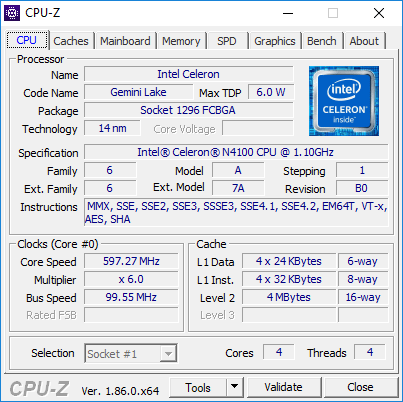
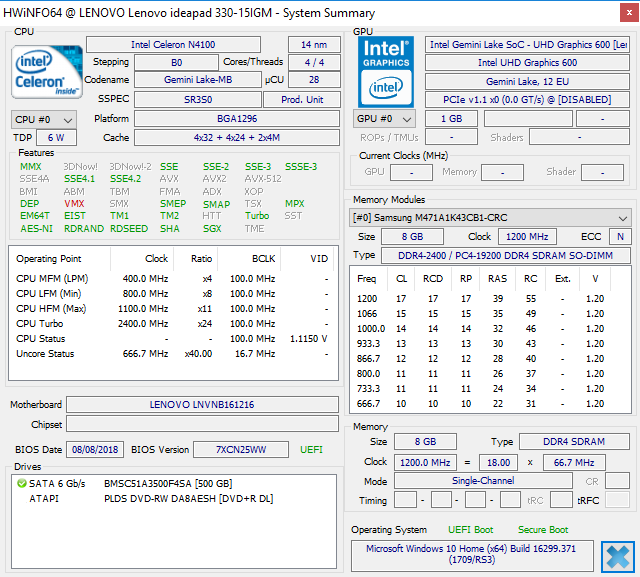
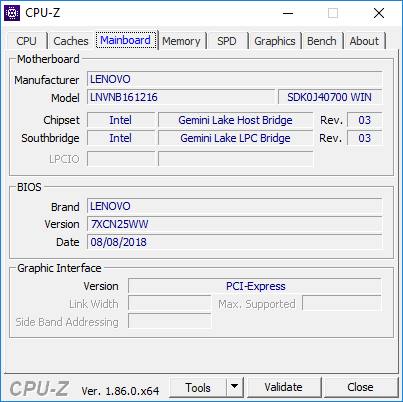
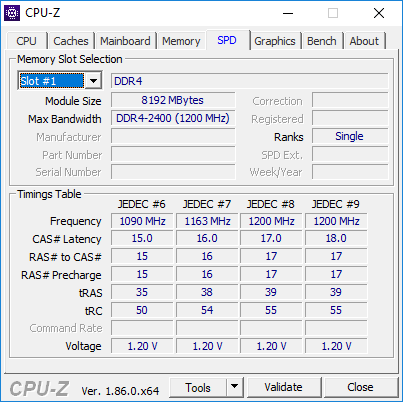
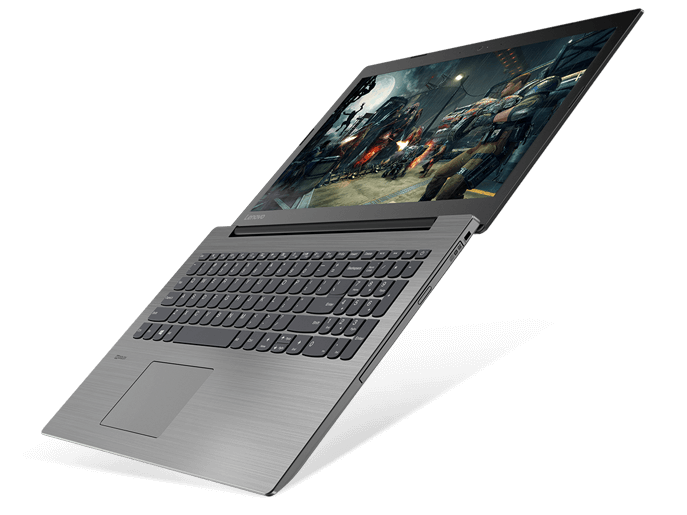
Breve Análise do Portátil Lenovo IdeaPad 330-15IGM (Celeron N4100)
| SD Card Reader | |
| average JPG Copy Test (av. of 3 runs) | |
| HP Pavilion 15-cs0053cl (Toshiba Exceria Pro SDXC 64 GB UHS-II) | |
| Asus VivoBook 15 F510UF-ES71 (Toshiba Exceria Pro SDXC 64 GB UHS-II) | |
| Lenovo IdeaPad 330-15IGM (Toshiba Exceria Pro SDXC 64 GB UHS-II) | |
| Acer Extensa 2519-P35U (Toshiba Exceria Pro SDXC 64 GB UHS-II) | |
| maximum AS SSD Seq Read Test (1GB) | |
| HP Pavilion 15-cs0053cl (Toshiba Exceria Pro SDXC 64 GB UHS-II) | |
| Asus VivoBook 15 F510UF-ES71 (Toshiba Exceria Pro SDXC 64 GB UHS-II) | |
| Acer Extensa 2519-P35U (Toshiba Exceria Pro SDXC 64 GB UHS-II) | |
| Lenovo IdeaPad 330-15IGM (Toshiba Exceria Pro SDXC 64 GB UHS-II) | |
| Networking | |
| iperf3 transmit AX12 | |
| Asus VivoBook 15 F510UF-ES71 | |
| Lenovo IdeaPad 330-15IGM | |
| HP Pavilion 15-cs0053cl | |
| Acer Extensa 2519-P35U | |
| iperf3 receive AX12 | |
| Asus VivoBook 15 F510UF-ES71 | |
| Lenovo IdeaPad 330-15IGM | |
| HP Pavilion 15-cs0053cl | |
| Acer Extensa 2519-P35U | |
| |||||||||||||||||||||||||
iluminação: 82 %
iluminação com acumulador: 212.7 cd/m²
Contraste: 409:1 (Preto: 0.52 cd/m²)
ΔE ColorChecker Calman: 8.75 | ∀{0.5-29.43 Ø4.73}
calibrated: 4.92
ΔE Greyscale Calman: 10.1 | ∀{0.09-98 Ø4.97}
53.6% sRGB (Argyll 1.6.3 3D)
34.1% AdobeRGB 1998 (Argyll 1.6.3 3D)
37.14% AdobeRGB 1998 (Argyll 3D)
53.9% sRGB (Argyll 3D)
35.95% Display P3 (Argyll 3D)
Gamma: 2.14
CCT: 10452 K
| Lenovo IdeaPad 330-15IGM NT156WHM-N42, TN LED, 15.6", 1366x768 | Acer Extensa 2519-P35U AU Optronics AUO71EC, TN LED, 15.6", 1366x768 | HP Pavilion 15-cs0053cl AU Optronics B156XW02 V0, TN LED, 15.6", 1366x768 | Asus VivoBook 15 F510UF-ES71 LG Philips LP156WF9-SPK2, IPS, 15.6", 1920x1080 | Huawei MateBook D 15-53010BAJ AU Optronics B156HW02, IPS, 15.6", 1920x1080 | Lenovo IdeaPad 330-15ARR 81D2005CUS AUO B156HTN03.8, TN LED, 15.6", 1920x1080 | |
|---|---|---|---|---|---|---|
| Display | 5% | 7% | 9% | 14% | 1% | |
| Display P3 Coverage (%) | 35.95 | 37.77 5% | 38.37 7% | 39.35 9% | 40.96 14% | 36.36 1% |
| sRGB Coverage (%) | 53.9 | 56.9 6% | 57.7 7% | 59.2 10% | 60.9 13% | 54.7 1% |
| AdobeRGB 1998 Coverage (%) | 37.14 | 39.02 5% | 39.65 7% | 40.65 9% | 42.24 14% | 37.57 1% |
| Response Times | -7% | -13% | -27% | -48% | -23% | |
| Response Time Grey 50% / Grey 80% * (ms) | 38.4 ? | 45 ? -17% | 43.6 ? -14% | 27.2 ? 29% | 36.4 ? 5% | 38.8 ? -1% |
| Response Time Black / White * (ms) | 13.6 ? | 13 ? 4% | 15.2 ? -12% | 24.8 ? -82% | 27.2 ? -100% | 19.6 ? -44% |
| PWM Frequency (Hz) | 893 ? | |||||
| Screen | -7% | 11% | 32% | 34% | 0% | |
| Brightness middle (cd/m²) | 212.7 | 202 -5% | 220.1 3% | 257 21% | 265.7 25% | 252.2 19% |
| Brightness (cd/m²) | 203 | 194 -4% | 210 3% | 246 21% | 258 27% | 251 24% |
| Brightness Distribution (%) | 82 | 77 -6% | 93 13% | 89 9% | 91 11% | 84 2% |
| Black Level * (cd/m²) | 0.52 | 0.49 6% | 0.29 44% | 0.34 35% | 0.31 40% | 0.54 -4% |
| Contrast (:1) | 409 | 412 1% | 759 86% | 756 85% | 857 110% | 467 14% |
| Colorchecker dE 2000 * | 8.75 | 14.24 -63% | 11.4 -30% | 4.54 48% | 6.01 31% | 12.36 -41% |
| Colorchecker dE 2000 max. * | 23.6 | 23.76 -1% | 25.96 -10% | 16 32% | 18.87 20% | 24.75 -5% |
| Colorchecker dE 2000 calibrated * | 4.92 | 2.95 40% | 4.09 17% | 3.61 27% | 3.94 20% | 4.43 10% |
| Greyscale dE 2000 * | 10.1 | 15.46 -53% | 12 -19% | 4.6 54% | 5 50% | 12.2 -21% |
| Gamma | 2.14 103% | 2.55 86% | 2.09 105% | 2.44 90% | 2.7 81% | 1.83 120% |
| CCT | 10452 62% | 20358 32% | 12625 51% | 7096 92% | 6569 99% | 13028 50% |
| Color Space (Percent of AdobeRGB 1998) (%) | 34.1 | 36 6% | 36.5 7% | 37.5 10% | 42.24 24% | 34.6 1% |
| Color Space (Percent of sRGB) (%) | 53.6 | 57 6% | 57.5 7% | 59.2 10% | 60.92 14% | 54.5 2% |
| Média Total (Programa/Configurações) | -3% /
-4% | 2% /
7% | 5% /
20% | 0% /
20% | -7% /
-3% |
* ... menor é melhor
Exibir tempos de resposta
| ↔ Tempo de resposta preto para branco | ||
|---|---|---|
| 13.6 ms ... ascensão ↗ e queda ↘ combinadas | ↗ 8.4 ms ascensão | 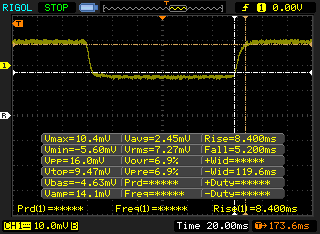 |
| ↘ 5.2 ms queda | ||
| A tela mostra boas taxas de resposta em nossos testes, mas pode ser muito lenta para jogadores competitivos. Em comparação, todos os dispositivos testados variam de 0.1 (mínimo) a 240 (máximo) ms. » 34 % de todos os dispositivos são melhores. Isso significa que o tempo de resposta medido é melhor que a média de todos os dispositivos testados (19.9 ms). | ||
| ↔ Tempo de resposta 50% cinza a 80% cinza | ||
| 38.4 ms ... ascensão ↗ e queda ↘ combinadas | ↗ 18.8 ms ascensão | 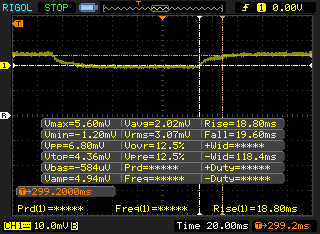 |
| ↘ 19.6 ms queda | ||
| A tela mostra taxas de resposta lentas em nossos testes e será insatisfatória para os jogadores. Em comparação, todos os dispositivos testados variam de 0.165 (mínimo) a 636 (máximo) ms. » 57 % de todos os dispositivos são melhores. Isso significa que o tempo de resposta medido é pior que a média de todos os dispositivos testados (31.1 ms). | ||
Cintilação da tela / PWM (modulação por largura de pulso)
| Tela tremeluzindo/PWM detectado | 893 Hz | ≤ 99 % configuração de brilho | 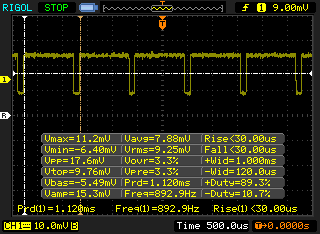 |
A luz de fundo da tela pisca em 893 Hz (pior caso, por exemplo, utilizando PWM) Cintilação detectada em uma configuração de brilho de 99 % e abaixo. Não deve haver cintilação ou PWM acima desta configuração de brilho. A frequência de 893 Hz é bastante alta, então a maioria dos usuários sensíveis ao PWM não deve notar nenhuma oscilação. [pwm_comparison] Em comparação: 52 % de todos os dispositivos testados não usam PWM para escurecer a tela. Se PWM foi detectado, uma média de 7794 (mínimo: 5 - máximo: 343500) Hz foi medida. | |||
| Cinebench R15 | |
| CPU Single 64Bit | |
| Asus VivoBook 15 F510UF-ES71 | |
| Dell Inspiron 15 5579-9672 | |
| Lenovo IdeaPad 330-15ARR 81D2005CUS | |
| Lenovo V330-15IKB | |
| Chuwi LapBook SE | |
| Lenovo IdeaPad 330-15IGM | |
| Lenovo Flex 6-11IGM | |
| Microsoft Surface Go MHN-00003 | |
| Acer Extensa 2519-P35U | |
| Fujitsu Stylistic V535 | |
| CPU Multi 64Bit | |
| Asus VivoBook 15 F510UF-ES71 | |
| Dell Inspiron 15 5579-9672 | |
| Lenovo IdeaPad 330-15ARR 81D2005CUS | |
| Lenovo V330-15IKB | |
| Lenovo IdeaPad 330-15IGM | |
| Microsoft Surface Go MHN-00003 | |
| Chuwi LapBook SE | |
| Acer Extensa 2519-P35U | |
| Lenovo Flex 6-11IGM | |
| Fujitsu Stylistic V535 | |
| Chuwi Hi10 Pro | |
| PCMark 8 - Home Score Accelerated v2 | |
| Média da turma Office (n=1últimos 2 anos) | |
| Asus VivoBook 15 F510UF-ES71 | |
| HP Pavilion 15-cs0053cl | |
| Lenovo IdeaPad 330-15ARR 81D2005CUS | |
| Lenovo IdeaPad 330-15IGM | |
| Acer Extensa 2519-P35U | |
| PCMark 8 Home Score Accelerated v2 | 1872 pontos | |
| PCMark 10 Score | 1630 pontos | |
Ajuda | ||
| Lenovo IdeaPad 330-15IGM BMSC51A3500F4SA | Huawei MateBook D 15-53010BAJ Samsung SSD PM981 MZVLB512HAJQ | Lenovo IdeaPad 330-15ARR 81D2005CUS SK Hynix Canvas SC311 256GB HFS256G32TNF | Lenovo V330-15IKB Samsung PM961 MZVLW256HEHP | Microsoft Surface Go MHN-00003 64 GB eMMC Flash | |
|---|---|---|---|---|---|
| AS SSD | 314% | 19% | 127% | -50% | |
| Copy Game MB/s (MB/s) | 410.2 | 1047 155% | 262.4 -36% | 465.5 13% | 76.5 -81% |
| Copy Program MB/s (MB/s) | 168.2 | 438.1 160% | 334 99% | 201.9 20% | 44.34 -74% |
| Copy ISO MB/s (MB/s) | 441.2 | 1287 192% | 434.5 -2% | 789 79% | 99.1 -78% |
| Score Total (Points) | 660 | 4225 540% | 752 14% | 1623 146% | 225 -66% |
| Score Write (Points) | 313 | 1709 446% | 295 -6% | 581 86% | 92 -71% |
| Score Read (Points) | 227 | 1665 633% | 296 30% | 704 210% | 88 -61% |
| Access Time Write * (ms) | 0.355 | 0.143 60% | 0.08 77% | 0.045 87% | 0.233 34% |
| Access Time Read * (ms) | 0.111 | 0.043 61% | 0.102 8% | 0.069 38% | 0.151 -36% |
| 4K-64 Write (MB/s) | 217.8 | 1486 582% | 203.6 -7% | 359.7 65% | 44.48 -80% |
| 4K-64 Read (MB/s) | 168.2 | 1455 765% | 228.5 36% | 448.4 167% | 40.27 -76% |
| 4K Write (MB/s) | 52.1 | 81.9 57% | 45.41 -13% | 83.9 61% | 35.07 -33% |
| 4K Read (MB/s) | 14.99 | 53 254% | 23.4 56% | 45.31 202% | 18.29 22% |
| Seq Write (MB/s) | 426.1 | 1411 231% | 459.6 8% | 1373 222% | 126.7 -70% |
| Seq Read (MB/s) | 440.9 | 1567 255% | 441.6 0% | 2104 377% | 289.8 -34% |
* ... menor é melhor

| 3DMark 11 | |
| 1280x720 Performance GPU | |
| Média da turma Office (2551 - 18313, n=68, últimos 2 anos) | |
| Huawei MateBook D 15-53010BAJ | |
| Asus VivoBook 15 F510UF-ES71 | |
| Lenovo ThinkPad A485-20MU000CGE | |
| Lenovo V330-15IKB | |
| Microsoft Surface Go MHN-00003 | |
| Média Intel UHD Graphics 600 (410 - 854, n=27) | |
| Trekstor Primebook C11 | |
| Xploretech XSLATE L10 | |
| Acer Extensa 2519-P35U | |
| Lenovo IdeaPad 330-15IGM | |
| Fujitsu Stylistic V535 | |
| 1280x720 Performance Combined | |
| Média da turma Office (2054 - 16787, n=68, últimos 2 anos) | |
| Huawei MateBook D 15-53010BAJ | |
| Asus VivoBook 15 F510UF-ES71 | |
| Lenovo ThinkPad A485-20MU000CGE | |
| Lenovo V330-15IKB | |
| Microsoft Surface Go MHN-00003 | |
| Trekstor Primebook C11 | |
| Média Intel UHD Graphics 600 (362 - 983, n=27) | |
| Xploretech XSLATE L10 | |
| Acer Extensa 2519-P35U | |
| Lenovo IdeaPad 330-15IGM | |
| Fujitsu Stylistic V535 | |
| 3DMark | |
| 1280x720 Cloud Gate Standard Graphics | |
| Média da turma Office (11640 - 118515, n=37, últimos 2 anos) | |
| Huawei MateBook D 15-53010BAJ | |
| Asus VivoBook 15 F510UF-ES71 | |
| Lenovo ThinkPad A485-20MU000CGE | |
| Lenovo V330-15IKB | |
| Microsoft Surface Go MHN-00003 | |
| Média Intel UHD Graphics 600 (2346 - 4958, n=20) | |
| 1920x1080 Fire Strike Graphics | |
| Média da turma Office (736 - 21871, n=72, últimos 2 anos) | |
| Huawei MateBook D 15-53010BAJ | |
| Asus VivoBook 15 F510UF-ES71 | |
| Lenovo ThinkPad A485-20MU000CGE | |
| Lenovo V330-15IKB | |
| Microsoft Surface Go MHN-00003 | |
| Média Intel UHD Graphics 600 (307 - 637, n=21) | |
| 1920x1080 Ice Storm Extreme Graphics | |
| Média da turma Office (80312 - 156297, n=5, últimos 2 anos) | |
| Microsoft Surface Go MHN-00003 | |
| Média Intel UHD Graphics 600 (8277 - 19919, n=12) | |
| 3DMark 11 Performance | 517 pontos | |
Ajuda | ||
(+) A temperatura máxima no lado superior é 33.8 °C / 93 F, em comparação com a média de 34.3 °C / 94 F , variando de 21.2 a 62.5 °C para a classe Office.
(±) A parte inferior aquece até um máximo de 40.2 °C / 104 F, em comparação com a média de 36.8 °C / 98 F
(+) Em uso inativo, a temperatura média para o lado superior é 24.9 °C / 77 F, em comparação com a média do dispositivo de 29.5 °C / ### class_avg_f### F.
(+) Os apoios para as mãos e o touchpad são mais frios que a temperatura da pele, com um máximo de 30 °C / 86 F e, portanto, são frios ao toque.
(-) A temperatura média da área do apoio para as mãos de dispositivos semelhantes foi 27.5 °C / 81.5 F (-2.5 °C / -4.5 F).
Lenovo IdeaPad 330-15IGM análise de áudio
(-) | alto-falantes não muito altos (###valor### dB)
Graves 100 - 315Hz
(-) | quase nenhum baixo - em média 21.4% menor que a mediana
(±) | a linearidade dos graves é média (14% delta para a frequência anterior)
Médios 400 - 2.000 Hz
(+) | médios equilibrados - apenas 4.8% longe da mediana
(±) | a linearidade dos médios é média (9.6% delta para frequência anterior)
Altos 2 - 16 kHz
(+) | agudos equilibrados - apenas 3.8% longe da mediana
(±) | a linearidade dos máximos é média (9.7% delta para frequência anterior)
Geral 100 - 16.000 Hz
(±) | a linearidade do som geral é média (24.6% diferença em relação à mediana)
Comparado com a mesma classe
» 72% de todos os dispositivos testados nesta classe foram melhores, 7% semelhantes, 21% piores
» O melhor teve um delta de 7%, a média foi 21%, o pior foi 53%
Comparado com todos os dispositivos testados
» 75% de todos os dispositivos testados foram melhores, 5% semelhantes, 20% piores
» O melhor teve um delta de 4%, a média foi 24%, o pior foi 134%
Apple MacBook 12 (Early 2016) 1.1 GHz análise de áudio
(+) | os alto-falantes podem tocar relativamente alto (###valor### dB)
Graves 100 - 315Hz
(±) | graves reduzidos - em média 11.3% menor que a mediana
(±) | a linearidade dos graves é média (14.2% delta para a frequência anterior)
Médios 400 - 2.000 Hz
(+) | médios equilibrados - apenas 2.4% longe da mediana
(+) | médios são lineares (5.5% delta para frequência anterior)
Altos 2 - 16 kHz
(+) | agudos equilibrados - apenas 2% longe da mediana
(+) | os máximos são lineares (4.5% delta da frequência anterior)
Geral 100 - 16.000 Hz
(+) | o som geral é linear (10.2% diferença em relação à mediana)
Comparado com a mesma classe
» 7% de todos os dispositivos testados nesta classe foram melhores, 2% semelhantes, 91% piores
» O melhor teve um delta de 5%, a média foi 18%, o pior foi 53%
Comparado com todos os dispositivos testados
» 5% de todos os dispositivos testados foram melhores, 1% semelhantes, 94% piores
» O melhor teve um delta de 4%, a média foi 24%, o pior foi 134%
| desligado | |
| Ocioso | |
| Carga |
|
Key:
min: | |
| Lenovo IdeaPad 330-15IGM Celeron N4100, UHD Graphics 600, BMSC51A3500F4SA, TN LED, 1366x768, 15.6" | Acer Extensa 2519-P35U N3710, HD Graphics 405 (Braswell), Western Digital Scorpio Blue WD5000LPCX-24C6HT0, TN LED, 1366x768, 15.6" | HP Pavilion 15-cs0053cl i5-8250U, UHD Graphics 620, Toshiba MQ04ABF100, TN LED, 1366x768, 15.6" | Microsoft Surface Go MHN-00003 Pentium 4415Y, UHD Graphics 615, 64 GB eMMC Flash, IPS, 1800x1200, 10" | Lenovo V330-15IKB i3-7130U, UHD Graphics 620, Samsung PM961 MZVLW256HEHP, TN LED, 1920x1080, 15.6" | Lenovo IdeaPad 330-15ARR 81D2005CUS R5 2500U, Vega 8, SK Hynix Canvas SC311 256GB HFS256G32TNF, TN LED, 1920x1080, 15.6" | |
|---|---|---|---|---|---|---|
| Power Consumption | -30% | -82% | -19% | -59% | -118% | |
| Idle Minimum * (Watt) | 3 | 5 -67% | 5.6 -87% | 2.88 4% | 3.2 -7% | 7.6 -153% |
| Idle Average * (Watt) | 5.7 | 6.9 -21% | 7.1 -25% | 4.8 16% | 6.7 -18% | 10.6 -86% |
| Idle Maximum * (Watt) | 7.5 | 7.8 -4% | 7.9 -5% | 7.5 -0% | 7.1 5% | 11.8 -57% |
| Load Average * (Watt) | 12.6 | 14.4 -14% | 32.8 -160% | 16.9 -34% | 29.6 -135% | 24.1 -91% |
| Load Maximum * (Watt) | 13.1 | 18.7 -43% | 30.5 -133% | 23.8 -82% | 31.5 -140% | 39.4 -201% |
| Witcher 3 ultra * (Watt) | 30.3 |
* ... menor é melhor
| Lenovo IdeaPad 330-15IGM Celeron N4100, UHD Graphics 600, 30 Wh | Acer Extensa 2519-P35U N3710, HD Graphics 405 (Braswell), Wh | HP Pavilion 15-cs0053cl i5-8250U, UHD Graphics 620, 41 Wh | Lenovo IdeaPad 330-15ARR 81D2005CUS R5 2500U, Vega 8, 35 Wh | Microsoft Surface Go MHN-00003 Pentium 4415Y, UHD Graphics 615, 28 Wh | Lenovo V330-15IKB i3-7130U, UHD Graphics 620, 30 Wh | |
|---|---|---|---|---|---|---|
| Duração da bateria | -51% | 27% | -27% | 36% | -16% | |
| WiFi v1.3 (h) | 5.5 | 2.7 -51% | 7 27% | 4 -27% | 7.5 36% | 4.6 -16% |
| Reader / Idle (h) | 12 | 12.9 | ||||
| Load (h) | 2.2 | 3 |
Pro
Contra

O Celeron Ideapad 330 é um pouco mais que apenas uma troca do processador quando comparado com o Ryzen Ideapad 330. Ausência do USB Type-C, não há ventilador do sistema, e a bateria é menor. Nossa configuração Celeron é cerca de 70 a 80 por cento mais lento no poder bruto da CPU e GPU, respectivamente, que a configuração Ryzen 5.
A CPU de muito baixo poder da Intel traz algumas vantagens sobre a opção Ryzen. Ou seja, o sistema é completamente silencioso e pode funcionar cerca de duas horas a mais. Para streaming, navegação, e processamento de texto, o Intel Ideapad 330 é adequado. Recomendamos atualizar para a tela 1080p se possível, dado que o painel 768p não é agradável para o trabalho ou vídeos.
Aceitável para navegação silenciosa, processamento de texto e saída de vídeo 4K a 30 FPS. Existem inúmeros recortes que esperamos que as iterações futuras abordem, como o carregamento USB Type-C, um painel 768p muito pobre e a falta de uma porta USB conveniente na lateral direita.
Lenovo IdeaPad 330-15IGM
- 09/28/2018 v6 (old)
Allen Ngo
Price comparison
