Breve Análise do Conversível Eve V (m3, i5, i7)

| SD Card Reader | |
| average JPG Copy Test (av. of 3 runs) | |
| Dell XPS 13 i5-8250U (Toshiba Exceria Pro SDXC 64 GB UHS-II) | |
| Apple MacBook Air 13.3" 1.8 GHz (2017) (Toshiba Exceria Pro SDXC 64 GB UHS-II) | |
| HP Elite x2 1012 G2-1LV76EA (Toshiba Exceria Pro M501) | |
| Lenovo ThinkPad X1 Tablet Gen 2 (Toshiba Exceria Pro SDXC 64 GB UHS-II) | |
| Eve-Tech Eve V i5 (Toshiba Exceria microSDHC 32GB UHS-I) | |
| Asus VivoBook Flip 14 TP410UA-EC242T (Toshiba Exceria Pro SDXC 64 GB UHS-II) | |
| Acer Spin 5 SP513-52N-54SF (Toshiba Exceria Pro SDXC 64 GB UHS-II) | |
| maximum AS SSD Seq Read Test (1GB) | |
| Dell XPS 13 i5-8250U (Toshiba Exceria Pro SDXC 64 GB UHS-II) | |
| Lenovo ThinkPad X1 Tablet Gen 2 (Toshiba Exceria Pro SDXC 64 GB UHS-II) | |
| Apple MacBook Air 13.3" 1.8 GHz (2017) (Toshiba Exceria Pro SDXC 64 GB UHS-II) | |
| HP Elite x2 1012 G2-1LV76EA (Toshiba Exceria Pro M501) | |
| Eve-Tech Eve V i5 (Toshiba Exceria microSDHC 32GB UHS-I) | |
| Asus VivoBook Flip 14 TP410UA-EC242T (Toshiba Exceria Pro SDXC 64 GB UHS-II) | |
| Acer Spin 5 SP513-52N-54SF (Toshiba Exceria Pro SDXC 64 GB UHS-II) | |
| |||||||||||||||||||||||||
iluminação: 85 %
iluminação com acumulador: 471 cd/m²
Contraste: 1472:1 (Preto: 0.32 cd/m²)
ΔE ColorChecker Calman: 2.2 | ∀{0.5-29.43 Ø4.73}
ΔE Greyscale Calman: 3.4 | ∀{0.09-98 Ø4.97}
92.99% sRGB (Argyll 1.6.3 3D)
70% AdobeRGB 1998 (Argyll 1.6.3 3D)
70% AdobeRGB 1998 (Argyll 3D)
99.8% sRGB (Argyll 3D)
68.2% Display P3 (Argyll 3D)
Gamma: 2.2
CCT: 6270 K
| Eve-Tech Eve V i5 Sharp LQ123Z1JX3X, , 2880x1920, 12.3" | Microsoft Surface Pro (2017) i5 LG Display LP123WQ112604, , 2736x1824, 12.3" | Samsung Galaxy Book 12 SM-W728 Samsung SDCA029, , 2160x1440, 12" | Huawei MateBook X Chi Mei CMN8201 / P130ZDZ-EF1, , 2160x1440, 13.3" | HP Elite x2 1012 G2-1LV76EA Samsung SDC4A49, , 2716x1824, 12.3" | Lenovo ThinkPad X1 Tablet Gen 2 LSN120QL01L01, , 2160x1440, 12" | |
|---|---|---|---|---|---|---|
| Display | -1% | 8% | -4% | -2% | ||
| Display P3 Coverage (%) | 68.2 | 67.6 -1% | 77.3 13% | 65.8 -4% | 66.7 -2% | |
| sRGB Coverage (%) | 99.8 | 99 -1% | 92.8 -7% | 96.2 -4% | 98 -2% | |
| AdobeRGB 1998 Coverage (%) | 70 | 69.1 -1% | 83.1 19% | 66.8 -5% | 68.7 -2% | |
| Response Times | 14% | 66% | 31% | 22% | 37% | |
| Response Time Grey 50% / Grey 80% * (ms) | 49.1 ? | 42 ? 14% | 4 ? 92% | 33 ? 33% | 45.6 ? 7% | 28.4 ? 42% |
| Response Time Black / White * (ms) | 33.6 ? | 29 ? 14% | 20 ? 40% | 24 ? 29% | 21.6 ? 36% | 22.8 ? 32% |
| PWM Frequency (Hz) | 985 ? | 21000 | 250 ? | 2119 ? | 221.2 ? | |
| Screen | -6% | 71% | 3% | -4% | -37% | |
| Brightness middle (cd/m²) | 471 | 417 -11% | 376 -20% | 408 -13% | 443 -6% | 388.1 -18% |
| Brightness (cd/m²) | 433 | 401 -7% | 378 -13% | 395 -9% | 446 3% | 344 -21% |
| Brightness Distribution (%) | 85 | 88 4% | 91 7% | 88 4% | 88 4% | 78 -8% |
| Black Level * (cd/m²) | 0.32 | 0.29 9% | 0.03 91% | 0.45 -41% | 0.41 -28% | 0.39 -22% |
| Contrast (:1) | 1472 | 1438 -2% | 12533 751% | 907 -38% | 1080 -27% | 995 -32% |
| Colorchecker dE 2000 * | 2.2 | 3.63 -65% | 4.1 -86% | 1.55 30% | 2.6 -18% | 4.6 -109% |
| Colorchecker dE 2000 max. * | 5.6 | 6.74 -20% | 6.45 -15% | 2.19 61% | 4 29% | 9.1 -63% |
| Greyscale dE 2000 * | 3.4 | 2.18 36% | 3.64 -7% | 1.91 44% | 3 12% | 6.1 -79% |
| Gamma | 2.2 100% | 3.09 71% | 2.58 85% | 2.34 94% | 2.38 92% | 2.07 106% |
| CCT | 6270 104% | 6767 96% | 7113 91% | 6491 100% | 6780 96% | 7104 91% |
| Color Space (Percent of AdobeRGB 1998) (%) | 70 | 63 -10% | 74 6% | 61 -13% | 62.6 -11% | 59 -16% |
| Color Space (Percent of sRGB) (%) | 92.99 | 99 6% | 93 0% | 96 3% | 98 5% | 91 -2% |
| Média Total (Programa/Configurações) | 2% /
-2% | 48% /
58% | 10% /
5% | 5% /
0% | 0% /
-25% |
* ... menor é melhor
Exibir tempos de resposta
| ↔ Tempo de resposta preto para branco | ||
|---|---|---|
| 33.6 ms ... ascensão ↗ e queda ↘ combinadas | ↗ 18.1 ms ascensão | 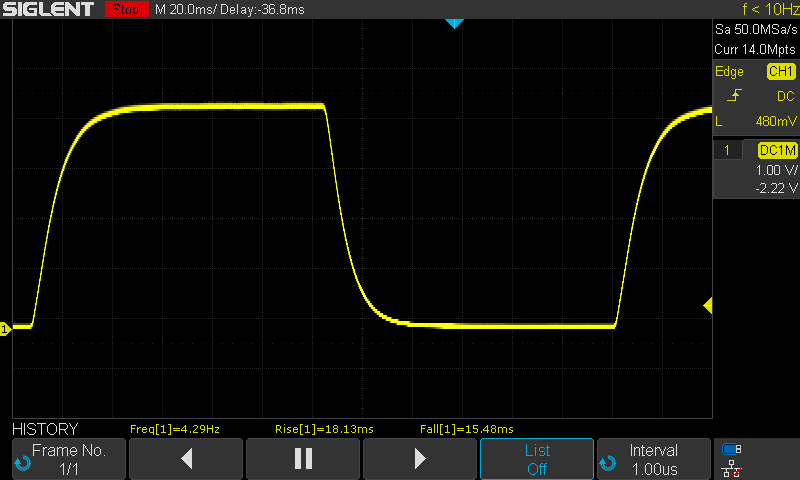 |
| ↘ 15.5 ms queda | ||
| A tela mostra taxas de resposta lentas em nossos testes e será insatisfatória para os jogadores. Em comparação, todos os dispositivos testados variam de 0.1 (mínimo) a 240 (máximo) ms. » 90 % de todos os dispositivos são melhores. Isso significa que o tempo de resposta medido é pior que a média de todos os dispositivos testados (19.9 ms). | ||
| ↔ Tempo de resposta 50% cinza a 80% cinza | ||
| 49.1 ms ... ascensão ↗ e queda ↘ combinadas | ↗ 23.1 ms ascensão | 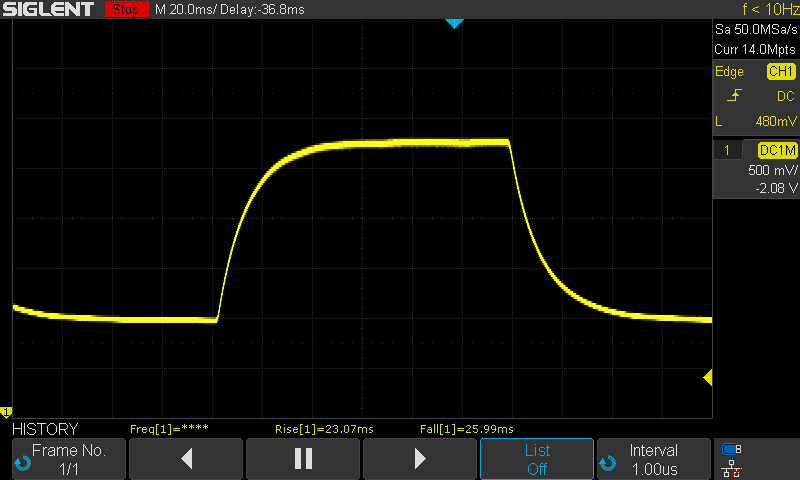 |
| ↘ 26 ms queda | ||
| A tela mostra taxas de resposta lentas em nossos testes e será insatisfatória para os jogadores. Em comparação, todos os dispositivos testados variam de 0.165 (mínimo) a 636 (máximo) ms. » 85 % de todos os dispositivos são melhores. Isso significa que o tempo de resposta medido é pior que a média de todos os dispositivos testados (31.1 ms). | ||
Cintilação da tela / PWM (modulação por largura de pulso)
| Tela tremeluzindo/PWM detectado | 985 Hz | ≤ 25 % configuração de brilho | 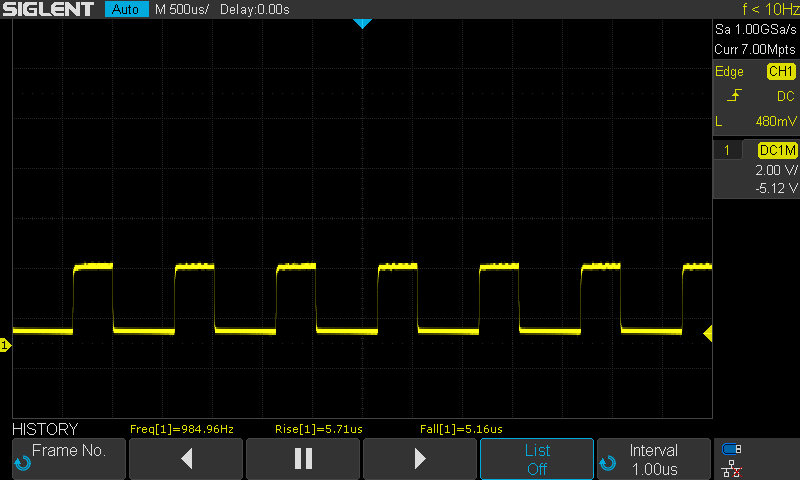 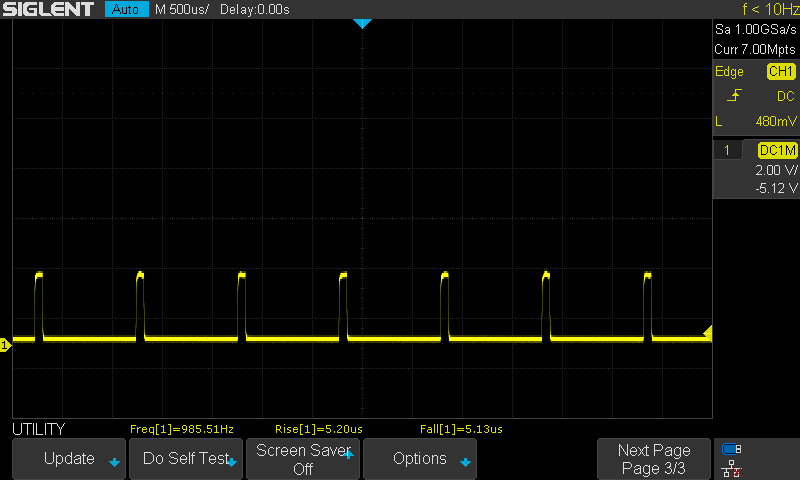 |
A luz de fundo da tela pisca em 985 Hz (pior caso, por exemplo, utilizando PWM) Cintilação detectada em uma configuração de brilho de 25 % e abaixo. Não deve haver cintilação ou PWM acima desta configuração de brilho. A frequência de 985 Hz é bastante alta, então a maioria dos usuários sensíveis ao PWM não deve notar nenhuma oscilação. [pwm_comparison] Em comparação: 52 % de todos os dispositivos testados não usam PWM para escurecer a tela. Se PWM foi detectado, uma média de 7798 (mínimo: 5 - máximo: 343500) Hz foi medida. | |||
Cinebench R15 CPU Multi 64 Bit Loop - Eve V i5-7Y54 (7W)
Cinebench R15 CPU Multi 64 Bit Loop - Surface Pro 2017 i5-7300U
| Cinebench R15 | |
| CPU Single 64Bit | |
| Acer Spin 5 SP513-52N-54SF | |
| Microsoft Surface Pro (2017) i5 | |
| Samsung Galaxy Book 12 SM-W728 | |
| HP Elite x2 1012 G2-1LV76EA | |
| Eve-Tech Eve V i7 | |
| Huawei MateBook X | |
| Apple MacBook Air 13.3" 1.8 GHz (2017) | |
| Lenovo ThinkPad X1 Tablet Gen 2 | |
| Eve-Tech Eve V i5 | |
| Eve-Tech Eve V m3 | |
| CPU Multi 64Bit | |
| Acer Spin 5 SP513-52N-54SF | |
| Microsoft Surface Pro (2017) i5 | |
| Huawei MateBook X | |
| HP Elite x2 1012 G2-1LV76EA | |
| Samsung Galaxy Book 12 SM-W728 | |
| Apple MacBook Air 13.3" 1.8 GHz (2017) | |
| Eve-Tech Eve V m3 | |
| Eve-Tech Eve V i7 | |
| Lenovo ThinkPad X1 Tablet Gen 2 | |
| Eve-Tech Eve V i5 | |
Cinebench R15 CPU Multi 64 Bit Loop - Eve V m3-7Y30
Cinebench R15 CPU Multi 64 Bit Loop - Eve V i7-7Y75
Cinebench R15 CPU Multi 64 Bit Loop - Eve V i5-7Y54 (12W)
| PCMark 8 - Home Score Accelerated v2 | |
| Lenovo Yoga 920-13IKB-80Y7 | |
| Samsung Galaxy Book 12 SM-W728 | |
| Huawei MateBook X | |
| HP Elite x2 1012 G2-1LV76EA | |
| Acer Spin 5 SP513-52N-54SF | |
| Lenovo ThinkPad X1 Tablet Gen 2 | |
| Microsoft Surface Pro (2017) i5 | |
| Eve-Tech Eve V i7 | |
| Eve-Tech Eve V i5 | |
| Eve-Tech Eve V m3 | |
| PCMark 8 Home Score Accelerated v2 | 2709 pontos | |
| PCMark 8 Creative Score Accelerated v2 | 3664 pontos | |
| PCMark 10 Score | 2556 pontos | |
Ajuda | ||
| Eve-Tech Eve V i5 Intel SSD 600p SSDPEKKW256G7 | Eve-Tech Eve V m3 Intel SSD 600p SSDPEKKW128G7 | Eve-Tech Eve V i7 Intel SSD 600p SSDPEKKW512G7 | Microsoft Surface Pro (2017) i5 Samsung PM971 KUS030202M | HP Elite x2 1012 G2-1LV76EA Samsung PM961 MZVLW256HEHP | |
|---|---|---|---|---|---|
| CrystalDiskMark 5.2 / 6 | -23% | 23% | 25% | 91% | |
| Write Seq (MB/s) | 588 | 275.8 -53% | 559 -5% | 831 41% | 1264 115% |
| Read Seq (MB/s) | 1127 | 688 -39% | 1066 -5% | 805 -29% | 1770 57% |
| Write 4K (MB/s) | 143.6 | 121.8 -15% | 152 6% | 124 -14% | 143 0% |
| Read 4K (MB/s) | 26.6 | 29.53 11% | 21 -21% | 42 58% | 53.4 101% |
| Write 4K Q32T1 (MB/s) | 170.2 | 252.3 48% | 444 161% | 300 76% | 471 177% |
| Read 4K Q32T1 (MB/s) | 283.1 | 140.3 -50% | 457 61% | 322 14% | 418.1 48% |
| Write Seq Q32T1 (MB/s) | 574 | 359.5 -37% | 559 -3% | 846 47% | 1270 121% |
| Read Seq Q32T1 (MB/s) | 1557 | 770 -51% | 1404 -10% | 1656 6% | 3196 105% |
| AS SSD | -36% | 13% | -12733% | 123% | |
| 4K Write (MB/s) | 115 | 105.6 -8% | 130.1 13% | 132.2 15% | |
| 4K Read (MB/s) | 32.3 | 32.42 0% | 33.2 3% | 45.24 40% | |
| Seq Write (MB/s) | 572 | 346.7 -39% | 539 -6% | 156.7 -73% | 897 57% |
| Seq Read (MB/s) | 1346 | 705 -48% | 1208 -10% | 1037 -23% | 2197 63% |
| 4K-64 Write (MB/s) | 508 | 264.4 -48% | 471 -7% | 75 -85% | 657 29% |
| 4K-64 Read (MB/s) | 279 | 137.2 -51% | 500 79% | 1222 338% | 2280 717% |
| Access Time Write * (ms) | 0.03 | 0.047 -57% | 0.028 7% | 23 -76567% | 0.027 10% |
| Access Time Read * (ms) | 0.08 | 0.106 -33% | 0.058 27% | 0.071 11% | 0.041 49% |
| Média Total (Programa/Configurações) | -30% /
-29% | 18% /
18% | -6354% /
-5443% | 107% /
107% |
* ... menor é melhor

| 3DMark 11 - 1280x720 Performance GPU | |
| Lenovo Yoga 920-13IKB-80Y7 | |
| Samsung Galaxy Book 12 SM-W728 | |
| Huawei MateBook X | |
| HP Elite x2 1012 G2-1LV76EA | |
| Eve-Tech Eve V m3 | |
| Eve-Tech Eve V i7 | |
| Eve-Tech Eve V i5 | |
| Lenovo ThinkPad X1 Tablet Gen 2 | |
| 3DMark | |
| 1280x720 Cloud Gate Standard Graphics | |
| Lenovo Yoga 920-13IKB-80Y7 | |
| Samsung Galaxy Book 12 SM-W728 | |
| Huawei MateBook X | |
| HP Elite x2 1012 G2-1LV76EA | |
| Microsoft Surface Pro (2017) i5 | |
| Eve-Tech Eve V m3 | |
| Eve-Tech Eve V i7 | |
| Eve-Tech Eve V i5 | |
| Lenovo ThinkPad X1 Tablet Gen 2 | |
| 1920x1080 Fire Strike Graphics | |
| Lenovo Yoga 920-13IKB-80Y7 | |
| Samsung Galaxy Book 12 SM-W728 | |
| Eve-Tech Eve V m3 | |
| HP Elite x2 1012 G2-1LV76EA | |
| Microsoft Surface Pro (2017) i5 | |
| Huawei MateBook X | |
| Eve-Tech Eve V i7 | |
| Eve-Tech Eve V i5 | |
| Lenovo ThinkPad X1 Tablet Gen 2 | |
| 3DMark 11 Performance | 1319 pontos | |
| 3DMark Cloud Gate Standard Score | 4836 pontos | |
| 3DMark Fire Strike Score | 762 pontos | |
| 3DMark Time Spy Score | 292 pontos | |
Ajuda | ||
| Overwatch | |
| 1280x720 Low (Render Scale 100 %) AA:FX AF:1x | |
| Xiaomi Mi Notebook Pro i5 | |
| Microsoft Surface Pro (2017) i7 | |
| Microsoft Surface Laptop i7 | |
| Dell XPS 13 i7-8550U | |
| HP Envy 13-ad065nr | |
| Eve-Tech Eve V i5 | |
| 1366x768 Medium (Render Scale 100 %) AA:FX AF:2x | |
| Xiaomi Mi Notebook Pro i5 | |
| Microsoft Surface Pro (2017) i7 | |
| Dell XPS 13 i7-8550U | |
| HP Envy 13-ad065nr | |
| Microsoft Surface Laptop i7 | |
| Eve-Tech Eve V i5 | |
| FIFA 18 | |
| 1280x720 Low Preset | |
| Xiaomi Mi Notebook Pro i5 | |
| Microsoft Surface Laptop i7 | |
| Eve-Tech Eve V i5 | |
| 1366x768 Medium Preset | |
| Xiaomi Mi Notebook Pro i5 | |
| baixo | média | alto | ultra | |
|---|---|---|---|---|
| Dota 2 Reborn (2015) | 57.4 | 31.85 | 15.7 | 14.1 |
| Overwatch (2016) | 28.2 | 21.9 | ||
| FIFA 18 (2017) | 45.2 | |||
| The Evil Within 2 (2017) | 8.6 | |||
| ELEX (2017) | 8.8 |
| Dota 2 Reborn | |
| 1280x720 min (0/3) fastest | |
| MSI Gaming X GeForce GTX 1080 Desktop PC | |
| Acer Aspire 5 A515-51G-51RL | |
| Asus AsusPro P4540UQ-FY0056R | |
| Microsoft Surface Pro (2017) i7 | |
| Razer Core V2 GTX 1080 + Eve V m3 | |
| Microsoft Surface Laptop i7 | |
| Eve-Tech Eve V i5 | |
| 1366x768 med (1/3) | |
| MSI Gaming X GeForce GTX 1080 Desktop PC | |
| Acer Aspire 5 A515-51G-51RL | |
| Asus AsusPro P4540UQ-FY0056R | |
| Microsoft Surface Pro (2017) i7 | |
| Razer Core V2 GTX 1080 + Eve V m3 | |
| Microsoft Surface Laptop i7 | |
| Eve-Tech Eve V i5 | |
| 1920x1080 high (2/3) | |
| MSI Gaming X GeForce GTX 1080 Desktop PC | |
| Acer Aspire 5 A515-51G-51RL | |
| Razer Core V2 GTX 1080 + Eve V m3 | |
| Asus AsusPro P4540UQ-FY0056R | |
| Microsoft Surface Pro (2017) i7 | |
| Microsoft Surface Laptop i7 | |
| Eve-Tech Eve V i5 | |
| 1920x1080 ultra (3/3) best looking | |
| MSI Gaming X GeForce GTX 1080 Desktop PC | |
| Acer Aspire 5 A515-51G-51RL | |
| Razer Core V2 GTX 1080 + Eve V m3 | |
| Asus AsusPro P4540UQ-FY0056R | |
| Microsoft Surface Laptop i7 | |
| Microsoft Surface Pro (2017) i7 | |
| Eve-Tech Eve V i5 | |
(±) A temperatura máxima no lado superior é 42.4 °C / 108 F, em comparação com a média de 35.4 °C / 96 F , variando de 19.6 a 60 °C para a classe Convertible.
(±) A parte inferior aquece até um máximo de 42.1 °C / 108 F, em comparação com a média de 36.9 °C / 98 F
(+) Em uso inativo, a temperatura média para o lado superior é 28.7 °C / 84 F, em comparação com a média do dispositivo de 30.3 °C / ### class_avg_f### F.
(±) Os apoios para as mãos e o touchpad podem ficar muito quentes ao toque, com um máximo de 37.9 °C / 100.2 F.
(-) A temperatura média da área do apoio para as mãos de dispositivos semelhantes foi 28 °C / 82.4 F (-9.9 °C / -17.8 F).
Eve-Tech Eve V i5 análise de áudio
(±) | o volume do alto-falante é médio, mas bom (###valor### dB)
Graves 100 - 315Hz
(-) | quase nenhum baixo - em média 19.5% menor que a mediana
(-) | graves não são lineares (15.5% delta para frequência anterior)
Médios 400 - 2.000 Hz
(±) | médios mais altos - em média 5.4% maior que a mediana
(±) | a linearidade dos médios é média (7.7% delta para frequência anterior)
Altos 2 - 16 kHz
(±) | máximos mais altos - em média 6.7% maior que a mediana
(±) | a linearidade dos máximos é média (7.4% delta para frequência anterior)
Geral 100 - 16.000 Hz
(±) | a linearidade do som geral é média (25.7% diferença em relação à mediana)
Comparado com a mesma classe
» 79% de todos os dispositivos testados nesta classe foram melhores, 4% semelhantes, 17% piores
» O melhor teve um delta de 6%, a média foi 20%, o pior foi 57%
Comparado com todos os dispositivos testados
» 79% de todos os dispositivos testados foram melhores, 4% semelhantes, 17% piores
» O melhor teve um delta de 4%, a média foi 24%, o pior foi 134%
Apple MacBook 12 (Early 2016) 1.1 GHz análise de áudio
(+) | os alto-falantes podem tocar relativamente alto (###valor### dB)
Graves 100 - 315Hz
(±) | graves reduzidos - em média 11.3% menor que a mediana
(±) | a linearidade dos graves é média (14.2% delta para a frequência anterior)
Médios 400 - 2.000 Hz
(+) | médios equilibrados - apenas 2.4% longe da mediana
(+) | médios são lineares (5.5% delta para frequência anterior)
Altos 2 - 16 kHz
(+) | agudos equilibrados - apenas 2% longe da mediana
(+) | os máximos são lineares (4.5% delta da frequência anterior)
Geral 100 - 16.000 Hz
(+) | o som geral é linear (10.2% diferença em relação à mediana)
Comparado com a mesma classe
» 7% de todos os dispositivos testados nesta classe foram melhores, 2% semelhantes, 91% piores
» O melhor teve um delta de 5%, a média foi 18%, o pior foi 53%
Comparado com todos os dispositivos testados
» 5% de todos os dispositivos testados foram melhores, 1% semelhantes, 94% piores
» O melhor teve um delta de 4%, a média foi 24%, o pior foi 134%
| desligado | |
| Ocioso | |
| Carga |
|
Key:
min: | |
| Eve-Tech Eve V i5 i5-7Y54, HD Graphics 615, Intel SSD 600p SSDPEKKW256G7, IPS LED, 2880x1920, 12.3" | Eve-Tech Eve V m3 m3-7Y30, HD Graphics 615, Intel SSD 600p SSDPEKKW128G7, IPS, 2880x1920, 12.3" | Eve-Tech Eve V i7 i7-7Y75, HD Graphics 615, Intel SSD 600p SSDPEKKW512G7, IPS, 2880x1920, 12.3" | Microsoft Surface Pro (2017) i5 i5-7300U, HD Graphics 620, Samsung PM971 KUS030202M, IPS, 2736x1824, 12.3" | Samsung Galaxy Book 12 SM-W728 i5-7200U, HD Graphics 620, Samsung SSD PM871a MZNLN256HMHQ, Super AMOLED, 2160x1440, 12" | Huawei MateBook X i5-7200U, HD Graphics 620, LITEON CB1-SD256, , 2160x1440, 13.3" | HP Elite x2 1012 G2-1LV76EA i5-7200U, HD Graphics 620, Samsung PM961 MZVLW256HEHP, IPS, 2716x1824, 12.3" | |
|---|---|---|---|---|---|---|---|
| Power Consumption | -0% | -4% | -1% | -17% | -42% | -35% | |
| Idle Minimum * (Watt) | 4.2 | 4.3 -2% | 4.5 -7% | 3.6 14% | 3.9 7% | 4.6 -10% | 4.1 2% |
| Idle Average * (Watt) | 7.2 | 7.3 -1% | 7.6 -6% | 8.1 -13% | 9 -25% | 11 -53% | 9.2 -28% |
| Idle Maximum * (Watt) | 7.8 | 7.8 -0% | 8.1 -4% | 8.7 -12% | 11.9 -53% | 12 -54% | 11.1 -42% |
| Load Average * (Watt) | 20.4 | 21.1 -3% | 22 -8% | 25.5 -25% | 27.3 -34% | 39.5 -94% | 33.8 -66% |
| Load Maximum * (Watt) | 34.6 | 33.2 4% | 33.1 4% | 23.5 32% | 27.9 19% | 34.6 -0% | 49.2 -42% |
* ... menor é melhor
| Eve-Tech Eve V i5 i5-7Y54, HD Graphics 615, 48 Wh | Eve-Tech Eve V m3 m3-7Y30, HD Graphics 615, 48 Wh | Eve-Tech Eve V i7 i7-7Y75, HD Graphics 615, 48 Wh | Microsoft Surface Pro (2017) i5 i5-7300U, HD Graphics 620, 45 Wh | Samsung Galaxy Book 12 SM-W728 i5-7200U, HD Graphics 620, 39 Wh | Huawei MateBook X i5-7200U, HD Graphics 620, 40 Wh | HP Elite x2 1012 G2-1LV76EA i5-7200U, HD Graphics 620, 47 Wh | Lenovo ThinkPad X1 Tablet Gen 2 i5-7Y54, HD Graphics 615, 37 Wh | Microsoft Surface Pro (2017) i7 i7-7660U, Iris Plus Graphics 640, 45 Wh | |
|---|---|---|---|---|---|---|---|---|---|
| Duração da bateria | -5% | -14% | 25% | -16% | -42% | -28% | -24% | -5% | |
| Reader / Idle (h) | 16.5 | 17.6 7% | 17.2 4% | 8.5 -48% | 13.9 -16% | 11 -33% | |||
| H.264 (h) | 10.6 | 10.1 -5% | 9.4 -11% | 6.8 -36% | 6.3 -41% | 10.2 -4% | |||
| WiFi v1.3 (h) | 8.7 | 7.3 -16% | 12.4 43% | 5.6 -36% | 6.3 -28% | 7.4 -15% | 8.2 -6% | ||
| Witcher 3 ultra (h) | 3.2 | 1.9 | |||||||
| Load (h) | 2.9 | 2.8 | 2.7 | 2.3 | 2.2 | 1.9 |
Pro
Contra
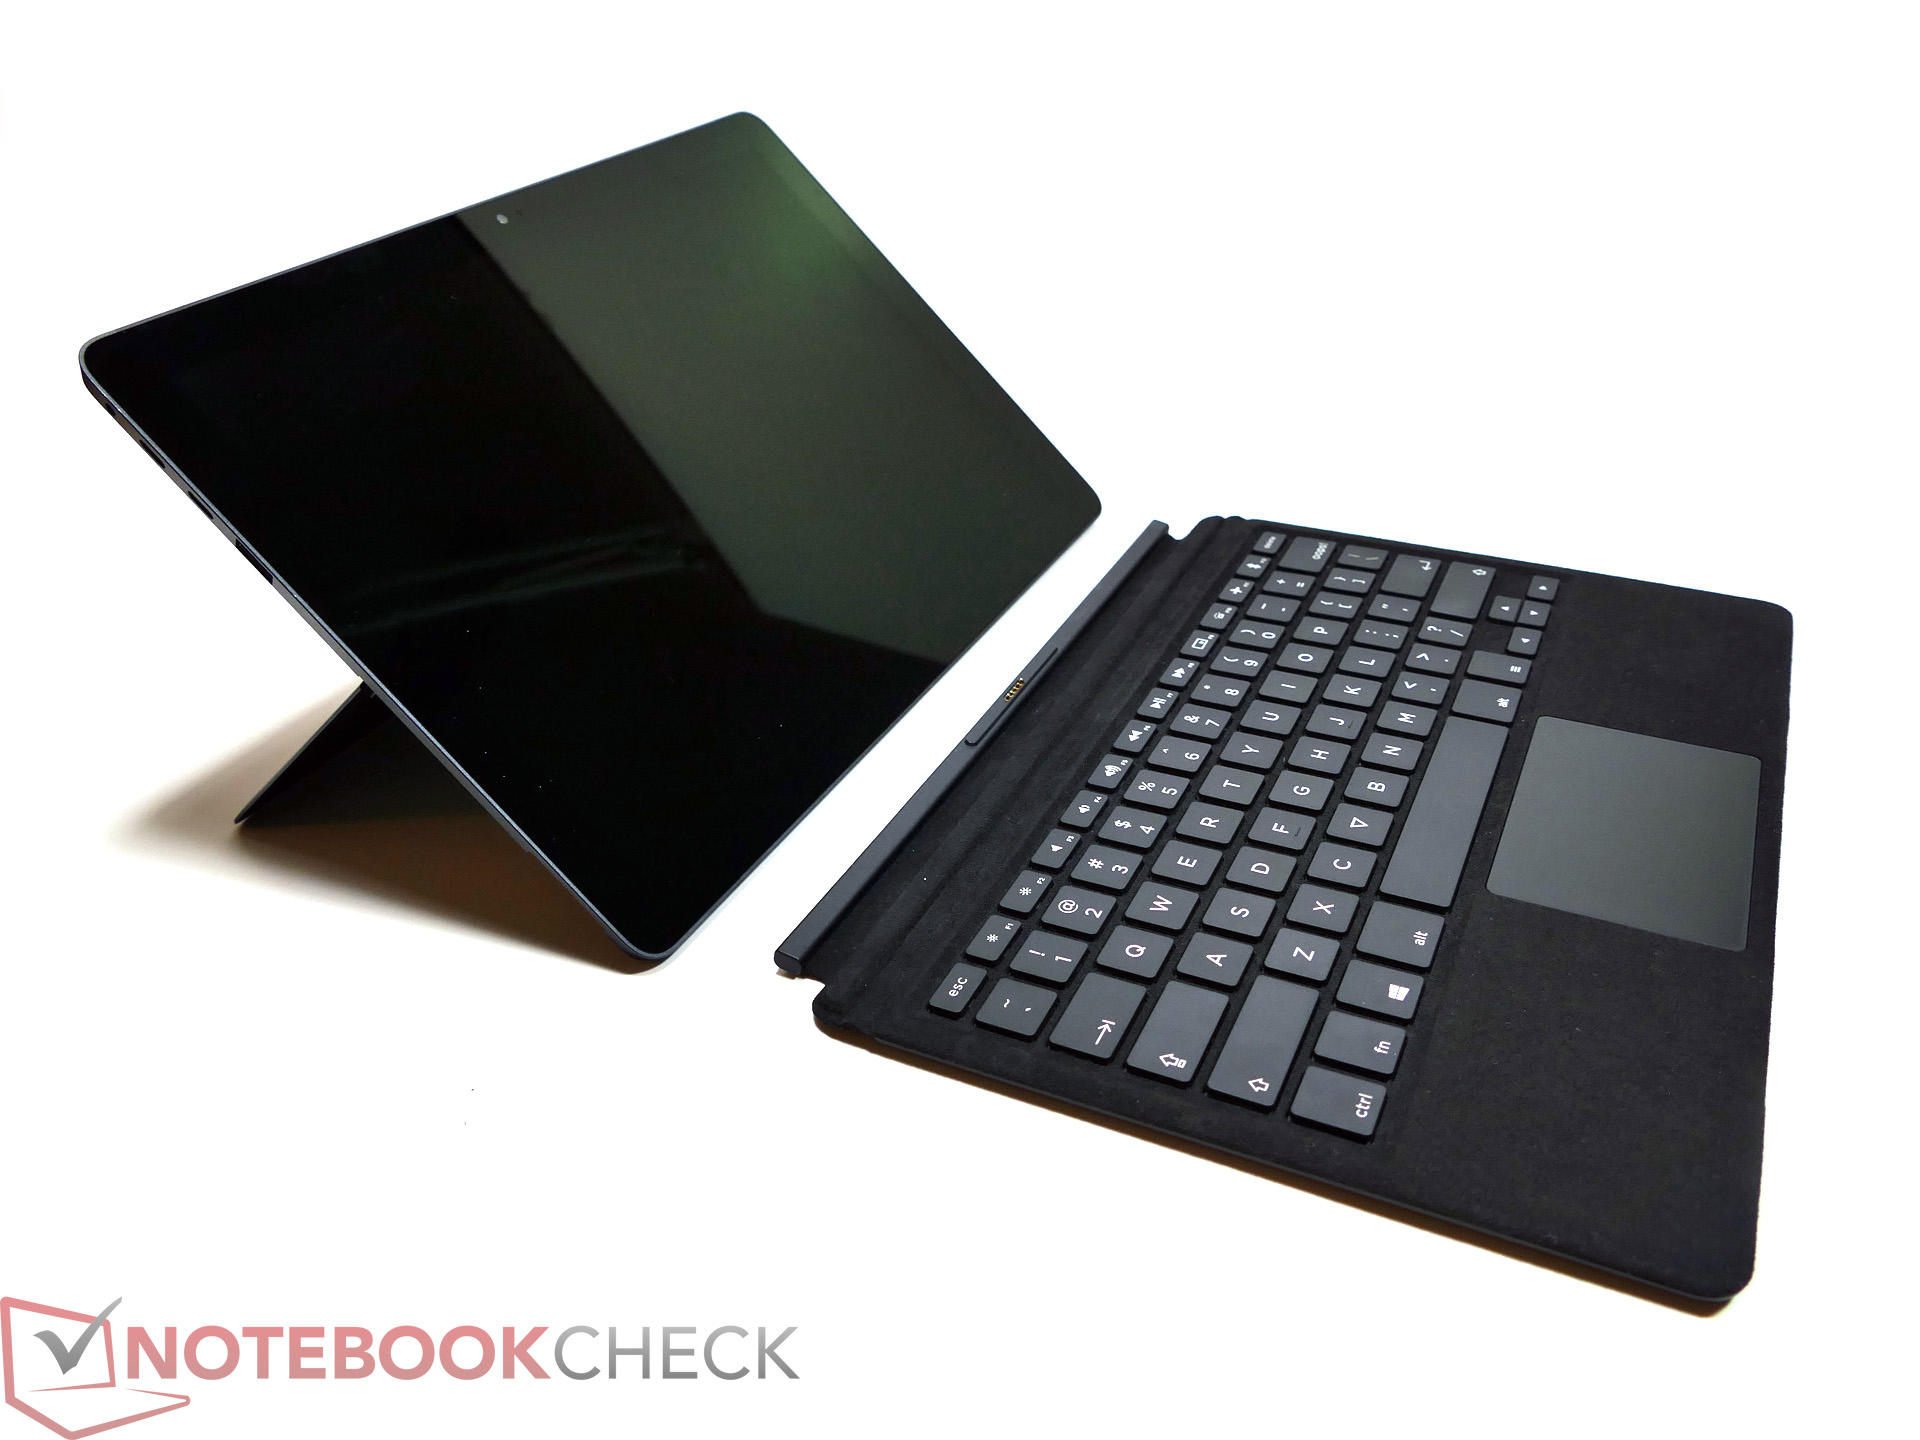
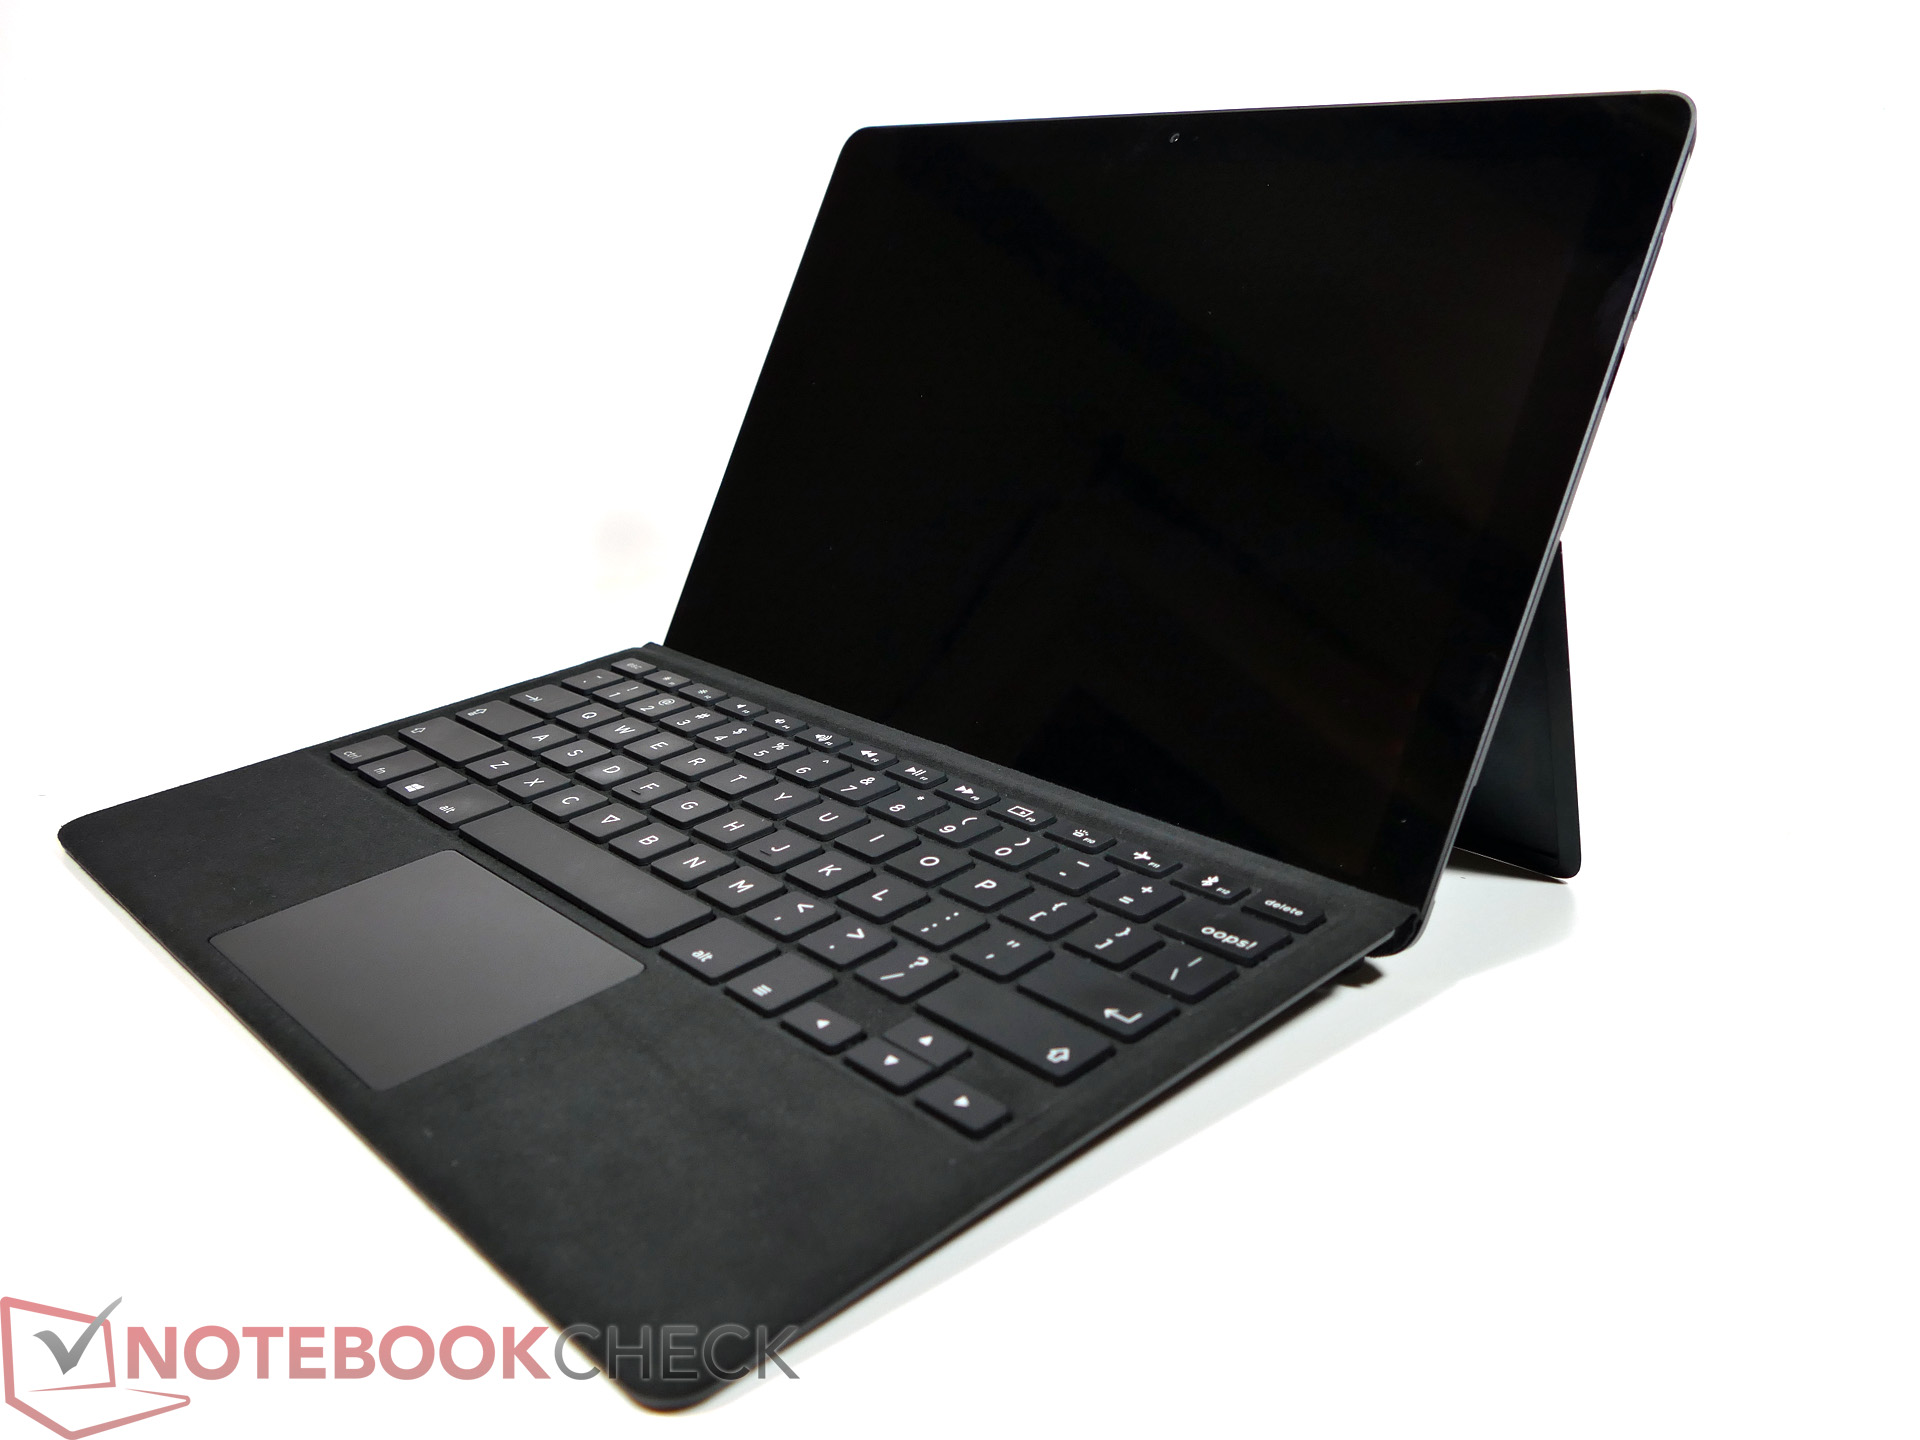
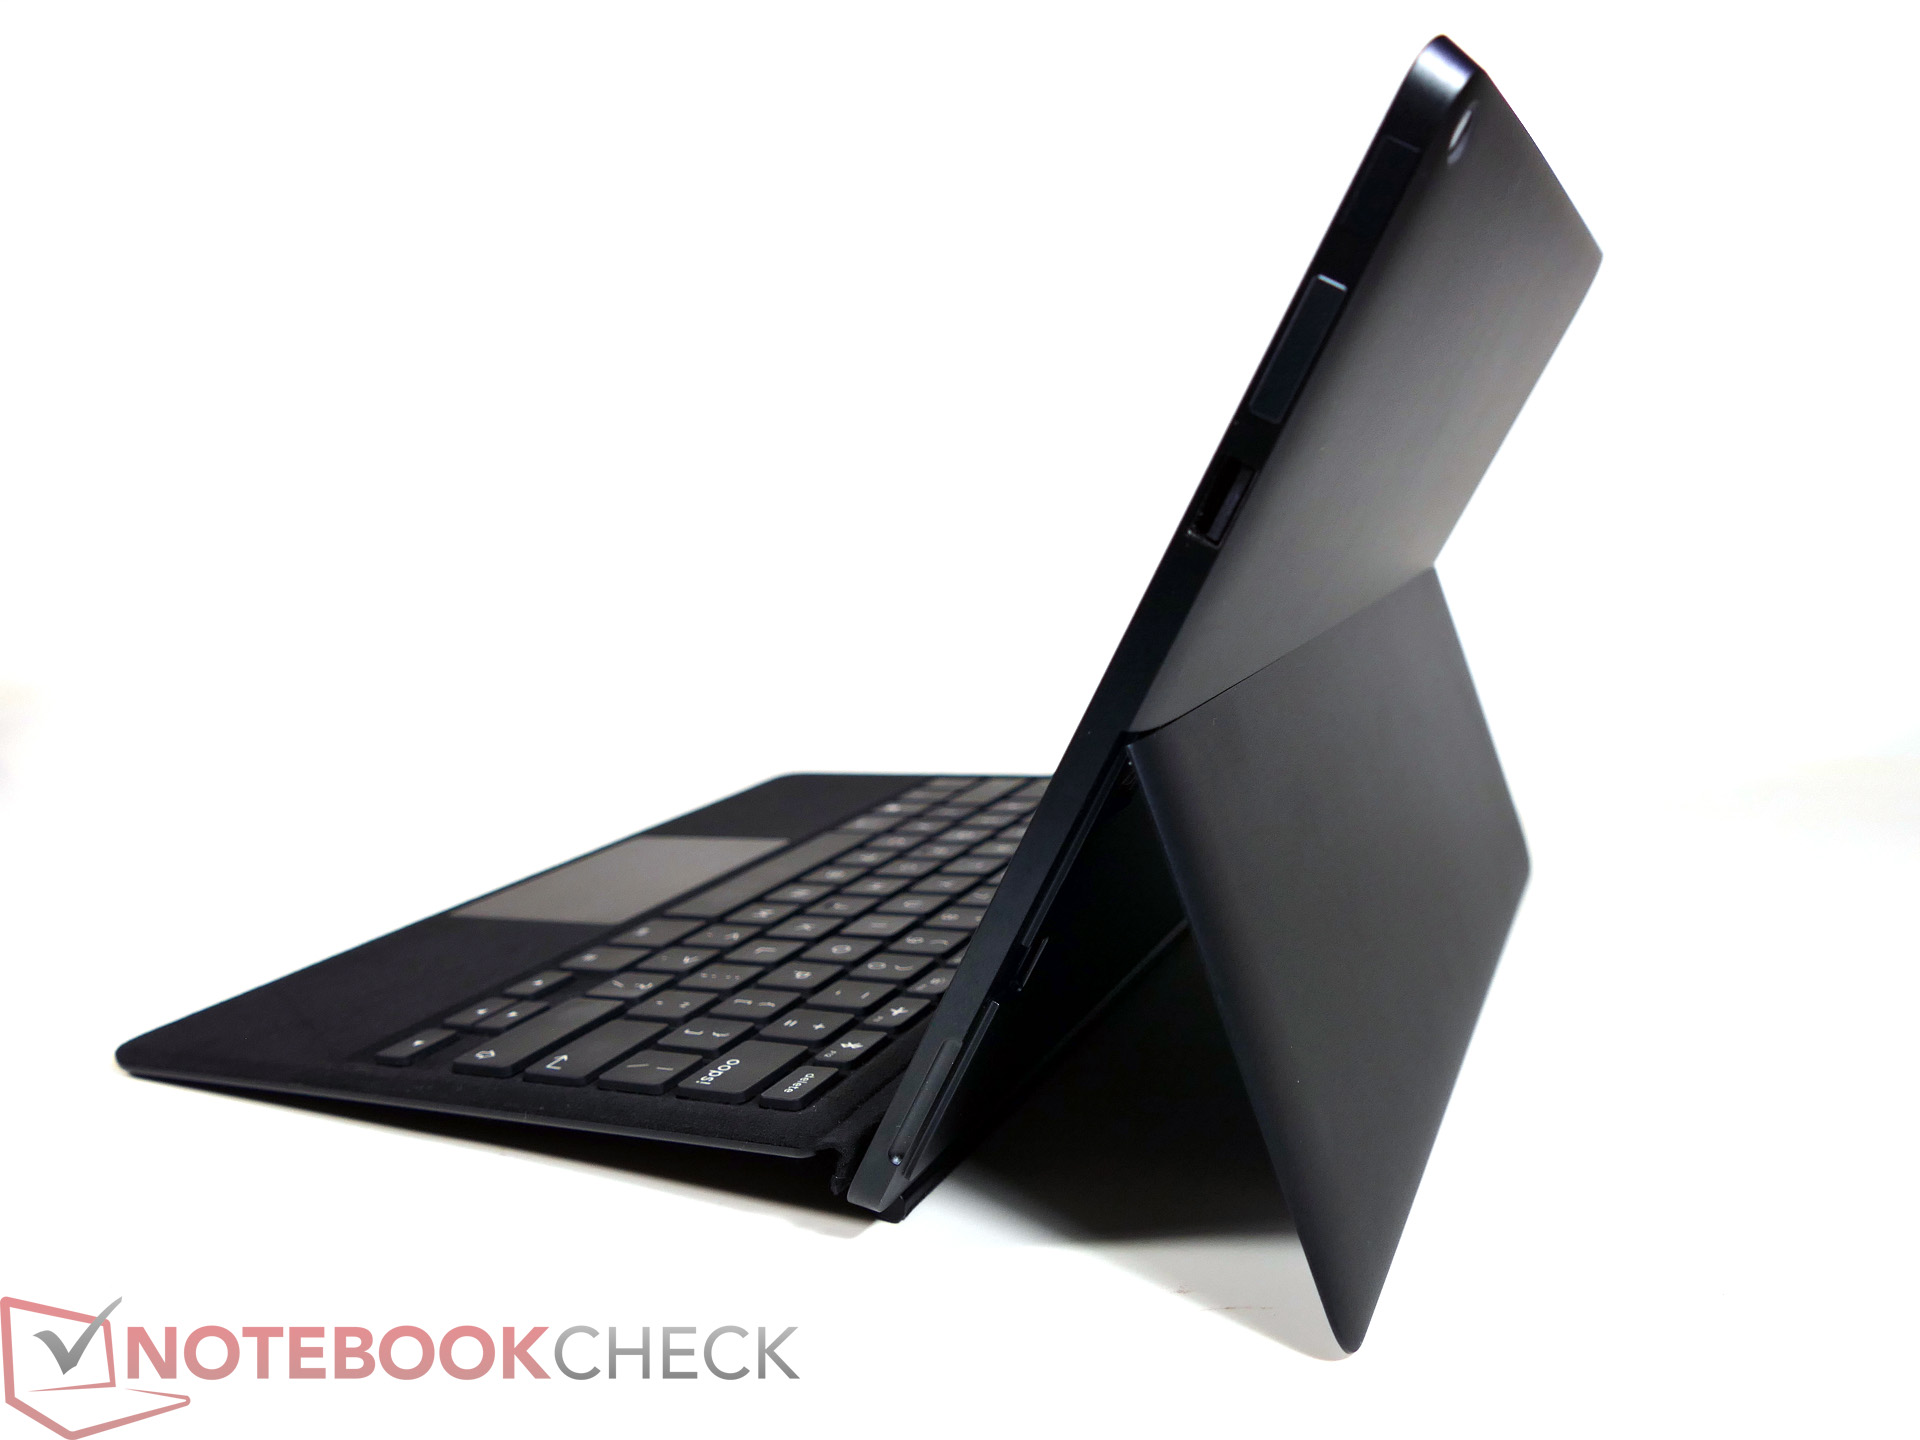
E aqui está, o novo conversível do povo, o Eve V! Aqui está um resumo do nosso teste:
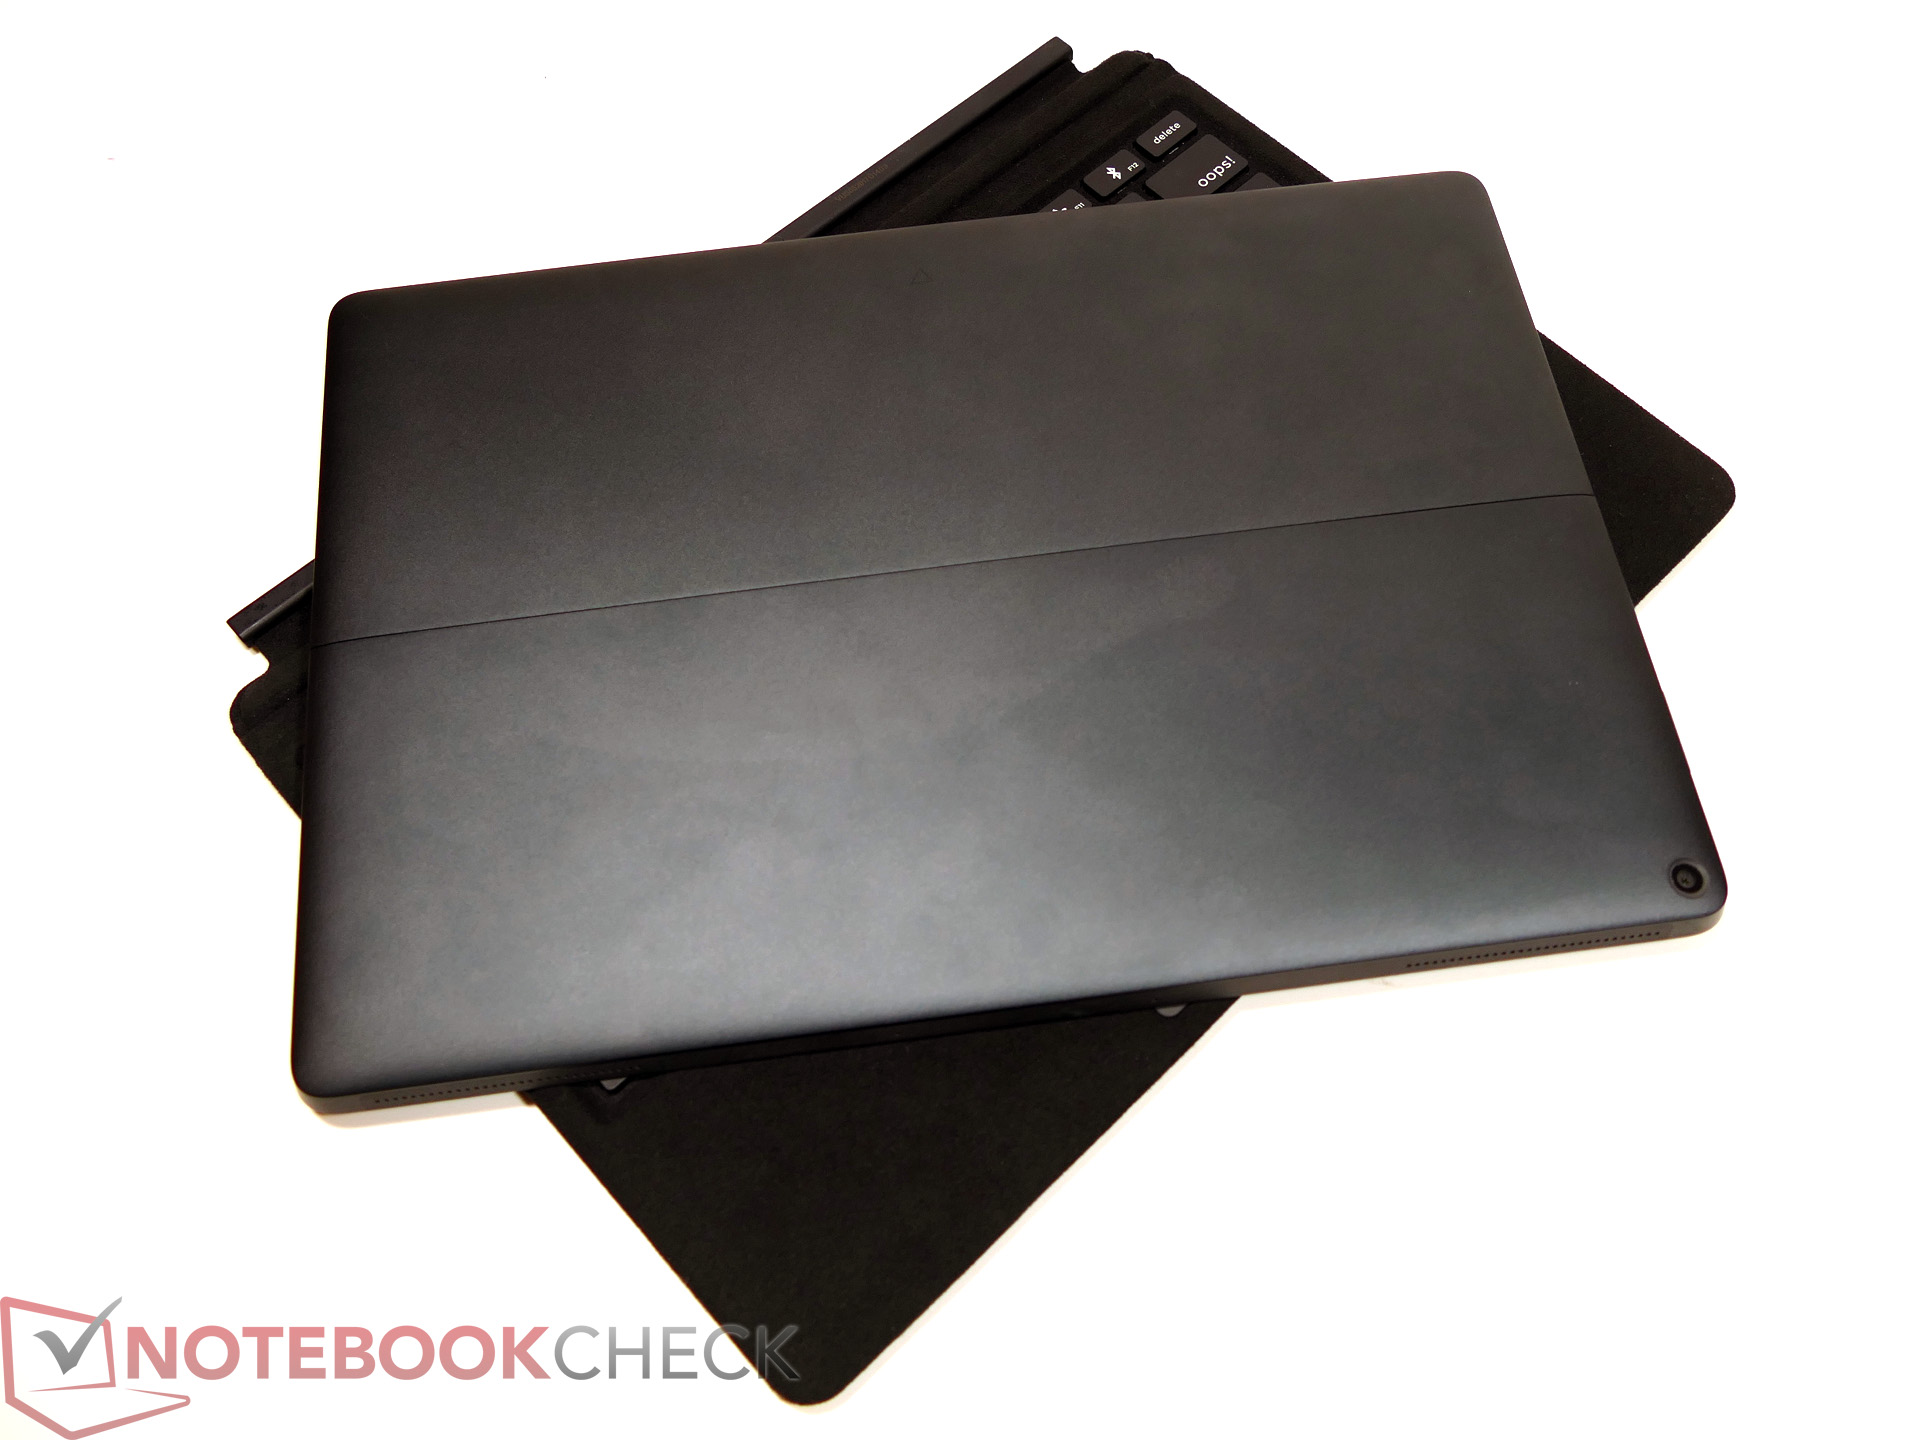
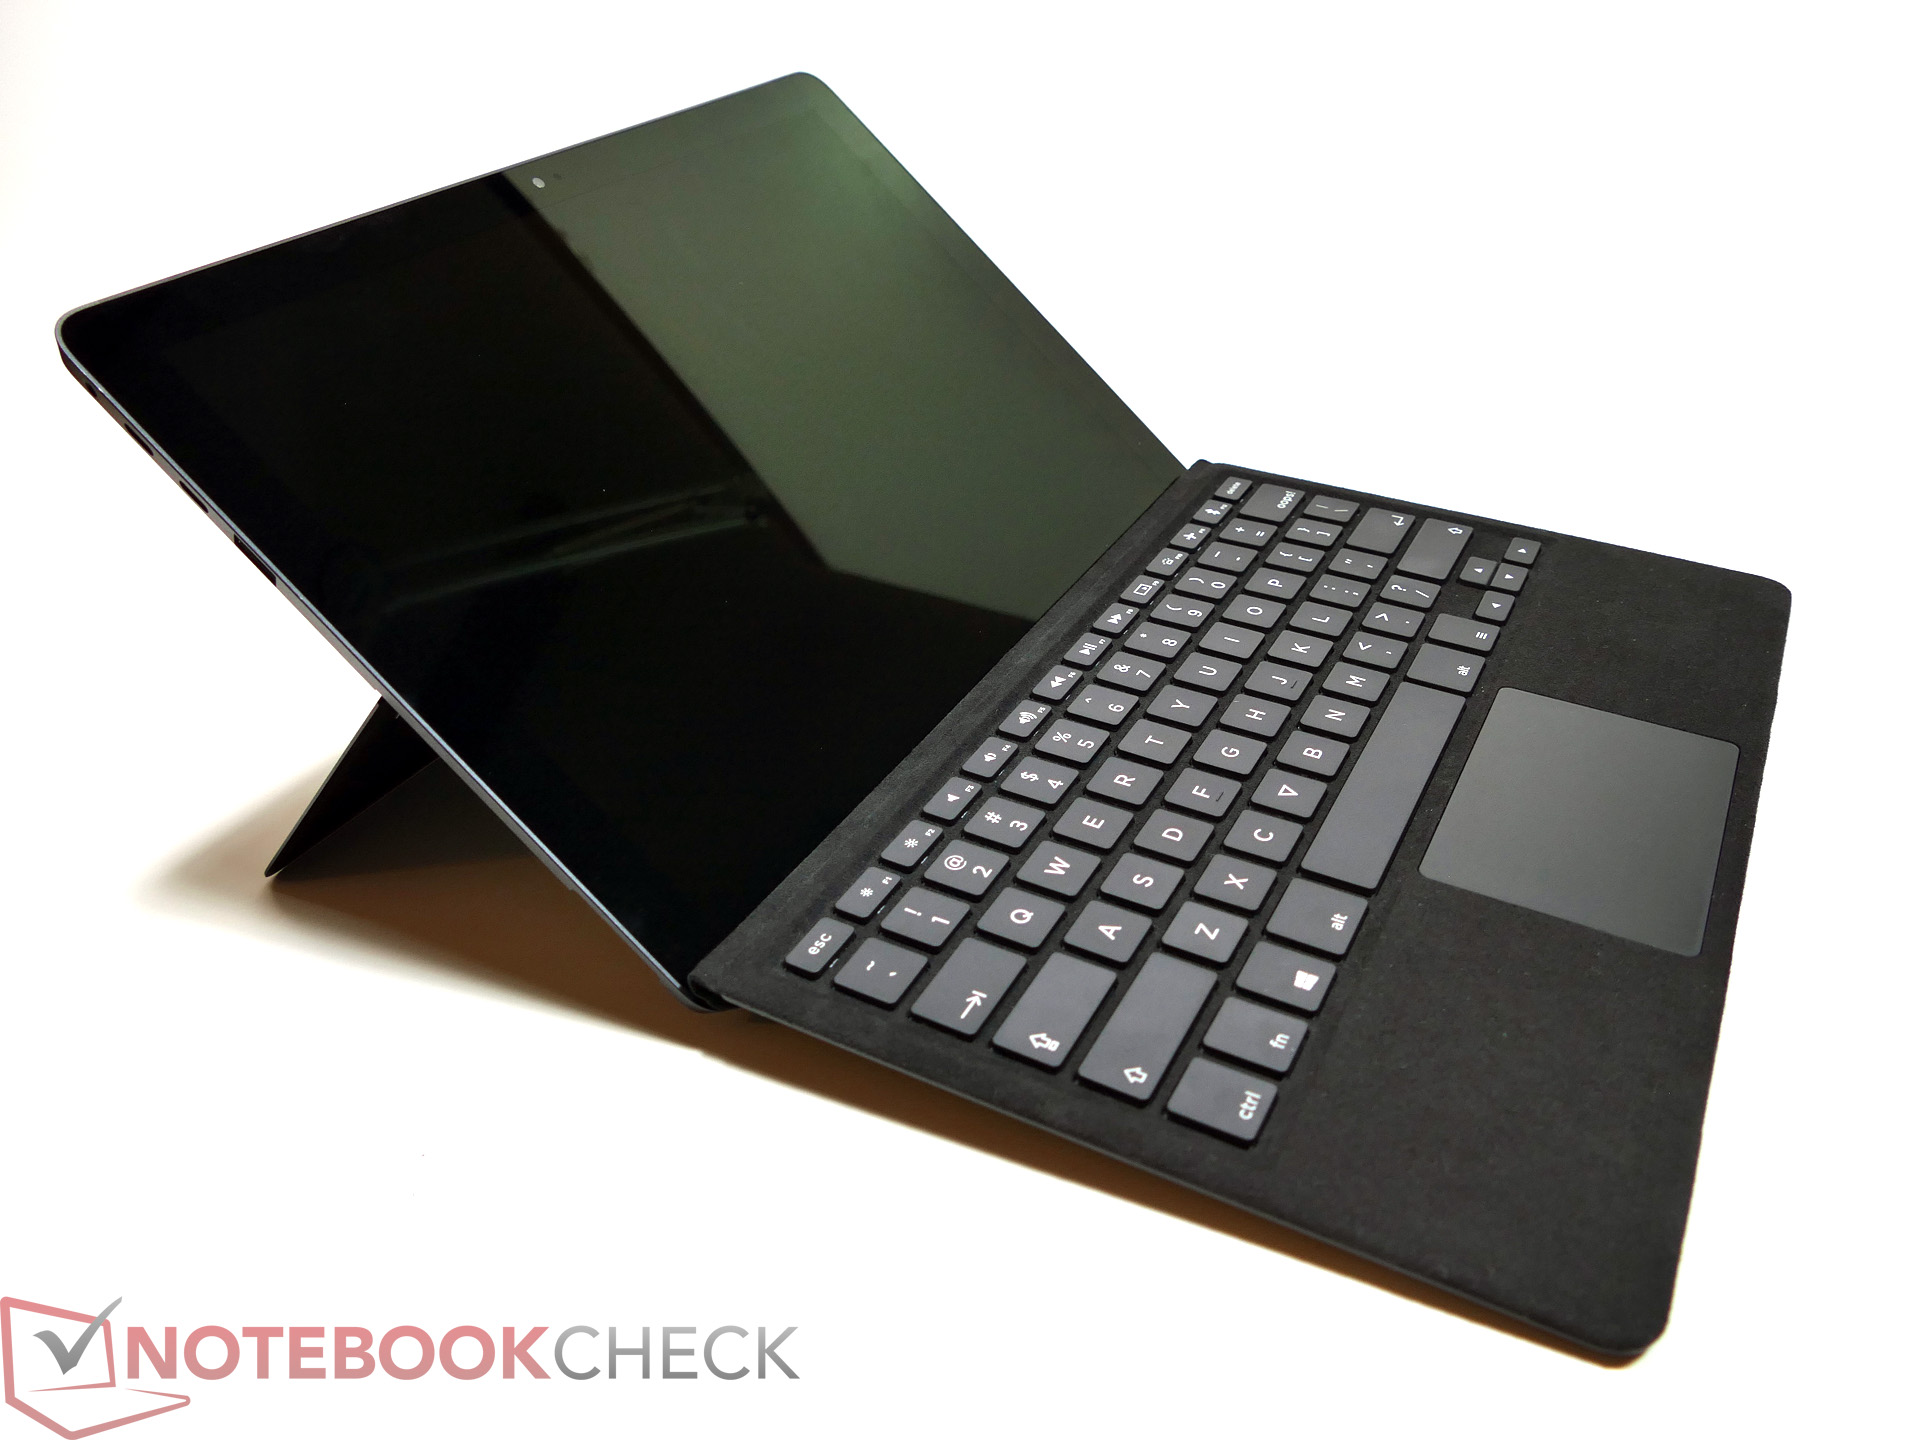
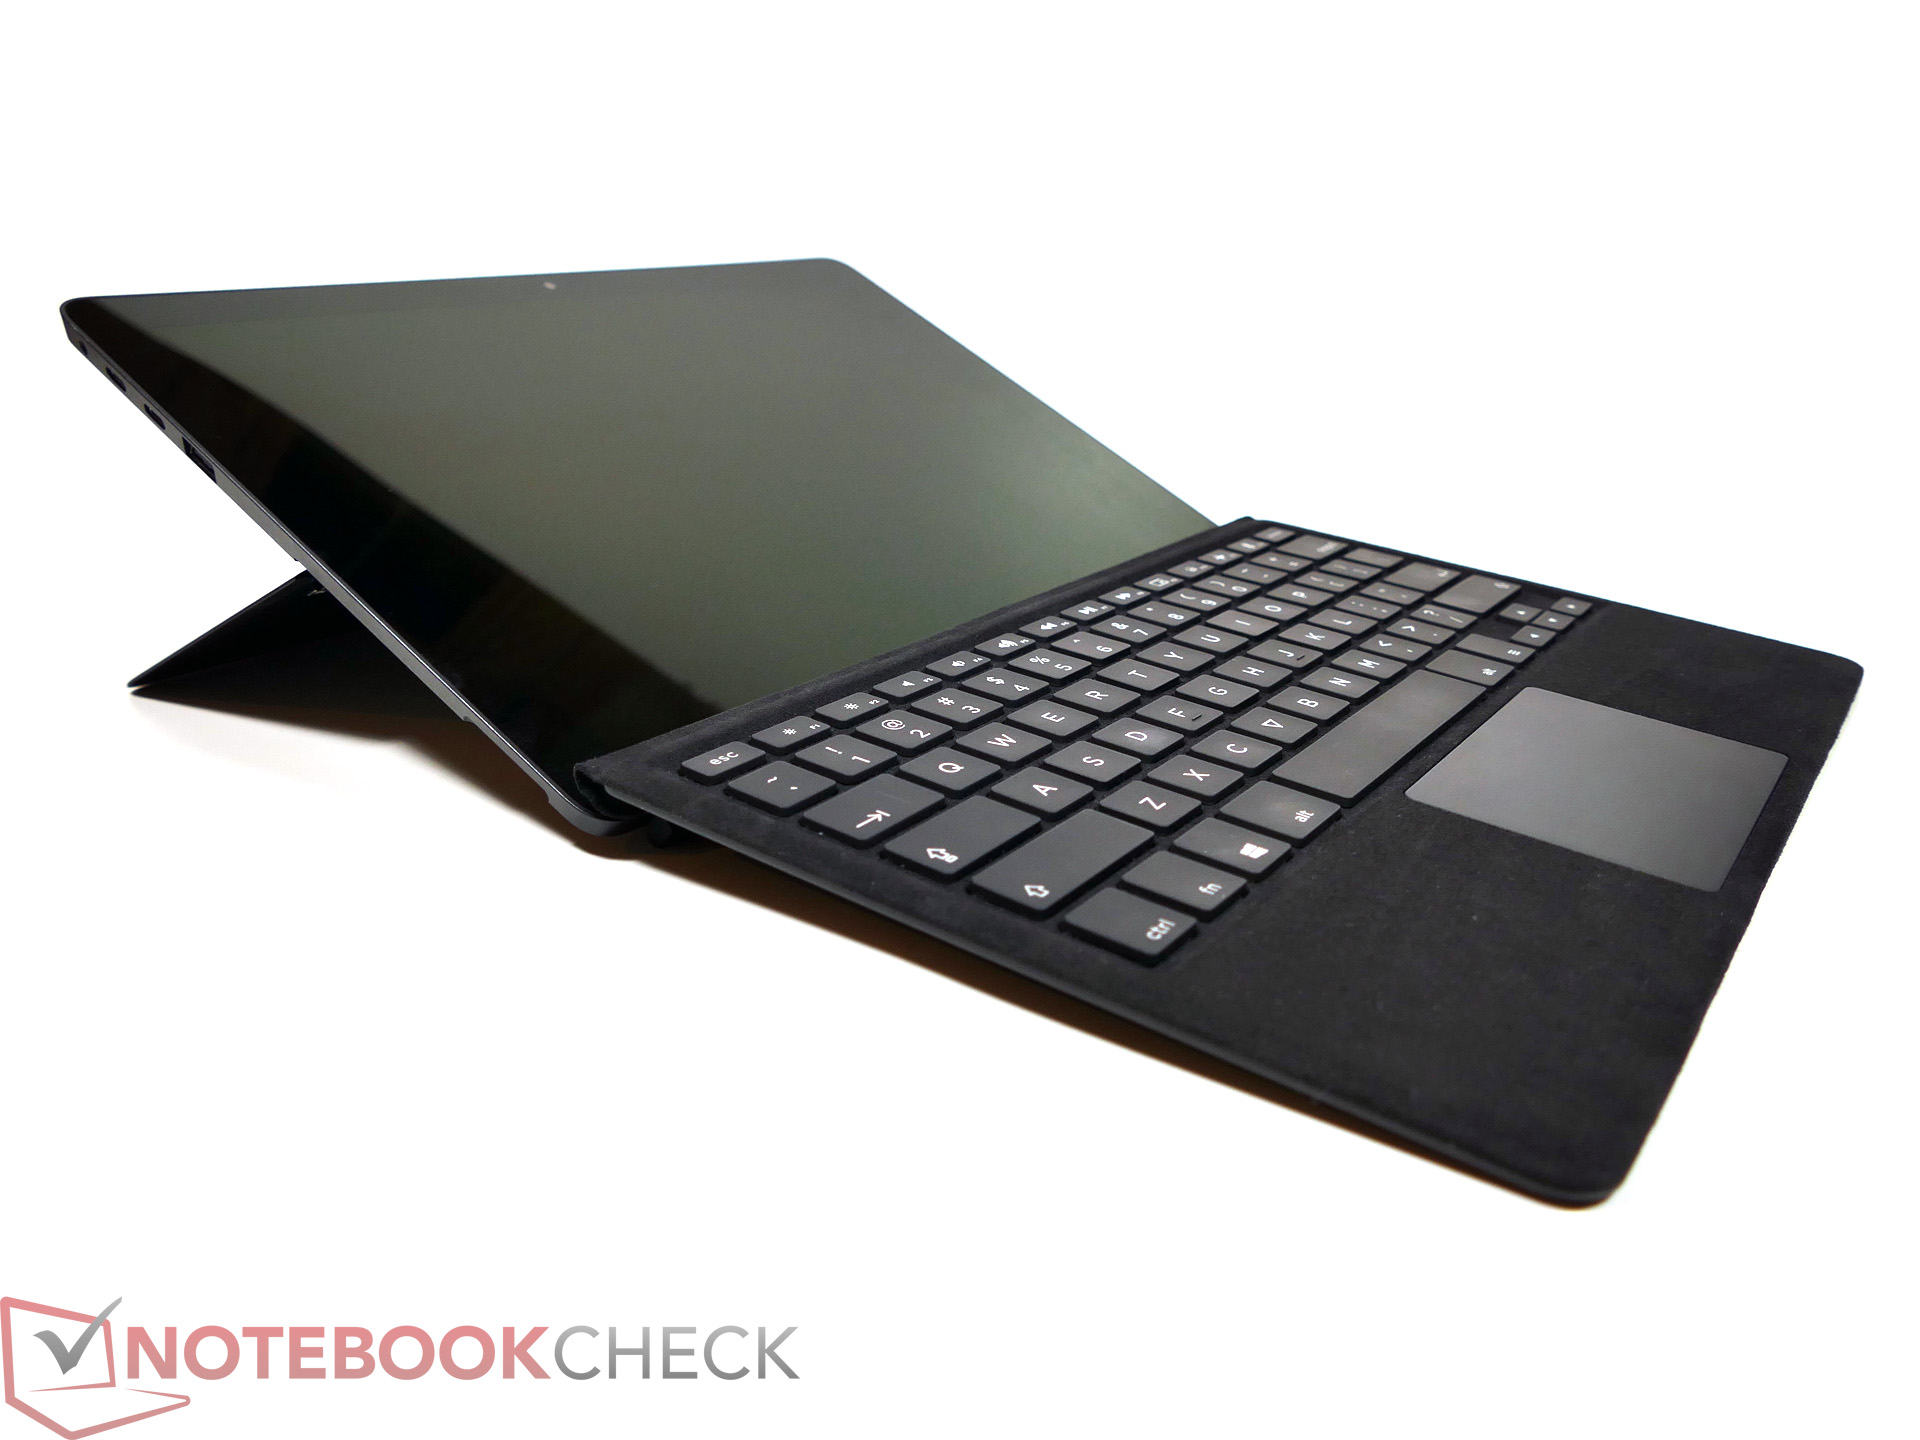
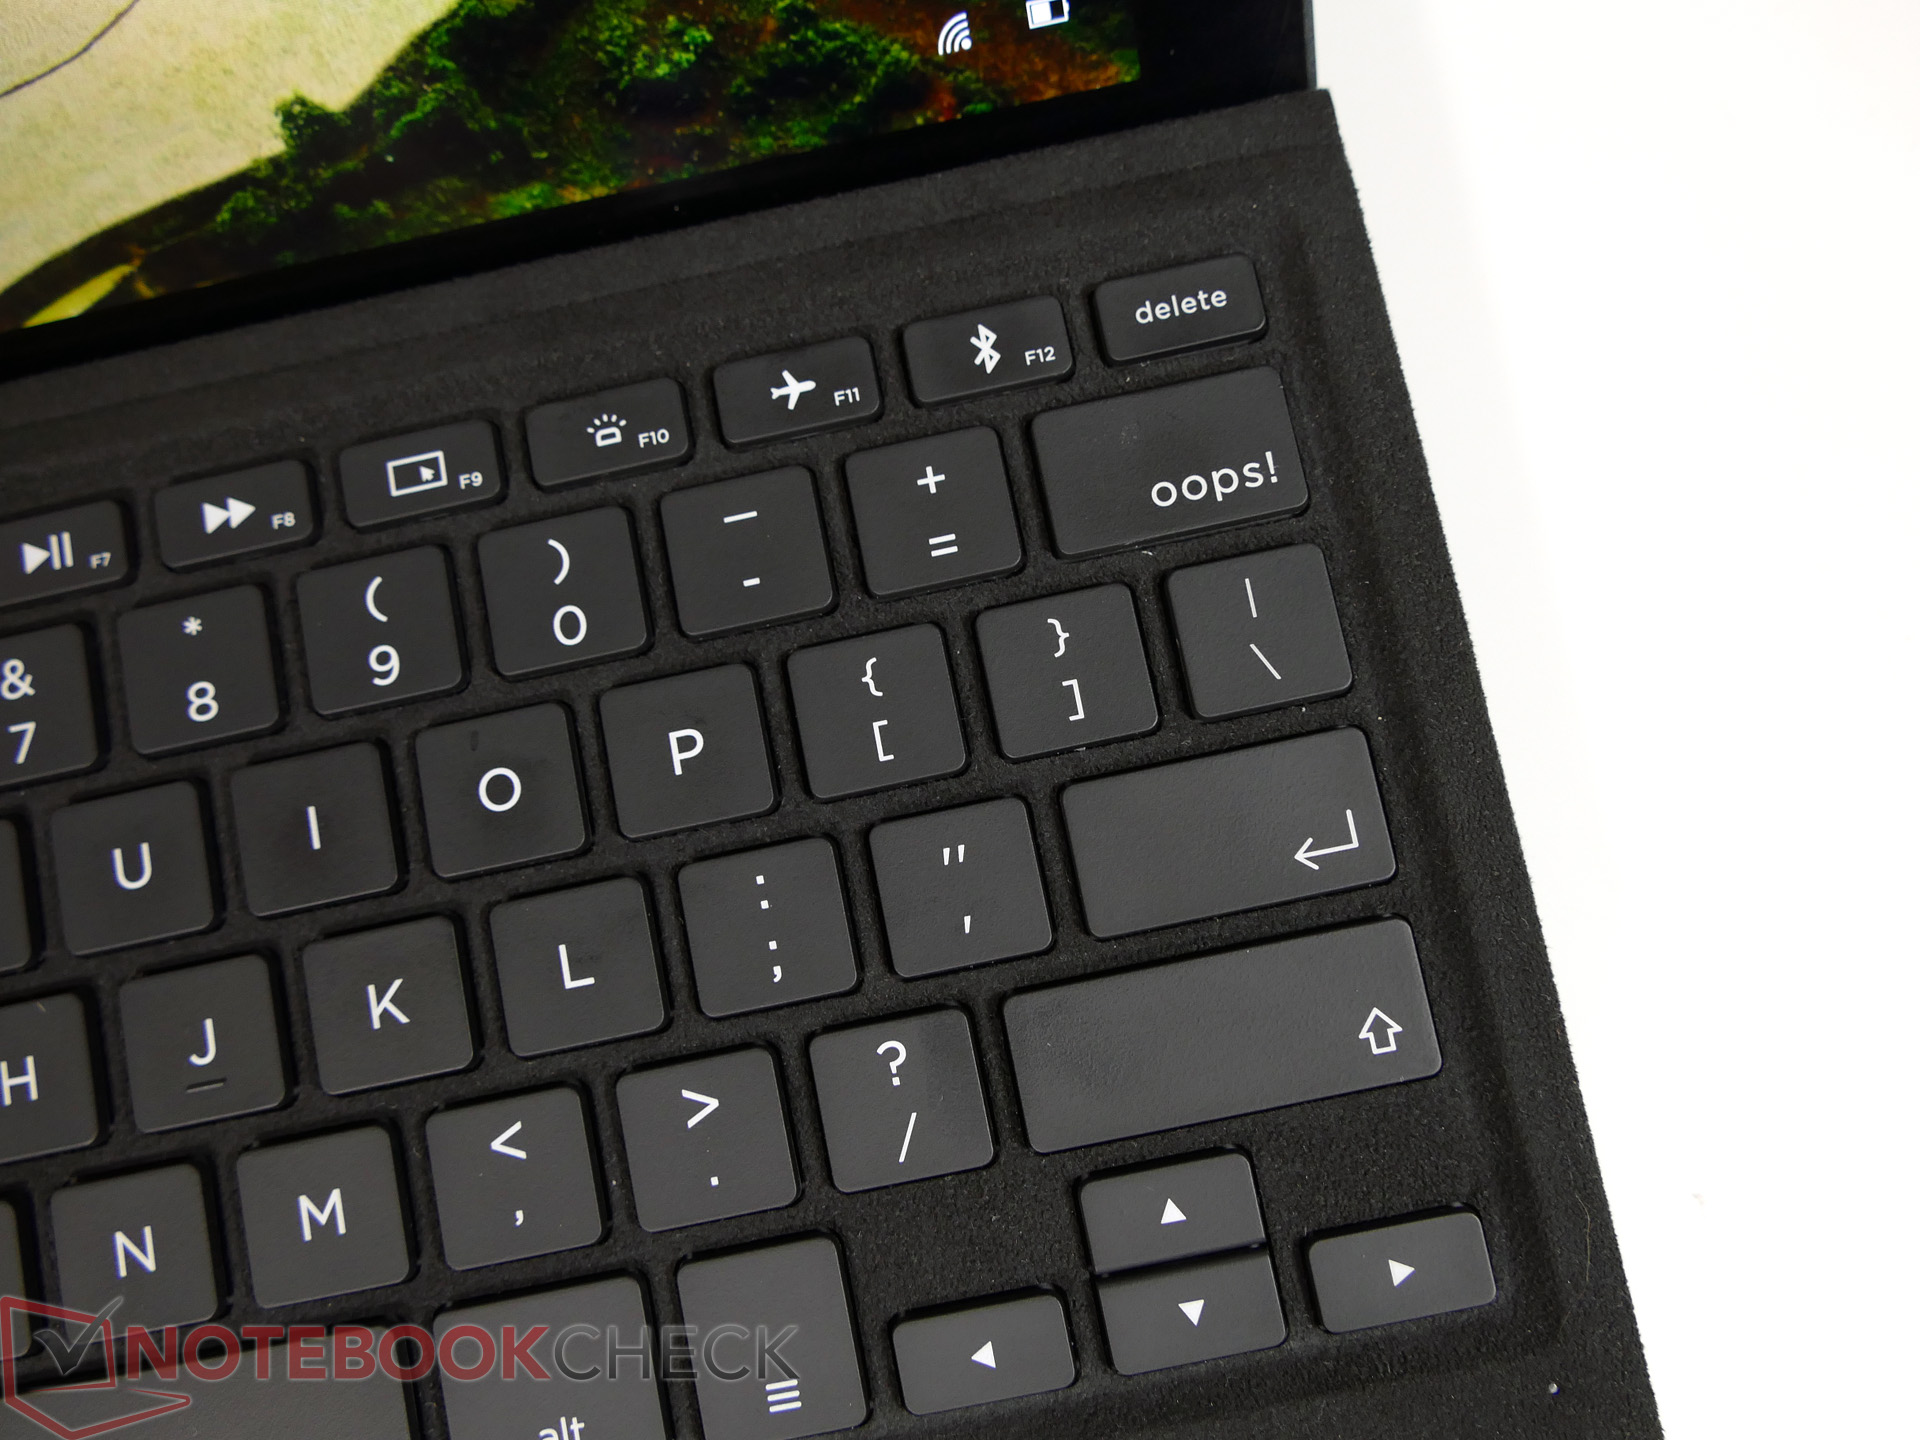
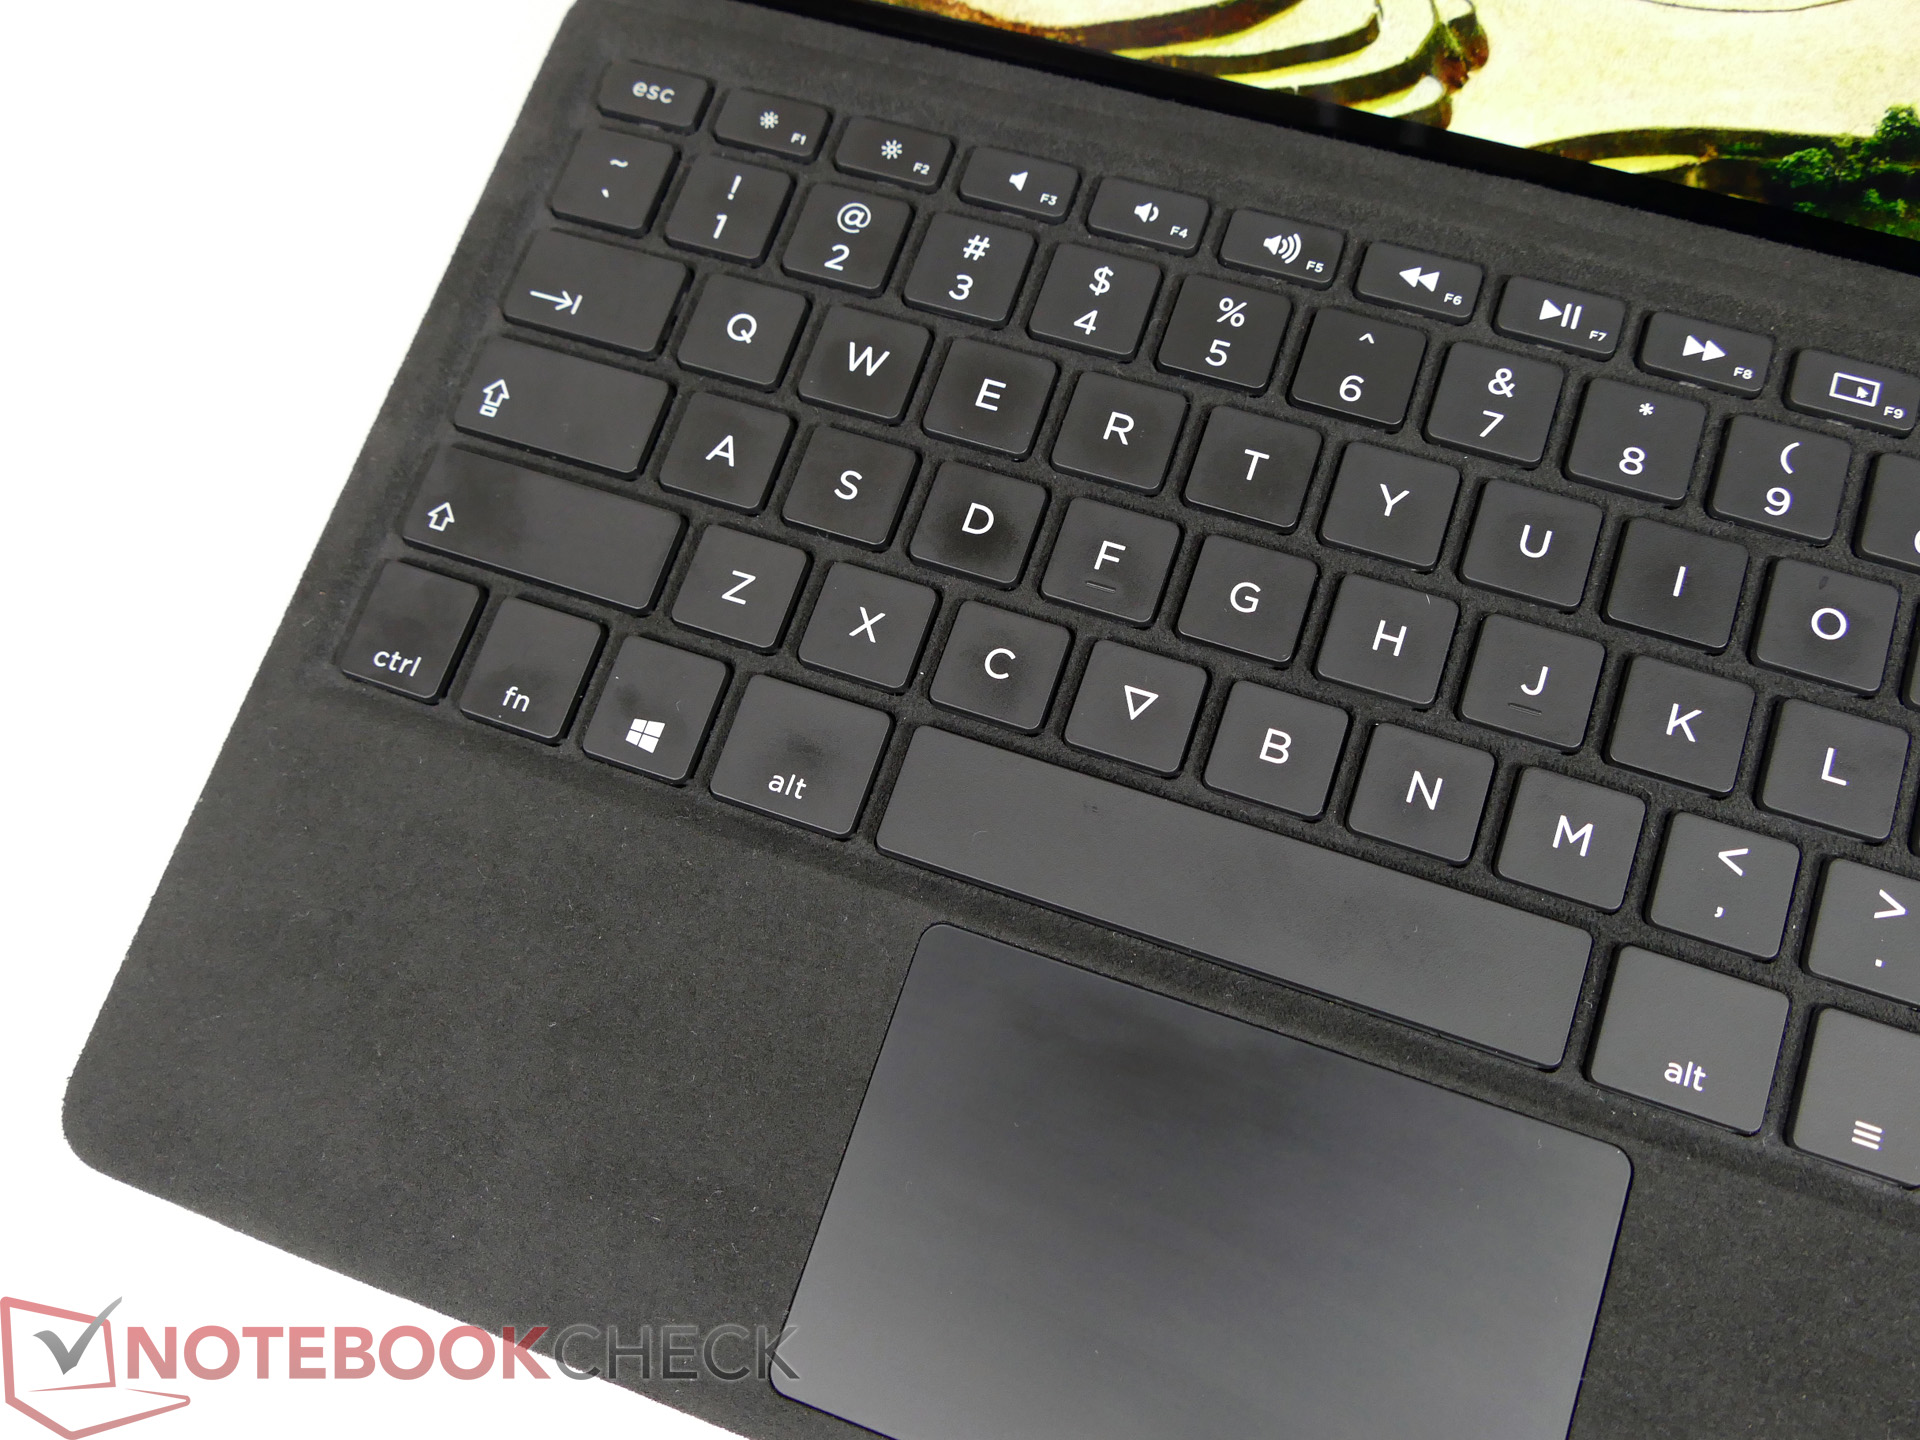
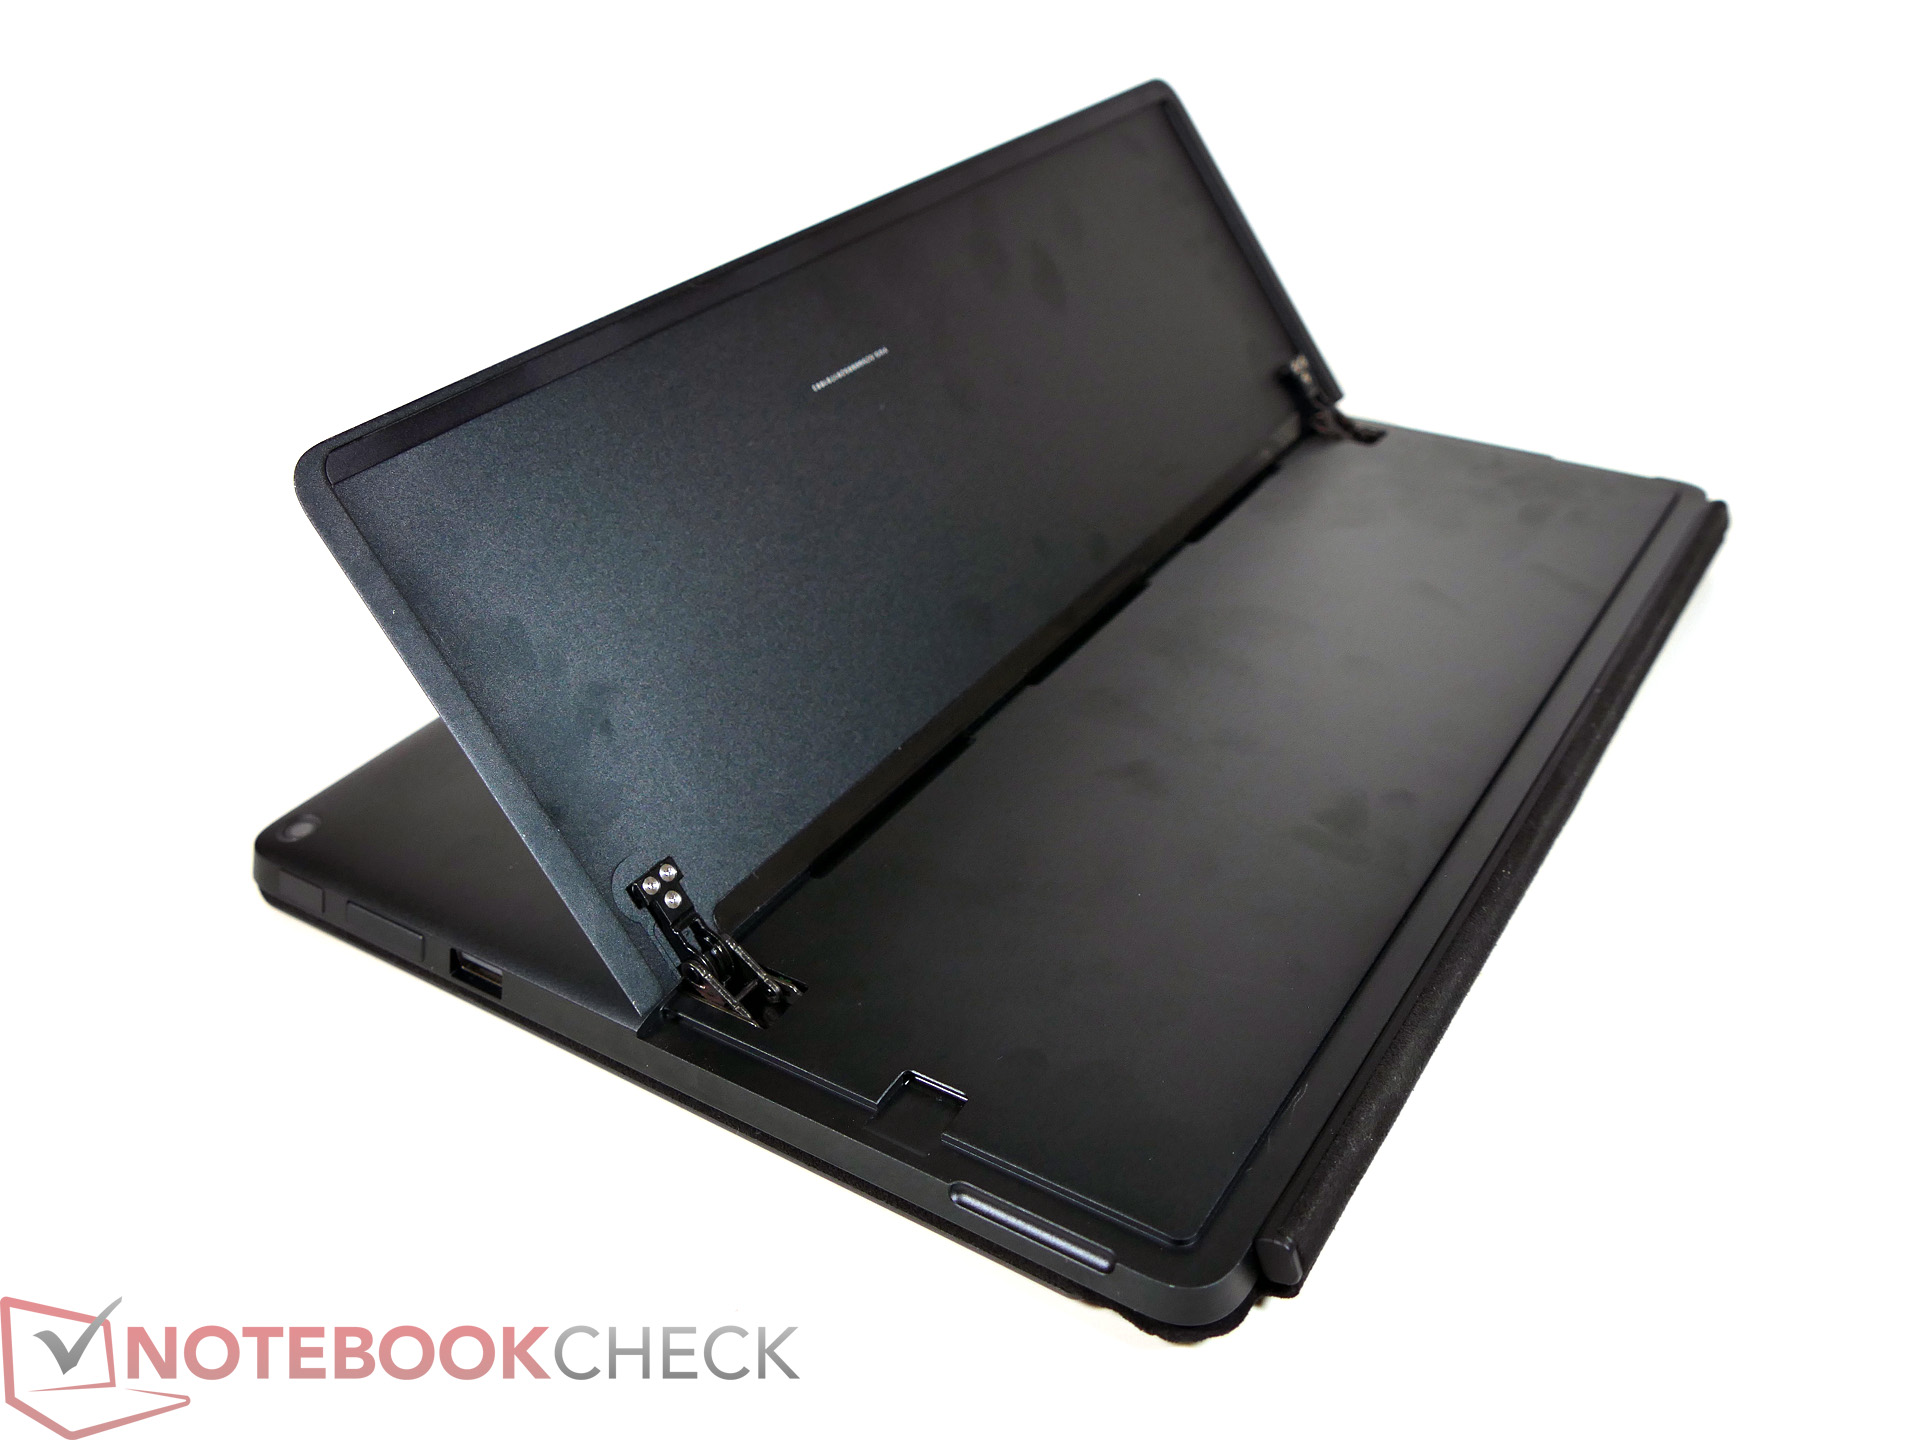
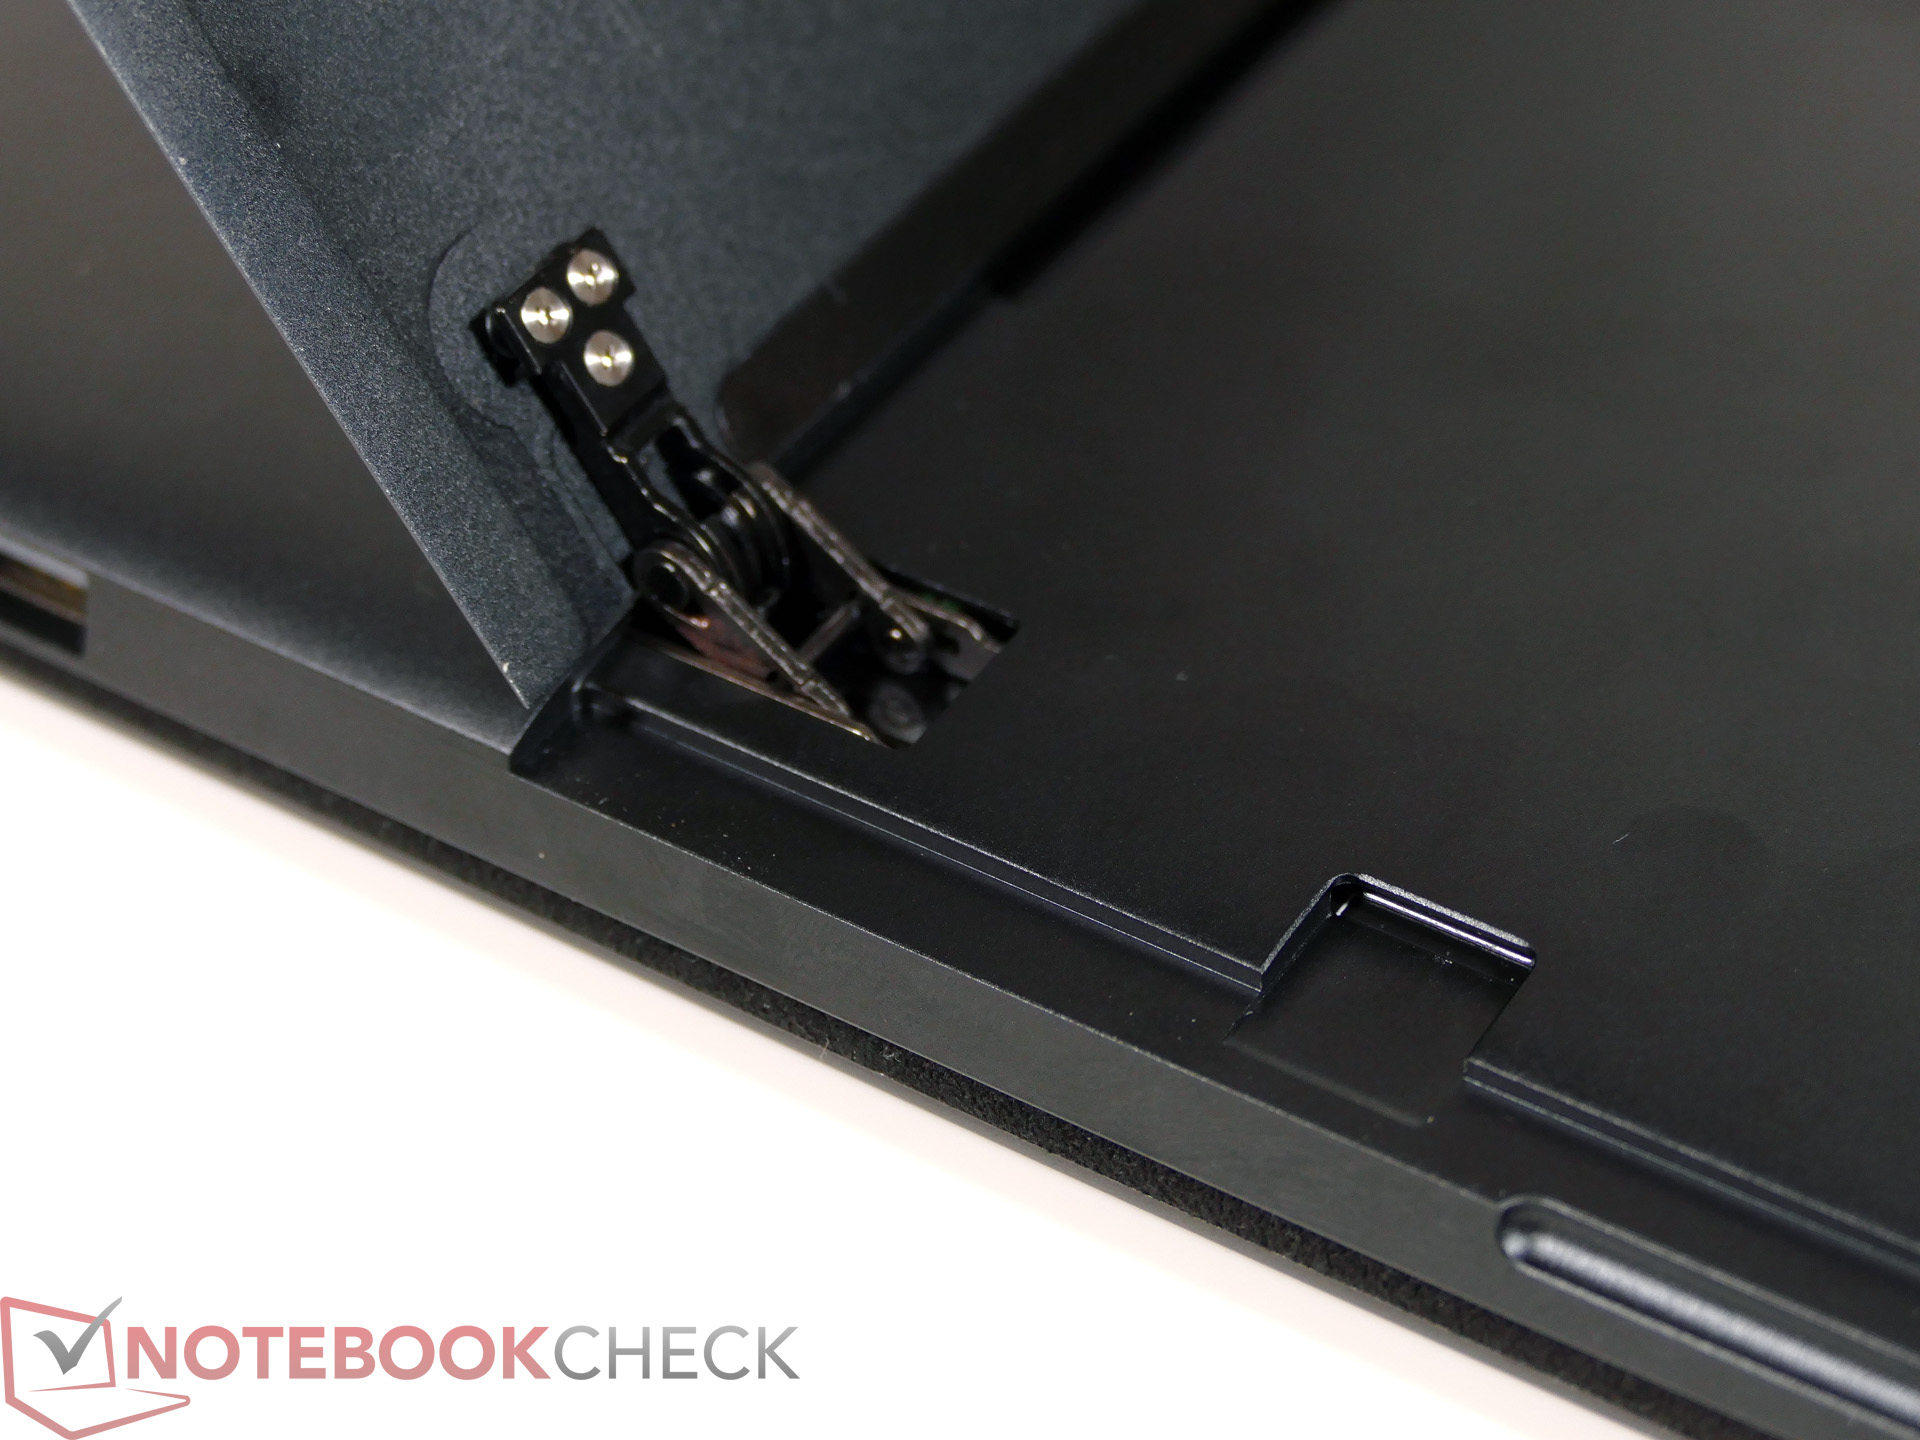
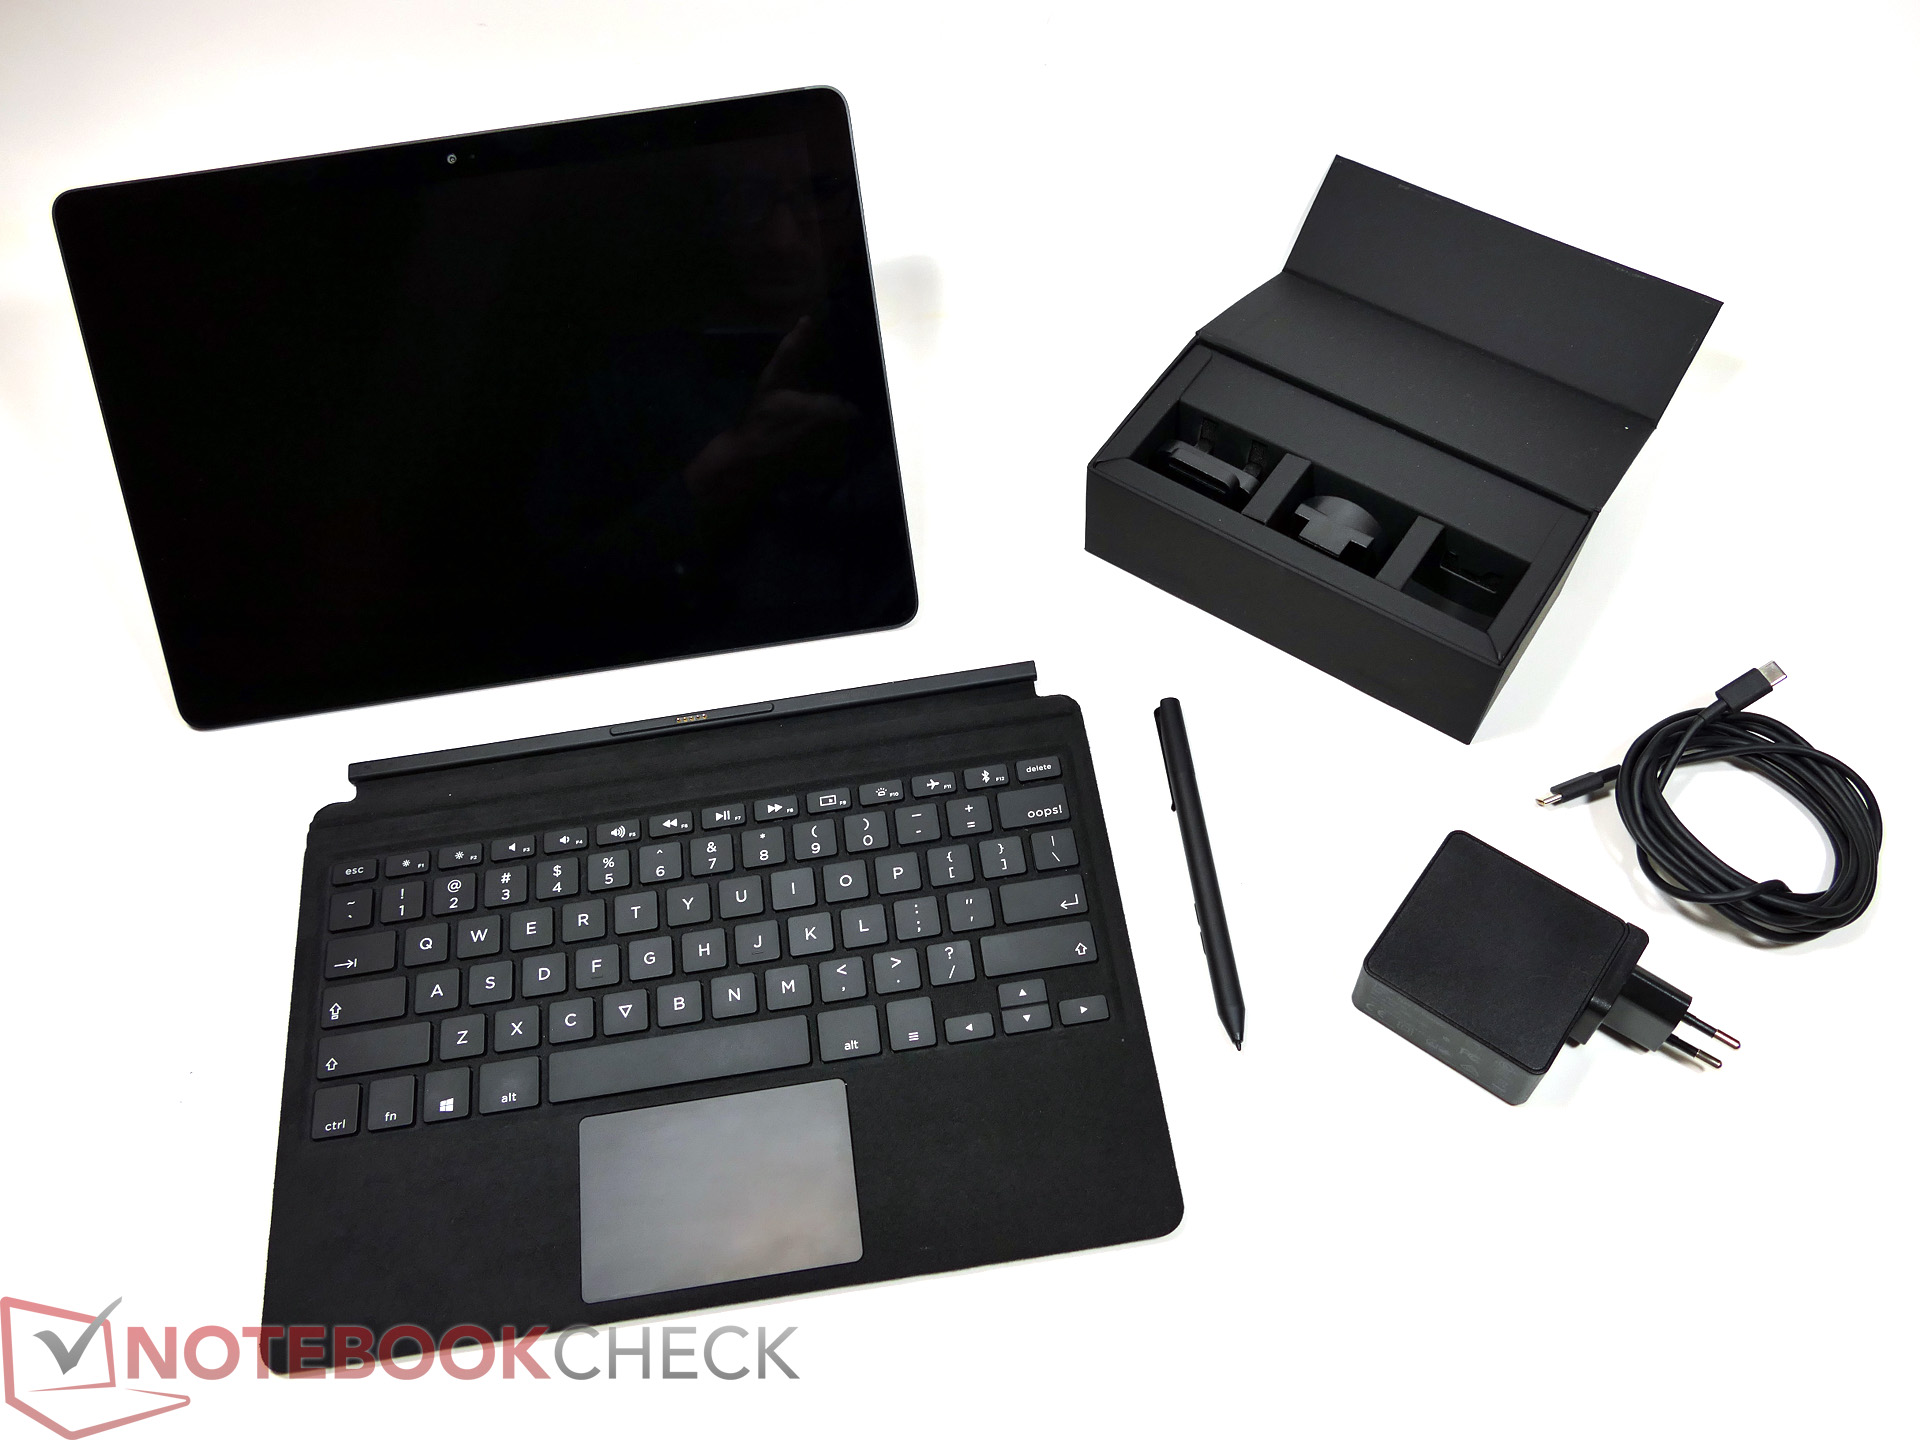
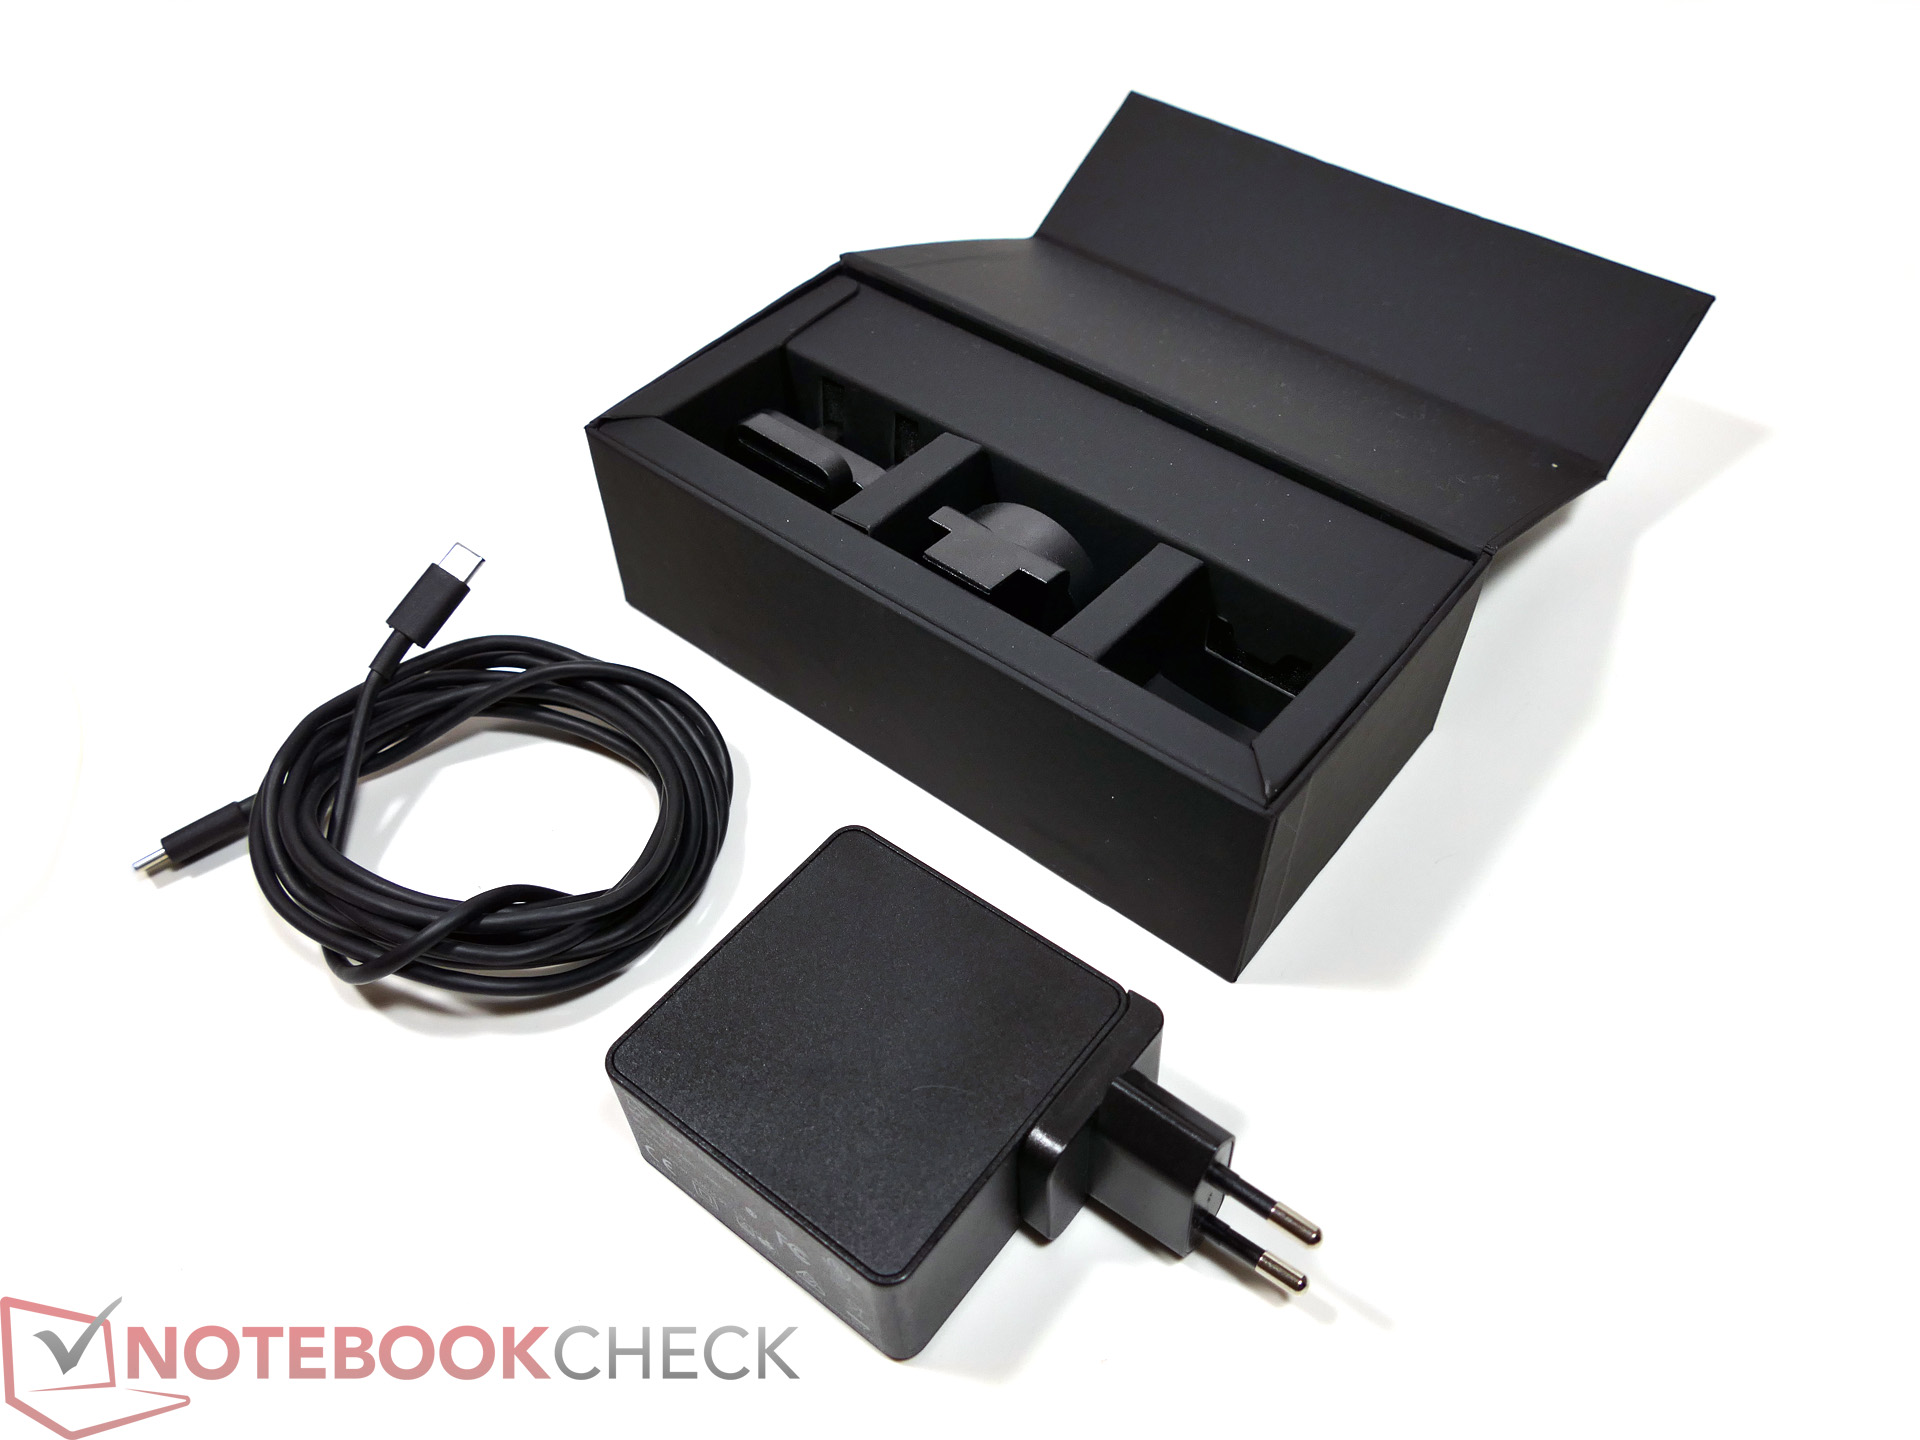
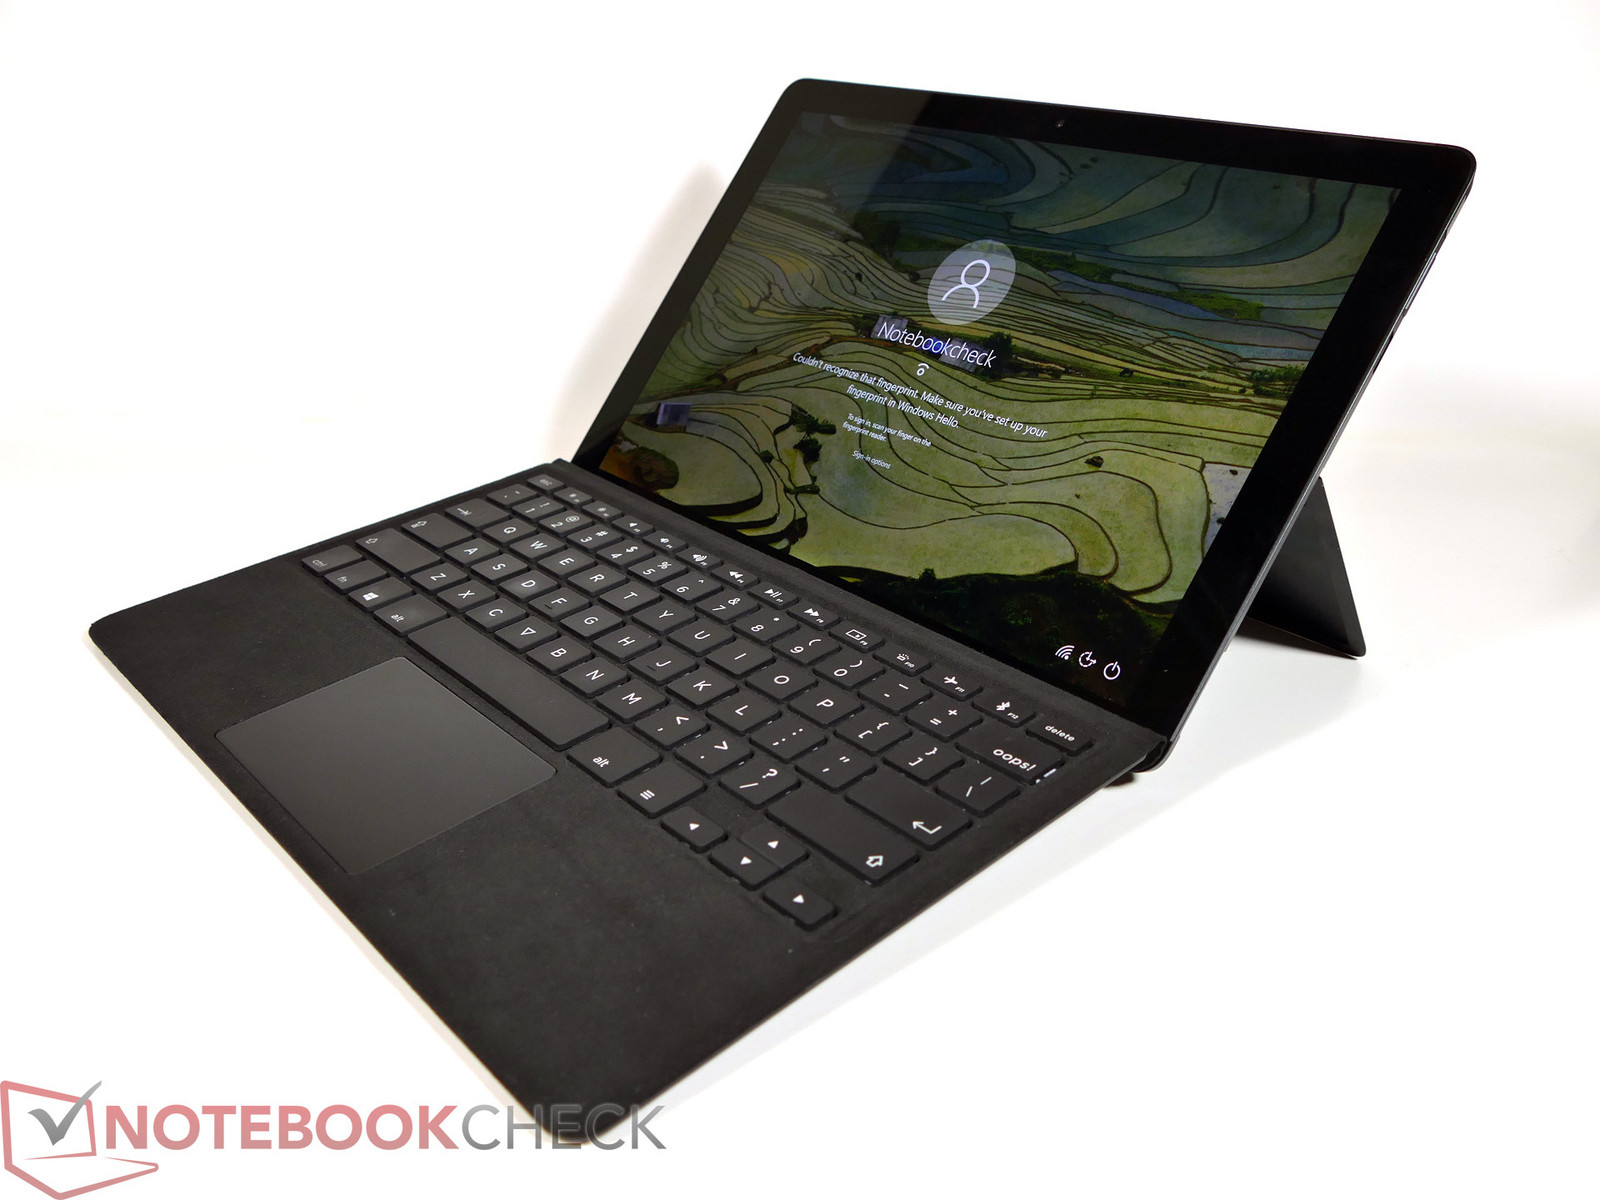
Em termos da carcaça, o Eve V prova ser um vencedor. O monobloco de alumínio e o teclado Alcantara têm uma sensação de alta qualidade, não apresentam fraquezas na construção e parecem muito robustos. Com quase 1,4 kg (~3,1lb), o aparelho não é realmente mais leve que os Ultrabooks atuais. No entanto, esse é o único ponto verdadeiramente negativo em nossa avaliação. A boa conectividade, por outro lado, é definitivamente positiva. Com duas conexões USB 3.0 tipo A e duas do tipo C, uma das quais é uma porta Thunderbolt 3 completa, você está bem equipado qualquer eventualidade. Também gostamos do teclado, e é bastante adequado para extensas tarefas de escrita. Nossas experiências com a entrada da caneta N-Trig incluída, foram satisfatórias, e é louvável oferecer apenas pacotes com teclado e caneta, como a Eve-Tech faz. Desta forma, você pode evitar "surpreender" o usuário com custos ocultos.
A tela oferece uma luminosidade e contraste muito bons. Como vem na caixa, o Eve V vem com uma tela calibrada e cores relativamente precisas. A resolução de 3K fornece alta nitidez da imagem, mas pode reultar em problemas com alguns aplicativos individuais devido à escala necessária do Windows.
O Eve V é um dispositivo atraente, mas não deve ser superestimado.
Agora, enquanto as reservas de desempenho do Eve V: Para este projeto, foram selecionados os processadores da série Y da Intel. Estes são chips passivamente resfriados com um TDP de 4,5 watts. Mesmo que o i5-7300U no Surface Pro possa oferecer brevemente um desempenho muito maior, durante cargas prolongadas, ele se nivelará no nível do modelo i5-7Y54 que estamos testando aqui. Todos os modelos de CPU testados (m3, i5, i7) demonstram um desempenho quase estável durante a carga constante. No entanto, era curioso que o modelo m3 que tínhamos aqui fosse muito melhor em muitos testes do que as versões i5 e i7 muito mais caras. O Eve V é um bom dispositivo para as tarefas básicas do escritório, também considerando a longa duração da bateria que pode ser alcançada. Para criadores de conteúdo, a CPU do dispositivo pode rapidamente se tornar um gargalo para software complexo.
O Eve V está disponível a partir de apenas 799 Euros (~$942; $799 nos EUA). No entanto, além da CPU m3, você só recebe 128 GB de armazenamento, o que pode ser um obstáculo para a maioria dos usuários. O próximo passo é o modelo i5 com 256 GB de armazenamento, que já custa 1199 Euros ou $1412. Um acréscimo de 400 euros ($471) por uma CPU que dificilmente mostra quaisquer vantagens e 128 GB de armazenamento adicional é bastante. Continua assim: i5, 16 GB de RAM e 512 GB de armazenamento custa $1499 ou 1549 Euros, o i7 começa em $1599 ou 1649 Euros e o modelo principal com i7, 16 GB de RAM e SSD de 1 TB (Samsung PM961) custa altos 1999 Euros (~$2358; $1999 nos EUA) ..
Em comparação com a concorrência, como a Surface Pro da Microsoft, o Eve V atinge uma boa figura em termos de preço (Surface Pro i5-7300U, SSD de 256 GB, 8 GB: 1149 Euros/~$1353, + Type over 179 Euros/~$210, + Caneta Surface 109 Euros/~$ 128), especialmente porque o teclado e a caneta estão incluídos no pacote. Mas, considerando as diferenças de preços entre os modelos, achamos os preços premium para outros modelos seguindo o estilo da Microsoft, muito altos, especialmente porque as diferenças entre os processadores usados são apenas mínimas.
O Eve V já foi enviada aos seus financiadores e deve chegar em breve. Outros compradores interessados podem começar a comprar online desde o dia 4 de dezembro.
Eve-Tech Eve V i5
- 11/19/2017 v6 (old)
J. Simon Leitner, Klaus A. Hinum