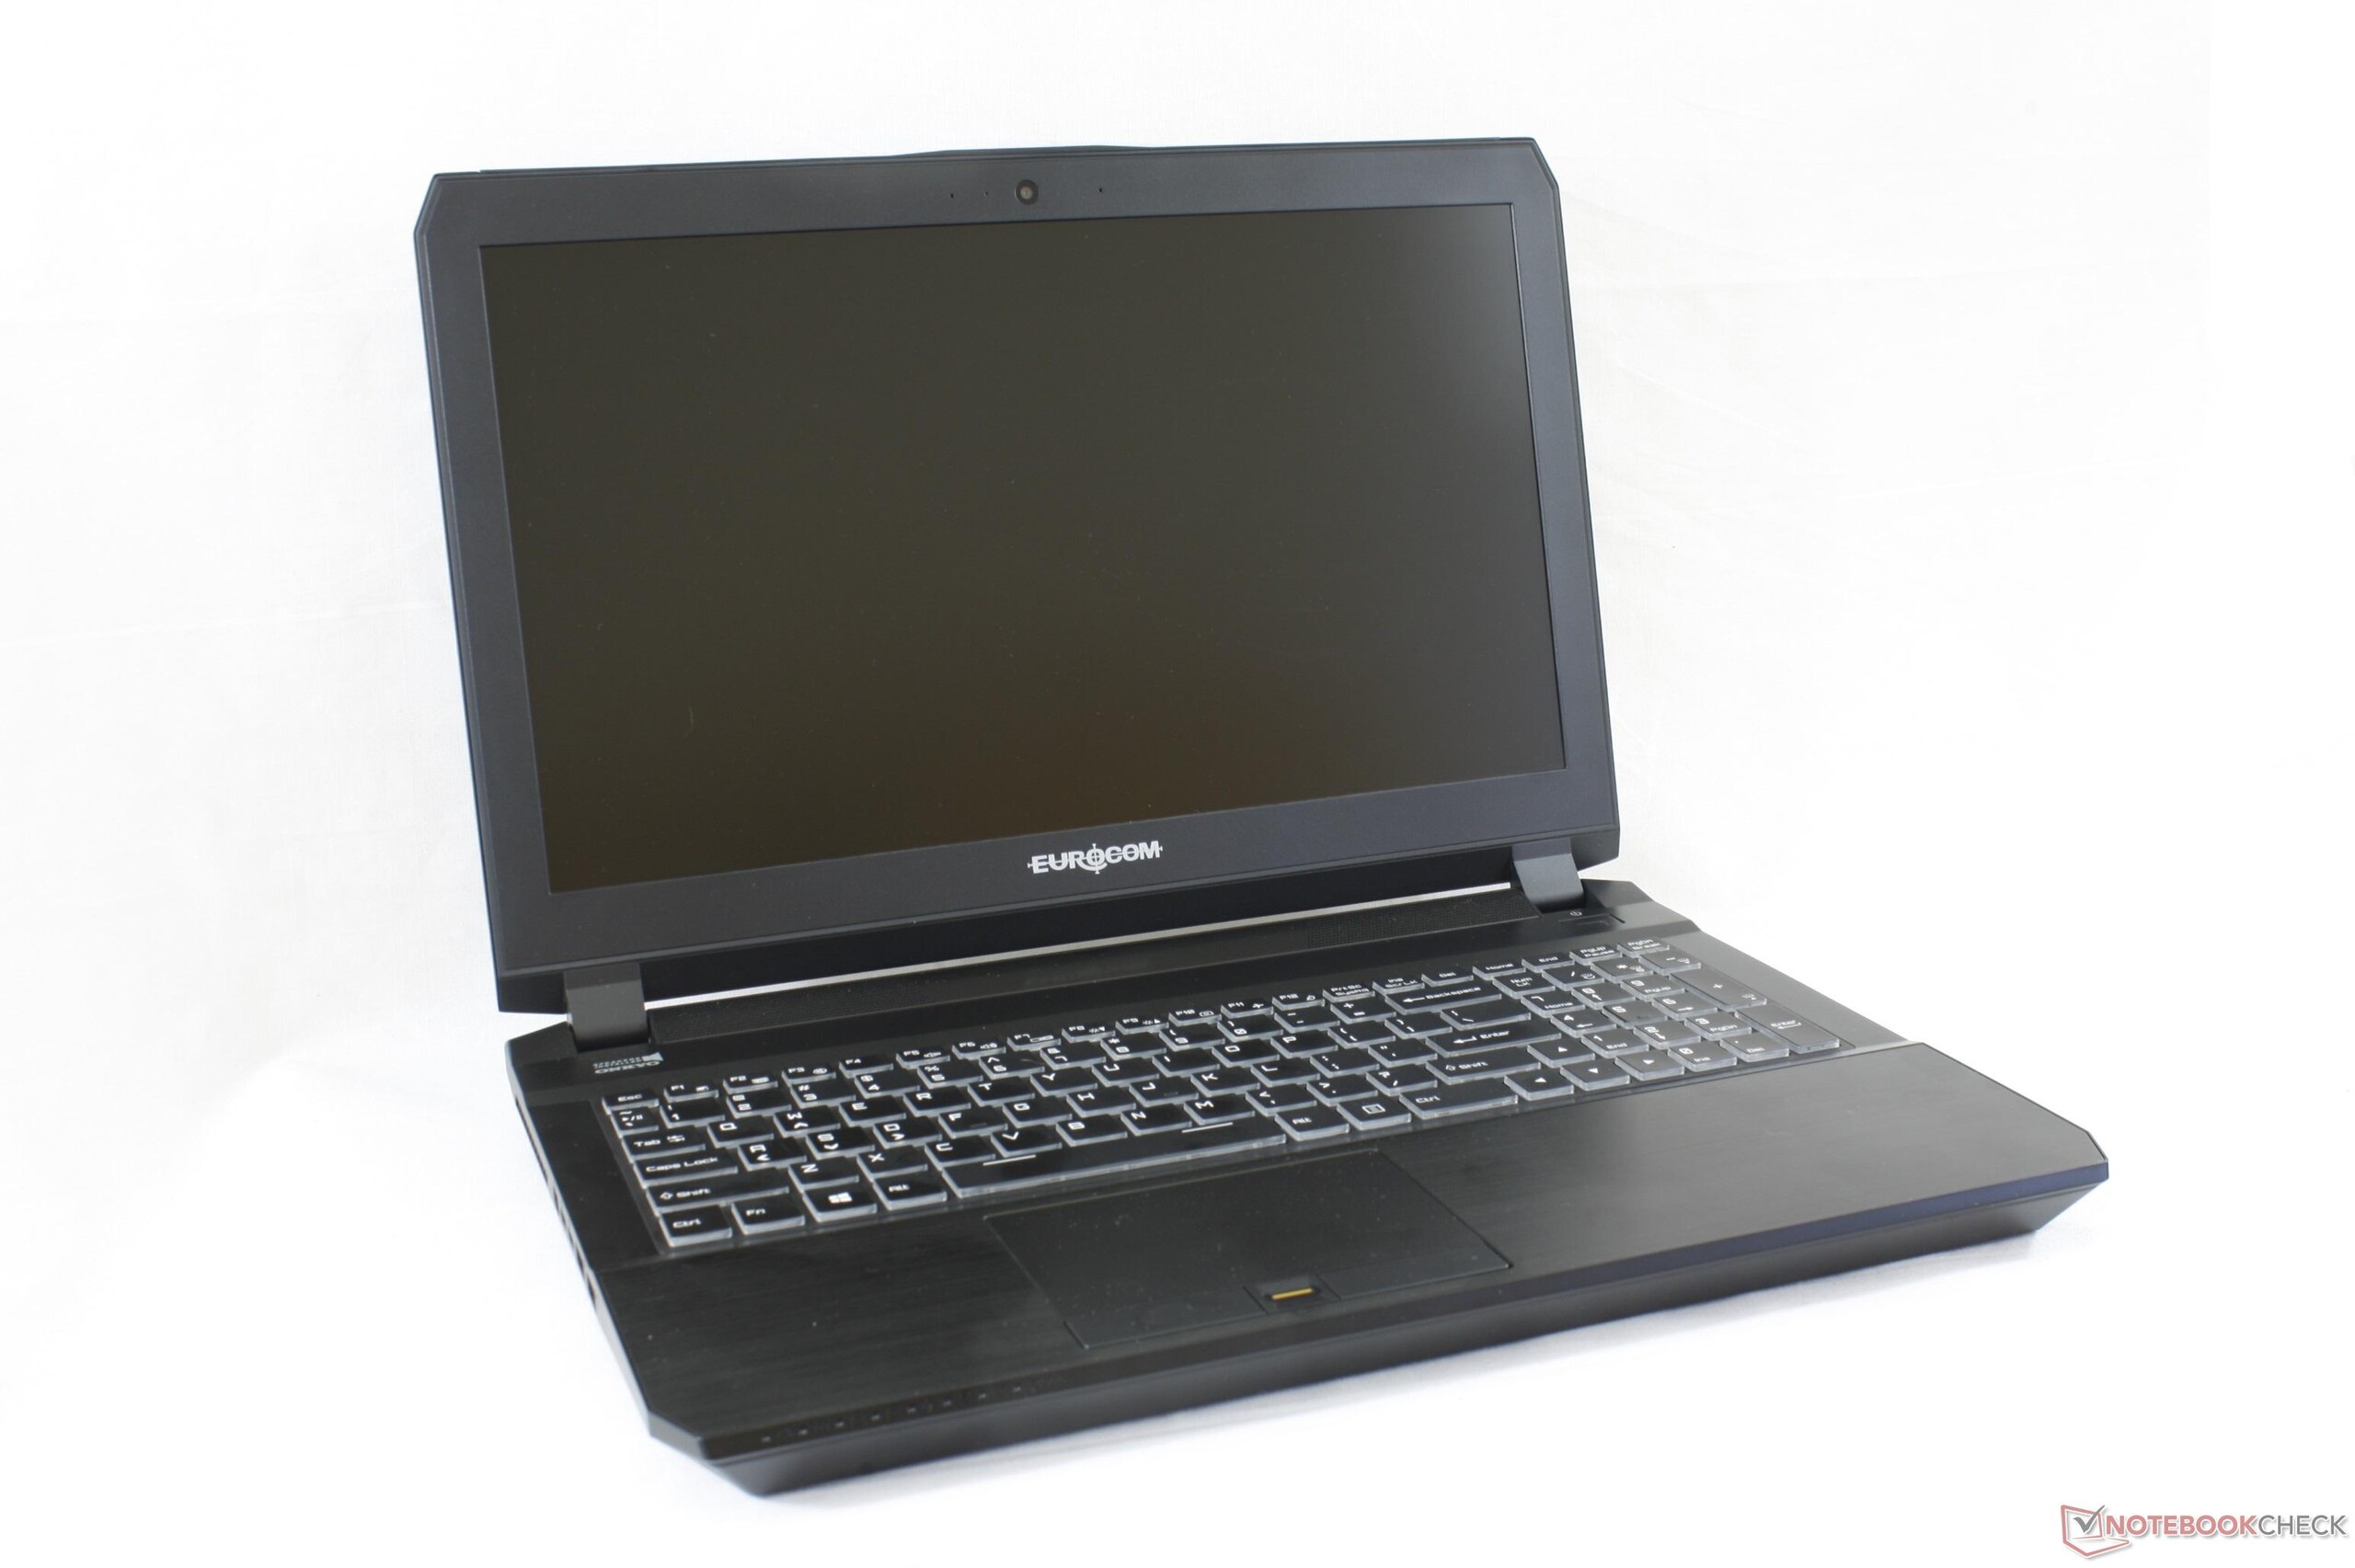
Breve Análise do Portátil Eurocom Sky MX5 R3 (i7-7820HK, FHD, Clevo P650HS-G)

| SD Card Reader | |
| average JPG Copy Test (av. of 3 runs) | |
| Eurocom Sky X7E2 | |
| MSI GT62VR 7RE-223 | |
| Eurocom Sky MX5 R3 | |
| Gigabyte Aero 15 | |
| maximum AS SSD Seq Read Test (1GB) | |
| Eurocom Sky X7E2 | |
| MSI GT62VR 7RE-223 | |
| Eurocom Sky MX5 R3 | |
| Gigabyte Aero 15 | |
| Networking | |
| iperf3 transmit AX12 | |
| Eurocom Sky MX5 R3 | |
| Gigabyte Aero 15 | |
| Lenovo Legion Y520-15IKBN-80WK001KUS | |
| iperf3 receive AX12 | |
| Gigabyte Aero 15 | |
| Eurocom Sky MX5 R3 | |
| Lenovo Legion Y520-15IKBN-80WK001KUS | |
| |||||||||||||||||||||||||
iluminação: 94 %
iluminação com acumulador: 416.2 cd/m²
Contraste: 484:1 (Preto: 0.86 cd/m²)
ΔE ColorChecker Calman: 8.4 | ∀{0.5-29.43 Ø4.73}
ΔE Greyscale Calman: 11.2 | ∀{0.09-98 Ø4.97}
87.3% sRGB (Argyll 1.6.3 3D)
57.2% AdobeRGB 1998 (Argyll 1.6.3 3D)
64.2% AdobeRGB 1998 (Argyll 3D)
87.8% sRGB (Argyll 3D)
65.9% Display P3 (Argyll 3D)
Gamma: 2.23
CCT: 10036 K
| Eurocom Sky MX5 R3 ID: AUO52ED, Name: AU Optronics B156HTN05.2, , 15.6", 1920x1080 | Acer Predator 15 G9-593-751X LG Philips LP156WF6-SPP1 (LGD04D5), IPS, 15.6", 1920x1080 | Lenovo Legion Y520-15IKBN-80WK001KUS LP156WF6-SPK3, IPS, 15.6", 1920x1080 | Gigabyte Aero 15 N156HCA-EA1 (CMN15D7), IPS, 15.6", 1920x1080 | Alienware 15 R3 HPJGK_B156HTN (AUO51ED), TN, 15.6", 1920x1080 | MSI GT62VR 7RE-223 LG Philips LP156WF6 (LGD046F), IPS, 15.6", 1920x1080 | |
|---|---|---|---|---|---|---|
| Display | -2% | 3% | 2% | -4% | ||
| Display P3 Coverage (%) | 65.9 | 65.4 -1% | 65.2 -1% | 66 0% | 63.9 -3% | |
| sRGB Coverage (%) | 87.8 | 85.5 -3% | 92.5 5% | 90.5 3% | 83.1 -5% | |
| AdobeRGB 1998 Coverage (%) | 64.2 | 62.5 -3% | 66.5 4% | 66.2 3% | 60.8 -5% | |
| Response Times | -137% | -246% | -185% | -28% | -131% | |
| Response Time Grey 50% / Grey 80% * (ms) | 20.8 ? | 36 ? -73% | 58.8 ? -183% | 42.8 ? -106% | 25 ? -20% | 37 ? -78% |
| Response Time Black / White * (ms) | 8.8 ? | 26.4 ? -200% | 36 ? -309% | 32 ? -264% | 12 ? -36% | 25 ? -184% |
| PWM Frequency (Hz) | 20830 ? | 21550 ? | 26000 ? | |||
| Screen | 22% | -6% | 23% | 13% | 25% | |
| Brightness middle (cd/m²) | 416.2 | 295 -29% | 239 -43% | 320 -23% | 386 -7% | 310 -26% |
| Brightness (cd/m²) | 409 | 274 -33% | 244 -40% | 316 -23% | 382 -7% | 311 -24% |
| Brightness Distribution (%) | 94 | 88 -6% | 88 -6% | 90 -4% | 93 -1% | 85 -10% |
| Black Level * (cd/m²) | 0.86 | 0.32 63% | 0.35 59% | 0.36 58% | 0.39 55% | 0.3 65% |
| Contrast (:1) | 484 | 922 90% | 683 41% | 889 84% | 990 105% | 1033 113% |
| Colorchecker dE 2000 * | 8.4 | 4.59 45% | 7.3 13% | 4.62 45% | 10.2 -21% | 4.82 43% |
| Colorchecker dE 2000 max. * | 15.4 | 11 29% | 24.7 -60% | 9.75 37% | 15.81 -3% | 10.14 34% |
| Greyscale dE 2000 * | 11.2 | 4.03 64% | 4.9 56% | 6 46% | 11.28 -1% | 3.94 65% |
| Gamma | 2.23 99% | 2.3 96% | 2.19 100% | 2.46 89% | 2.23 99% | 2.45 90% |
| CCT | 10036 65% | 7229 90% | 7332 89% | 6761 96% | 11383 57% | 6877 95% |
| Color Space (Percent of AdobeRGB 1998) (%) | 57.2 | 56 -2% | 35 -39% | 60 5% | 59 3% | 54 -6% |
| Color Space (Percent of sRGB) (%) | 87.3 | 85 -3% | 55 -37% | 92 5% | 90 3% | 83 -5% |
| Média Total (Programa/Configurações) | -39% /
-4% | -126% /
-46% | -53% /
-9% | -4% /
5% | -37% /
-2% |
* ... menor é melhor
Exibir tempos de resposta
| ↔ Tempo de resposta preto para branco | ||
|---|---|---|
| 8.8 ms ... ascensão ↗ e queda ↘ combinadas | ↗ 6.8 ms ascensão | 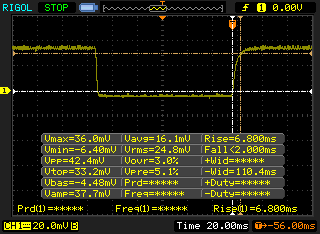 |
| ↘ 2 ms queda | ||
| A tela mostra taxas de resposta rápidas em nossos testes e deve ser adequada para jogos. Em comparação, todos os dispositivos testados variam de 0.1 (mínimo) a 240 (máximo) ms. » 24 % de todos os dispositivos são melhores. Isso significa que o tempo de resposta medido é melhor que a média de todos os dispositivos testados (19.9 ms). | ||
| ↔ Tempo de resposta 50% cinza a 80% cinza | ||
| 20.8 ms ... ascensão ↗ e queda ↘ combinadas | ↗ 11.6 ms ascensão | 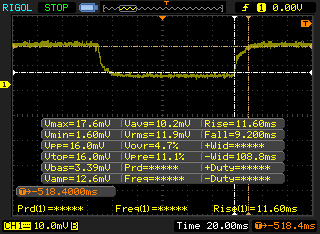 |
| ↘ 9.2 ms queda | ||
| A tela mostra boas taxas de resposta em nossos testes, mas pode ser muito lenta para jogadores competitivos. Em comparação, todos os dispositivos testados variam de 0.165 (mínimo) a 636 (máximo) ms. » 33 % de todos os dispositivos são melhores. Isso significa que o tempo de resposta medido é melhor que a média de todos os dispositivos testados (31.1 ms). | ||
Cintilação da tela / PWM (modulação por largura de pulso)
| Tela tremeluzindo / PWM não detectado | 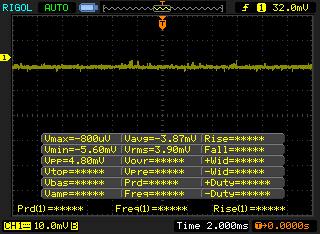 | ||
[pwm_comparison] Em comparação: 52 % de todos os dispositivos testados não usam PWM para escurecer a tela. Se PWM foi detectado, uma média de 7801 (mínimo: 5 - máximo: 343500) Hz foi medida. | |||
| Cinebench R11.5 | |
| CPU Single 64Bit | |
| Schenker XMG U507 2017 | |
| MSI GT83VR-6RE32SR451 | |
| Eurocom Sky MX5 R3 | |
| Eurocom Sky X7E2 | |
| Alienware 17 R4 | |
| MSI GE62 2QC-468XPL | |
| Lenovo IdeaPad Y50 | |
| CPU Multi 64Bit | |
| Schenker XMG U507 2017 | |
| Alienware 17 R4 | |
| MSI GT83VR-6RE32SR451 | |
| Eurocom Sky X7E2 | |
| Eurocom Sky MX5 R3 | |
| MSI GE62 2QC-468XPL | |
| Lenovo IdeaPad Y50 | |
| Cinebench R10 | |
| Rendering Multiple CPUs 32Bit | |
| Alienware 17 R4 | |
| Eurocom Sky X7E2 | |
| Eurocom Sky MX5 R3 | |
| MSI GE62 2QC-468XPL | |
| Lenovo IdeaPad Y50 | |
| Rendering Single 32Bit | |
| Alienware 17 R4 | |
| Eurocom Sky X7E2 | |
| Eurocom Sky MX5 R3 | |
| MSI GE62 2QC-468XPL | |
| Lenovo IdeaPad Y50 | |
| wPrime 2.10 - 1024m | |
| Lenovo IdeaPad Y50 | |
| Apple MacBook Pro 15 2017 (2.8 GHz, 555) | |
| Eurocom Sky MX5 R3 | |
| MSI GE62 2QC-468XPL | |
| Eurocom Sky X7E2 | |
| Alienware 17 R4 | |
* ... menor é melhor
| PCMark 8 | |
| Home Score Accelerated v2 | |
| Acer Predator 15 G9-593-751X | |
| Eurocom Sky MX5 R3 | |
| Gigabyte Aero 15 | |
| Work Score Accelerated v2 | |
| Acer Predator 15 G9-593-751X | |
| Gigabyte Aero 15 | |
| Eurocom Sky MX5 R3 | |
| Creative Score Accelerated v2 | |
| Eurocom Sky MX5 R3 | |
| Acer Predator 15 G9-593-751X | |
| PCMark 8 Home Score Accelerated v2 | 5065 pontos | |
| PCMark 8 Creative Score Accelerated v2 | 8233 pontos | |
| PCMark 8 Work Score Accelerated v2 | 5192 pontos | |
Ajuda | ||
| Eurocom Sky MX5 R3 Samsung SSD 960 Evo 500GB m.2 NVMe | Acer Predator 15 G9-593-751X Samsung SM951 MZVPV256HDGL m.2 PCI-e | Lenovo Legion Y520-15IKBN-80WK001KUS Samsung PM961 MZVLW256HEHP | MSI GT62VR 7RE-223 Samsung SSD PM871a MZNLN256HMHQ | Aorus X5 v6 Samsung SM951 MZVPV256 m.2 | |
|---|---|---|---|---|---|
| AS SSD | -22% | -14% | -69% | -94% | |
| Copy Game MB/s (MB/s) | 1191 | 1091 -8% | 1115 -6% | 377.8 -68% | 1073 -10% |
| Copy Program MB/s (MB/s) | 441.8 | 488.6 11% | 502 14% | 199 -55% | 351.5 -20% |
| Copy ISO MB/s (MB/s) | 1375 | 1575 15% | 1912 39% | 354.7 -74% | 351.1 -74% |
| Score Total (Points) | 3987 | 2574 -35% | 2617 -34% | 1019 -74% | 1630 -59% |
| Score Write (Points) | 1670 | 570 -66% | 807 -52% | 304 -82% | 514 -69% |
| Score Read (Points) | 1550 | 1350 -13% | 1232 -21% | 472 -70% | 756 -51% |
| Access Time Write * (ms) | 0.029 | 0.032 -10% | 0.027 7% | 0.037 -28% | 0.025 14% |
| Access Time Read * (ms) | 0.038 | 0.059 -55% | 0.065 -71% | 0.1 -163% | 0.367 -866% |
| 4K-64 Write (MB/s) | 1375 | 346 -75% | 529 -62% | 171.6 -88% | 272.5 -80% |
| 4K-64 Read (MB/s) | 1280 | 1109 -13% | 919 -28% | 383.4 -70% | 521 -59% |
| 4K Write (MB/s) | 129.1 | 117.3 -9% | 139.4 8% | 104 -19% | 131.3 2% |
| 4K Read (MB/s) | 44.54 | 46.35 4% | 48.57 9% | 37.2 -16% | 44.6 0% |
| Seq Write (MB/s) | 1660 | 1067 -36% | 1392 -16% | 288.2 -83% | 1099 -34% |
| Seq Read (MB/s) | 2257 | 1941 -14% | 2649 17% | 510 -77% | 1904 -16% |
* ... menor é melhor

| 3DMark | |
| 1920x1080 Fire Strike Graphics | |
| Nvidia GeForce GTX 1080 Ti Founders Edition | |
| Alienware 17 R4 | |
| Eurocom Sky MX5 R3 | |
| Asus G752VS-BA338T | |
| Nvidia GeForce GTX 1070 Founders Edition | |
| Asus G701VO-CS74K | |
| Aorus x3 Plus v7 | |
| Fire Strike Extreme Graphics | |
| Alienware 17 R4 | |
| Asus G752VS-BA338T | |
| Eurocom Sky MX5 R3 | |
| Asus G701VO-CS74K | |
| Aorus x3 Plus v7 | |
| 3840x2160 Fire Strike Ultra Graphics | |
| Nvidia GeForce GTX 1080 Ti Founders Edition | |
| Alienware 17 R4 | |
| Asus G752VS-BA338T | |
| Eurocom Sky MX5 R3 | |
| Nvidia GeForce GTX 1070 Founders Edition | |
| Asus G701VO-CS74K | |
| 3DMark 11 | |
| 1280x720 Performance GPU | |
| Nvidia GeForce GTX 1080 Ti Founders Edition | |
| Alienware 17 R4 | |
| Asus G752VS-BA338T | |
| Nvidia GeForce GTX 1070 Founders Edition | |
| Eurocom Sky MX5 R3 | |
| Asus G701VO-CS74K | |
| 1280x720 Performance Combined | |
| Nvidia GeForce GTX 1080 Ti Founders Edition | |
| Nvidia GeForce GTX 1070 Founders Edition | |
| Alienware 17 R4 | |
| Eurocom Sky MX5 R3 | |
| Asus G701VO-CS74K | |
| Asus G752VS-BA338T | |
| 3DMark 11 Performance | 17505 pontos | |
| 3DMark Ice Storm Standard Score | 156072 pontos | |
| 3DMark Cloud Gate Standard Score | 28943 pontos | |
| 3DMark Fire Strike Score | 14447 pontos | |
| 3DMark Fire Strike Extreme Score | 7854 pontos | |
Ajuda | ||
| Rise of the Tomb Raider - 1920x1080 Very High Preset AA:FX AF:16x | |
| Nvidia GeForce GTX 1080 Ti Founders Edition | |
| Alienware 17 R4 | |
| Eurocom Sky MX5 R3 | |
| Eurocom Tornado F5 | |
| Nvidia GeForce GTX 1070 Founders Edition | |
| Zotac ZBOX Magnus EN980-U | |
| Aorus x3 Plus v7 | |
| BioShock Infinite - 1920x1080 Ultra Preset, DX11 (DDOF) | |
| Nvidia GeForce GTX 1080 Ti Founders Edition | |
| Alienware 17 R4 | |
| Nvidia GeForce GTX 1070 Founders Edition | |
| Eurocom Tornado F5 | |
| Eurocom Sky MX5 R3 | |
| Zotac ZBOX Magnus EN980-U | |
| Aorus x3 Plus v7 | |
| Metro: Last Light - 1920x1080 Very High (DX11) AF:16x | |
| Nvidia GeForce GTX 1080 Ti Founders Edition | |
| Alienware 17 R4 | |
| Nvidia GeForce GTX 1070 Founders Edition | |
| Eurocom Tornado F5 | |
| Eurocom Sky MX5 R3 | |
| Zotac ZBOX Magnus EN980-U | |
| Aorus x3 Plus v7 | |
| Batman: Arkham Knight - 1920x1080 High / On AA:SM AF:16x | |
| Alienware 17 R4 | |
| Eurocom Tornado F5 | |
| Eurocom Sky MX5 R3 | |
| Zotac ZBOX Magnus EN980-U | |
| Fallout 4 - 1920x1080 Ultra Preset AA:T AF:16x | |
| Nvidia GeForce GTX 1080 Ti Founders Edition | |
| Alienware 17 R4 | |
| Nvidia GeForce GTX 1070 Founders Edition | |
| Eurocom Tornado F5 | |
| Eurocom Sky MX5 R3 | |
| Zotac ZBOX Magnus EN980-U | |
| Aorus x3 Plus v7 | |
| Ashes of the Singularity - 1920x1080 high | |
| Nvidia GeForce GTX 1080 Ti Founders Edition | |
| Eurocom Tornado F5 | |
| Nvidia GeForce GTX 1070 Founders Edition | |
| Eurocom Sky MX5 R3 | |
| Alienware 17 R4 | |
| Aorus x3 Plus v7 | |
| Doom - 1920x1080 Ultra Preset AA:SM | |
| Nvidia GeForce GTX 1080 Ti Founders Edition | |
| Nvidia GeForce GTX 1080 Ti Founders Edition | |
| Alienware 17 R4 | |
| Eurocom Tornado F5 | |
| Nvidia GeForce GTX 1070 Founders Edition | |
| Eurocom Sky MX5 R3 | |
| Aorus x3 Plus v7 | |
| Overwatch - 1920x1080 Epic (Render Scale 100 %) AA:SM AF:16x | |
| Nvidia GeForce GTX 1080 Ti Founders Edition | |
| Alienware 17 R4 | |
| Nvidia GeForce GTX 1070 Founders Edition | |
| Eurocom Sky MX5 R3 | |
| Eurocom Tornado F5 | |
| Zotac ZBOX Magnus EN980-U | |
| Mafia 3 - 1920x1080 High Preset | |
| Nvidia GeForce GTX 1080 Ti Founders Edition | |
| Alienware 17 R4 | |
| Eurocom Tornado F5 | |
| Eurocom Sky MX5 R3 | |
| Aorus x3 Plus v7 | |
| Prey - 1920x1080 Very High Preset AA:2TX SM AF:16x | |
| Nvidia GeForce GTX 1080 Ti Founders Edition | |
| Eurocom Sky MX5 R3 | |
| baixo | média | alto | ultra | |
|---|---|---|---|---|
| BioShock Infinite (2013) | 141 | |||
| Metro: Last Light (2013) | 115 | |||
| The Witcher 3 (2015) | 66.3 | |||
| Batman: Arkham Knight (2015) | 85 | |||
| Metal Gear Solid V (2015) | 60 | |||
| Fallout 4 (2015) | 103.3 | |||
| Rise of the Tomb Raider (2016) | 100.5 | |||
| Ashes of the Singularity (2016) | 76.4 | |||
| Doom (2016) | 126.7 | |||
| Overwatch (2016) | 160.6 | |||
| Mafia 3 (2016) | 65.7 | |||
| Prey (2017) | 138.5 |
| The Witcher 3 | |||
| Resolução | Configurações | Valor | |
| 1920x1080 | Ultra Graphics & Postprocessing (HBAO+) | 66.3 fps | |
Barulho
| Ocioso |
| 28.5 / 29.2 / 35.5 dB |
| Carga |
| 47 / 51 dB |
 | ||
30 dB silencioso 40 dB(A) audível 50 dB(A) ruidosamente alto |
||
min: | ||
| Eurocom Sky MX5 R3 GeForce GTX 1070 Mobile, i7-7820HK, Samsung SSD 960 Evo 500GB m.2 NVMe | Acer Predator 15 G9-593-751X GeForce GTX 1070 Mobile, i7-7700HQ, Samsung SM951 MZVPV256HDGL m.2 PCI-e | Lenovo Legion Y520-15IKBN-80WK001KUS GeForce GTX 1050 Ti Mobile, i7-7700HQ, Samsung PM961 MZVLW256HEHP | Gigabyte Aero 15 GeForce GTX 1060 Mobile, i7-7700HQ, Lite-On CX2-8B512-Q11 | Alienware 15 R3 GeForce GTX 1070 Mobile, i7-7700HQ | MSI GT62VR 7RE-223 GeForce GTX 1070 Mobile, i7-7700HQ, Samsung SSD PM871a MZNLN256HMHQ | |
|---|---|---|---|---|---|---|
| Noise | -8% | 6% | -2% | -8% | -4% | |
| desligado / ambiente * (dB) | 28 | 32 -14% | 27.7 1% | 31 -11% | 30 -7% | 30 -7% |
| Idle Minimum * (dB) | 28.5 | 34 -19% | 30.5 -7% | 32 -12% | 31 -9% | 34 -19% |
| Idle Average * (dB) | 29.2 | 36 -23% | 30.5 -4% | 33 -13% | 32 -10% | 35 -20% |
| Idle Maximum * (dB) | 35.5 | 38 -7% | 30.6 14% | 34 4% | 42 -18% | 36 -1% |
| Load Average * (dB) | 47 | 41 13% | 40 15% | 39 17% | 49 -4% | 40 15% |
| Load Maximum * (dB) | 51 | 50 2% | 42.6 16% | 50 2% | 50 2% | 46 10% |
| Witcher 3 ultra * (dB) | 42 | 40 | 43 |
* ... menor é melhor
(-) A temperatura máxima no lado superior é 50 °C / 122 F, em comparação com a média de 40.4 °C / 105 F , variando de 21.2 a 68.8 °C para a classe Gaming.
(-) A parte inferior aquece até um máximo de 52.2 °C / 126 F, em comparação com a média de 43.2 °C / 110 F
(+) Em uso inativo, a temperatura média para o lado superior é 30 °C / 86 F, em comparação com a média do dispositivo de 33.9 °C / ### class_avg_f### F.
(±) Jogando The Witcher 3, a temperatura média para o lado superior é 36.7 °C / 98 F, em comparação com a média do dispositivo de 33.9 °C / ## #class_avg_f### F.
(+) Os apoios para as mãos e o touchpad são mais frios que a temperatura da pele, com um máximo de 28.2 °C / 82.8 F e, portanto, são frios ao toque.
(±) A temperatura média da área do apoio para as mãos de dispositivos semelhantes foi 28.8 °C / 83.8 F (+0.6 °C / 1 F).
Eurocom Sky MX5 R3 análise de áudio
(-) | alto-falantes não muito altos (###valor### dB)
Graves 100 - 315Hz
(±) | graves reduzidos - em média 11.4% menor que a mediana
(±) | a linearidade dos graves é média (11.8% delta para a frequência anterior)
Médios 400 - 2.000 Hz
(+) | médios equilibrados - apenas 3.7% longe da mediana
(±) | a linearidade dos médios é média (10.8% delta para frequência anterior)
Altos 2 - 16 kHz
(+) | agudos equilibrados - apenas 2% longe da mediana
(±) | a linearidade dos máximos é média (7% delta para frequência anterior)
Geral 100 - 16.000 Hz
(±) | a linearidade do som geral é média (28.3% diferença em relação à mediana)
Comparado com a mesma classe
» 94% de todos os dispositivos testados nesta classe foram melhores, 1% semelhantes, 5% piores
» O melhor teve um delta de 6%, a média foi 18%, o pior foi 132%
Comparado com todos os dispositivos testados
» 85% de todos os dispositivos testados foram melhores, 3% semelhantes, 12% piores
» O melhor teve um delta de 4%, a média foi 24%, o pior foi 134%
Apple MacBook 12 (Early 2016) 1.1 GHz análise de áudio
(+) | os alto-falantes podem tocar relativamente alto (###valor### dB)
Graves 100 - 315Hz
(±) | graves reduzidos - em média 11.3% menor que a mediana
(±) | a linearidade dos graves é média (14.2% delta para a frequência anterior)
Médios 400 - 2.000 Hz
(+) | médios equilibrados - apenas 2.4% longe da mediana
(+) | médios são lineares (5.5% delta para frequência anterior)
Altos 2 - 16 kHz
(+) | agudos equilibrados - apenas 2% longe da mediana
(+) | os máximos são lineares (4.5% delta da frequência anterior)
Geral 100 - 16.000 Hz
(+) | o som geral é linear (10.2% diferença em relação à mediana)
Comparado com a mesma classe
» 7% de todos os dispositivos testados nesta classe foram melhores, 2% semelhantes, 91% piores
» O melhor teve um delta de 5%, a média foi 18%, o pior foi 53%
Comparado com todos os dispositivos testados
» 5% de todos os dispositivos testados foram melhores, 1% semelhantes, 94% piores
» O melhor teve um delta de 4%, a média foi 24%, o pior foi 134%
| desligado | |
| Ocioso | |
| Carga |
|
Key:
min: | |
| Eurocom Sky MX5 R3 i7-7820HK, GeForce GTX 1070 Mobile, Samsung SSD 960 Evo 500GB m.2 NVMe, , 1920x1080, 15.6" | Acer Predator 15 G9-593-751X i7-7700HQ, GeForce GTX 1070 Mobile, Samsung SM951 MZVPV256HDGL m.2 PCI-e, IPS, 1920x1080, 15.6" | Lenovo Legion Y520-15IKBN-80WK001KUS i7-7700HQ, GeForce GTX 1050 Ti Mobile, Samsung PM961 MZVLW256HEHP, IPS, 1920x1080, 15.6" | Gigabyte Aero 15 i7-7700HQ, GeForce GTX 1060 Mobile, Lite-On CX2-8B512-Q11, IPS, 1920x1080, 15.6" | Alienware 15 R3 i7-7700HQ, GeForce GTX 1070 Mobile, , TN, 1920x1080, 15.6" | MSI GT62VR 7RE-223 i7-7700HQ, GeForce GTX 1070 Mobile, Samsung SSD PM871a MZNLN256HMHQ, IPS, 1920x1080, 15.6" | |
|---|---|---|---|---|---|---|
| Power Consumption | 3% | 49% | 31% | 6% | 4% | |
| Idle Minimum * (Watt) | 22 | 18 18% | 8.5 61% | 12 45% | 19 14% | 20 9% |
| Idle Average * (Watt) | 24.5 | 23 6% | 9.1 63% | 15 39% | 23 6% | 24 2% |
| Idle Maximum * (Watt) | 25.2 | 30 -19% | 9.7 62% | 20 21% | 29 -15% | 29 -15% |
| Load Average * (Watt) | 97.2 | 89 8% | 79.9 18% | 82 16% | 85 13% | 82 16% |
| Witcher 3 ultra * (Watt) | 177.5 | 168 5% | 97.7 45% | 111 37% | ||
| Load Maximum * (Watt) | 213.8 | 213 -0% | 121.5 43% | 161 25% | 192 10% | 193 10% |
* ... menor é melhor
| Eurocom Sky MX5 R3 i7-7820HK, GeForce GTX 1070 Mobile, Wh | Acer Predator 15 G9-593-751X i7-7700HQ, GeForce GTX 1070 Mobile, 90 Wh | Lenovo Legion Y520-15IKBN-80WK001KUS i7-7700HQ, GeForce GTX 1050 Ti Mobile, 45 Wh | Gigabyte Aero 15 i7-7700HQ, GeForce GTX 1060 Mobile, 94.24 Wh | Alienware 15 R3 i7-7700HQ, GeForce GTX 1070 Mobile, 99 Wh | MSI GT62VR 7RE-223 i7-7700HQ, GeForce GTX 1070 Mobile, 75 Wh | |
|---|---|---|---|---|---|---|
| Duração da bateria | 83% | 44% | 120% | 45% | 38% | |
| Reader / Idle (h) | 3.4 | 8.4 147% | 8.5 150% | 10.6 212% | 6.4 88% | 6.3 85% |
| WiFi v1.3 (h) | 2.9 | 5.5 90% | 4 38% | 7 141% | 4.4 52% | 4.1 41% |
| Load (h) | 1.8 | 2 11% | 0.8 -56% | 1.9 6% | 1.7 -6% | 1.6 -11% |
Pro
Contra
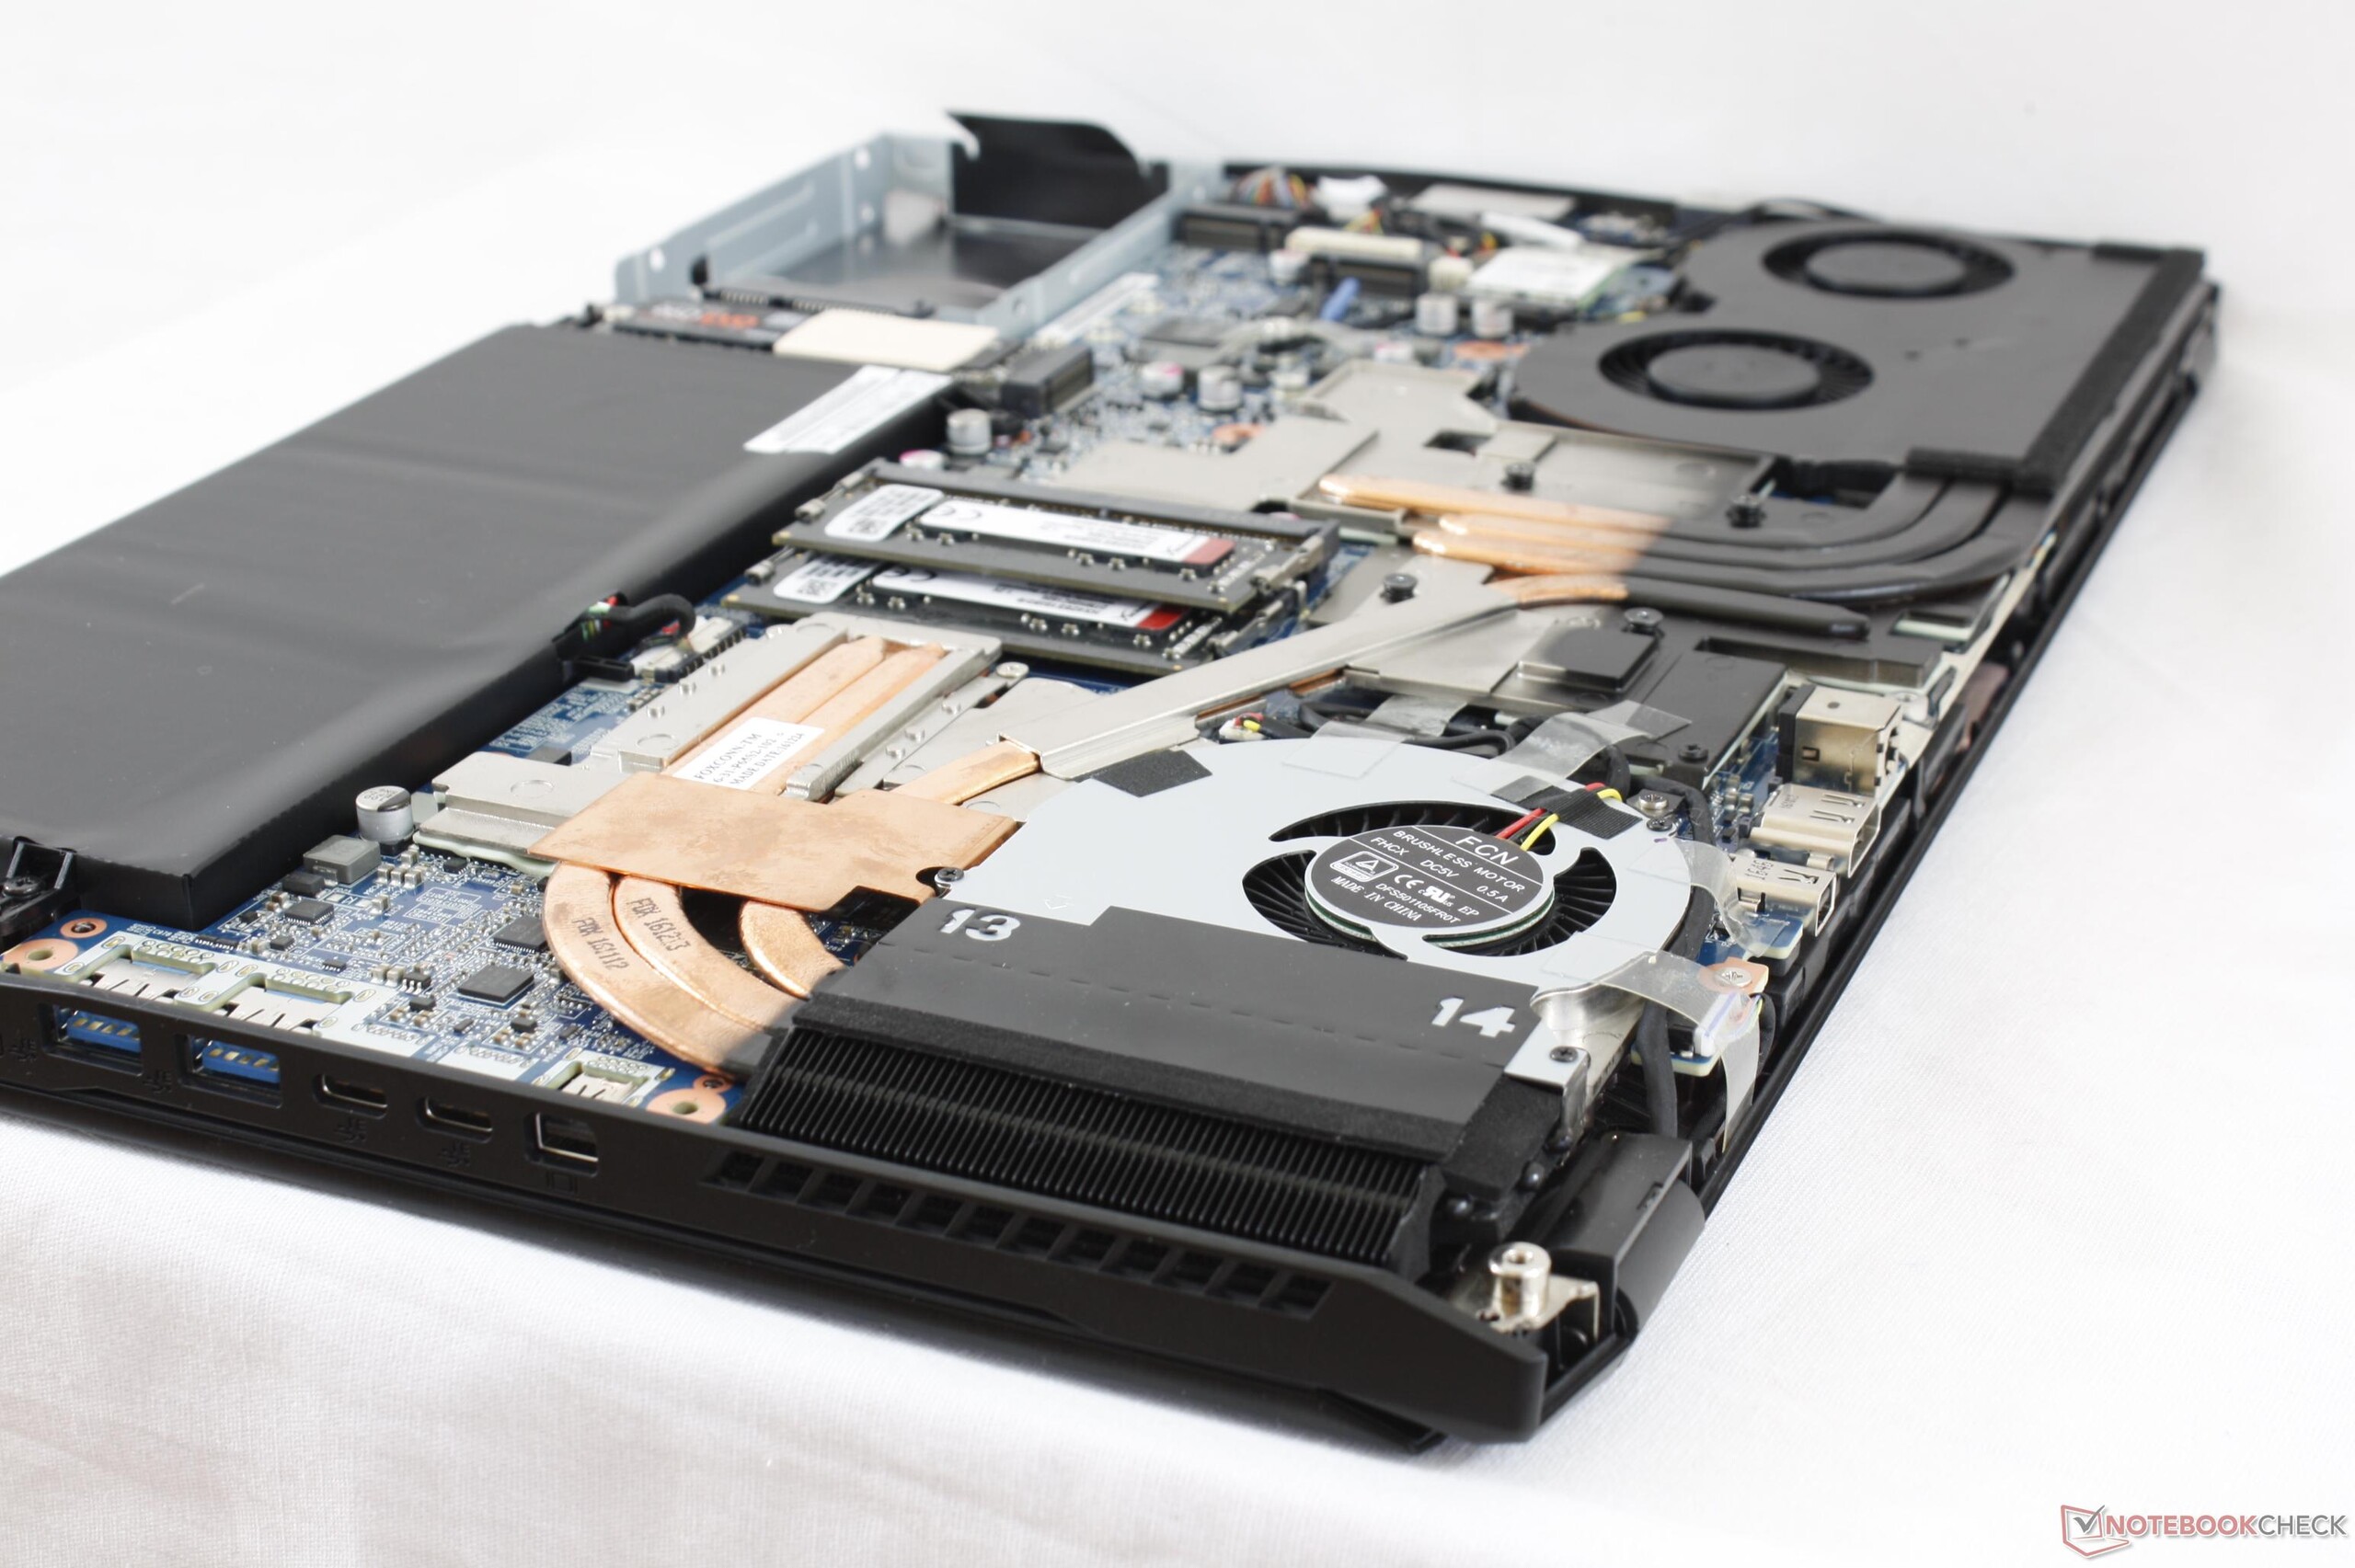
O Sky MX5 R3 tem quase tudo o que um gamer móvel precisará, incluindo facilidade de manutenção, um número saudável de opções de telas e portas, e um excelente equilíbrio de componentes que se complementam bem. O GTX 1070 combina perfeitamente com as telas 1080p 120 Hz ou UHD 4K 60 Hz enquanto a CPU i7-7820HK ou i7-7700HQ será mais do que suficiente para a maioria dos títulos. Os usuários encontrarão o portátil especialmente sedutor se suas capacidades 4G/WWAN forem utilizadas e se as atualizações de GPU não forem consideradas.
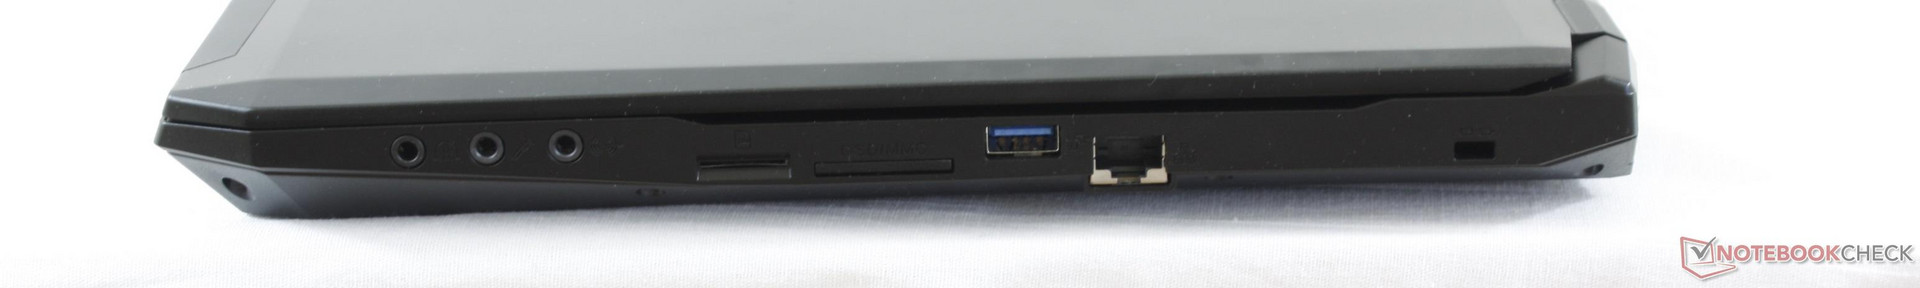
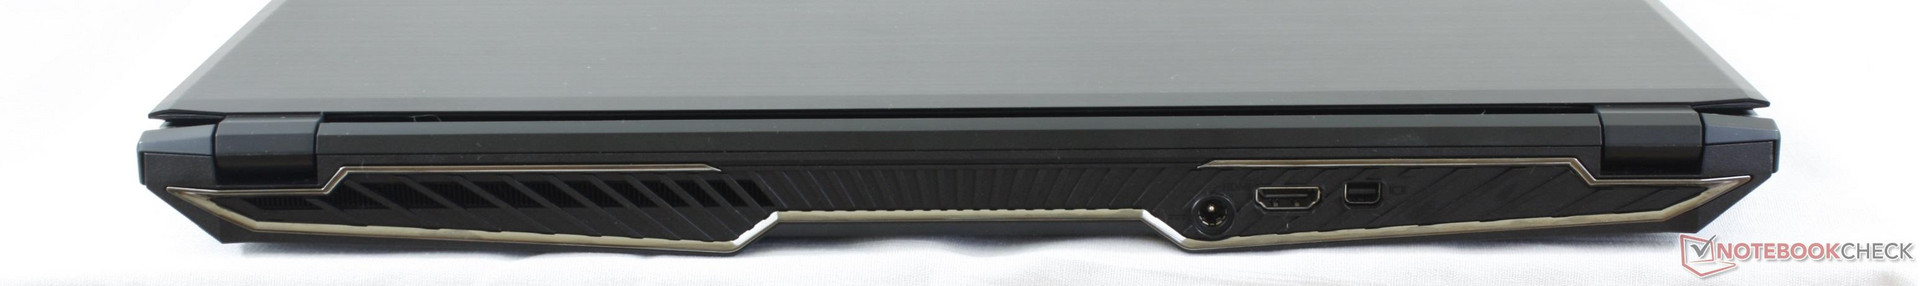
As principais desvantagens incluem a ausência de Thunderbolt 3, a taxa média de contraste e um ruído alto do ventilador mesmo para um portátil de jogos. O desempenho médio do i7-7820HK em velocidades padrão e sua temperatura de CPU alarmantemente alta com velocidade Turbo Boost máxima, são asteriscos em um sistema, que de outra forma, é versátil. É nesta área vital que o MSI GT62VR ainda pode a melhor opção de compra, por sua ventoinha mais silenciosa. Ainda assim, a Eurocom supera a MSI em outros aspectos, incluindo sua luz de fundo mais brilhante, temperaturas médias mais baixas da superfície, construção mais fina e maior seleção de portas.
A qualidade de construção é melhor do que no Asus GL702VS, enquanto possui uma variedade maior de opções configuráveis do que o MS1 GT62VR. O ruído da ventoinha é decepcionante e recomendamos a configuração com o i7-7700HQ inferior, dado que os ganhos do i7-7820HK mais caro são essencialmente imperceptíveis.
Eurocom Sky MX5 R3
- 06/23/2017 v6 (old)
Allen Ngo
Price comparison
