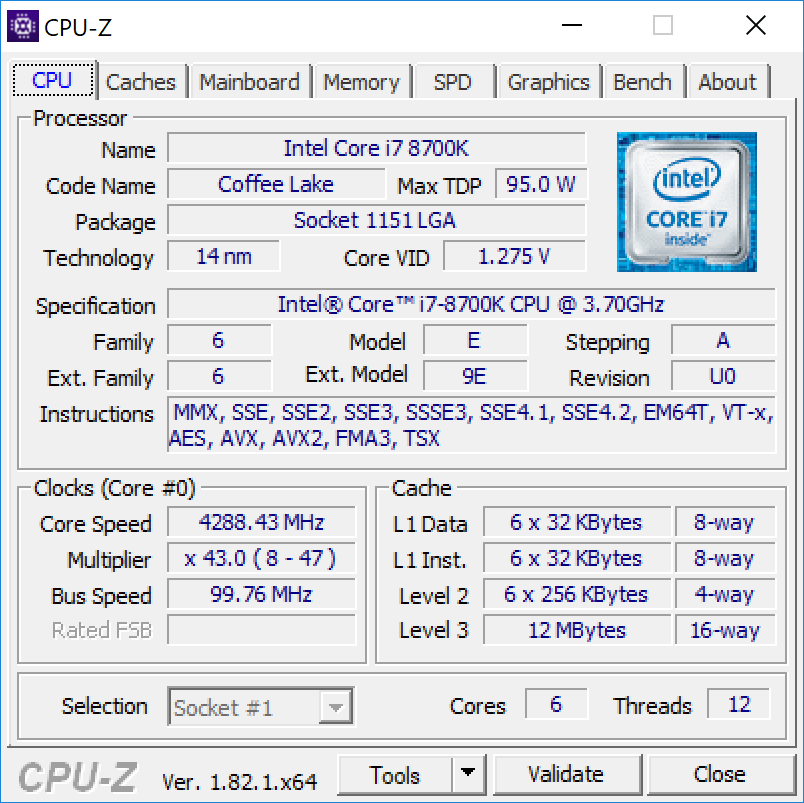
Breve Análise do Portátil Eurocom Sky X9C (i7-8700K, GTX 1080 SLI, Clevo P870TM1-G)
| SD Card Reader | |
| average JPG Copy Test (av. of 3 runs) | |
| Eurocom Sky X9C | |
| Eurocom Tornado F5 Killer Edition | |
| MSI GT75VR 7RF-012 Titan Pro | |
| maximum AS SSD Seq Read Test (1GB) | |
| Eurocom Tornado F5 Killer Edition | |
| Eurocom Sky X9C | |
| MSI GT75VR 7RF-012 Titan Pro | |
| Networking | |
| iperf3 transmit AX12 | |
| Eurocom Sky X9C | |
| Alienware 17 R4 | |
| MSI GT75VR 7RF-012 Titan Pro | |
| iperf3 receive AX12 | |
| MSI GT75VR 7RF-012 Titan Pro | |
| Eurocom Sky X9C | |
| Alienware 17 R4 | |
| |||||||||||||||||||||||||
iluminação: 87 %
iluminação com acumulador: 347.7 cd/m²
Contraste: 869:1 (Preto: 0.4 cd/m²)
ΔE ColorChecker Calman: 6.39 | ∀{0.5-29.43 Ø4.71}
ΔE Greyscale Calman: 5.4 | ∀{0.09-98 Ø4.96}
100% sRGB (Argyll 1.6.3 3D)
87.8% AdobeRGB 1998 (Argyll 1.6.3 3D)
99.4% AdobeRGB 1998 (Argyll 3D)
100% sRGB (Argyll 3D)
86.6% Display P3 (Argyll 3D)
Gamma: 2.4
CCT: 6271 K
| Eurocom Sky X9C ID: AUO109B, Name: AU Optronics B173ZAN01.0, IPS, 17.3", 3840x2160 | Alienware 17 R4 TN LED, 17.3", 2560x1440 | MSI GT75VR 7RF-012 Titan Pro CMN N173HHE-G32 (CMN1747), TN LED, 17.3", 1920x1080 | Asus G701VIK-BA049T B173HAN01.1 (AUO119D), IPS, 17.3", 1920x1080 | Razer Blade Pro 2017 Sharp LQ173D1JW33 (SHP145A), IGZO, 17.3", 3840x2160 | Schenker XMG U727 2017 AU Optronics B173ZAN01.0 (AUO109B), AHVA, 17.3", 3840x2160 | |
|---|---|---|---|---|---|---|
| Display | -28% | -3% | -23% | 1% | 0% | |
| Display P3 Coverage (%) | 86.6 | 61.2 -29% | 90.3 4% | 68.8 -21% | 88.9 3% | 86.6 0% |
| sRGB Coverage (%) | 100 | 82.9 -17% | 99.6 0% | 87.7 -12% | 100 0% | 99.9 0% |
| AdobeRGB 1998 Coverage (%) | 99.4 | 60.5 -39% | 86.8 -13% | 64.1 -36% | 99.7 0% | 99.5 0% |
| Response Times | 44% | 75% | 22% | -36% | 1% | |
| Response Time Grey 50% / Grey 80% * (ms) | 43.6 ? | 30 ? 31% | 11.6 ? 73% | 38 ? 13% | 60.8 ? -39% | 44 ? -1% |
| Response Time Black / White * (ms) | 28.8 ? | 12.8 ? 56% | 6.8 ? 76% | 20 ? 31% | 38.4 ? -33% | 28 ? 3% |
| PWM Frequency (Hz) | 25000 ? | 204.9 ? | ||||
| Screen | -8% | 23% | 9% | 3% | 20% | |
| Brightness middle (cd/m²) | 347.7 | 402.3 16% | 274 -21% | 306 -12% | 230 -34% | 362 4% |
| Brightness (cd/m²) | 324 | 372 15% | 262 -19% | 299 -8% | 207 -36% | 344 6% |
| Brightness Distribution (%) | 87 | 86 -1% | 87 0% | 91 5% | 83 -5% | 85 -2% |
| Black Level * (cd/m²) | 0.4 | 0.62 -55% | 0.26 35% | 0.27 32% | 0.2 50% | 0.35 13% |
| Contrast (:1) | 869 | 649 -25% | 1054 21% | 1133 30% | 1150 32% | 1034 19% |
| Colorchecker dE 2000 * | 6.39 | 5.6 12% | 1.36 79% | 3.98 38% | 5.62 12% | 2.46 62% |
| Colorchecker dE 2000 max. * | 9.69 | 9.8 -1% | 4.1 58% | 7.29 25% | 10.24 -6% | 4.26 56% |
| Greyscale dE 2000 * | 5.4 | 4.7 13% | 0.64 88% | 4.15 23% | 4.54 16% | 2.9 46% |
| Gamma | 2.4 92% | 2.14 103% | 2.19 100% | 2.45 90% | 2.36 93% | 2.31 95% |
| CCT | 6271 104% | 7519 86% | 6551 99% | 7386 88% | 6625 98% | 6120 106% |
| Color Space (Percent of AdobeRGB 1998) (%) | 87.8 | 53.7 -39% | 77 -12% | 58 -34% | 88 0% | 88 0% |
| Color Space (Percent of sRGB) (%) | 100 | 82.2 -18% | 100 0% | 89 -11% | 100 0% | 100 0% |
| Média Total (Programa/Configurações) | 3% /
-5% | 32% /
25% | 3% /
4% | -11% /
-3% | 7% /
14% |
* ... menor é melhor
Exibir tempos de resposta
| ↔ Tempo de resposta preto para branco | ||
|---|---|---|
| 28.8 ms ... ascensão ↗ e queda ↘ combinadas | ↗ 17.2 ms ascensão | 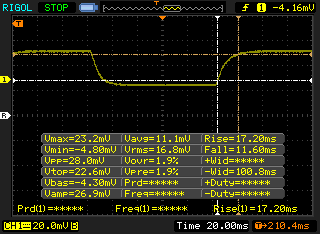 |
| ↘ 11.6 ms queda | ||
| A tela mostra taxas de resposta relativamente lentas em nossos testes e pode ser muito lenta para os jogadores. Em comparação, todos os dispositivos testados variam de 0.1 (mínimo) a 240 (máximo) ms. » 76 % de todos os dispositivos são melhores. Isso significa que o tempo de resposta medido é pior que a média de todos os dispositivos testados (19.8 ms). | ||
| ↔ Tempo de resposta 50% cinza a 80% cinza | ||
| 43.6 ms ... ascensão ↗ e queda ↘ combinadas | ↗ 24 ms ascensão | 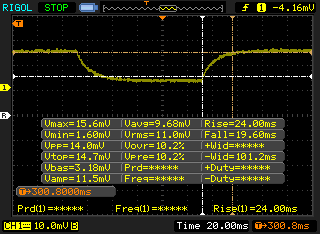 |
| ↘ 19.6 ms queda | ||
| A tela mostra taxas de resposta lentas em nossos testes e será insatisfatória para os jogadores. Em comparação, todos os dispositivos testados variam de 0.165 (mínimo) a 636 (máximo) ms. » 73 % de todos os dispositivos são melhores. Isso significa que o tempo de resposta medido é pior que a média de todos os dispositivos testados (31 ms). | ||
Cintilação da tela / PWM (modulação por largura de pulso)
| Tela tremeluzindo / PWM não detectado | 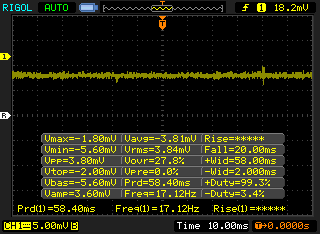 | ||
[pwm_comparison] Em comparação: 52 % de todos os dispositivos testados não usam PWM para escurecer a tela. Se PWM foi detectado, uma média de 7754 (mínimo: 5 - máximo: 343500) Hz foi medida. | |||
| Cinebench R10 | |
| Rendering Multiple CPUs 32Bit | |
| no name | |
| Eurocom Sky X9C | |
| Asus GL702ZC-GC104T | |
| Eurocom Tornado F5 | |
| Eurocom Sky X7E2 | |
| MSI GT80 Titan SLI | |
| Razer Blade Pro RZ09-0220 | |
| Razer Blade (2016) FHD | |
| HP Spectre x360 15t-bl100 | |
| Rendering Single 32Bit | |
| Eurocom Sky X9C | |
| no name | |
| Eurocom Tornado F5 | |
| HP Spectre x360 15t-bl100 | |
| Eurocom Sky X7E2 | |
| MSI GT80 Titan SLI | |
| Razer Blade (2016) FHD | |
| Razer Blade Pro RZ09-0220 | |
| Asus GL702ZC-GC104T | |
| wPrime 2.10 - 1024m | |
| HP Spectre x360 15t-bl100 | |
| Razer Blade Pro RZ09-0220 | |
| Eurocom Sky X7E2 | |
| Eurocom Tornado F5 | |
| no name | |
| Eurocom Sky X9C | |
* ... menor é melhor
| PCMark 8 | |
| Home Score Accelerated v2 | |
| Eurocom Tornado F5 | |
| MSI GT83VR 7RF-206 Titan SLI | |
| Eurocom Sky X9C | |
| Eurocom Sky X7E2 | |
| Razer Blade Pro RZ09-0220 | |
| Work Score Accelerated v2 | |
| Eurocom Tornado F5 | |
| MSI GT83VR 7RF-206 Titan SLI | |
| Razer Blade Pro RZ09-0220 | |
| Eurocom Sky X9C | |
| Eurocom Sky X7E2 | |
| Creative Score Accelerated v2 | |
| Eurocom Sky X9C | |
| Eurocom Tornado F5 | |
| Eurocom Sky X7E2 | |
| Razer Blade Pro RZ09-0220 | |
| PCMark 8 Home Score Accelerated v2 | 5005 pontos | |
| PCMark 8 Creative Score Accelerated v2 | 9529 pontos | |
| PCMark 8 Work Score Accelerated v2 | 5095 pontos | |
| PCMark 10 Score | 6495 pontos | |
Ajuda | ||
| Eurocom Sky X9C 2x Samsung SSD 960 Pro 1TB m.2 NVMe (RAID 0) | MSI GT75VR 7RF-012 Titan Pro 2x Samsung SM961 MZVPW256HEGL NVMe (RAID 0) | Razer Blade Pro RZ09-0220 Samsung SSD PM951 MZVLV256HCHP | Asus GL702ZC-GC104T SanDisk SD8SN8U256G1002 | HP Spectre x360 15t-bl100 Samsung PM961 NVMe MZVLW512HMJP | |
|---|---|---|---|---|---|
| CrystalDiskMark 5.2 / 6 | 1% | -46% | -67% | -22% | |
| Write 4K (MB/s) | 152 | 165 9% | 155.1 2% | 96.1 -37% | 174.1 15% |
| Read 4K (MB/s) | 54.7 | 55.9 2% | 44.22 -19% | 38.91 -29% | 48.07 -12% |
| Write Seq (MB/s) | 2702 | 2612 -3% | 311.2 -88% | 467.9 -83% | 1444 -47% |
| Read Seq (MB/s) | 3261 | 3377 4% | 1247 -62% | 494.2 -85% | 1008 -69% |
| Write 4K Q32T1 (MB/s) | 528 | 548 4% | 310.3 -41% | 188.9 -64% | 512 -3% |
| Read 4K Q32T1 (MB/s) | 630 | 625 -1% | 551 -13% | 205.9 -67% | 632 0% |
| Write Seq Q32T1 (MB/s) | 3074 | 2944 -4% | 311.5 -90% | 461.2 -85% | 1522 -50% |
| Read Seq Q32T1 (MB/s) | 3425 | 3407 -1% | 1560 -54% | 450.8 -87% | 3111 -9% |

| 3DMark | |
| 1920x1080 Fire Strike Graphics | |
| MSI GT83VR 7RF-206 Titan SLI | |
| Eurocom Sky X9C | |
| Desktop PC Ryzen 7 1800X + Zotac GeForce GTX 1070 SLI | |
| Aorus X9 | |
| Nvidia GeForce GTX 1080 Ti Founders Edition | |
| MSI GT75VR 7RF-012 Titan Pro | |
| Nvidia GeForce GTX 1080 Founders Edition | |
| MSI GT80-2QES32SR311BW | |
| Asus Zephyrus GX501 | |
| Razer Blade Pro RZ09-0220 | |
| 3840x2160 Fire Strike Ultra Graphics | |
| Eurocom Sky X9C | |
| Desktop PC Ryzen 7 1800X + Zotac GeForce GTX 1070 SLI | |
| Nvidia GeForce GTX 1080 Ti Founders Edition | |
| Nvidia GeForce GTX 1080 Founders Edition | |
| Asus Zephyrus GX501 | |
| Razer Blade Pro RZ09-0220 | |
| 1920x1080 Fire Strike Combined | |
| Eurocom Sky X9C | |
| Nvidia GeForce GTX 1080 Ti Founders Edition | |
| Nvidia GeForce GTX 1080 Founders Edition | |
| Aorus X9 | |
| MSI GT83VR 7RF-206 Titan SLI | |
| MSI GT75VR 7RF-012 Titan Pro | |
| Asus Zephyrus GX501 | |
| Desktop PC Ryzen 7 1800X + Zotac GeForce GTX 1070 SLI | |
| MSI GT80-2QES32SR311BW | |
| Razer Blade Pro RZ09-0220 | |
| 3DMark 11 | |
| 1280x720 Performance GPU | |
| MSI GT83VR 7RF-206 Titan SLI | |
| Eurocom Sky X9C | |
| Desktop PC Ryzen 7 1800X + Zotac GeForce GTX 1070 SLI | |
| Aorus X9 | |
| Nvidia GeForce GTX 1080 Ti Founders Edition | |
| Nvidia GeForce GTX 1080 Founders Edition | |
| MSI GT75VR 7RF-012 Titan Pro | |
| Asus Zephyrus GX501 | |
| MSI GT80-2QES32SR311BW | |
| Razer Blade Pro RZ09-0220 | |
| 1280x720 Performance Combined | |
| Eurocom Sky X9C | |
| Nvidia GeForce GTX 1080 Founders Edition | |
| Desktop PC Ryzen 7 1800X + Zotac GeForce GTX 1070 SLI | |
| Nvidia GeForce GTX 1080 Ti Founders Edition | |
| MSI GT80-2QES32SR311BW | |
| Aorus X9 | |
| MSI GT75VR 7RF-012 Titan Pro | |
| MSI GT83VR 7RF-206 Titan SLI | |
| Asus Zephyrus GX501 | |
| Razer Blade Pro RZ09-0220 | |
| 3DMark 11 Performance | 30042 pontos | |
| 3DMark Ice Storm Standard Score | 192638 pontos | |
| 3DMark Cloud Gate Standard Score | 45068 pontos | |
| 3DMark Fire Strike Score | 26751 pontos | |
| 3DMark Fire Strike Extreme Score | 17060 pontos | |
Ajuda | ||
| Rise of the Tomb Raider - 3840x2160 High Preset AA:FX AF:4x | |
| Eurocom Sky X9C | |
| Asus GX800VH Prototype | |
| Desktop PC Ryzen 7 1800X + Zotac GeForce GTX 1070 SLI | |
| Nvidia GeForce GTX 1080 Ti Founders Edition | |
| Nvidia GeForce GTX 1080 Ti Founders Edition | |
| MSI Gaming X GeForce GTX 1080 Desktop PC | |
| Nvidia GeForce GTX 1070 Ti Founders Edition | |
| Asus Zephyrus GX501 | |
| Asus GL702ZC-GC104T | |
| Destiny 2 - 3840x2160 Highest Preset AA:SM AF:16x | |
| Eurocom Sky X9C | |
| Desktop PC Ryzen 7 1800X + Zotac GeForce GTX 1070 SLI | |
| Nvidia GeForce GTX 1080 Ti Founders Edition | |
| Middle-earth: Shadow of War - 3840x2160 Ultra Preset AA:T | |
| Eurocom Sky X9C | |
| Nvidia GeForce GTX 1080 Ti Founders Edition | |
| Desktop PC Ryzen 7 1800X + Zotac GeForce GTX 1070 SLI | |
| Nvidia GeForce GTX 1070 Ti Founders Edition | |
| Ashes of the Singularity - 3840x2160 crazy | |
| Nvidia GeForce GTX 1080 Ti Founders Edition | |
| Eurocom Sky X9C | |
| Mafia 3 - 3840x2160 High Preset | |
| Nvidia GeForce GTX 1080 Ti Founders Edition | |
| Eurocom Sky X9C | |
| MSI Gaming X GeForce GTX 1080 Desktop PC | |
| baixo | média | alto | ultra | 4K | |
|---|---|---|---|---|---|
| Guild Wars 2 (2012) | 150.3 | 84.3 | 77.8 | ||
| BioShock Infinite (2013) | 398.4 | 347.3 | 295.5 | 265.6 | |
| Metro: Last Light (2013) | 196 | 194.8 | 192.8 | 172.1 | |
| Thief (2014) | 150.1 | 147.5 | 144.5 | 141.9 | |
| The Witcher 3 (2015) | 357 | 229.8 | 184.3 | 106.4 | 87.1 |
| Batman: Arkham Knight (2015) | 202 | 186 | 150 | 99 | 57 |
| Metal Gear Solid V (2015) | 60 | 60 | 60 | 60 | 60 |
| Fallout 4 (2015) | 212.9 | 219.5 | 174.5 | 167.6 | 100 |
| Rise of the Tomb Raider (2016) | 122.8 | 110.6 | 99.8 | 103.5 | 87.4 |
| Ashes of the Singularity (2016) | 109.8 | 105.9 | 100.6 | 46.7 | |
| Overwatch (2016) | 300 | 300 | 300 | 300 | 216.3 |
| Mafia 3 (2016) | 134.4 | 115 | 79.9 | 33.4 | |
| Prey (2017) | 144 | 144 | 144 | 143 | 84 |
| Dirt 4 (2017) | 360.8 | 245.7 | 122.5 | 82.6 | 54.9 |
| F1 2017 (2017) | 237 | 178 | 152 | 109 | 56 |
| Middle-earth: Shadow of War (2017) | 98 | 123 | 106 | 92 | 55 |
| Destiny 2 (2017) | 148.4 | 121.9 | 116.2 | 113.1 | 80.3 |
Barulho
| Ocioso |
| 34.2 / 39.6 / 39.6 dB |
| Carga |
| 48.5 / 56.5 dB |
 | ||
30 dB silencioso 40 dB(A) audível 50 dB(A) ruidosamente alto |
||
min: | ||
| Eurocom Sky X9C GeForce GTX 1080 SLI (Laptop), i7-8700K, 2x Samsung SSD 960 Pro 1TB m.2 NVMe (RAID 0) | Alienware 17 R4 GeForce GTX 1080 Mobile, i7-7820HK, SK Hynix PC300 NVMe 512 GB | MSI GT83VR 7RF-206 Titan SLI GeForce GTX 1080 SLI (Laptop), i7-7920HQ, 2x Toshiba NVMe THNSN5256GPU7 (RAID 0) | Eurocom Sky X7E2 GeForce GTX 1080 Mobile, 6700K, Samsung SM951 MZVPV512HDGL m.2 PCI-e | Aorus X9 GeForce GTX 1070 SLI (Laptop), i7-7820HK, Samsung SM961 MZVKW512HMJP m.2 PCI-e | Razer Blade Pro 2017 GeForce GTX 1080 Mobile, i7-7820HK, 2x Samsung SSD PM951 MZVLV256HCHP (RAID 0) | |
|---|---|---|---|---|---|---|
| Noise | 4% | -3% | 8% | -3% | 7% | |
| desligado / ambiente * (dB) | 28.4 | 28.2 1% | 31 -9% | 28.9 -2% | 30 -6% | 30 -6% |
| Idle Minimum * (dB) | 34.2 | 35.6 -4% | 35 -2% | 28.9 15% | 35 -2% | 30 12% |
| Idle Average * (dB) | 39.6 | 35.6 10% | 38 4% | 30.6 23% | 37 7% | 31 22% |
| Idle Maximum * (dB) | 39.6 | 35.7 10% | 41 -4% | 35.7 10% | 43 -9% | 33 17% |
| Load Average * (dB) | 48.5 | 50.2 -4% | 52 -7% | 49 -1% | 49 -1% | 43 11% |
| Witcher 3 ultra * (dB) | 54 | 50.2 7% | 53 2% | 56 -4% | 55 -2% | |
| Load Maximum * (dB) | 56.5 | 50.2 11% | 59 -4% | 55 3% | 60 -6% | 58 -3% |
* ... menor é melhor
(±) A temperatura máxima no lado superior é 44.6 °C / 112 F, em comparação com a média de 40.4 °C / 105 F , variando de 21.2 a 68.8 °C para a classe Gaming.
(-) A parte inferior aquece até um máximo de 48 °C / 118 F, em comparação com a média de 43.2 °C / 110 F
(+) Em uso inativo, a temperatura média para o lado superior é 27.9 °C / 82 F, em comparação com a média do dispositivo de 33.9 °C / ### class_avg_f### F.
(+) Jogando The Witcher 3, a temperatura média para o lado superior é 30.6 °C / 87 F, em comparação com a média do dispositivo de 33.9 °C / ## #class_avg_f### F.
(±) Os apoios para as mãos e o touchpad podem ficar muito quentes ao toque, com um máximo de 38.4 °C / 101.1 F.
(-) A temperatura média da área do apoio para as mãos de dispositivos semelhantes foi 28.8 °C / 83.8 F (-9.6 °C / -17.3 F).
Eurocom Sky X9C análise de áudio
(-) | alto-falantes não muito altos (###valor### dB)
Graves 100 - 315Hz
(±) | graves reduzidos - em média 7.2% menor que a mediana
(±) | a linearidade dos graves é média (14.7% delta para a frequência anterior)
Médios 400 - 2.000 Hz
(±) | médios mais altos - em média 5.6% maior que a mediana
(+) | médios são lineares (5.5% delta para frequência anterior)
Altos 2 - 16 kHz
(±) | máximos reduzidos - em média 5.3% menor que a mediana
(±) | a linearidade dos máximos é média (11.4% delta para frequência anterior)
Geral 100 - 16.000 Hz
(±) | a linearidade do som geral é média (24.4% diferença em relação à mediana)
Comparado com a mesma classe
» 88% de todos os dispositivos testados nesta classe foram melhores, 3% semelhantes, 8% piores
» O melhor teve um delta de 6%, a média foi 18%, o pior foi 132%
Comparado com todos os dispositivos testados
» 74% de todos os dispositivos testados foram melhores, 6% semelhantes, 20% piores
» O melhor teve um delta de 4%, a média foi 23%, o pior foi 134%
Apple MacBook 12 (Early 2016) 1.1 GHz análise de áudio
(+) | os alto-falantes podem tocar relativamente alto (###valor### dB)
Graves 100 - 315Hz
(±) | graves reduzidos - em média 11.3% menor que a mediana
(±) | a linearidade dos graves é média (14.2% delta para a frequência anterior)
Médios 400 - 2.000 Hz
(+) | médios equilibrados - apenas 2.4% longe da mediana
(+) | médios são lineares (5.5% delta para frequência anterior)
Altos 2 - 16 kHz
(+) | agudos equilibrados - apenas 2% longe da mediana
(+) | os máximos são lineares (4.5% delta da frequência anterior)
Geral 100 - 16.000 Hz
(+) | o som geral é linear (10.2% diferença em relação à mediana)
Comparado com a mesma classe
» 7% de todos os dispositivos testados nesta classe foram melhores, 2% semelhantes, 90% piores
» O melhor teve um delta de 5%, a média foi 18%, o pior foi 53%
Comparado com todos os dispositivos testados
» 5% de todos os dispositivos testados foram melhores, 1% semelhantes, 94% piores
» O melhor teve um delta de 4%, a média foi 23%, o pior foi 134%
| desligado | |
| Ocioso | |
| Carga |
|
Key:
min: | |
| Eurocom Sky X9C i7-8700K, GeForce GTX 1080 SLI (Laptop), 2x Samsung SSD 960 Pro 1TB m.2 NVMe (RAID 0), IPS, 3840x2160, 17.3" | Alienware 17 R4 i7-7820HK, GeForce GTX 1080 Mobile, SK Hynix PC300 NVMe 512 GB, TN LED, 2560x1440, 17.3" | MSI GT83VR 7RF-206 Titan SLI i7-7920HQ, GeForce GTX 1080 SLI (Laptop), 2x Toshiba NVMe THNSN5256GPU7 (RAID 0), IPS, 1920x1080, 18.4" | Aorus X9 i7-7820HK, GeForce GTX 1070 SLI (Laptop), Samsung SM961 MZVKW512HMJP m.2 PCI-e, TN, 2560x1440, 17.3" | MSI GT80-2QES32SR311BW 4980HQ, GeForce GTX 980M SLI, 4x Toshiba HG6 THNSNJ256G8NU (RAID 0), Wide View, Super PLS, 1920x1080, 18.4" | |
|---|---|---|---|---|---|
| Power Consumption | 34% | -9% | 28% | 19% | |
| Idle Minimum * (Watt) | 54.7 | 37.5 31% | 45 18% | 29 47% | 34.3 37% |
| Idle Average * (Watt) | 55.7 | 37.6 32% | 54 3% | 35 37% | 41.9 25% |
| Idle Maximum * (Watt) | 56.8 | 37.6 34% | 62 -9% | 42 26% | 49.3 13% |
| Load Average * (Watt) | 183.7 | 122.4 33% | 178 3% | 140 24% | 140.2 24% |
| Witcher 3 ultra * (Watt) | 454.8 | 180.3 60% | 380 16% | 295 35% | |
| Load Maximum * (Watt) | 321.8 | 277.4 14% | 586 -82% | 334 -4% | 328.6 -2% |
* ... menor é melhor
| Eurocom Sky X9C i7-8700K, GeForce GTX 1080 SLI (Laptop), 89 Wh | Alienware 17 R4 i7-7820HK, GeForce GTX 1080 Mobile, 99 Wh | MSI GT83VR 7RF-206 Titan SLI i7-7920HQ, GeForce GTX 1080 SLI (Laptop), 75.24 Wh | Aorus X9 i7-7820HK, GeForce GTX 1070 SLI (Laptop), 94.24 Wh | Eurocom Sky X7E2 6700K, GeForce GTX 1080 Mobile, 89 Wh | Asus GL702ZC-GC104T R7 1700, Radeon RX 580 (Laptop), 76 Wh | |
|---|---|---|---|---|---|---|
| Duração da bateria | 137% | 50% | 75% | 57% | 16% | |
| Reader / Idle (h) | 1.4 | 4.6 229% | 2.4 71% | 2.9 107% | 2.3 64% | 1.7 21% |
| WiFi v1.3 (h) | 1.3 | 3 131% | 2 54% | 2.2 69% | 1.7 31% | 1.5 15% |
| Load (h) | 0.8 | 1.2 50% | 1 25% | 1.2 50% | 1.4 75% | 0.9 13% |
Pro
Contra
Deixamos nossa opinião sobre SLI bem clara no passado. Para fins de jogo, o SLI sempre foi um saco misto. O advento do DX12, em particular, tornou o SLI ainda mais difícil de recomendar, uma vez que a API agora relega a otimização multi-GPU às mãos dos desenvolvedores individuais, em vez da Nvidia. O suporte confiável do SLI está se tornando muito irregular como resultado, e os números mornos de benchmark reforçam essa noção. Os usuários que desejam o SLI em um portátil devem ter motivos muito específicos para possuir a tecnologia porque a GPU extra pode ser pior do que um pisa papeis em muitos casos.
Com isso fora do caminho, o Eurocom Sky X9C superou rapidamente a maioria dos benchmarks em nosso banco de dados devido à sua configuração extrema e Core i7-8700K. Seus componentes modulares e ampla gama de recursos de hardware suportados continuam a ser o destaque de possuir um Eurocom sobre alternativas de fabricantes mais conhecidos.
As mesmas desvantagens permanecem como e quase todos os portáteis Eurocom que testamos. O perfil de desempenho muito denso comporta alto ruído do ventilador (54 dB (A)), temperaturas do núcleo muito quentes (> 85 C), peso pesado (5,6 kg) e uma duração reduzida da bateria que também pode ser medida em minutos. Enquanto o peso e as durações não são grandes fatores para os portáteis de jogo, as temperaturas quentes do núcleo limitam significativamente o potencial de overclocking e o ruído alto é tão inimigo quanto qualquer obstáculo na tela durante os jogos. Não podemos deixar de nos perguntar como este sistema poderia ter se desempenhado removendo o SLI e duplicando o número de tubos de calor, tanto para a CPU quanto para a GPU. Estamos dispostos a apostar que as temperaturas mais baixas resultantes, os ventiladores mais silenciosos, as velocidades mais altas do Boost e o potencial de overclocking mais amplo levariam a um melhor desempenho nos jogos, mesmo que os índices de benchmark sintéticos sejam menores do que os da configuração SLI.
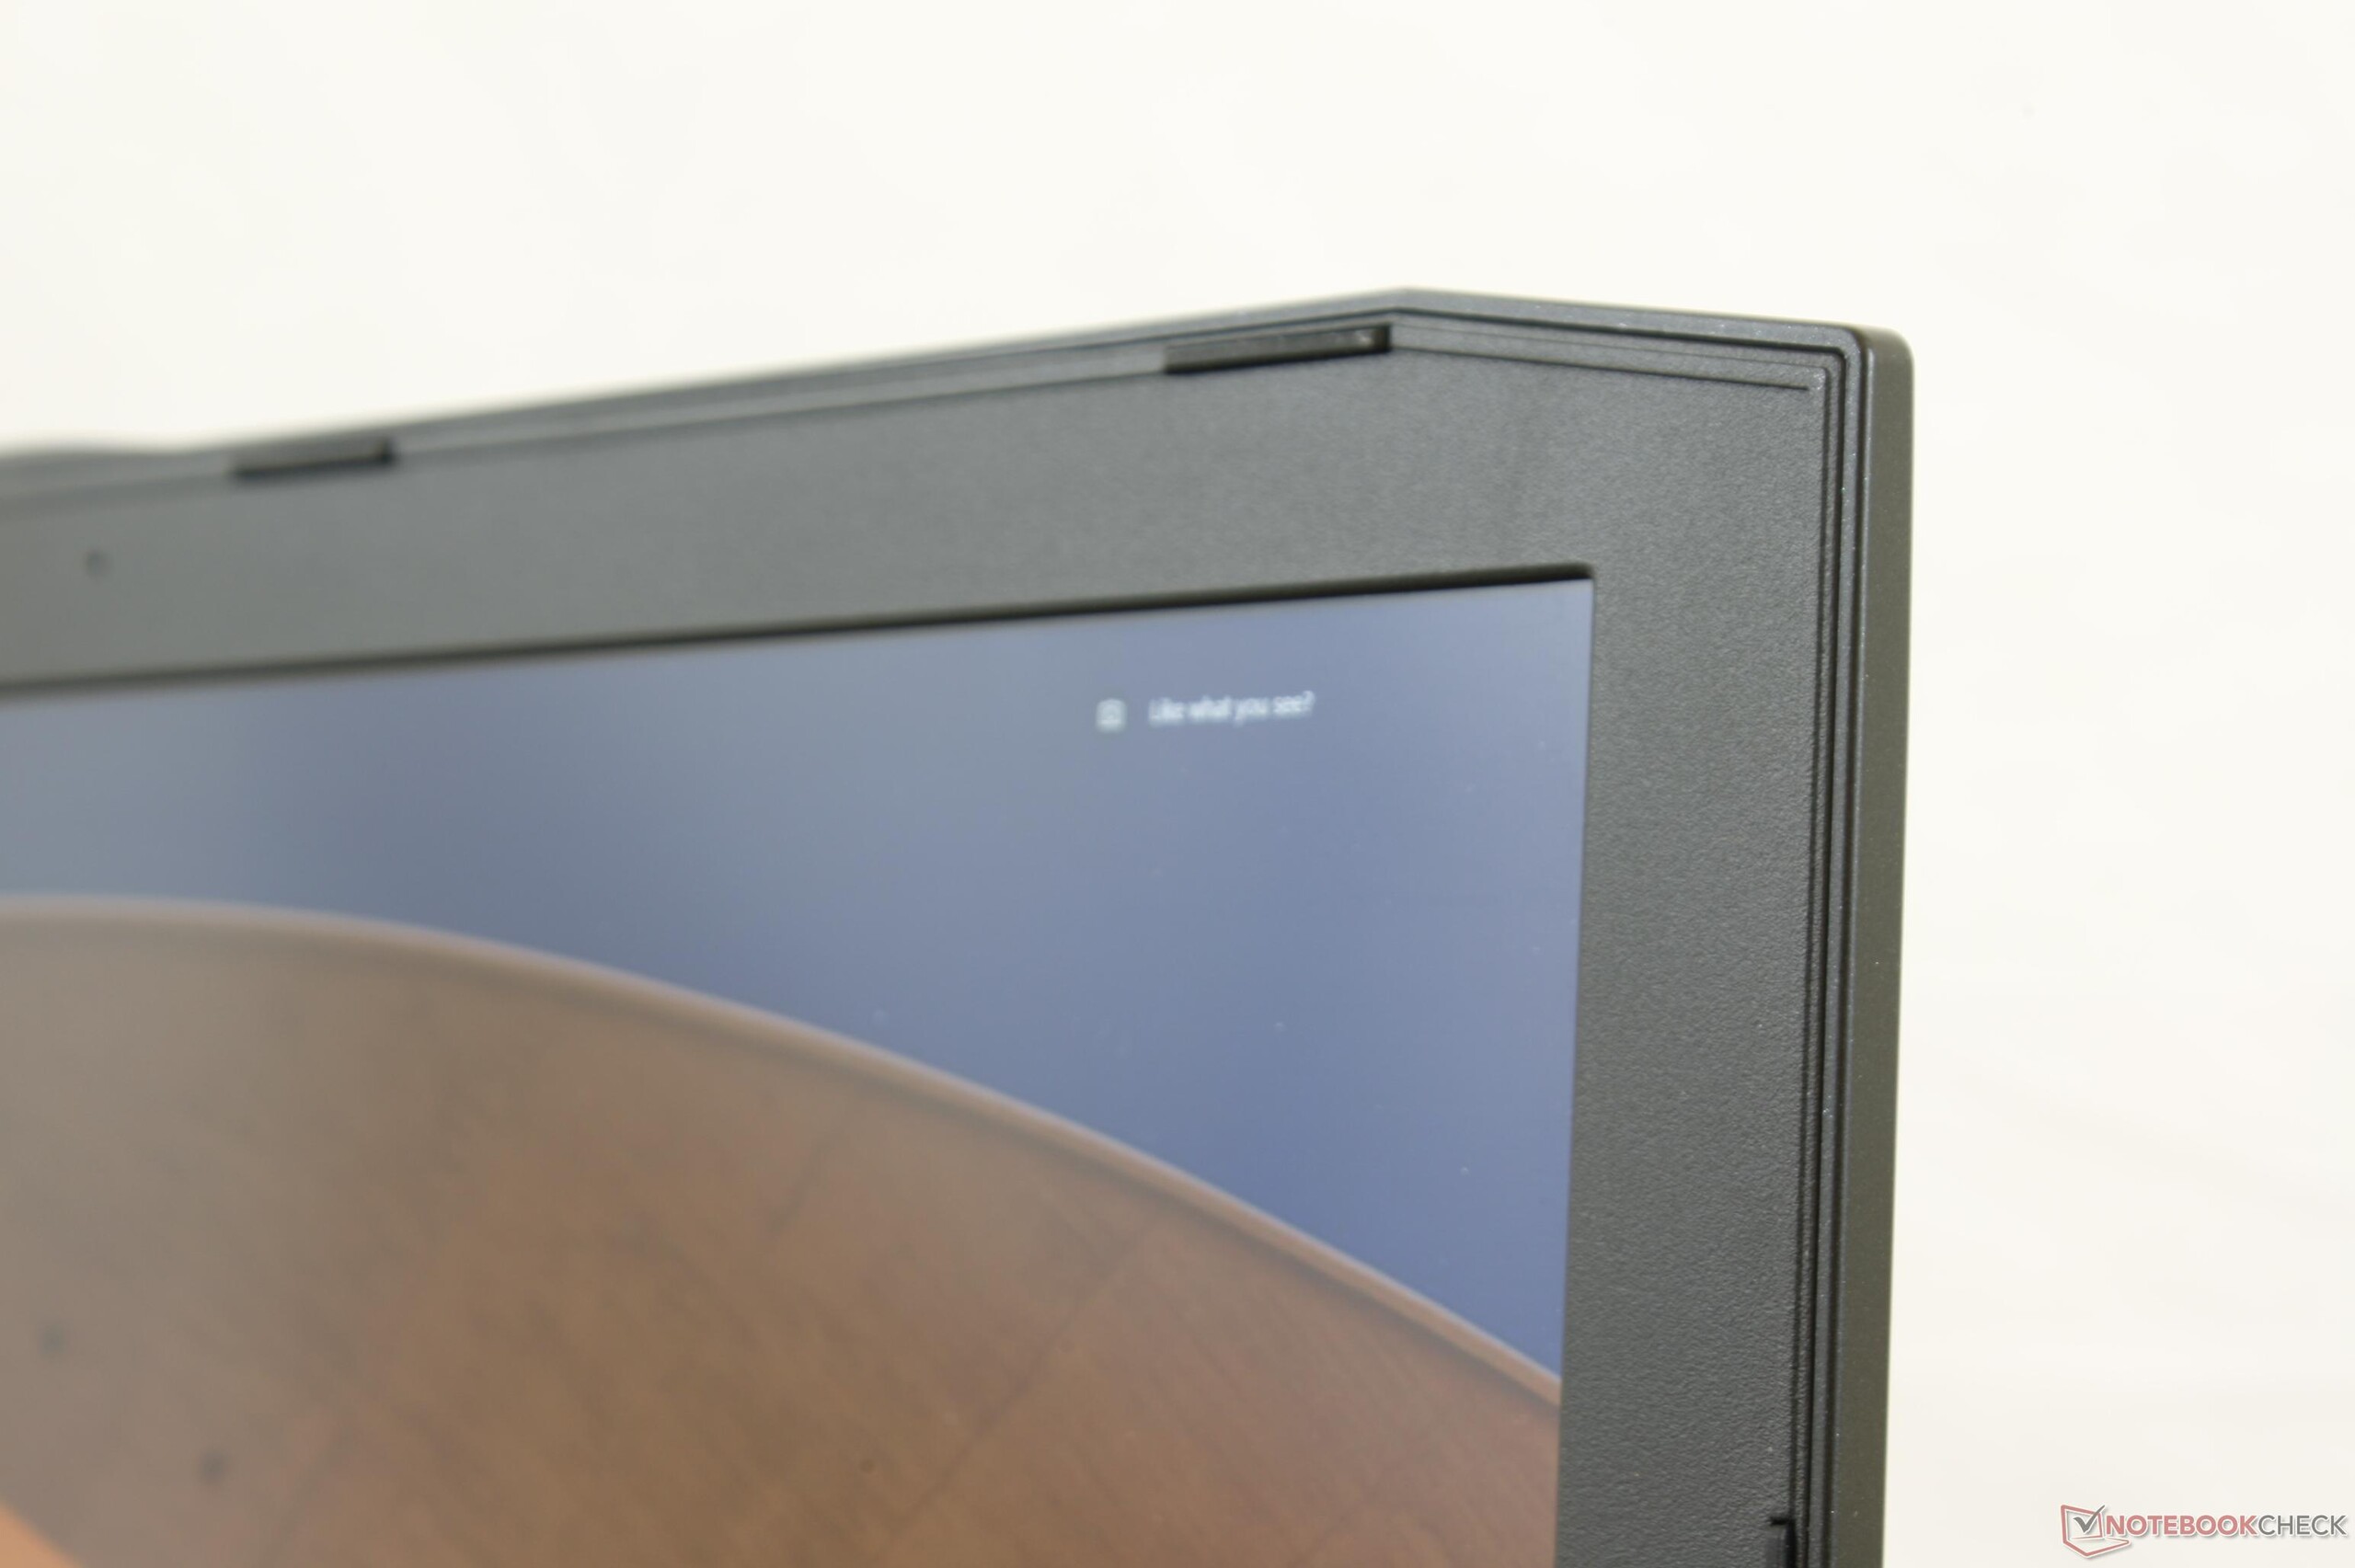
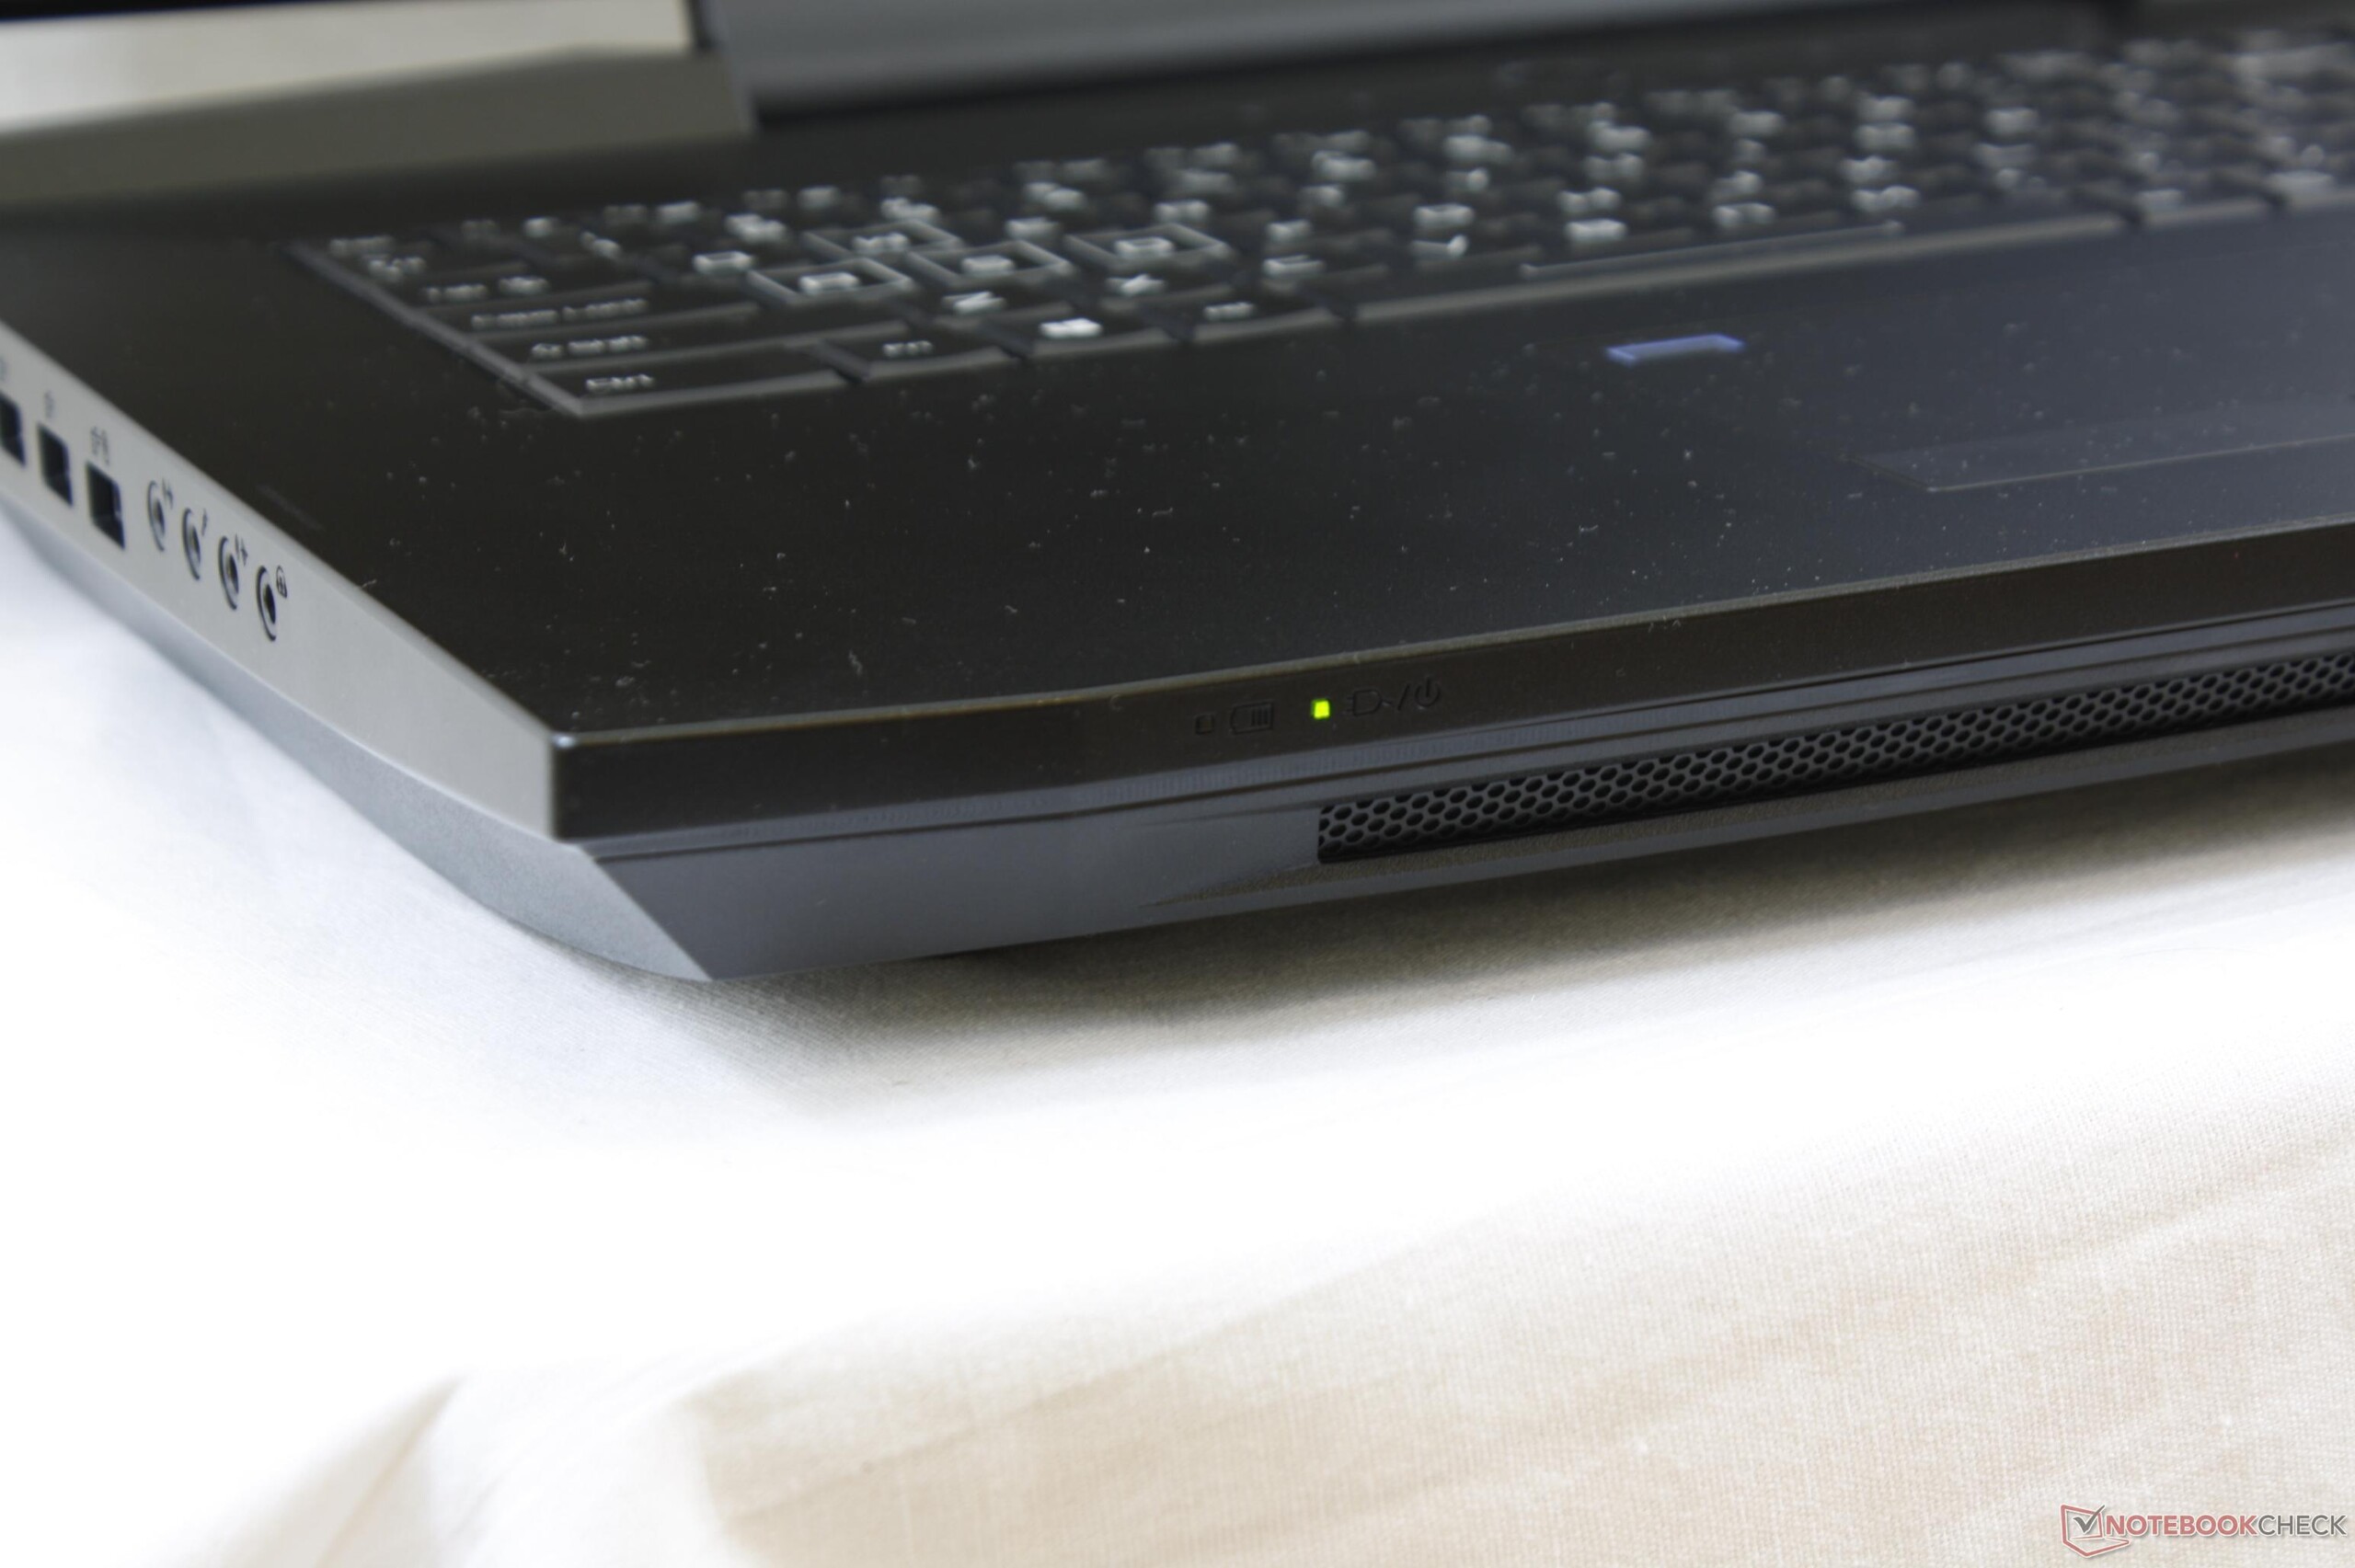
Alguns aspectos do chassi e do software parecem presos no passado. A falta de teclas RGB iluminadas individualmente é cada vez mais difícil de perdoar e o marco plástico interno da tela ainda se sente barato em comparação com um design Alienware. O Centro de Controle e os utilitários de overclocking estão mais focados na criação de uma GUI "Fisher-Price" atraente com tamanhos de fonte grandes em vez de uma interface limpa com opções facilmente acessíveis que não estão enterradas em várias janelas. Os recursos que são realmente mais úteis para os jogadores, como gravação de dados, gravação de vídeo, ajustes/leituras diretas de RPM para cada ventoinha, e sobreposições de desempenho ainda estão faltando no software pré-instalado.
Para a melhor experiência geral de jogos, os usuários estarão melhor configurando o Sky X9C com uma única GTX 1080 e depois fazendo o overclocking a partir daí. Mais jogadores conscientes do orçamento podem obter essencialmente o mesmo desempenho de jogos de um processador menos exigente de classe HQ de 45 W, já que a maioria dos títulos não está vinculada pela CPU. Certifique-se de ter um bom par de fones de ouvido quando jogar!
Eurocom Sky X9C
- 12/29/2017 v6 (old)
Allen Ngo
Price comparison
