Breve Análise do Portátil Eurocom Sky X7C (i7-8086K, GTX 1080, Clevo P775TM1-G)

| SD Card Reader | |
| average JPG Copy Test (av. of 3 runs) | |
| Asus Chimera G703GI (Toshiba Exceria Pro SDXC 64 GB UHS-II) | |
| Eurocom Sky X7C (Toshiba Exceria Pro SDXC 64 GB UHS-II) | |
| MSI GT75 8RG-090 Titan (Toshiba Exceria Pro SDXC 64 GB UHS-II) | |
| Alienware 17 R3 (A17-9935) (Toshiba Exceria Pro SDXC 64 GB UHS-II) | |
| maximum AS SSD Seq Read Test (1GB) | |
| Asus Chimera G703GI (Toshiba Exceria Pro SDXC 64 GB UHS-II) | |
| Eurocom Sky X7C (Toshiba Exceria Pro SDXC 64 GB UHS-II) | |
| Alienware 17 R3 (A17-9935) (Toshiba Exceria Pro SDXC 64 GB UHS-II) | |
| MSI GT75 8RG-090 Titan (Toshiba Exceria Pro SDXC 64 GB UHS-II) | |
| Networking | |
| iperf3 transmit AX12 | |
| Asus Chimera G703GI | |
| MSI GT75 8RG-090 Titan | |
| Eurocom Sky X7C | |
| Aorus X7 DT v8 | |
| iperf3 receive AX12 | |
| MSI GT75 8RG-090 Titan | |
| Asus Chimera G703GI | |
| Eurocom Sky X7C | |
| Aorus X7 DT v8 | |
| |||||||||||||||||||||||||
iluminação: 88 %
iluminação com acumulador: 333 cd/m²
Contraste: 833:1 (Preto: 0.4 cd/m²)
ΔE ColorChecker Calman: 5.87 | ∀{0.5-29.43 Ø4.71}
calibrated: 4.59
ΔE Greyscale Calman: 4.5 | ∀{0.09-98 Ø4.96}
100% sRGB (Argyll 1.6.3 3D)
88% AdobeRGB 1998 (Argyll 1.6.3 3D)
98.9% AdobeRGB 1998 (Argyll 3D)
99.9% sRGB (Argyll 3D)
86% Display P3 (Argyll 3D)
Gamma: 2.34
CCT: 6384 K
| Eurocom Sky X7C AU Optronics B173ZAN01.0, IPS, 17.3", 3840x2160 | MSI GT75 8RG-090 Titan CMN N173HHE-G32 (CMN1747), TN, 17.3", 1920x1080 | Alienware 17 R3 (A17-9935) CV69H_173WF4 (LGD0459), IPS, 17.3", 1920x1080 | Asus Chimera G703GI B173HAN03.2 (AUO329D), IPS, 17.3", 1920x1080 | Aorus X7 DT v8 AU Optronics B173HAN03.0 (AUO309D), IPS, 17.3", 1920x1080 | Razer Blade Pro 2017 Sharp LQ173D1JW33 (SHP145A), IGZO, 17.3", 3840x2160 | |
|---|---|---|---|---|---|---|
| Display | -2% | -25% | -21% | -22% | 1% | |
| Display P3 Coverage (%) | 86 | 90.9 6% | 66.9 -22% | 65.8 -23% | 65.3 -24% | 88.9 3% |
| sRGB Coverage (%) | 99.9 | 100 0% | 83.9 -16% | 92.6 -7% | 91.2 -9% | 100 0% |
| AdobeRGB 1998 Coverage (%) | 98.9 | 86.2 -13% | 61.4 -38% | 67 -32% | 66.3 -33% | 99.7 1% |
| Response Times | 79% | 14% | 72% | 54% | -51% | |
| Response Time Grey 50% / Grey 80% * (ms) | 38.4 ? | 8 ? 79% | 33 ? 14% | 6.4 ? 83% | 18 ? 53% | 60.8 ? -58% |
| Response Time Black / White * (ms) | 26.8 ? | 5.6 ? 79% | 23 ? 14% | 10.8 ? 60% | 12 ? 55% | 38.4 ? -43% |
| PWM Frequency (Hz) | 26000 ? | 204.9 ? | ||||
| Screen | 22% | -3% | 19% | 21% | 1% | |
| Brightness middle (cd/m²) | 333 | 240 -28% | 360 8% | 285 -14% | 297 -11% | 230 -31% |
| Brightness (cd/m²) | 330 | 248 -25% | 336 2% | 275 -17% | 281 -15% | 207 -37% |
| Brightness Distribution (%) | 88 | 83 -6% | 90 2% | 82 -7% | 84 -5% | 83 -6% |
| Black Level * (cd/m²) | 0.4 | 0.22 45% | 0.44 -10% | 0.22 45% | 0.23 43% | 0.2 50% |
| Contrast (:1) | 833 | 1091 31% | 818 -2% | 1295 55% | 1291 55% | 1150 38% |
| Colorchecker dE 2000 * | 5.87 | 2.14 64% | 4.76 19% | 3.18 46% | 2.19 63% | 5.62 4% |
| Colorchecker dE 2000 max. * | 9.74 | 5.04 48% | 10.8 -11% | 5.99 39% | 4.81 51% | 10.24 -5% |
| Colorchecker dE 2000 calibrated * | 4.59 | 1.54 66% | 1.73 62% | |||
| Greyscale dE 2000 * | 4.5 | 1.62 64% | 3.69 18% | 2.93 35% | 1.31 71% | 4.54 -1% |
| Gamma | 2.34 94% | 2.28 96% | 2.24 98% | 2.45 90% | 2.42 91% | 2.36 93% |
| CCT | 6384 102% | 6846 95% | 6091 107% | 7165 91% | 6464 101% | 6625 98% |
| Color Space (Percent of AdobeRGB 1998) (%) | 88 | 77 -12% | 55 -37% | 60 -32% | 59 -33% | 88 0% |
| Color Space (Percent of sRGB) (%) | 100 | 100 0% | 84 -16% | 93 -7% | 91 -9% | 100 0% |
| Média Total (Programa/Configurações) | 33% /
25% | -5% /
-5% | 23% /
18% | 18% /
17% | -16% /
-6% |
* ... menor é melhor
Exibir tempos de resposta
| ↔ Tempo de resposta preto para branco | ||
|---|---|---|
| 26.8 ms ... ascensão ↗ e queda ↘ combinadas | ↗ 15.6 ms ascensão | 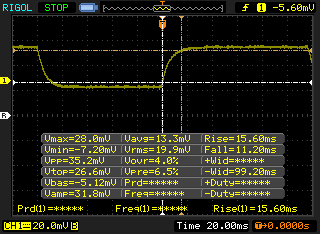 |
| ↘ 11.2 ms queda | ||
| A tela mostra taxas de resposta relativamente lentas em nossos testes e pode ser muito lenta para os jogadores. Em comparação, todos os dispositivos testados variam de 0.1 (mínimo) a 240 (máximo) ms. » 67 % de todos os dispositivos são melhores. Isso significa que o tempo de resposta medido é pior que a média de todos os dispositivos testados (19.8 ms). | ||
| ↔ Tempo de resposta 50% cinza a 80% cinza | ||
| 38.4 ms ... ascensão ↗ e queda ↘ combinadas | ↗ 18 ms ascensão | 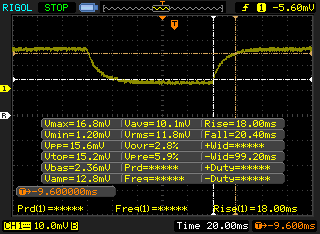 |
| ↘ 20.4 ms queda | ||
| A tela mostra taxas de resposta lentas em nossos testes e será insatisfatória para os jogadores. Em comparação, todos os dispositivos testados variam de 0.165 (mínimo) a 636 (máximo) ms. » 58 % de todos os dispositivos são melhores. Isso significa que o tempo de resposta medido é pior que a média de todos os dispositivos testados (31 ms). | ||
Cintilação da tela / PWM (modulação por largura de pulso)
| Tela tremeluzindo / PWM não detectado |  | ||
[pwm_comparison] Em comparação: 52 % de todos os dispositivos testados não usam PWM para escurecer a tela. Se PWM foi detectado, uma média de 7754 (mínimo: 5 - máximo: 343500) Hz foi medida. | |||
| Cinebench R10 | |
| Rendering Multiple CPUs 32Bit | |
| no name | |
| Eurocom Sky X9C | |
| Aorus X9 DT | |
| Eurocom Sky X7C | |
| Asus GL702ZC-GC104T | |
| Eurocom Tornado F5 | |
| Asus ROG Strix GL702VI-WB74 | |
| MSI GV62 8RE-016US | |
| Aorus X5S v5 | |
| Rendering Single 32Bit | |
| Eurocom Sky X9C | |
| no name | |
| Eurocom Tornado F5 | |
| Aorus X9 DT | |
| Eurocom Sky X7C | |
| MSI GV62 8RE-016US | |
| Asus ROG Strix GL702VI-WB74 | |
| Aorus X5S v5 | |
| Asus GL702ZC-GC104T | |
| wPrime 2.10 - 1024m | |
| Asus ROG Strix GL702VI-WB74 | |
| Aorus X5S v5 | |
| MSI GV62 8RE-016US | |
| Eurocom Tornado F5 | |
| Eurocom Sky X7C | |
| no name | |
| Eurocom Sky X9C | |
* ... menor é melhor
| PCMark 10 - Score | |
| Asus Chimera G703GI | |
| MSI GT75 8RG-090 Titan | |
| Eurocom Sky X9C | |
| Aorus X9 DT | |
| Eurocom Sky X7C | |
| Razer Blade Pro 2017 | |
| PCMark 8 - Home Score Accelerated v2 | |
| Asus Chimera G703GI | |
| Aorus X9 DT | |
| MSI GT75 8RG-090 Titan | |
| Eurocom Sky X9C | |
| Eurocom Sky X7C | |
| Razer Blade Pro 2017 | |
| PCMark 8 Home Score Accelerated v2 | 4908 pontos | |
| PCMark 10 Score | 6369 pontos | |
Ajuda | ||
| Eurocom Sky X7C 2x Samsung SSD 970 Pro 512GB (RAID 0) | MSI GT75 8RG-090 Titan 2x Samsung PM961 MZVLW256HEHP (RAID 0) | Asus Chimera G703GI 2x Intel 760p 512 GB + 1x Samsung SM961 512 GB (RAID) | Aorus X7 DT v8 Toshiba NVMe THNSN5512GPU7 | Razer Blade Pro 2017 2x Samsung SSD PM951 MZVLV256HCHP (RAID 0) | Aorus X9 DT Transcend TS1TMTE850 | |
|---|---|---|---|---|---|---|
| CrystalDiskMark 5.2 / 6 | -20% | 30% | -43% | -28% | -45% | |
| Write 4K (MB/s) | 152.2 | 111.8 -27% | 130.2 -14% | 88.6 -42% | 124 -19% | 104.4 -31% |
| Read 4K (MB/s) | 60.4 | 42.09 -30% | 57.3 -5% | 30.76 -49% | 40.68 -33% | 35.69 -41% |
| Write Seq (MB/s) | 3002 | 2288 -24% | 4049 35% | 1340 -55% | 618 -79% | 1015 -66% |
| Read Seq (MB/s) | 3329 | 3321 0% | 5325 60% | 1362 -59% | 2446 -27% | 1283 -61% |
| Write 4K Q32T1 (MB/s) | 432.9 | 308.3 -29% | 383.2 -11% | 305.7 -29% | 554 28% | 308.9 -29% |
| Read 4K Q32T1 (MB/s) | 494 | 364.9 -26% | 424.9 -14% | 366.8 -26% | 627 27% | 371.9 -25% |
| Write Seq Q32T1 (MB/s) | 3391 | 2440 -28% | 4316 27% | 1562 -54% | 620 -82% | 1056 -69% |
| Read Seq Q32T1 (MB/s) | 3405 | 3485 2% | 8905 162% | 2414 -29% | 2228 -35% | 2204 -35% |

| 3DMark 11 | |
| 1280x720 Performance GPU | |
| Eurocom Sky X9C | |
| MSI Gaming X GeForce GTX 1080 Desktop PC | |
| Média NVIDIA GeForce GTX 1080 Mobile (24868 - 31412, n=26) | |
| Eurocom Sky X7C | |
| Asus Zephyrus GX501 | |
| Eurocom X8 | |
| Eurocom Q8 | |
| Eurocom Q6 | |
| Asus ROG Strix GL702ZC-GC204T | |
| Asus Strix GL703GM-DS74 | |
| Asus Strix GL502VY-DS71 | |
| 1280x720 Performance Combined | |
| Eurocom Sky X7C | |
| Eurocom Sky X9C | |
| Eurocom Q8 | |
| MSI Gaming X GeForce GTX 1080 Desktop PC | |
| Média NVIDIA GeForce GTX 1080 Mobile (7533 - 16949, n=26) | |
| Eurocom Q6 | |
| Asus Strix GL703GM-DS74 | |
| Asus Zephyrus GX501 | |
| Eurocom X8 | |
| Asus Strix GL502VY-DS71 | |
| Asus ROG Strix GL702ZC-GC204T | |
| 3DMark 11 Performance | 22653 pontos | |
Ajuda | ||
| baixo | média | alto | ultra | |
|---|---|---|---|---|
| BioShock Infinite (2013) | 379.5 | 320.7 | 303.4 | 178.5 |
| The Witcher 3 (2015) | 72 |
Barulho
| Ocioso |
| 28.2 / 28.2 / 29 dB |
| Carga |
| 41.8 / 42.2 dB |
 | ||
30 dB silencioso 40 dB(A) audível 50 dB(A) ruidosamente alto |
||
min: | ||
| Eurocom Sky X7C GeForce GTX 1080 Mobile, i7-8086K, 2x Samsung SSD 970 Pro 512GB (RAID 0) | MSI GT75 8RG-090 Titan GeForce GTX 1080 Mobile, i9-8950HK, 2x Samsung PM961 MZVLW256HEHP (RAID 0) | Alienware 17 R3 (A17-9935) GeForce GTX 980M, 6700HQ, Samsung PM951 NVMe 512 GB | Asus Chimera G703GI GeForce GTX 1080 Mobile, i9-8950HK, 2x Intel 760p 512 GB + 1x Samsung SM961 512 GB (RAID) | Aorus X7 DT v8 GeForce GTX 1080 Mobile, i7-8850H, Toshiba NVMe THNSN5512GPU7 | Razer Blade Pro 2017 GeForce GTX 1080 Mobile, i7-7820HK, 2x Samsung SSD PM951 MZVLV256HCHP (RAID 0) | |
|---|---|---|---|---|---|---|
| Noise | -22% | -9% | -21% | -22% | -15% | |
| desligado / ambiente * (dB) | 28.2 | 30 -6% | 30 -6% | 29 -3% | 29 -3% | 30 -6% |
| Idle Minimum * (dB) | 28.2 | 32 -13% | 31 -10% | 30 -6% | 35 -24% | 30 -6% |
| Idle Average * (dB) | 28.2 | 34 -21% | 32 -13% | 34 -21% | 36 -28% | 31 -10% |
| Idle Maximum * (dB) | 29 | 37 -28% | 33 -14% | 42 -45% | 41 -41% | 33 -14% |
| Load Average * (dB) | 41.8 | 43 -3% | 38 9% | 53 -27% | 43 -3% | 43 -3% |
| Witcher 3 ultra * (dB) | 42.2 | 57 -35% | 51 -21% | 53 -26% | 55 -30% | |
| Load Maximum * (dB) | 42.2 | 62 -47% | 50 -18% | 53 -26% | 54 -28% | 58 -37% |
* ... menor é melhor
(±) A temperatura máxima no lado superior é 42 °C / 108 F, em comparação com a média de 40.4 °C / 105 F , variando de 21.2 a 68.8 °C para a classe Gaming.
(±) A parte inferior aquece até um máximo de 40.2 °C / 104 F, em comparação com a média de 43.2 °C / 110 F
(+) Em uso inativo, a temperatura média para o lado superior é 24.4 °C / 76 F, em comparação com a média do dispositivo de 33.9 °C / ### class_avg_f### F.
(+) Jogando The Witcher 3, a temperatura média para o lado superior é 29.6 °C / 85 F, em comparação com a média do dispositivo de 33.9 °C / ## #class_avg_f### F.
(+) Os apoios para as mãos e o touchpad são mais frios que a temperatura da pele, com um máximo de 25 °C / 77 F e, portanto, são frios ao toque.
(+) A temperatura média da área do apoio para as mãos de dispositivos semelhantes foi 28.8 °C / 83.8 F (+3.8 °C / 6.8 F).
Eurocom Sky X7C análise de áudio
(-) | alto-falantes não muito altos (###valor### dB)
Graves 100 - 315Hz
(±) | graves reduzidos - em média 5.3% menor que a mediana
(±) | a linearidade dos graves é média (14.8% delta para a frequência anterior)
Médios 400 - 2.000 Hz
(+) | médios equilibrados - apenas 2.3% longe da mediana
(±) | a linearidade dos médios é média (7% delta para frequência anterior)
Altos 2 - 16 kHz
(+) | agudos equilibrados - apenas 1% longe da mediana
(+) | os máximos são lineares (4.6% delta da frequência anterior)
Geral 100 - 16.000 Hz
(+) | o som geral é linear (12% diferença em relação à mediana)
Comparado com a mesma classe
» 12% de todos os dispositivos testados nesta classe foram melhores, 4% semelhantes, 84% piores
» O melhor teve um delta de 6%, a média foi 18%, o pior foi 132%
Comparado com todos os dispositivos testados
» 9% de todos os dispositivos testados foram melhores, 2% semelhantes, 88% piores
» O melhor teve um delta de 4%, a média foi 23%, o pior foi 134%
Apple MacBook 12 (Early 2016) 1.1 GHz análise de áudio
(+) | os alto-falantes podem tocar relativamente alto (###valor### dB)
Graves 100 - 315Hz
(±) | graves reduzidos - em média 11.3% menor que a mediana
(±) | a linearidade dos graves é média (14.2% delta para a frequência anterior)
Médios 400 - 2.000 Hz
(+) | médios equilibrados - apenas 2.4% longe da mediana
(+) | médios são lineares (5.5% delta para frequência anterior)
Altos 2 - 16 kHz
(+) | agudos equilibrados - apenas 2% longe da mediana
(+) | os máximos são lineares (4.5% delta da frequência anterior)
Geral 100 - 16.000 Hz
(+) | o som geral é linear (10.2% diferença em relação à mediana)
Comparado com a mesma classe
» 7% de todos os dispositivos testados nesta classe foram melhores, 2% semelhantes, 90% piores
» O melhor teve um delta de 5%, a média foi 18%, o pior foi 53%
Comparado com todos os dispositivos testados
» 5% de todos os dispositivos testados foram melhores, 1% semelhantes, 94% piores
» O melhor teve um delta de 4%, a média foi 23%, o pior foi 134%
| desligado | |
| Ocioso | |
| Carga |
|
Key:
min: | |
| Eurocom Sky X7C i7-8086K, GeForce GTX 1080 Mobile, 2x Samsung SSD 970 Pro 512GB (RAID 0), IPS, 3840x2160, 17.3" | MSI GT75 8RG-090 Titan i9-8950HK, GeForce GTX 1080 Mobile, 2x Samsung PM961 MZVLW256HEHP (RAID 0), TN, 1920x1080, 17.3" | Alienware 17 R3 (A17-9935) 6700HQ, GeForce GTX 980M, Samsung PM951 NVMe 512 GB, IPS, 1920x1080, 17.3" | Asus Chimera G703GI i9-8950HK, GeForce GTX 1080 Mobile, 2x Intel 760p 512 GB + 1x Samsung SM961 512 GB (RAID), IPS, 1920x1080, 17.3" | Aorus X7 DT v8 i7-8850H, GeForce GTX 1080 Mobile, Toshiba NVMe THNSN5512GPU7, IPS, 1920x1080, 17.3" | Razer Blade Pro 2017 i7-7820HK, GeForce GTX 1080 Mobile, 2x Samsung SSD PM951 MZVLV256HCHP (RAID 0), IGZO, 3840x2160, 17.3" | Aorus X9 DT i9-8950HK, GeForce GTX 1080 Mobile, Transcend TS1TMTE850, IPS, 1920x1080, 17.3" | |
|---|---|---|---|---|---|---|---|
| Power Consumption | -28% | 35% | -27% | -6% | -9% | -19% | |
| Idle Minimum * (Watt) | 33.3 | 31 7% | 12 64% | 29 13% | 23 31% | 31 7% | 28 16% |
| Idle Average * (Watt) | 40.1 | 35 13% | 18 55% | 37 8% | 33 18% | 36 10% | 37 8% |
| Idle Maximum * (Watt) | 42.1 | 45 -7% | 26 38% | 46 -9% | 37 12% | 44 -5% | 40 5% |
| Load Average * (Watt) | 95.6 | 130 -36% | 95 1% | 156 -63% | 115 -20% | 107 -12% | 109 -14% |
| Witcher 3 ultra * (Watt) | 152.9 | 268 -75% | 252 -65% | 225 -47% | 212 -39% | 256 -67% | |
| Load Maximum * (Watt) | 220 | 374 -70% | 188 15% | 314 -43% | 281 -28% | 258 -17% | 353 -60% |
* ... menor é melhor
| Eurocom Sky X7C i7-8086K, GeForce GTX 1080 Mobile, 82 Wh | MSI GT75 8RG-090 Titan i9-8950HK, GeForce GTX 1080 Mobile, 75 Wh | Asus Chimera G703GI i9-8950HK, GeForce GTX 1080 Mobile, 71 Wh | Aorus X7 DT v8 i7-8850H, GeForce GTX 1080 Mobile, 94.24 Wh | Razer Blade Pro 2017 i7-7820HK, GeForce GTX 1080 Mobile, 99 Wh | Eurocom Sky X9C i7-8700K, GeForce GTX 1080 SLI (Laptop), 89 Wh | Aorus X9 DT i9-8950HK, GeForce GTX 1080 Mobile, 94.24 Wh | |
|---|---|---|---|---|---|---|---|
| Duração da bateria | -8% | 58% | 38% | -46% | 33% | ||
| WiFi v1.3 (h) | 2.4 | 2.2 -8% | 3.8 58% | 3.3 38% | 1.3 -46% | 3.2 33% | |
| Reader / Idle (h) | 3.8 | 2.8 | 4.9 | 4.2 | 1.4 | 4.2 | |
| Load (h) | 1.1 | 0.9 | 1.3 | 1.4 | 0.8 | 1.3 |
Pro
Contra
Antes de dar a nossa opinião sobre o Sky X7C, é imperativo que os proprietários do sistema atualizem seu software para a versão mais recente Aqui. Está confirmado que as versões mais antigas do Centro de Controle têm um bug onde a GPU se afogará sob certos jogos como o Witcher 3. Infelizmente para nós, nossa unidade de teste foi enviada com a versão com bug do software e, portanto, nossos resultados de teste refletem essa configuração de fábrica. Também observamos exatamente os mesmos resultados em nossa recente análise do Eurocom Q8.
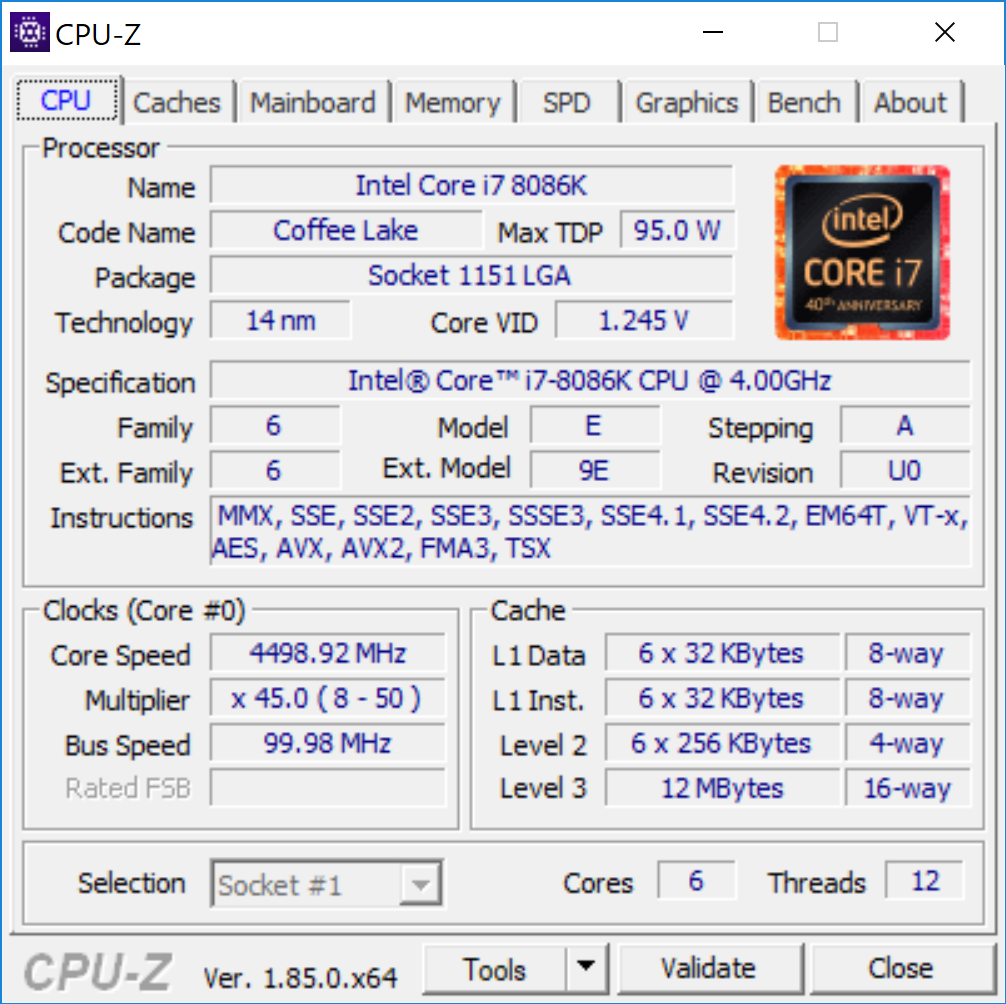
Com o nosso alerta antecipado, o Core i7-8086K na Eurocom é, na melhor das hipóteses, 5 a 10% mais rápido no desempenho bruto do que o i7-8700K no Sky X9C e i9-8950HK no Aorus X9 DT. A carga pesada com a velocidade de 4,0 GHz já induzirá uma temperatura constante de 83 °C. O desempenho se beneficia quando o jogo é marginal, para dizer o mínimo.
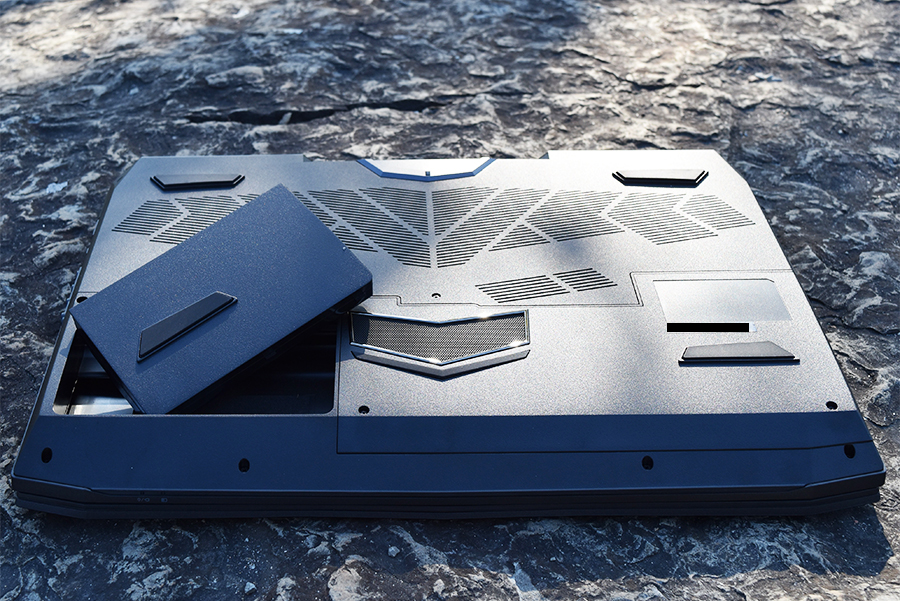
O melhor aspecto do Sky X7C continua sendo sua modularidade. Os entusiastas que anseiam por cada gota0 de desempenho multi-core podem querer considerar o Ryzen 1800X mais barato do que o i7-8086K. Até que essas opções AMD estejam disponíveis, no entanto, o Sky X7C ainda é o melhor DTR no espaço de 17 polegadas.
O Sky X7C aloja a CPU Intel mais rápida atualmente disponível para um formato móvel. Não obstante, esperamos que as opções do Threadripper sejam disponibilizadas no futuro, simplesmente porque a AMD ultimamente tem sido extremamente competitiva no espaço de desktops.
Price comparison
