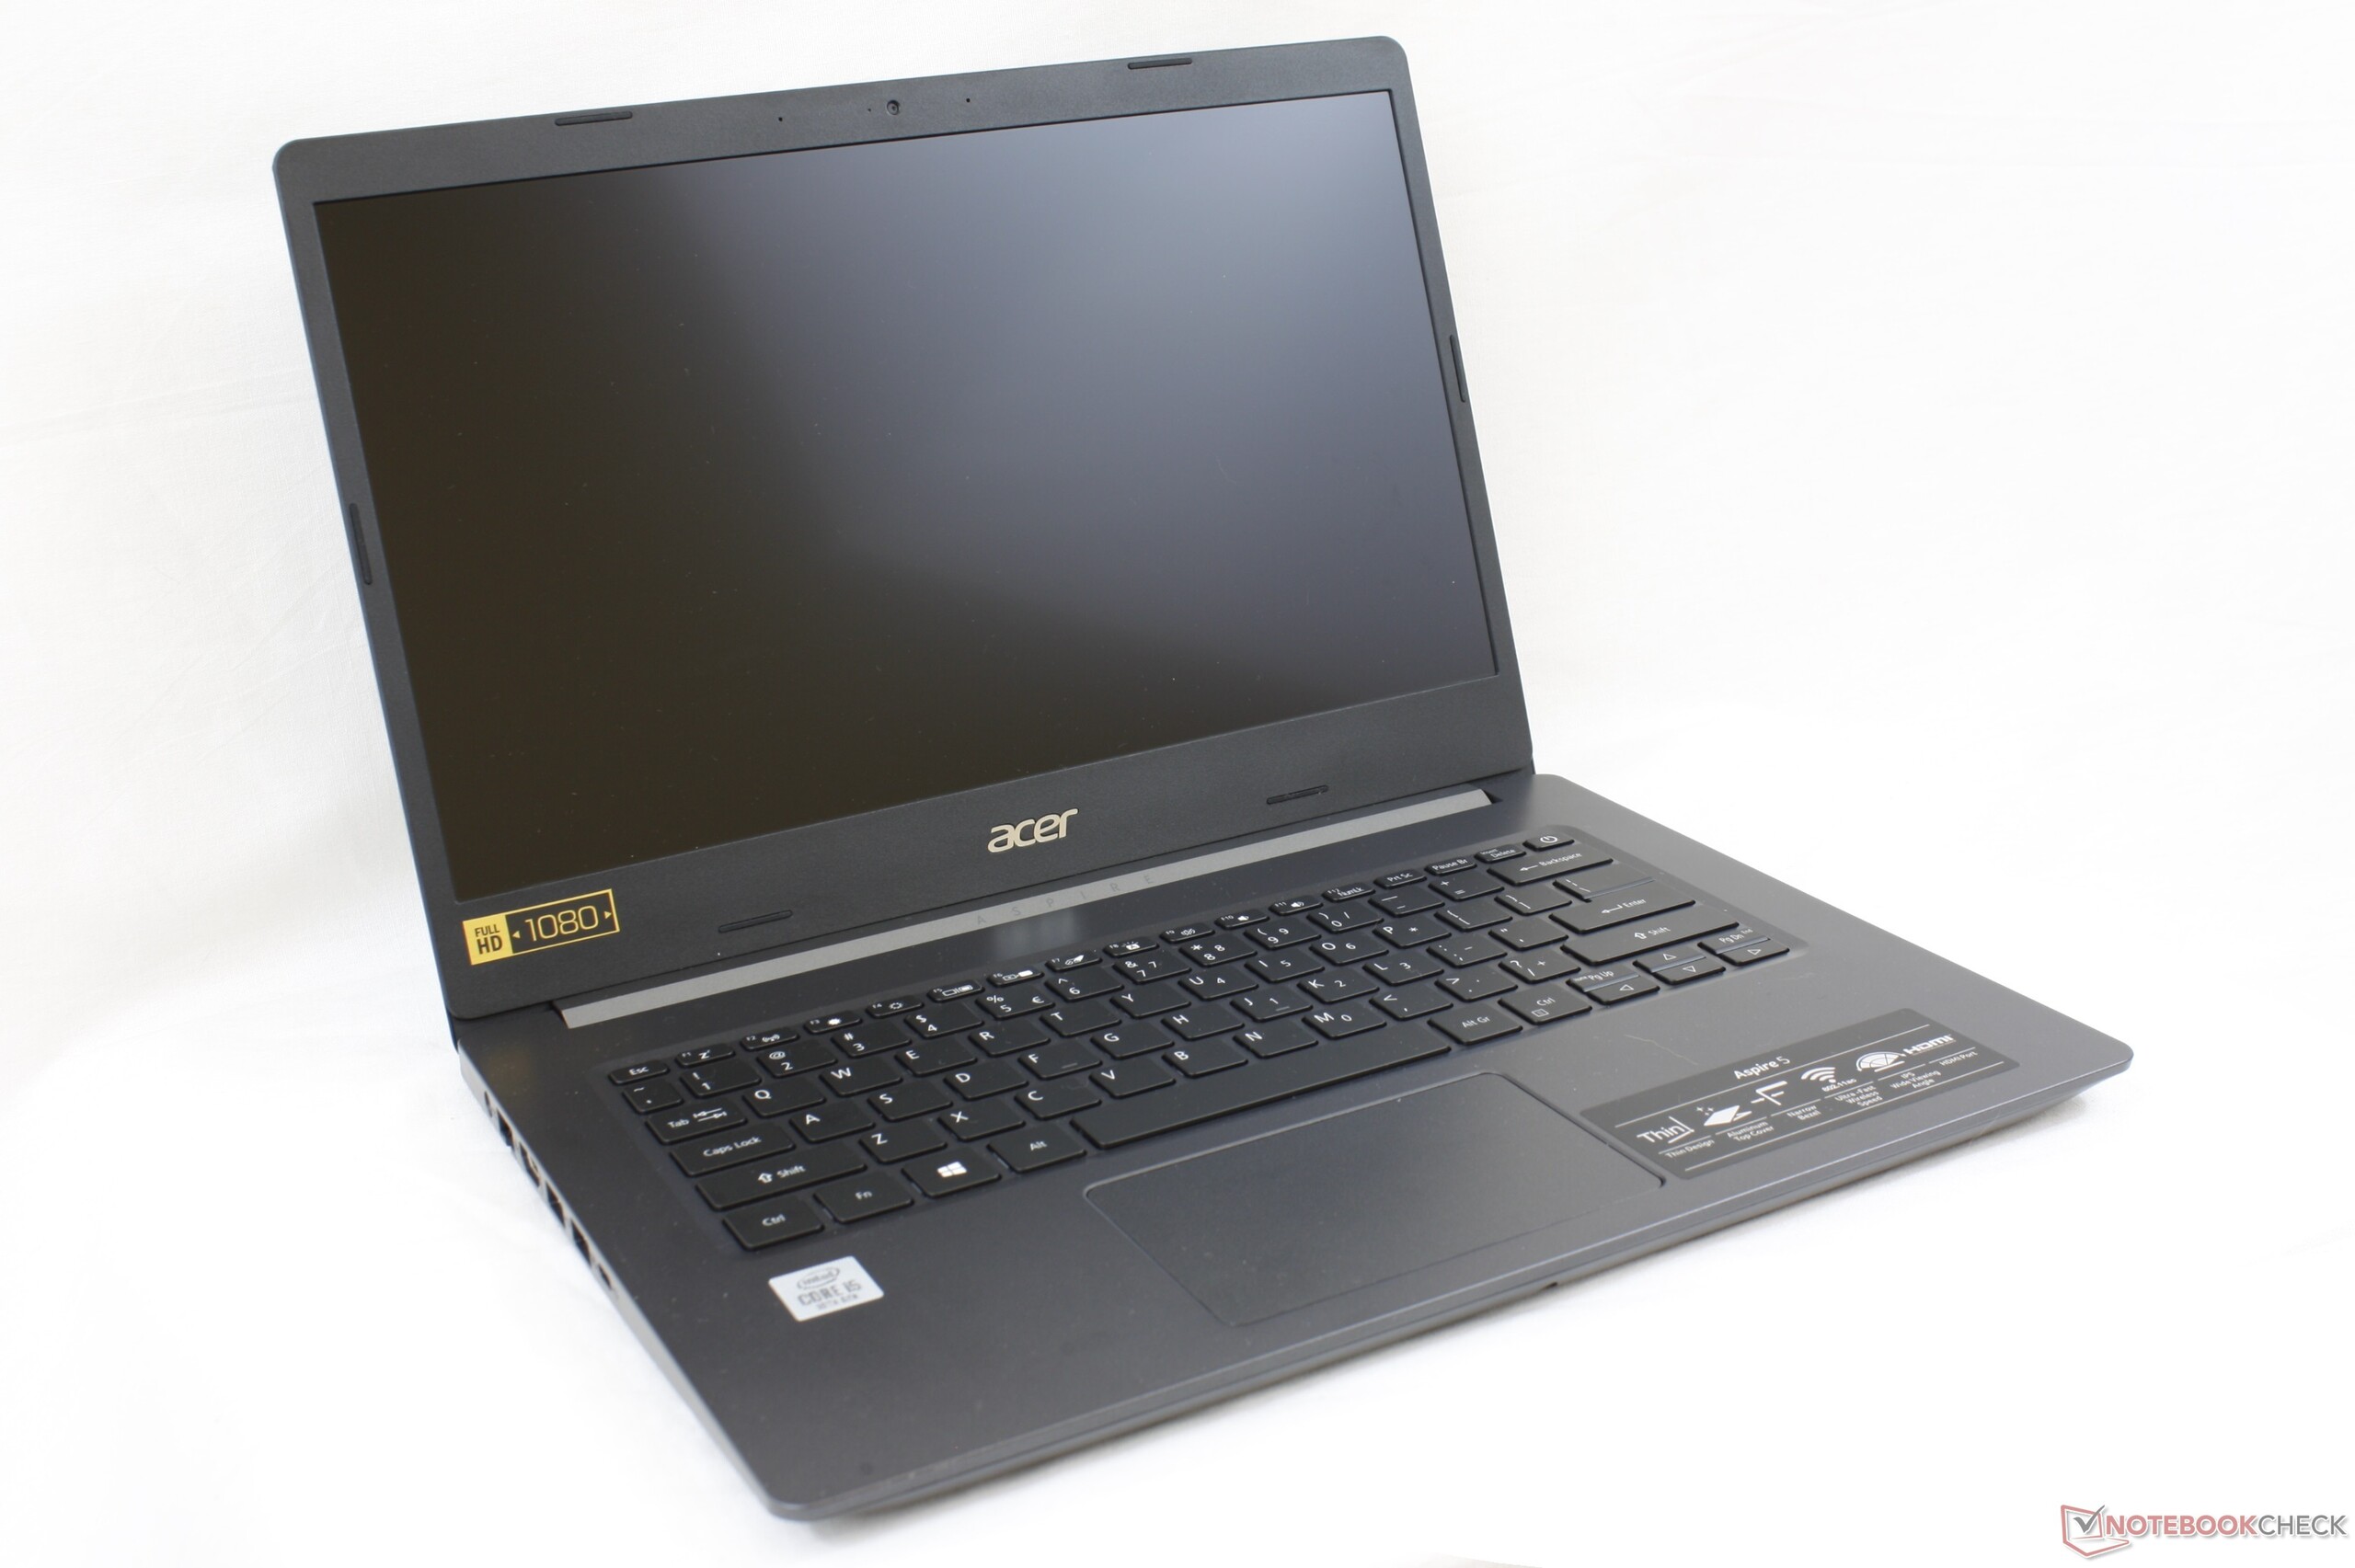
Breve Análise do Portátil Acer Aspire 5 A514: Não o Intel Comet Lake na sua melhor forma
Avaliação | Data | Modelo | Peso | Altura | Size | Resolução | Preço |
|---|---|---|---|---|---|---|---|
| 79.2 % v7 (old) | 02/2020 | Acer Aspire 5 A514-52 i5-10210U, UHD Graphics 620 | 1.7 kg | 17.95 mm | 14.00" | 1920x1080 | |
| 83.7 % v7 (old) | 10/2019 | Asus VivoBook 14 X403FA i5-8265U, UHD Graphics 620 | 1.3 kg | 16.5 mm | 14.00" | 1920x1080 | |
| 80.9 % v7 (old) | 01/2020 | MSI Modern 14 A10RB-459US i5-10210U, GeForce MX250 | 1.2 kg | 16 mm | 14.00" | 1920x1080 | |
| 74.5 % v7 (old) | 01/2020 | Dell Inspiron 14 3493-4KWCF i7-1065G7, GeForce MX230 | 1.8 kg | 21 mm | 14.00" | 1920x1080 | |
| 77.7 % v7 (old) | Walmart Motile M142 R5 3500U, Vega 8 | 1.1 kg | 18 mm | 14.00" | 1920x1080 |
| |||||||||||||||||||||||||
iluminação: 82 %
iluminação com acumulador: 237.8 cd/m²
Contraste: 743:1 (Preto: 0.32 cd/m²)
ΔE ColorChecker Calman: 3.41 | ∀{0.5-29.43 Ø4.73}
calibrated: 3.12
ΔE Greyscale Calman: 1.2 | ∀{0.09-98 Ø4.97}
62.2% sRGB (Argyll 1.6.3 3D)
39.5% AdobeRGB 1998 (Argyll 1.6.3 3D)
42.78% AdobeRGB 1998 (Argyll 3D)
62.2% sRGB (Argyll 3D)
41.39% Display P3 (Argyll 3D)
Gamma: 2.05
CCT: 6395 K
| Acer Aspire 5 A514-52 Chi Mei N140HCA-EAC, IPS, 14", 1920x1080 | Asus VivoBook 14 X403FA Chi Mei N140HCA-EAC, IPS, 14", 1920x1080 | MSI Modern 14 A10RB-459US Chi Mei N140HCE-EN2, IPS, 14", 1920x1080 | Dell Inspiron 14 3493-4KWCF Chi Mei 140HCA, IPS, 14", 1920x1080 | Walmart Motile M142 Chi Mei N140HCA-EAC, IPS, 14", 1920x1080 | Lenovo Ideapad C340-14API 81N6004UGE BOE CQ NV140FHM-N48, IPS, 14", 1920x1080 | |
|---|---|---|---|---|---|---|
| Display | -1% | 53% | 1% | 1% | -5% | |
| Display P3 Coverage (%) | 41.39 | 40.85 -1% | 64.2 55% | 41.84 1% | 41.95 1% | 39.63 -4% |
| sRGB Coverage (%) | 62.2 | 61.1 -2% | 94.8 52% | 62.3 0% | 62.5 0% | 58.6 -6% |
| AdobeRGB 1998 Coverage (%) | 42.78 | 42.25 -1% | 65.4 53% | 43.33 1% | 43.43 2% | 40.94 -4% |
| Response Times | 14% | 0% | 7% | 23% | 4% | |
| Response Time Grey 50% / Grey 80% * (ms) | 55.6 ? | 40.8 ? 27% | 39.2 ? 29% | 41 ? 26% | 35.2 ? 37% | 43 ? 23% |
| Response Time Black / White * (ms) | 27.6 ? | 27.2 ? 1% | 35.6 ? -29% | 31 ? -12% | 25.2 ? 9% | 32 ? -16% |
| PWM Frequency (Hz) | 24510 ? | 24510 ? | 25000 ? | 2500 ? | 25000 ? | 208 ? |
| Screen | -16% | 37% | -17% | -13% | -30% | |
| Brightness middle (cd/m²) | 237.8 | 250 5% | 324.1 36% | 226 -5% | 240.3 1% | 285 20% |
| Brightness (cd/m²) | 231 | 236 2% | 301 30% | 214 -7% | 233 1% | 273 18% |
| Brightness Distribution (%) | 82 | 78 -5% | 87 6% | 92 12% | 82 0% | 87 6% |
| Black Level * (cd/m²) | 0.32 | 0.27 16% | 0.22 31% | 0.17 47% | 0.27 16% | 0.4 -25% |
| Contrast (:1) | 743 | 926 25% | 1473 98% | 1329 79% | 890 20% | 713 -4% |
| Colorchecker dE 2000 * | 3.41 | 5 -47% | 1.63 52% | 5.21 -53% | 4.22 -24% | 5.62 -65% |
| Colorchecker dE 2000 max. * | 15.73 | 20.7 -32% | 4.25 73% | 22.15 -41% | 23.32 -48% | 17.22 -9% |
| Colorchecker dE 2000 calibrated * | 3.12 | 4.3 -38% | 1.42 54% | 4.43 -42% | 3.76 -21% | |
| Greyscale dE 2000 * | 1.2 | 2.4 -100% | 2.2 -83% | 3.27 -173% | 2.3 -92% | 3.97 -231% |
| Gamma | 2.05 107% | 2.05 107% | 2.26 97% | 2.36 93% | 2.39 92% | 2.28 96% |
| CCT | 6395 102% | 6697 97% | 6887 94% | 6538 99% | 6585 99% | 6848 95% |
| Color Space (Percent of AdobeRGB 1998) (%) | 39.5 | 38.9 -2% | 60.2 52% | 40 1% | 39.9 1% | 38 -4% |
| Color Space (Percent of sRGB) (%) | 62.2 | 61 -2% | 95 53% | 62 0% | 62.1 0% | 58 -7% |
| Média Total (Programa/Configurações) | -1% /
-10% | 30% /
35% | -3% /
-10% | 4% /
-6% | -10% /
-21% |
* ... menor é melhor
Exibir tempos de resposta
| ↔ Tempo de resposta preto para branco | ||
|---|---|---|
| 27.6 ms ... ascensão ↗ e queda ↘ combinadas | ↗ 17.2 ms ascensão | 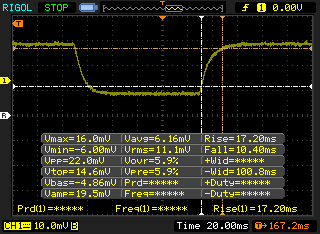 |
| ↘ 10.4 ms queda | ||
| A tela mostra taxas de resposta relativamente lentas em nossos testes e pode ser muito lenta para os jogadores. Em comparação, todos os dispositivos testados variam de 0.1 (mínimo) a 240 (máximo) ms. » 70 % de todos os dispositivos são melhores. Isso significa que o tempo de resposta medido é pior que a média de todos os dispositivos testados (19.9 ms). | ||
| ↔ Tempo de resposta 50% cinza a 80% cinza | ||
| 55.6 ms ... ascensão ↗ e queda ↘ combinadas | ↗ 24.4 ms ascensão | 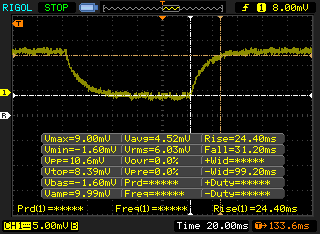 |
| ↘ 31.2 ms queda | ||
| A tela mostra taxas de resposta lentas em nossos testes e será insatisfatória para os jogadores. Em comparação, todos os dispositivos testados variam de 0.165 (mínimo) a 636 (máximo) ms. » 92 % de todos os dispositivos são melhores. Isso significa que o tempo de resposta medido é pior que a média de todos os dispositivos testados (31.1 ms). | ||
Cintilação da tela / PWM (modulação por largura de pulso)
| Tela tremeluzindo/PWM detectado | 24510 Hz | ≤ 19 % configuração de brilho | 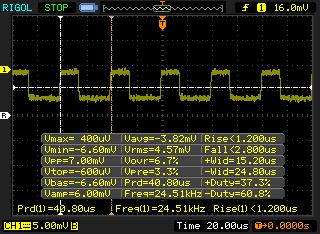 |
A luz de fundo da tela pisca em 24510 Hz (pior caso, por exemplo, utilizando PWM) Cintilação detectada em uma configuração de brilho de 19 % e abaixo. Não deve haver cintilação ou PWM acima desta configuração de brilho. A frequência de 24510 Hz é bastante alta, então a maioria dos usuários sensíveis ao PWM não deve notar nenhuma oscilação. [pwm_comparison] Em comparação: 52 % de todos os dispositivos testados não usam PWM para escurecer a tela. Se PWM foi detectado, uma média de 7798 (mínimo: 5 - máximo: 343500) Hz foi medida. | |||
| Cinebench R11.5 | |
| CPU Single 64Bit | |
| Média Intel Core i5-10210U (1.71 - 1.91, n=4) | |
| Dell Inspiron 15 5000 5585 | |
| CPU Multi 64Bit | |
| Dell Inspiron 15 5000 5585 | |
| Média Intel Core i5-10210U (5.69 - 8.66, n=4) | |
| Cinebench R10 | |
| Rendering Multiple CPUs 32Bit | |
| Lenovo Ideapad C340-15IWL-81N5004QGE | |
| Média Intel Core i5-10210U (15037 - 22164, n=3) | |
| Dynabook Portege A30-E-174 | |
| Rendering Single 32Bit | |
| Média Intel Core i5-10210U (6410 - 6613, n=3) | |
| Dynabook Portege A30-E-174 | |
| Lenovo Ideapad C340-15IWL-81N5004QGE | |
| PCMark 8 | |
| Home Score Accelerated v2 | |
| Média Intel Core i5-10210U, Intel UHD Graphics 620 (3182 - 4284, n=21) | |
| Lenovo Ideapad C340-14API 81N6004UGE | |
| Asus VivoBook 14 X403FA | |
| Walmart Motile M142 | |
| MSI Modern 14 A10RB-459US | |
| Dell Inspiron 14 3493-4KWCF | |
| Acer Aspire 5 A514-52 | |
| Work Score Accelerated v2 | |
| MSI Modern 14 A10RB-459US | |
| Dell Inspiron 14 3493-4KWCF | |
| Walmart Motile M142 | |
| Média Intel Core i5-10210U, Intel UHD Graphics 620 (4286 - 5114, n=21) | |
| Asus VivoBook 14 X403FA | |
| Acer Aspire 5 A514-52 | |
| Lenovo Ideapad C340-14API 81N6004UGE | |
| PCMark 8 Home Score Accelerated v2 | 3182 pontos | |
| PCMark 8 Work Score Accelerated v2 | 4642 pontos | |
| PCMark 10 Score | 3752 pontos | |
Ajuda | ||
| Acer Aspire 5 A514-52 WDC PC SN520 SDAPNUW-512G | Dell XPS 15 7590 i5 iGPU FHD Toshiba XG6 KXG60ZNV512G | Asus VivoBook S15 S532F WDC PC SN520 SDAPNUW-256G | HP Envy x360 15-bq102ng Samsung PM961 MZVLW256HEHP | Lenovo Ideapad S540-15IML Samsung SSD PM981a MZVLB512HBJQ | |
|---|---|---|---|---|---|
| AS SSD | 23% | -14% | -19% | 66% | |
| Seq Read (MB/s) | 1244 | 2357 89% | 1147 -8% | 2465 98% | 2642 112% |
| Seq Write (MB/s) | 1393 | 1235 -11% | 752 -46% | 1318 -5% | 2433 75% |
| 4K Read (MB/s) | 46.86 | 43.29 -8% | 41.52 -11% | 42.97 -8% | 58 24% |
| 4K Write (MB/s) | 135.1 | 99.7 -26% | 149.7 11% | 81.9 -39% | 145.3 8% |
| 4K-64 Read (MB/s) | 650 | 1020 57% | 605 -7% | 1025 58% | 1431 120% |
| 4K-64 Write (MB/s) | 789 | 1502 90% | 453.2 -43% | 338.6 -57% | 1753 122% |
| Access Time Read * (ms) | 0.045 | 0.07 -56% | 0.073 -62% | 0.077 -71% | 0.072 -60% |
| Access Time Write * (ms) | 0.027 | 0.039 -44% | 0.025 7% | 0.046 -70% | 0.027 -0% |
| Score Read (Points) | 821 | 1299 58% | 761 -7% | 1314 60% | 1753 114% |
| Score Write (Points) | 1064 | 1726 62% | 678 -36% | 552 -48% | 2142 101% |
| Score Total (Points) | 2326 | 3640 56% | 1821 -22% | 2488 7% | 4790 106% |
| Copy ISO MB/s (MB/s) | 1637 | 2145 31% | 1093 -33% | 700 -57% | |
| Copy Program MB/s (MB/s) | 496.6 | 565 14% | 775 56% | 167.2 -66% | |
| Copy Game MB/s (MB/s) | 1161 | 1320 14% | 1196 3% | 370.4 -68% | |
| CrystalDiskMark 5.2 / 6 | 17% | -16% | -4% | 23% | |
| Write 4K (MB/s) | 166.6 | 93.6 -44% | 149.9 -10% | 116 -30% | 170.7 2% |
| Read 4K (MB/s) | 46.72 | 41.87 -10% | 46.13 -1% | 42.73 -9% | 49.51 6% |
| Write Seq (MB/s) | 1458 | 1698 16% | 970 -33% | 1222 -16% | 1156 -21% |
| Read Seq (MB/s) | 1387 | 1978 43% | 1085 -22% | 1608 16% | 1136 -18% |
| Write 4K Q32T1 (MB/s) | 419.5 | 383.1 -9% | 460.8 10% | 280.1 -33% | 420.5 0% |
| Read 4K Q32T1 (MB/s) | 487.8 | 326.9 -33% | 410.3 -16% | 333.6 -32% | 527 8% |
| Write Seq Q32T1 (MB/s) | 1456 | 2778 91% | 662 -55% | 1291 -11% | 2984 105% |
| Read Seq Q32T1 (MB/s) | 1733 | 3119 80% | 1728 0% | 3183 84% | 3550 105% |
| Média Total (Programa/Configurações) | 20% /
21% | -15% /
-15% | -12% /
-14% | 45% /
48% |
* ... menor é melhor

| 3DMark 11 | |
| 1280x720 Performance GPU | |
| MSI Prestige 15 A10SC | |
| MSI Modern 14 A10RB-459US | |
| Microsoft Surface Laptop 3 15 i7-1065G7 | |
| Dell Inspiron 15 5000 5585 | |
| Asus Zenbook 14 UX433FN-A6023T | |
| HP Envy x360 15-bq102ng | |
| Walmart Motile M142 | |
| Dell Latitude 14 5495 | |
| Asus VivoBook 14 X403FA | |
| Acer Aspire 5 A514-52 | |
| Dynabook Portege A30-E-174 | |
| Dell XPS 15 7590 i5 iGPU FHD | |
| Média Intel UHD Graphics 620 (1144 - 3432, n=244) | |
| 1280x720 Performance Combined | |
| MSI Prestige 15 A10SC | |
| MSI Modern 14 A10RB-459US | |
| Microsoft Surface Laptop 3 15 i7-1065G7 | |
| Asus Zenbook 14 UX433FN-A6023T | |
| Dell Inspiron 15 5000 5585 | |
| HP Envy x360 15-bq102ng | |
| Walmart Motile M142 | |
| Dell Latitude 14 5495 | |
| Asus VivoBook 14 X403FA | |
| Dell XPS 15 7590 i5 iGPU FHD | |
| Dynabook Portege A30-E-174 | |
| Acer Aspire 5 A514-52 | |
| Média Intel UHD Graphics 620 (927 - 2505, n=244) | |
| 3DMark 11 Performance | 2023 pontos | |
| 3DMark Cloud Gate Standard Score | 8289 pontos | |
| 3DMark Fire Strike Score | 1136 pontos | |
| 3DMark Time Spy Score | 442 pontos | |
Ajuda | ||
| BioShock Infinite | |
| 1280x720 Very Low Preset | |
| MSI Modern 14 A10RB-459US | |
| Asus Zenbook 14 UX433FN-A6023T | |
| Dell Inspiron 14 3493-4KWCF | |
| Walmart Motile M142 | |
| Asus VivoBook 14 X403FA | |
| Dynabook Portege A30-E-174 | |
| Acer Aspire 5 A514-52 | |
| Média Intel UHD Graphics 620 (18.3 - 90.2, n=187) | |
| Dell XPS 15 7590 i5 iGPU FHD | |
| 1366x768 Medium Preset | |
| MSI Modern 14 A10RB-459US | |
| Asus Zenbook 14 UX433FN-A6023T | |
| Dell Inspiron 14 3493-4KWCF | |
| Asus VivoBook 14 X403FA | |
| Dynabook Portege A30-E-174 | |
| Acer Aspire 5 A514-52 | |
| Dell XPS 15 7590 i5 iGPU FHD | |
| Média Intel UHD Graphics 620 (11.5 - 45.5, n=187) | |
| 1920x1080 Ultra Preset, DX11 (DDOF) | |
| MSI Modern 14 A10RB-459US | |
| Asus Zenbook 14 UX433FN-A6023T | |
| Dell Inspiron 14 3493-4KWCF | |
| Walmart Motile M142 | |
| Asus VivoBook 14 X403FA | |
| Dynabook Portege A30-E-174 | |
| Dell XPS 15 7590 i5 iGPU FHD | |
| Acer Aspire 5 A514-52 | |
| Média Intel UHD Graphics 620 (4.5 - 17, n=176) | |
| The Witcher 3 | |
| 1024x768 Low Graphics & Postprocessing | |
| MSI Modern 14 A10RB-459US | |
| Média Intel UHD Graphics 620 (8.8 - 50.9, n=64) | |
| 1366x768 Medium Graphics & Postprocessing | |
| MSI Modern 14 A10RB-459US | |
| Média Intel UHD Graphics 620 (8 - 27.9, n=29) | |
| 1920x1080 High Graphics & Postprocessing (Nvidia HairWorks Off) | |
| MSI Modern 14 A10RB-459US | |
| Média Intel UHD Graphics 620 (4.2 - 13.5, n=17) | |
| baixo | média | alto | ultra | |
|---|---|---|---|---|
| BioShock Infinite (2013) | 67 | 35.2 | 30.1 | 9.6 |
| Rocket League (2017) | 20.1 |
| Acer Aspire 5 A514-52 UHD Graphics 620, i5-10210U, WDC PC SN520 SDAPNUW-512G | Dell XPS 15 7590 i5 iGPU FHD UHD Graphics 630, i5-9300H, Toshiba XG6 KXG60ZNV512G | Asus VivoBook S15 S532F GeForce MX250, i7-8565U, WDC PC SN520 SDAPNUW-256G | HP Envy x360 15-bq102ng Vega 8, R5 2500U, Samsung PM961 MZVLW256HEHP | Lenovo Ideapad S540-15IML GeForce MX250, i5-10210U, Samsung SSD PM981a MZVLB512HBJQ | MSI Modern 15 A10RB GeForce MX250, i7-10510U, WDC PC SN730 SDBPNTY-512G | |
|---|---|---|---|---|---|---|
| Noise | -1% | -5% | -7% | -14% | -12% | |
| desligado / ambiente * (dB) | 29.1 | 29.3 -1% | 28 4% | 30.13 -4% | 30 -3% | 28.3 3% |
| Idle Minimum * (dB) | 29.1 | 29.3 -1% | 28 4% | 30.13 -4% | 30 -3% | 32 -10% |
| Idle Average * (dB) | 29.1 | 29.3 -1% | 28 4% | 30.13 -4% | 32 -10% | 32 -10% |
| Idle Maximum * (dB) | 29.1 | 29.8 -2% | 30 -3% | 30.13 -4% | 37 -27% | 32 -10% |
| Load Average * (dB) | 33.5 | 32.4 3% | 41.4 -24% | 38.8 -16% | 41 -22% | 34.5 -3% |
| Load Maximum * (dB) | 36.1 | 37.2 -3% | 41.5 -15% | 38.8 -7% | 42 -16% | 50.9 -41% |
| Witcher 3 ultra * (dB) | 41.5 | 39 | 39.5 |
* ... menor é melhor
Barulho
| Ocioso |
| 29.1 / 29.1 / 29.1 dB |
| Carga |
| 33.5 / 36.1 dB |
 | ||
30 dB silencioso 40 dB(A) audível 50 dB(A) ruidosamente alto |
||
min: | ||
(+) A temperatura máxima no lado superior é 39.2 °C / 103 F, em comparação com a média de 36.8 °C / 98 F , variando de 21 a 71 °C para a classe Multimedia.
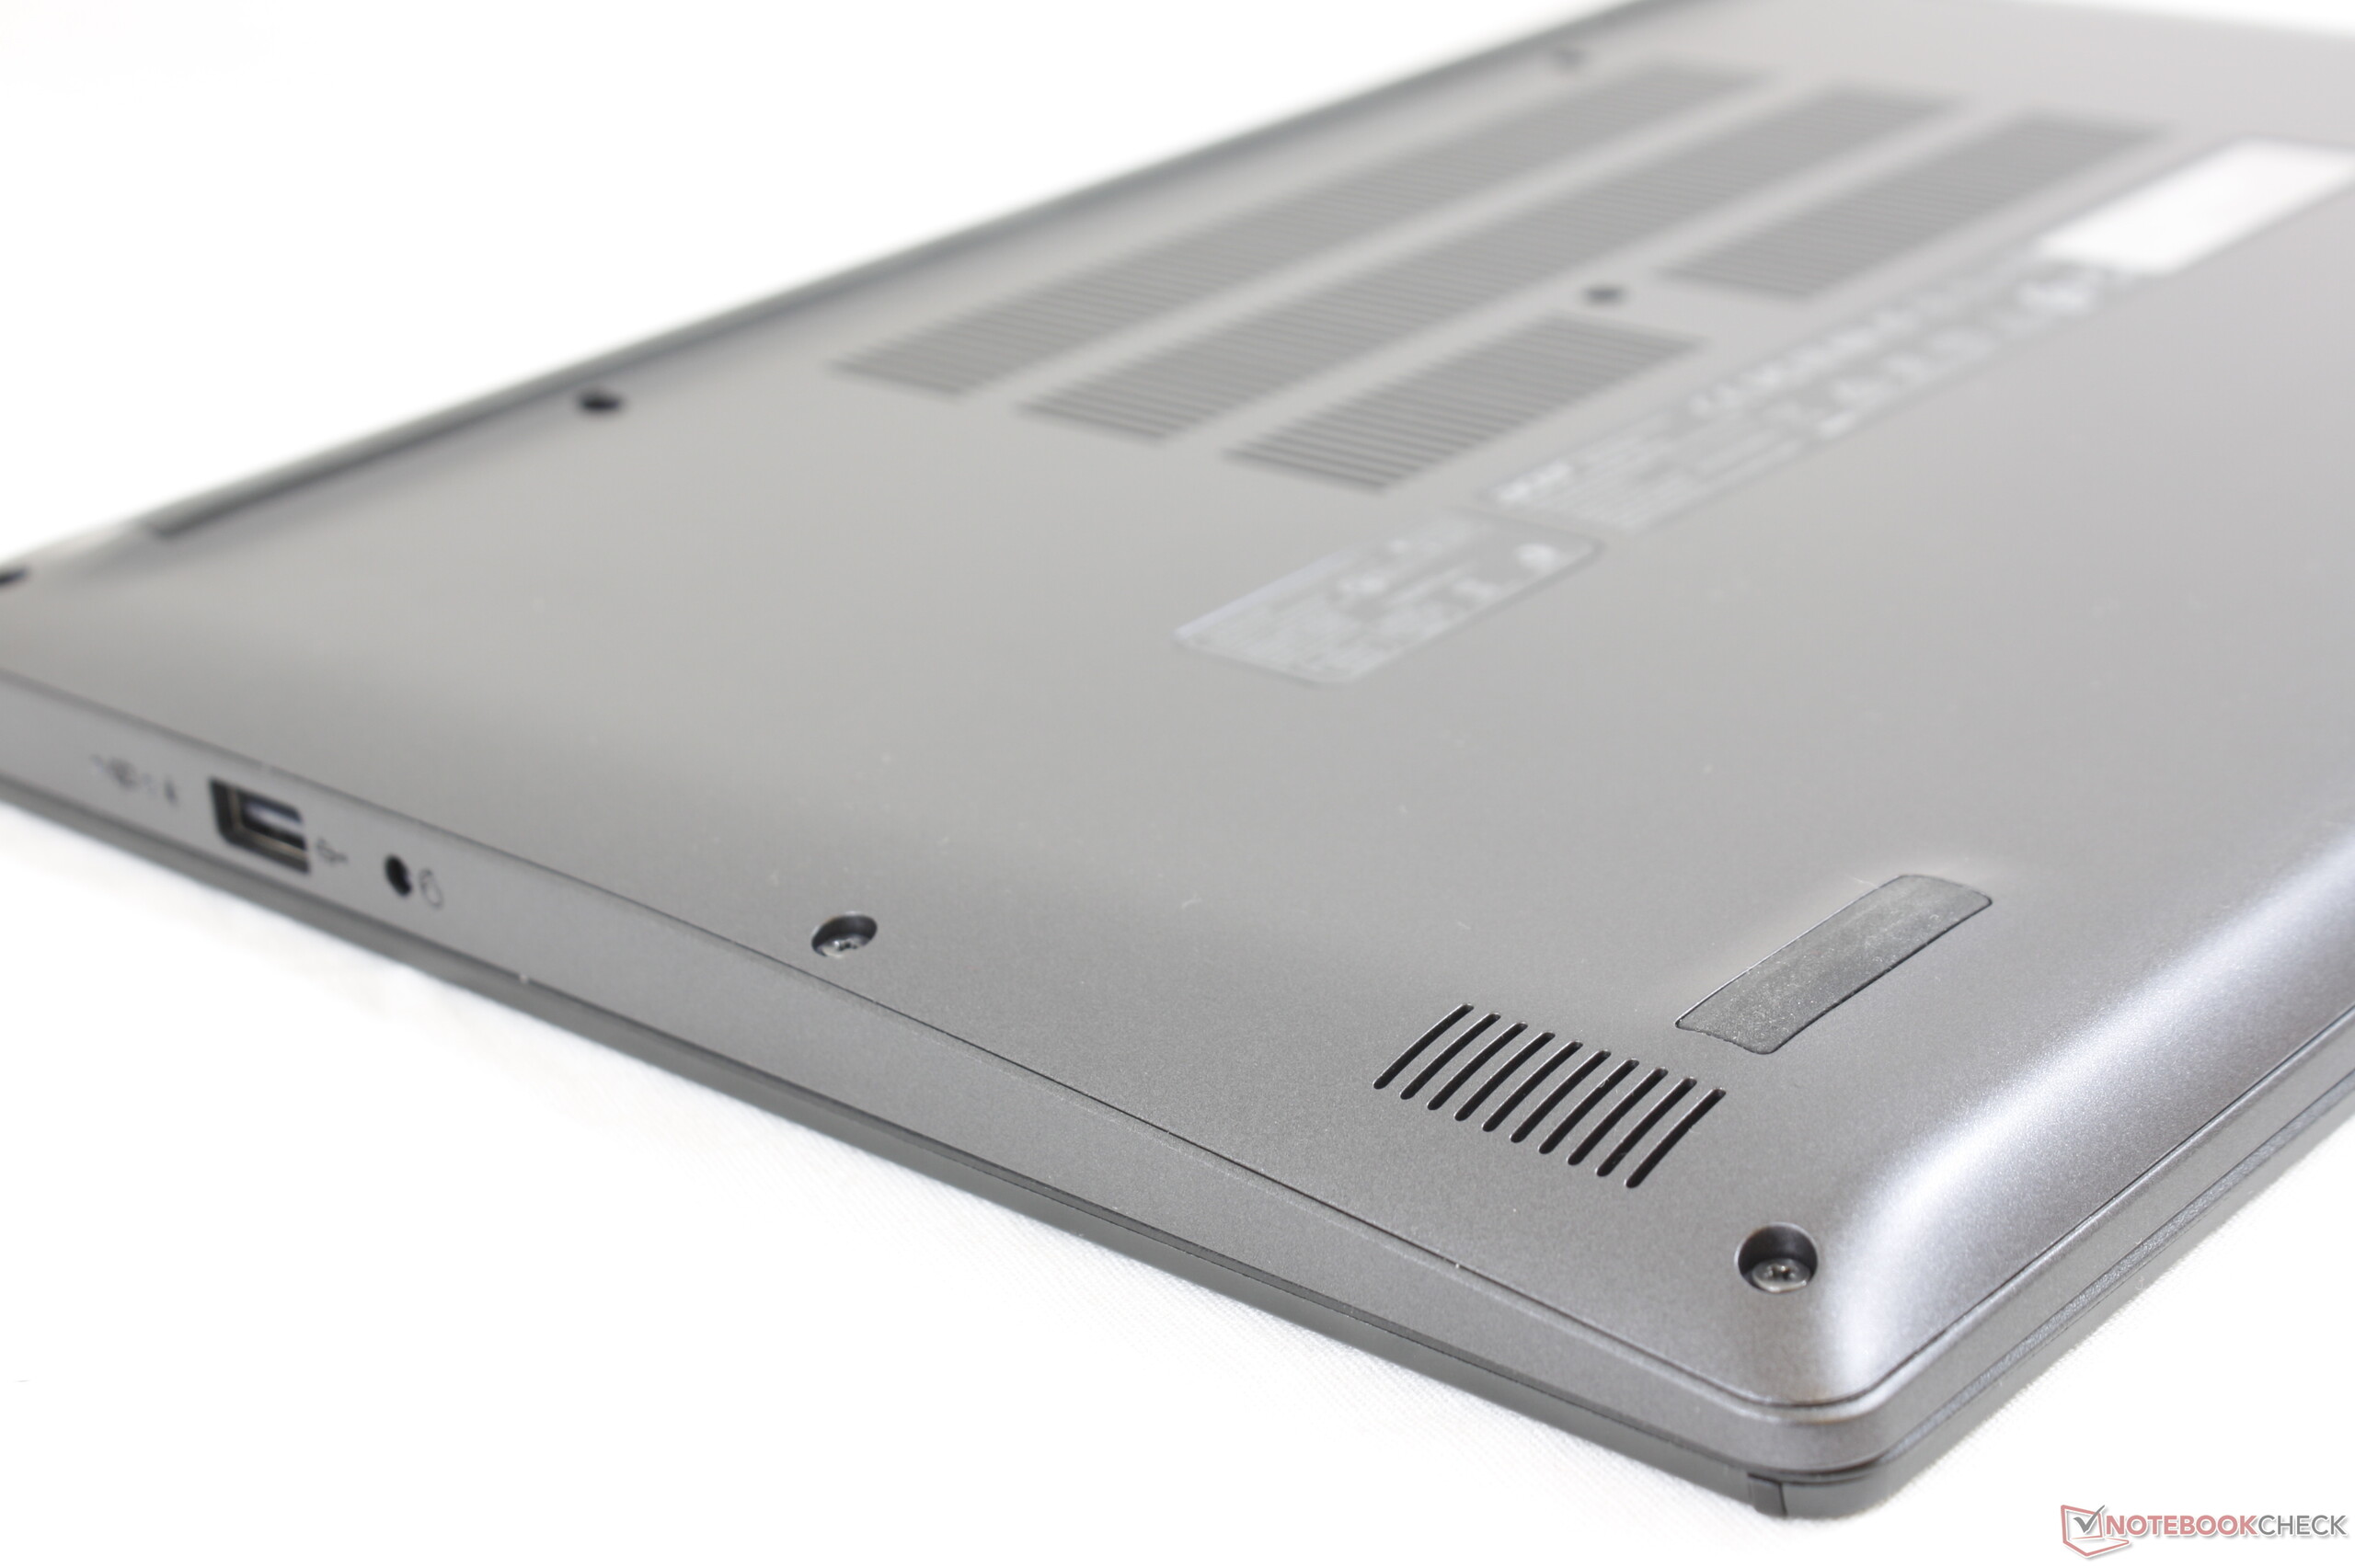
(-) A parte inferior aquece até um máximo de 46 °C / 115 F, em comparação com a média de 39.1 °C / 102 F
(+) Em uso inativo, a temperatura média para o lado superior é 21.1 °C / 70 F, em comparação com a média do dispositivo de 31.3 °C / ### class_avg_f### F.
(+) Os apoios para as mãos e o touchpad são mais frios que a temperatura da pele, com um máximo de 27.2 °C / 81 F e, portanto, são frios ao toque.
(±) A temperatura média da área do apoio para as mãos de dispositivos semelhantes foi 28.7 °C / 83.7 F (+1.5 °C / 2.7 F).
Acer Aspire 5 A514-52 análise de áudio
(±) | o volume do alto-falante é médio, mas bom (###valor### dB)
Graves 100 - 315Hz
(-) | quase nenhum baixo - em média 16.5% menor que a mediana
(-) | graves não são lineares (15.3% delta para frequência anterior)
Médios 400 - 2.000 Hz
(+) | médios equilibrados - apenas 2.6% longe da mediana
(±) | a linearidade dos médios é média (9.3% delta para frequência anterior)
Altos 2 - 16 kHz
(+) | agudos equilibrados - apenas 2.8% longe da mediana
(±) | a linearidade dos máximos é média (8.8% delta para frequência anterior)
Geral 100 - 16.000 Hz
(±) | a linearidade do som geral é média (20.1% diferença em relação à mediana)
Comparado com a mesma classe
» 67% de todos os dispositivos testados nesta classe foram melhores, 8% semelhantes, 25% piores
» O melhor teve um delta de 5%, a média foi 17%, o pior foi 45%
Comparado com todos os dispositivos testados
» 52% de todos os dispositivos testados foram melhores, 8% semelhantes, 40% piores
» O melhor teve um delta de 4%, a média foi 24%, o pior foi 134%
Apple MacBook 12 (Early 2016) 1.1 GHz análise de áudio
(+) | os alto-falantes podem tocar relativamente alto (###valor### dB)
Graves 100 - 315Hz
(±) | graves reduzidos - em média 11.3% menor que a mediana
(±) | a linearidade dos graves é média (14.2% delta para a frequência anterior)
Médios 400 - 2.000 Hz
(+) | médios equilibrados - apenas 2.4% longe da mediana
(+) | médios são lineares (5.5% delta para frequência anterior)
Altos 2 - 16 kHz
(+) | agudos equilibrados - apenas 2% longe da mediana
(+) | os máximos são lineares (4.5% delta da frequência anterior)
Geral 100 - 16.000 Hz
(+) | o som geral é linear (10.2% diferença em relação à mediana)
Comparado com a mesma classe
» 7% de todos os dispositivos testados nesta classe foram melhores, 2% semelhantes, 91% piores
» O melhor teve um delta de 5%, a média foi 18%, o pior foi 53%
Comparado com todos os dispositivos testados
» 5% de todos os dispositivos testados foram melhores, 1% semelhantes, 94% piores
» O melhor teve um delta de 4%, a média foi 24%, o pior foi 134%
| desligado | |
| Ocioso | |
| Carga |
|
Key:
min: | |
| Acer Aspire 5 A514-52 i5-10210U, UHD Graphics 620, WDC PC SN520 SDAPNUW-512G, IPS, 1920x1080, 14" | Asus VivoBook 14 X403FA i5-8265U, UHD Graphics 620, Intel SSD 660p SSDPEKNW512G8, IPS, 1920x1080, 14" | MSI Modern 14 A10RB-459US i5-10210U, GeForce MX250, Kingston RBUSNS8154P3512GJ, IPS, 1920x1080, 14" | Dell Inspiron 14 3493-4KWCF i7-1065G7, GeForce MX230, Toshiba KBG40ZNS512G NVMe, IPS, 1920x1080, 14" | Walmart Motile M142 R5 3500U, Vega 8, BIWIN SSD 256 GB, IPS, 1920x1080, 14" | Lenovo Ideapad C340-14API 81N6004UGE R5 3500U, Vega 8, Samsung SSD PM981 MZVLB256HAHQ, IPS, 1920x1080, 14" | |
|---|---|---|---|---|---|---|
| Power Consumption | -18% | -75% | -69% | -115% | -77% | |
| Idle Minimum * (Watt) | 2.7 | 2.7 -0% | 4.2 -56% | 4.7 -74% | 5.3 -96% | 5.1 -89% |
| Idle Average * (Watt) | 3 | 4.6 -53% | 5.9 -97% | 6.6 -120% | 8.6 -187% | 7.2 -140% |
| Idle Maximum * (Watt) | 4.6 | 5.2 -13% | 7.2 -57% | 5.9 -28% | 13.1 -185% | 9.7 -111% |
| Load Average * (Watt) | 29.3 | 35.9 -23% | 63.4 -116% | 56 -91% | 50.6 -73% | 40 -37% |
| Load Maximum * (Watt) | 45.4 | 46 -1% | 67.4 -48% | 60.2 -33% | 61.6 -36% | 49 -8% |
| Witcher 3 ultra * (Watt) | 53.5 |
* ... menor é melhor
| Acer Aspire 5 A514-52 i5-10210U, UHD Graphics 620, 51 Wh | Asus VivoBook 14 X403FA i5-8265U, UHD Graphics 620, 72 Wh | MSI Modern 14 A10RB-459US i5-10210U, GeForce MX250, 50 Wh | Dell Inspiron 14 3493-4KWCF i7-1065G7, GeForce MX230, 42 Wh | Walmart Motile M142 R5 3500U, Vega 8, 47 Wh | Lenovo Ideapad C340-14API 81N6004UGE R5 3500U, Vega 8, 45 Wh | |
|---|---|---|---|---|---|---|
| Duração da bateria | 41% | -16% | -30% | -18% | -20% | |
| Reader / Idle (h) | 22.7 | 35.7 57% | 16.4 -28% | 13.8 -39% | ||
| WiFi v1.3 (h) | 9.4 | 12.7 35% | 8.6 -9% | 6.5 -31% | 7.7 -18% | 7.5 -20% |
| Load (h) | 2 | 2.6 30% | 1.8 -10% | 1.6 -20% |
Pro
Contra
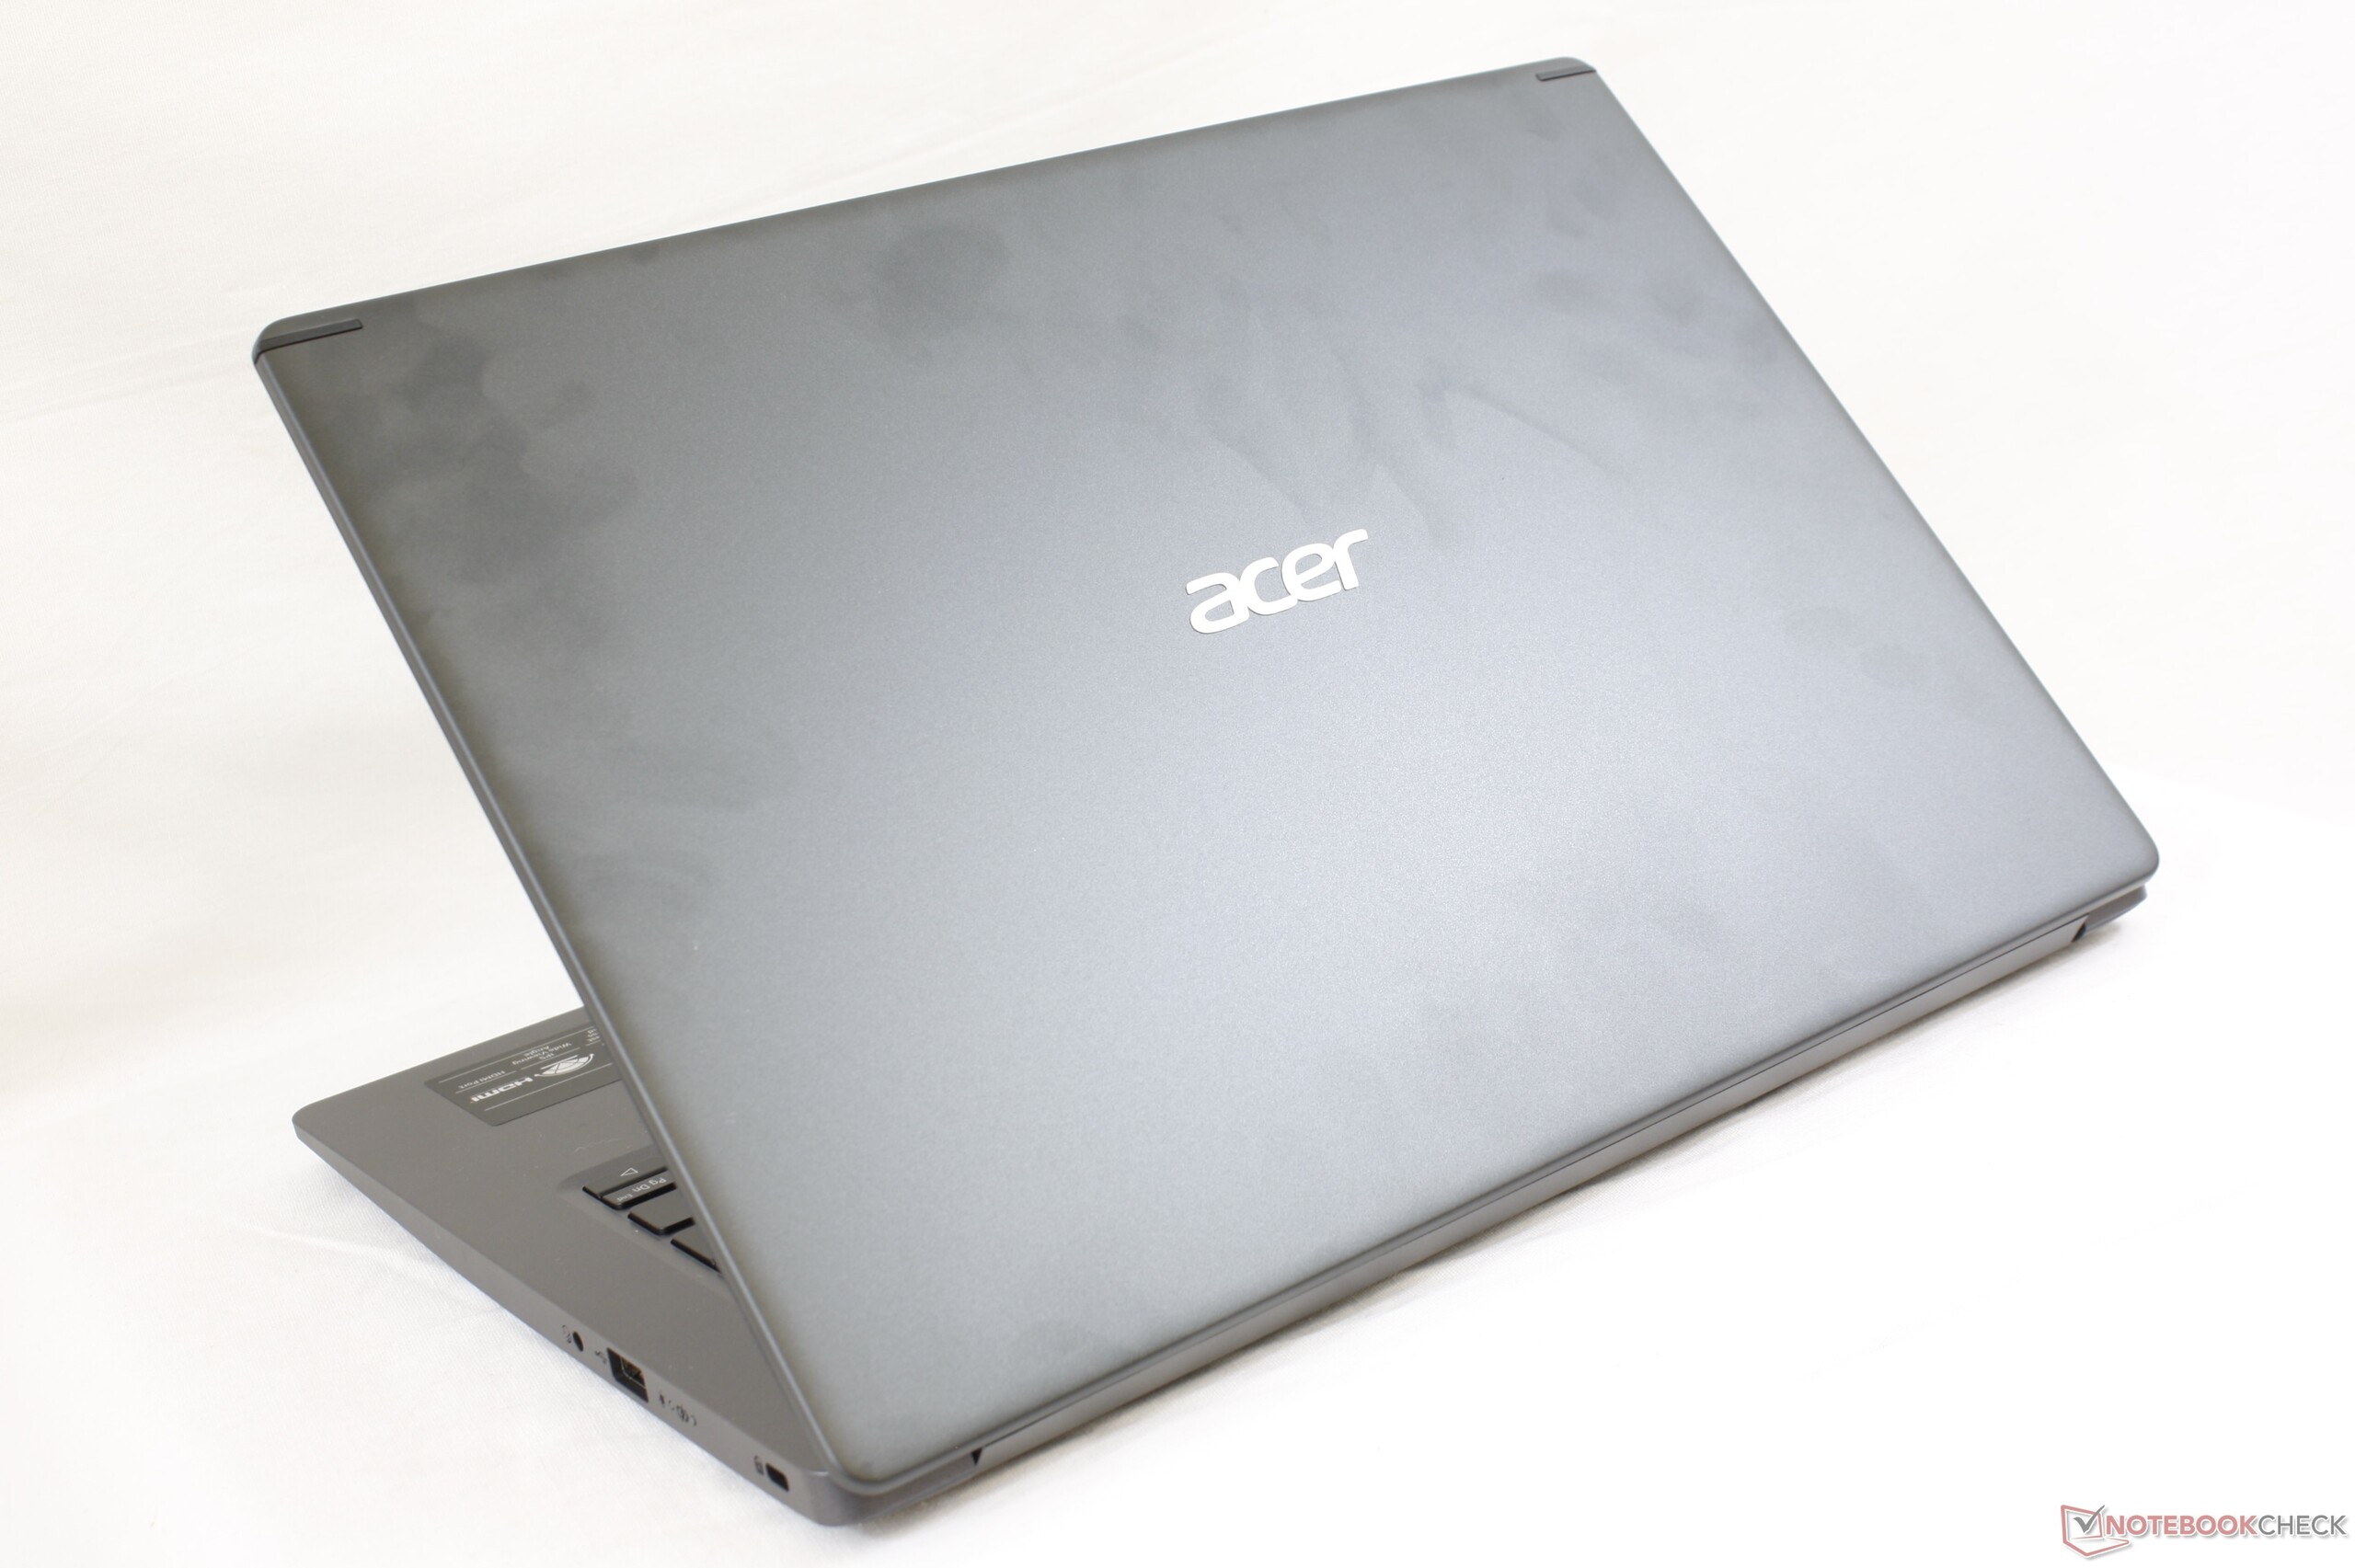
O Acer Aspire 5 A514 não se destaca em uma categoria em particular, o que não está mal, dado que deve ser um portátil acessível. Mesmo assim, isso não significa que possa ficar atrás em alguns aspectos chave. Os usuários que escolhem um portátil de 14 polegadas sobre um de 15,6 polegadas provavelmente valorizam mais a portabilidade do formato menor. Os marcos grossos e, portanto, o peso maior do Acer o tornam uma opção inferior para alternativas mais leves como o Asus VivoBook ou Walmart Motile. As dimensões maiores do Acer teriam sido boas se ofereceria vantagens como rigidez melhorada ou recursos adicionais, mas não vemos nada disso aqui.
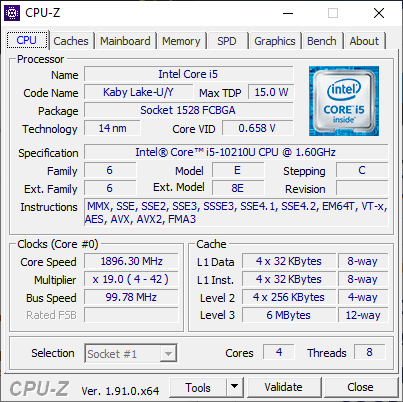
O bug do desempenho da CPU que encontramos é outro ponto negativo no sistema. Afortunadamente isto não irá impactar o desempenho do dia a dia, dado que o Aspire 5 não tem como alvo cargas de trabalho exigentes, mas, finalmente, isso não é desejável. Mesmo sem considerar o bug, o desempenho bruto da CPU é mais lento do que a maioria dos outros portáteis equipados com o mesmo processador Core i5-10210U.
Existem alguns destaques no sistema que valem a pena mencionar. A tela é bem calibrada de fábrica e existem duas opções de armazenamento interno, em vez de uma só. O ruído do ventilador quase sempre é baixo durante cargas de trabalho baixas a médias e a duração da bateria é respeitável para sua categoria. Mesmo assim, o Aspire 5 A514 fica para trás quando comparado com subportáteis mais novos e com preço similar de OEMs concorrentes.
A tela pode ser boa para o preço, mas quase tudo sobre o Aspire 5 A514 se sente antigo. Pode ser a hora em que a Acer tenha que redesenhar o chassi para poder ser competitiva no mercado de portáteis de 14 polegadas.
Acer Aspire 5 A514-52
- 02/14/2020 v7 (old)
Allen Ngo
Price comparison
