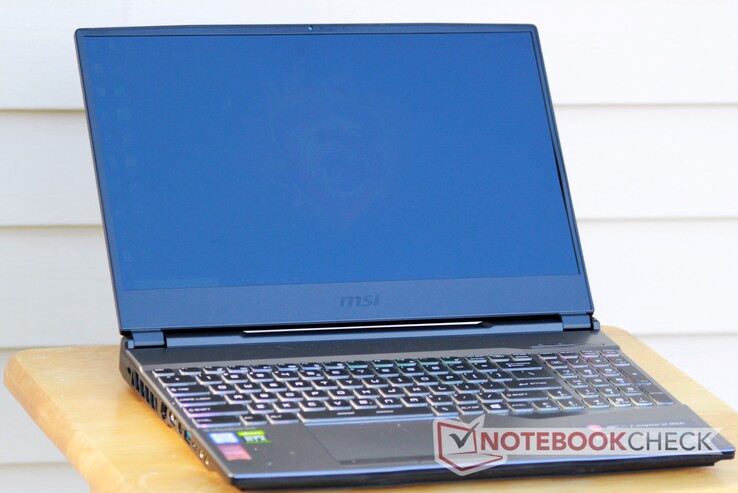
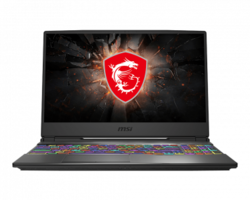
Breve Análise do Portátil MSI GP65 Leopard 9SE - A melhor tela em um portátil para jogos de gama média
Os Top 10
» Os Top 10 Portáteis Multimídia
» Os Top 10 Portáteis de Jogos
» Os Top 10 Portáteis Leves para Jogos
» Os Top 10 Portáteis Acessíveis de Escritório/Empresariais
» Os Top 10 Portáteis Premium de Escritório/Empresariais
» Os Top 10 dos Portáteis Workstation
» Os Top 10 Subportáteis
» Os Top 10 Ultrabooks
» Os Top 10 Conversíveis
» Os Top 10 Tablets
» Os Top 10 Smartphones
» A melhores Telas de Portáteis Analisadas Pela Notebookcheck
» Top 10 dos portáteis abaixo dos 500 Euros da Notebookcheck
» Top 10 dos Portáteis abaixo dos 300 Euros
| SD Card Reader | |
| average JPG Copy Test (av. of 3 runs) | |
| Eurocom Nightsky Ti15 (Toshiba Exceria Pro SDXC 64 GB UHS-II) | |
| Média da turma Gaming (20 - 210, n=64, últimos 2 anos) | |
| CUK Model Z GK5CQ7Z (Toshiba Exceria Pro SDXC 64 GB UHS-II) | |
| HP Omen 15-dc1303ng (Toshiba Exceria Pro SDXC 64 GB UHS-II) | |
| MSI GP65 Leopard 9SE-225US | |
| maximum AS SSD Seq Read Test (1GB) | |
| Eurocom Nightsky Ti15 (Toshiba Exceria Pro SDXC 64 GB UHS-II) | |
| Média da turma Gaming (25.5 - 261, n=61, últimos 2 anos) | |
| CUK Model Z GK5CQ7Z (Toshiba Exceria Pro SDXC 64 GB UHS-II) | |
| HP Omen 15-dc1303ng (Toshiba Exceria Pro SDXC 64 GB UHS-II) | |
| MSI GP65 Leopard 9SE-225US | |
| Networking | |
| iperf3 transmit AX12 | |
| Eurocom Nightsky Ti15 | |
| MSI GP65 Leopard 9SE-225US | |
| Lenovo Legion Y540-15IRH-81SX00B2GE | |
| CUK Model Z GK5CQ7Z | |
| HP Omen 15-dc1303ng | |
| Asus Strix GL531GV-PB74 | |
| iperf3 receive AX12 | |
| MSI GP65 Leopard 9SE-225US | |
| Eurocom Nightsky Ti15 | |
| HP Omen 15-dc1303ng | |
| Asus Strix GL531GV-PB74 | |
| CUK Model Z GK5CQ7Z | |
| Lenovo Legion Y540-15IRH-81SX00B2GE | |
| |||||||||||||||||||||||||
iluminação: 85 %
iluminação com acumulador: 348.3 cd/m²
Contraste: 871:1 (Preto: 0.4 cd/m²)
ΔE ColorChecker Calman: 1.6 | ∀{0.5-29.43 Ø4.76}
calibrated: 1
ΔE Greyscale Calman: 2.3 | ∀{0.09-98 Ø5}
96% sRGB (Argyll 1.6.3 3D)
61% AdobeRGB 1998 (Argyll 1.6.3 3D)
66.3% AdobeRGB 1998 (Argyll 3D)
96.2% sRGB (Argyll 3D)
64.8% Display P3 (Argyll 3D)
Gamma: 2.203
CCT: 6707 K
| MSI GP65 Leopard 9SE-225US LG Philips LGD0625, IPS, 15.6", 1920x1080 | HP Omen 15-dc1303ng LG Philips LGD05C0, IPS, 15.6", 1920x1080 | Lenovo Legion Y540-15IRH-81SX00B2GE BOE 084D, IPS, 15.6", 1920x1080 | Asus Strix GL531GV-PB74 Panda LM156LF-GL02, IPS, 15.6", 1920x1080 | CUK Model Z GK5CQ7Z LG Philips LGD05C0, IPS, 15.6", 1920x1080 | Eurocom Nightsky Ti15 AU Optronics B156HAN, IPS, 15.6", 1920x1080 | |
|---|---|---|---|---|---|---|
| Display | -2% | -3% | -37% | -1% | -2% | |
| Display P3 Coverage (%) | 64.8 | 63.8 -2% | 63.6 -2% | 40.13 -38% | 64.5 0% | 65.2 1% |
| sRGB Coverage (%) | 96.2 | 93.4 -3% | 91.7 -5% | 60.3 -37% | 93 -3% | 90.9 -6% |
| AdobeRGB 1998 Coverage (%) | 66.3 | 65 -2% | 65.2 -2% | 41.48 -37% | 65.7 -1% | 66.3 0% |
| Response Times | -26% | -4% | -159% | -29% | -21% | |
| Response Time Grey 50% / Grey 80% * (ms) | 9.6 ? | 14 ? -46% | 8.8 ? 8% | 26 ? -171% | 13.6 ? -42% | 14.4 ? -50% |
| Response Time Black / White * (ms) | 10.4 ? | 11 ? -6% | 12 ? -15% | 25.6 ? -146% | 12 ? -15% | 9.6 ? 8% |
| PWM Frequency (Hz) | ||||||
| Screen | -17% | -30% | -99% | -26% | -45% | |
| Brightness middle (cd/m²) | 348.3 | 316 -9% | 299 -14% | 290.1 -17% | 306.8 -12% | 331 -5% |
| Brightness (cd/m²) | 327 | 295 -10% | 290 -11% | 274 -16% | 309 -6% | 327 0% |
| Brightness Distribution (%) | 85 | 84 -1% | 89 5% | 86 1% | 87 2% | 83 -2% |
| Black Level * (cd/m²) | 0.4 | 0.42 -5% | 0.29 28% | 0.54 -35% | 0.38 5% | 0.35 13% |
| Contrast (:1) | 871 | 752 -14% | 1031 18% | 537 -38% | 807 -7% | 946 9% |
| Colorchecker dE 2000 * | 1.6 | 2.7 -69% | 3.7 -131% | 5.16 -223% | 3.16 -98% | 4.22 -164% |
| Colorchecker dE 2000 max. * | 5.07 | 5.65 -11% | 7 -38% | 18.09 -257% | 6.05 -19% | 6.95 -37% |
| Colorchecker dE 2000 calibrated * | 1 | 1.58 -58% | 2 -100% | 4.35 -335% | 2.4 -140% | 3.27 -227% |
| Greyscale dE 2000 * | 2.3 | 2.35 -2% | 4.1 -78% | 4.4 -91% | 2.3 -0% | 3.9 -70% |
| Gamma | 2.203 100% | 2.41 91% | 2.19 100% | 2.1 105% | 2.17 101% | 2.26 97% |
| CCT | 6707 97% | 6904 94% | 7166 91% | 7362 88% | 6557 99% | 7392 88% |
| Color Space (Percent of AdobeRGB 1998) (%) | 61 | 60 -2% | 59.3 -3% | 38.1 -38% | 60 -2% | 59 -3% |
| Color Space (Percent of sRGB) (%) | 96 | 93 -3% | 91.5 -5% | 60 -37% | 92.6 -4% | 90.5 -6% |
| Média Total (Programa/Configurações) | -15% /
-15% | -12% /
-22% | -98% /
-95% | -19% /
-21% | -23% /
-34% |
* ... menor é melhor
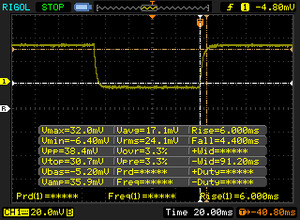
Exibir tempos de resposta
| ↔ Tempo de resposta preto para branco | ||
|---|---|---|
| 10.4 ms ... ascensão ↗ e queda ↘ combinadas | ↗ 6 ms ascensão | |
| ↘ 4.4 ms queda | ||
| A tela mostra boas taxas de resposta em nossos testes, mas pode ser muito lenta para jogadores competitivos. Em comparação, todos os dispositivos testados variam de 0.1 (mínimo) a 240 (máximo) ms. » 27 % de todos os dispositivos são melhores. Isso significa que o tempo de resposta medido é melhor que a média de todos os dispositivos testados (20.1 ms). | ||
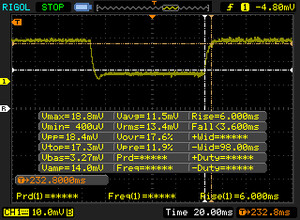
| ↔ Tempo de resposta 50% cinza a 80% cinza | ||
| 9.6 ms ... ascensão ↗ e queda ↘ combinadas | ↗ 6 ms ascensão | |
| ↘ 3.6 ms queda | ||
| A tela mostra taxas de resposta rápidas em nossos testes e deve ser adequada para jogos. Em comparação, todos os dispositivos testados variam de 0.165 (mínimo) a 636 (máximo) ms. » 22 % de todos os dispositivos são melhores. Isso significa que o tempo de resposta medido é melhor que a média de todos os dispositivos testados (31.5 ms). | ||
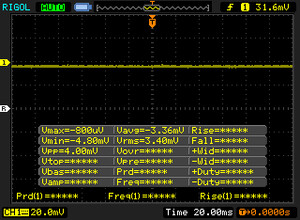
Cintilação da tela / PWM (modulação por largura de pulso)
| Tela tremeluzindo / PWM não detectado | |||
[pwm_comparison] Em comparação: 53 % de todos os dispositivos testados não usam PWM para escurecer a tela. Se PWM foi detectado, uma média de 8023 (mínimo: 5 - máximo: 343500) Hz foi medida. | |||
| Cinebench R15 | |
| CPU Single 64Bit | |
| Média da turma Gaming (188.8 - 343, n=134, últimos 2 anos) | |
| Lenovo ThinkPad P1 2019-20QT000RGE | |
| MSI GP65 Leopard 9SE-225US | |
| Schenker Slim 15 Comet Lake U | |
| Média Intel Core i7-9750H (170 - 194, n=82) | |
| Dell Inspiron 7390 2-in-1 | |
| Lenovo Legion Y540-17IRH | |
| Schenker Key 16 | |
| Eurocom Nightsky Ti15 | |
| Asus TUF FX505DT-EB73 | |
| CPU Multi 64Bit | |
| Média da turma Gaming (1537 - 6271, n=135, últimos 2 anos) | |
| Eurocom Nightsky Ti15 | |
| MSI GP65 Leopard 9SE-225US | |
| Média Intel Core i7-9750H (952 - 1306, n=85) | |
| Schenker Key 16 | |
| Lenovo ThinkPad P1 2019-20QT000RGE | |
| Lenovo Legion Y540-17IRH | |
| Asus TUF FX505DT-EB73 | |
| Schenker Slim 15 Comet Lake U | |
| Schenker Slim 15 Comet Lake U | |
| Schenker Slim 15 Comet Lake U | |
| Dell Inspiron 7390 2-in-1 | |
| Cinebench R11.5 | |
| CPU Single 64Bit | |
| Média da turma Gaming (2.62 - 3.98, n=9, últimos 2 anos) | |
| Lenovo ThinkPad P1 2019-20QT000RGE | |
| Média Intel Core i7-9750H (1.96 - 2.19, n=10) | |
| Eurocom Nightsky Ti15 | |
| CPU Multi 64Bit | |
| Média da turma Gaming (10.4 - 70.7, n=9, últimos 2 anos) | |
| Eurocom Nightsky Ti15 | |
| Média Intel Core i7-9750H (11.3 - 14.1, n=10) | |
| Lenovo ThinkPad P1 2019-20QT000RGE | |
| Cinebench R10 | |
| Rendering Multiple CPUs 32Bit | |
| Média da turma Gaming (32456 - 81339, n=9, últimos 2 anos) | |
| Média Intel Core i7-9750H (28251 - 36304, n=13) | |
| Schenker Key 16 | |
| Lenovo ThinkPad P1 2019-20QT000RGE | |
| Lenovo Legion Y540-17IRH | |
| Rendering Single 32Bit | |
| Média da turma Gaming (5719 - 11779, n=9, últimos 2 anos) | |
| Lenovo ThinkPad P1 2019-20QT000RGE | |
| Média Intel Core i7-9750H (6659 - 7214, n=13) | |
| Schenker Key 16 | |
| Lenovo Legion Y540-17IRH | |
| wPrime 2.10 - 1024m | |
| Lenovo ThinkPad P1 2019-20QT000RGE | |
| Média da turma Gaming (33 - 410, n=7, últimos 2 anos) | |
| Média Intel Core i7-9750H (n=1) | |
* ... menor é melhor
| PCMark 8 | |
| Home Score Accelerated v2 | |
| Média da turma Gaming (5564 - 5883, n=2, últimos 2 anos) | |
| HP Omen 15-dc1303ng | |
| Lenovo Legion Y540-15IRH-81SX00B2GE | |
| CUK Model Z GK5CQ7Z | |
| MSI GP65 Leopard 9SE-225US | |
| Média Intel Core i7-9750H, NVIDIA GeForce RTX 2060 Mobile (3533 - 5185, n=11) | |
| Asus Strix GL531GV-PB74 | |
| Eurocom Nightsky Ti15 | |
| Work Score Accelerated v2 | |
| HP Omen 15-dc1303ng | |
| MSI GP65 Leopard 9SE-225US | |
| CUK Model Z GK5CQ7Z | |
| Média Intel Core i7-9750H, NVIDIA GeForce RTX 2060 Mobile (4450 - 5931, n=11) | |
| Eurocom Nightsky Ti15 | |
| Asus Strix GL531GV-PB74 | |
| Lenovo Legion Y540-15IRH-81SX00B2GE | |
| Média da turma Gaming (n=1últimos 2 anos) | |
| PCMark 8 Home Score Accelerated v2 | 4456 pontos | |
| PCMark 8 Work Score Accelerated v2 | 5808 pontos | |
| PCMark 10 Score | 5834 pontos | |
Ajuda | ||
| MSI GP65 Leopard 9SE-225US Toshiba KBG30ZMT512G | HP Omen 15-dc1303ng Samsung SSD PM981 MZVLB256HAHQ | Lenovo Legion Y540-15IRH-81SX00B2GE WDC PC SN720 SDAPNTW-512G | Asus Strix GL531GV-PB74 Intel SSD 660p SSDPEKNW512G8 | CUK Model Z GK5CQ7Z Intel SSD 660p 2TB SSDPEKNW020T8 | Eurocom Nightsky Ti15 Samsung SSD 970 Pro 512GB | Média Toshiba KBG30ZMT512G | |
|---|---|---|---|---|---|---|---|
| AS SSD | 119% | 151% | 55% | 89% | 196% | 12% | |
| Seq Read (MB/s) | 1307 | 2485 90% | 2927 124% | 1280 -2% | 1283 -2% | 2168 66% | 1326 ? 1% |
| Seq Write (MB/s) | 730 | 1575 116% | 2149 194% | 905 24% | 1730 137% | 2194 201% | 755 ? 3% |
| 4K Read (MB/s) | 27.58 | 53.4 94% | 42.43 54% | 48.73 77% | 49.89 81% | 53.2 93% | 39 ? 41% |
| 4K Write (MB/s) | 80.3 | 113.5 41% | 147.1 83% | 107 33% | 110.1 37% | 128.5 60% | 92.6 ? 15% |
| 4K-64 Read (MB/s) | 878 | 725 -17% | 1286 46% | 321.1 -63% | 904 3% | 1320 50% | 873 ? -1% |
| 4K-64 Write (MB/s) | 246.8 | 1371 456% | 1432 480% | 761 208% | 792 221% | 2162 776% | 349 ? 41% |
| Access Time Read * (ms) | 0.231 | 0.059 74% | 0.065 72% | 0.058 75% | 0.036 84% | 0.04 83% | 0.1463 ? 37% |
| Access Time Write * (ms) | 0.223 | 0.032 86% | 0.026 88% | 0.046 79% | 0.042 81% | 0.029 87% | 0.2073 ? 7% |
| Score Read (Points) | 1036 | 1027 -1% | 1621 56% | 498 -52% | 1082 4% | 1590 53% | 1045 ? 1% |
| Score Write (Points) | 400 | 1642 311% | 1794 349% | 958 140% | 1075 169% | 2510 528% | 517 ? 29% |
| Score Total (Points) | 1940 | 3163 63% | 4208 117% | 1711 -12% | 2745 41% | 4924 154% | 2075 ? 7% |
| Copy ISO MB/s (MB/s) | 993 | 1519 53% | 3089 211% | 935 ? -6% | |||
| Copy Program MB/s (MB/s) | 309.5 | 749 142% | 549 77% | 260 ? -16% | |||
| Copy Game MB/s (MB/s) | 582 | 943 62% | 1171 101% | 591 ? 2% |
* ... menor é melhor
| 3DMark 11 | |
| 1280x720 Performance GPU | |
| Média da turma Gaming (16033 - 80022, n=129, últimos 2 anos) | |
| HP Omen 17-cb0020ng | |
| Origin PC EVO16-S i7-9750H RTX 2080 Max-Q | |
| Eurocom Nightsky RX15 | |
| Acer Predator Triton 500 PT515-51-71PZ | |
| MSI GP65 Leopard 9SE-225US | |
| Média NVIDIA GeForce RTX 2060 Mobile (19143 - 24662, n=40) | |
| Eurocom Nightsky Ti15 | |
| Lenovo Legion Y530-15ICH | |
| HP Omen 15-dc1020ng | |
| Dell XPS 15 7590 9980HK GTX 1650 | |
| Asus VivoBook 15 X512FL-EJ205T | |
| 1280x720 Performance Combined | |
| Média da turma Gaming (7343 - 30851, n=129, últimos 2 anos) | |
| Eurocom Nightsky RX15 | |
| HP Omen 17-cb0020ng | |
| MSI GP65 Leopard 9SE-225US | |
| Acer Predator Triton 500 PT515-51-71PZ | |
| Eurocom Nightsky Ti15 | |
| Origin PC EVO16-S i7-9750H RTX 2080 Max-Q | |
| Média NVIDIA GeForce RTX 2060 Mobile (1107 - 14726, n=40) | |
| Lenovo Legion Y530-15ICH | |
| HP Omen 15-dc1020ng | |
| Dell XPS 15 7590 9980HK GTX 1650 | |
| Asus VivoBook 15 X512FL-EJ205T | |
| 3DMark 11 Performance | 18447 pontos | |
| 3DMark Cloud Gate Standard Score | 37504 pontos | |
| 3DMark Fire Strike Score | 15252 pontos | |
| 3DMark Time Spy Score | 6117 pontos | |
Ajuda | ||
| Rocket League | |
| 1280x720 Performance | |
| MSI GP65 Leopard 9SE-225US | |
| Média NVIDIA GeForce RTX 2060 Mobile (244 - 252, n=4) | |
| 1920x1080 Quality AA:Medium FX | |
| MSI GP65 Leopard 9SE-225US | |
| Média NVIDIA GeForce RTX 2060 Mobile (242 - 250, n=5) | |
| 1920x1080 High Quality AA:High FX | |
| MSI GP65 Leopard 9SE-225US | |
| Média NVIDIA GeForce RTX 2060 Mobile (180.6 - 247, n=5) | |
| Monster Hunter World | |
| 1280x720 Low Preset (Image Quality High) | |
| MSI GP65 Leopard 9SE-225US | |
| Média NVIDIA GeForce RTX 2060 Mobile (n=1) | |
| 1920x1080 Mid Preset (Image Quality High) | |
| Média NVIDIA GeForce RTX 2060 Mobile (102 - 104, n=2) | |
| MSI GP65 Leopard 9SE-225US | |
| 1920x1080 High Preset (Image Quality High) | |
| MSI GP65 Leopard 9SE-225US | |
| Média NVIDIA GeForce RTX 2060 Mobile (89.9 - 96, n=2) | |
| 1920x1080 Highest Preset (Image Quality High) | |
| Média NVIDIA GeForce RTX 2060 Mobile (70 - 70.2, n=2) | |
| MSI GP65 Leopard 9SE-225US | |
| Hitman 2 | |
| 1280x720 Low AF:Trilinear | |
| MSI GP65 Leopard 9SE-225US | |
| Média NVIDIA GeForce RTX 2060 Mobile (n=1) | |
| 1920x1080 Medium AF:4x | |
| MSI GP65 Leopard 9SE-225US | |
| Média NVIDIA GeForce RTX 2060 Mobile (89.4 - 90, n=2) | |
| 1920x1080 High AF:8x | |
| MSI GP65 Leopard 9SE-225US | |
| Média NVIDIA GeForce RTX 2060 Mobile (81.4 - 85, n=2) | |
| 1920x1080 Ultra AF:16x | |
| Média NVIDIA GeForce RTX 2060 Mobile (74 - 78.4, n=2) | |
| MSI GP65 Leopard 9SE-225US | |
| F1 2019 | |
| 1280x720 Ultra Low Preset | |
| Média NVIDIA GeForce RTX 2060 Mobile (166 - 231, n=4) | |
| MSI GP65 Leopard 9SE-225US | |
| 1920x1080 Medium Preset AA:T AF:16x | |
| Média NVIDIA GeForce RTX 2060 Mobile (146 - 177, n=4) | |
| MSI GP65 Leopard 9SE-225US | |
| 1920x1080 High Preset AA:T AF:16x | |
| Média NVIDIA GeForce RTX 2060 Mobile (122 - 149, n=4) | |
| MSI GP65 Leopard 9SE-225US | |
| 1920x1080 Ultra High Preset AA:T AF:16x | |
| Média NVIDIA GeForce RTX 2060 Mobile (97 - 127, n=4) | |
| MSI GP65 Leopard 9SE-225US | |
| baixo | média | alto | ultra | |
|---|---|---|---|---|
| The Witcher 3 (2015) | 252 | 178 | 111 | 59 |
| Rocket League (2017) | 250 | 250 | 244 | |
| Monster Hunter World (2018) | 141 | 102 | 96 | 70 |
| Shadow of the Tomb Raider (2018) | 116 | 70 | 66 | 54 |
| Hitman 2 (2018) | 116 | 90 | 85 | 74 |
| F1 2019 (2019) | 166 | 146 | 122 | 104 |
| MSI GP65 Leopard 9SE-225US GeForce RTX 2060 Mobile, i7-9750H, Toshiba KBG30ZMT512G | HP Omen 15-dc1303ng GeForce RTX 2070 Max-Q, i7-8750H, Samsung SSD PM981 MZVLB256HAHQ | Lenovo Legion Y540-15IRH-81SX00B2GE GeForce GTX 1660 Ti Mobile, i7-9750H, WDC PC SN720 SDAPNTW-512G | Asus Strix GL531GV-PB74 GeForce RTX 2060 Mobile, i7-9750H, Intel SSD 660p SSDPEKNW512G8 | CUK Model Z GK5CQ7Z GeForce RTX 2070 Max-Q, i7-9750H, Intel SSD 660p 2TB SSDPEKNW020T8 | Eurocom Nightsky Ti15 GeForce GTX 1660 Ti Mobile, i7-9750H, Samsung SSD 970 Pro 512GB | |
|---|---|---|---|---|---|---|
| Noise | -10% | 1% | -9% | -12% | -8% | |
| desligado / ambiente * (dB) | 28.2 | 30.5 -8% | 29.3 -4% | 28.2 -0% | 28.6 -1% | 28.4 -1% |
| Idle Minimum * (dB) | 29.5 | 32.8 -11% | 29.3 1% | 28.8 2% | 30.8 -4% | 28.6 3% |
| Idle Average * (dB) | 29.6 | 32.8 -11% | 29.3 1% | 31.4 -6% | 30.8 -4% | 28.6 3% |
| Idle Maximum * (dB) | 29.6 | 32.8 -11% | 29.3 1% | 33.3 -12% | 35 -18% | 28.6 3% |
| Load Average * (dB) | 33 | 42.5 -29% | 35.7 -8% | 46.2 -40% | 45 -36% | 47.8 -45% |
| Witcher 3 ultra * (dB) | 47.2 | 44.2 6% | 50.5 -7% | 51.6 -9% | 53.7 -14% | |
| Load Maximum * (dB) | 52 | 47.5 9% | 45.6 12% | 51.3 1% | 57.8 -11% | 53.7 -3% |
* ... menor é melhor
Barulho
| Ocioso |
| 29.5 / 29.6 / 29.6 dB |
| Carga |
| 33 / 52 dB |
 | ||
30 dB silencioso 40 dB(A) audível 50 dB(A) ruidosamente alto |
||
min: | ||
(-) A temperatura máxima no lado superior é 48.8 °C / 120 F, em comparação com a média de 40.4 °C / 105 F , variando de 21.2 a 68.8 °C para a classe Gaming.
(-) A parte inferior aquece até um máximo de 54 °C / 129 F, em comparação com a média de 43.3 °C / 110 F
(±) Em uso inativo, a temperatura média para o lado superior é 32.4 °C / 90 F, em comparação com a média do dispositivo de 33.9 °C / ### class_avg_f### F.
(±) Jogando The Witcher 3, a temperatura média para o lado superior é 35.8 °C / 96 F, em comparação com a média do dispositivo de 33.9 °C / ## #class_avg_f### F.
(+) Os apoios para as mãos e o touchpad estão atingindo a temperatura máxima da pele (34 °C / 93.2 F) e, portanto, não estão quentes.
(-) A temperatura média da área do apoio para as mãos de dispositivos semelhantes foi 28.8 °C / 83.8 F (-5.2 °C / -9.4 F).
MSI GP65 Leopard 9SE-225US análise de áudio
(±) | o volume do alto-falante é médio, mas bom (###valor### dB)
Graves 100 - 315Hz
(-) | quase nenhum baixo - em média 36.8% menor que a mediana
(+) | o baixo é linear (5.9% delta para a frequência anterior)
Médios 400 - 2.000 Hz
(±) | médios reduzidos - em média 9.7% menor que a mediana
(±) | a linearidade dos médios é média (9% delta para frequência anterior)
Altos 2 - 16 kHz
(+) | agudos equilibrados - apenas 2.2% longe da mediana
(+) | os máximos são lineares (4% delta da frequência anterior)
Geral 100 - 16.000 Hz
(±) | a linearidade do som geral é média (29.1% diferença em relação à mediana)
Comparado com a mesma classe
» 94% de todos os dispositivos testados nesta classe foram melhores, 2% semelhantes, 4% piores
» O melhor teve um delta de 6%, a média foi 18%, o pior foi 132%
Comparado com todos os dispositivos testados
» 87% de todos os dispositivos testados foram melhores, 2% semelhantes, 11% piores
» O melhor teve um delta de 4%, a média foi 24%, o pior foi 134%
HP Omen 15-dc1303ng análise de áudio
(-) | alto-falantes não muito altos (###valor### dB)
Graves 100 - 315Hz
(-) | quase nenhum baixo - em média 20.2% menor que a mediana
(±) | a linearidade dos graves é média (11.4% delta para a frequência anterior)
Médios 400 - 2.000 Hz
(+) | médios equilibrados - apenas 2.2% longe da mediana
(±) | a linearidade dos médios é média (8.2% delta para frequência anterior)
Altos 2 - 16 kHz
(+) | agudos equilibrados - apenas 2.5% longe da mediana
(+) | os máximos são lineares (5.9% delta da frequência anterior)
Geral 100 - 16.000 Hz
(±) | a linearidade do som geral é média (20.3% diferença em relação à mediana)
Comparado com a mesma classe
» 71% de todos os dispositivos testados nesta classe foram melhores, 6% semelhantes, 23% piores
» O melhor teve um delta de 6%, a média foi 18%, o pior foi 132%
Comparado com todos os dispositivos testados
» 52% de todos os dispositivos testados foram melhores, 8% semelhantes, 39% piores
» O melhor teve um delta de 4%, a média foi 24%, o pior foi 134%
Lenovo Legion Y540-15IRH-81SX00B2GE análise de áudio
(±) | o volume do alto-falante é médio, mas bom (###valor### dB)
Graves 100 - 315Hz
(-) | quase nenhum baixo - em média 17.7% menor que a mediana
(±) | a linearidade dos graves é média (11.6% delta para a frequência anterior)
Médios 400 - 2.000 Hz
(+) | médios equilibrados - apenas 3.7% longe da mediana
(+) | médios são lineares (4.5% delta para frequência anterior)
Altos 2 - 16 kHz
(+) | agudos equilibrados - apenas 3.3% longe da mediana
(+) | os máximos são lineares (5.9% delta da frequência anterior)
Geral 100 - 16.000 Hz
(±) | a linearidade do som geral é média (18.1% diferença em relação à mediana)
Comparado com a mesma classe
» 56% de todos os dispositivos testados nesta classe foram melhores, 8% semelhantes, 36% piores
» O melhor teve um delta de 6%, a média foi 18%, o pior foi 132%
Comparado com todos os dispositivos testados
» 38% de todos os dispositivos testados foram melhores, 8% semelhantes, 54% piores
» O melhor teve um delta de 4%, a média foi 24%, o pior foi 134%
| desligado | |
| Ocioso | |
| Carga |
|
Key:
min: | |
| MSI GP65 Leopard 9SE-225US i7-9750H, GeForce RTX 2060 Mobile, Toshiba KBG30ZMT512G, IPS, 1920x1080, 15.6" | HP Omen 15-dc1303ng i7-8750H, GeForce RTX 2070 Max-Q, Samsung SSD PM981 MZVLB256HAHQ, IPS, 1920x1080, 15.6" | Lenovo Legion Y540-15IRH-81SX00B2GE i7-9750H, GeForce GTX 1660 Ti Mobile, WDC PC SN720 SDAPNTW-512G, IPS, 1920x1080, 15.6" | Asus Strix GL531GV-PB74 i7-9750H, GeForce RTX 2060 Mobile, Intel SSD 660p SSDPEKNW512G8, IPS, 1920x1080, 15.6" | CUK Model Z GK5CQ7Z i7-9750H, GeForce RTX 2070 Max-Q, Intel SSD 660p 2TB SSDPEKNW020T8, IPS, 1920x1080, 15.6" | Eurocom Nightsky Ti15 i7-9750H, GeForce GTX 1660 Ti Mobile, Samsung SSD 970 Pro 512GB, IPS, 1920x1080, 15.6" | |
|---|---|---|---|---|---|---|
| Power Consumption | 6% | 5% | -6% | -30% | -18% | |
| Idle Minimum * (Watt) | 13.6 | 14.7 -8% | 14.5 -7% | 10.9 20% | 23.5 -73% | 16.8 -24% |
| Idle Average * (Watt) | 17.9 | 18.6 -4% | 18.5 -3% | 14.7 18% | 28 -56% | 29 -62% |
| Idle Maximum * (Watt) | 20.6 | 22.6 -10% | 20 3% | 32.4 -57% | 32 -55% | 30.8 -50% |
| Load Average * (Watt) | 96 | 90 6% | 81.6 15% | 121.9 -27% | 102.4 -7% | 89.2 7% |
| Witcher 3 ultra * (Watt) | 154.6 | 132 15% | 143.5 7% | 142.8 8% | 141.1 9% | |
| Load Maximum * (Watt) | 218.6 | 120 45% | 208.1 5% | 209.6 4% | 209 4% | 192.3 12% |
* ... menor é melhor
| MSI GP65 Leopard 9SE-225US i7-9750H, GeForce RTX 2060 Mobile, 51 Wh | HP Omen 15-dc1303ng i7-8750H, GeForce RTX 2070 Max-Q, 70 Wh | Lenovo Legion Y540-15IRH-81SX00B2GE i7-9750H, GeForce GTX 1660 Ti Mobile, 57 Wh | Asus Strix GL531GV-PB74 i7-9750H, GeForce RTX 2060 Mobile, 66 Wh | CUK Model Z GK5CQ7Z i7-9750H, GeForce RTX 2070 Max-Q, 46.74 Wh | Eurocom Nightsky Ti15 i7-9750H, GeForce GTX 1660 Ti Mobile, 62 Wh | |
|---|---|---|---|---|---|---|
| Duração da bateria | -8% | -18% | -51% | -23% | -8% | |
| Reader / Idle (h) | 6 | 5 -17% | 4 -33% | |||
| WiFi v1.3 (h) | 3.9 | 3.3 -15% | 2.4 -38% | 1.9 -51% | 3 -23% | 3.6 -8% |
| Load (h) | 1.1 | 1.2 9% | 1.3 18% |
Pro
Contra
O MSI GP65 Leopard continua pavimentando a estrada iniciada pelo GP62 e GP63. Enquanto o chassi parece e se sente barato, o hardware alojado no interior é excelente para o preço. A tela de 144 Hz, em particular, é a estrela do show. A tela não apenas oferece uma jogabilidade fluente, mas também é incrivelmente precisa nas cores, algo inédito em um portátil para jogos de nível intermediário.
Outras sutilezas premium começaram a aparecer no meio do mercado de portáteis para jogos, como mostra o GP65. O teclado continua com a excelente reputação das marcas SteelSeries e a luz de fundo RGB por tecla é uma adição bem-vinda (e divertida). A seleção de portas é variada, embora o posicionamento seja estranho e frustrante. Finalmente, os jogos e desempenho geral são ótimos por US$ 1.500; o GP65 seria um portátil de criação de conteúdo decente e uma máquina de jogos.
No entanto, o GP65 não foi criado no vácuo. Existem alguns candidatos que oferecem melhores pacotes gerais nesta faixa de preço. Por exemplo, o Lenovo Legion Y540 possui melhor gerenciamento térmico (com ventiladores mais silenciosos) e desempenho de jogos comparável, por US$ 100 a menos. O CUK Model Z oferece uma carcaça melhor, um teclado mecânico e uma GPU mais poderosa (RTX 2070 Max-Q) pelo mesmo preço de US$ 1.500. No entanto, o Modelo Z esquenta muito mais que o GP65 e isso com os ventiladores mais barulhentos.
A decisão se resume ao que você deseja que seu portátil faça. Se seu objetivo principal são os jogos (e as térmicas que se danem), oCUK Model Z é difícil de superar nesta faixa de preço. Se o orçamento for de maior preocupação, o Lenovo Legion Y540 tem um bom preço com uma pequena desvantagem no desempenho dos jogos. (A Lenovo frequentemente também tem ofertas.)
Embora comprometa a qualidade da construção e o gerenciamento térmico, o MSI GP65 Leopard representa um excelente valor e é um ótimo portátil "polifuncional”. A excelente tela é boa o suficiente para a criação de conteúdo, e o desempenho dos jogos certamente deixará a maioria dos jogadores satisfeitos no futuro próximo. Por US$ 1.500, o GP65 Leopard fica no extremo do mercado de gama média, mas também é um dos melhores portáteis de jogos disponíveis atualmente.
MSI GP65 Leopard 9SE-225US
- 08/25/2019 v6 (old)
Sam Medley


