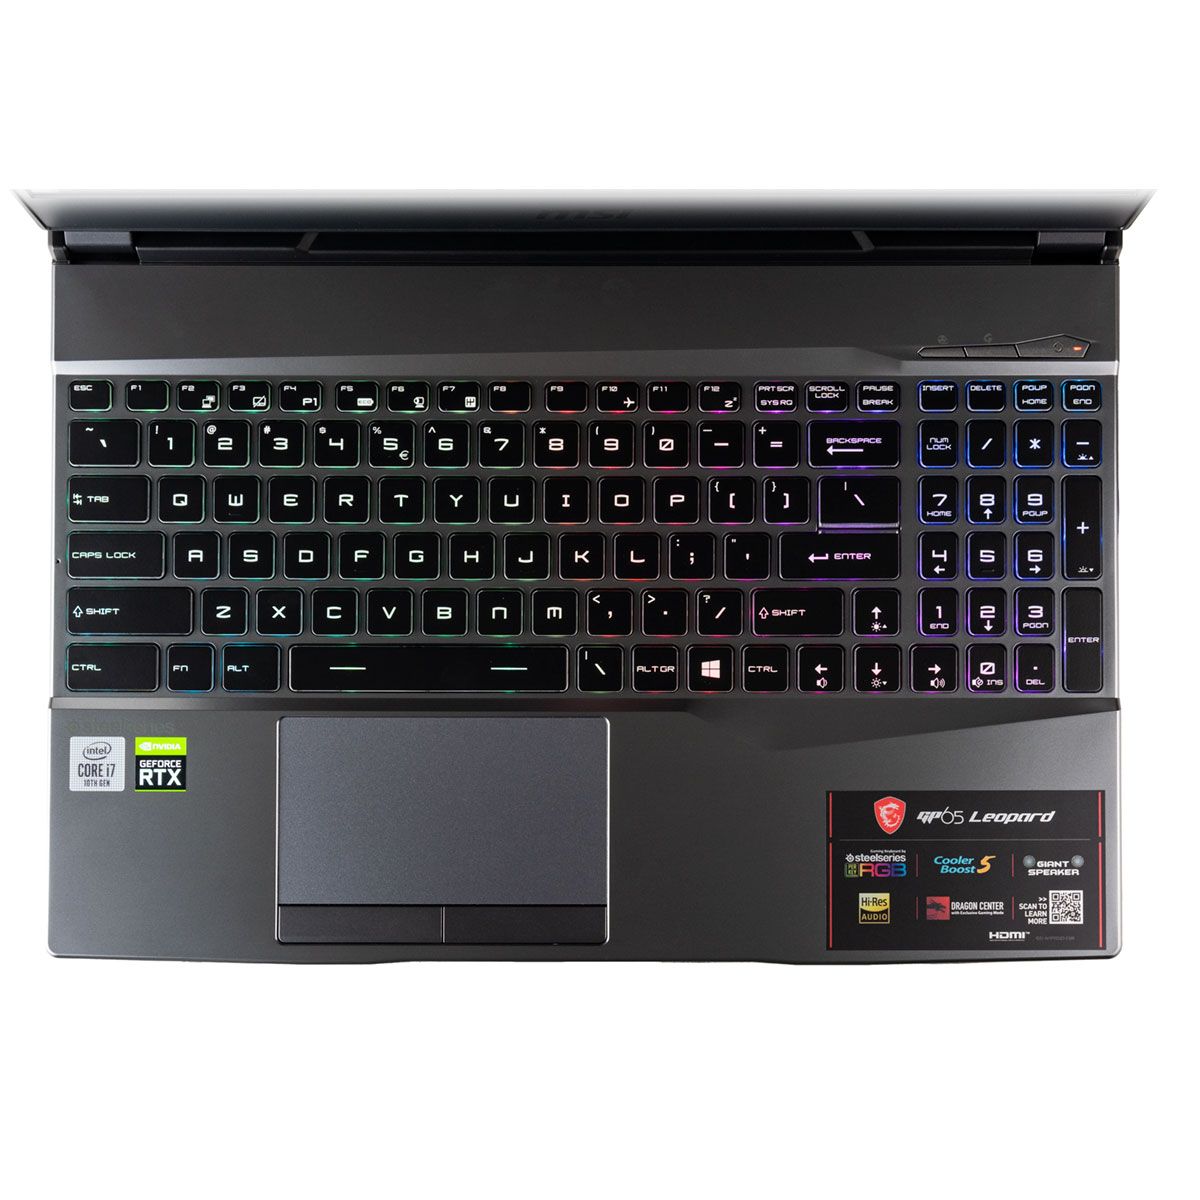
Breve Análise do Portátil MSI GP65 10SFK: O Intel Core i7 de 10a geração deixa sua marca
Avaliação | Data | Modelo | Peso | Altura | Size | Resolução | Preço |
|---|---|---|---|---|---|---|---|
| 83.2 % v7 (old) | 05/2020 | MSI GP65 10SFK-047US i7-10750H, GeForce RTX 2070 Mobile | 2.3 kg | 27.5 mm | 15.60" | 1920x1080 | |
| 82.1 % v7 (old) | Asus Strix Scar III G531GW-AZ062T i7-9750H, GeForce RTX 2070 Mobile | 2.4 kg | 25 mm | 15.60" | 1920x1080 | ||
| 80.4 % v6 (old) | 07/2019 | Asus TUF FX505DT-EB73 R7 3750H, GeForce GTX 1650 Mobile | 2.2 kg | 26.8 mm | 15.60" | 1920x1080 | |
| 86.2 % v6 (old) | 06/2019 | HP Omen 15-dc1303ng i7-8750H, GeForce RTX 2070 Max-Q | 2.4 kg | 25 mm | 15.60" | 1920x1080 | |
| 85.5 % v6 (old) | 06/2019 | Aorus 15-SA i7-9750H, GeForce GTX 1660 Ti Mobile | 2.1 kg | 24.4 mm | 15.60" | 1920x1080 |
| SD Card Reader | |
| average JPG Copy Test (av. of 3 runs) | |
| HP Omen 15-dc1303ng (Toshiba Exceria Pro SDXC 64 GB UHS-II) | |
| MSI GP65 10SFK-047US (Toshiba Exceria Pro SDXC 64 GB UHS-II) | |
| MSI GP65 Leopard 9SE-225US | |
| MSI GP62 7REX-1045US (Toshiba Exceria Pro SDXC 64 GB UHS-II) | |
| maximum AS SSD Seq Read Test (1GB) | |
| HP Omen 15-dc1303ng (Toshiba Exceria Pro SDXC 64 GB UHS-II) | |
| MSI GP65 10SFK-047US (Toshiba Exceria Pro SDXC 64 GB UHS-II) | |
| MSI GP65 Leopard 9SE-225US | |
| MSI GP62 7REX-1045US (Toshiba Exceria Pro SDXC 64 GB UHS-II) | |


| |||||||||||||||||||||||||
iluminação: 87 %
iluminação com acumulador: 384.9 cd/m²
Contraste: 574:1 (Preto: 0.67 cd/m²)
ΔE ColorChecker Calman: 2.43 | ∀{0.5-29.43 Ø4.71}
calibrated: 2.03
ΔE Greyscale Calman: 2.6 | ∀{0.09-98 Ø4.96}
93.9% sRGB (Argyll 1.6.3 3D)
59.7% AdobeRGB 1998 (Argyll 1.6.3 3D)
65.1% AdobeRGB 1998 (Argyll 3D)
94.4% sRGB (Argyll 3D)
63.5% Display P3 (Argyll 3D)
Gamma: 2.2
CCT: 6981 K
| MSI GP65 10SFK-047US LG Philips LP156WFG-SPB3, IPS, 15.6", 1920x1080 | MSI GP65 Leopard 9SE-225US LG Philips LGD0625, IPS, 15.6", 1920x1080 | Asus Strix Scar III G531GW-AZ062T Sharp LQ156M1JW09 (SHP14D3), IPS, 15.6", 1920x1080 | Asus TUF FX505DT-EB73 Panda LM156LF-GL, IPS, 15.6", 1920x1080 | HP Omen 15-dc1303ng LG Philips LGD05C0, IPS, 15.6", 1920x1080 | MSI GP62 7REX-1045US CMN N156HGE-EAL, TN LED, 15.6", 1920x1080 | |
|---|---|---|---|---|---|---|
| Display | 2% | 4% | -37% | -0% | 23% | |
| Display P3 Coverage (%) | 63.5 | 64.8 2% | 66.2 4% | 39.56 -38% | 63.8 0% | 85.8 35% |
| sRGB Coverage (%) | 94.4 | 96.2 2% | 97.1 3% | 59.5 -37% | 93.4 -1% | 100 6% |
| AdobeRGB 1998 Coverage (%) | 65.1 | 66.3 2% | 67.6 4% | 40.91 -37% | 65 0% | 84.2 29% |
| Response Times | 11% | -10% | -161% | -14% | -174% | |
| Response Time Grey 50% / Grey 80% * (ms) | 10.4 ? | 9.6 ? 8% | 15 ? -44% | 30.4 ? -192% | 14 ? -35% | 34.4 ? -231% |
| Response Time Black / White * (ms) | 12 ? | 10.4 ? 13% | 9 ? 25% | 27.6 ? -130% | 11 ? 8% | 26 ? -117% |
| PWM Frequency (Hz) | 250 ? | 200 ? | ||||
| Screen | 15% | -16% | -61% | 2% | -104% | |
| Brightness middle (cd/m²) | 384.9 | 348.3 -10% | 309 -20% | 286.2 -26% | 316 -18% | 265.7 -31% |
| Brightness (cd/m²) | 358 | 327 -9% | 284 -21% | 267 -25% | 295 -18% | 243 -32% |
| Brightness Distribution (%) | 87 | 85 -2% | 88 1% | 84 -3% | 84 -3% | 87 0% |
| Black Level * (cd/m²) | 0.67 | 0.4 40% | 0.42 37% | 0.33 51% | 0.42 37% | 0.63 6% |
| Contrast (:1) | 574 | 871 52% | 736 28% | 867 51% | 752 31% | 422 -26% |
| Colorchecker dE 2000 * | 2.43 | 1.6 34% | 3.99 -64% | 5.45 -124% | 2.7 -11% | 9.6 -295% |
| Colorchecker dE 2000 max. * | 4.58 | 5.07 -11% | 8.3 -81% | 18.08 -295% | 5.65 -23% | 18.5 -304% |
| Colorchecker dE 2000 calibrated * | 2.03 | 1 51% | 1.12 45% | 4.47 -120% | 1.58 22% | |
| Greyscale dE 2000 * | 2.6 | 2.3 12% | 5.43 -109% | 5.3 -104% | 2.35 10% | 12.7 -388% |
| Gamma | 2.2 100% | 2.203 100% | 2.57 86% | 2.1 105% | 2.41 91% | 2.01 109% |
| CCT | 6981 93% | 6707 97% | 7767 84% | 7679 85% | 6904 94% | 13654 48% |
| Color Space (Percent of AdobeRGB 1998) (%) | 59.7 | 61 2% | 63 6% | 37.6 -37% | 60 1% | 76 27% |
| Color Space (Percent of sRGB) (%) | 93.9 | 96 2% | 97 3% | 59.1 -37% | 93 -1% | 100 6% |
| Média Total (Programa/Configurações) | 9% /
12% | -7% /
-11% | -86% /
-69% | -4% /
-0% | -85% /
-88% |
* ... menor é melhor
Exibir tempos de resposta
| ↔ Tempo de resposta preto para branco | ||
|---|---|---|
| 12 ms ... ascensão ↗ e queda ↘ combinadas | ↗ 6.8 ms ascensão | 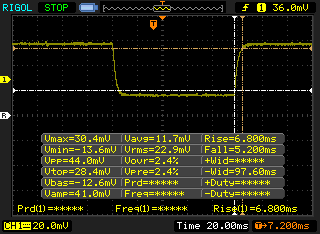 |
| ↘ 5.2 ms queda | ||
| A tela mostra boas taxas de resposta em nossos testes, mas pode ser muito lenta para jogadores competitivos. Em comparação, todos os dispositivos testados variam de 0.1 (mínimo) a 240 (máximo) ms. » 32 % de todos os dispositivos são melhores. Isso significa que o tempo de resposta medido é melhor que a média de todos os dispositivos testados (19.8 ms). | ||
| ↔ Tempo de resposta 50% cinza a 80% cinza | ||
| 10.4 ms ... ascensão ↗ e queda ↘ combinadas | ↗ 6.4 ms ascensão | 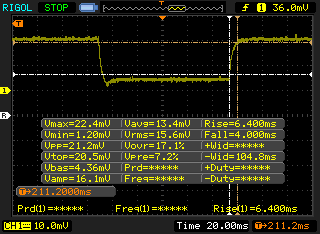 |
| ↘ 4 ms queda | ||
| A tela mostra boas taxas de resposta em nossos testes, mas pode ser muito lenta para jogadores competitivos. Em comparação, todos os dispositivos testados variam de 0.165 (mínimo) a 636 (máximo) ms. » 24 % de todos os dispositivos são melhores. Isso significa que o tempo de resposta medido é melhor que a média de todos os dispositivos testados (30.9 ms). | ||
Cintilação da tela / PWM (modulação por largura de pulso)
| Tela tremeluzindo / PWM não detectado |  | ||
[pwm_comparison] Em comparação: 52 % de todos os dispositivos testados não usam PWM para escurecer a tela. Se PWM foi detectado, uma média de 7744 (mínimo: 5 - máximo: 343500) Hz foi medida. | |||
Cinebench R15: CPU Single 64Bit | CPU Multi 64Bit
Blender: v2.79 BMW27 CPU
7-Zip 18.03: 7z b 4 -mmt1 | 7z b 4
Geekbench 5.5: Single-Core | Multi-Core
HWBOT x265 Benchmark v2.2: 4k Preset
LibreOffice : 20 Documents To PDF
R Benchmark 2.5: Overall mean
| Cinebench R20 / CPU (Multi Core) | |
| Asus Zephyrus G14 GA401IV | |
| Eurocom Nightsky RX15 | |
| AMD Ryzen 1800X - Asus Crosshair VI Hero | |
| MSI GE65 Raider 9SF-049US | |
| Gigabyte Aero 17 HDR XB | |
| MSI GP65 10SFK-047US | |
| Média Intel Core i7-9750H (2017 - 3133, n=55) | |
| Schenker Key 16 | |
| MSI GF75 Thin 10SCXR | |
| MSI GF63 Thin 9SC | |
| MSI Alpha 15 A3DDK-034 | |
| Cinebench R20 / CPU (Single Core) | |
| Gigabyte Aero 17 HDR XB | |
| Asus Zephyrus G14 GA401IV | |
| Eurocom Nightsky RX15 | |
| MSI GE65 Raider 9SF-049US | |
| MSI GP65 10SFK-047US | |
| Média Intel Core i7-9750H (416 - 486, n=55) | |
| MSI GF75 Thin 10SCXR | |
| MSI GF63 Thin 9SC | |
| Schenker Key 16 | |
| AMD Ryzen 1800X - Asus Crosshair VI Hero | |
| MSI Alpha 15 A3DDK-034 | |
| Cinebench R15 / CPU Single 64Bit | |
| Gigabyte Aero 17 HDR XB | |
| Eurocom Nightsky RX15 | |
| MSI GE65 Raider 9SF-049US | |
| MSI GP65 Leopard 9SE-225US | |
| Asus Zephyrus G14 GA401IV | |
| MSI GP65 10SFK-047US | |
| Média Intel Core i7-9750H (170 - 194, n=82) | |
| MSI GF75 Thin 10SCXR | |
| MSI GF63 Thin 9SC | |
| Schenker Key 16 | |
| AMD Ryzen 1800X - Asus Crosshair VI Hero | |
| MSI Alpha 15 A3DDK-034 | |
| Cinebench R15 / CPU Multi 64Bit | |
| Asus Zephyrus G14 GA401IV | |
| Eurocom Nightsky RX15 | |
| Gigabyte Aero 17 HDR XB | |
| MSI GE65 Raider 9SF-049US | |
| AMD Ryzen 1800X - Asus Crosshair VI Hero | |
| MSI GP65 10SFK-047US | |
| MSI GP65 Leopard 9SE-225US | |
| Média Intel Core i7-9750H (952 - 1306, n=85) | |
| Schenker Key 16 | |
| MSI GF75 Thin 10SCXR | |
| MSI GF63 Thin 9SC | |
| MSI Alpha 15 A3DDK-034 | |
| Blender / v2.79 BMW27 CPU | |
| MSI GF75 Thin 10SCXR | |
| Eurocom Nightsky RX15 | |
| Média Intel Core i7-9750H (342 - 495, n=21) | |
| MSI GP65 10SFK-047US | |
| Gigabyte Aero 17 HDR XB | |
| Asus Zephyrus G14 GA401IV | |
| AMD Ryzen 1800X - Asus Crosshair VI Hero | |
| 7-Zip 18.03 / 7z b 4 -mmt1 | |
| Gigabyte Aero 17 HDR XB | |
| Eurocom Nightsky RX15 | |
| MSI GP65 10SFK-047US | |
| Média Intel Core i7-9750H (4580 - 5090, n=21) | |
| MSI GF75 Thin 10SCXR | |
| Asus Zephyrus G14 GA401IV | |
| 7-Zip 18.03 / 7z b 4 | |
| Asus Zephyrus G14 GA401IV | |
| Gigabyte Aero 17 HDR XB | |
| Eurocom Nightsky RX15 | |
| MSI GP65 10SFK-047US | |
| Média Intel Core i7-9750H (28512 - 35174, n=21) | |
| MSI GF75 Thin 10SCXR | |
| Geekbench 5.5 / Single-Core | |
| Gigabyte Aero 17 HDR XB | |
| Asus Zephyrus G14 GA401IV | |
| MSI GP65 10SFK-047US | |
| Média Intel Core i7-9750H (1117 - 1251, n=13) | |
| MSI GF75 Thin 10SCXR | |
| MSI Alpha 15 A3DDK-034 | |
| Geekbench 5.5 / Multi-Core | |
| Asus Zephyrus G14 GA401IV | |
| Gigabyte Aero 17 HDR XB | |
| MSI GP65 10SFK-047US | |
| Média Intel Core i7-9750H (4859 - 6262, n=13) | |
| MSI GF75 Thin 10SCXR | |
| MSI Alpha 15 A3DDK-034 | |
| HWBOT x265 Benchmark v2.2 / 4k Preset | |
| Eurocom Nightsky RX15 | |
| Asus Zephyrus G14 GA401IV | |
| Gigabyte Aero 17 HDR XB | |
| MSI GP65 10SFK-047US | |
| Média Intel Core i7-9750H (7.1 - 10.7, n=21) | |
| MSI GF75 Thin 10SCXR | |
| LibreOffice / 20 Documents To PDF | |
| MSI GP65 10SFK-047US | |
| Gigabyte Aero 17 HDR XB | |
| Média Intel Core i7-9750H (54.5 - 64.7, n=9) | |
| MSI GF75 Thin 10SCXR | |
| R Benchmark 2.5 / Overall mean | |
| MSI GF75 Thin 10SCXR | |
| Média Intel Core i7-9750H (0.608 - 0.695, n=14) | |
| MSI GP65 10SFK-047US | |
| Gigabyte Aero 17 HDR XB | |
* ... menor é melhor
| PCMark 10 | |
| Score | |
| MSI GP65 10SFK-047US | |
| MSI GP65 Leopard 9SE-225US | |
| Aorus 15-SA | |
| Asus Strix Scar III G531GW-AZ062T | |
| HP Omen 15-dc1303ng | |
| Asus TUF FX505DT-EB73 | |
| MSI GP62 7REX-1045US | |
| Essentials | |
| MSI GP65 10SFK-047US | |
| HP Omen 15-dc1303ng | |
| MSI GP65 Leopard 9SE-225US | |
| Aorus 15-SA | |
| Asus Strix Scar III G531GW-AZ062T | |
| Asus TUF FX505DT-EB73 | |
| MSI GP62 7REX-1045US | |
| Productivity | |
| MSI GP65 10SFK-047US | |
| MSI GP65 Leopard 9SE-225US | |
| Asus Strix Scar III G531GW-AZ062T | |
| HP Omen 15-dc1303ng | |
| Aorus 15-SA | |
| MSI GP62 7REX-1045US | |
| Asus TUF FX505DT-EB73 | |
| Digital Content Creation | |
| MSI GP65 10SFK-047US | |
| Aorus 15-SA | |
| Asus Strix Scar III G531GW-AZ062T | |
| MSI GP65 Leopard 9SE-225US | |
| HP Omen 15-dc1303ng | |
| Asus TUF FX505DT-EB73 | |
| MSI GP62 7REX-1045US | |
| PCMark 8 | |
| Home Score Accelerated v2 | |
| Aorus 15-SA | |
| HP Omen 15-dc1303ng | |
| Asus Strix Scar III G531GW-AZ062T | |
| MSI GP65 10SFK-047US | |
| MSI GP65 Leopard 9SE-225US | |
| MSI GP62 7REX-1045US | |
| Asus TUF FX505DT-EB73 | |
| Work Score Accelerated v2 | |
| Aorus 15-SA | |
| MSI GP65 10SFK-047US | |
| HP Omen 15-dc1303ng | |
| MSI GP65 Leopard 9SE-225US | |
| Asus Strix Scar III G531GW-AZ062T | |
| MSI GP62 7REX-1045US | |
| Asus TUF FX505DT-EB73 | |
| PCMark 8 Home Score Accelerated v2 | 4516 pontos | |
| PCMark 8 Work Score Accelerated v2 | 5894 pontos | |
| PCMark 10 Score | 6254 pontos | |
Ajuda | ||
| DPC Latencies / LatencyMon - interrupt to process latency (max), Web, Youtube, Prime95 | |
| MSI GP65 10SFK-047US | |
* ... menor é melhor
| MSI GP65 10SFK-047US Samsung SSD PM981 MZVLB1T0HALR | Asus Strix Scar III G531GW-AZ062T Intel SSD 660p SSDPEKNW512G8 | Asus TUF FX505DT-EB73 Intel SSD 660p SSDPEKNW512G8 | HP Omen 15-dc1303ng Samsung SSD PM981 MZVLB256HAHQ | MSI GP62 7REX-1045US Toshiba NVMe THNSN5128GP | MSI GP65 Leopard 9SE-225US Toshiba KBG30ZMT512G | |
|---|---|---|---|---|---|---|
| AS SSD | -79% | -46% | -19% | -49% | -94% | |
| Seq Read (MB/s) | 2066 | 1163 -44% | 1019 -51% | 2485 20% | 1848 -11% | 1307 -37% |
| Seq Write (MB/s) | 2418 | 919 -62% | 889 -63% | 1575 -35% | 601 -75% | 730 -70% |
| 4K Read (MB/s) | 54.2 | 48.88 -10% | 48.22 -11% | 53.4 -1% | 35.84 -34% | 27.58 -49% |
| 4K Write (MB/s) | 129 | 90.1 -30% | 115.5 -10% | 113.5 -12% | 112 -13% | 80.3 -38% |
| 4K-64 Read (MB/s) | 1865 | 323.8 -83% | 321.5 -83% | 725 -61% | 628 -66% | 878 -53% |
| 4K-64 Write (MB/s) | 1878 | 403.8 -78% | 787 -58% | 1371 -27% | 428.2 -77% | 246.8 -87% |
| Access Time Read * (ms) | 0.042 | 0.24 -471% | 0.065 -55% | 0.059 -40% | 0.079 -88% | 0.231 -450% |
| Access Time Write * (ms) | 0.091 | 0.046 49% | 0.047 48% | 0.032 65% | 0.034 63% | 0.223 -145% |
| Score Read (Points) | 2126 | 489 -77% | 472 -78% | 1027 -52% | 849 -60% | 1036 -51% |
| Score Write (Points) | 2249 | 586 -74% | 992 -56% | 1642 -27% | 600 -73% | 400 -82% |
| Score Total (Points) | 5482 | 1332 -76% | 1717 -69% | 3163 -42% | 1829 -67% | 1940 -65% |
| Copy ISO MB/s (MB/s) | 2927 | 1269 -57% | 942 -68% | 1128 -61% | 993 -66% | |
| Copy Program MB/s (MB/s) | 728 | 452.8 -38% | 444.5 -39% | 326.3 -55% | 309.5 -57% | |
| Copy Game MB/s (MB/s) | 1614 | 755 -53% | 867 -46% | 442.8 -73% | 582 -64% | |
| CrystalDiskMark 5.2 / 6 | -34% | -33% | -27% | -25% | -33% | |
| Write 4K (MB/s) | 145 | 133.3 -8% | 137.5 -5% | 50.2 -65% | 158.4 9% | 99.3 -32% |
| Read 4K (MB/s) | 46.84 | 55.3 18% | 57 22% | 35.32 -25% | 45.04 -4% | 46.96 0% |
| Write Seq (MB/s) | 2377 | 980 -59% | 984 -59% | 991 -58% | 622 -74% | |
| Read Seq (MB/s) | 2185 | 1406 -36% | 1564 -28% | 1526 -30% | 1592 -27% | |
| Write 4K Q32T1 (MB/s) | 463.5 | 286.3 -38% | 237.4 -49% | 445.1 -4% | 434.2 -6% | 240.1 -48% |
| Read 4K Q32T1 (MB/s) | 527 | 331.5 -37% | 340.7 -35% | 526 0% | 590 12% | 581 10% |
| Write Seq Q32T1 (MB/s) | 2395 | 976 -59% | 959 -60% | 1647 -31% | 630 -74% | 686 -71% |
| Read Seq Q32T1 (MB/s) | 3470 | 1520 -56% | 1732 -50% | 3427 -1% | 2108 -39% | 1581 -54% |
| Write 4K Q8T8 (MB/s) | 748 | 268.1 | ||||
| Read 4K Q8T8 (MB/s) | 344.6 | 977 | ||||
| Média Total (Programa/Configurações) | -57% /
-63% | -40% /
-41% | -23% /
-22% | -37% /
-41% | -64% /
-75% |
* ... menor é melhor

| 3DMark 11 | |
| 1280x720 Performance GPU | |
| MSI RTX 2080 Ti Gaming X Trio | |
| Eurocom Sky X4C i9-9900KS | |
| Zotac GeForce RTX 2070 AMP Extreme | |
| Acer Predator Triton 500 PT515-52-70N3 | |
| MSI GP65 10SFK-047US | |
| Média NVIDIA GeForce RTX 2070 Mobile (23335 - 27298, n=21) | |
| Dell G7 17 7790 | |
| MSI GP65 Leopard 9SE-225US | |
| Aorus 15-SA | |
| MSI Alpha 15 A3DDK-034 | |
| HP Omen 15-dc1303ng | |
| Asus TUF FX505DT-EB73 | |
| MSI GP62 7REX-1045US | |
| 1280x720 Performance Combined | |
| Eurocom Sky X4C i9-9900KS | |
| MSI RTX 2080 Ti Gaming X Trio | |
| Zotac GeForce RTX 2070 AMP Extreme | |
| MSI GP65 10SFK-047US | |
| MSI GP65 Leopard 9SE-225US | |
| Acer Predator Triton 500 PT515-52-70N3 | |
| Média NVIDIA GeForce RTX 2070 Mobile (8716 - 16364, n=21) | |
| Aorus 15-SA | |
| HP Omen 15-dc1303ng | |
| Dell G7 17 7790 | |
| MSI Alpha 15 A3DDK-034 | |
| MSI GP62 7REX-1045US | |
| Asus TUF FX505DT-EB73 | |
| 3DMark 06 Standard Score | 39513 pontos | |
| 3DMark 11 Performance | 21386 pontos | |
| 3DMark Cloud Gate Standard Score | 39359 pontos | |
| 3DMark Fire Strike Score | 17768 pontos | |
| 3DMark Time Spy Score | 7404 pontos | |
Ajuda | ||
| Shadow of the Tomb Raider | |
| 1280x720 Lowest Preset | |
| Eurocom Sky X4C i9-9900KS | |
| MSI GF65 9SD | |
| MSI GP65 10SFK-047US | |
| Walmart EVOO Gaming 17 | |
| MSI RTX 2080 Gaming X Trio | |
| Média NVIDIA GeForce RTX 2070 Mobile (91.3 - 160, n=9) | |
| Asus G752VS | |
| Alienware 17 R4 | |
| 1920x1080 Medium Preset | |
| Eurocom Sky X4C i9-9900KS | |
| MSI RTX 2080 Gaming X Trio | |
| MSI GP65 10SFK-047US | |
| Média NVIDIA GeForce RTX 2070 Mobile (86 - 114, n=10) | |
| Walmart EVOO Gaming 17 | |
| Asus G752VS | |
| Alienware 17 R4 | |
| MSI GF65 9SD | |
| 1920x1080 Highest Preset AA:T | |
| Eurocom Sky X4C i9-9900KS | |
| MSI RTX 2080 Gaming X Trio | |
| MSI GP65 10SFK-047US | |
| Média NVIDIA GeForce RTX 2070 Mobile (74.2 - 97, n=11) | |
| Walmart EVOO Gaming 17 | |
| Alienware 17 R4 | |
| Asus G752VS | |
| MSI GF65 9SD | |
| The Witcher 3 | |
| 1024x768 Low Graphics & Postprocessing | |
| Eurocom Sky X4C i9-9900KS | |
| MSI GP65 10SFK-047US | |
| MSI RTX 2080 Gaming X Trio | |
| Walmart EVOO Gaming 17 | |
| Média NVIDIA GeForce RTX 2070 Mobile (193.9 - 357, n=12) | |
| MSI GF65 9SD | |
| 1366x768 Medium Graphics & Postprocessing | |
| Eurocom Sky X4C i9-9900KS | |
| MSI RTX 2080 Gaming X Trio | |
| MSI GP65 10SFK-047US | |
| Média NVIDIA GeForce RTX 2070 Mobile (154 - 250, n=12) | |
| Walmart EVOO Gaming 17 | |
| MSI GF65 9SD | |
| 1920x1080 High Graphics & Postprocessing (Nvidia HairWorks Off) | |
| MSI RTX 2080 Gaming X Trio | |
| Eurocom Sky X4C i9-9900KS | |
| MSI GP65 10SFK-047US | |
| Média NVIDIA GeForce RTX 2070 Mobile (115.7 - 160.8, n=17) | |
| Walmart EVOO Gaming 17 | |
| MSI GF65 9SD | |
| 1920x1080 Ultra Graphics & Postprocessing (HBAO+) | |
| MSI RTX 2080 Gaming X Trio | |
| Eurocom Sky X4C i9-9900KS | |
| MSI GP65 10SFK-047US | |
| Média NVIDIA GeForce RTX 2070 Mobile (64 - 82.1, n=21) | |
| Walmart EVOO Gaming 17 | |
| MSI GF65 9SD | |
| baixo | média | alto | ultra | |
|---|---|---|---|---|
| BioShock Infinite (2013) | 352 | 316 | 288.9 | 164.6 |
| The Witcher 3 (2015) | 326.4 | 244.5 | 160.8 | 82.1 |
| Dota 2 Reborn (2015) | 152 | 139 | 128 | 120 |
| X-Plane 11.11 (2018) | 102 | 91.7 | 77.5 | |
| Shadow of the Tomb Raider (2018) | 135 | 107 | 102 | 93 |
| MSI GP65 10SFK-047US GeForce RTX 2070 Mobile, i7-10750H, Samsung SSD PM981 MZVLB1T0HALR | Asus Strix Scar III G531GW-AZ062T GeForce RTX 2070 Mobile, i7-9750H, Intel SSD 660p SSDPEKNW512G8 | Asus TUF FX505DT-EB73 GeForce GTX 1650 Mobile, R7 3750H, Intel SSD 660p SSDPEKNW512G8 | HP Omen 15-dc1303ng GeForce RTX 2070 Max-Q, i7-8750H, Samsung SSD PM981 MZVLB256HAHQ | MSI GP62 7REX-1045US GeForce GTX 1050 Ti Mobile, i7-7700HQ, Toshiba NVMe THNSN5128GP | MSI GP65 Leopard 9SE-225US GeForce RTX 2060 Mobile, i7-9750H, Toshiba KBG30ZMT512G | |
|---|---|---|---|---|---|---|
| Noise | 5% | 10% | 3% | 7% | 12% | |
| desligado / ambiente * (dB) | 29.3 | 30 -2% | 28.2 4% | 30.5 -4% | 28 4% | 28.2 4% |
| Idle Minimum * (dB) | 31.9 | 30.6 4% | 28.2 12% | 32.8 -3% | 32.2 -1% | 29.5 8% |
| Idle Average * (dB) | 31.9 | 30.6 4% | 28.2 12% | 32.8 -3% | 32.2 -1% | 29.6 7% |
| Idle Maximum * (dB) | 33.5 | 37.7 -13% | 31.4 6% | 32.8 2% | 32.2 4% | 29.6 12% |
| Load Average * (dB) | 47 | 36.5 22% | 39.8 15% | 42.5 10% | 40.9 13% | 33 30% |
| Witcher 3 ultra * (dB) | 53.8 | 52.1 3% | 47 13% | 45.4 16% | 47.2 12% | |
| Load Maximum * (dB) | 56.7 | 48.1 15% | 50.2 11% | 47.5 16% | 48.6 14% | 52 8% |
* ... menor é melhor
Barulho
| Ocioso |
| 31.9 / 31.9 / 33.5 dB |
| Carga |
| 47 / 56.7 dB |
 | ||
30 dB silencioso 40 dB(A) audível 50 dB(A) ruidosamente alto |
||
min: | ||
(-) A temperatura máxima no lado superior é 49.4 °C / 121 F, em comparação com a média de 40.4 °C / 105 F , variando de 21.2 a 68.8 °C para a classe Gaming.
(-) A parte inferior aquece até um máximo de 57.2 °C / 135 F, em comparação com a média de 43.2 °C / 110 F
(+) Em uso inativo, a temperatura média para o lado superior é 30.6 °C / 87 F, em comparação com a média do dispositivo de 33.9 °C / ### class_avg_f### F.
(±) Jogando The Witcher 3, a temperatura média para o lado superior é 34.3 °C / 94 F, em comparação com a média do dispositivo de 33.9 °C / ## #class_avg_f### F.
(+) Os apoios para as mãos e o touchpad são mais frios que a temperatura da pele, com um máximo de 30.8 °C / 87.4 F e, portanto, são frios ao toque.
(±) A temperatura média da área do apoio para as mãos de dispositivos semelhantes foi 28.8 °C / 83.8 F (-2 °C / -3.6 F).
MSI GP65 10SFK-047US análise de áudio
(+) | os alto-falantes podem tocar relativamente alto (###valor### dB)
Graves 100 - 315Hz
(-) | quase nenhum baixo - em média 28.5% menor que a mediana
(+) | o baixo é linear (6.2% delta para a frequência anterior)
Médios 400 - 2.000 Hz
(±) | médios reduzidos - em média 8.2% menor que a mediana
(±) | a linearidade dos médios é média (9.1% delta para frequência anterior)
Altos 2 - 16 kHz
(+) | agudos equilibrados - apenas 1.8% longe da mediana
(+) | os máximos são lineares (4% delta da frequência anterior)
Geral 100 - 16.000 Hz
(±) | a linearidade do som geral é média (23.5% diferença em relação à mediana)
Comparado com a mesma classe
» 85% de todos os dispositivos testados nesta classe foram melhores, 5% semelhantes, 10% piores
» O melhor teve um delta de 6%, a média foi 18%, o pior foi 132%
Comparado com todos os dispositivos testados
» 70% de todos os dispositivos testados foram melhores, 6% semelhantes, 24% piores
» O melhor teve um delta de 4%, a média foi 23%, o pior foi 134%
Apple MacBook 12 (Early 2016) 1.1 GHz análise de áudio
(+) | os alto-falantes podem tocar relativamente alto (###valor### dB)
Graves 100 - 315Hz
(±) | graves reduzidos - em média 11.3% menor que a mediana
(±) | a linearidade dos graves é média (14.2% delta para a frequência anterior)
Médios 400 - 2.000 Hz
(+) | médios equilibrados - apenas 2.4% longe da mediana
(+) | médios são lineares (5.5% delta para frequência anterior)
Altos 2 - 16 kHz
(+) | agudos equilibrados - apenas 2% longe da mediana
(+) | os máximos são lineares (4.5% delta da frequência anterior)
Geral 100 - 16.000 Hz
(+) | o som geral é linear (10.2% diferença em relação à mediana)
Comparado com a mesma classe
» 7% de todos os dispositivos testados nesta classe foram melhores, 2% semelhantes, 90% piores
» O melhor teve um delta de 5%, a média foi 18%, o pior foi 53%
Comparado com todos os dispositivos testados
» 5% de todos os dispositivos testados foram melhores, 1% semelhantes, 94% piores
» O melhor teve um delta de 4%, a média foi 23%, o pior foi 134%
| desligado | |
| Ocioso | |
| Carga |
|
Key:
min: | |
| MSI GP65 10SFK-047US i7-10750H, GeForce RTX 2070 Mobile, Samsung SSD PM981 MZVLB1T0HALR, IPS, 1920x1080, 15.6" | Asus Strix Scar III G531GW-AZ062T i7-9750H, GeForce RTX 2070 Mobile, Intel SSD 660p SSDPEKNW512G8, IPS, 1920x1080, 15.6" | HP Omen 15-dc1303ng i7-8750H, GeForce RTX 2070 Max-Q, Samsung SSD PM981 MZVLB256HAHQ, IPS, 1920x1080, 15.6" | MSI GP62 7REX-1045US i7-7700HQ, GeForce GTX 1050 Ti Mobile, Toshiba NVMe THNSN5128GP, TN LED, 1920x1080, 15.6" | Aorus 15-SA i7-9750H, GeForce GTX 1660 Ti Mobile, Intel SSD 760p SSDPEKKW512G8, IPS, 1920x1080, 15.6" | MSI GP65 Leopard 9SE-225US i7-9750H, GeForce RTX 2060 Mobile, Toshiba KBG30ZMT512G, IPS, 1920x1080, 15.6" | Schenker XMG Pro 15 i7-9750H, GeForce RTX 2070 Mobile, Samsung SSD 970 EVO Plus 500GB, IPS, 1920x1080, 15.6" | |
|---|---|---|---|---|---|---|---|
| Power Consumption | 11% | 12% | 22% | -4% | 8% | -4% | |
| Idle Minimum * (Watt) | 14.2 | 11.4 20% | 14.7 -4% | 14.6 -3% | 20 -41% | 13.6 4% | 15 -6% |
| Idle Average * (Watt) | 18.8 | 13.5 28% | 18.6 1% | 17.2 9% | 23 -22% | 17.9 5% | 19 -1% |
| Idle Maximum * (Watt) | 23.9 | 21.6 10% | 22.6 5% | 17.3 28% | 29 -21% | 20.6 14% | 26 -9% |
| Load Average * (Watt) | 96.9 | 106 -9% | 90 7% | 82.7 15% | 87 10% | 96 1% | 101 -4% |
| Witcher 3 ultra * (Watt) | 185 | 186 -1% | 107 42% | 136 26% | 154.6 16% | 177 4% | |
| Load Maximum * (Watt) | 233.4 | 196 16% | 120 49% | 136.7 41% | 173 26% | 218.6 6% | 245 -5% |
* ... menor é melhor
| MSI GP65 10SFK-047US i7-10750H, GeForce RTX 2070 Mobile, 51 Wh | Asus Strix Scar III G531GW-AZ062T i7-9750H, GeForce RTX 2070 Mobile, 66 Wh | Asus TUF FX505DT-EB73 R7 3750H, GeForce GTX 1650 Mobile, 48 Wh | HP Omen 15-dc1303ng i7-8750H, GeForce RTX 2070 Max-Q, 70 Wh | MSI GP62 7REX-1045US i7-7700HQ, GeForce GTX 1050 Ti Mobile, 41 Wh | Aorus 15-SA i7-9750H, GeForce GTX 1660 Ti Mobile, 62 Wh | MSI GP65 Leopard 9SE-225US i7-9750H, GeForce RTX 2060 Mobile, 51 Wh | |
|---|---|---|---|---|---|---|---|
| Duração da bateria | 51% | 30% | -11% | -22% | -24% | 5% | |
| WiFi v1.3 (h) | 3.7 | 5.6 51% | 4.8 30% | 3.3 -11% | 2.9 -22% | 2.8 -24% | 3.9 5% |
| Reader / Idle (h) | 7.8 | 5 | 4.3 | 3.5 | 6 | ||
| Load (h) | 1.5 | 1.2 | 0.7 | 2 | 1.1 |
Pro
Contra

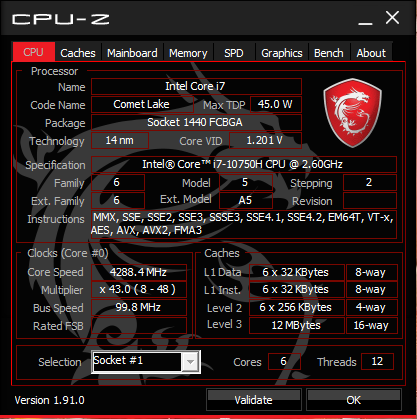
Na série Comet Lake-U, as diferenças de desempenho entre gerações e a série Whiskey Lake-U de saída são mínimas, a menos que você opte pelo Comet Lake-U Core i7-10710U de gama alta. Caso contrário, opções menores como o Core i7-10510U terão o mesmo desempenho que o Core i7-8565U mais antigo.
O mesmo pode ser dito para a série Comet Lake-H. O Core i7-10750H se desempenha muito próximo do Core i7-9750H até o ponto em que qualquer diferença seria imperceptível, especialmente se os jogos têm maior probabilidade de vincular à GPU do que à CPU. Em vez disso, os usuários podem considerar a mais avançada opção Core i7-10875H para quaisquer ganhos brutos significativos de desempenho em relação ao Core i7-9750H.
Embora não sejam as notícias que a maioria dos entusiastas gostam de ouvir, são boas notícias para os jogadores que desejam atualizar seus portáteis antigos. O fato de o Comet Lake-H de 10ª geração ser apenas marginalmente mais rápido que o Coffee Lake-H de 9ª geração no nível SKU de gama média significa que você pode atualizar para um portátil de jogos Intel de 9ª geração e ainda obter essencialmente a mesma experiência de jogo que um modelo mais caro Intel de 10a geração. O dinheiro economizado pode ser usado para atualizar outros aspectos mais tangíveis do portátil, como tela ou RAM, ou mesmo um modelo melhor como o MSI GS65, GE65, ou GS65.
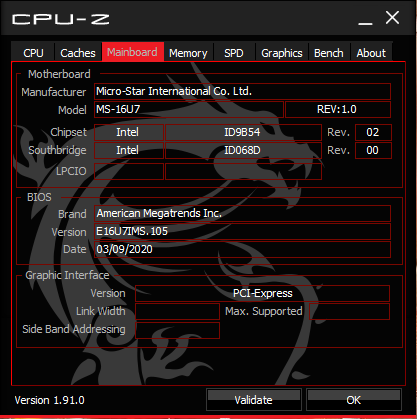
O MSI GP65 10SFK é o mesmo portátil que o GP65 9SE do ano passado, mas com um processador um pouco mais rápido e mais novo. Os usuários não perderão nenhum recurso interessante ou enormes vantagens de desempenho ao usar uma CPU Coffee Lake-H.
MSI GP65 10SFK-047US
- 05/06/2020 v7 (old)
Allen Ngo
Price comparison
