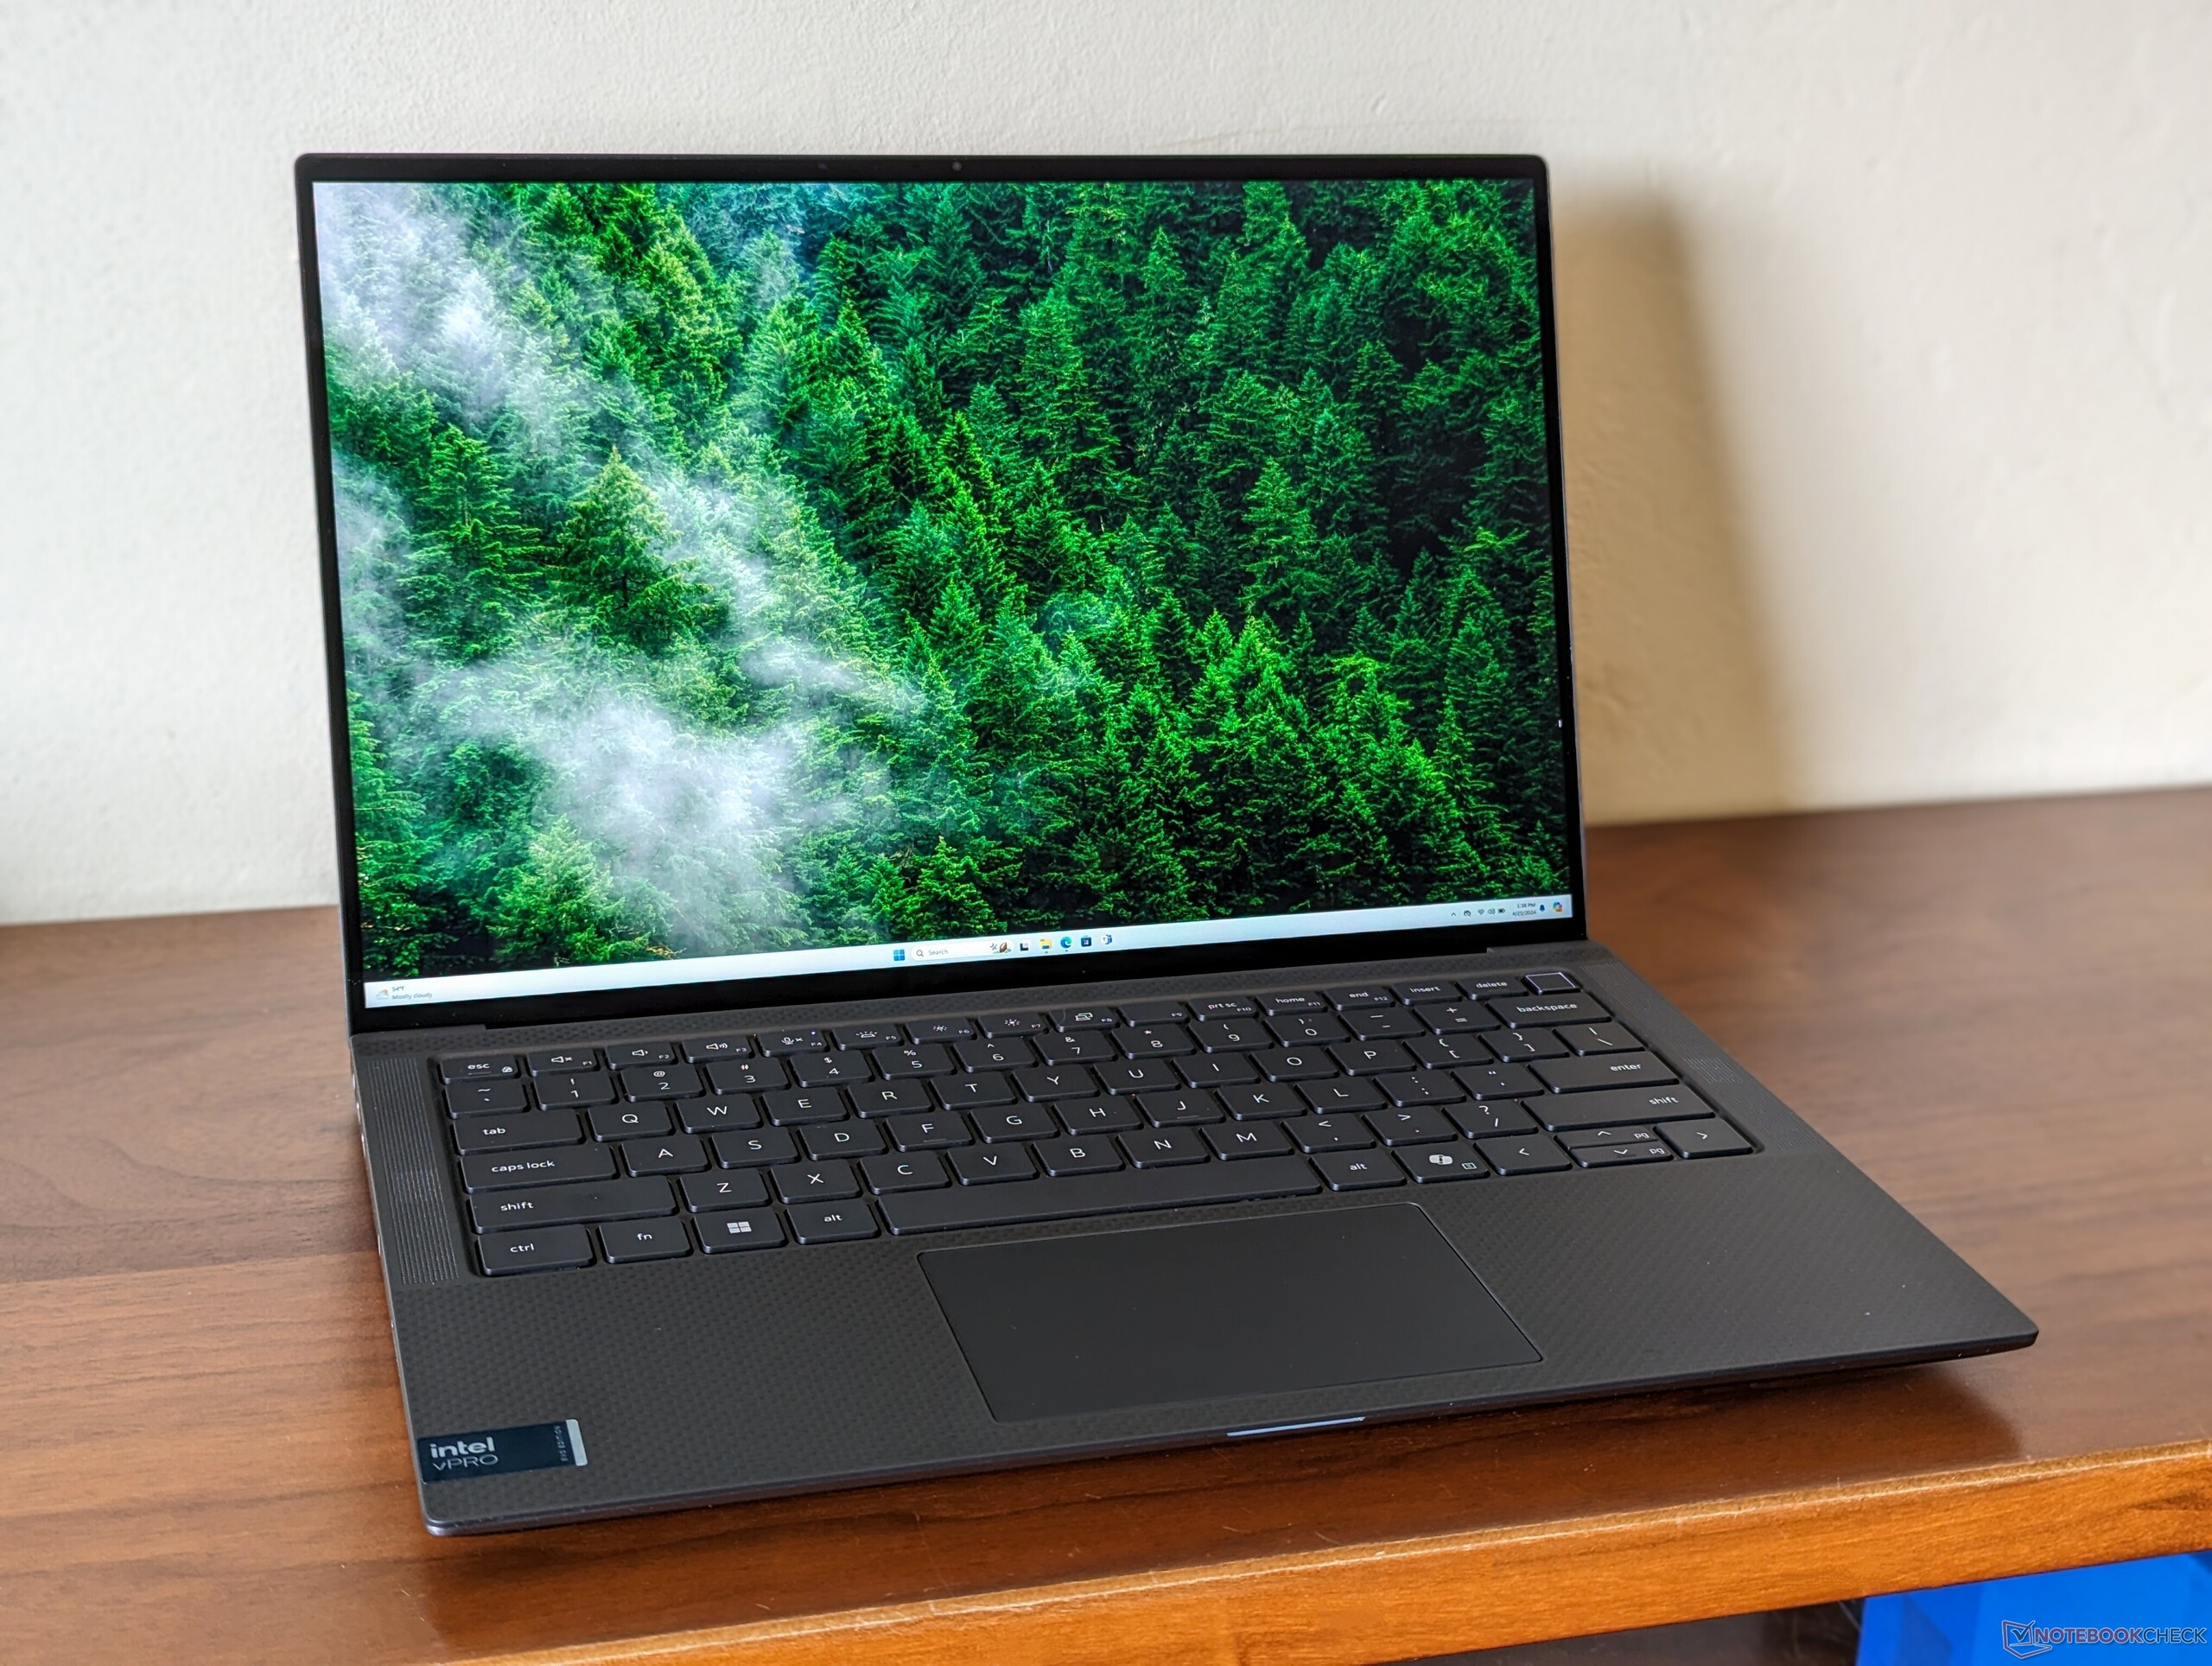
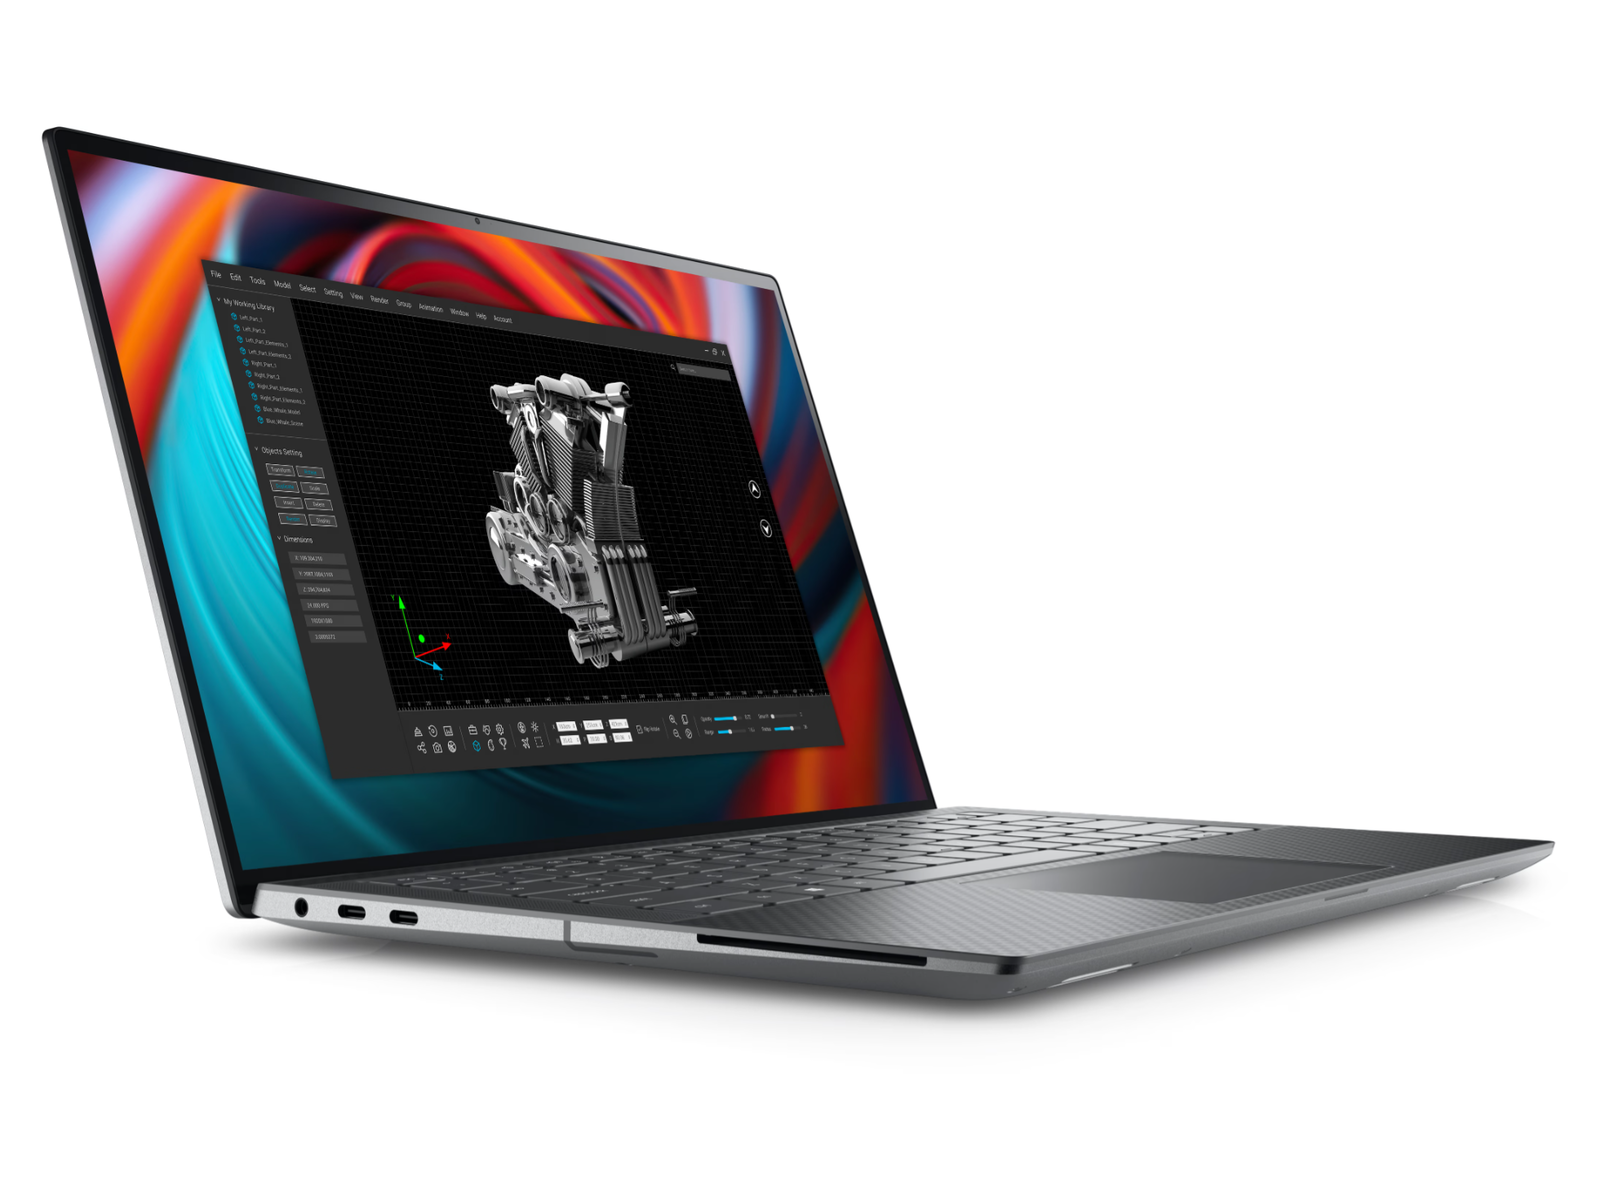
Análise da estação de trabalho Dell Precision 5490: Agora com Intel Meteor Lake-H vPro

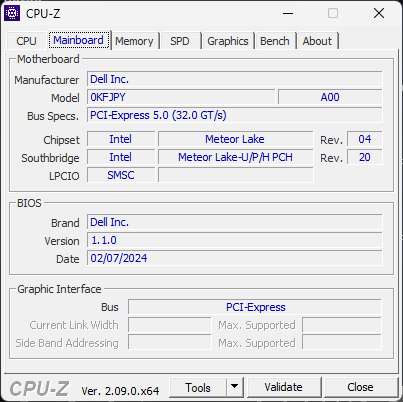
O 2024 Precision 5490 é uma atualização do Precision 5480 do ano passado. O modelo mais recente utiliza o mesmo design de chassi dos modelos Precision 5480 e 5470 o que significa que todos os nossos comentários existentes sobre os recursos físicos do Precision 5470 ainda se aplicam ao 5490.
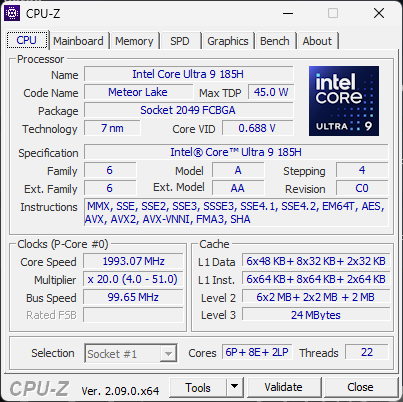
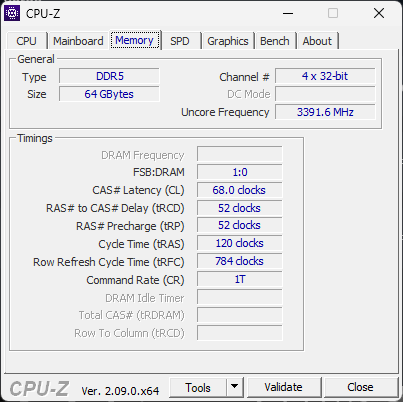
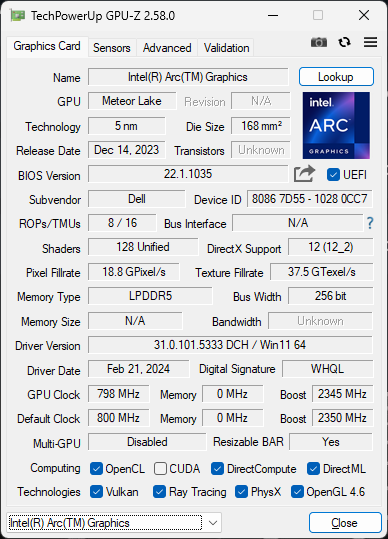
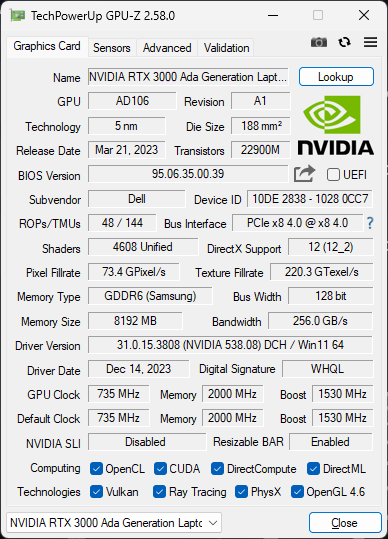
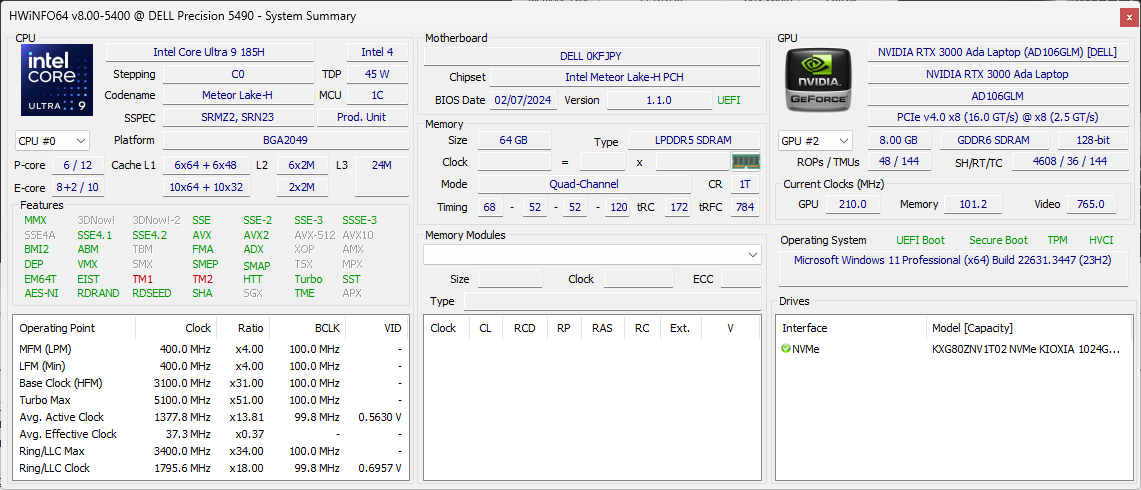
Nossa unidade de teste é a configuração de ponta com a CPU Meteor Lake-H Core Ultra 9 185H para substituir as opções Raptor Lake-H do ano passado. Fora isso, todo o resto permanece igual, incluindo a tela sensível ao toque IPS QHD+ 2560 x 1600 e a GPU Nvidia RTX 3000 Ada de 50 W. SKUs menores podem ser fornecidas com o Core Ultra 5 135H, tela FHD+ 1920 x 1200 e apenas gráficos Arc integrados.
Os concorrentes diretos do Precision 5490 incluem outras estações de trabalho ultraportáteis de 14 polegadas, como o Lenovo ThinkPad P14s ou o HP ZBook Firefly 14 G10.
Mais análises da Dell:
Possíveis concorrentes em comparação
Avaliação | Data | Modelo | Peso | Altura | Size | Resolução | Preço |
|---|---|---|---|---|---|---|---|
| 89.3 % v7 (old) | 04/2024 | Dell Precision 5000 5490 Ultra 9 185H, RTX 3000 Ada Generation Laptop | 1.6 kg | 18.95 mm | 14.00" | 2560x1600 | |
| 81 % | 07/2024 | Lenovo ThinkPad P14s G4 21HF0017GE i7-1370P, RTX A500 Laptop GPU | 1.5 kg | 22.7 mm | 14.00" | 2880x1800 | |
| 87.4 % v7 (old) | 10/2023 | HP ZBook Firefly 14 G10 A R5 PRO 7640HS, Radeon 760M | 1.5 kg | 20 mm | 14.00" | 1920x1200 | |
| 87.4 % v7 (old) | HP ZBook Firefly 14 G9-6B8A2EA i7-1265U, T550 Laptop GPU | 1.5 kg | 19.9 mm | 14.00" | 1920x1200 | ||
| 89.6 % v7 (old) | 09/2023 | Dell Precision 5480 i9-13900H, RTX 3000 Ada Generation Laptop | 1.6 kg | 18.95 mm | 14.00" | 2560x1600 | |
| 87.6 % v7 (old) | 09/2022 | Dell Precision 5000 5470 i9-12900H, RTX A1000 Laptop GPU | 1.6 kg | 18.95 mm | 14.00" | 2560x1600 |
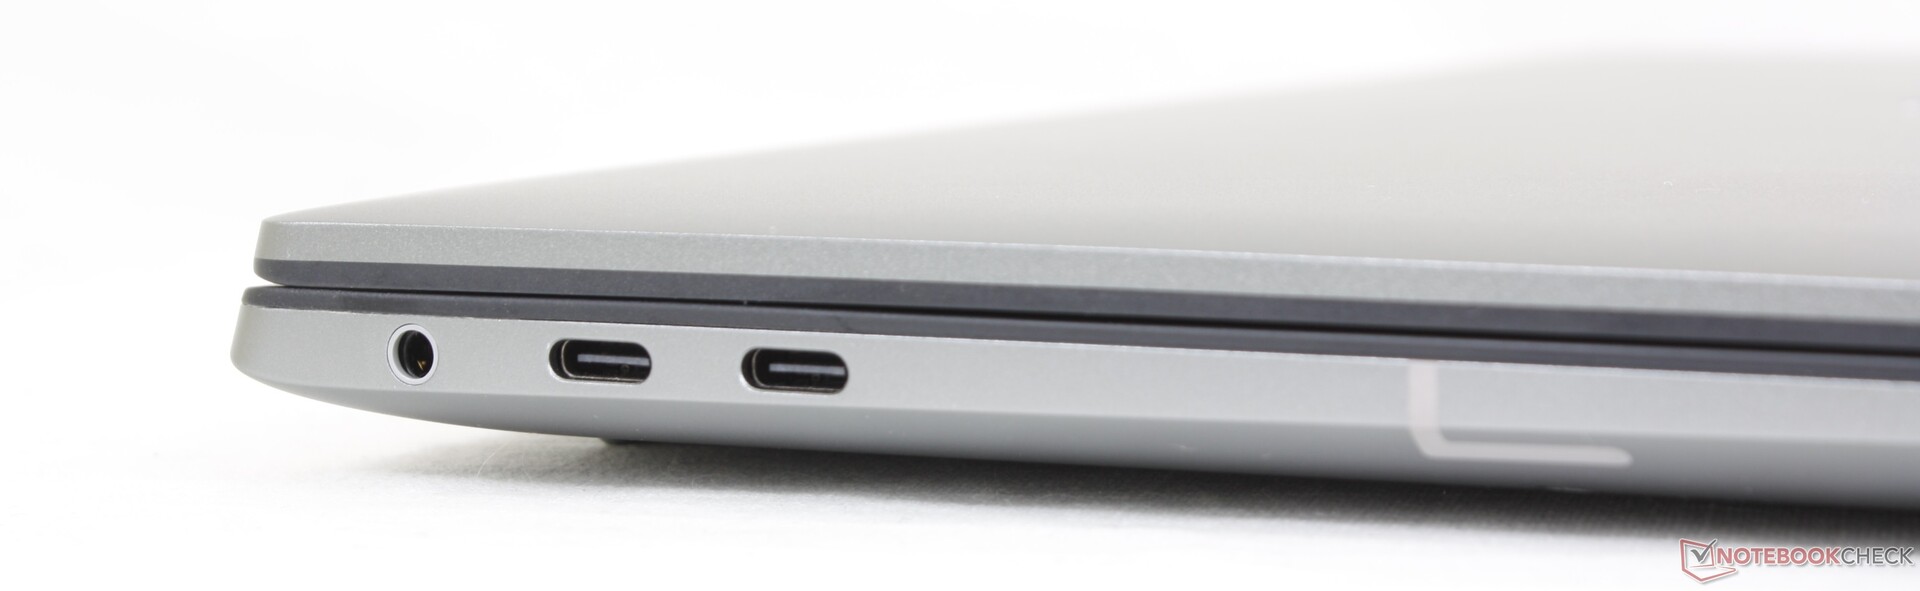
Case - Inspired By XPS
A maneira mais fácil de distinguir visualmente o Precision 5490 do Precision 5480 ou 5470 é procurar a nova tecla Co-Pilot no teclado. A Microsoft está exigindo essa tecla dedicada de todos os principais fabricantes no futuro para oferecer melhor suporte aos próximos recursos de IA do Windows. Fora isso, não há outras alterações no chassi. Recomendamos conferir nossa análise do Precision 5470 para obter mais informações.
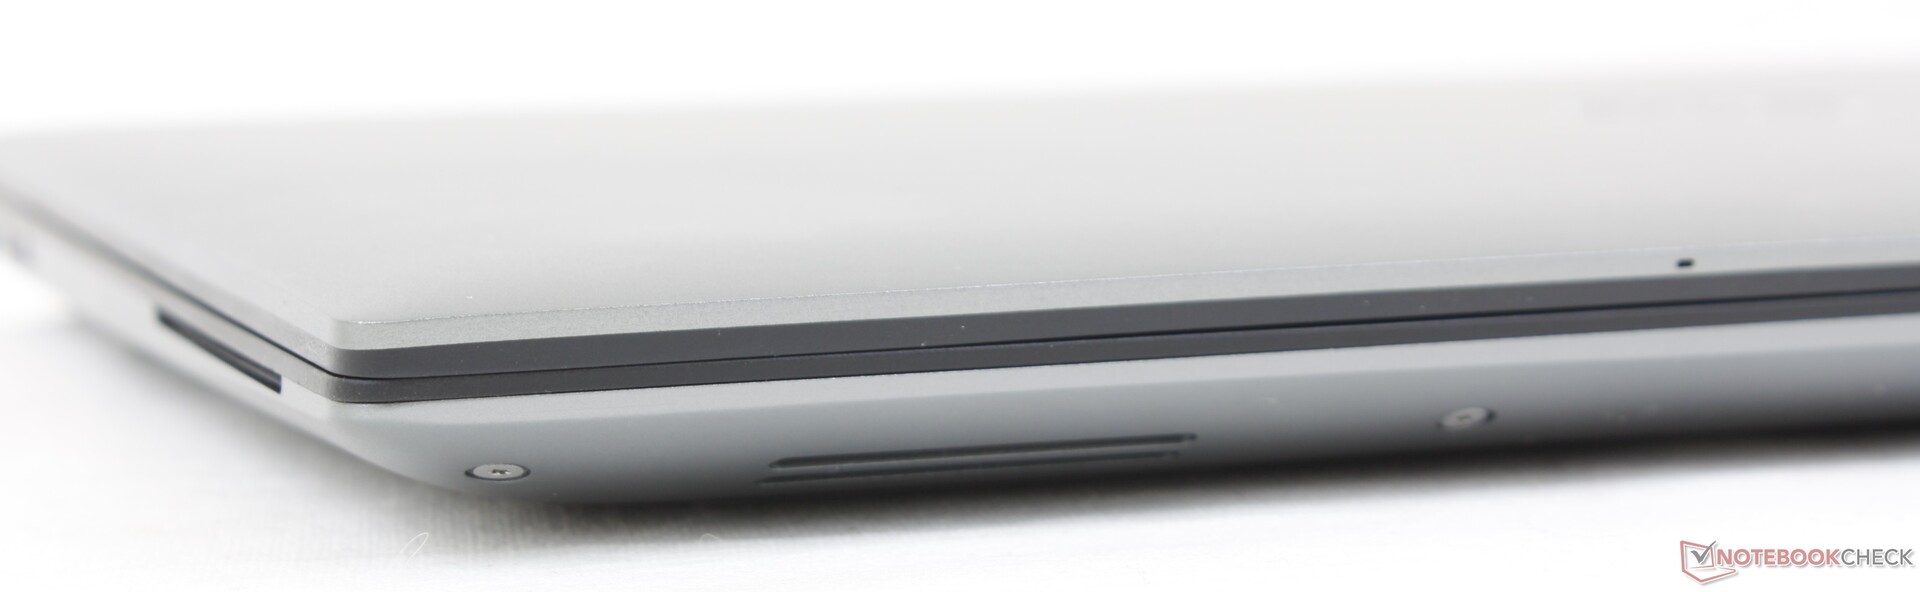
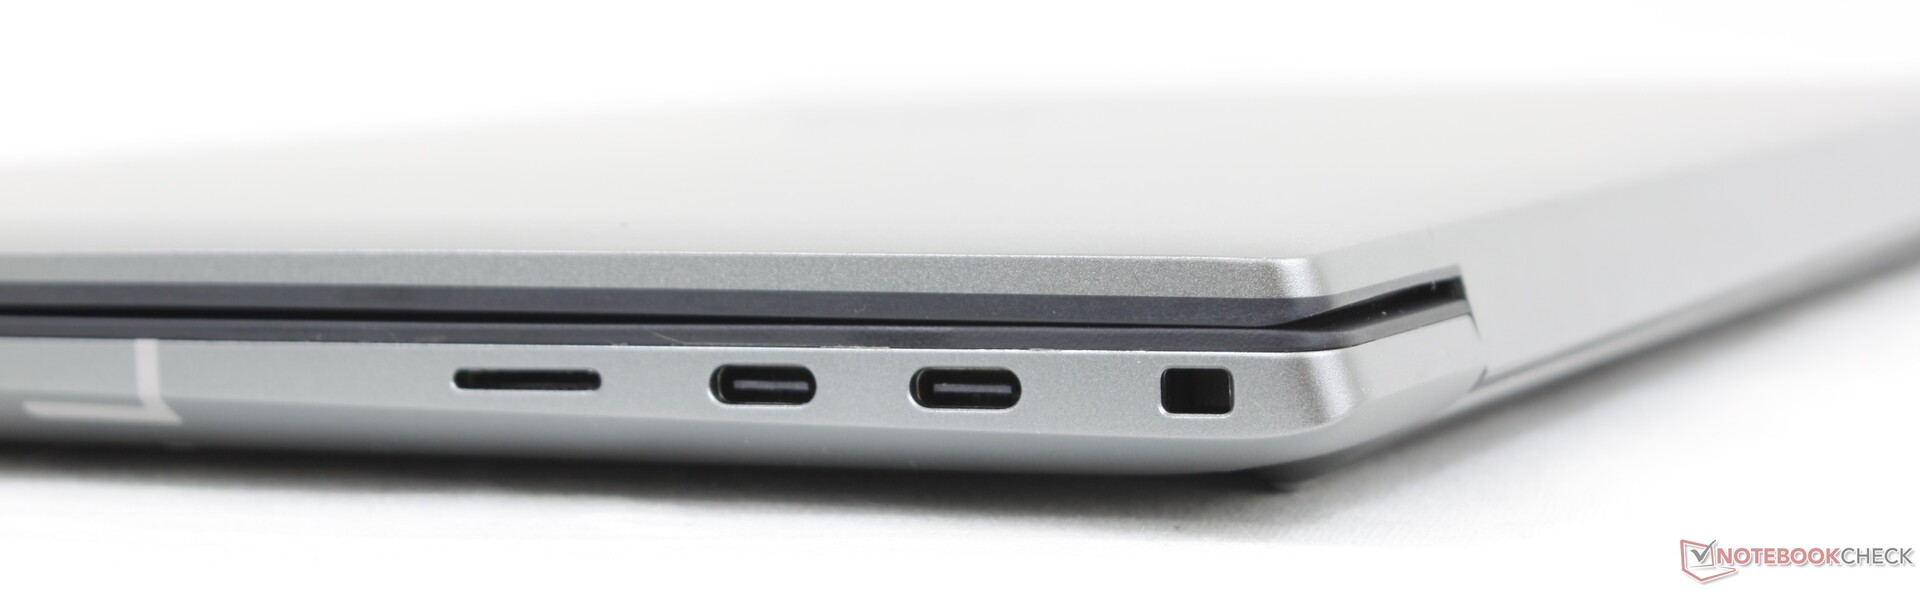
Observe que o leitor de cartão MicroSD continua sendo opcional.
Conectividade
Comunicação
O modelo deste ano inclui o Intel BE200 para ser compatível com Wi-Fi 7.
| Networking | |
| iperf3 transmit AXE11000 | |
| Dell Precision 5480 | |
| Dell Precision 5000 5490 | |
| HP ZBook Firefly 14 G10 A | |
| Lenovo ThinkPad P14s G4 21HF0017GE | |
| iperf3 receive AXE11000 | |
| HP ZBook Firefly 14 G10 A | |
| Lenovo ThinkPad P14s G4 21HF0017GE | |
| Dell Precision 5480 | |
| Dell Precision 5000 5490 | |
| iperf3 transmit AXE11000 6GHz | |
| Dell Precision 5000 5490 | |
| Dell Precision 5480 | |
| Dell Precision 5000 5470 | |
| Lenovo ThinkPad P14s G4 21HF0017GE | |
| iperf3 receive AXE11000 6GHz | |
| Lenovo ThinkPad P14s G4 21HF0017GE | |
| Dell Precision 5000 5490 | |
| Dell Precision 5480 | |
| Dell Precision 5000 5470 | |
Webcam


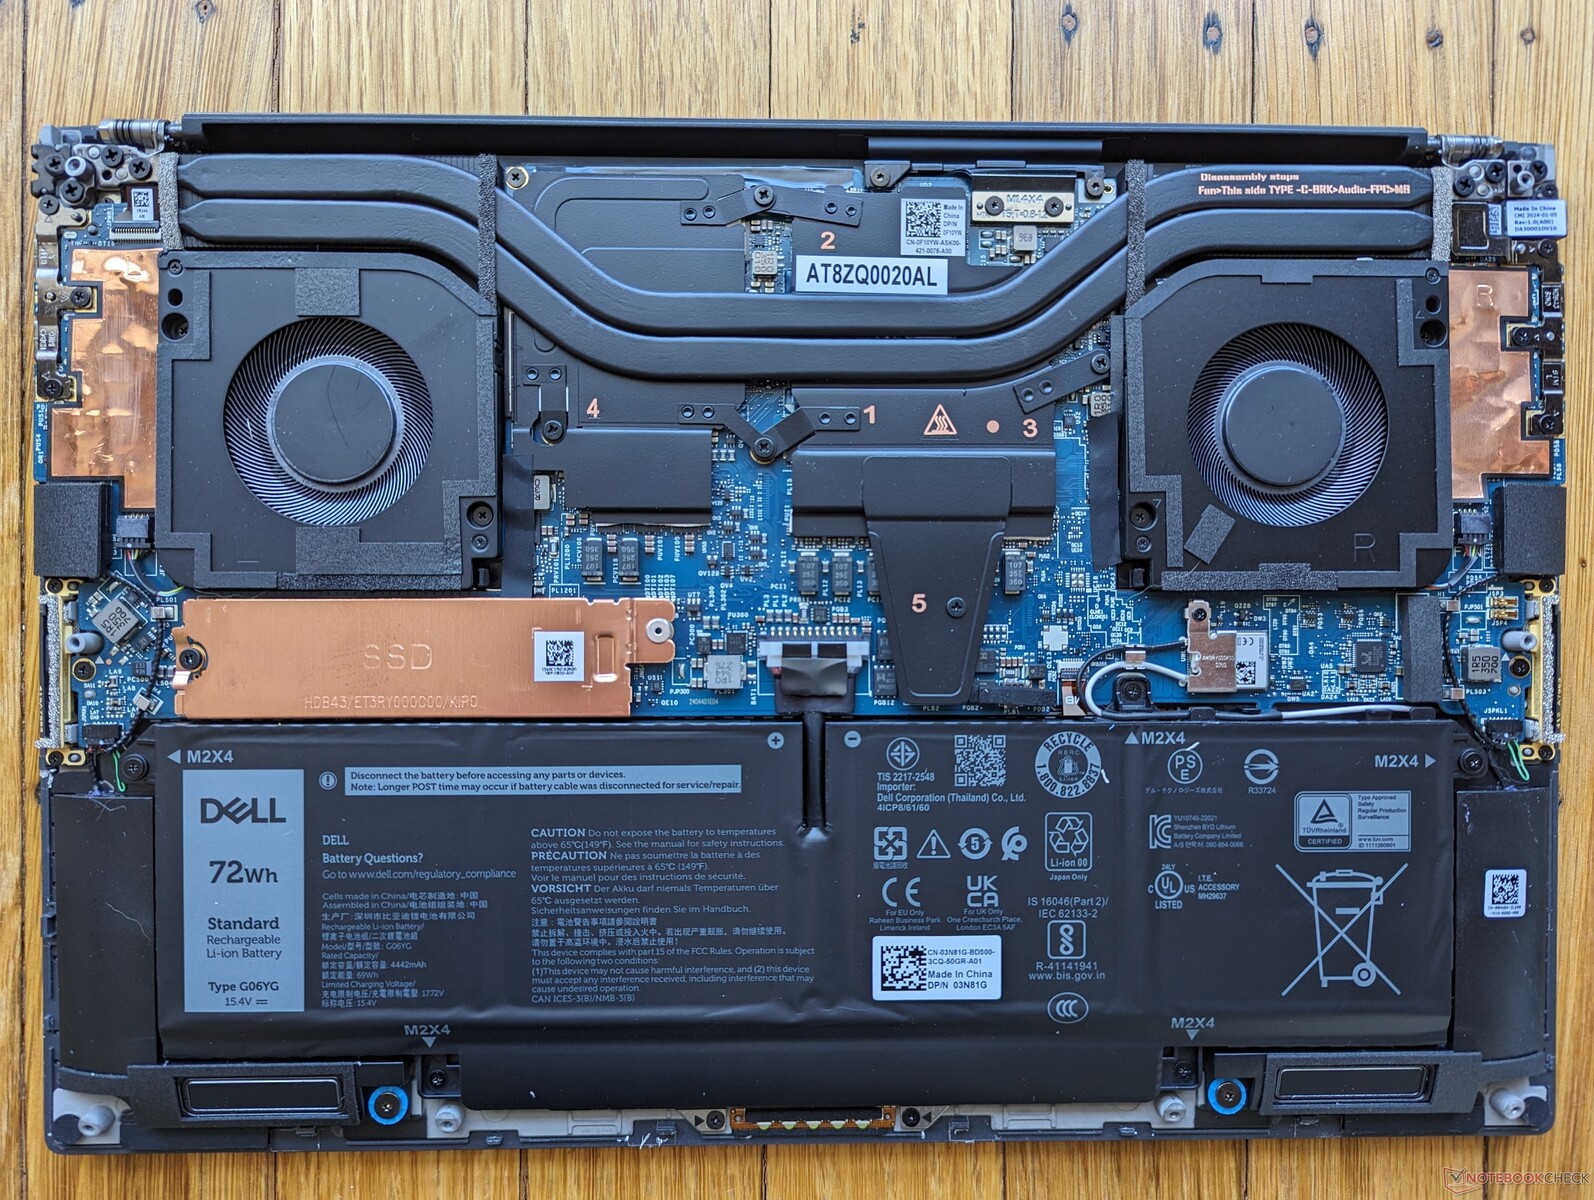
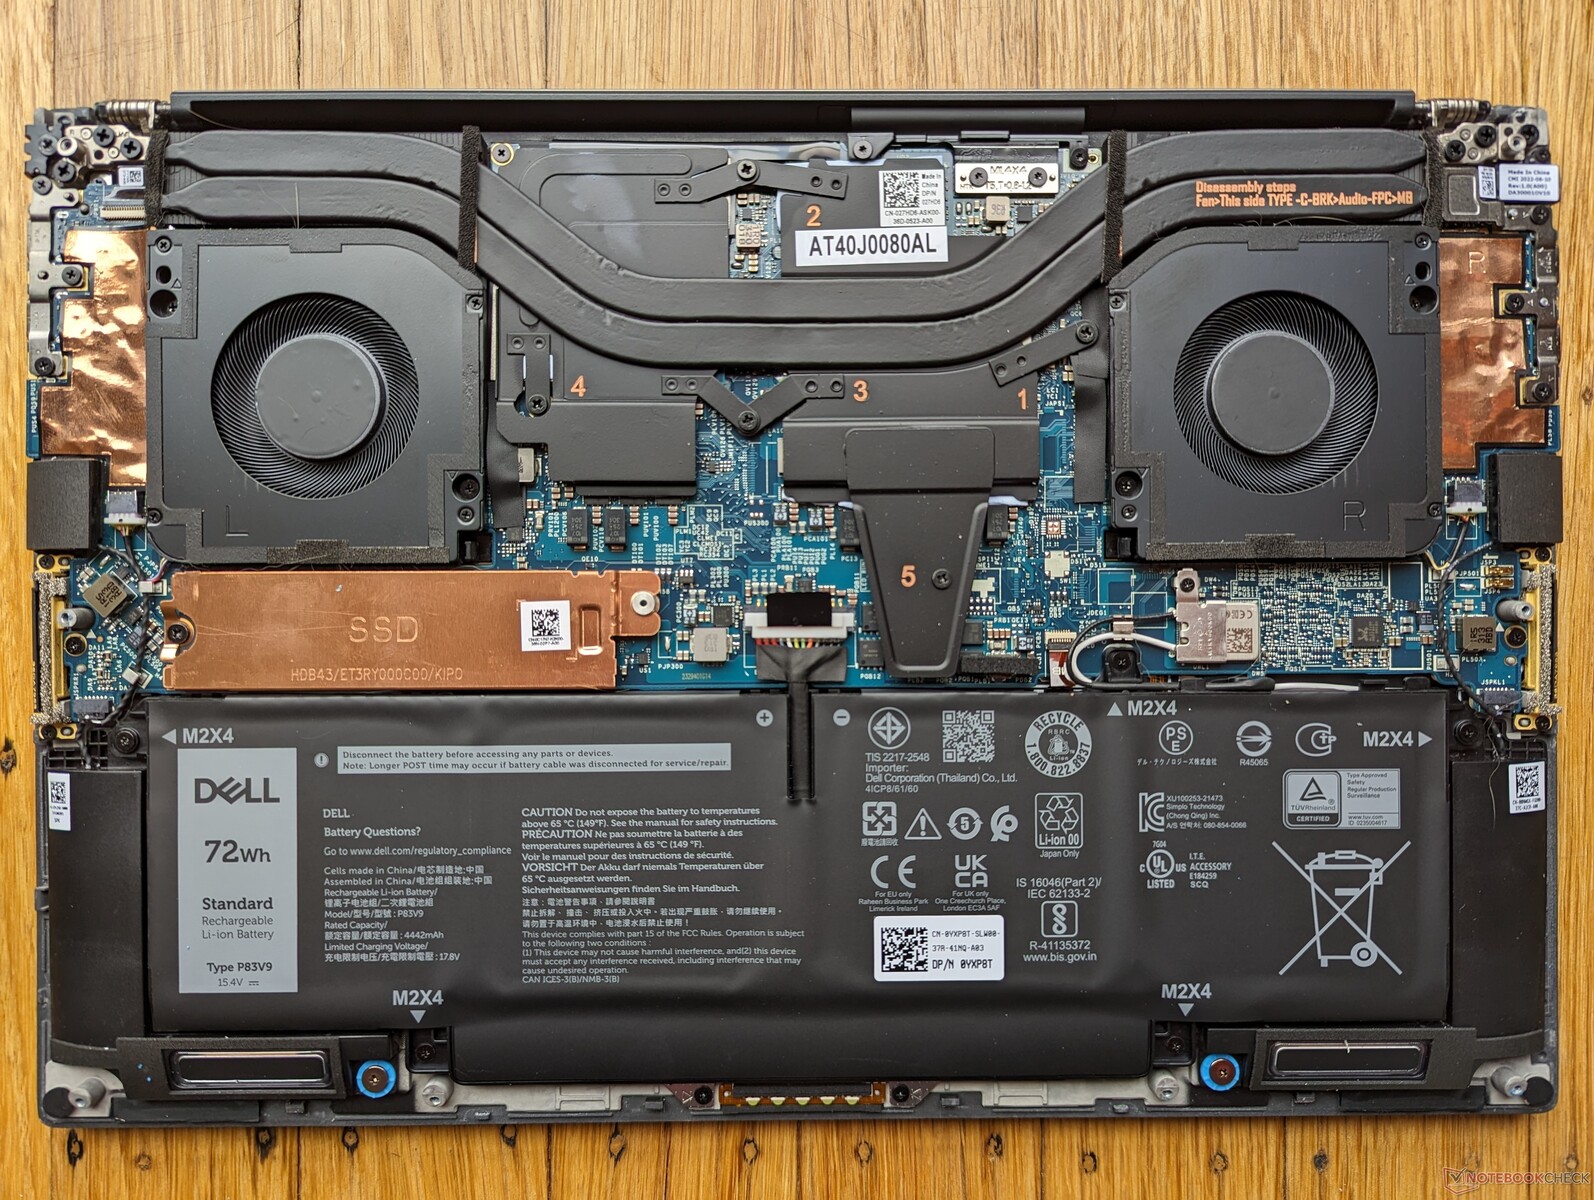
Manutenção
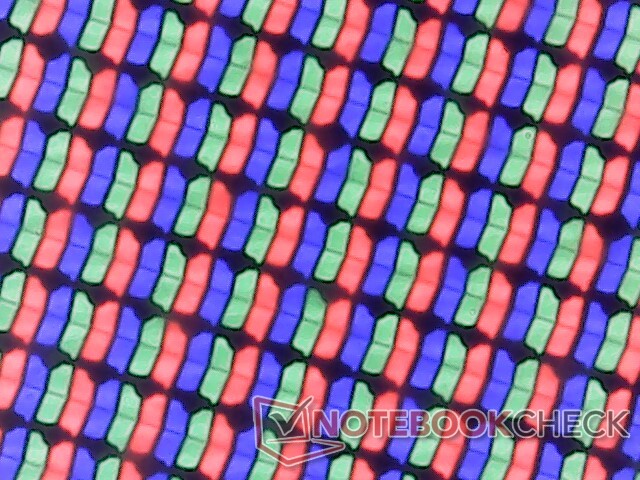
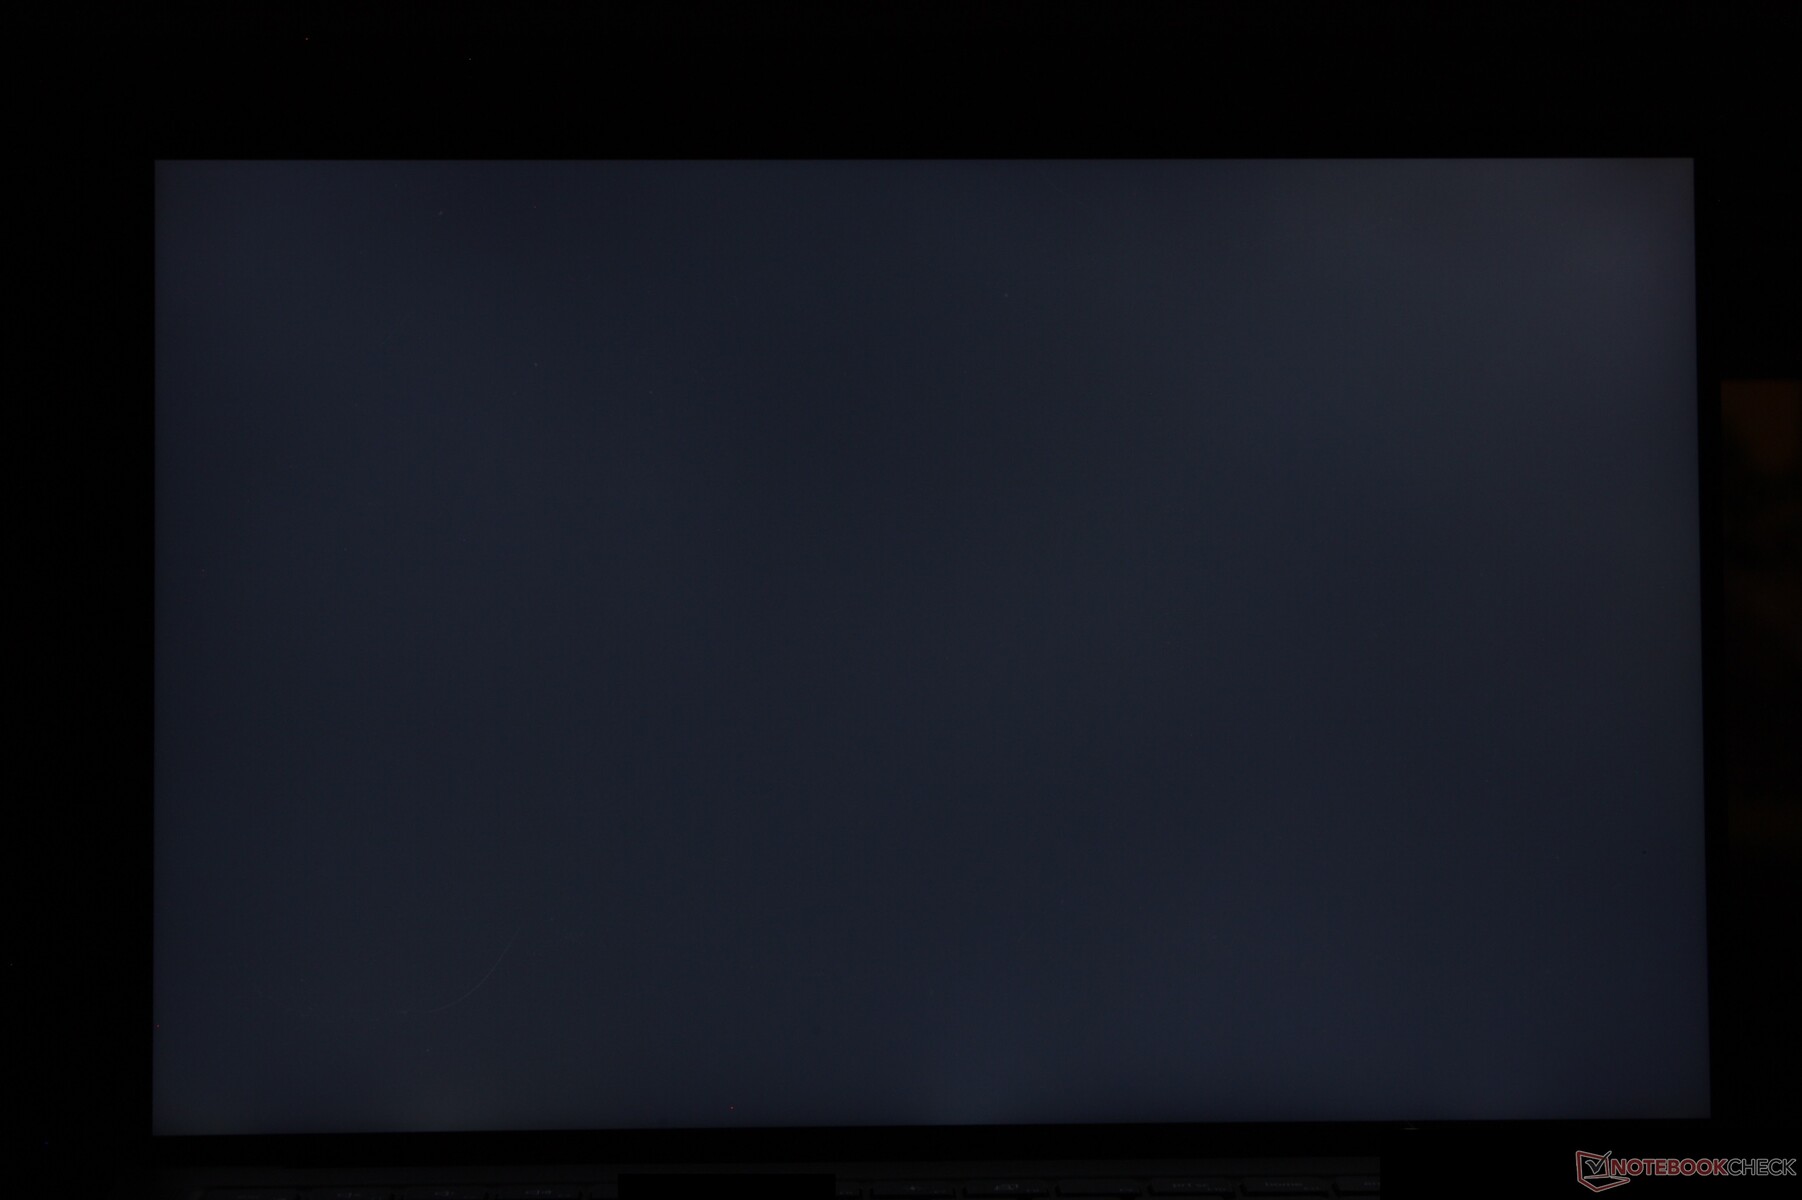
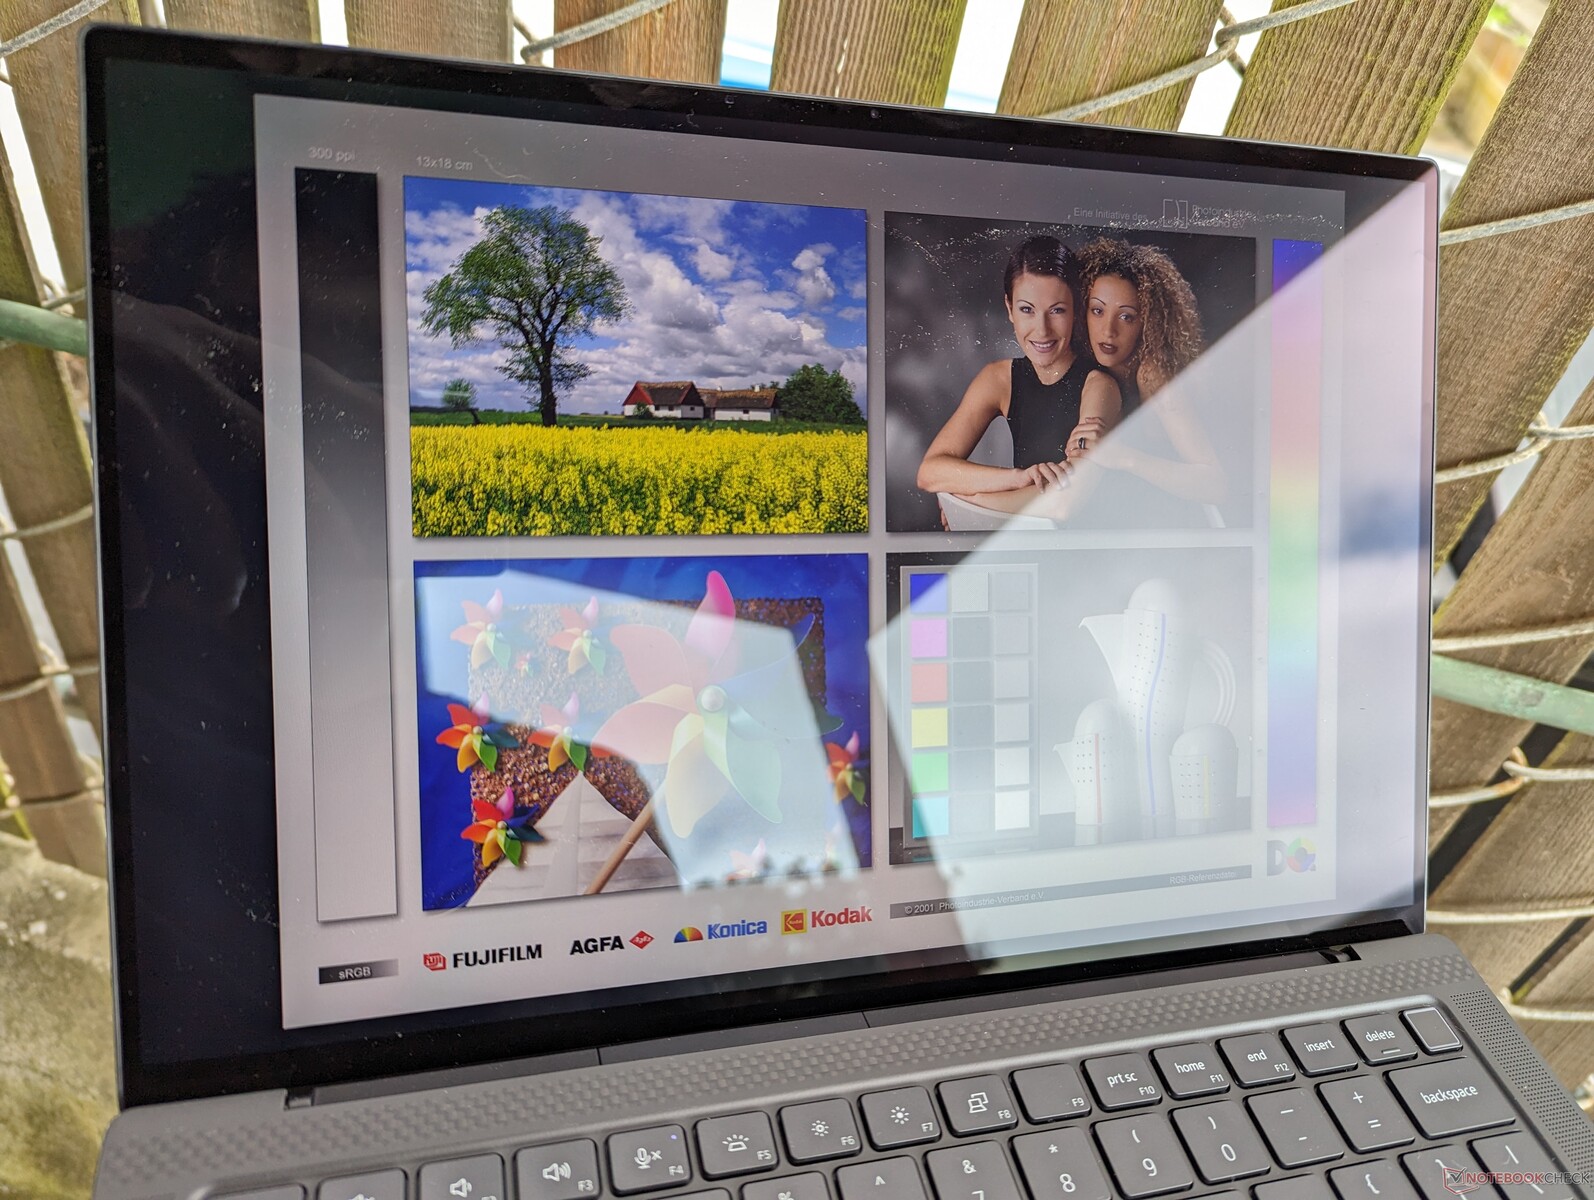
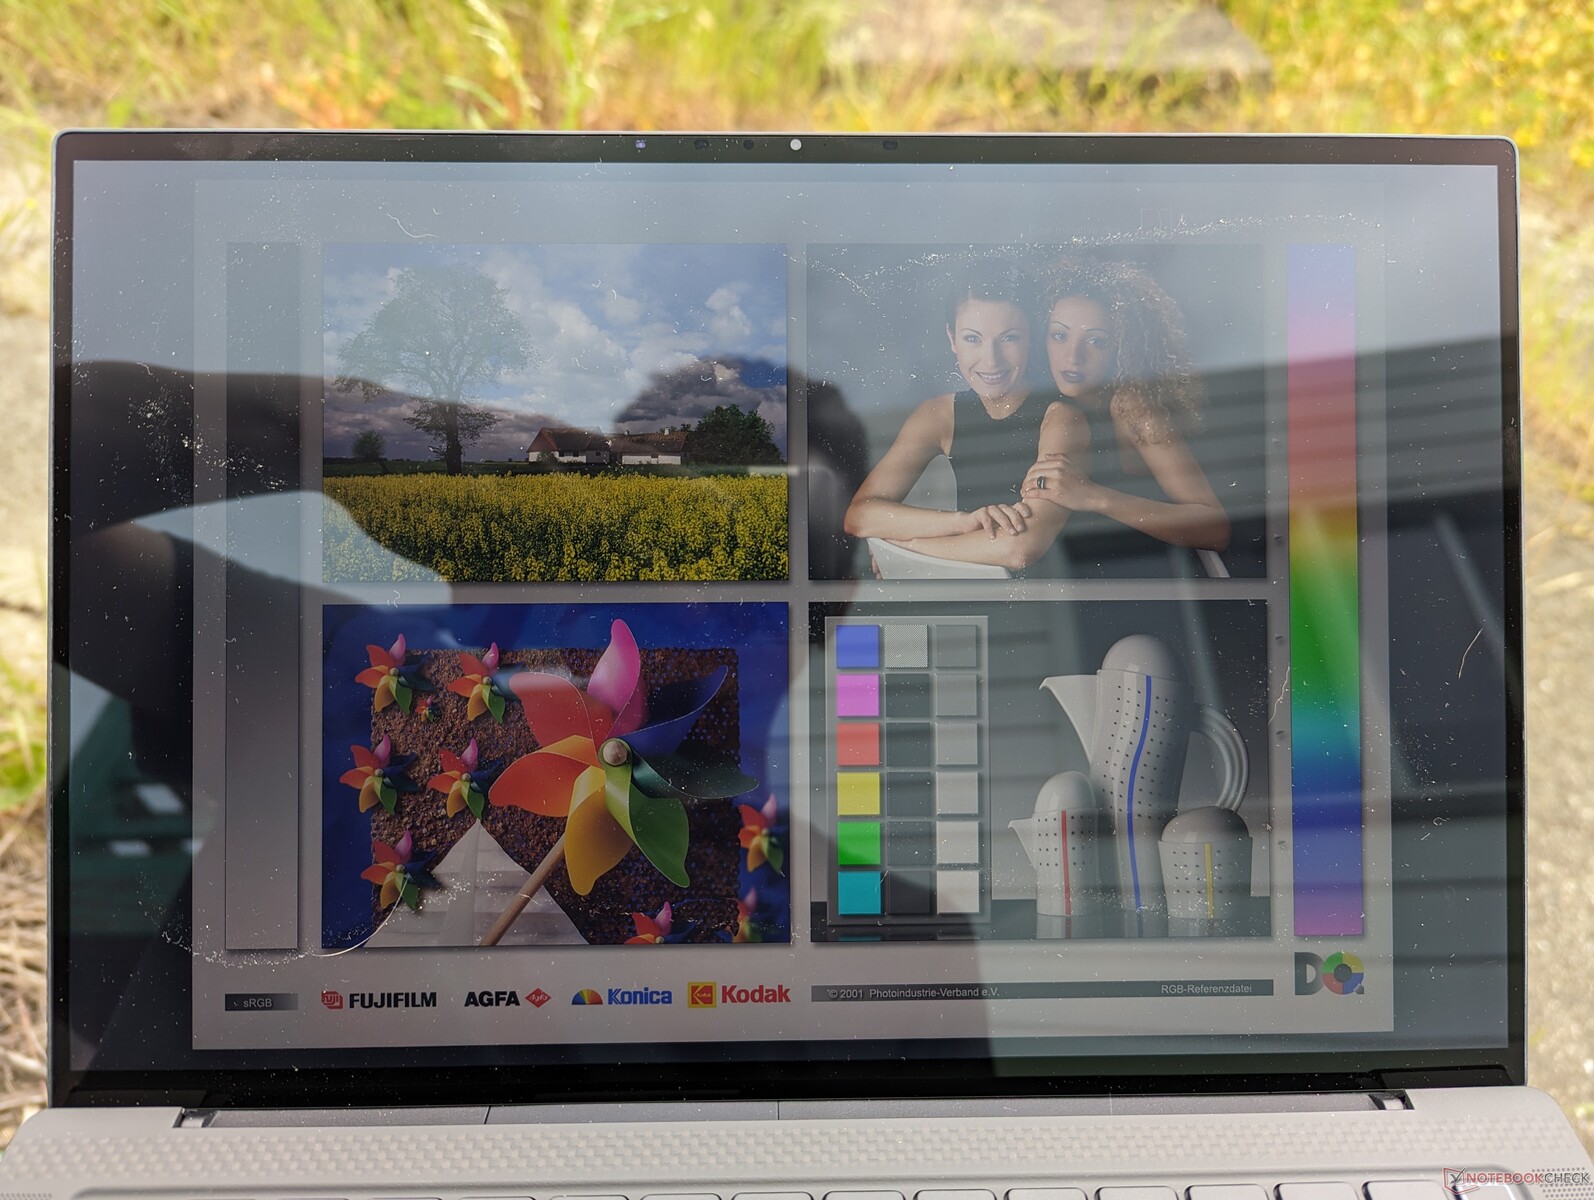
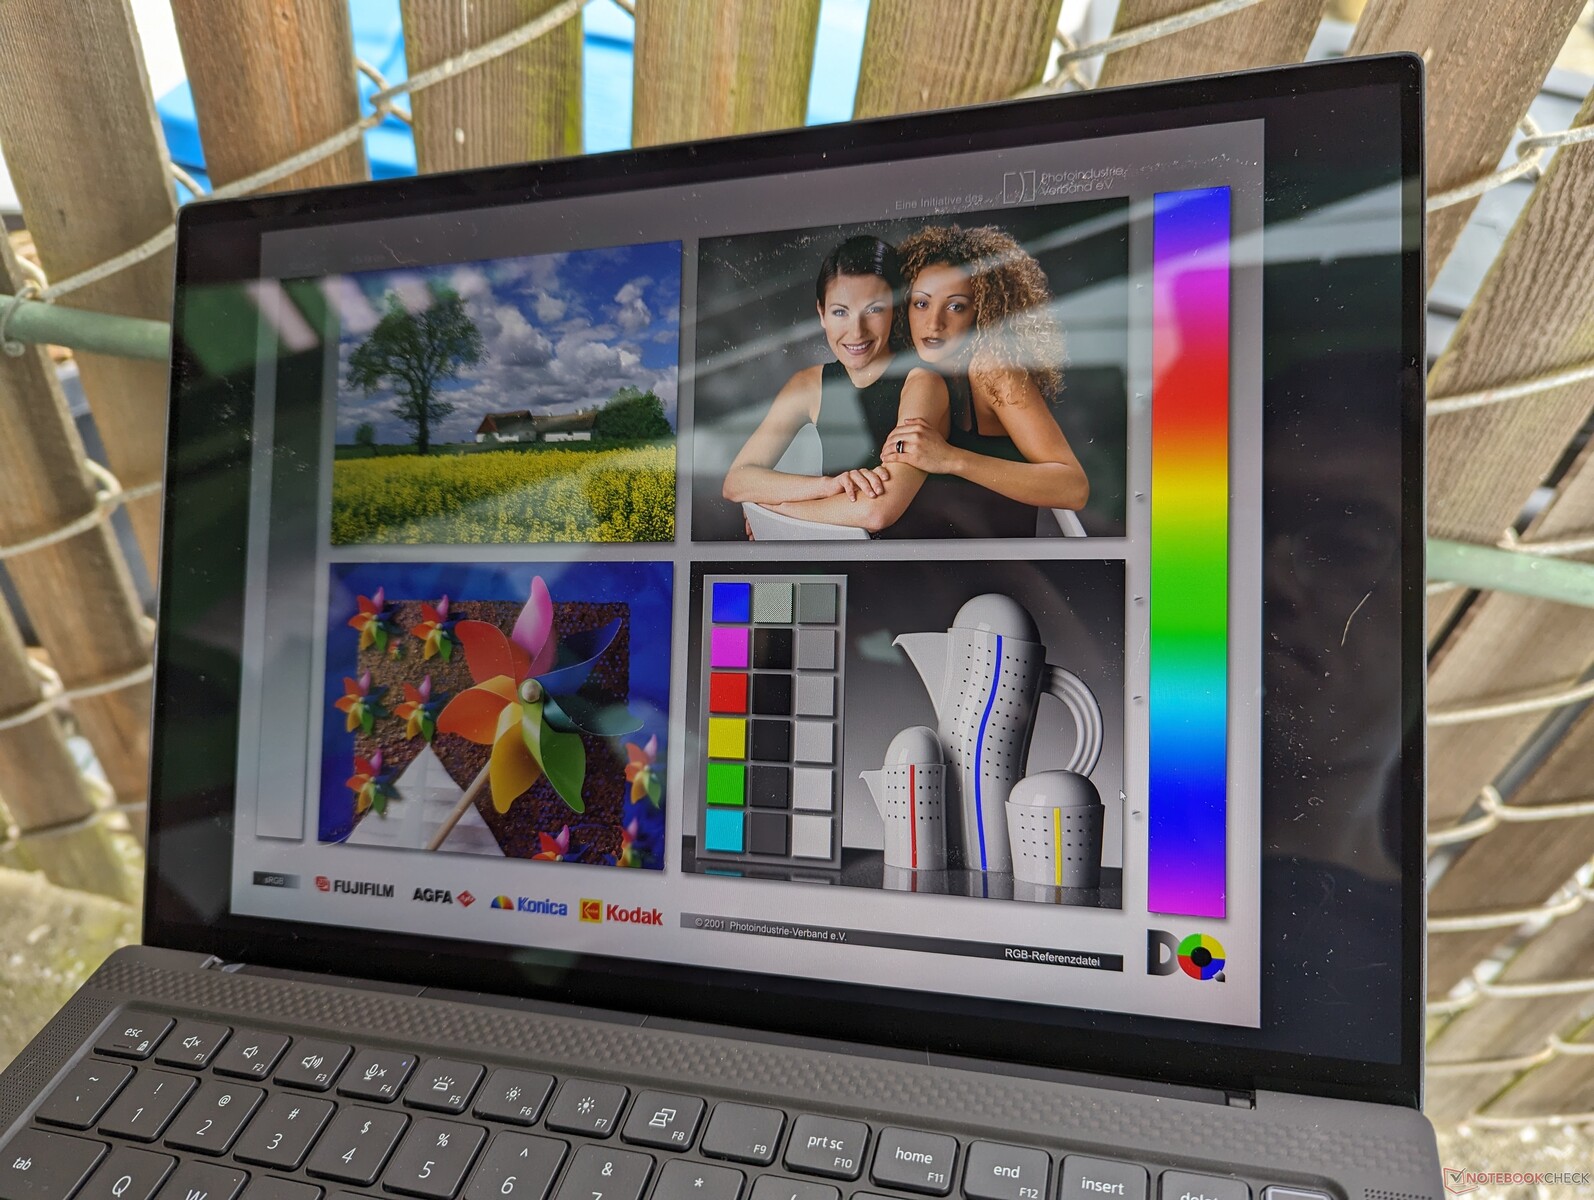
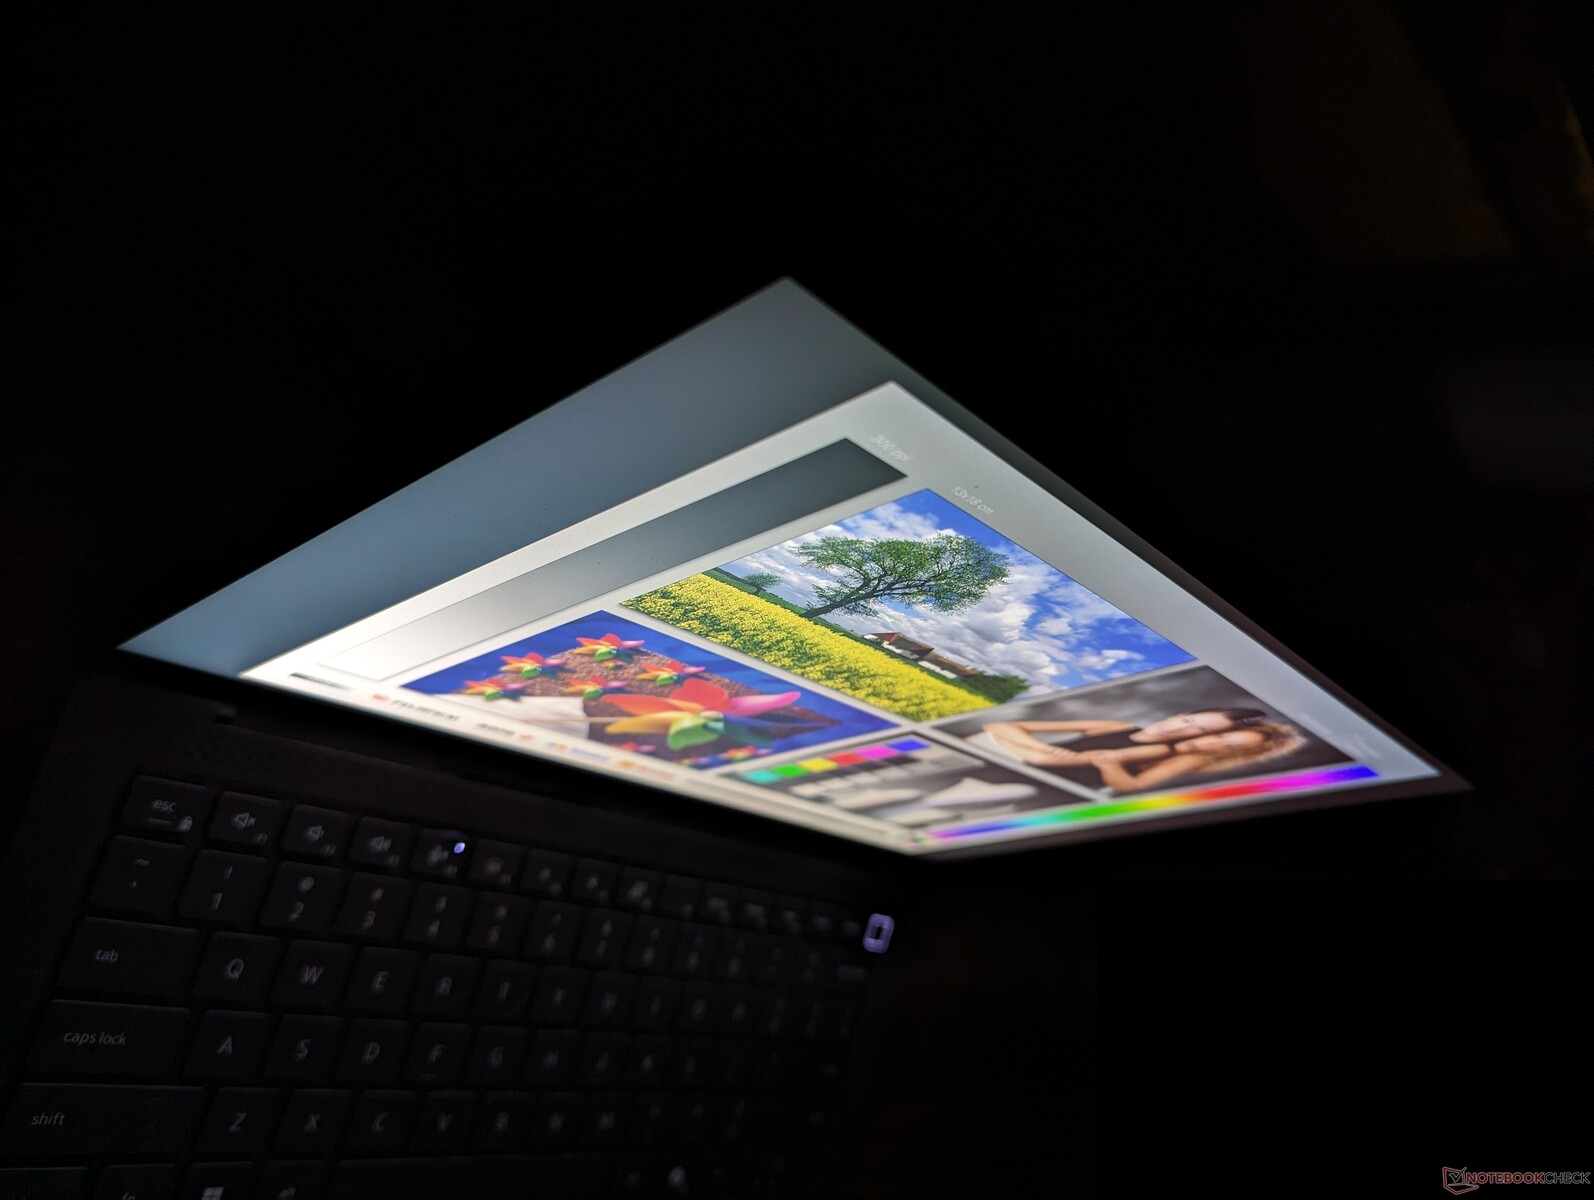
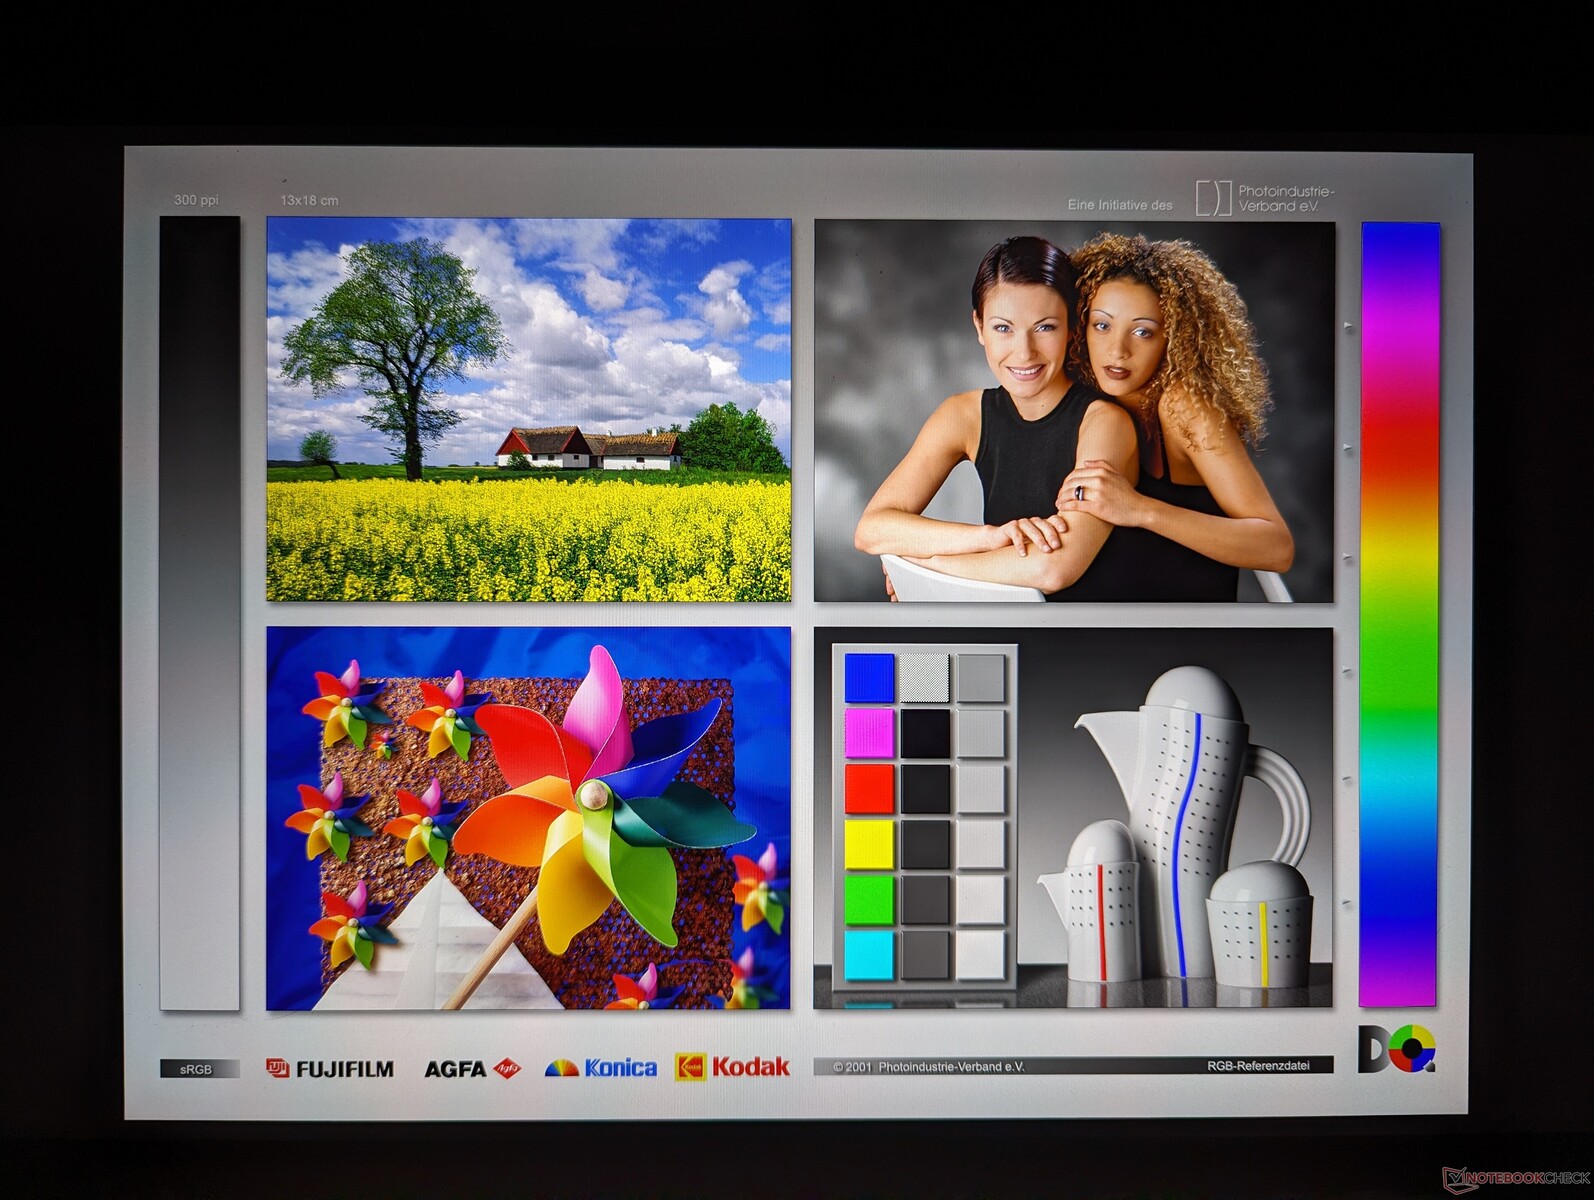
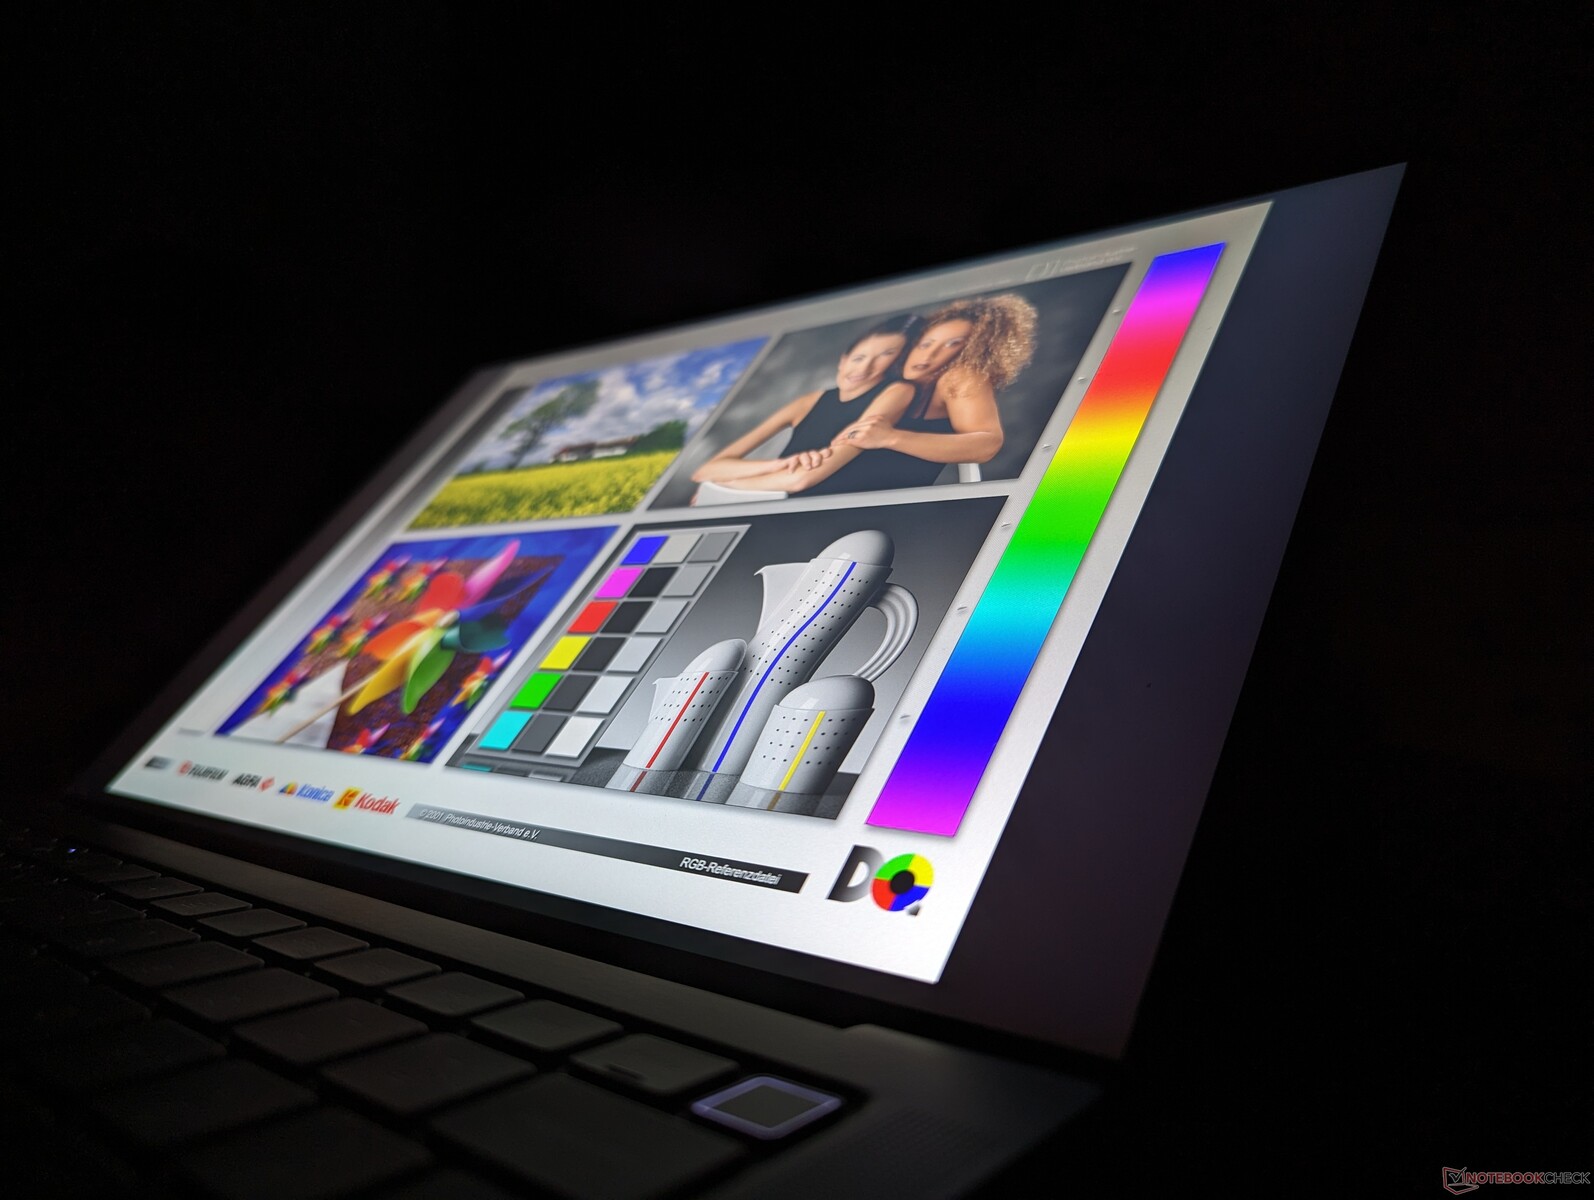
Tela - O bom e velho IPS
A AU Optronics é mais uma vez a fornecedora do painel QHD+ pelo terceiro ano consecutivo. Embora tenha sido excelente quando foi lançado pela primeira vez para o Precision 5470, o painel agora está começando a mostrar sua idade diante das novas alternativas OLED e de taxa de atualização mais alta. O Lenovo ThinkPad P14s G4por exemplo, vem com uma opção OLED de 1800p que não está disponível no Precision 5490.
| |||||||||||||||||||||||||
iluminação: 90 %
iluminação com acumulador: 485.1 cd/m²
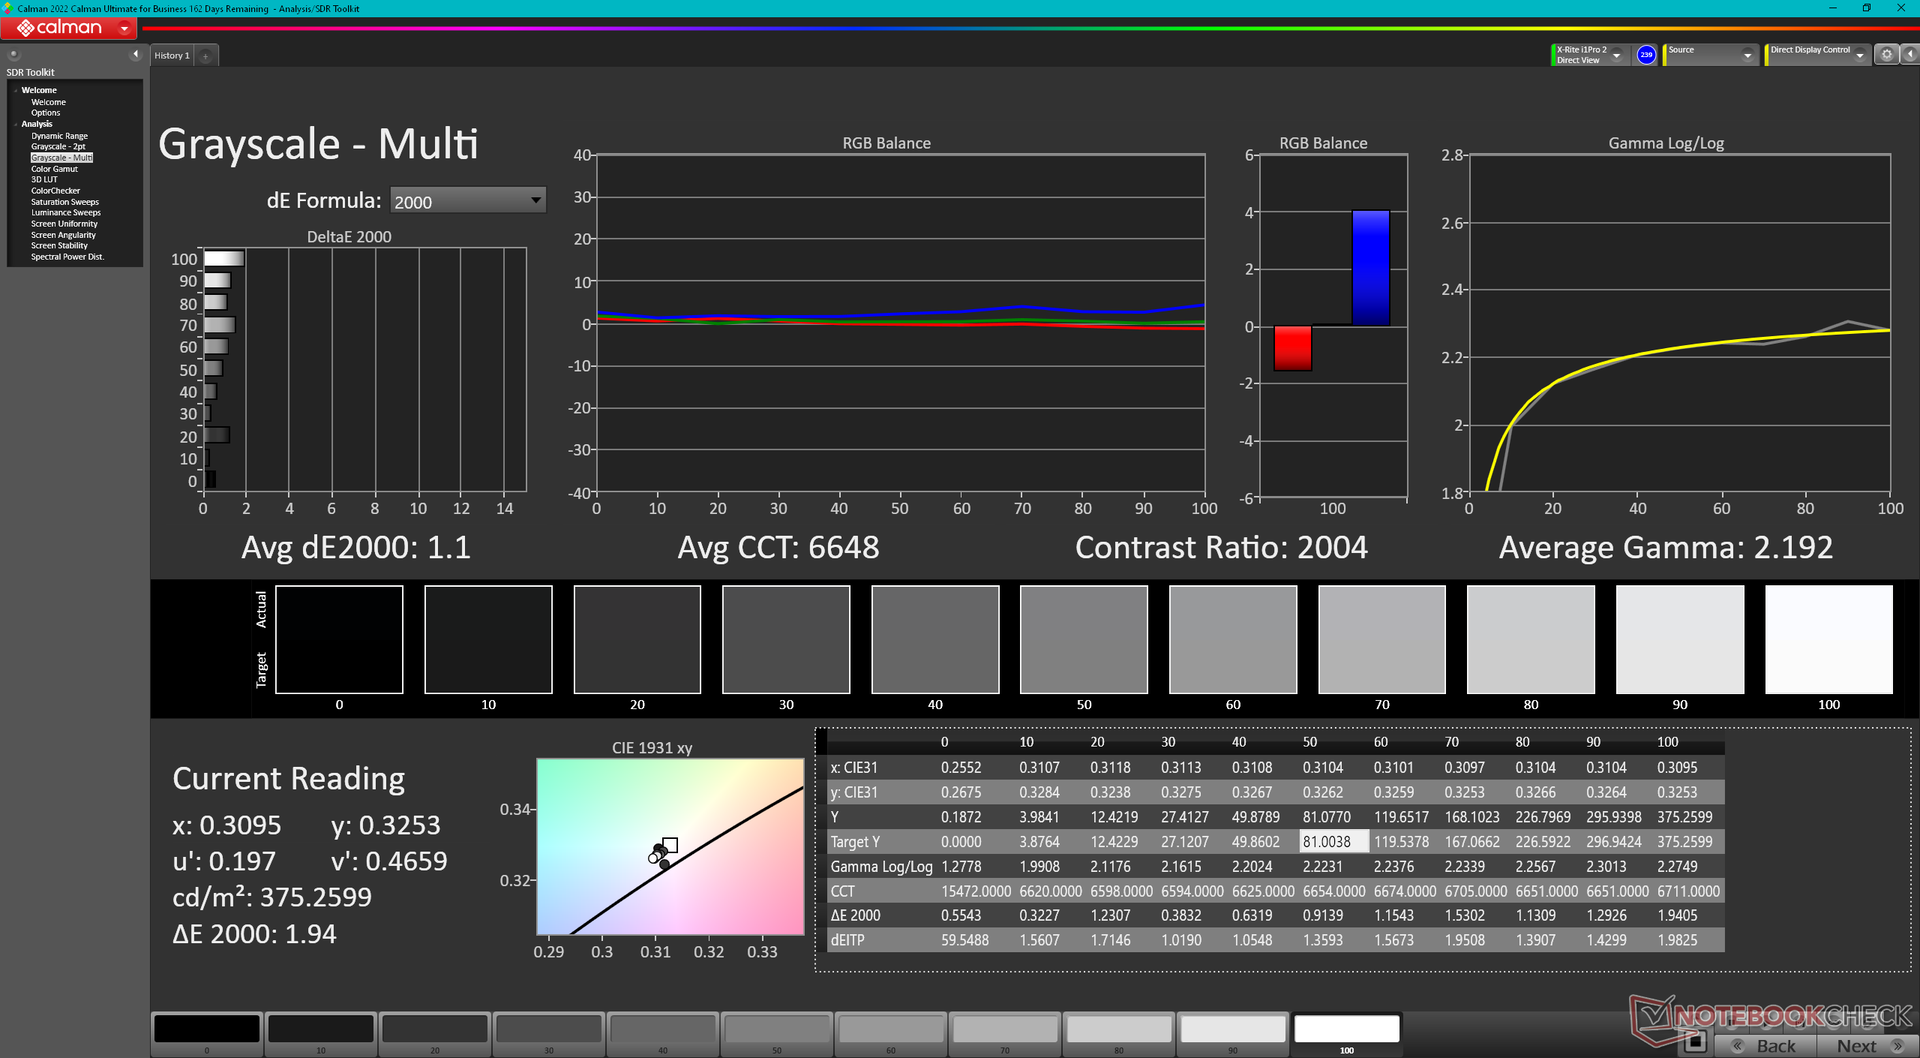
Contraste: 1277:1 (Preto: 0.38 cd/m²)
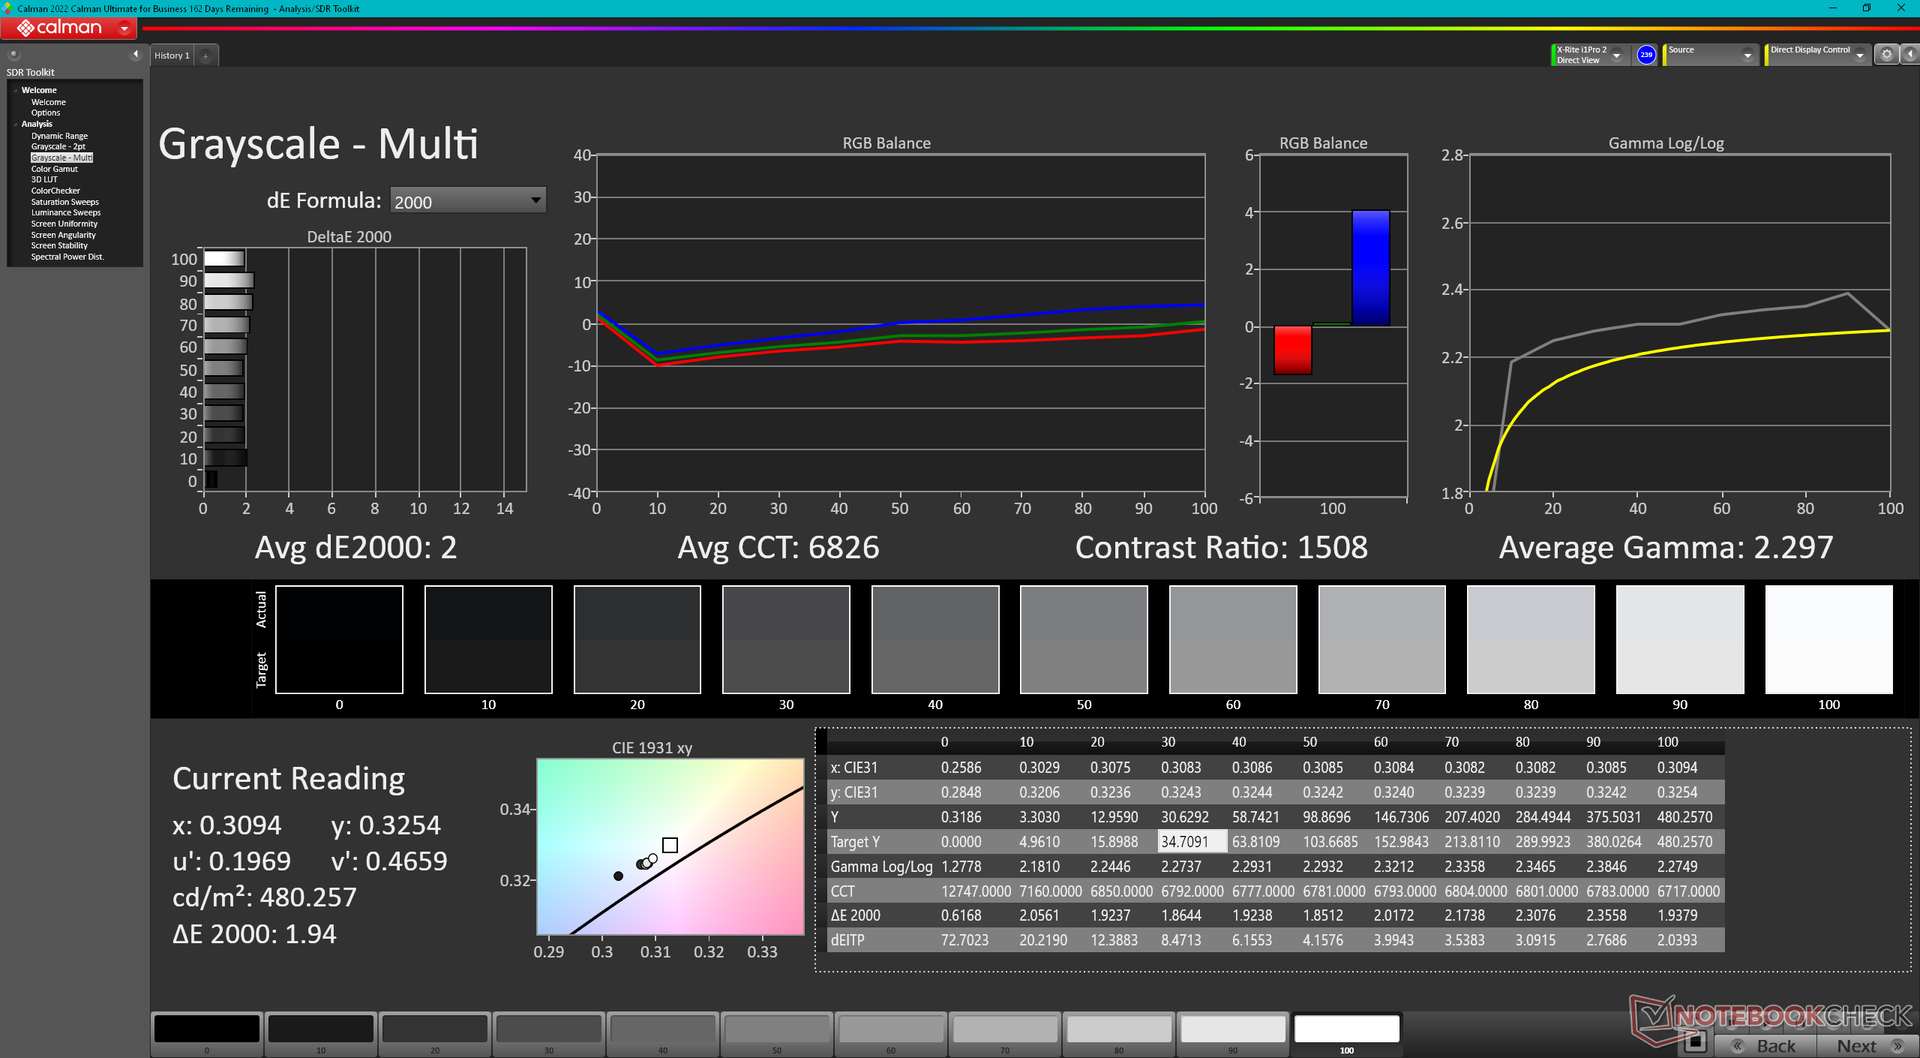
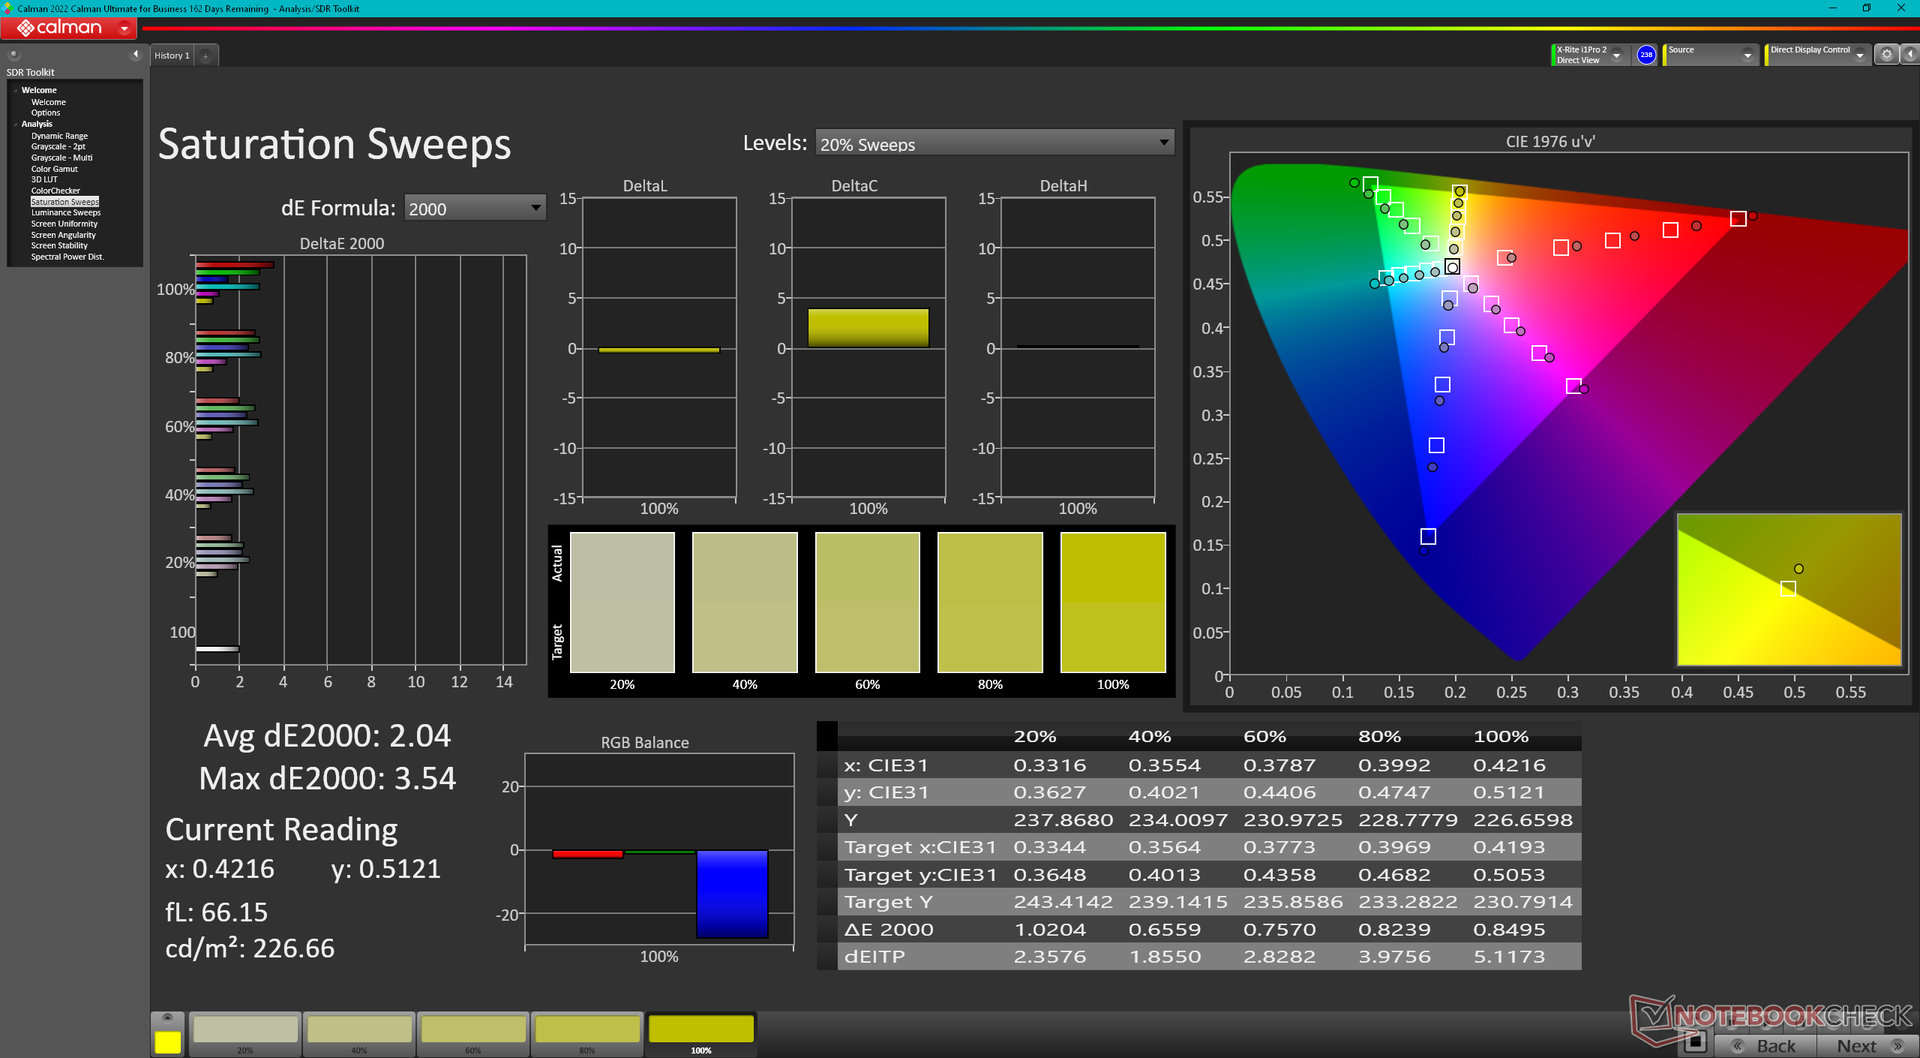
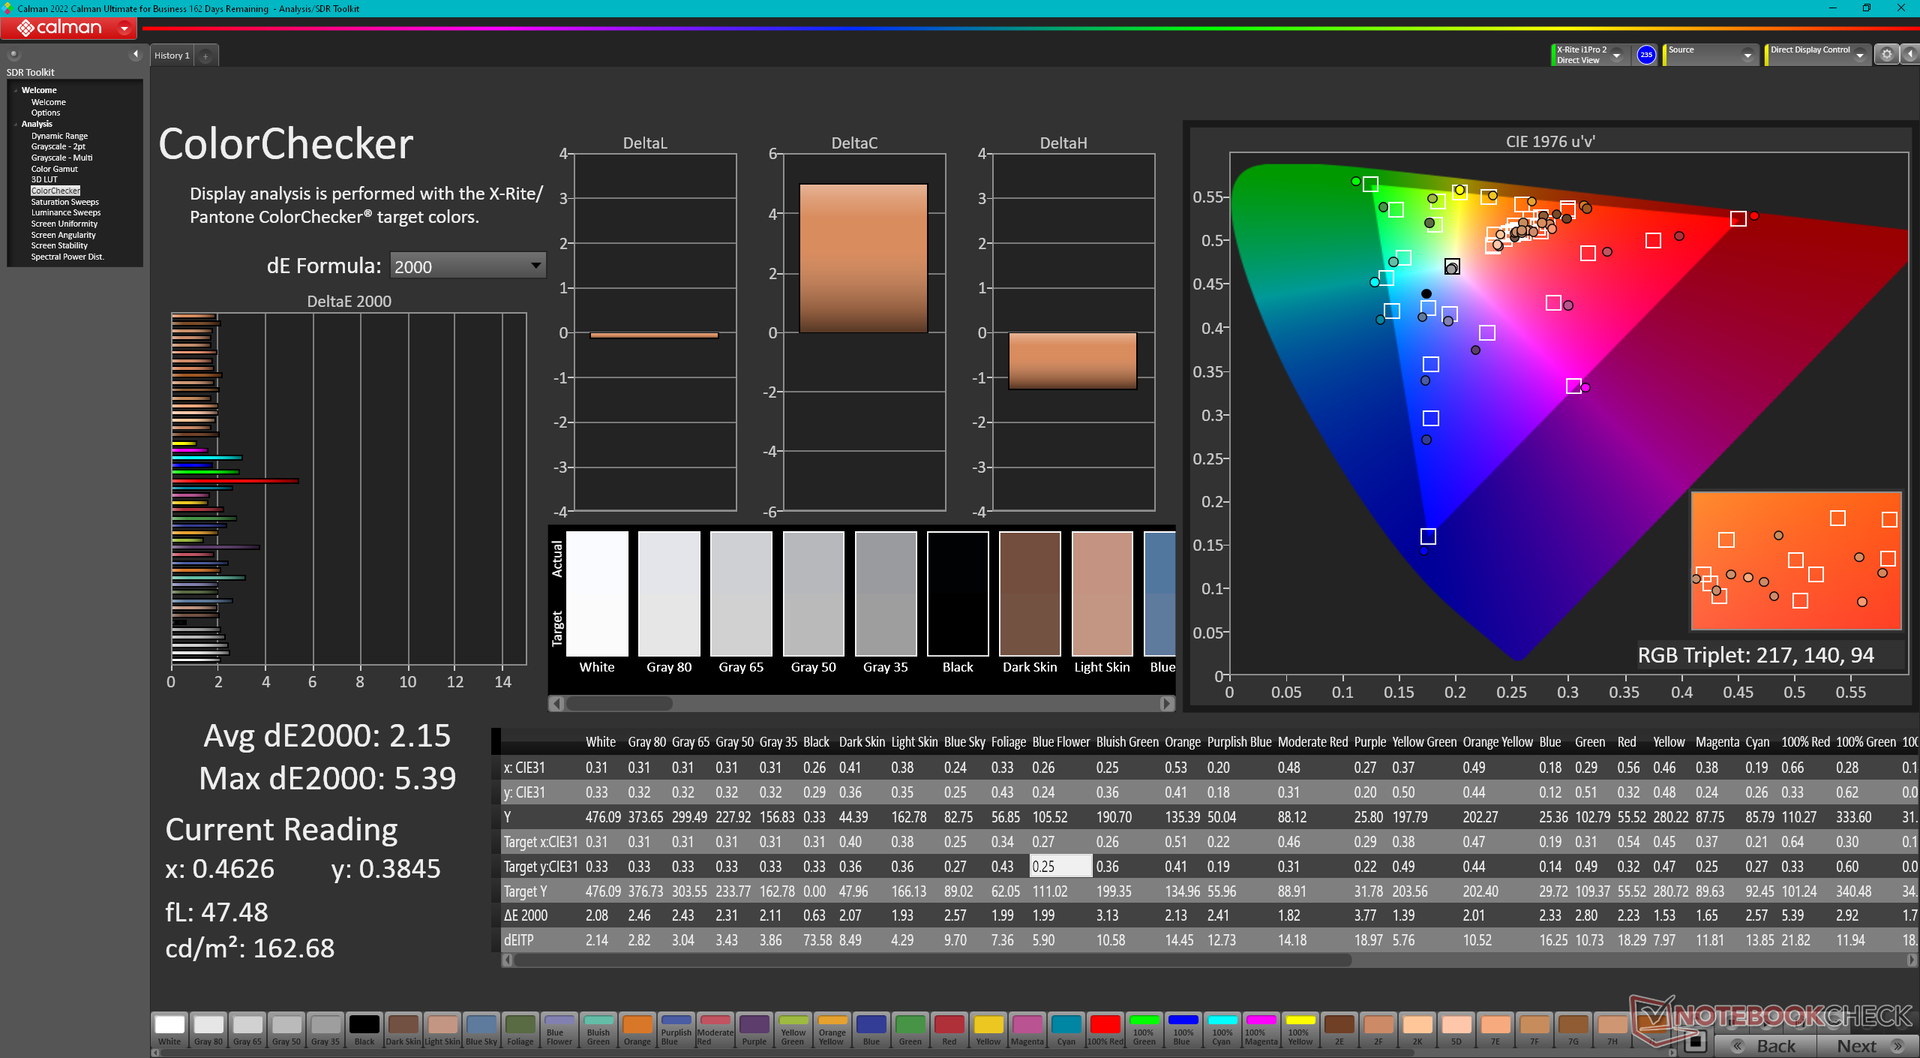
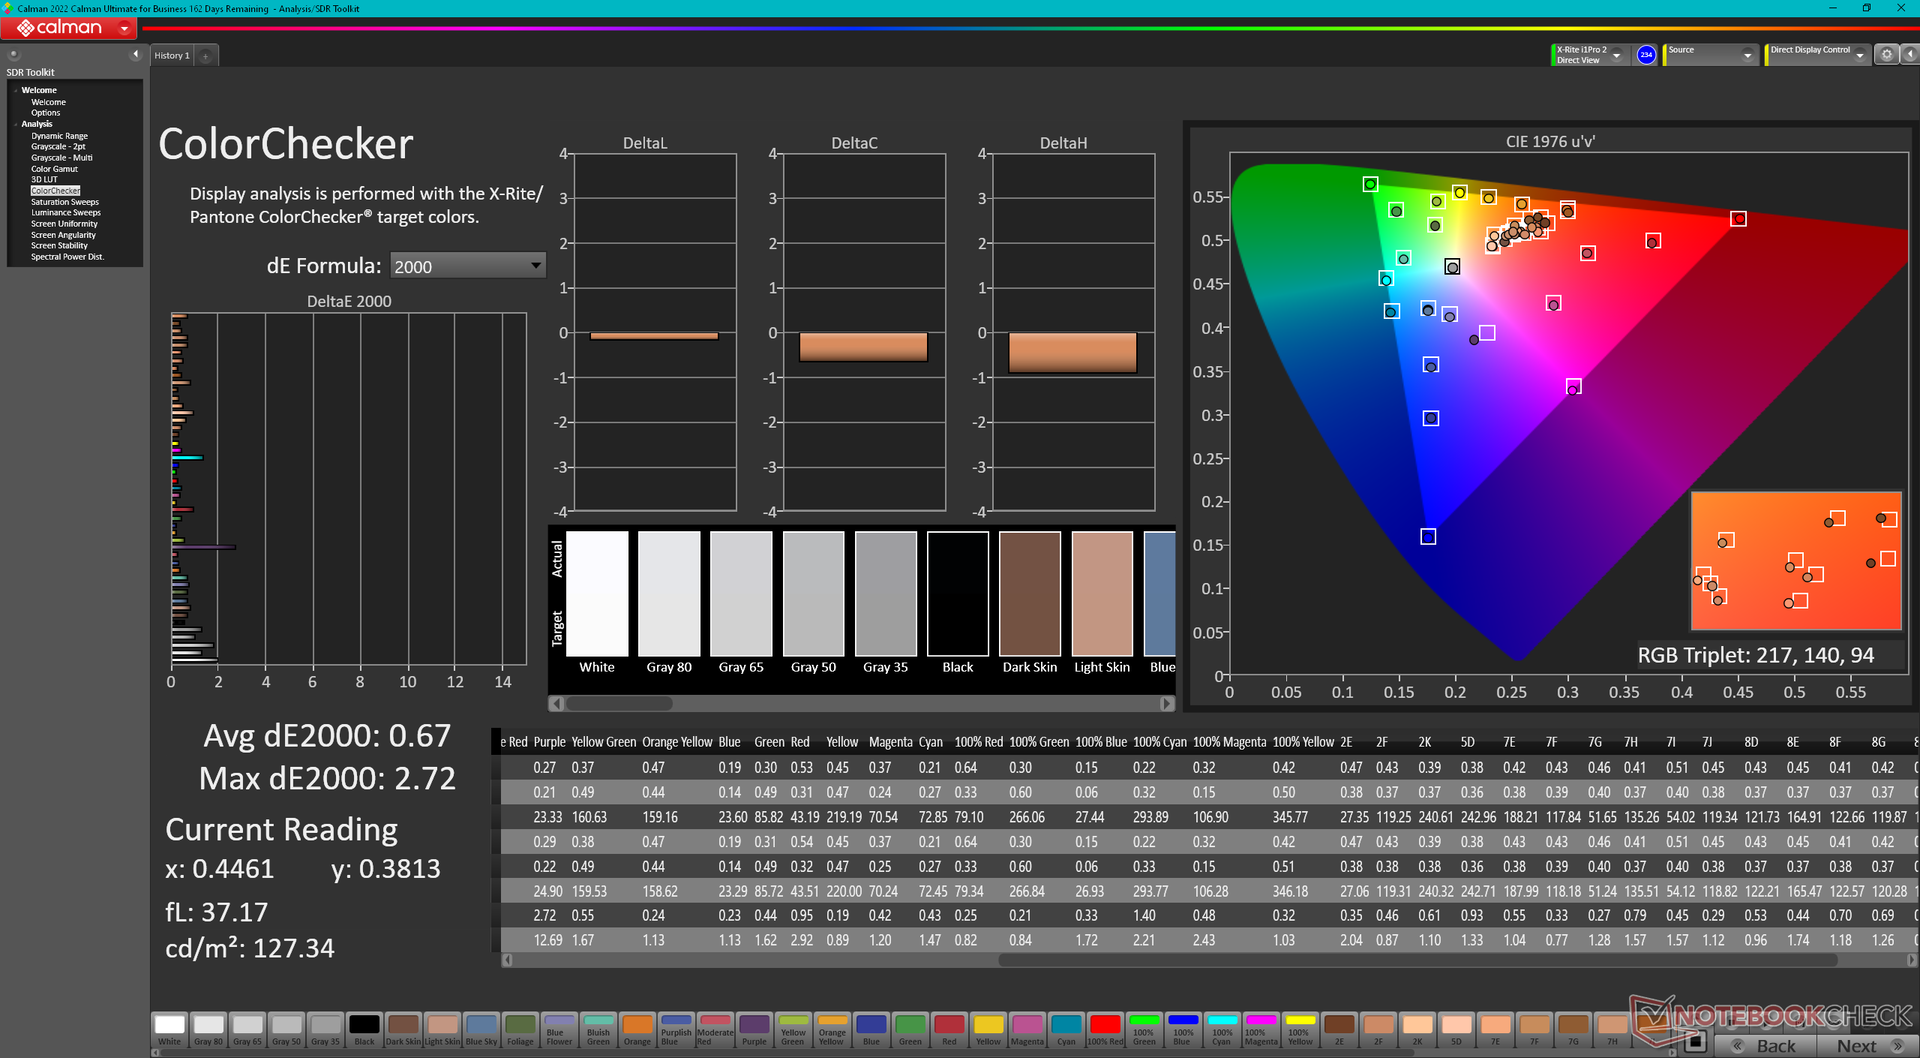
ΔE ColorChecker Calman: 2.15 | ∀{0.5-29.43 Ø4.72}
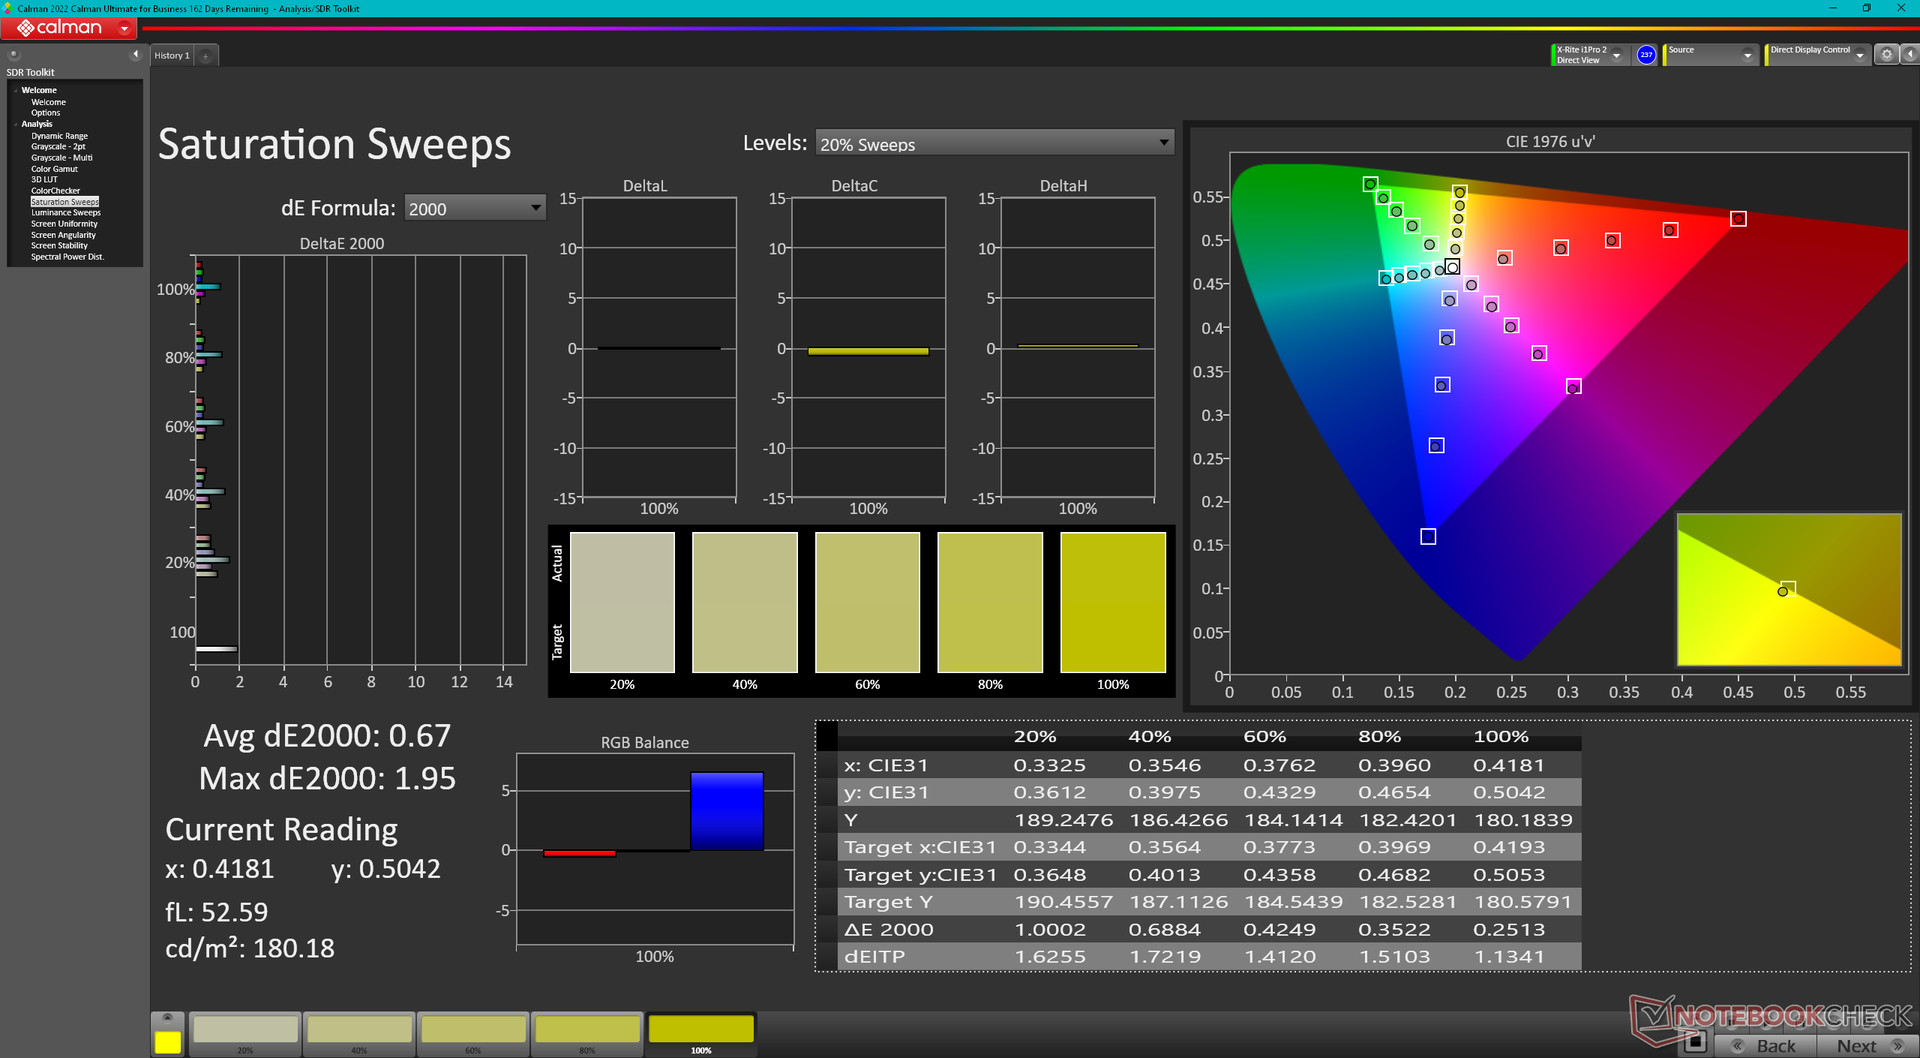
calibrated: 0.67
ΔE Greyscale Calman: 2 | ∀{0.09-98 Ø4.97}
79.5% AdobeRGB 1998 (Argyll 3D)
100% sRGB (Argyll 3D)
79.7% Display P3 (Argyll 3D)
Gamma: 2.3
CCT: 6826 K
| Dell Precision 5000 5490 AU Optronics B140QAN, IPS, 2560x1600, 14" | Lenovo ThinkPad P14s G4 21HF0017GE ATNA40YK15-0, OLED, 2880x1800, 14" | HP ZBook Firefly 14 G10 A CMN1435, IPS, 1920x1200, 14" | HP ZBook Firefly 14 G9-6B8A2EA CMN1435, IPS, 1920x1200, 14" | Dell Precision 5480 AU Optronics B140QAN, IPS, 2560x1600, 14" | Dell Precision 5000 5470 AU Optronics B140QAN, IPS, 2560x1600, 14" | |
|---|---|---|---|---|---|---|
| Display | 16% | -9% | -8% | -2% | -1% | |
| Display P3 Coverage (%) | 79.7 | 99.9 25% | 68.7 -14% | 69.6 -13% | 77.6 -3% | 79.3 -1% |
| sRGB Coverage (%) | 100 | 100 0% | 98.2 -2% | 99.9 0% | 99.8 0% | 100 0% |
| AdobeRGB 1998 Coverage (%) | 79.5 | 97 22% | 70.8 -11% | 71.1 -11% | 78 -2% | 78.7 -1% |
| Response Times | 94% | 9% | 7% | 20% | 2% | |
| Response Time Grey 50% / Grey 80% * (ms) | 52.3 ? | 3 ? 94% | 56.2 ? -7% | 56.3 ? -8% | 43.9 ? 16% | 52.4 ? -0% |
| Response Time Black / White * (ms) | 33.3 ? | 2.2 ? 93% | 25.2 ? 24% | 26.2 ? 21% | 25.3 ? 24% | 32.4 ? 3% |
| PWM Frequency (Hz) | 360 ? | |||||
| PWM Amplitude * (%) | 25 | |||||
| Screen | -121% | -8% | -19% | 4% | -3% | |
| Brightness middle (cd/m²) | 485.1 | 432 -11% | 397 -18% | 432 -11% | 472.8 -3% | 537 11% |
| Brightness (cd/m²) | 471 | 432 -8% | 367 -22% | 407 -14% | 469 0% | 518 10% |
| Brightness Distribution (%) | 90 | 98 9% | 86 -4% | 91 1% | 87 -3% | 94 4% |
| Black Level * (cd/m²) | 0.38 | 0.25 34% | 0.28 26% | 0.35 8% | 0.33 13% | |
| Contrast (:1) | 1277 | 1588 24% | 1543 21% | 1351 6% | 1627 27% | |
| Colorchecker dE 2000 * | 2.15 | 4.8 -123% | 2.35 -9% | 3.1 -44% | 2.1 2% | 2.97 -38% |
| Colorchecker dE 2000 max. * | 5.39 | 9.2 -71% | 4.68 13% | 5.6 -4% | 5.54 -3% | 5.33 1% |
| Colorchecker dE 2000 calibrated * | 0.67 | 4.9 -631% | 1.15 -72% | 0.8 -19% | 0.59 12% | 0.88 -31% |
| Greyscale dE 2000 * | 2 | 2.3 -15% | 2.4 -20% | 4.5 -125% | 1.7 15% | 2.4 -20% |
| Gamma | 2.3 96% | 2.23 99% | 2.067 106% | 2 110% | 2.26 97% | 2.06 107% |
| CCT | 6826 95% | 6391 102% | 6409 101% | 6528 100% | 6493 100% | 6668 97% |
| Média Total (Programa/Configurações) | -4% /
-51% | -3% /
-6% | -7% /
-13% | 7% /
5% | -1% /
-2% |
* ... menor é melhor
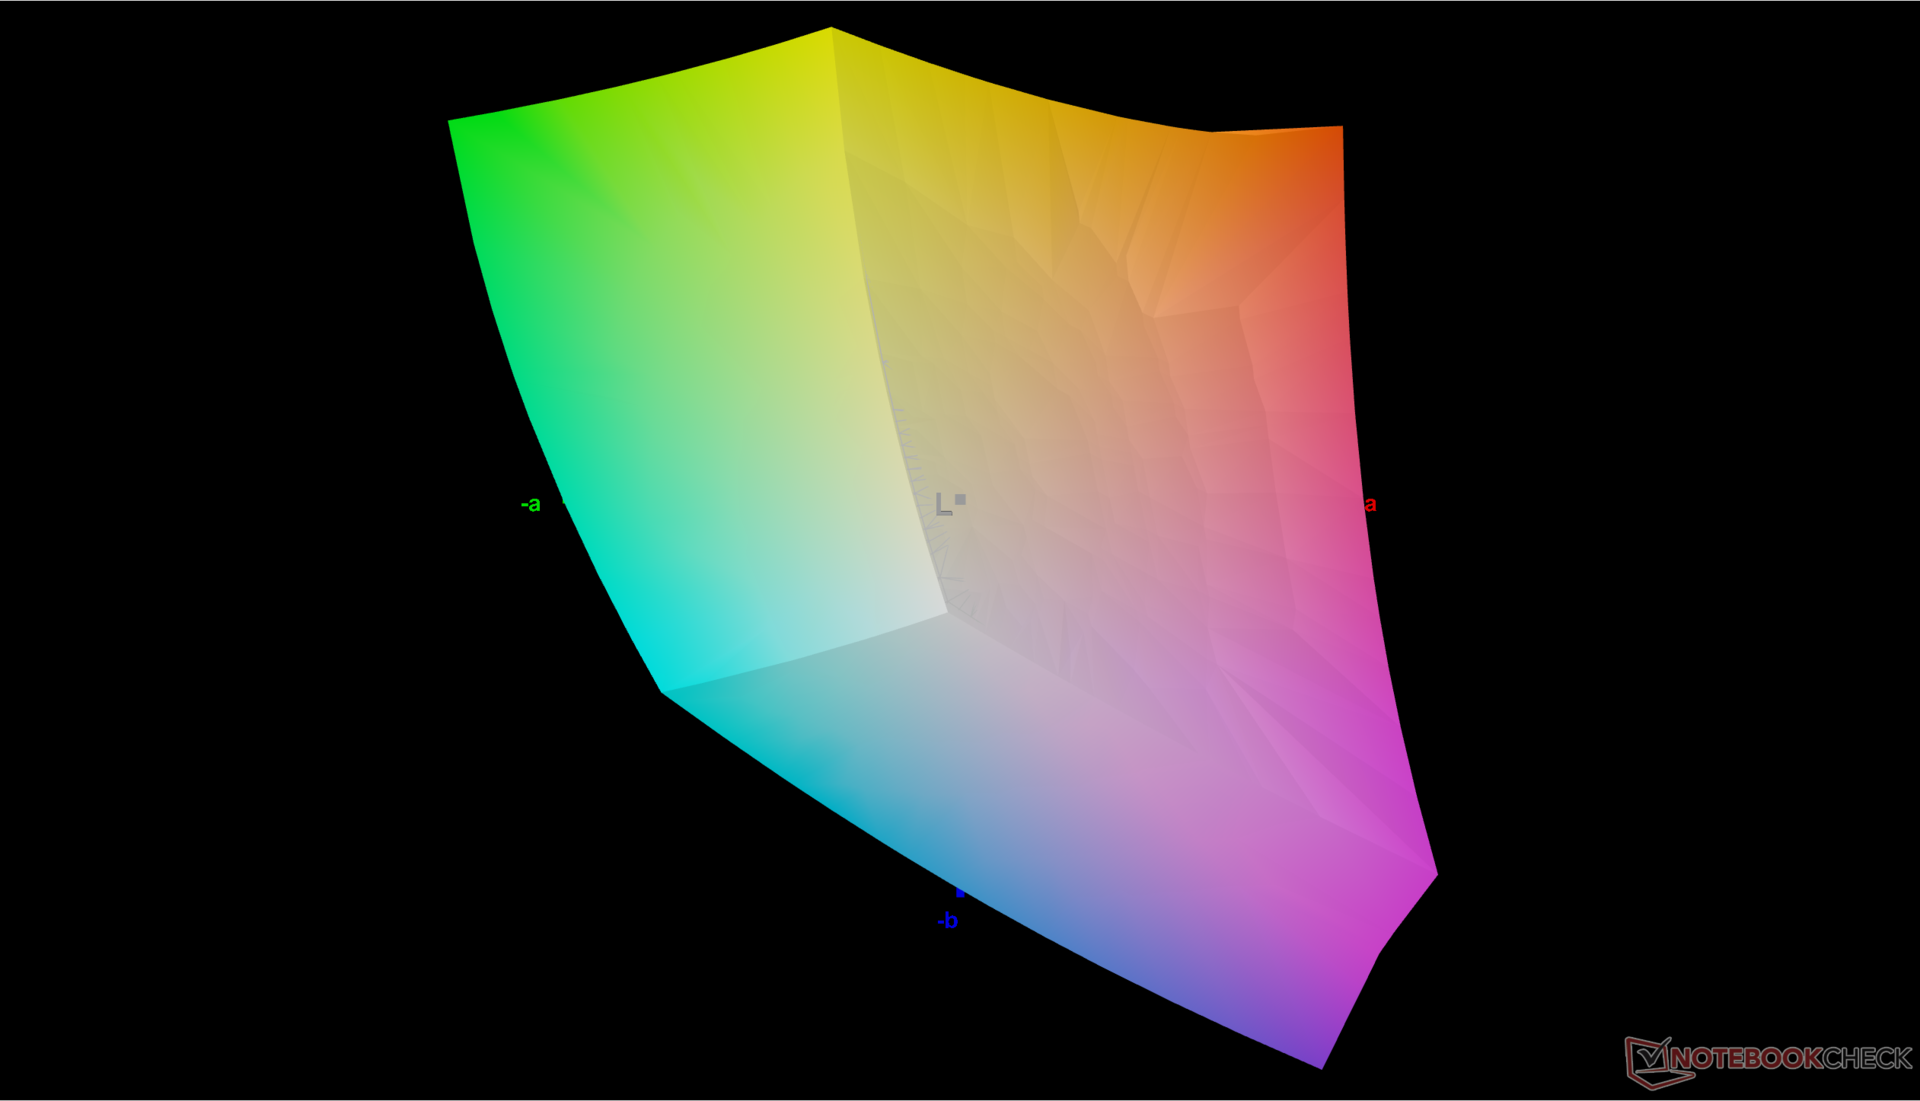
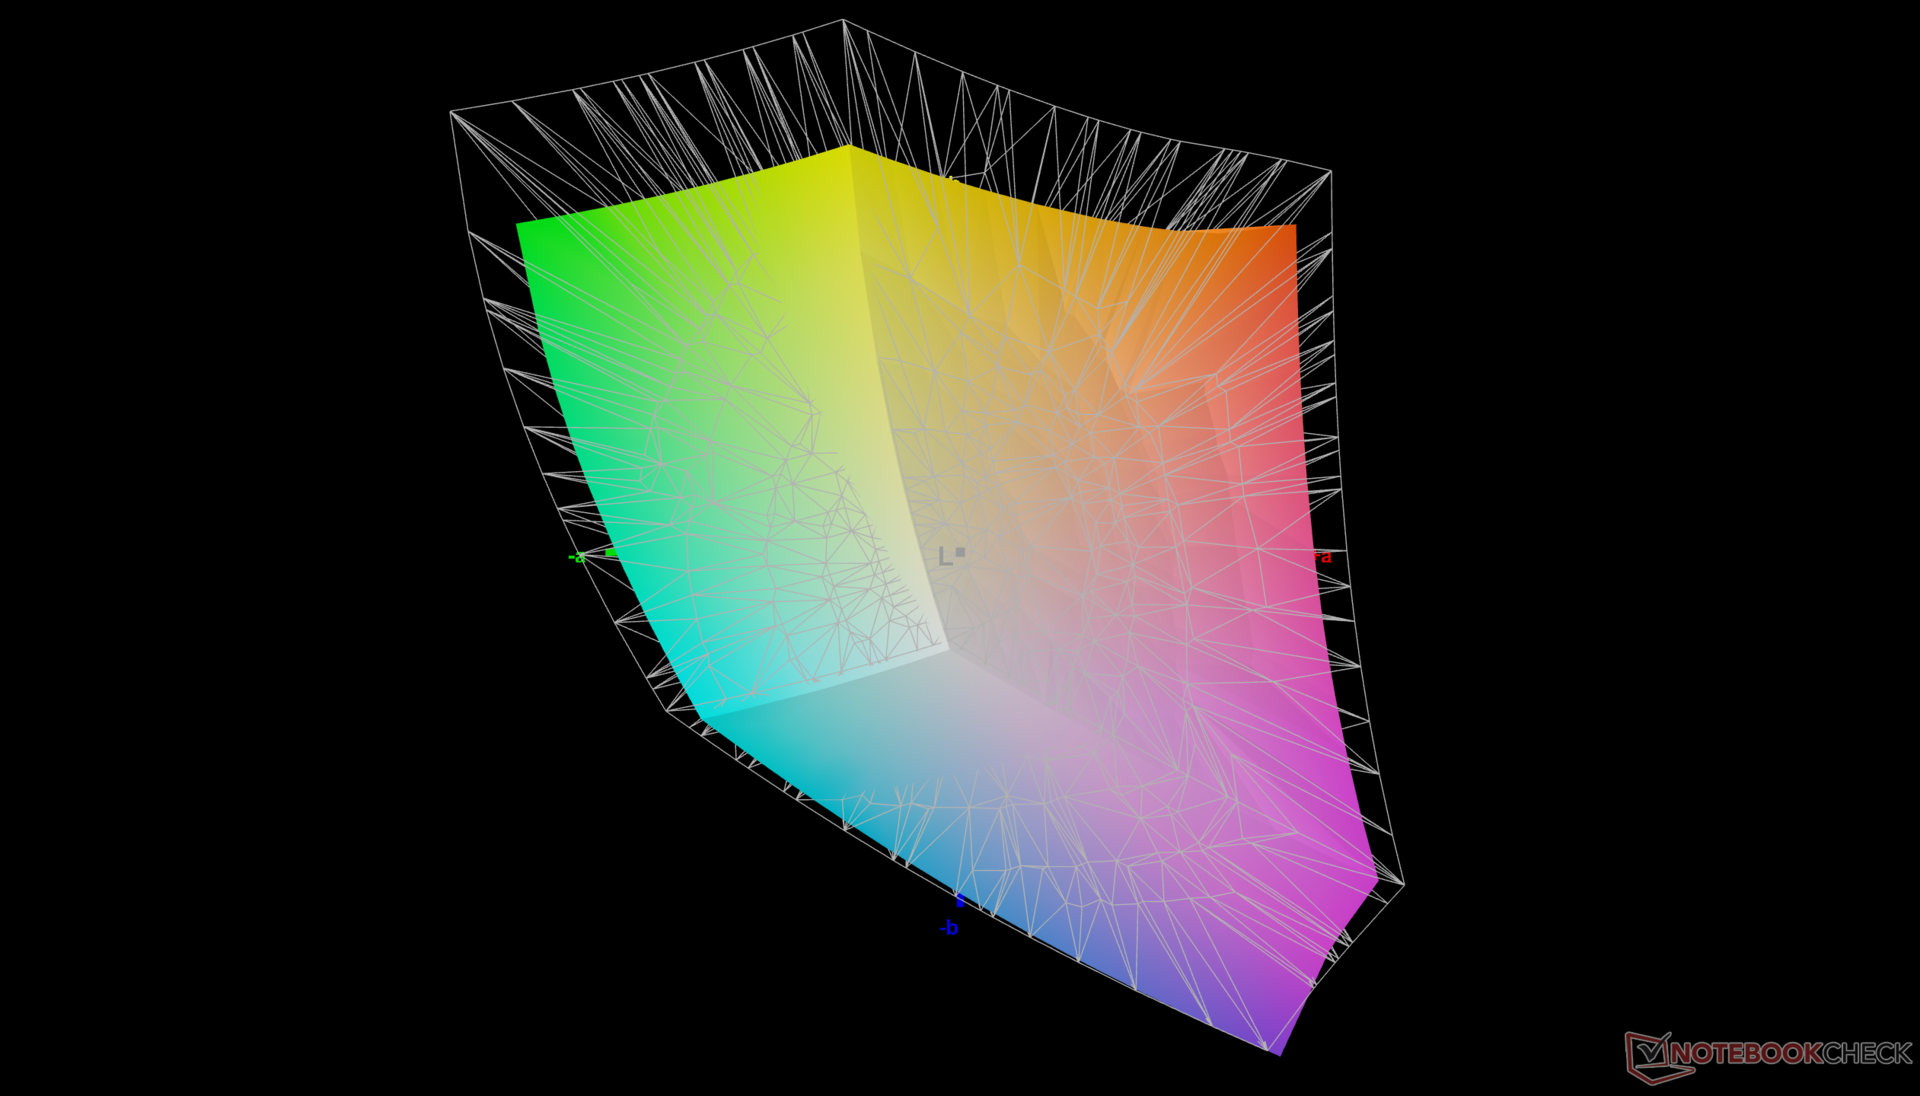
A tela vem bem calibrada, com valores médios de escala de cinza e deltaE de cores de apenas 2 e 2,15, respectivamente. Apenas o sRGB é totalmente suportado em todas as configurações.
Exibir tempos de resposta
| ↔ Tempo de resposta preto para branco | ||
|---|---|---|
| 33.3 ms ... ascensão ↗ e queda ↘ combinadas | ↗ 16.2 ms ascensão | 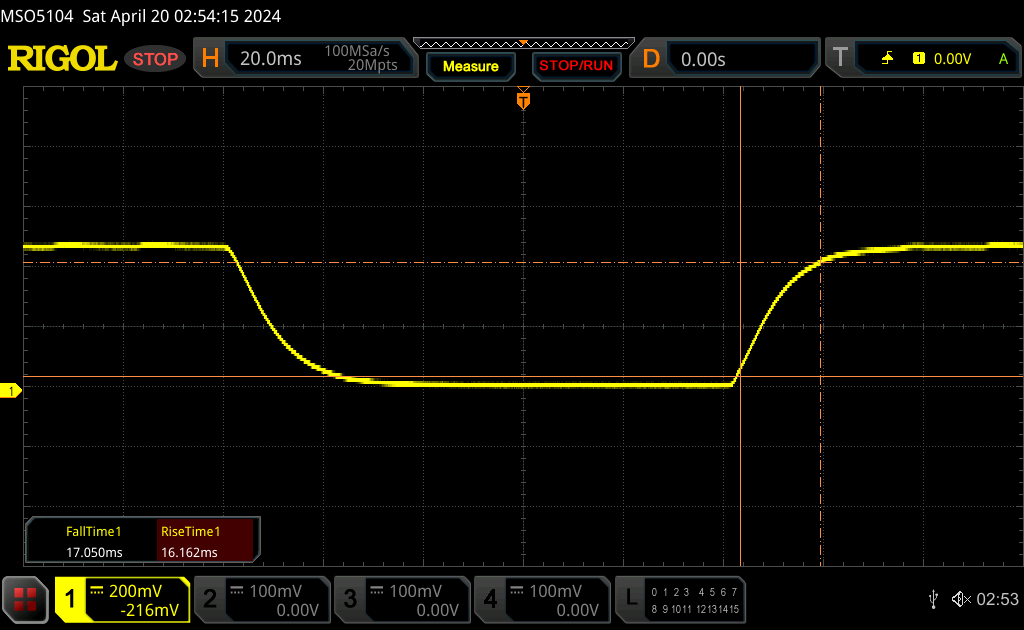 |
| ↘ 17.1 ms queda | ||
| A tela mostra taxas de resposta lentas em nossos testes e será insatisfatória para os jogadores. Em comparação, todos os dispositivos testados variam de 0.1 (mínimo) a 240 (máximo) ms. » 90 % de todos os dispositivos são melhores. Isso significa que o tempo de resposta medido é pior que a média de todos os dispositivos testados (19.8 ms). | ||
| ↔ Tempo de resposta 50% cinza a 80% cinza | ||
| 52.3 ms ... ascensão ↗ e queda ↘ combinadas | ↗ 23.6 ms ascensão | 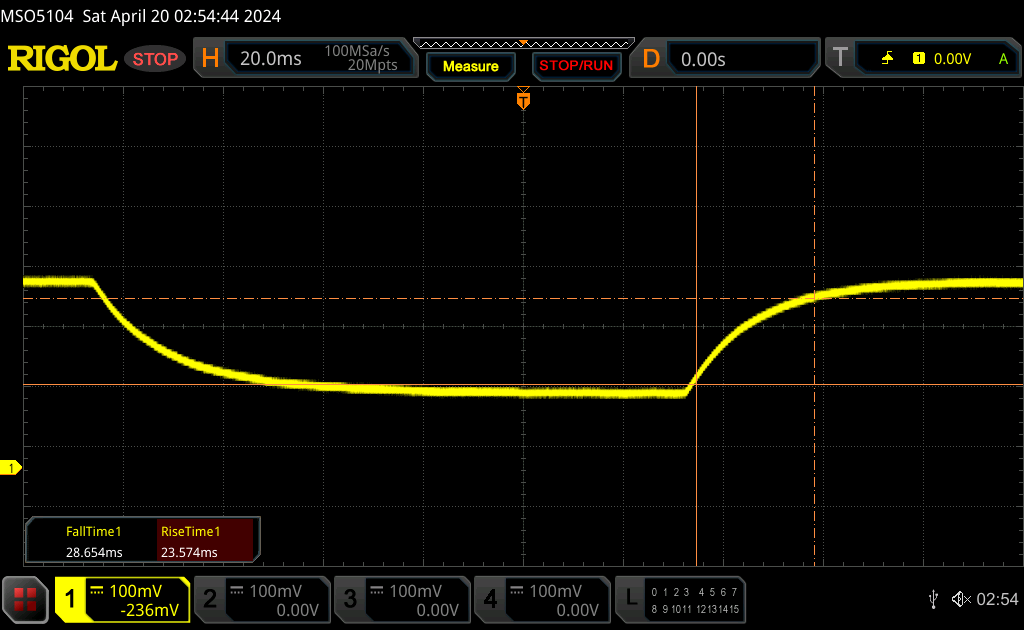 |
| ↘ 28.7 ms queda | ||
| A tela mostra taxas de resposta lentas em nossos testes e será insatisfatória para os jogadores. Em comparação, todos os dispositivos testados variam de 0.165 (mínimo) a 636 (máximo) ms. » 89 % de todos os dispositivos são melhores. Isso significa que o tempo de resposta medido é pior que a média de todos os dispositivos testados (31 ms). | ||
Cintilação da tela / PWM (modulação por largura de pulso)
| Tela tremeluzindo / PWM não detectado | 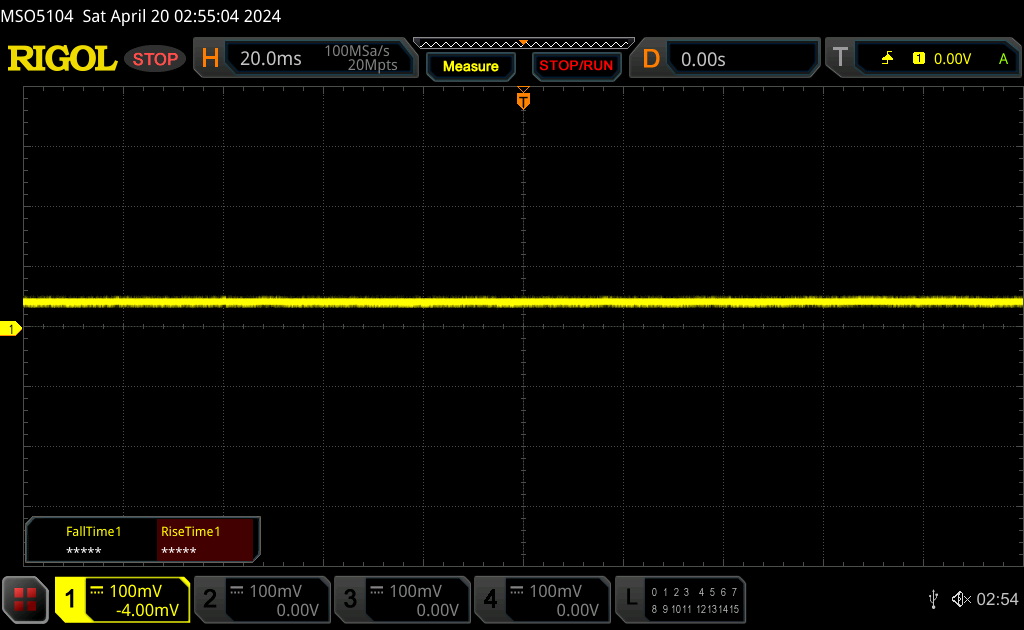 | ||
[pwm_comparison] Em comparação: 52 % de todos os dispositivos testados não usam PWM para escurecer a tela. Se PWM foi detectado, uma média de 7772 (mínimo: 5 - máximo: 343500) Hz foi medida. | |||
Desempenho - Tudo sobre IA
Condições de teste
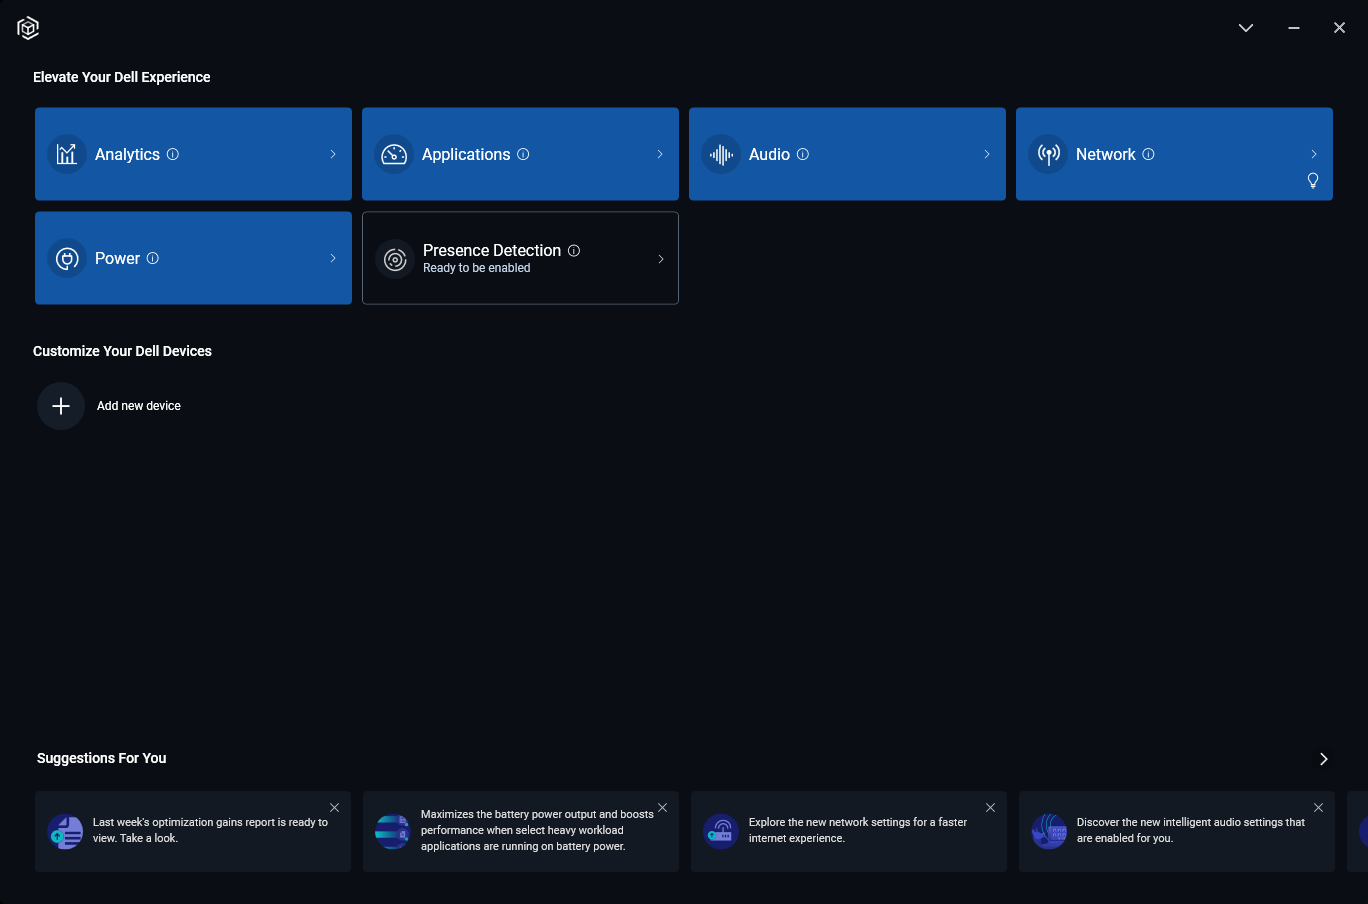
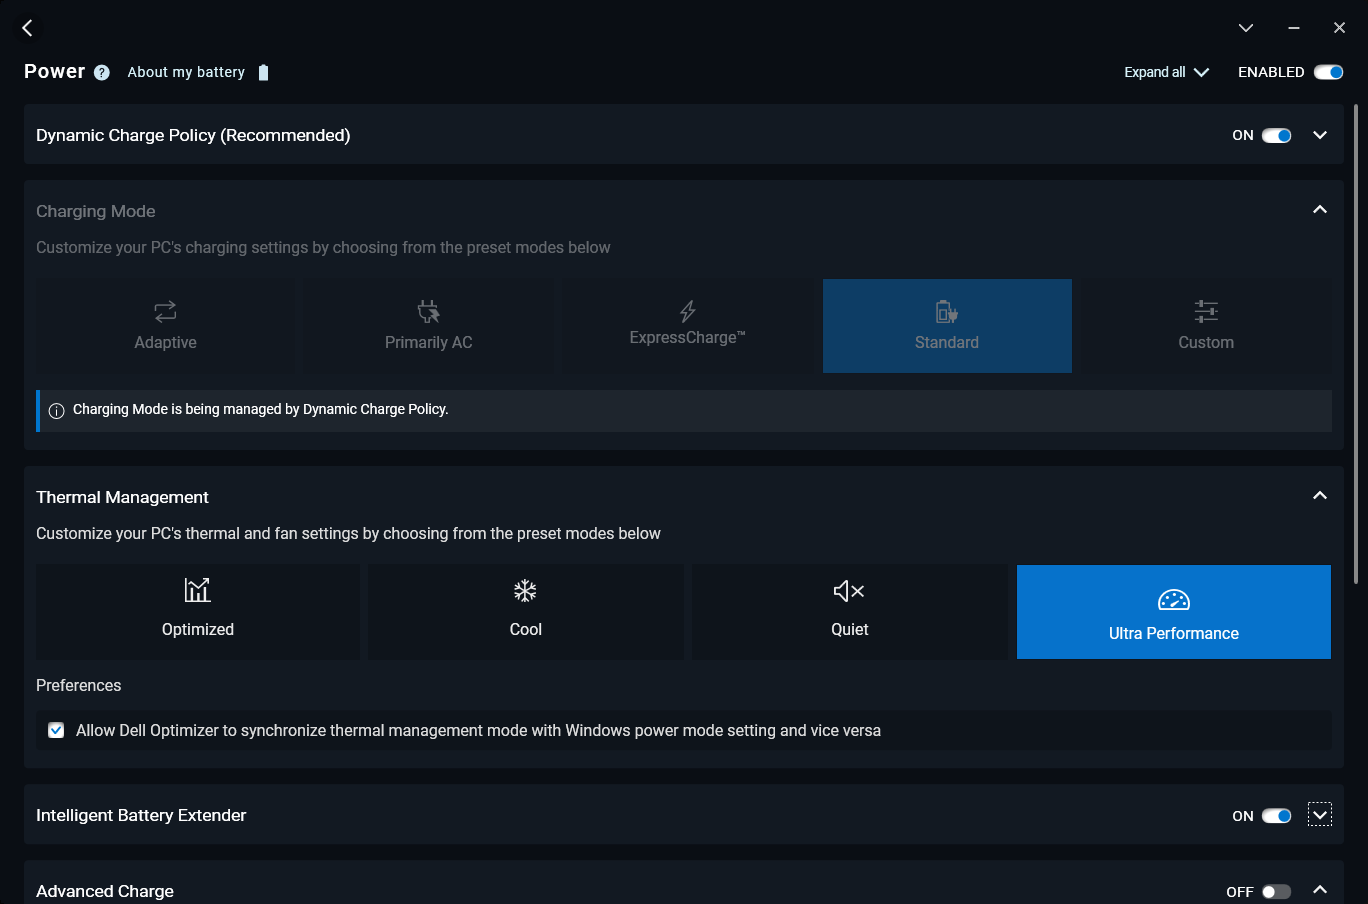
Definimos o Dell Optimizer para o modo Ultra Performance e a GPU para Nvidia antes de executar os benchmarks abaixo.
Processador
O desempenho bruto da CPU permanece estável quando comparado com o Core i9-13900H no Precision 5480 do ano passado. Quaisquer benefícios são marginais, na melhor das hipóteses, em até 5%, mas mesmo esse pequeno delta pode diminuir quando as limitações do Turbo Boost são levadas em conta, conforme mostrado pelos resultados do loop do CineBench R15 xT abaixo.
Se os recursos de IA integrados não forem importantes, então o Ryzen 7 Pro 7840HS em modelos concorrentes como o HP Firefly 14 series pode oferecer essencialmente o mesmo desempenho que o mais recente Core Ultra 9 185H.
O downgrade para o Core Ultra 5 135H deverá afetar o desempenho do processador em 15 a 20 por cento, com base em nossa experiência com o Core i5-13500H core i5-13500H.
Cinebench R15 Multi Loop
Cinebench R23: Multi Core | Single Core
Cinebench R20: CPU (Multi Core) | CPU (Single Core)
Cinebench R15: CPU Multi 64Bit | CPU Single 64Bit
Blender: v2.79 BMW27 CPU
7-Zip 18.03: 7z b 4 | 7z b 4 -mmt1
Geekbench 6.7: Multi-Core | Single-Core
Geekbench 5.5: Multi-Core | Single-Core
HWBOT x265 Benchmark v2.2: 4k Preset
LibreOffice : 20 Documents To PDF
R Benchmark 2.5: Overall mean
| CPU Performance rating | |
| Dell Precision 5480 | |
| HP ZBook Power 15 G10 | |
| Média Intel Core Ultra 9 185H | |
| Dell Precision 5000 5490 | |
| Lenovo ThinkPad P14s G4 21HF0017GE | |
| Lenovo ThinkPad P14s G4 21K5000LGE | |
| HP ZBook Power 15 G9 6B8C4EA -2! | |
| Dell Precision 5000 5470 -2! | |
| Asus VivoBook 14X K3405 -2! | |
| HP ZBook Firefly 14 G10 A | |
| Lenovo ThinkPad P14s G3 AMD 21J6S05000 -2! | |
| HP ZBook Firefly 14 G9-6B8A2EA -2! | |
| Lenovo ThinkPad P15v G3 21EM001AGE -2! | |
| Dell Precision 5000 5560 -4! | |
| Lenovo ThinkPad P15v G2 21A9000XGE -3! | |
| Lenovo ThinkPad P14s Gen1-20Y10002GE -2! | |
| Geekbench 6.7 / Multi-Core | |
| Dell Precision 5480 | |
| Dell Precision 5000 5490 | |
| Média Intel Core Ultra 9 185H (9140 - 14540, n=20) | |
| HP ZBook Power 15 G10 | |
| Lenovo ThinkPad P14s G4 21HF0017GE | |
| Lenovo ThinkPad P14s G4 21K5000LGE | |
| HP ZBook Firefly 14 G10 A | |
| Geekbench 6.7 / Single-Core | |
| Dell Precision 5480 | |
| Lenovo ThinkPad P14s G4 21HF0017GE | |
| HP ZBook Power 15 G10 | |
| Lenovo ThinkPad P14s G4 21K5000LGE | |
| Média Intel Core Ultra 9 185H (1490 - 2573, n=20) | |
| Dell Precision 5000 5490 | |
| HP ZBook Firefly 14 G10 A | |
Cinebench R23: Multi Core | Single Core
Cinebench R20: CPU (Multi Core) | CPU (Single Core)
Cinebench R15: CPU Multi 64Bit | CPU Single 64Bit
Blender: v2.79 BMW27 CPU
7-Zip 18.03: 7z b 4 | 7z b 4 -mmt1
Geekbench 6.7: Multi-Core | Single-Core
Geekbench 5.5: Multi-Core | Single-Core
HWBOT x265 Benchmark v2.2: 4k Preset
LibreOffice : 20 Documents To PDF
R Benchmark 2.5: Overall mean
* ... menor é melhor
AIDA64: FP32 Ray-Trace | FPU Julia | CPU SHA3 | CPU Queen | FPU SinJulia | FPU Mandel | CPU AES | CPU ZLib | FP64 Ray-Trace | CPU PhotoWorxx
| Performance rating | |
| Média Intel Core Ultra 9 185H | |
| Dell Precision 5480 | |
| Dell Precision 5000 5490 | |
| HP ZBook Firefly 14 G10 A | |
| Dell Precision 5000 5470 | |
| Lenovo ThinkPad P14s G4 21HF0017GE | |
| HP ZBook Firefly 14 G9-6B8A2EA | |
| AIDA64 / FP32 Ray-Trace | |
| HP ZBook Firefly 14 G10 A | |
| Média Intel Core Ultra 9 185H (9220 - 18676, n=20) | |
| Dell Precision 5480 | |
| Dell Precision 5000 5490 | |
| Dell Precision 5000 5470 | |
| Lenovo ThinkPad P14s G4 21HF0017GE | |
| HP ZBook Firefly 14 G9-6B8A2EA | |
| AIDA64 / FPU Julia | |
| Média Intel Core Ultra 9 185H (48865 - 96463, n=20) | |
| HP ZBook Firefly 14 G10 A | |
| Dell Precision 5000 5490 | |
| Dell Precision 5480 | |
| Dell Precision 5000 5470 | |
| Lenovo ThinkPad P14s G4 21HF0017GE | |
| HP ZBook Firefly 14 G9-6B8A2EA | |
| AIDA64 / CPU SHA3 | |
| Média Intel Core Ultra 9 185H (2394 - 4534, n=20) | |
| Dell Precision 5000 5490 | |
| Dell Precision 5480 | |
| HP ZBook Firefly 14 G10 A | |
| Dell Precision 5000 5470 | |
| Lenovo ThinkPad P14s G4 21HF0017GE | |
| HP ZBook Firefly 14 G9-6B8A2EA | |
| AIDA64 / CPU Queen | |
| Dell Precision 5480 | |
| Dell Precision 5000 5470 | |
| Lenovo ThinkPad P14s G4 21HF0017GE | |
| Dell Precision 5000 5490 | |
| Média Intel Core Ultra 9 185H (66785 - 95241, n=20) | |
| HP ZBook Firefly 14 G10 A | |
| HP ZBook Firefly 14 G9-6B8A2EA | |
| AIDA64 / FPU SinJulia | |
| HP ZBook Firefly 14 G10 A | |
| Média Intel Core Ultra 9 185H (7255 - 11392, n=20) | |
| Dell Precision 5000 5490 | |
| Dell Precision 5480 | |
| Dell Precision 5000 5470 | |
| Lenovo ThinkPad P14s G4 21HF0017GE | |
| HP ZBook Firefly 14 G9-6B8A2EA | |
| AIDA64 / FPU Mandel | |
| HP ZBook Firefly 14 G10 A | |
| Média Intel Core Ultra 9 185H (24004 - 48020, n=20) | |
| Dell Precision 5480 | |
| Dell Precision 5000 5490 | |
| Dell Precision 5000 5470 | |
| Lenovo ThinkPad P14s G4 21HF0017GE | |
| HP ZBook Firefly 14 G9-6B8A2EA | |
| AIDA64 / CPU AES | |
| Média Intel Core Ultra 9 185H (53116 - 154066, n=20) | |
| Dell Precision 5000 5490 | |
| Dell Precision 5480 | |
| HP ZBook Firefly 14 G10 A | |
| Lenovo ThinkPad P14s G4 21HF0017GE | |
| HP ZBook Firefly 14 G9-6B8A2EA | |
| Dell Precision 5000 5470 | |
| AIDA64 / CPU ZLib | |
| Média Intel Core Ultra 9 185H (678 - 1341, n=20) | |
| Dell Precision 5000 5490 | |
| Dell Precision 5480 | |
| Lenovo ThinkPad P14s G4 21HF0017GE | |
| HP ZBook Firefly 14 G10 A | |
| HP ZBook Firefly 14 G9-6B8A2EA | |
| Dell Precision 5000 5470 | |
| AIDA64 / FP64 Ray-Trace | |
| HP ZBook Firefly 14 G10 A | |
| Média Intel Core Ultra 9 185H (4428 - 10078, n=20) | |
| Dell Precision 5480 | |
| Dell Precision 5000 5490 | |
| Dell Precision 5000 5470 | |
| Lenovo ThinkPad P14s G4 21HF0017GE | |
| HP ZBook Firefly 14 G9-6B8A2EA | |
| AIDA64 / CPU PhotoWorxx | |
| Dell Precision 5000 5490 | |
| Média Intel Core Ultra 9 185H (44547 - 53918, n=20) | |
| Dell Precision 5480 | |
| Dell Precision 5000 5470 | |
| HP ZBook Firefly 14 G9-6B8A2EA | |
| Lenovo ThinkPad P14s G4 21HF0017GE | |
| HP ZBook Firefly 14 G10 A | |
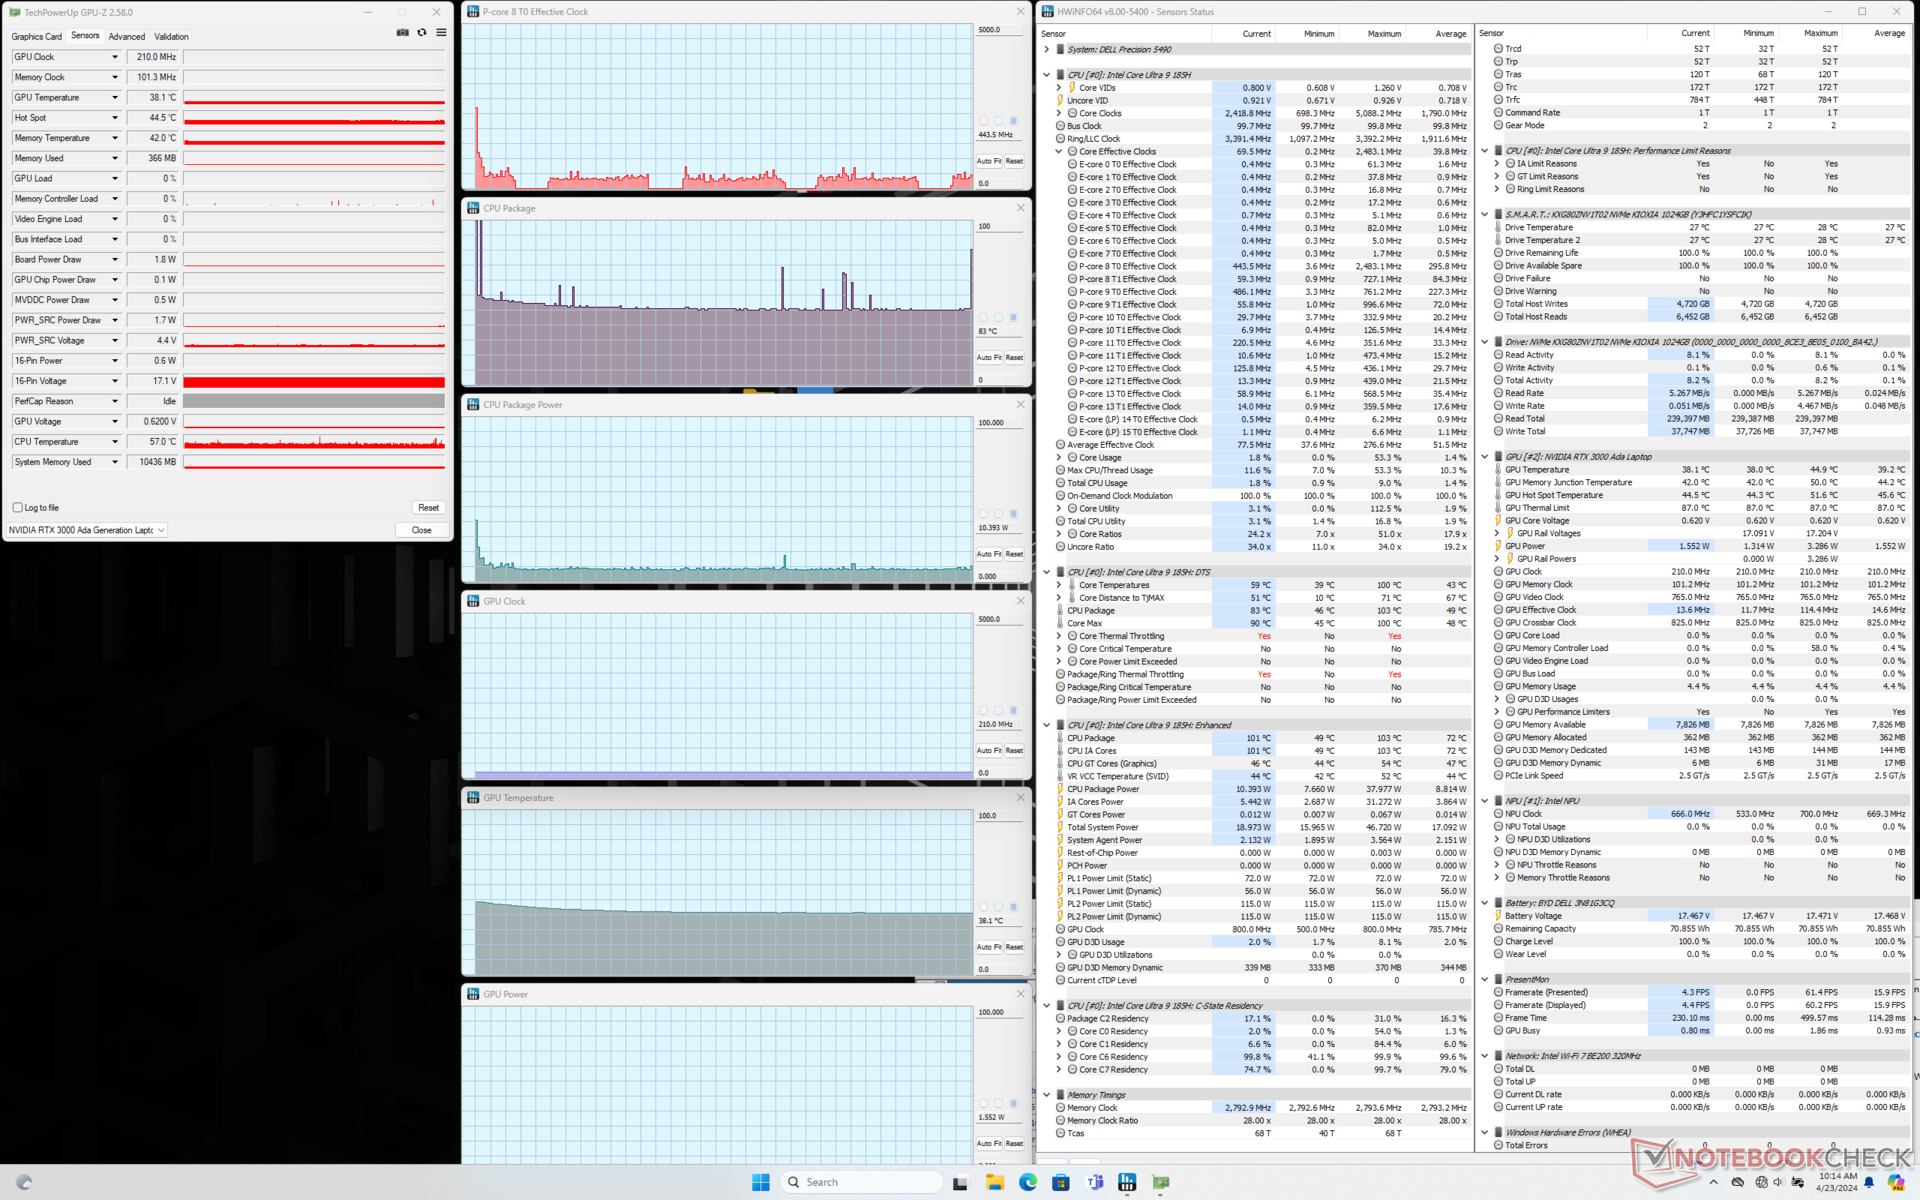
Teste de estresse
A taxa de clock do núcleo e o consumo de energia da placa chegavam a 3,3 GHz e 92 W, respectivamente, ao iniciar o estresse do Prime95. No entanto, isso cairia rapidamente para 2,2 GHz e 55 W em média para manter uma temperatura de núcleo muito alta de 101 C. Os resultados são semelhantes aos que registramos no Precision 5480 do ano passado, se não um pouco mais quentes.
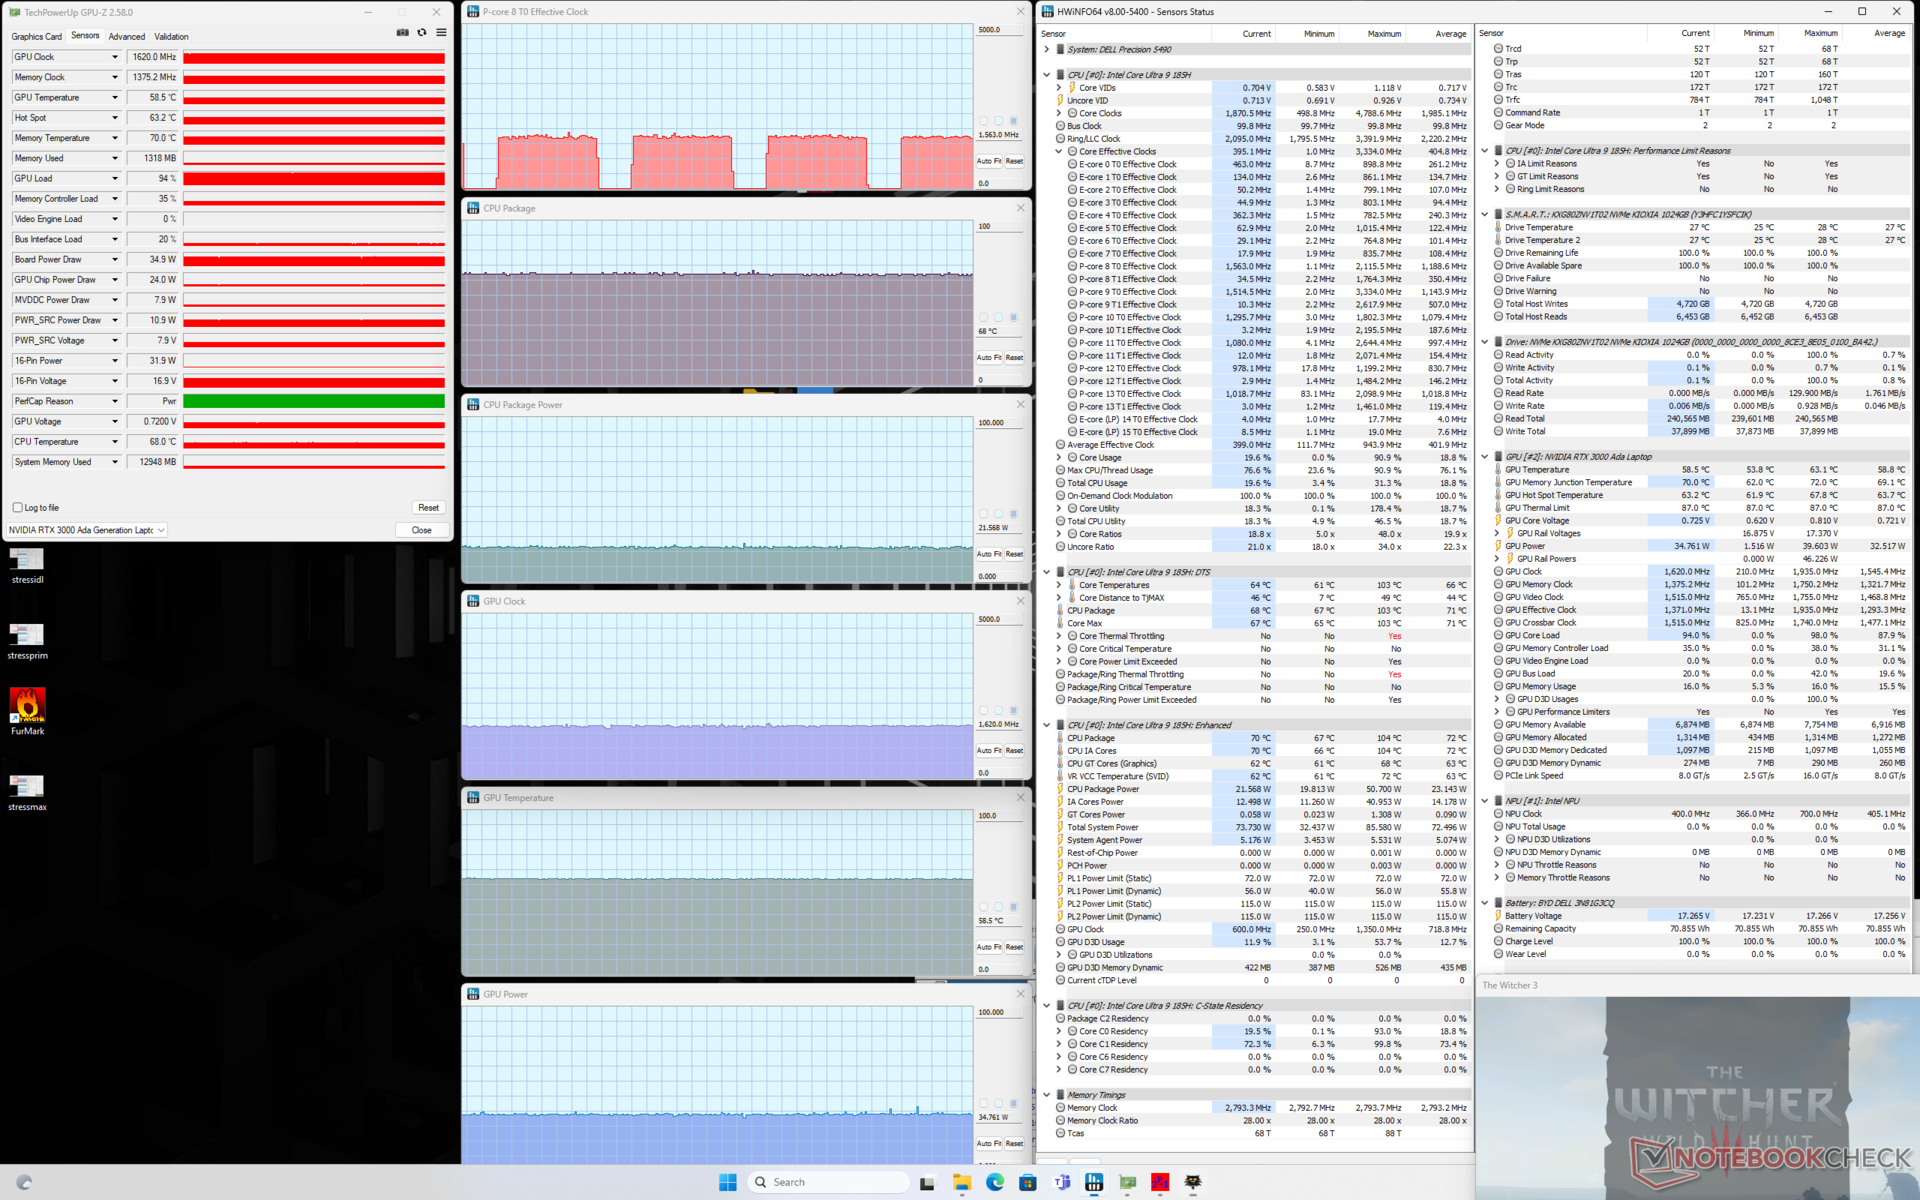
É interessante notar que o consumo de energia da placa da GPU ao executar o Witcher 3 se estabilizaria em 35 W, enquanto a GPU do Precision 5480 do ano passado se estabilizaria em 45 W, mesmo quando configurada no modo Ultra Performance. O consumo de energia da placa pode explicar parcialmente o desempenho gráfico um pouco mais lento na seção Desempenho da GPU abaixo.
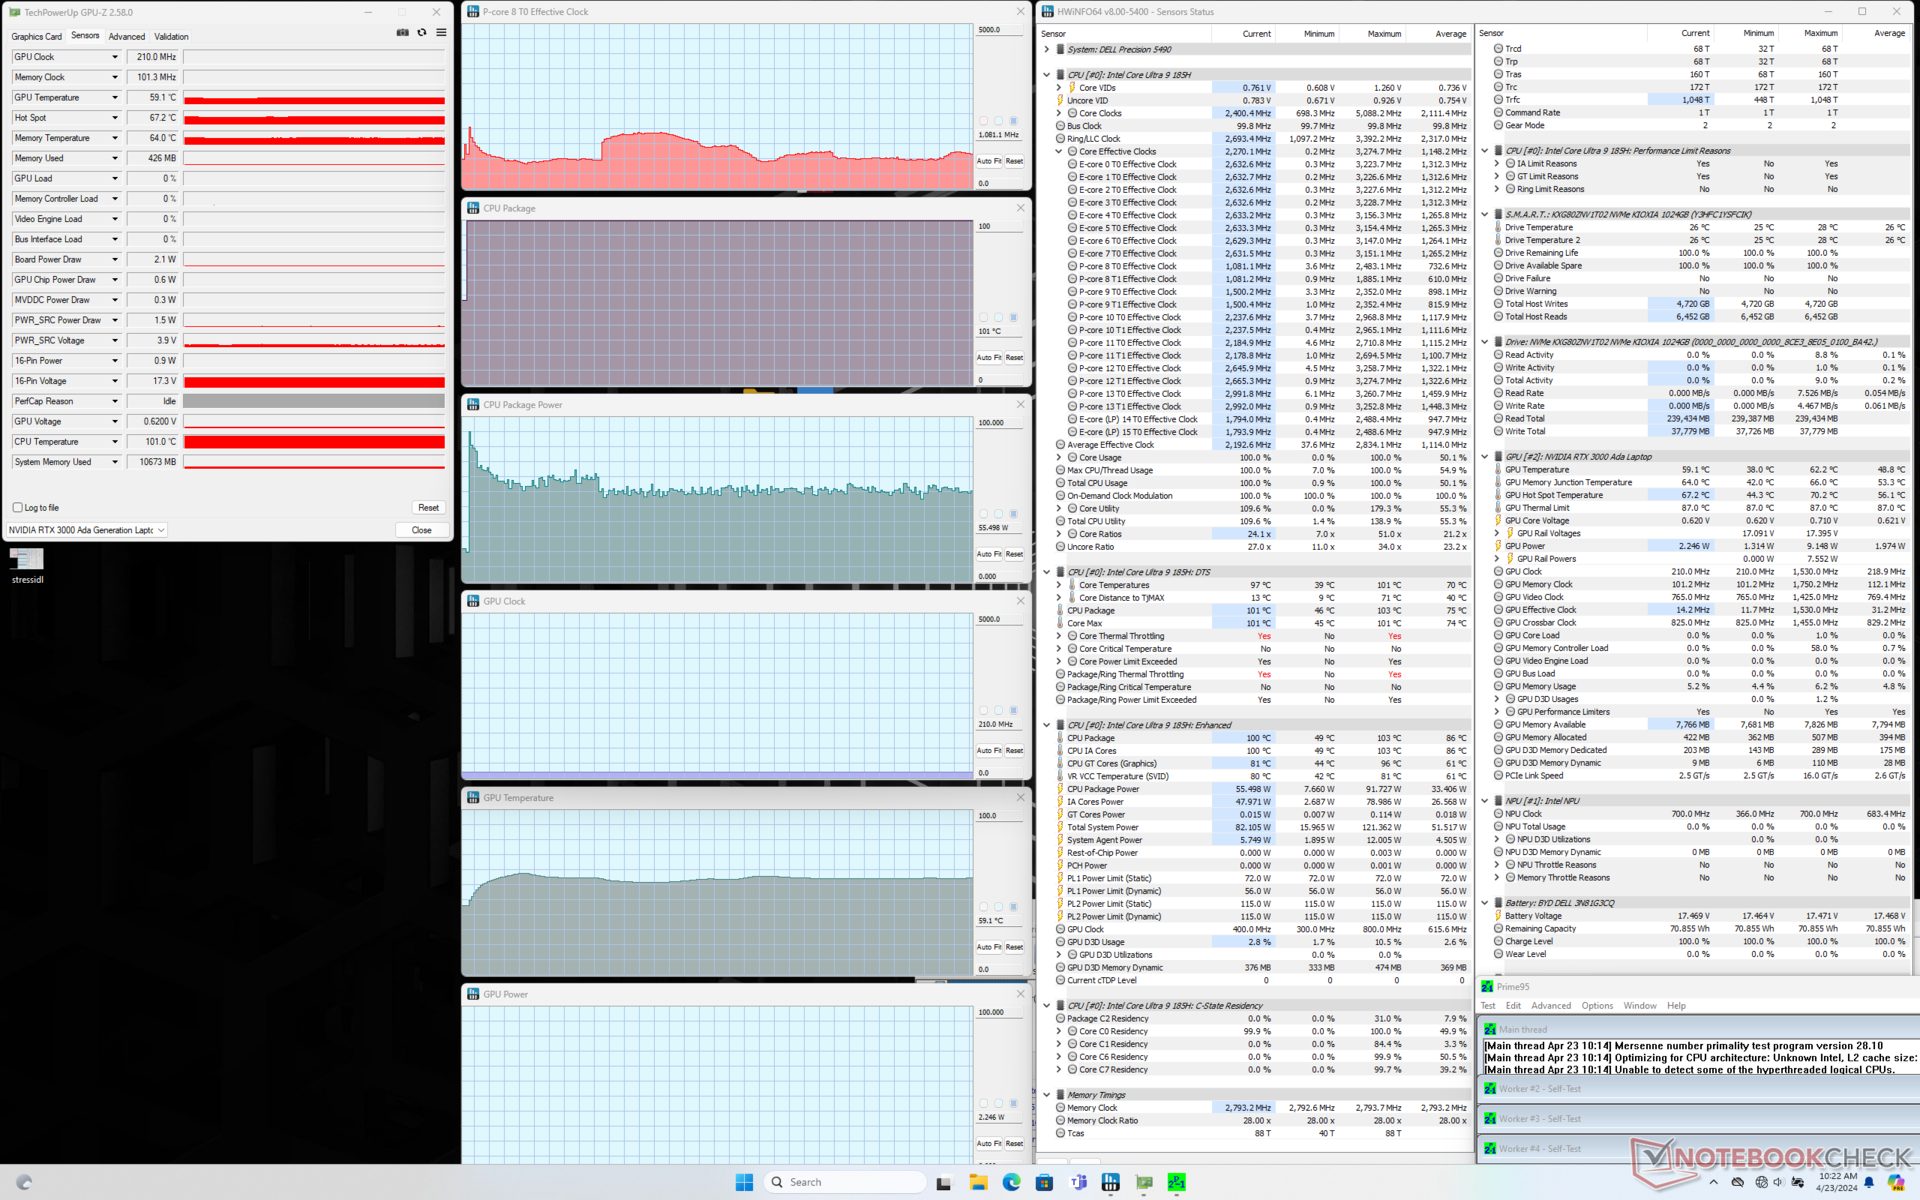
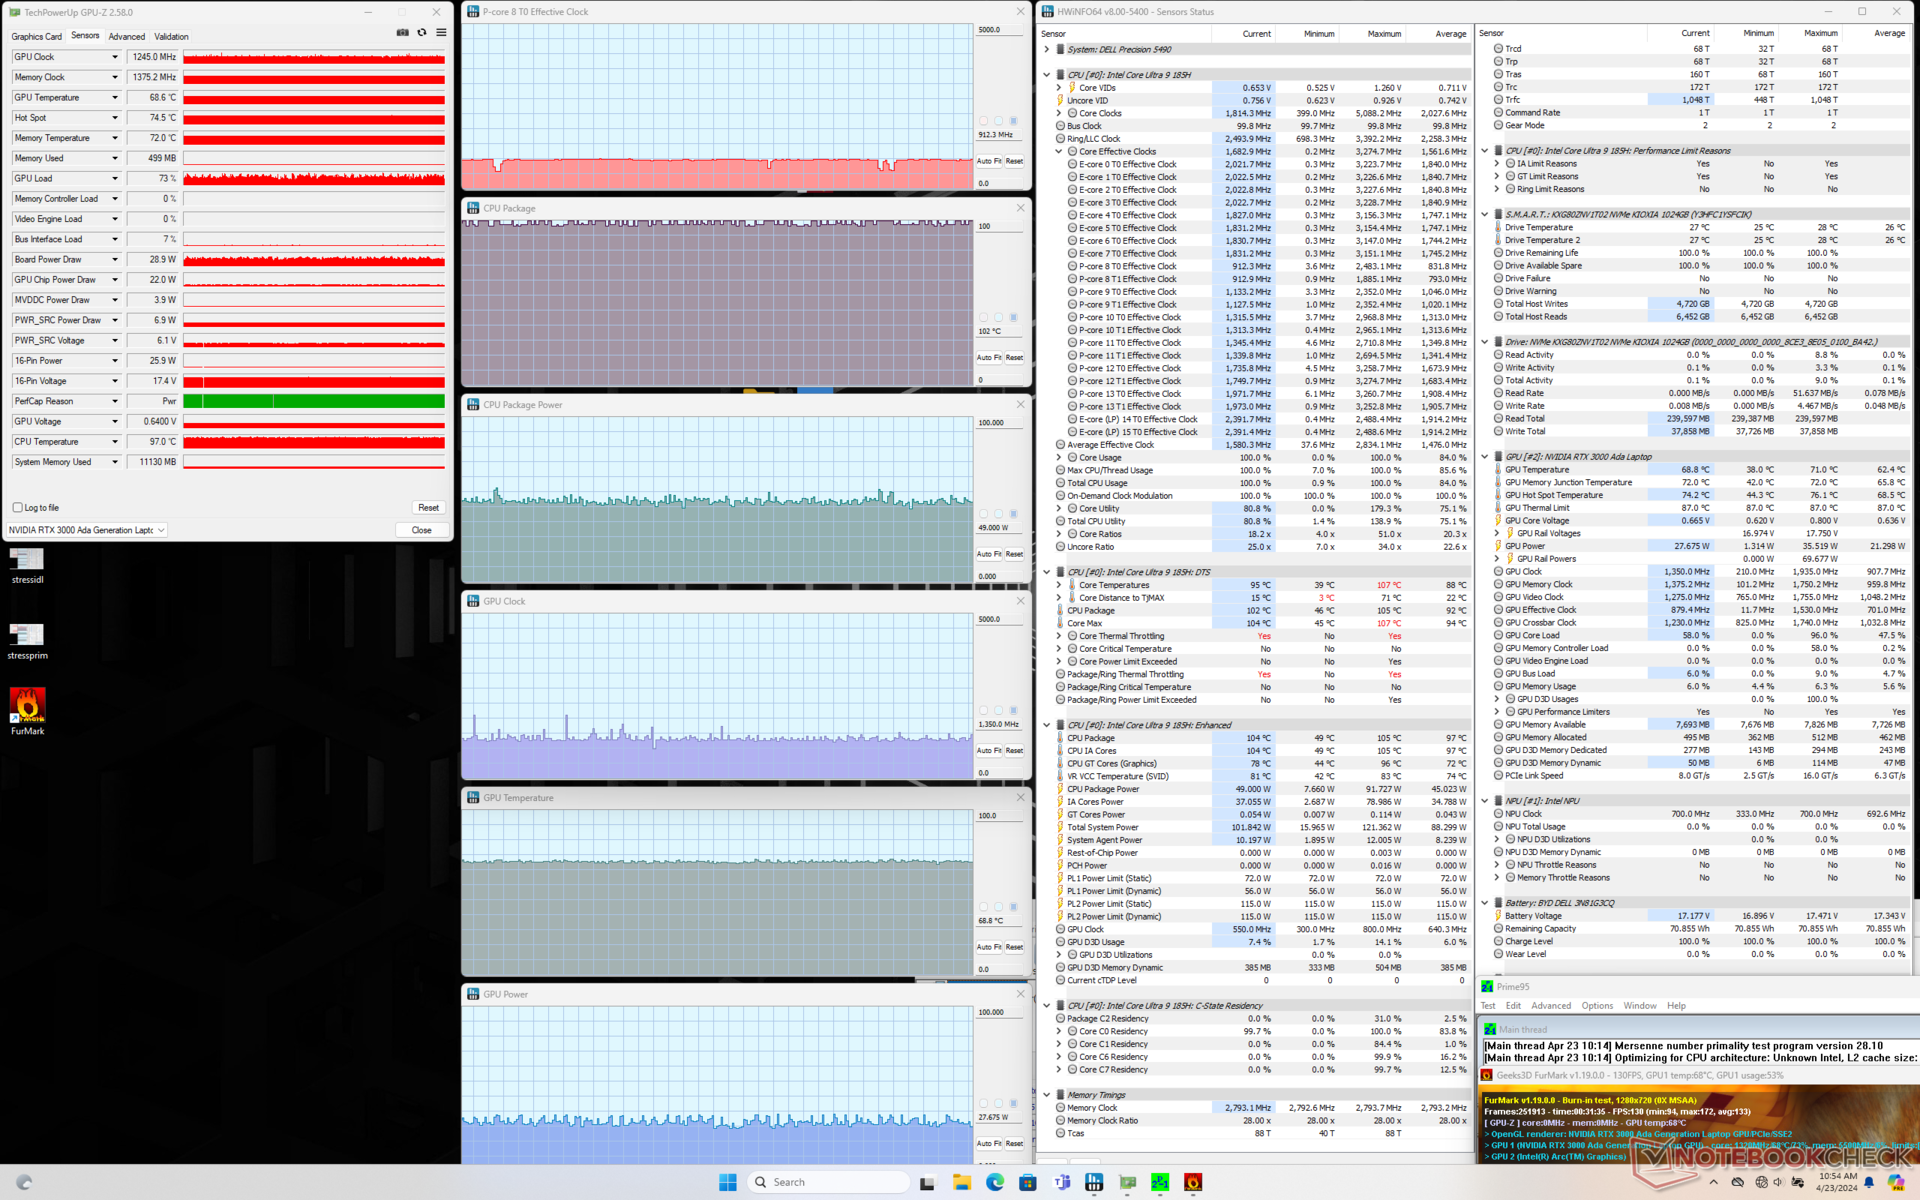
| CPU Clock (GHz) | GPU Clock (MHz) | Temperatura média da CPU (°C) | Temperatura média da GPU (°C) | |
| Sistema ocioso | -- | -- | 45 | 38 |
| Estresse doPrime95 | 2.2 | -- | 101 | 59 |
| Prime95 + FurMark Stress | 1.6 | ~1350 | 101 | 69 |
| Witcher 3 Estresse | 0,4 | 1620 | 68 | 59 |
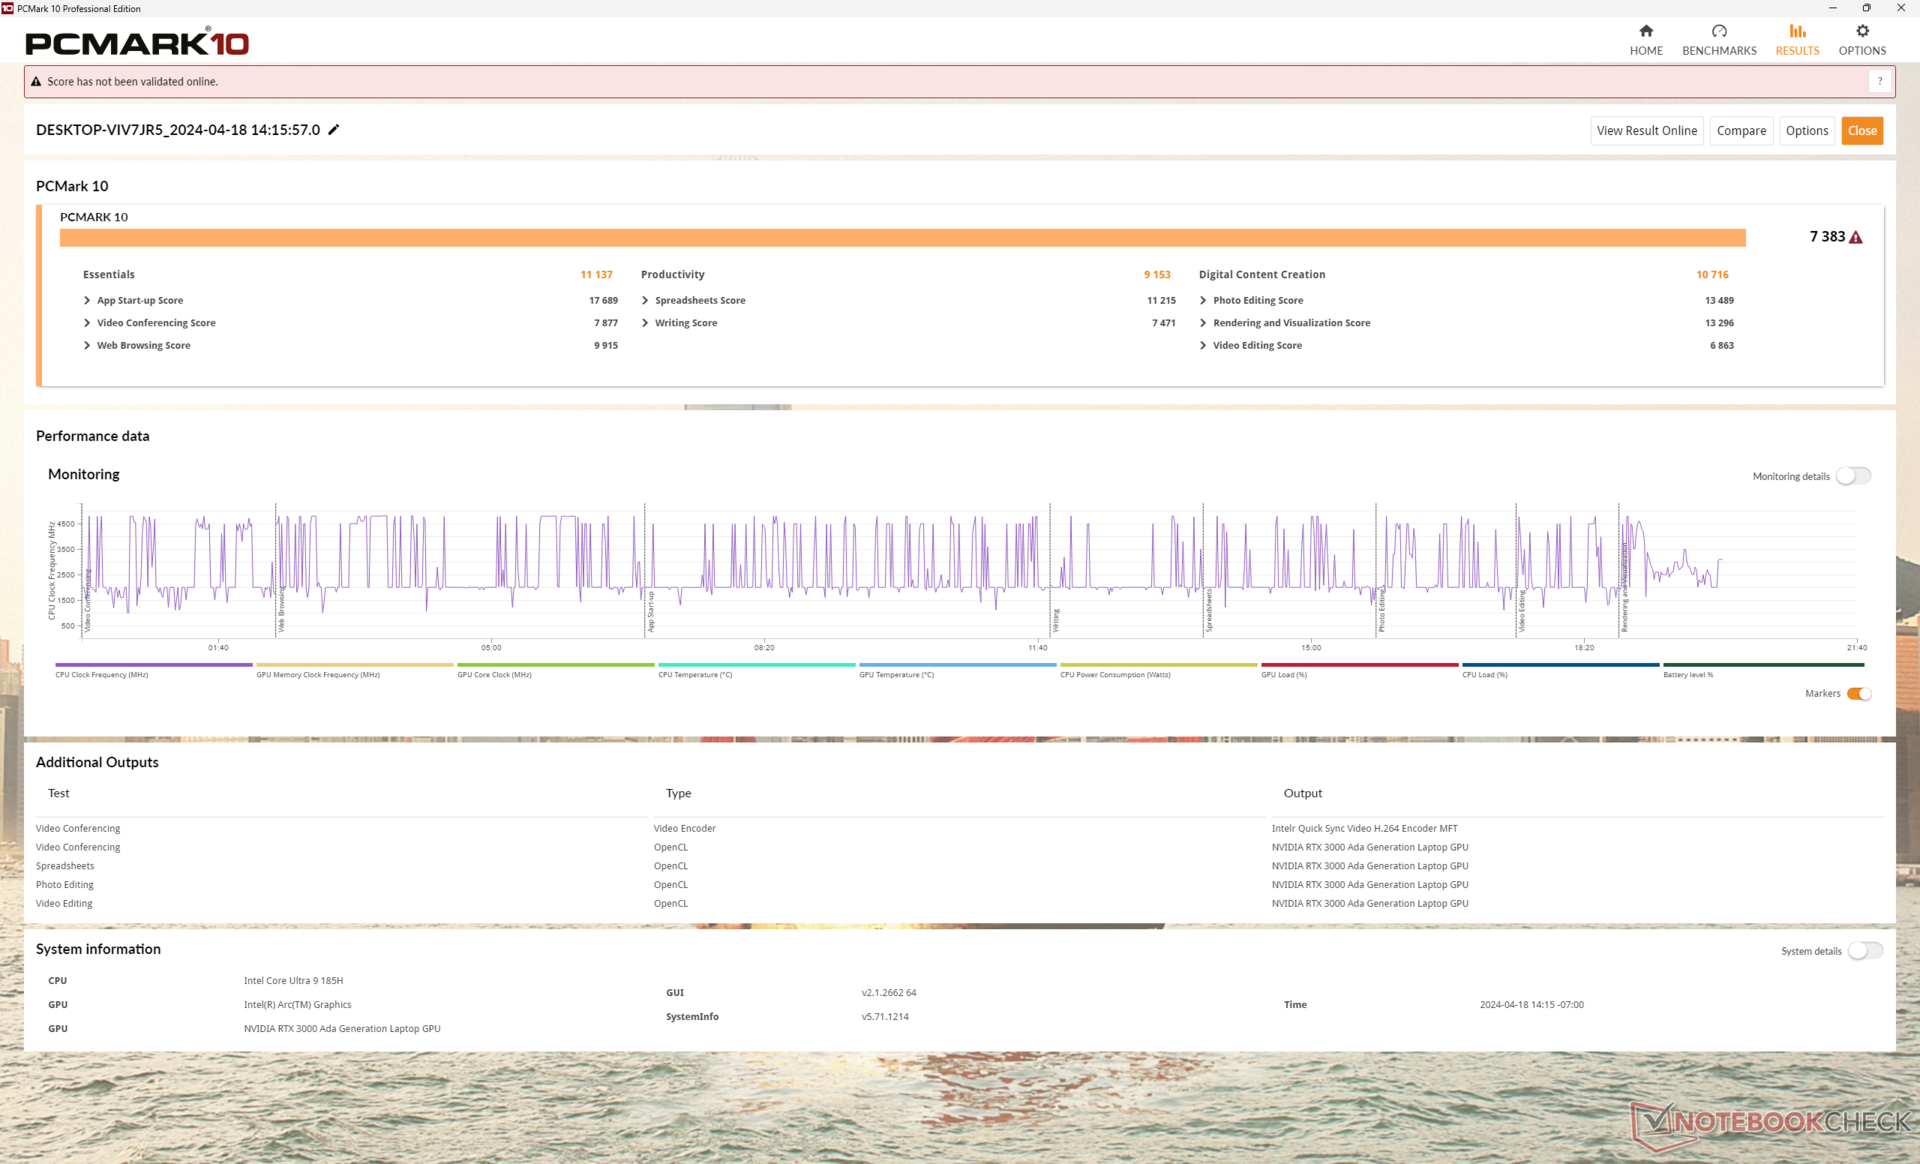
Desempenho do sistema
Os resultados do PCMark são praticamente idênticos aos que registramos no Precision 5480 do ano passado, o que sugere que não há grandes vantagens de desempenho quando se trata de multitarefa geral ou tarefas de edição de vídeo. Os benchmarks PCMark AI, que ainda não executamos, podem diferenciar melhor os notebooks com NPUs integradas, como o nosso Precision 5490, dos modelos mais antigos.
CrossMark: Overall | Productivity | Creativity | Responsiveness
WebXPRT 3: Overall
WebXPRT 4: Overall
Mozilla Kraken 1.1: Total
| PCMark 10 / Score | |
| Dell Precision 5480 | |
| Média Intel Core Ultra 9 185H, NVIDIA RTX 3000 Ada Generation Laptop (7383 - 7537, n=2) | |
| Dell Precision 5000 5490 | |
| Lenovo ThinkPad P14s G4 21HF0017GE | |
| Dell Precision 5000 5470 | |
| HP ZBook Firefly 14 G10 A | |
| HP ZBook Firefly 14 G9-6B8A2EA | |
| PCMark 10 / Essentials | |
| Dell Precision 5480 | |
| Dell Precision 5000 5490 | |
| Dell Precision 5000 5470 | |
| Média Intel Core Ultra 9 185H, NVIDIA RTX 3000 Ada Generation Laptop (10514 - 11137, n=2) | |
| Lenovo ThinkPad P14s G4 21HF0017GE | |
| HP ZBook Firefly 14 G9-6B8A2EA | |
| HP ZBook Firefly 14 G10 A | |
| PCMark 10 / Productivity | |
| Lenovo ThinkPad P14s G4 21HF0017GE | |
| HP ZBook Firefly 14 G9-6B8A2EA | |
| Dell Precision 5480 | |
| Média Intel Core Ultra 9 185H, NVIDIA RTX 3000 Ada Generation Laptop (9153 - 9356, n=2) | |
| HP ZBook Firefly 14 G10 A | |
| Dell Precision 5000 5490 | |
| Dell Precision 5000 5470 | |
| PCMark 10 / Digital Content Creation | |
| Dell Precision 5480 | |
| Média Intel Core Ultra 9 185H, NVIDIA RTX 3000 Ada Generation Laptop (10716 - 11811, n=2) | |
| Dell Precision 5000 5490 | |
| Dell Precision 5000 5470 | |
| Lenovo ThinkPad P14s G4 21HF0017GE | |
| HP ZBook Firefly 14 G10 A | |
| HP ZBook Firefly 14 G9-6B8A2EA | |
| CrossMark / Overall | |
| Dell Precision 5480 | |
| Lenovo ThinkPad P14s G4 21HF0017GE | |
| Dell Precision 5000 5470 | |
| Média Intel Core Ultra 9 185H, NVIDIA RTX 3000 Ada Generation Laptop (1754 - 1770, n=2) | |
| Dell Precision 5000 5490 | |
| HP ZBook Firefly 14 G9-6B8A2EA | |
| CrossMark / Productivity | |
| Dell Precision 5480 | |
| Lenovo ThinkPad P14s G4 21HF0017GE | |
| Dell Precision 5000 5470 | |
| Média Intel Core Ultra 9 185H, NVIDIA RTX 3000 Ada Generation Laptop (1643 - 1686, n=2) | |
| Dell Precision 5000 5490 | |
| HP ZBook Firefly 14 G9-6B8A2EA | |
| CrossMark / Creativity | |
| Dell Precision 5480 | |
| Dell Precision 5000 5470 | |
| Lenovo ThinkPad P14s G4 21HF0017GE | |
| Dell Precision 5000 5490 | |
| Média Intel Core Ultra 9 185H, NVIDIA RTX 3000 Ada Generation Laptop (1981 - 2001, n=2) | |
| HP ZBook Firefly 14 G9-6B8A2EA | |
| CrossMark / Responsiveness | |
| Dell Precision 5480 | |
| Lenovo ThinkPad P14s G4 21HF0017GE | |
| Dell Precision 5000 5470 | |
| Média Intel Core Ultra 9 185H, NVIDIA RTX 3000 Ada Generation Laptop (1438 - 1458, n=2) | |
| Dell Precision 5000 5490 | |
| HP ZBook Firefly 14 G9-6B8A2EA | |
| WebXPRT 3 / Overall | |
| Dell Precision 5480 | |
| Dell Precision 5000 5470 | |
| Lenovo ThinkPad P14s G4 21HF0017GE | |
| Média Intel Core Ultra 9 185H, NVIDIA RTX 3000 Ada Generation Laptop (286 - 295, n=2) | |
| Dell Precision 5000 5490 | |
| HP ZBook Firefly 14 G9-6B8A2EA | |
| HP ZBook Firefly 14 G10 A | |
| HP ZBook Firefly 14 G10 A | |
| WebXPRT 4 / Overall | |
| Dell Precision 5480 | |
| Lenovo ThinkPad P14s G4 21HF0017GE | |
| Lenovo ThinkPad P14s G4 21HF0017GE | |
| Dell Precision 5000 5470 | |
| Dell Precision 5000 5490 | |
| Média Intel Core Ultra 9 185H, NVIDIA RTX 3000 Ada Generation Laptop (261 - 268, n=2) | |
| HP ZBook Firefly 14 G9-6B8A2EA | |
| Mozilla Kraken 1.1 / Total | |
| HP ZBook Firefly 14 G10 A | |
| HP ZBook Firefly 14 G10 A | |
| HP ZBook Firefly 14 G9-6B8A2EA | |
| Dell Precision 5000 5470 | |
| Dell Precision 5000 5490 | |
| Média Intel Core Ultra 9 185H, NVIDIA RTX 3000 Ada Generation Laptop (515 - 522, n=2) | |
| Dell Precision 5480 | |
| Lenovo ThinkPad P14s G4 21HF0017GE | |
* ... menor é melhor
| PCMark 10 Score | 7383 pontos | |
Ajuda | ||
| AIDA64 / Memory Copy | |
| Dell Precision 5000 5490 | |
| Média Intel Core Ultra 9 185H (69929 - 95718, n=20) | |
| Dell Precision 5480 | |
| Dell Precision 5000 5470 | |
| HP ZBook Firefly 14 G10 A | |
| Lenovo ThinkPad P14s G4 21HF0017GE | |
| HP ZBook Firefly 14 G9-6B8A2EA | |
| AIDA64 / Memory Read | |
| Dell Precision 5000 5490 | |
| Média Intel Core Ultra 9 185H (64619 - 87768, n=20) | |
| Dell Precision 5000 5470 | |
| Dell Precision 5480 | |
| HP ZBook Firefly 14 G9-6B8A2EA | |
| HP ZBook Firefly 14 G10 A | |
| Lenovo ThinkPad P14s G4 21HF0017GE | |
| AIDA64 / Memory Write | |
| Dell Precision 5000 5490 | |
| Dell Precision 5480 | |
| HP ZBook Firefly 14 G10 A | |
| Média Intel Core Ultra 9 185H (51114 - 93871, n=20) | |
| Lenovo ThinkPad P14s G4 21HF0017GE | |
| HP ZBook Firefly 14 G9-6B8A2EA | |
| Dell Precision 5000 5470 | |
| AIDA64 / Memory Latency | |
| Média Intel Core Ultra 9 185H (121.4 - 259, n=20) | |
| Dell Precision 5000 5490 | |
| Dell Precision 5000 5470 | |
| HP ZBook Firefly 14 G10 A | |
| Lenovo ThinkPad P14s G4 21HF0017GE | |
| Dell Precision 5480 | |
| HP ZBook Firefly 14 G9-6B8A2EA | |
* ... menor é melhor
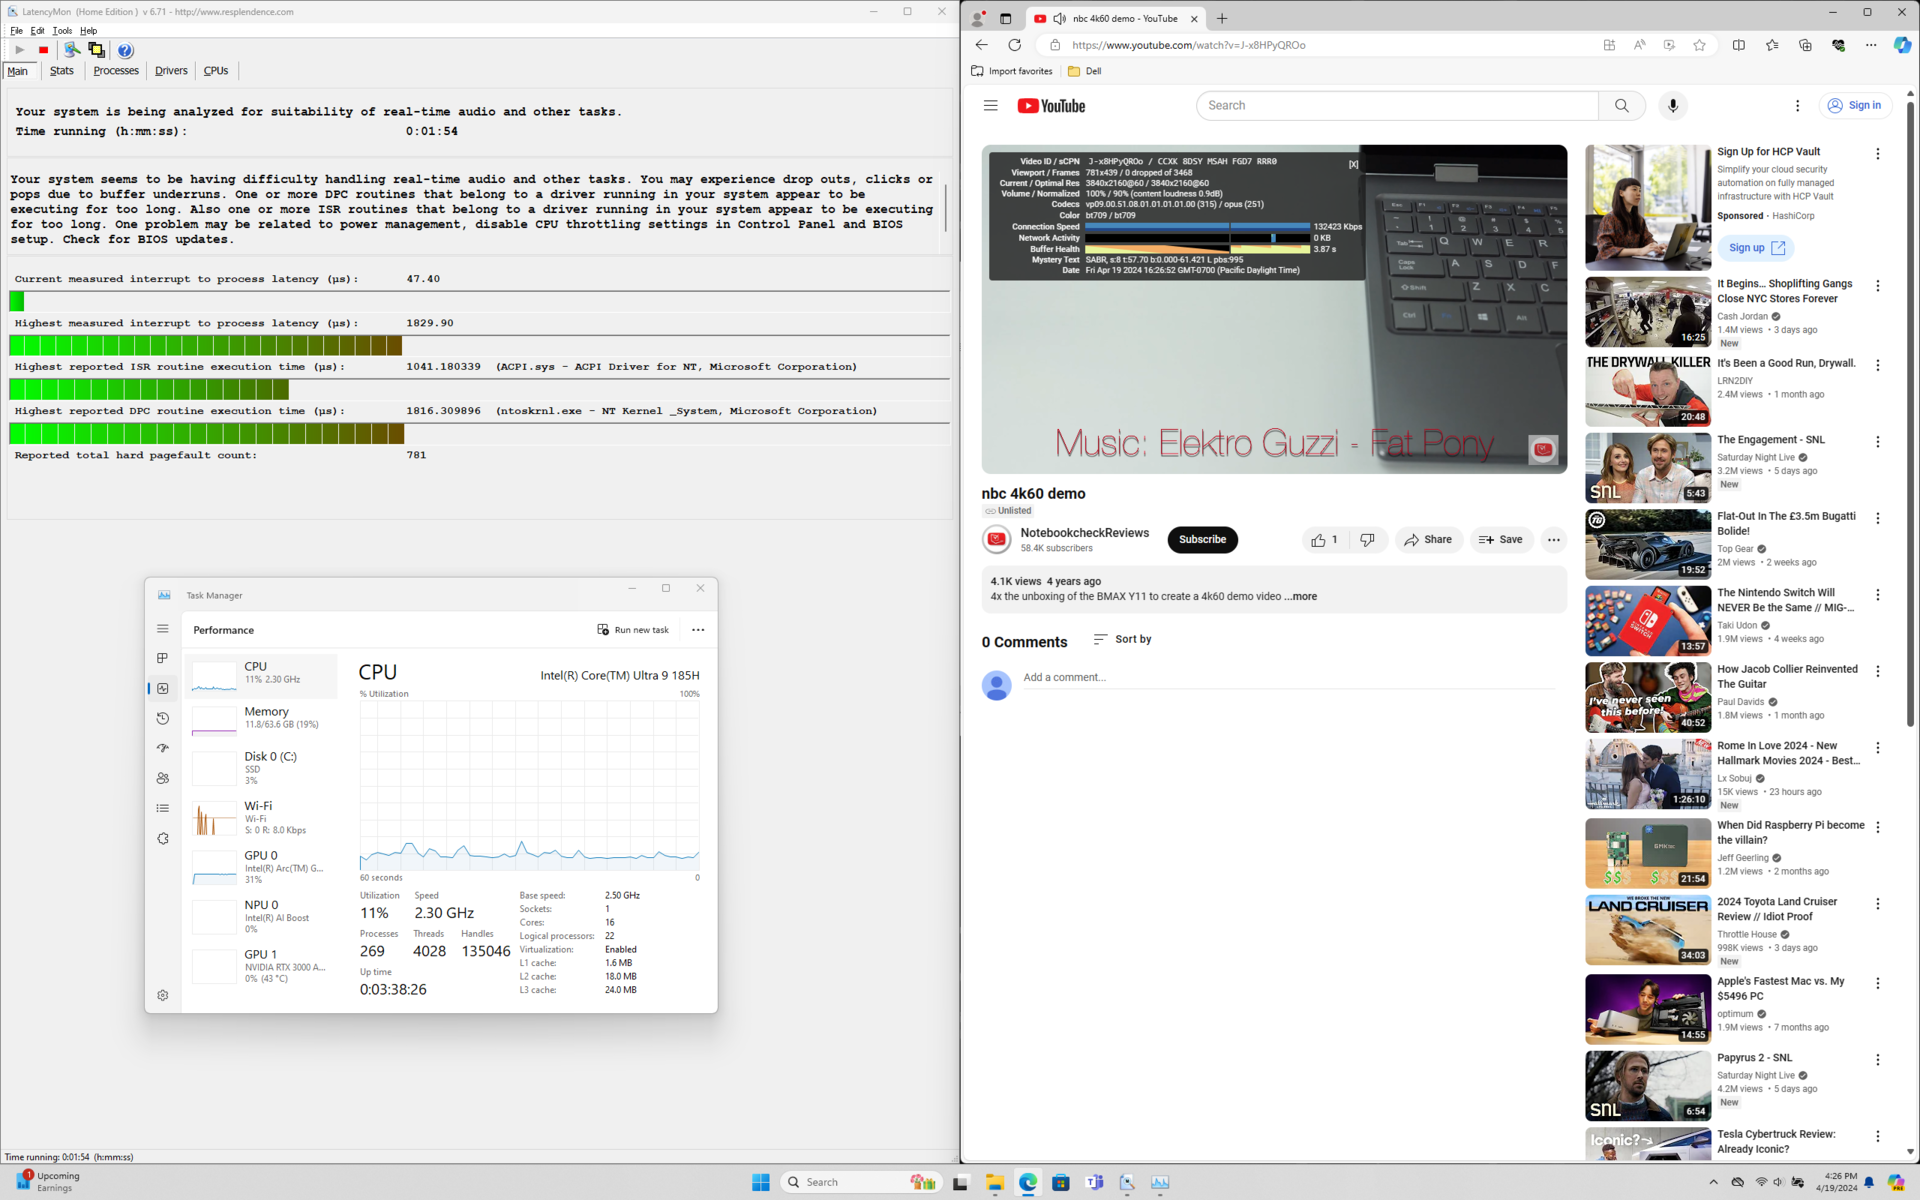
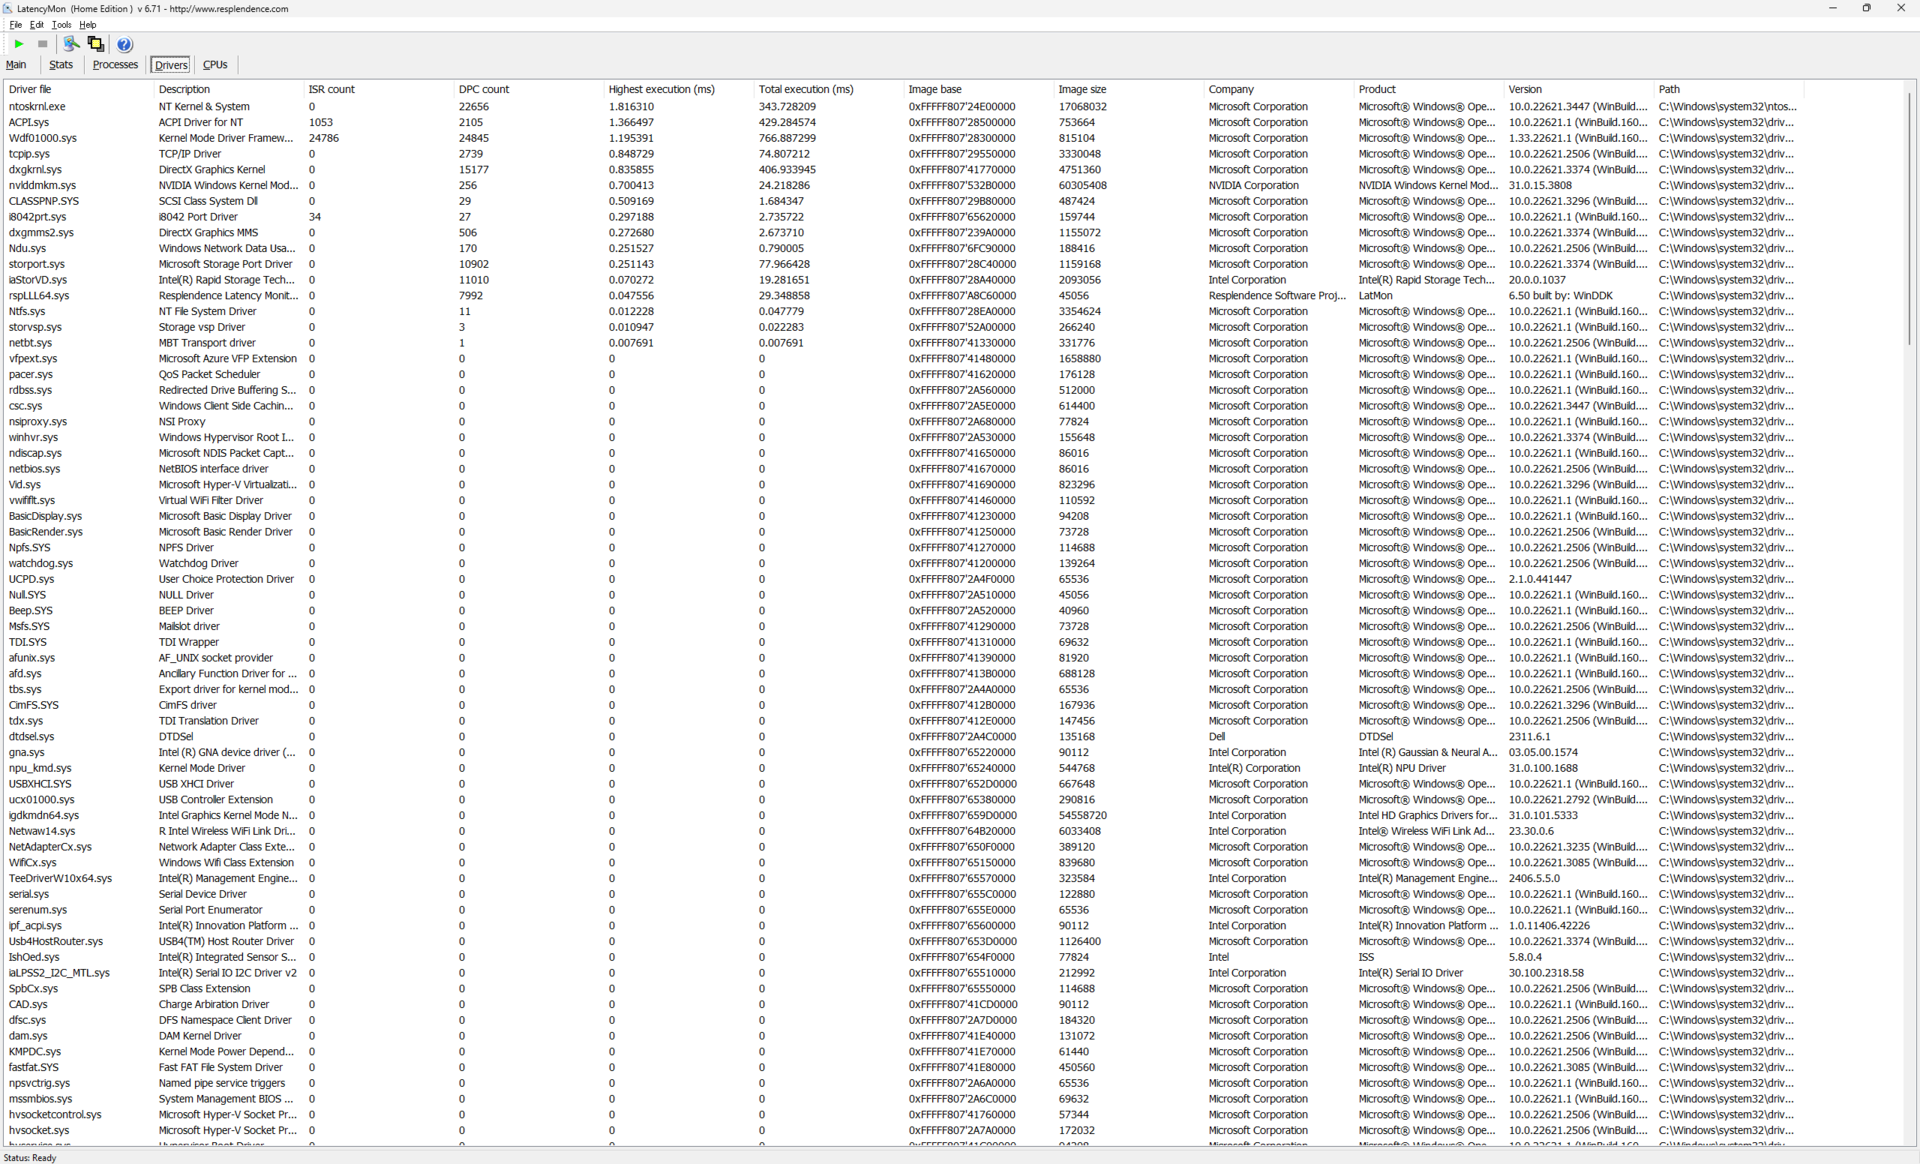
Latência DPC
O LatencyMon mostra apenas pequenos problemas de DPC novamente ao abrir várias guias de nossa página inicial. a reprodução de vídeo 4K a 60 FPS é perfeita, sem registro de queda de quadros.
| DPC Latencies / LatencyMon - interrupt to process latency (max), Web, Youtube, Prime95 | |
| Dell Precision 5000 5490 | |
| Lenovo ThinkPad P14s G4 21HF0017GE | |
| Dell Precision 5480 | |
| HP ZBook Firefly 14 G10 A | |
| Dell Precision 5000 5470 | |
* ... menor é melhor
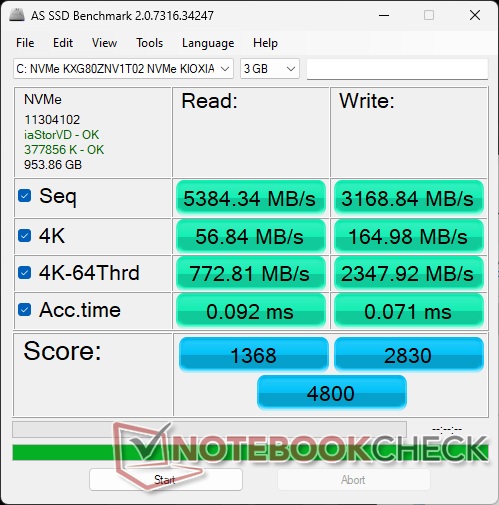
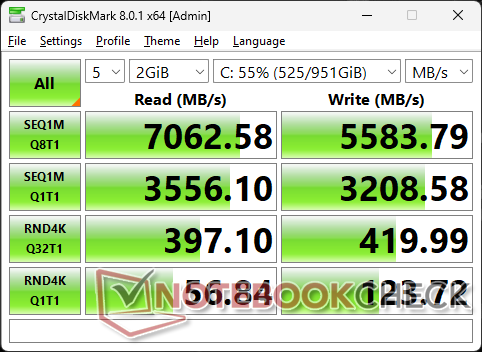
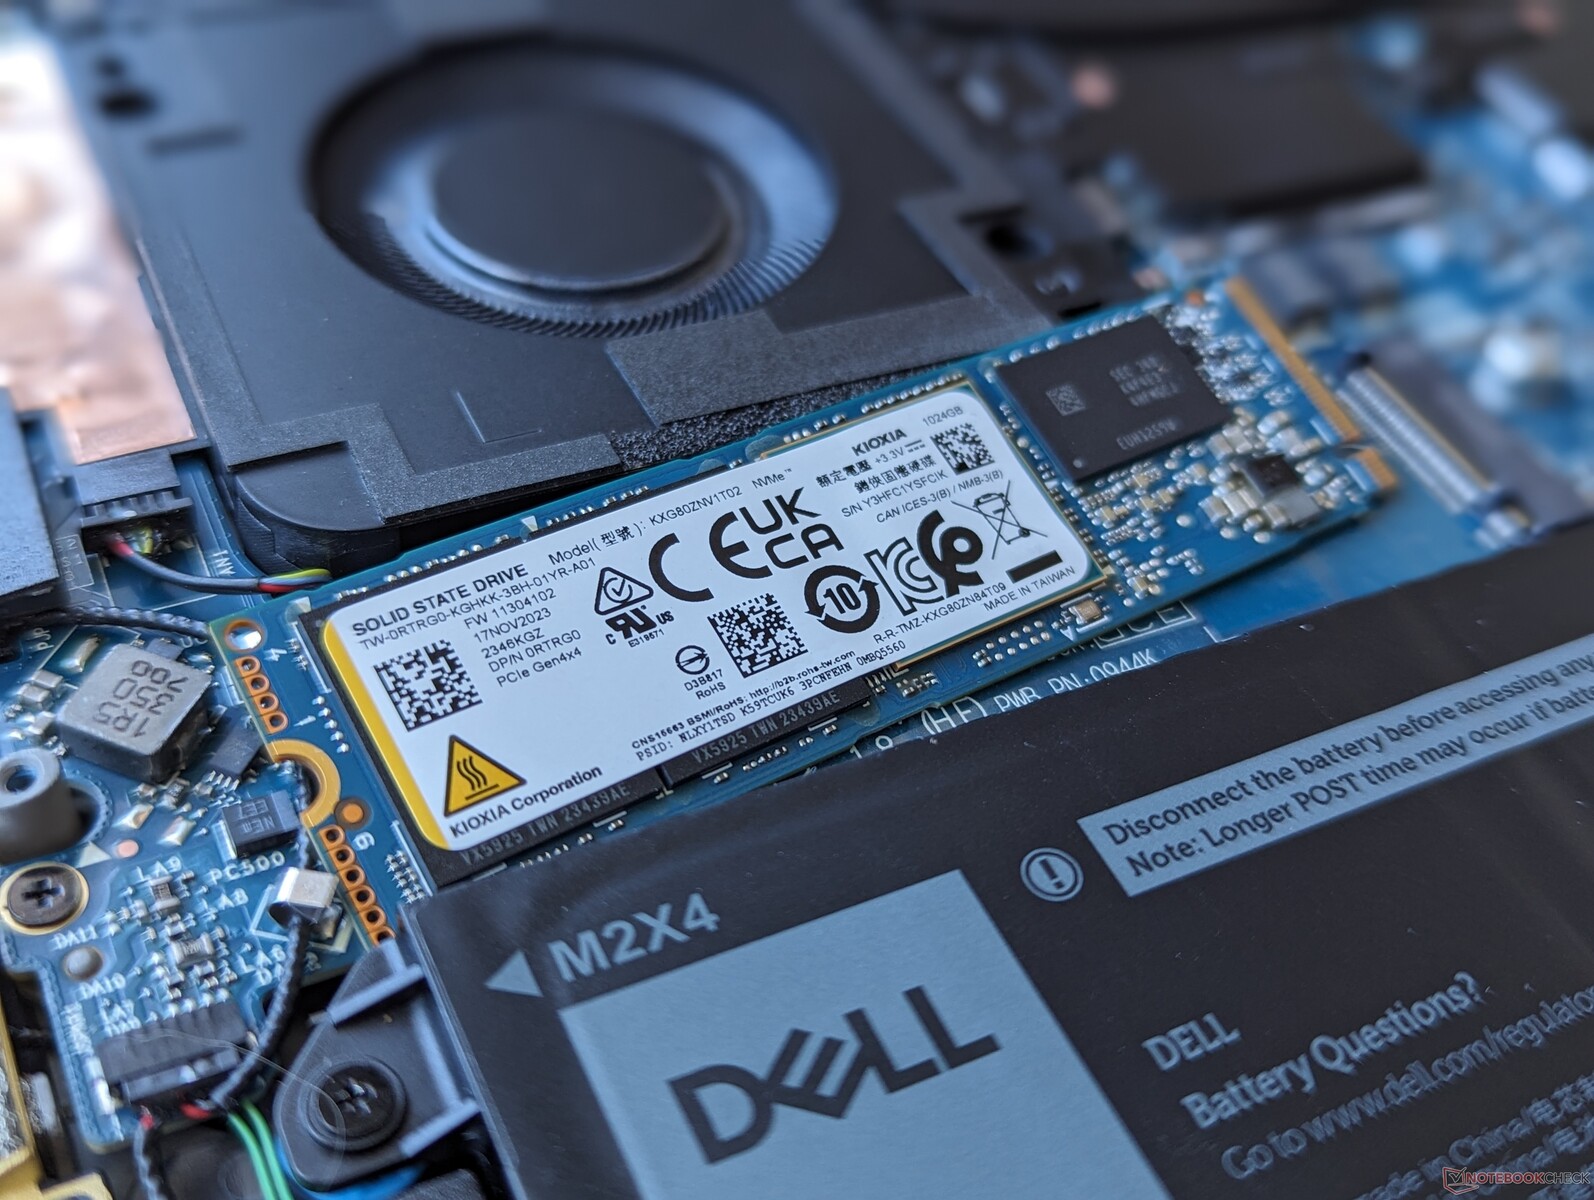
Dispositivos de armazenamento
Nossa unidade é fornecida com o Kioxia KXG80ZNV1T02 em vez do Samsung PM9A1 do modelo do ano passado. O desempenho geral é praticamente o mesmo, embora com taxas de leitura um pouco mais lentas de blocos menores de 4K.

| Drive Performance rating - Percent | |
| Lenovo ThinkPad P14s G4 21HF0017GE | |
| Dell Precision 5480 | |
| Dell Precision 5000 5470 | |
| HP ZBook Firefly 14 G9-6B8A2EA | |
| Dell Precision 5000 5490 | |
| HP ZBook Firefly 14 G10 A | |
* ... menor é melhor
Disk Throttling: DiskSpd Read Loop, Queue Depth 8
Desempenho da GPU - RTX 3000 Ada
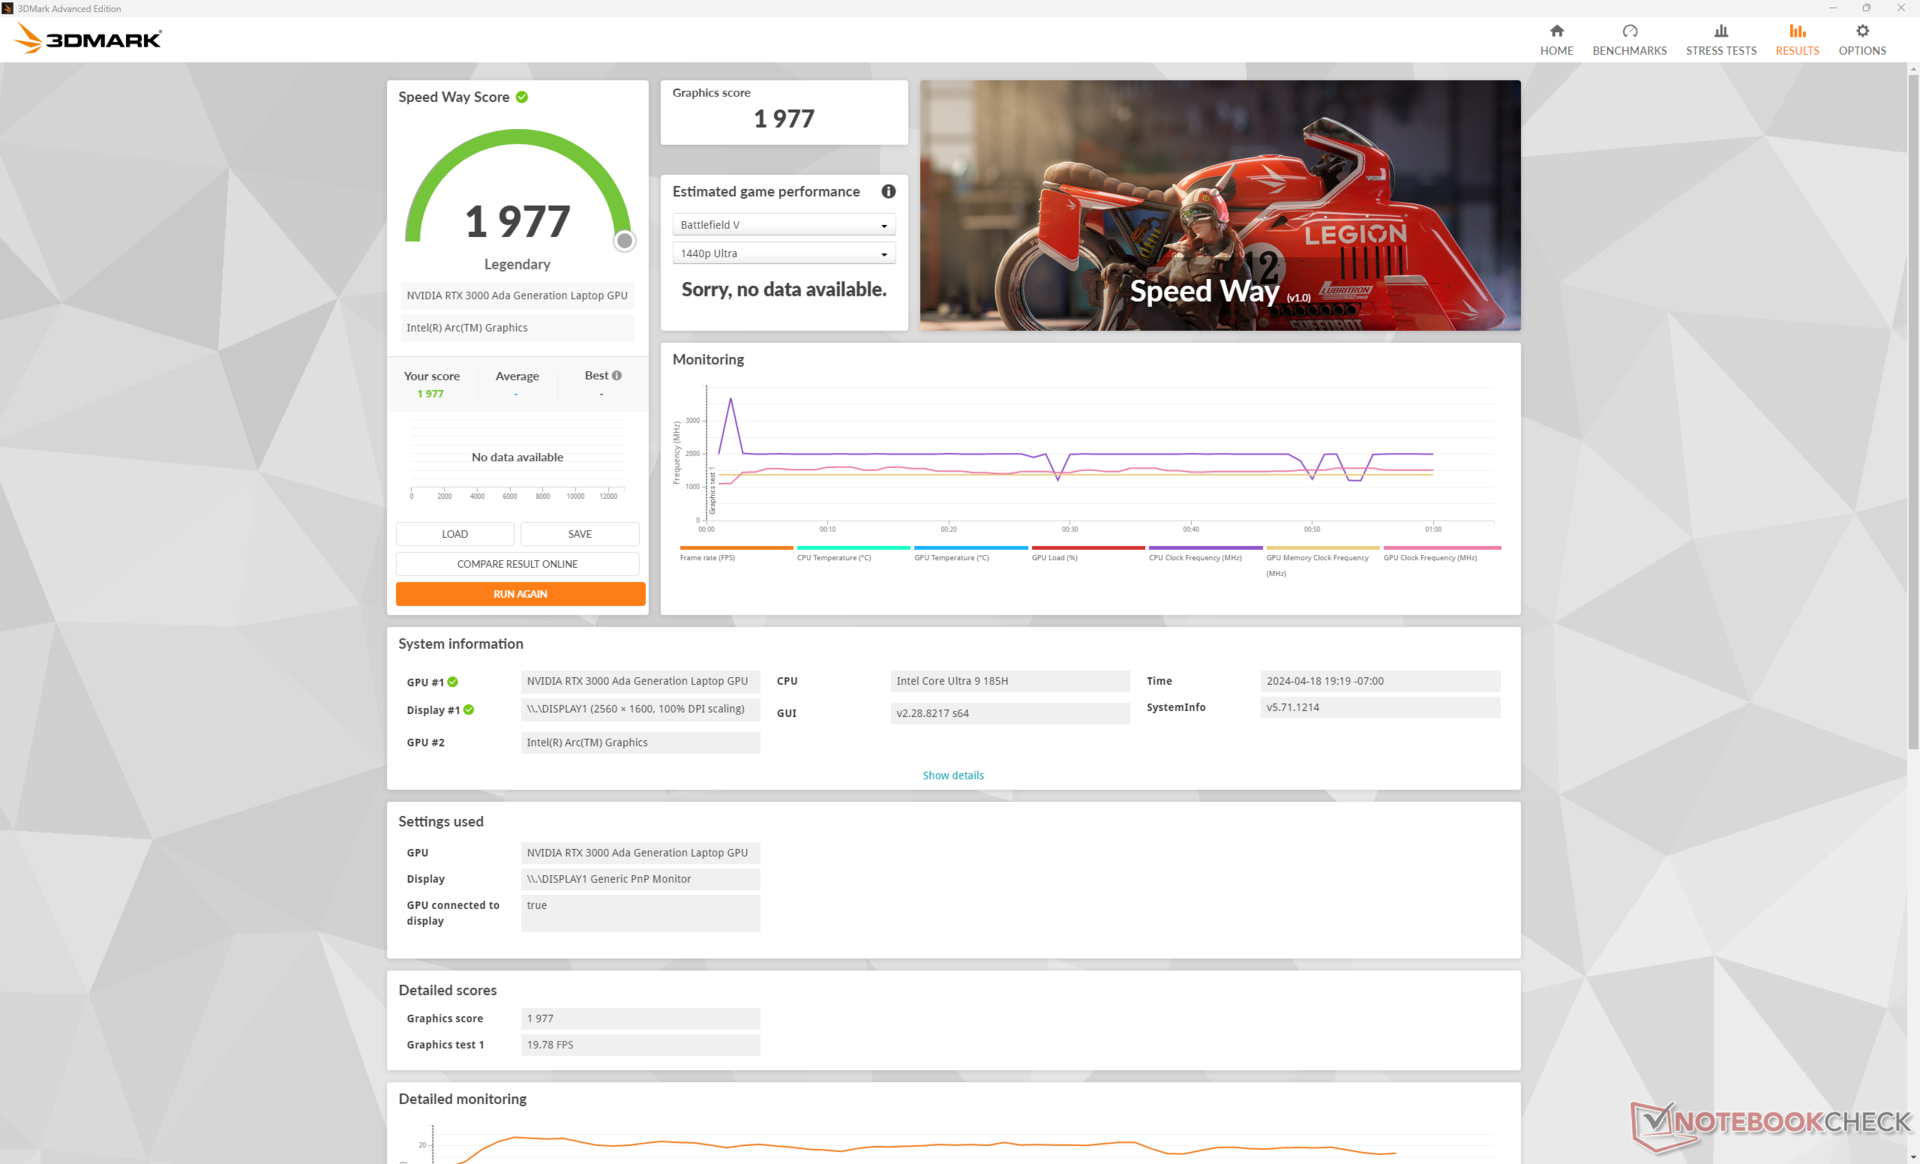
A RTX 3000 Ada retornou sem alterações e sem benefícios de desempenho em relação à Precision 5480. Na verdade, o desempenho médio pode ser um pouco mais lento em muitos casos, inclusive em determinados jogos e benchmarks do 3DMark. Mesmo assim, o Precision 5490 continua sendo uma das estações de trabalho de 14 polegadas mais rápidas.
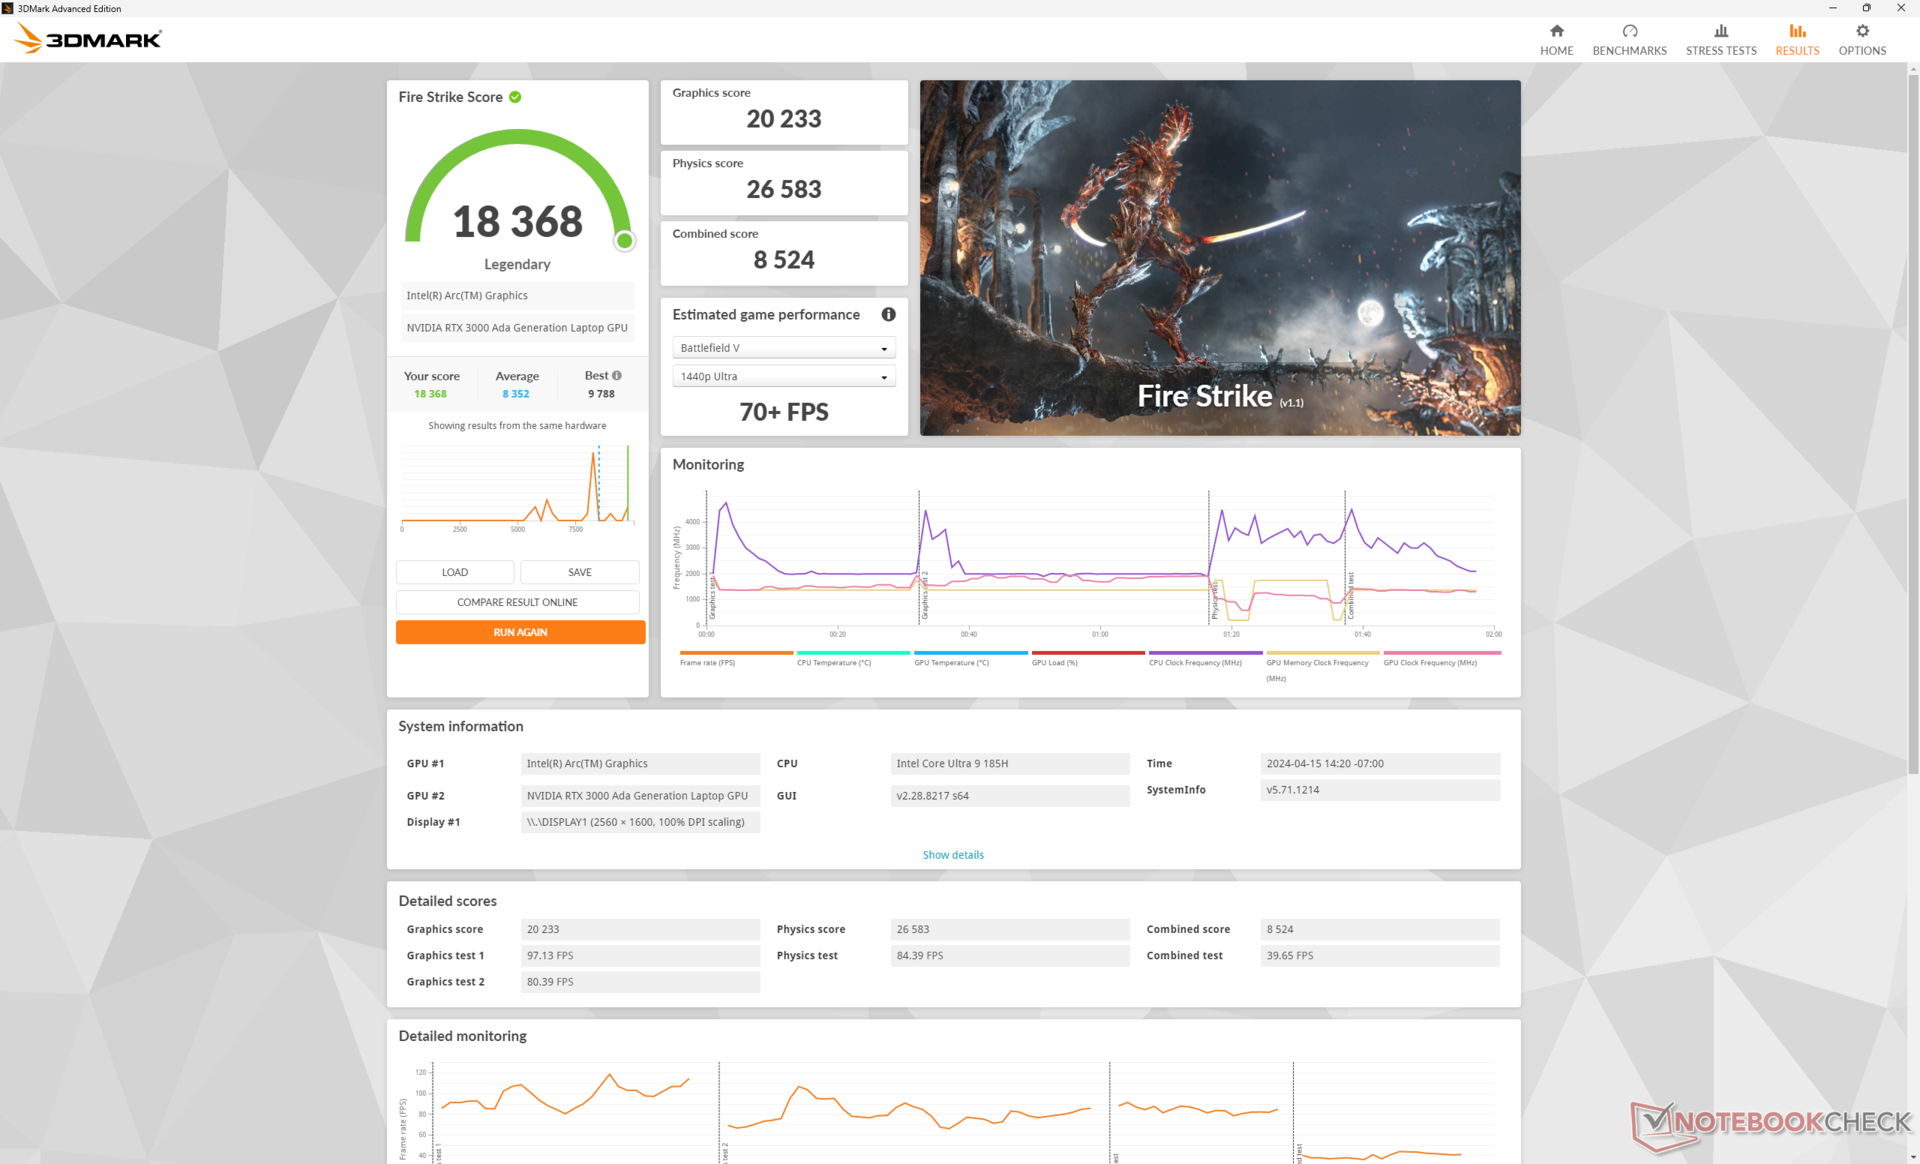
| Perfil de potência | Pontuação de gráficos | Pontuação de física | Pontuação combinada |
| Modo de desempenho | 20233 | 26583 | 8524 |
| Modo equilibrado | 19308 (-5%) | 25981 (-2%) | 7568 (-11%) |
| Energia da bateria | 19040 (-6%) | 20532 (-23%) | 7331 (-14%) |
A execução no modo Balanced em vez do modo Performance afeta o desempenho apenas marginalmente, conforme demonstrado pelos resultados do site Fire Strike acima. A energia da bateria reduz o desempenho do processador de forma mais significativa do que o desempenho gráfico.
| 3DMark Performance rating - Percent | |
| Média NVIDIA RTX 3000 Ada Generation Laptop -1! | |
| Dell Precision 5000 5490 -3! | |
| Dell Precision 5480 -5! | |
| HP ZBook Power 15 G10 -11! | |
| HP ZBook Power 15 G9 6B8C4EA -18! | |
| Dell Precision 5000 5560 -4! | |
| Dell Precision 5000 5470 -11! | |
| Lenovo ThinkPad P15v G3 21EM001AGE -12! | |
| Lenovo ThinkPad P15v G2 21A9000XGE -19! | |
| Lenovo ThinkPad P14s G4 21HF0017GE -19! | |
| Lenovo ThinkPad P14s G4 21K5000LGE -21! | |
| Lenovo ThinkPad P14s G3 AMD 21J6S05000 -19! | |
| HP ZBook Firefly 14 G9-6B8A2EA -19! | |
| HP ZBook Firefly 14 G10 A -35! | |
| Lenovo ThinkPad P14s Gen1-20Y10002GE -19! | |
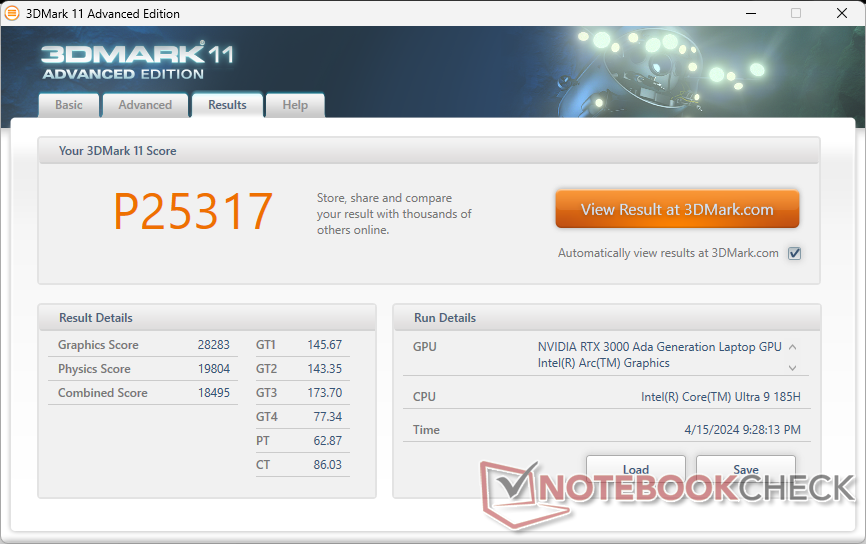
| 3DMark 11 Performance | 25317 pontos | |
| 3DMark Cloud Gate Standard Score | 45774 pontos | |
| 3DMark Fire Strike Score | 18368 pontos | |
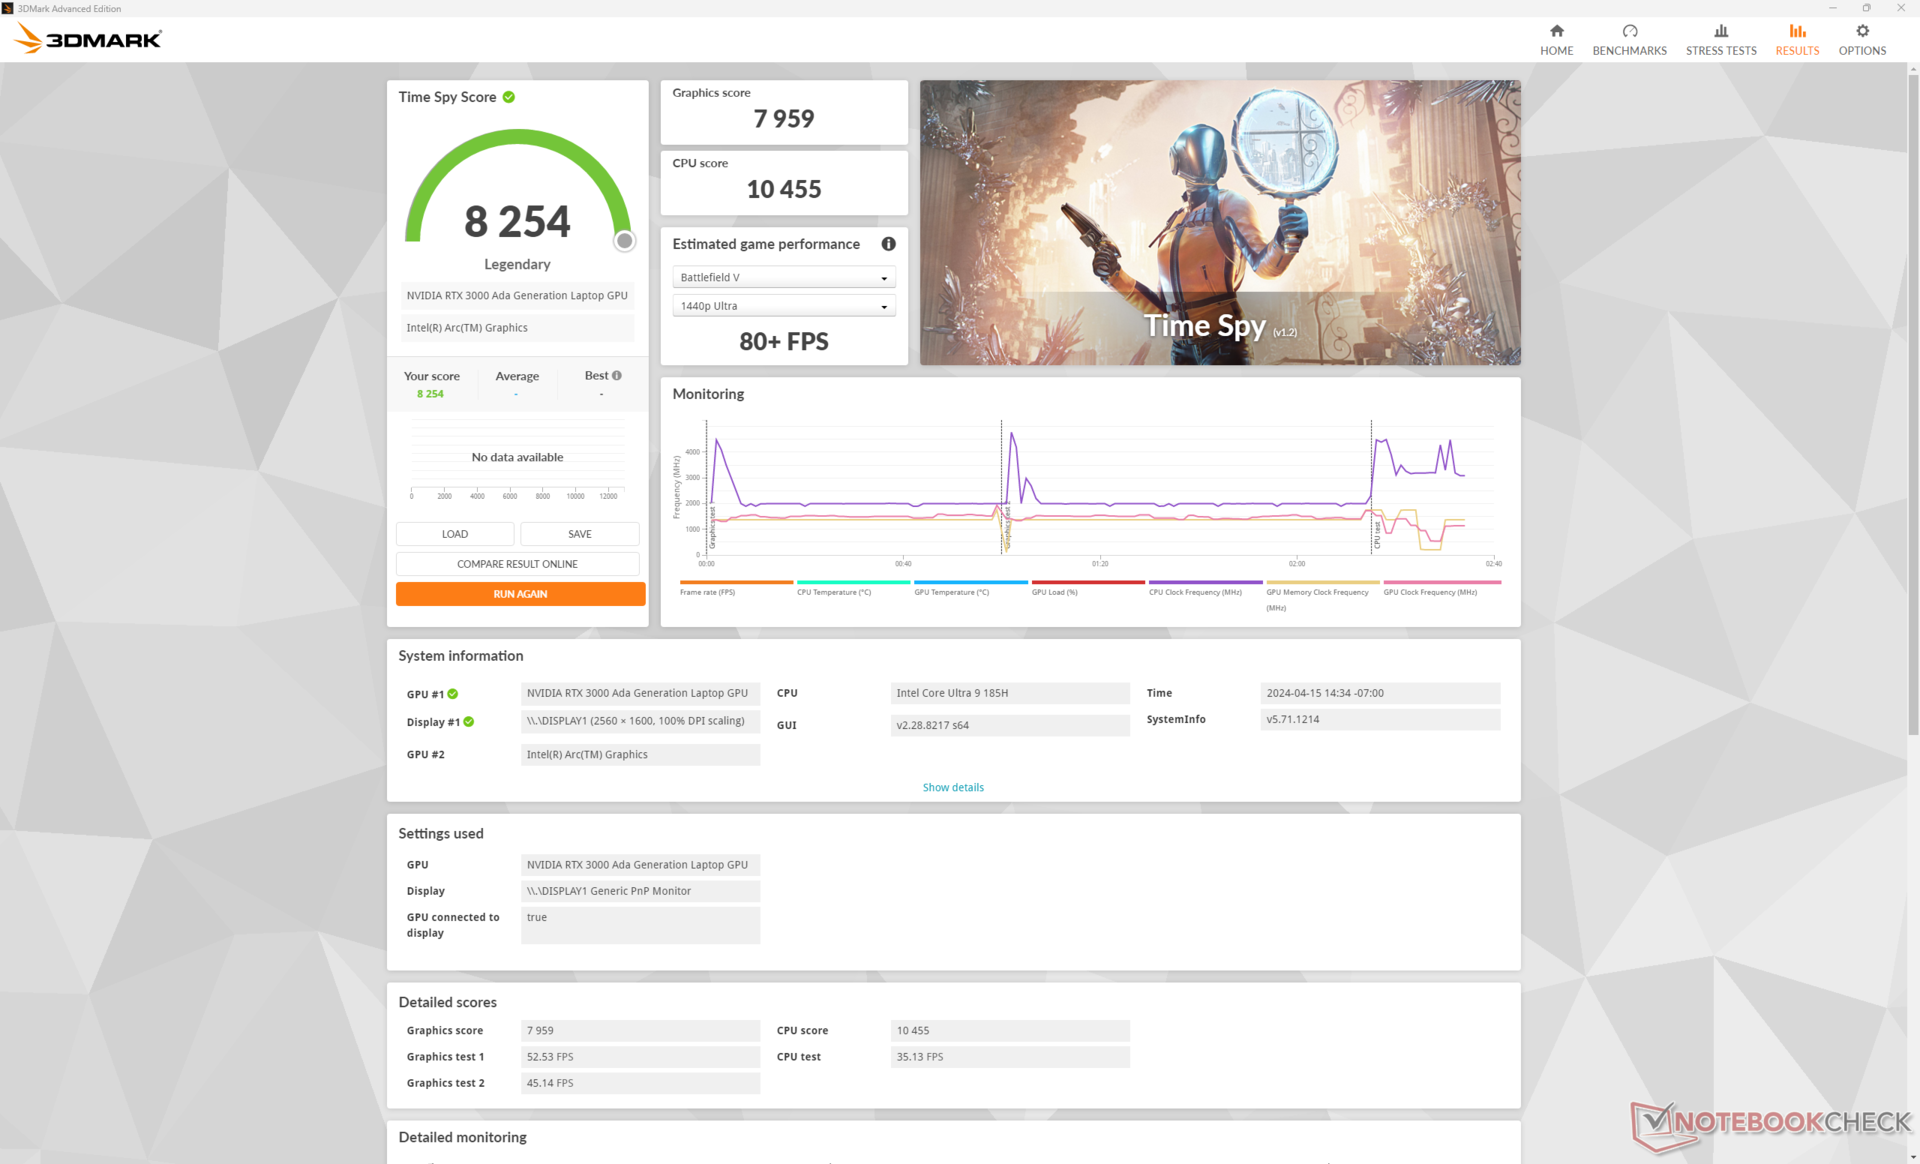
| 3DMark Time Spy Score | 8254 pontos | |
Ajuda | ||
* ... menor é melhor
| The Witcher 3 - 1920x1080 Ultra Graphics & Postprocessing (HBAO+) | |
| Dell Precision 5000 5490 | |
| Dell Precision 5480 | |
| HP ZBook Power 15 G10 | |
| Dell Precision 5000 5560 | |
| HP ZBook Power 15 G9 6B8C4EA | |
| Lenovo ThinkPad P15v G3 21EM001AGE | |
| Dell Precision 5000 5470 | |
| Lenovo ThinkPad P15v G2 21A9000XGE | |
| Lenovo ThinkPad P14s G4 21HF0017GE | |
| Lenovo ThinkPad P14s G4 21K5000LGE | |
| Lenovo ThinkPad P14s G3 AMD 21J6S05000 | |
| HP ZBook Firefly 14 G10 A | |
| HP ZBook Firefly 14 G9-6B8A2EA | |
| Strange Brigade - 1920x1080 ultra AA:ultra AF:16 | |
| Dell Precision 5480 | |
| HP ZBook Power 15 G10 | |
| Dell Precision 5000 5490 | |
| HP ZBook Power 15 G9 6B8C4EA | |
| Lenovo ThinkPad P15v G3 21EM001AGE | |
| Dell Precision 5000 5470 | |
| Lenovo ThinkPad P15v G2 21A9000XGE | |
| Lenovo ThinkPad P14s G4 21HF0017GE | |
| Lenovo ThinkPad P14s G4 21K5000LGE | |
| HP ZBook Firefly 14 G9-6B8A2EA | |
| HP ZBook Firefly 14 G10 A | |
| Lenovo ThinkPad P14s G3 AMD 21J6S05000 | |
| Cyberpunk 2077 | |
| 1920x1080 Low Preset (FSR off) | |
| Média NVIDIA RTX 3000 Ada Generation Laptop (87.2 - 104.6, n=2) | |
| Dell Precision 5000 5490 | |
| HP ZBook Power 15 G10 | |
| Lenovo ThinkPad P14s G4 21HF0017GE | |
| 1920x1080 Medium Preset (FSR off) | |
| Média NVIDIA RTX 3000 Ada Generation Laptop (72.7 - 87.9, n=2) | |
| Dell Precision 5000 5490 | |
| HP ZBook Power 15 G10 | |
| Lenovo ThinkPad P14s G4 21HF0017GE | |
| 1920x1080 High Preset (FSR off) | |
| Média NVIDIA RTX 3000 Ada Generation Laptop (60.7 - 74.2, n=2) | |
| Dell Precision 5000 5490 | |
| HP ZBook Power 15 G10 | |
| Lenovo ThinkPad P14s G4 21HF0017GE | |
| 1920x1080 Ultra Preset (FSR off) | |
| Média NVIDIA RTX 3000 Ada Generation Laptop (52.1 - 64.3, n=2) | |
| Dell Precision 5000 5490 | |
| HP ZBook Power 15 G10 | |
| Lenovo ThinkPad P14s G4 21HF0017GE | |
| 1920x1080 Ray Tracing Ultra Preset (DLSS off) | |
| Média NVIDIA RTX 3000 Ada Generation Laptop (26.2 - 33.2, n=2) | |
| Dell Precision 5000 5490 | |
| HP ZBook Power 15 G10 | |
| Lenovo ThinkPad P14s G4 21HF0017GE | |
| Tiny Tina's Wonderlands | |
| 1920x1080 Low Preset (DX12) | |
| Média NVIDIA RTX 3000 Ada Generation Laptop (153.9 - 194, n=3) | |
| Dell Precision 5480 | |
| Dell Precision 5000 5490 | |
| HP ZBook Power 15 G10 | |
| 1920x1080 Medium Preset (DX12) | |
| Média NVIDIA RTX 3000 Ada Generation Laptop (125.4 - 157.7, n=3) | |
| Dell Precision 5480 | |
| Dell Precision 5000 5490 | |
| HP ZBook Power 15 G10 | |
| 1920x1080 High Preset (DX12) | |
| Média NVIDIA RTX 3000 Ada Generation Laptop (88 - 110, n=3) | |
| Dell Precision 5000 5490 | |
| Dell Precision 5480 | |
| HP ZBook Power 15 G10 | |
| 1920x1080 Badass Preset (DX12) | |
| Média NVIDIA RTX 3000 Ada Generation Laptop (69 - 87.9, n=3) | |
| Dell Precision 5000 5490 | |
| Dell Precision 5480 | |
| HP ZBook Power 15 G10 | |
Witcher 3 FPS Chart
| baixo | média | alto | ultra | |
|---|---|---|---|---|
| The Witcher 3 (2015) | 344 | 249.5 | 145.8 | 79.5 |
| Dota 2 Reborn (2015) | 168 | 151.3 | 136 | 123.3 |
| Final Fantasy XV Benchmark (2018) | 128.8 | 91.9 | 72.9 | |
| X-Plane 11.11 (2018) | 109.9 | 102.1 | 76.7 | |
| Far Cry 5 (2018) | 115 | 105 | 104 | 96 |
| Strange Brigade (2018) | 282 | 182.4 | 151.4 | 132.5 |
| Tiny Tina's Wonderlands (2022) | 153.9 | 125.4 | 88.5 | 70.2 |
| F1 22 (2022) | 183.6 | 168 | 127.5 | 50.4 |
| Baldur's Gate 3 (2023) | 92 | 78.8 | 70.1 | 68.8 |
| Cyberpunk 2077 (2023) | 87.2 | 72.7 | 60.7 | 52.1 |
Emissões
Ruído do sistema
O piso e o teto do ruído do ventilador são essencialmente idênticos aos que registramos no Precision 5480. O teto, em particular, continua a ser mais alto ou mais barulhento do que o de outras estações de trabalho de 14 polegadas, principalmente devido à GPU mais rápida do sistema Dell. Para este ano, o Precision 5490 pode, pelo menos, funcionar de forma mais silenciosa por períodos mais longos antes que as ventoinhas comecem a aumentar.
Barulho
| Ocioso |
| 23.8 / 23.8 / 24.7 dB |
| Carga |
| 38.9 / 51.4 dB |
 | ||
30 dB silencioso 40 dB(A) audível 50 dB(A) ruidosamente alto |
||
min: | ||
| Dell Precision 5000 5490 RTX 3000 Ada Generation Laptop, Ultra 9 185H, Kioxia XG8 KXG80ZNV1T02 | Lenovo ThinkPad P14s G4 21HF0017GE RTX A500 Laptop GPU, i7-1370P, SK Hynix HFS002TEJ9X162N | HP ZBook Firefly 14 G10 A Radeon 760M, R5 PRO 7640HS, Samsung PM9B1 512GB MZVL4512HBLU | HP ZBook Firefly 14 G9-6B8A2EA T550 Laptop GPU, i7-1265U, Micron 3400 1TB MTFDKBA1T0TFH | Dell Precision 5480 RTX 3000 Ada Generation Laptop, i9-13900H, Samsung PM9A1 MZVL21T0HCLR | Dell Precision 5000 5470 RTX A1000 Laptop GPU, i9-12900H, Samsung PM9A1 MZVL21T0HCLR | |
|---|---|---|---|---|---|---|
| Noise | -1% | -4% | 4% | 0% | -2% | |
| desligado / ambiente * (dB) | 22.8 | 24.6 -8% | 25 -10% | 23.6 -4% | 23.5 -3% | 23 -1% |
| Idle Minimum * (dB) | 23.8 | 24.6 -3% | 25 -5% | 23.6 1% | 23.5 1% | 23.3 2% |
| Idle Average * (dB) | 23.8 | 24.6 -3% | 26 -9% | 23.6 1% | 23.5 1% | 23.3 2% |
| Idle Maximum * (dB) | 24.7 | 25.9 -5% | 27 -9% | 23.6 4% | 23.5 5% | 23.3 6% |
| Load Average * (dB) | 38.9 | 41.3 -6% | 45 -16% | 42.5 -9% | 39.9 -3% | 48.5 -25% |
| Witcher 3 ultra * (dB) | 49.9 | 46 8% | 45 10% | 42.5 15% | 50.1 -0% | 48.6 3% |
| Load Maximum * (dB) | 51.4 | 46.2 10% | 46 11% | 42.5 17% | 51 1% | 50.4 2% |
| Cyberpunk 2077 ultra * (dB) | 44.2 |
* ... menor é melhor
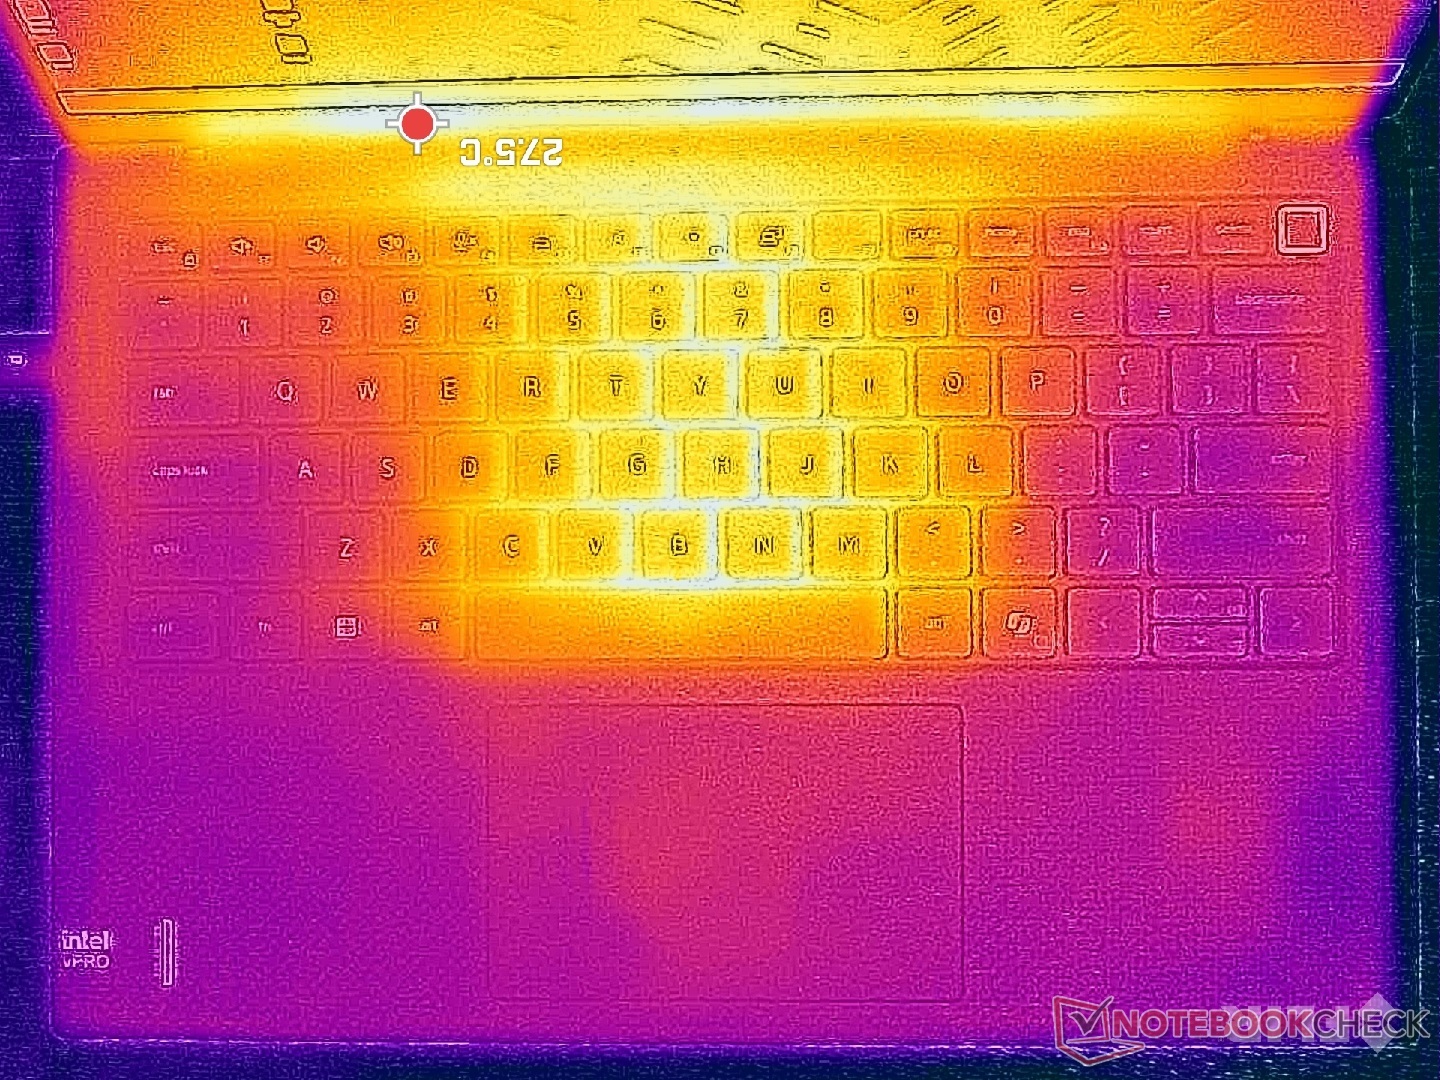
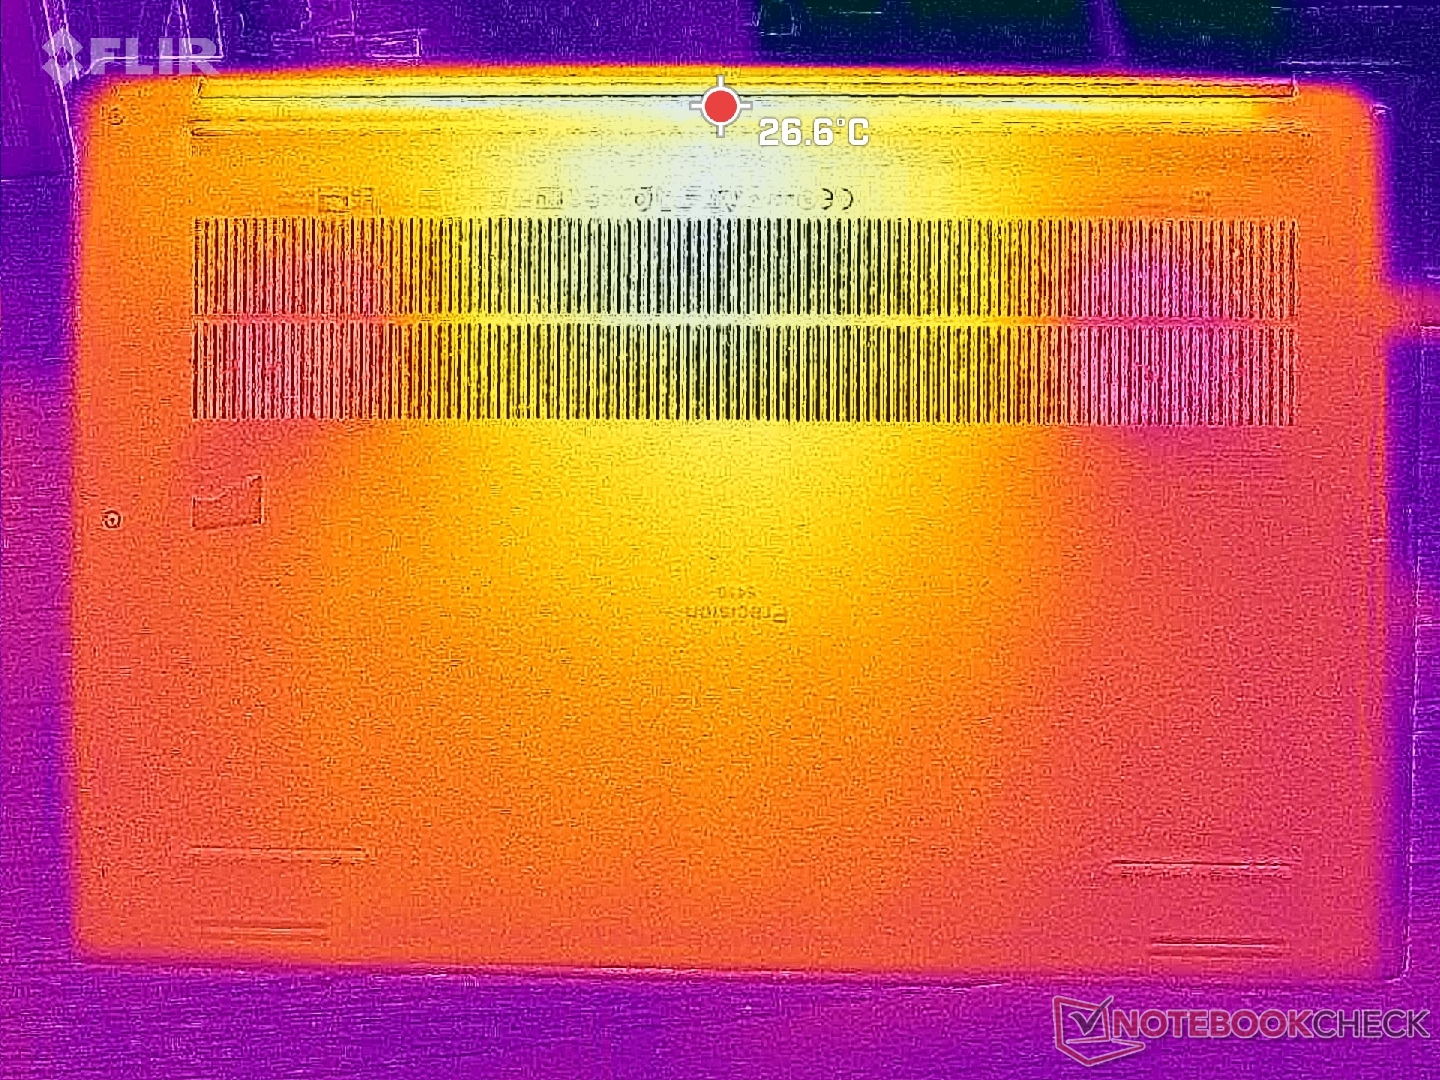
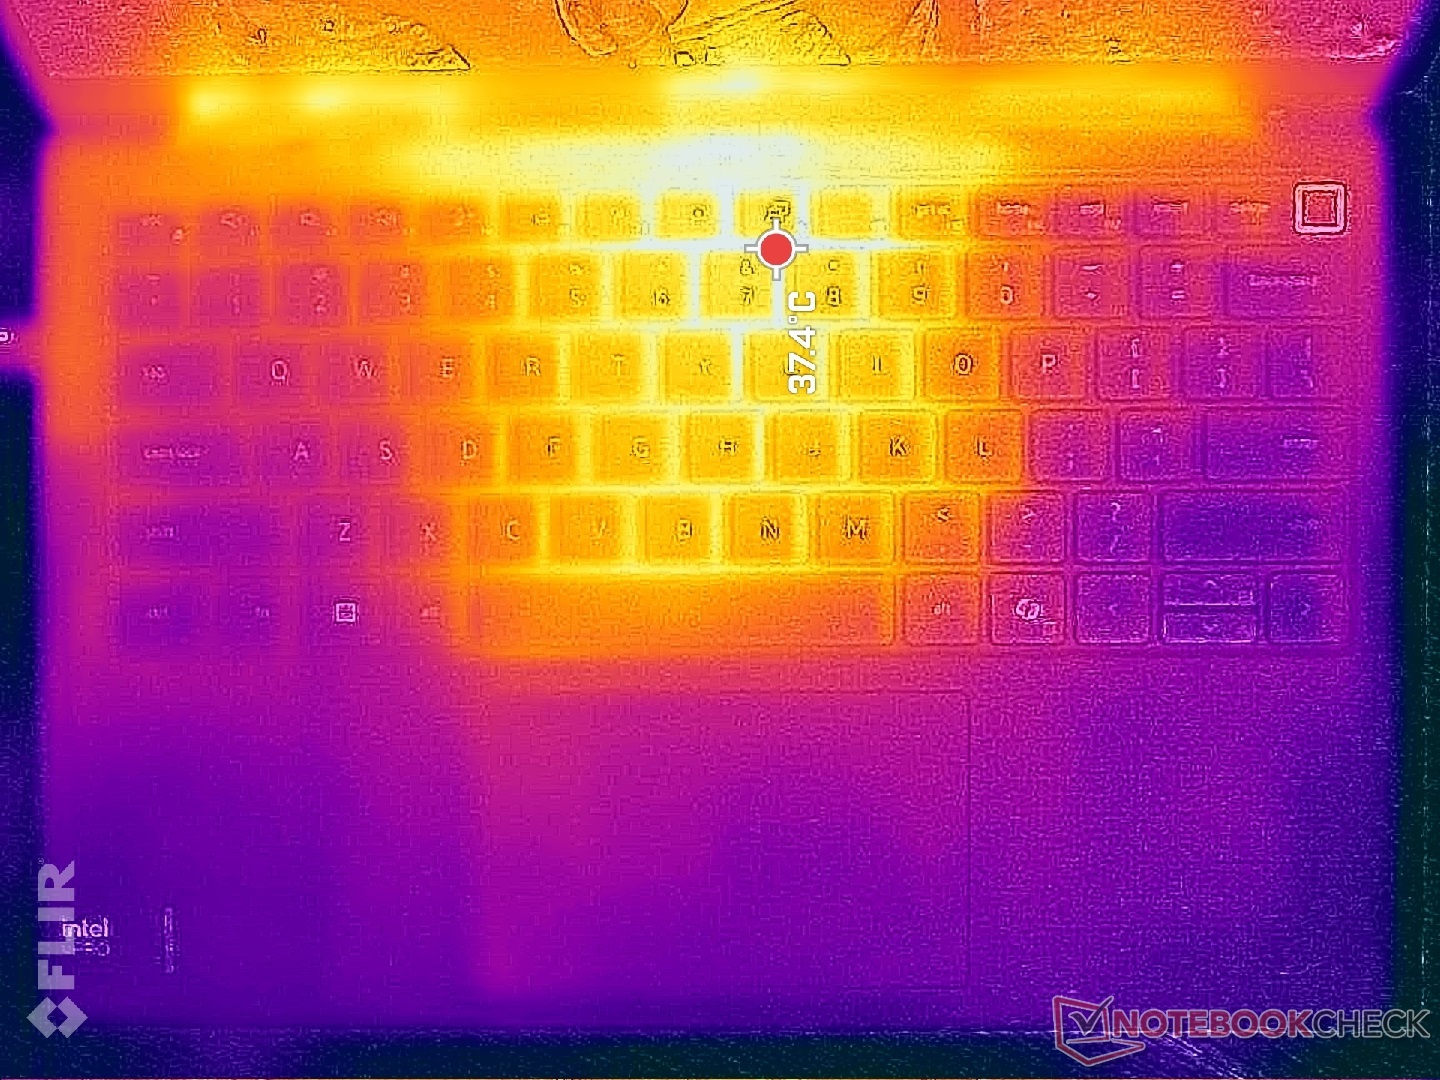
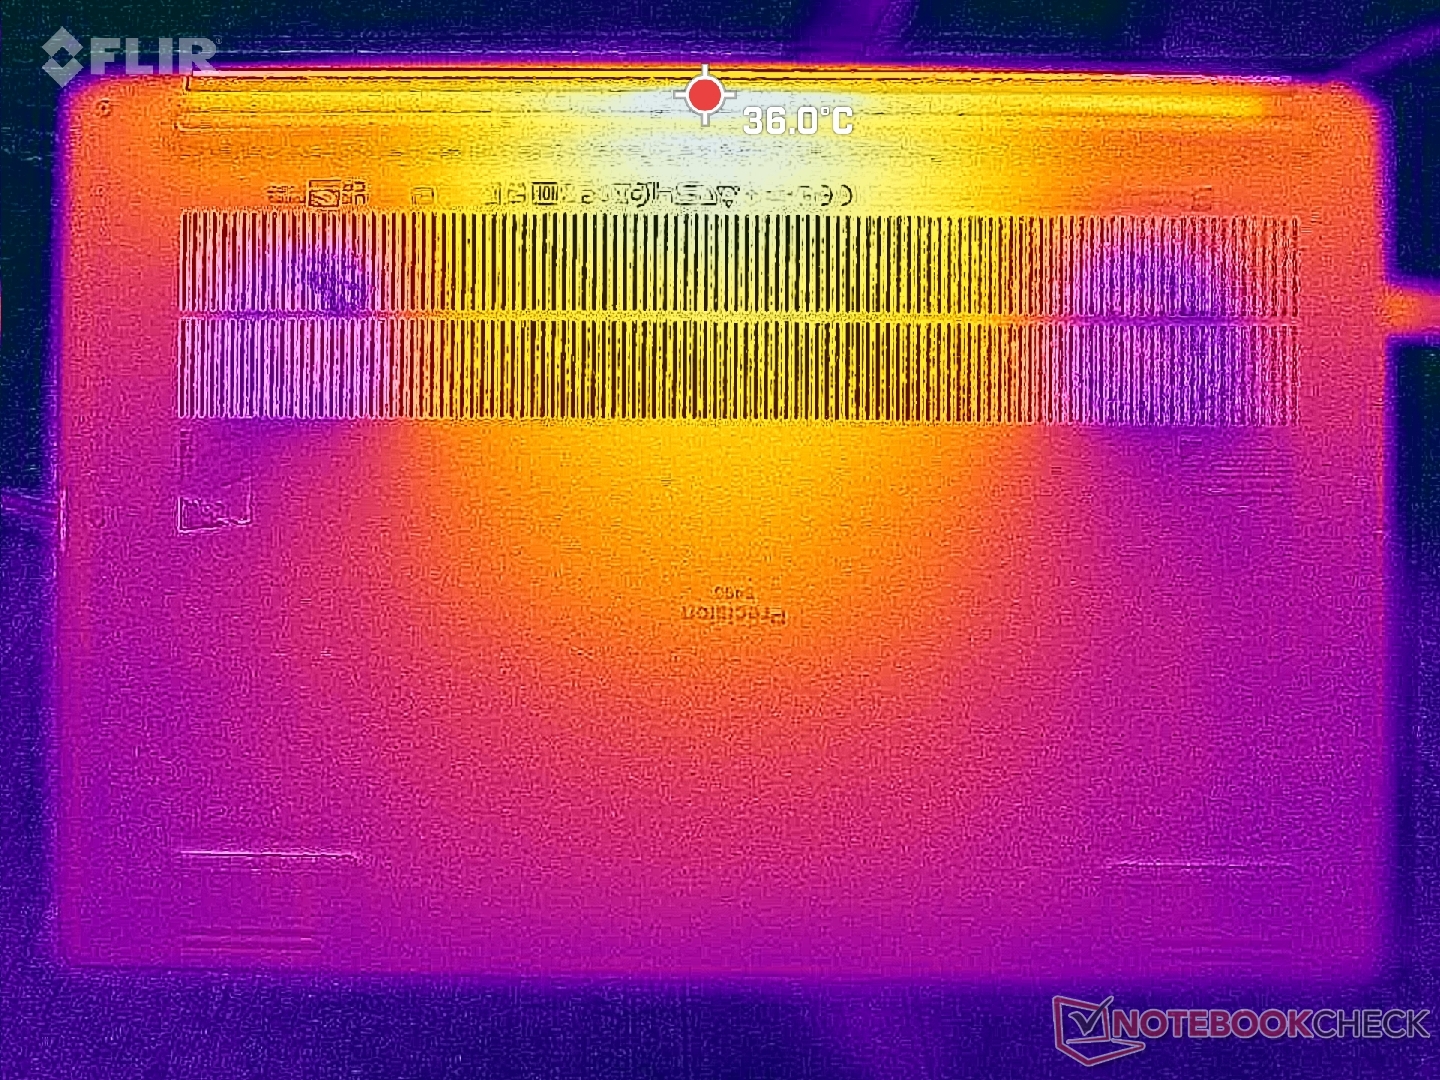
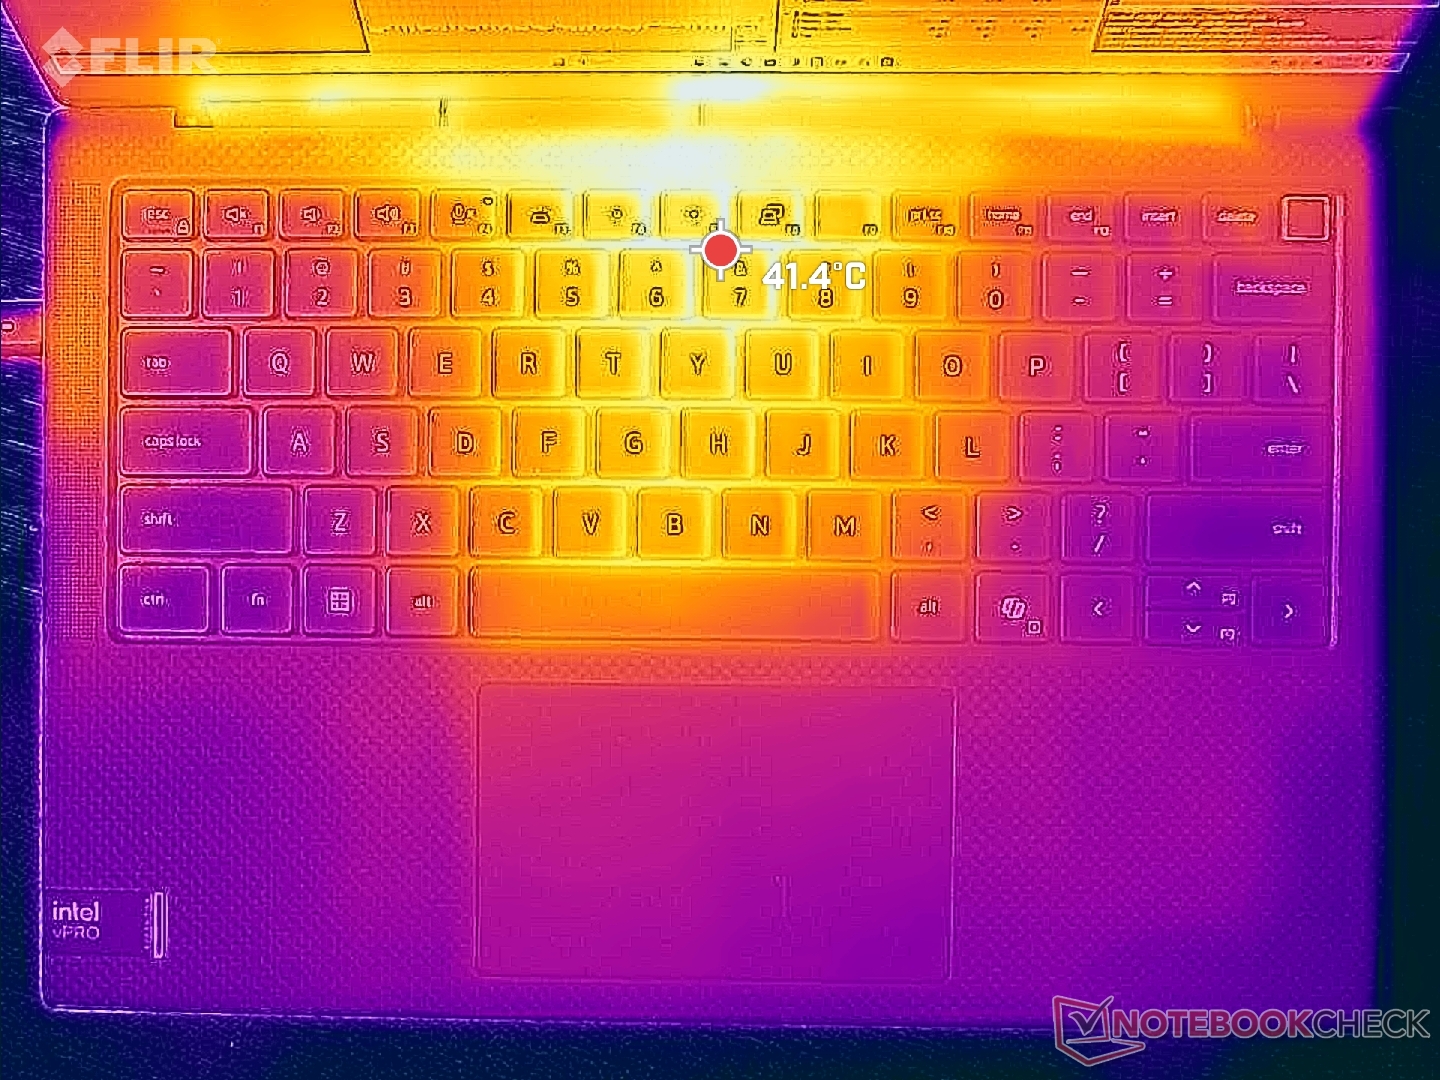
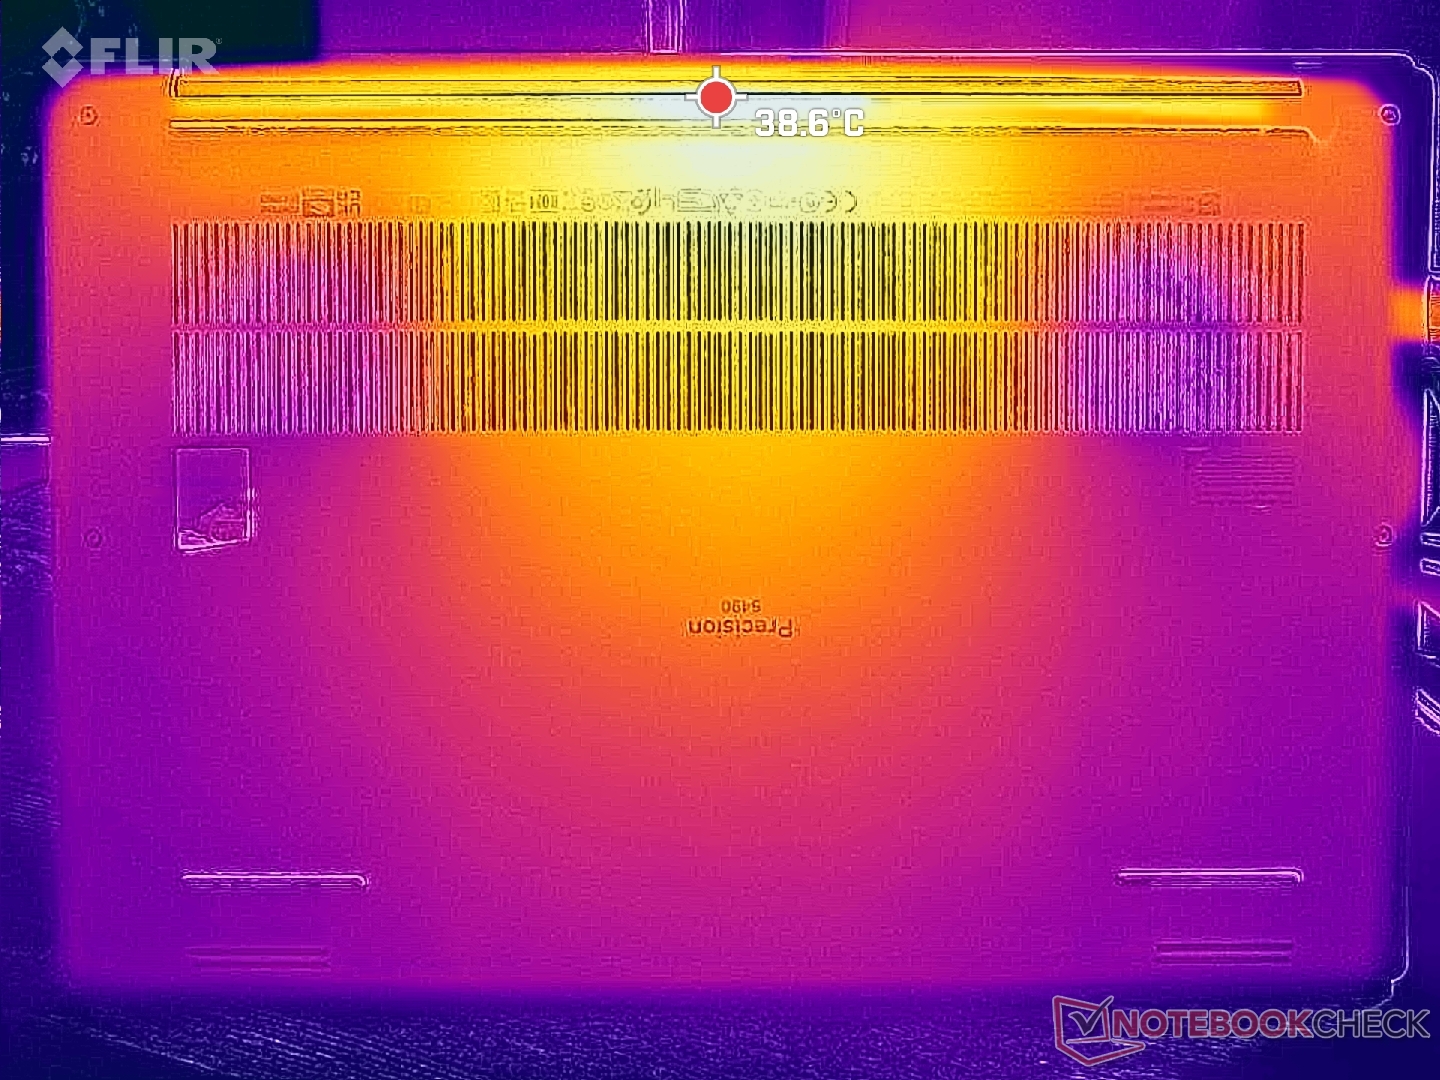
Temperatura
O desenvolvimento da temperatura é simétrico e, portanto, os pontos quentes estão mais próximos do centro do teclado, enquanto as laterais e os apoios para as mãos são muito mais frios. No entanto, os pontos quentes são visivelmente mais frios do que no HP ZBook Firefly 14 G10 em vários graus Celsius.
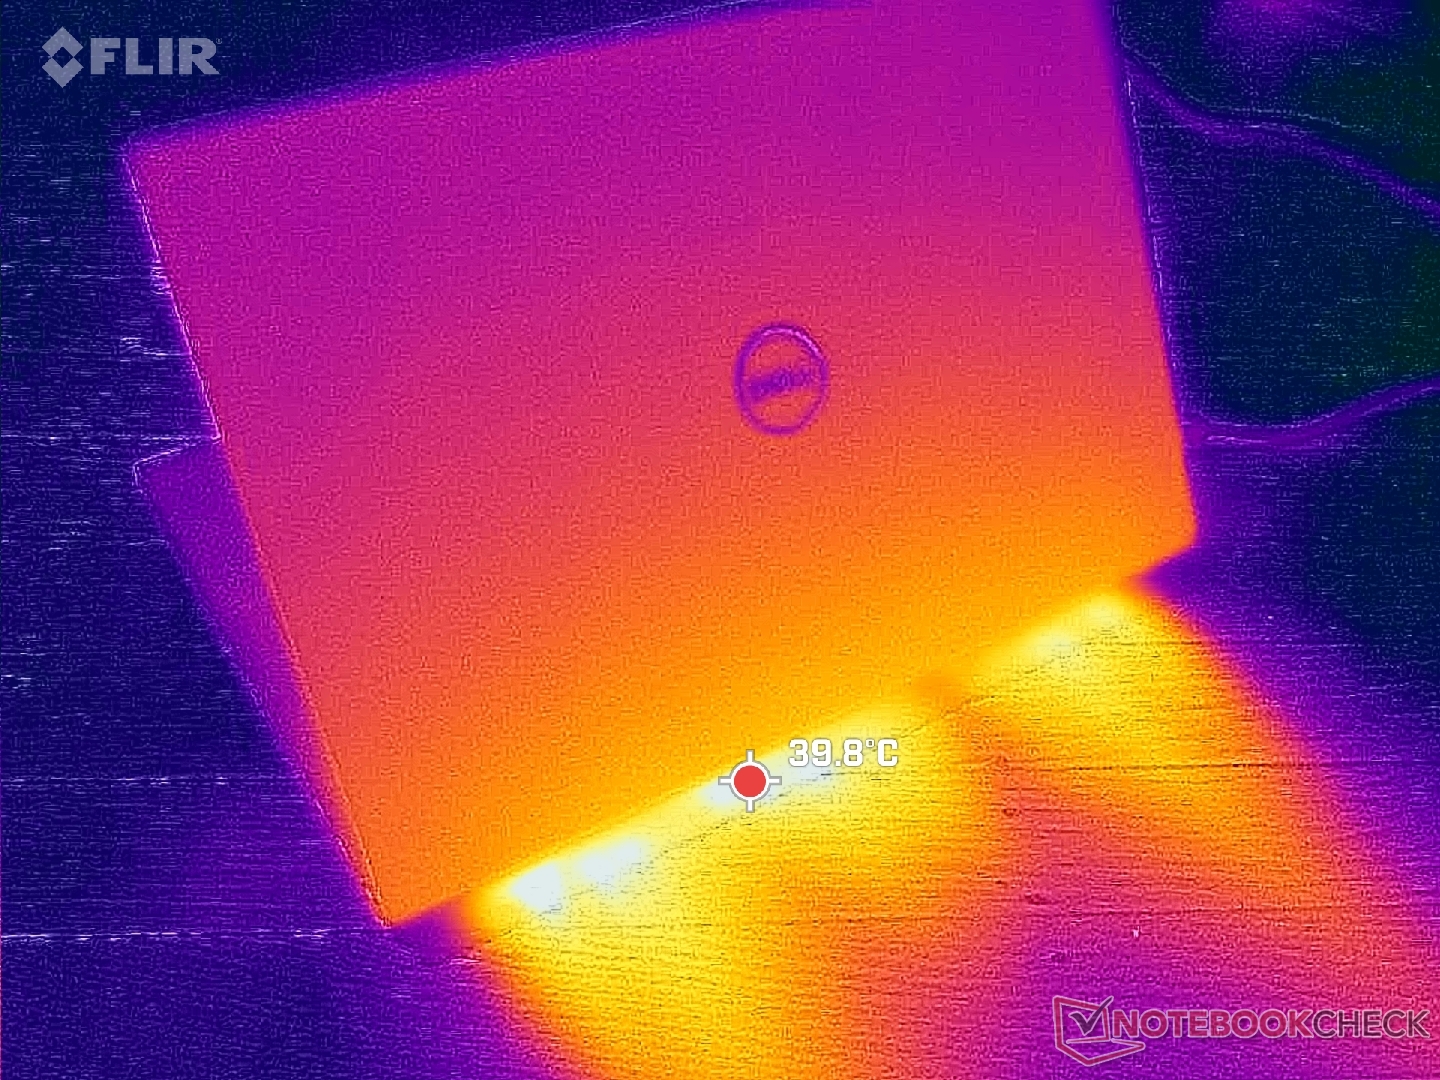
(±) A temperatura máxima no lado superior é 43.2 °C / 110 F, em comparação com a média de 38.2 °C / 101 F , variando de 22.2 a 69.8 °C para a classe Workstation.
(+) A parte inferior aquece até um máximo de 38.4 °C / 101 F, em comparação com a média de 41.1 °C / 106 F
(+) Em uso inativo, a temperatura média para o lado superior é 29 °C / 84 F, em comparação com a média do dispositivo de 32 °C / ### class_avg_f### F.
(+) Jogando The Witcher 3, a temperatura média para o lado superior é 31.7 °C / 89 F, em comparação com a média do dispositivo de 32 °C / ## #class_avg_f### F.
(+) Os apoios para as mãos e o touchpad são mais frios que a temperatura da pele, com um máximo de 27.6 °C / 81.7 F e, portanto, são frios ao toque.
(±) A temperatura média da área do apoio para as mãos de dispositivos semelhantes foi 27.8 °C / 82 F (+0.2 °C / 0.3 F).
| Dell Precision 5000 5490 Intel Core Ultra 9 185H, NVIDIA RTX 3000 Ada Generation Laptop | Lenovo ThinkPad P14s G4 21HF0017GE Intel Core i7-1370P, NVIDIA RTX A500 Laptop GPU | HP ZBook Firefly 14 G10 A AMD Ryzen 5 PRO 7640HS, AMD Radeon 760M | HP ZBook Firefly 14 G9-6B8A2EA Intel Core i7-1265U, NVIDIA T550 Laptop GPU | Dell Precision 5480 Intel Core i9-13900H, NVIDIA RTX 3000 Ada Generation Laptop | Dell Precision 5000 5470 Intel Core i9-12900H, NVIDIA RTX A1000 Laptop GPU | |
|---|---|---|---|---|---|---|
| Heat | -13% | -4% | 2% | -13% | -3% | |
| Maximum Upper Side * (°C) | 43.2 | 55.3 -28% | 50 -16% | 41.2 5% | 44 -2% | 41.8 3% |
| Maximum Bottom * (°C) | 38.4 | 48.7 -27% | 51 -33% | 47.9 -25% | 38.2 1% | 36 6% |
| Idle Upper Side * (°C) | 31.6 | 31 2% | 25 21% | 26.5 16% | 38.8 -23% | 34.6 -9% |
| Idle Bottom * (°C) | 30.6 | 29.9 2% | 27 12% | 27 12% | 38.6 -26% | 33.6 -10% |
* ... menor é melhor
Alto-falantes
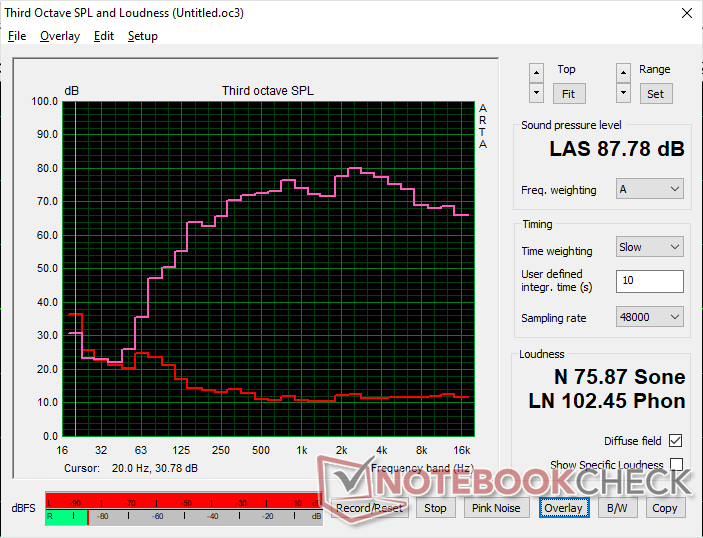
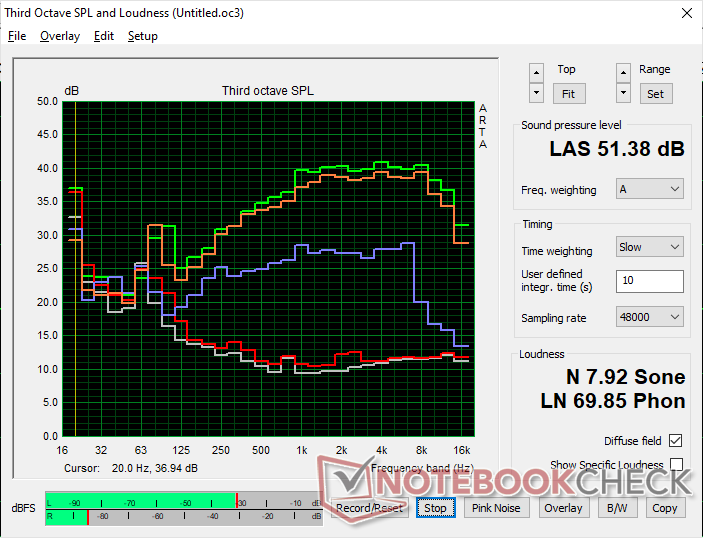
Dell Precision 5000 5490 análise de áudio
(+) | os alto-falantes podem tocar relativamente alto (###valor### dB)
Graves 100 - 315Hz
(±) | graves reduzidos - em média 10.9% menor que a mediana
(±) | a linearidade dos graves é média (7.2% delta para a frequência anterior)
Médios 400 - 2.000 Hz
(+) | médios equilibrados - apenas 1.7% longe da mediana
(+) | médios são lineares (3.5% delta para frequência anterior)
Altos 2 - 16 kHz
(+) | agudos equilibrados - apenas 4.4% longe da mediana
(+) | os máximos são lineares (3.4% delta da frequência anterior)
Geral 100 - 16.000 Hz
(+) | o som geral é linear (9.2% diferença em relação à mediana)
Comparado com a mesma classe
» 4% de todos os dispositivos testados nesta classe foram melhores, 2% semelhantes, 94% piores
» O melhor teve um delta de 7%, a média foi 17%, o pior foi 35%
Comparado com todos os dispositivos testados
» 3% de todos os dispositivos testados foram melhores, 1% semelhantes, 96% piores
» O melhor teve um delta de 4%, a média foi 24%, o pior foi 134%
Apple MacBook Pro 16 2021 M1 Pro análise de áudio
(+) | os alto-falantes podem tocar relativamente alto (###valor### dB)
Graves 100 - 315Hz
(+) | bons graves - apenas 3.8% longe da mediana
(+) | o baixo é linear (5.2% delta para a frequência anterior)
Médios 400 - 2.000 Hz
(+) | médios equilibrados - apenas 1.3% longe da mediana
(+) | médios são lineares (2.1% delta para frequência anterior)
Altos 2 - 16 kHz
(+) | agudos equilibrados - apenas 1.9% longe da mediana
(+) | os máximos são lineares (2.7% delta da frequência anterior)
Geral 100 - 16.000 Hz
(+) | o som geral é linear (4.6% diferença em relação à mediana)
Comparado com a mesma classe
» 0% de todos os dispositivos testados nesta classe foram melhores, 0% semelhantes, 100% piores
» O melhor teve um delta de 5%, a média foi 17%, o pior foi 45%
Comparado com todos os dispositivos testados
» 0% de todos os dispositivos testados foram melhores, 0% semelhantes, 100% piores
» O melhor teve um delta de 4%, a média foi 24%, o pior foi 134%
Gerenciamento de energia
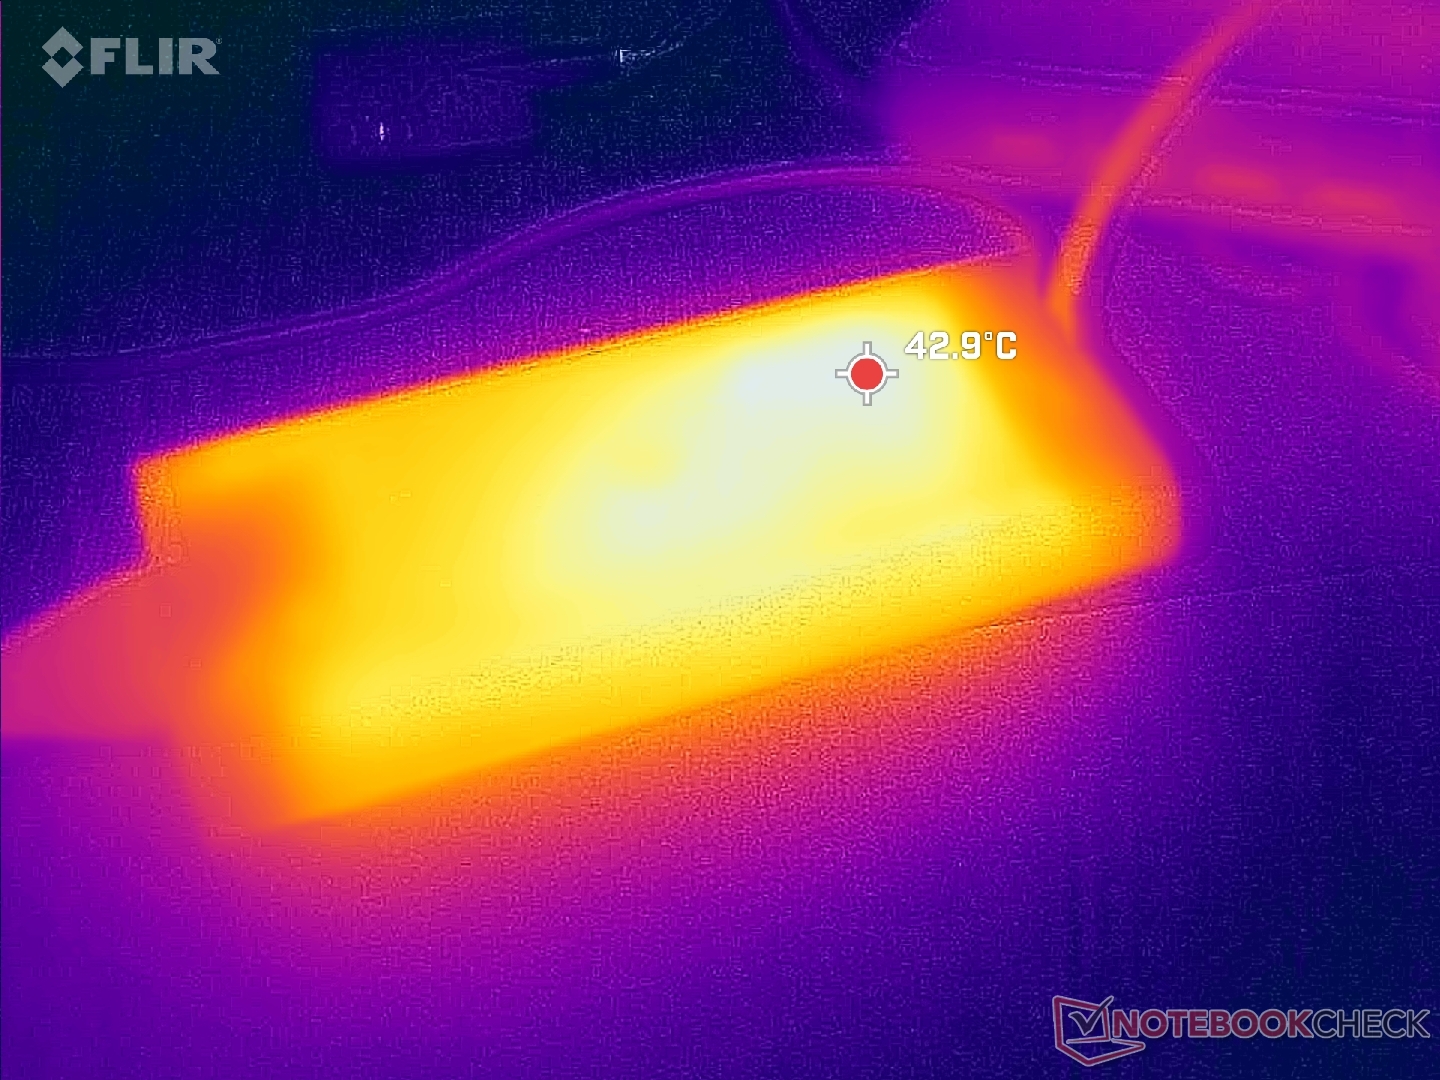
Consumo de energia
A execução Witcher 3 exige uma média de 88 W para ficar próximo do que registramos no Precision 5480, apesar das diferenças de CPU. Quando comparada a outras estações de trabalho de 14 polegadas, a Precision 5490 é uma das mais exigentes, o que se alinha com seu desempenho relativamente rápido.
Um adaptador USB-C menor, de 100 W, é fornecido com configurações que não utilizam gráficos discretos. Caso contrário, um adaptador USB-C de 130 W é padrão.
(Nota do editor: esta seção será atualizada quando os reparos em nosso multímetro Metrahit Energy forem concluídos no final deste mês. Pedimos desculpas pelo inconveniente)
| desligado | |
| Ocioso | |
| Carga |
|
Key:
min: | |
| Dell Precision 5000 5490 Ultra 9 185H, RTX 3000 Ada Generation Laptop, Kioxia XG8 KXG80ZNV1T02, IPS, 2560x1600, 14" | Lenovo ThinkPad P14s G4 21HF0017GE i7-1370P, RTX A500 Laptop GPU, SK Hynix HFS002TEJ9X162N, OLED, 2880x1800, 14" | HP ZBook Firefly 14 G10 A R5 PRO 7640HS, Radeon 760M, Samsung PM9B1 512GB MZVL4512HBLU, IPS, 1920x1200, 14" | HP ZBook Firefly 14 G9-6B8A2EA i7-1265U, T550 Laptop GPU, Micron 3400 1TB MTFDKBA1T0TFH, IPS, 1920x1200, 14" | Dell Precision 5480 i9-13900H, RTX 3000 Ada Generation Laptop, Samsung PM9A1 MZVL21T0HCLR, IPS, 2560x1600, 14" | Dell Precision 5000 5470 i9-12900H, RTX A1000 Laptop GPU, Samsung PM9A1 MZVL21T0HCLR, IPS, 2560x1600, 14" | |
|---|---|---|---|---|---|---|
| Power Consumption | 32% | 51% | 52% | -24% | 11% | |
| Idle Minimum * (Watt) | 11.1 | 6.3 43% | 3 73% | 4.2 62% | 14.9 -34% | 4.3 61% |
| Idle Average * (Watt) | 14.8 | 7 53% | 4 73% | 6.5 56% | 19.5 -32% | 8.9 40% |
| Idle Maximum * (Watt) | 16.5 | 8.1 51% | 8 52% | 7.2 56% | 27.2 -65% | 18.9 -15% |
| Load Average * (Watt) | 70.1 | 84.6 -21% | 56 20% | 47.7 32% | 81.6 -16% | 94 -34% |
| Witcher 3 ultra * (Watt) | 93.1 | 56.5 39% | 58.2 37% | 42.9 54% | 90.4 3% | 83.2 11% |
| Load Maximum * (Watt) | 137.5 | 98.3 29% | 66 52% | 68.2 50% | 137.8 -0% | 137.5 -0% |
* ... menor é melhor
Power Consumption Witcher 3 / Stresstest
Power Consumption external Monitor
Duração da bateria
A duração da bateria é praticamente idêntica à que registramos no Precision 5480, pois os dois modelos compartilham componentes e níveis de desempenho semelhantes.
| Dell Precision 5000 5490 Ultra 9 185H, RTX 3000 Ada Generation Laptop, 72 Wh | Lenovo ThinkPad P14s G4 21HF0017GE i7-1370P, RTX A500 Laptop GPU, 52.5 Wh | HP ZBook Firefly 14 G10 A R5 PRO 7640HS, Radeon 760M, 51 Wh | HP ZBook Firefly 14 G9-6B8A2EA i7-1265U, T550 Laptop GPU, 51 Wh | Dell Precision 5480 i9-13900H, RTX 3000 Ada Generation Laptop, 72 Wh | Dell Precision 5000 5470 i9-12900H, RTX A1000 Laptop GPU, 72 Wh | |
|---|---|---|---|---|---|---|
| Duração da bateria | -45% | 18% | -20% | -1% | -13% | |
| WiFi v1.3 (h) | 11 | 6.1 -45% | 13 18% | 8.8 -20% | 10.9 -1% | 9.6 -13% |
| Load (h) | 1 | 0.9 | 1.1 | |||
| Reader / Idle (h) | 14.7 |
Pro
Contra
Veredicto - Quase indistinguível do Precision 5480
O Precision 5480 proporcionou um aumento significativo da GPU em relação ao Precision 5470 devido ao salto na geração de GPUs, embora seus chassis fossem idênticos. Para o Precision 5490, no entanto, o modelo não apresenta novas opções de GPU e, portanto, o RTX 3000 Ada continua sendo a configuração de ponta. Se o desempenho da GPU for prioritário, o Precision 5490 funcionará de forma idêntica ao Precision 5480.
O desempenho da CPU e o desempenho gráfico permanecem estagnados entre o Precision 5490 e o Precision 5480. Em vez disso, o modelo mais recente se concentra na aceleração de IA, que ainda está em sua infância no momento da publicação.
Além da GPU, o salto da CPU do Raptor Lake-H para o Meteor Lake-H não oferece grandes benefícios de desempenho bruto. Sua NPU integrada, que é o principal ponto de venda do Precision 5490, tem poucos aplicativos no momento em que este artigo foi escrito. Portanto, comprar o Precision 5490 hoje significa investir na aceleração local de IA e nos futuros recursos de IA do Windows.
Para modelos futuros, gostaríamos de ver opções adicionais de tela, especialmente para aplicativos que exigem cores P3 e tempos de resposta mais rápidos em preto e branco. Alternativas como o ThinkPad P14s oferecem OLED, enquanto o nosso Precision está preso apenas ao IPS.
Preço e disponibilidade
A Dell agora está enviando o Precision 5490 a partir de US$ 2250 para a configuração básica Core Ultra 5, RTX 1000 Ada e 1200p até mais de US$ 3900 para a configuração de ponta Core Ultra 9, RTX 3000 Ada e 1600p.
Dell Precision 5000 5490
- 04/25/2024 v7 (old)
Allen Ngo
Transparência
A seleção dos dispositivos a serem analisados é feita pela nossa equipe editorial. A amostra de teste foi fornecida ao autor como empréstimo pelo fabricante ou varejista para fins desta revisão. O credor não teve influência nesta revisão, nem o fabricante recebeu uma cópia desta revisão antes da publicação. Não houve obrigação de publicar esta revisão. Como empresa de mídia independente, a Notebookcheck não está sujeita à autoridade de fabricantes, varejistas ou editores.
É assim que o Notebookcheck está testando
Todos os anos, o Notebookcheck analisa de forma independente centenas de laptops e smartphones usando procedimentos padronizados para garantir que todos os resultados sejam comparáveis. Desenvolvemos continuamente nossos métodos de teste há cerca de 20 anos e definimos padrões da indústria no processo. Em nossos laboratórios de teste, equipamentos de medição de alta qualidade são utilizados por técnicos e editores experientes. Esses testes envolvem um processo de validação em vários estágios. Nosso complexo sistema de classificação é baseado em centenas de medições e benchmarks bem fundamentados, o que mantém a objetividade.Price comparison

