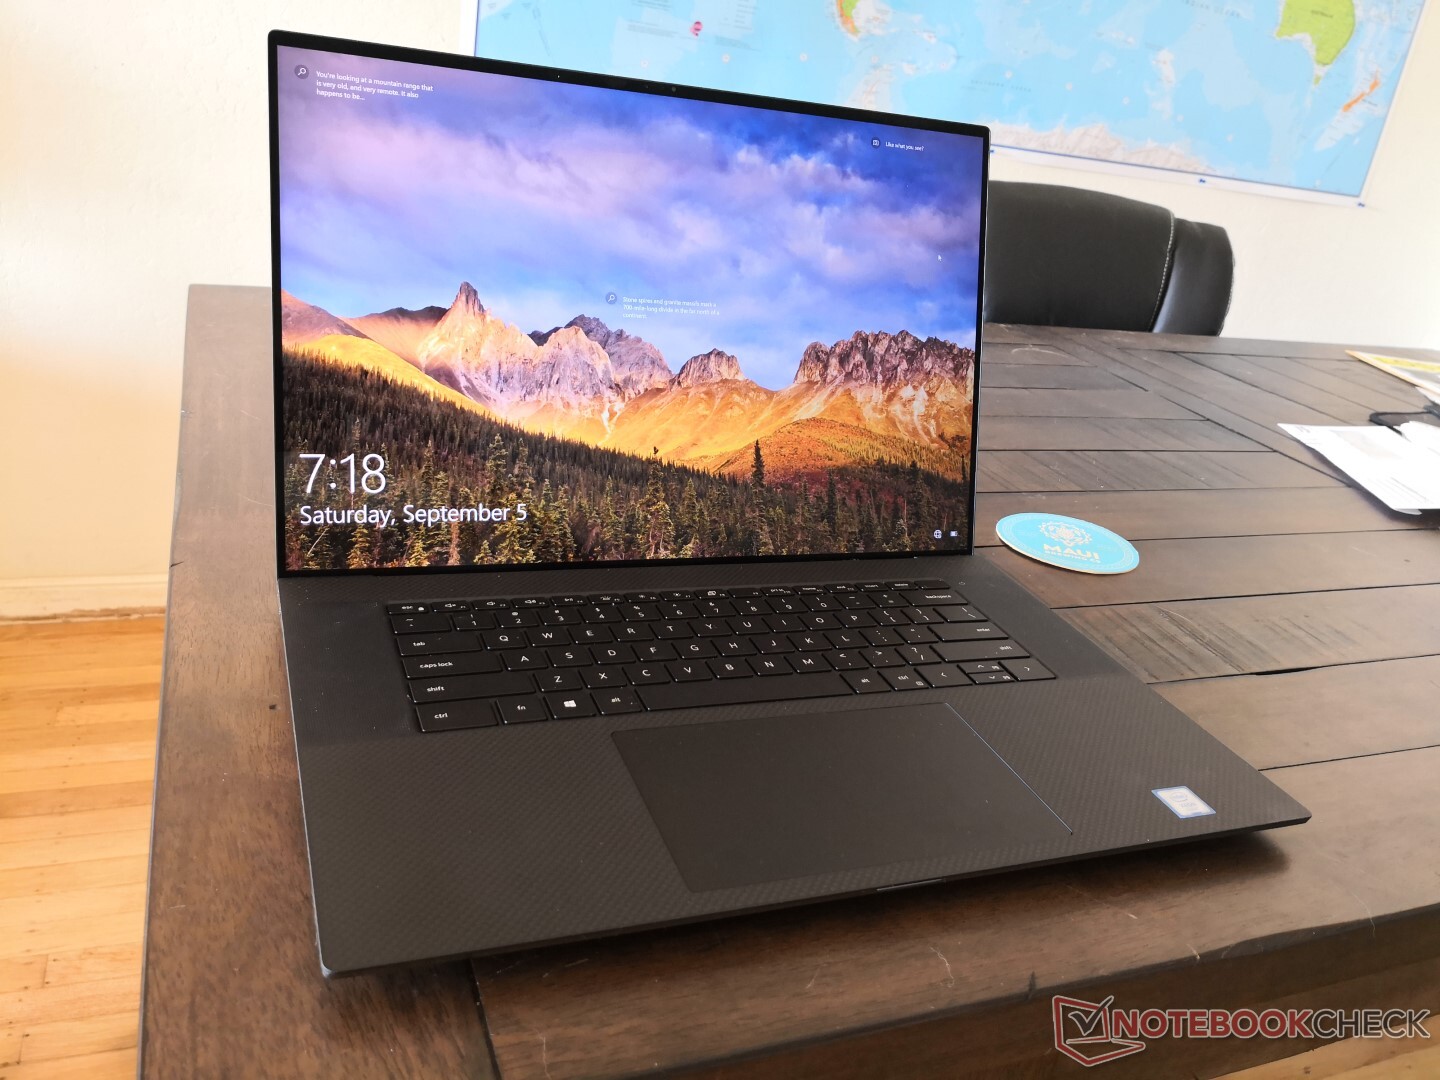
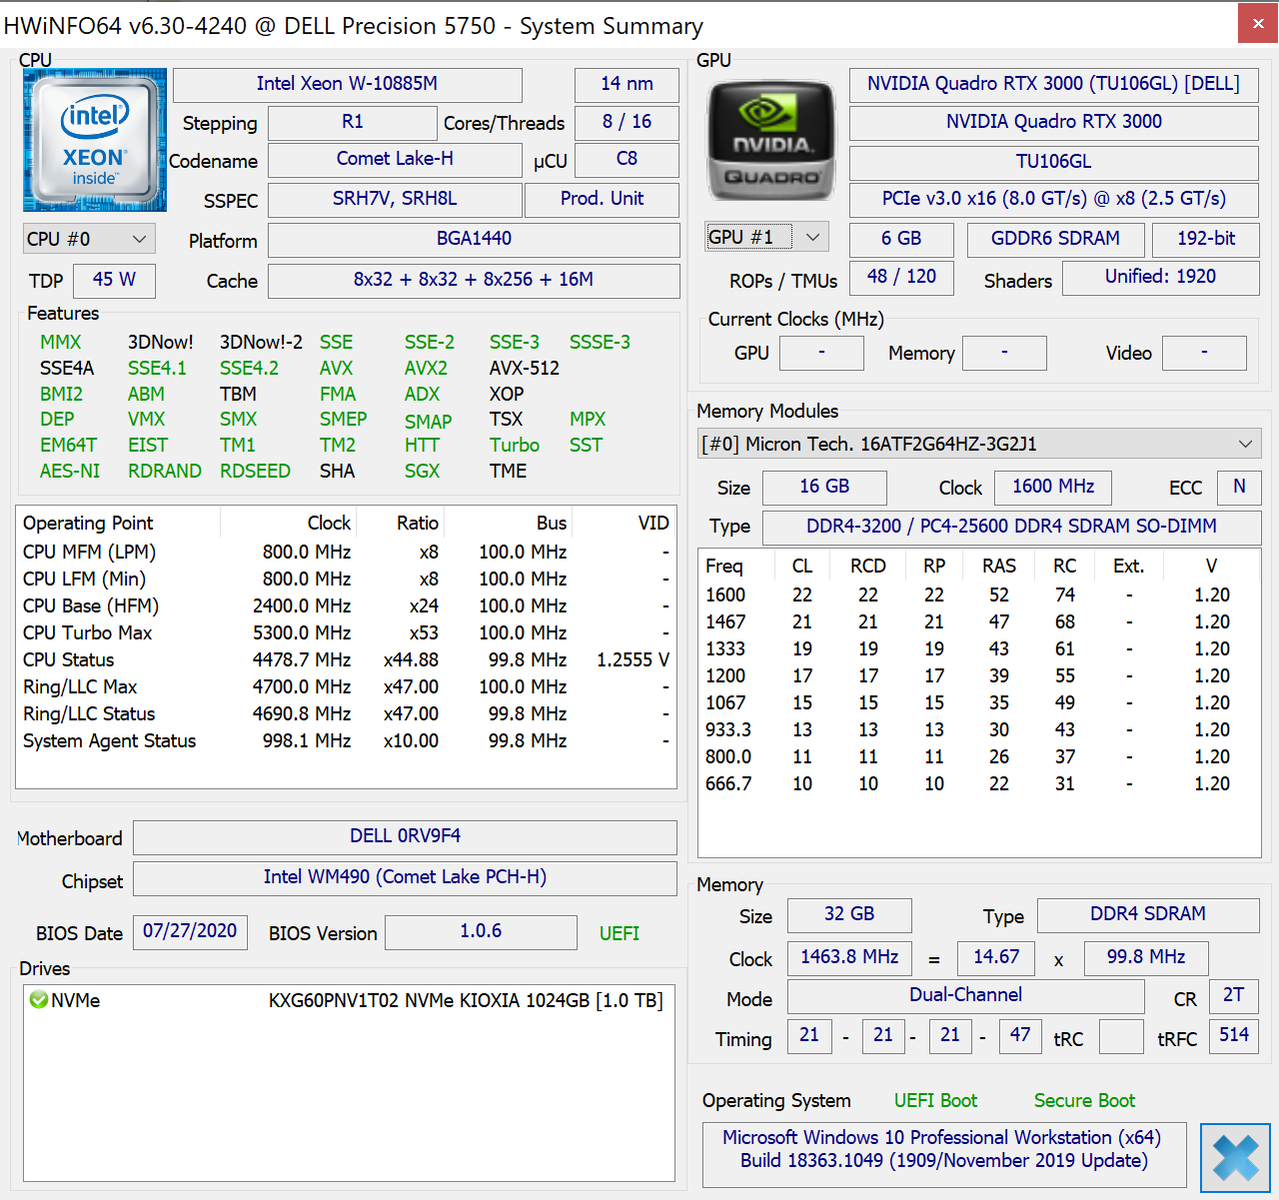
Breve Análise do Workstation Dell Precision 5750: O XPS 17 para profissionais
Avaliação | Data | Modelo | Peso | Altura | Size | Resolução | Preço |
|---|---|---|---|---|---|---|---|
| 87 % v7 (old) | 09/2020 | Dell Precision 5000 5750 P92F W-10885M, Quadro RTX 3000 Max-Q | 2.5 kg | 19.5 mm | 17.00" | 3840x2400 | |
| 86.4 % v7 (old) | 05/2020 | Asus ProArt StudioBook Pro 17 W700G3T i7-9750H, Quadro RTX 3000 Max-Q | 2.5 kg | 18.4 mm | 17.00" | 1920x1200 | |
| 83.8 % v7 (old) | MSI WS75 9TL-636 i7-9750H, Quadro RTX 4000 (Laptop) | 2.3 kg | 18.95 mm | 17.30" | 1920x1080 | ||
| 85.7 % v7 (old) | 05/2019 | Dell Precision 7730 i7-8850H, Quadro P3200 | 3.3 kg | 30 mm | 17.30" | 1920x1080 | |
| 86.6 % v7 (old) | Lenovo ThinkPad P73-20QR002DGE i7-9850H, Quadro RTX 3000 (Laptop) | 3.5 kg | 31 mm | 17.30" | 1920x1080 | ||
| 84.8 % v7 (old) | 12/2019 | MSI WE75 9TK i7-9750H, Quadro RTX 3000 (Laptop) | 2.6 kg | 27.5 mm | 17.30" | 1920x1080 |
| SD Card Reader | |
| average JPG Copy Test (av. of 3 runs) | |
| Dell Precision 7730 (Toshiba Exceria Pro SDXC 64 GB UHS-II) | |
| Lenovo ThinkPad P73-20QR002DGE (Toshiba Exceria Pro SDXC 64 GB UHS-II) | |
| Asus ProArt StudioBook Pro 17 W700G3T (Toshiba Exceria Pro SDXC 64 GB UHS-II) | |
| MSI WS75 9TL-636 (Toshiba Exceria Pro M501 64 GB UHS-II) | |
| Dell Precision 5000 5750 P92F (Toshiba Exceria Pro SDXC 64 GB UHS-II) | |
| MSI WE75 9TK (Toshiba Exceria Pro SDXC 64 GB UHS-II) | |
| maximum AS SSD Seq Read Test (1GB) | |
| Asus ProArt StudioBook Pro 17 W700G3T (Toshiba Exceria Pro SDXC 64 GB UHS-II) | |
| Dell Precision 7730 (Toshiba Exceria Pro SDXC 64 GB UHS-II) | |
| MSI WS75 9TL-636 (Toshiba Exceria Pro M501 64 GB UHS-II) | |
| Lenovo ThinkPad P73-20QR002DGE (Toshiba Exceria Pro SDXC 64 GB UHS-II) | |
| Dell Precision 5000 5750 P92F (Toshiba Exceria Pro SDXC 64 GB UHS-II) | |
| MSI WE75 9TK (Toshiba Exceria Pro SDXC 64 GB UHS-II) | |


| |||||||||||||||||||||||||
iluminação: 90 %
iluminação com acumulador: 483.8 cd/m²
Contraste: 1308:1 (Preto: 0.37 cd/m²)
ΔE ColorChecker Calman: 4.27 | ∀{0.5-29.43 Ø4.71}
calibrated: 4.01
ΔE Greyscale Calman: 3.5 | ∀{0.09-98 Ø4.96}
99.9% sRGB (Argyll 1.6.3 3D)
86.7% AdobeRGB 1998 (Argyll 1.6.3 3D)
97.7% AdobeRGB 1998 (Argyll 3D)
99.7% sRGB (Argyll 3D)
83.6% Display P3 (Argyll 3D)
Gamma: 2.43
CCT: 1741 K
| Dell Precision 5000 5750 P92F Sharp LQ170R1, IPS, 17", 3840x2400 | Asus ProArt StudioBook Pro 17 W700G3T 170PUW1-A00, IPS, 17", 1920x1200 | MSI WS75 9TL-636 B173HAN04.2, IPS, 17.3", 1920x1080 | Dell Precision 7730 B173HAN01.3, IPS LED, 17.3", 1920x1080 | Lenovo ThinkPad P73-20QR002DGE N173HCE-E31, IPS LED, 17.3", 1920x1080 | MSI WE75 9TK AU Optronics B173HAN04.2, IPS, 17.3", 1920x1080 | |
|---|---|---|---|---|---|---|
| Display | 1% | -22% | -20% | -19% | -23% | |
| Display P3 Coverage (%) | 83.6 | 96.2 15% | 64.5 -23% | 65 -22% | 67.5 -19% | 63.2 -24% |
| sRGB Coverage (%) | 99.7 | 99.8 0% | 91.1 -9% | 93.4 -6% | 94.2 -6% | 89.9 -10% |
| AdobeRGB 1998 Coverage (%) | 97.7 | 84.7 -13% | 65.8 -33% | 66.3 -32% | 67.8 -31% | 64.3 -34% |
| Response Times | 7% | 11% | -7% | 11% | 17% | |
| Response Time Grey 50% / Grey 80% * (ms) | 41.2 ? | 41.2 ? -0% | 39.2 ? 5% | 48.8 ? -18% | 40 ? 3% | 30.8 ? 25% |
| Response Time Black / White * (ms) | 34 ? | 29.6 ? 13% | 28.4 ? 16% | 32.8 ? 4% | 28 ? 18% | 31.2 ? 8% |
| PWM Frequency (Hz) | 25000 ? | |||||
| Screen | 17% | -3% | 12% | -12% | 0% | |
| Brightness middle (cd/m²) | 483.8 | 323 -33% | 300 -38% | 322 -33% | 333 -31% | 287.3 -41% |
| Brightness (cd/m²) | 457 | 308 -33% | 288 -37% | 316 -31% | 310 -32% | 280 -39% |
| Brightness Distribution (%) | 90 | 88 -2% | 86 -4% | 84 -7% | 83 -8% | 89 -1% |
| Black Level * (cd/m²) | 0.37 | 0.36 3% | 0.25 32% | 0.24 35% | 0.39 -5% | 0.26 30% |
| Contrast (:1) | 1308 | 897 -31% | 1200 -8% | 1342 3% | 854 -35% | 1105 -16% |
| Colorchecker dE 2000 * | 4.27 | 1.1 74% | 3.9 9% | 2.2 48% | 4.4 -3% | 2.98 30% |
| Colorchecker dE 2000 max. * | 8.78 | 3.3 62% | 6 32% | 4.6 48% | 7.5 15% | 5.08 42% |
| Colorchecker dE 2000 calibrated * | 4.01 | 0.8 80% | 2.3 43% | 1.9 53% | 2 50% | 3.06 24% |
| Greyscale dE 2000 * | 3.5 | 0.8 77% | 4.3 -23% | 1.6 54% | 5.1 -46% | 3 14% |
| Gamma | 2.43 91% | 2.23 99% | 2.2 100% | 2.19 100% | 2.39 92% | 2.28 96% |
| CCT | 1741 373% | 6479 100% | 7391 88% | 6621 98% | 7061 92% | 6993 93% |
| Color Space (Percent of AdobeRGB 1998) (%) | 86.7 | 75.7 -13% | 59.2 -32% | 60.4 -30% | 61.1 -30% | 58.1 -33% |
| Color Space (Percent of sRGB) (%) | 99.9 | 99.8 0% | 91 -9% | 93.3 -7% | 94 -6% | 89.5 -10% |
| Média Total (Programa/Configurações) | 8% /
12% | -5% /
-5% | -5% /
4% | -7% /
-10% | -2% /
-2% |
* ... menor é melhor
Exibir tempos de resposta
| ↔ Tempo de resposta preto para branco | ||
|---|---|---|
| 34 ms ... ascensão ↗ e queda ↘ combinadas | ↗ 20 ms ascensão | 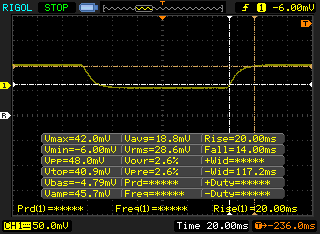 |
| ↘ 14 ms queda | ||
| A tela mostra taxas de resposta lentas em nossos testes e será insatisfatória para os jogadores. Em comparação, todos os dispositivos testados variam de 0.1 (mínimo) a 240 (máximo) ms. » 91 % de todos os dispositivos são melhores. Isso significa que o tempo de resposta medido é pior que a média de todos os dispositivos testados (19.8 ms). | ||
| ↔ Tempo de resposta 50% cinza a 80% cinza | ||
| 41.2 ms ... ascensão ↗ e queda ↘ combinadas | ↗ 18.4 ms ascensão | 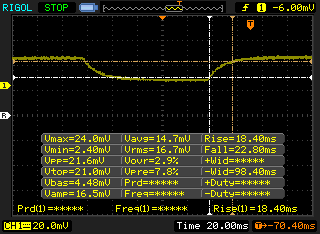 |
| ↘ 22.8 ms queda | ||
| A tela mostra taxas de resposta lentas em nossos testes e será insatisfatória para os jogadores. Em comparação, todos os dispositivos testados variam de 0.165 (mínimo) a 636 (máximo) ms. » 66 % de todos os dispositivos são melhores. Isso significa que o tempo de resposta medido é pior que a média de todos os dispositivos testados (31 ms). | ||
Cintilação da tela / PWM (modulação por largura de pulso)
| Tela tremeluzindo / PWM não detectado |  | ||
[pwm_comparison] Em comparação: 52 % de todos os dispositivos testados não usam PWM para escurecer a tela. Se PWM foi detectado, uma média de 7757 (mínimo: 5 - máximo: 343500) Hz foi medida. | |||
Cinebench R15: CPU Multi 64Bit | CPU Single 64Bit
Blender: v2.79 BMW27 CPU
7-Zip 18.03: 7z b 4 -mmt1 | 7z b 4
Geekbench 5.5: Single-Core | Multi-Core
HWBOT x265 Benchmark v2.2: 4k Preset
LibreOffice : 20 Documents To PDF
R Benchmark 2.5: Overall mean
| Cinebench R20 / CPU (Multi Core) | |
| Corsair One i160 | |
| Eluktronics RP-17 | |
| MSI WS66 10TMT-207US | |
| Dell Precision 5000 5750 P92F | |
| Média Intel Xeon W-10885M (2727 - 4065, n=4) | |
| Dell Precision 5550 P91F | |
| Acer ConceptD 9 Pro | |
| MSI GS66 Stealth 10SE-045 | |
| Dell Precision 7730 | |
| Lenovo ThinkPad P73-20QR002DGE | |
| Acer ConceptD 3 Pro CN315-71P-73W1 | |
| Dell XPS 15 9500 Core i5 | |
| Cinebench R20 / CPU (Single Core) | |
| Acer ConceptD 9 Pro | |
| MSI WS66 10TMT-207US | |
| Corsair One i160 | |
| Média Intel Xeon W-10885M (488 - 502, n=4) | |
| Dell Precision 5550 P91F | |
| Dell Precision 5000 5750 P92F | |
| Eluktronics RP-17 | |
| MSI GS66 Stealth 10SE-045 | |
| Lenovo ThinkPad P73-20QR002DGE | |
| Dell XPS 15 9500 Core i5 | |
| Dell Precision 7730 | |
| Acer ConceptD 3 Pro CN315-71P-73W1 | |
| Cinebench R15 / CPU Multi 64Bit | |
| Corsair One i160 | |
| Eluktronics RP-17 | |
| MSI WS66 10TMT-207US | |
| Dell Precision 5000 5750 P92F | |
| Acer ConceptD 9 Pro | |
| Dell Precision 5550 P91F | |
| Média Intel Xeon W-10885M (1089 - 1666, n=4) | |
| Dell Precision 7730 | |
| Lenovo ThinkPad P73-20QR002DGE | |
| MSI GS66 Stealth 10SE-045 | |
| Acer ConceptD 3 Pro CN315-71P-73W1 | |
| Dell XPS 15 9500 Core i5 | |
| Cinebench R15 / CPU Single 64Bit | |
| Dell Precision 5000 5750 P92F | |
| MSI WS66 10TMT-207US | |
| Média Intel Xeon W-10885M (208 - 211, n=4) | |
| Corsair One i160 | |
| Dell Precision 5550 P91F | |
| Acer ConceptD 9 Pro | |
| Lenovo ThinkPad P73-20QR002DGE | |
| MSI GS66 Stealth 10SE-045 | |
| Eluktronics RP-17 | |
| Acer ConceptD 3 Pro CN315-71P-73W1 | |
| Dell XPS 15 9500 Core i5 | |
| Dell Precision 7730 | |
| Blender / v2.79 BMW27 CPU | |
| Dell XPS 15 9500 Core i5 | |
| Acer ConceptD 3 Pro CN315-71P-73W1 | |
| Lenovo ThinkPad P73-20QR002DGE | |
| Dell Precision 7730 | |
| MSI GS66 Stealth 10SE-045 | |
| Dell Precision 5550 P91F | |
| Média Intel Xeon W-10885M (281 - 412, n=3) | |
| Dell Precision 5000 5750 P92F | |
| MSI WS66 10TMT-207US | |
| Eluktronics RP-17 | |
| Corsair One i160 | |
| 7-Zip 18.03 / 7z b 4 -mmt1 | |
| Média Intel Xeon W-10885M (5495 - 5703, n=3) | |
| Dell Precision 5000 5750 P92F | |
| Acer ConceptD 9 Pro | |
| Dell Precision 5550 P91F | |
| MSI WS66 10TMT-207US | |
| Corsair One i160 | |
| Lenovo ThinkPad P73-20QR002DGE | |
| Dell XPS 15 9500 Core i5 | |
| MSI GS66 Stealth 10SE-045 | |
| Dell Precision 7730 | |
| Eluktronics RP-17 | |
| Acer ConceptD 3 Pro CN315-71P-73W1 | |
| 7-Zip 18.03 / 7z b 4 | |
| Corsair One i160 | |
| Eluktronics RP-17 | |
| MSI WS66 10TMT-207US | |
| Dell Precision 5000 5750 P92F | |
| Média Intel Xeon W-10885M (36204 - 48044, n=3) | |
| Dell Precision 5550 P91F | |
| Acer ConceptD 9 Pro | |
| MSI GS66 Stealth 10SE-045 | |
| Dell Precision 7730 | |
| Lenovo ThinkPad P73-20QR002DGE | |
| Acer ConceptD 3 Pro CN315-71P-73W1 | |
| Dell XPS 15 9500 Core i5 | |
| Geekbench 5.5 / Single-Core | |
| Dell Precision 5000 5750 P92F | |
| MSI WS66 10TMT-207US | |
| Média Intel Xeon W-10885M (1331 - 1347, n=3) | |
| Dell Precision 5550 P91F | |
| Acer ConceptD 9 Pro | |
| MSI GS66 Stealth 10SE-045 | |
| Acer ConceptD 3 Pro CN315-71P-73W1 | |
| Dell XPS 15 9500 Core i5 | |
| Eluktronics RP-17 | |
| Lenovo ThinkPad P73-20QR002DGE | |
| Geekbench 5.5 / Multi-Core | |
| Dell Precision 5000 5750 P92F | |
| Dell Precision 5550 P91F | |
| MSI WS66 10TMT-207US | |
| Média Intel Xeon W-10885M (6948 - 8491, n=3) | |
| Eluktronics RP-17 | |
| Acer ConceptD 9 Pro | |
| MSI GS66 Stealth 10SE-045 | |
| Lenovo ThinkPad P73-20QR002DGE | |
| Acer ConceptD 3 Pro CN315-71P-73W1 | |
| Dell XPS 15 9500 Core i5 | |
| HWBOT x265 Benchmark v2.2 / 4k Preset | |
| Corsair One i160 | |
| Dell Precision 5000 5750 P92F | |
| Eluktronics RP-17 | |
| MSI WS66 10TMT-207US | |
| Média Intel Xeon W-10885M (8.89 - 13.6, n=3) | |
| Dell Precision 5550 P91F | |
| MSI GS66 Stealth 10SE-045 | |
| Dell Precision 7730 | |
| Lenovo ThinkPad P73-20QR002DGE | |
| Acer ConceptD 3 Pro CN315-71P-73W1 | |
| Dell XPS 15 9500 Core i5 | |
| LibreOffice / 20 Documents To PDF | |
| Dell XPS 15 9500 Core i5 | |
| MSI GS66 Stealth 10SE-045 | |
| Eluktronics RP-17 | |
| Acer ConceptD 9 Pro | |
| Acer ConceptD 3 Pro CN315-71P-73W1 | |
| Média Intel Xeon W-10885M (44.4 - 58.1, n=3) | |
| Dell Precision 5000 5750 P92F | |
| MSI WS66 10TMT-207US | |
| Dell Precision 5550 P91F | |
| R Benchmark 2.5 / Overall mean | |
| Acer ConceptD 3 Pro CN315-71P-73W1 | |
| Dell XPS 15 9500 Core i5 | |
| MSI GS66 Stealth 10SE-045 | |
| Dell Precision 5550 P91F | |
| Eluktronics RP-17 | |
| MSI WS66 10TMT-207US | |
| Dell Precision 5000 5750 P92F | |
| Média Intel Xeon W-10885M (0.551 - 0.57, n=3) | |
* ... menor é melhor
| PCMark 10 | |
| Score | |
| MSI WS75 9TL-636 | |
| MSI WE75 9TK | |
| Lenovo ThinkPad P73-20QR002DGE | |
| Dell Precision 5000 5750 P92F | |
| Dell Precision 7730 | |
| Asus ProArt StudioBook Pro 17 W700G3T | |
| Essentials | |
| Dell Precision 5000 5750 P92F | |
| Lenovo ThinkPad P73-20QR002DGE | |
| MSI WE75 9TK | |
| MSI WS75 9TL-636 | |
| Dell Precision 7730 | |
| Asus ProArt StudioBook Pro 17 W700G3T | |
| Productivity | |
| Dell Precision 5000 5750 P92F | |
| MSI WS75 9TL-636 | |
| Asus ProArt StudioBook Pro 17 W700G3T | |
| MSI WE75 9TK | |
| Lenovo ThinkPad P73-20QR002DGE | |
| Dell Precision 7730 | |
| Digital Content Creation | |
| MSI WS75 9TL-636 | |
| MSI WE75 9TK | |
| Lenovo ThinkPad P73-20QR002DGE | |
| Dell Precision 7730 | |
| Dell Precision 5000 5750 P92F | |
| Asus ProArt StudioBook Pro 17 W700G3T | |
| PCMark 8 | |
| Home Score Accelerated v2 | |
| MSI WS75 9TL-636 | |
| Dell Precision 7730 | |
| Asus ProArt StudioBook Pro 17 W700G3T | |
| MSI WE75 9TK | |
| Lenovo ThinkPad P73-20QR002DGE | |
| Dell Precision 5000 5750 P92F | |
| Work Score Accelerated v2 | |
| MSI WE75 9TK | |
| Dell Precision 7730 | |
| Lenovo ThinkPad P73-20QR002DGE | |
| MSI WS75 9TL-636 | |
| Asus ProArt StudioBook Pro 17 W700G3T | |
| Dell Precision 5000 5750 P92F | |
| PCMark 8 Home Score Accelerated v2 | 3819 pontos | |
| PCMark 8 Work Score Accelerated v2 | 4718 pontos | |
| PCMark 10 Score | 5484 pontos | |
Ajuda | ||
| DPC Latencies / LatencyMon - interrupt to process latency (max), Web, Youtube, Prime95 | |
| Dell Precision 7550 | |
| MSI WS66 10TMT-207US | |
| Eluktronics RP-17 | |
| Acer ConceptD 3 Pro CN315-71P-73W1 | |
| Acer ConceptD 9 Pro | |
| Razer Blade 15 Studio Edition 2020 | |
| Dell Precision 5000 5750 P92F | |
| Dell Precision 5550 P91F | |
* ... menor é melhor
| Dell Precision 5000 5750 P92F Toshiba Kioxia XG6 KXG60PNV1T02 | Asus ProArt StudioBook Pro 17 W700G3T Samsung SSD PM981 MZVLB1T0HALR | MSI WS75 9TL-636 Samsung SSD PM981 MZVLB1T0HALR | Dell Precision 7730 Samsung SSD PM981 MZVLB512HAJQ | Lenovo ThinkPad P73-20QR002DGE Intel SSD Pro 7600p SSDPEKKF512G8L | MSI WE75 9TK Samsung SSD PM981 MZVLB512HAJQ | |
|---|---|---|---|---|---|---|
| AS SSD | 44% | 23% | 15% | 3% | 7% | |
| Seq Read (MB/s) | 2025 | 2958 46% | 870 -57% | 2697 33% | 2693 33% | 1308 -35% |
| Seq Write (MB/s) | 1438 | 2350 63% | 2247 56% | 1789 24% | 1542 7% | 1871 30% |
| 4K Read (MB/s) | 38.77 | 56.6 46% | 53.4 38% | 50.5 30% | 62.6 61% | 48.35 25% |
| 4K Write (MB/s) | 96.9 | 106.1 9% | 123.2 27% | 105.9 9% | 149.5 54% | 106.6 10% |
| 4K-64 Read (MB/s) | 1105 | 1836 66% | 1673 51% | 1139 3% | 871 -21% | 1510 37% |
| 4K-64 Write (MB/s) | 1435 | 1789 25% | 1826 27% | 1714 19% | 1006 -30% | 1715 20% |
| Access Time Read * (ms) | 0.08 | 0.061 24% | 0.05 37% | 0.061 24% | 0.058 27% | 0.103 -29% |
| Access Time Write * (ms) | 0.116 | 0.036 69% | 0.033 72% | 0.037 68% | 0.067 42% | 0.106 9% |
| Score Read (Points) | 1347 | 2189 63% | 1813 35% | 1460 8% | 1203 -11% | 1689 25% |
| Score Write (Points) | 1676 | 2130 27% | 2173 30% | 1999 19% | 1309 -22% | 2008 20% |
| Score Total (Points) | 3686 | 5411 47% | 4989 35% | 4168 13% | 3088 -16% | 4594 25% |
| Copy ISO MB/s (MB/s) | 2609 | 3154 21% | 3259 25% | 1716 -34% | 2343 -10% | |
| Copy Program MB/s (MB/s) | 740 | 533 -28% | 435.6 -41% | 542 -27% | 526 -29% | |
| Copy Game MB/s (MB/s) | 1624 | 1349 -17% | 1273 -22% | 1375 -15% | 1506 -7% | |
| CrystalDiskMark 5.2 / 6 | 19% | -1% | -7% | 16% | 19% | |
| Write 4K (MB/s) | 103.5 | 147.6 43% | 103.5 0% | 103.2 0% | 154.3 49% | 135.4 31% |
| Read 4K (MB/s) | 44.56 | 47.57 7% | 41.88 -6% | 41.39 -7% | 66.4 49% | 56.6 27% |
| Write Seq (MB/s) | 1934 | 2222 15% | 1931 0% | 1880 -3% | 1561 -19% | 1972 2% |
| Read Seq (MB/s) | 1937 | 2543 31% | 1286 -34% | 2350 21% | 2460 27% | 2101 8% |
| Write 4K Q32T1 (MB/s) | 372.9 | 459.2 23% | 414.3 11% | 282.3 -24% | 438 17% | 527 41% |
| Read 4K Q32T1 (MB/s) | 358.9 | 515 43% | 470.2 31% | 314.3 -12% | 568 58% | 578 61% |
| Write Seq Q32T1 (MB/s) | 2894 | 2167 -25% | 2393 -17% | 1881 -35% | 1581 -45% | 1985 -31% |
| Read Seq Q32T1 (MB/s) | 3082 | 3430 11% | 3425 11% | 3216 4% | 2724 -12% | 3358 9% |
| Write 4K Q8T8 (MB/s) | 1484 | 1000 | ||||
| Read 4K Q8T8 (MB/s) | 1536 | 928 | ||||
| Média Total (Programa/Configurações) | 32% /
33% | 11% /
15% | 4% /
7% | 10% /
8% | 13% /
11% |
* ... menor é melhor

Disk Throttling: DiskSpd Read Loop, Queue Depth 8
| 3DMark 11 | |
| 1280x720 Performance GPU | |
| Acer ConceptD 9 Pro | |
| MSI WS66 10TMT-207US | |
| MSI RTX 2060 Gaming Z 6G | |
| MSI WS75 9TL-636 | |
| MSI WE75 9TK | |
| Maingear Vector 15 | |
| Dell Precision 5000 5750 P92F | |
| Média NVIDIA Quadro RTX 3000 Max-Q (17074 - 19513, n=3) | |
| Acer ConceptD 3 Pro CN315-71P-73W1 | |
| Dell Precision 5540 | |
| Dell Precision 5550 P91F | |
| Lenovo ThinkPad P53s-20N6001NGE | |
| HP ZBook 15u G6 6TP54EA | |
| 1280x720 Performance Combined | |
| MSI WS66 10TMT-207US | |
| Dell Precision 5000 5750 P92F | |
| Acer ConceptD 9 Pro | |
| MSI RTX 2060 Gaming Z 6G | |
| Média NVIDIA Quadro RTX 3000 Max-Q (10298 - 16401, n=3) | |
| MSI WS75 9TL-636 | |
| MSI WE75 9TK | |
| Maingear Vector 15 | |
| Dell Precision 5550 P91F | |
| Acer ConceptD 3 Pro CN315-71P-73W1 | |
| Dell Precision 5540 | |
| HP ZBook 15u G6 6TP54EA | |
| Lenovo ThinkPad P53s-20N6001NGE | |
| 3DMark 11 Performance | 18981 pontos | |
| 3DMark Cloud Gate Standard Score | 34264 pontos | |
| 3DMark Fire Strike Score | 13342 pontos | |
| 3DMark Time Spy Score | 5737 pontos | |
Ajuda | ||
| baixo | média | alto | ultra | QHD | 4K | |
|---|---|---|---|---|---|---|
| The Witcher 3 (2015) | 304.7 | 189.4 | 107.4 | 57.2 | 36.5 | |
| Dota 2 Reborn (2015) | 145 | 133 | 126 | 120 | 77.6 | |
| Final Fantasy XV Benchmark (2018) | 149 | 79.1 | 59.5 | 43.8 | 25.9 | |
| X-Plane 11.11 (2018) | 117 | 106 | 85.8 | 67.6 |
| Dell Precision 5000 5750 P92F Quadro RTX 3000 Max-Q, W-10885M, Toshiba Kioxia XG6 KXG60PNV1T02 | Asus ProArt StudioBook Pro 17 W700G3T Quadro RTX 3000 Max-Q, i7-9750H, Samsung SSD PM981 MZVLB1T0HALR | MSI WS75 9TL-636 Quadro RTX 4000 (Laptop), i7-9750H, Samsung SSD PM981 MZVLB1T0HALR | Dell Precision 7730 Quadro P3200, i7-8850H, Samsung SSD PM981 MZVLB512HAJQ | Lenovo ThinkPad P73-20QR002DGE Quadro RTX 3000 (Laptop), i7-9850H, Intel SSD Pro 7600p SSDPEKKF512G8L | MSI WE75 9TK Quadro RTX 3000 (Laptop), i7-9750H, Samsung SSD PM981 MZVLB512HAJQ | |
|---|---|---|---|---|---|---|
| Noise | 11% | 2% | 6% | 12% | 1% | |
| desligado / ambiente * (dB) | 27.5 | 29.4 -7% | 29.4 -7% | 29.7 -8% | 29.3 -7% | 28.5 -4% |
| Idle Minimum * (dB) | 27.5 | 29.4 -7% | 29.4 -7% | 29.7 -8% | 29.3 -7% | 29 -5% |
| Idle Average * (dB) | 27.5 | 29.9 -9% | 30.1 -9% | 29.7 -8% | 29.3 -7% | 29 -5% |
| Idle Maximum * (dB) | 27.5 | 29.9 -9% | 30.9 -12% | 29.7 -8% | 29.3 -7% | 31.5 -15% |
| Load Average * (dB) | 44.8 | 31.6 29% | 40.7 9% | 31.4 30% | 30.2 33% | 32 29% |
| Witcher 3 ultra * (dB) | 52.5 | 31.6 40% | 41.9 20% | 37.9 28% | 30.7 42% | 44.7 15% |
| Load Maximum * (dB) | 52.5 | 31.6 40% | 42.7 19% | 44.2 16% | 33.1 37% | 56.5 -8% |
* ... menor é melhor
Barulho
| Ocioso |
| 27.5 / 27.5 / 27.5 dB |
| Carga |
| 44.8 / 52.5 dB |
 | ||
30 dB silencioso 40 dB(A) audível 50 dB(A) ruidosamente alto |
||
min: | ||
(-) A temperatura máxima no lado superior é 55.6 °C / 132 F, em comparação com a média de 38.2 °C / 101 F , variando de 22.2 a 69.8 °C para a classe Workstation.
(±) A parte inferior aquece até um máximo de 42 °C / 108 F, em comparação com a média de 41.1 °C / 106 F
(+) Em uso inativo, a temperatura média para o lado superior é 25.2 °C / 77 F, em comparação com a média do dispositivo de 32 °C / ### class_avg_f### F.
(±) Jogando The Witcher 3, a temperatura média para o lado superior é 36 °C / 97 F, em comparação com a média do dispositivo de 32 °C / ## #class_avg_f### F.
(+) Os apoios para as mãos e o touchpad estão atingindo a temperatura máxima da pele (33.6 °C / 92.5 F) e, portanto, não estão quentes.
(-) A temperatura média da área do apoio para as mãos de dispositivos semelhantes foi 27.8 °C / 82 F (-5.8 °C / -10.5 F).
Dell Precision 5000 5750 P92F análise de áudio
(+) | os alto-falantes podem tocar relativamente alto (###valor### dB)
Graves 100 - 315Hz
(±) | graves reduzidos - em média 7.4% menor que a mediana
(±) | a linearidade dos graves é média (8.7% delta para a frequência anterior)
Médios 400 - 2.000 Hz
(+) | médios equilibrados - apenas 3.6% longe da mediana
(+) | médios são lineares (3.8% delta para frequência anterior)
Altos 2 - 16 kHz
(±) | máximos mais altos - em média 5.3% maior que a mediana
(+) | os máximos são lineares (5.6% delta da frequência anterior)
Geral 100 - 16.000 Hz
(+) | o som geral é linear (10.5% diferença em relação à mediana)
Comparado com a mesma classe
» 7% de todos os dispositivos testados nesta classe foram melhores, 6% semelhantes, 87% piores
» O melhor teve um delta de 7%, a média foi 17%, o pior foi 35%
Comparado com todos os dispositivos testados
» 5% de todos os dispositivos testados foram melhores, 1% semelhantes, 93% piores
» O melhor teve um delta de 4%, a média foi 23%, o pior foi 134%
Apple MacBook 12 (Early 2016) 1.1 GHz análise de áudio
(+) | os alto-falantes podem tocar relativamente alto (###valor### dB)
Graves 100 - 315Hz
(±) | graves reduzidos - em média 11.3% menor que a mediana
(±) | a linearidade dos graves é média (14.2% delta para a frequência anterior)
Médios 400 - 2.000 Hz
(+) | médios equilibrados - apenas 2.4% longe da mediana
(+) | médios são lineares (5.5% delta para frequência anterior)
Altos 2 - 16 kHz
(+) | agudos equilibrados - apenas 2% longe da mediana
(+) | os máximos são lineares (4.5% delta da frequência anterior)
Geral 100 - 16.000 Hz
(+) | o som geral é linear (10.2% diferença em relação à mediana)
Comparado com a mesma classe
» 7% de todos os dispositivos testados nesta classe foram melhores, 2% semelhantes, 90% piores
» O melhor teve um delta de 5%, a média foi 18%, o pior foi 53%
Comparado com todos os dispositivos testados
» 5% de todos os dispositivos testados foram melhores, 1% semelhantes, 94% piores
» O melhor teve um delta de 4%, a média foi 23%, o pior foi 134%
| desligado | |
| Ocioso | |
| Carga |
|
Key:
min: | |
| Dell Precision 5000 5750 P92F W-10885M, Quadro RTX 3000 Max-Q, Toshiba Kioxia XG6 KXG60PNV1T02, IPS, 3840x2400, 17" | Asus ProArt StudioBook Pro 17 W700G3T i7-9750H, Quadro RTX 3000 Max-Q, Samsung SSD PM981 MZVLB1T0HALR, IPS, 1920x1200, 17" | MSI WS75 9TL-636 i7-9750H, Quadro RTX 4000 (Laptop), Samsung SSD PM981 MZVLB1T0HALR, IPS, 1920x1080, 17.3" | Dell Precision 7730 i7-8850H, Quadro P3200, Samsung SSD PM981 MZVLB512HAJQ, IPS LED, 1920x1080, 17.3" | Lenovo ThinkPad P73-20QR002DGE i7-9850H, Quadro RTX 3000 (Laptop), Intel SSD Pro 7600p SSDPEKKF512G8L, IPS LED, 1920x1080, 17.3" | MSI WE75 9TK i7-9750H, Quadro RTX 3000 (Laptop), Samsung SSD PM981 MZVLB512HAJQ, IPS, 1920x1080, 17.3" | |
|---|---|---|---|---|---|---|
| Power Consumption | -17% | -47% | -25% | -13% | -30% | |
| Idle Minimum * (Watt) | 6.3 | 11.3 -79% | 16.4 -160% | 10.1 -60% | 8.9 -41% | 12.1 -92% |
| Idle Average * (Watt) | 14.2 | 16 -13% | 21.6 -52% | 18 -27% | 12.8 10% | 18.4 -30% |
| Idle Maximum * (Watt) | 17.3 | 16.8 3% | 22.9 -32% | 19.7 -14% | 16.4 5% | 18.8 -9% |
| Load Average * (Watt) | 121.2 | 93.6 23% | 88 27% | 89.6 26% | 108.4 11% | 95.1 22% |
| Witcher 3 ultra * (Watt) | 115.4 | 106 8% | 137 -19% | 134 -16% | 153 -33% | 135.5 -17% |
| Load Maximum * (Watt) | 130.7 | 186.6 -43% | 193 -48% | 204 -56% | 166 -27% | 203.7 -56% |
* ... menor é melhor
| Dell Precision 5000 5750 P92F W-10885M, Quadro RTX 3000 Max-Q, 97 Wh | Asus ProArt StudioBook Pro 17 W700G3T i7-9750H, Quadro RTX 3000 Max-Q, 57 Wh | MSI WS75 9TL-636 i7-9750H, Quadro RTX 4000 (Laptop), 82 Wh | Dell Precision 7730 i7-8850H, Quadro P3200, 92 Wh | Lenovo ThinkPad P73-20QR002DGE i7-9850H, Quadro RTX 3000 (Laptop), 99 Wh | MSI WE75 9TK i7-9750H, Quadro RTX 3000 (Laptop), 65 Wh | |
|---|---|---|---|---|---|---|
| Duração da bateria | -35% | -38% | -41% | -17% | -50% | |
| Reader / Idle (h) | 18.2 | 12.6 -31% | 11 -40% | |||
| WiFi v1.3 (h) | 10.9 | 5.9 -46% | 6.6 -39% | 5.6 -49% | 11.1 2% | 4.9 -55% |
| Load (h) | 2.2 | 1.7 -23% | 1.2 -45% | 1.5 -32% | 1.4 -36% | 1 -55% |
Pro
Contra
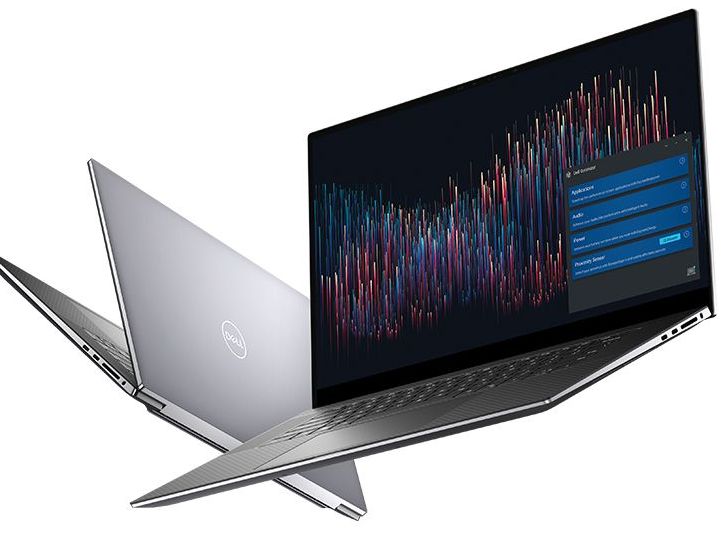
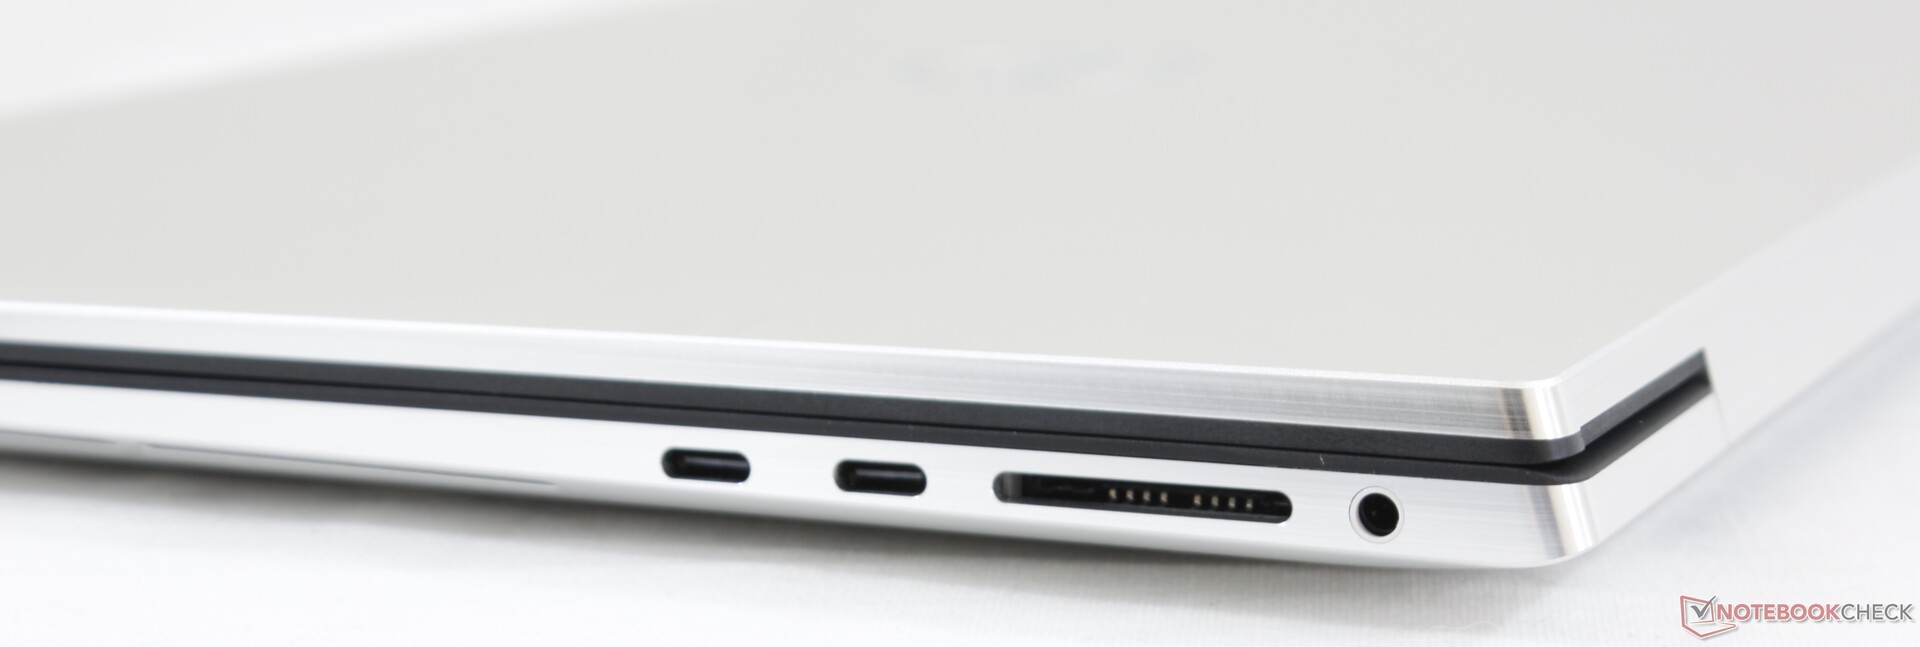
O Precision 5750 é para usuários que não precisam de nenhum dos recursos auxiliares do Precision 7750 maior e preferem omiti-los completamente em favor de um design mais fino, elegante e portátil. Se você viaja muito e não se importa com um sistema barebones que é parte Ultrabook e parte workstation, então este Precision cumpre esse papel. É recomendável ter monitores Thunderbolt 3 e estações docking para aproveitar ao máximo o sistema.
Além dos sacrifícios de hardware, existem algumas outras desvantagens a serem consideradas. Em primeiro lugar, é lamentável que a garantia básica seja de apenas 12 meses em comparação com 36 meses no Precision 7750 maior, quase como se a Dell estivesse vendo o Precision 5550 como o modelo inferior. Em segundo lugar, as temperaturas da CPU serão bastante altas e com uma taxa de recarga da bateria mais lenta ao executar cargas exigentes. O último é devido ao pequeno adaptador de CA de 130 W que favorece a portabilidade em vez de uma saída mais alta. É evidente que a Dell projetou o sistema para se sobressair em cargas de trabalho "intermitentes", enquanto os maiores e mais poderosos Precision 7550/7570 terá um desempenho melhor em cargas de trabalho sustentadas. E por último, a falta de qualquer tipo de obturador de webcam é estranho de se ver em um chassi com design tão novo.
O Precision 5750 é propositalmente leve em recursos de hardware em favor de um design mais portátil. Se você deseja um workstation de 17 polegadas mais amigável para viagens, o Precision 5750 é o ideal.
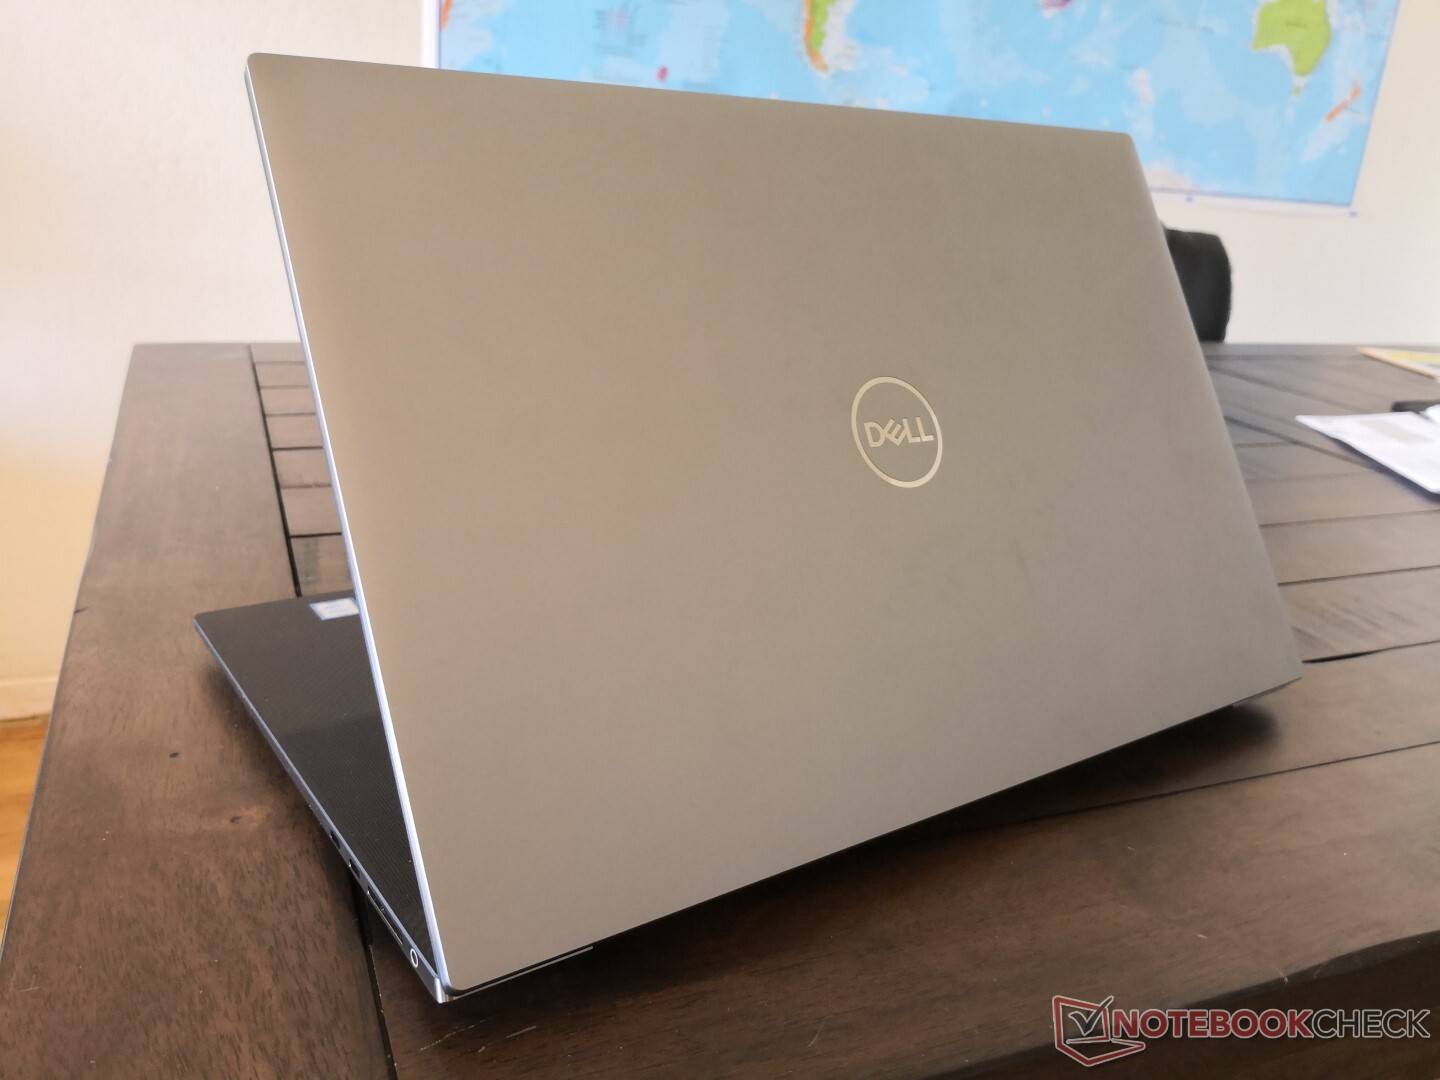
Dell Precision 5000 5750 P92F
- 09/07/2020 v7 (old)
Allen Ngo
Price comparison
