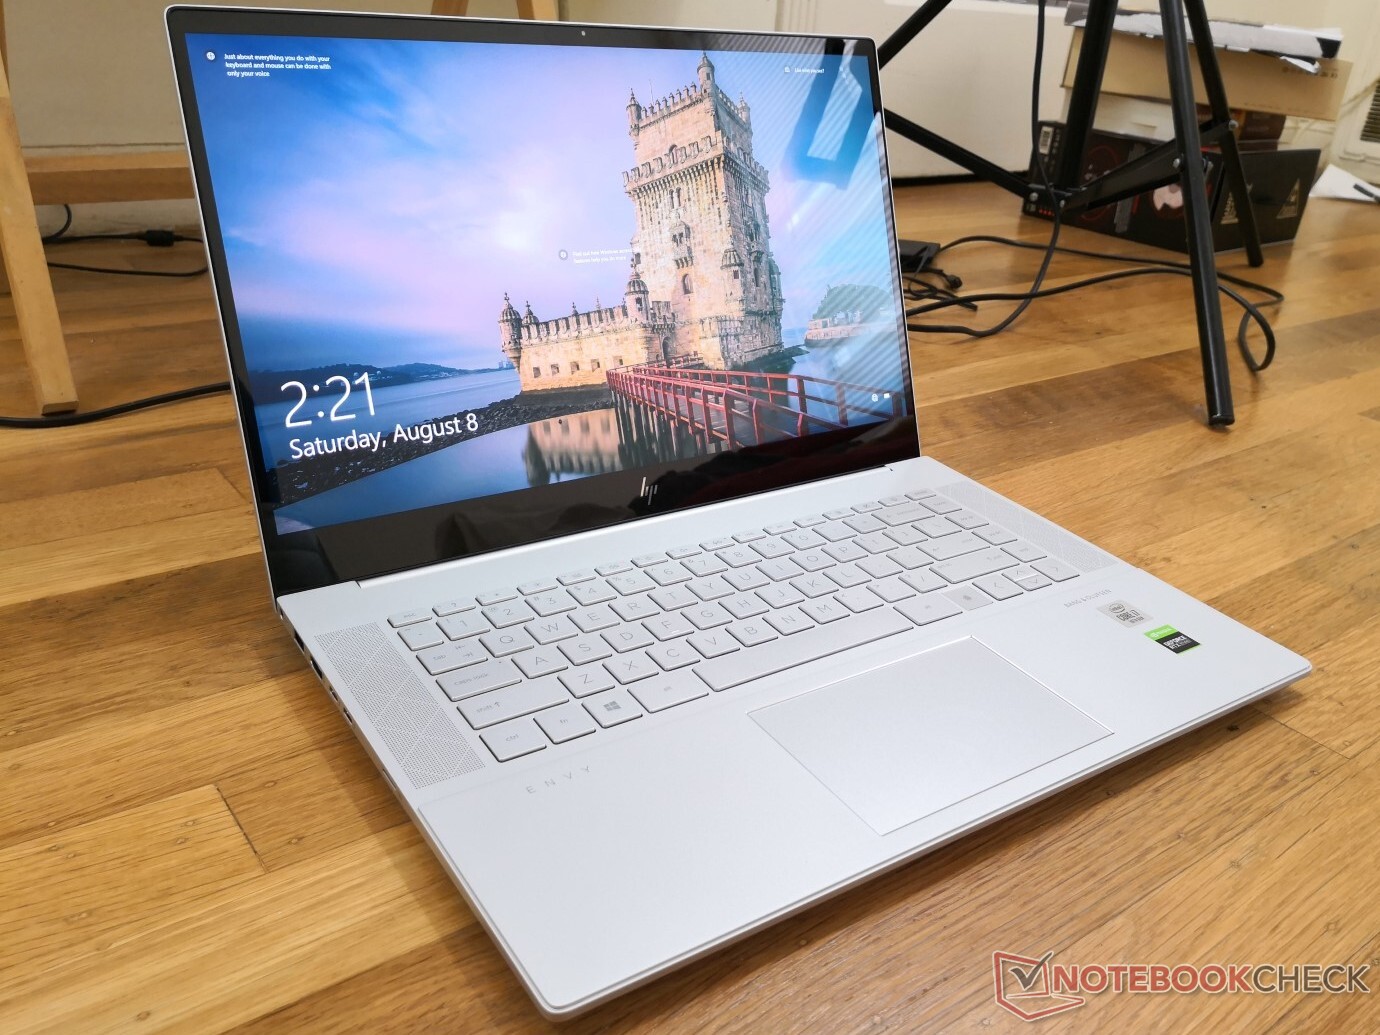
Esta é a resposta da HP ao Apple MacBook Pro: Breve análise do Envy 15 Creator Core i7 2020
Avaliação | Data | Modelo | Peso | Altura | Size | Resolução | Preço |
|---|---|---|---|---|---|---|---|
| 83 % v7 (old) | 08/2020 | HP Envy 15-ep0098nr i7-10750H, GeForce RTX 2060 Max-Q | 2 kg | 19 mm | 15.60" | 3840x2160 | |
| 80.4 % v7 (old) | 06/2020 | HP Envy x360 15-dr1679cl i7-10510U, UHD Graphics 620 | 2.1 kg | 17.2 mm | 15.60" | 1920x1080 | |
| 85 % v7 (old) | 01/2020 | HP Spectre X360 15-5ZV31AV i7-10510U, GeForce MX250 | 2.1 kg | 19.3 mm | 15.60" | 3840x2160 | |
| 90.1 % v7 (old) | 06/2020 | Dell XPS 15 9500 Core i7 4K UHD i7-10875H, GeForce GTX 1650 Ti Mobile | 2 kg | 18 mm | 15.60" | 3840x2400 | |
| 86 % v7 (old) | 12/2019 | Lenovo Yoga C940-15IRH i7-9750H, GeForce GTX 1650 Max-Q | 2 kg | 19.7 mm | 15.60" | 1920x1080 | |
| 89.7 % v7 (old) | 12/2019 | Apple MacBook Pro 16 2019 i9 5500M i9-9880H, Radeon Pro 5500M | 2 kg | 16.2 mm | 16.00" | 3072x1920 |
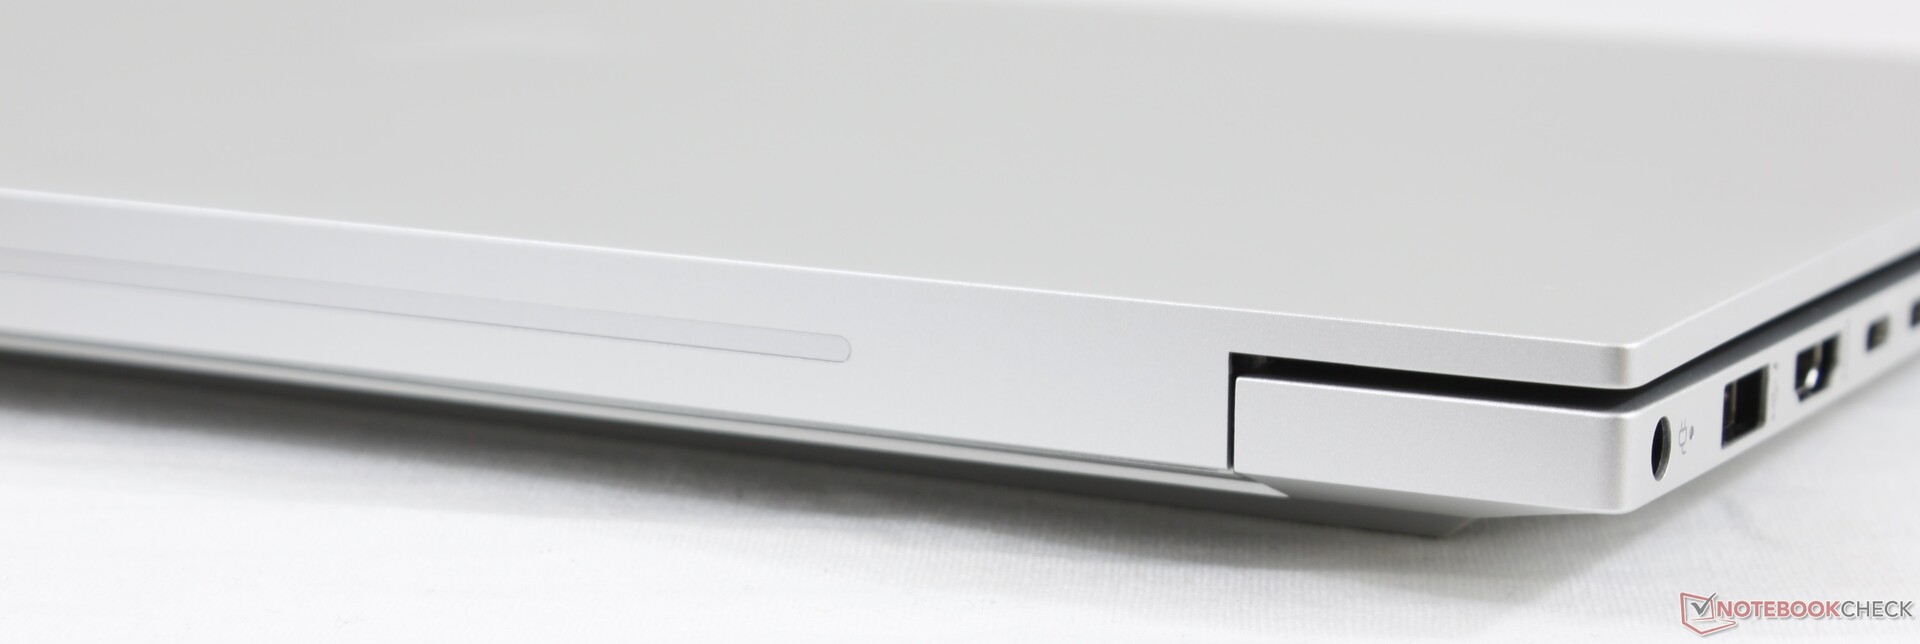
| SD Card Reader | |
| average JPG Copy Test (av. of 3 runs) | |
| Dell XPS 15 9500 Core i7 4K UHD (Toshiba Exceria Pro SDXC 64 GB UHS-II) | |
| HP Spectre X360 15-5ZV31AV (Toshiba Exceria Pro M501 UHS-II) | |
| HP Envy x360 15-dr1679cl (Toshiba Exceria Pro SDXC 64 GB UHS-II) | |
| HP Envy 15-ep0098nr (Toshiba Exceria Pro M501 UHS-II) | |
| maximum AS SSD Seq Read Test (1GB) | |
| Dell XPS 15 9500 Core i7 4K UHD (Toshiba Exceria Pro SDXC 64 GB UHS-II) | |
| HP Spectre X360 15-5ZV31AV (Toshiba Exceria Pro M501 UHS-II) | |
| HP Envy 15-ep0098nr (Toshiba Exceria Pro M501 UHS-II) | |
| HP Envy x360 15-dr1679cl (Toshiba Exceria Pro SDXC 64 GB UHS-II) | |

")
")
| |||||||||||||||||||||||||
iluminação: 91 %
iluminação com acumulador: 374.3 cd/m²
Contraste: ∞:1 (Preto: 0 cd/m²)
ΔE ColorChecker Calman: 5.47 | ∀{0.5-29.43 Ø4.72}
calibrated: 4.61
ΔE Greyscale Calman: 2.3 | ∀{0.09-98 Ø4.97}
100% sRGB (Argyll 1.6.3 3D)
87.8% AdobeRGB 1998 (Argyll 1.6.3 3D)
99.9% AdobeRGB 1998 (Argyll 3D)
100% sRGB (Argyll 3D)
88.5% Display P3 (Argyll 3D)
Gamma: 2.09
CCT: 6340 K
| HP Envy 15-ep0098nr Samsung SDC4145, AMOLED, 15.6", 3840x2160 | HP Envy x360 15-dr1679cl AU Optronics B156HW02, IPS, 15.6", 1920x1080 | HP Spectre X360 15-5ZV31AV AU Optronics AUO30EB, IPS, 15.6", 3840x2160 | Dell XPS 15 9500 Core i7 4K UHD Sharp LQ156R1, IPS, 15.6", 3840x2400 | Lenovo Yoga C940-15IRH LG Philips LP156WFC-SPU1, IPS, 15.6", 1920x1080 | Apple MacBook Pro 16 2019 i9 5500M APPA044, IPS, 16", 3072x1920 | |
|---|---|---|---|---|---|---|
| Display | -52% | -20% | 0% | -25% | ||
| Display P3 Coverage (%) | 88.5 | 39.28 -56% | 68.3 -23% | 89.7 1% | 61.5 -31% | |
| sRGB Coverage (%) | 100 | 58.8 -41% | 94.3 -6% | 100 0% | 92.7 -7% | |
| AdobeRGB 1998 Coverage (%) | 99.9 | 40.58 -59% | 68.4 -32% | 99.8 0% | 63.6 -36% | |
| Response Times | -2812% | -4206% | -3890% | -3599% | -3822% | |
| Response Time Grey 50% / Grey 80% * (ms) | 0.8 ? | 39.6 ? -4850% | 56.8 ? -7000% | 54 ? -6650% | 48.4 ? -5950% | 52.4 ? -6450% |
| Response Time Black / White * (ms) | 2.7 ? | 23.6 ? -774% | 40.8 ? -1411% | 33.2 ? -1130% | 36.4 ? -1248% | 34.9 ? -1193% |
| PWM Frequency (Hz) | 242.7 ? | 131700 | ||||
| Screen | -36% | -3% | 10% | -5% | 34% | |
| Brightness middle (cd/m²) | 374.3 | 261.2 -30% | 284.6 -24% | 557.9 49% | 484.8 30% | 519 39% |
| Brightness (cd/m²) | 379 | 248 -35% | 285 -25% | 541 43% | 463 22% | 477 26% |
| Brightness Distribution (%) | 91 | 92 1% | 85 -7% | 91 0% | 82 -10% | 86 -5% |
| Black Level * (cd/m²) | 0.38 | 0.25 | 0.39 | 0.26 | 0.39 | |
| Colorchecker dE 2000 * | 5.47 | 5.4 1% | 3.52 36% | 4.54 17% | 4.5 18% | 2.28 58% |
| Colorchecker dE 2000 max. * | 8.22 | 16.31 -98% | 5.56 32% | 7.92 4% | 7.55 8% | 6.54 20% |
| Colorchecker dE 2000 calibrated * | 4.61 | 3.81 17% | 3 35% | 3.82 17% | 1.19 74% | 0.86 81% |
| Greyscale dE 2000 * | 2.3 | 4.1 -78% | 3.2 -39% | 3.2 -39% | 5.7 -148% | 0.9 61% |
| Gamma | 2.09 105% | 2.53 87% | 2.28 96% | 1.99 111% | 2.45 90% | 2145 0% |
| CCT | 6340 103% | 6611 98% | 7070 92% | 6451 101% | 6101 107% | 6572 99% |
| Color Space (Percent of AdobeRGB 1998) (%) | 87.8 | 37.4 -57% | 61.1 -30% | 89.5 2% | 58.7 -33% | 78 -11% |
| Color Space (Percent of sRGB) (%) | 100 | 58.7 -41% | 93.8 -6% | 100 0% | 92.8 -7% | |
| Contrast (:1) | 687 | 1138 | 1431 | 1865 | 1331 | |
| Média Total (Programa/Configurações) | -967% /
-436% | -1410% /
-607% | -1293% /
-549% | -1210% /
-523% | -1894% /
-737% |
* ... menor é melhor
Exibir tempos de resposta
| ↔ Tempo de resposta preto para branco | ||
|---|---|---|
| 2.7 ms ... ascensão ↗ e queda ↘ combinadas | ↗ 1.3 ms ascensão | 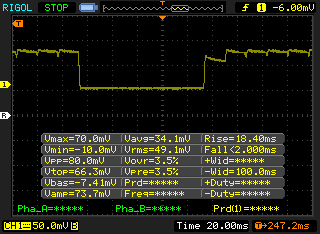 |
| ↘ 1.4 ms queda | ||
| A tela mostra taxas de resposta muito rápidas em nossos testes e deve ser muito adequada para jogos em ritmo acelerado. Em comparação, todos os dispositivos testados variam de 0.1 (mínimo) a 240 (máximo) ms. » 14 % de todos os dispositivos são melhores. Isso significa que o tempo de resposta medido é melhor que a média de todos os dispositivos testados (19.8 ms). | ||
| ↔ Tempo de resposta 50% cinza a 80% cinza | ||
| 0.8 ms ... ascensão ↗ e queda ↘ combinadas | ↗ 0.4 ms ascensão | 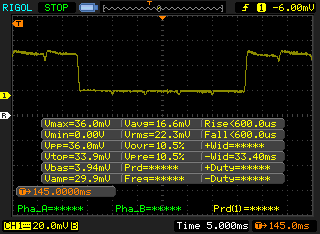 |
| ↘ 0.4 ms queda | ||
| A tela mostra taxas de resposta muito rápidas em nossos testes e deve ser muito adequada para jogos em ritmo acelerado. Em comparação, todos os dispositivos testados variam de 0.165 (mínimo) a 636 (máximo) ms. » 3 % de todos os dispositivos são melhores. Isso significa que o tempo de resposta medido é melhor que a média de todos os dispositivos testados (31 ms). | ||
Cintilação da tela / PWM (modulação por largura de pulso)
| Tela tremeluzindo/PWM detectado | 242.7 Hz | ≤ 44 % configuração de brilho | 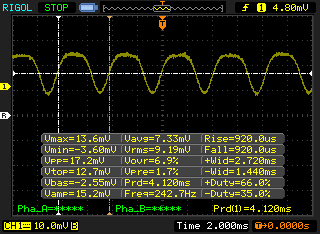 |
A luz de fundo da tela pisca em 242.7 Hz (pior caso, por exemplo, utilizando PWM) Cintilação detectada em uma configuração de brilho de 44 % e abaixo. Não deve haver cintilação ou PWM acima desta configuração de brilho. A frequência de 242.7 Hz é relativamente baixa, portanto, usuários sensíveis provavelmente notarão cintilação e sentirão fadiga ocular na configuração de brilho indicada e abaixo. [pwm_comparison] Em comparação: 52 % de todos os dispositivos testados não usam PWM para escurecer a tela. Se PWM foi detectado, uma média de 7753 (mínimo: 5 - máximo: 343500) Hz foi medida. | |||
Cinebench R15: CPU Multi 64Bit | CPU Single 64Bit
Blender: v2.79 BMW27 CPU
7-Zip 18.03: 7z b 4 -mmt1 | 7z b 4
Geekbench 5.5: Single-Core | Multi-Core
HWBOT x265 Benchmark v2.2: 4k Preset
LibreOffice : 20 Documents To PDF
R Benchmark 2.5: Overall mean
| Cinebench R20 / CPU (Multi Core) | |
| Eurocom Sky X4C i9-9900KS | |
| Asus TUF Gaming A15 FA506IV-HN172 | |
| MSI GS66 Stealth 10SFS | |
| MSI GE65 Raider 9SF-049US | |
| Dell XPS 15 9500 Core i7 4K UHD | |
| Acer Nitro 5 AN515-44-R5FT | |
| HP Envy 15-ep0098nr | |
| Média Intel Core i7-10750H (1749 - 3325, n=43) | |
| Lenovo Yoga C940-15IRH | |
| Schenker Work 15 | |
| Cinebench R20 / CPU (Single Core) | |
| Eurocom Sky X4C i9-9900KS | |
| Dell XPS 15 9500 Core i7 4K UHD | |
| Asus TUF Gaming A15 FA506IV-HN172 | |
| MSI GS66 Stealth 10SFS | |
| MSI GE65 Raider 9SF-049US | |
| Média Intel Core i7-10750H (431 - 504, n=43) | |
| Lenovo Yoga C940-15IRH | |
| HP Envy 15-ep0098nr | |
| Acer Nitro 5 AN515-44-R5FT | |
| Schenker Work 15 | |
| Cinebench R15 / CPU Multi 64Bit | |
| Eurocom Sky X4C i9-9900KS | |
| Asus TUF Gaming A15 FA506IV-HN172 | |
| MSI GS66 Stealth 10SFS | |
| MSI GE65 Raider 9SF-049US | |
| Acer Nitro 5 AN515-44-R5FT | |
| Dell XPS 15 9500 Core i7 4K UHD | |
| HP Envy 15-ep0098nr | |
| Média Intel Core i7-10750H (804 - 1418, n=50) | |
| Lenovo Yoga C940-15IRH | |
| Schenker Work 15 | |
| Cinebench R15 / CPU Single 64Bit | |
| Eurocom Sky X4C i9-9900KS | |
| Dell XPS 15 9500 Core i7 4K UHD | |
| MSI GS66 Stealth 10SFS | |
| MSI GE65 Raider 9SF-049US | |
| HP Envy 15-ep0098nr | |
| Média Intel Core i7-10750H (184 - 213, n=45) | |
| Asus TUF Gaming A15 FA506IV-HN172 | |
| Lenovo Yoga C940-15IRH | |
| Acer Nitro 5 AN515-44-R5FT | |
| Schenker Work 15 | |
| Blender / v2.79 BMW27 CPU | |
| Schenker Work 15 | |
| Schenker Work 15 | |
| Média Intel Core i7-10750H (322 - 587, n=43) | |
| Dell XPS 15 9500 Core i7 4K UHD | |
| HP Envy 15-ep0098nr | |
| Acer Nitro 5 AN515-44-R5FT | |
| MSI GS66 Stealth 10SFS | |
| Asus TUF Gaming A15 FA506IV-HN172 | |
| Eurocom Sky X4C i9-9900KS | |
| 7-Zip 18.03 / 7z b 4 -mmt1 | |
| Eurocom Sky X4C i9-9900KS | |
| Dell XPS 15 9500 Core i7 4K UHD | |
| MSI GS66 Stealth 10SFS | |
| Média Intel Core i7-10750H (4504 - 5470, n=43) | |
| Asus TUF Gaming A15 FA506IV-HN172 | |
| Schenker Work 15 | |
| Schenker Work 15 | |
| HP Envy 15-ep0098nr | |
| Acer Nitro 5 AN515-44-R5FT | |
| 7-Zip 18.03 / 7z b 4 | |
| Eurocom Sky X4C i9-9900KS | |
| Asus TUF Gaming A15 FA506IV-HN172 | |
| MSI GS66 Stealth 10SFS | |
| Acer Nitro 5 AN515-44-R5FT | |
| Dell XPS 15 9500 Core i7 4K UHD | |
| Média Intel Core i7-10750H (26040 - 37345, n=43) | |
| HP Envy 15-ep0098nr | |
| Schenker Work 15 | |
| Schenker Work 15 | |
| Geekbench 5.5 / Single-Core | |
| Eurocom Sky X4C i9-9900KS | |
| Dell XPS 15 9500 Core i7 4K UHD | |
| MSI GS66 Stealth 10SFS | |
| HP Envy 15-ep0098nr | |
| Média Intel Core i7-10750H (1114 - 1333, n=43) | |
| Asus TUF Gaming A15 FA506IV-HN172 | |
| Acer Nitro 5 AN515-44-R5FT | |
| Geekbench 5.5 / Multi-Core | |
| Eurocom Sky X4C i9-9900KS | |
| Dell XPS 15 9500 Core i7 4K UHD | |
| MSI GS66 Stealth 10SFS | |
| HP Envy 15-ep0098nr | |
| Média Intel Core i7-10750H (4443 - 6674, n=43) | |
| Asus TUF Gaming A15 FA506IV-HN172 | |
| Acer Nitro 5 AN515-44-R5FT | |
| HWBOT x265 Benchmark v2.2 / 4k Preset | |
| Eurocom Sky X4C i9-9900KS | |
| MSI GS66 Stealth 10SFS | |
| Asus TUF Gaming A15 FA506IV-HN172 | |
| HP Envy 15-ep0098nr | |
| Dell XPS 15 9500 Core i7 4K UHD | |
| Média Intel Core i7-10750H (5.54 - 11.6, n=43) | |
| Acer Nitro 5 AN515-44-R5FT | |
| Schenker Work 15 | |
| Schenker Work 15 | |
| LibreOffice / 20 Documents To PDF | |
| Acer Nitro 5 AN515-44-R5FT | |
| Média Intel Core i7-10750H (43.1 - 99.2, n=43) | |
| Dell XPS 15 9500 Core i7 4K UHD | |
| MSI GS66 Stealth 10SFS | |
| HP Envy 15-ep0098nr | |
| Asus TUF Gaming A15 FA506IV-HN172 | |
| R Benchmark 2.5 / Overall mean | |
| Acer Nitro 5 AN515-44-R5FT | |
| Média Intel Core i7-10750H (0.578 - 0.708, n=42) | |
| HP Envy 15-ep0098nr | |
| Asus TUF Gaming A15 FA506IV-HN172 | |
| MSI GS66 Stealth 10SFS | |
| Dell XPS 15 9500 Core i7 4K UHD | |
* ... menor é melhor
| PCMark 8 Home Score Accelerated v2 | 3463 pontos | |
| PCMark 8 Work Score Accelerated v2 | 4448 pontos | |
| PCMark 10 Score | 5553 pontos | |
Ajuda | ||
| DPC Latencies / LatencyMon - interrupt to process latency (max), Web, Youtube, Prime95 | |
| Dell XPS 15 9500 Core i7 4K UHD | |
| HP Envy 15-ep0098nr | |
| HP Envy x360 15-dr1679cl | |
| MSI GS66 Stealth 10SFS | |
| MSI GS66 Stealth 10SE-045 | |
| Razer Blade 15 RZ09-0328 | |
| Asus TUF Gaming A15 FA506IV-HN172 | |
* ... menor é melhor
| HP Envy 15-ep0098nr Intel Optane Memory H10 with Solid State Storage 32GB + 512GB HBRPEKNX0202A(L/H) | HP Envy x360 15-dr1679cl Intel Optane Memory H10 with Solid State Storage 32GB + 512GB HBRPEKNX0202A(L/H) | HP Spectre X360 15-5ZV31AV Intel SSD 660p 2TB SSDPEKNW020T8 | Dell XPS 15 9500 Core i7 4K UHD SK Hynix PC611 512GB | Apple MacBook Pro 16 2019 i9 5500M Apple SSD AP1024 7171 | |
|---|---|---|---|---|---|
| AS SSD | -13% | 32% | 49% | 80% | |
| Seq Read (MB/s) | 1005 | 931 -7% | 1220 21% | 2072 106% | 2531 152% |
| Seq Write (MB/s) | 436.8 | 331.5 -24% | 1152 164% | 1486 240% | 2289 424% |
| 4K Read (MB/s) | 51.5 | 72.8 41% | 52.3 2% | 47.41 -8% | 15.85 -69% |
| 4K Write (MB/s) | 88 | 119 35% | 146.6 67% | 117.6 34% | 39.88 -55% |
| 4K-64 Read (MB/s) | 517 | 389.7 -25% | 652 26% | 967 87% | 1267 145% |
| 4K-64 Write (MB/s) | 839 | 573 -32% | 847 1% | 715 -15% | 1749 108% |
| Access Time Read * (ms) | 0.088 | 0.07 20% | 0.077 12% | 0.057 35% | 0.122 -39% |
| Access Time Write * (ms) | 0.151 | 0.138 9% | 0.106 30% | 0.096 36% | 0.095 37% |
| Score Read (Points) | 669 | 556 -17% | 826 23% | 1222 83% | 1536 130% |
| Score Write (Points) | 970 | 725 -25% | 1109 14% | 981 1% | 2018 108% |
| Score Total (Points) | 1972 | 1565 -21% | 2371 20% | 2809 42% | 4317 119% |
| Copy ISO MB/s (MB/s) | 1173 | 593 -49% | 2070 76% | 1999 70% | 1995 70% |
| Copy Program MB/s (MB/s) | 769 | 495.5 -36% | 571 -26% | 627 -18% | 584 -24% |
| Copy Game MB/s (MB/s) | 1045 | 566 -46% | 1219 17% | 1001 -4% | 1135 9% |
| CrystalDiskMark 5.2 / 6 | 4% | 26% | 51% | 48% | |
| Write 4K (MB/s) | 100.2 | 125.6 25% | 151.5 51% | 123.3 23% | 55.5 -45% |
| Read 4K (MB/s) | 112.8 | 145.8 29% | 59.3 -47% | 41.85 -63% | 16.21 -86% |
| Write Seq (MB/s) | 537 | 509 -5% | 1424 165% | 2054 282% | 1959 265% |
| Read Seq (MB/s) | 1270 | 1536 21% | 1609 27% | 1617 27% | 1763 39% |
| Write 4K Q32T1 (MB/s) | 480.6 | 362.4 -25% | 393.6 -18% | 413 -14% | 398.5 -17% |
| Read 4K Q32T1 (MB/s) | 364.9 | 307.3 -16% | 369.4 1% | 377.5 3% | 648 78% |
| Write Seq Q32T1 (MB/s) | 1224 | 1320 8% | 1946 59% | 2705 121% | 2727 123% |
| Read Seq Q32T1 (MB/s) | 2635 | 2489 -6% | 1934 -27% | 3442 31% | 3242 23% |
| Média Total (Programa/Configurações) | -5% /
-7% | 29% /
30% | 50% /
50% | 64% /
68% |
* ... menor é melhor

Disk Throttling: DiskSpd Read Loop, Queue Depth 8
| 3DMark 11 | |
| 1280x720 Performance GPU | |
| Gigabyte Aero 15 OLED XB-8DE51B0SP | |
| MSI RTX 2060 Gaming Z 6G | |
| Dell G5 15 SE 5505 P89F | |
| Eluktronics RP-15 | |
| HP Envy 15-ep0098nr | |
| Média NVIDIA GeForce RTX 2060 Max-Q (18863 - 21105, n=4) | |
| MSI P65 8RF-451 - Creator | |
| Microsoft Surface Book 3 15 | |
| Apple MacBook Pro 16 2019 i9 5500M | |
| Microsoft Surface Book 2 15 | |
| Dell XPS 15 9500 Core i7 4K UHD | |
| 1280x720 Performance Combined | |
| Gigabyte Aero 15 OLED XB-8DE51B0SP | |
| Eluktronics RP-15 | |
| MSI RTX 2060 Gaming Z 6G | |
| Média NVIDIA GeForce RTX 2060 Max-Q (12071 - 15054, n=4) | |
| Dell G5 15 SE 5505 P89F | |
| HP Envy 15-ep0098nr | |
| Dell XPS 15 9500 Core i7 4K UHD | |
| Apple MacBook Pro 16 2019 i9 5500M | |
| Microsoft Surface Book 3 15 | |
| MSI P65 8RF-451 - Creator | |
| Microsoft Surface Book 2 15 | |
| 3DMark 11 Performance | 18109 pontos | |
| 3DMark Cloud Gate Standard Score | 25407 pontos | |
| 3DMark Fire Strike Score | 14259 pontos | |
| 3DMark Time Spy Score | 6052 pontos | |
Ajuda | ||
| The Witcher 3 - 1920x1080 Ultra Graphics & Postprocessing (HBAO+) | |
| Eurocom Sky X4C i9-9900KS | |
| Gigabyte Aero 15 OLED XB-8DE51B0SP | |
| MSI GE65 Raider 9SF-049US | |
| MSI RTX 2060 Gaming Z 6G | |
| MSI GS66 Stealth 10SFS | |
| Dell G5 15 SE 5505 P89F | |
| HP Envy 15-ep0098nr | |
| Eluktronics RP-15 | |
| Razer Blade 15 RZ09-0328 | |
| Asus TUF Gaming A15 FA506IV-HN172 | |
| Média NVIDIA GeForce RTX 2060 Max-Q (51.2 - 62.9, n=4) | |
| MSI P65 8RF-451 - Creator | |
| Microsoft Surface Book 3 15 | |
| Apple MacBook Pro 16 2019 i9 5500M | |
| Acer Nitro 5 AN515-44-R5FT | |
| Dell XPS 15 9500 Core i7 4K UHD | |
| Lenovo Yoga C940-15IRH | |
| Apple MacBook Pro 15 2019 i9 Vega 20 | |
| HP Spectre X360 15-5ZV31AV | |
| baixo | média | alto | ultra | QHD | 4K | |
|---|---|---|---|---|---|---|
| The Witcher 3 (2015) | 310.8 | 209.6 | 119 | 62.9 | 45.5 | |
| Dota 2 Reborn (2015) | 141 | 129 | 120 | 114 | 83.2 | |
| Final Fantasy XV Benchmark (2018) | 139 | 79 | 61.3 | 43.6 | 24.9 | |
| X-Plane 11.11 (2018) | 103 | 90.7 | 77.4 | 59.3 |
| HP Envy 15-ep0098nr GeForce RTX 2060 Max-Q, i7-10750H, Intel Optane Memory H10 with Solid State Storage 32GB + 512GB HBRPEKNX0202A(L/H) | HP Envy x360 15-dr1679cl UHD Graphics 620, i7-10510U, Intel Optane Memory H10 with Solid State Storage 32GB + 512GB HBRPEKNX0202A(L/H) | HP Spectre X360 15-5ZV31AV GeForce MX250, i7-10510U, Intel SSD 660p 2TB SSDPEKNW020T8 | Dell XPS 15 9500 Core i7 4K UHD GeForce GTX 1650 Ti Mobile, i7-10875H, SK Hynix PC611 512GB | Apple MacBook Pro 16 2019 i9 5500M Radeon Pro 5500M, i9-9880H, Apple SSD AP1024 7171 | |
|---|---|---|---|---|---|
| Noise | 11% | 14% | 11% | 8% | |
| desligado / ambiente * (dB) | 26.4 | 28 -6% | 30.1 -14% | 28.4 -8% | 29.8 -13% |
| Idle Minimum * (dB) | 32.2 | 28 13% | 30.1 7% | 28.4 12% | 29.9 7% |
| Idle Average * (dB) | 32.2 | 30.2 6% | 30.1 7% | 28.4 12% | 29.9 7% |
| Idle Maximum * (dB) | 32.2 | 31.5 2% | 30.1 7% | 28.4 12% | 29.9 7% |
| Load Average * (dB) | 48.3 | 35.7 26% | 30.1 38% | 46 5% | 43 11% |
| Witcher 3 ultra * (dB) | 53.7 | 39.7 26% | 42 22% | 45.4 15% | |
| Load Maximum * (dB) | 58.8 | 43.1 27% | 42 29% | 47.1 20% | 46.1 22% |
* ... menor é melhor
Barulho
| Ocioso |
| 32.2 / 32.2 / 32.2 dB |
| Carga |
| 48.3 / 58.8 dB |
 | ||
30 dB silencioso 40 dB(A) audível 50 dB(A) ruidosamente alto |
||
min: | ||
(-) A temperatura máxima no lado superior é 47.6 °C / 118 F, em comparação com a média de 36.8 °C / 98 F , variando de 21 a 71 °C para a classe Multimedia.
(-) A parte inferior aquece até um máximo de 52 °C / 126 F, em comparação com a média de 39.1 °C / 102 F
(+) Em uso inativo, a temperatura média para o lado superior é 26.1 °C / 79 F, em comparação com a média do dispositivo de 31.3 °C / ### class_avg_f### F.
(±) Jogando The Witcher 3, a temperatura média para o lado superior é 32.4 °C / 90 F, em comparação com a média do dispositivo de 31.3 °C / ## #class_avg_f### F.
(+) Os apoios para as mãos e o touchpad são mais frios que a temperatura da pele, com um máximo de 31.8 °C / 89.2 F e, portanto, são frios ao toque.
(-) A temperatura média da área do apoio para as mãos de dispositivos semelhantes foi 28.7 °C / 83.7 F (-3.1 °C / -5.5 F).
HP Envy 15-ep0098nr análise de áudio
(±) | o volume do alto-falante é médio, mas bom (###valor### dB)
Graves 100 - 315Hz
(-) | quase nenhum baixo - em média 15.8% menor que a mediana
(±) | a linearidade dos graves é média (14.9% delta para a frequência anterior)
Médios 400 - 2.000 Hz
(+) | médios equilibrados - apenas 3.7% longe da mediana
(+) | médios são lineares (5.9% delta para frequência anterior)
Altos 2 - 16 kHz
(+) | agudos equilibrados - apenas 1.8% longe da mediana
(+) | os máximos são lineares (4% delta da frequência anterior)
Geral 100 - 16.000 Hz
(±) | a linearidade do som geral é média (16.2% diferença em relação à mediana)
Comparado com a mesma classe
» 41% de todos os dispositivos testados nesta classe foram melhores, 7% semelhantes, 51% piores
» O melhor teve um delta de 5%, a média foi 17%, o pior foi 45%
Comparado com todos os dispositivos testados
» 26% de todos os dispositivos testados foram melhores, 6% semelhantes, 68% piores
» O melhor teve um delta de 4%, a média foi 23%, o pior foi 134%
Apple MacBook 12 (Early 2016) 1.1 GHz análise de áudio
(+) | os alto-falantes podem tocar relativamente alto (###valor### dB)
Graves 100 - 315Hz
(±) | graves reduzidos - em média 11.3% menor que a mediana
(±) | a linearidade dos graves é média (14.2% delta para a frequência anterior)
Médios 400 - 2.000 Hz
(+) | médios equilibrados - apenas 2.4% longe da mediana
(+) | médios são lineares (5.5% delta para frequência anterior)
Altos 2 - 16 kHz
(+) | agudos equilibrados - apenas 2% longe da mediana
(+) | os máximos são lineares (4.5% delta da frequência anterior)
Geral 100 - 16.000 Hz
(+) | o som geral é linear (10.2% diferença em relação à mediana)
Comparado com a mesma classe
» 7% de todos os dispositivos testados nesta classe foram melhores, 2% semelhantes, 91% piores
» O melhor teve um delta de 5%, a média foi 18%, o pior foi 53%
Comparado com todos os dispositivos testados
» 5% de todos os dispositivos testados foram melhores, 1% semelhantes, 94% piores
» O melhor teve um delta de 4%, a média foi 23%, o pior foi 134%
| desligado | |
| Ocioso | |
| Carga |
|
Key:
min: | |
| HP Envy 15-ep0098nr i7-10750H, GeForce RTX 2060 Max-Q, Intel Optane Memory H10 with Solid State Storage 32GB + 512GB HBRPEKNX0202A(L/H), AMOLED, 3840x2160, 15.6" | HP Envy x360 15-dr1679cl i7-10510U, UHD Graphics 620, Intel Optane Memory H10 with Solid State Storage 32GB + 512GB HBRPEKNX0202A(L/H), IPS, 1920x1080, 15.6" | HP Spectre X360 15-5ZV31AV i7-10510U, GeForce MX250, Intel SSD 660p 2TB SSDPEKNW020T8, IPS, 3840x2160, 15.6" | Dell XPS 15 9500 Core i7 4K UHD i7-10875H, GeForce GTX 1650 Ti Mobile, SK Hynix PC611 512GB, IPS, 3840x2400, 15.6" | Apple MacBook Pro 16 2019 i9 5500M i9-9880H, Radeon Pro 5500M, Apple SSD AP1024 7171, IPS, 3072x1920, 16" | Lenovo Yoga C940-15IRH i7-9750H, GeForce GTX 1650 Max-Q, Intel Optane Memory H10 with Solid State Storage 32GB + 512GB HBRPEKNX0202A(L/H), IPS, 1920x1080, 15.6" | |
|---|---|---|---|---|---|---|
| Power Consumption | 58% | 48% | 15% | 28% | 20% | |
| Idle Minimum * (Watt) | 9.2 | 4.3 53% | 5.2 43% | 5.7 38% | 3.7 60% | 5.2 43% |
| Idle Average * (Watt) | 14.5 | 7.2 50% | 8.5 41% | 13.5 7% | 12.1 17% | 10.7 26% |
| Idle Maximum * (Watt) | 18 | 7.5 58% | 8.7 52% | 19.6 -9% | 17 6% | 24.3 -35% |
| Load Average * (Watt) | 110.9 | 40.4 64% | 65.6 41% | 114.1 -3% | 91.5 17% | 84.4 24% |
| Witcher 3 ultra * (Watt) | 125.5 | 56.5 55% | 93 26% | 103 18% | 83.9 33% | |
| Load Maximum * (Watt) | 194.6 | 65.7 66% | 92.4 53% | 135.2 31% | 102.3 47% | 142.8 27% |
* ... menor é melhor
| HP Envy 15-ep0098nr i7-10750H, GeForce RTX 2060 Max-Q, 83 Wh | HP Envy x360 15-dr1679cl i7-10510U, UHD Graphics 620, 55.67 Wh | HP Spectre X360 15-5ZV31AV i7-10510U, GeForce MX250, 84 Wh | Dell XPS 15 9500 Core i7 4K UHD i7-10875H, GeForce GTX 1650 Ti Mobile, 86 Wh | Apple MacBook Pro 15 2019 i9 Vega 20 i9-9980HK, Radeon Pro Vega 20, 83 Wh | Lenovo Yoga C940-15IRH i7-9750H, GeForce GTX 1650 Max-Q, 69 Wh | |
|---|---|---|---|---|---|---|
| Duração da bateria | 55% | 71% | 43% | 92% | 15% | |
| Reader / Idle (h) | 15 | 25.4 69% | 22.6 51% | 23 53% | 18.2 21% | |
| WiFi v1.3 (h) | 6 | 9.2 53% | 10.8 80% | 9.1 52% | 11.5 92% | 9.7 62% |
| Load (h) | 1.6 | 2.3 44% | 2.9 81% | 2 25% | 1 -37% |
Pro
Contra
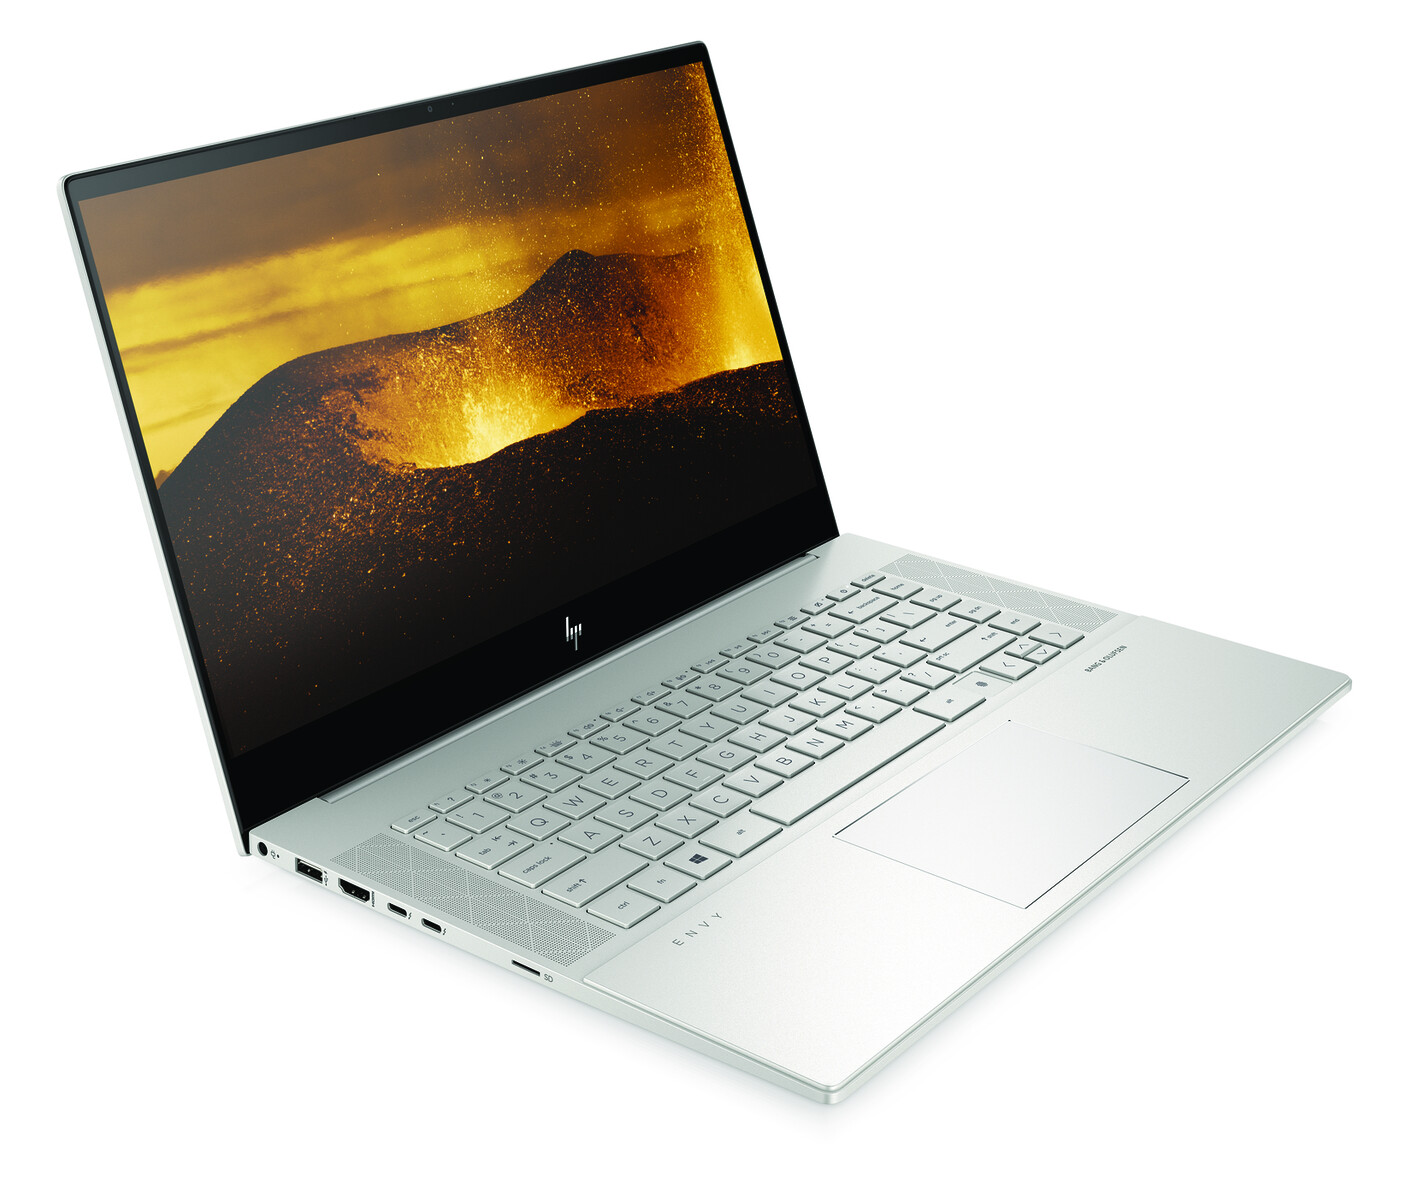
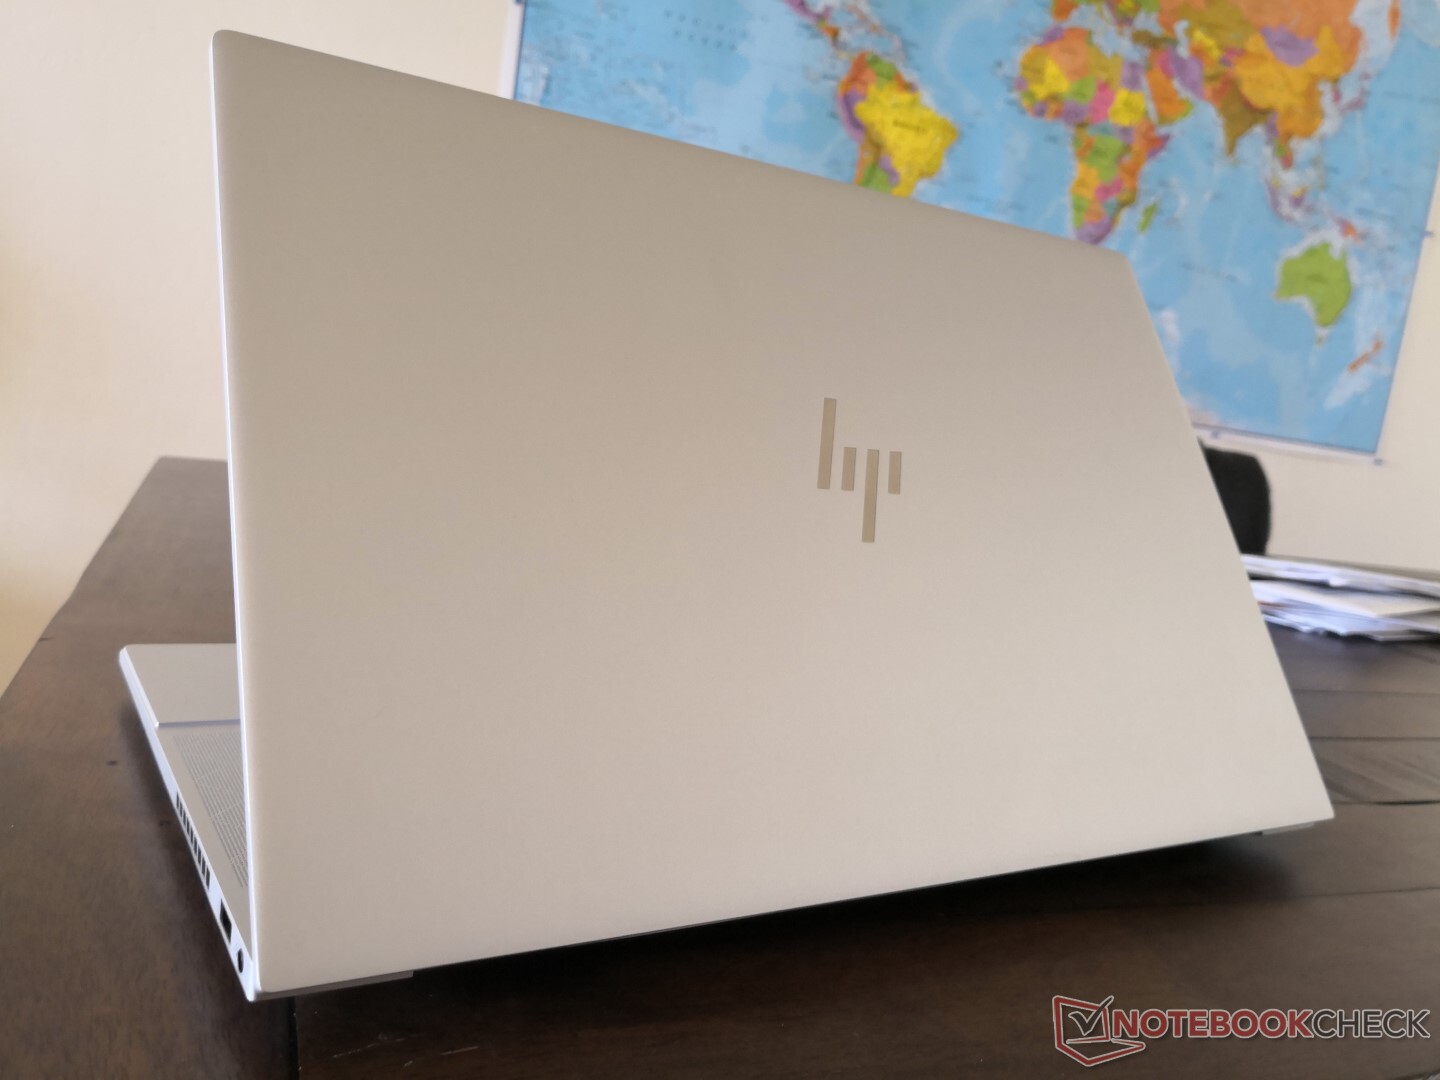
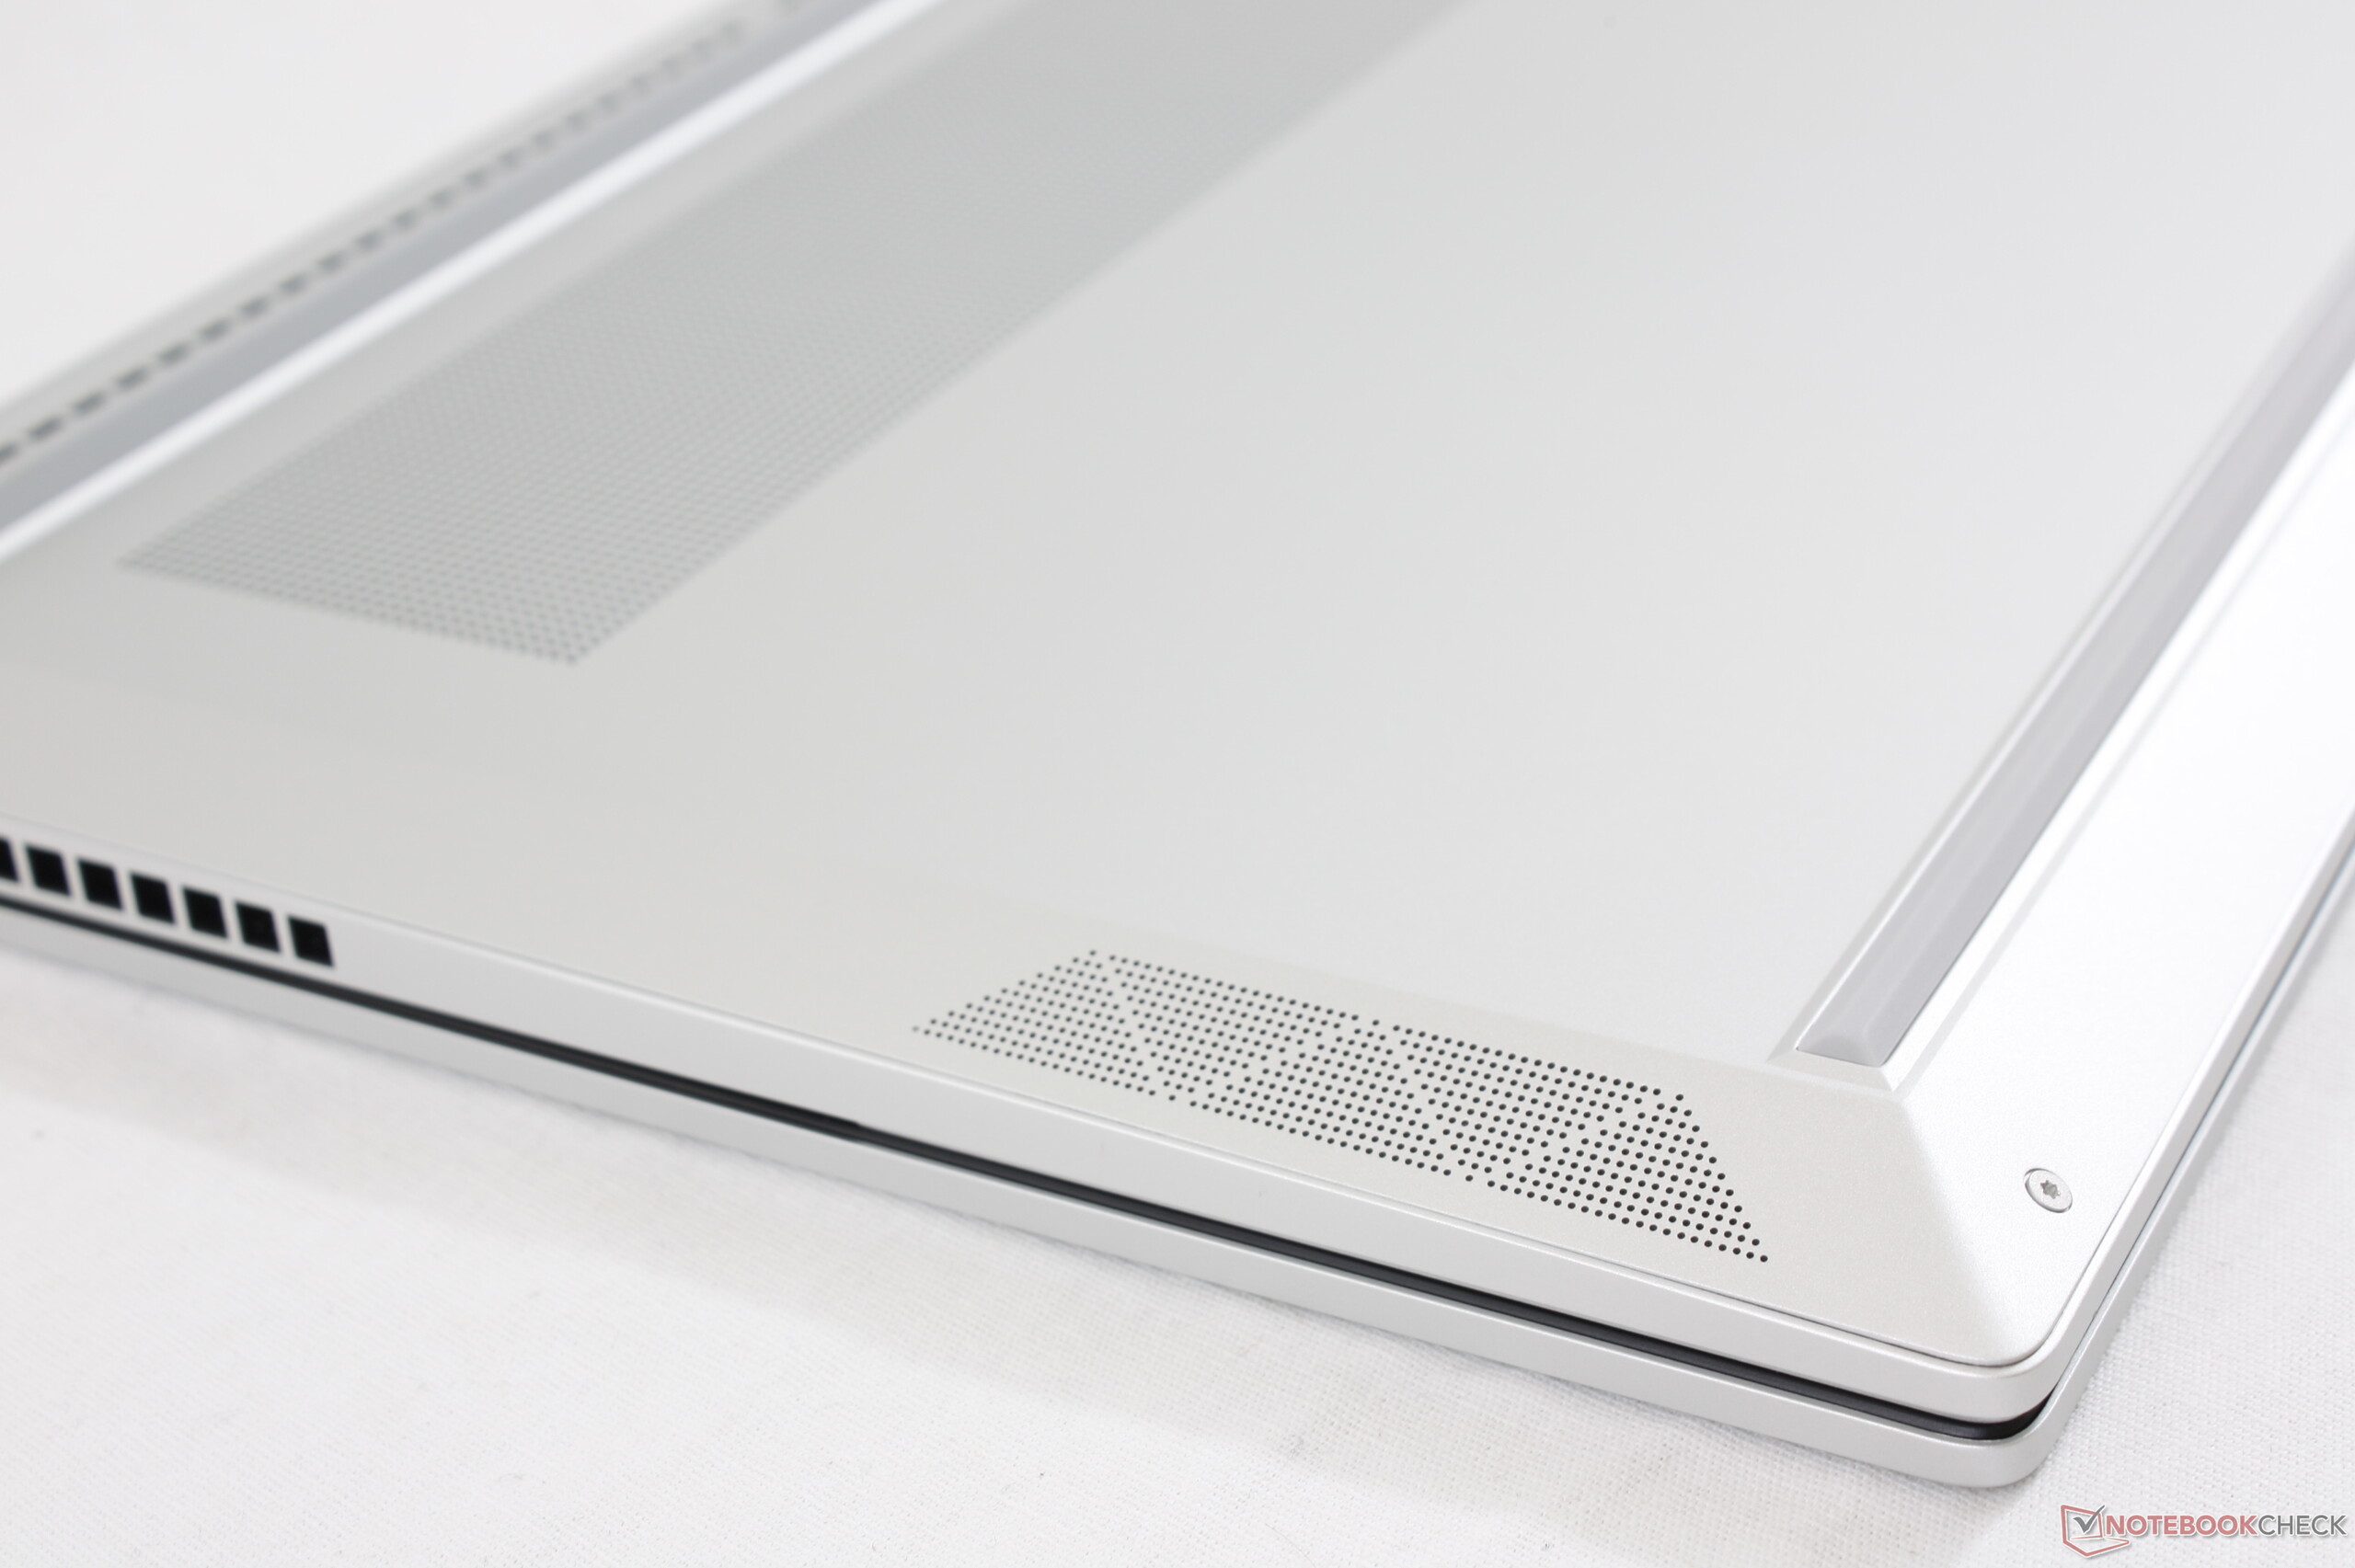
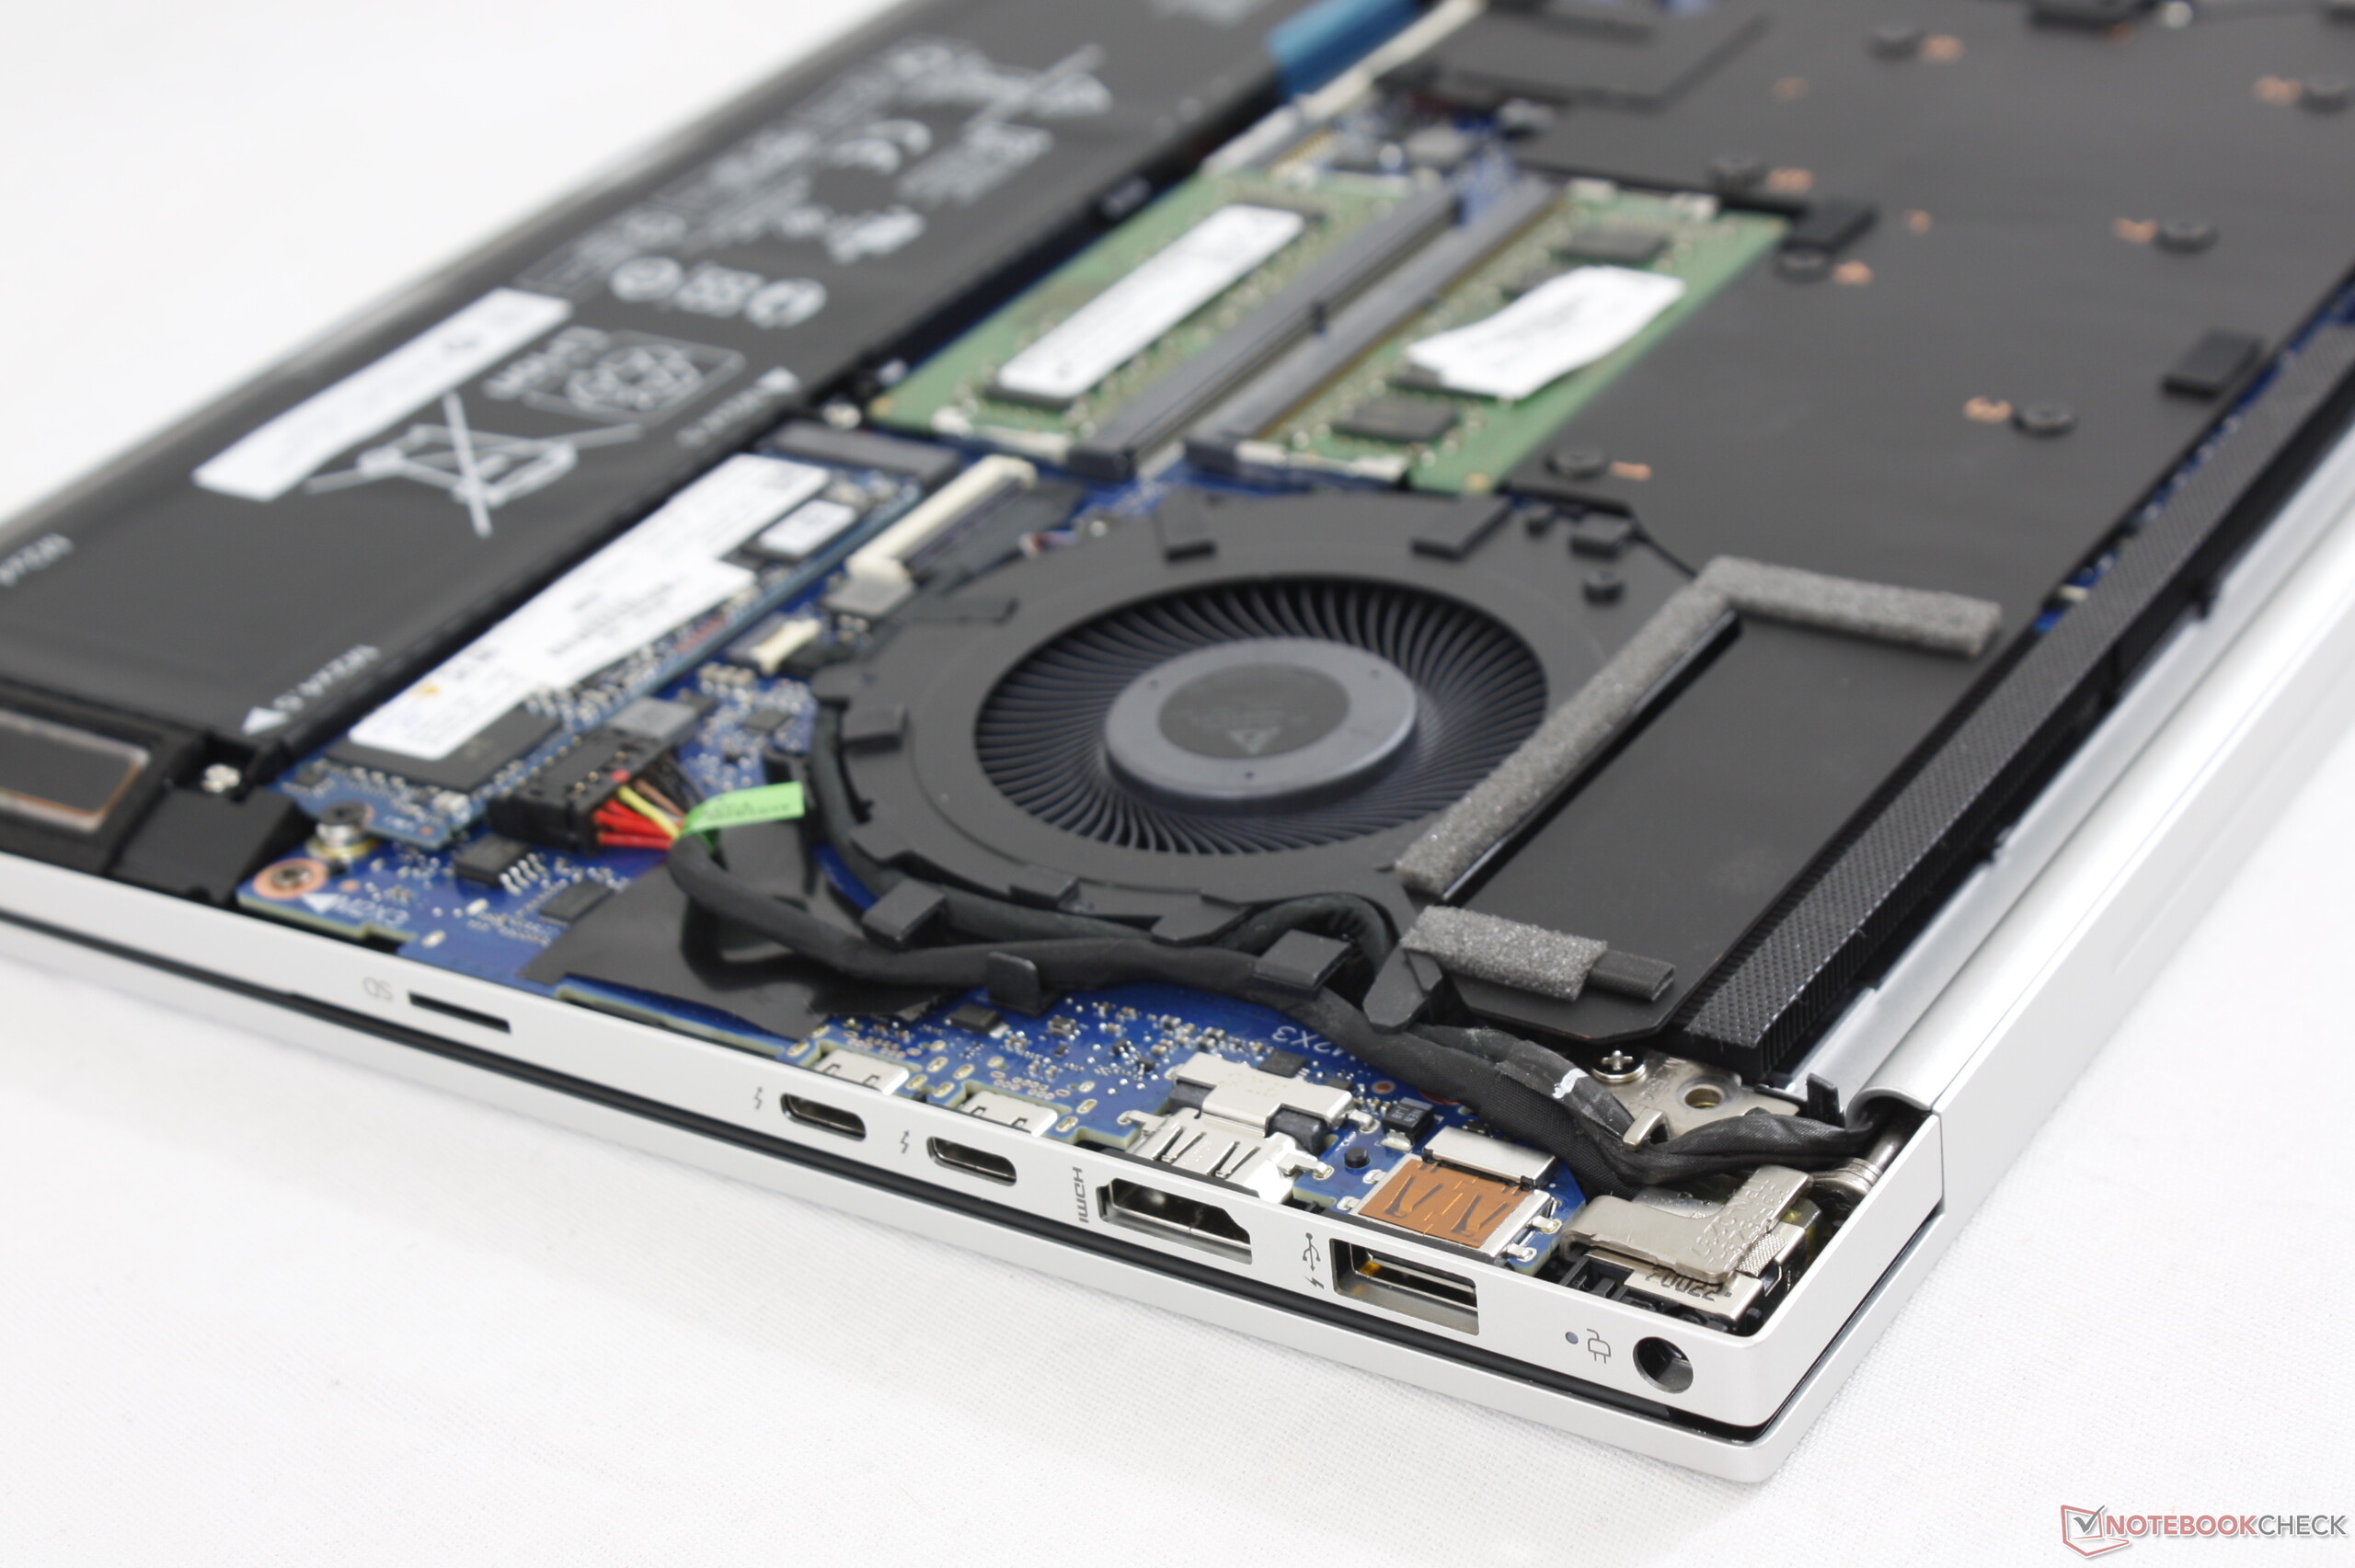
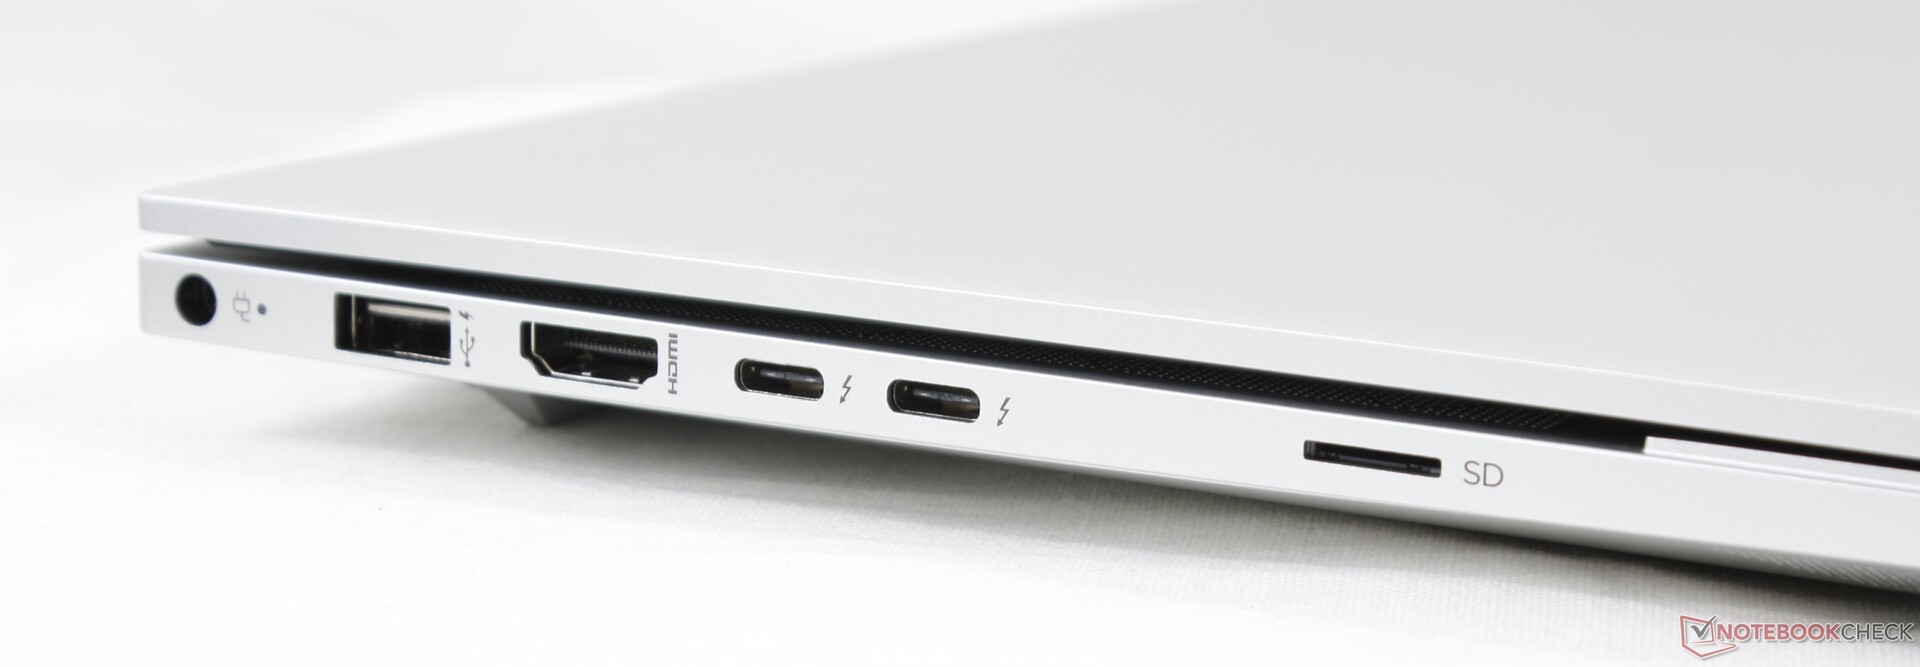
A HP essencialmente reinventou sua série Envy 15. Este último modelo é completamente diferente da versão de última geração, com quase todas as mudanças sendo para melhor. Além da aparência mais profissional, facilidade de manutenção e novas opções da série Core H, a GPU GeForce RTX 2060 Max-Q opcional é muito mais rápida do que o Apple MacBook Pro 13 15 ou MacBook Pro 16 pode oferecer no momento, custando menos no processo, que é exatamente o que a HP queria.
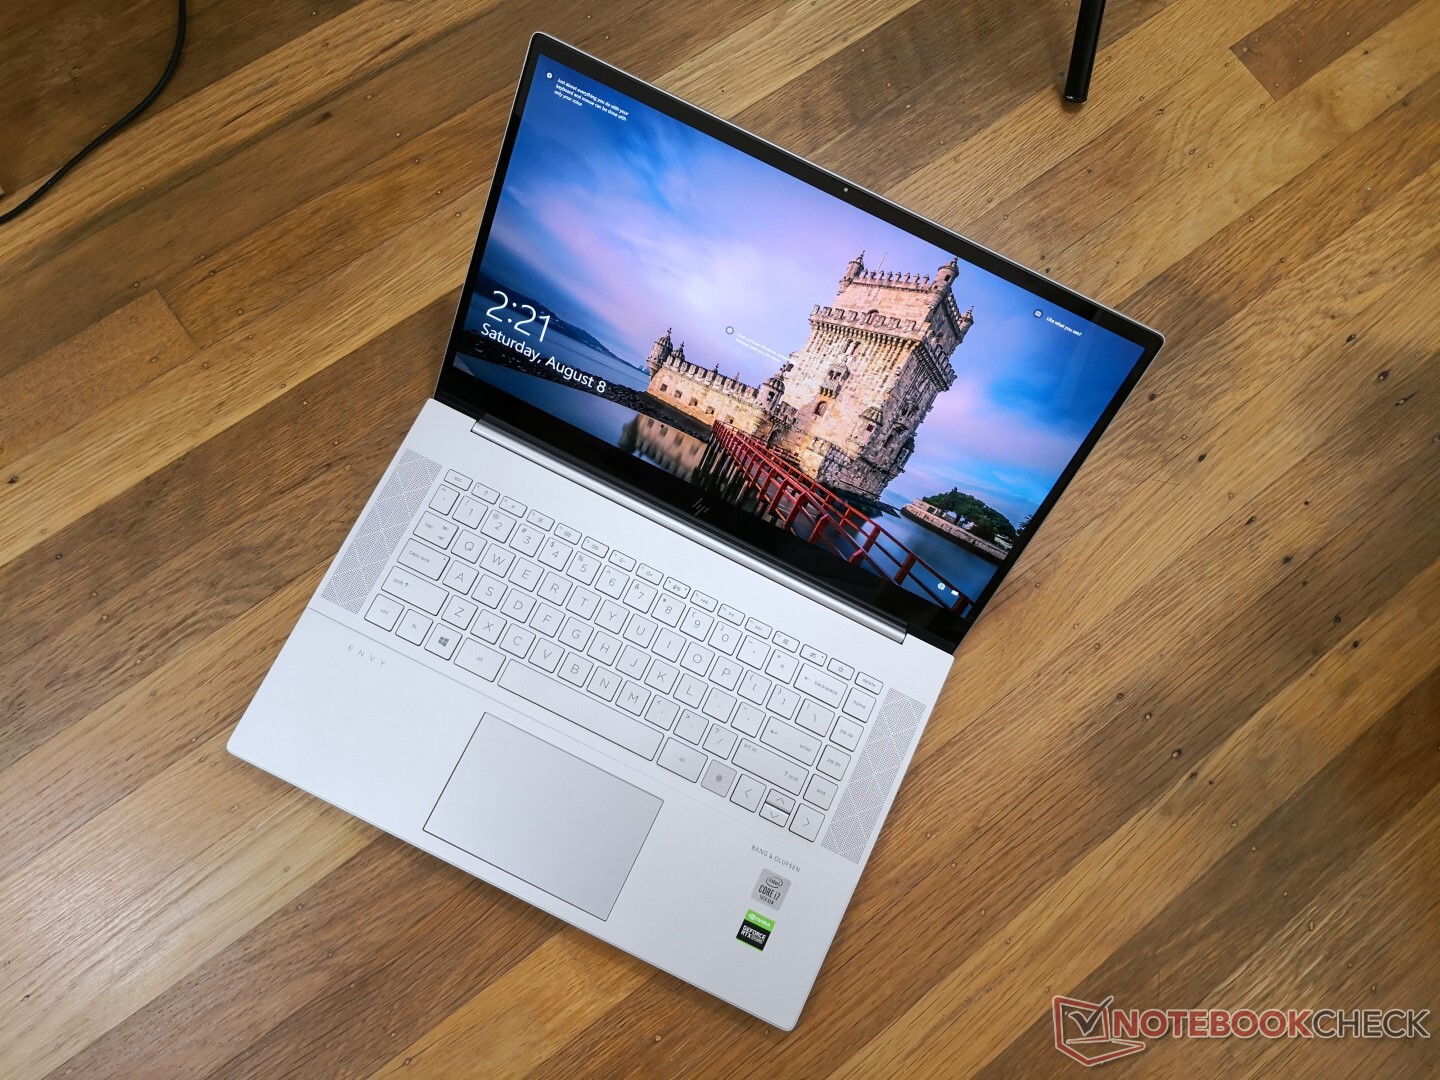
No entanto, o hardware para jogos significa que o Envy 15 também herda muitas das mesmas desvantagens de um portátil fino para jogos. Não se deixe enganar por sua aparência elegante de Ultrabook, porque este portátil não durará tanto quanto seu Ultrabook Intel UHD ou GeForce MX típico, nem será tão silencioso ou leve. É quase um portátil para jogos disfarçado, embora seja comercializado para criadores de conteúdo da mesma forma que a série Gigabyte Aero. O adaptador de CA de 200 W, por exemplo, é significativamente maior e, portanto, mais pesado de carregar do que qualquer Ultrabook. Se os usuários compreenderem essas desvantagens inerentes, eles ficarão felizes com o novo Envy 15 e seu alto nível de desempenho, considerando o preço e o formato. Caso contrário, você estaria melhor com um Spectre, se suas cargas de trabalho consistirem principalmente de navegação na web e processamento de texto.
Existem alguns ajustes que gostaríamos de ver para tornar o Envy 15 melhor. O suporte de carregamento USB-C seria extremamente útil para viajantes, pois o grande adaptador de CA de 200 W pode ficar em casa quando não for necessário. Tanto o clickpad quanto as dobradiças poderiam ser mais firmes para refletir melhor o alto preço do novo modelo. Um posicionamento menos intrusivo para o leitor de digitais satisfaria os usuários que contam com a tecla Fn.
Quer um MacBook Pro, mas gostaria que tivesse gráficos mais rápidos, OLED e mais opções de portas? Então vale a pena dar uma olhada no Envy 15 2020. Deixando de ser impulsionado por processadores ULV, o novo Envy abriga opções de hardware poderosas para jogos em um chassi tipo Ultrabook para ser uma ótima solução intermediária.
HP Envy 15-ep0098nr
- 08/31/2022 v7 (old)
Allen Ngo
Price comparison
