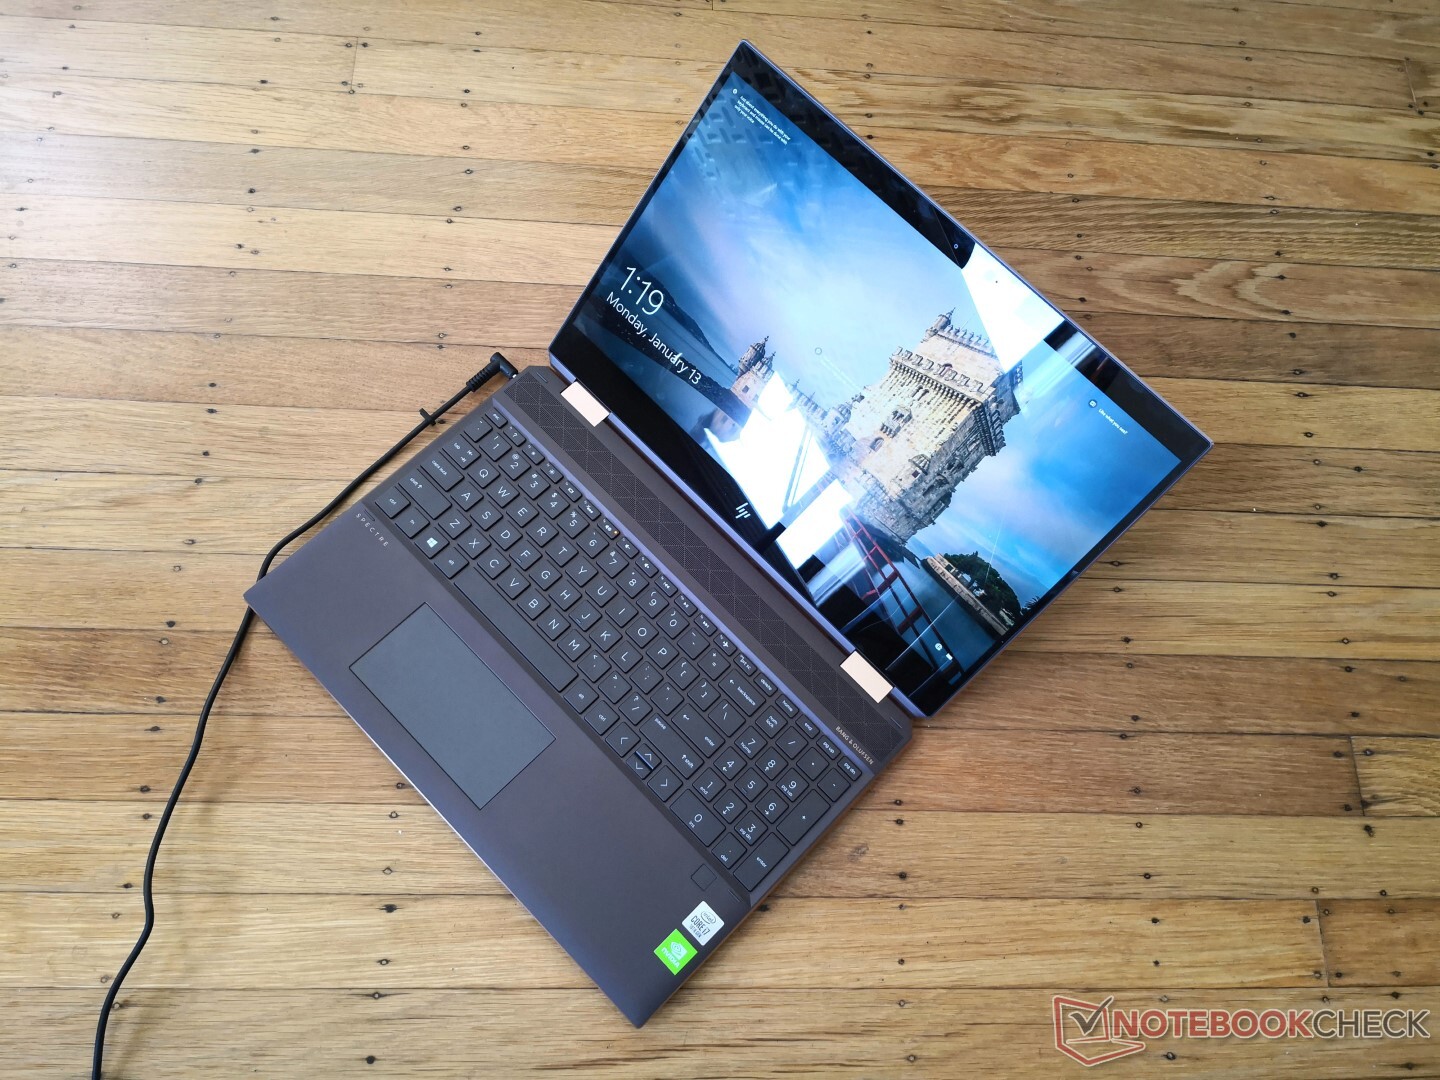
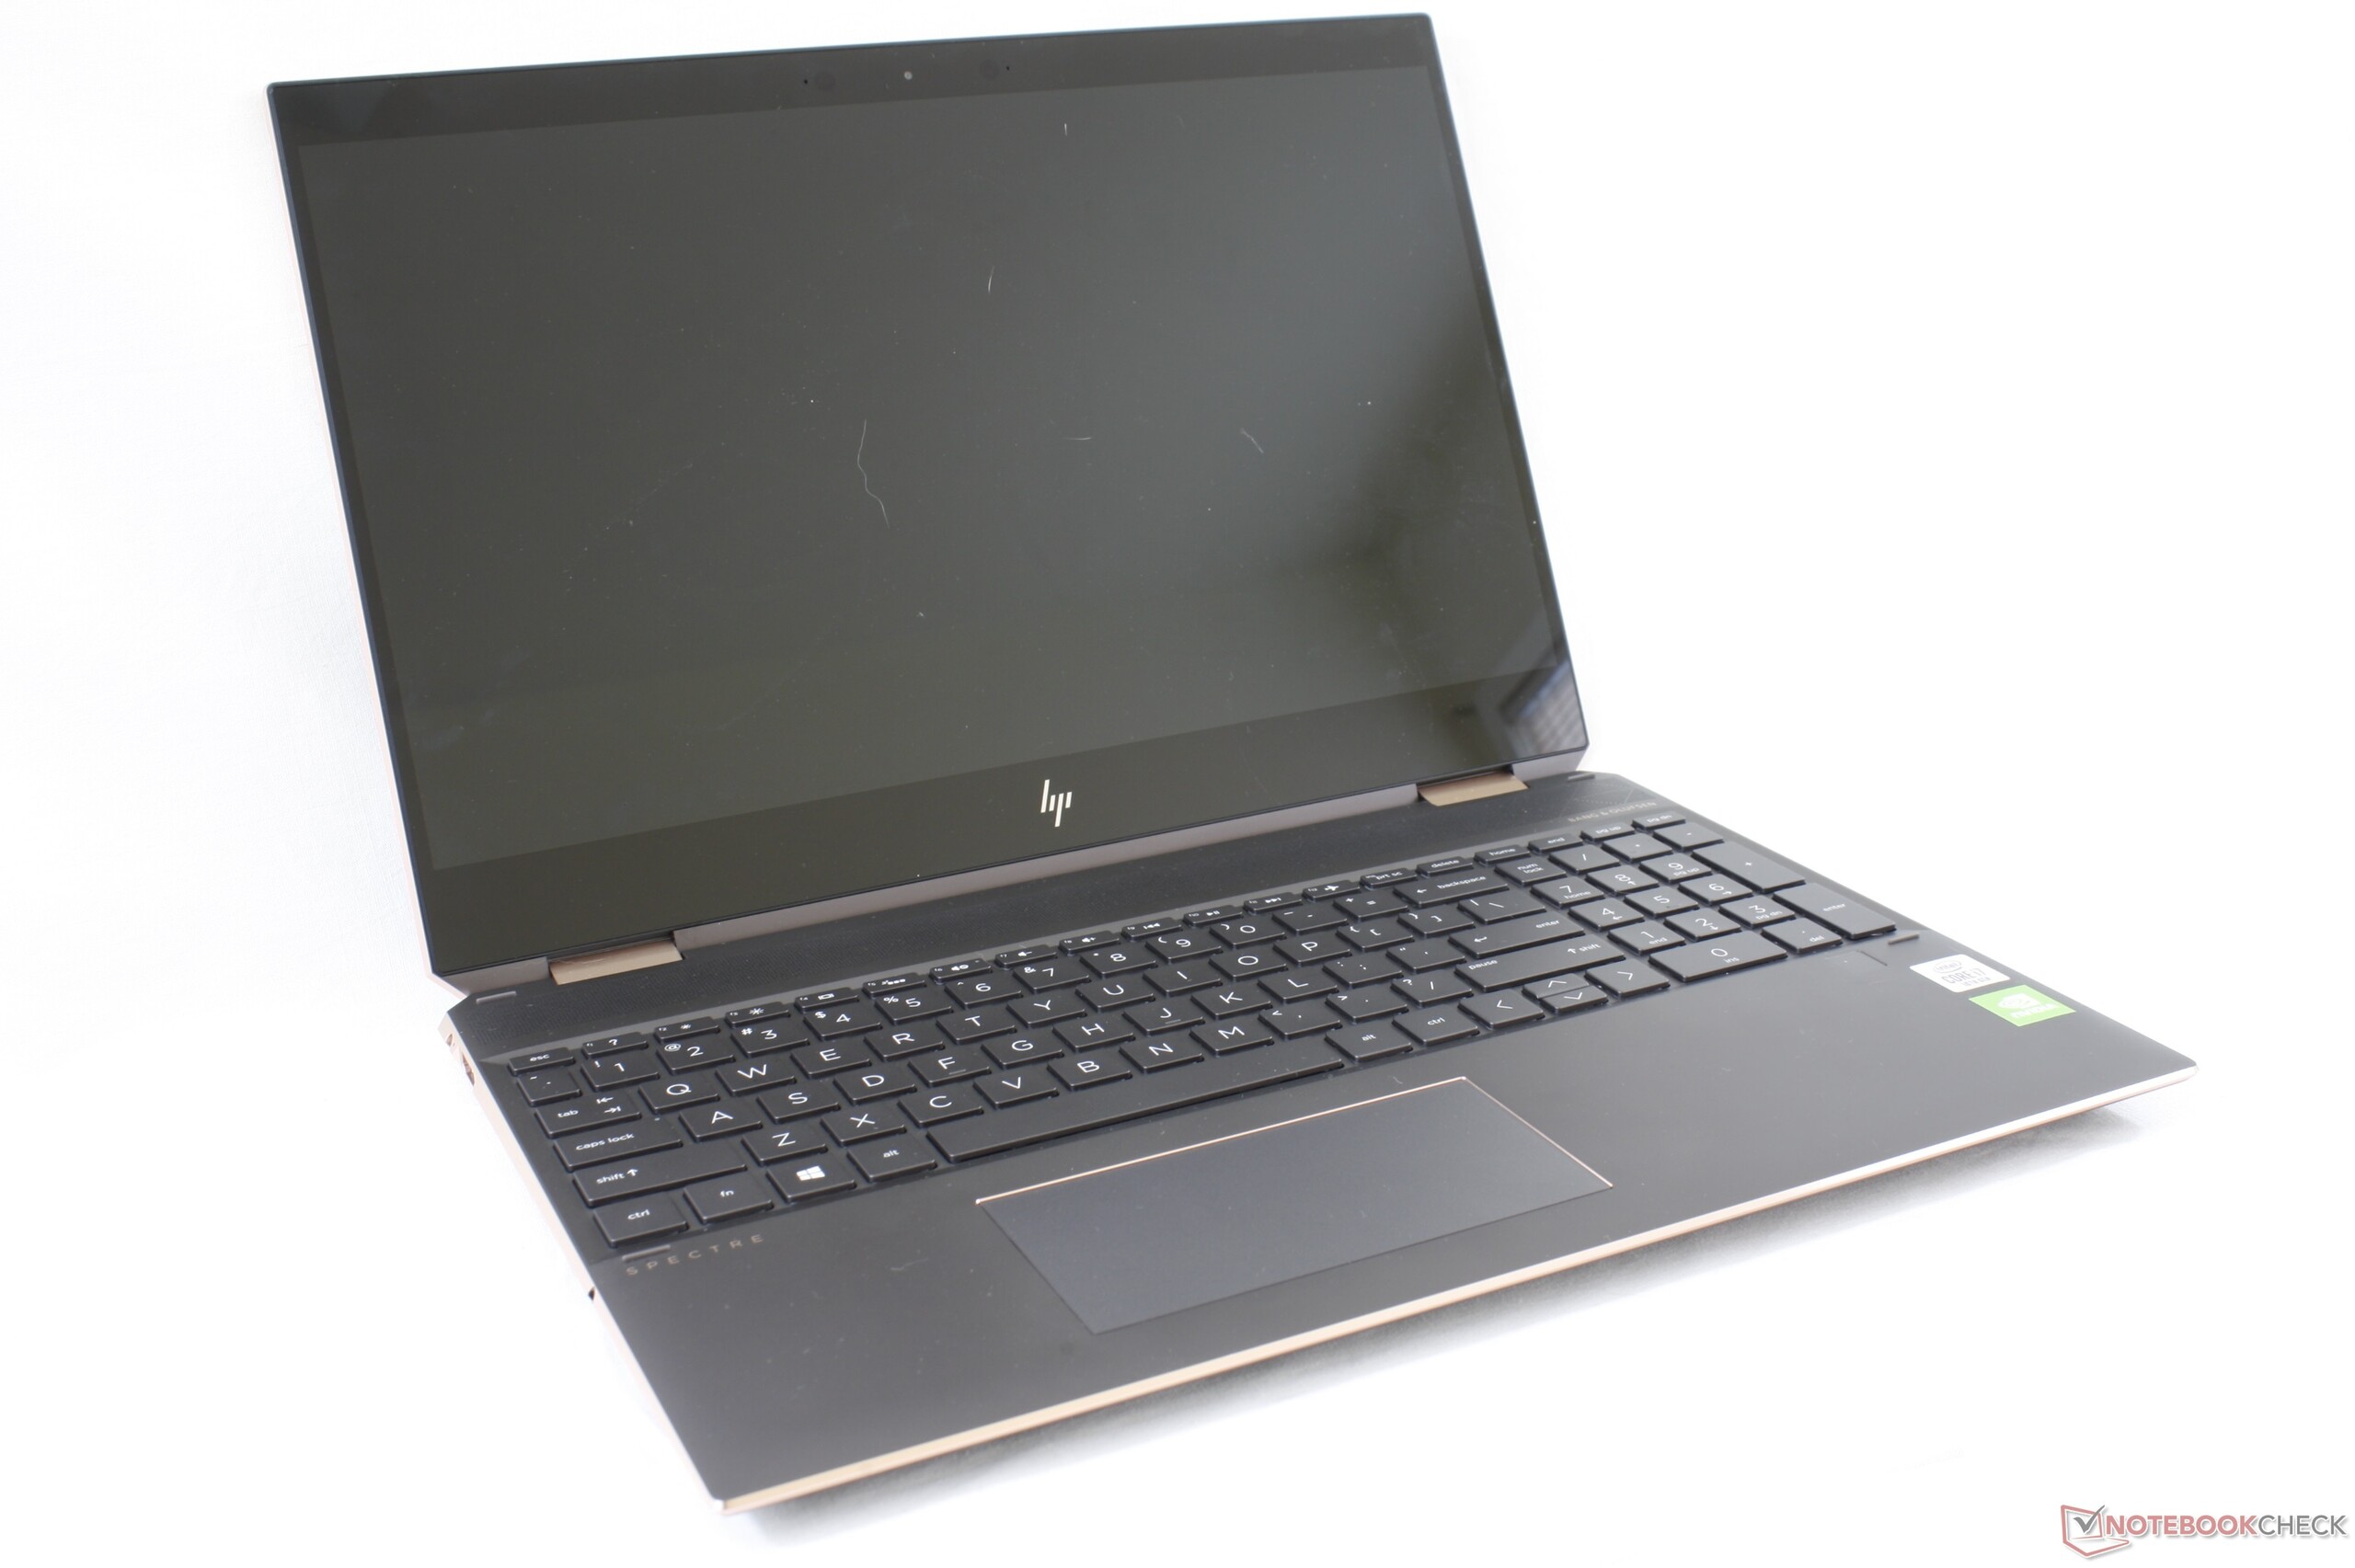
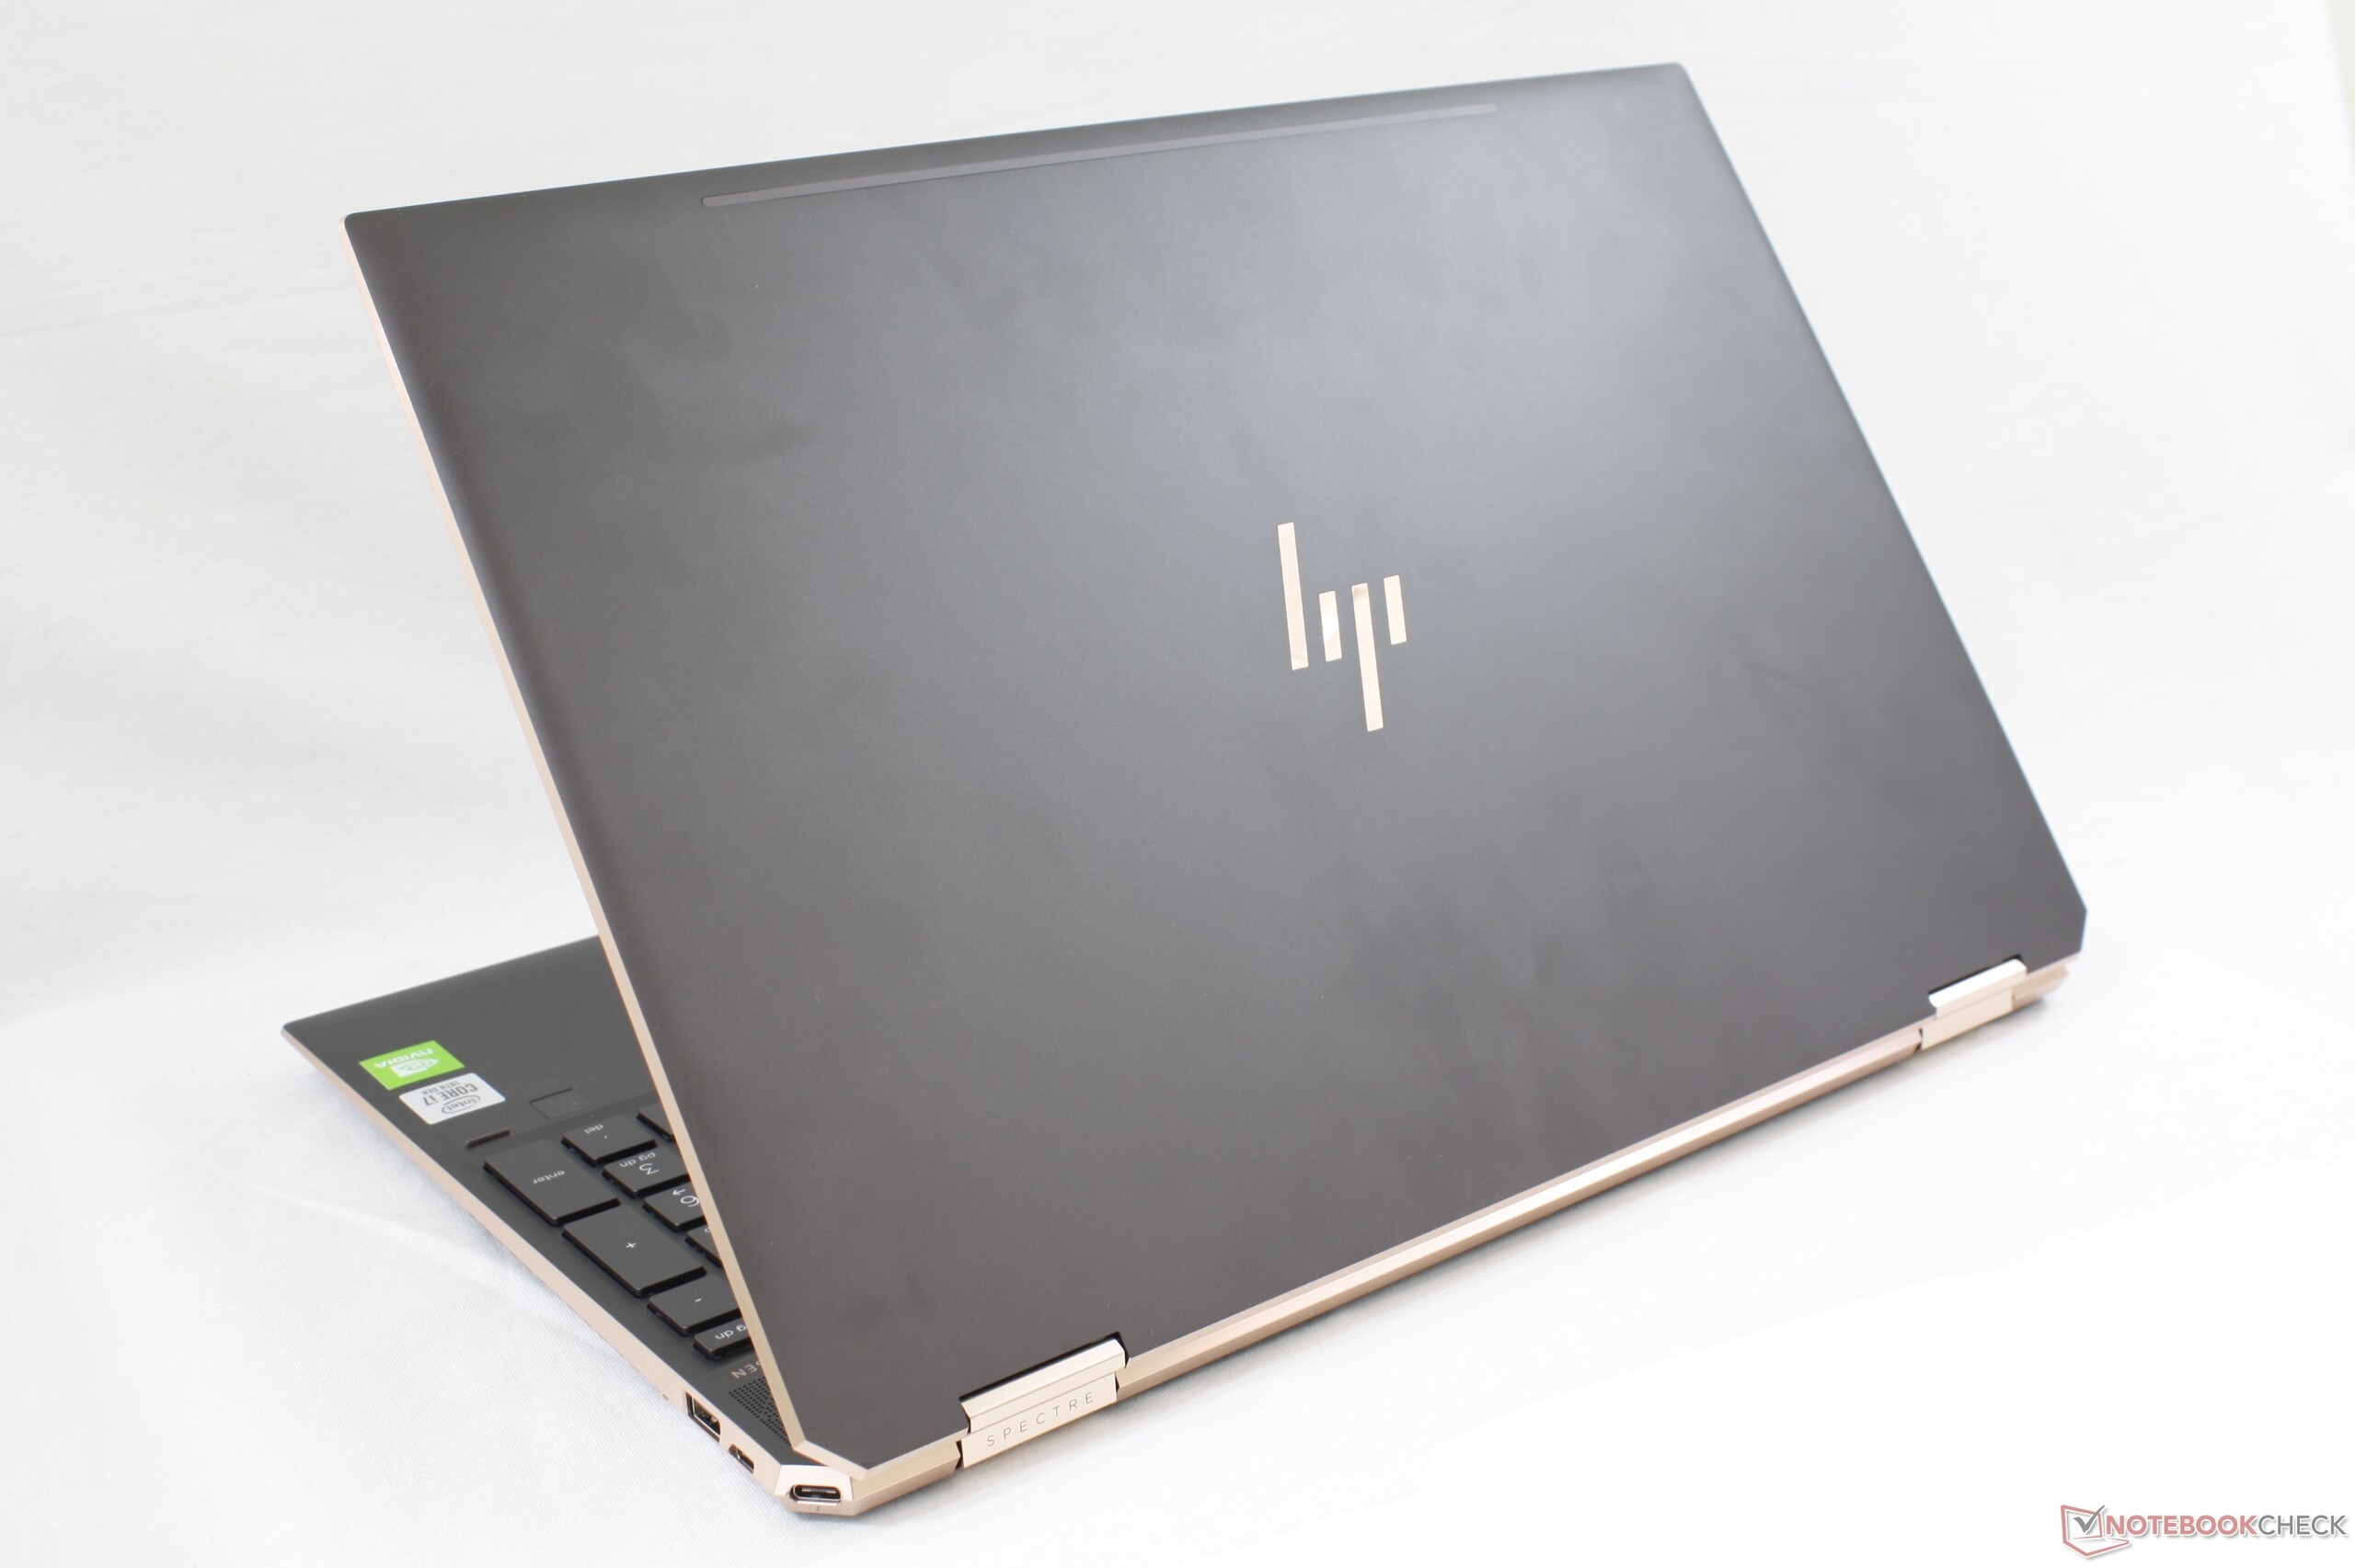
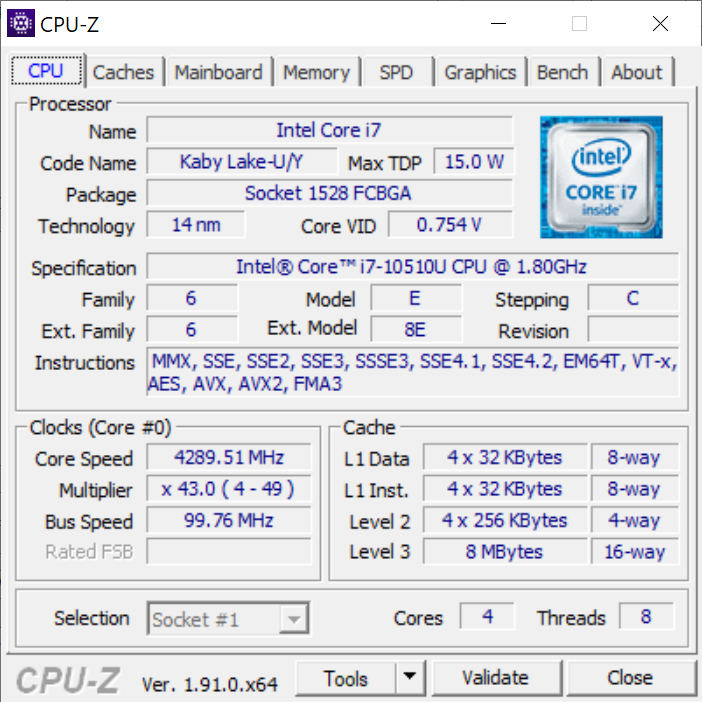
Breve Análise do Conversível HP Spectre X360 15 Final 2019: Comet Lake Core i7 com GeForce MX Graphics
Avaliação | Data | Modelo | Peso | Altura | Size | Resolução | Preço |
|---|---|---|---|---|---|---|---|
| 85 % v7 (old) | 01/2020 | HP Spectre X360 15-5ZV31AV i7-10510U, GeForce MX250 | 2.1 kg | 19.3 mm | 15.60" | 3840x2160 | |
| 86 % v7 (old) | 12/2019 | Lenovo Yoga C940-15IRH i7-9750H, GeForce GTX 1650 Max-Q | 2 kg | 19.7 mm | 15.60" | 1920x1080 | |
| 83.1 % v7 (old) | 10/2019 | Asus ZenBook 15 UX534FT-DB77 i7-8565U, GeForce GTX 1650 Max-Q | 1.7 kg | 18.9 mm | 15.60" | 1920x1080 | |
| 86.5 % v6 (old) | 07/2018 | HP Spectre x360 15-ch011nr i5-8550U, GeForce MX150 | 2.1 kg | 19.3 mm | 15.60" | 3840x2160 | |
| 85.2 % v7 (old) | 11/2019 | MSI Prestige 15 A10SC i7-10710U, GeForce GTX 1650 Max-Q | 1.7 kg | 16 mm | 15.60" | 3840x2160 |

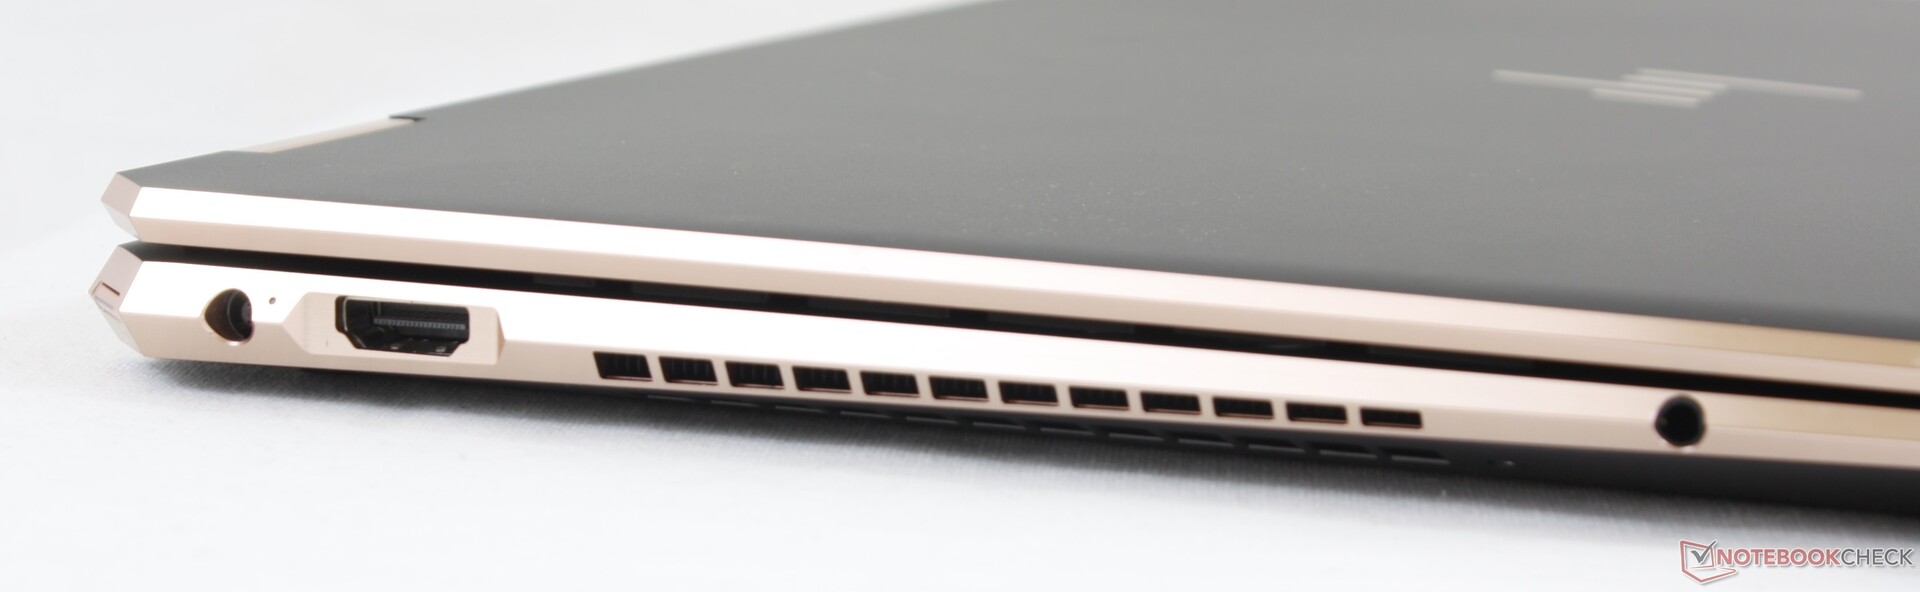
| SD Card Reader | |
| average JPG Copy Test (av. of 3 runs) | |
| Dell XPS 15 7590 9980HK GTX 1650 (Toshiba Exceria Pro SDXC 64 GB UHS-II) | |
| HP Spectre X360 15-5ZV31AV (Toshiba Exceria Pro M501 UHS-II) | |
| MSI Prestige 15 A10SC (Toshiba Exceria Pro M501 UHS-II) | |
| Asus ZenBook 15 UX534FT-DB77 (Toshiba Exceria Pro SDXC 64 GB UHS-II) | |
| HP Pavilion Gaming 15-ec0017ng (Toshiba Exceria Pro SDXC 64 GB UHS-II) | |
| maximum AS SSD Seq Read Test (1GB) | |
| MSI Prestige 15 A10SC (Toshiba Exceria Pro M501 UHS-II) | |
| Dell XPS 15 7590 9980HK GTX 1650 (Toshiba Exceria Pro SDXC 64 GB UHS-II) | |
| HP Spectre X360 15-5ZV31AV (Toshiba Exceria Pro M501 UHS-II) | |
| Asus ZenBook 15 UX534FT-DB77 (Toshiba Exceria Pro SDXC 64 GB UHS-II) | |
| HP Pavilion Gaming 15-ec0017ng (Toshiba Exceria Pro SDXC 64 GB UHS-II) | |
| Networking | |
| iperf3 transmit AX12 | |
| MSI Prestige 15 A10SC | |
| HP Pavilion Gaming 15-ec0017ng | |
| iperf3 receive AX12 | |
| MSI Prestige 15 A10SC | |
| HP Pavilion Gaming 15-ec0017ng | |
| |||||||||||||||||||||||||
iluminação: 85 %
iluminação com acumulador: 284.6 cd/m²
Contraste: 1138:1 (Preto: 0.25 cd/m²)
ΔE ColorChecker Calman: 3.52 | ∀{0.5-29.43 Ø4.73}
calibrated: 3
ΔE Greyscale Calman: 3.2 | ∀{0.09-98 Ø4.97}
93.8% sRGB (Argyll 1.6.3 3D)
61.1% AdobeRGB 1998 (Argyll 1.6.3 3D)
68.4% AdobeRGB 1998 (Argyll 3D)
94.3% sRGB (Argyll 3D)
68.3% Display P3 (Argyll 3D)
Gamma: 2.28
CCT: 7070 K
| HP Spectre X360 15-5ZV31AV AU Optronics AUO30EB, IPS, 15.6", 3840x2160 | HP Spectre x360 15-ch011nr BOE0730, IPS, 15.6", 3840x2160 | Dell XPS 15 7590 9980HK GTX 1650 Samsung 156WR04, SDCA029, OLED, 15.6", 3840x2160 | Lenovo Yoga C940-15IRH LG Philips LP156WFC-SPU1, IPS, 15.6", 1920x1080 | MSI Prestige 15 A10SC Sharp LQ156D1JW42, IPS, 15.6", 3840x2160 | HP Spectre x360 15-df0126ng AU Optronics AUO30EB, IPS, 15.6", 3840x2160 | |
|---|---|---|---|---|---|---|
| Display | -2% | 23% | -6% | 22% | 0% | |
| Display P3 Coverage (%) | 68.3 | 68.5 0% | 88.1 29% | 61.5 -10% | 82 20% | 68.1 0% |
| sRGB Coverage (%) | 94.3 | 90.7 -4% | 99.6 6% | 92.7 -2% | 98.3 4% | 94.2 0% |
| AdobeRGB 1998 Coverage (%) | 68.4 | 66.3 -3% | 91.8 34% | 63.6 -7% | 96.2 41% | 68.4 0% |
| Response Times | 33% | 95% | 13% | -4% | 12% | |
| Response Time Grey 50% / Grey 80% * (ms) | 56.8 ? | 38 ? 33% | 2.3 ? 96% | 48.4 ? 15% | 60 ? -6% | 57 ? -0% |
| Response Time Black / White * (ms) | 40.8 ? | 27.6 ? 32% | 2.4 ? 94% | 36.4 ? 11% | 41.2 ? -1% | 31 ? 24% |
| PWM Frequency (Hz) | 943 ? | 59.5 ? | 26040 ? | |||
| Screen | -29% | -4% | 9% | 7% | -8% | |
| Brightness middle (cd/m²) | 284.6 | 329.3 16% | 421.2 48% | 484.8 70% | 464.5 63% | 330 16% |
| Brightness (cd/m²) | 285 | 316 11% | 417 46% | 463 62% | 451 58% | 310 9% |
| Brightness Distribution (%) | 85 | 84 -1% | 94 11% | 82 -4% | 92 8% | 87 2% |
| Black Level * (cd/m²) | 0.25 | 0.31 -24% | 0.26 -4% | 0.5 -100% | 0.37 -48% | |
| Contrast (:1) | 1138 | 1062 -7% | 1865 64% | 929 -18% | 892 -22% | |
| Colorchecker dE 2000 * | 3.52 | 4.78 -36% | 6.06 -72% | 4.5 -28% | 3.36 5% | 4.03 -14% |
| Colorchecker dE 2000 max. * | 5.56 | 11.75 -111% | 11.89 -114% | 7.55 -36% | 7.06 -27% | 6.74 -21% |
| Colorchecker dE 2000 calibrated * | 3 | 3.51 -17% | 1.19 60% | 3.42 -14% | 1.96 35% | |
| Greyscale dE 2000 * | 3.2 | 7.9 -147% | 2.8 13% | 5.7 -78% | 1.3 59% | 4.49 -40% |
| Gamma | 2.28 96% | 2.24 98% | 2.15 102% | 2.45 90% | 2.14 103% | 2.57 86% |
| CCT | 7070 92% | 8323 78% | 6235 104% | 6101 107% | 6596 99% | 6744 96% |
| Color Space (Percent of AdobeRGB 1998) (%) | 61.1 | 58.8 -4% | 81 33% | 58.7 -4% | 84.8 39% | 61 0% |
| Color Space (Percent of sRGB) (%) | 93.8 | 90.4 -4% | 99.6 6% | 92.8 -1% | 98.3 5% | 94 0% |
| Média Total (Programa/Configurações) | 1% /
-17% | 38% /
18% | 5% /
7% | 8% /
9% | 1% /
-4% |
* ... menor é melhor
Exibir tempos de resposta
| ↔ Tempo de resposta preto para branco | ||
|---|---|---|
| 40.8 ms ... ascensão ↗ e queda ↘ combinadas | ↗ 20.4 ms ascensão | 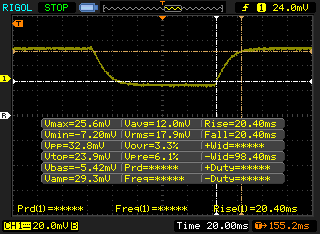 |
| ↘ 20.4 ms queda | ||
| A tela mostra taxas de resposta lentas em nossos testes e será insatisfatória para os jogadores. Em comparação, todos os dispositivos testados variam de 0.1 (mínimo) a 240 (máximo) ms. » 98 % de todos os dispositivos são melhores. Isso significa que o tempo de resposta medido é pior que a média de todos os dispositivos testados (19.9 ms). | ||
| ↔ Tempo de resposta 50% cinza a 80% cinza | ||
| 56.8 ms ... ascensão ↗ e queda ↘ combinadas | ↗ 26 ms ascensão | 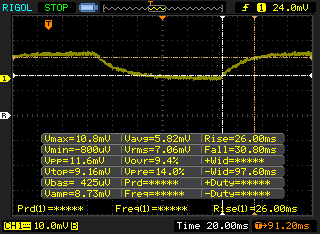 |
| ↘ 30.8 ms queda | ||
| A tela mostra taxas de resposta lentas em nossos testes e será insatisfatória para os jogadores. Em comparação, todos os dispositivos testados variam de 0.165 (mínimo) a 636 (máximo) ms. » 94 % de todos os dispositivos são melhores. Isso significa que o tempo de resposta medido é pior que a média de todos os dispositivos testados (31.1 ms). | ||
Cintilação da tela / PWM (modulação por largura de pulso)
| Tela tremeluzindo / PWM não detectado | 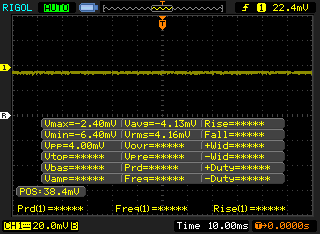 | ||
[pwm_comparison] Em comparação: 52 % de todos os dispositivos testados não usam PWM para escurecer a tela. Se PWM foi detectado, uma média de 7791 (mínimo: 5 - máximo: 343500) Hz foi medida. | |||
| Cinebench R20 | |
| CPU (Single Core) | |
| Dell XPS 13 7390 Core i7-10710U | |
| Microsoft Surface Laptop 3 15 i7-1065G7 | |
| Média Intel Core i7-10510U (362 - 497, n=37) | |
| Asus ROG Zephyrus S GX701GXR | |
| Dynabook Portege A30-E-174 | |
| Lenovo ThinkPad P43s-20RH001FGE | |
| HP Spectre X360 15-5ZV31AV | |
| Walmart Motile M142 | |
| Microsoft Surface Laptop 3 15 Ryzen 5 3580U | |
| Dell Latitude 13 3390 | |
| Dell Inspiron 15 5000 5585 | |
| CPU (Multi Core) | |
| Dell XPS 13 7390 Core i7-10710U | |
| Asus ROG Zephyrus S GX701GXR | |
| Microsoft Surface Laptop 3 15 i7-1065G7 | |
| Microsoft Surface Laptop 3 15 Ryzen 5 3580U | |
| Dell Inspiron 15 5000 5585 | |
| Média Intel Core i7-10510U (1015 - 1897, n=38) | |
| Walmart Motile M142 | |
| HP Spectre X360 15-5ZV31AV | |
| Dynabook Portege A30-E-174 | |
| Dell Latitude 13 3390 | |
| Lenovo ThinkPad P43s-20RH001FGE | |
| PCMark 8 Home Score Accelerated v2 | 3365 pontos | |
| PCMark 8 Work Score Accelerated v2 | 4633 pontos | |
| PCMark 10 Score | 4101 pontos | |
Ajuda | ||
| HP Spectre X360 15-5ZV31AV Intel SSD 660p 2TB SSDPEKNW020T8 | Dell XPS 15 7590 9980HK GTX 1650 Toshiba XG6 KXG60ZNV1T02 | Lenovo Yoga C940-15IRH Intel Optane Memory H10 with Solid State Storage 32GB + 512GB HBRPEKNX0202A(L/H) | Asus ZenBook 15 UX534FT-DB77 Samsung SSD PM981 MZVLB1T0HALR | HP Spectre x360 15-ch011nr SK hynix PC401 NVMe 500 GB | |
|---|---|---|---|---|---|
| AS SSD | 42% | -20% | 27% | -4% | |
| Seq Read (MB/s) | 1220 | 1723 41% | 769 -37% | 1887 55% | 1739 43% |
| Seq Write (MB/s) | 1152 | 1386 20% | 351.1 -70% | 1432 24% | 1189 3% |
| 4K Read (MB/s) | 52.3 | 43.25 -17% | 69.1 32% | 52.3 0% | 38.76 -26% |
| 4K Write (MB/s) | 146.6 | 98.3 -33% | 100.9 -31% | 146 0% | 93.2 -36% |
| 4K-64 Read (MB/s) | 652 | 1078 65% | 472 -28% | 969 49% | 646 -1% |
| 4K-64 Write (MB/s) | 847 | 1456 72% | 948 12% | 1375 62% | 545 -36% |
| Access Time Read * (ms) | 0.077 | 0.05 35% | 0.071 8% | 0.034 56% | 0.054 30% |
| Access Time Write * (ms) | 0.106 | 0.039 63% | 0.137 -29% | 0.075 29% | 0.051 52% |
| Score Read (Points) | 826 | 1294 57% | 618 -25% | 1210 46% | 859 4% |
| Score Write (Points) | 1109 | 1693 53% | 1084 -2% | 1664 50% | 757 -32% |
| Score Total (Points) | 2371 | 3638 53% | 2024 -15% | 3483 47% | 2037 -14% |
| Copy ISO MB/s (MB/s) | 2070 | 3182 54% | 839 -59% | 1375 -34% | 1668 -19% |
| Copy Program MB/s (MB/s) | 571 | 984 72% | 455.8 -20% | 468 -18% | 486.8 -15% |
| Copy Game MB/s (MB/s) | 1219 | 1824 50% | 969 -21% | 1287 6% | 1042 -15% |
* ... menor é melhor

| 3DMark 11 | |
| 1280x720 Performance GPU | |
| Desktop PC Intel Xeon E5 2680v4 KFA2 GTX 1060 6GB | |
| Lenovo Yoga C940-15IRH | |
| HP Spectre x360 15-df0126ng | |
| Lenovo Yoga 730-15IKB | |
| HP Spectre x360 15-ch011nr | |
| HP Spectre X360 15-5ZV31AV | |
| Microsoft Surface Laptop 3 15 i7-1065G7 | |
| Média NVIDIA GeForce MX250 (3585 - 4942, n=29) | |
| Dell Inspiron 15 5000 5585 | |
| HP Envy 13-ah0003ng | |
| Dell Inspiron 14 3493-4KWCF | |
| 1280x720 Performance Combined | |
| Desktop PC Intel Xeon E5 2680v4 KFA2 GTX 1060 6GB | |
| Lenovo Yoga C940-15IRH | |
| HP Spectre x360 15-df0126ng | |
| Lenovo Yoga 730-15IKB | |
| HP Spectre x360 15-ch011nr | |
| Média NVIDIA GeForce MX250 (3532 - 4638, n=29) | |
| HP Spectre X360 15-5ZV31AV | |
| Microsoft Surface Laptop 3 15 i7-1065G7 | |
| Dell Inspiron 15 5000 5585 | |
| HP Envy 13-ah0003ng | |
| Dell Inspiron 14 3493-4KWCF | |
| 3DMark 11 Performance | 4929 pontos | |
| 3DMark Cloud Gate Standard Score | 12540 pontos | |
| 3DMark Fire Strike Score | 3206 pontos | |
| 3DMark Time Spy Score | 1218 pontos | |
Ajuda | ||
| The Witcher 3 | |
| 1366x768 Medium Graphics & Postprocessing | |
| Lenovo Yoga C940-15IRH | |
| Dell G3 3590 | |
| HP Spectre x360 15-df0126ng | |
| HP Spectre X360 15-5ZV31AV | |
| Xiaomi Mi Notebook Pro i7 | |
| Média NVIDIA GeForce MX250 (30 - 40, n=27) | |
| 1920x1080 High Graphics & Postprocessing (Nvidia HairWorks Off) | |
| Asus TUF FX705GM | |
| Dell G3 3590 | |
| Lenovo Yoga C940-15IRH | |
| HP Spectre x360 15-df0126ng | |
| HP Spectre X360 15-5ZV31AV | |
| Média NVIDIA GeForce MX250 (16.3 - 23.1, n=27) | |
| Xiaomi Mi Notebook Pro i7 | |
| Dell Inspiron 15 5000 5585 | |
| 1920x1080 Ultra Graphics & Postprocessing (HBAO+) | |
| Asus TUF FX705GM | |
| Lenovo Yoga C940-15IRH | |
| Dell G3 3590 | |
| HP Spectre x360 15-df0126ng | |
| HP Spectre X360 15-5ZV31AV | |
| Média NVIDIA GeForce MX250 (9 - 16, n=24) | |
| Xiaomi Mi Notebook Pro i7 | |
| Dell Inspiron 15 5000 5585 | |
| baixo | média | alto | ultra | |
|---|---|---|---|---|
| BioShock Infinite (2013) | 203 | 112.2 | 94.2 | 35.3 |
| The Witcher 3 (2015) | 38.7 | 21.9 | 12.2 | |
| Shadow of the Tomb Raider (2018) | 53 | 18 | 13 | 9 |
| HP Spectre X360 15-5ZV31AV GeForce MX250, i7-10510U, Intel SSD 660p 2TB SSDPEKNW020T8 | Dell XPS 15 7590 9980HK GTX 1650 GeForce GTX 1650 Mobile, i9-9980HK, Toshiba XG6 KXG60ZNV1T02 | Lenovo Yoga C940-15IRH GeForce GTX 1650 Max-Q, i7-9750H, Intel Optane Memory H10 with Solid State Storage 32GB + 512GB HBRPEKNX0202A(L/H) | Asus ZenBook 15 UX534FT-DB77 GeForce GTX 1650 Max-Q, i7-8565U, Samsung SSD PM981 MZVLB1T0HALR | MSI Prestige 15 A10SC GeForce GTX 1650 Max-Q, i7-10710U, Samsung SSD PM981 MZVLB1T0HALR | HP Spectre x360 15-ch011nr GeForce MX150, i5-8550U, SK hynix PC401 NVMe 500 GB | |
|---|---|---|---|---|---|---|
| Noise | -9% | -7% | 2% | -1% | 2% | |
| desligado / ambiente * (dB) | 30.1 | 28.2 6% | 28.7 5% | 28.4 6% | 29.3 3% | 28.6 5% |
| Idle Minimum * (dB) | 30.1 | 28.2 6% | 28.7 5% | 28.4 6% | 30.1 -0% | 29.2 3% |
| Idle Average * (dB) | 30.1 | 28.2 6% | 28.8 4% | 28.4 6% | 30.2 -0% | 29.2 3% |
| Idle Maximum * (dB) | 30.1 | 30.4 -1% | 28.8 4% | 28.4 6% | 30.2 -0% | 29.2 3% |
| Load Average * (dB) | 30.1 | 43.8 -46% | 45 -50% | 33.9 -13% | 31.5 -5% | 29.2 3% |
| Witcher 3 ultra * (dB) | 39.7 | 47.2 -19% | 44.7 -13% | 39.8 -0% | 37 7% | 38.4 3% |
| Load Maximum * (dB) | 42 | 47.2 -12% | 44.7 -6% | 40.2 4% | 47 -12% | 45.7 -9% |
* ... menor é melhor
Barulho
| Ocioso |
| 30.1 / 30.1 / 30.1 dB |
| Carga |
| 30.1 / 42 dB |
 | ||
30 dB silencioso 40 dB(A) audível 50 dB(A) ruidosamente alto |
||
min: | ||
(-) A temperatura máxima no lado superior é 47 °C / 117 F, em comparação com a média de 36.8 °C / 98 F , variando de 21 a 71 °C para a classe Multimedia.
(-) A parte inferior aquece até um máximo de 47.4 °C / 117 F, em comparação com a média de 39.1 °C / 102 F
(+) Em uso inativo, a temperatura média para o lado superior é 21.4 °C / 71 F, em comparação com a média do dispositivo de 31.3 °C / ### class_avg_f### F.
(±) Jogando The Witcher 3, a temperatura média para o lado superior é 33.6 °C / 92 F, em comparação com a média do dispositivo de 31.3 °C / ## #class_avg_f### F.
(+) Os apoios para as mãos e o touchpad são mais frios que a temperatura da pele, com um máximo de 29.8 °C / 85.6 F e, portanto, são frios ao toque.
(±) A temperatura média da área do apoio para as mãos de dispositivos semelhantes foi 28.7 °C / 83.7 F (-1.1 °C / -1.9 F).
HP Spectre X360 15-5ZV31AV análise de áudio
(+) | os alto-falantes podem tocar relativamente alto (###valor### dB)
Graves 100 - 315Hz
(±) | graves reduzidos - em média 13.6% menor que a mediana
(±) | a linearidade dos graves é média (11.8% delta para a frequência anterior)
Médios 400 - 2.000 Hz
(+) | médios equilibrados - apenas 2.5% longe da mediana
(+) | médios são lineares (6.7% delta para frequência anterior)
Altos 2 - 16 kHz
(+) | agudos equilibrados - apenas 2.5% longe da mediana
(±) | a linearidade dos máximos é média (7% delta para frequência anterior)
Geral 100 - 16.000 Hz
(±) | a linearidade do som geral é média (15.4% diferença em relação à mediana)
Comparado com a mesma classe
» 39% de todos os dispositivos testados nesta classe foram melhores, 3% semelhantes, 59% piores
» O melhor teve um delta de 5%, a média foi 17%, o pior foi 45%
Comparado com todos os dispositivos testados
» 22% de todos os dispositivos testados foram melhores, 4% semelhantes, 73% piores
» O melhor teve um delta de 4%, a média foi 24%, o pior foi 134%
Apple MacBook 12 (Early 2016) 1.1 GHz análise de áudio
(+) | os alto-falantes podem tocar relativamente alto (###valor### dB)
Graves 100 - 315Hz
(±) | graves reduzidos - em média 11.3% menor que a mediana
(±) | a linearidade dos graves é média (14.2% delta para a frequência anterior)
Médios 400 - 2.000 Hz
(+) | médios equilibrados - apenas 2.4% longe da mediana
(+) | médios são lineares (5.5% delta para frequência anterior)
Altos 2 - 16 kHz
(+) | agudos equilibrados - apenas 2% longe da mediana
(+) | os máximos são lineares (4.5% delta da frequência anterior)
Geral 100 - 16.000 Hz
(+) | o som geral é linear (10.2% diferença em relação à mediana)
Comparado com a mesma classe
» 7% de todos os dispositivos testados nesta classe foram melhores, 2% semelhantes, 91% piores
» O melhor teve um delta de 5%, a média foi 18%, o pior foi 53%
Comparado com todos os dispositivos testados
» 5% de todos os dispositivos testados foram melhores, 1% semelhantes, 94% piores
» O melhor teve um delta de 4%, a média foi 24%, o pior foi 134%
| desligado | |
| Ocioso | |
| Carga |
|
Key:
min: | |
| HP Spectre X360 15-5ZV31AV i7-10510U, GeForce MX250, Intel SSD 660p 2TB SSDPEKNW020T8, IPS, 3840x2160, 15.6" | HP Spectre x360 15-ch011nr i5-8550U, GeForce MX150, SK hynix PC401 NVMe 500 GB, IPS, 3840x2160, 15.6" | Dell XPS 15 7590 9980HK GTX 1650 i9-9980HK, GeForce GTX 1650 Mobile, Toshiba XG6 KXG60ZNV1T02, OLED, 3840x2160, 15.6" | Lenovo Yoga C940-15IRH i7-9750H, GeForce GTX 1650 Max-Q, Intel Optane Memory H10 with Solid State Storage 32GB + 512GB HBRPEKNX0202A(L/H), IPS, 1920x1080, 15.6" | Asus ZenBook 15 UX534FT-DB77 i7-8565U, GeForce GTX 1650 Max-Q, Samsung SSD PM981 MZVLB1T0HALR, IPS, 1920x1080, 15.6" | MSI Prestige 15 A10SC i7-10710U, GeForce GTX 1650 Max-Q, Samsung SSD PM981 MZVLB1T0HALR, IPS, 3840x2160, 15.6" | |
|---|---|---|---|---|---|---|
| Power Consumption | -13% | -57% | -56% | -45% | -39% | |
| Idle Minimum * (Watt) | 5.2 | 5.3 -2% | 6.2 -19% | 5.2 -0% | 5 4% | 6.1 -17% |
| Idle Average * (Watt) | 8.5 | 9.8 -15% | 9.6 -13% | 10.7 -26% | 13.2 -55% | 13.2 -55% |
| Idle Maximum * (Watt) | 8.7 | 12.6 -45% | 21.2 -144% | 24.3 -179% | 24 -176% | 19.2 -121% |
| Load Average * (Watt) | 65.6 | 73 -11% | 104.3 -59% | 84.4 -29% | 70 -7% | 75 -14% |
| Witcher 3 ultra * (Watt) | 56.5 | 67.6 -20% | 91.7 -62% | 83.9 -48% | 63.3 -12% | 74 -31% |
| Load Maximum * (Watt) | 92.4 | 80 13% | 135.3 -46% | 142.8 -55% | 114 -23% | 89.7 3% |
* ... menor é melhor
| HP Spectre X360 15-5ZV31AV i7-10510U, GeForce MX250, 84 Wh | Dell XPS 15 7590 9980HK GTX 1650 i9-9980HK, GeForce GTX 1650 Mobile, 97 Wh | Lenovo Yoga C940-15IRH i7-9750H, GeForce GTX 1650 Max-Q, 69 Wh | Asus ZenBook 15 UX534FT-DB77 i7-8565U, GeForce GTX 1650 Max-Q, 71 Wh | MSI Prestige 15 A10SC i7-10710U, GeForce GTX 1650 Max-Q, 82 Wh | HP Spectre x360 15-ch011nr i5-8550U, GeForce MX150, 84 Wh | |
|---|---|---|---|---|---|---|
| Duração da bateria | -16% | -32% | -9% | -24% | -19% | |
| Reader / Idle (h) | 22.6 | 15.2 -33% | 18.2 -19% | 21.5 -5% | 19.1 -15% | 15.5 -31% |
| WiFi v1.3 (h) | 10.8 | 7.8 -28% | 9.7 -10% | 8.4 -22% | 7.6 -30% | 10.4 -4% |
| Load (h) | 2.9 | 3.3 14% | 1 -66% | 2.9 0% | 2.1 -28% | 2.3 -21% |
Pro
Contra

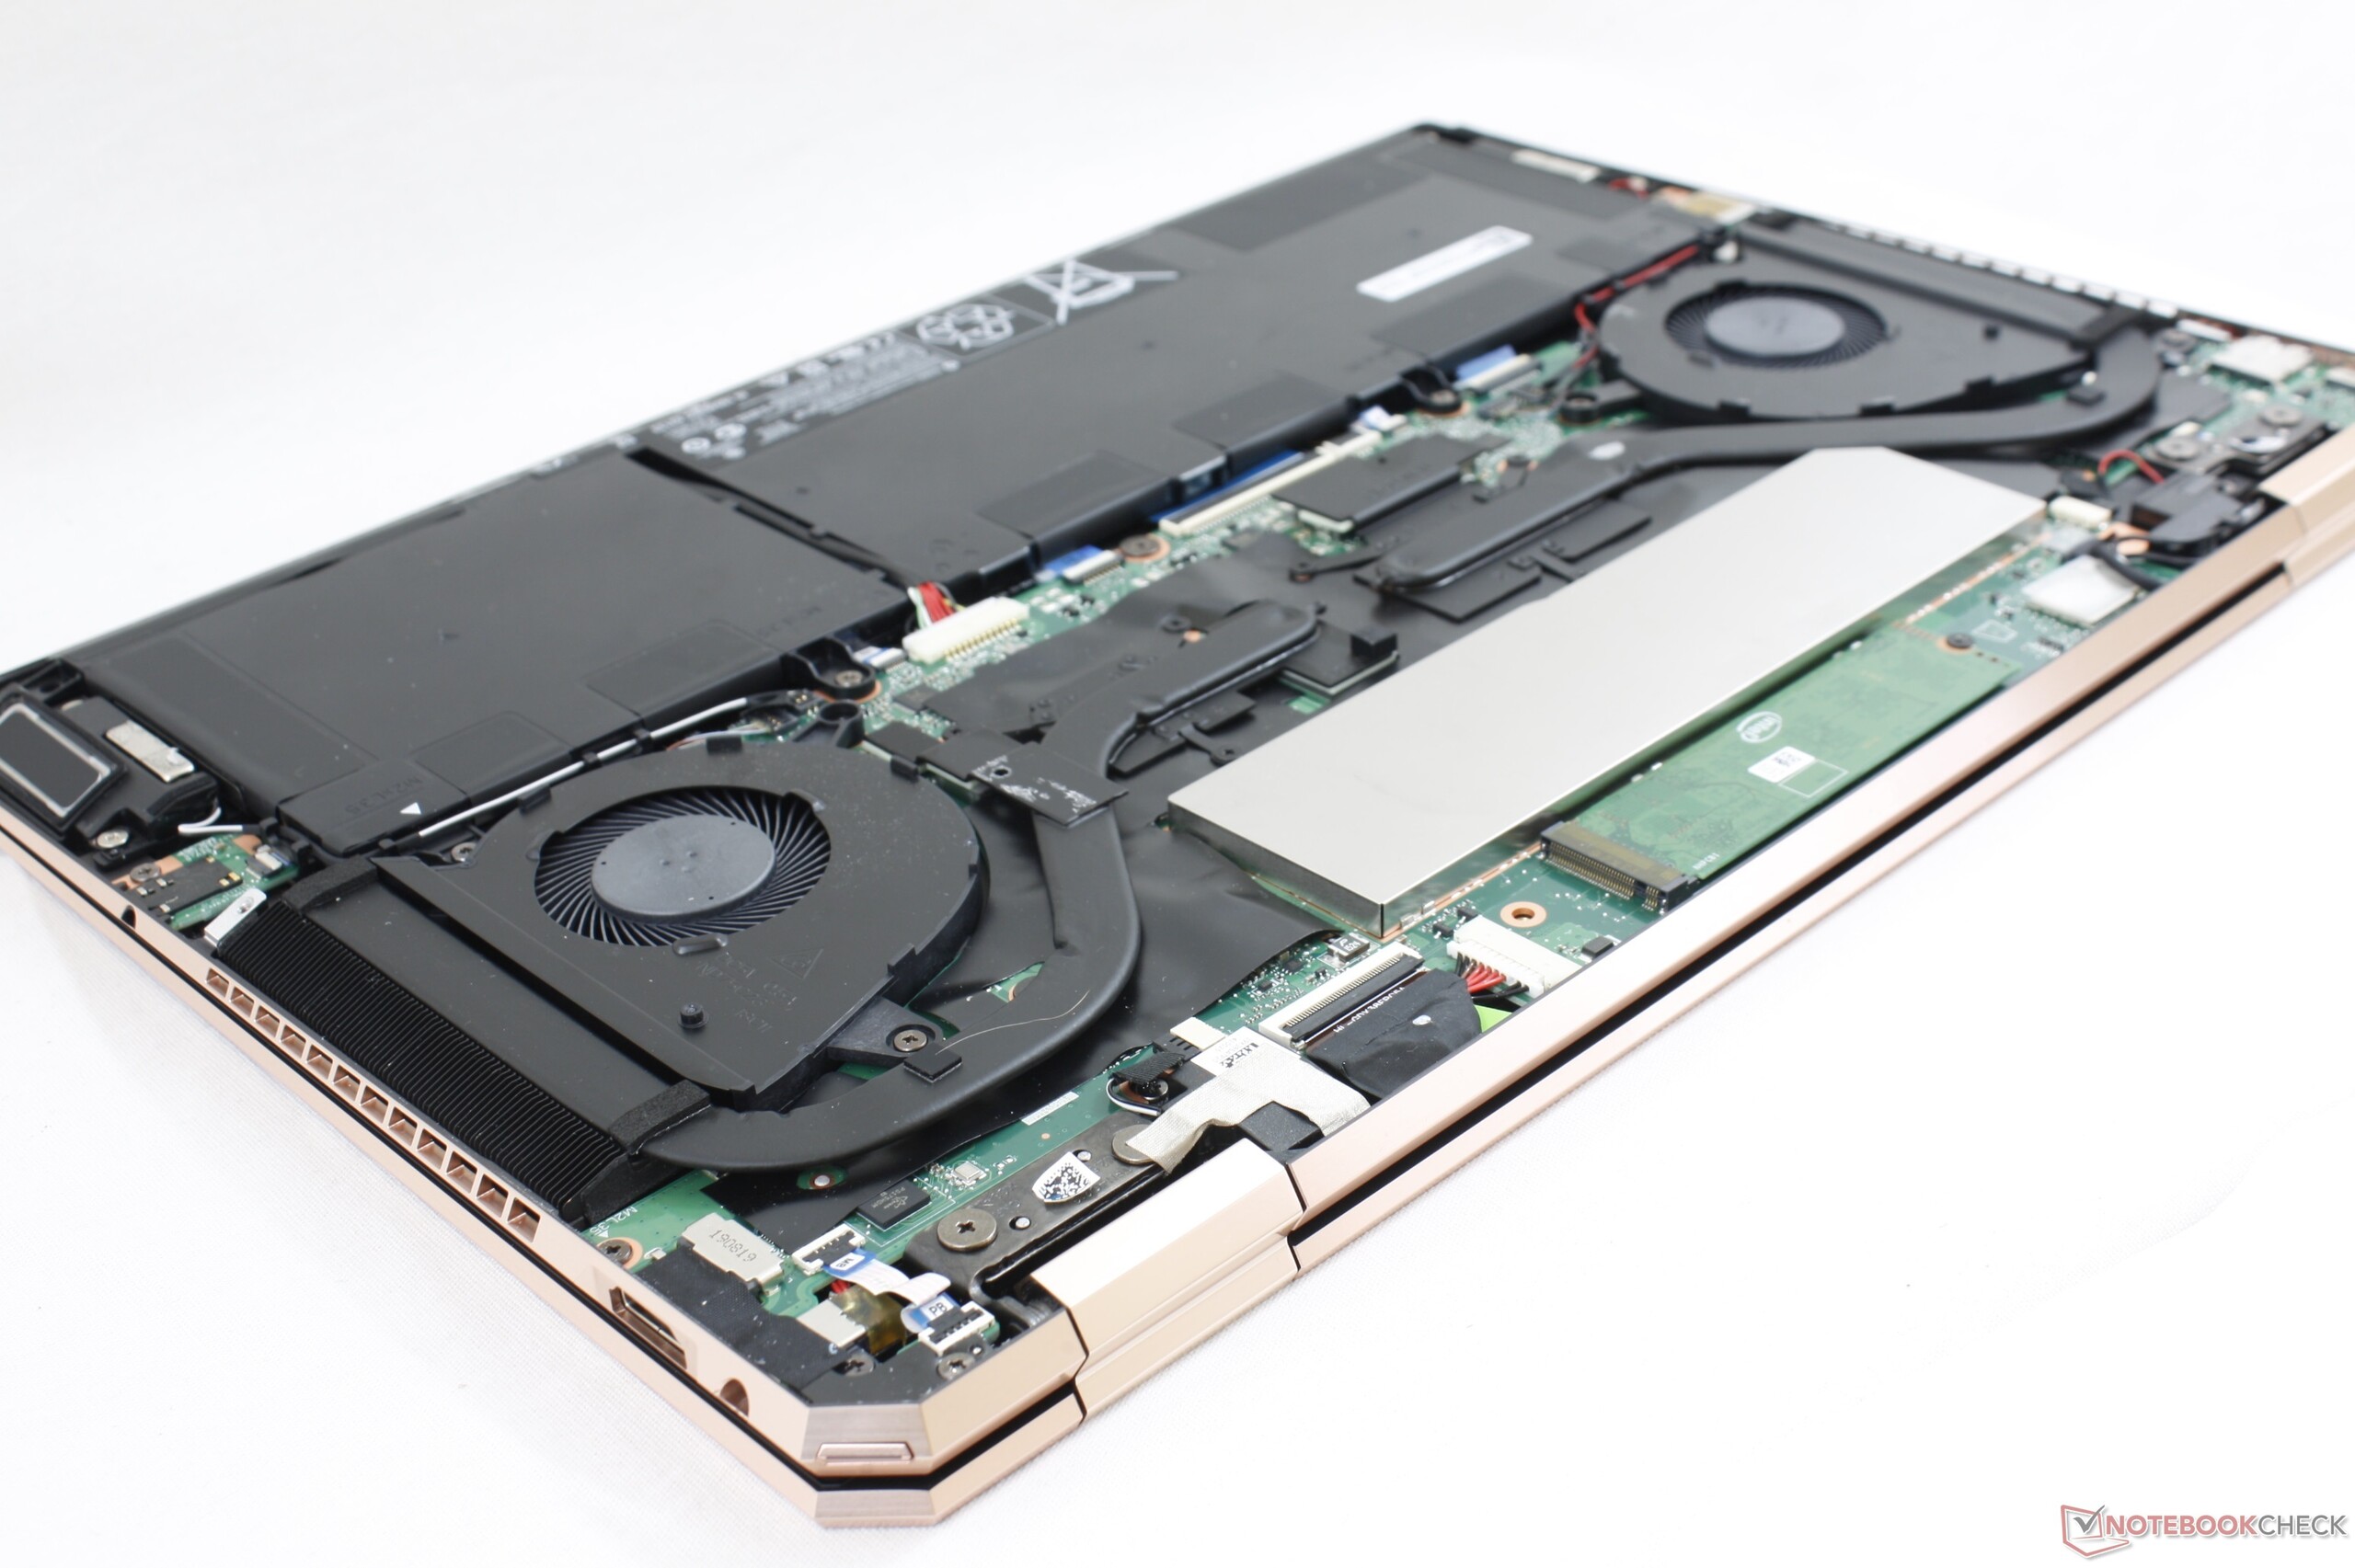
Em nossa análise dos modelos Ice Lake Spectre x360 13 e Kaby Lake-G Spectre x360 15, descobrimos velocidades, taxas de quadros e ruído do ventilador flutuantes quando sob uso intenso para uma experiência de jogos com engasgos. Este SpectreComet Lake-U Spectre x360 15 exibe características similares dado que suas velocidades, taxas de quadros, e ruído do ventilador também flutuariam durante os jogos. Os usuários avançados que procuram mais desempenho consistente de seus portáteis podem querer evitar esta configuração do Spectre como resultado.
Além disso, o Comet Lake-U Core i7-10510U e a GeForce MX250 são apenas um pouco melhores que a última geração Whiskey Lake-U Core i7-8565U e GeForce MX150 pela menor margem em termos de desempenho bruto. Combine isso com o fato de que o modelo Comet Lake-U 2019 compartilha o mesmo teclado, tela, duração da bateria e chassi que o modelo Whiskey Lake-U mais barato e você possui um sistema que não vale a pena atualizar se você já possui um Spectre. Outras pessoas considerando o conversível HP, estariam melhor com o modelo Whiskey Lake-U por seu desempenho por dólar superior.
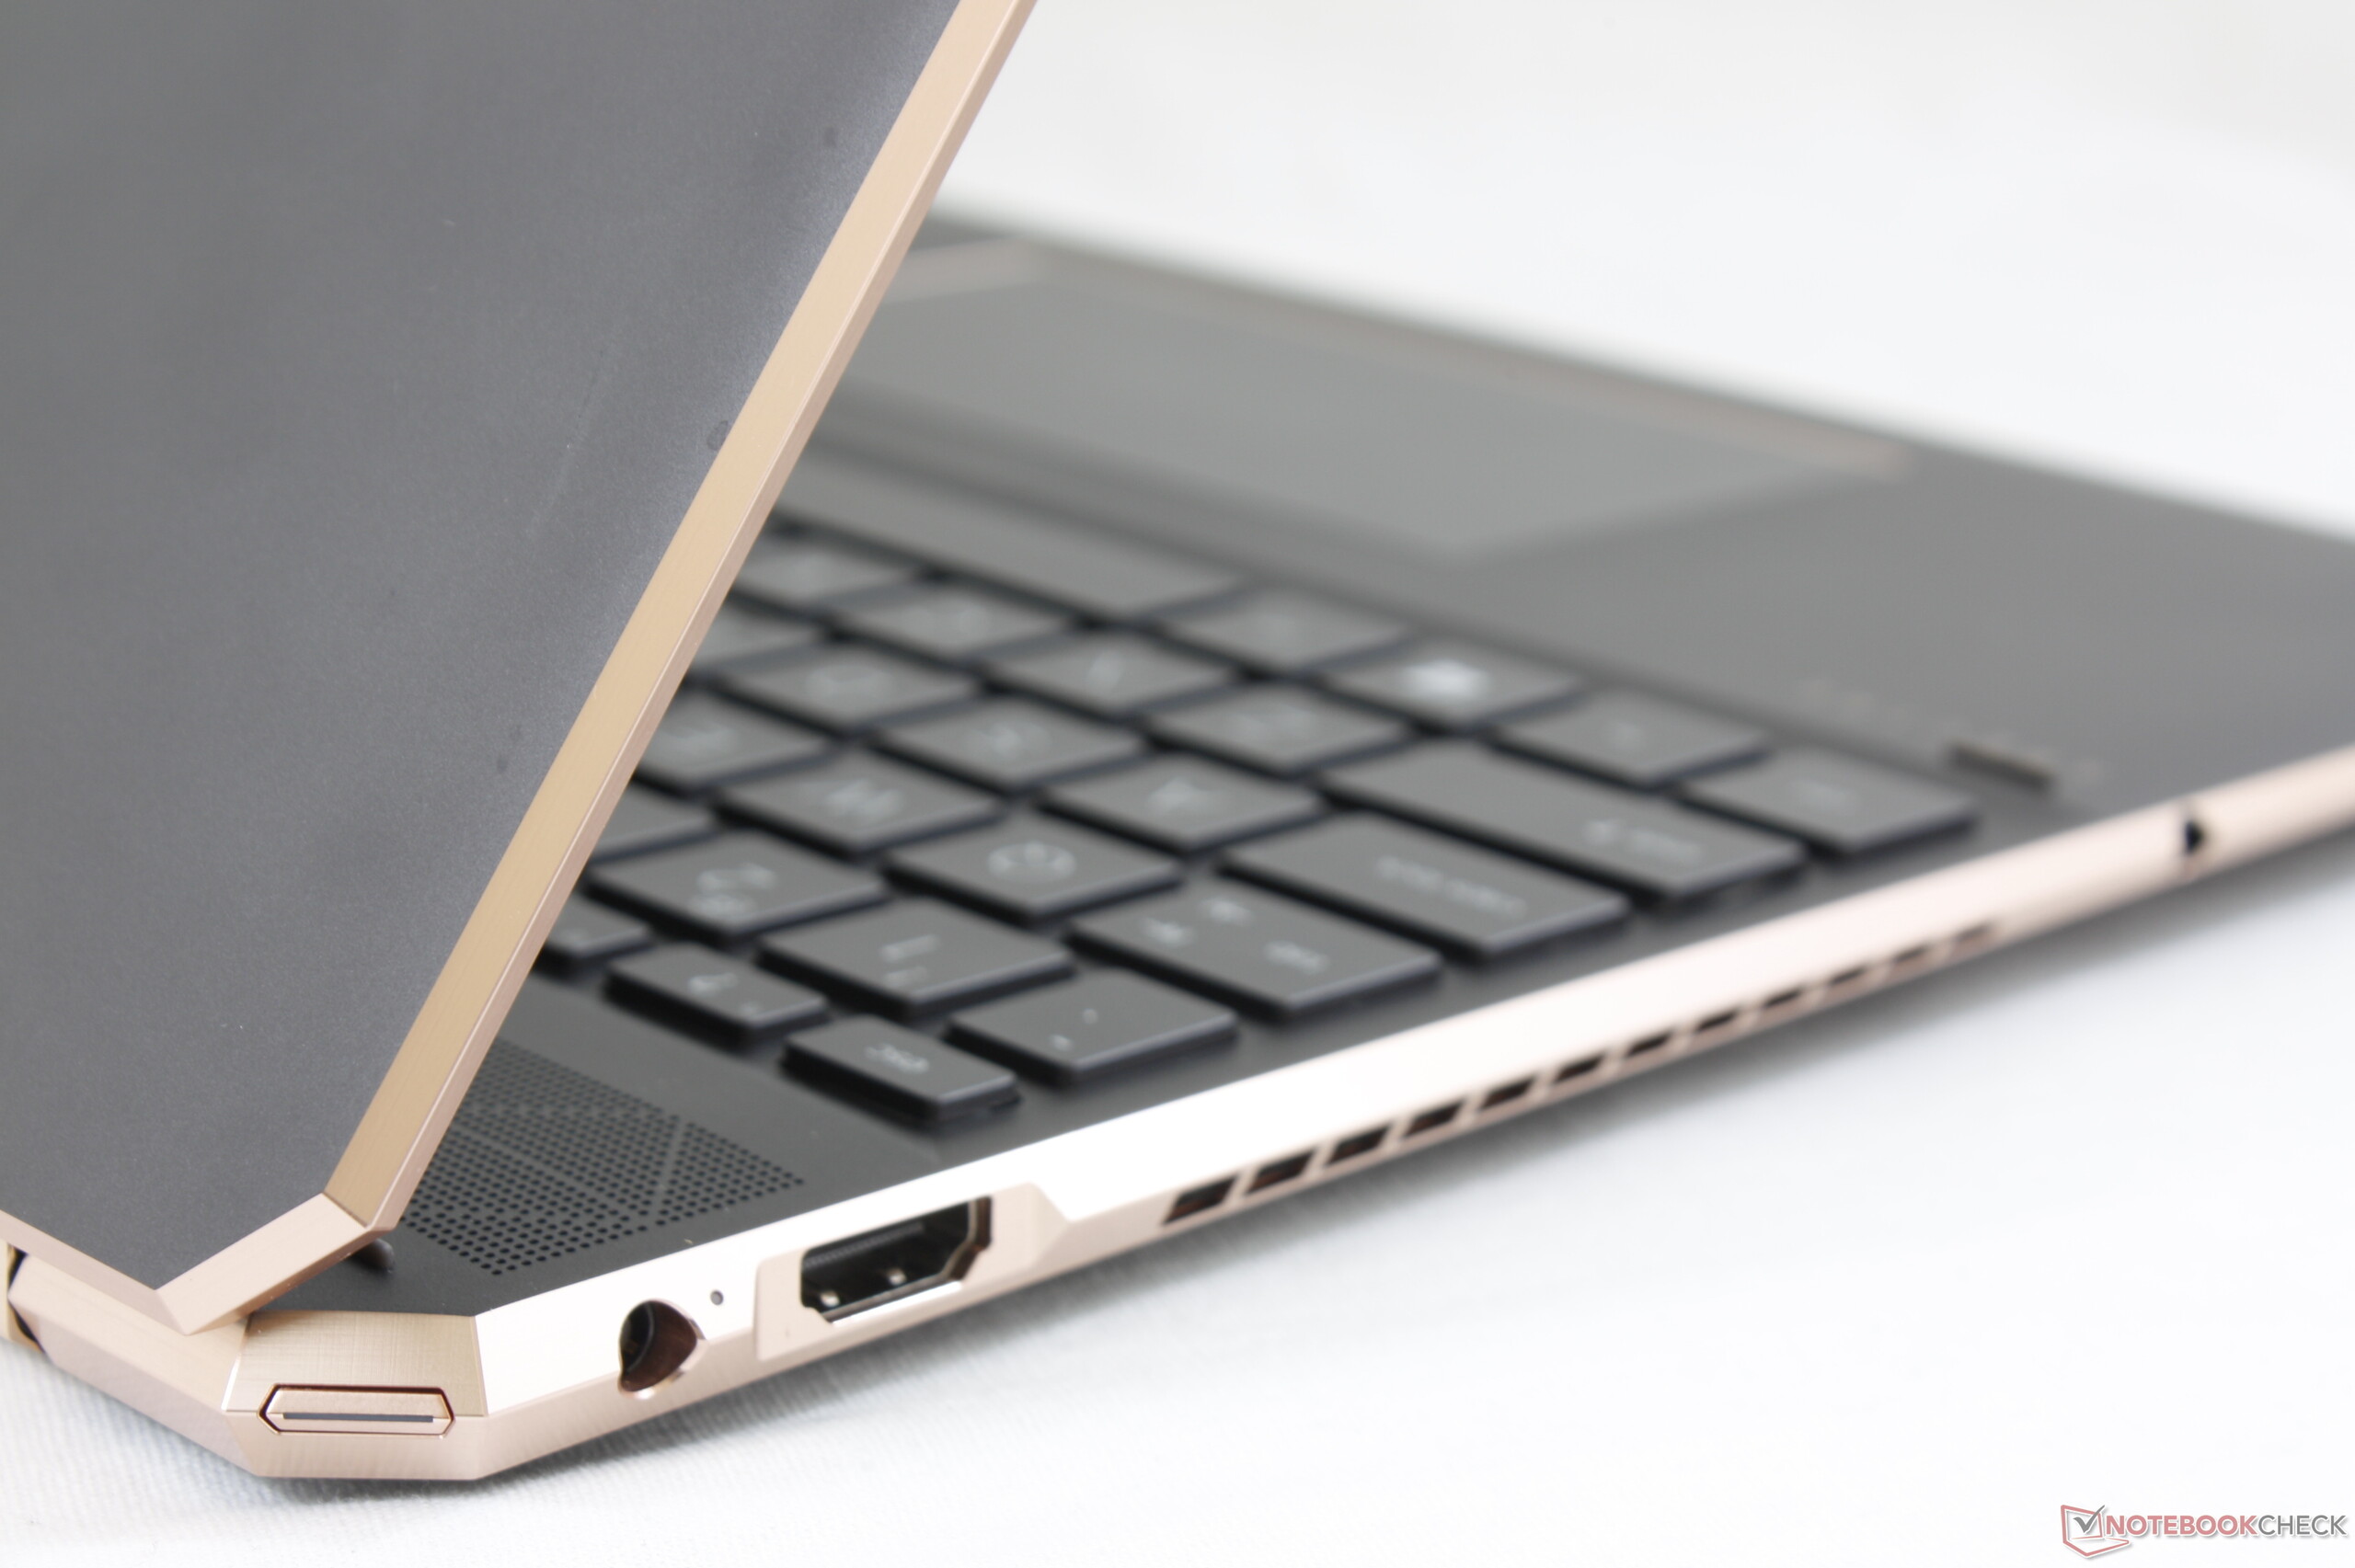
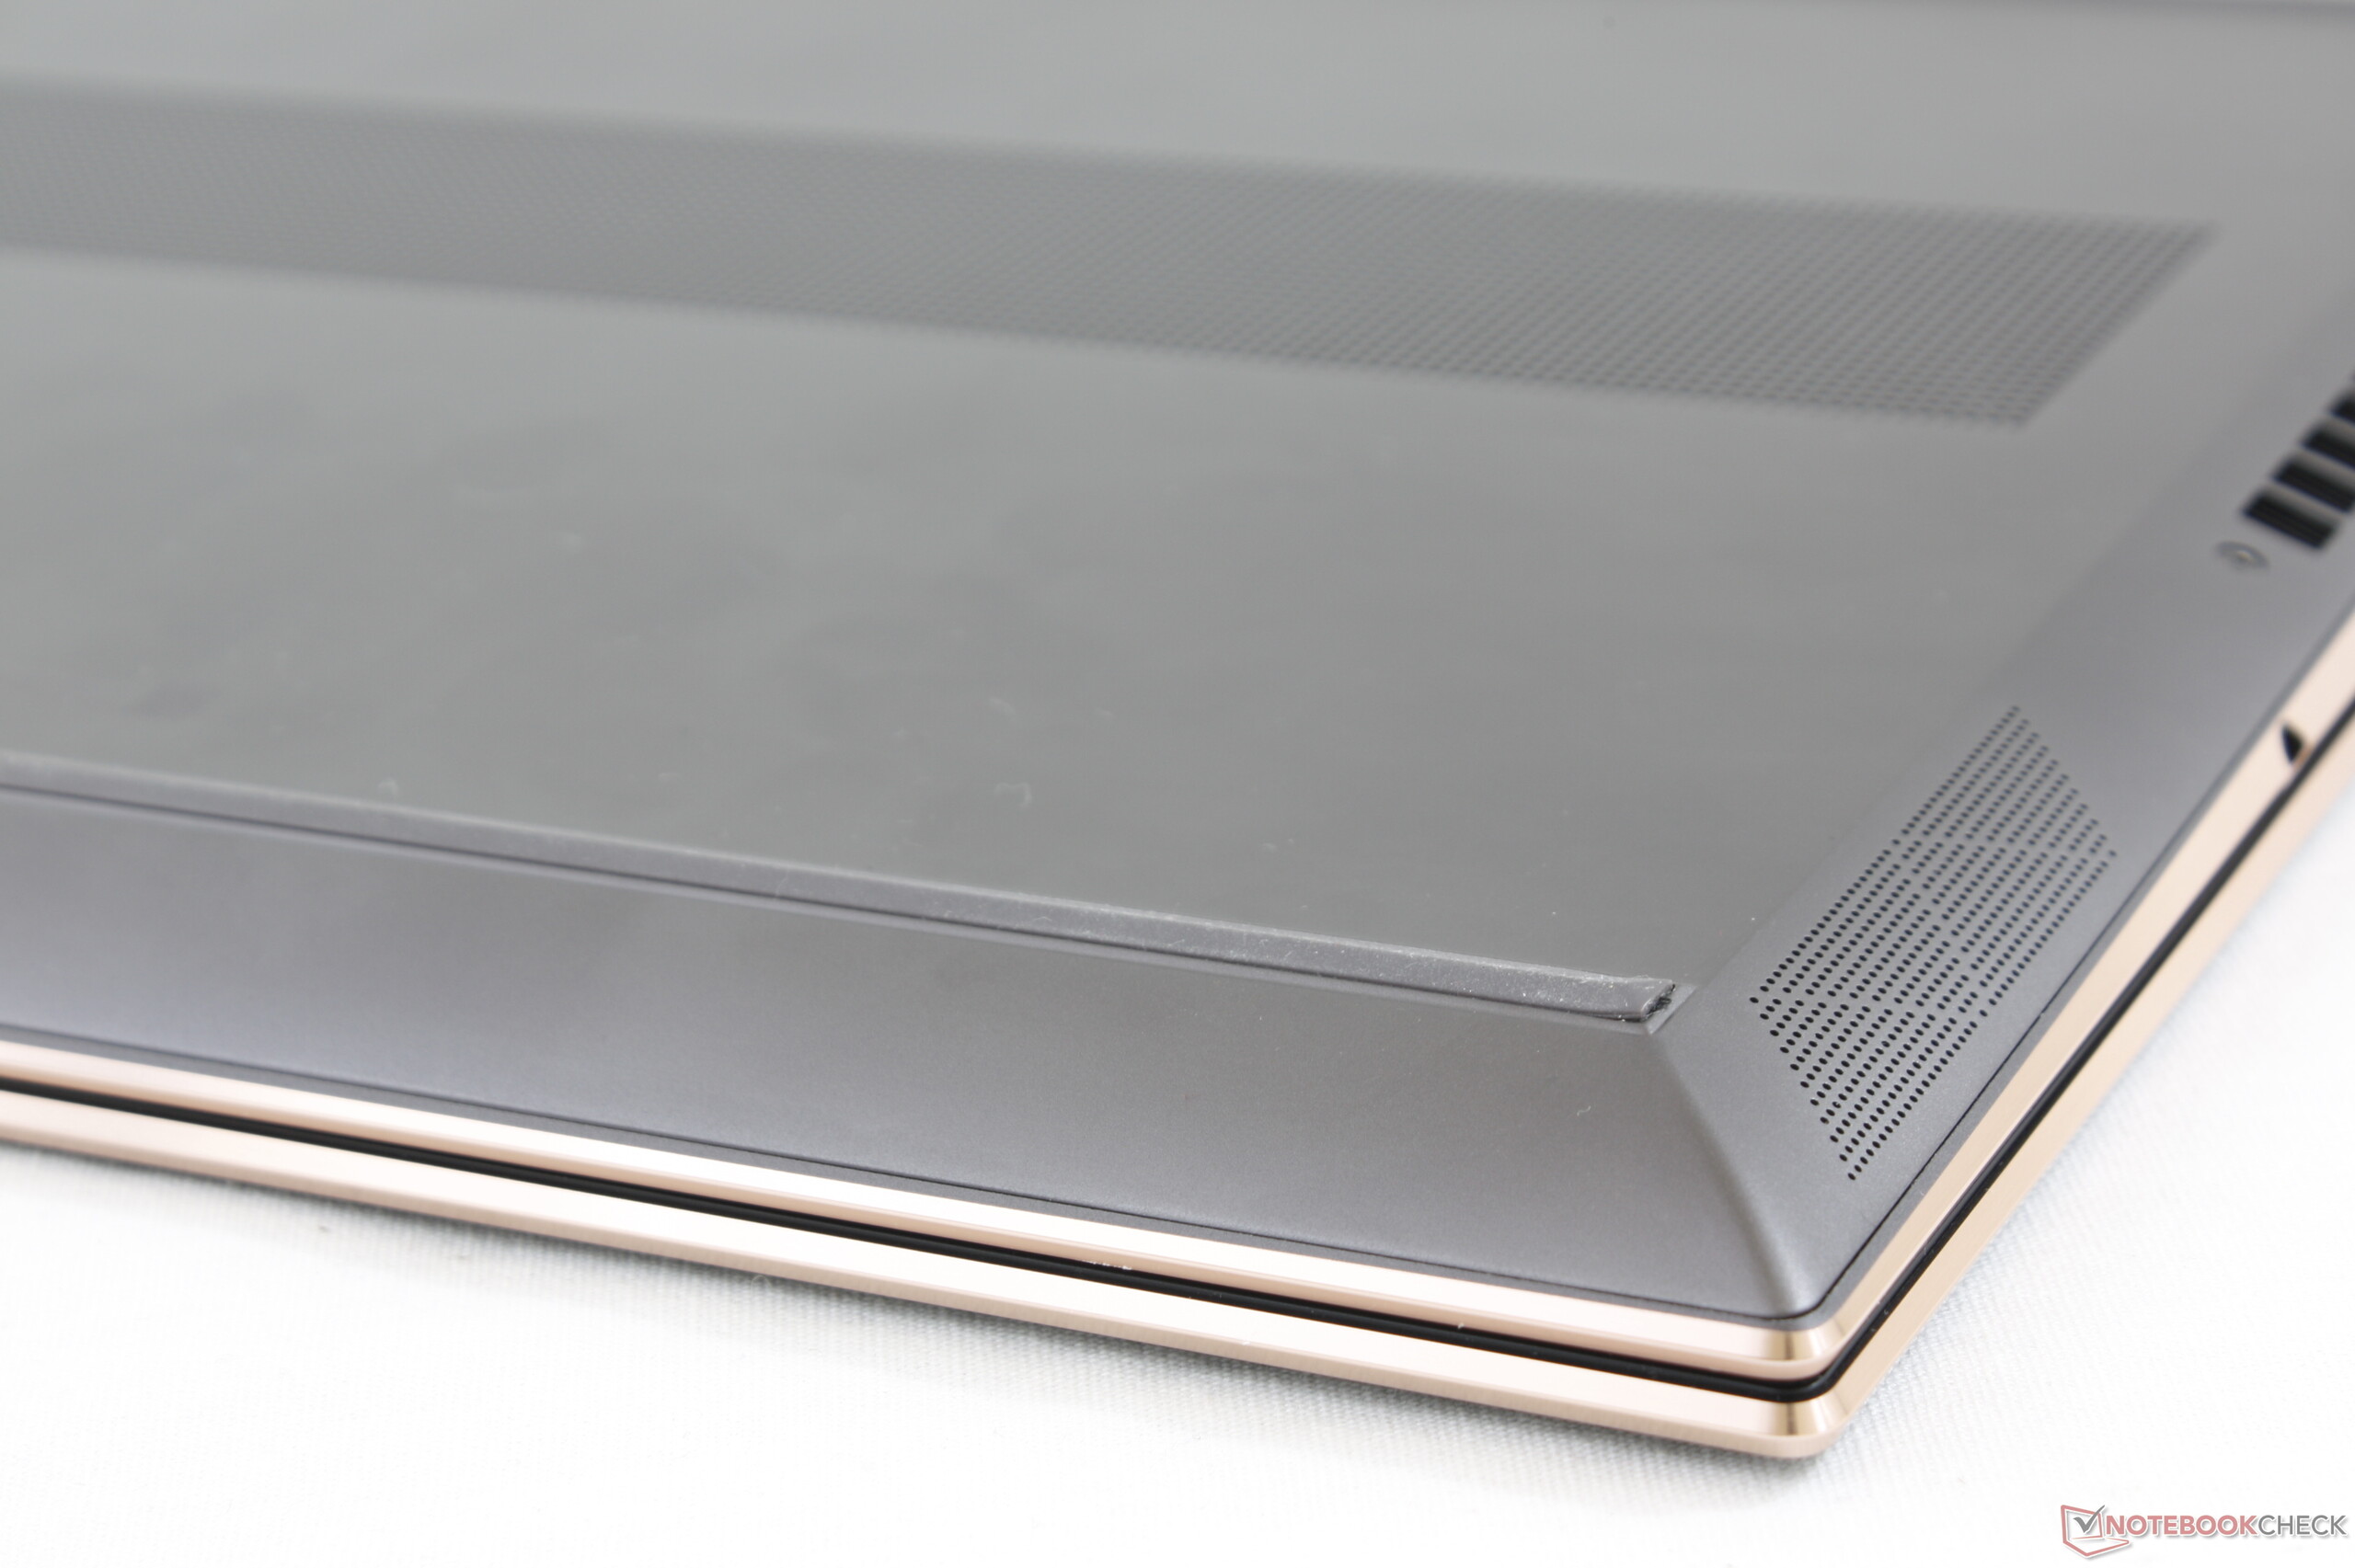
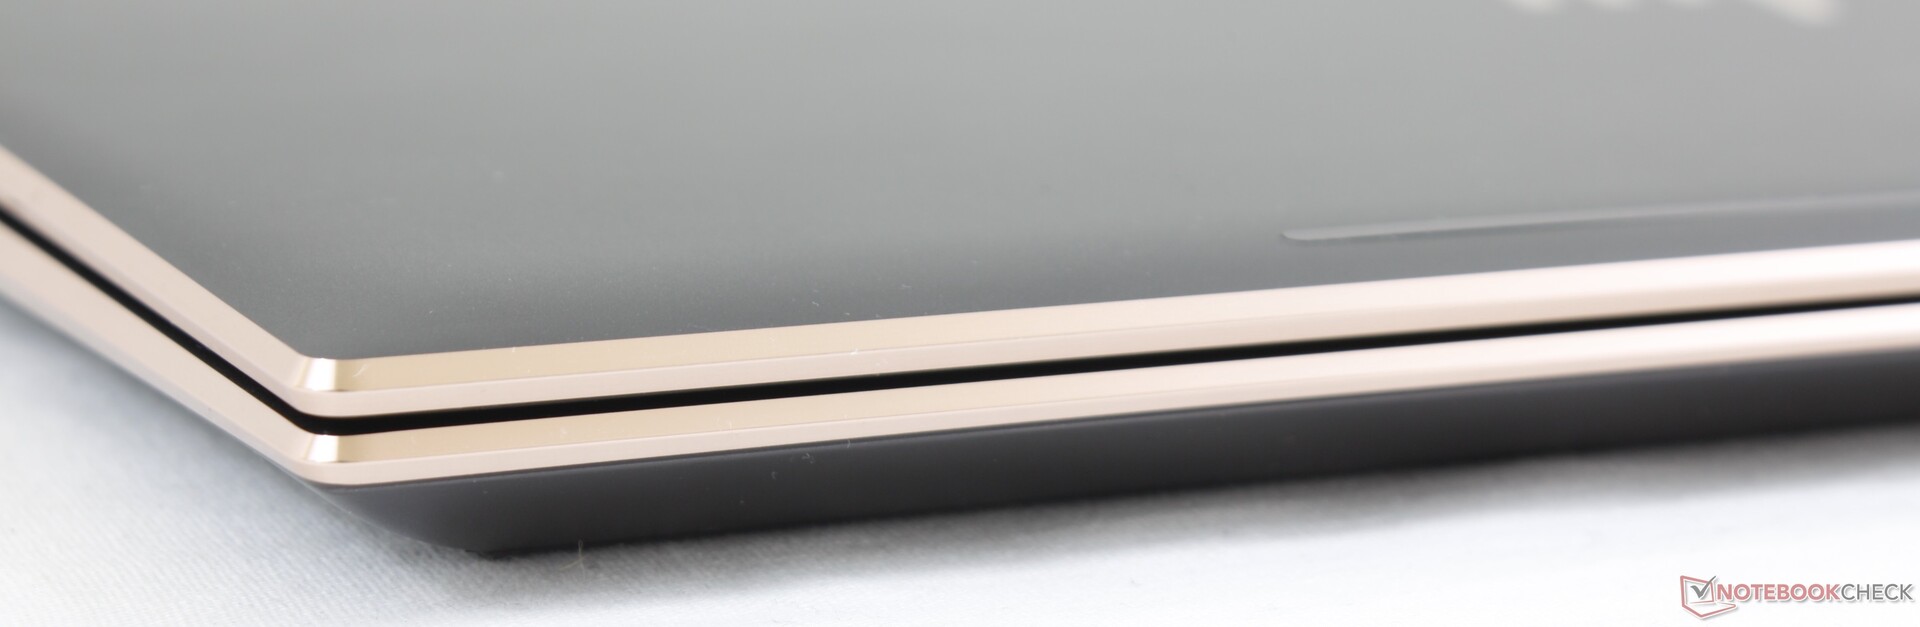
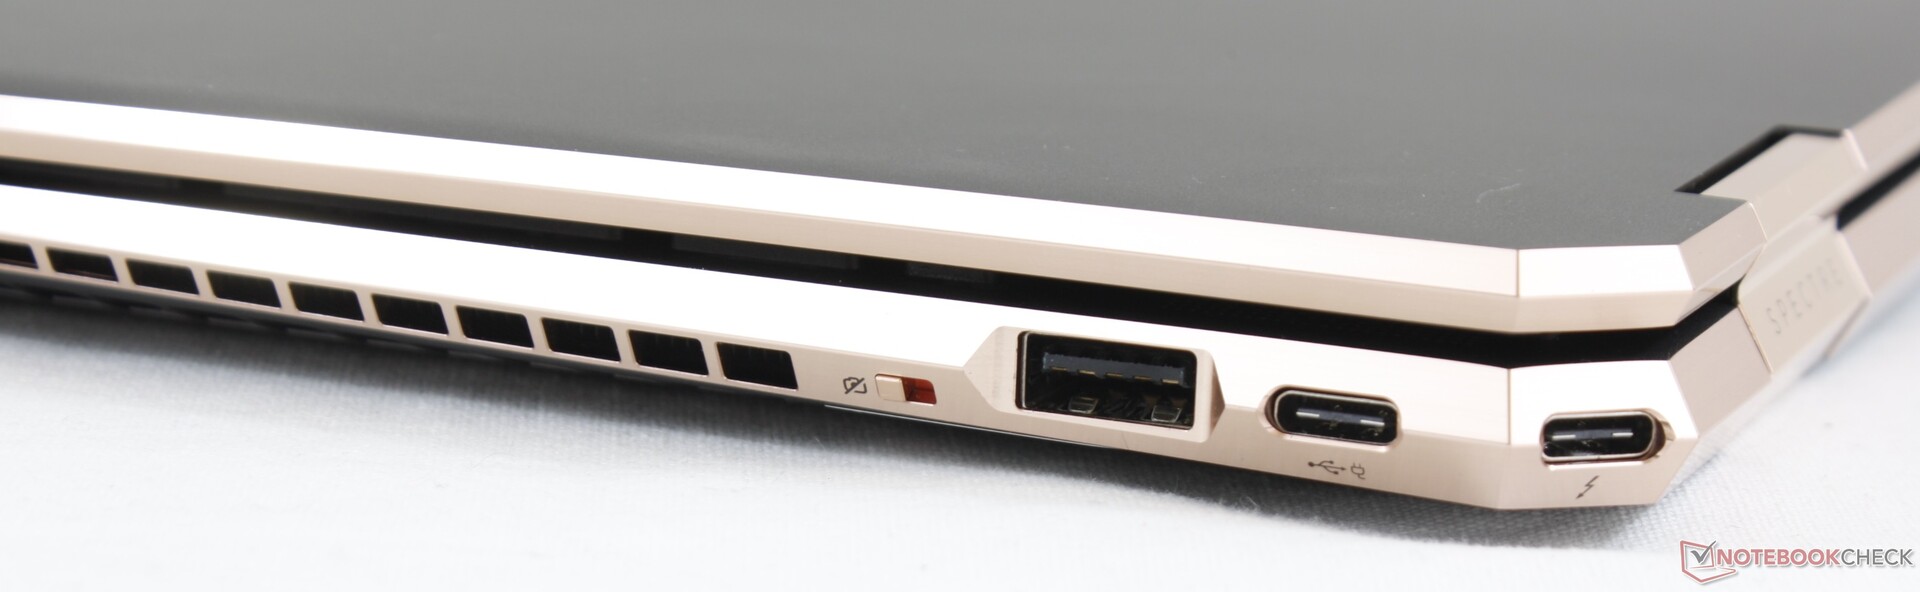
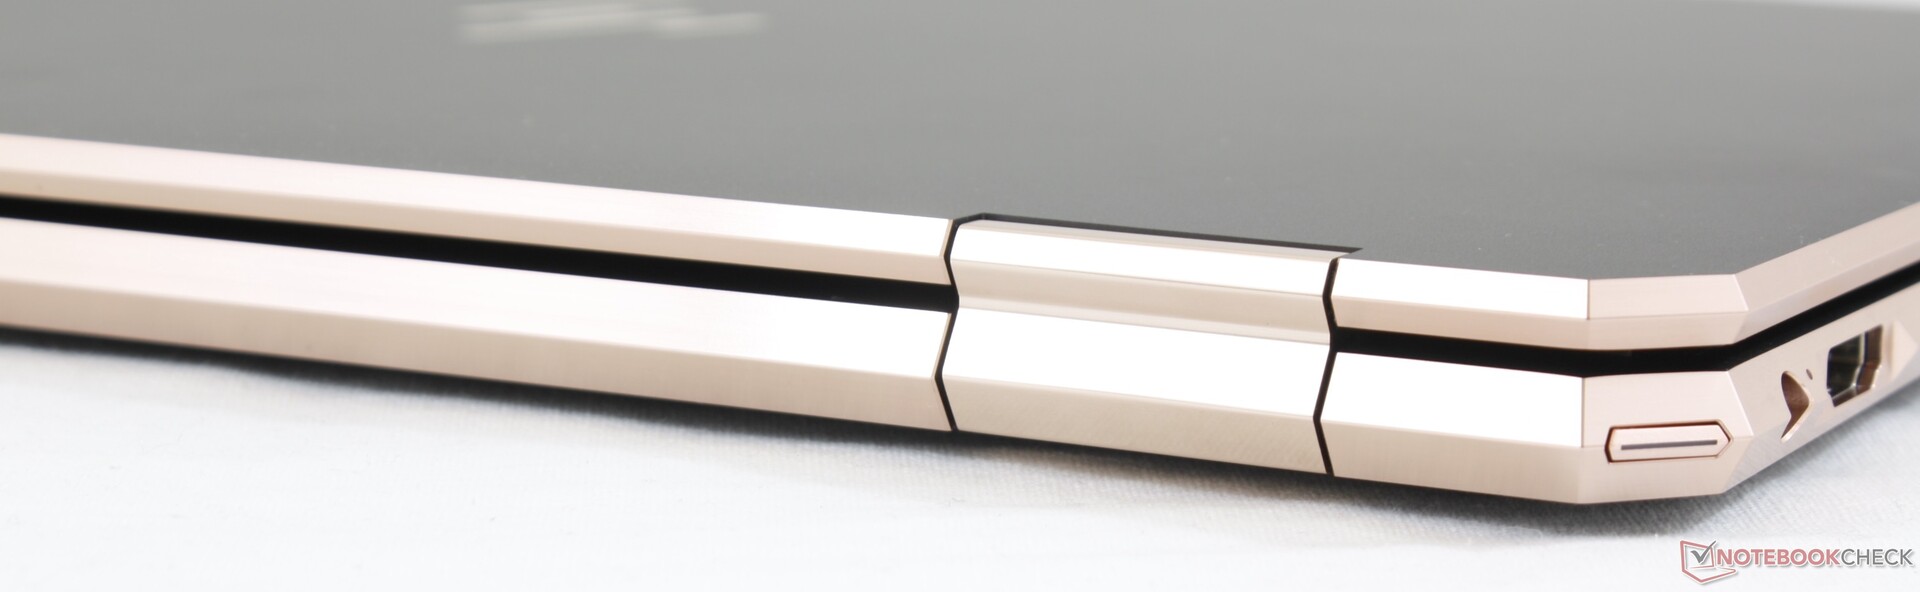
Além das desvantagens de desempenho mencionadas acima, o chassi Spectre x360 15 é excelente e continua sendo um dos conversíveis mais resistentes de 15,6 polegadas no mercado. A duração da bateria e o ruído do ventilador são relativamente longos e silenciosos, respectivamente, para tarefas de escritório pouco exigentes.
Os usuários dispostos a esperar alguns meses devem considerar o 2020 Spectre x360 15 que trará atualizações mais significantes para a série incluindo marcos mais estreitos e CPUs hexa-core e GPUs GTX 1650 Max-Q Turing mais poderosas.
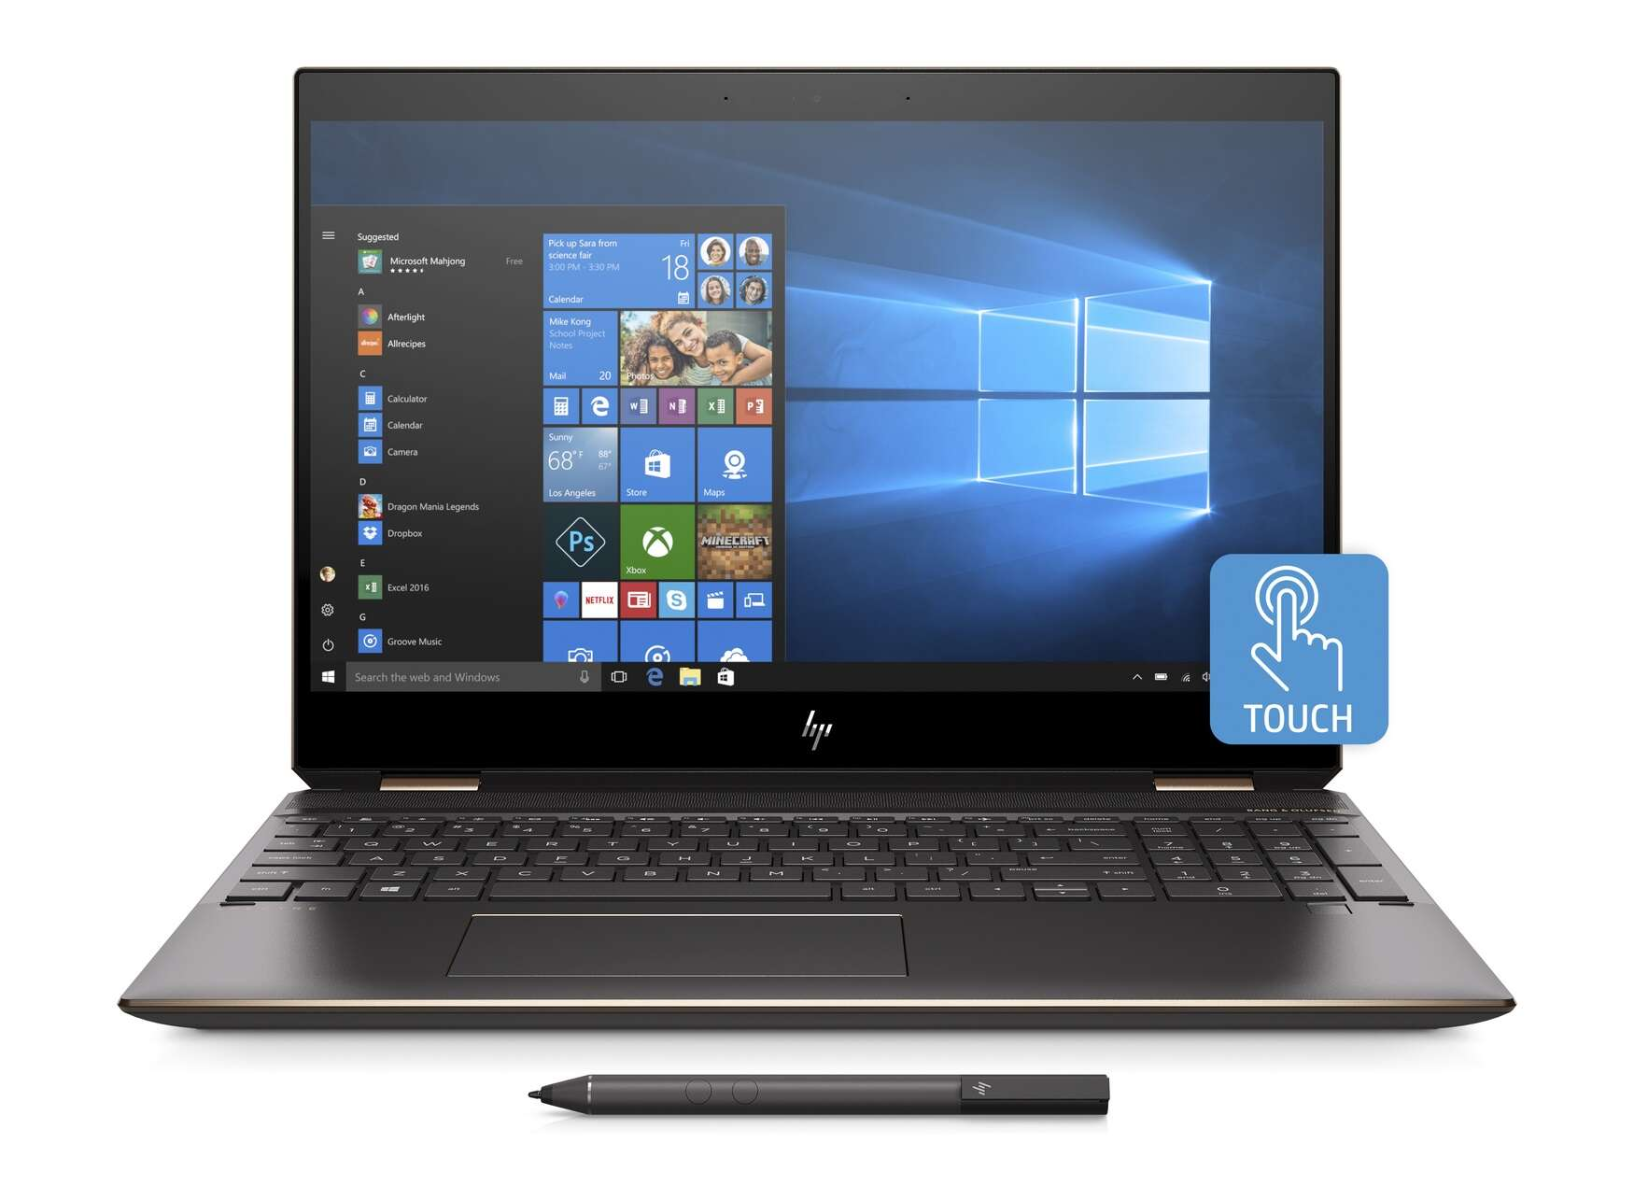
HP Spectre X360 15-5ZV31AV
- 01/16/2020 v7 (old)
Allen Ngo
Price comparison
