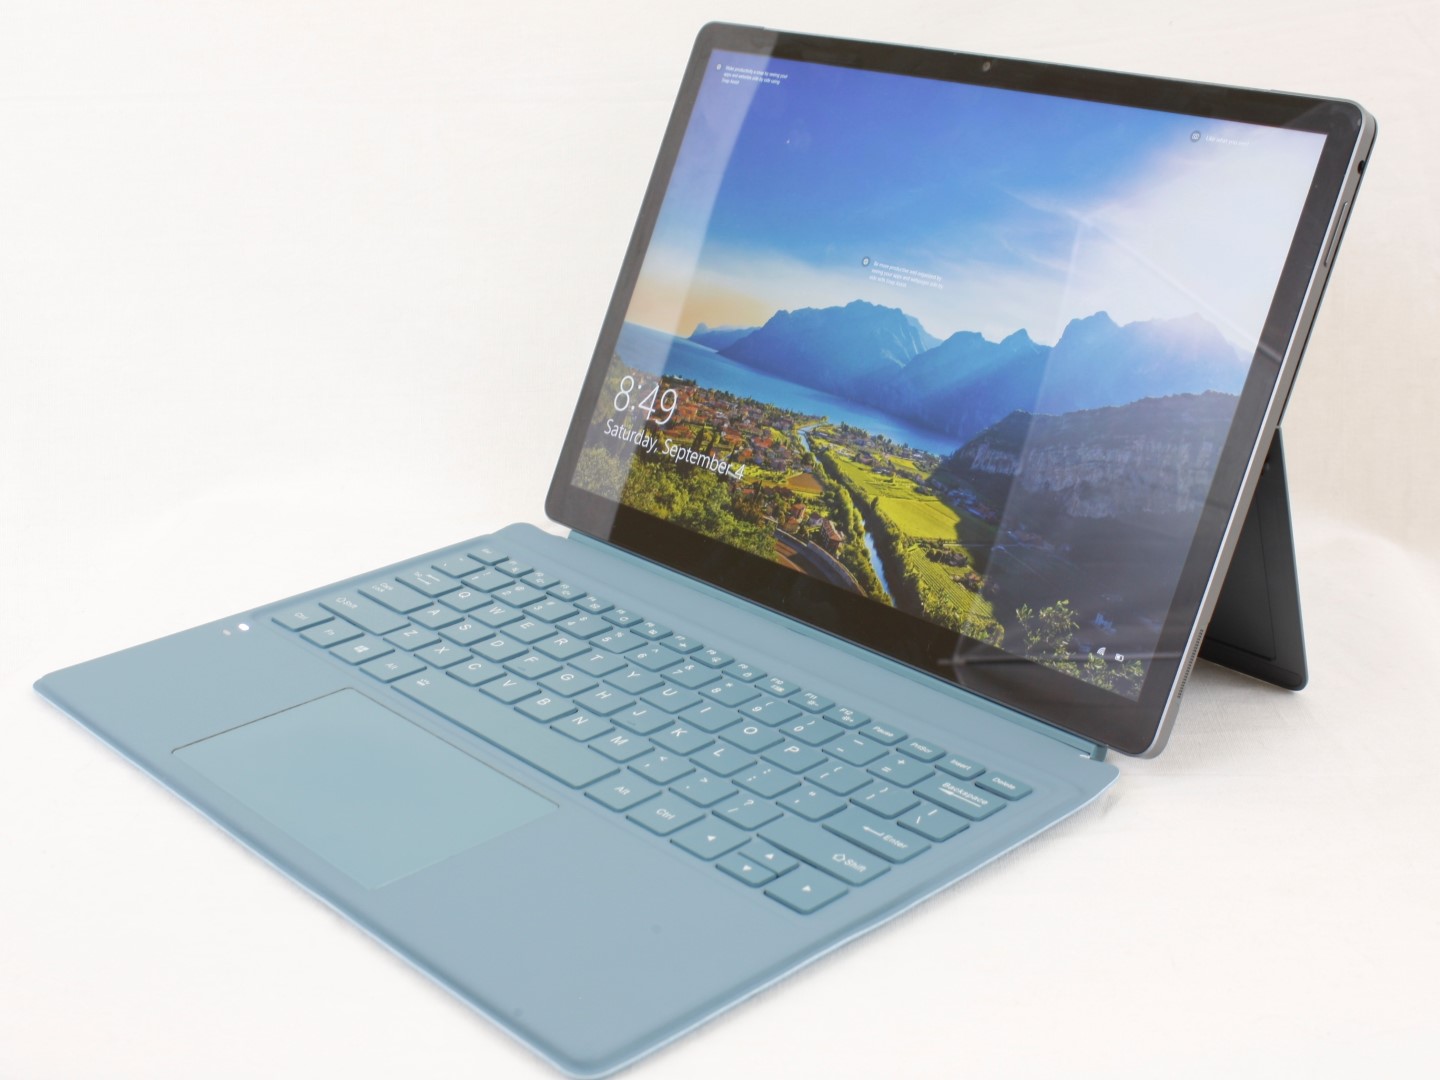
KUU LeBook 12.6 Revisão 2 em 1 conversível: Uma alternativa mais barata ao Microsoft Surface Pro
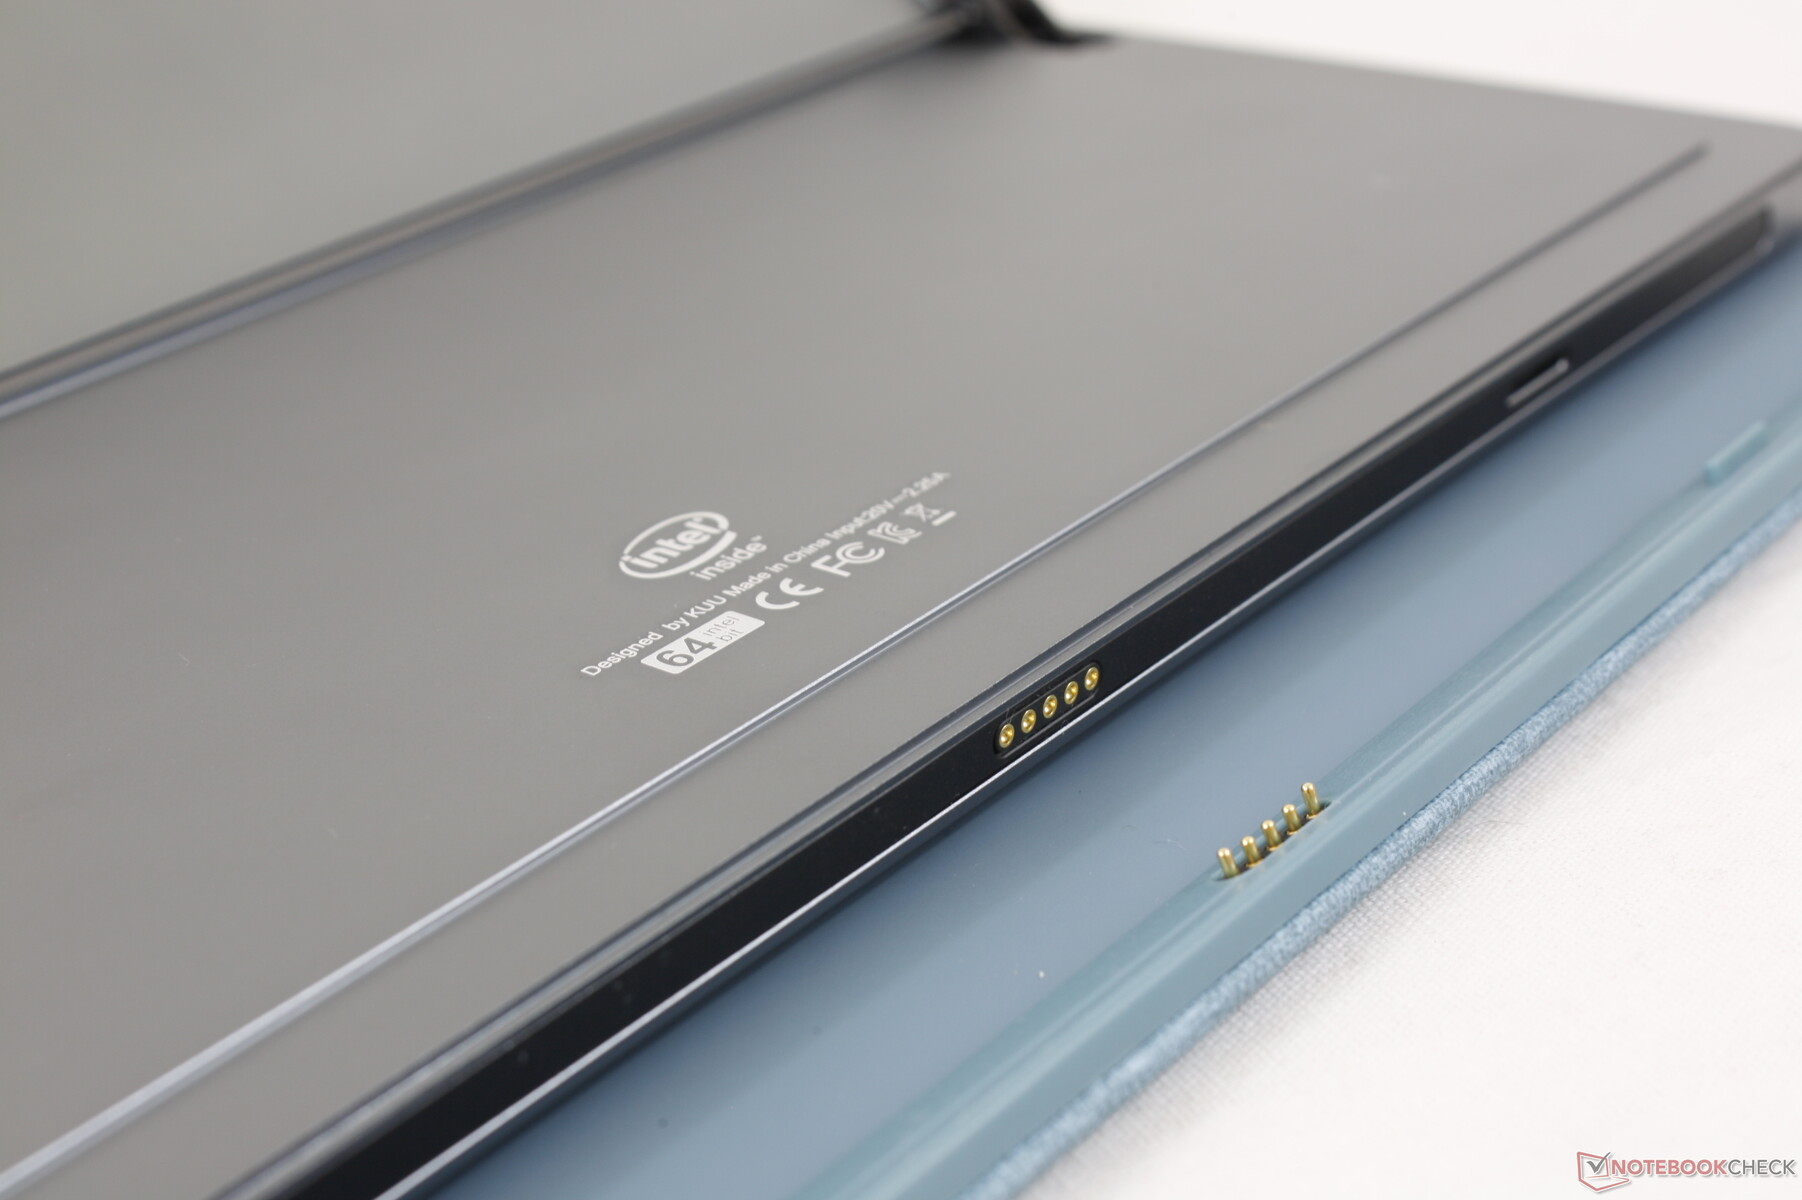
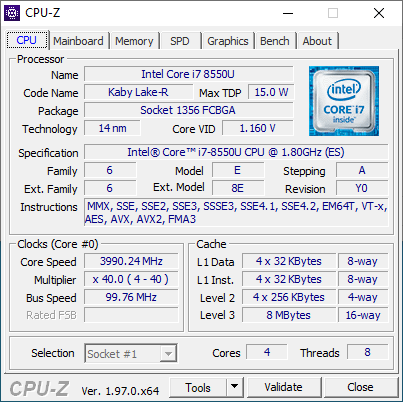
O KUU LeBook 12.6 é um Windows 10 destacável na mesma veia que a série Surface Pro. Seu design e características são claramente inspirados pelos tablets bem sucedidos da Microsoft com certas mudanças e cantos cortados a fim de manter os preços significativamente mais baixos. Uma destas mudanças é o uso de uma CPU Intel CPU Intel série U do 8º gênero Core em vez das últimas versões do 11º gênero atualmente encontradas na maioria dos PCs no mercado. Esta revisão irá explorar todas as outras diferenças que os usuários podem esperar se comprarem o LeBook mais barato em vez de um Surface Pro mais tradicional.
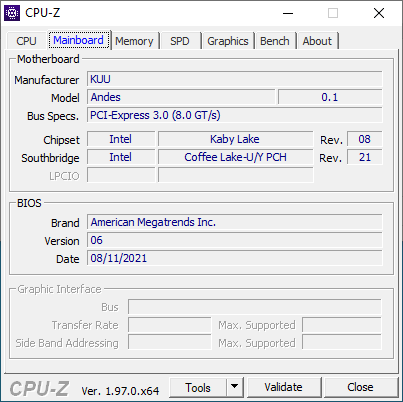
Os concorrentes do LeBook incluem outros tabletes do Windows 10 ou objetos destacados como o Superfície Microsoft, Lenovo ThinkPad X12ou Dell Latitude 12 7210 2 em 1 todos eles a varejo por preços mais altos. Entretanto, o LeBook é único com sua tela ligeiramente maior de 3:2 de 12,6 polegadas em vez das habituais telas de 12,3 ou 12,5 polegadas. O fabricante ainda não finalizou o preço do LeBook, pois ele ainda não está amplamente disponível no momento da publicação
potential competitors in comparison
Avaliação | Data | Modelo | Peso | Altura | Size | Resolução | Preço |
|---|---|---|---|---|---|---|---|
| 75.3 % v7 (old) | 09/2021 | Kuu LeBook 12.6 Core i7-8550U i5-8550U, UHD Graphics 620 | 859 g | 9.5 mm | 12.60" | 2160x1440 | |
| 88.5 % v7 (old) | 04/2021 | Lenovo ThinkPad X12 20UVS03G00 i7-1160G7, Iris Xe G7 96EUs | 1.1 kg | 14.5 mm | 12.30" | 1920x1280 | |
| 88.5 % v7 (old) | 03/2021 | Microsoft Surface Pro 7 Plus i5-1135G7, Iris Xe G7 80EUs | 796 g | 8.5 mm | 12.30" | 2736x1824 | |
| 89.5 % v7 (old) | 03/2021 | Dell Latitude 12 7210 2-in-1 i7-10610U, UHD Graphics 620 | 850 g | 9.35 mm | 12.30" | 1920x1280 | |
| 84.6 % v7 (old) | 10/2020 | Microsoft Surface Laptop Go Core i5 i5-1035G1, UHD Graphics G1 (Ice Lake 32 EU) | 1.1 kg | 15.69 mm | 12.40" | 1536x1024 | |
| 77.1 % v6 (old) | 01/2019 | NuVision Encite Book 12 Plus Celeron N3350, HD Graphics 500 | 1 kg | 15 mm | 12.50" | 2560x1440 |
Caso
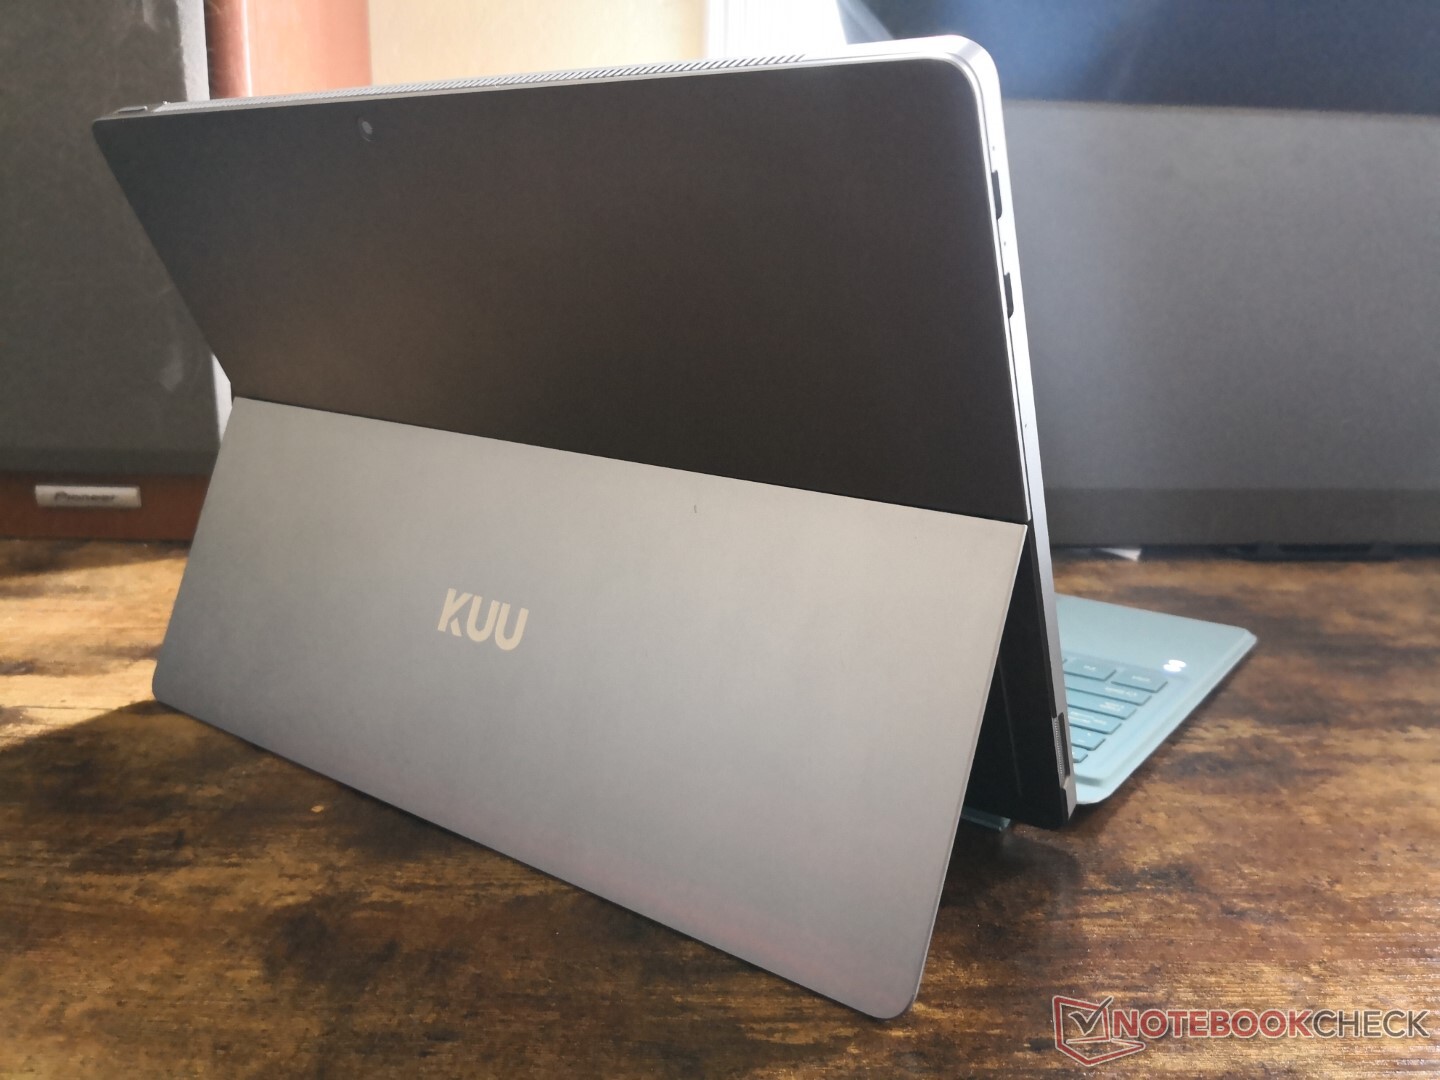
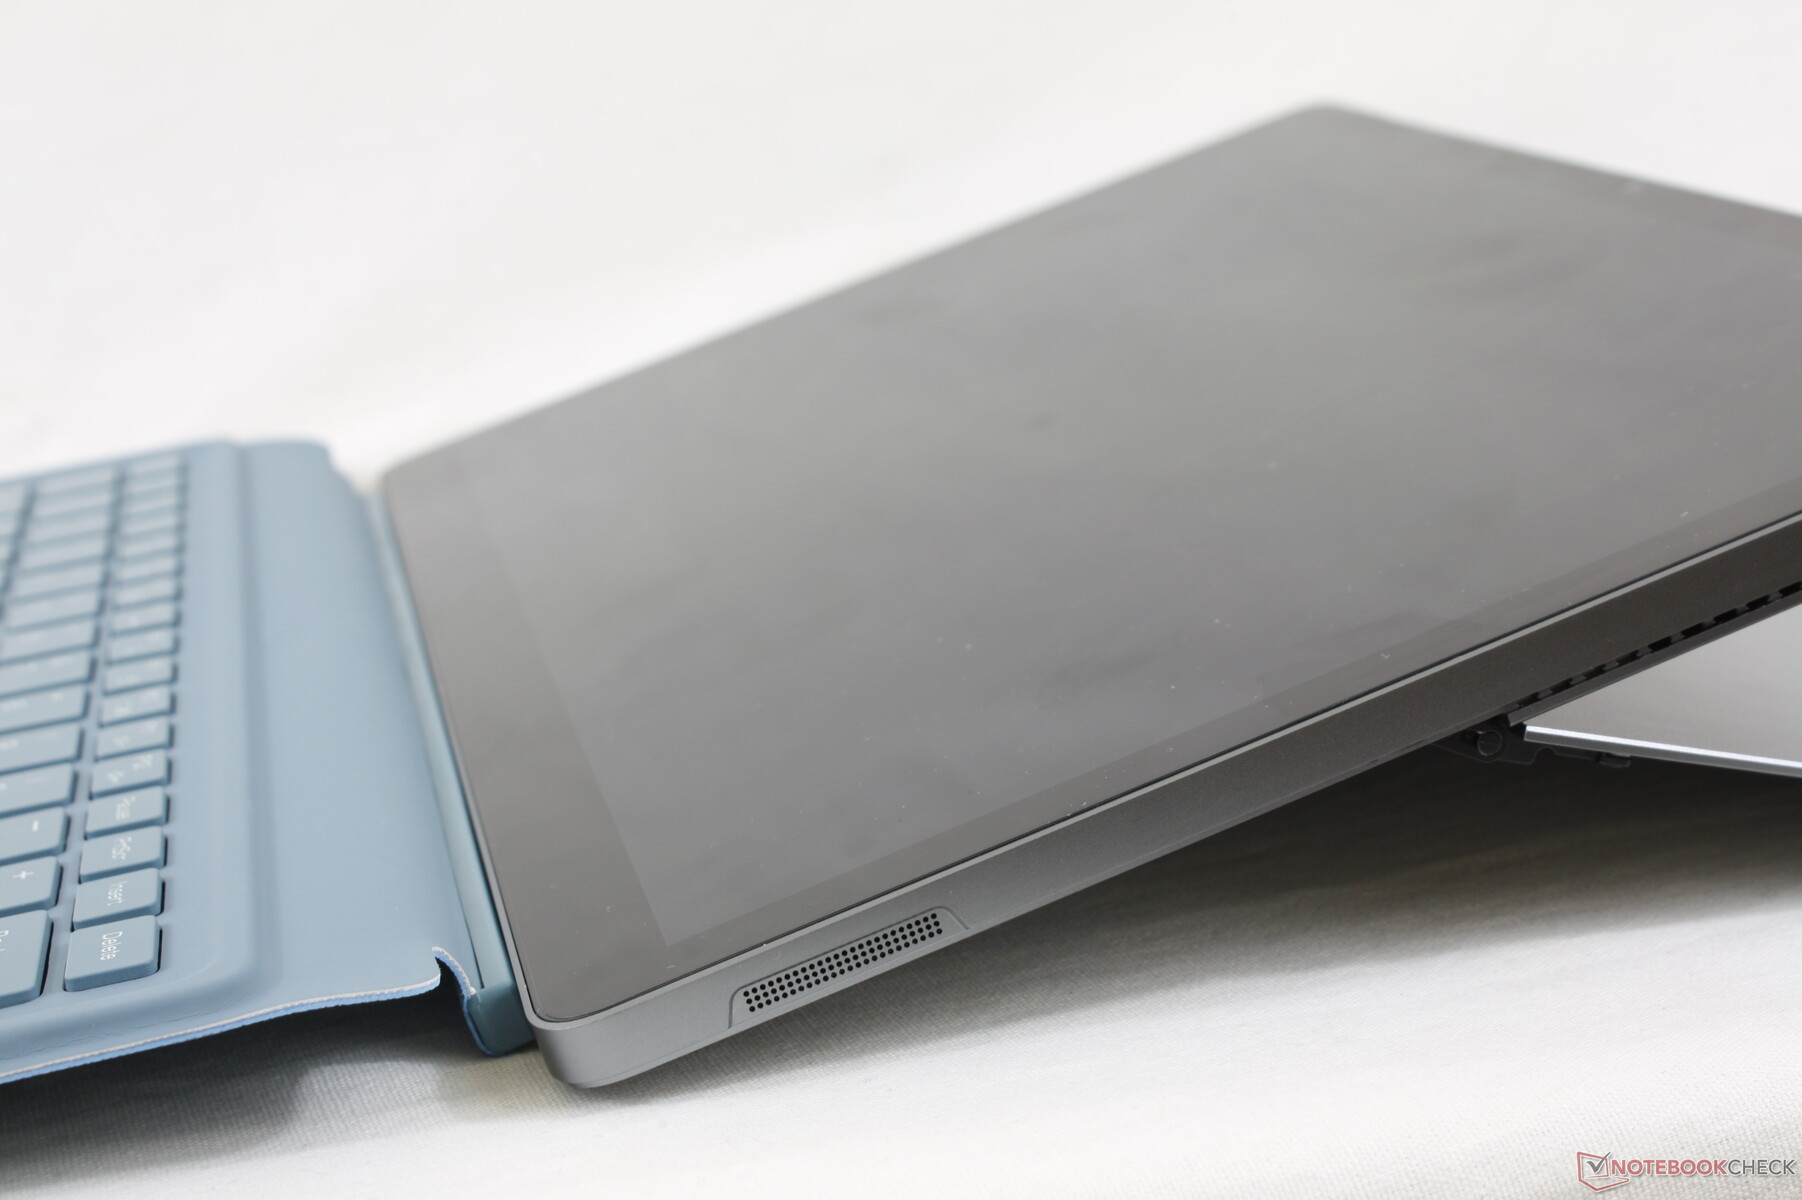
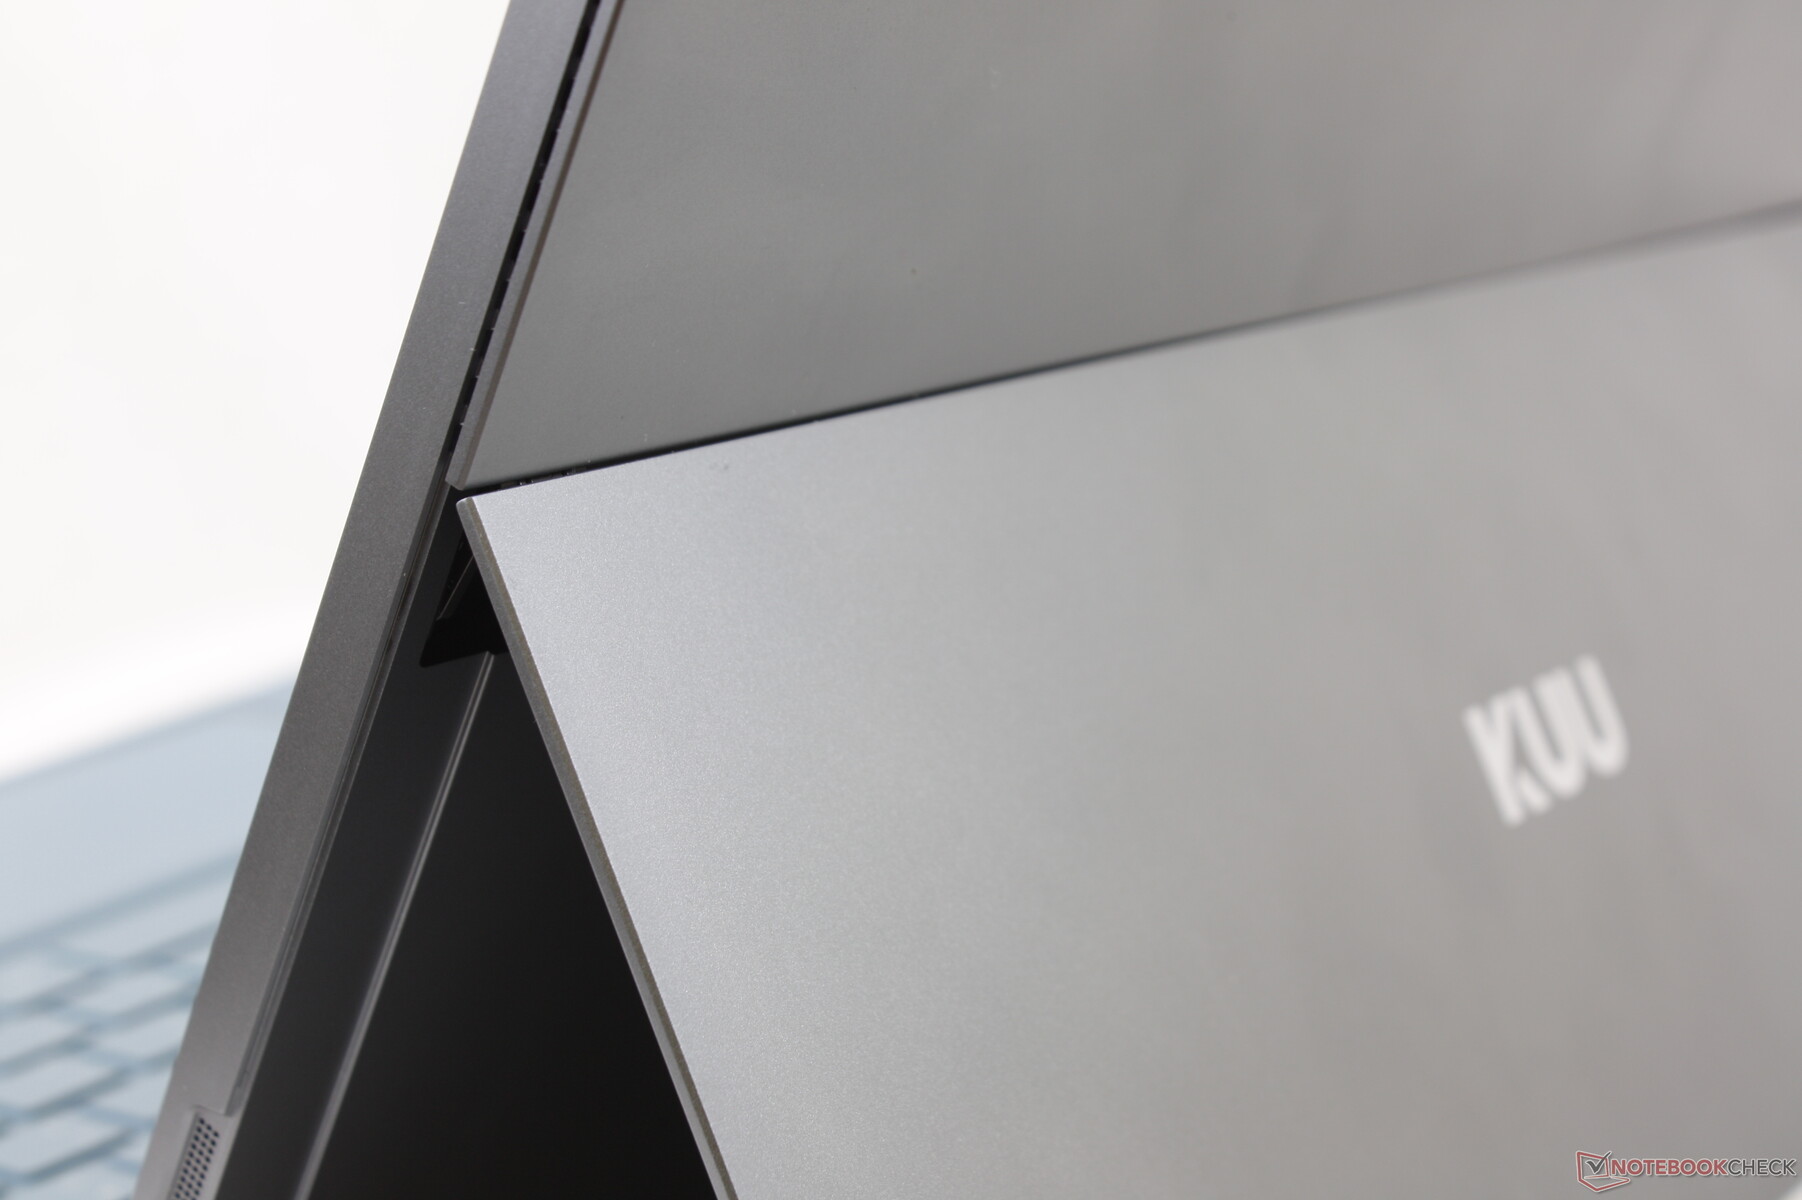
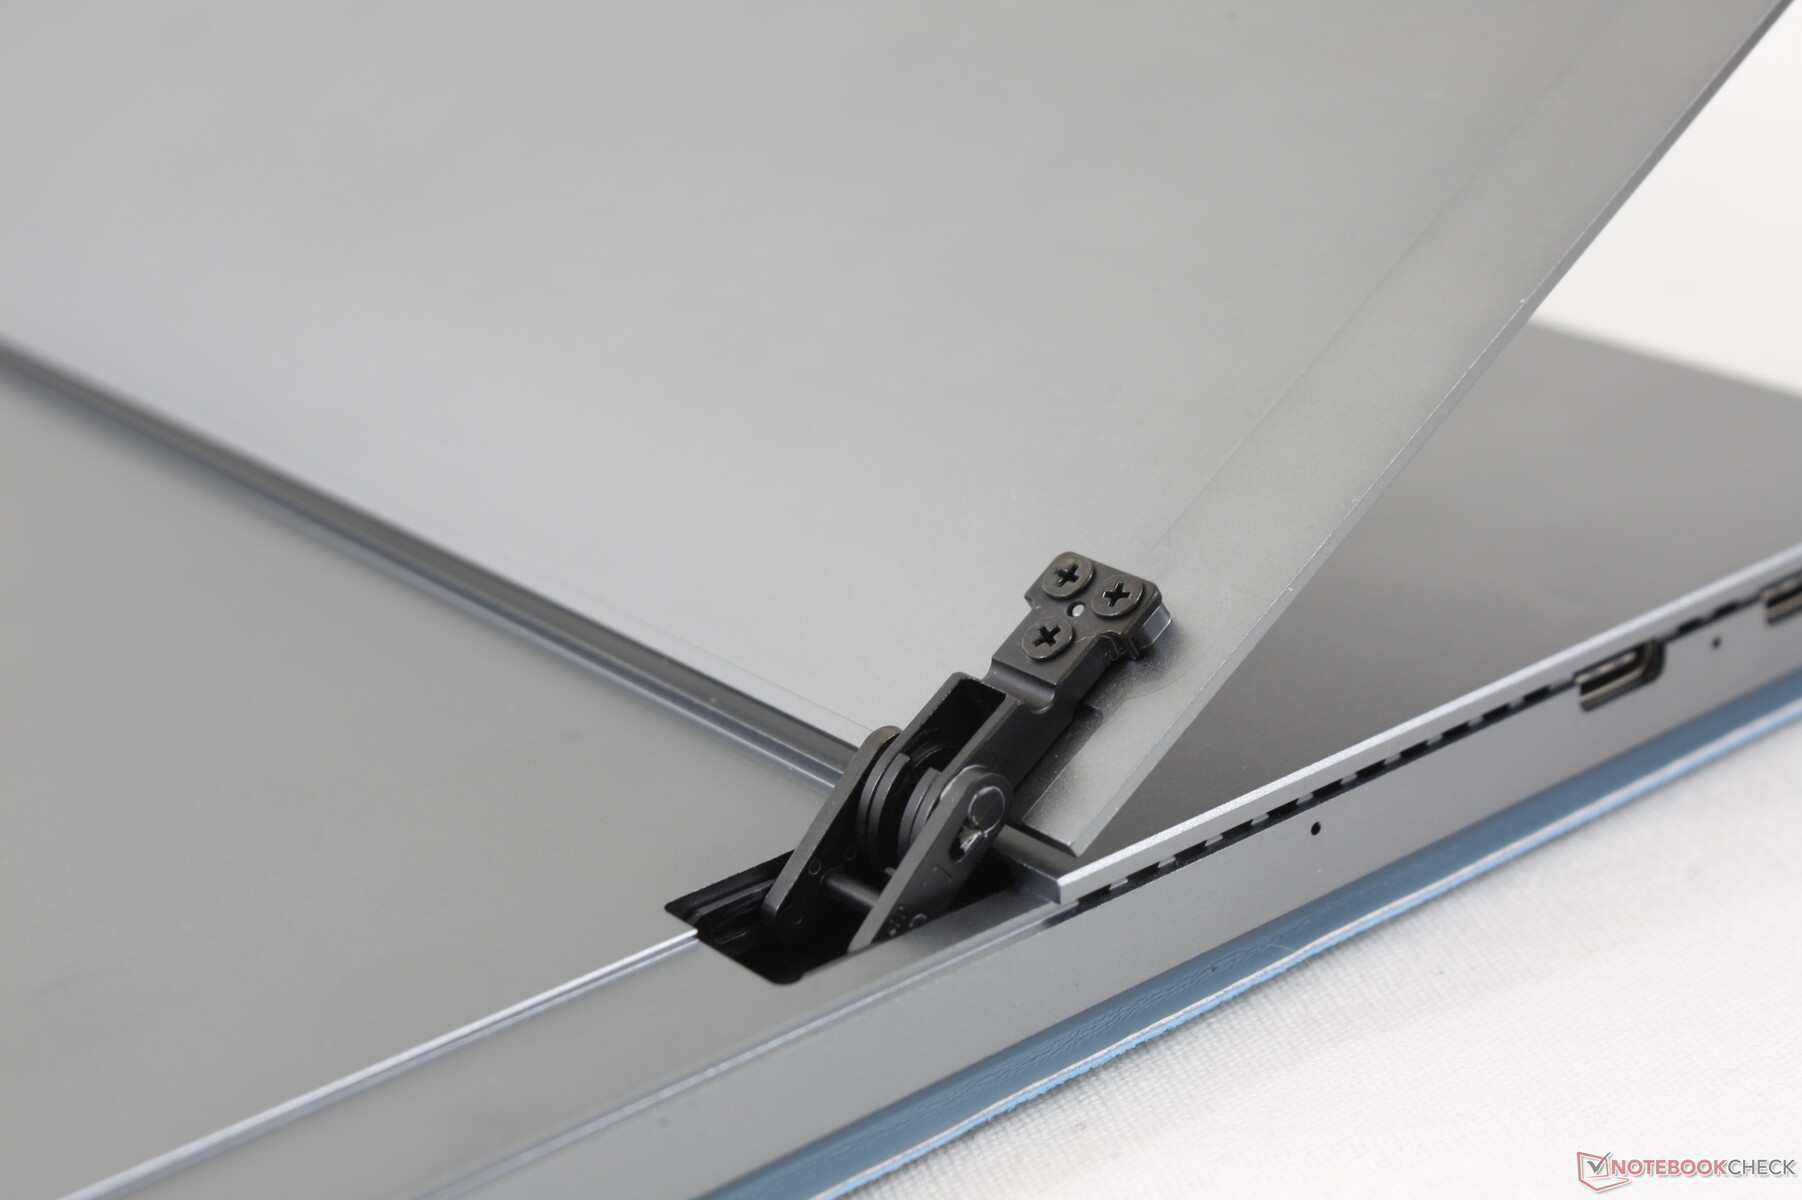
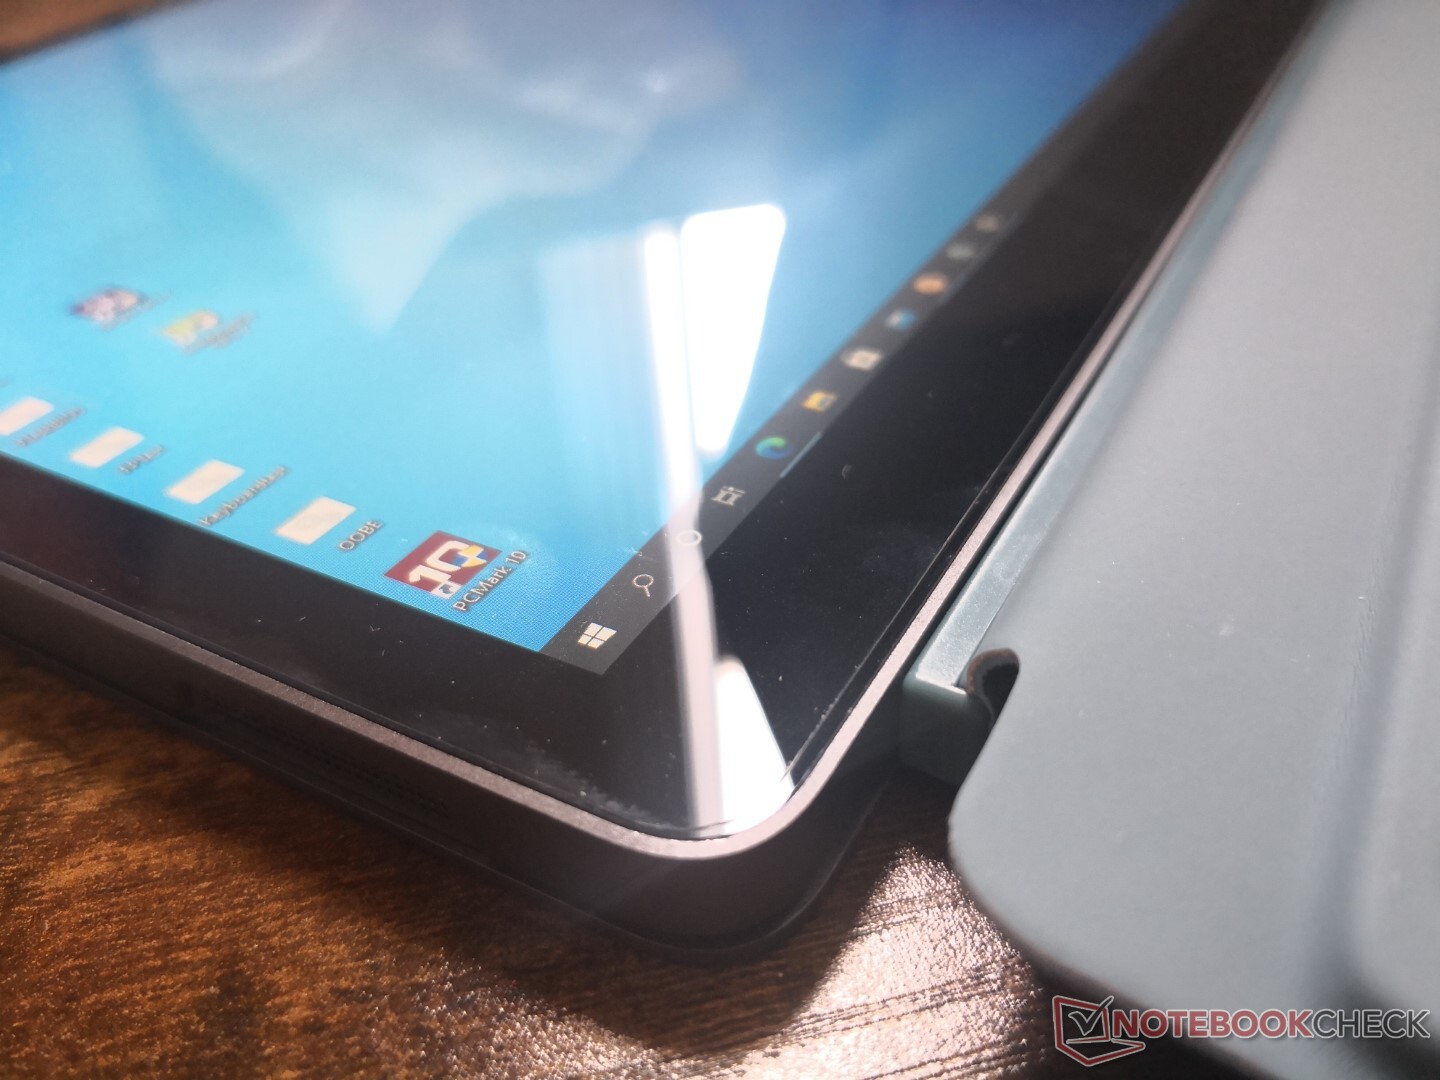
O chassi metálico é um destaque do LeBook, pois se sente próximo à qualidade de um Surface Pro mais caro. O suporte metálico na parte de trás poderia ter sido mais rígido ou mais grosso, no entanto, uma vez que ele se empena com alguma facilidade.
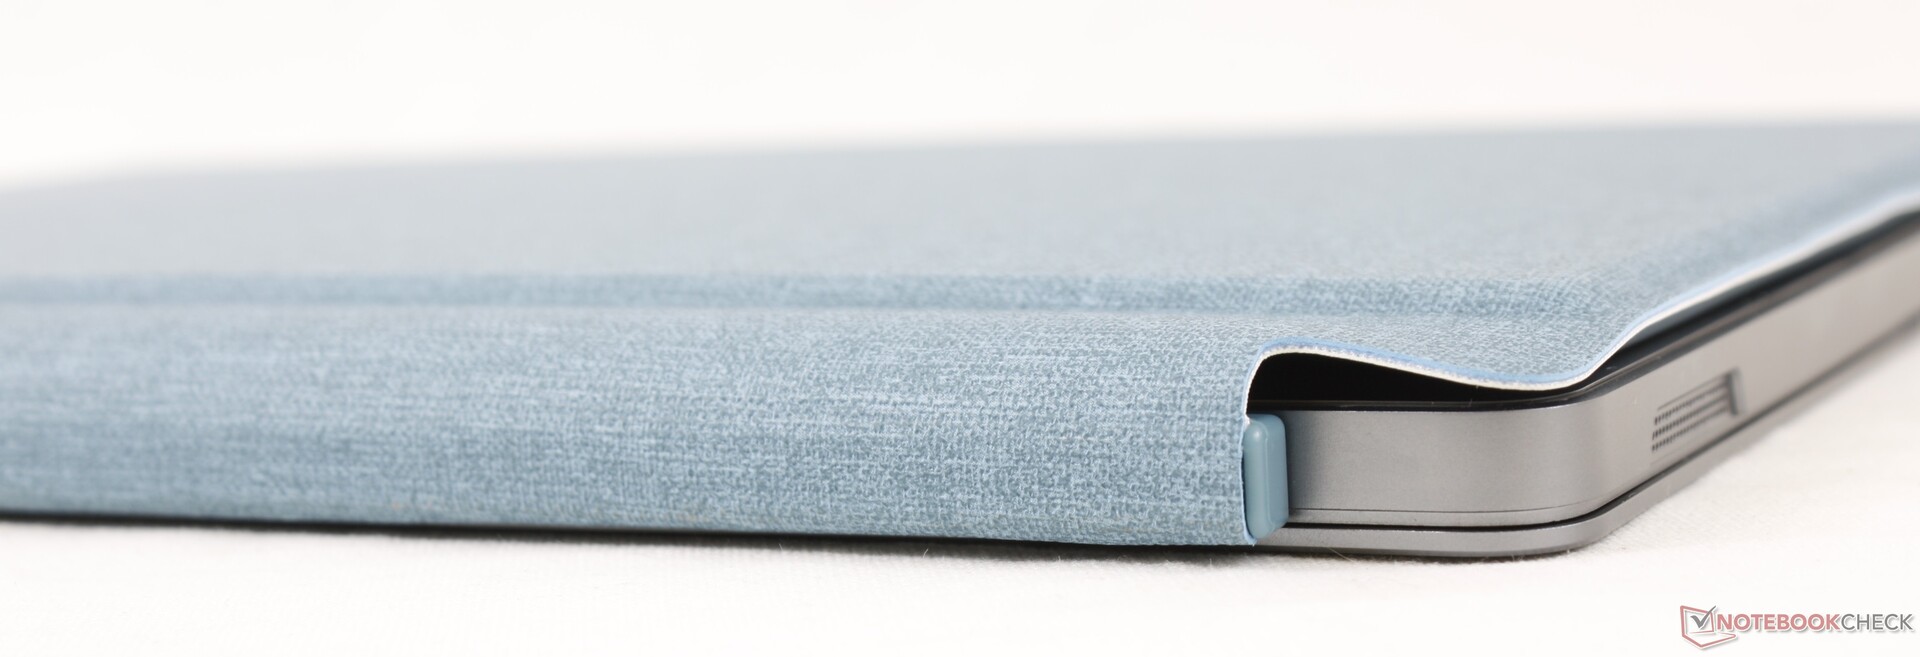
A base consiste em Alcântara e uma textura de fundo de couro falso. Embora tenha boa aparência com uma sensação de alta qualidade, é muito flexível e suscetível a torção, o que impacta negativamente a experiência de digitação. Um deck de teclado mais firme e mais sólido teria sido melhor.
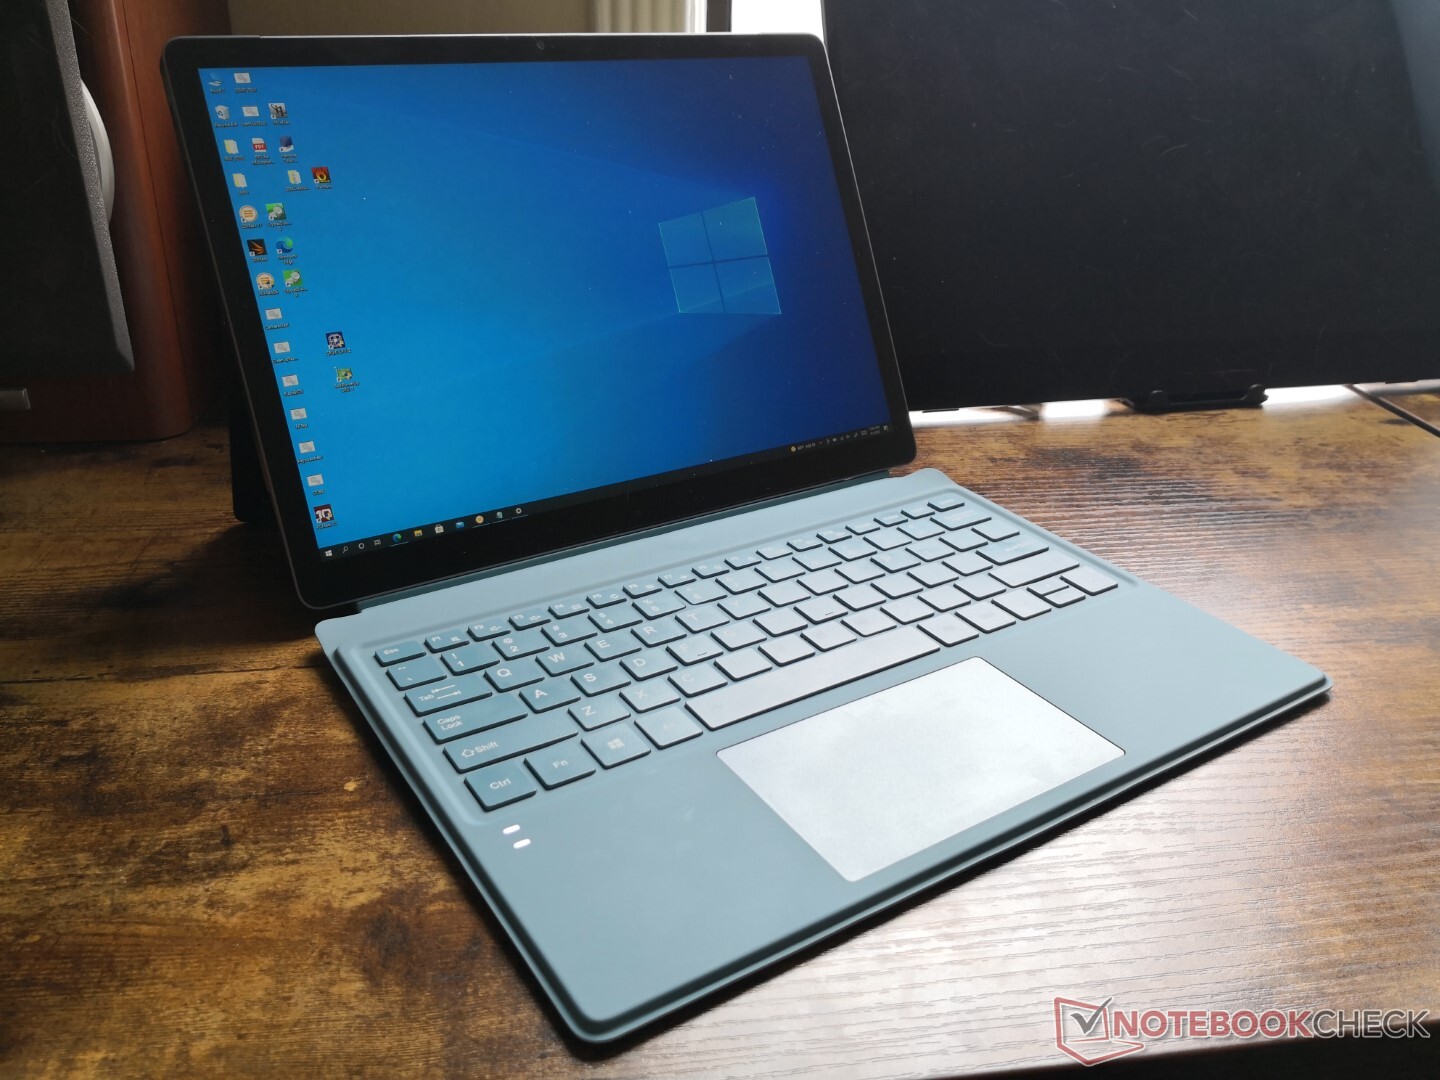
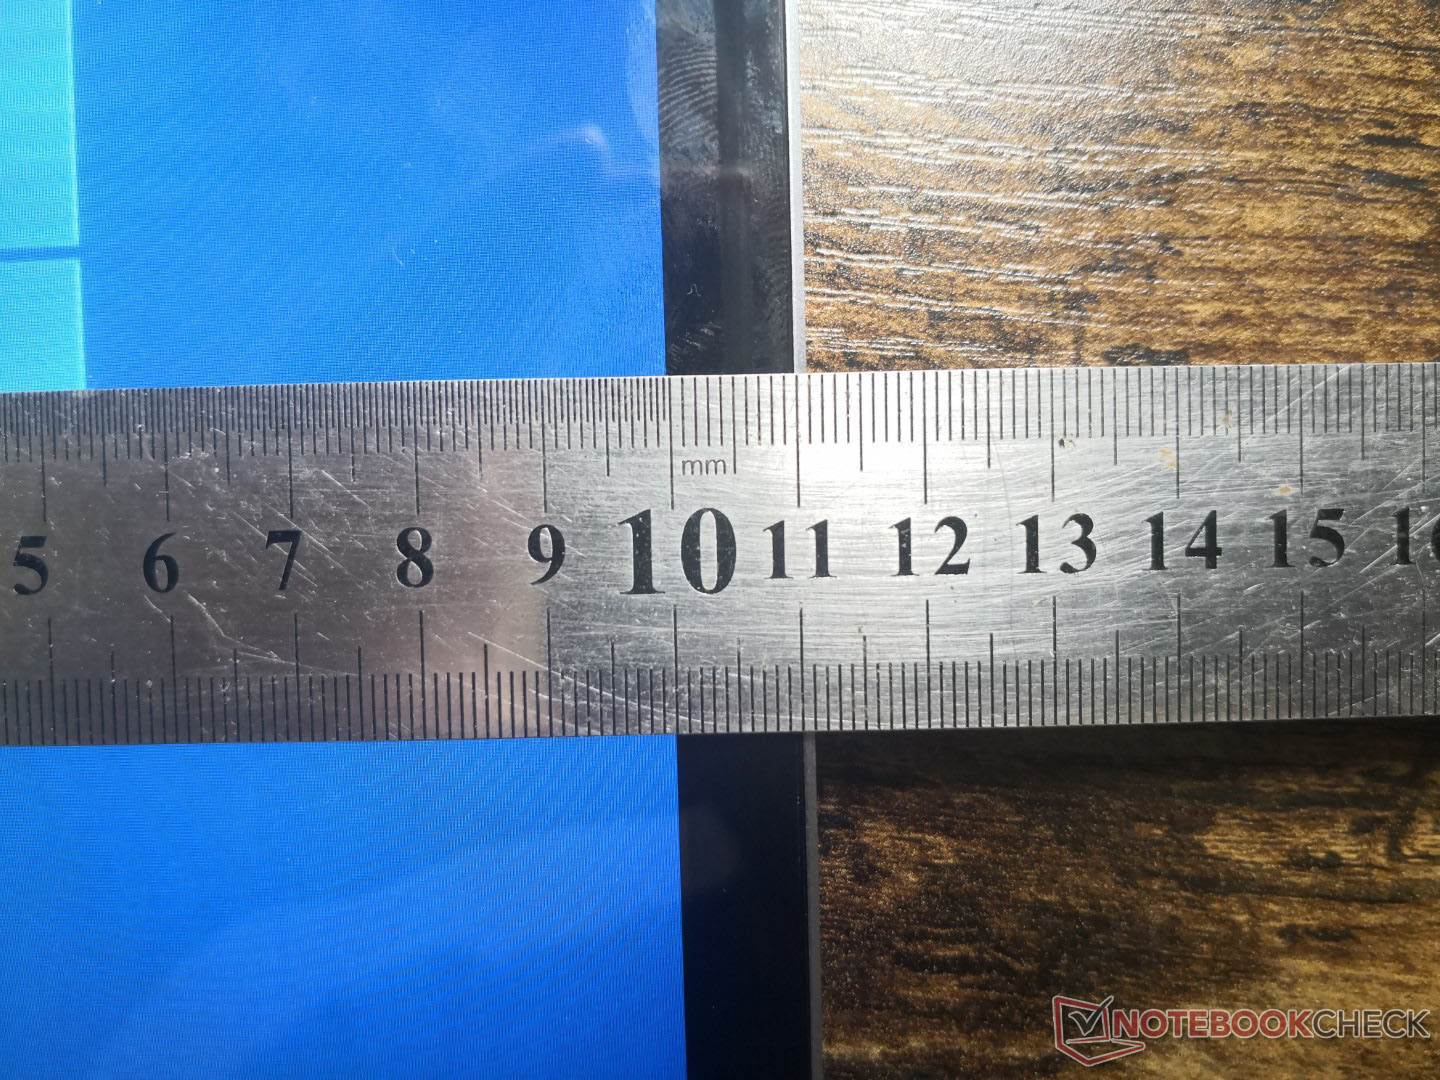
O tamanho e o peso são cada vez maiores e mais pesados que o Surface Pro 7, que se correlaciona com a tela de 12,6 polegadas ligeiramente maior. A relação tela/corpo é maior na KUU independentemente. O uso da base do teclado acrescenta cerca de 308 g ao peso do tablete.
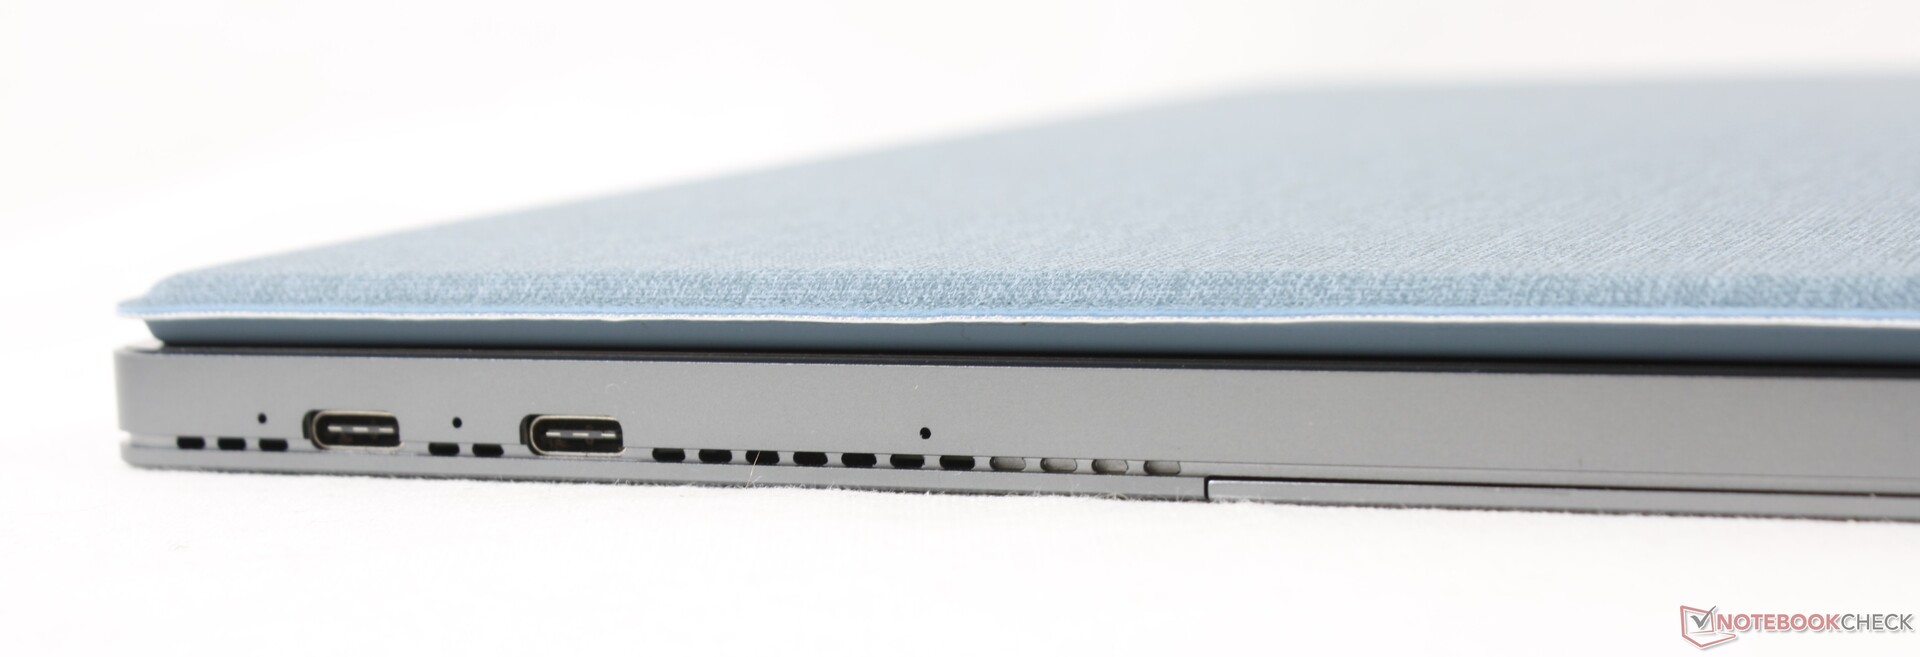
Conectividade
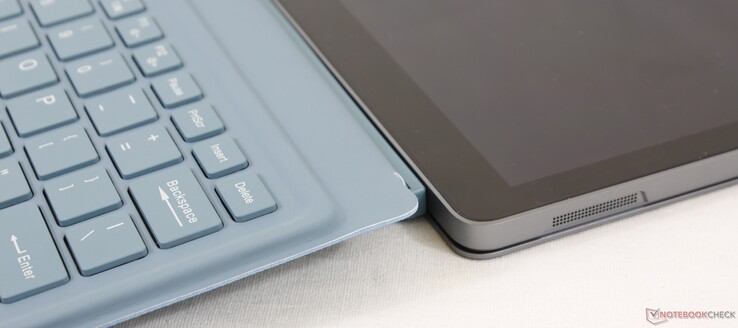
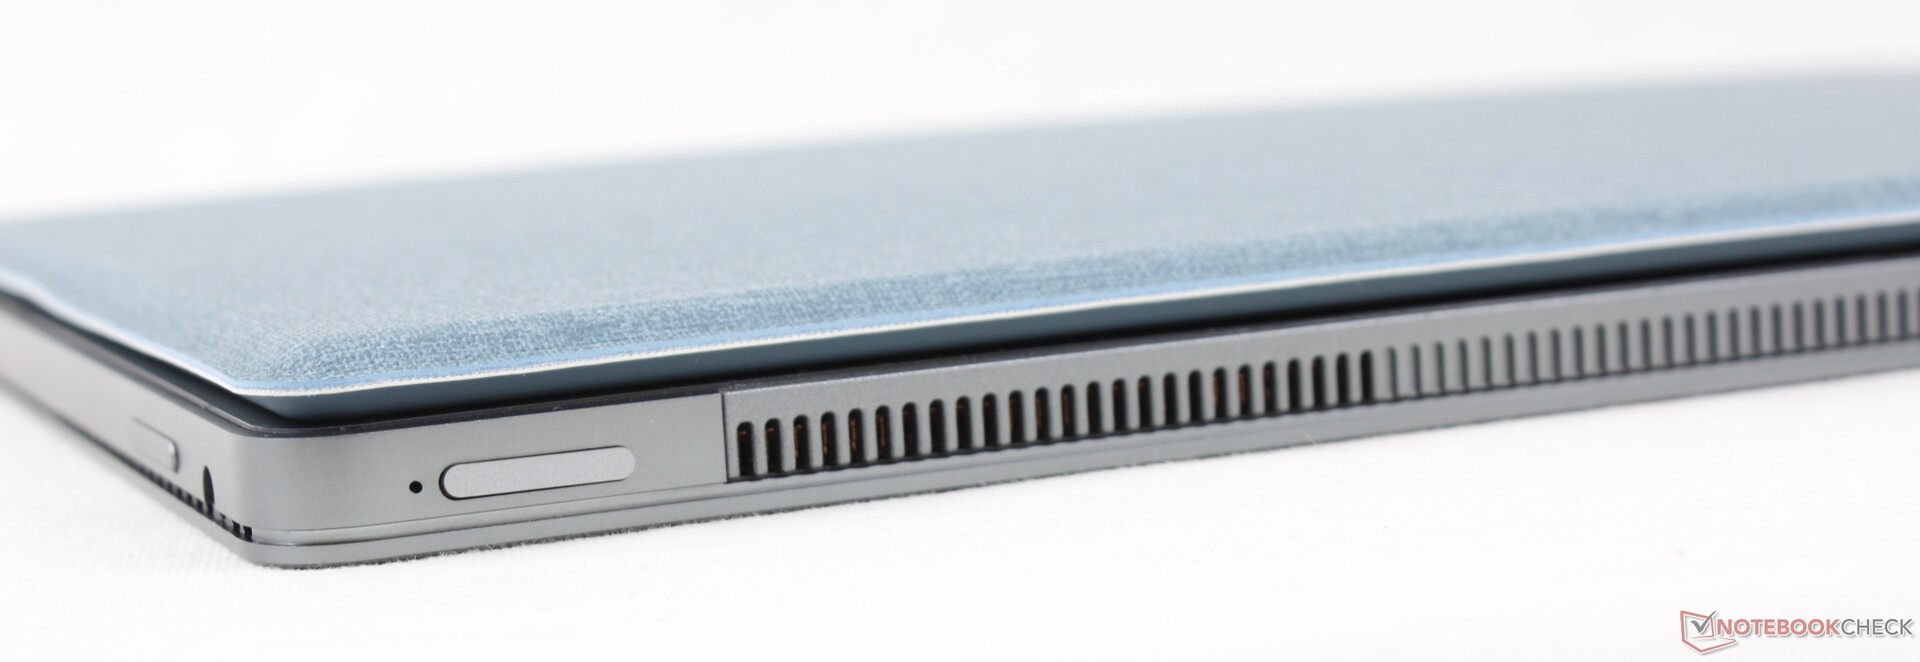
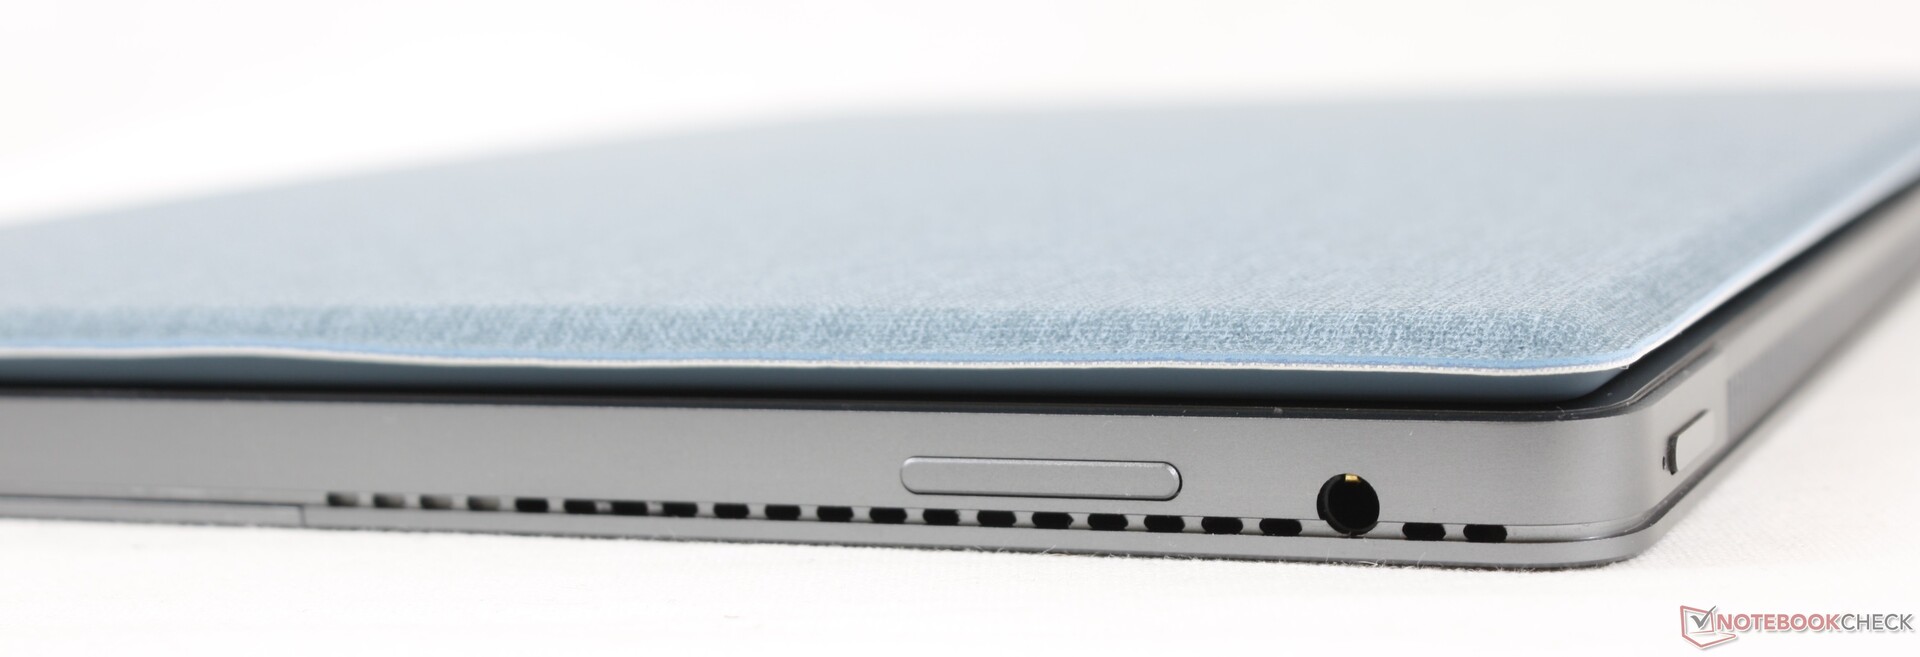
As duas portas USB-C cada uma suportam carregamento e monitores externos. Infelizmente não há portas USB-A integradas, ao contrário da série Surface Pro.
Comunicação
Não há suporte Wi-Fi 6 que possa economizar em custos. O Intel 3168 integrado 1x1 oferece taxas de transferência no mundo real de apenas cerca de 350 Mbps para ser mais 4x mais lento que os laptops mais caros com o Intel AX200 ou AX201.
Webcam


Acessórios e Garantia
A caixa de varejo inclui o adaptador AC, a base do teclado destacável e uma caneta stylus ativa. Aplica-se a garantia padrão limitada de um ano do fabricante.
Dispositivos de entrada
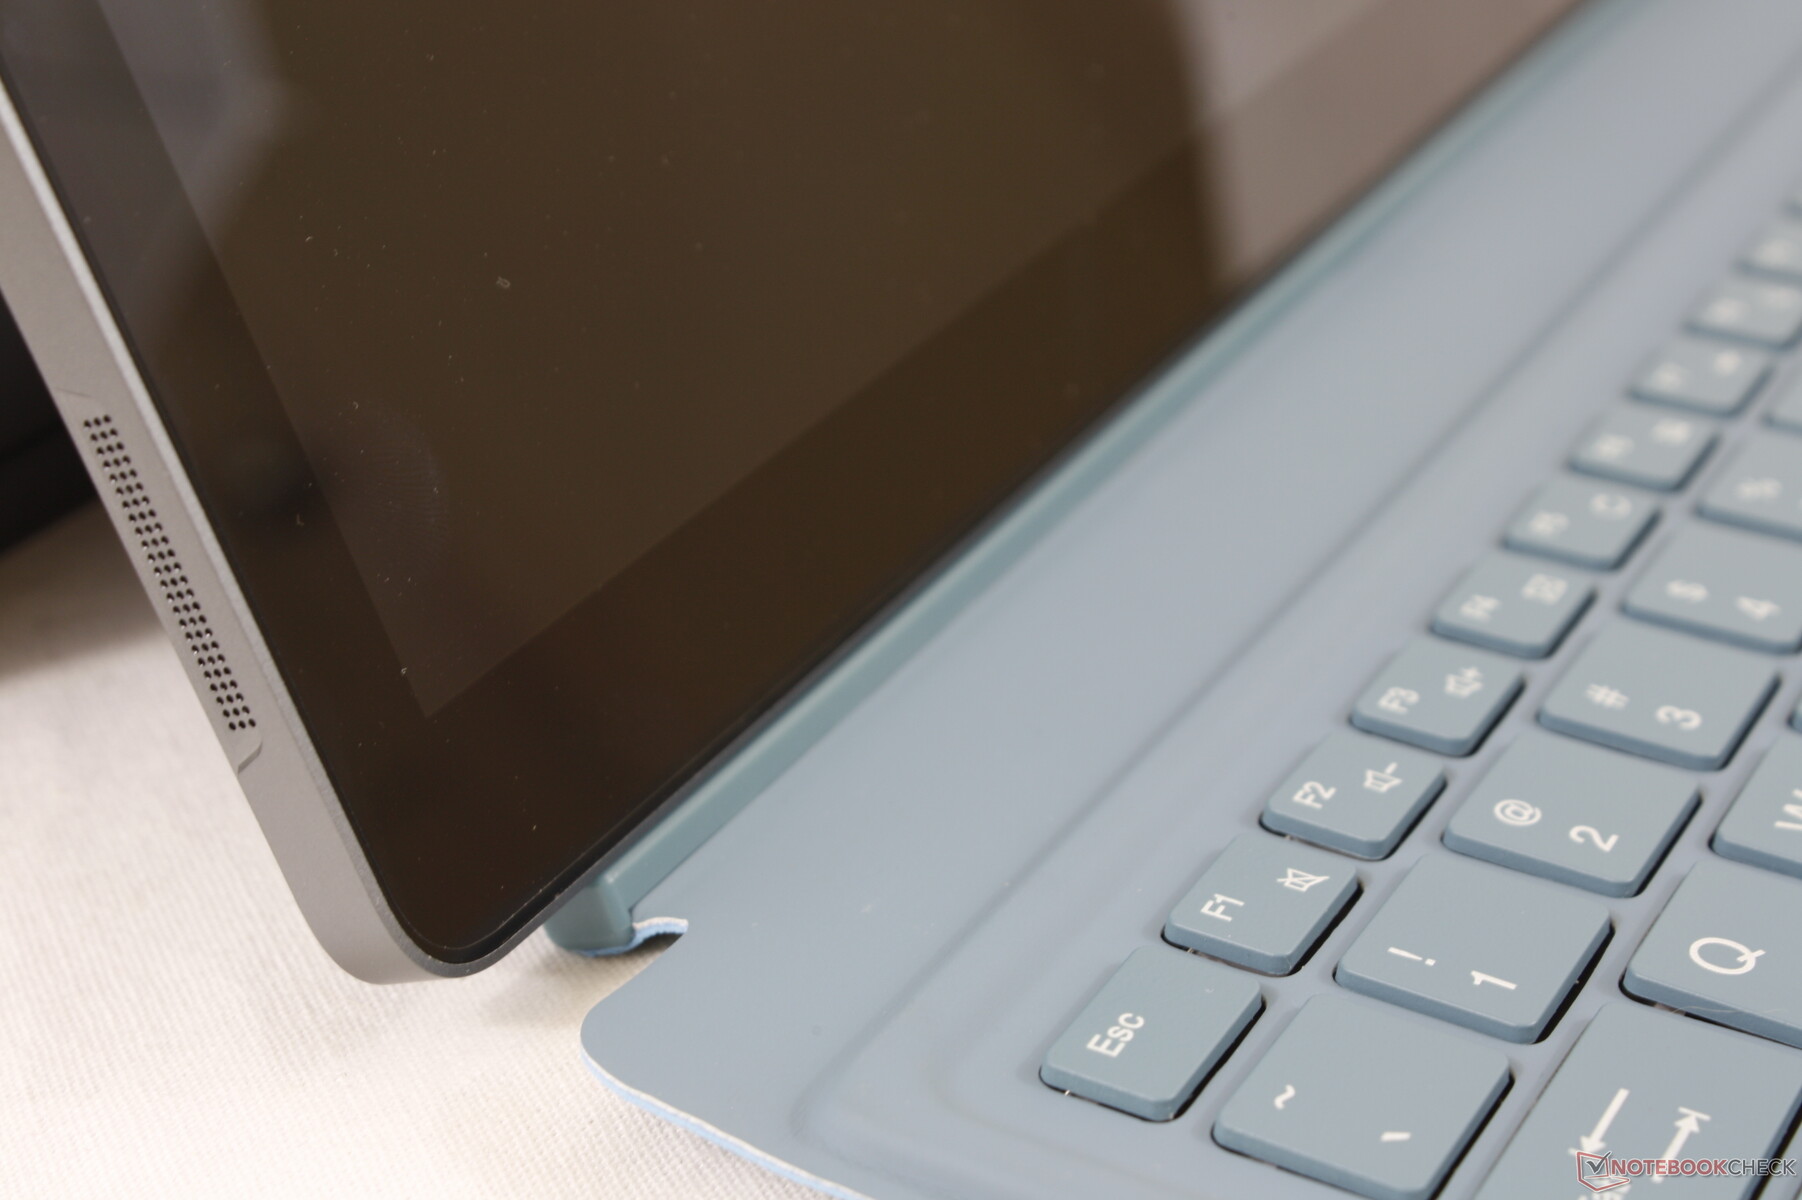
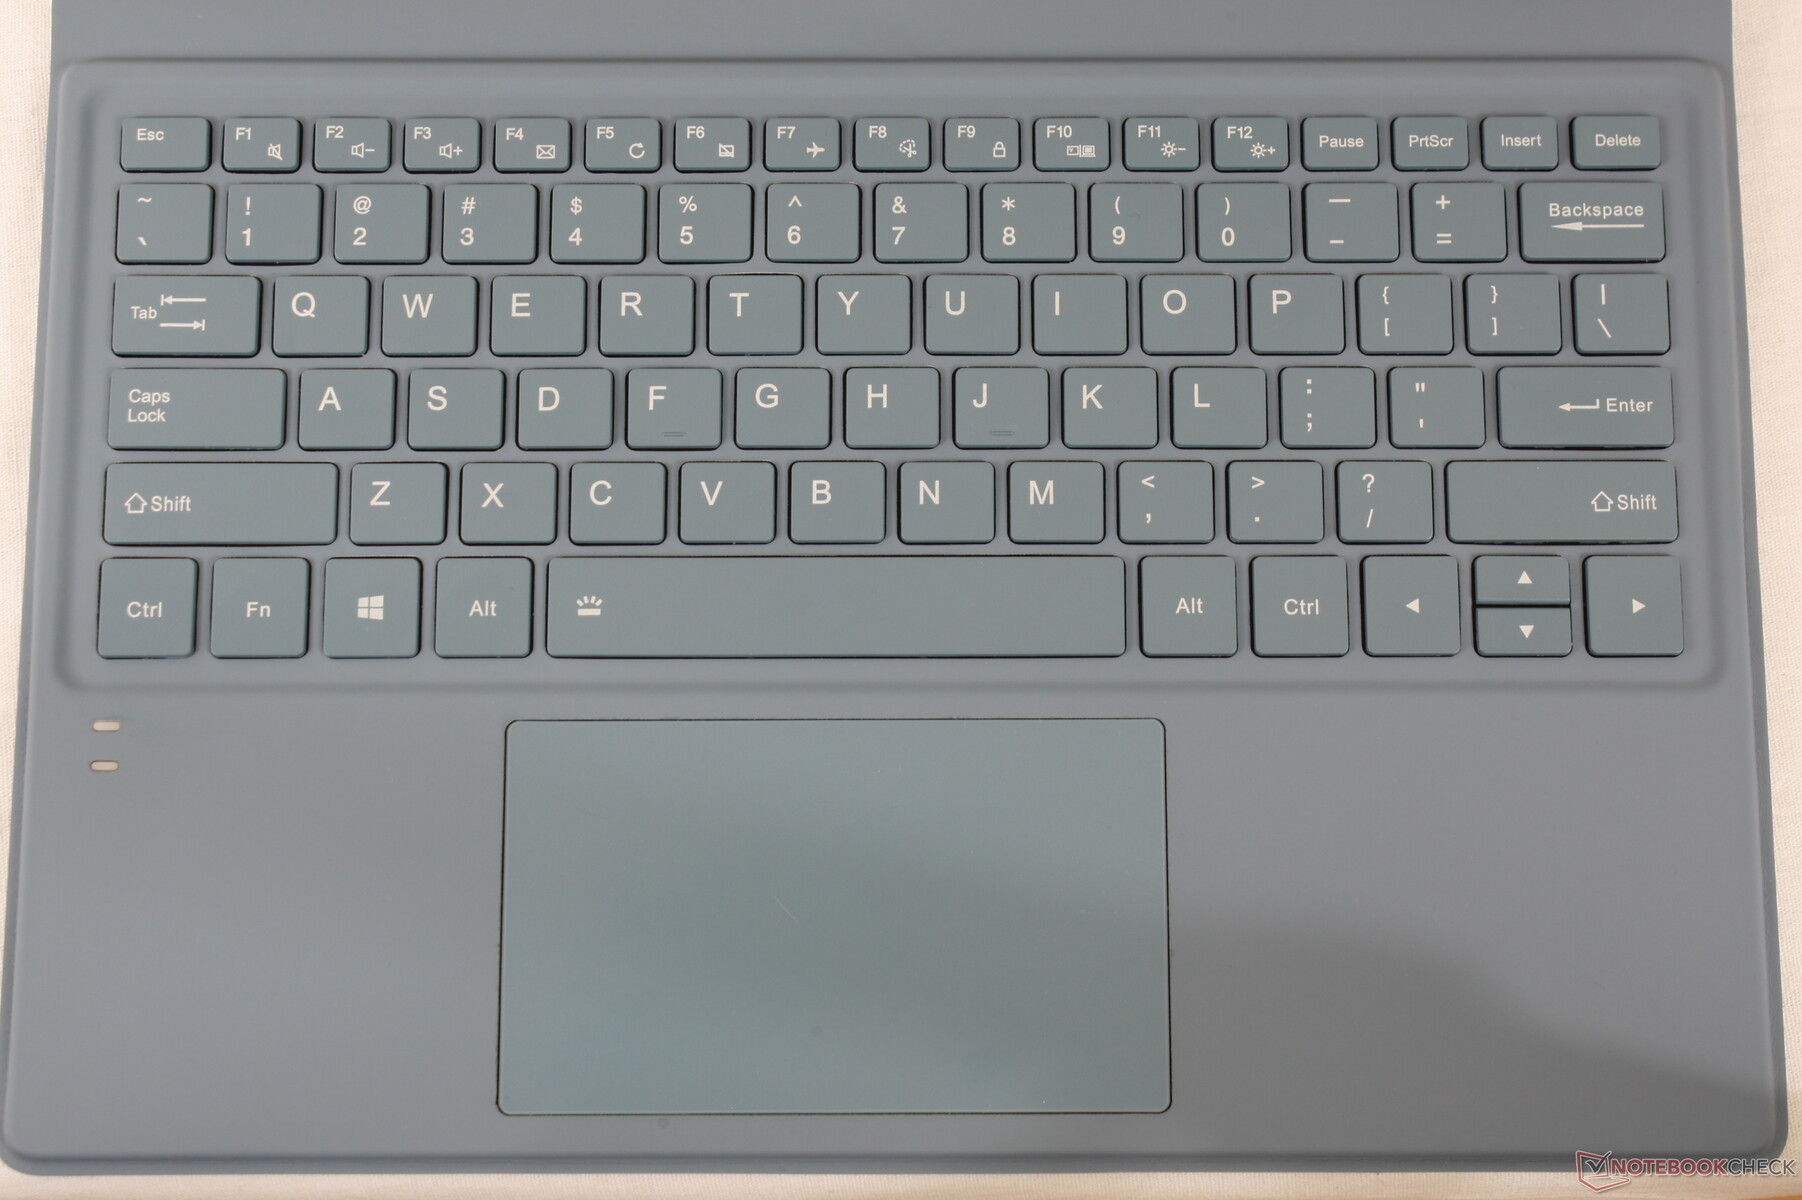
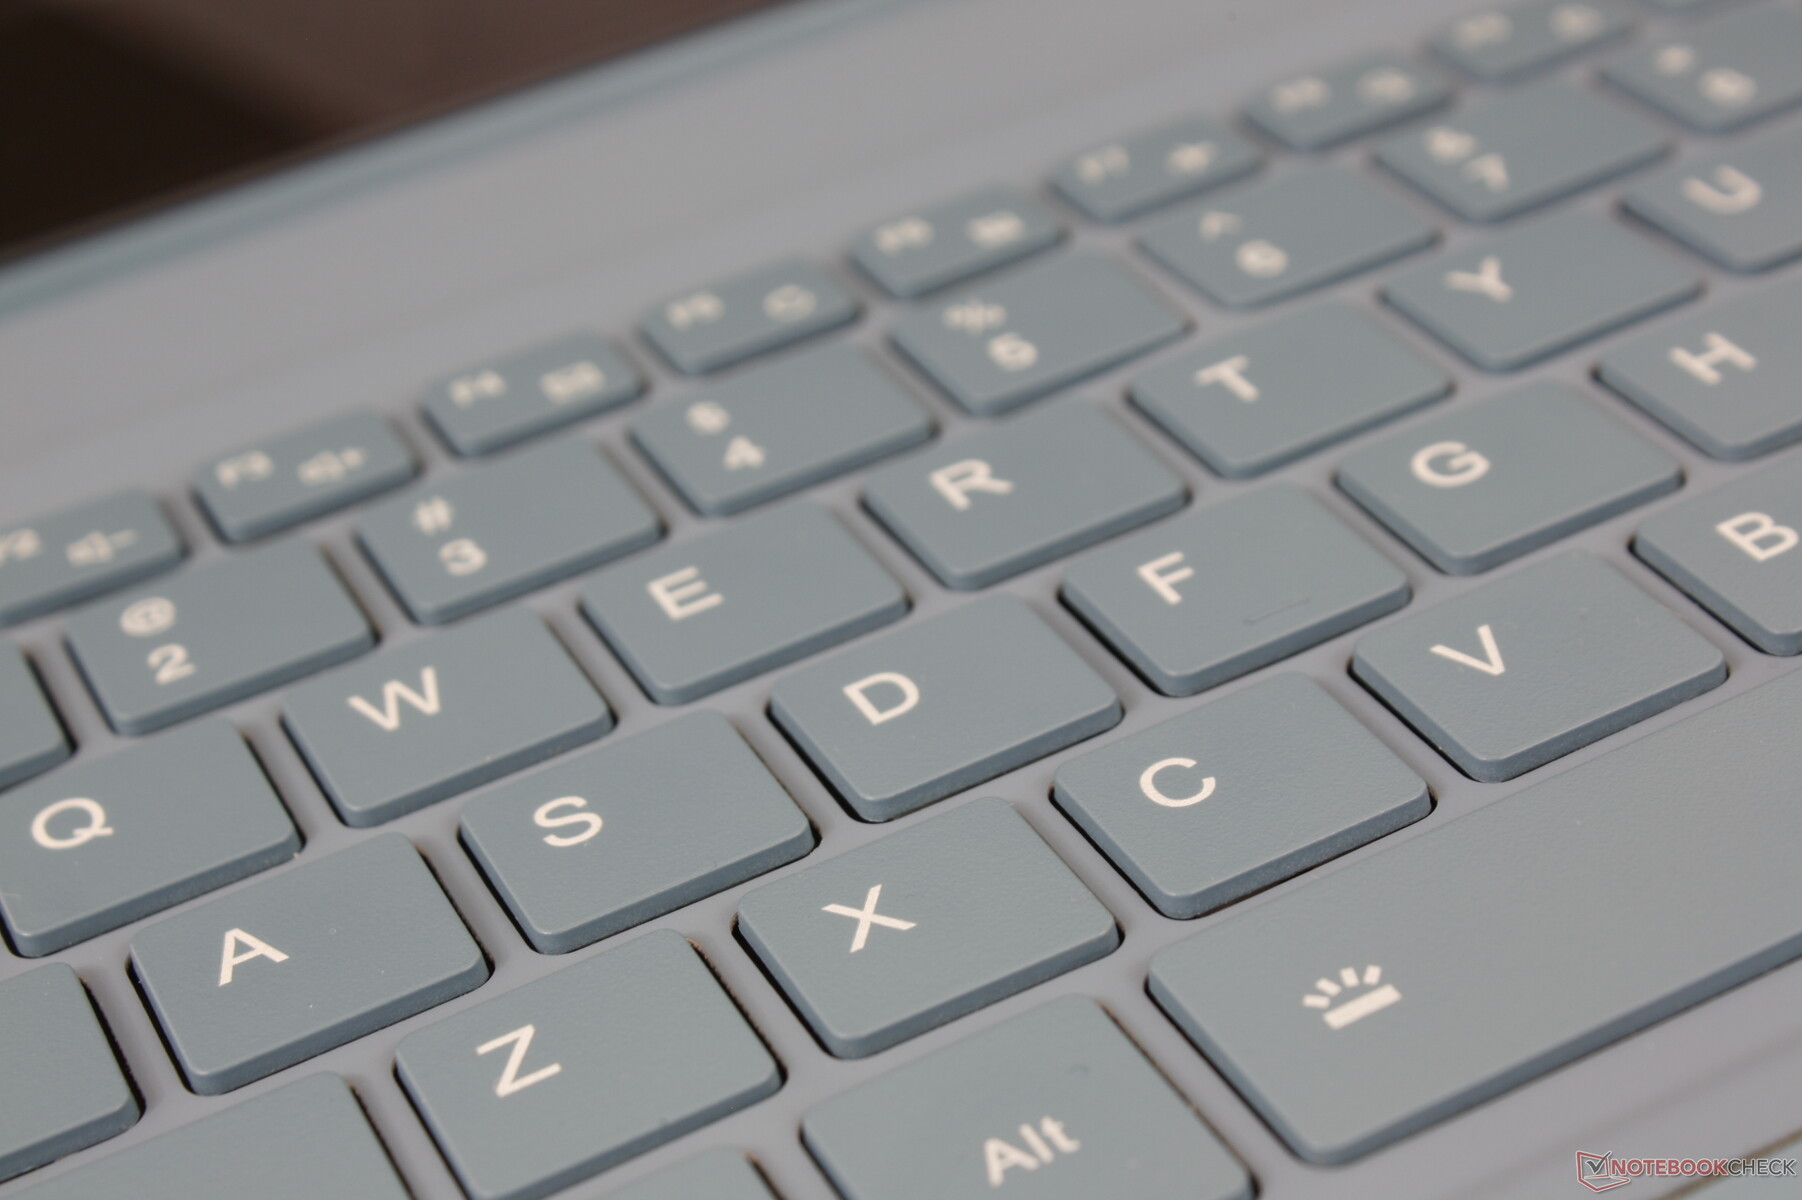
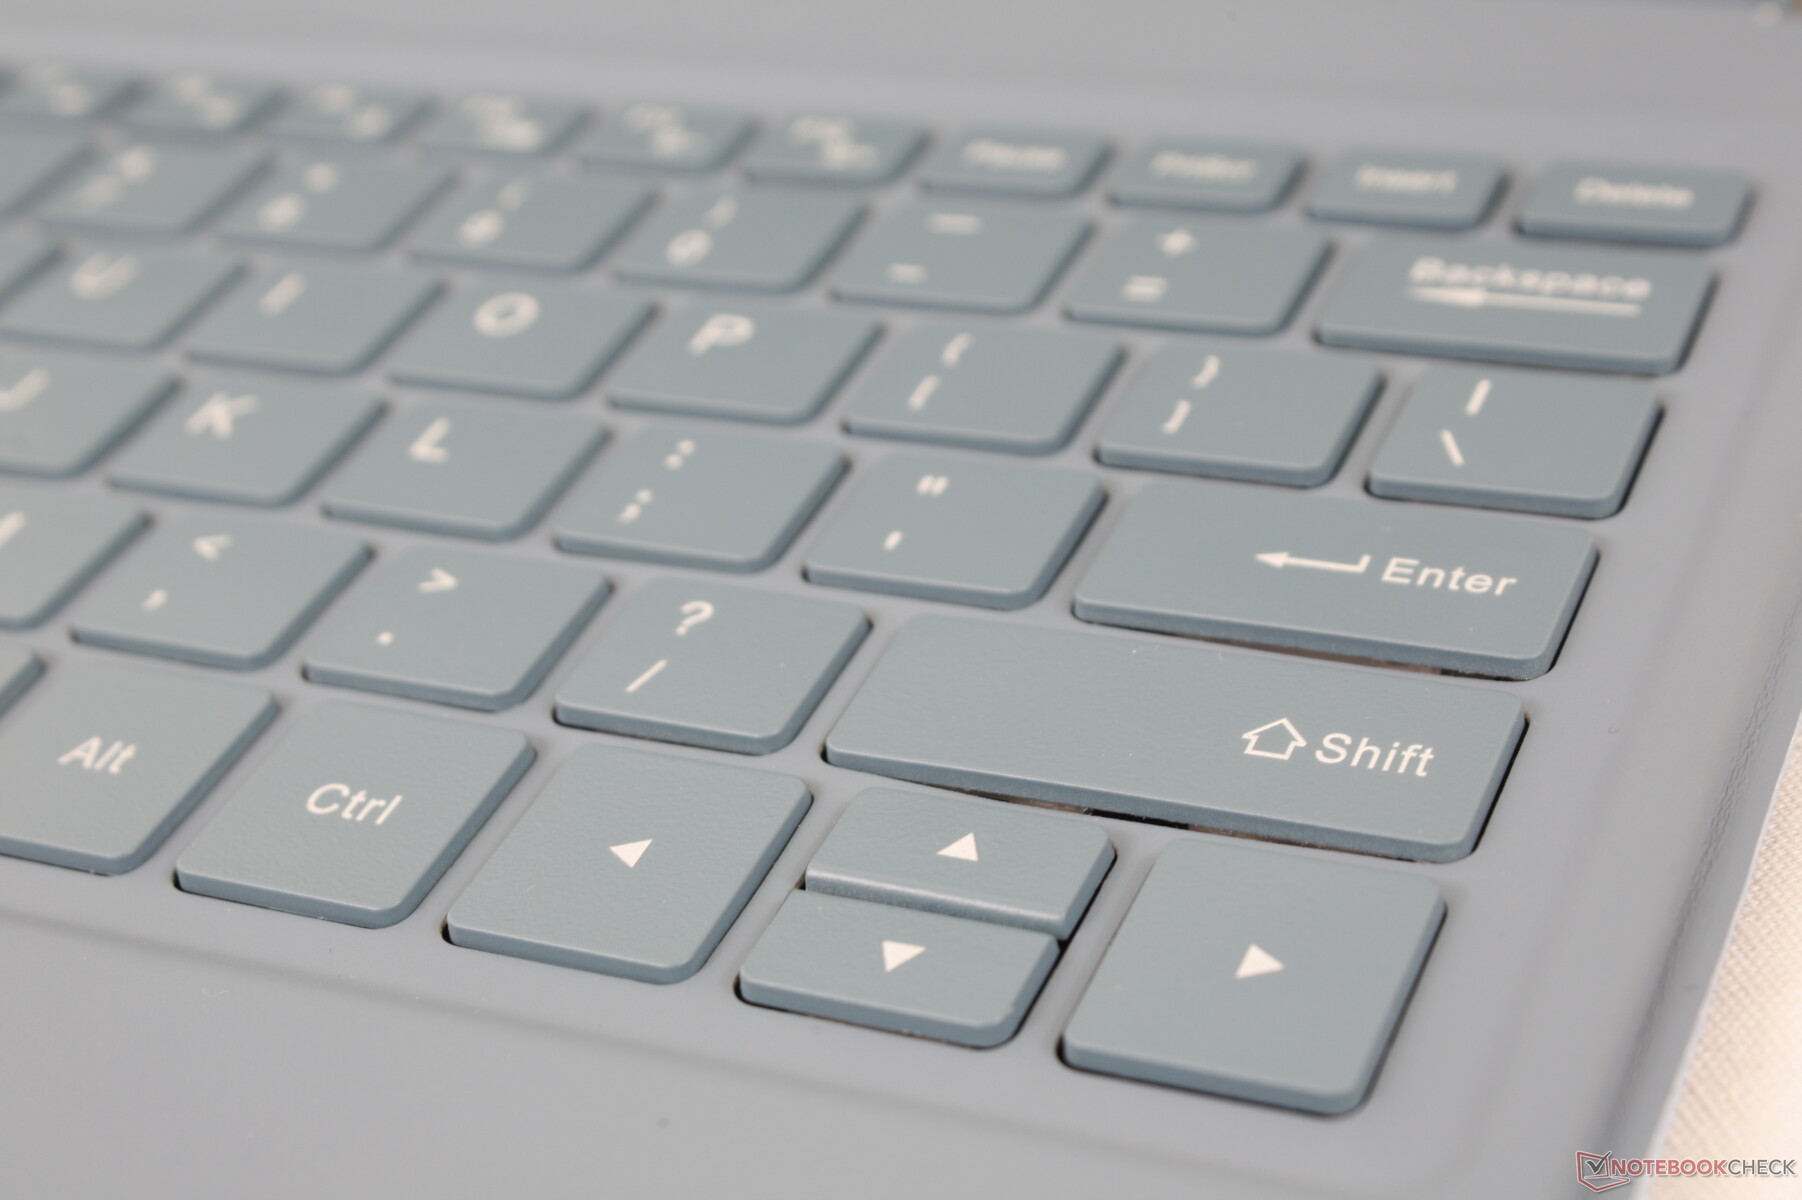
Teclado
A experiência de digitação é pior do que na série Surface Pro principalmente por causa de uma desvantagem: a base não fica completamente plana sobre a mesa. Como resultado, a parte de trás da base do teclado sempre ricocheteia para cima e para baixo ao digitar, o que impacta o feedback das teclas do teclado. A digitação é esponjosa, já que você está empurrando para baixo toda a base com cada pressionamento de tecla.
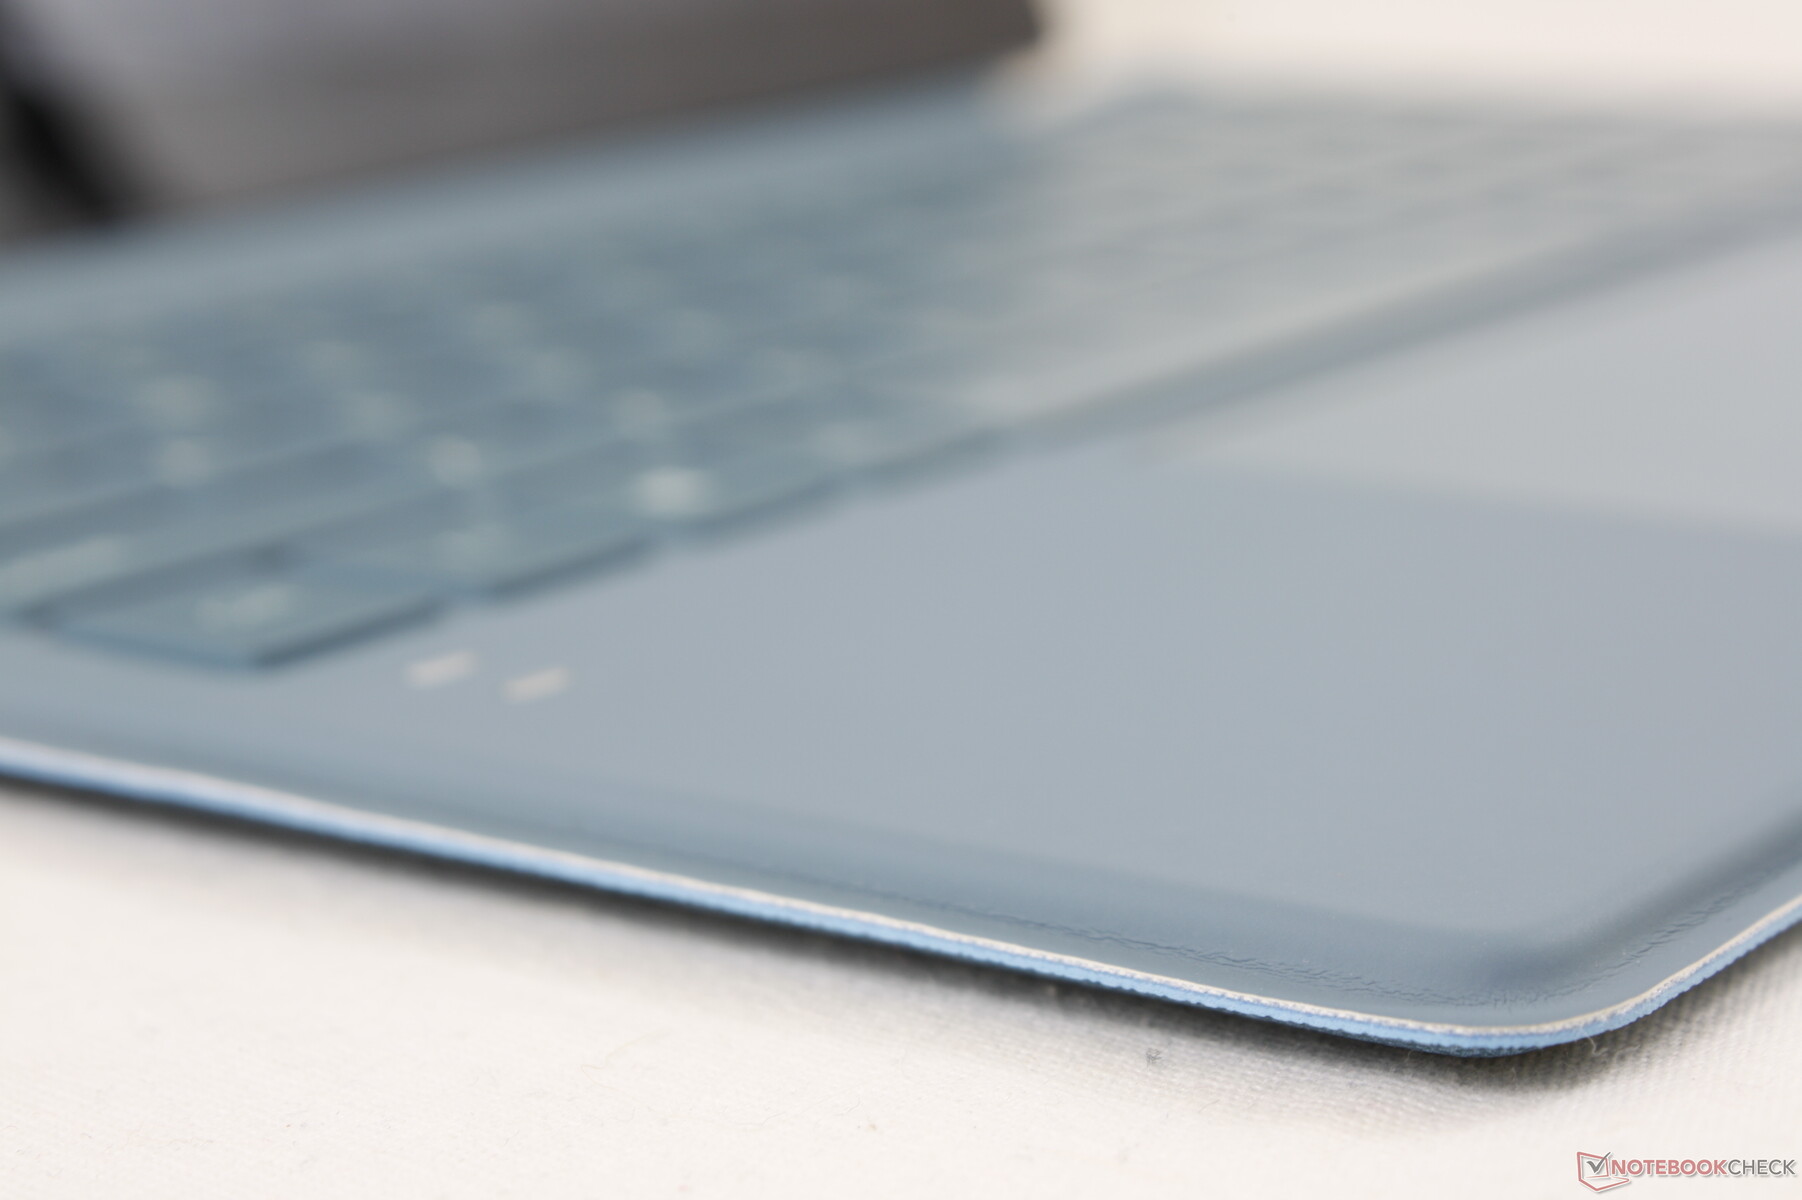
Há dois indicadores LED no descanso da palma da mão esquerda da base do teclado. Estas luzes são relativamente brilhantes e gostaríamos que pudessem ter sido um pouco menores para serem visualmente menos intrusivas.
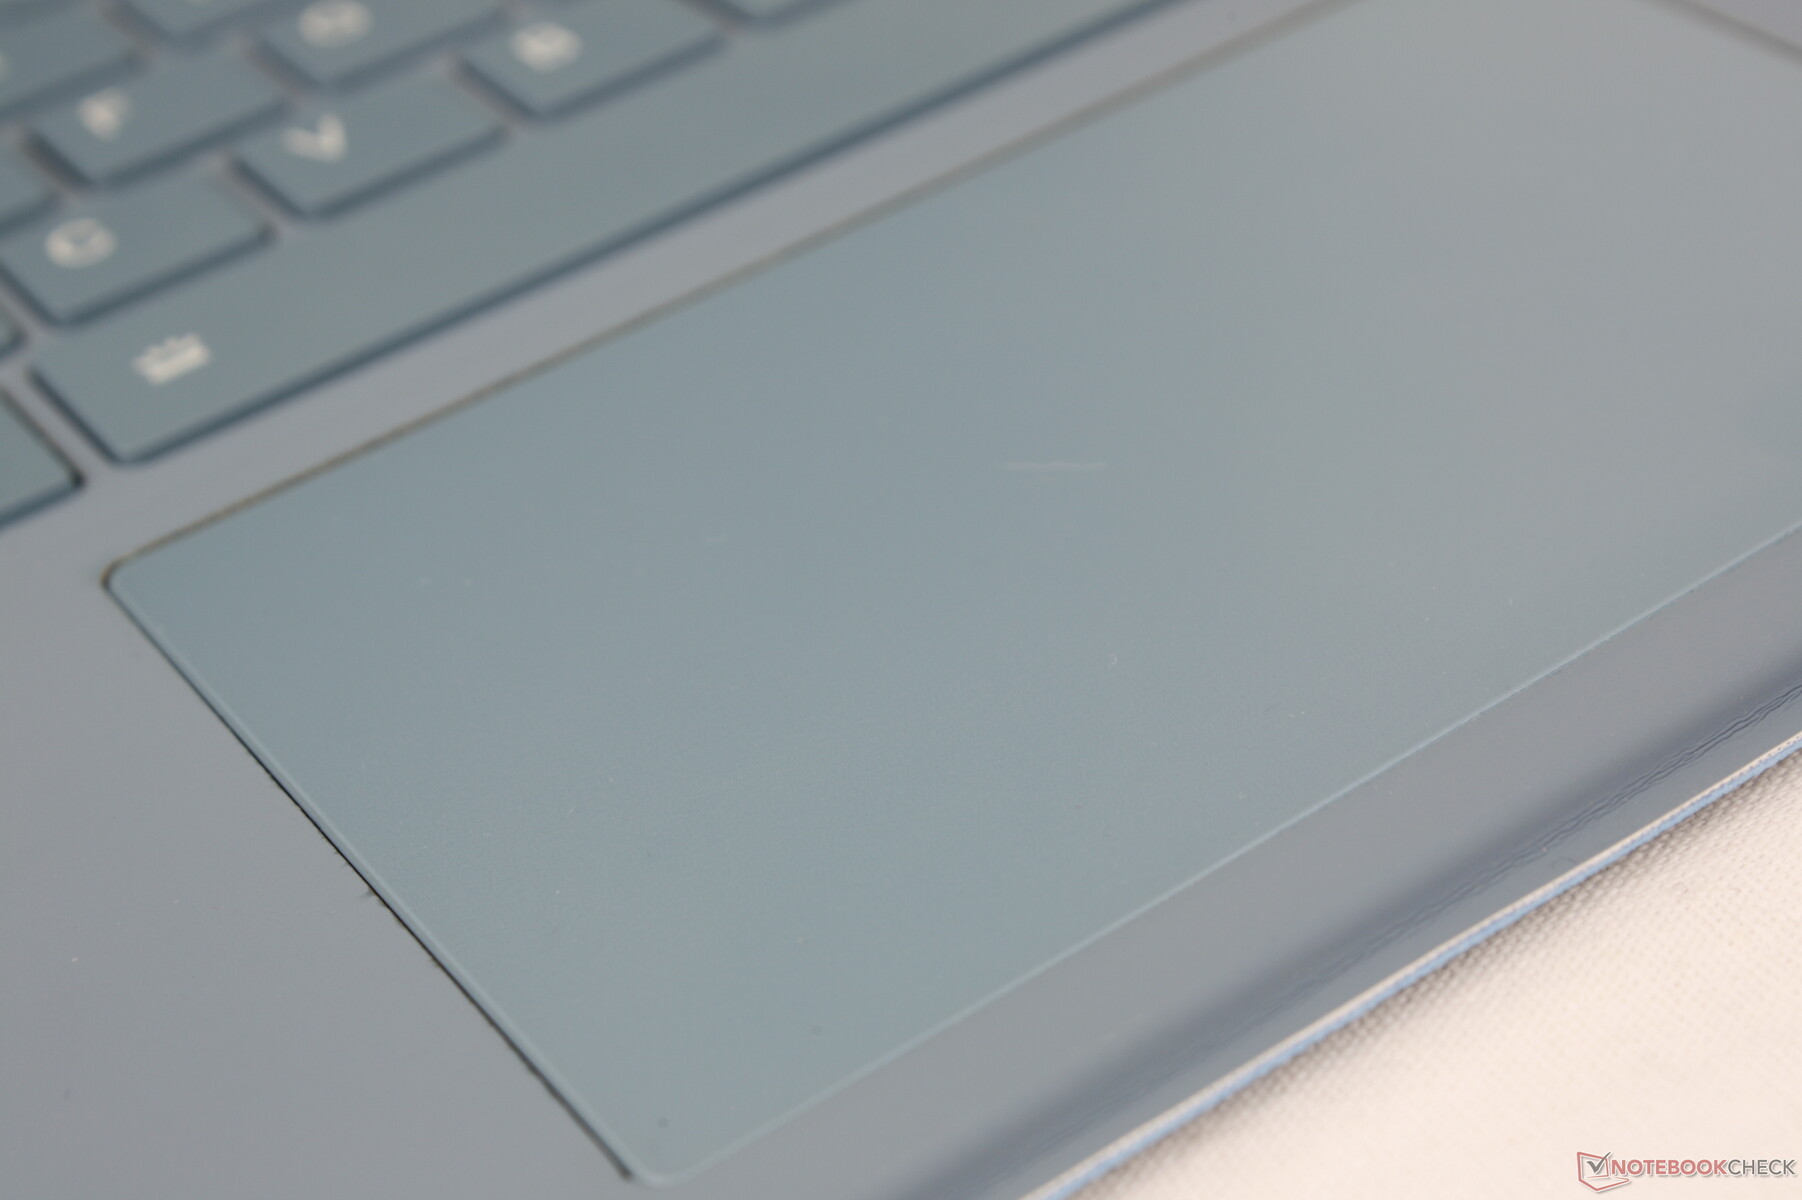
Touchpad
O clickpad é maior que o clickpad do Surface Pro 7 (10,8 x 6,4 cm vs. 10,2 x 5,3 cm). Suas vantagens terminam aí, no entanto, como quase tudo o mais sobre o clickpad do LeBook é pior. Sua superfície é pegajosa quando desliza a velocidades mais lentas, o que leva a um cursor saltitante. As entradas multi-toque também são finas, não respondem e, muitas vezes, imprecisas. Ao tentar arrastar e soltar, por exemplo, o sistema freqüentemente registraria nossas ações como zoom in ou out em seu lugar. Os botões integrados do clickpad, apesar de serem ruidosos e com cliques, requerem muita força para serem realmente pressionados. E, finalmente, o clickpad não é Precision-enabled, o que significa que qualquer recurso da Microsoft Precision está fora de questão.
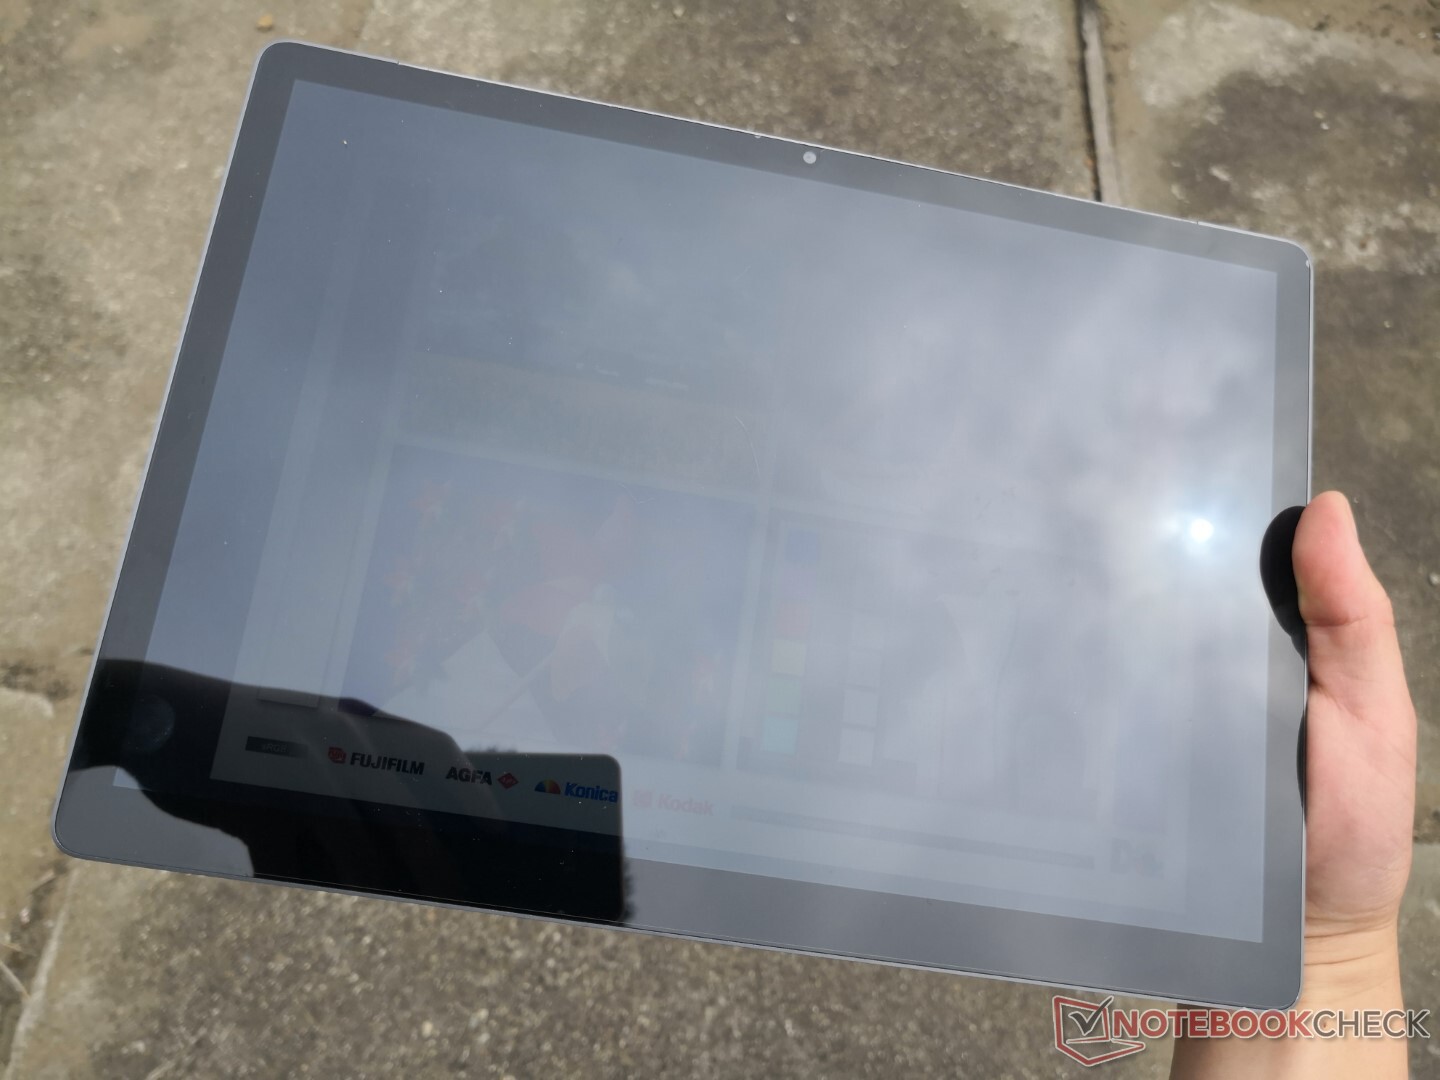
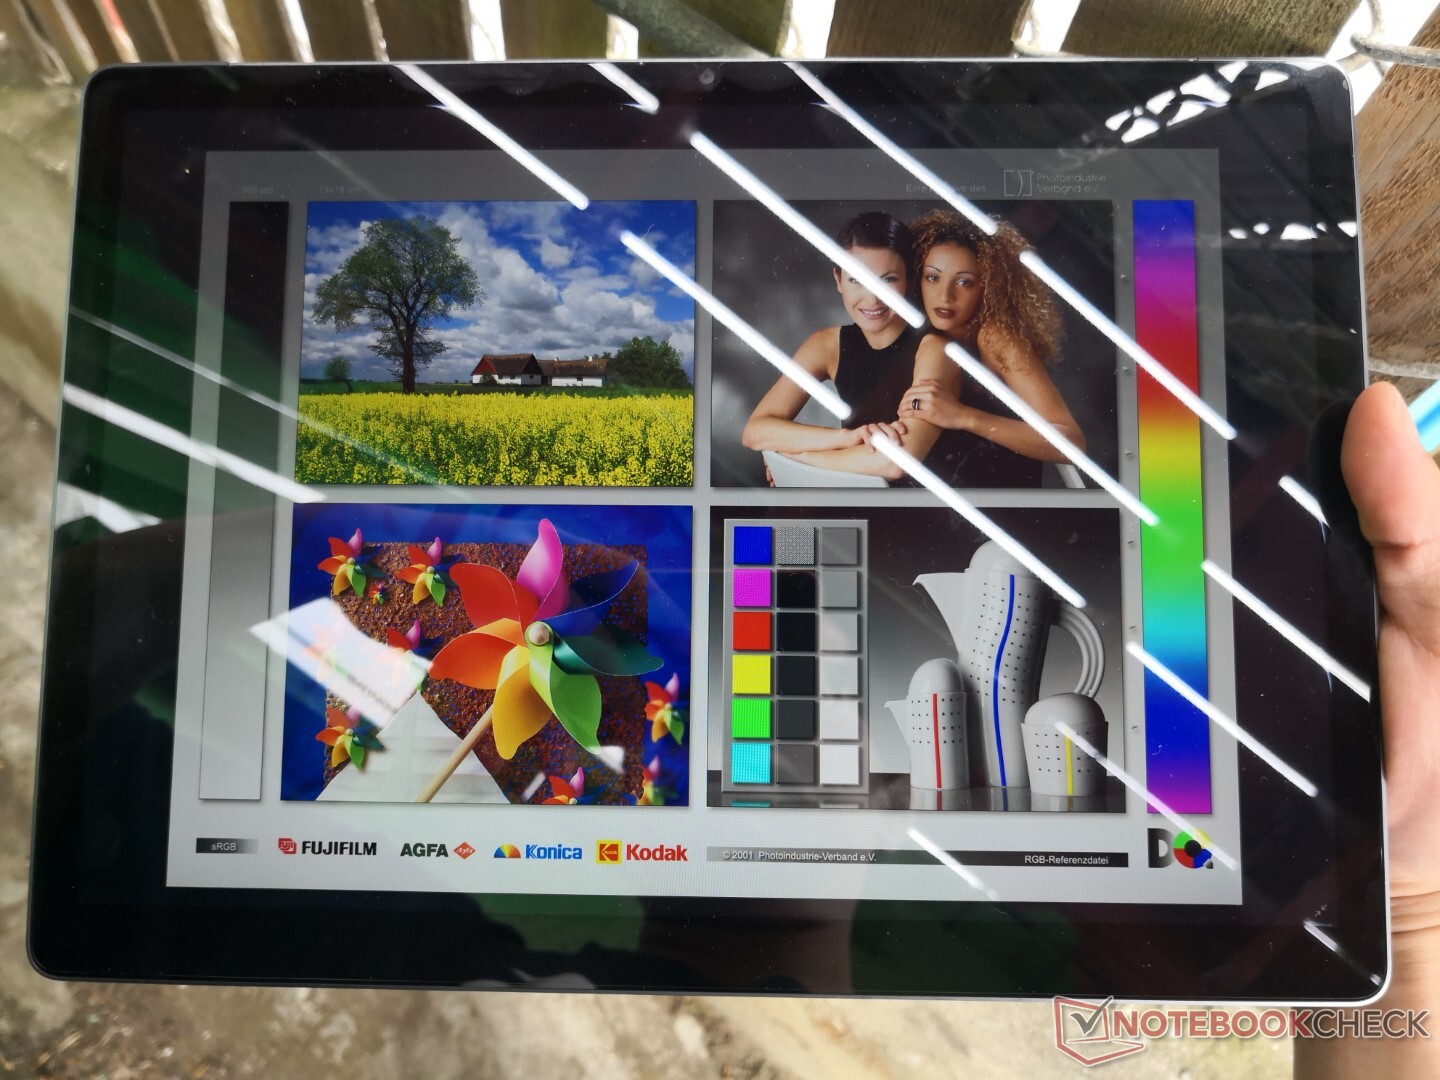
Mostrar
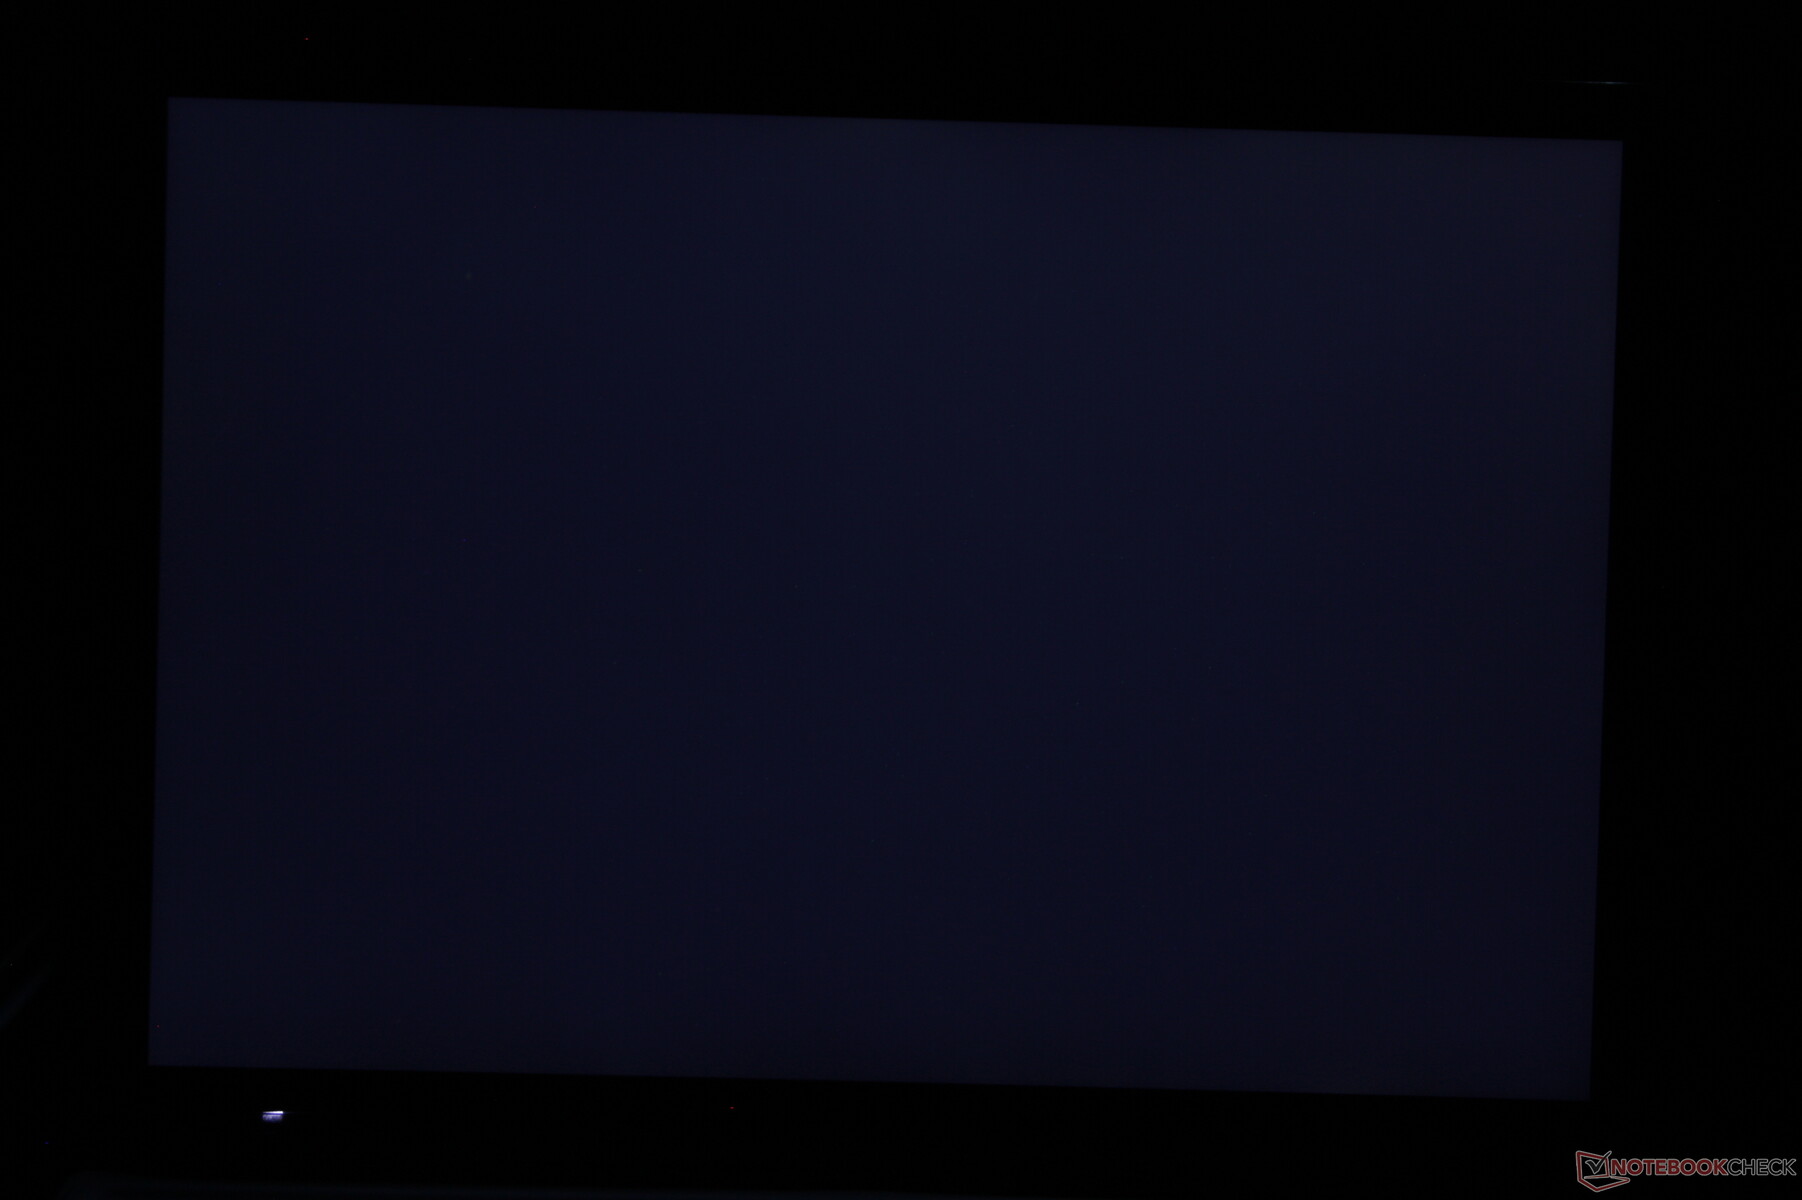
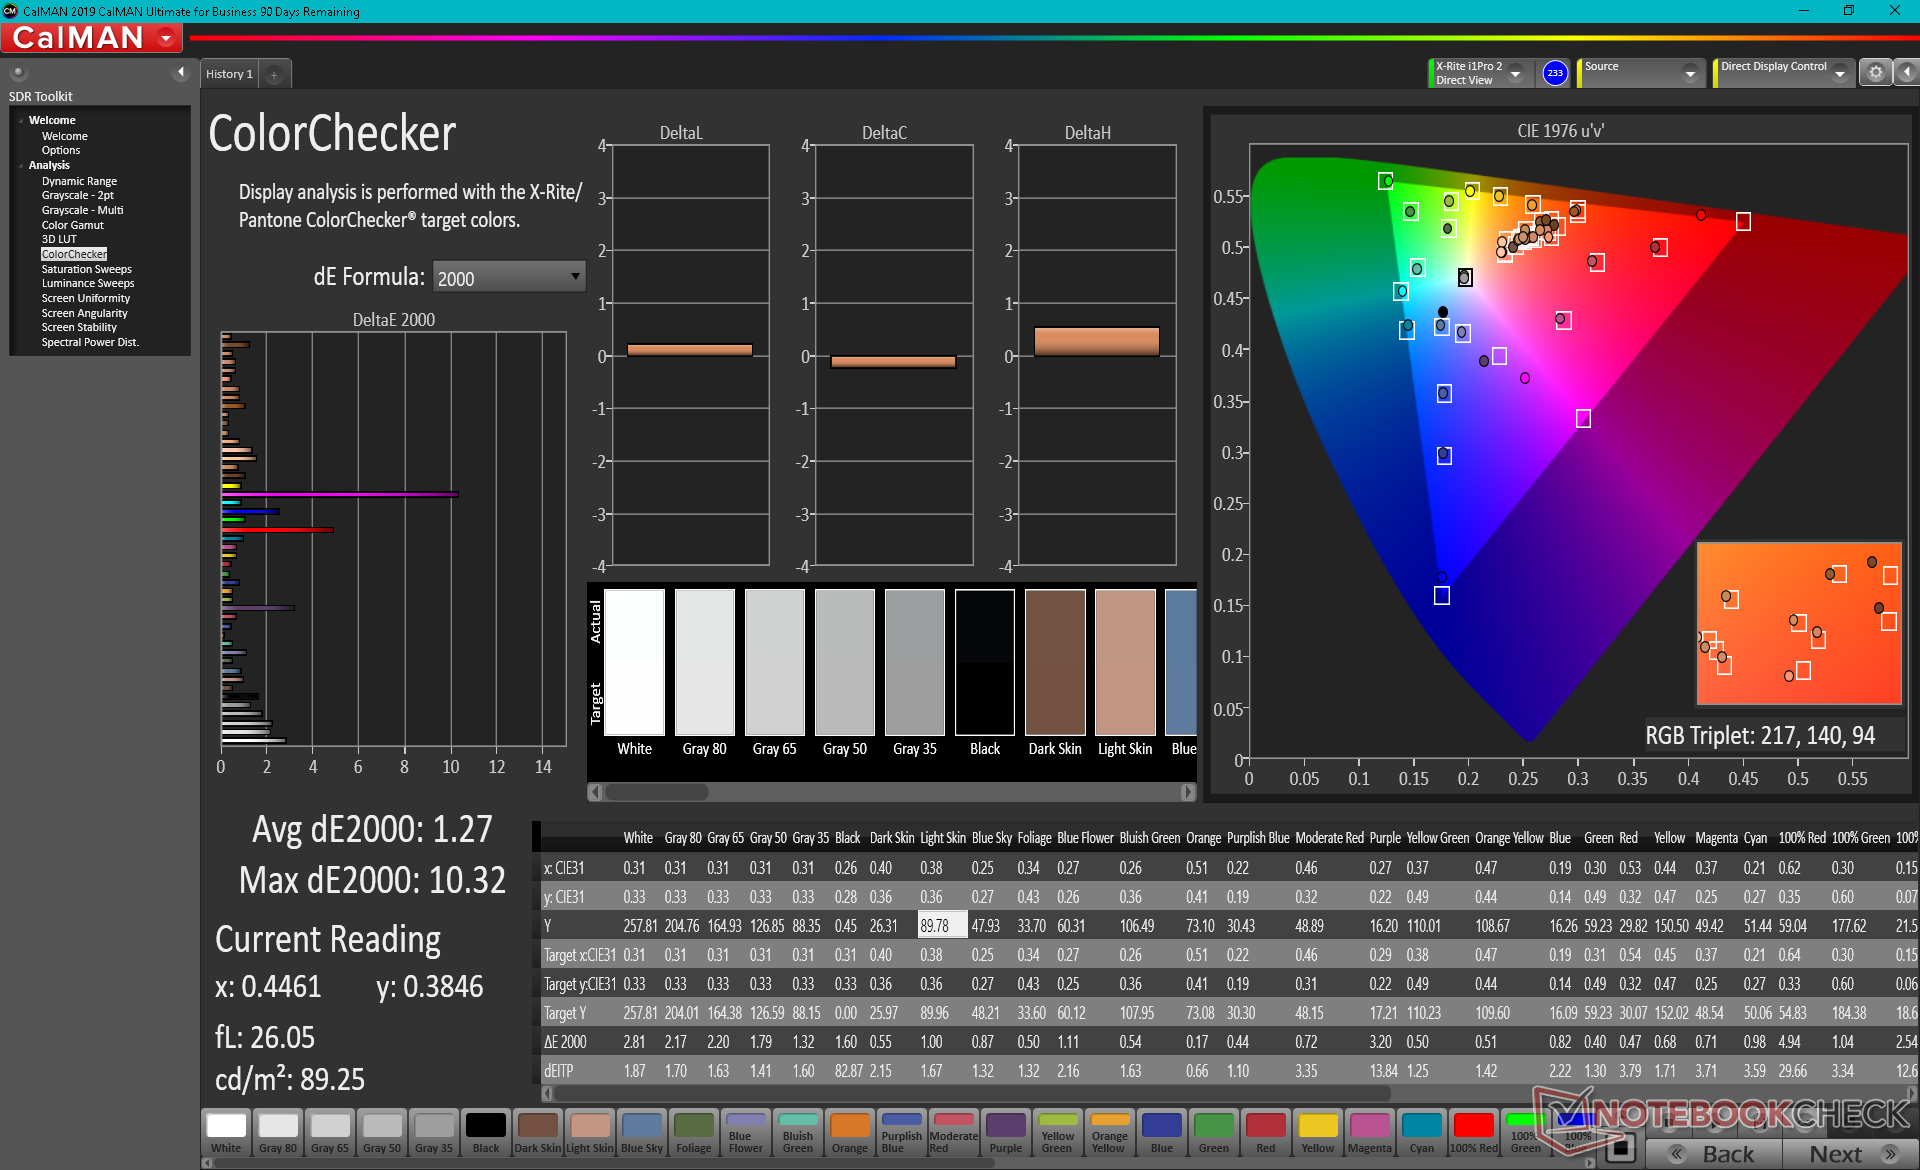
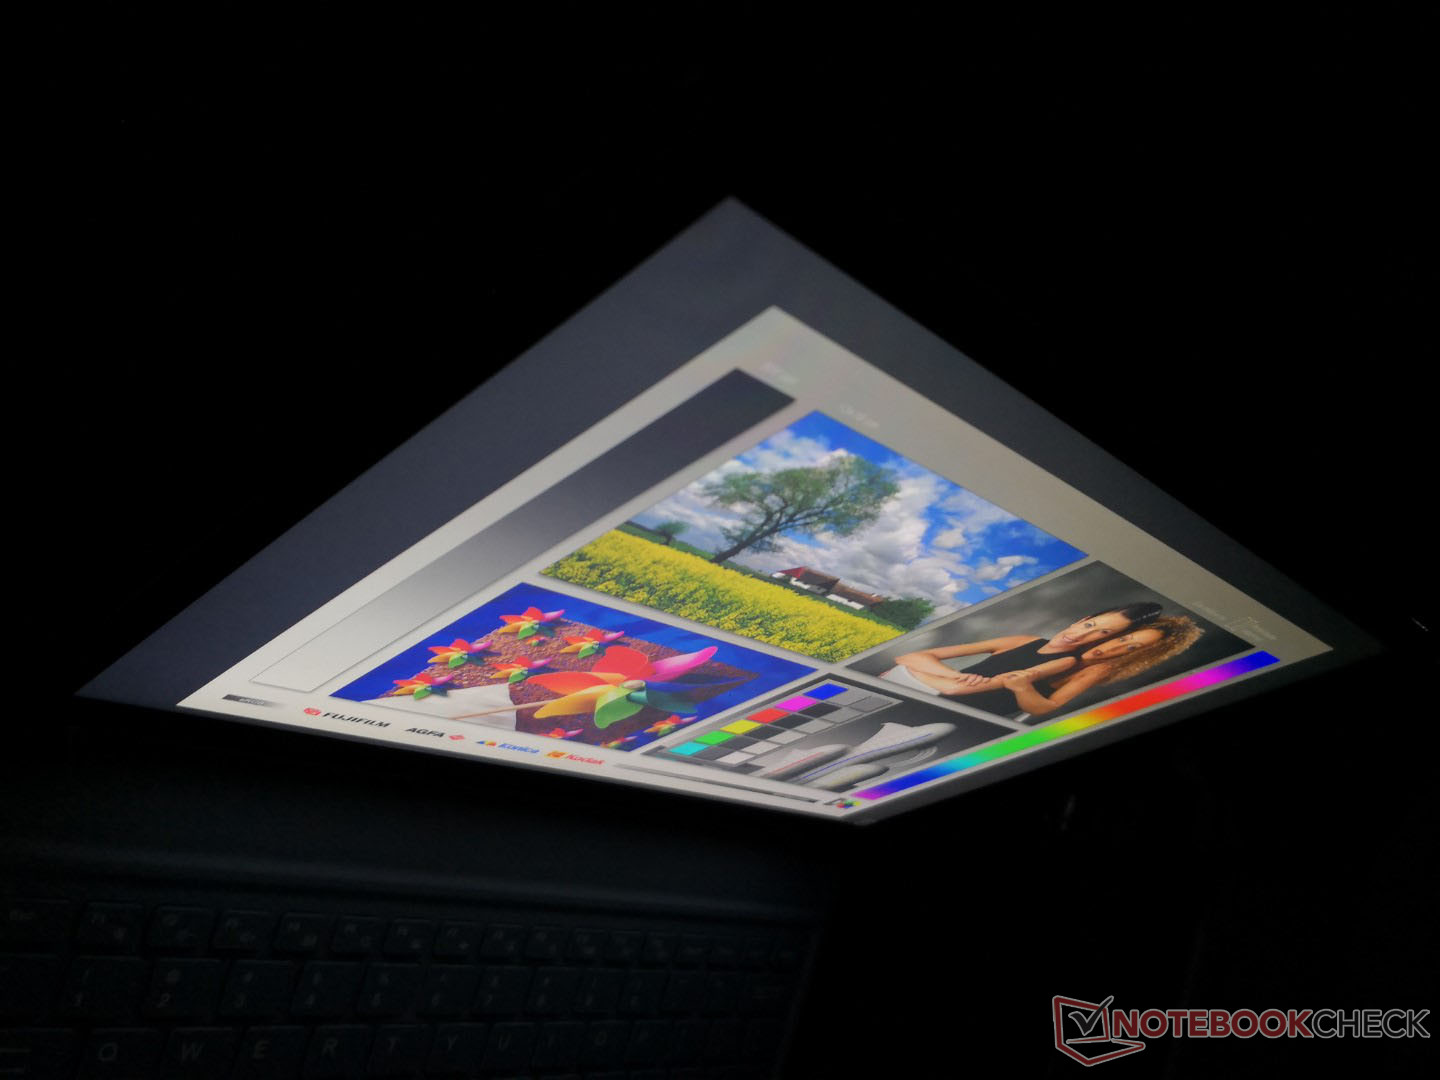
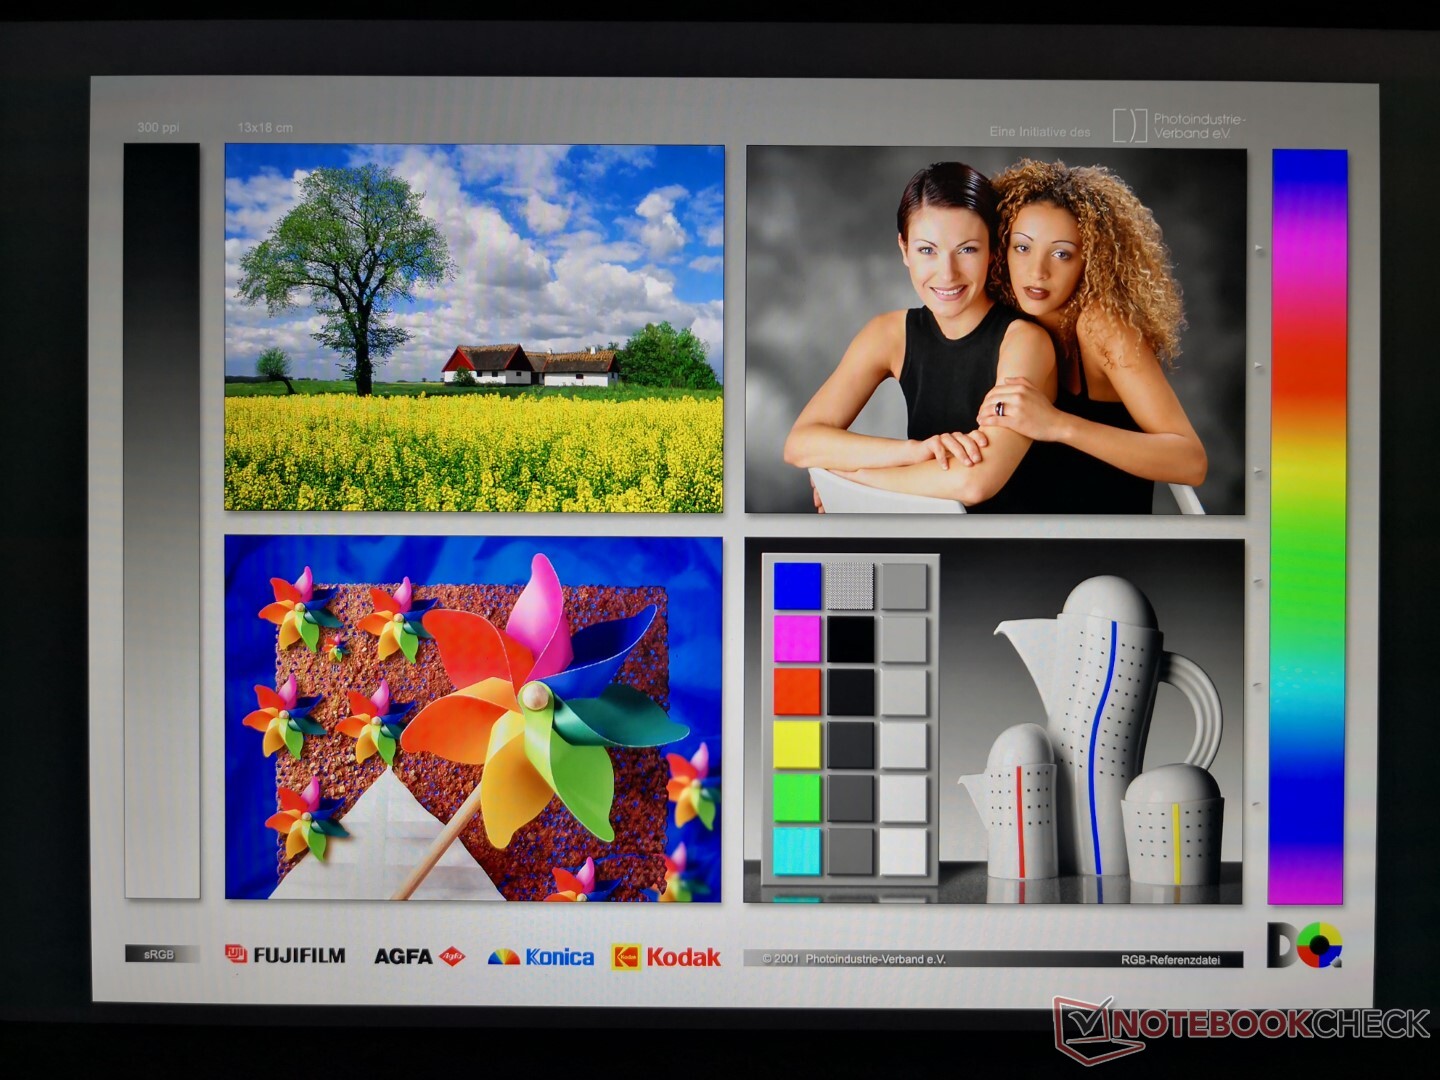
O painel IPS BOE TV126WTM-NU0 de 12,6 polegadas é o primeiro a aparecer em nosso banco de dados. Alguns atributos como tempo de resposta e cobertura de coressão ligeiramente piores do que no Surface Pro que, felizmente, não importam muito quando se navega na web. Outros atributos como a relação de contraste e brilho máximo são escassos e representativos de um painel de orçamento.
| |||||||||||||||||||||||||
iluminação: 87 %
iluminação com acumulador: 269.7 cd/m²
Contraste: 586:1 (Preto: 0.46 cd/m²)
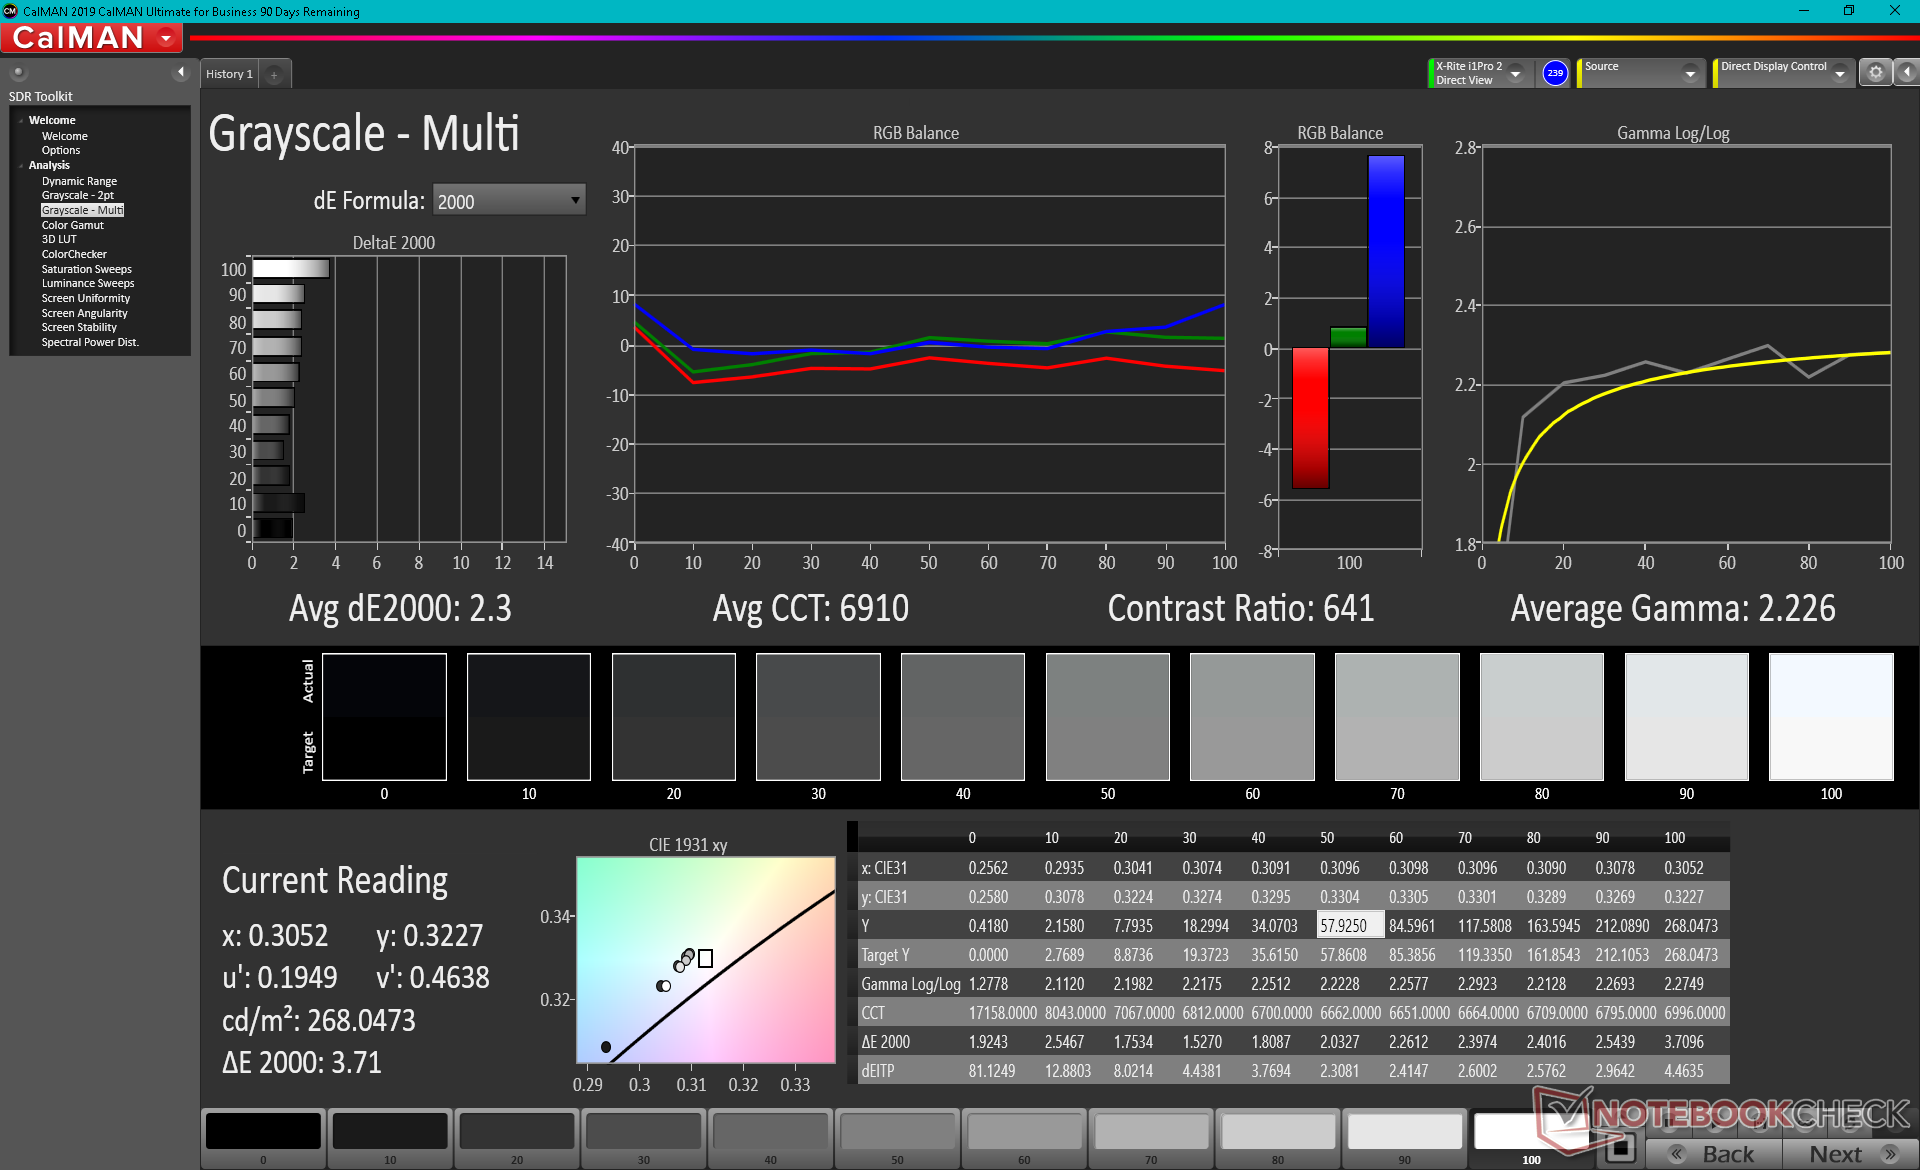
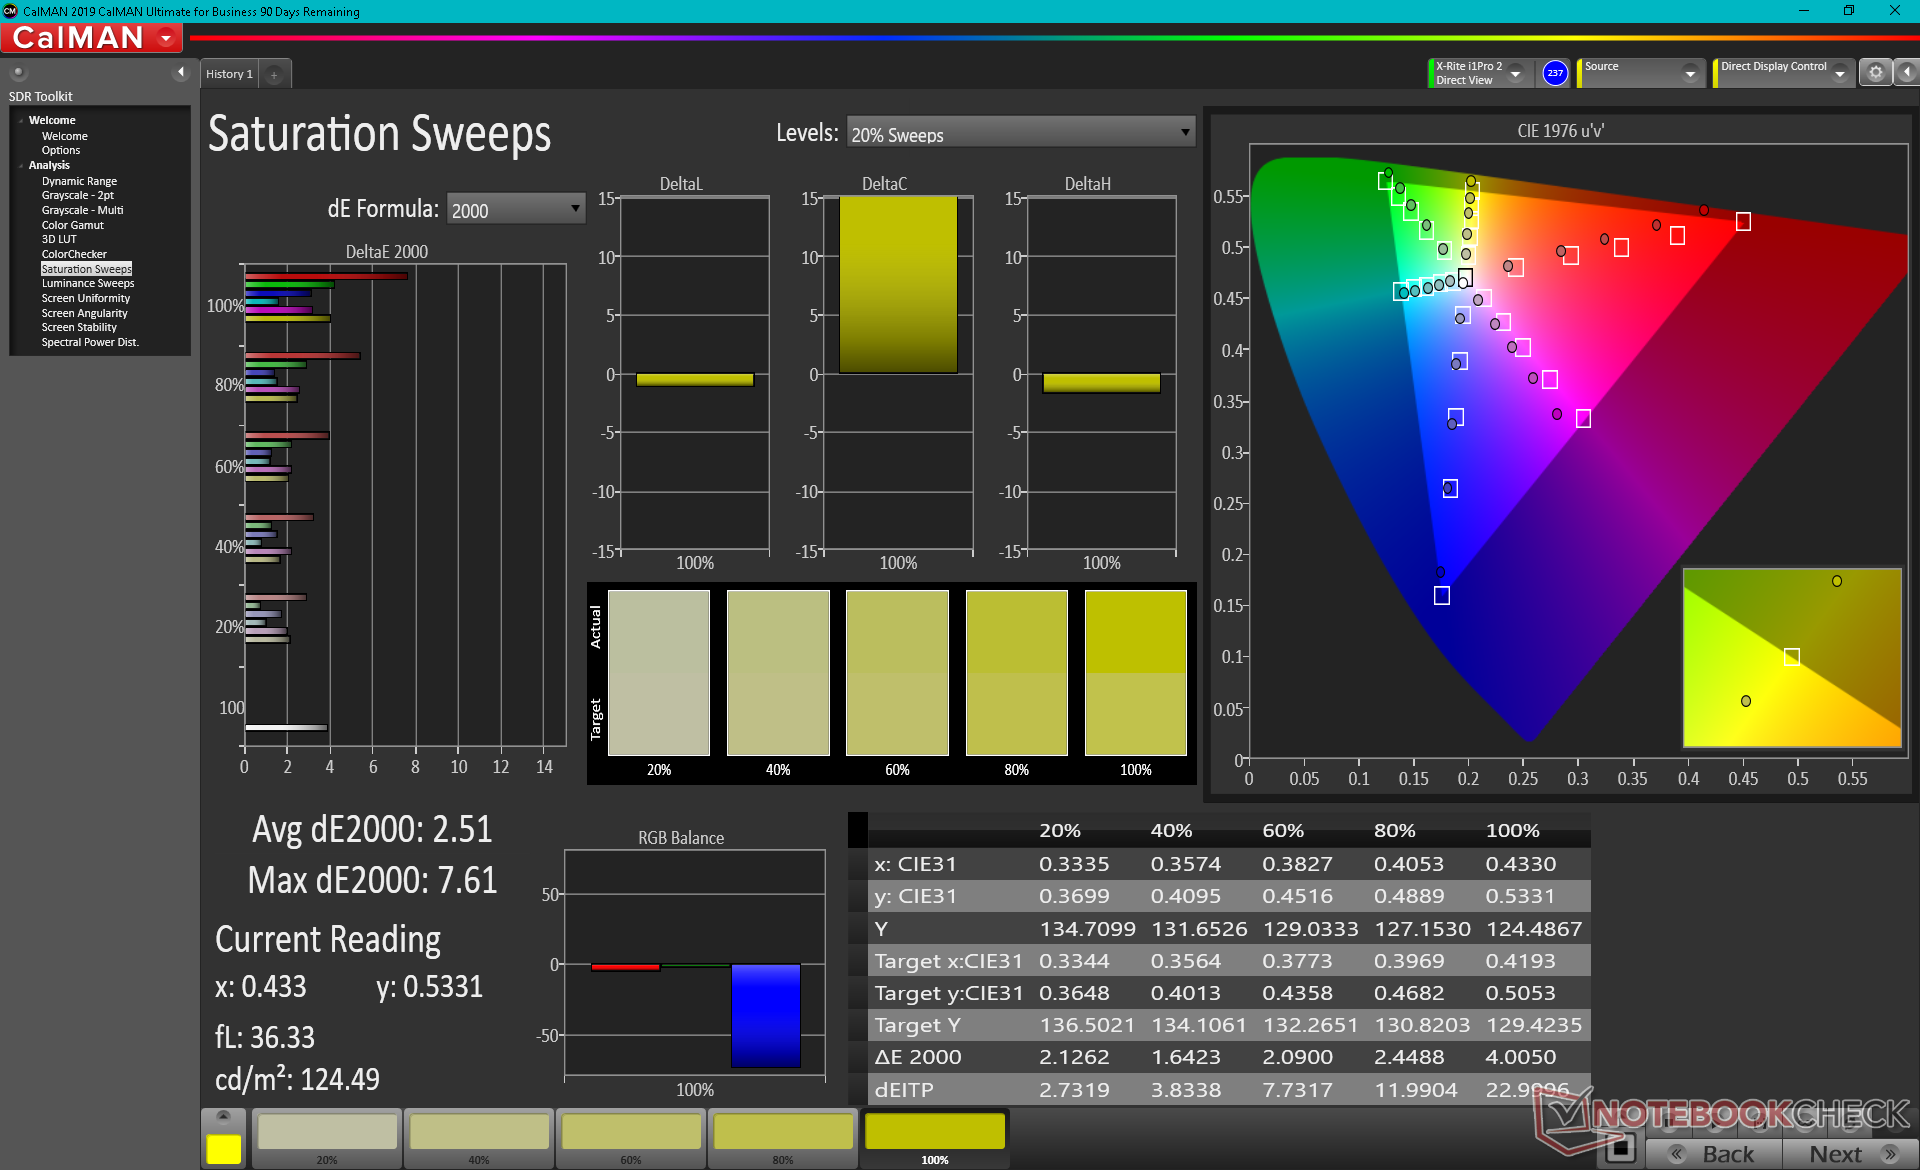
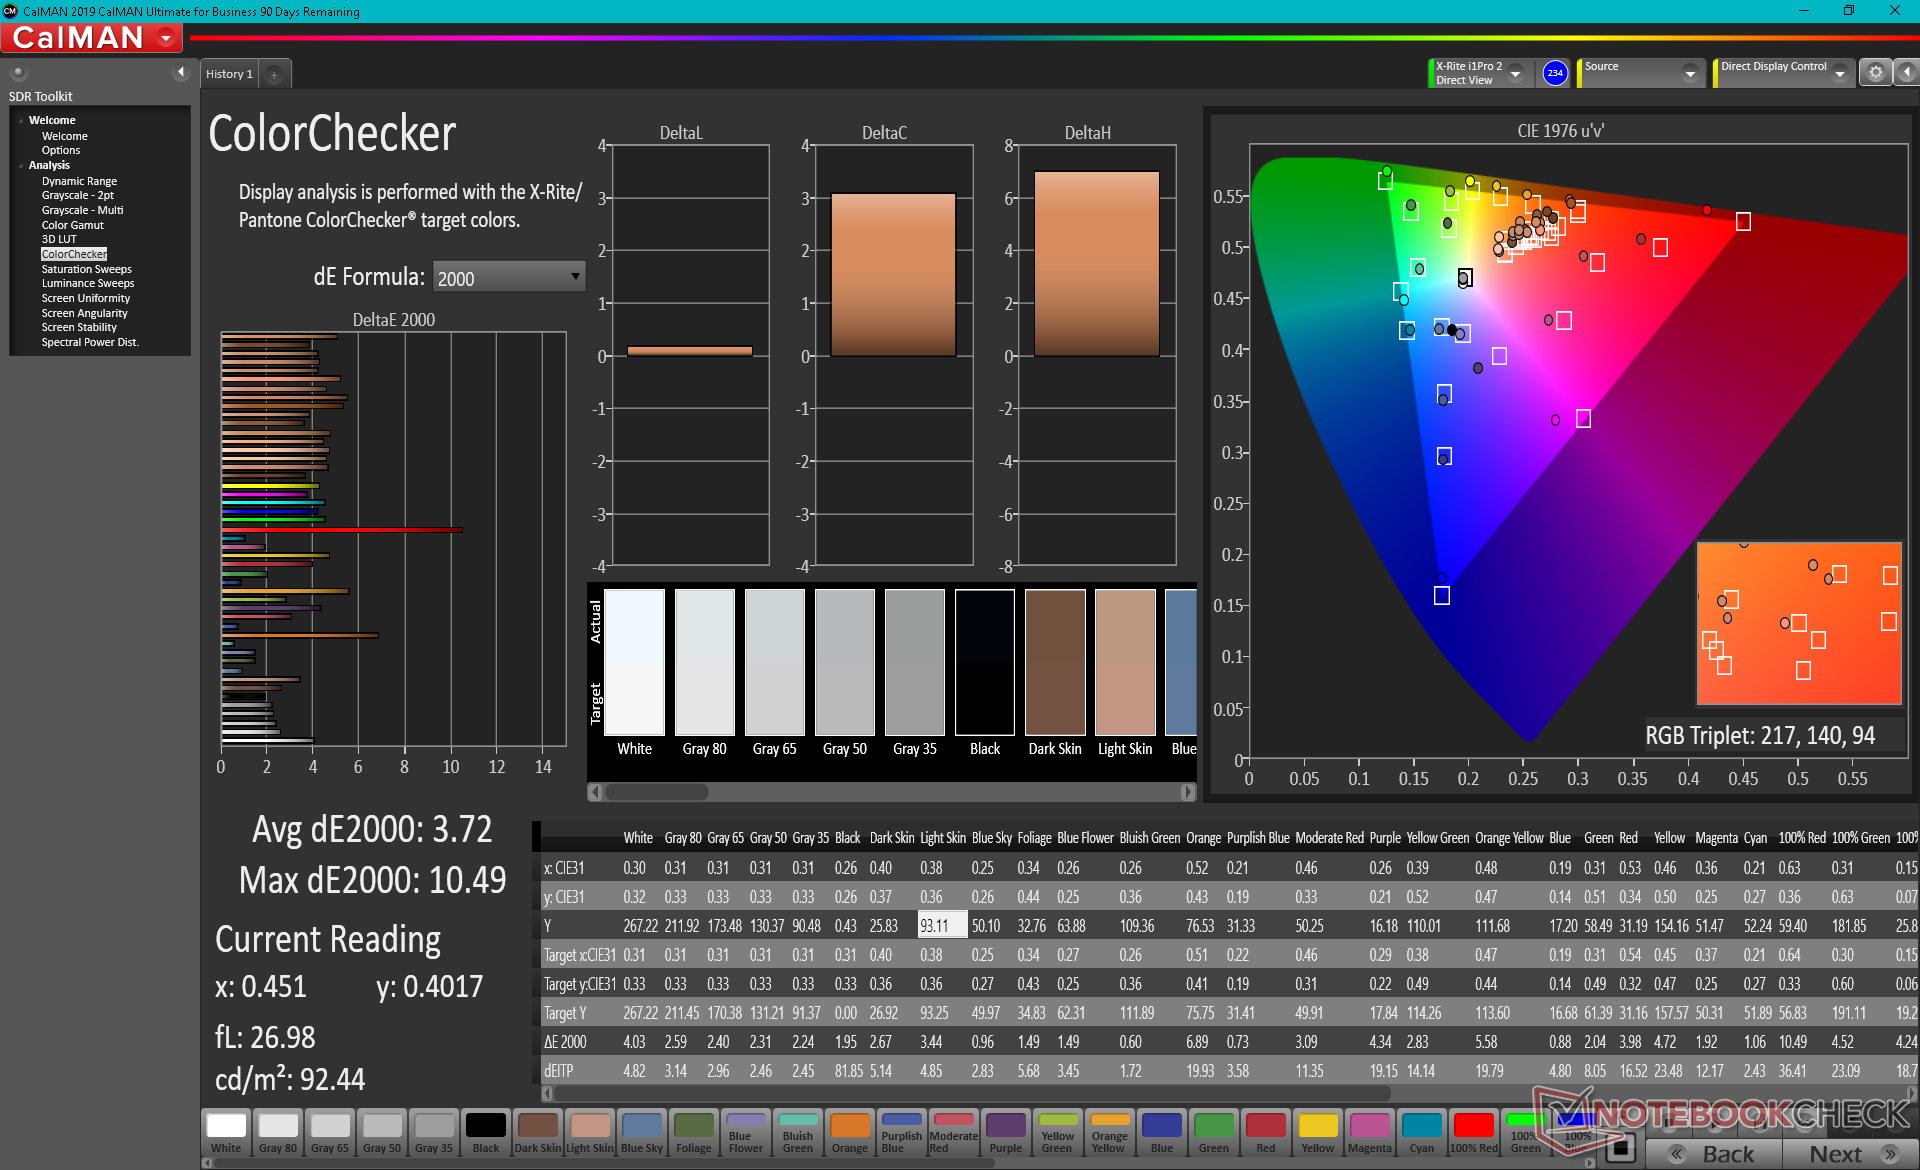
ΔE ColorChecker Calman: 3.72 | ∀{0.5-29.43 Ø4.71}
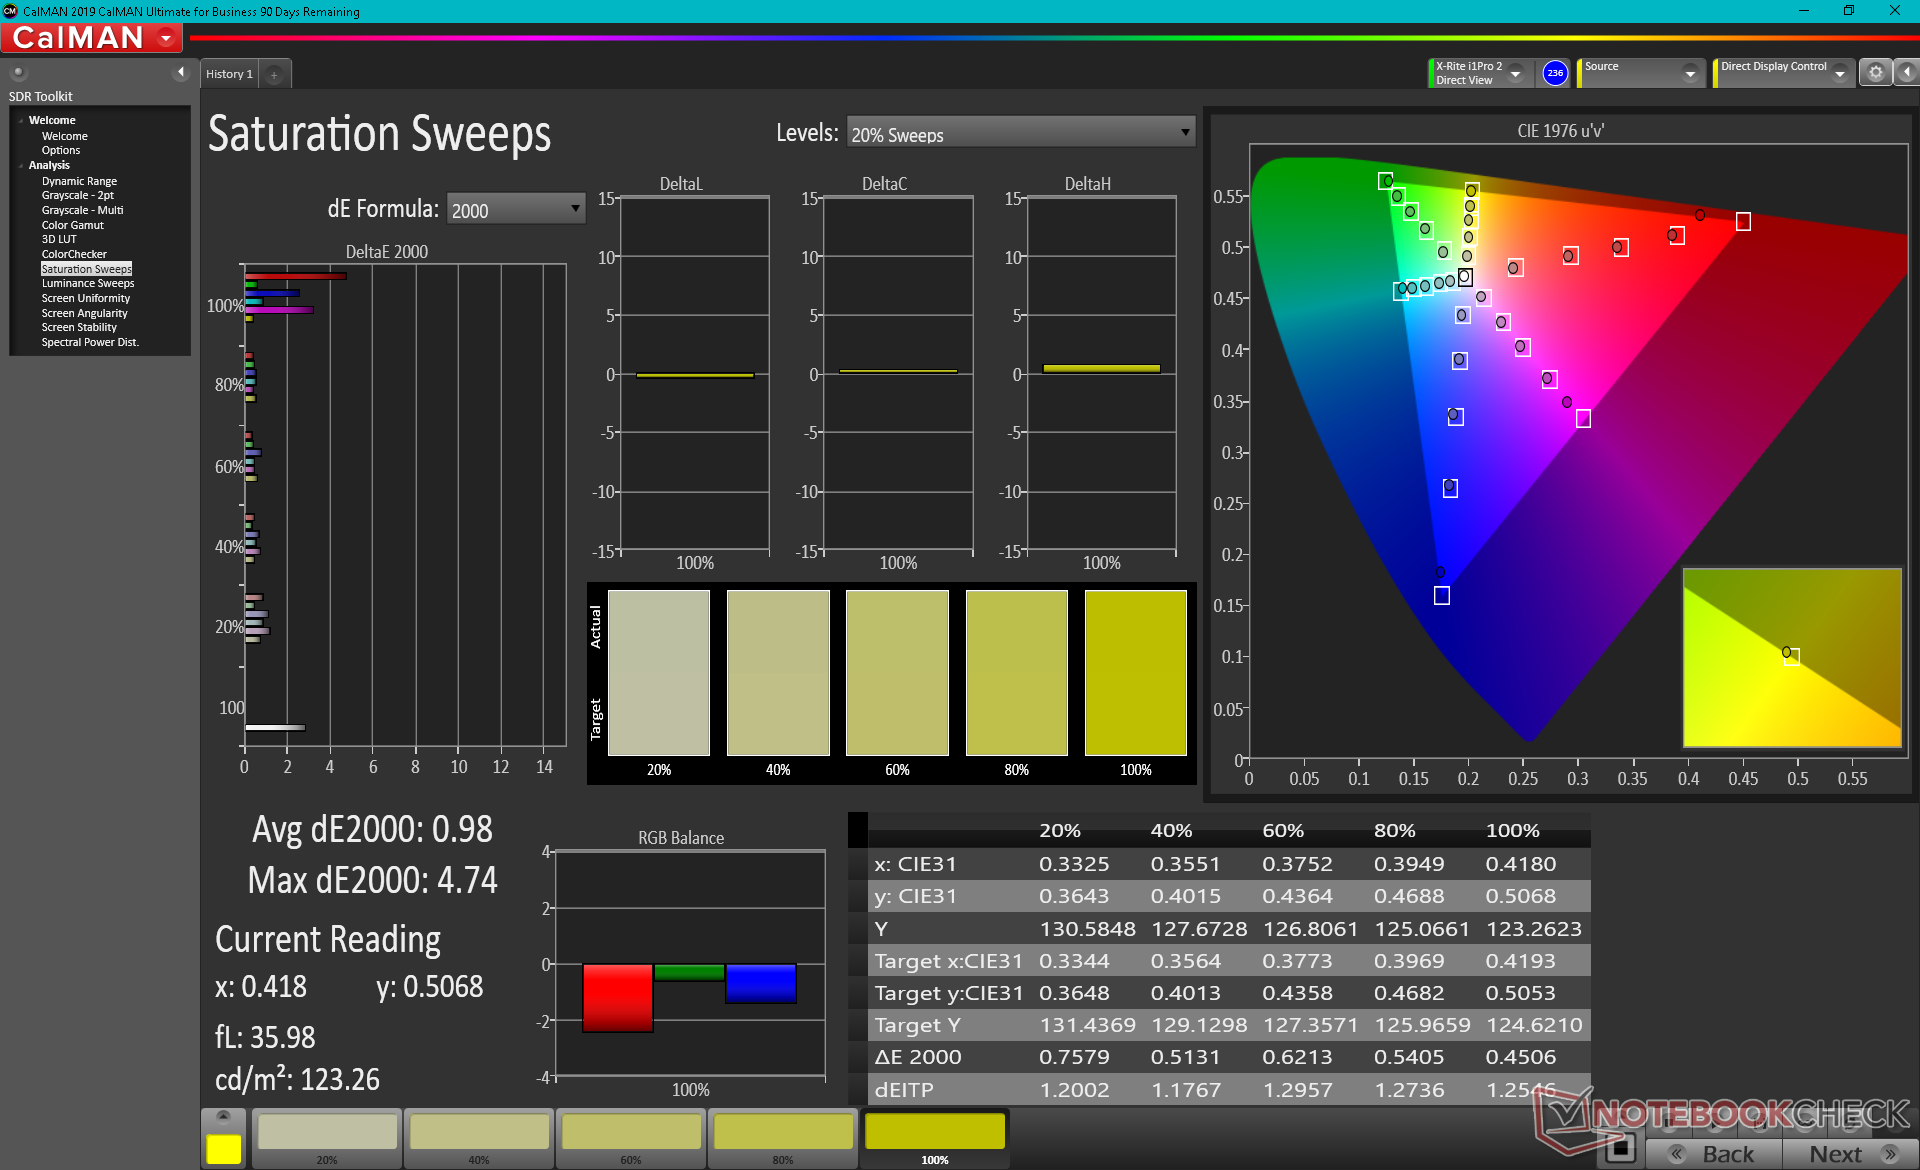
calibrated: 1.27
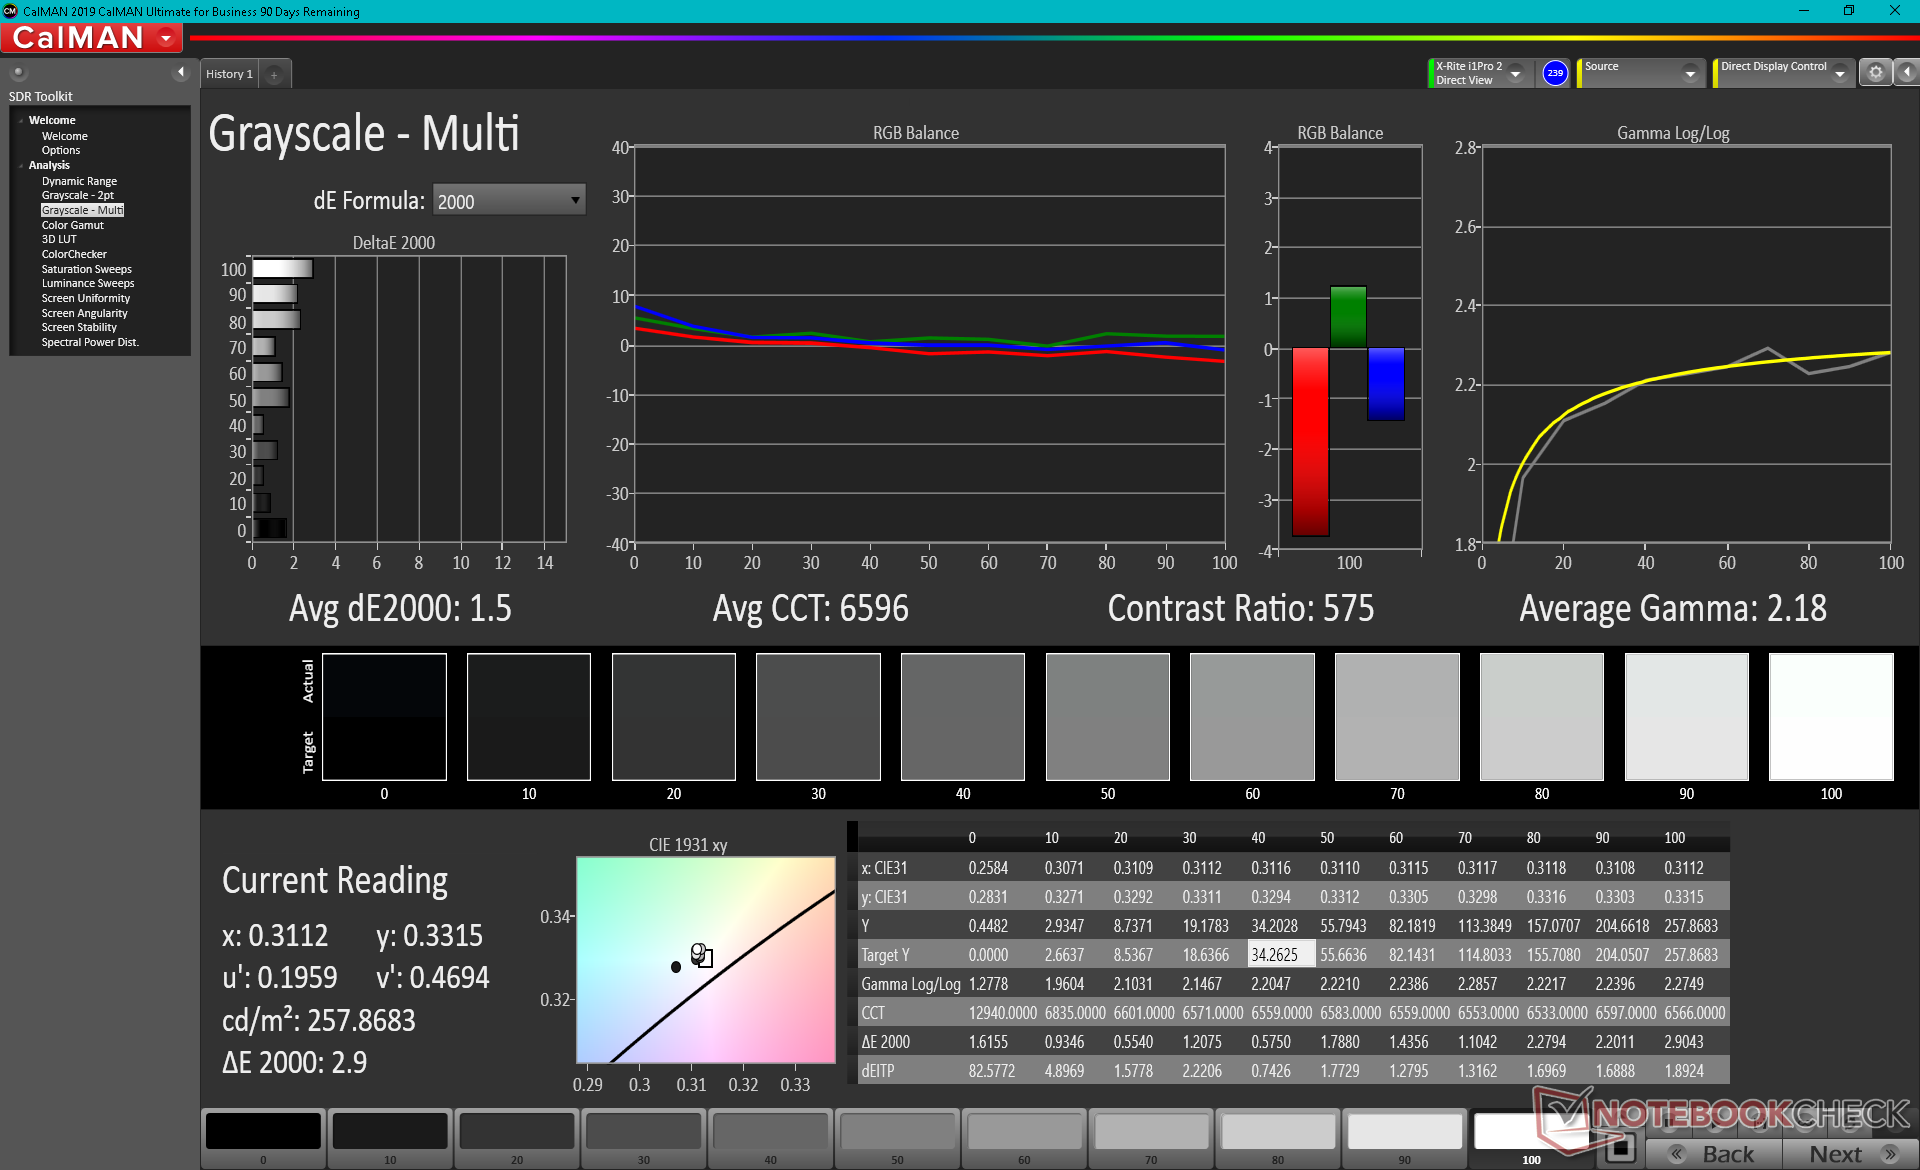
ΔE Greyscale Calman: 2.3 | ∀{0.09-98 Ø4.96}
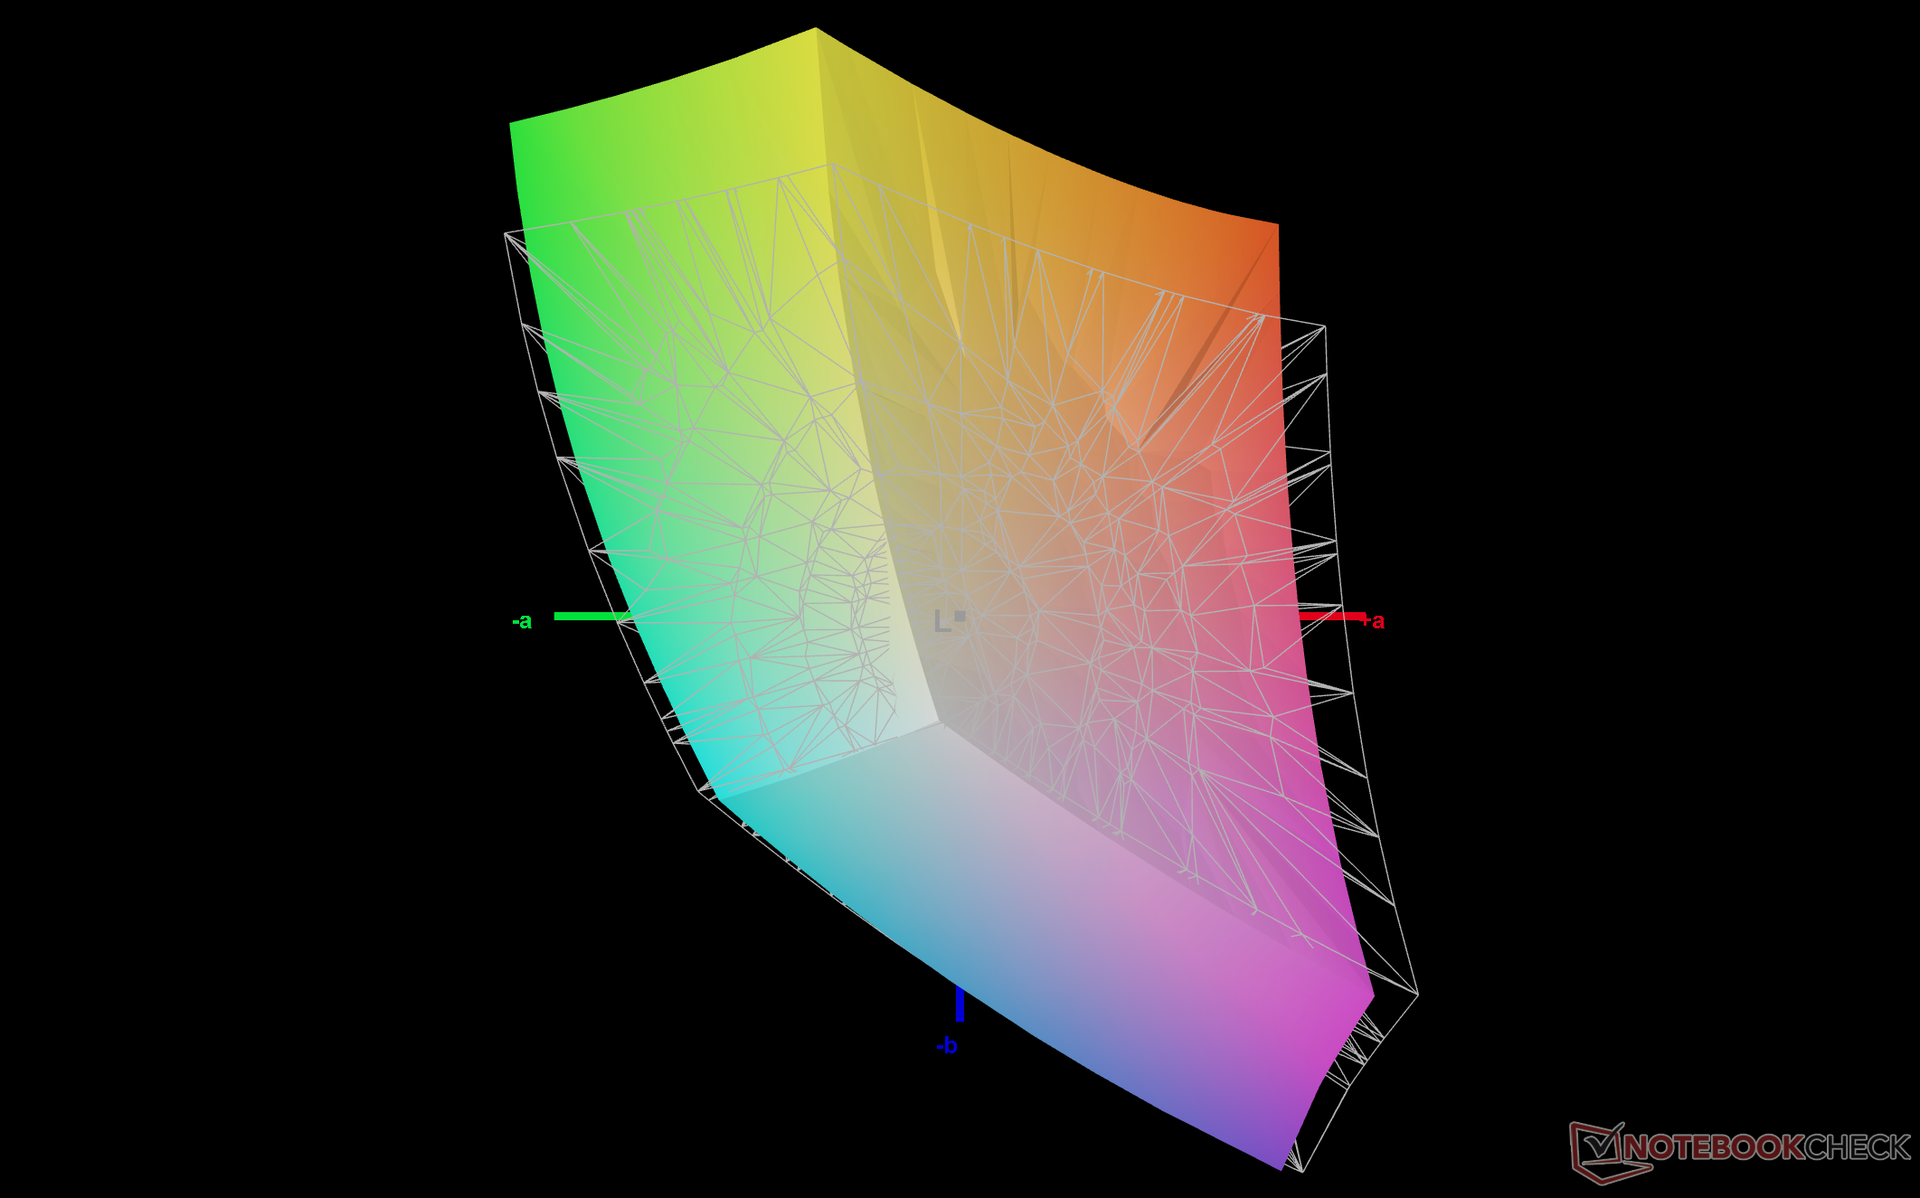
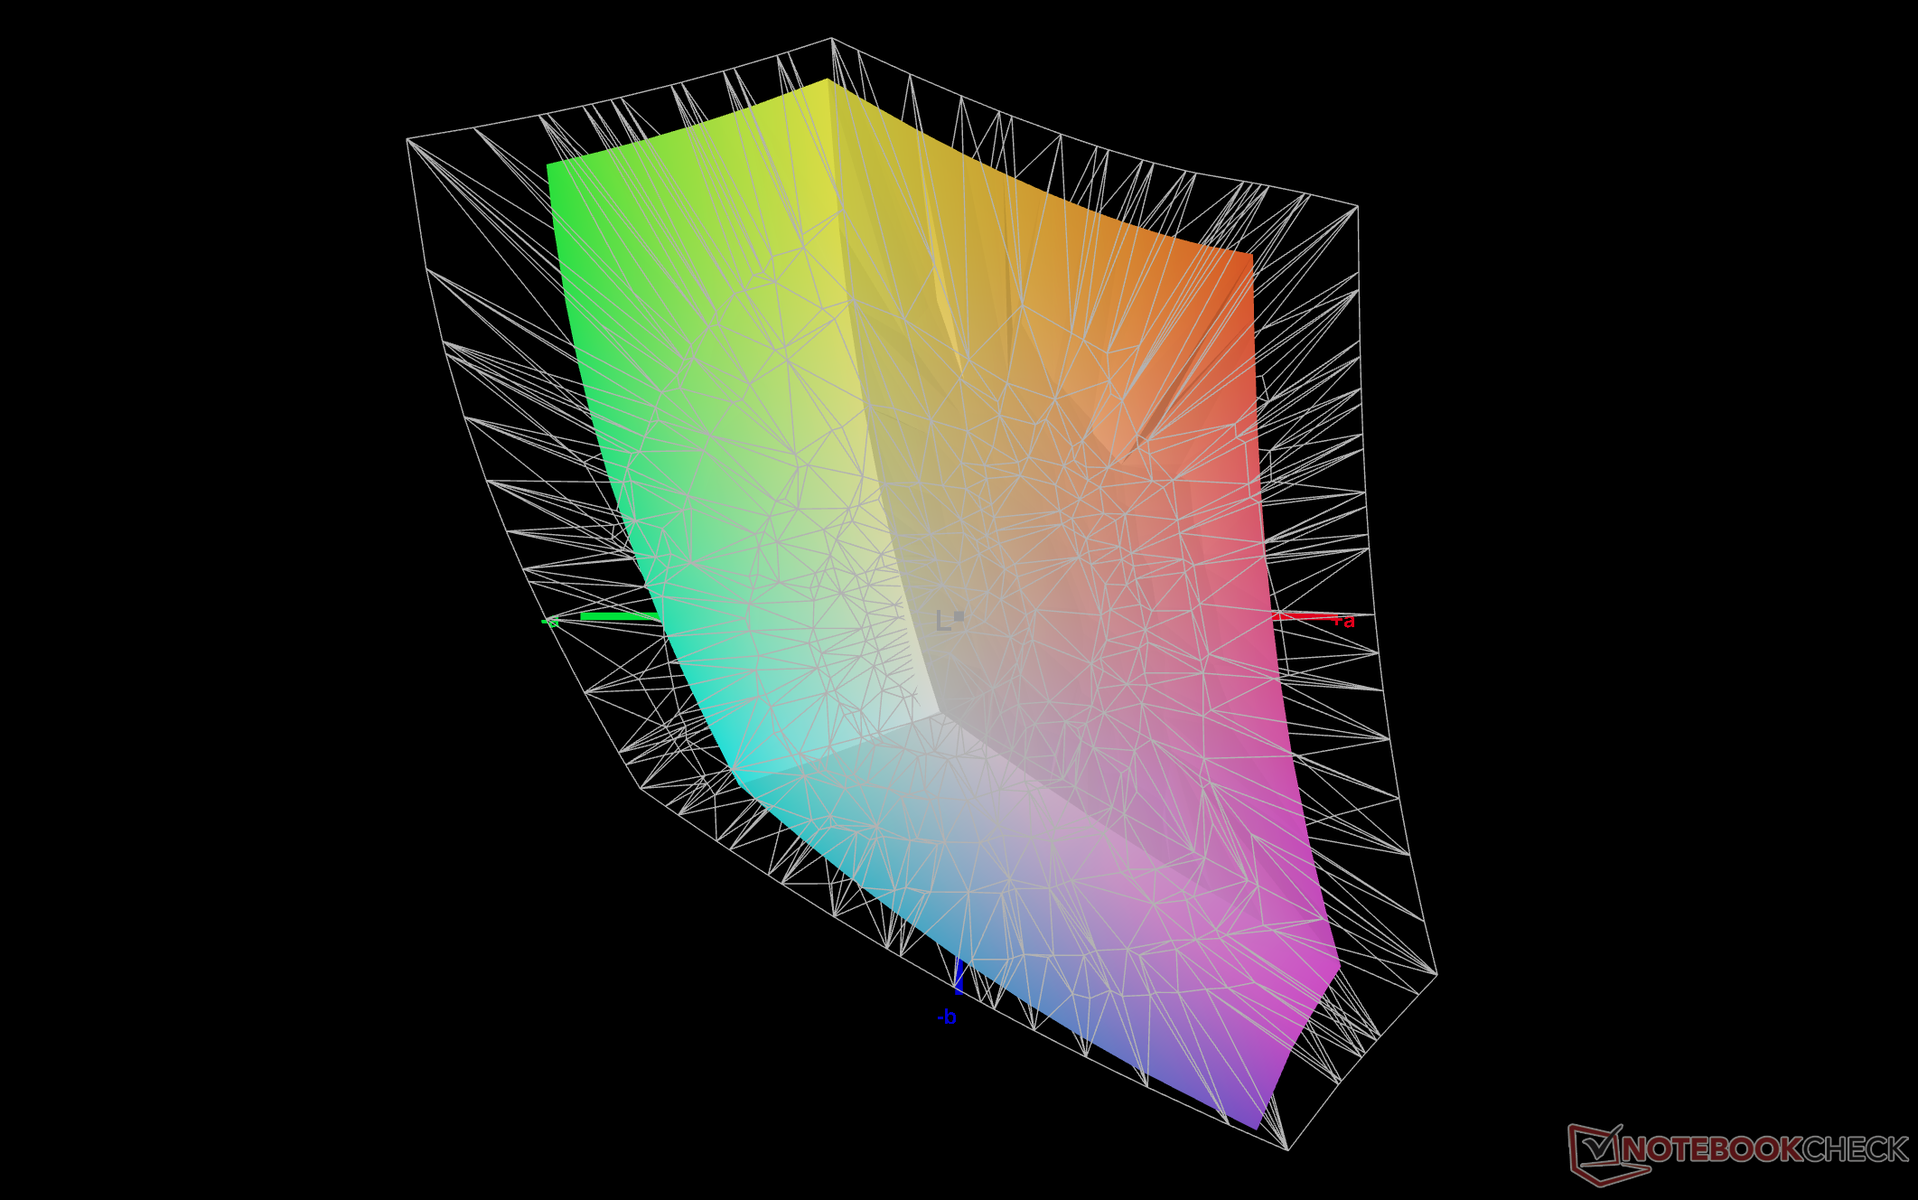
65.3% AdobeRGB 1998 (Argyll 3D)
89.1% sRGB (Argyll 3D)
68.8% Display P3 (Argyll 3D)
Gamma: 2.23
CCT: 6910 K
| Kuu LeBook 12.6 Core i7-8550U BOE TV126WTM-NU0, IPS, 12.6", 2160x1440 | Lenovo ThinkPad X12 20UVS03G00 N123NCA-GS1, a-Si IPS LED, 12.3", 1920x1280 | Microsoft Surface Pro 7 Plus LG Philips LP123WQ332684, IPS, 12.3", 2736x1824 | Dell Latitude 12 7210 2-in-1 Sharp LQ123N1, IPS, 12.3", 1920x1280 | Microsoft Surface Laptop Go Core i5 LG Philips LP125WX112403, IPS, 12.4", 1536x1024 | NuVision Encite Book 12 Plus Sharp SHP142C, IPS, 12.5", 2560x1440 | |
|---|---|---|---|---|---|---|
| Display | 4% | 4% | 4% | 0% | 12% | |
| Display P3 Coverage (%) | 68.8 | 67 -3% | 66.9 -3% | 67.9 -1% | 64.4 -6% | 74.8 9% |
| sRGB Coverage (%) | 89.1 | 99.2 11% | 96.7 9% | 96.8 9% | 94.6 6% | 98.9 11% |
| AdobeRGB 1998 Coverage (%) | 65.3 | 68.8 5% | 69.1 6% | 68.8 5% | 65.7 1% | 75.6 16% |
| Response Times | -29% | -11% | 42% | 15% | 8% | |
| Response Time Grey 50% / Grey 80% * (ms) | 42 ? | 63.2 ? -50% | 50.8 ? -21% | 29 ? 31% | 34.8 ? 17% | 37.6 ? 10% |
| Response Time Black / White * (ms) | 33.2 ? | 36 ? -8% | 33.6 ? -1% | 16 ? 52% | 29.2 ? 12% | 31.6 ? 5% |
| PWM Frequency (Hz) | 199.2 ? | 1250 ? | 21930 ? | 198.4 ? | ||
| Screen | 70% | 45% | 38% | 44% | 4% | |
| Brightness middle (cd/m²) | 269.7 | 419 55% | 408 51% | 380 41% | 354.3 31% | 431.5 60% |
| Brightness (cd/m²) | 256 | 406 59% | 425 66% | 378 48% | 353 38% | 406 59% |
| Brightness Distribution (%) | 87 | 94 8% | 85 -2% | 86 -1% | 95 9% | 80 -8% |
| Black Level * (cd/m²) | 0.46 | 0.23 50% | 0.34 26% | 0.31 33% | 0.29 37% | 0.43 7% |
| Contrast (:1) | 586 | 1822 211% | 1200 105% | 1226 109% | 1222 109% | 1003 71% |
| Colorchecker dE 2000 * | 3.72 | 1.1 70% | 1.5 60% | 2.28 39% | 1.41 62% | 3.56 4% |
| Colorchecker dE 2000 max. * | 10.49 | 2.2 79% | 2.5 76% | 3.93 63% | 2.96 72% | 7 33% |
| Colorchecker dE 2000 calibrated * | 1.27 | 0.5 61% | 1.4 -10% | 0.97 24% | 1.44 -13% | 3.34 -163% |
| Greyscale dE 2000 * | 2.3 | 1.5 35% | 1.6 30% | 2.56 -11% | 1.2 48% | 2.9 -26% |
| Gamma | 2.23 99% | 2.06 107% | 2.05 107% | 2.32 95% | 2.26 97% | 2.2 100% |
| CCT | 6910 94% | 6524 100% | 6432 101% | 6130 106% | 6600 98% | 6572 99% |
| Color Space (Percent of AdobeRGB 1998) (%) | 62.8 | 63.7 | 63 | 60.2 | 66.7 | |
| Color Space (Percent of sRGB) (%) | 99.2 | 96.8 | 97 | 94.4 | 98.9 | |
| Média Total (Programa/Configurações) | 15% /
42% | 13% /
28% | 28% /
32% | 20% /
30% | 8% /
6% |
* ... menor é melhor
O espaço de cor é amplo em aproximadamente 89% do sRGB em comparação com >95% em Ultrabooks e tabletes de preço. A reprodução de cores é mais ou menos comparável com a exibição no Superfície Laptop Go.
O display é decentemente calibrado fora da caixa, apesar do preço inicial barato. A temperatura da cor é um pouco fria demais, mas uma calibração trata disso sem nenhum problema. Os valores finais médios de escala de cinza e deltaE ColorChecker de apenas 1,5 e 1,27, respectivamente, são melhores do que esperávamos inicialmente. Os tons de magenta podem ser mais imprecisos do que outras cores, no entanto.
Exibir tempos de resposta
| ↔ Tempo de resposta preto para branco | ||
|---|---|---|
| 33.2 ms ... ascensão ↗ e queda ↘ combinadas | ↗ 19.2 ms ascensão | 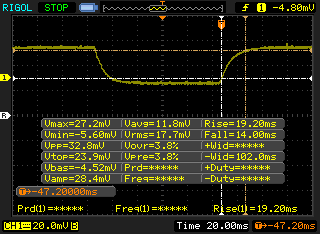 |
| ↘ 14 ms queda | ||
| A tela mostra taxas de resposta lentas em nossos testes e será insatisfatória para os jogadores. Em comparação, todos os dispositivos testados variam de 0.1 (mínimo) a 240 (máximo) ms. » 90 % de todos os dispositivos são melhores. Isso significa que o tempo de resposta medido é pior que a média de todos os dispositivos testados (19.8 ms). | ||
| ↔ Tempo de resposta 50% cinza a 80% cinza | ||
| 42 ms ... ascensão ↗ e queda ↘ combinadas | ↗ 22.4 ms ascensão | 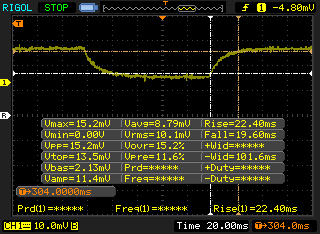 |
| ↘ 19.6 ms queda | ||
| A tela mostra taxas de resposta lentas em nossos testes e será insatisfatória para os jogadores. Em comparação, todos os dispositivos testados variam de 0.165 (mínimo) a 636 (máximo) ms. » 67 % de todos os dispositivos são melhores. Isso significa que o tempo de resposta medido é pior que a média de todos os dispositivos testados (30.9 ms). | ||
Cintilação da tela / PWM (modulação por largura de pulso)
| Tela tremeluzindo / PWM não detectado | 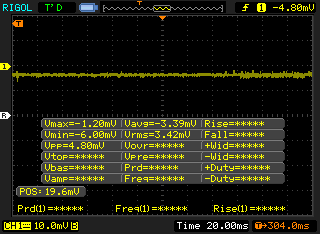 | ||
[pwm_comparison] Em comparação: 52 % de todos os dispositivos testados não usam PWM para escurecer a tela. Se PWM foi detectado, uma média de 7741 (mínimo: 5 - máximo: 343500) Hz foi medida. | |||
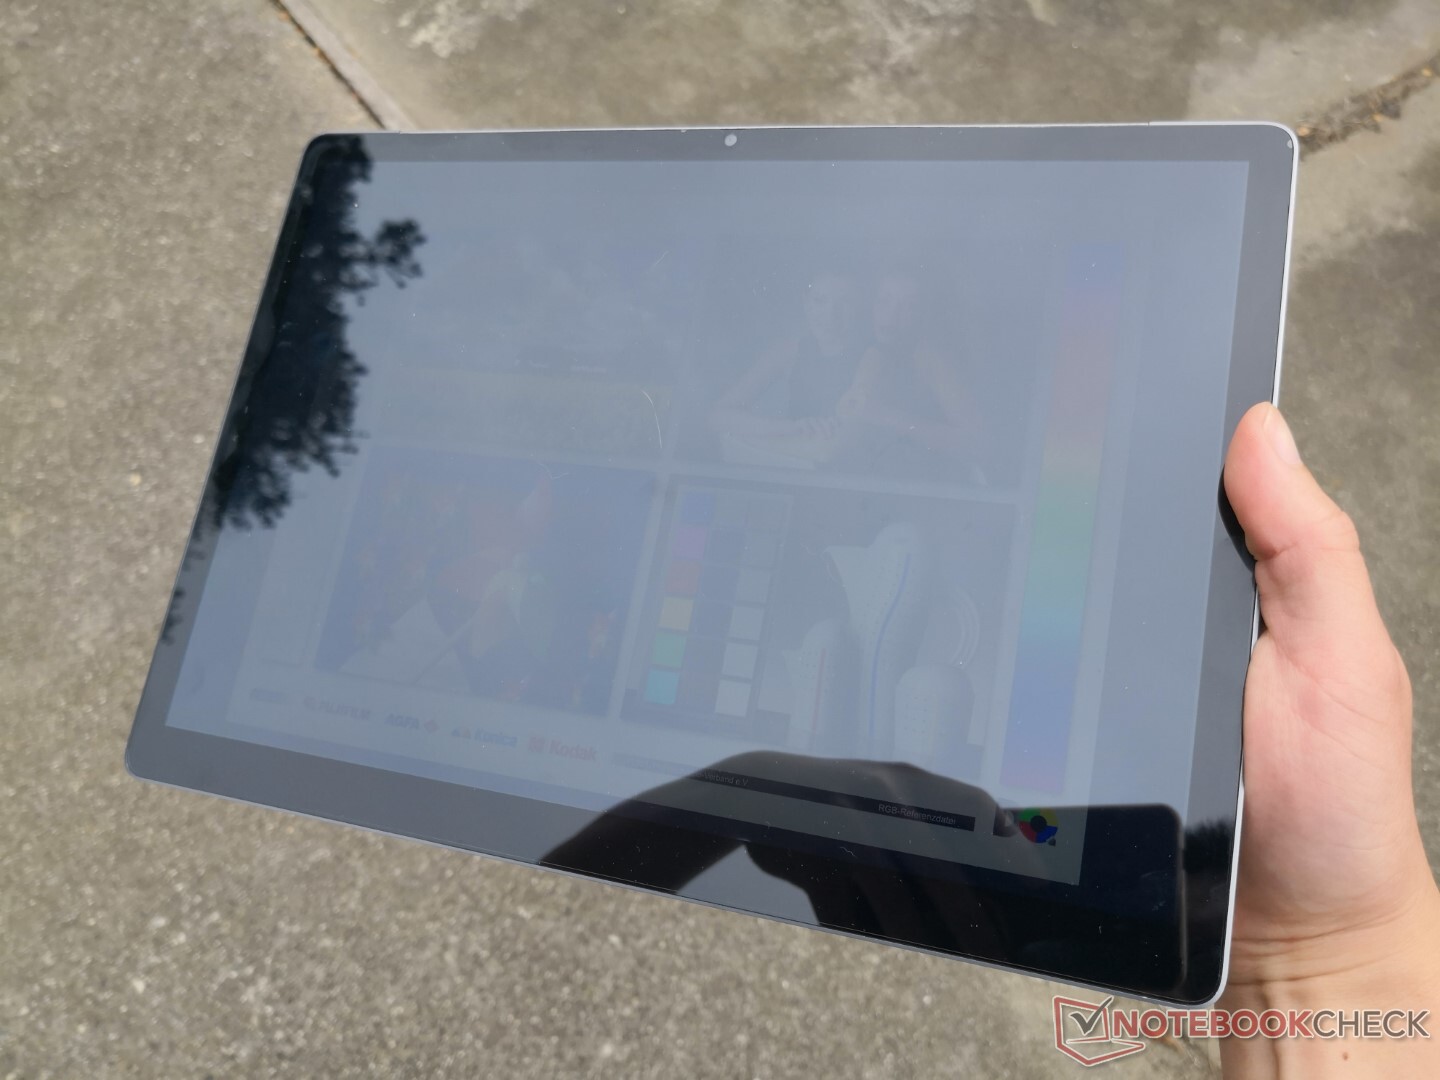
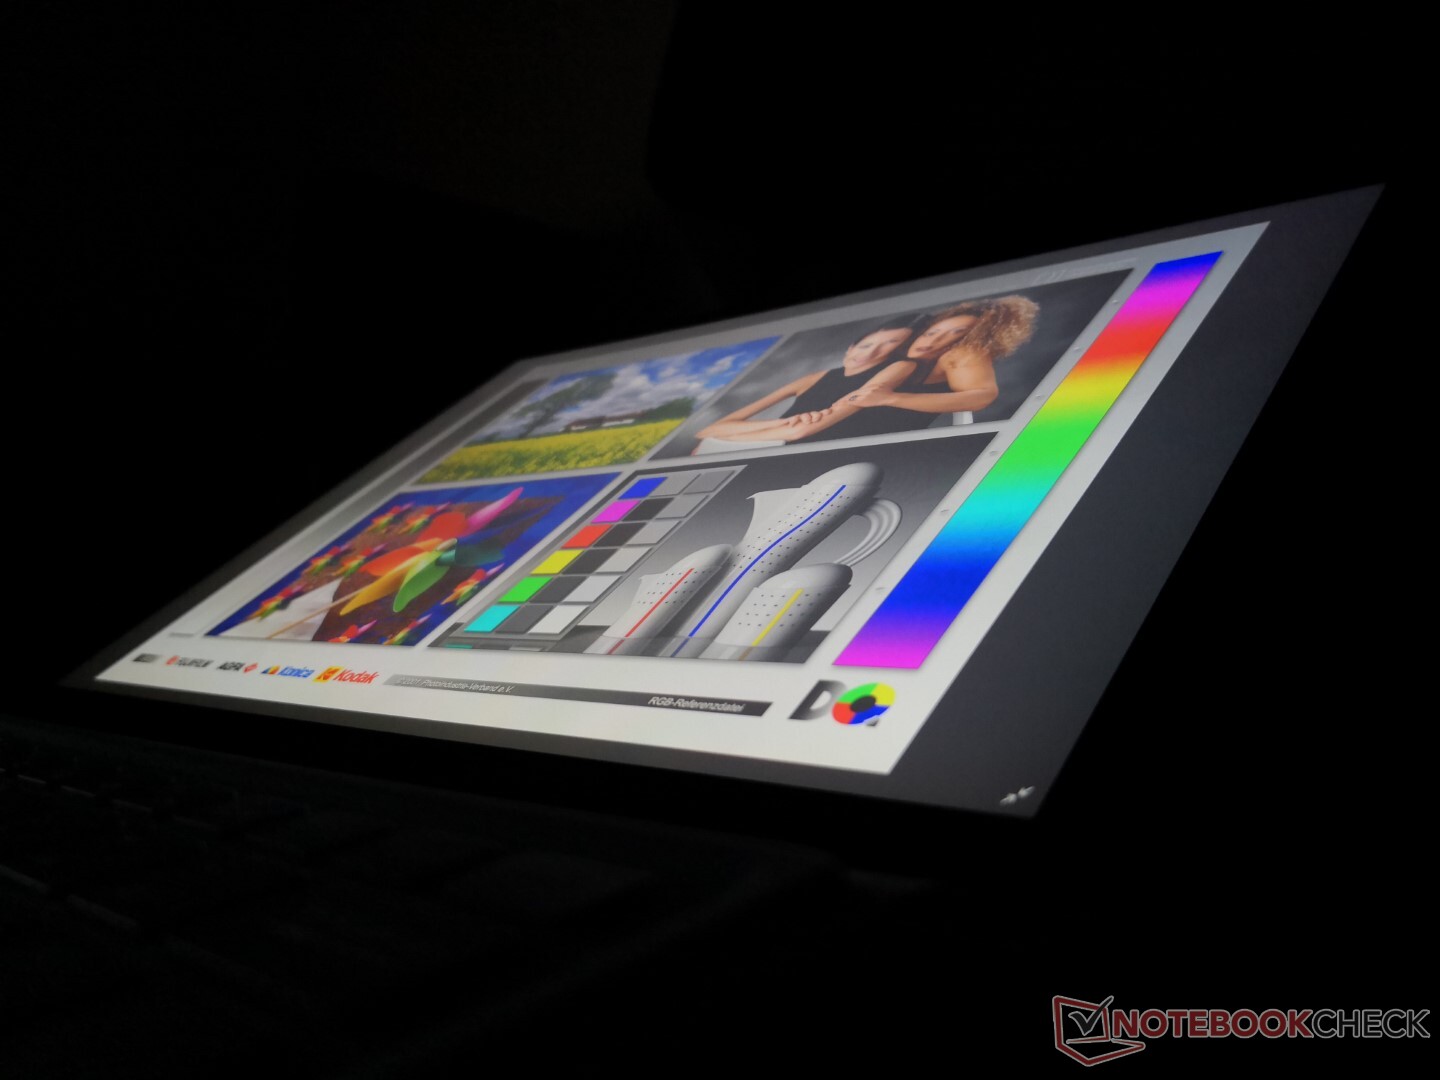
A visibilidade ao ar livre é menor do que na maioria das outras pastilhas, uma vez que o visor é mais escuro. Espere muito brilho inevitável quando sob a maioria das condições externas.
Desempenho
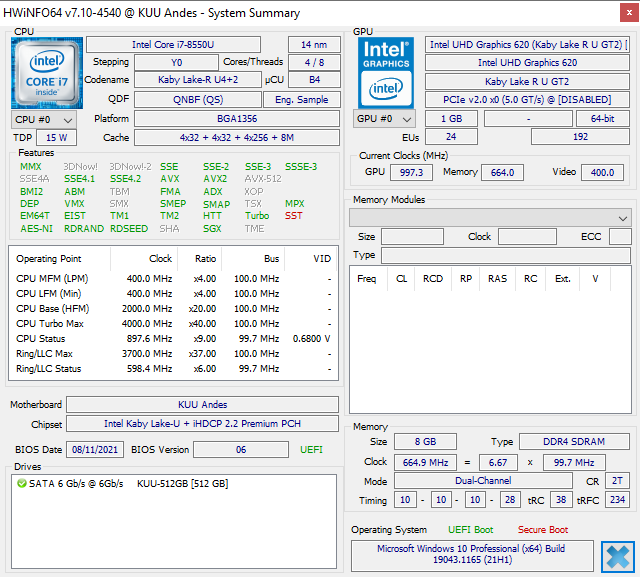
Processador
O desempenho da CPU é cerca de 30% e 45% mais lento do que o mais recente Núcleo i7-1165G7 em cargas de trabalho com rosca única e rosca múltipla, respectivamente. Embora significativa, a diferença não é muito perceptível para tarefas mais simples como navegação na web ou processamento de texto. Certamente ainda é melhor do que um sistema Celeron ou Atom onde as aplicações levam muito mais tempo para serem lançadas ou navegadas.
Cinebench R15 Multi Loop
Cinebench R23: Multi Core | Single Core
Cinebench R15: CPU Multi 64Bit | CPU Single 64Bit
Blender: v2.79 BMW27 CPU
7-Zip 18.03: 7z b 4 -mmt1 | 7z b 4
Geekbench 5.5: Single-Core | Multi-Core
HWBOT x265 Benchmark v2.2: 4k Preset
LibreOffice : 20 Documents To PDF
R Benchmark 2.5: Overall mean
| Cinebench R23 / Multi Core | |
| Framework Laptop 13.5 | |
| Microsoft Surface Pro 7 Plus | |
| Dell Latitude 12 7210 2-in-1 | |
| Lenovo ThinkPad X12 20UVS03G00 | |
| Kuu LeBook 12.6 Core i7-8550U | |
| Média Intel Core i7-8550U (n=1) | |
| Teclast F7 Air | |
| Cinebench R23 / Single Core | |
| Framework Laptop 13.5 | |
| Microsoft Surface Pro 7 Plus | |
| Dell Latitude 12 7210 2-in-1 | |
| Lenovo ThinkPad X12 20UVS03G00 | |
| Kuu LeBook 12.6 Core i7-8550U | |
| Média Intel Core i7-8550U (n=1) | |
| Teclast F7 Air | |
Cinebench R23: Multi Core | Single Core
Cinebench R15: CPU Multi 64Bit | CPU Single 64Bit
Blender: v2.79 BMW27 CPU
7-Zip 18.03: 7z b 4 -mmt1 | 7z b 4
Geekbench 5.5: Single-Core | Multi-Core
HWBOT x265 Benchmark v2.2: 4k Preset
LibreOffice : 20 Documents To PDF
R Benchmark 2.5: Overall mean
* ... menor é melhor
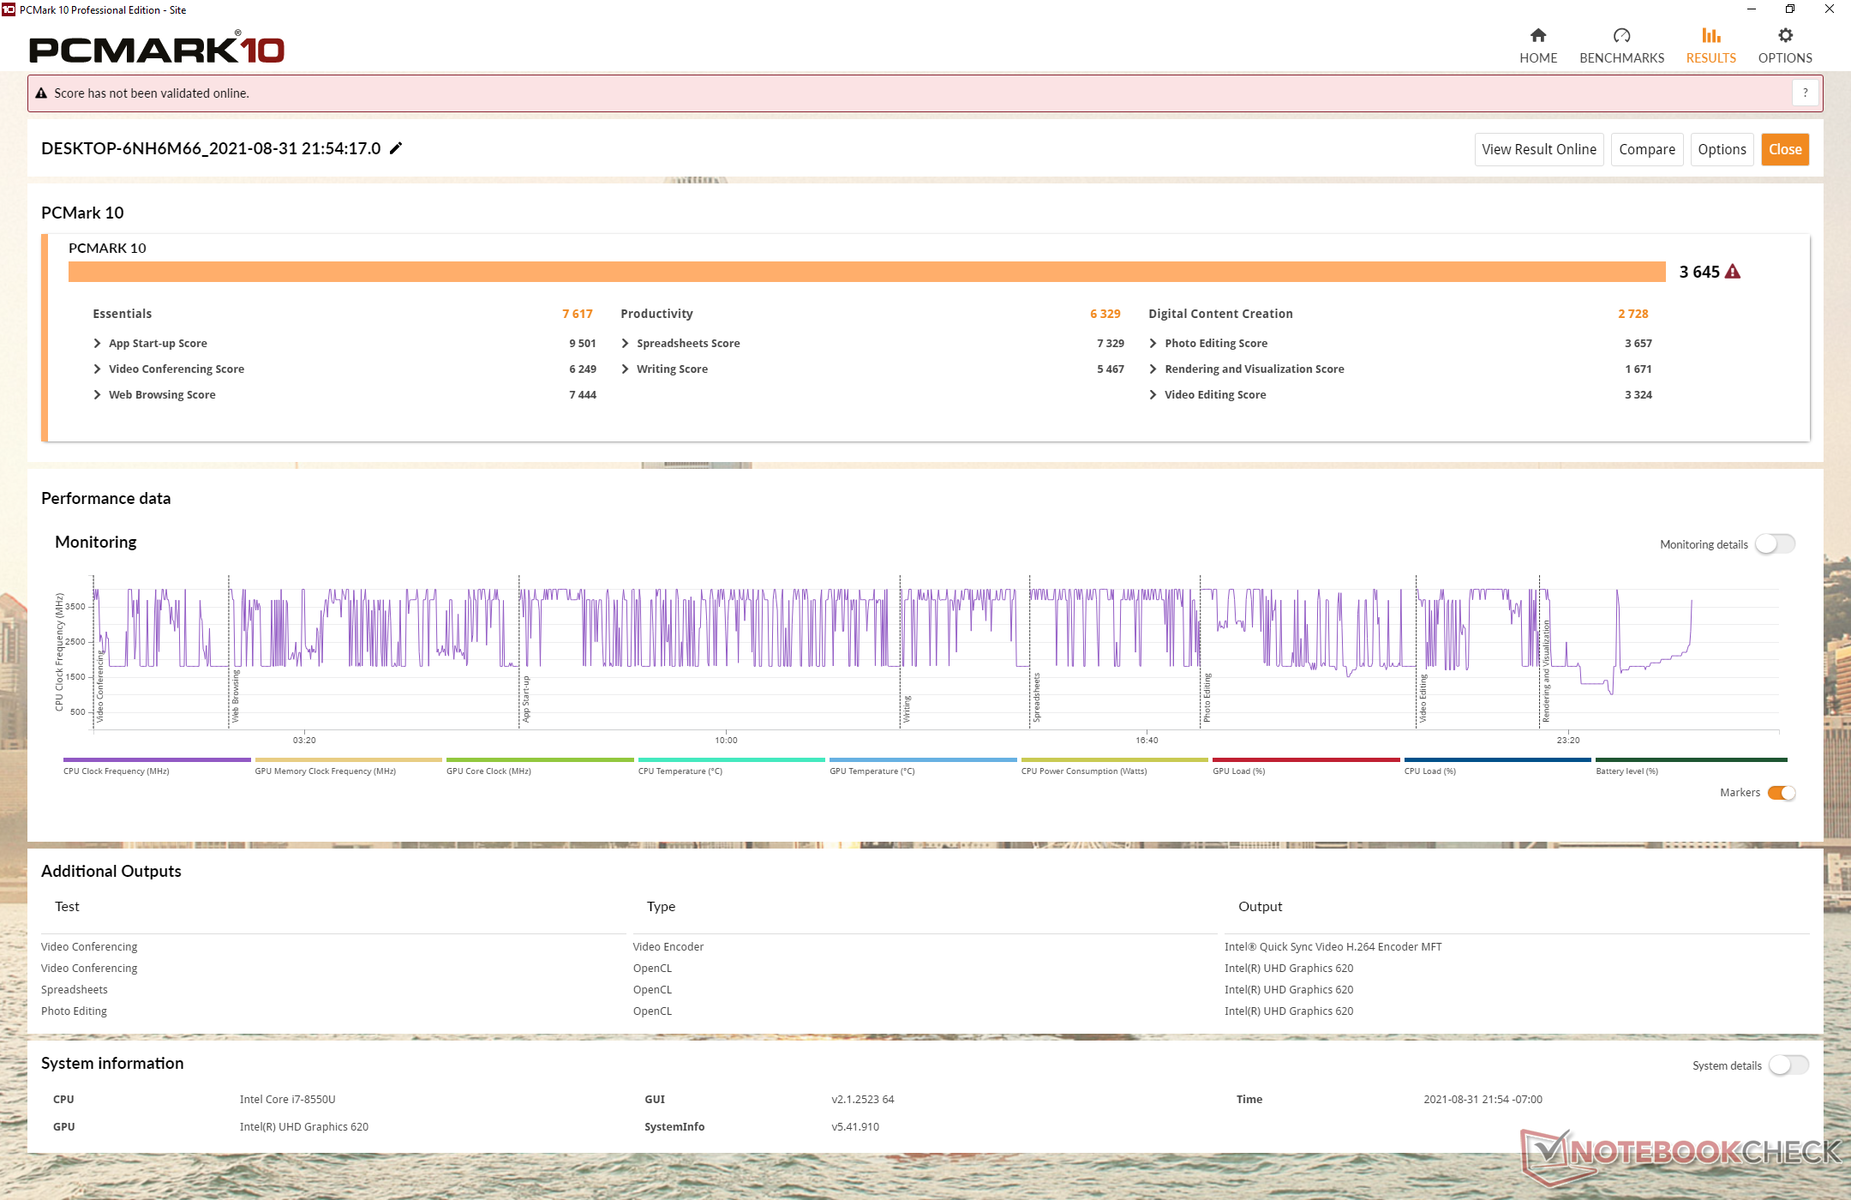
Desempenho do sistema
Os resultados da PCMark estão onde esperamos que sejam relativos a outros modelos com a mesma CPU Core i7-8550U. Apreciamos o fato de que o sistema não vem com bloatware do fabricante para uma experiência limpa com o Windows 10.
| PCMark 10 / Score | |
| Lenovo ThinkPad X12 20UVS03G00 | |
| Dell Latitude 12 7210 2-in-1 | |
| Microsoft Surface Pro 7 Plus | |
| Kuu LeBook 12.6 Core i7-8550U | |
| Média Intel Core i7-8550U, Intel UHD Graphics 620 (2629 - 4072, n=31) | |
| Microsoft Surface Laptop Go Core i5 | |
| NuVision Encite Book 12 Plus | |
| PCMark 10 / Essentials | |
| Lenovo ThinkPad X12 20UVS03G00 | |
| Dell Latitude 12 7210 2-in-1 | |
| Microsoft Surface Pro 7 Plus | |
| Microsoft Surface Laptop Go Core i5 | |
| Média Intel Core i7-8550U, Intel UHD Graphics 620 (6628 - 9291, n=29) | |
| Kuu LeBook 12.6 Core i7-8550U | |
| NuVision Encite Book 12 Plus | |
| PCMark 10 / Productivity | |
| Dell Latitude 12 7210 2-in-1 | |
| Kuu LeBook 12.6 Core i7-8550U | |
| Média Intel Core i7-8550U, Intel UHD Graphics 620 (4889 - 7006, n=29) | |
| Lenovo ThinkPad X12 20UVS03G00 | |
| Microsoft Surface Pro 7 Plus | |
| Microsoft Surface Laptop Go Core i5 | |
| NuVision Encite Book 12 Plus | |
| PCMark 10 / Digital Content Creation | |
| Lenovo ThinkPad X12 20UVS03G00 | |
| Microsoft Surface Pro 7 Plus | |
| Dell Latitude 12 7210 2-in-1 | |
| Microsoft Surface Laptop Go Core i5 | |
| Média Intel Core i7-8550U, Intel UHD Graphics 620 (1506 - 3160, n=29) | |
| Kuu LeBook 12.6 Core i7-8550U | |
| NuVision Encite Book 12 Plus | |
| PCMark 10 Score | 3645 pontos | |
Ajuda | ||
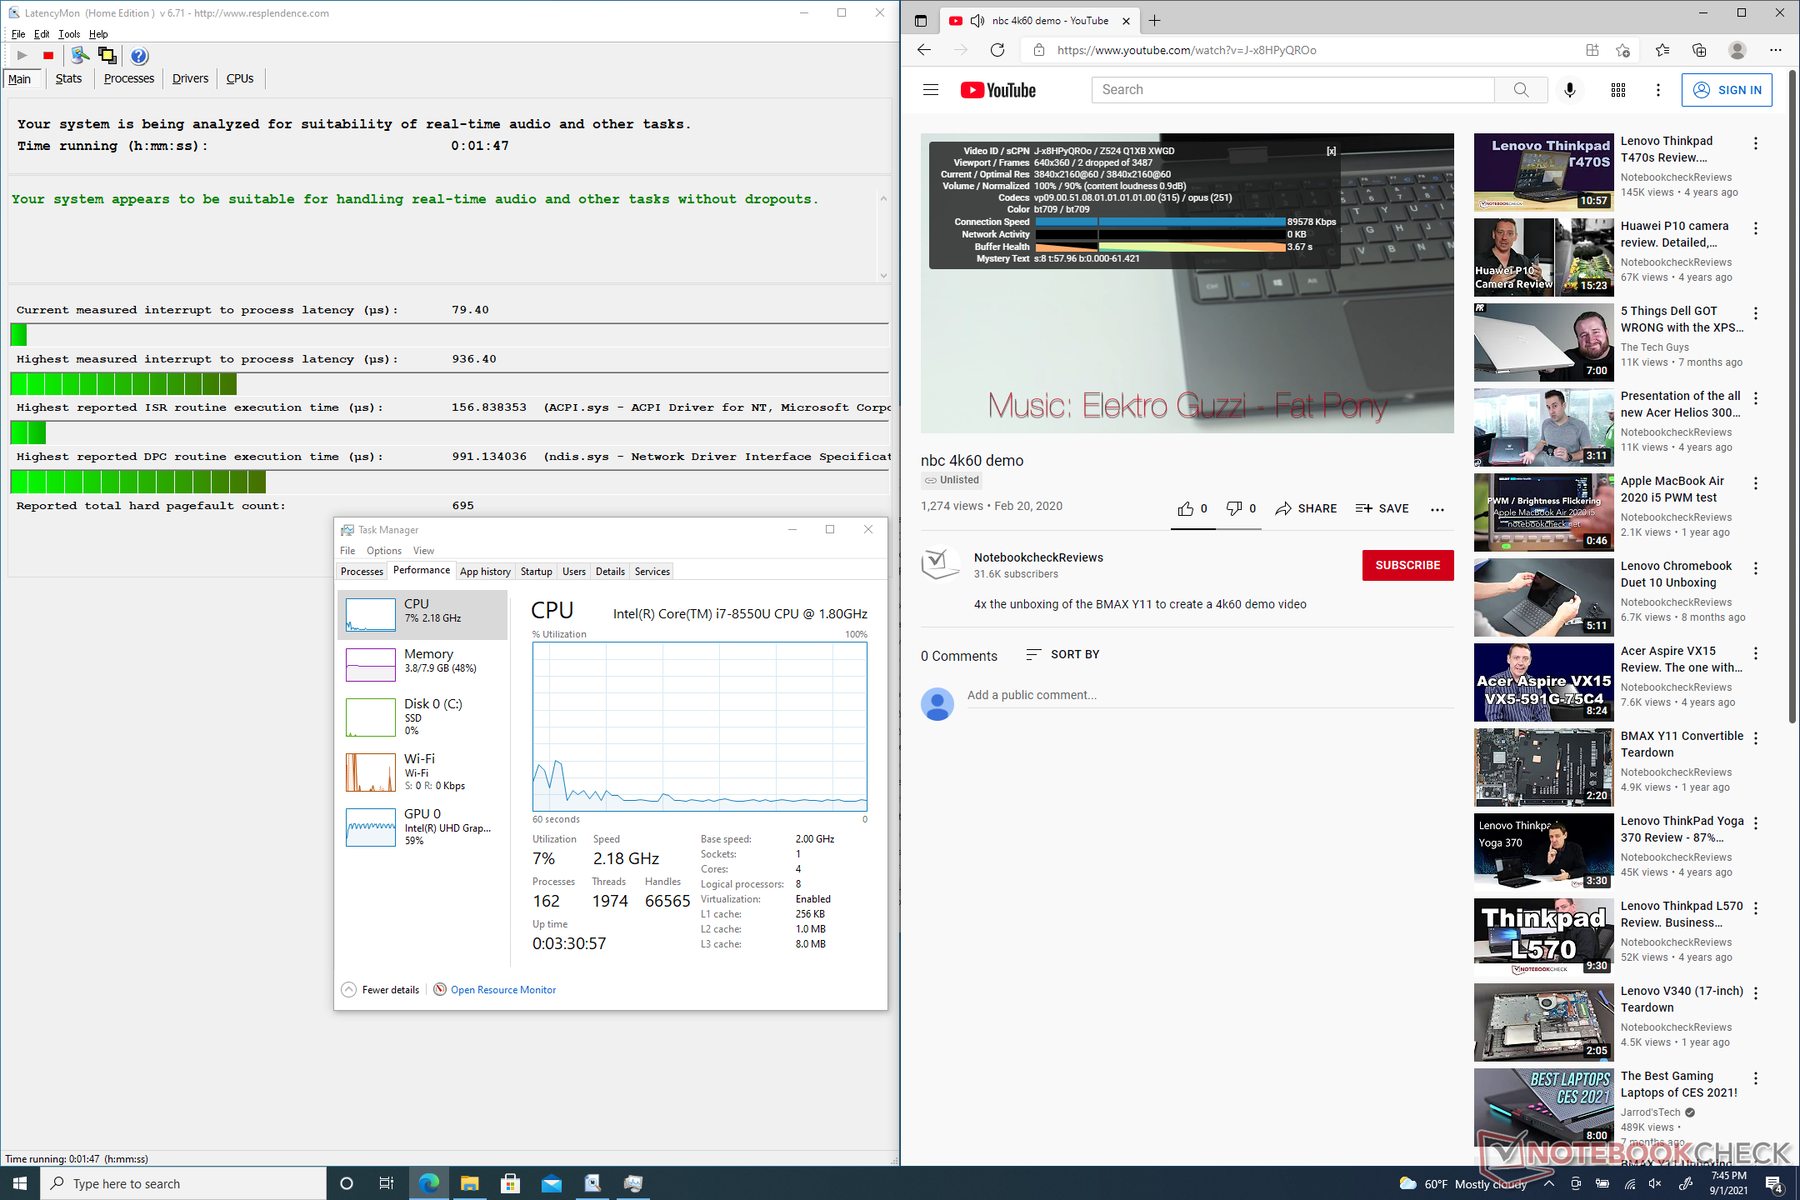
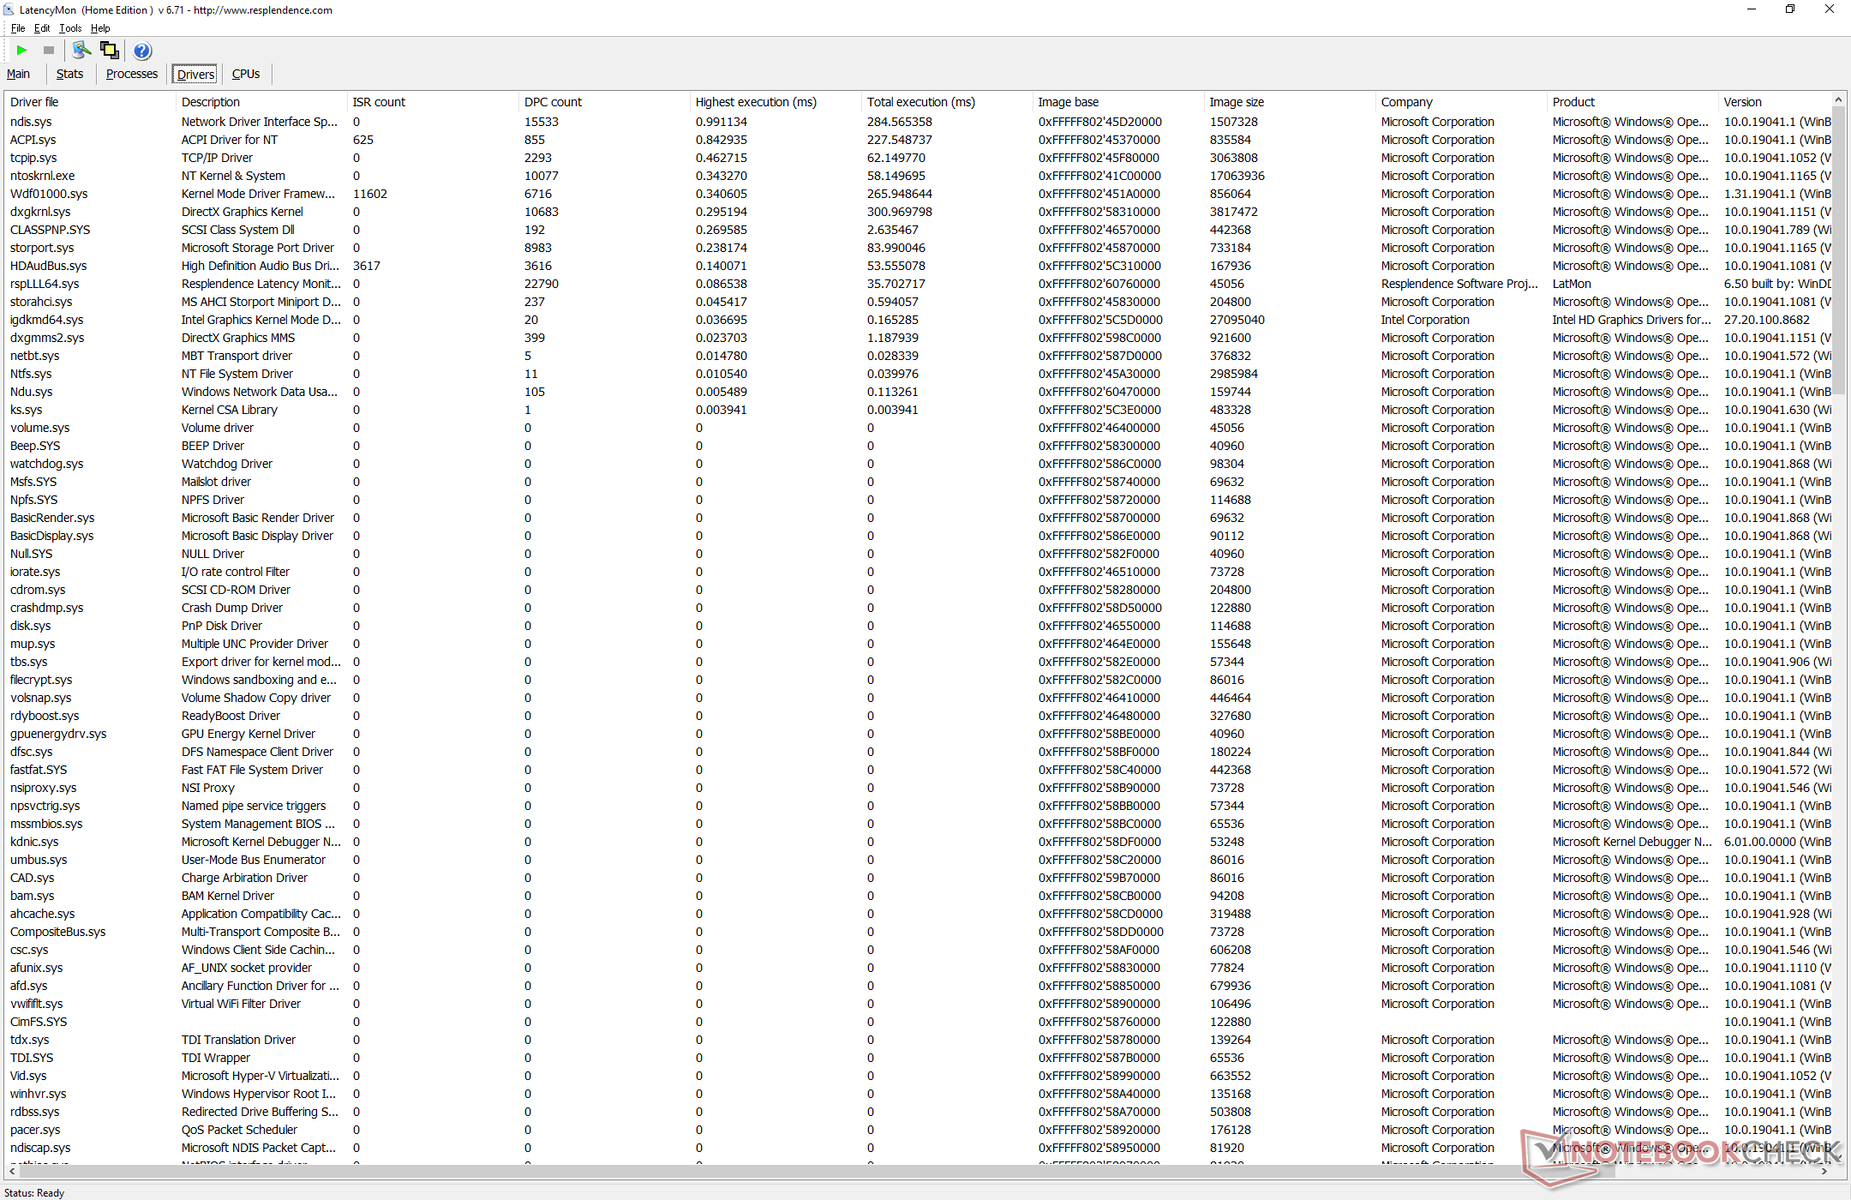
Latência do DPC
LatencyMon não revela grandes problemas de latência ao abrir várias abas do navegador em nossa página inicial. A reprodução do vídeo 4K a 60 FPS também não apresenta problemas, apesar da CPU Intel desatualizada.
| DPC Latencies / LatencyMon - interrupt to process latency (max), Web, Youtube, Prime95 | |
| Dell Latitude 12 7210 2-in-1 | |
| Kuu LeBook 12.6 Core i7-8550U | |
| Microsoft Surface Laptop Go Core i5 | |
| Lenovo ThinkPad X12 20UVS03G00 | |
| Microsoft Surface Pro 7 Plus | |
* ... menor é melhor
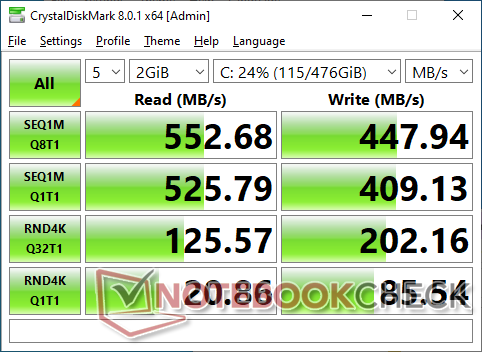
Dispositivos de armazenamento
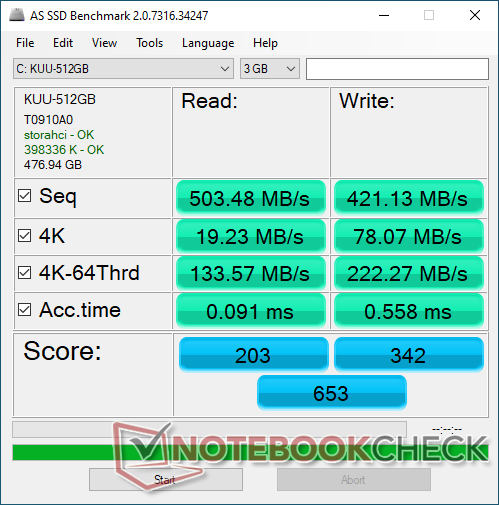
O armazenamento interno é espaçoso a 512 GB com taxas de transferência similares à maioria dos SSDs SATA III. A falta de um leitor de cartões SD significa menos problemas quando a unidade interna é tão grande quanto a maioria das unidades de laptop.
| Kuu LeBook 12.6 Core i7-8550U KUU-512GB | Lenovo ThinkPad X12 20UVS03G00 Toshiba BG4 KBG40ZNT512G | Microsoft Surface Pro 7 Plus Samsung PM991 MZ9LQ256HBJQ | Dell Latitude 12 7210 2-in-1 WDC PC SN530 SDBPTPZ-512G | Microsoft Surface Laptop Go Core i5 SK hynix BC501 HFM256GDGTNG | NuVision Encite Book 12 Plus SanDisk DF4064 | |
|---|---|---|---|---|---|---|
| AS SSD | 121% | 171% | 268% | 85% | -127% | |
| Seq Read (MB/s) | 503 | 1760 250% | 1725 243% | 2185 334% | 1347 168% | 154 -69% |
| Seq Write (MB/s) | 421.1 | 761 81% | 931 121% | 1731 311% | 491 17% | 102.4 -76% |
| 4K Read (MB/s) | 19.23 | 47.68 148% | 50.1 161% | 46.28 141% | 38.08 98% | 5.07 -74% |
| 4K Write (MB/s) | 78.1 | 176 125% | 136.9 75% | 161.6 107% | 98.2 26% | 8.42 -89% |
| 4K-64 Read (MB/s) | 133.6 | 581 335% | 870 551% | 1021 664% | 483.1 262% | 27.74 -79% |
| 4K-64 Write (MB/s) | 222.3 | 118.5 -47% | 762 243% | 1125 406% | 350.9 58% | 12.15 -95% |
| Access Time Read * (ms) | 0.091 | 0.155 -70% | 0.279 -207% | 0.069 24% | 0.057 37% | 0.747 -721% |
| Access Time Write * (ms) | 0.558 | 0.188 66% | 0.028 95% | 0.046 92% | 0.105 81% | 1.136 -104% |
| Score Read (Points) | 203 | 805 297% | 1093 438% | 1286 533% | 656 223% | 48 -76% |
| Score Write (Points) | 342 | 371 8% | 992 190% | 1460 327% | 498 46% | 31 -91% |
| Score Total (Points) | 653 | 1551 138% | 2616 301% | 3389 419% | 1458 123% | 103 -84% |
| Copy ISO MB/s (MB/s) | 433.4 | 1174 171% | 1555 259% | 765 77% | 119.7 -72% | |
| Copy Program MB/s (MB/s) | 365.8 | 262.8 -28% | 468.5 28% | 299.6 -18% | 72.8 -80% | |
| Copy Game MB/s (MB/s) | 409.2 | 562 37% | 841 106% | 371.5 -9% | 116.5 -72% | |
| CrystalDiskMark 5.2 / 6 | 98% | 156% | 211% | 93% | -77% | |
| Write 4K (MB/s) | 85.8 | 72.8 -15% | 165.3 93% | 182.7 113% | 87.6 2% | 7.837 -91% |
| Read 4K (MB/s) | 19.22 | 26.35 37% | 42.95 123% | 51.4 167% | 40.41 110% | 7.689 -60% |
| Write Seq (MB/s) | 412.7 | 823 99% | 955 131% | 1303 216% | 601 46% | 104.9 -75% |
| Read Seq (MB/s) | 518 | 1169 126% | 867 67% | 1450 180% | 1033 99% | 167.8 -68% |
| Write 4K Q32T1 (MB/s) | 201 | 112.6 -44% | 423.5 111% | 342.9 71% | 269.1 34% | 13.64 -93% |
| Read 4K Q32T1 (MB/s) | 125.6 | 327.2 161% | 479.2 282% | 523 316% | 261.4 108% | 32.95 -74% |
| Write Seq Q32T1 (MB/s) | 451.1 | 1039 130% | 1060 135% | 1776 294% | 818 81% | 99.5 -78% |
| Read Seq Q32T1 (MB/s) | 556 | 2176 291% | 2251 305% | 2378 328% | 2025 264% | 128.8 -77% |
| Média Total (Programa/Configurações) | 110% /
111% | 164% /
165% | 240% /
247% | 89% /
88% | -102% /
-109% |
* ... menor é melhor

Disk Throttling: DiskSpd Read Loop, Queue Depth 8
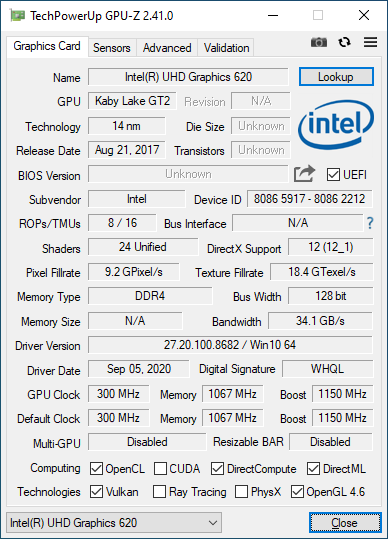
Desempenho da GPU
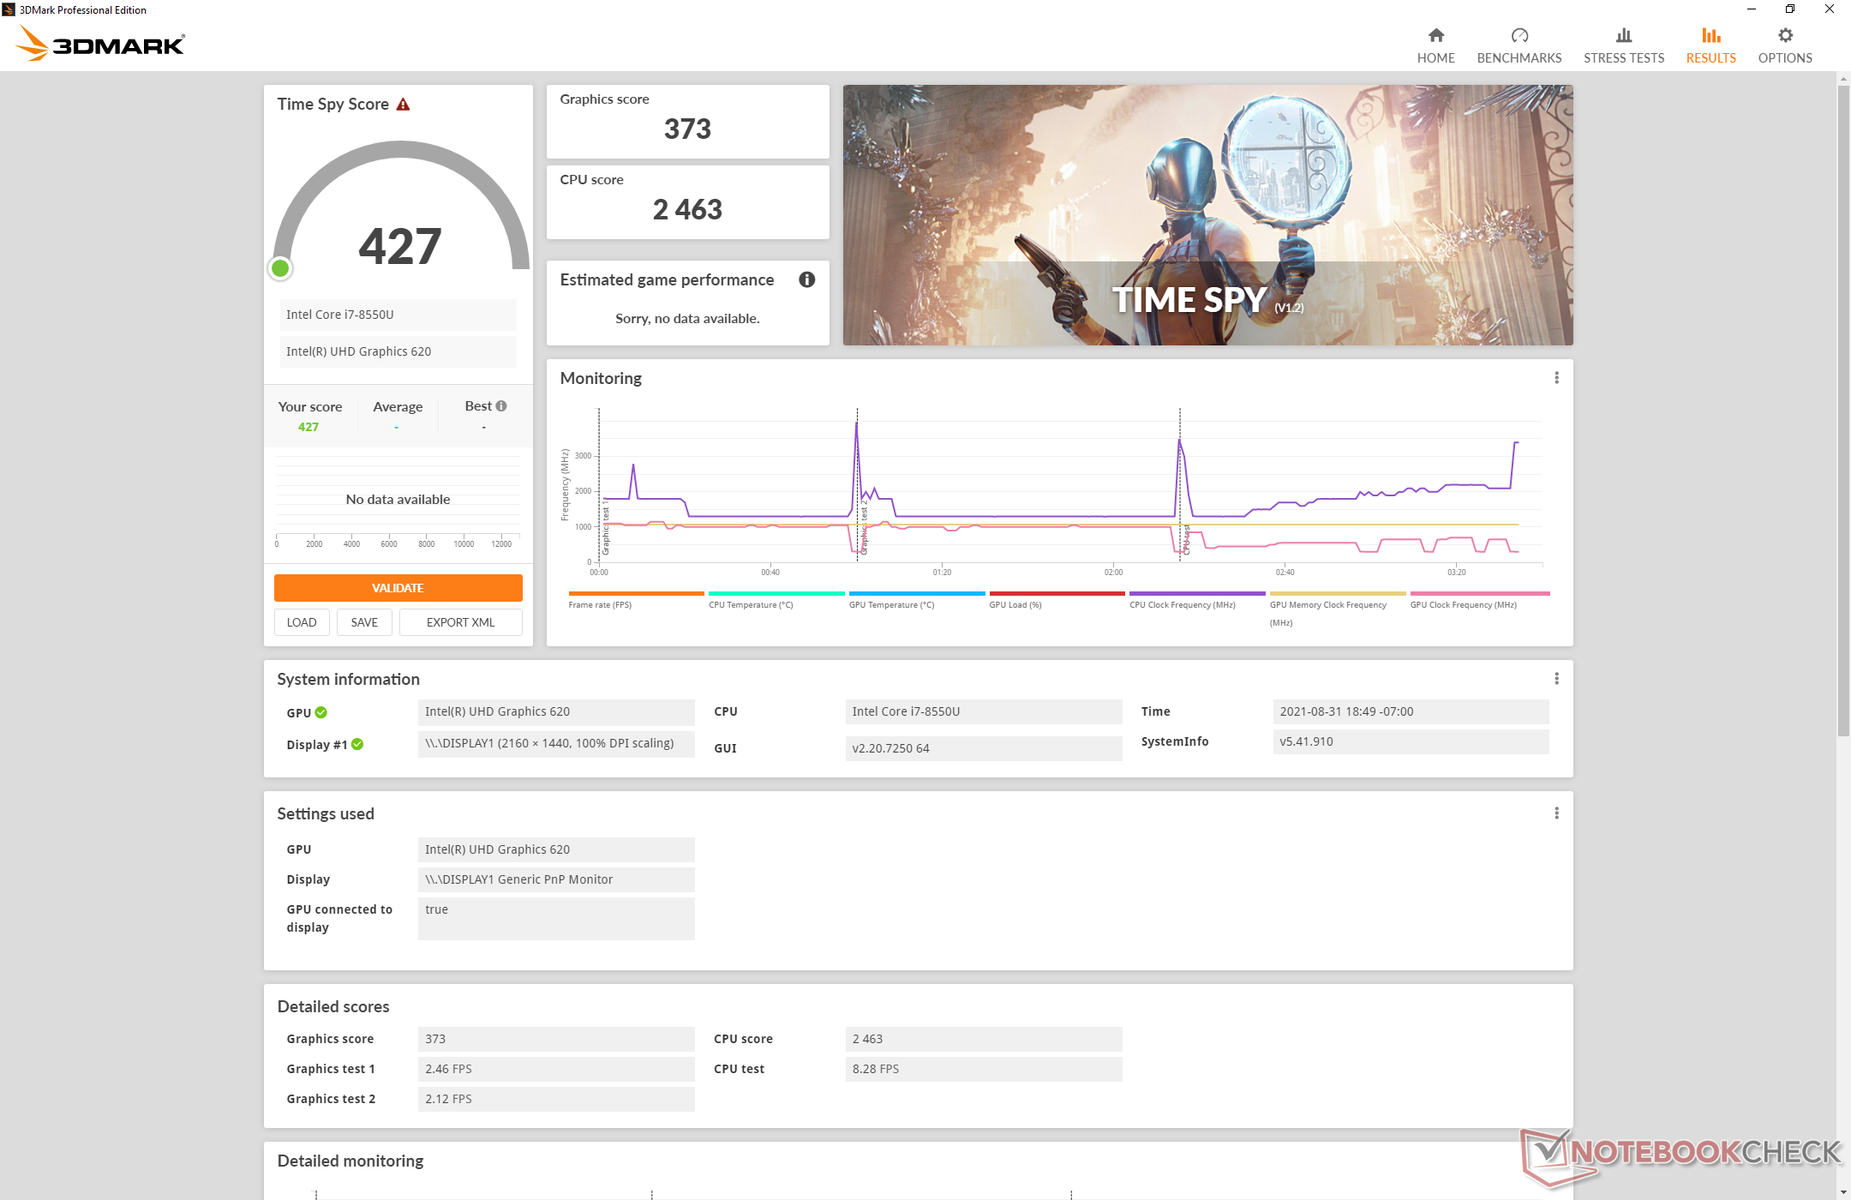
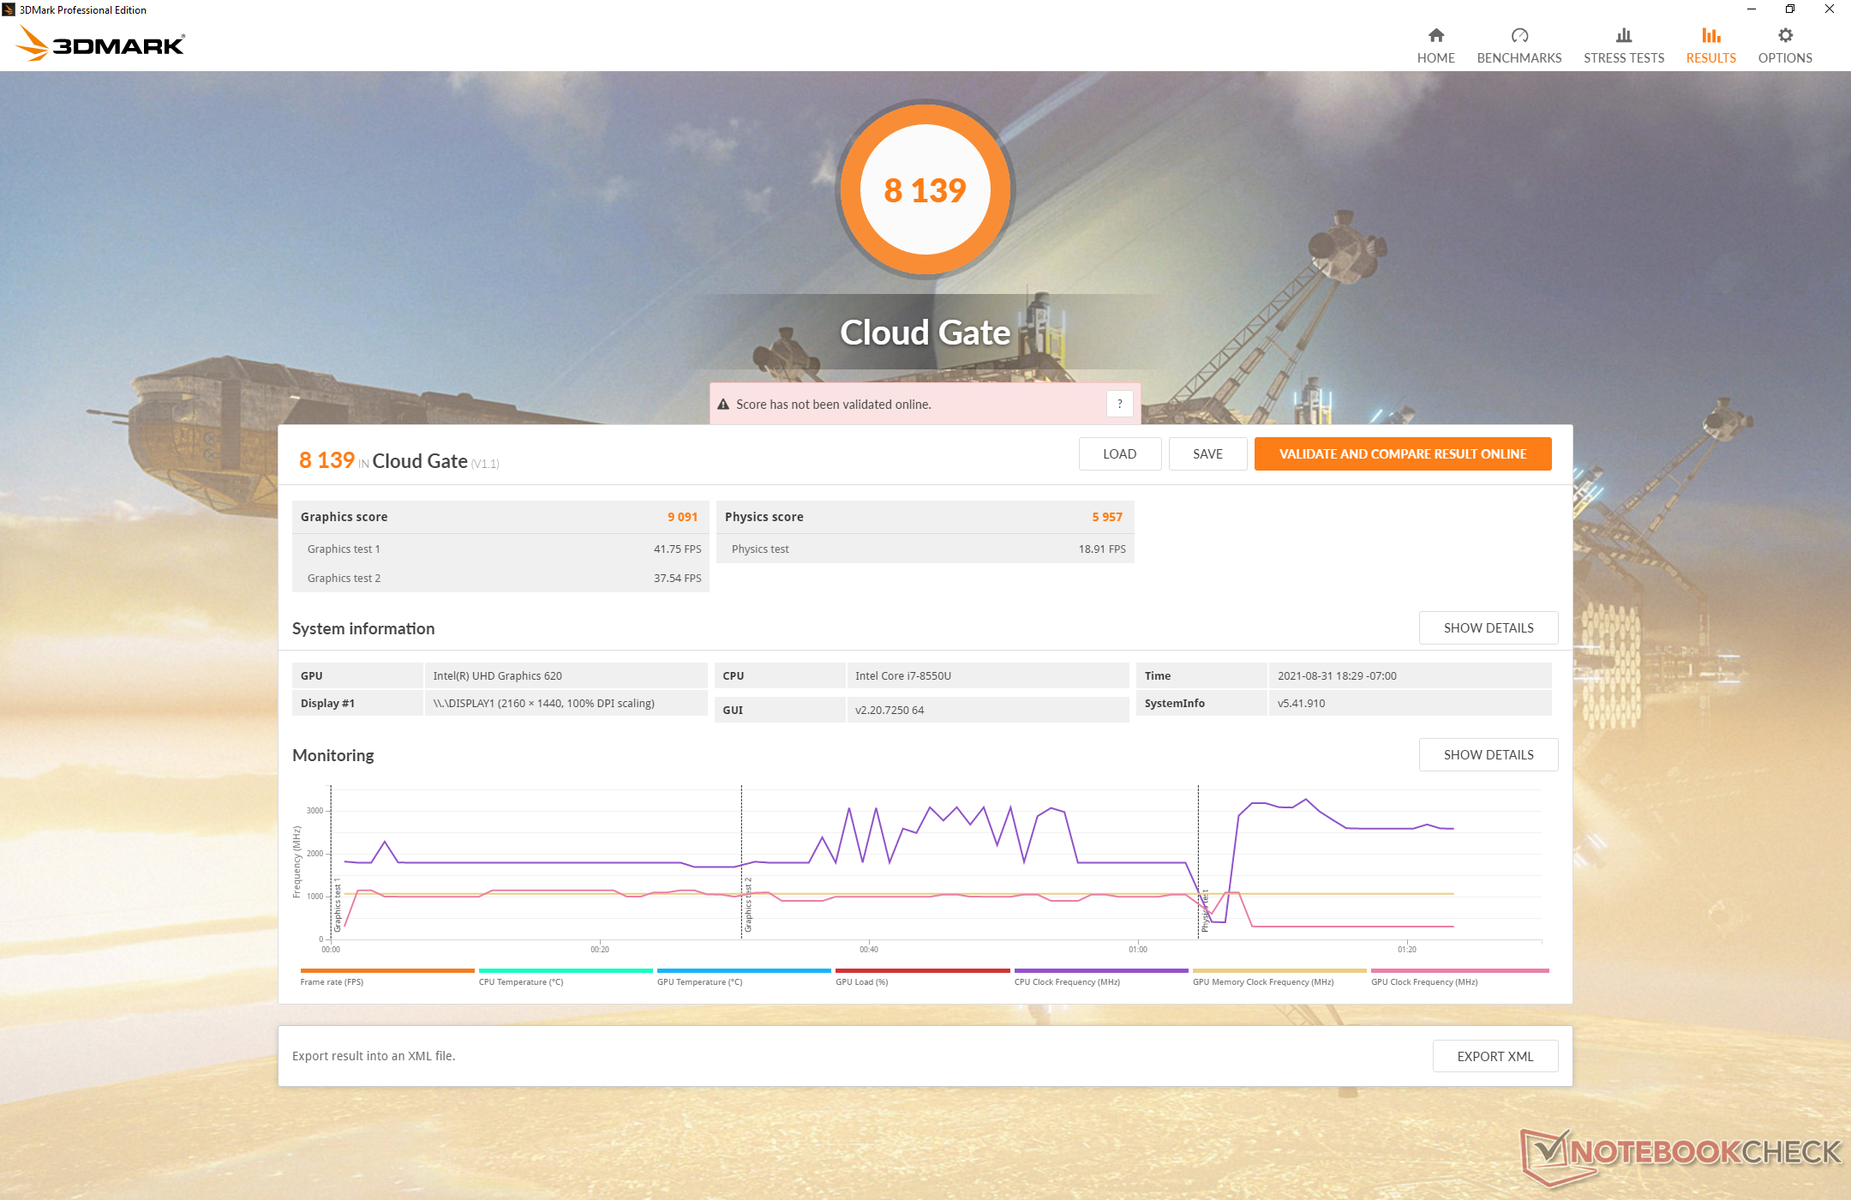
O UHD Graphics 620 é pobre pelos padrões atuais, onde Radeon RX Vega e Iris Xe modelos reina suprema. Isto não será um problema para o streaming 4K ou não-gameers, mas mesmo a mínima parte de edição ou jogos se beneficiará significativamente com a atualização para o tablet Surface ou qualquer outro dispositivo com AMD Zen ou 11th Intel Tiger Lake CPUs.
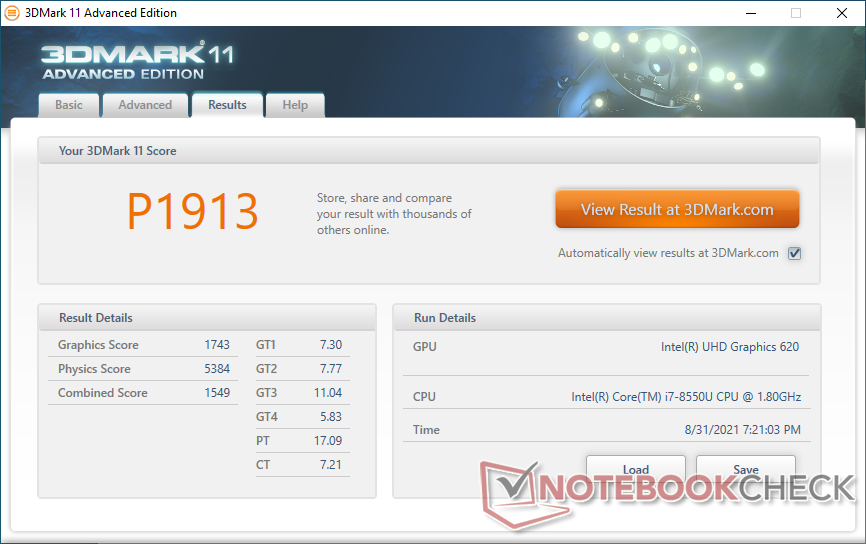

| 3DMark 11 Performance | 1913 pontos | |
| 3DMark Cloud Gate Standard Score | 8139 pontos | |
| 3DMark Fire Strike Score | 1046 pontos | |
| 3DMark Time Spy Score | 427 pontos | |
Ajuda | ||
| baixo | média | alto | ultra | |
|---|---|---|---|---|
| Dota 2 Reborn (2015) | 75.3 | 40.9 | 17.9 | 16 |
| Final Fantasy XV Benchmark (2018) | 11.7 | 5.39 | 5.39 | |
| X-Plane 11.11 (2018) | 11.3 | 9.73 | 9.11 |
Emissions
Ruído do sistema
O ventilador interno é ruidoso e pulsa com freqüência. Mesmo ações simples como a navegação na web iniciarão o ventilador, enquanto ele permanecerá silencioso na maioria dos outros tablets e laptops ULV. Espere que o ventilador pulsar na faixa de 36 a 41 dB(A) na maioria das condições ou até 45 dB(A) ao executar cargas mais altas como jogos.
| Kuu LeBook 12.6 Core i7-8550U UHD Graphics 620, i5-8550U, KUU-512GB | Lenovo ThinkPad X12 20UVS03G00 Iris Xe G7 96EUs, i7-1160G7, Toshiba BG4 KBG40ZNT512G | Microsoft Surface Pro 7 Plus Iris Xe G7 80EUs, i5-1135G7, Samsung PM991 MZ9LQ256HBJQ | Dell Latitude 12 7210 2-in-1 UHD Graphics 620, i7-10610U, WDC PC SN530 SDBPTPZ-512G | Microsoft Surface Laptop Go Core i5 UHD Graphics G1 (Ice Lake 32 EU), i5-1035G1, SK hynix BC501 HFM256GDGTNG | |
|---|---|---|---|---|---|
| Noise | 10% | 14% | 4% | ||
| desligado / ambiente * (dB) | 23.8 | 25.1 -5% | 25 -5% | 26.4 -11% | |
| Idle Minimum * (dB) | 23.8 | 25.1 -5% | 25 -5% | 26.4 -11% | |
| Idle Average * (dB) | 23.8 | 25.1 -5% | 25 -5% | 26.4 -11% | |
| Idle Maximum * (dB) | 41.1 | 26 37% | 25 39% | 26.4 36% | |
| Load Average * (dB) | 44.5 | 34.6 22% | 28.7 36% | 36.9 17% | |
| Load Maximum * (dB) | 45 | 37 18% | 34.5 23% | 44.2 2% | |
| Witcher 3 ultra * (dB) | 34.6 |
* ... menor é melhor
Barulho
| Ocioso |
| 23.8 / 23.8 / 41.1 dB |
| Carga |
| 44.5 / 45 dB |
 | ||
30 dB silencioso 40 dB(A) audível 50 dB(A) ruidosamente alto |
||
min: | ||
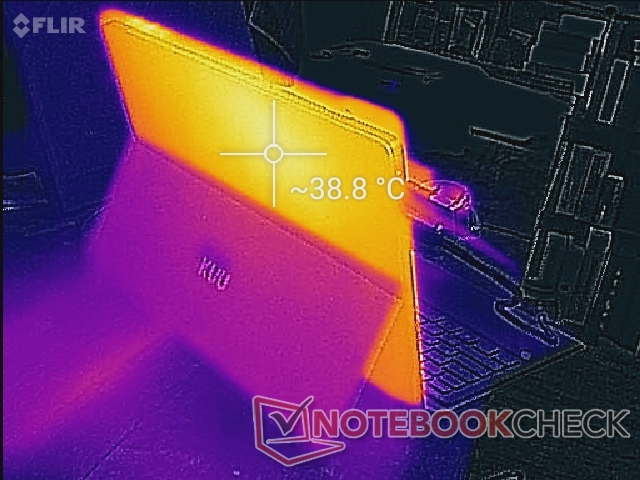
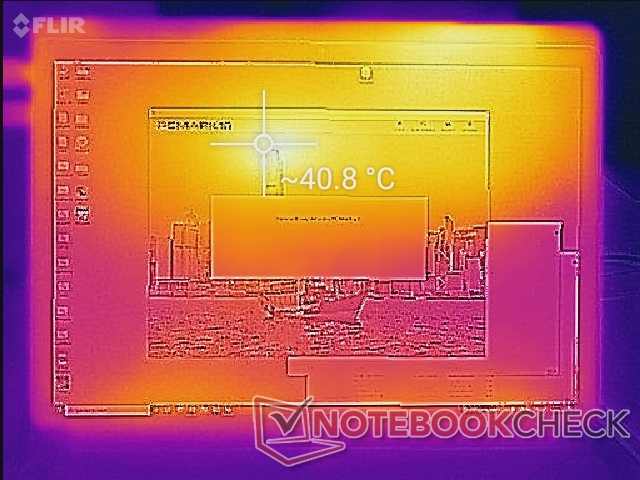
Temperatura
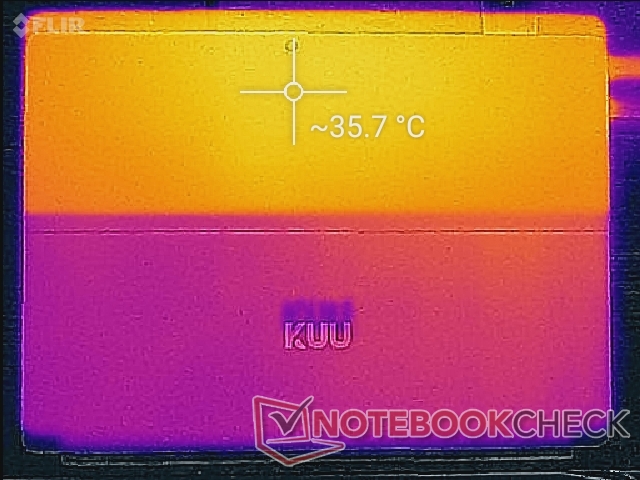
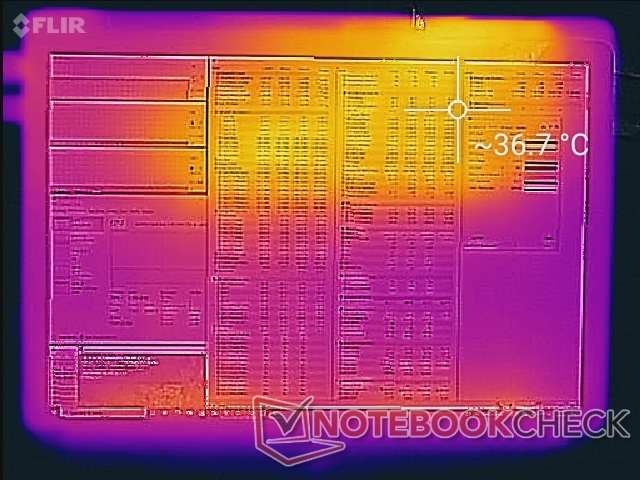
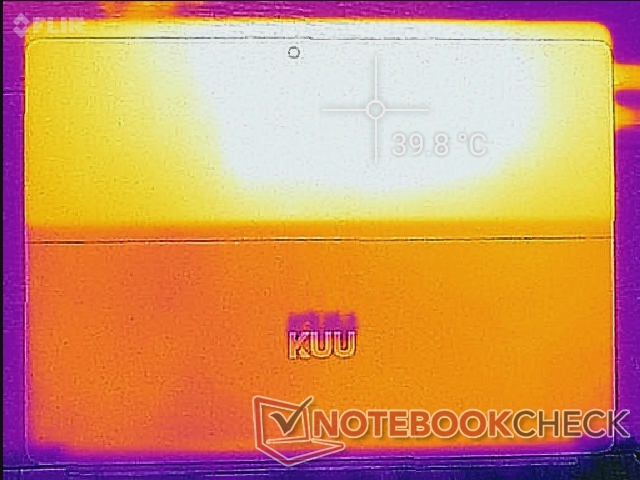
As temperaturas da superfície quando ociosas na mesa de trabalho são mais quentes do que o esperado em até 41 C e 36 C nos pontos quentes na frente e atrás, respectivamente. A carga mais alta fará com que o ventilador interno dê o pontapé inicial, levando a um ponto quente ligeiramente mais frio de 37 C na frente enquanto que o de trás será ligeiramente mais quente a 40 C. O calor é perceptível ao manusear a mesa, mas felizmente é mais frio ao redor das bordas e cantos para não distrair.
(+) A temperatura máxima no lado superior é 36.8 °C / 98 F, em comparação com a média de 35.4 °C / 96 F , variando de 19.6 a 60 °C para a classe Convertible.
(+) A parte inferior aquece até um máximo de 39.8 °C / 104 F, em comparação com a média de 36.9 °C / 98 F
(±) Em uso inativo, a temperatura média para o lado superior é 34.5 °C / 94 F, em comparação com a média do dispositivo de 30.3 °C / ### class_avg_f### F.
(+) Os apoios para as mãos e o touchpad estão atingindo a temperatura máxima da pele (32.6 °C / 90.7 F) e, portanto, não estão quentes.
(-) A temperatura média da área do apoio para as mãos de dispositivos semelhantes foi 28 °C / 82.4 F (-4.6 °C / -8.3 F).
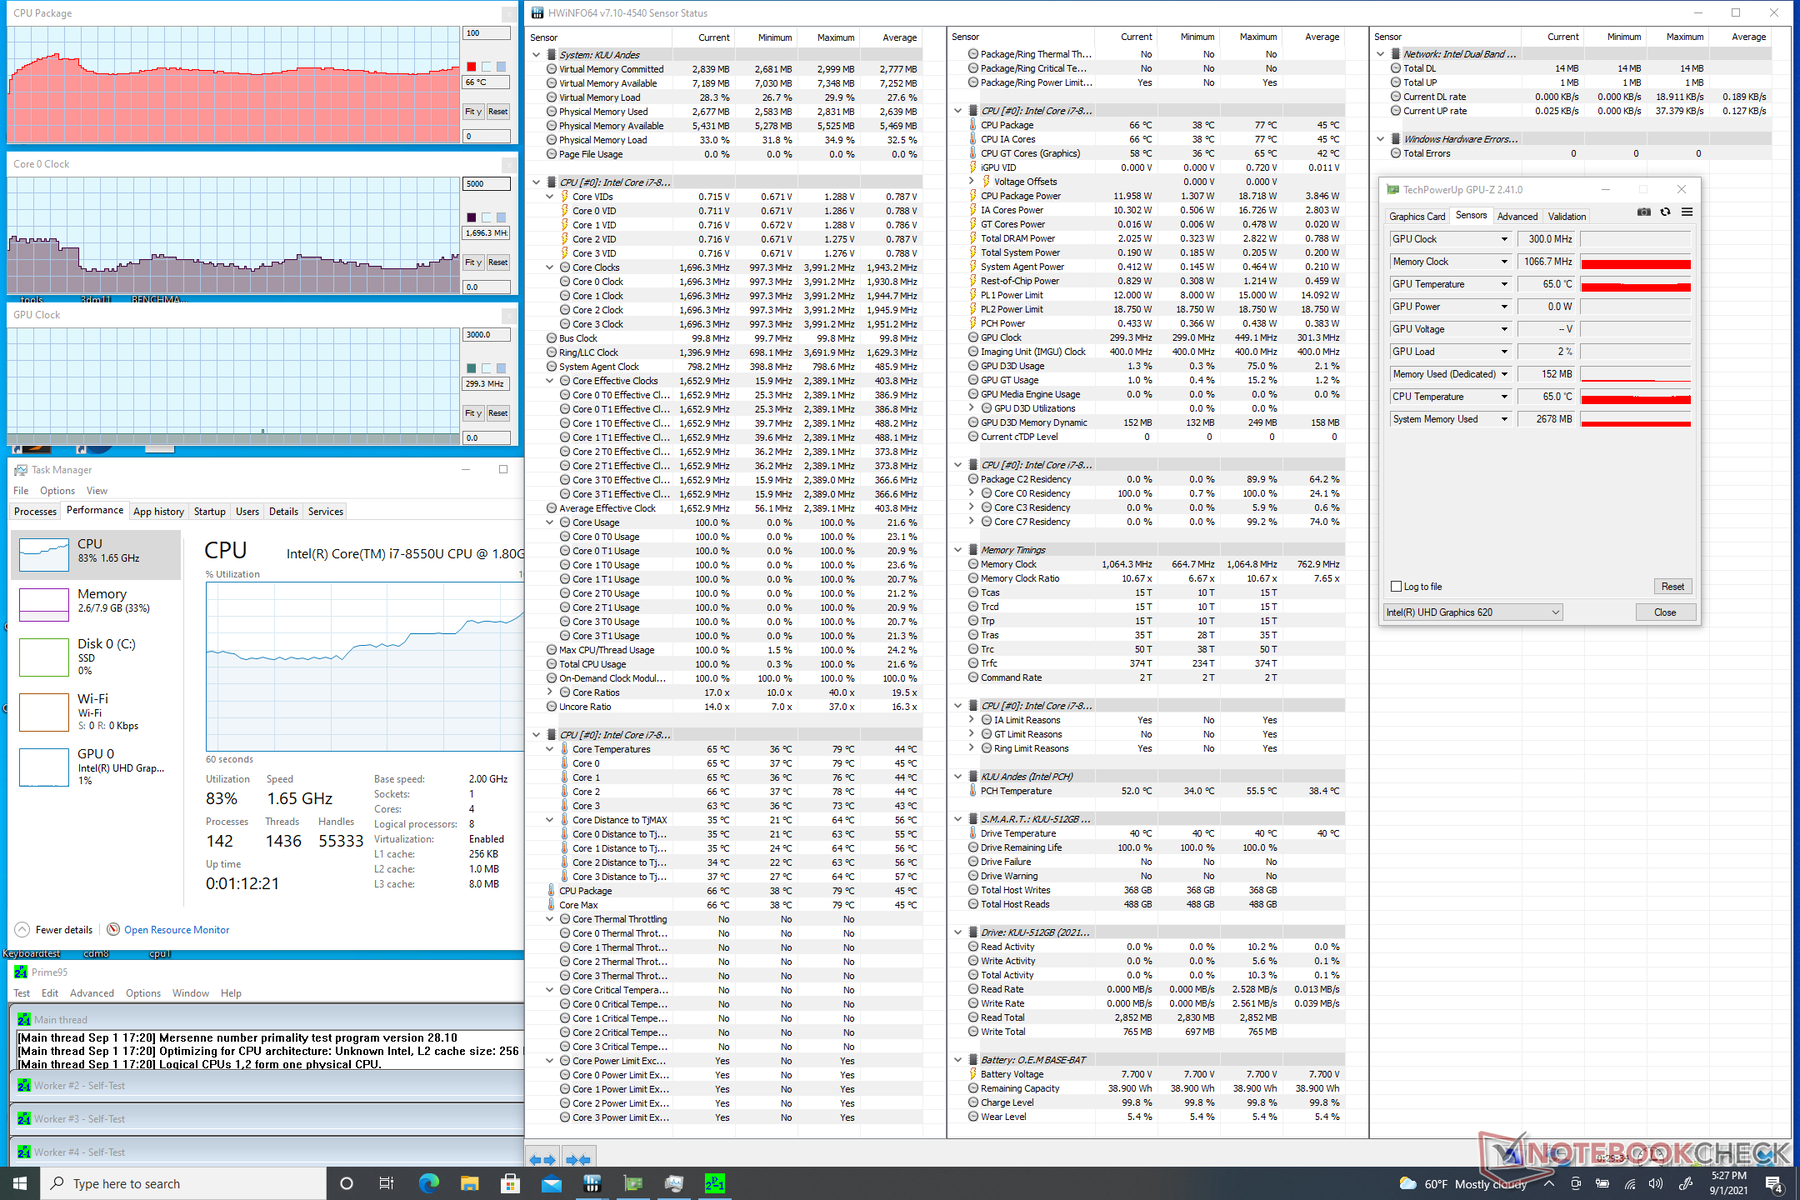
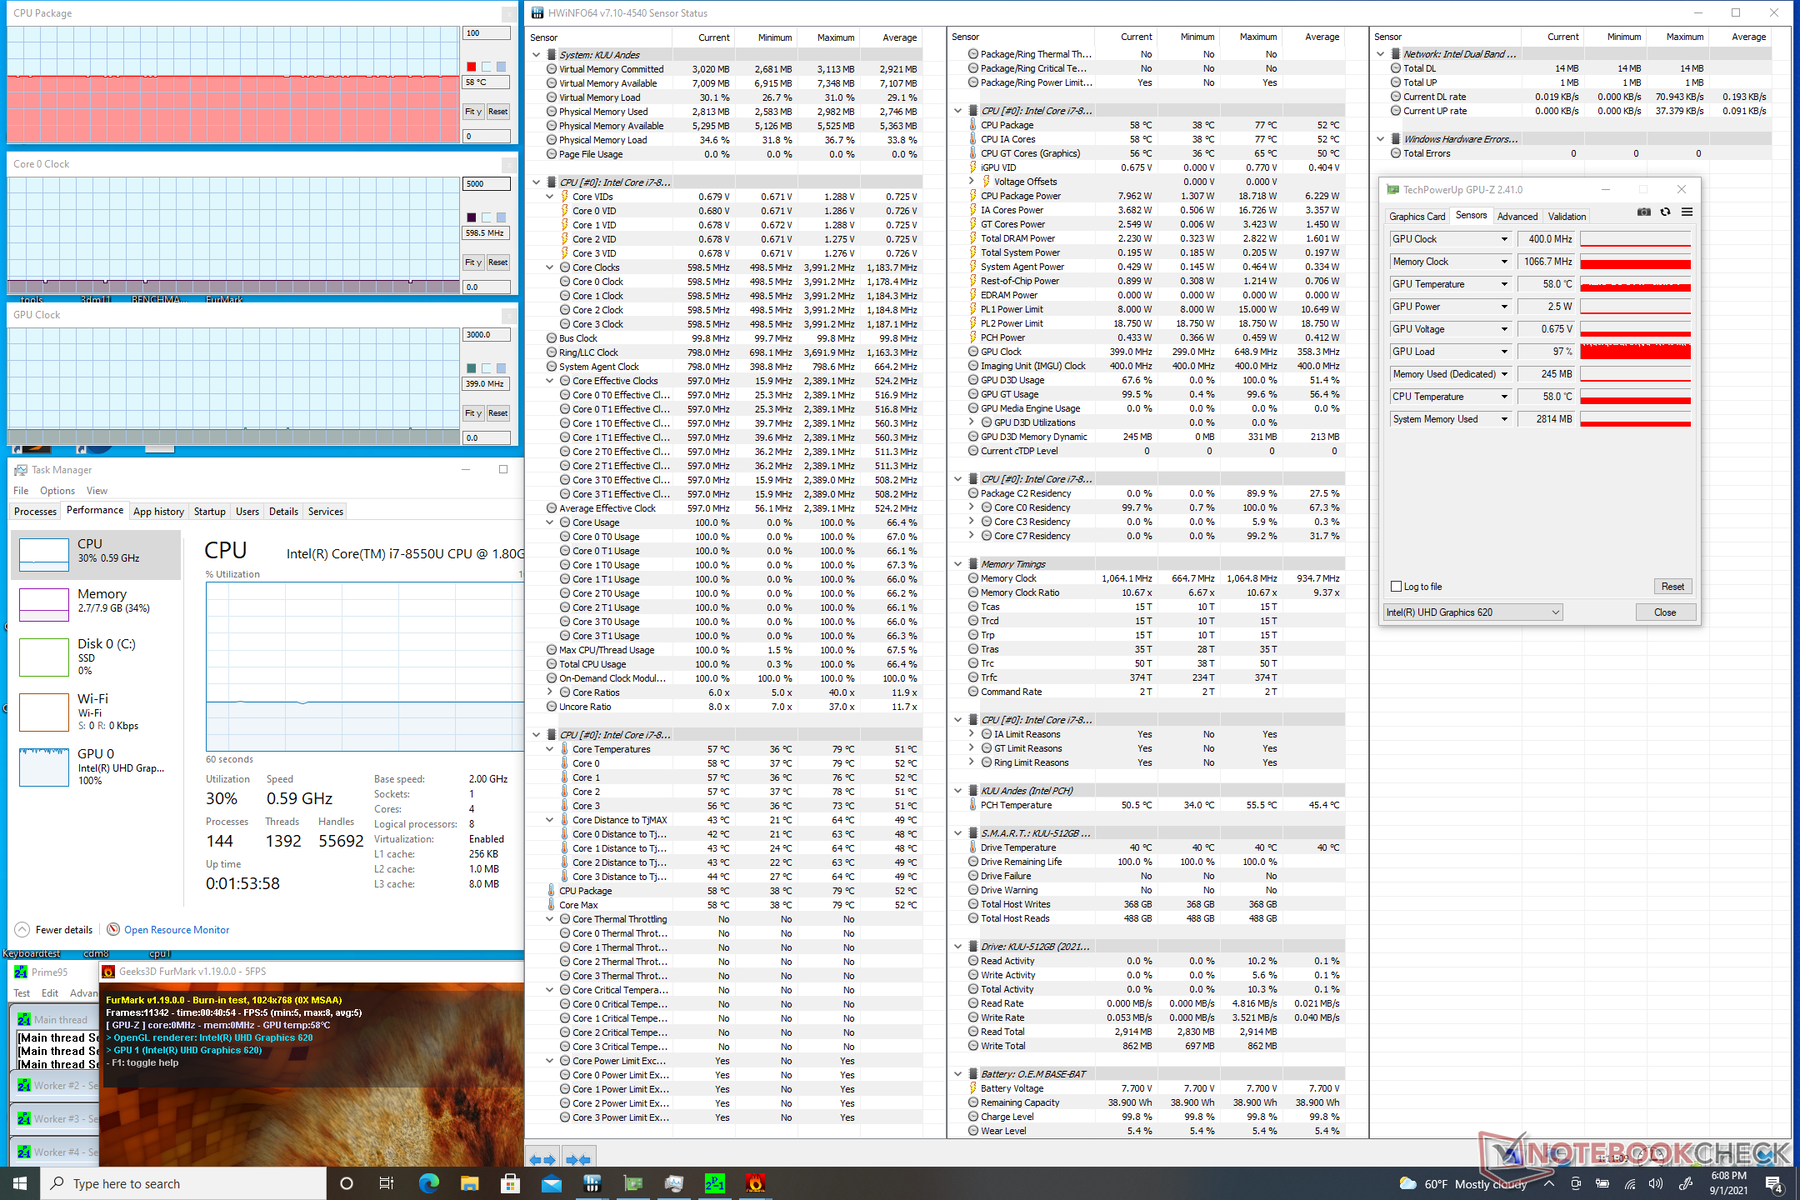
Teste de estresse
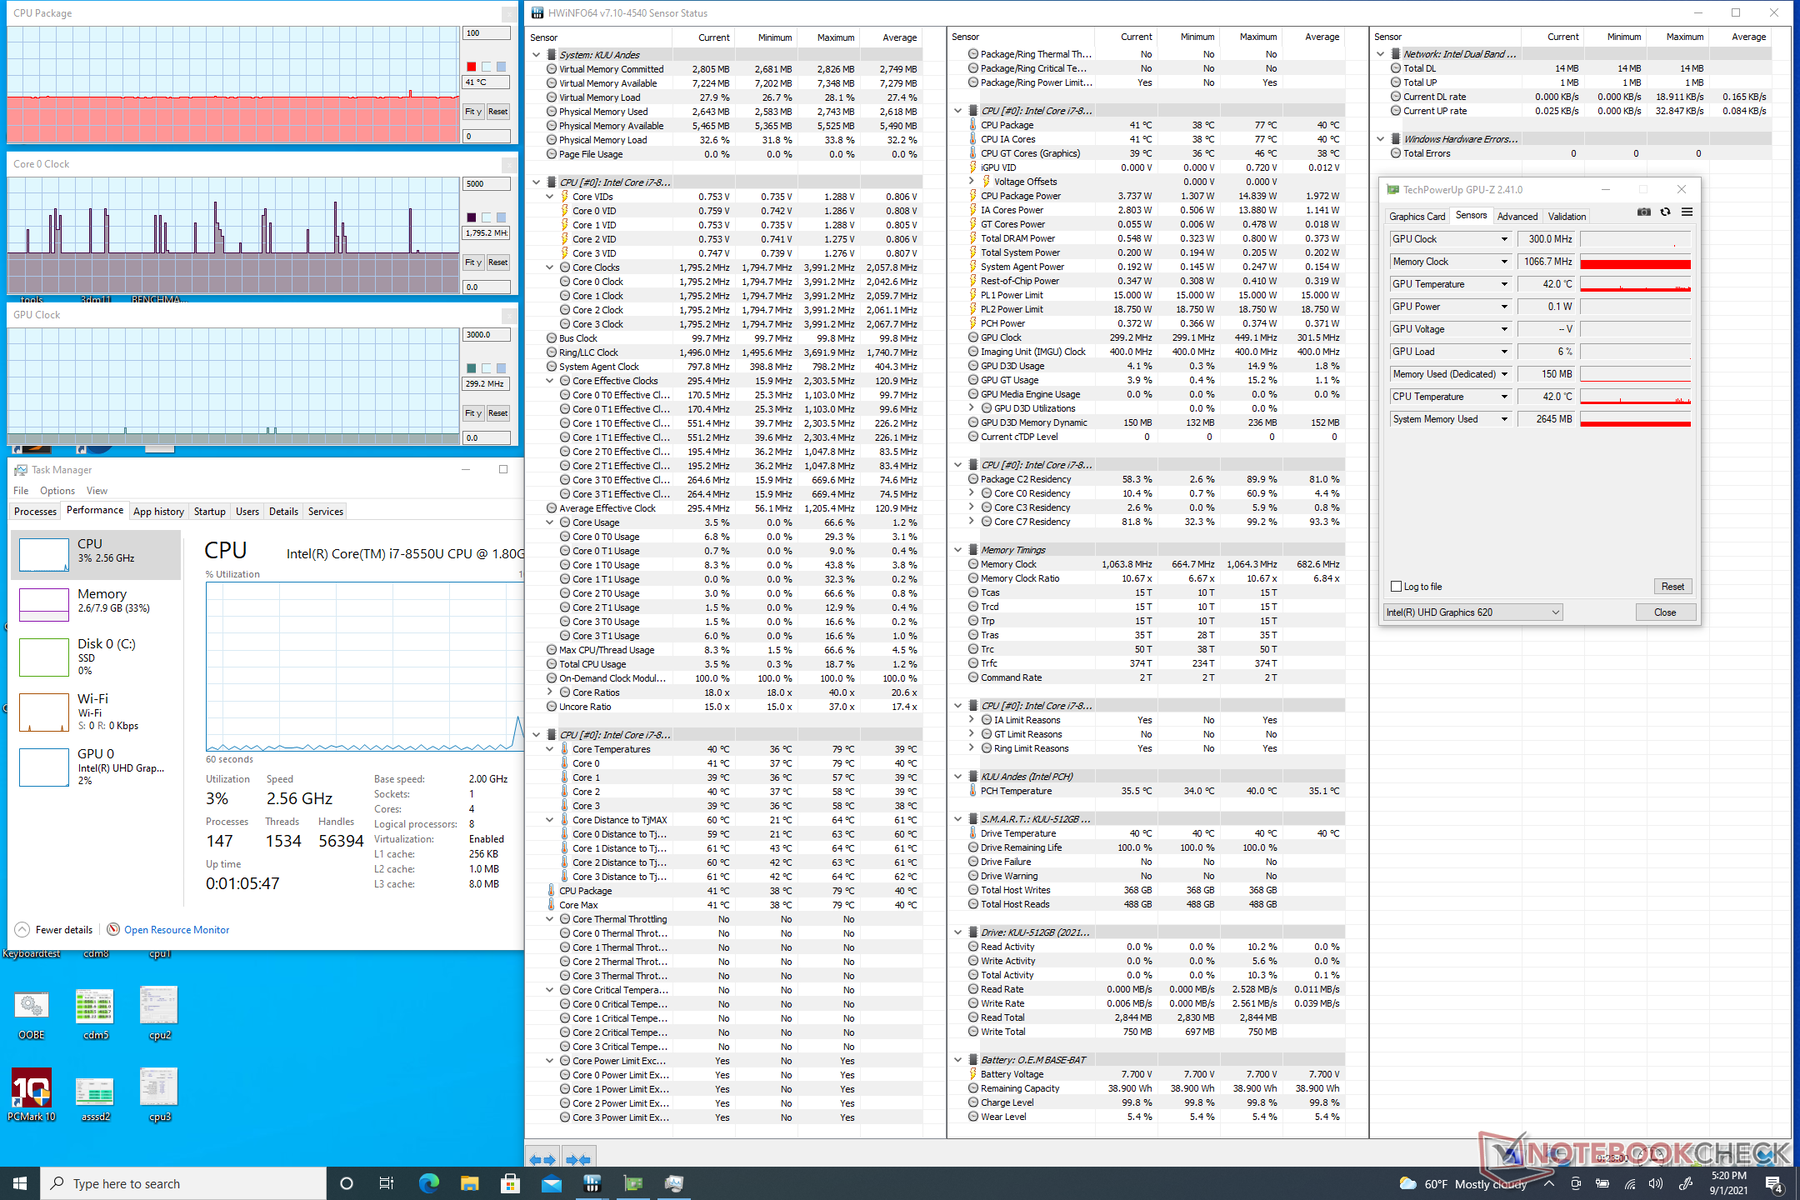
Ao rodar Prime95, a CPU aumentaria para 2,4 GHz por cerca de 30 segundos até atingir uma temperatura central de 77 C. Depois disso, as taxas de relógio cairiam e girariam entre 1 GHz e 1,7 GHz a fim de manter uma temperatura mais fria na faixa de 60 C a 65 C. A sustentabilidade do Turbo Boost é, portanto, limitada no LeBook, uma vez que ele é, afinal de contas, um tablet
O funcionamento com bateria não limitará o desempenho. Um 3DMark 11 rodando com baterias retornaria pontuações de Física e Gráficos de 6186 e 1689 pontos, respectivamente, em comparação com 5384 e 1743 pontos quando em rede elétrica.
| RelógioCPU (GHz) | RelógioGPU (MHz) | Temperaturamédiada CPU (°C) | |
| System Idle | -- | --41 | |
| Prime95 Stress | 1.0 - 1.7 | --->60 - 65 | |
| Prime95 + FurMark Stress | 600 | 400 | 58 |
Oradores


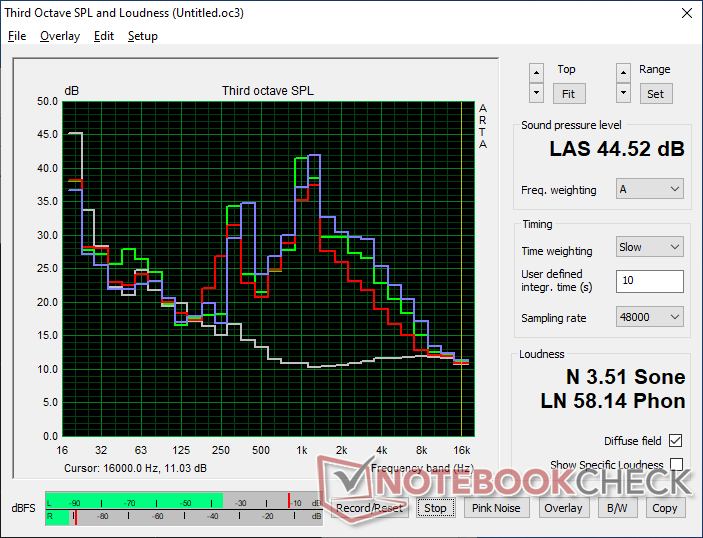
Kuu LeBook 12.6 Core i7-8550U análise de áudio
(±) | o volume do alto-falante é médio, mas bom (###valor### dB)
Graves 100 - 315Hz
(-) | quase nenhum baixo - em média 28.8% menor que a mediana
(±) | a linearidade dos graves é média (7.9% delta para a frequência anterior)
Médios 400 - 2.000 Hz
(±) | médios mais altos - em média 5.4% maior que a mediana
(±) | a linearidade dos médios é média (9.7% delta para frequência anterior)
Altos 2 - 16 kHz
(±) | máximos mais altos - em média 5.5% maior que a mediana
(±) | a linearidade dos máximos é média (9% delta para frequência anterior)
Geral 100 - 16.000 Hz
(±) | a linearidade do som geral é média (29.5% diferença em relação à mediana)
Comparado com a mesma classe
» 87% de todos os dispositivos testados nesta classe foram melhores, 3% semelhantes, 10% piores
» O melhor teve um delta de 6%, a média foi 20%, o pior foi 57%
Comparado com todos os dispositivos testados
» 88% de todos os dispositivos testados foram melhores, 3% semelhantes, 10% piores
» O melhor teve um delta de 4%, a média foi 23%, o pior foi 134%
Apple MacBook 12 (Early 2016) 1.1 GHz análise de áudio
(+) | os alto-falantes podem tocar relativamente alto (###valor### dB)
Graves 100 - 315Hz
(±) | graves reduzidos - em média 11.3% menor que a mediana
(±) | a linearidade dos graves é média (14.2% delta para a frequência anterior)
Médios 400 - 2.000 Hz
(+) | médios equilibrados - apenas 2.4% longe da mediana
(+) | médios são lineares (5.5% delta para frequência anterior)
Altos 2 - 16 kHz
(+) | agudos equilibrados - apenas 2% longe da mediana
(+) | os máximos são lineares (4.5% delta da frequência anterior)
Geral 100 - 16.000 Hz
(+) | o som geral é linear (10.2% diferença em relação à mediana)
Comparado com a mesma classe
» 7% de todos os dispositivos testados nesta classe foram melhores, 2% semelhantes, 90% piores
» O melhor teve um delta de 5%, a média foi 18%, o pior foi 53%
Comparado com todos os dispositivos testados
» 5% de todos os dispositivos testados foram melhores, 1% semelhantes, 94% piores
» O melhor teve um delta de 4%, a média foi 23%, o pior foi 134%
Energy Management
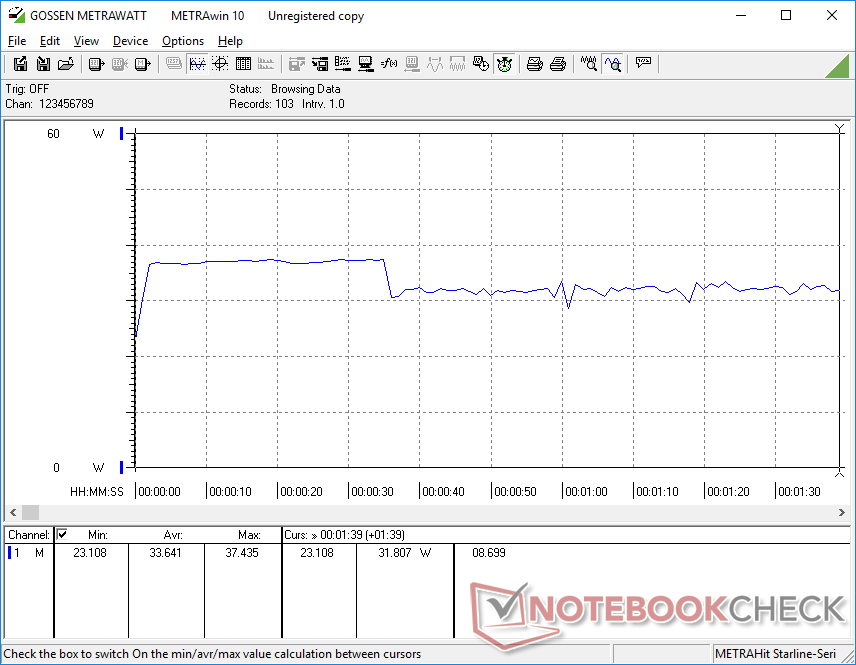
Consumo de energia
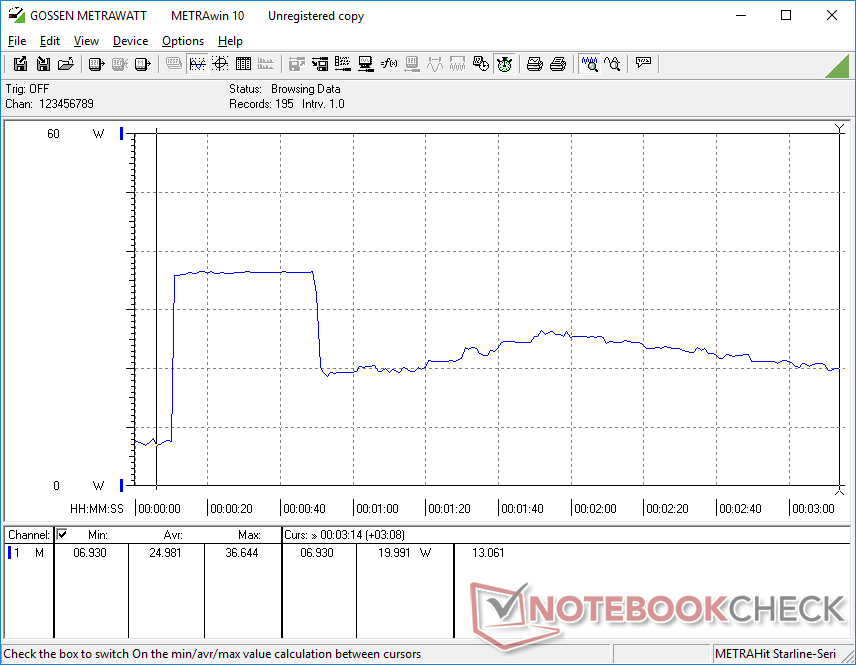
O sistema consome um pouco menos de energia do que no Surface Pro 7 Plus ao executar aplicações comparáveis. No entanto, a economia de apenas alguns watts é pálida em comparação com os enormes ganhos de desempenho que o tablet da Microsoft é capaz de oferecer sobre o LeBook.
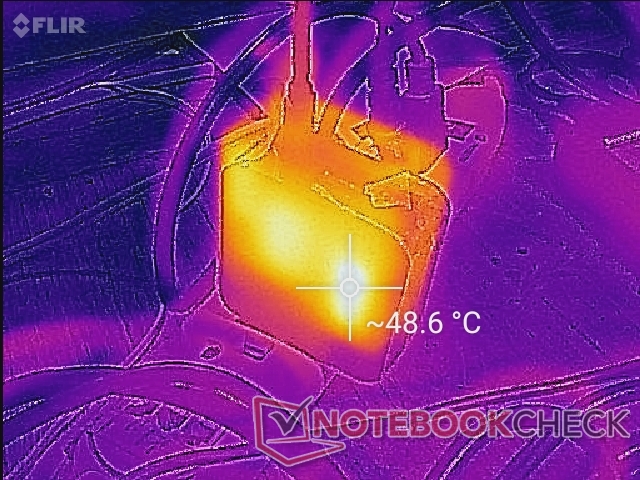
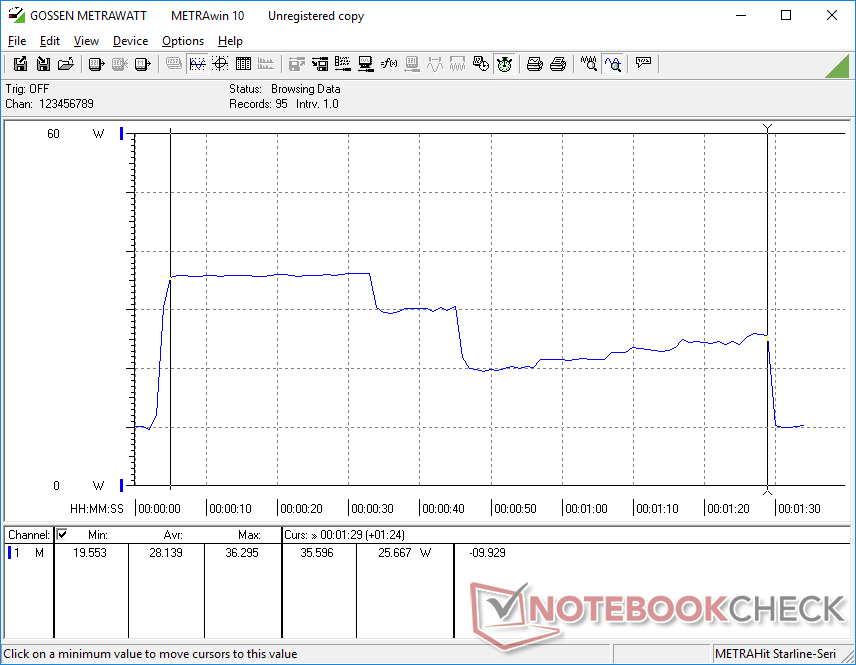
Somos capazes de medir um draw máximo temporário de 38,9 W a partir do pequeno (~6,3 x 6,3 x 3 cm) adaptador CA de 45 W ao executar simultaneamente Prime95 e FurMark antes que as limitações térmicas entrem em funcionamento. O supracitado Surface Pro 7 Plus pode tirar significativamente mais a até 62,5 W devido ao maior potencial de Turbo Boost de seu processador mais novo.

| desligado | |
| Ocioso | |
| Carga |
|
Key:
min: | |
| Kuu LeBook 12.6 Core i7-8550U i5-8550U, UHD Graphics 620, KUU-512GB, IPS, 2160x1440, 12.6" | Lenovo ThinkPad X12 20UVS03G00 i7-1160G7, Iris Xe G7 96EUs, Toshiba BG4 KBG40ZNT512G, a-Si IPS LED, 1920x1280, 12.3" | Microsoft Surface Pro 7 Plus i5-1135G7, Iris Xe G7 80EUs, Samsung PM991 MZ9LQ256HBJQ, IPS, 2736x1824, 12.3" | Dell Latitude 12 7210 2-in-1 i7-10610U, UHD Graphics 620, WDC PC SN530 SDBPTPZ-512G, IPS, 1920x1280, 12.3" | Microsoft Surface Laptop Go Core i5 i5-1035G1, UHD Graphics G1 (Ice Lake 32 EU), SK hynix BC501 HFM256GDGTNG, IPS, 1536x1024, 12.4" | NuVision Encite Book 12 Plus Celeron N3350, HD Graphics 500, SanDisk DF4064, IPS, 2560x1440, 12.5" | |
|---|---|---|---|---|---|---|
| Power Consumption | 7% | -18% | 19% | 9% | 29% | |
| Idle Minimum * (Watt) | 6.4 | 4 37% | 5.5 14% | 3.2 50% | 2.8 56% | 4.7 27% |
| Idle Average * (Watt) | 8.8 | 5.9 33% | 9.1 -3% | 5.3 40% | 6.8 23% | 7 20% |
| Idle Maximum * (Watt) | 8.9 | 8.3 7% | 10.8 -21% | 8.4 6% | 8 10% | 8 10% |
| Load Average * (Watt) | 33.6 | 30.1 10% | 39.2 -17% | 27 20% | 37.2 -11% | 14.1 58% |
| Load Maximum * (Watt) | 38.9 | 59 -52% | 62.5 -61% | 46.9 -21% | 51.6 -33% | 27.1 30% |
| Witcher 3 ultra * (Watt) | 30.8 |
* ... menor é melhor
Power Consumption Prime95 Stress Test
Vida útil da bateria
A capacidade da bateria está entre a do Surface Pro 7 e a do Latitude 12 7210 2 em 1. O tempo de funcionamento da WLAN, no entanto, é cerca de duas horas mais curto no modelo KUU por um total de quase 6,5 horas
O carregamento da capacidade vazia para a cheia leva cerca de duas horas completas.
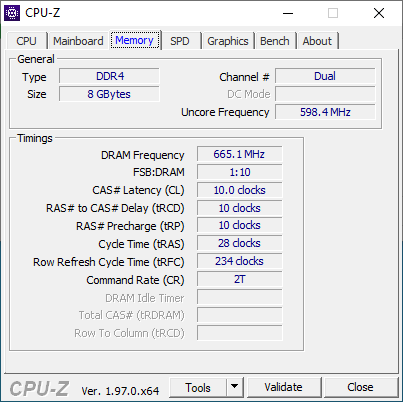
| Kuu LeBook 12.6 Core i7-8550U i5-8550U, UHD Graphics 620, 42 Wh | Lenovo ThinkPad X12 20UVS03G00 i7-1160G7, Iris Xe G7 96EUs, 42 Wh | Microsoft Surface Pro 7 Plus i5-1135G7, Iris Xe G7 80EUs, 48.9 Wh | Dell Latitude 12 7210 2-in-1 i7-10610U, UHD Graphics 620, 38 Wh | Microsoft Surface Laptop Go Core i5 i5-1035G1, UHD Graphics G1 (Ice Lake 32 EU), 39 Wh | NuVision Encite Book 12 Plus Celeron N3350, HD Graphics 500, 31.9 Wh | |
|---|---|---|---|---|---|---|
| Duração da bateria | 28% | 27% | 28% | 25% | 6% | |
| WiFi v1.3 (h) | 6.4 | 8.2 28% | 8.1 27% | 8.2 28% | 8 25% | 6.8 6% |
| Load (h) | 2 | 3.9 | 1.9 | 2 | 3.6 | |
| Reader / Idle (h) | 13.6 | 22.8 | 35 | 11.3 |
Pro
Contra
Veredicto - Um dos Melhores Tabletes de Windows em um Orçamento
A força do KUU LeBook é visual e tangível. É uma placa solidamente construída que poderia passar como um modelo emblemático mais caro, como o Surface Pro ou o HP ElitePad. Também temos que aplaudir o fabricante por aderir a uma CPU Core U-series em vez da muito mais fraca Atom, Celeron ou Pentium part a la the Surface Go ou muitos outros tablets Windows mais baratos na faixa de orçamento. A espaçosa tela sensível ao toque de 12,6 polegadas e as moldura relativamente estreitas ajudam a tornar o LeBook ainda mais atraente
Ele se parece e se sente como um tablet de alta qualidade com desempenho respeitável de sua CPU Core da série U. No entanto, a base do teclado saltitante e o ruído do ventilador de alta intensidade são difíceis de ignorar.
Os benefícios do KUU são, em sua maioria, profundos, pois o ventilador pulsante de alta pressão, o visor com regulação de fluxo luminoso, a bateria mais curta e as teclas esponjosas do teclado dificultam a experiência do usuário, apesar de quão elegante e suave o chassi pode ser. Embora o LeBook não possa se comparar ao Surface Pro nestas áreas específicas, ele ainda é geralmente melhor do que outros tablets do Windows de orçamento, incluindo o Asus Transformer Book ou Superfície Ir especialmente em termos de tamanho e desempenho de exibição.
Preço e disponibilidade
O LeBook 12.6 ainda não está amplamente disponível e sem uma data sólida de lançamento no momento da publicação.
Kuu LeBook 12.6 Core i7-8550U
- 09/04/2021 v7 (old)
Allen Ngo
Price comparison

