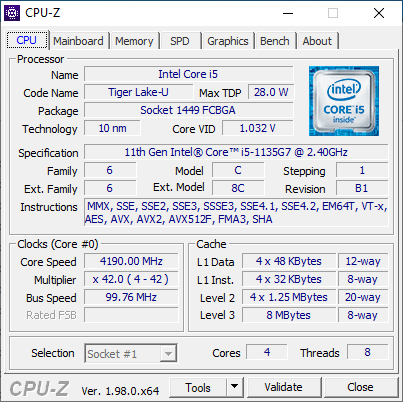
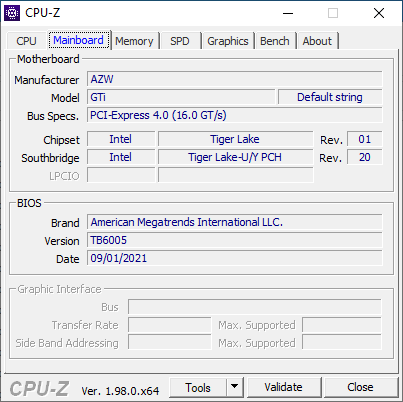
Nossa principal alternativa Intel NUC 11: Revisão do mini PC Beelink GTI 11
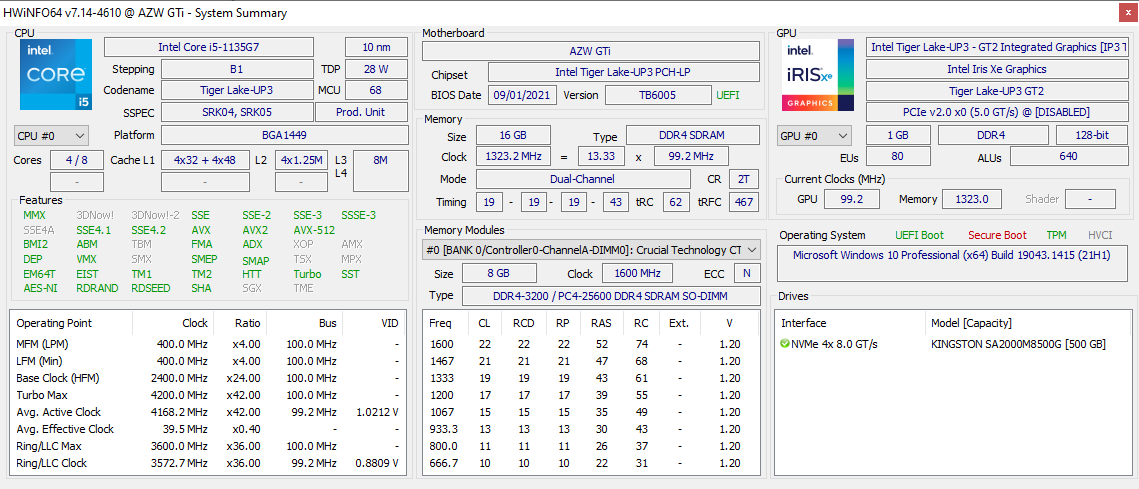
A Beelink tem toda uma gama de mini PCs disponíveis para compradores interessados na experiência da Intel NUC sem ter que pagar os altos preços da Intel NUC. O mais novo modelo é o GTI 11 que utiliza o mais recente 11º gen Tiger Lake-U Core i5-1135G7 processador com gráficos integrados Iris Xe 80 EUs. Este detalhe é notável, já que a maioria dos outros mini PCs Beelink normalmente dependem de CPUs mais antigas ou mais lentas, a fim de manter os custos em níveis mais acessíveis. O GTI 11 é subseqüentemente um dos mais rápidos e mais caros mini PCs da linha atual da Beelink.
As alternativas ao GTI 11 incluem outros mini PCs alimentados por CPUs Intel Core série U da 11ª geração, como o Intel NUC11 Phantom Canyon, Beelink GMK NucBoc 2ou Zotac ZBox CI665 Nano
Mais análises da Beelink:
Potential Competitors in Comparison
Avaliação | Data | Modelo | Peso | Altura | Size | Resolução | Preço |
|---|---|---|---|---|---|---|---|
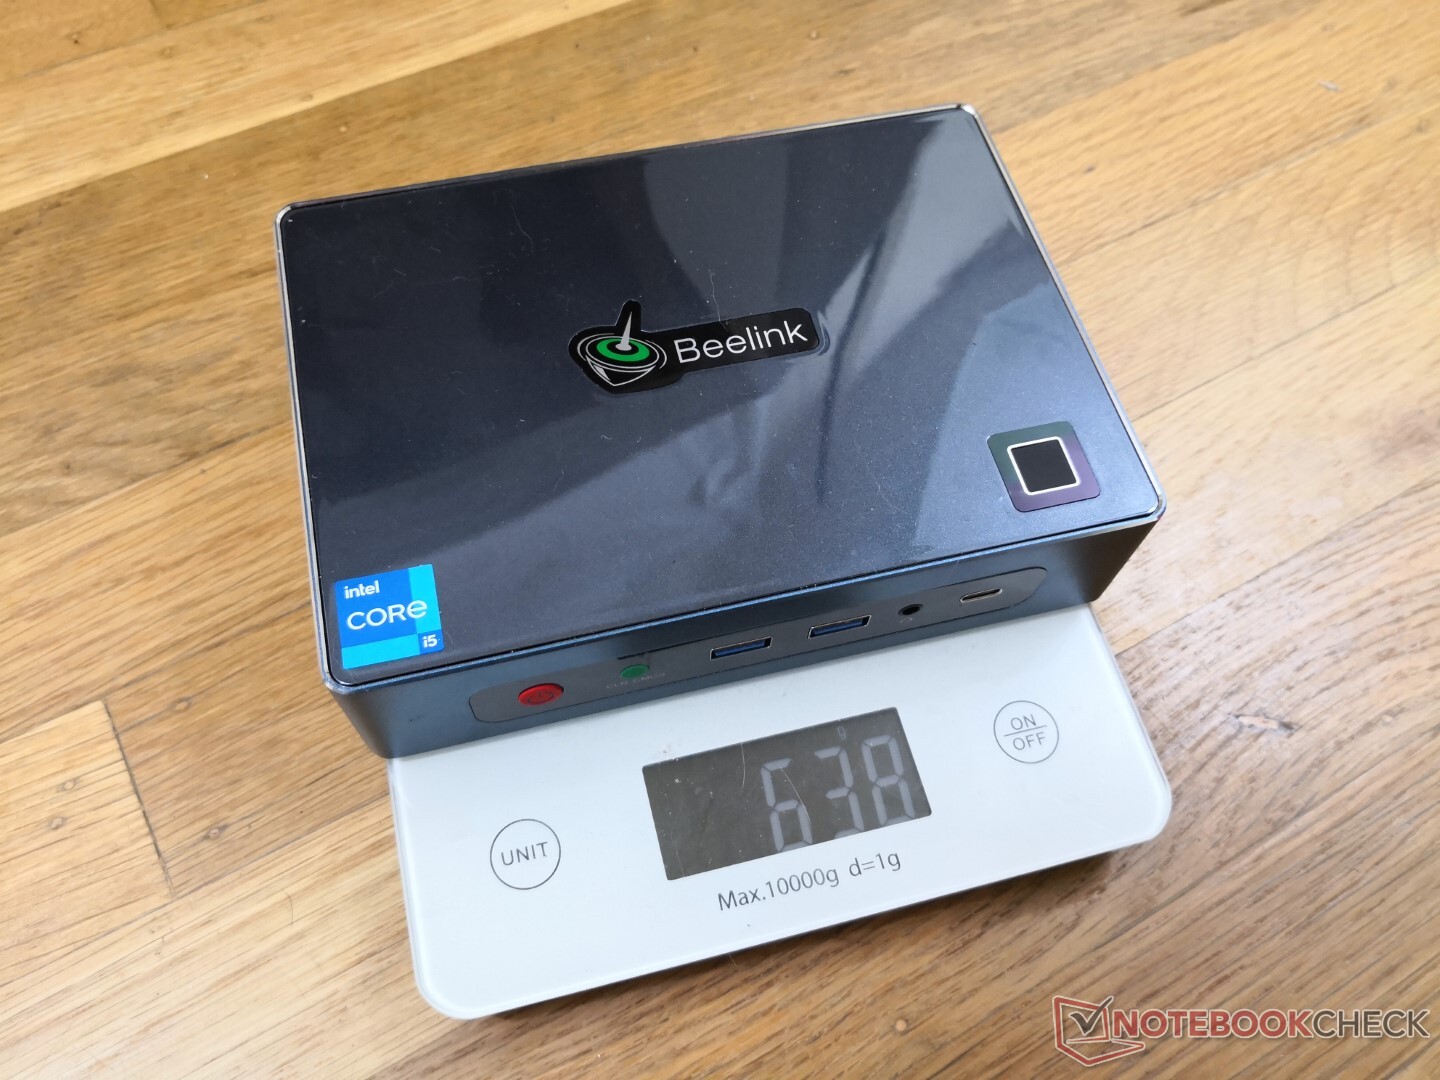
v (old) | 12/2021 | Beelink GTI 11 i5-1135G7, Iris Xe G7 80EUs | 638 g | 39 mm | x | ||
v (old) | 11/2021 | Beelink SER3 R7 3750H, Vega 10 | 492 g | 40 mm | x | ||
v (old) | 04/2021 | Intel NUC11TNKi5 i5-1135G7, Iris Xe G7 80EUs | 504 g | 37 mm | x | ||
v (old) | Intel NUC10i7FNH i7-10710U, UHD Graphics 620 | 697 g | 51 mm | 0.00" | 0x0 | ||
v (old) | 03/2021 | GMK NucBox 2 i5-8259U, Iris Plus Graphics 655 | 430 g | 50 mm | x | ||
v (old) | Intel Hades Canyon NUC8i7HVK i7-8809G, Vega M GH | 1.3 kg | 39 mm | x |
Caso
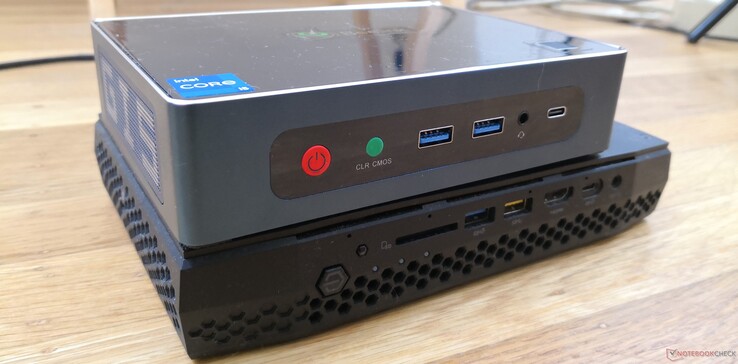
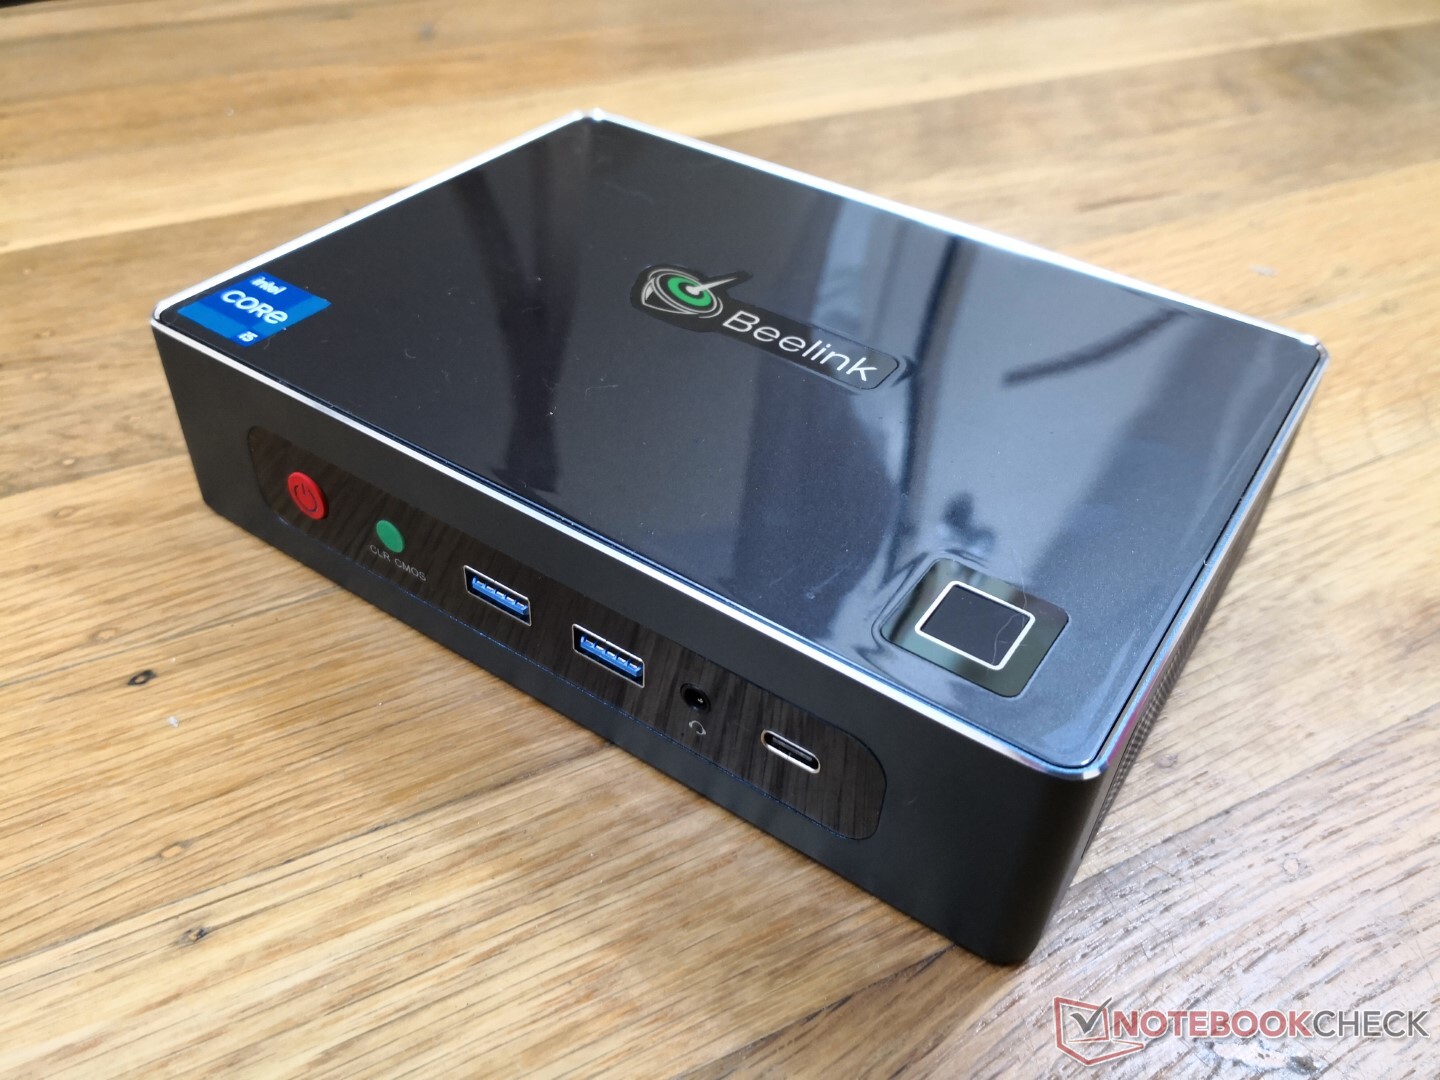
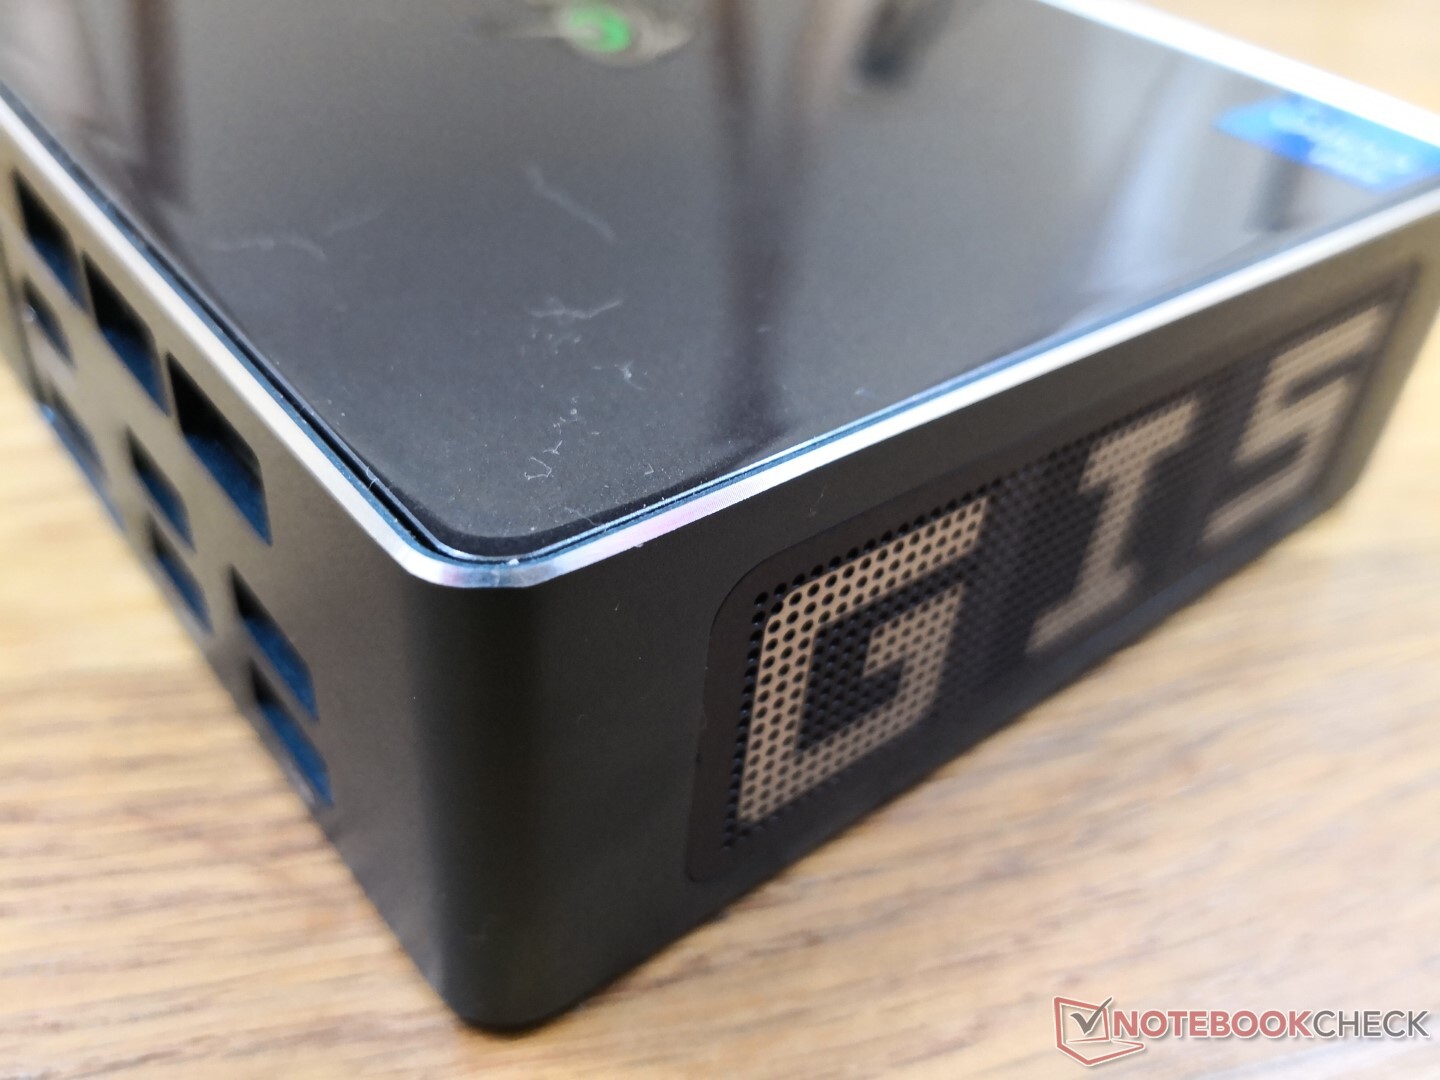
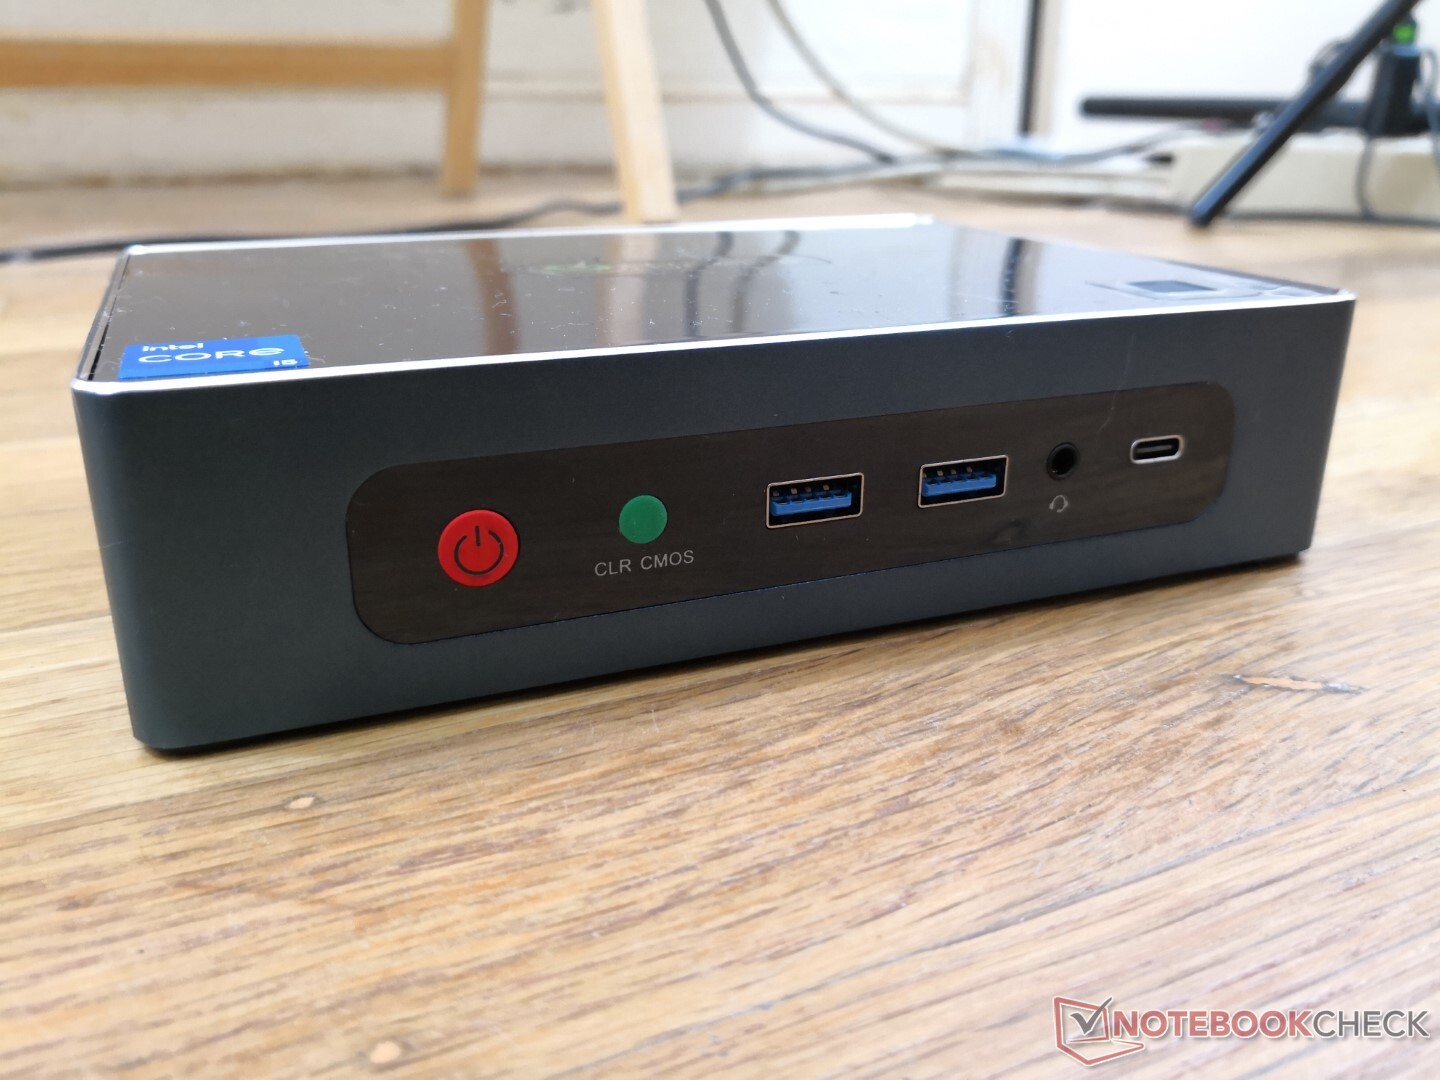
O esqueleto é feito de materiais mais finos e menos metálicos do que em um NUC da Intel, o que provavelmente manterá tanto os custos quanto o peso baixos. A qualidade de construção ainda é excelente e sem pontos flexionados ou visivelmente fracos. Entretanto, não gostamos particularmente da tampa de plástico brilhante, pois ela atrai tanto as impressões digitais quanto os arranhões muito rapidamente
Conectividade
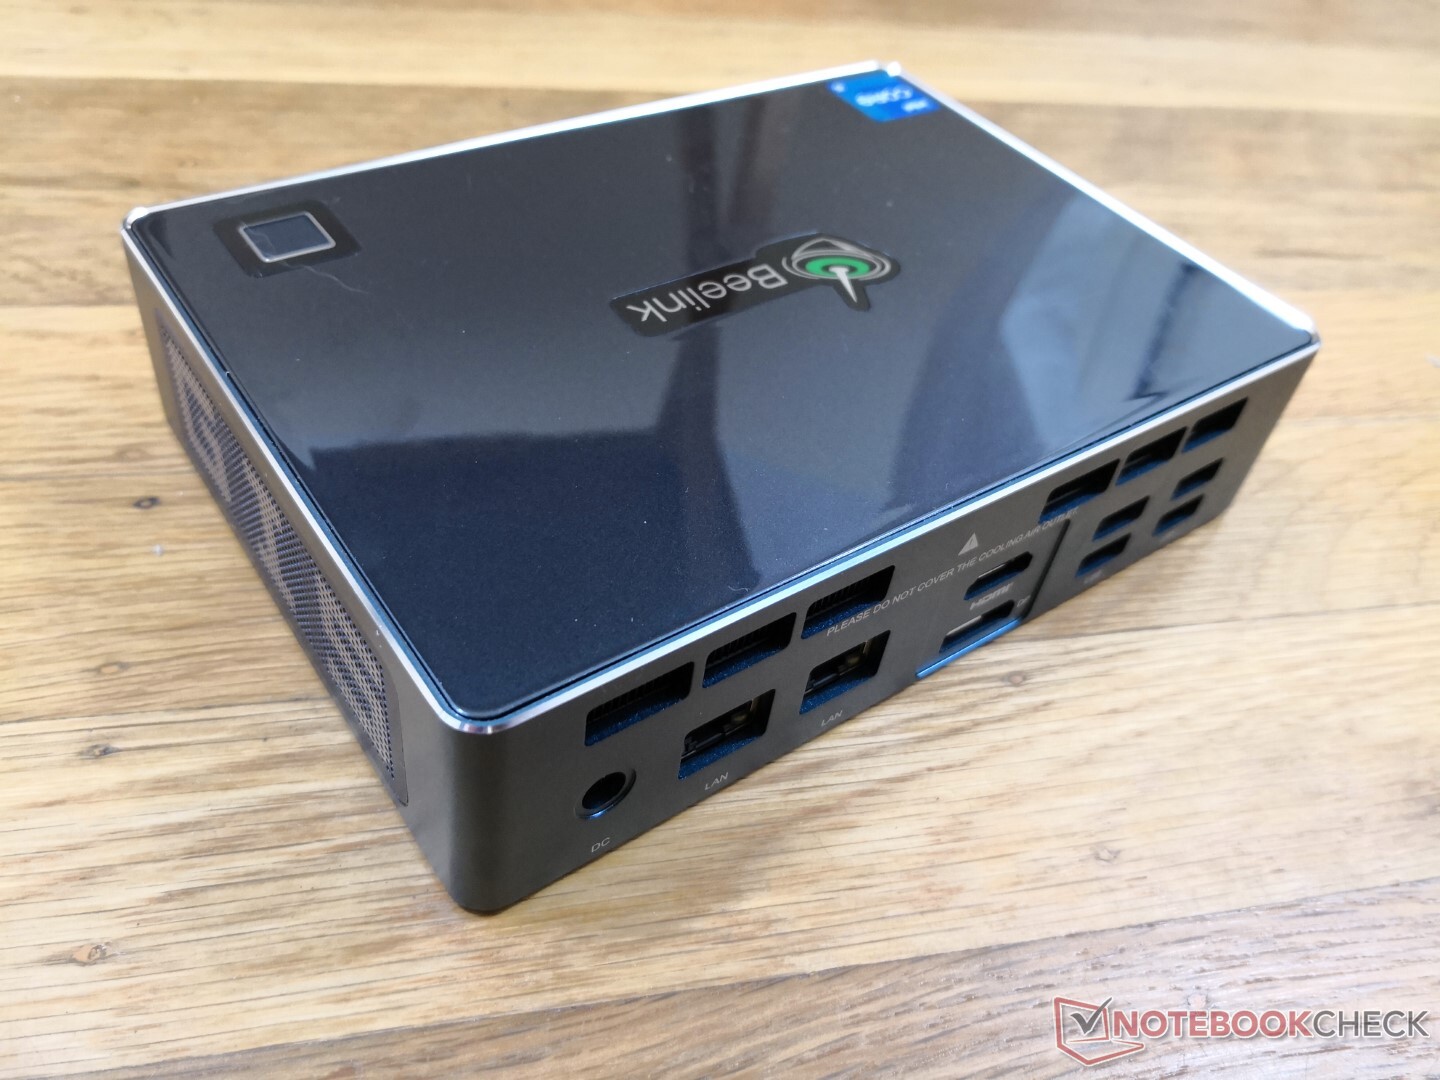
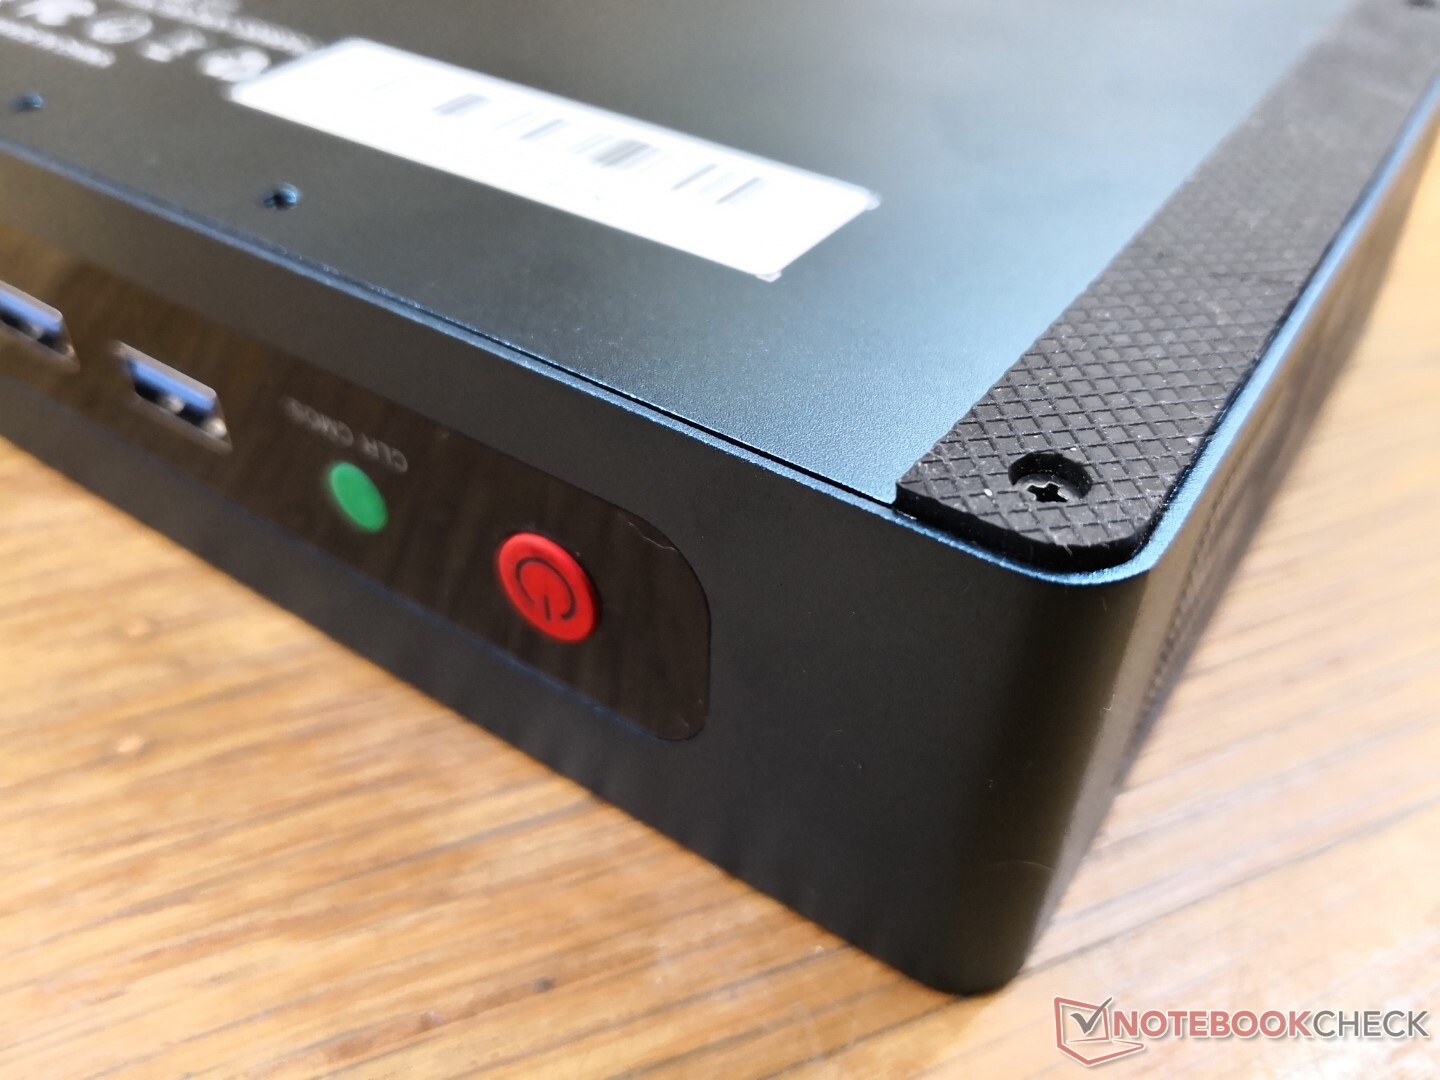
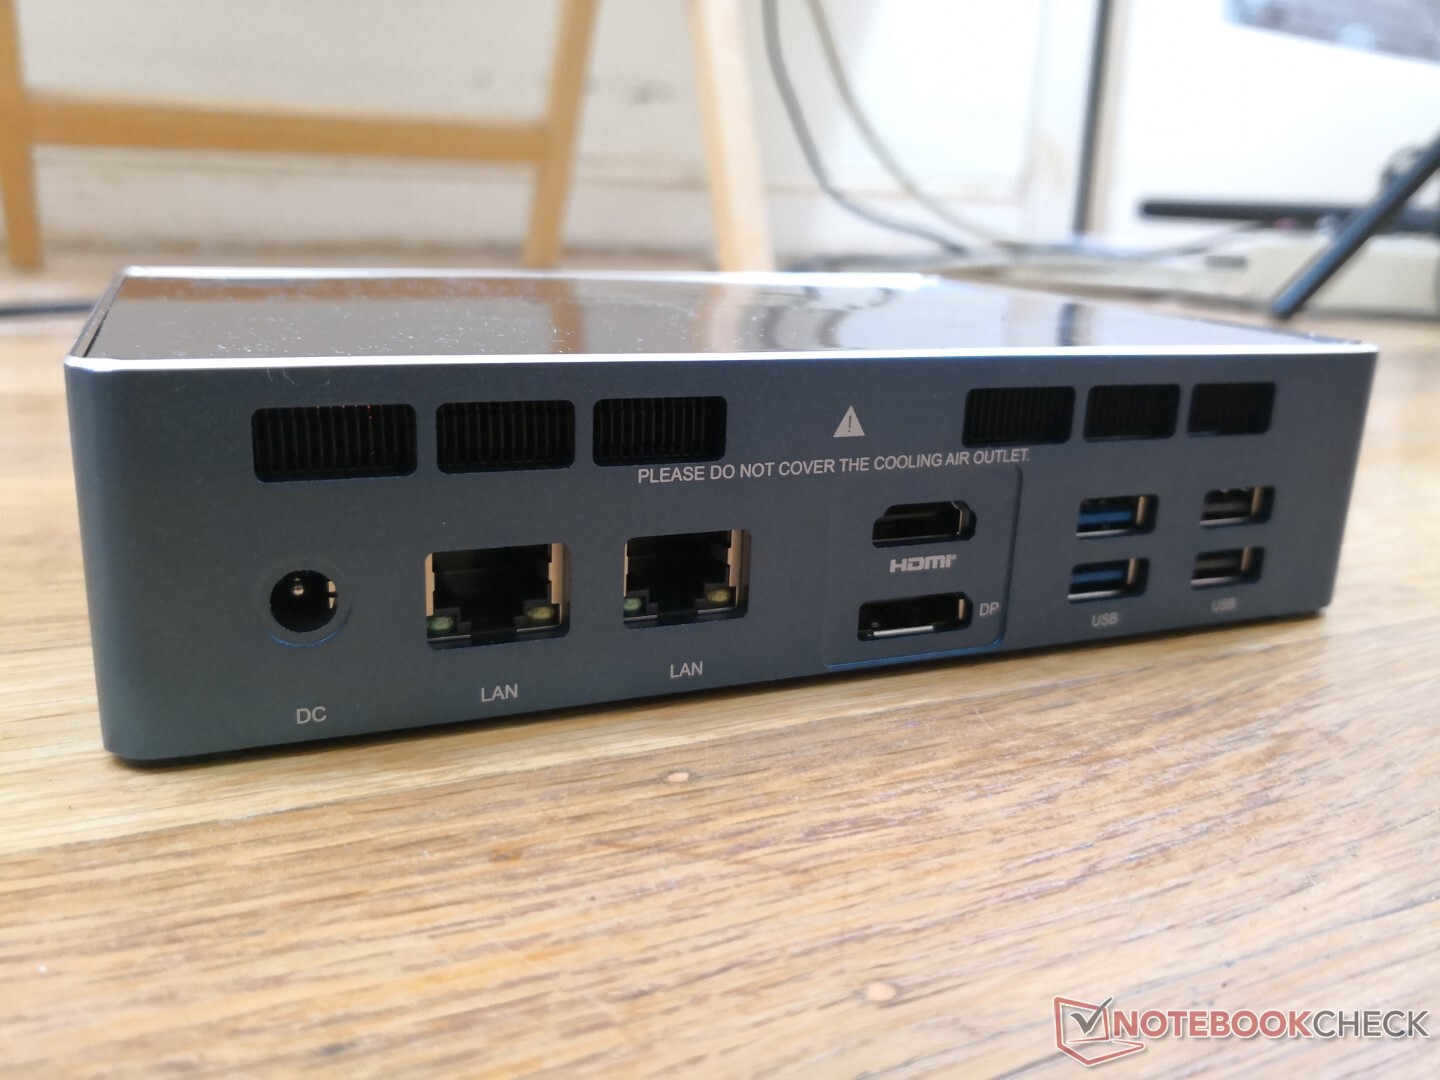
Há muitas portas à escolha, incluindo múltiplas portas RJ-45, múltiplas portas HDMI, e seis portas USB-A. A porta USB-C suporta também dispositivos Thunderbolt 4, mesmo que o fabricante não o divulgue. O Centro de Controle Thunderbolt vem pré-instalado e seu arquivo DxDiag confirma o suporte ao Thunderbolt também.
A única porta USB-C pode ser limitada e não há mini-DisplayPort ou fechadura Kensington, ao contrário da Intel NUC11TNKi5 Pro.
É importante ressaltar que o Beelink pode ser alimentado por USB-C em vez do adaptador AC proprietário. Testamos isto com um adaptador USB-C de 130 W de um Dell XPS 15 9500 que funcionou sem problemas em nossa unidade Beelink.
Comunicação
Módulos embutidos de comunicação com e sem fio, comparação de dados de teste de rede com a concorrência, soluções alternativas disponíveis (5G/LTE)?, Irregularidades (recepção de rádio)?
| Networking | |
| iperf3 transmit AX12 | |
| Intel NUC11TNKi5 | |
| Beelink GTI 11 | |
| GMK NucBox 2 | |
| Intel Hades Canyon NUC8i7HVK | |
| Beelink SER3 | |
| iperf3 receive AX12 | |
| Intel NUC11TNKi5 | |
| Beelink GTI 11 | |
| Beelink SER3 | |
| GMK NucBox 2 | |
| Intel Hades Canyon NUC8i7HVK | |
Manutenção
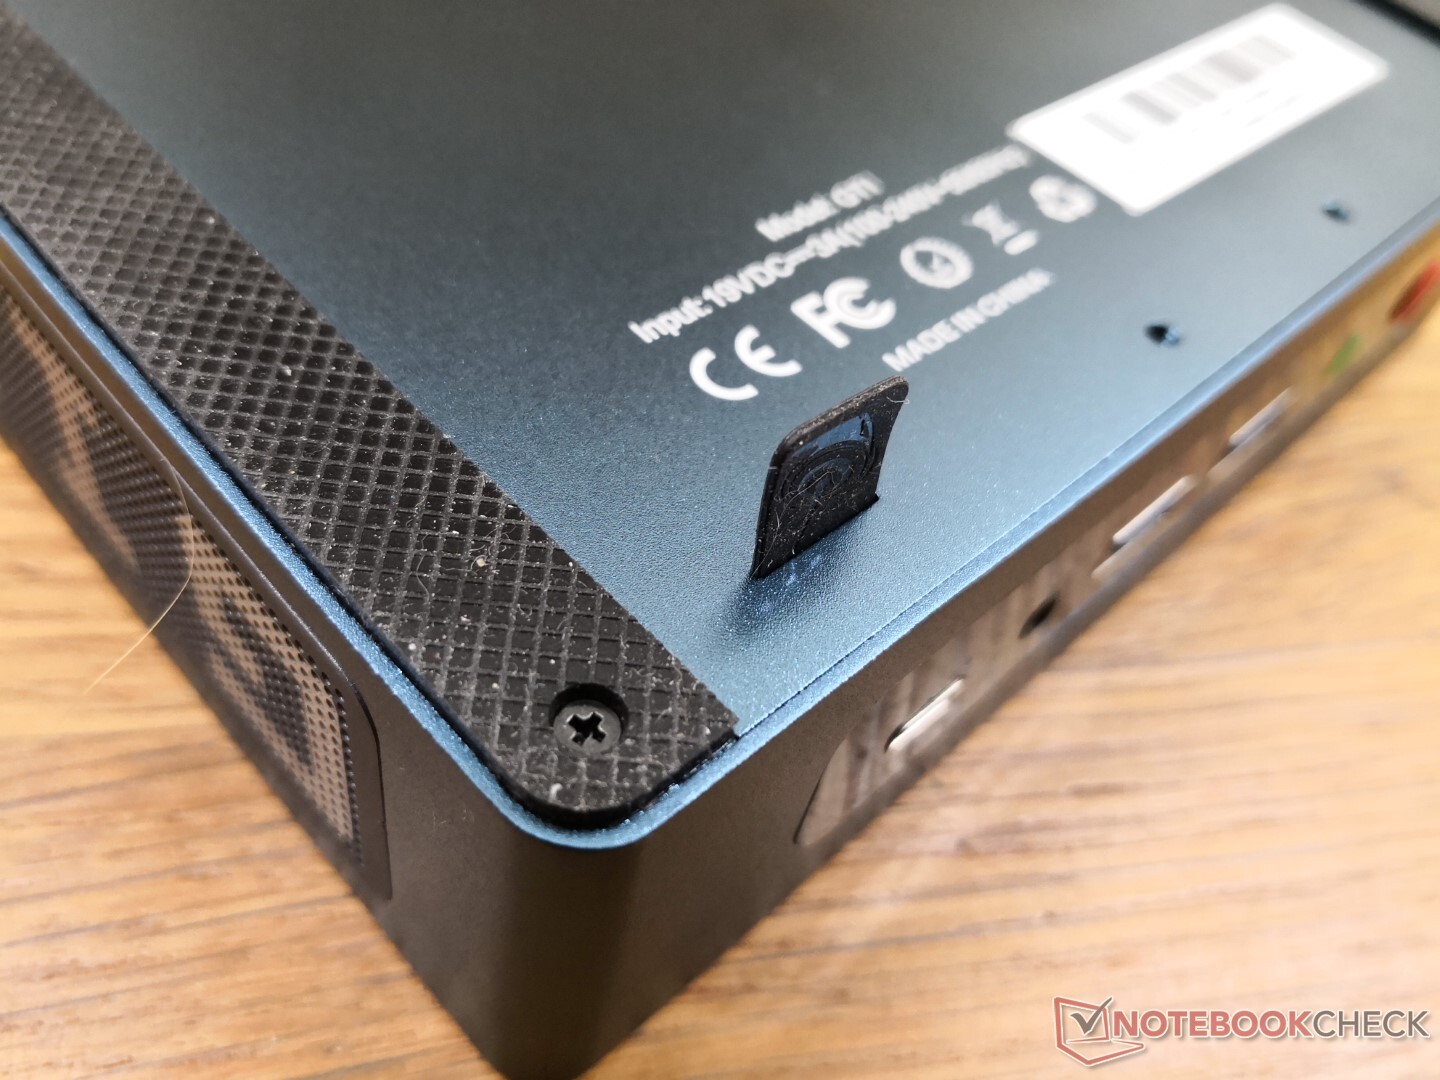
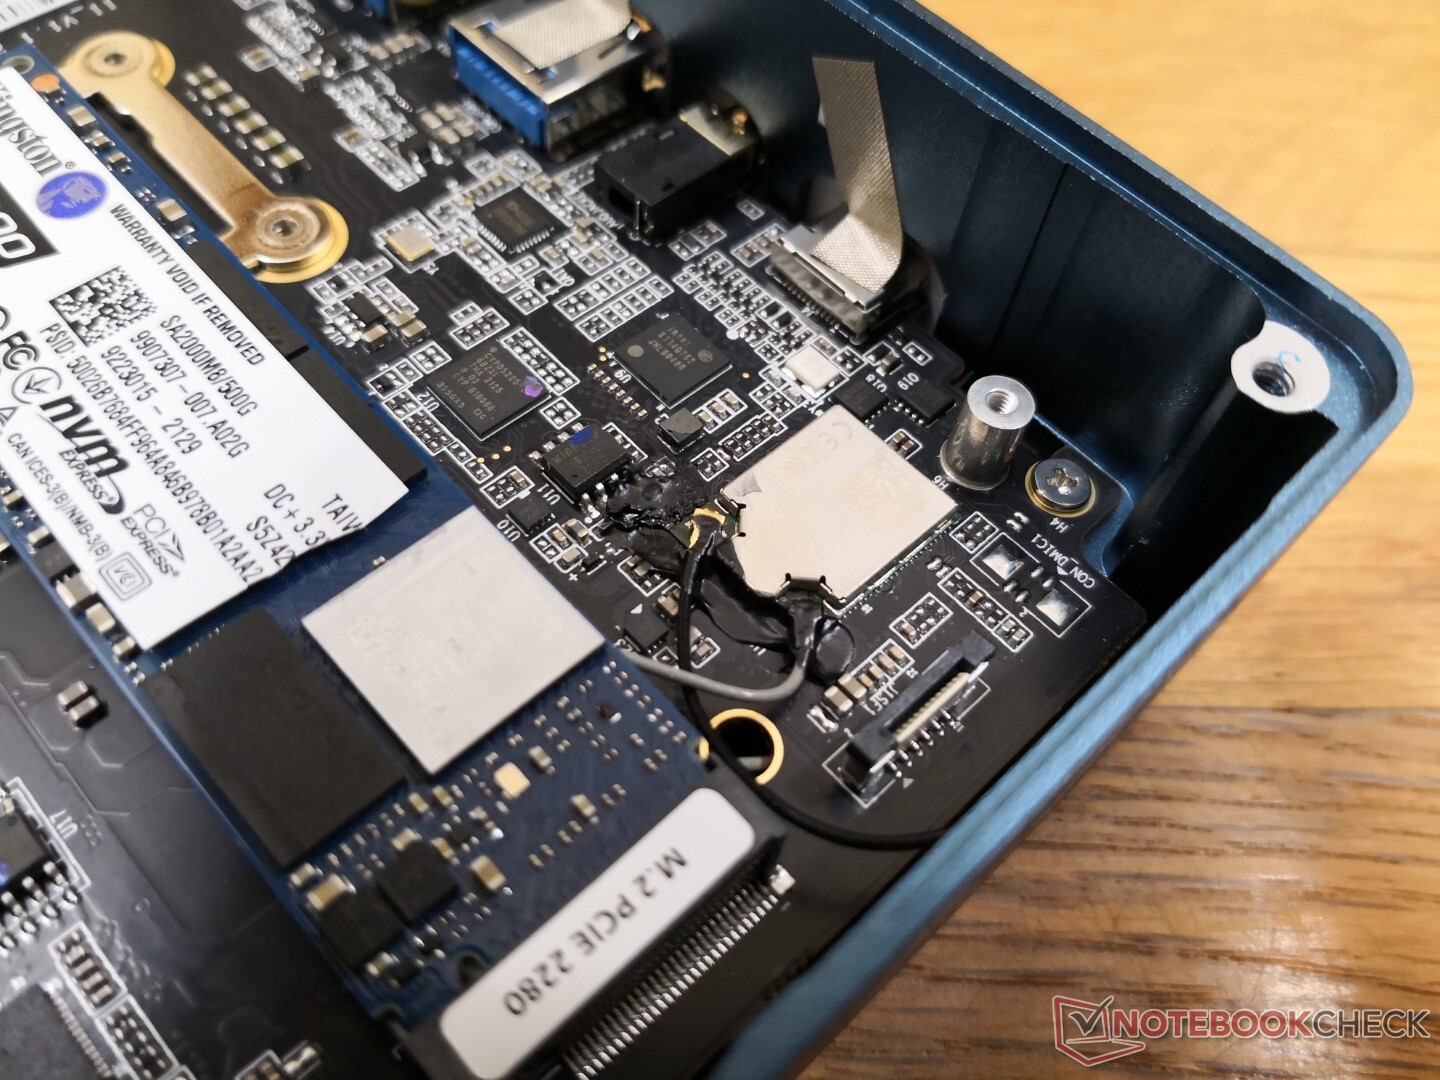
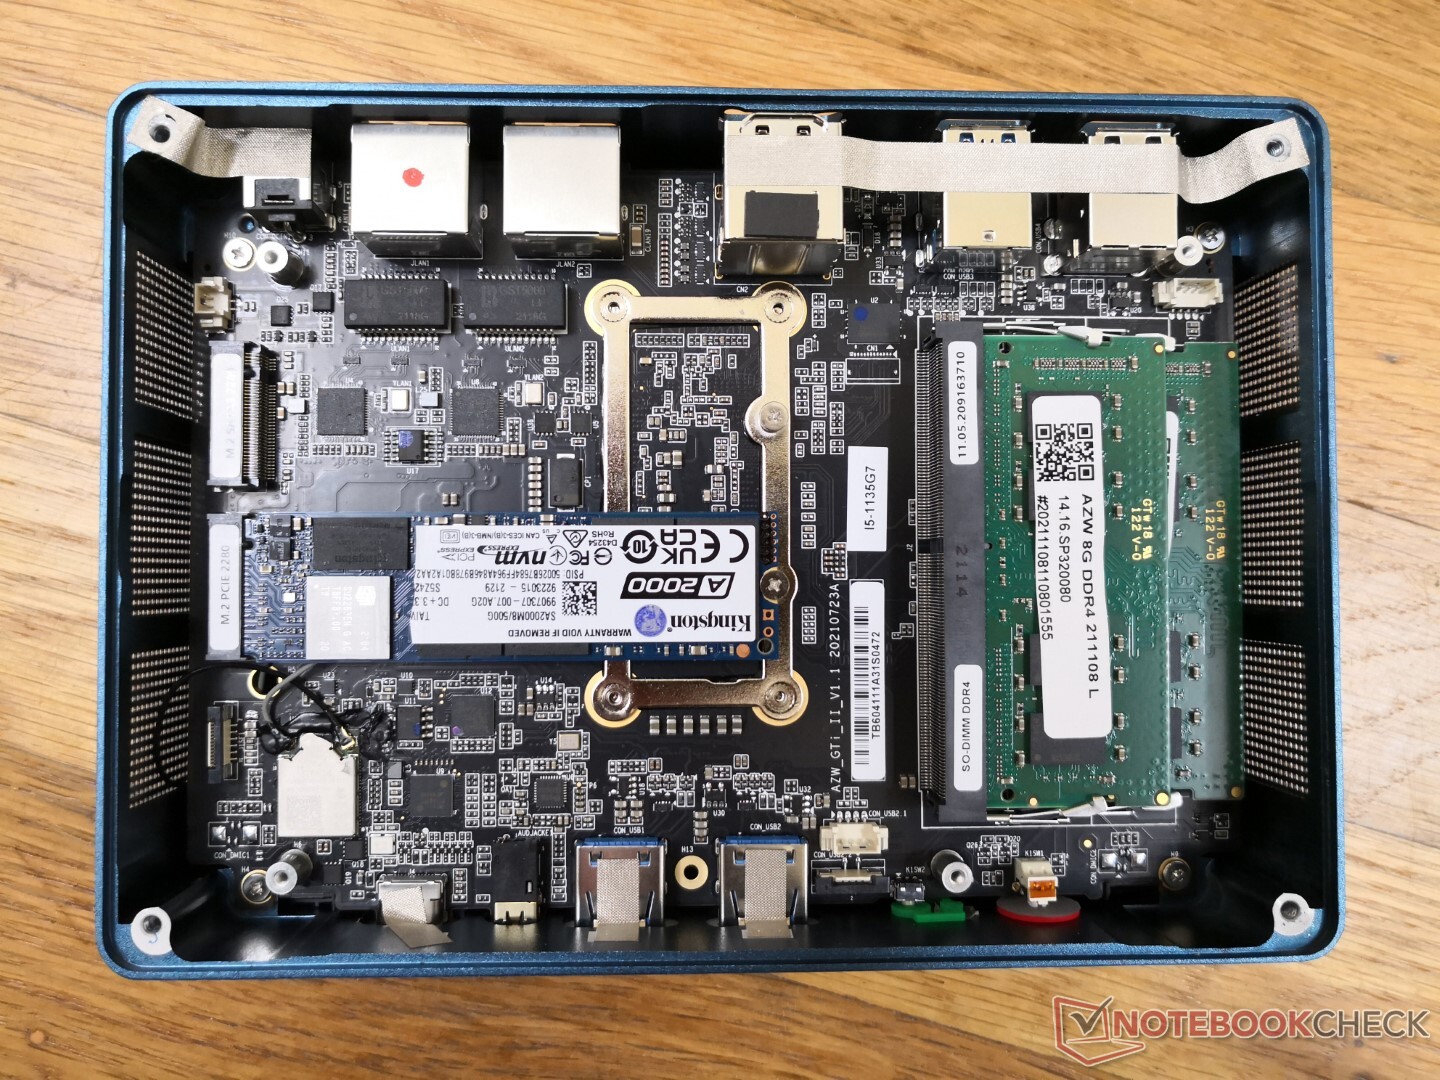
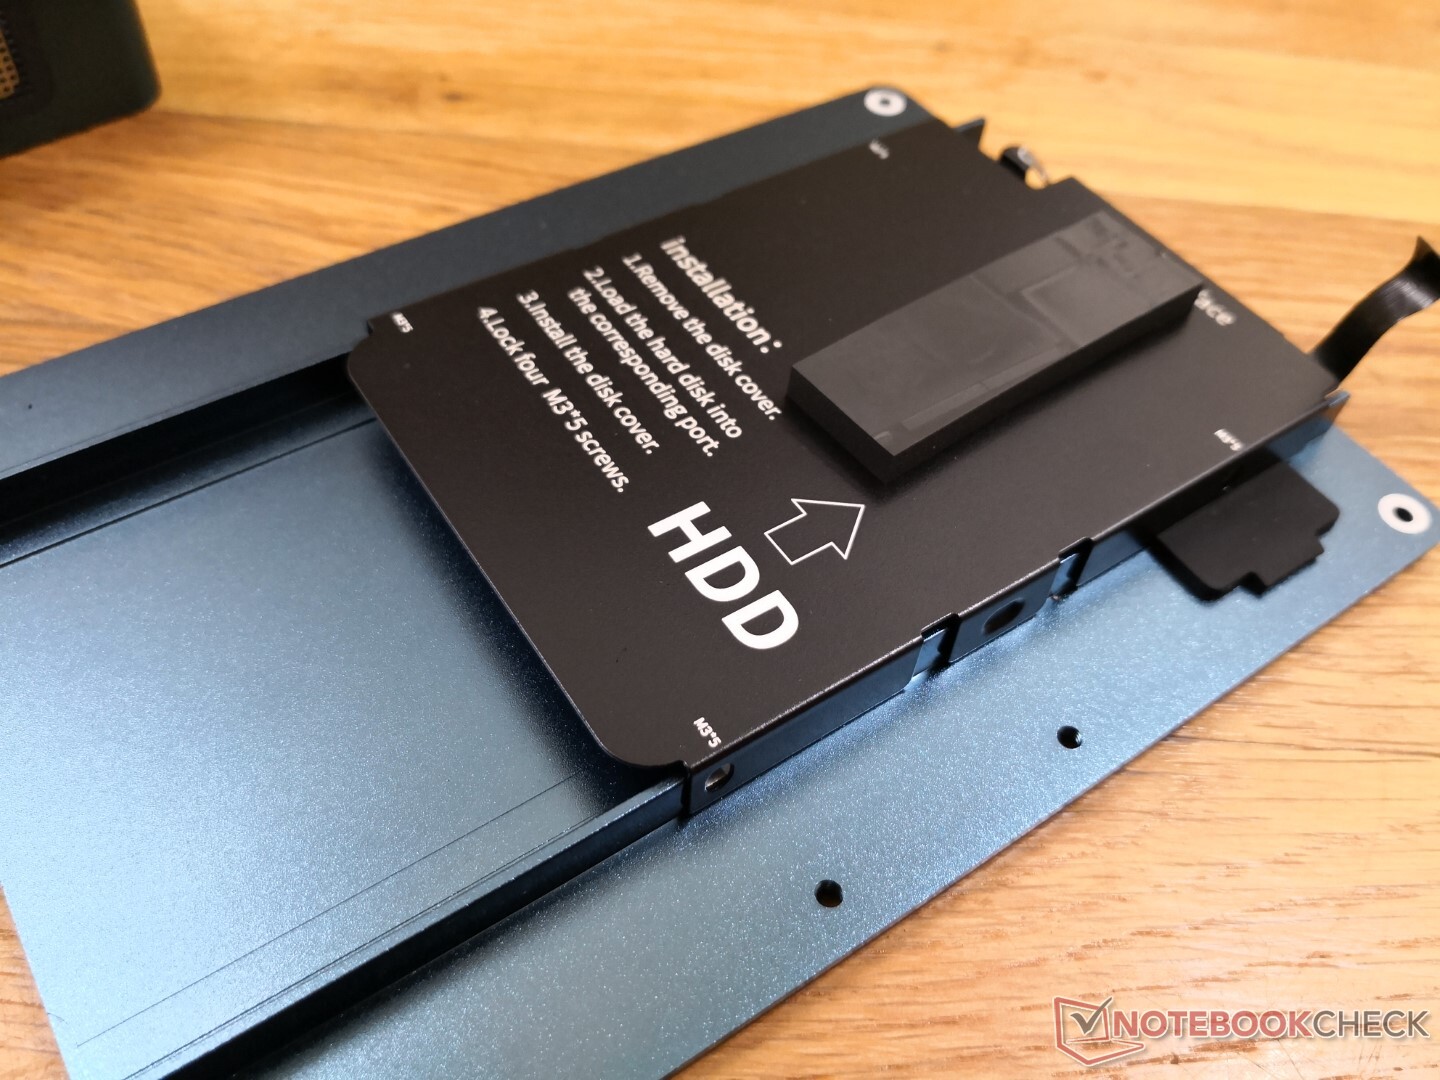
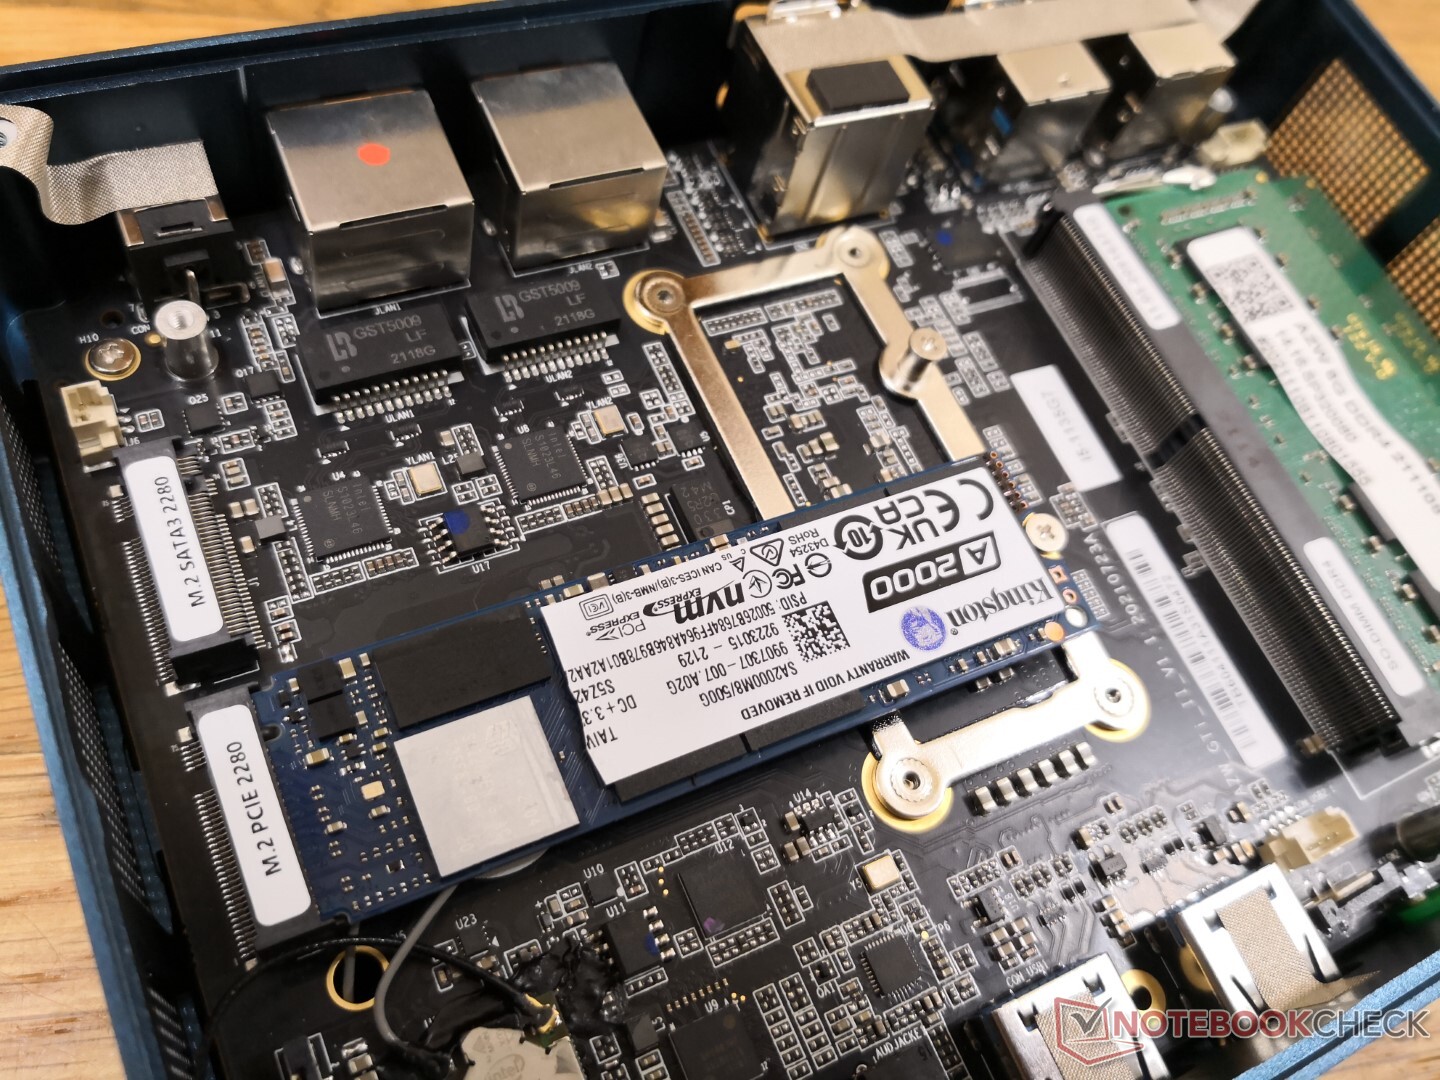
O painel inferior pode ser removido apenas com uma chave de fenda Philips. Os usuários devem ter o cuidado de destacar também a fita que conecta o painel inferior à placa-mãe. Há acesso direto aos dois slots SODIMM, ambos os slots M.2 2280, e ao bay SATA III de 2,5 polegadas no painel inferior, uma vez removido.
Acessórios e Garantia
Extras incluem dois cabos HDMI, parafusos extras e um suporte de contagem VESA 50/100 mm.
Aplica-se a garantia limitada padrão de um ano. A garantia pode ser árdua para alguns usuários, pois o envio é feito para o exterior.
Desempenho
Processador
O desempenho bruto da CPU multi-fio é de 15% a 20% mais rápido do que a média do PC ou laptop com o mesmo Núcleo i5-1135G7 CPU. Mesmo os mais velhos 100 W Kaby Lake-GNúcleo i7-8809G Hades Canyon mini PC está atrás de nossa CPU Core i7 da 11ª geração. O mais avançadoNúcleo i7-1165G7A GTI 11, que não está disponível no GTI 11, pode proporcionar aos usuários da rede um desempenho multitarefa até 25% superior ao nosso Core i5-1135G7
Ao executar o CineBench R15 xT em um loop, a pontuação inicial de 915 pontos cairia rapidamente para ~840 pontos para representar um mergulho de desempenho de 8% devido à sustentabilidade limitada do Turbo Boost, conforme detalhado em nossa seção de Teste de Estresse abaixo.
Cinebench R15 Multi Loop
Cinebench R23: Multi Core | Single Core
Cinebench R20: CPU (Multi Core) | CPU (Single Core)
Cinebench R15: CPU Multi 64Bit | CPU Single 64Bit
Blender: v2.79 BMW27 CPU
7-Zip 18.03: 7z b 4 | 7z b 4 -mmt1
Geekbench 5.5: Multi-Core | Single-Core
HWBOT x265 Benchmark v2.2: 4k Preset
LibreOffice : 20 Documents To PDF
R Benchmark 2.5: Overall mean
| CPU Performance rating | |
| Intel NUC11PAQi7 -1! | |
| Lenovo Yoga 6 13ALC6 -2! | |
| Intel NUC10i7FNH -3! | |
| Asus Vivobook 15 K513EQ -2! | |
| Beelink GTI 11 | |
| Lenovo Yoga 6 13 82ND0009US -2! | |
| Intel NUC11TNKi5 | |
| Intel Hades Canyon NUC8i7HVK -6! | |
| Média Intel Core i5-1135G7 | |
| Infinix INBook X1 Pro -2! | |
| Asus VivoBook S13 S333JA-DS51 | |
| GMK NucBox 2 | |
| Beelink SER3 -2! | |
| Beelink GTR35 II-G-16512D00W64PRO-1T -2! | |
| Cinebench R23 / Multi Core | |
| Lenovo Yoga 6 13ALC6 | |
| Intel NUC11PAQi7 | |
| Lenovo Yoga 6 13 82ND0009US | |
| Asus Vivobook 15 K513EQ | |
| Beelink GTI 11 | |
| Intel NUC11TNKi5 | |
| Média Intel Core i5-1135G7 (2786 - 6136, n=55) | |
| Infinix INBook X1 Pro | |
| Asus VivoBook S13 S333JA-DS51 | |
| Beelink SER3 | |
| GMK NucBox 2 | |
| Cinebench R23 / Single Core | |
| Asus Vivobook 15 K513EQ | |
| Intel NUC11TNKi5 | |
| Beelink GTI 11 | |
| Média Intel Core i5-1135G7 (1062 - 1373, n=53) | |
| Lenovo Yoga 6 13ALC6 | |
| Infinix INBook X1 Pro | |
| Lenovo Yoga 6 13 82ND0009US | |
| Asus VivoBook S13 S333JA-DS51 | |
| GMK NucBox 2 | |
| Beelink SER3 | |
| Cinebench R20 / CPU (Multi Core) | |
| Lenovo Yoga 6 13ALC6 | |
| Intel NUC11PAQi7 | |
| Lenovo Yoga 6 13 82ND0009US | |
| Intel NUC10i7FNH | |
| Asus Vivobook 15 K513EQ | |
| Beelink GTI 11 | |
| Intel Hades Canyon NUC8i7HVK | |
| Intel NUC11TNKi5 | |
| Média Intel Core i5-1135G7 (979 - 2382, n=62) | |
| Infinix INBook X1 Pro | |
| Beelink GTR35 II-G-16512D00W64PRO-1T | |
| Asus VivoBook S13 S333JA-DS51 | |
| Beelink SER3 | |
| GMK NucBox 2 | |
| Cinebench R20 / CPU (Single Core) | |
| Intel NUC11PAQi7 | |
| Asus Vivobook 15 K513EQ | |
| Beelink GTI 11 | |
| Média Intel Core i5-1135G7 (375 - 527, n=62) | |
| Intel NUC11TNKi5 | |
| Lenovo Yoga 6 13ALC6 | |
| Intel NUC10i7FNH | |
| Infinix INBook X1 Pro | |
| Lenovo Yoga 6 13 82ND0009US | |
| Intel Hades Canyon NUC8i7HVK | |
| GMK NucBox 2 | |
| Asus VivoBook S13 S333JA-DS51 | |
| Beelink SER3 | |
| Beelink GTR35 II-G-16512D00W64PRO-1T | |
| Cinebench R15 / CPU Multi 64Bit | |
| Lenovo Yoga 6 13ALC6 | |
| Intel NUC10i7FNH | |
| Lenovo Yoga 6 13 82ND0009US | |
| Intel NUC11PAQi7 | |
| Beelink GTI 11 | |
| Asus Vivobook 15 K513EQ | |
| Intel Hades Canyon NUC8i7HVK | |
| Intel NUC11TNKi5 | |
| Média Intel Core i5-1135G7 (431 - 941, n=65) | |
| Beelink SER3 | |
| Beelink GTR35 II-G-16512D00W64PRO-1T | |
| Infinix INBook X1 Pro | |
| Asus VivoBook S13 S333JA-DS51 | |
| GMK NucBox 2 | |
| Cinebench R15 / CPU Single 64Bit | |
| Intel NUC11PAQi7 | |
| Asus Vivobook 15 K513EQ | |
| Intel NUC11TNKi5 | |
| Beelink GTI 11 | |
| Média Intel Core i5-1135G7 (141.4 - 205, n=61) | |
| Intel NUC10i7FNH | |
| Lenovo Yoga 6 13ALC6 | |
| Infinix INBook X1 Pro | |
| Intel Hades Canyon NUC8i7HVK | |
| Lenovo Yoga 6 13 82ND0009US | |
| GMK NucBox 2 | |
| Beelink GTR35 II-G-16512D00W64PRO-1T | |
| Beelink SER3 | |
| Asus VivoBook S13 S333JA-DS51 | |
| Blender / v2.79 BMW27 CPU | |
| GMK NucBox 2 | |
| Asus VivoBook S13 S333JA-DS51 | |
| Infinix INBook X1 Pro | |
| Beelink SER3 | |
| Beelink GTR35 II-G-16512D00W64PRO-1T | |
| Média Intel Core i5-1135G7 (499 - 1044, n=60) | |
| Intel NUC11TNKi5 | |
| Beelink GTI 11 | |
| Asus Vivobook 15 K513EQ | |
| Intel Hades Canyon NUC8i7HVK | |
| Lenovo Yoga 6 13 82ND0009US | |
| Intel NUC10i7FNH | |
| Intel NUC11PAQi7 | |
| Lenovo Yoga 6 13ALC6 | |
| 7-Zip 18.03 / 7z b 4 | |
| Lenovo Yoga 6 13ALC6 | |
| Lenovo Yoga 6 13 82ND0009US | |
| Intel NUC10i7FNH | |
| Intel NUC11PAQi7 | |
| Asus Vivobook 15 K513EQ | |
| Beelink GTI 11 | |
| Intel NUC11TNKi5 | |
| Média Intel Core i5-1135G7 (14745 - 24873, n=62) | |
| Infinix INBook X1 Pro | |
| Intel Hades Canyon NUC8i7HVK | |
| GMK NucBox 2 | |
| Asus VivoBook S13 S333JA-DS51 | |
| Beelink SER3 | |
| Beelink GTR35 II-G-16512D00W64PRO-1T | |
| 7-Zip 18.03 / 7z b 4 -mmt1 | |
| Intel NUC11PAQi7 | |
| Asus Vivobook 15 K513EQ | |
| Beelink GTI 11 | |
| Intel NUC11TNKi5 | |
| Intel NUC10i7FNH | |
| Média Intel Core i5-1135G7 (3924 - 4921, n=62) | |
| Lenovo Yoga 6 13ALC6 | |
| Infinix INBook X1 Pro | |
| Lenovo Yoga 6 13 82ND0009US | |
| Intel Hades Canyon NUC8i7HVK | |
| GMK NucBox 2 | |
| Beelink SER3 | |
| Asus VivoBook S13 S333JA-DS51 | |
| Beelink GTR35 II-G-16512D00W64PRO-1T | |
| Geekbench 5.5 / Multi-Core | |
| Intel NUC10i7FNH | |
| Beelink GTI 11 | |
| Intel NUC11PAQi7 | |
| Média Intel Core i5-1135G7 (3475 - 5472, n=58) | |
| Intel NUC11TNKi5 | |
| Asus VivoBook S13 S333JA-DS51 | |
| GMK NucBox 2 | |
| Beelink GTR35 II-G-16512D00W64PRO-1T | |
| Geekbench 5.5 / Single-Core | |
| Intel NUC11PAQi7 | |
| Beelink GTI 11 | |
| Intel NUC11TNKi5 | |
| Média Intel Core i5-1135G7 (1147 - 1428, n=58) | |
| Intel NUC10i7FNH | |
| Asus VivoBook S13 S333JA-DS51 | |
| GMK NucBox 2 | |
| Beelink GTR35 II-G-16512D00W64PRO-1T | |
| HWBOT x265 Benchmark v2.2 / 4k Preset | |
| Lenovo Yoga 6 13ALC6 | |
| Intel NUC11PAQi7 | |
| Intel NUC10i7FNH | |
| Lenovo Yoga 6 13 82ND0009US | |
| Asus Vivobook 15 K513EQ | |
| Intel Hades Canyon NUC8i7HVK | |
| Beelink GTI 11 | |
| Intel NUC11TNKi5 | |
| Média Intel Core i5-1135G7 (3.57 - 7.6, n=57) | |
| Infinix INBook X1 Pro | |
| Asus VivoBook S13 S333JA-DS51 | |
| GMK NucBox 2 | |
| Beelink SER3 | |
| Beelink GTR35 II-G-16512D00W64PRO-1T | |
| LibreOffice / 20 Documents To PDF | |
| Beelink SER3 | |
| Beelink GTR35 II-G-16512D00W64PRO-1T | |
| Lenovo Yoga 6 13 82ND0009US | |
| GMK NucBox 2 | |
| Lenovo Yoga 6 13ALC6 | |
| Asus VivoBook S13 S333JA-DS51 | |
| Infinix INBook X1 Pro | |
| Beelink GTI 11 | |
| Média Intel Core i5-1135G7 (44.2 - 62.9, n=60) | |
| Intel NUC11TNKi5 | |
| Asus Vivobook 15 K513EQ | |
| Intel NUC11PAQi7 | |
| R Benchmark 2.5 / Overall mean | |
| GMK NucBox 2 | |
| Asus VivoBook S13 S333JA-DS51 | |
| Beelink GTR35 II-G-16512D00W64PRO-1T | |
| Beelink SER3 | |
| Infinix INBook X1 Pro | |
| Intel NUC10i7FNH | |
| Média Intel Core i5-1135G7 (0.619 - 0.727, n=59) | |
| Lenovo Yoga 6 13 82ND0009US | |
| Beelink GTI 11 | |
| Intel NUC11TNKi5 | |
| Lenovo Yoga 6 13ALC6 | |
| Asus Vivobook 15 K513EQ | |
| Intel NUC11PAQi7 | |
Cinebench R23: Multi Core | Single Core
Cinebench R20: CPU (Multi Core) | CPU (Single Core)
Cinebench R15: CPU Multi 64Bit | CPU Single 64Bit
Blender: v2.79 BMW27 CPU
7-Zip 18.03: 7z b 4 | 7z b 4 -mmt1
Geekbench 5.5: Multi-Core | Single-Core
HWBOT x265 Benchmark v2.2: 4k Preset
LibreOffice : 20 Documents To PDF
R Benchmark 2.5: Overall mean
* ... menor é melhor
AIDA64: FP32 Ray-Trace | FPU Julia | CPU SHA3 | CPU Queen | FPU SinJulia | FPU Mandel | CPU AES | CPU ZLib | FP64 Ray-Trace | CPU PhotoWorxx
| Performance rating | |
| Beelink GTI 11 | |
| Intel NUC11TNKi5 | |
| Média Intel Core i5-1135G7 | |
| GMK NucBox 2 | |
| Beelink SER3 | |
| AIDA64 / FP32 Ray-Trace | |
| Beelink GTI 11 | |
| Intel NUC11TNKi5 | |
| Média Intel Core i5-1135G7 (4313 - 7952, n=45) | |
| GMK NucBox 2 | |
| Beelink SER3 | |
| AIDA64 / FPU Julia | |
| Beelink GTI 11 | |
| Intel NUC11TNKi5 | |
| Média Intel Core i5-1135G7 (19402 - 32283, n=45) | |
| GMK NucBox 2 | |
| Beelink SER3 | |
| AIDA64 / CPU SHA3 | |
| Beelink GTI 11 | |
| Intel NUC11TNKi5 | |
| Média Intel Core i5-1135G7 (1316 - 2172, n=45) | |
| GMK NucBox 2 | |
| Beelink SER3 | |
| AIDA64 / CPU Queen | |
| Beelink GTI 11 | |
| Intel NUC11TNKi5 | |
| Média Intel Core i5-1135G7 (39000 - 46951, n=45) | |
| Beelink SER3 | |
| GMK NucBox 2 | |
| AIDA64 / FPU SinJulia | |
| Beelink SER3 | |
| Intel NUC11TNKi5 | |
| Beelink GTI 11 | |
| GMK NucBox 2 | |
| Média Intel Core i5-1135G7 (3497 - 4445, n=45) | |
| AIDA64 / FPU Mandel | |
| Beelink GTI 11 | |
| Intel NUC11TNKi5 | |
| Média Intel Core i5-1135G7 (12569 - 19635, n=45) | |
| GMK NucBox 2 | |
| Beelink SER3 | |
| AIDA64 / CPU AES | |
| Beelink GTI 11 | |
| Intel NUC11TNKi5 | |
| Média Intel Core i5-1135G7 (28988 - 67977, n=45) | |
| Beelink SER3 | |
| GMK NucBox 2 | |
| AIDA64 / CPU ZLib | |
| Intel NUC11TNKi5 | |
| Beelink GTI 11 | |
| Beelink SER3 | |
| Média Intel Core i5-1135G7 (265 - 373, n=51) | |
| GMK NucBox 2 | |
| AIDA64 / FP64 Ray-Trace | |
| Beelink GTI 11 | |
| Intel NUC11TNKi5 | |
| Média Intel Core i5-1135G7 (2226 - 4291, n=45) | |
| GMK NucBox 2 | |
| Beelink SER3 | |
| AIDA64 / CPU PhotoWorxx | |
| Beelink GTI 11 | |
| Média Intel Core i5-1135G7 (9004 - 45366, n=45) | |
| Intel NUC11TNKi5 | |
| Beelink SER3 | |
| GMK NucBox 2 | |
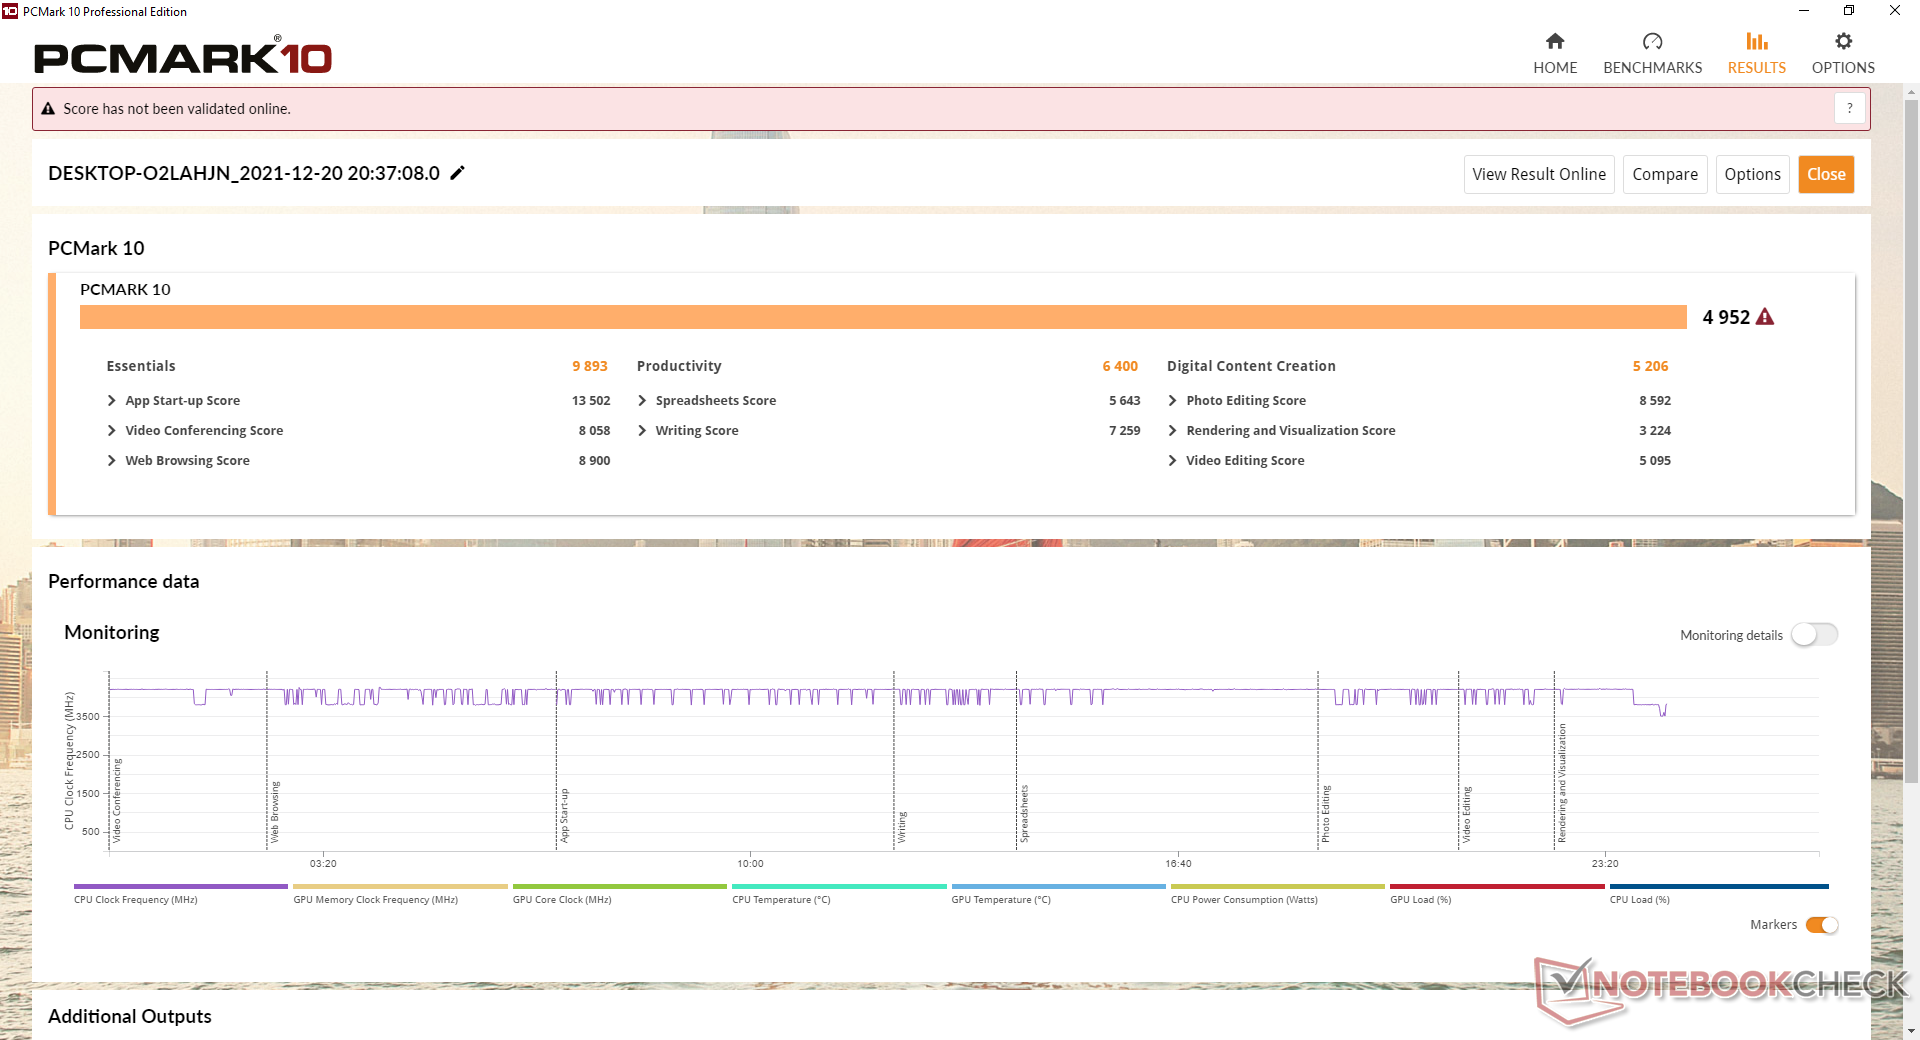
Desempenho do sistema
As pontuações PCMark 10 são excelentes e consistentemente acima de qualquer sistema Beelink que veio antes de nosso GTI 11. Os benefícios de usar uma CPU Intel do 11º gênero mais enxuta e mais eficiente em termos de energia somam-se a uma experiência de usuário mais suave.
| PCMark 10 / Score | |
| Intel Hades Canyon NUC8i7HVK | |
| Beelink GTI 11 | |
| Média Intel Core i5-1135G7, Intel Iris Xe Graphics G7 80EUs (4026 - 4952, n=53) | |
| Intel NUC11TNKi5 | |
| Intel NUC10i7FNH | |
| GMK NucBox 2 | |
| Beelink SER3 | |
| PCMark 10 / Essentials | |
| Beelink GTI 11 | |
| Média Intel Core i5-1135G7, Intel Iris Xe Graphics G7 80EUs (8149 - 9917, n=53) | |
| Intel Hades Canyon NUC8i7HVK | |
| Intel NUC10i7FNH | |
| Intel NUC11TNKi5 | |
| GMK NucBox 2 | |
| Beelink SER3 | |
| PCMark 10 / Productivity | |
| Intel Hades Canyon NUC8i7HVK | |
| Intel NUC10i7FNH | |
| Beelink GTI 11 | |
| GMK NucBox 2 | |
| Média Intel Core i5-1135G7, Intel Iris Xe Graphics G7 80EUs (5040 - 6619, n=53) | |
| Intel NUC11TNKi5 | |
| Beelink SER3 | |
| PCMark 10 / Digital Content Creation | |
| Intel Hades Canyon NUC8i7HVK | |
| Beelink GTI 11 | |
| Média Intel Core i5-1135G7, Intel Iris Xe Graphics G7 80EUs (3548 - 5255, n=53) | |
| Intel NUC11TNKi5 | |
| Intel NUC10i7FNH | |
| GMK NucBox 2 | |
| Beelink SER3 | |
| PCMark 10 Score | 4952 pontos | |
Ajuda | ||
| AIDA64 / Memory Copy | |
| GMK NucBox 2 | |
| Beelink GTI 11 | |
| Média Intel Core i5-1135G7 (17443 - 63889, n=45) | |
| Intel NUC11TNKi5 | |
| Beelink SER3 | |
| AIDA64 / Memory Read | |
| Beelink GTI 11 | |
| Média Intel Core i5-1135G7 (19716 - 63705, n=45) | |
| GMK NucBox 2 | |
| Intel NUC11TNKi5 | |
| Beelink SER3 | |
| AIDA64 / Memory Write | |
| GMK NucBox 2 | |
| Beelink GTI 11 | |
| Média Intel Core i5-1135G7 (18722 - 66778, n=45) | |
| Intel NUC11TNKi5 | |
| Beelink SER3 | |
| AIDA64 / Memory Latency | |
| Beelink SER3 | |
| Intel NUC11TNKi5 | |
| Média Intel Core i5-1135G7 (68.3 - 107, n=51) | |
| Beelink GTI 11 | |
| GMK NucBox 2 | |
* ... menor é melhor
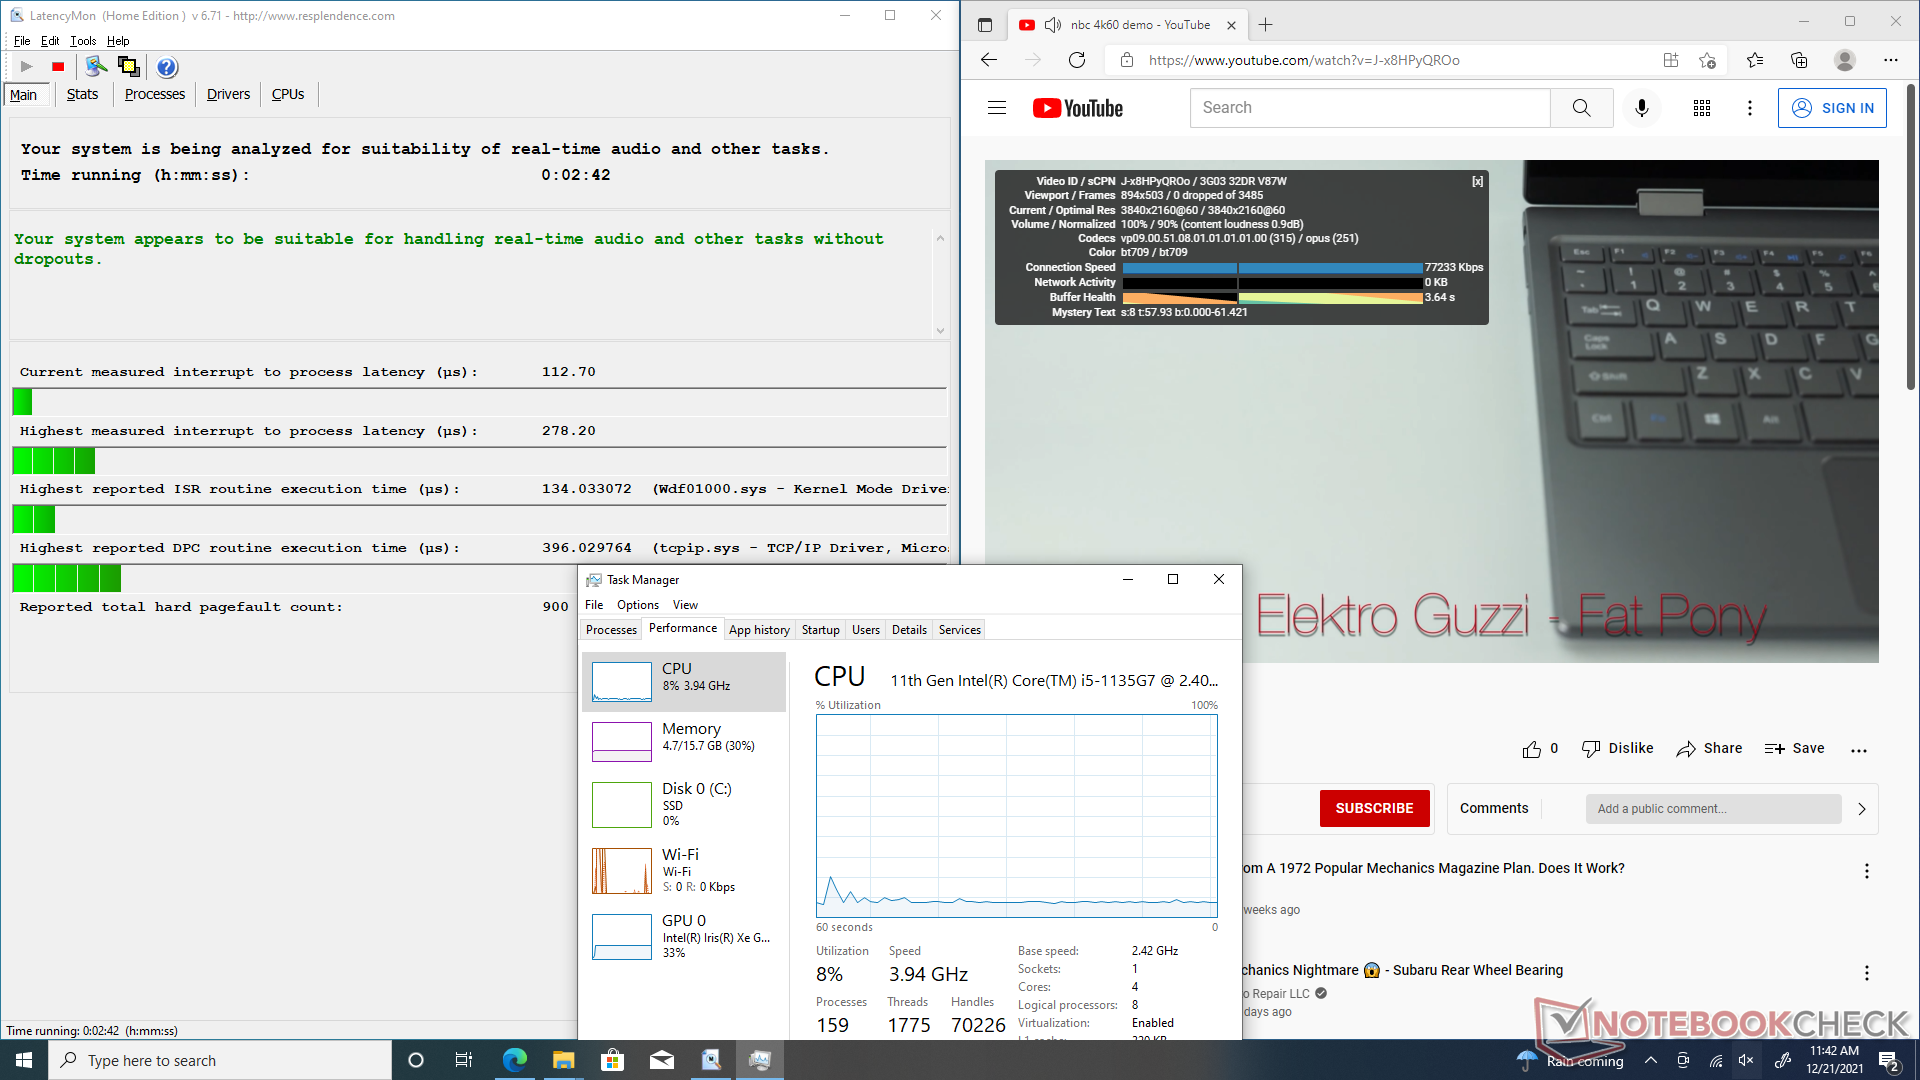
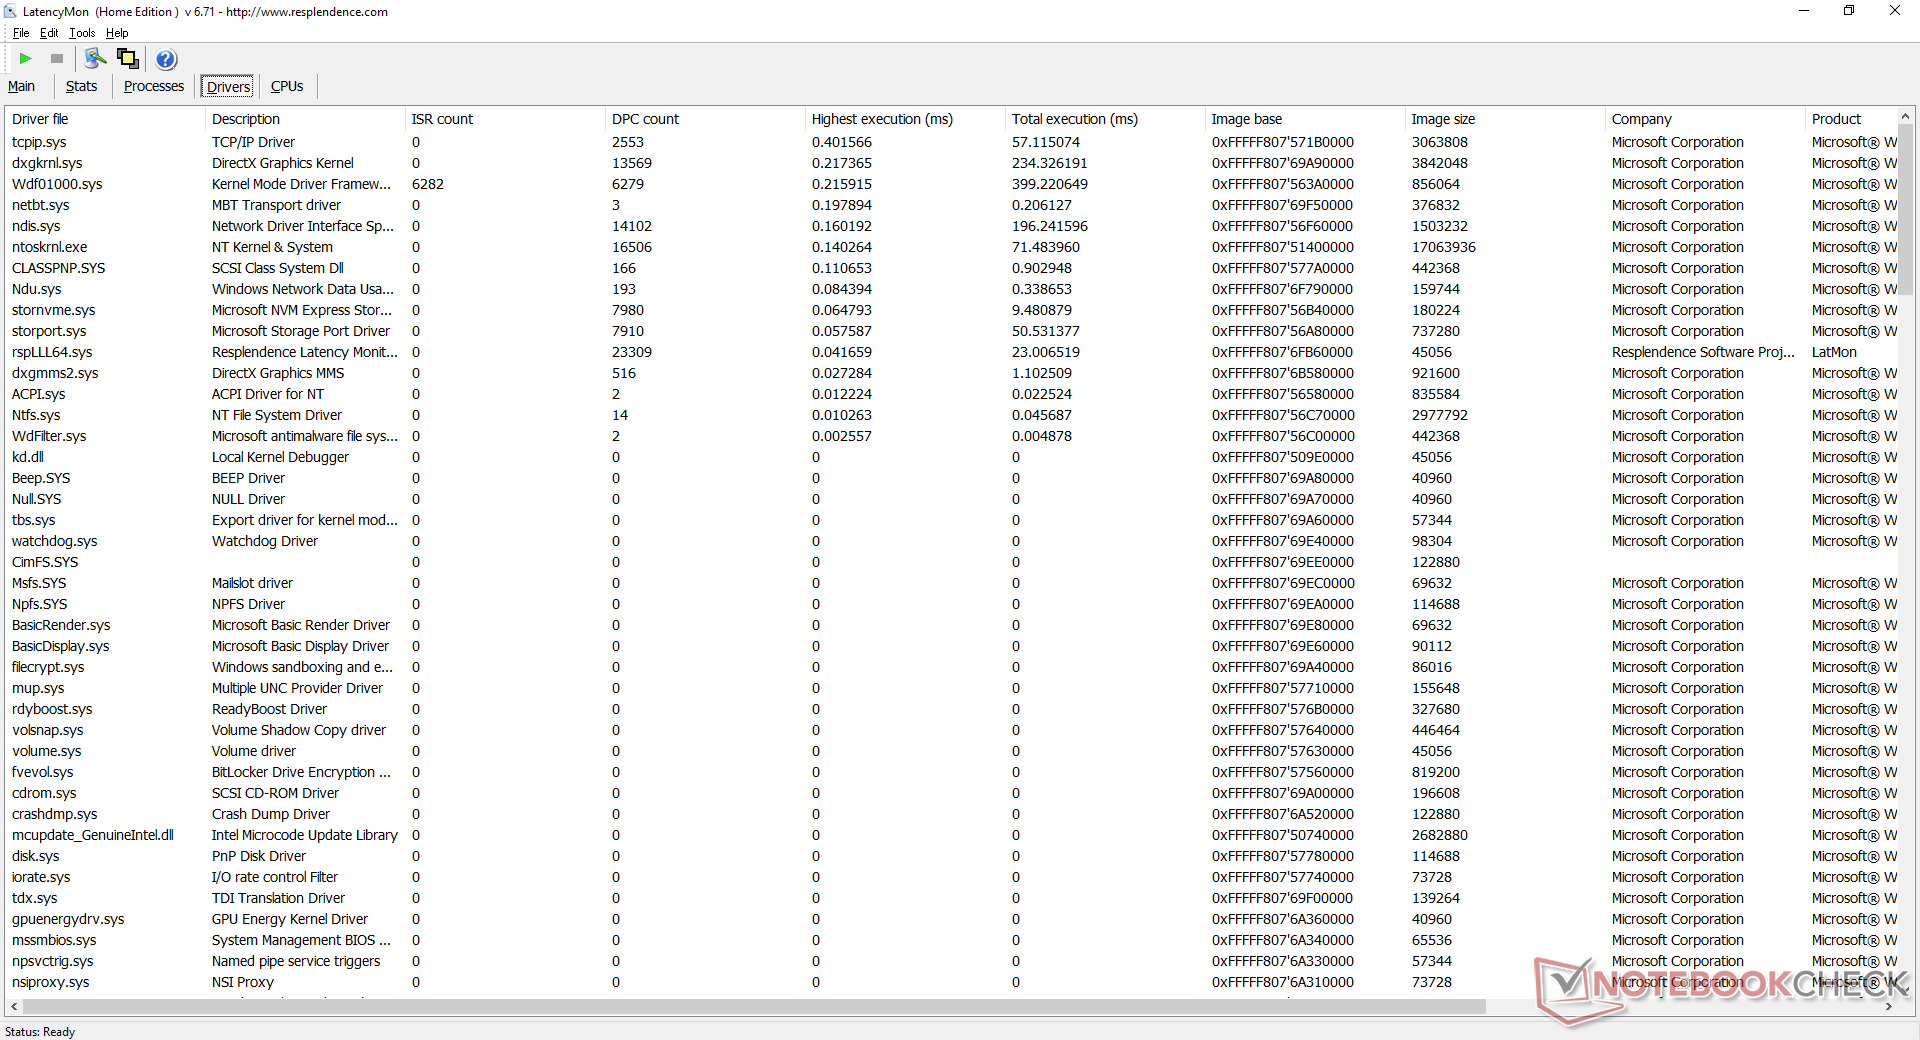
Latência do DPC
LatencyMon não revela nenhum problema de DPC ao abrir várias abas do navegador em nossa página inicial. A reprodução do vídeo 4K a 60 FPS também é suave e sem qualquer queda de quadros.
| DPC Latencies / LatencyMon - interrupt to process latency (max), Web, Youtube, Prime95 | |
| GMK NucBox 2 | |
| Beelink SER3 | |
| Intel NUC11TNKi5 | |
| Beelink GTI 11 | |
* ... menor é melhor
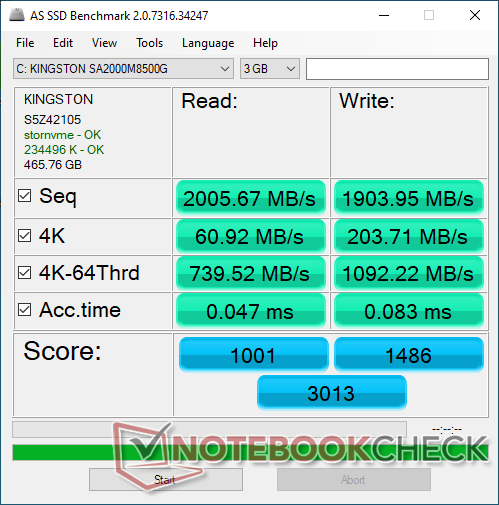
Dispositivos de armazenamento
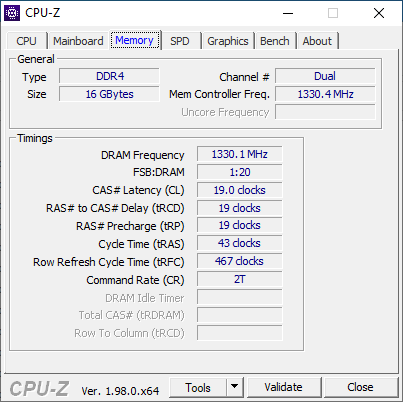
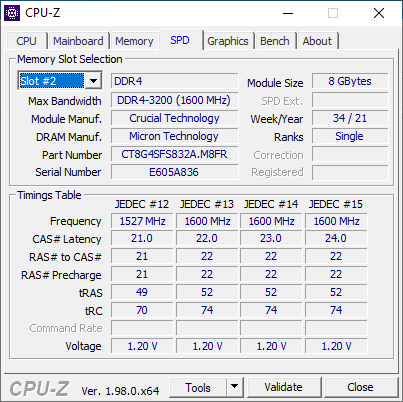
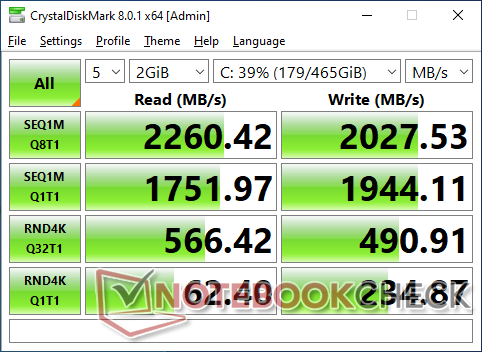
O sistema pode suportar até três drives internos (2x M.2 2280 + 1x SATA III de 2,5 polegadas). Tenha em mente que o segundo drive M.2 deve ser um drive SATA III e não um drive NVMe. O 500 GB Kingston A2000 em nossa unidade é um drive PCIe3 M.2 de médio alcance com taxas de leitura e gravação sequenciais de cerca de 2000 a 2200 MB/s cada. A sustentabilidade do desempenho também é excelente, sem problemas térmicos ao executar o DiskSpd em loop.
A unidade é fornecida com um drive PCIe3 em vez de PCIe4, o que provavelmente economizará em custos. Os usuários podem instalar seus próprios drives PCIe4, se desejarem.

| Drive Performance rating - Percent | |
| Beelink GTI 11 | |
| Intel Hades Canyon NUC8i7HVK -8! | |
| Beelink SER3 | |
| GMK NucBox 2 | |
| Intel NUC10i7FNH | |
| Intel NUC11TNKi5 | |
| DiskSpd | |
| seq read | |
| GMK NucBox 2 | |
| Beelink GTI 11 | |
| Beelink SER3 | |
| Intel NUC10i7FNH | |
| Intel NUC11TNKi5 | |
| seq write | |
| Beelink GTI 11 | |
| Beelink SER3 | |
| GMK NucBox 2 | |
| Intel NUC10i7FNH | |
| Intel NUC11TNKi5 | |
| seq q8 t1 read | |
| GMK NucBox 2 | |
| Beelink SER3 | |
| Beelink GTI 11 | |
| Intel NUC10i7FNH | |
| Intel NUC11TNKi5 | |
| seq q8 t1 write | |
| Beelink GTI 11 | |
| Beelink SER3 | |
| GMK NucBox 2 | |
| Intel NUC10i7FNH | |
| Intel NUC11TNKi5 | |
| 4k q1 t1 read | |
| Beelink GTI 11 | |
| Beelink SER3 | |
| GMK NucBox 2 | |
| Intel NUC10i7FNH | |
| Intel NUC11TNKi5 | |
| 4k q1 t1 write | |
| Beelink GTI 11 | |
| GMK NucBox 2 | |
| Beelink SER3 | |
| Intel NUC10i7FNH | |
| Intel NUC11TNKi5 | |
| 4k q32 t16 read | |
| Beelink SER3 | |
| Beelink GTI 11 | |
| GMK NucBox 2 | |
| Intel NUC11TNKi5 | |
| Intel NUC10i7FNH | |
| 4k q32 t16 write | |
| Beelink GTI 11 | |
| GMK NucBox 2 | |
| Beelink SER3 | |
| Intel NUC11TNKi5 | |
| Intel NUC10i7FNH | |
| AS SSD | |
| Score Total | |
| Intel Hades Canyon NUC8i7HVK | |
| Beelink GTI 11 | |
| Beelink SER3 | |
| Intel NUC10i7FNH | |
| GMK NucBox 2 | |
| Intel NUC11TNKi5 | |
| Score Read | |
| Intel Hades Canyon NUC8i7HVK | |
| Beelink GTI 11 | |
| Beelink SER3 | |
| Intel NUC10i7FNH | |
| GMK NucBox 2 | |
| Intel NUC11TNKi5 | |
| Score Write | |
| Beelink GTI 11 | |
| Beelink SER3 | |
| Intel NUC10i7FNH | |
| Intel Hades Canyon NUC8i7HVK | |
| GMK NucBox 2 | |
| Intel NUC11TNKi5 | |
| Seq Read | |
| GMK NucBox 2 | |
| Beelink GTI 11 | |
| Beelink SER3 | |
| Intel Hades Canyon NUC8i7HVK | |
| Intel NUC10i7FNH | |
| Intel NUC11TNKi5 | |
| Seq Write | |
| Beelink GTI 11 | |
| Beelink SER3 | |
| GMK NucBox 2 | |
| Intel NUC10i7FNH | |
| Intel Hades Canyon NUC8i7HVK | |
| Intel NUC11TNKi5 | |
| 4K Read | |
| Intel Hades Canyon NUC8i7HVK | |
| Beelink GTI 11 | |
| GMK NucBox 2 | |
| Beelink SER3 | |
| Intel NUC10i7FNH | |
| Intel NUC11TNKi5 | |
| 4K Write | |
| Beelink GTI 11 | |
| GMK NucBox 2 | |
| Beelink SER3 | |
| Intel Hades Canyon NUC8i7HVK | |
| Intel NUC10i7FNH | |
| Intel NUC11TNKi5 | |
| 4K-64 Read | |
| Intel Hades Canyon NUC8i7HVK | |
| Beelink SER3 | |
| Beelink GTI 11 | |
| Intel NUC10i7FNH | |
| GMK NucBox 2 | |
| Intel NUC11TNKi5 | |
| 4K-64 Write | |
| Beelink GTI 11 | |
| Intel NUC10i7FNH | |
| Beelink SER3 | |
| Intel Hades Canyon NUC8i7HVK | |
| GMK NucBox 2 | |
| Intel NUC11TNKi5 | |
| Access Time Read | |
| Intel NUC11TNKi5 | |
| Intel NUC10i7FNH | |
| Beelink SER3 | |
| GMK NucBox 2 | |
| Beelink GTI 11 | |
| Intel Hades Canyon NUC8i7HVK | |
| Access Time Write | |
| Beelink SER3 | |
| GMK NucBox 2 | |
| Intel NUC11TNKi5 | |
| Beelink GTI 11 | |
| Intel NUC10i7FNH | |
| Intel Hades Canyon NUC8i7HVK | |
* ... menor é melhor
Disk Throttling: DiskSpd Read Loop, Queue Depth 8
Desempenho da GPU
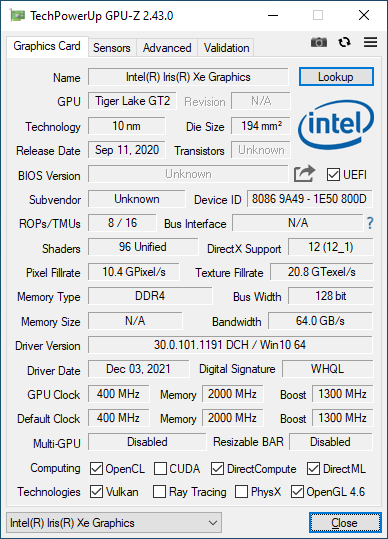
O desempenho gráfico é muito bom a cerca de 13% mais rápido do que o de um laptop ou PC equipado com o mesmo integrado Iris Xe 80 EUs. O GTI 11 vem com RAM de canal duplo, ao contrário do nosso Intel NUC11TNKi5 unidade de teste que vem com a mesma CPU Core i5-1135G7, mas com apenas um canal de RAM. O desempenho gráfico é cerca de 25% mais rápido em nosso Beelink devido principalmente a suas diferentes configurações de RAM
Atualização para um PC ou laptop com o Core i7-1165G7 de ponta mais alta e sua integração Iris Xe 96 EUs resultará em um aumento de desempenho de até 25 a 35 por cento, dependendo do modelo.

| 3DMark 11 - 1280x720 Performance GPU | |
| Intel Hades Canyon NUC8i7HVK | |
| Samsung Galaxy Book Pro 15 NP950XDB-KC5US | |
| Asus Vivobook 15 K513EQ | |
| Intel NUC11PAQi7 | |
| Lenovo Yoga 6 13ALC6 | |
| Beelink GTI 11 | |
| Intel NUC11TNKi5 | |
| Lenovo Yoga 6 13 82ND0009US | |
| Média Intel Iris Xe Graphics G7 80EUs (2246 - 6579, n=112) | |
| Infinix INBook X1 Pro | |
| Beelink GTR35 II-G-16512D00W64PRO-1T | |
| Beelink SER3 | |
| GMK NucBox 2 | |
| Asus VivoBook S13 S333JA-DS51 | |
| Intel NUC10i7FNH | |
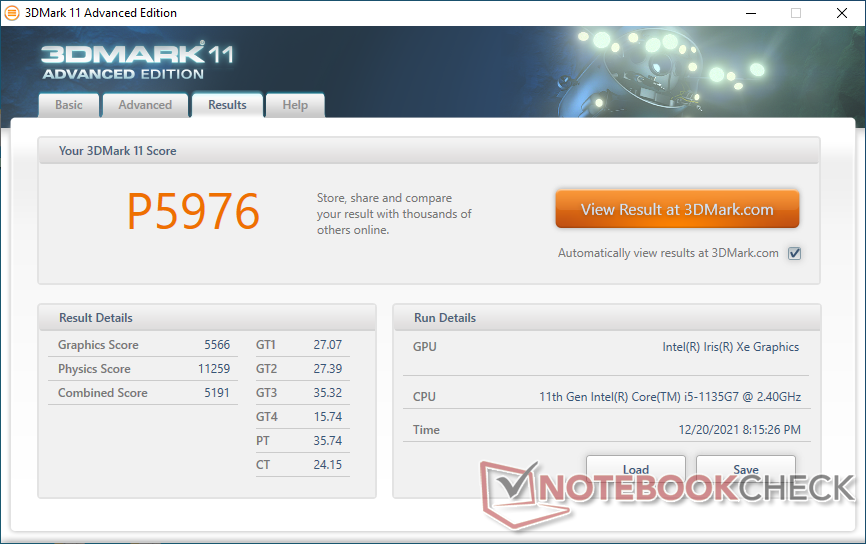
| 3DMark 11 Performance | 5976 pontos | |
| 3DMark Cloud Gate Standard Score | 18036 pontos | |
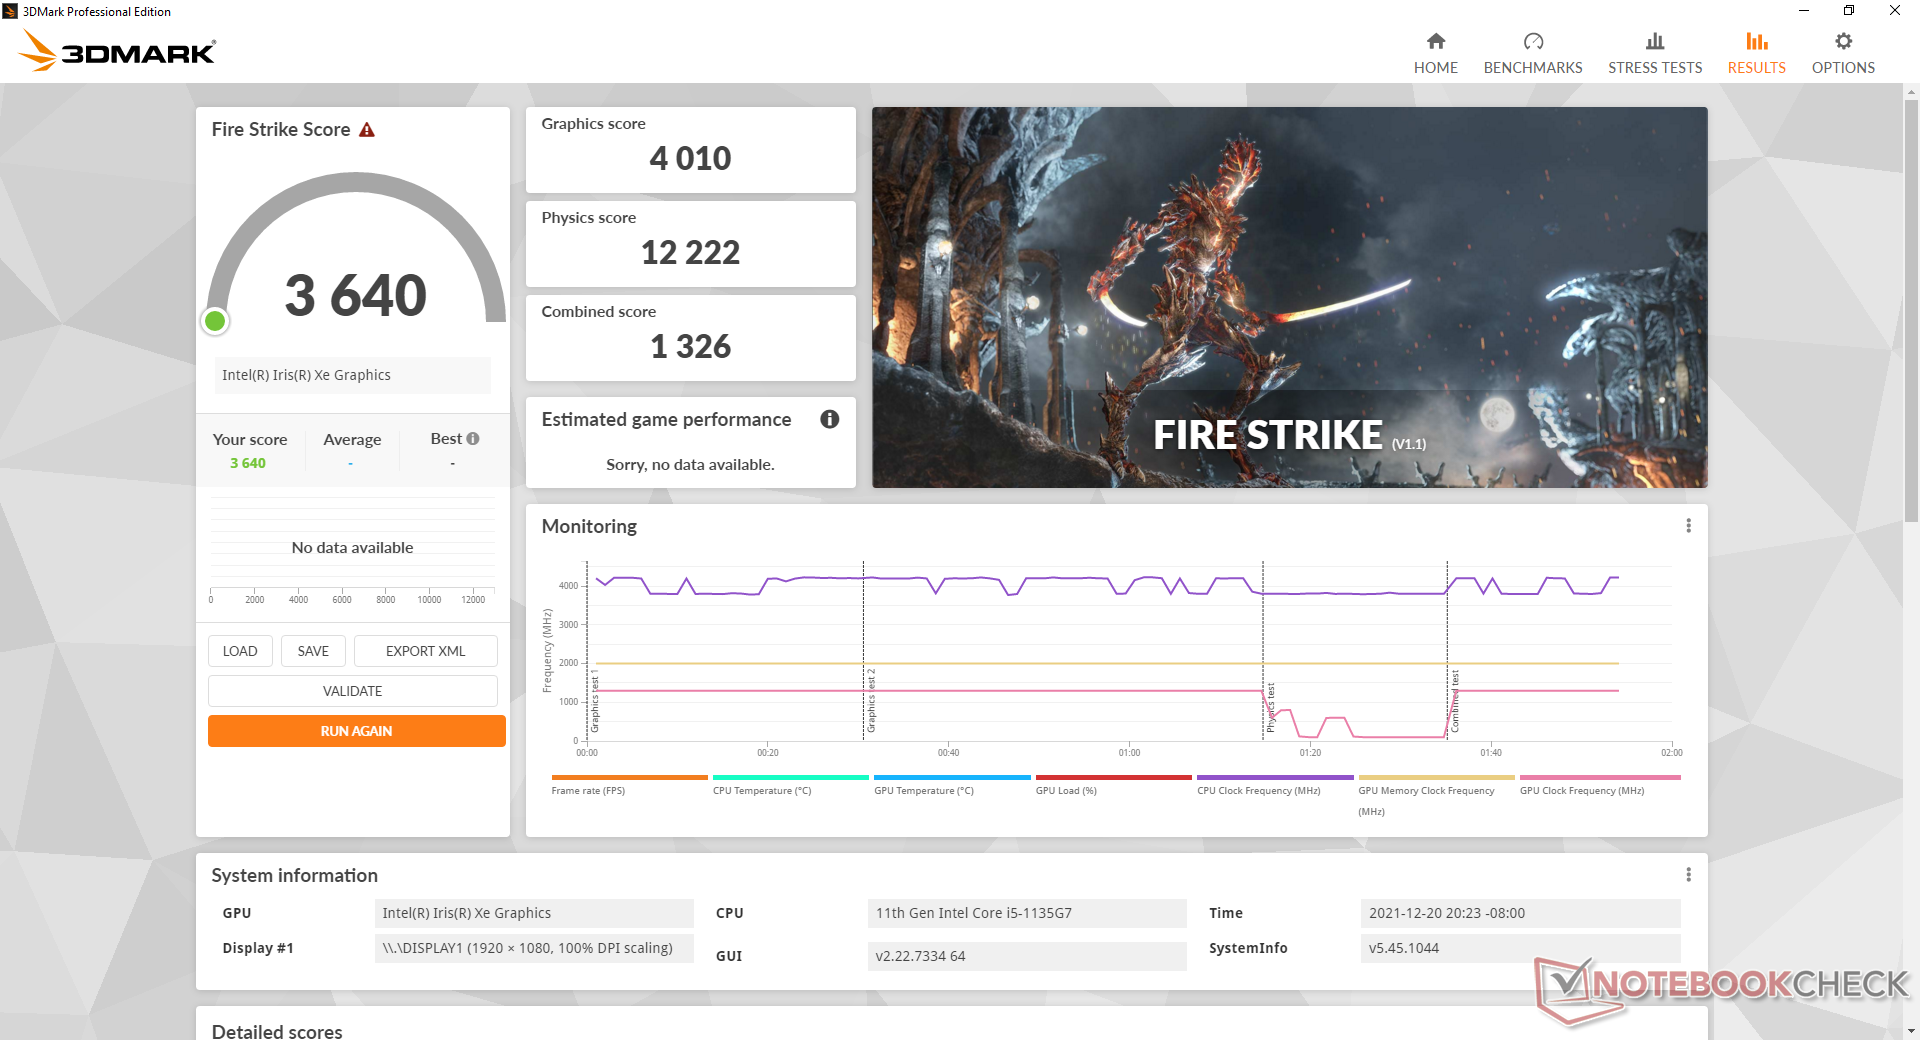
| 3DMark Fire Strike Score | 3640 pontos | |
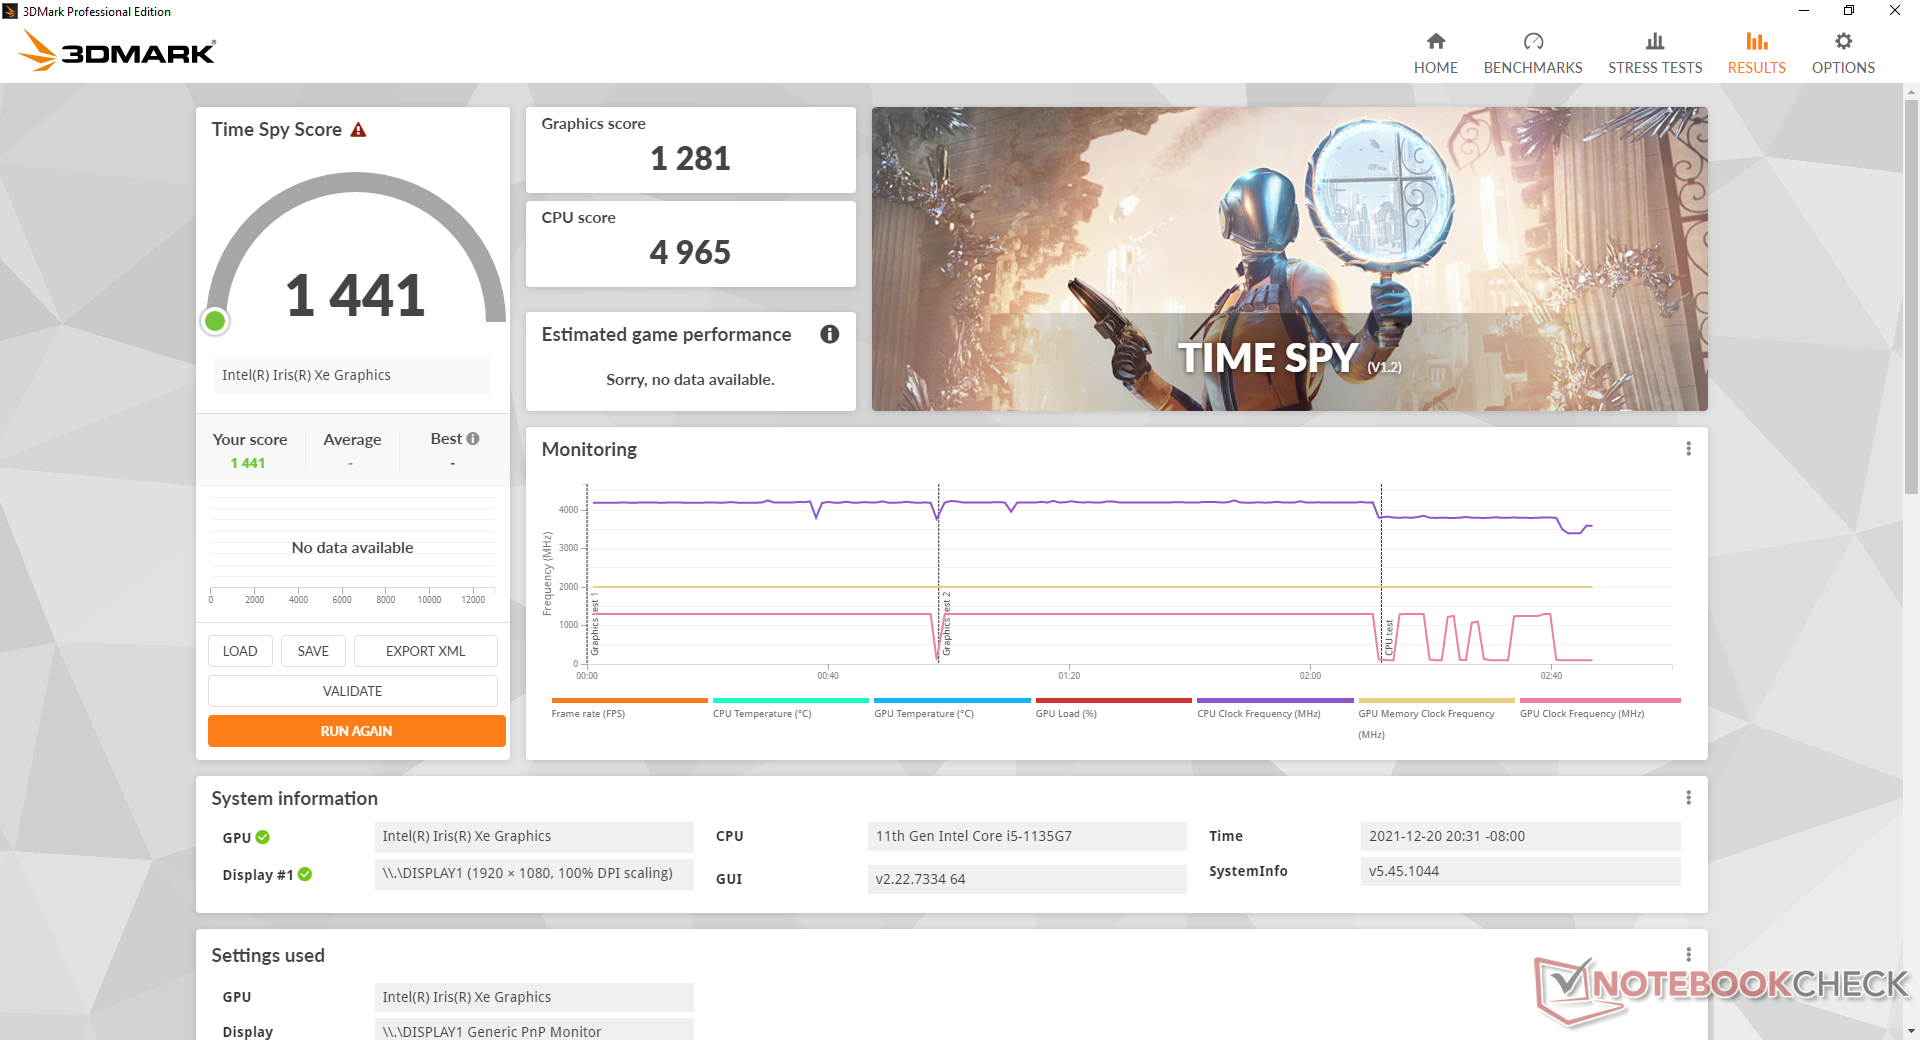
| 3DMark Time Spy Score | 1441 pontos | |
Ajuda | ||
| Far Cry 5 | |
| 1280x720 Low Preset AA:T | |
| Asus Vivobook 15 K513EQ | |
| Beelink GTI 11 | |
| Lenovo Yoga 6 13ALC6 | |
| Média Intel Iris Xe Graphics G7 80EUs (14 - 63, n=50) | |
| Beelink SER3 | |
| 1920x1080 Low Preset AA:T | |
| Asus Vivobook 15 K513EQ | |
| Média Intel Iris Xe Graphics G7 80EUs (15 - 35, n=13) | |
| Beelink GTI 11 | |
| Lenovo Yoga 6 13ALC6 | |
| Beelink SER3 | |
| 1920x1080 Medium Preset AA:T | |
| Asus Vivobook 15 K513EQ | |
| Beelink GTI 11 | |
| Média Intel Iris Xe Graphics G7 80EUs (9 - 31, n=47) | |
| Lenovo Yoga 6 13ALC6 | |
| Beelink SER3 | |
| 1920x1080 High Preset AA:T | |
| Intel Hades Canyon NUC8i7HVK | |
| Asus Vivobook 15 K513EQ | |
| Beelink GTI 11 | |
| Média Intel Iris Xe Graphics G7 80EUs (8 - 29, n=39) | |
| Lenovo Yoga 6 13ALC6 | |
| Beelink SER3 | |
| 1920x1080 Ultra Preset AA:T | |
| Intel Hades Canyon NUC8i7HVK | |
| Asus Vivobook 15 K513EQ | |
| Beelink GTI 11 | |
| Média Intel Iris Xe Graphics G7 80EUs (8 - 27, n=29) | |
| Lenovo Yoga 6 13ALC6 | |
| Beelink SER3 | |
| Strange Brigade | |
| 1280x720 lowest AF:1 | |
| Intel Hades Canyon NUC8i7HVK | |
| Asus Vivobook 15 K513EQ | |
| Beelink GTI 11 | |
| Lenovo Yoga 6 13ALC6 | |
| Lenovo Yoga 6 13 82ND0009US | |
| Média Intel Iris Xe Graphics G7 80EUs (22.7 - 98.7, n=84) | |
| Intel NUC11PAQi7 | |
| Beelink SER3 | |
| 1920x1080 medium AA:medium AF:4 | |
| Intel Hades Canyon NUC8i7HVK | |
| Asus Vivobook 15 K513EQ | |
| Beelink GTI 11 | |
| Lenovo Yoga 6 13ALC6 | |
| Média Intel Iris Xe Graphics G7 80EUs (6 - 48.8, n=86) | |
| Lenovo Yoga 6 13 82ND0009US | |
| Intel NUC11PAQi7 | |
| Beelink SER3 | |
| 1920x1080 high AA:high AF:8 | |
| Intel Hades Canyon NUC8i7HVK | |
| Beelink GTI 11 | |
| Asus Vivobook 15 K513EQ | |
| Lenovo Yoga 6 13ALC6 | |
| Média Intel Iris Xe Graphics G7 80EUs (11.4 - 34, n=83) | |
| Lenovo Yoga 6 13 82ND0009US | |
| Intel NUC11PAQi7 | |
| Beelink SER3 | |
| 1920x1080 ultra AA:ultra AF:16 | |
| Intel Hades Canyon NUC8i7HVK | |
| Lenovo Yoga 6 13 82ND0009US | |
| Lenovo Yoga 6 13ALC6 | |
| Beelink GTI 11 | |
| Média Intel Iris Xe Graphics G7 80EUs (13.6 - 27, n=60) | |
| Asus Vivobook 15 K513EQ | |
| Intel NUC11PAQi7 | |
| Beelink SER3 | |
Witcher 3 FPS Chart
| baixo | média | alto | ultra | |
|---|---|---|---|---|
| GTA V (2015) | 95.1 | 79.5 | 21.1 | 8.17 |
| The Witcher 3 (2015) | 77.1 | 46.6 | 23.1 | 11.5 |
| Dota 2 Reborn (2015) | 123 | 81 | 49.7 | 47.2 |
| Final Fantasy XV Benchmark (2018) | 36.7 | 18.7 | 13.5 | |
| X-Plane 11.11 (2018) | 24 | 21.4 | 21.9 | |
| Far Cry 5 (2018) | 47 | 23 | 22 | 21 |
| Strange Brigade (2018) | 76.5 | 30.8 | 25.2 | 20.2 |
Emissões
Ruído do sistema
O ruído dos ventiladores é talvez o pior aspecto do GTI 11. Os dois ventiladores internos pulsam com freqüência e notavelmente entre 28,4 dB(A) e 37,7 dB(A) mesmo quando simplesmente estão ociosos na área de trabalho ou navegando na web. O comportamento dos ventiladores também não mudaria ao ajustar o sistema para o modo Power Saver.
Executar cargas mais altas como jogos induzirá um ruído do ventilador variando de 44 dB(A) a 56 dB(A), o que é muito mais alto do que o que gravamos na maioria dos outros mini PCs, incluindo a série Intel NUC. Nossa unidade também sofreria de um leve ruído eletrônico ou lamúria de bobina e, portanto, nunca é verdadeiramente silenciosa.
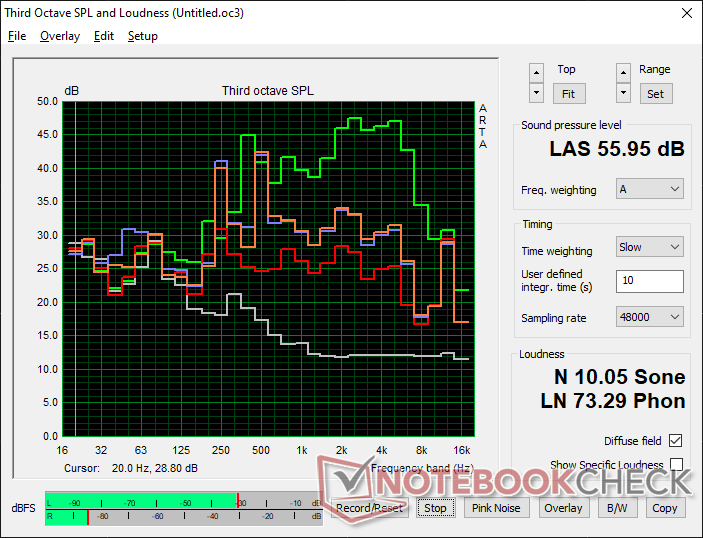
Barulho
| Ocioso |
| 28.4 / 32 / 37.7 dB |
| Carga |
| 44.2 / 56 dB |
 | ||
30 dB silencioso 40 dB(A) audível 50 dB(A) ruidosamente alto |
||
min: | ||
| Beelink GTI 11 Iris Xe G7 80EUs, i5-1135G7, Kingston SA2000M8500G | Beelink SER3 Vega 10, R7 3750H, GSemi AZW GSDFN512TS3F1OGCX | Intel NUC11TNKi5 Iris Xe G7 80EUs, i5-1135G7, Transcend M.2 SSD 430S TS512GMTS430S | GMK NucBox 2 Iris Plus Graphics 655, i5-8259U, Netac S930E8/256GPN | Intel Hades Canyon NUC8i7HVK Vega M GH, i7-8809G, Intel Optane 120 GB SSDPEK1W120GA | |
|---|---|---|---|---|---|
| Noise | 19% | 3% | 20% | 8% | |
| desligado / ambiente * (dB) | 25.7 | 23.4 9% | 24.8 4% | 25.6 -0% | 28.7 -12% |
| Idle Minimum * (dB) | 28.4 | 23.4 18% | 35.6 -25% | 25.7 10% | 29 -2% |
| Idle Average * (dB) | 32 | 23.4 27% | 35.6 -11% | 25.7 20% | 29 9% |
| Idle Maximum * (dB) | 37.7 | 29.4 22% | 35.6 6% | 25.7 32% | 29 23% |
| Load Average * (dB) | 44.2 | 35.2 20% | 36.2 18% | 35.3 20% | 36 19% |
| Witcher 3 ultra * (dB) | 44.5 | 37.2 16% | 38 15% | 42 6% | |
| Load Maximum * (dB) | 56 | 43.3 23% | 47.6 15% | 35.1 37% | 49.4 12% |
* ... menor é melhor
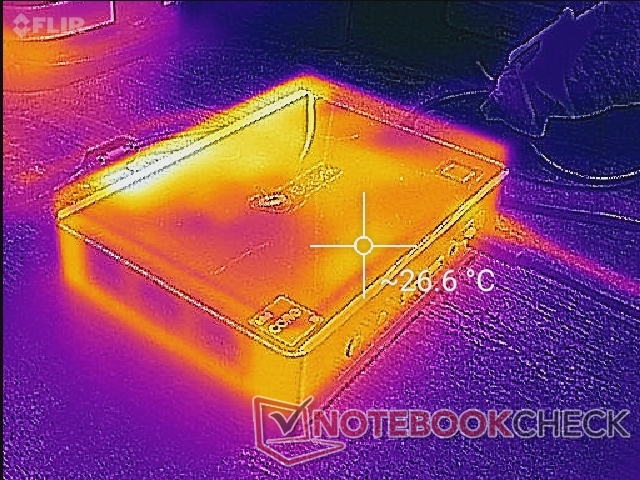
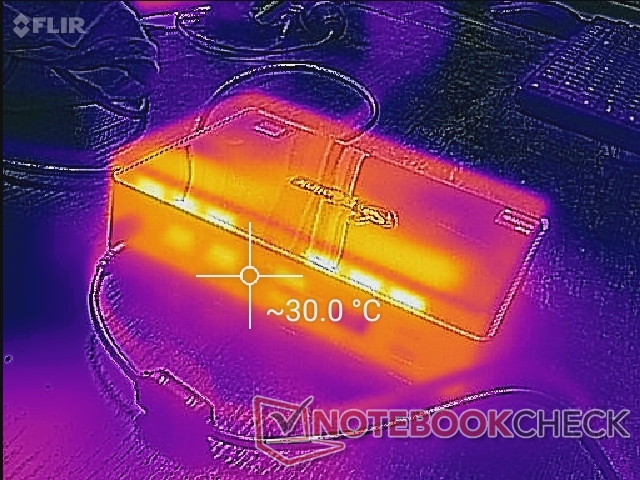
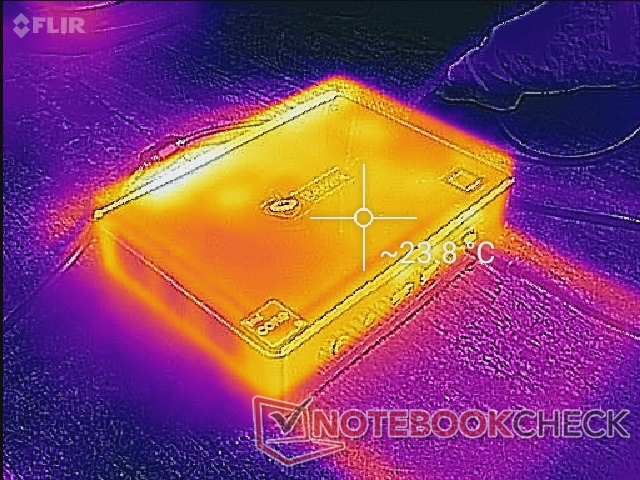
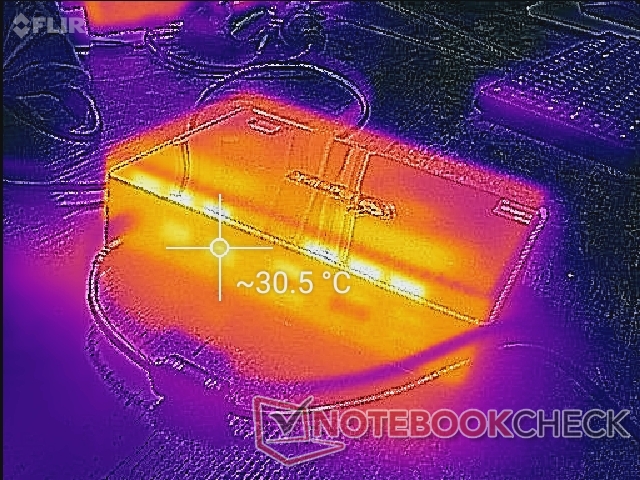
Temperatura
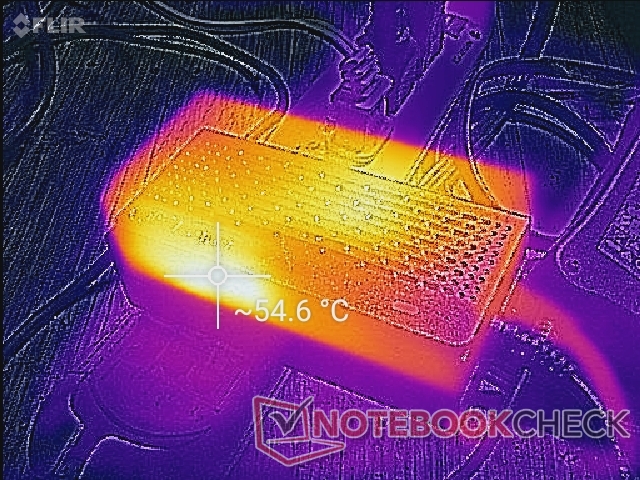
As temperaturas superficiais não são um problema no GTI 11. Na verdade, quaisquer diferenças entre cargas ociosas e de jogos são bem menores, como mostram nossos mapas de temperatura abaixo. O ar frio entra pelos dois lados do chassi que estão mais afastados e existe ar quente pela parte de trás. Os itens podem ser colocados em cima da unidade sem obstruir o fluxo de ar, mas uma orientação vertical pode impactar o ruído ou a temperatura do ventilador.
Teste de estresse
Ao executar Prime95 para enfatizar a CPU, as taxas de relógio aumentariam para 3,8 GHz durante os primeiros 20 segundos ou mais até atingir uma temperatura central de 89 C. As taxas de relógio cairiam então para 2,8 GHz a fim de manter uma temperatura central mais fria de 70 C. A potência do pacote de CPU também cairia de 48 W no máximo para 28 W mais estável.
A temperatura central e o relógio GPU se estabilizariam em 64 C e 1300 MHz, respectivamente, quando em funcionamento Witcher 3 para representar cargas elevadas. Os resultados são muito semelhantes aos que registramos na NUC11TNKi5 concorrente, quando ambos os sistemas estão sujeitos a condições semelhantes.
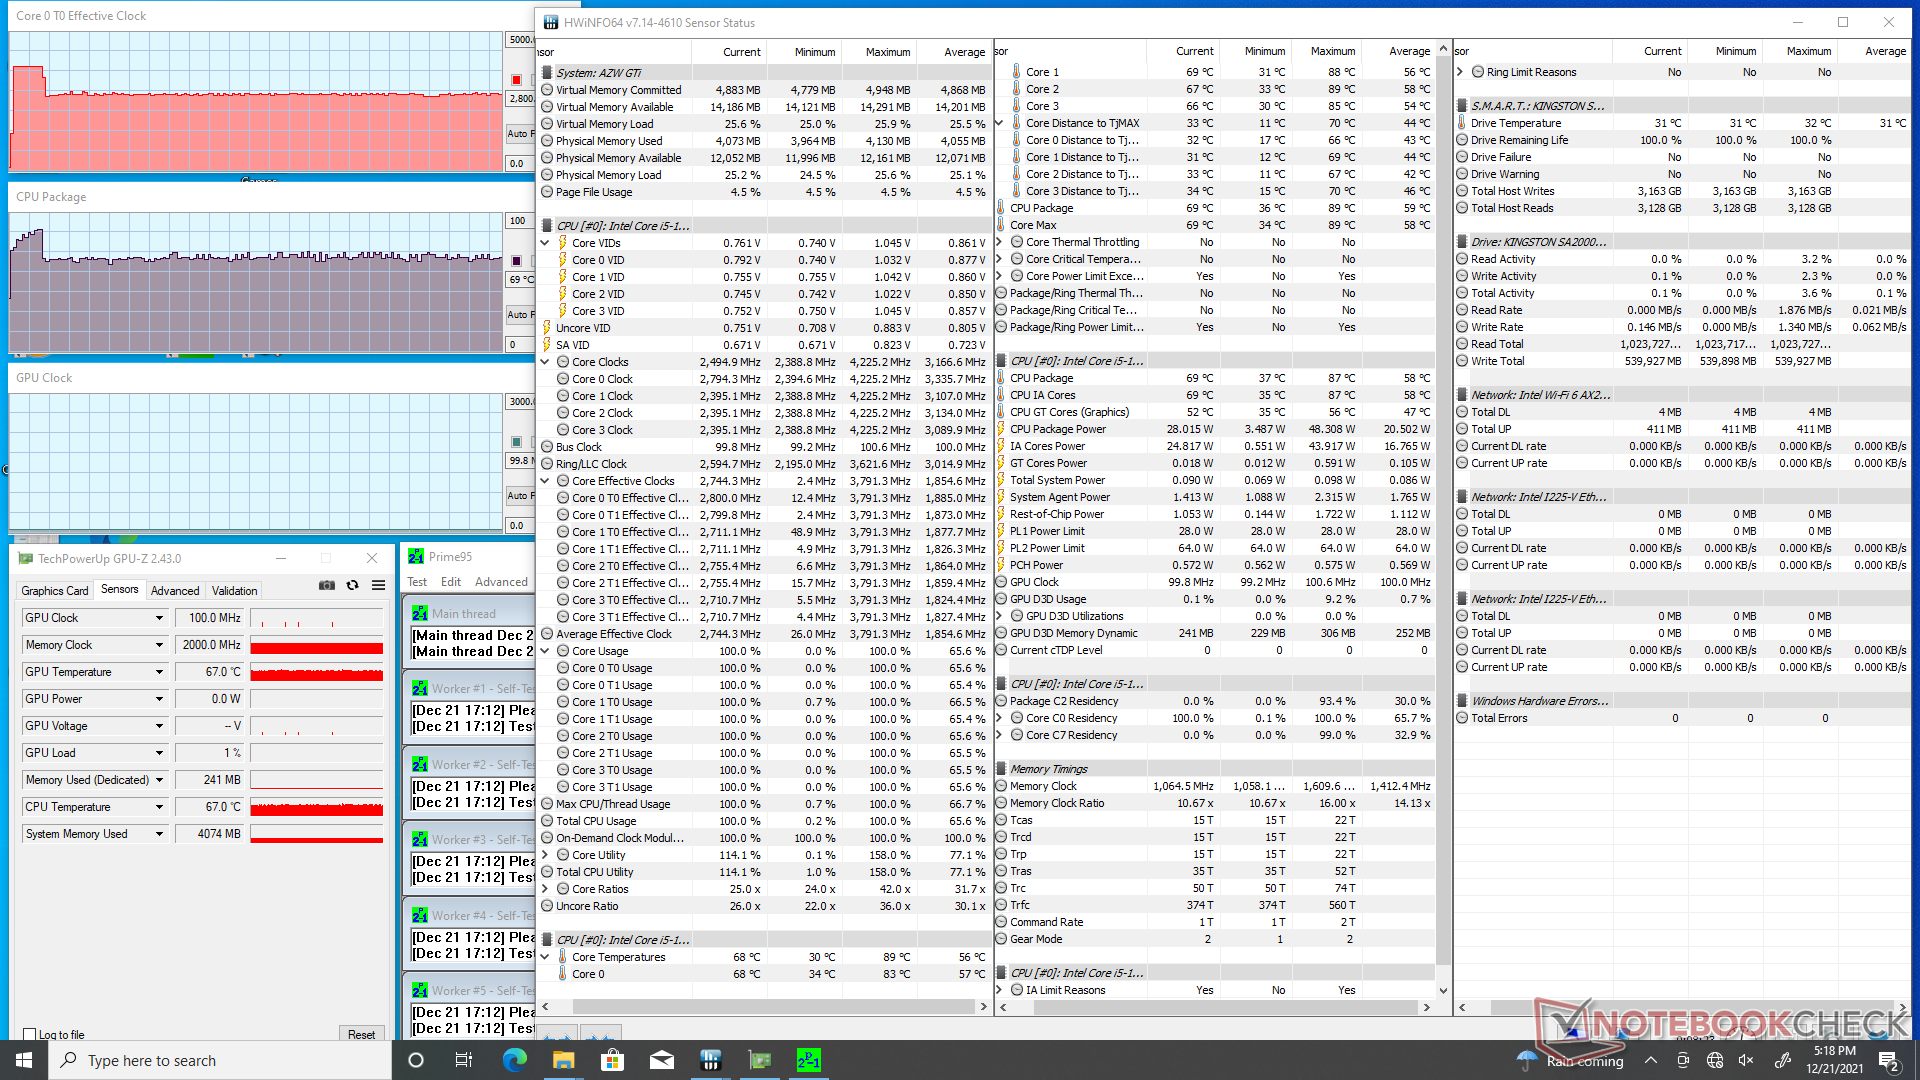
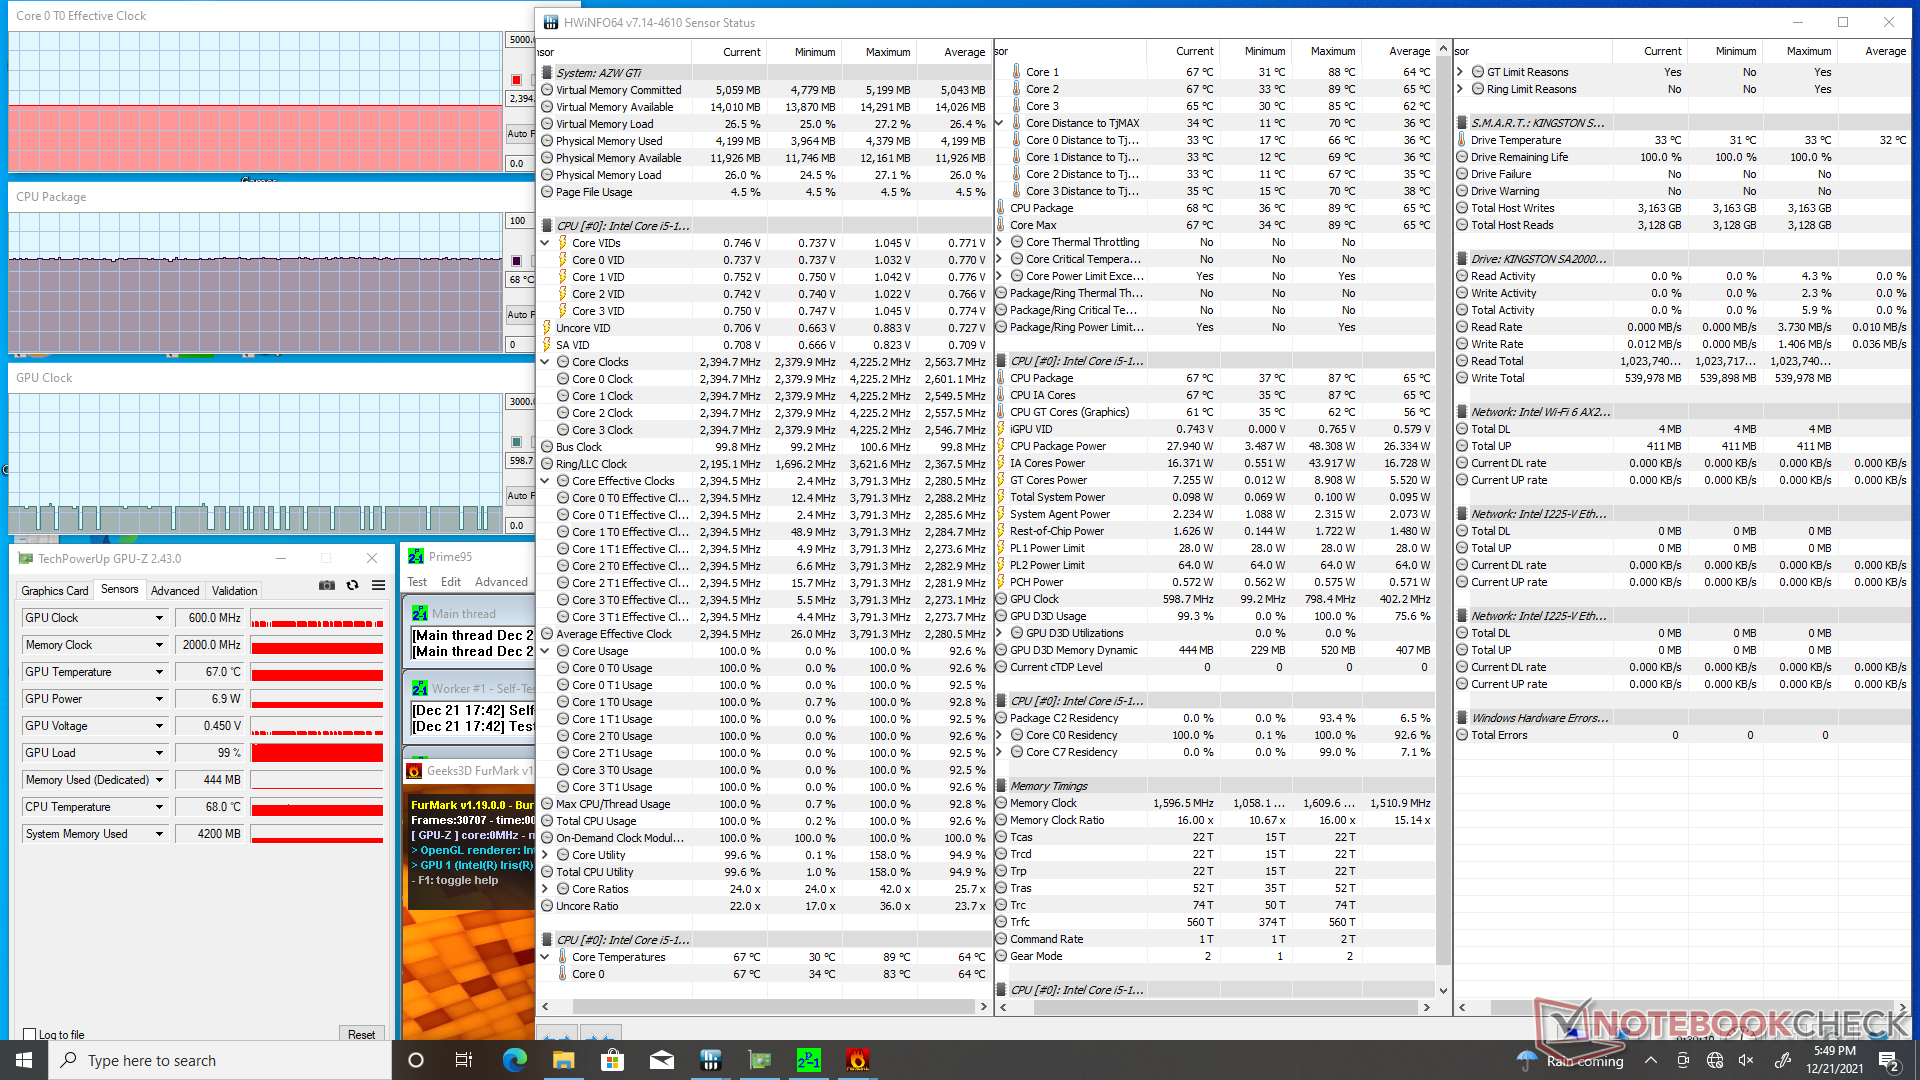
| RelógioCPU (GHz) | RelógioGPU (MHz) | Temperaturamédiada CPU (°C) | |
| System Idle | -- | --39 | |
| Prime95 Stress | 2.8 | ---70 | |
| Prime95 + FurMark Stress | 2.4 | 100 - 600 | 68 |
| Witcher 3 Stress | 1.6 | 1300 | 64 |
Gestão de energia
Consumo de energia
O consumo geral de energia é maior do que o esperado. A Intel NUC11TNKi5 com exatamente a mesma CPU, por exemplo, exigiria vários watts a menos em todas as condições testadas quando comparada à nossa unidade Beelink. O desempenho mais rápido da CPU e GPU do Beelink quando comparado ao PC médio com a mesma CPU Core i5-1135G7 é provavelmente responsável por seu maior consumo de energia
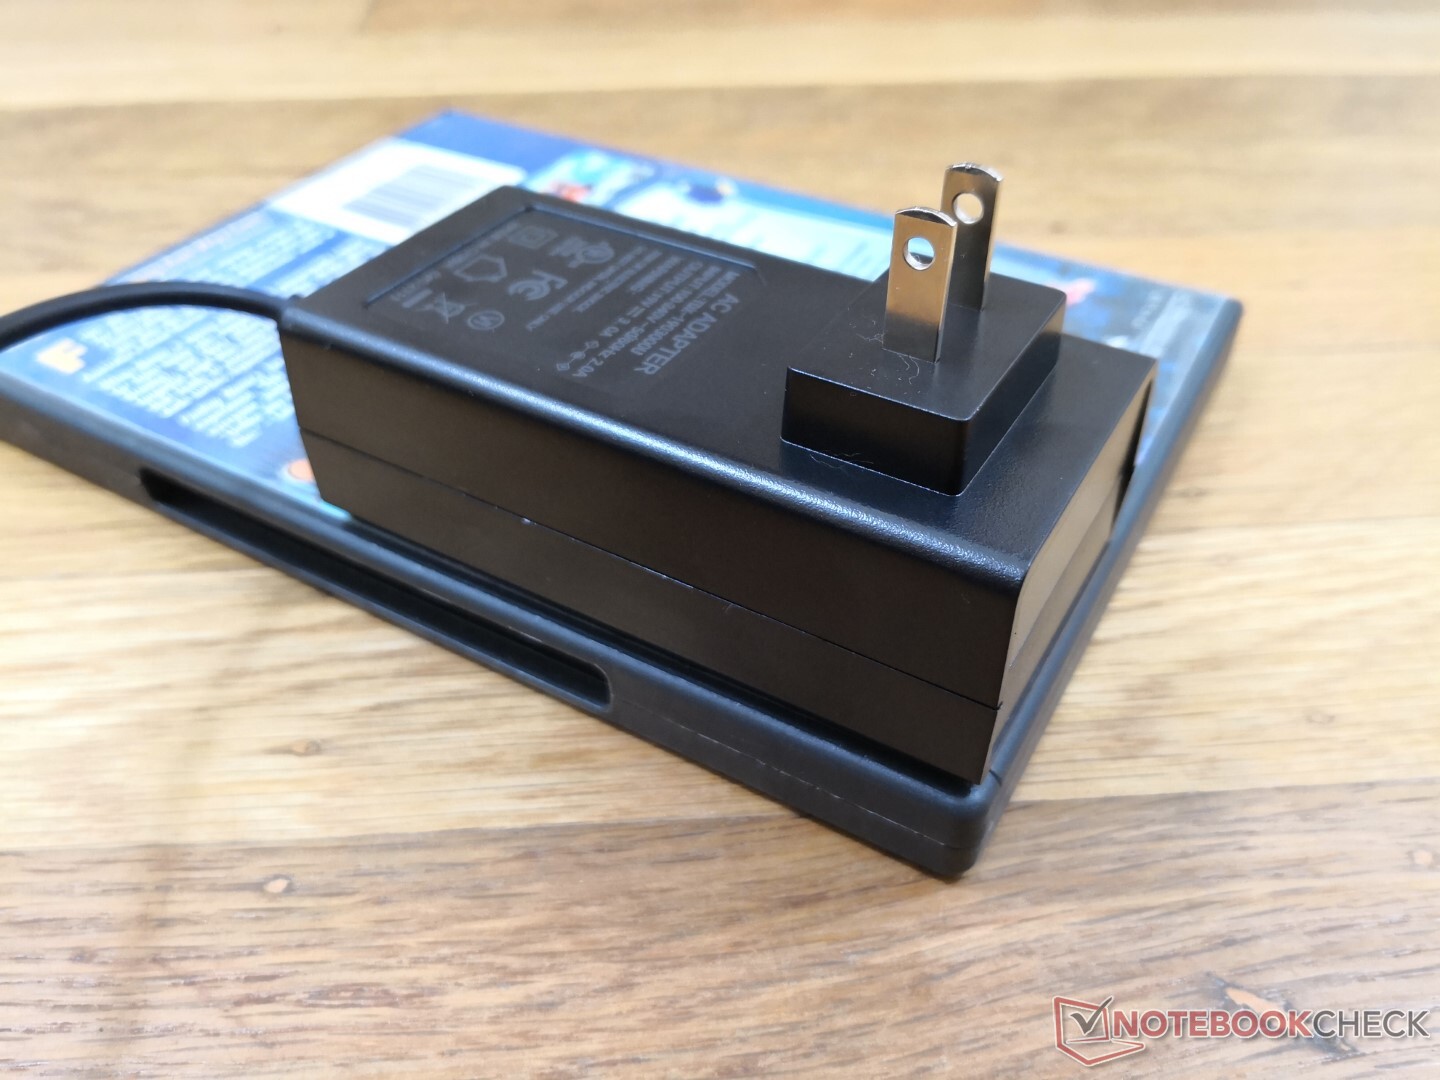
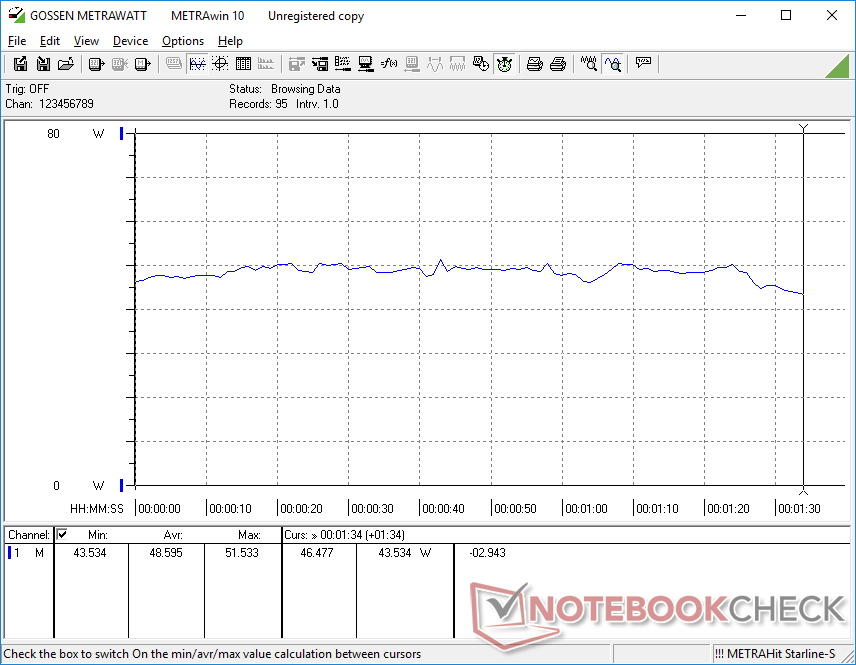
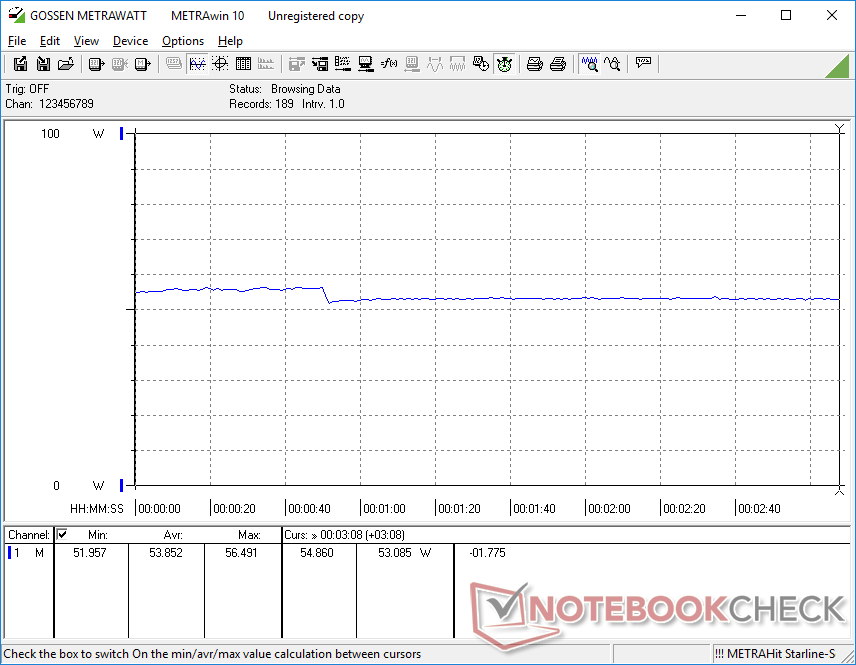
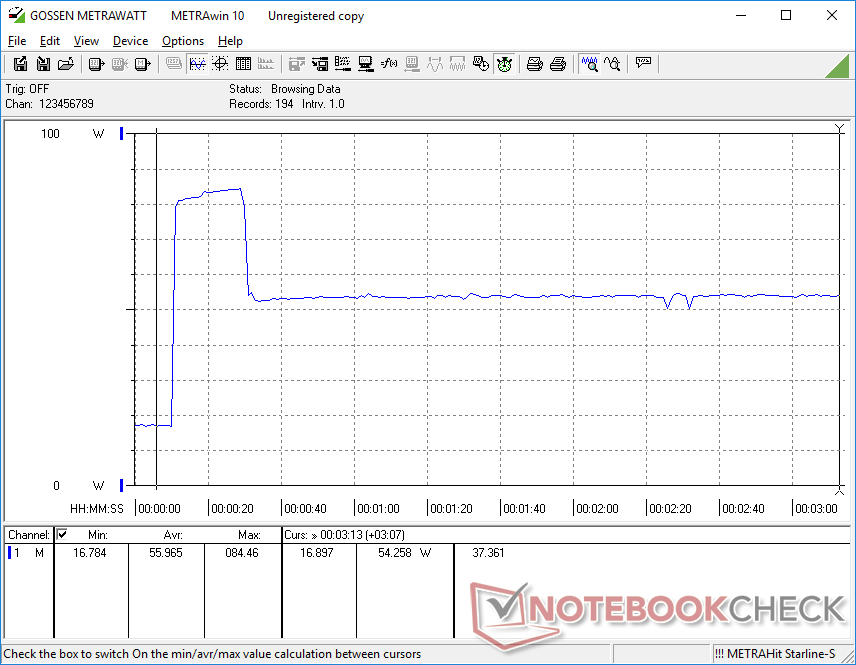
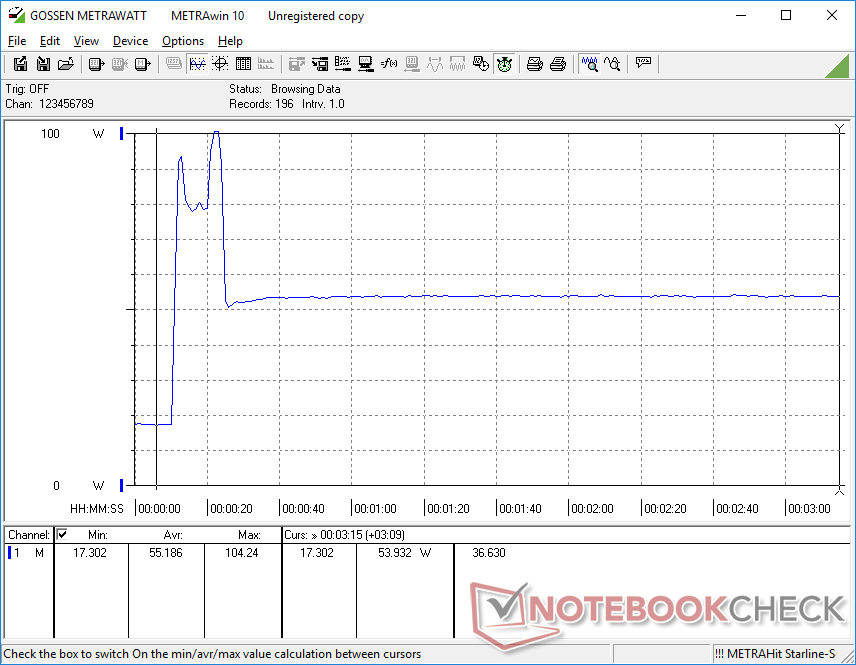
Somos capazes de medir um consumo máximo temporário de 104 W a partir do adaptador AC pequeno-médio (~9,8 x 5 x 3,4 cm) 57 W (19 V, 3A) quando executando Prime95. Este pico dura cerca de 20 segundos antes de eventualmente cair e se estabilizar em 56 W, como mostram nossos gráficos abaixo.
| desligado | |
| Ocioso | |
| Carga |
|
Key:
min: | |
| Beelink GTI 11 i5-1135G7, Iris Xe G7 80EUs, Kingston SA2000M8500G, , x, | Beelink SER3 R7 3750H, Vega 10, GSemi AZW GSDFN512TS3F1OGCX, , x, | Intel NUC11TNKi5 i5-1135G7, Iris Xe G7 80EUs, Transcend M.2 SSD 430S TS512GMTS430S, , x, | Intel NUC10i7FNH i7-10710U, UHD Graphics 620, Kingston RBUSNS8154P3256GJ1, , 0x0, 0" | GMK NucBox 2 i5-8259U, Iris Plus Graphics 655, Netac S930E8/256GPN, , x, | Intel Hades Canyon NUC8i7HVK i7-8809G, Vega M GH, Intel Optane 120 GB SSDPEK1W120GA, , x, | |
|---|---|---|---|---|---|---|
| Power Consumption | 45% | 22% | 33% | 45% | -45% | |
| Idle Minimum * (Watt) | 15.2 | 7 54% | 11.5 24% | 6.1 60% | 15.5 -2% | |
| Idle Average * (Watt) | 16 | 9.1 43% | 12.4 22% | 8.4 47% | 6.8 57% | 16.2 -1% |
| Idle Maximum * (Watt) | 16 | 9.7 39% | 12.9 19% | 7.3 54% | 16.5 -3% | |
| Load Average * (Watt) | 48.6 | 29.5 39% | 40.7 16% | 46.3 5% | 83.4 -72% | |
| Witcher 3 ultra * (Watt) | 53.8 | 32.5 40% | 43.9 18% | 121.7 -126% | ||
| Load Maximum * (Watt) | 104.3 | 48.7 53% | 73.5 30% | 86 18% | 50.7 51% | 173.5 -66% |
* ... menor é melhor
Power Consumption Witcher 3 / Stresstest
Power Consumption external Monitor
Pro
Contra
Veredicto - Como um NUC da Intel, mas a um preço mais razoável
O Beelink GTI 11 é muito convincente. Por $600 a $700 USD, os usuários estão recebendo o pacote completo com RAM, armazenamento e Windows 10 Pro, enquanto um Intel NUC 11 com a mesma CPU funcionaria por quase 600 dólares como um kit de barebones. Assim, você estaria gastando cerca de US$ 800 em um NUC da Intel apenas para corresponder às especificações do Beelink. O fato de poder suportar os acessórios Thunderbolt 4, Wi-Fi 6 e até três SSDs internos significa que os usuários não precisam desistir de muitas características importantes ao mudar para o Beelink.
A maior desvantagem a ter em mente é o pobre comportamento do ruído do ventilador do GTI 11. O RPM dos ventiladores muda com freqüência e notavelmente por aparentemente nenhuma razão. Espere que o sistema seja mais alto em geral quando comparado com a maioria dos modelos Intel NUC.
Preço e Disponibilidade
Price comparison

