Notebookcheck Logo

Asus Vivobook 15 K513EQ OLED revisão de laptop: A alternativa Lenovo IdeaPad
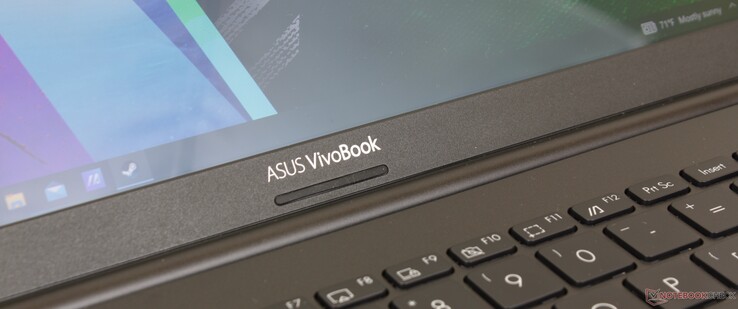
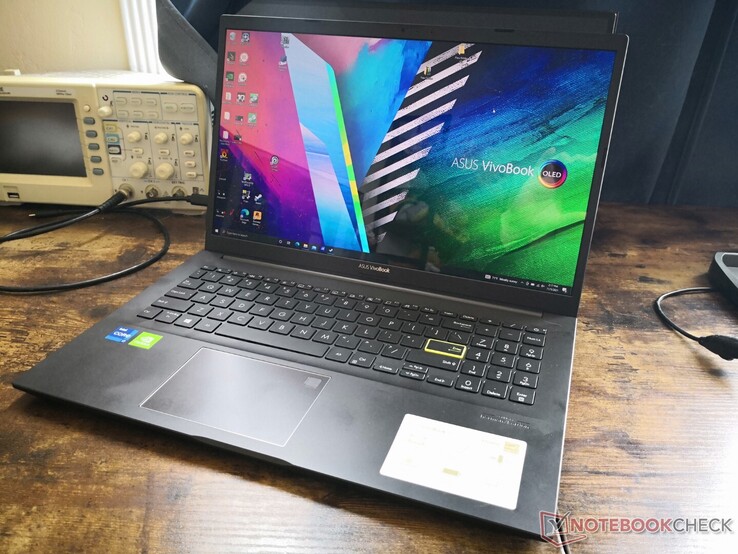
OLED 1080p é o novo ponto doce. O VivoBook 15 K513 oferece um estrondo incrível pelo dólar com sua tela OLED, CPU Intel da 11ª geração, e gráficos discretos da Nvidia, tudo por menos de US$ 950. Embora sólido no papel, alguns cantos cortados o impedem de alcançar os mesmos níveis de um ZenBook.

Dê um passo abaixo na série Asus ZenBook de alta qualidade e você se encontrará ajoelhado na série Asus VivoBook orientada para o orçamento. A família tem se expandido rapidamente em uma linha confusa de modelos que consiste de CPUs Intel e AMD com gráficos integrados ou discretos e até mesmo opções OLED. Definitivamente, tem sido difícil manter-se atualizado e o último VivoBook 15 K513 não facilita exatamente as coisas.

Além da convenção de nomes, nossa unidade de teste VivoBook 15 K513 é certamente diferente da maioria dos outros laptops multimídia de orçamento ou de médio alcance por aí com seu incomum Intel 11th gen Core i7-1165G7 e GeForce MX350 emparelhamento. Além disso, é um dos primeiros laptops de 15,6 polegadas a vir com uma tela OLED 1080p sem contato em comparação com todos os painéis OLED de 4K lá fora. Vamos dar uma olhada mais detalhada no desempenho, exibição e características físicas do VivoBook 15 K513 para descobrir o que exatamente o torna tão diferente de todos os outros modelos VivoBook 15 no mercado

Os concorrentes neste espaço incluem outros laptops multimídia de médio alcance como o Lenovo IdeaPad 5 15, Dell Inspiron 15, HP Pavilion 15ou o Cúpula MSI B15/E15série. Nossa unidade de teste específica pode ser encontrada on-line por cerca de $900 a $1000 USD.

Mais resenhas do Asus VivoBook:

Asus Vivobook 15 K513EQ (Vivobook 15 K513 Serie)
Processador
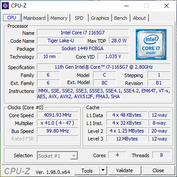
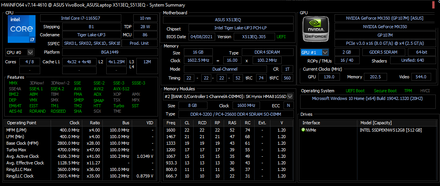
Intel Core i7-1165G7 4 x 2.8 - 4.7 GHz, 40 W PL2 / Short Burst, 30 W PL1 / Sustained, Tiger Lake-UP3
Placa gráfica
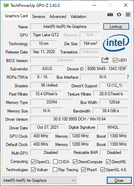
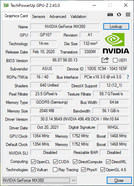
NVIDIA GeForce MX350 - 2048 MB VRAM, Análises do: 1468 MHz, Memoría: 1752 MHz, GDDR5, 496.49, Optimus
Memória
16 GB 
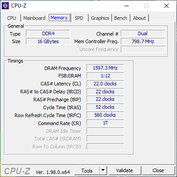
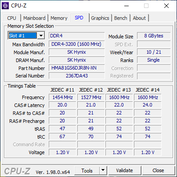
, 8 GB soldered + 8 GB SK Hynix DDR4-3200 removable, 1600 MHz, 22-22-22-52
Pantalha
15.60 polegadas 16:9, 1920 x 1080 pixel 141 PPI, Samsung ATNA56YX03-0, OLED, Brilhante: sim, HDR, 60 Hz
placa mãe
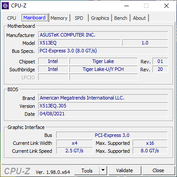
Intel Tiger Lake-UP3 PCH-LP
Disco rígido
Intel SSD 660p SSDPEKNW512G8, 512 GB 
Placa de Som
Intel Tiger Lake-U/Y PCH-LP - cAVS (Audio, Voice, Speech)
Conexões
2 USB 2.0, 4 USB 3.0, 1 HDMI, Conexões Audio: 3.5 mm combo, Card Reader: MicroSD
Funcionamento em rede
Intel Wi-Fi 6 AX201 (a/b/g/h/n = Wi-Fi 4/ac = Wi-Fi 5/ax = Wi-Fi 6/), Bluetooth 5.1
Tamanho
altura x largura x profundidade (em mm): 17.9 x 359 x 235
Bateria
42 Wh Lítio-Polímero, 3-cell
Sistema Operativo
Microsoft Windows 10 Home 64 Bit
Camera
Webcam: 720p
Primary Camera: 0.9 MPix
Características adicionais
Alto falantes: Stereo, Teclado: Chiclet, Iluminação do Teclado: sim, McAfee Anti-Virus, MyAsus, 12 Meses Garantia
peso
1.56 kg, Suprimento de energia: 166 g
Preço
900 USD
Note: The manufacturer may use components from different suppliers including display panels, drives or memory sticks with similar specifications.


Potential Competitors in Comparison

Rating
Date
Model
Weight
Height
Size
Resolution
Best Price
80.6 %
11/2021
Asus Vivobook 15 K513EQ
i7-1165G7, GeForce MX350
1.6 kg17.9 mm15.60"1920x1080
85.9 %
11/2021
Asus VivoBook 15 Pro M3500QC-L1062
R5 5600H, GeForce RTX 3050 4GB Laptop GPU
1.7 kg19.9 mm15.60"1920x1080
83.4 %
12/2020
Asus VivoBook S15 S533EQ-BQ002T
i7-1165G7, GeForce MX350
1.8 kg16.1 mm15.60"1920x1080
83.5 %
08/2021
Lenovo IdeaPad 5 15ALC05
R5 5500U, Vega 7
1.7 kg19.1 mm15.60"1920x1080
80.5 %
10/2021
Dell Inspiron 15 3501
i7-1165G7, Iris Xe G7 96EUs
2 kg19.9 mm15.60"1920x1080
81.2 %
06/2021
HP Pavilion 15-eg
i7-1165G7, GeForce MX450
1.7 kg17.9 mm15.60"1920x1080

Estojo - Espero que você goste de Plástico

Há diferenças moderadas tanto por dentro quanto por fora entre todos os vários modelos VivoBook 15 de 15,6 polegadas. Em nosso caso, o VivoBook 15 K513 é mais parecido com o VivoBook 15 F512 em termos de posicionamento do porto e layout da placa-mãe. A base plástica em particular não é tão firme ou luxuosa quanto uma típica ZenBook 15HP Spectre, HP Spectre, ou Dell XPS 15 o que é de se esperar. Em vez disso, a rigidez do chassi está mais de acordo com a Lenovo IdeaPad 5 15 ou Dell Inspiron 3501, sendo um pouco mais fraca do que a última HP Pavilion 15. Seu centro de teclado, por exemplo, flexiona mais prontamente do que gostaríamos.

O sistema é mais leve que muitos de seus concorrentes em cerca de 100 g a 200 g, apesar da GPU discreta e do painel OLED. As dimensões gerais são mais parecidas com a última HP Pavilion 15, sendo mais fino e mais grosso que o VivoBook 15 Pro e VivoBook S15, respectivamente.

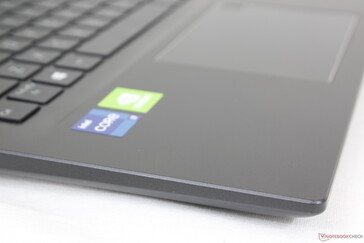
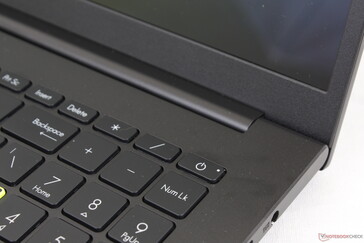
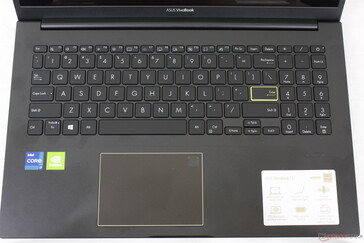
Os suportes para palma e o teclado são de plástico fosco liso
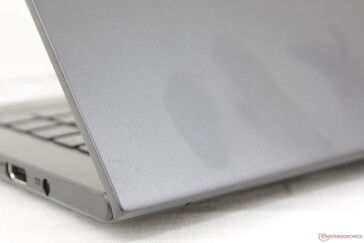
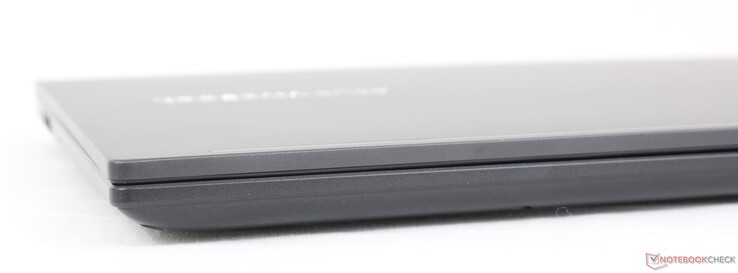
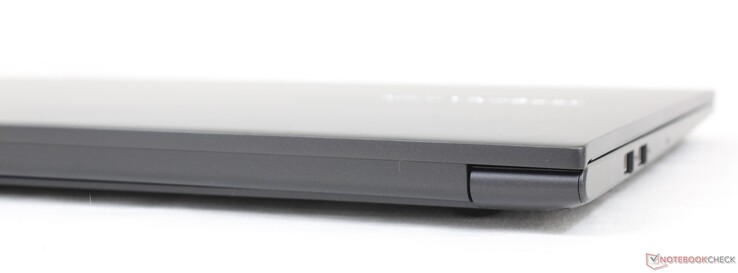
A tampa externa é de alumínio fosco ligeiramente áspero. As impressões digitais são mais difíceis de ver na cor cinza escuro
Tampa aberta até o ângulo máximo (~140 graus)
Sem botão de alimentação com impressões digitais. A rigidez das dobradiças é decente, mas poderia ter sido melhor para evitar o ajuste dos ângulos
Felizmente, nenhum parafuso está escondido sob os pés de borracha
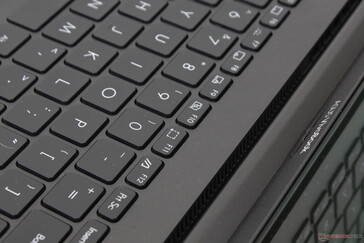
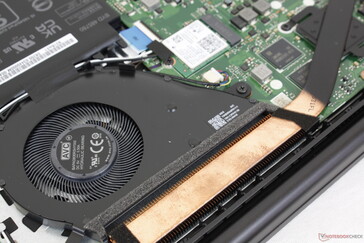
Grelhas de ventilação escondidas embaixo da dobradiça da barra

Size Comparison

363.96 mm 249 mm 19.9 mm 2 kg359.8 mm 235.3 mm 19.9 mm 1.7 kg360.2 mm 234 mm 17.9 mm 1.7 kg359 mm 235 mm 17.9 mm 1.6 kg359.8 mm 233.8 mm 16.1 mm 1.8 kg356.67 mm 233.13 mm 19.1 mm 1.7 kg297 mm 210 mm 1 mm 5.7 g

Conectividade - Sem Thunderbolt ou Carregamento USB-C

As opções portuárias são decentes, mas com advertências decepcionantes. Primeiramente, a porta USB-C não suporta DisplayPort ou Power Delivery, o que significa que você não pode conectar monitores externos ou recarregar o sistema através desta porta, ao contrário da maioria dos outros laptops. Em segundo lugar, a porta HDMI é apenas a versão 1.4, o que significa que ela não suporta monitores externos de 4K a 60 FPS. O modelo ainda utiliza portas USB-A 2.0 mais lentas do que a USB-A 3.0.

Frente: Sem portas
Frente: Sem portas
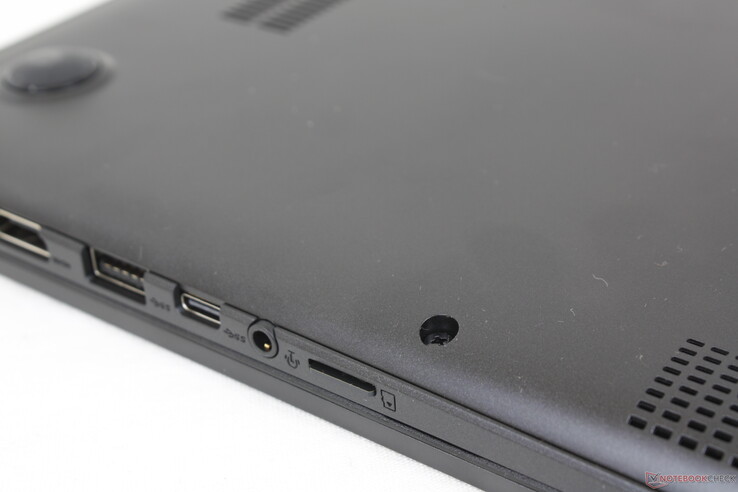
Certo: Slot MicroSD, áudio combinado de 3,5 mm, USB-C, USB-A 3.2 Gen. 1, HDMI 1.4
Atrás: Sem portas
Atrás: Sem portas
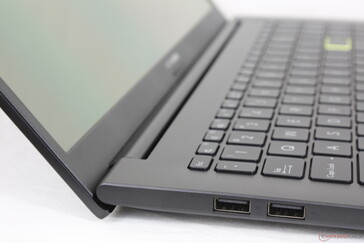
Esquerda: 2x USB-A 2.0

Leitor de cartões SD

O leitor de cartões MicroSD com mola continua lento para refletir o orçamento da linha Vivobook. A mudança de 1 GB de fotos de nossa placa de teste UHS-II para a área de trabalho leva cerca de 30 segundos em comparação com apenas 14 segundos no ZenBook 15.

O cartão MicroSD inserido fica quase nivelado contra a borda
SD Card Reader
average JPG Copy Test (av. of 3 runs)
HP Pavilion 15-eg
  (AV PRO microSD 128 GB V60)
66.7 MB/s +100%
Asus VivoBook 15 Pro M3500QC-L1062
  (AV Pro V60)
36.8 MB/s +10%
Asus Vivobook 15 K513EQ
  (AV Pro V60)
33.4 MB/s
Lenovo IdeaPad 5 15ALC05
  (Toshiba Exceria Pro SDXC 64 GB UHS-II)
28.2 MB/s -16%
Asus VivoBook S15 S533EQ-BQ002T
  (Toshiba Exceria Pro M501 microSDXC 64GB)
25 MB/s -25%
Dell Inspiron 15 3501
  (AV Pro SD 128 GB V60)
19.7 MB/s -41%
maximum AS SSD Seq Read Test (1GB)
HP Pavilion 15-eg
  (AV PRO microSD 128 GB V60)
77.8 MB/s +112%
Asus VivoBook 15 Pro M3500QC-L1062
  (AV Pro V60)
38.1 MB/s +4%
Asus Vivobook 15 K513EQ
  (AV Pro V60)
36.7 MB/s
Lenovo IdeaPad 5 15ALC05
  (Toshiba Exceria Pro SDXC 64 GB UHS-II)
36.5 MB/s -1%
Dell Inspiron 15 3501
  (AV Pro SD microSD 128 GB V60)
27.6 MB/s -25%
Asus VivoBook S15 S533EQ-BQ002T
  (Toshiba Exceria Pro M501 microSDXC 64GB)
25.9 MB/s -29%

Comunicação

Nossa unidade de teste vem com Wi-Fi 6 enquanto as SKUs menores vêm com Wi-Fi 5. Somos capazes de alcançar excelentes taxas de recepção no mundo real de mais de 1,2 Gbps em nosso roteador de teste Netgear RAX200, enquanto as taxas de transmissão são mais decepcionantes com apenas ~600 Mbps.

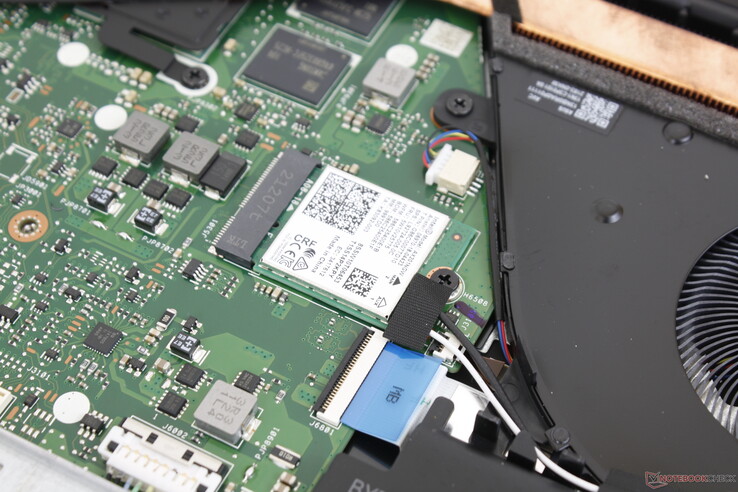
Módulo WLAN Intel AX201 M.2 2242 atualizável
Networking
iperf3 transmit AX12
HP Pavilion 15-eg
Intel Wi-Fi 6 AX201
1197 (1057min - 1282max) MBit/s +98%
Lenovo IdeaPad 5 15ALC05
RealTek Semiconductor RTL8852AE
890 (431min - 988max) MBit/s +47%
Asus VivoBook 15 Pro M3500QC-L1062
MediaTek MT7921
704 (365min - 738max) MBit/s +17%
Asus VivoBook S15 S533EQ-BQ002T
Intel Wi-Fi 6 AX201
670 (647min - 687max) MBit/s +11%
Asus Vivobook 15 K513EQ
Intel Wi-Fi 6 AX201
604 (417min - 698max) MBit/s
Dell Inspiron 15 3501
Intel Wireless AC 9462
95 MBit/s -84%
iperf3 receive AX12
HP Pavilion 15-eg
Intel Wi-Fi 6 AX201
1434 (1199min - 1500max) MBit/s +12%
Asus Vivobook 15 K513EQ
Intel Wi-Fi 6 AX201
1285 (1029min - 1399max) MBit/s
Asus VivoBook S15 S533EQ-BQ002T
Intel Wi-Fi 6 AX201
902 (860min - 921max) MBit/s -30%
Lenovo IdeaPad 5 15ALC05
RealTek Semiconductor RTL8852AE
621 (506min - 708max) MBit/s -52%
Asus VivoBook 15 Pro M3500QC-L1062
MediaTek MT7921
569 (538min - 599max) MBit/s -56%
Dell Inspiron 15 3501
Intel Wireless AC 9462
333 (320min - 336max) MBit/s -74%
05010015020025030035040045050055060065070075080085090095010001050110011501200125013001350Tooltip
Asus Vivobook 15 K513EQ; iperf3 receive AX12; iperf 3.1.3: Ø1285 (1029-1399)
Asus Vivobook 15 K513EQ; iperf3 transmit AX12; iperf 3.1.3: Ø604 (417-698)

Webcam

A qualidade da câmera permanece pobre e em grande parte inalterada por anos. Windows Olá também não é suportado, uma vez que não há sensor infravermelho integrado ou mesmo um obturador de privacidade física.
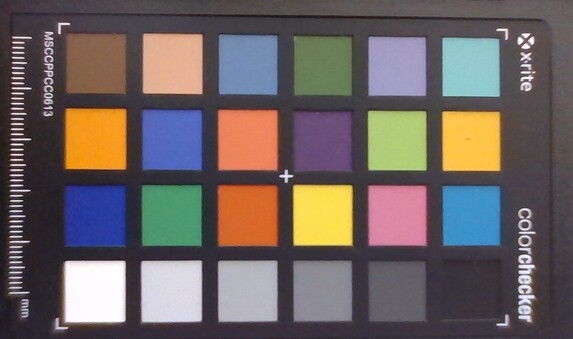
ColorChecker
7.7 ∆E
8.2 ∆E
6.7 ∆E
6.9 ∆E
10 ∆E
12.4 ∆E
10.5 ∆E
6.2 ∆E
20.4 ∆E
6.1 ∆E
7.7 ∆E
9 ∆E
2.4 ∆E
8.5 ∆E
22.8 ∆E
5.6 ∆E
15.6 ∆E
11.9 ∆E
3.4 ∆E
7.1 ∆E
8.4 ∆E
9.7 ∆E
7.4 ∆E
5.9 ∆E
ColorChecker Asus Vivobook 15 K513EQ: 9.18 ∆E min: 2.38 - max: 22.81 ∆E

Manutenção - Fácil de abrir

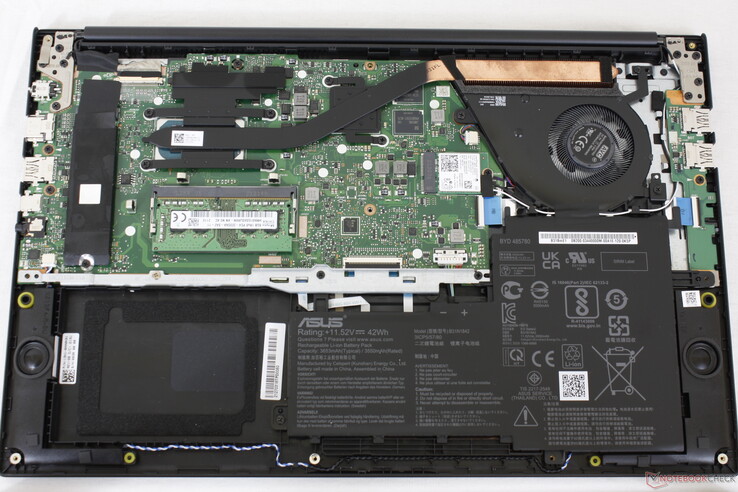
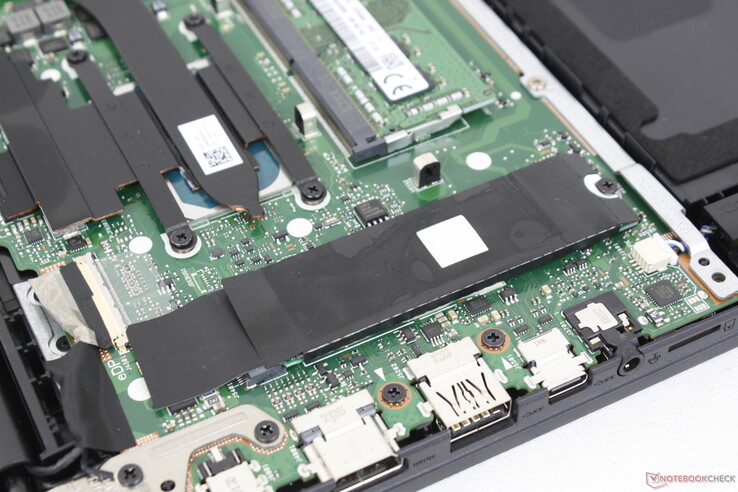
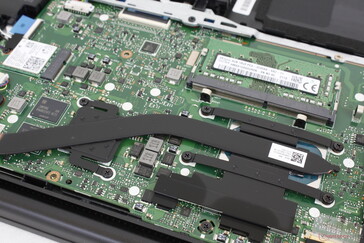
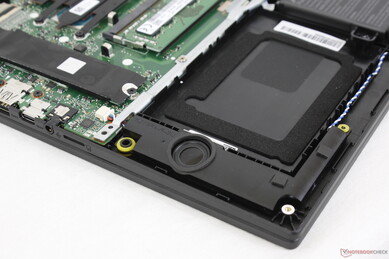
O painel inferior pode ser facilmente removido com uma chave de fenda Philips e uma aresta afiada para revelar o único slot SODIMM, módulo WLAN e slot M.2 2280 PCIe3 x4. Uma base de 8 GB de RAM monocanal vem soldada que pode ser emparelhada com um módulo removível de 8 GB para um total de até 16 GB.

A placa-mãe é visivelmente diferente de outros modelos VivoBook 15

Acessórios e Garantia

A caixa de varejo não inclui outros extras além da papelaria e do adaptador AC. Aplica-se a garantia padrão limitada de um ano do fabricante

Dispositivos de entrada - Spongy Clickpad

Teclado

Se você já digitou em um laptop VivoBook antes, então você saberá exatamente o que esperar do VivoBook 15 K513, pois há muito pouca variação entre os modelos em termos de feedback do teclado. Tanto as viagens quanto a tactilidade permanecem rasas e suaves, respectivamente, em comparação com as teclas mais firmes do Lenovo ThinkPad ou HP EliteBook. As chaves do Lenovo IdeaPad 5 15se sente semelhante ao que temos aqui no Asus, mas o ruído das chaves é moderadamente mais alto no Asus.

Touchpad

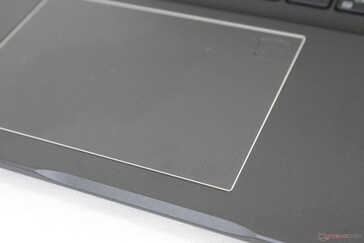
O "clickpad" (~10,5 x 7,3 cm) é pobre e abaixo da média, mesmo pelos padrões orçamentários. Embora o movimento regular do cursor seja suave e sem saltos bruscos, suas teclas integradas do mouse são muito esponjosas e rasas demais. Os cliques são insatisfatórios, especialmente se clicar e arrastar ou executar outras ações multi-toque.

Layout e fonte similares aos de outros laptops VivoBook. A luz de fundo do teclado vem em três níveis de luminosidade
Leitor de impressão digital no canto superior direito do clickpad. A superfície é lisa e com um pouco de aderência ao deslizar a velocidades mais lentas
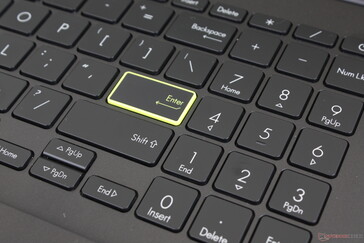
O Asus não melhorou o teclado de sua série VivoBook durante anos. O percurso da chave é rasa a 1,4 mm
A chave colorida Enter é uma característica superficial introduzida pela primeira vez nos modelos VivoBook 2020

Mostrador - Principalmente melhor que o IPS

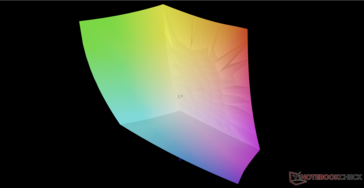
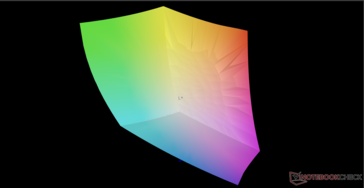
A Asus utiliza o mesmo painel 1080p Samsung ATNA56YX03-0 OLED tanto para sua série VivoBook 15 K513 quanto VivoBook 15 Pro. O painel é notável por oferecer cobertura completa DCI-P3 que a maioria dos painéis IPS não pode alcançar especialmente nesta faixa de preço <$1000 USD. Os tempos de resposta extra-rápidos, a luz de fundo relativamente brilhante e a relação de contraste extrema tornam nosso VivoBook melhor do que o esperado para edição gráfica

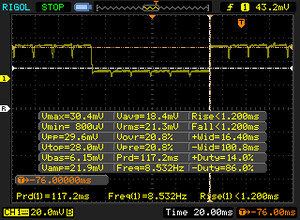
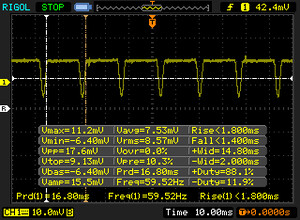
Tenha em mente que a modulação por largura de pulso está presente em todos os níveis de brilho, ao contrário da maioria dos outros laptops. Somos capazes de registrar uma freqüência de 59 Hz quando o brilho é definido para 50% ou mais e 434 Hz quando o brilho é definido para 49% ou menos.

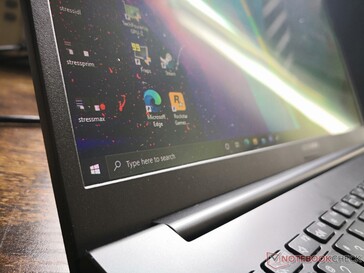
O painel OLED brilhante não é touchscreen e não inclui vidro de proteção borda a borda
Luneis laterais estreitos com luneis superiores e inferiores mais espessos
RGB AMOLED matriz subpixel
Absolutamente nenhum sangramento de luz de fundo desigual
391.7
cd/m²
386.7
cd/m²
387.1
cd/m²
388.8
cd/m²
384.5
cd/m²
392.3
cd/m²
385.1
cd/m²
384.2
cd/m²
391.5
cd/m²
Distribuição do brilho
Samsung ATNA56YX03-0 tested with X-Rite i1Pro 2
Máximo: 392.3 cd/m² (Nits) Médio: 388 cd/m² Minimum: 4.6 cd/m²
iluminação: 98 %
iluminação com acumulador: 384.5 cd/m²
Contraste: ∞:1 (Preto: 0 cd/m²)
ΔE Color 2.53 | 0.5-29.43 Ø5
ΔE Greyscale 1.6 | 0.57-98 Ø5.3
99.9% AdobeRGB 1998 (Argyll 2.2.0 3D)
100% sRGB (Argyll 2.2.0 3D)
99.9% Display P3 (Argyll 2.2.0 3D)
Gamma: 2.24
Asus Vivobook 15 K513EQ
Samsung ATNA56YX03-0, OLED, 1920x1080, 15.60
Asus VivoBook 15 Pro M3500QC-L1062
ATNA56YX03-0, AMOLED, 1920x1080, 15.60
Asus VivoBook S15 S533EQ-BQ002T
Panda LM156LF-5L04, IPS, 1920x1080, 15.60
Lenovo IdeaPad 5 15ALC05
Lenovo LEN156FHD, IPS, 1920x1080, 15.60
Dell Inspiron 15 3501
BOE NV15N3D (Dell P/N: N39X1), IPS, 1920x1080, 15.60
HP Pavilion 15-eg
Chi Mei CMN1523, IPS, 1920x1080, 15.60
Display
-1%
-54%
-52%
-54%
-50%
Display P3 Coverage
99.9
99.9
0%
39.01
-61%
39.4
-61%
42.9
-57%
sRGB Coverage
100
99.9
0%
58.5
-41%
59
-41%
58.7
-41%
64
-36%
AdobeRGB 1998 Coverage
99.9
95.8
-4%
40.33
-60%
38
-62%
40.7
-59%
44.4
-56%
Response Times
-18%
-1229%
-870%
-426%
14162%
Response Time Grey 50% / Grey 80% *
2.2 ?(1.1, 1.1)
3.2 ?(1.6, 1.6)
-45%
38 ?(19, 19)
-1627%
29 ?(13, 16)
-1218%
43 ?(21, 22)
-1855%
22.8 ?(10, 12.8)
-936%
Response Time Black / White *
2.9 ?(1.1, 1.8)
3.2 ?(1.6, 1.6)
-10%
27 ?(15, 12)
-831%
18 ?(9, 9)
-521%
32 ?(17, 15)
-1003%
23.6 ?(13.6, 10)
-714%
PWM Frequency
59.5 ?(100)
60.2 ?(60)
1%
1000 ?(90)
1581%
26320 ?(43)
44135%
Screen
14%
-65%
-101%
-47%
-74%
Brightness middle
384.5
396
3%
287
-25%
376
-2%
271
-30%
294.3
-23%
Brightness
388
397
2%
261
-33%
341
-12%
263
-32%
251
-35%
Brightness Distribution
98
99
1%
84
-14%
78
-20%
92
-6%
76
-22%
Black Level *
0.51
0.66
0.15
0.26
Colorchecker dE 2000 *
2.53
2
21%
4.72
-87%
6.4
-153%
4.83
-91%
4.08
-61%
Colorchecker dE 2000 max. *
6.16
4.8
22%
17.94
-191%
20.45
-232%
7
-14%
19.49
-216%
Greyscale dE 2000 *
1.6
1
37%
2.2
-38%
4.59
-187%
3.36
-110%
3
-88%
Gamma
2.24 98%
2.17 101%
2.51 88%
2.26 97%
2.56 86%
2.21 100%
CCT
6464 101%
6608 98%
6758 96%
6819 95%
6764 96%
6616 98%
Colorchecker dE 2000 calibrated *
1.8
3.74
3.7
Contrast
563
570
1807
1132
Color Space (Percent of AdobeRGB 1998)
37
38
Color Space (Percent of sRGB)
58
59
Total Average (Program / Settings)
-2% / 2%
-449% / -273%
-341% / -245%
-176% / -143%
4679% / 3491%

* ... smaller is better

vs. sRGB
vs. sRGB
vs. DCI-P3
vs. DCI-P3

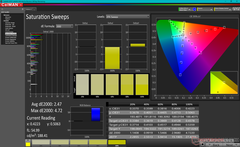
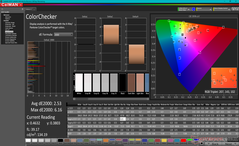
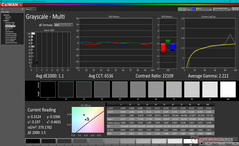
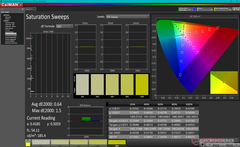
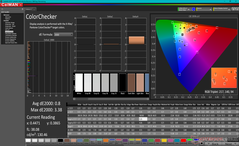
O display é decentemente calibrado fora da caixa com valores médios de escala de cinza e deltaE de cor de apenas 1,6 e 2,53, respectivamente, quando comparado com o padrão P3. As cores vermelho e amarelo parecem ser as mais imprecisas quando comparadas com outras cores primárias e secundárias

Escala de cinza antes da calibração (vs DCI-P3)
Varredura de saturação antes da calibração (vs DCI-P3)
ColorChecker antes da calibração (vs DCI-P3)
Escala de cinza após calibração (sRGB)
Varredura de saturação após calibração (sRGB)
ColorChecker após a calibração (sRGB)

Display Response Times

Display response times show how fast the screen is able to change from one color to the next. Slow response times can lead to afterimages and can cause moving objects to appear blurry (ghosting). Gamers of fast-paced 3D titles should pay special attention to fast response times.
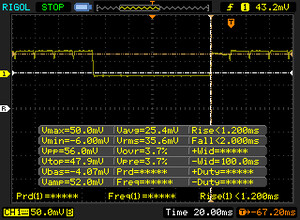
       Response Time Black to White
2.9 ms ... rise ↗ and fall ↘ combined↗ 1.1 ms rise
↘ 1.8 ms fall
The screen shows very fast response rates in our tests and should be very well suited for fast-paced gaming.
In comparison, all tested devices range from 0.1 (minimum) to 240 (maximum) ms. » 9 % of all devices are better.
This means that the measured response time is better than the average of all tested devices (21.5 ms).
       Response Time 50% Grey to 80% Grey
2.2 ms ... rise ↗ and fall ↘ combined↗ 1.1 ms rise
↘ 1.1 ms fall
The screen shows very fast response rates in our tests and should be very well suited for fast-paced gaming.
In comparison, all tested devices range from 0.2 (minimum) to 636 (maximum) ms. » 6 % of all devices are better.
This means that the measured response time is better than the average of all tested devices (33.7 ms).

Screen Flickering / PWM (Pulse-Width Modulation)

To dim the screen, some notebooks will simply cycle the backlight on and off in rapid succession - a method called Pulse Width Modulation (PWM) . This cycling frequency should ideally be undetectable to the human eye. If said frequency is too low, users with sensitive eyes may experience strain or headaches or even notice the flickering altogether.
Screen flickering / PWM detected 59.5 Hz ≤ 100 % brightness setting

The display backlight flickers at 59.5 Hz (worst case, e.g., utilizing PWM) Flickering detected at a brightness setting of 100 % and below. There should be no flickering or PWM above this brightness setting.

The frequency of 59.5 Hz is very low, so the flickering may cause eyestrain and headaches after extended use.

In comparison: 53 % of all tested devices do not use PWM to dim the display. If PWM was detected, an average of 17900 (minimum: 5 - maximum: 3846000) Hz was measured.

A visibilidade ao ar livre é média se sob a sombra e ligeiramente melhor que o IPS quando no mesmo nível de brilho, devido aos níveis de preto muito mais profundos do OLED. Como resultado, a tela não sai tão facilmente, mas o brilho ainda assim é difícil de evitar.

Ao ar livre sob a sombra
Ao ar livre sob a luz do sol
Ao ar livre sob a sombra
Amplos ângulos de visão OLED. A leve tonalidade azul-verde nos ângulos extremos é exclusiva do OLED

Desempenho - 11ª geração Tiger Lake-U

As SKUs atuais vêm equipadas com a série U Núcleo i3-1115G4 CPU até o Core i7-1165G7 mais opcional GeForce MX330 ou MX350 nos gráficos Optimus 1.0. O referido Core i3 SKU vem apenas com UHD Graphics integrado para ser significativamente mais lento que o Iris Xe ou a discreta GPU Nvidia. Os usuários terão que olhar para a parte superior VivoBook 15 Pro se quiserem CPUs mais rápidas da série Core H e GeForce RTX graphics


Condições de teste

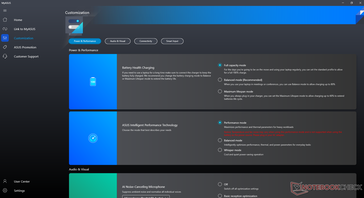
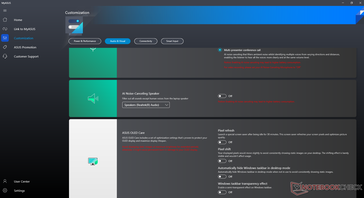
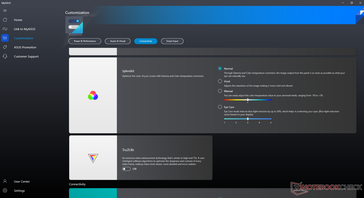
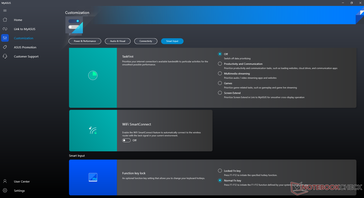
Nossa unidade foi ajustada para o modo Performance através do software MyAsus para obter as melhores pontuações de referência possíveis. Recomendamos aos proprietários que se familiarizem com este software como características-chave relacionadas ao OLED, microfone, saúde da bateria, atualizações Asus, e muito mais estão acessíveis aqui.

Processador

O desempenho da CPU é excelente com resultados multi-tarefa que são cerca de 10% mais rápidos do que a média do laptop em nosso banco de dados com o mesmo Núcleo i7-1165G7 processador. Optando pelo menor Núcleo i5-1135G7 a opção de desempenho implicará uma queda de apenas cerca de 10% a 15%.

Cinebench R15 Multi Loop

050100150200250300350400450500550600650700750800850900Tooltip
Asus Vivobook 15 K513EQ Intel Core i7-1165G7: Ø851 (831.5-866.44)
Dell Inspiron 15 3501 Intel Core i7-1165G7: Ø737 (725.22-798.11)
HP EliteBook 850 G8 3C7Z8EA Intel Core i7-1165G7: Ø702 (674.47-727.03)
HP Pavilion 15-eg Intel Core i7-1165G7: Ø725 (618.81-762.14)
MSI Summit B15 A11M Intel Core i7-1165G7: Ø937 (912.76-946.14)
CPU Performance Rating: Percent
Cinebench R23: Multi Core | Single Core
Cinebench R20: CPU (Multi Core) | CPU (Single Core)
Cinebench R15: CPU Multi 64Bit | CPU Single 64Bit
Blender: v2.79 BMW27 CPU
7-Zip 18.03: 7z b 4 | 7z b 4 -mmt1
Geekbench 5.5: Multi-Core | Single-Core
HWBOT x265 Benchmark v2.2: 4k Preset
LibreOffice : 20 Documents To PDF
R Benchmark 2.5: Overall mean
CPU Performance Rating
HP Pavilion Aero 13 be0097nr -2!
AMD Ryzen 7 5800U
79.3 pt
Lenovo ThinkPad E15 G3-20YG003UGE
AMD Ryzen 7 5700U
76.3 pt
Microsoft Surface Laptop 4 15 AMD TFF_00028
AMD Ryzen 7 4980U
76 pt
MSI Prestige 15 A10SC -10!
Intel Core i7-10710U
73.9 pt
VAIO SX14 VJS144X0111K -2!
Intel Core i7-1195G7
71.5 pt
Asus Vivobook 15 K513EQ -2!
Intel Core i7-1165G7
65.7 pt
Average Intel Core i7-1165G7
 
64.7 pt
Microsoft Surface Laptop 3 15 i7-1065G7 -10!
Intel Core i7-1065G7
61.8 pt
HP Pavilion x360 15-er0155ng
Intel Core i5-1135G7
60.1 pt
Asus ZenBook 15 UX534FT-DB77 -10!
Intel Core i7-8565U
59 pt
Lenovo ThinkPad P15s Gen1-20T4000JGE -2!
Intel Core i7-10510U
51.9 pt
HP 250 G7-15S40ES -2!
Intel Core i5-1035G1
44.1 pt
Dell Inspiron 15 5000 5502 -2!
Intel Core i3-1115G4
41.5 pt
Cinebench R23 / Multi Core
Microsoft Surface Laptop 4 15 AMD TFF_00028
AMD Ryzen 7 4980U
9164 Points +63%
Lenovo ThinkPad E15 G3-20YG003UGE
AMD Ryzen 7 5700U
9033 Points +61%
HP Pavilion Aero 13 be0097nr
AMD Ryzen 7 5800U
7872 (7780.83min - 7871.73max) Points +40%
VAIO SX14 VJS144X0111K
Intel Core i7-1195G7
6806 (6011.21min - 6805.52max) Points +21%
Asus Vivobook 15 K513EQ
Intel Core i7-1165G7
5609 (5443.41min - 5609.45max) Points
Average Intel Core i7-1165G7
  (2525 - 6862, n=64)
5110 Points -9%
HP Pavilion x360 15-er0155ng
Intel Core i5-1135G7
4204 Points -25%
Cinebench R23 / Single Core
VAIO SX14 VJS144X0111K
Intel Core i7-1195G7
1624 Points +10%
Asus Vivobook 15 K513EQ
Intel Core i7-1165G7
1480 Points
Average Intel Core i7-1165G7
  (1110 - 1539, n=59)
1425 Points -4%
HP Pavilion Aero 13 be0097nr
AMD Ryzen 7 5800U
1415 Points -4%
HP Pavilion x360 15-er0155ng
Intel Core i5-1135G7
1362 Points -8%
Microsoft Surface Laptop 4 15 AMD TFF_00028
AMD Ryzen 7 4980U
1260 Points -15%
Lenovo ThinkPad E15 G3-20YG003UGE
AMD Ryzen 7 5700U
1255 Points -15%
Cinebench R20 / CPU (Multi Core)
Lenovo ThinkPad E15 G3-20YG003UGE
AMD Ryzen 7 5700U
3490 Points +60%
Microsoft Surface Laptop 4 15 AMD TFF_00028
AMD Ryzen 7 4980U
3453 Points +58%
HP Pavilion Aero 13 be0097nr
AMD Ryzen 7 5800U
3092 Points +42%
MSI Prestige 15 A10SC
Intel Core i7-10710U
2598 Points +19%
VAIO SX14 VJS144X0111K
Intel Core i7-1195G7
2590 Points +19%
Asus Vivobook 15 K513EQ
Intel Core i7-1165G7
2182 Points
Average Intel Core i7-1165G7
  (1060 - 2657, n=81)
1967 Points -10%
HP Pavilion x360 15-er0155ng
Intel Core i5-1135G7
1855 Points -15%
Microsoft Surface Laptop 3 15 i7-1065G7
Intel Core i7-1065G7
1799 Points -18%
Asus ZenBook 15 UX534FT-DB77
Intel Core i7-8565U
1645 Points -25%
Lenovo ThinkPad P15s Gen1-20T4000JGE
Intel Core i7-10510U
1602 Points -27%
HP 250 G7-15S40ES
Intel Core i5-1035G1
1311 Points -40%
Dell Inspiron 15 5000 5502
Intel Core i3-1115G4
961 Points -56%
Cinebench R20 / CPU (Single Core)
VAIO SX14 VJS144X0111K
Intel Core i7-1195G7
620 Points +10%
Asus Vivobook 15 K513EQ
Intel Core i7-1165G7
565 Points
HP Pavilion Aero 13 be0097nr
AMD Ryzen 7 5800U
552 Points -2%
Average Intel Core i7-1165G7
  (442 - 589, n=81)
552 Points -2%
HP Pavilion x360 15-er0155ng
Intel Core i5-1135G7
518 Points -8%
Dell Inspiron 15 5000 5502
Intel Core i3-1115G4
504 Points -11%
Microsoft Surface Laptop 4 15 AMD TFF_00028
AMD Ryzen 7 4980U
492 Points -13%
Lenovo ThinkPad E15 G3-20YG003UGE
AMD Ryzen 7 5700U
489 Points -13%
Lenovo ThinkPad P15s Gen1-20T4000JGE
Intel Core i7-10510U
467 Points -17%
MSI Prestige 15 A10SC
Intel Core i7-10710U
460 Points -19%
Microsoft Surface Laptop 3 15 i7-1065G7
Intel Core i7-1065G7
460 Points -19%
Asus ZenBook 15 UX534FT-DB77
Intel Core i7-8565U
444 Points -21%
HP 250 G7-15S40ES
Intel Core i5-1035G1
428 Points -24%
Cinebench R15 / CPU Multi 64Bit
Microsoft Surface Laptop 4 15 AMD TFF_00028
AMD Ryzen 7 4980U
1658 (1358.14min - 1658.24max) Points +91%
Lenovo ThinkPad E15 G3-20YG003UGE
AMD Ryzen 7 5700U
1512 (1475.63min - 1511.6max) Points +75%
HP Pavilion Aero 13 be0097nr
AMD Ryzen 7 5800U
1390 (1297.77min - 1389.66max) Points +61%
MSI Prestige 15 A10SC
Intel Core i7-10710U
1103 Points +27%
VAIO SX14 VJS144X0111K
Intel Core i7-1195G7
994 (846.99min - 994.46max) Points +15%
Asus Vivobook 15 K513EQ
Intel Core i7-1165G7
866 (831.5min - 866.44max) Points
Average Intel Core i7-1165G7
  (553 - 1027, n=86)
846 Points -2%
HP Pavilion x360 15-er0155ng
Intel Core i5-1135G7
735 Points -15%
Microsoft Surface Laptop 3 15 i7-1065G7
Intel Core i7-1065G7
733 Points -15%
Lenovo ThinkPad P15s Gen1-20T4000JGE
Intel Core i7-10510U
703 (593.24min - 703.32max) Points -19%
Asus ZenBook 15 UX534FT-DB77
Intel Core i7-8565U
683 Points -21%
HP 250 G7-15S40ES
Intel Core i5-1035G1
561 Points -35%
Dell Inspiron 15 5000 5502
Intel Core i3-1115G4
384.7 (375.47min - 384.71max) Points -56%
Cinebench R15 / CPU Single 64Bit
VAIO SX14 VJS144X0111K
Intel Core i7-1195G7
238 Points +6%
HP Pavilion Aero 13 be0097nr
AMD Ryzen 7 5800U
229 Points +2%
Asus Vivobook 15 K513EQ
Intel Core i7-1165G7
225 Points
Average Intel Core i7-1165G7
  (115 - 230, n=78)
212 Points -6%
HP Pavilion x360 15-er0155ng
Intel Core i5-1135G7
197 Points -12%
Dell Inspiron 15 5000 5502
Intel Core i3-1115G4
193.6 Points -14%
MSI Prestige 15 A10SC
Intel Core i7-10710U
191 Points -15%
Lenovo ThinkPad E15 G3-20YG003UGE
AMD Ryzen 7 5700U
188 Points -16%
Lenovo ThinkPad P15s Gen1-20T4000JGE
Intel Core i7-10510U
185 Points -18%
Microsoft Surface Laptop 3 15 i7-1065G7
Intel Core i7-1065G7
184 Points -18%
Microsoft Surface Laptop 4 15 AMD TFF_00028
AMD Ryzen 7 4980U
182 Points -19%
Asus ZenBook 15 UX534FT-DB77
Intel Core i7-8565U
181 Points -20%
HP 250 G7-15S40ES
Intel Core i5-1035G1
166 Points -26%
Blender / v2.79 BMW27 CPU
Dell Inspiron 15 5000 5502
Intel Core i3-1115G4
1188 Seconds * -119%
HP 250 G7-15S40ES
Intel Core i5-1035G1
863 Seconds * -59%
Lenovo ThinkPad P15s Gen1-20T4000JGE
Intel Core i7-10510U
703 Seconds * -30%
HP Pavilion x360 15-er0155ng
Intel Core i5-1135G7
696 Seconds * -28%
Average Intel Core i7-1165G7
  (468 - 1138, n=80)
618 Seconds * -14%
Asus Vivobook 15 K513EQ
Intel Core i7-1165G7
542 Seconds *
VAIO SX14 VJS144X0111K
Intel Core i7-1195G7
473 Seconds * +13%
Microsoft Surface Laptop 4 15 AMD TFF_00028
AMD Ryzen 7 4980U
342 Seconds * +37%
HP Pavilion Aero 13 be0097nr
AMD Ryzen 7 5800U
331 Seconds * +39%
Lenovo ThinkPad E15 G3-20YG003UGE
AMD Ryzen 7 5700U
317 Seconds * +42%
7-Zip 18.03 / 7z b 4
HP Pavilion Aero 13 be0097nr
AMD Ryzen 7 5800U
43633 MIPS +73%
Microsoft Surface Laptop 4 15 AMD TFF_00028
AMD Ryzen 7 4980U
42368 MIPS +68%
Lenovo ThinkPad E15 G3-20YG003UGE
AMD Ryzen 7 5700U
41849 MIPS +66%
VAIO SX14 VJS144X0111K
Intel Core i7-1195G7
25412 MIPS +1%
Asus Vivobook 15 K513EQ
Intel Core i7-1165G7
25242 MIPS
Average Intel Core i7-1165G7
  (15347 - 27405, n=80)
22935 MIPS -9%
HP Pavilion x360 15-er0155ng
Intel Core i5-1135G7
21927 MIPS -13%
Lenovo ThinkPad P15s Gen1-20T4000JGE
Intel Core i7-10510U
19247 MIPS -24%
HP 250 G7-15S40ES
Intel Core i5-1035G1
15114 MIPS -40%
Dell Inspiron 15 5000 5502
Intel Core i3-1115G4
11122 MIPS -56%
7-Zip 18.03 / 7z b 4 -mmt1
HP Pavilion Aero 13 be0097nr
AMD Ryzen 7 5800U
5405 MIPS +2%
Asus Vivobook 15 K513EQ
Intel Core i7-1165G7
5308 MIPS
Average Intel Core i7-1165G7
  (4478 - 5507, n=80)
5182 MIPS -2%
VAIO SX14 VJS144X0111K
Intel Core i7-1195G7
5059 MIPS -5%
HP Pavilion x360 15-er0155ng
Intel Core i5-1135G7
4838 MIPS -9%
Lenovo ThinkPad P15s Gen1-20T4000JGE
Intel Core i7-10510U
4693 MIPS -12%
Dell Inspiron 15 5000 5502
Intel Core i3-1115G4
4621 MIPS -13%
Lenovo ThinkPad E15 G3-20YG003UGE
AMD Ryzen 7 5700U
4483 MIPS -16%
Microsoft Surface Laptop 4 15 AMD TFF_00028
AMD Ryzen 7 4980U
4320 MIPS -19%
HP 250 G7-15S40ES
Intel Core i5-1035G1
4261 MIPS -20%
Geekbench 5.5 / Multi-Core
Microsoft Surface Laptop 4 15 AMD TFF_00028
AMD Ryzen 7 4980U
7156 Points
Lenovo ThinkPad E15 G3-20YG003UGE
AMD Ryzen 7 5700U
6018 Points
Average Intel Core i7-1165G7
  (3078 - 5926, n=77)
5155 Points
HP Pavilion x360 15-er0155ng
Intel Core i5-1135G7
5059 Points
Lenovo ThinkPad P15s Gen1-20T4000JGE
Intel Core i7-10510U
4484 Points
HP 250 G7-15S40ES
Intel Core i5-1035G1
3337 Points
Dell Inspiron 15 5000 5502
Intel Core i3-1115G4
2427 Points
Geekbench 5.5 / Single-Core
Average Intel Core i7-1165G7
  (1302 - 1595, n=77)
1524 Points
HP Pavilion x360 15-er0155ng
Intel Core i5-1135G7
1417 Points
Dell Inspiron 15 5000 5502
Intel Core i3-1115G4
1337 Points
Lenovo ThinkPad P15s Gen1-20T4000JGE
Intel Core i7-10510U
1206 Points
Lenovo ThinkPad E15 G3-20YG003UGE
AMD Ryzen 7 5700U
1175 Points
HP 250 G7-15S40ES
Intel Core i5-1035G1
1172 Points
Microsoft Surface Laptop 4 15 AMD TFF_00028
AMD Ryzen 7 4980U
1133 Points
HWBOT x265 Benchmark v2.2 / 4k Preset
HP Pavilion Aero 13 be0097nr
AMD Ryzen 7 5800U
10.4 fps +43%
Lenovo ThinkPad E15 G3-20YG003UGE
AMD Ryzen 7 5700U
10.2 fps +40%
Microsoft Surface Laptop 4 15 AMD TFF_00028
AMD Ryzen 7 4980U
9.82 fps +35%
VAIO SX14 VJS144X0111K
Intel Core i7-1195G7
8.8 fps +21%
Asus Vivobook 15 K513EQ
Intel Core i7-1165G7
7.27 fps
Average Intel Core i7-1165G7
  (1.39 - 8.47, n=80)
6.3 fps -13%
HP Pavilion x360 15-er0155ng
Intel Core i5-1135G7
5.82 fps -20%
Lenovo ThinkPad P15s Gen1-20T4000JGE
Intel Core i7-10510U
5.24 fps -28%
HP 250 G7-15S40ES
Intel Core i5-1035G1
4.25 fps -42%
Dell Inspiron 15 5000 5502
Intel Core i3-1115G4
3.25 fps -55%
LibreOffice / 20 Documents To PDF
Microsoft Surface Laptop 4 15 AMD TFF_00028
AMD Ryzen 7 4980U
68 s * -45%
Lenovo ThinkPad P15s Gen1-20T4000JGE
Intel Core i7-10510U
66 s * -41%
Dell Inspiron 15 5000 5502
Intel Core i3-1115G4
62.8 s * -34%
Lenovo ThinkPad E15 G3-20YG003UGE
AMD Ryzen 7 5700U
59.3 s * -26%
HP 250 G7-15S40ES
Intel Core i5-1035G1
59 s * -26%
HP Pavilion Aero 13 be0097nr
AMD Ryzen 7 5800U
53.9 s * -15%
VAIO SX14 VJS144X0111K
Intel Core i7-1195G7
50.2 s * -7%
Average Intel Core i7-1165G7
  (21.5 - 88.1, n=78)
49.2 s * -5%
HP Pavilion x360 15-er0155ng
Intel Core i5-1135G7
47.5 s * -1%
Asus Vivobook 15 K513EQ
Intel Core i7-1165G7
46.9 s *
R Benchmark 2.5 / Overall mean
HP 250 G7-15S40ES
Intel Core i5-1035G1
0.749 sec * -33%
Dell Inspiron 15 5000 5502
Intel Core i3-1115G4
0.655 sec * -16%
Microsoft Surface Laptop 4 15 AMD TFF_00028
AMD Ryzen 7 4980U
0.64 sec * -14%
Lenovo ThinkPad P15s Gen1-20T4000JGE
Intel Core i7-10510U
0.637 sec * -13%
HP Pavilion x360 15-er0155ng
Intel Core i5-1135G7
0.625 sec * -11%
Lenovo ThinkPad E15 G3-20YG003UGE
AMD Ryzen 7 5700U
0.602 sec * -7%
Average Intel Core i7-1165G7
  (0.552 - 1.002, n=80)
0.594 sec * -6%
Asus Vivobook 15 K513EQ
Intel Core i7-1165G7
0.563 sec *
VAIO SX14 VJS144X0111K
Intel Core i7-1195G7
0.552 sec * +2%
HP Pavilion Aero 13 be0097nr
AMD Ryzen 7 5800U
0.54 sec * +4%
CPU Performance Rating: Percent
Cinebench R23: Multi Core | Single Core
Cinebench R20: CPU (Multi Core) | CPU (Single Core)
Cinebench R15: CPU Multi 64Bit | CPU Single 64Bit
Blender: v2.79 BMW27 CPU
7-Zip 18.03: 7z b 4 | 7z b 4 -mmt1
Geekbench 5.5: Multi-Core | Single-Core
HWBOT x265 Benchmark v2.2: 4k Preset
LibreOffice : 20 Documents To PDF
R Benchmark 2.5: Overall mean

* ... smaller is better

Cinebench R15 CPU Multi 64Bit
866 Points
Cinebench R15 OpenGL 64Bit
136 fps
Cinebench R15 Ref. Match 64Bit
99.6 %
Cinebench R15 CPU Single 64Bit
225 Points
Ajuda
Performance Rating
Asus VivoBook 15 Pro M3500QC-L1062
AMD Ryzen 5 5600H, GeForce RTX 3050 4GB Laptop GPU
93.7 pt
Lenovo IdeaPad 5 15ALC05
AMD Ryzen 5 5500U, Vega 7
77.2 pt
Asus Vivobook 15 K513EQ
Intel Core i7-1165G7, GeForce MX350
63.9 pt
HP Pavilion 15-eg
Intel Core i7-1165G7, GeForce MX450
61.5 pt
Asus VivoBook S15 S533EQ-BQ002T
Intel Core i7-1165G7, GeForce MX350
61.2 pt
Average Intel Core i7-1165G7
 
61.2 pt
Dell Inspiron 15 3501
Intel Core i7-1165G7, Iris Xe G7 96EUs
56.3 pt
AIDA64 / FP32 Ray-Trace
Asus VivoBook 15 Pro M3500QC-L1062
AMD Ryzen 5 5600H, GeForce RTX 3050 4GB Laptop GPU
10946 KRay/s +52%
Lenovo IdeaPad 5 15ALC05
AMD Ryzen 5 5500U, Vega 7
8612 KRay/s +20%
Asus Vivobook 15 K513EQ
Intel Core i7-1165G7, GeForce MX350
7197 KRay/s
Asus VivoBook S15 S533EQ-BQ002T
Intel Core i7-1165G7, GeForce MX350
6736 KRay/s -6%
Average Intel Core i7-1165G7
  (3933 - 8184, n=58)
6555 KRay/s -9%
HP Pavilion 15-eg
Intel Core i7-1165G7, GeForce MX450
6344 KRay/s -12%
Dell Inspiron 15 3501
Intel Core i7-1165G7, Iris Xe G7 96EUs
6272 KRay/s -13%
AIDA64 / FPU Julia
Asus VivoBook 15 Pro M3500QC-L1062
AMD Ryzen 5 5600H, GeForce RTX 3050 4GB Laptop GPU
68549 Points +124%
Lenovo IdeaPad 5 15ALC05
AMD Ryzen 5 5500U, Vega 7
49306 Points +61%
Asus Vivobook 15 K513EQ
Intel Core i7-1165G7, GeForce MX350
30646 Points
Asus VivoBook S15 S533EQ-BQ002T
Intel Core i7-1165G7, GeForce MX350
28192 Points -8%
Average Intel Core i7-1165G7
  (17720 - 34369, n=58)
27783 Points -9%
HP Pavilion 15-eg
Intel Core i7-1165G7, GeForce MX450
27167 Points -11%
Dell Inspiron 15 3501
Intel Core i7-1165G7, Iris Xe G7 96EUs
26131 Points -15%
AIDA64 / CPU SHA3
Asus VivoBook 15 Pro M3500QC-L1062
AMD Ryzen 5 5600H, GeForce RTX 3050 4GB Laptop GPU
2350 MB/s +13%
Asus Vivobook 15 K513EQ
Intel Core i7-1165G7, GeForce MX350
2076 MB/s
Asus VivoBook S15 S533EQ-BQ002T
Intel Core i7-1165G7, GeForce MX350
1884 MB/s -9%
Average Intel Core i7-1165G7
  (958 - 2338, n=58)
1867 MB/s -10%
HP Pavilion 15-eg
Intel Core i7-1165G7, GeForce MX450
1838 MB/s -11%
Dell Inspiron 15 3501
Intel Core i7-1165G7, Iris Xe G7 96EUs
1783 MB/s -14%
Lenovo IdeaPad 5 15ALC05
AMD Ryzen 5 5500U, Vega 7
1670 MB/s -20%
AIDA64 / CPU Queen
Asus VivoBook 15 Pro M3500QC-L1062
AMD Ryzen 5 5600H, GeForce RTX 3050 4GB Laptop GPU
74015 Points +47%
Lenovo IdeaPad 5 15ALC05
AMD Ryzen 5 5500U, Vega 7
72332 Points +44%
HP Pavilion 15-eg
Intel Core i7-1165G7, GeForce MX450
50460 Points 0%
Asus VivoBook S15 S533EQ-BQ002T
Intel Core i7-1165G7, GeForce MX350
50390 Points 0%
Asus Vivobook 15 K513EQ
Intel Core i7-1165G7, GeForce MX350
50250 Points
Dell Inspiron 15 3501
Intel Core i7-1165G7, Iris Xe G7 96EUs
50089 Points 0%
Average Intel Core i7-1165G7
  (44161 - 50624, n=58)
49716 Points -1%
AIDA64 / FPU SinJulia
Lenovo IdeaPad 5 15ALC05
AMD Ryzen 5 5500U, Vega 7
10108 Points +111%
Asus VivoBook 15 Pro M3500QC-L1062
AMD Ryzen 5 5600H, GeForce RTX 3050 4GB Laptop GPU
8649 Points +81%
Asus Vivobook 15 K513EQ
Intel Core i7-1165G7, GeForce MX350
4790 Points
Asus VivoBook S15 S533EQ-BQ002T
Intel Core i7-1165G7, GeForce MX350
4571 Points -5%
Average Intel Core i7-1165G7
  (3183 - 4796, n=58)
4431 Points -7%
HP Pavilion 15-eg
Intel Core i7-1165G7, GeForce MX450
4374 Points -9%
Dell Inspiron 15 3501
Intel Core i7-1165G7, Iris Xe G7 96EUs
4361 Points -9%
AIDA64 / FPU Mandel
Asus VivoBook 15 Pro M3500QC-L1062
AMD Ryzen 5 5600H, GeForce RTX 3050 4GB Laptop GPU
37739 Points +102%
Lenovo IdeaPad 5 15ALC05
AMD Ryzen 5 5500U, Vega 7
25846 Points +38%
Asus Vivobook 15 K513EQ
Intel Core i7-1165G7, GeForce MX350
18672 Points
Asus VivoBook S15 S533EQ-BQ002T
Intel Core i7-1165G7, GeForce MX350
17331 Points -7%
Average Intel Core i7-1165G7
  (11876 - 20468, n=58)
16813 Points -10%
HP Pavilion 15-eg
Intel Core i7-1165G7, GeForce MX450
16576 Points -11%
Dell Inspiron 15 3501
Intel Core i7-1165G7, Iris Xe G7 96EUs
15890 Points -15%
AIDA64 / CPU AES
Asus VivoBook 15 Pro M3500QC-L1062
AMD Ryzen 5 5600H, GeForce RTX 3050 4GB Laptop GPU
91509 MB/s +25%
Asus Vivobook 15 K513EQ
Intel Core i7-1165G7, GeForce MX350
73387 MB/s
Asus VivoBook S15 S533EQ-BQ002T
Intel Core i7-1165G7, GeForce MX350
65825 MB/s -10%
HP Pavilion 15-eg
Intel Core i7-1165G7, GeForce MX450
63944 MB/s -13%
Dell Inspiron 15 3501
Intel Core i7-1165G7, Iris Xe G7 96EUs
63116 MB/s -14%
Average Intel Core i7-1165G7
  (29506 - 73387, n=58)
62121 MB/s -15%
Lenovo IdeaPad 5 15ALC05
AMD Ryzen 5 5500U, Vega 7
50257 MB/s -32%
AIDA64 / CPU ZLib
Asus VivoBook 15 Pro M3500QC-L1062
AMD Ryzen 5 5600H, GeForce RTX 3050 4GB Laptop GPU
596 MB/s +52%
Lenovo IdeaPad 5 15ALC05
AMD Ryzen 5 5500U, Vega 7
565 MB/s +45%
Asus Vivobook 15 K513EQ
Intel Core i7-1165G7, GeForce MX350
391 MB/s
Asus VivoBook S15 S533EQ-BQ002T
Intel Core i7-1165G7, GeForce MX350
362 MB/s -7%
Dell Inspiron 15 3501
Intel Core i7-1165G7, Iris Xe G7 96EUs
327 MB/s -16%
HP Pavilion 15-eg
Intel Core i7-1165G7, GeForce MX450
319 MB/s -18%
Average Intel Core i7-1165G7
  (169 - 402, n=65)
304 MB/s -22%
AIDA64 / FP64 Ray-Trace
Asus VivoBook 15 Pro M3500QC-L1062
AMD Ryzen 5 5600H, GeForce RTX 3050 4GB Laptop GPU
5764 KRay/s +48%
Lenovo IdeaPad 5 15ALC05
AMD Ryzen 5 5500U, Vega 7
4703 KRay/s +21%
Asus Vivobook 15 K513EQ
Intel Core i7-1165G7, GeForce MX350
3902 KRay/s
Asus VivoBook S15 S533EQ-BQ002T
Intel Core i7-1165G7, GeForce MX350
3626 KRay/s -7%
Dell Inspiron 15 3501
Intel Core i7-1165G7, Iris Xe G7 96EUs
3531 KRay/s -10%
Average Intel Core i7-1165G7
  (2033 - 4461, n=58)
3525 KRay/s -10%
HP Pavilion 15-eg
Intel Core i7-1165G7, GeForce MX450
3502 KRay/s -10%
AIDA64 / CPU PhotoWorxx
HP Pavilion 15-eg
Intel Core i7-1165G7, GeForce MX450
31380 MPixel/s +61%
Average Intel Core i7-1165G7
  (12392 - 45694, n=58)
30266 MPixel/s +56%
Asus VivoBook S15 S533EQ-BQ002T
Intel Core i7-1165G7, GeForce MX350
23260 MPixel/s +20%
Asus Vivobook 15 K513EQ
Intel Core i7-1165G7, GeForce MX350
19463 MPixel/s
Dell Inspiron 15 3501
Intel Core i7-1165G7, Iris Xe G7 96EUs
16949 MPixel/s -13%
Lenovo IdeaPad 5 15ALC05
AMD Ryzen 5 5500U, Vega 7
16576 MPixel/s -15%
Asus VivoBook 15 Pro M3500QC-L1062
AMD Ryzen 5 5600H, GeForce RTX 3050 4GB Laptop GPU
16014 MPixel/s -18%

Desempenho do sistema

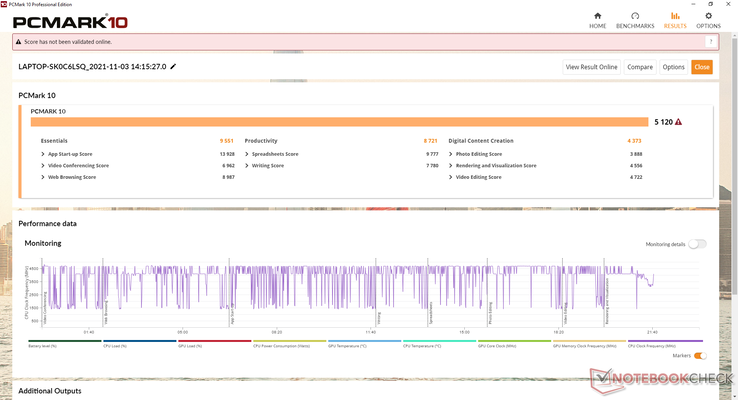
As pontuações da PCMark 10 Digital Content Creation geralmente preferem o Iris Xe integrado ao invés de gráficos dedicados GeForce MX. Assim, nossa pontuação geral PCMark 10 é ligeiramente inferior à de muitos computadores portáteis Tiger Lake-U que não possuem gráficos discretos
PCMark 10 / Score
Asus VivoBook 15 Pro M3500QC-L1062
GeForce RTX 3050 4GB Laptop GPU, R5 5600H, SK Hynix HFM512GD3JX013N
5905 Points +15%
HP Pavilion 15-eg
GeForce MX450, i7-1165G7, Samsung PM991 MZVLQ1T0HALB
5814 Points +14%
Asus VivoBook S15 S533EQ-BQ002T
GeForce MX350, i7-1165G7, Intel SSD 660p 1TB SSDPEKNW010T8
5306 Points +4%
Lenovo IdeaPad 5 15ALC05
Vega 7, R5 5500U
5218 Points +2%
Asus Vivobook 15 K513EQ
GeForce MX350, i7-1165G7, Intel SSD 660p SSDPEKNW512G8
5120 Points
Average Intel Core i7-1165G7, NVIDIA GeForce MX350
  (4855 - 5306, n=5)
5113 Points 0%
Dell Inspiron 15 3501
Iris Xe G7 96EUs, i7-1165G7, Samsung PM991a MZ9LQ512HBLU-00BD1
4891 Points -4%
PCMark 10 / Essentials
Asus VivoBook 15 Pro M3500QC-L1062
GeForce RTX 3050 4GB Laptop GPU, R5 5600H, SK Hynix HFM512GD3JX013N
9987 Points +5%
HP Pavilion 15-eg
GeForce MX450, i7-1165G7, Samsung PM991 MZVLQ1T0HALB
9833 Points +3%
Dell Inspiron 15 3501
Iris Xe G7 96EUs, i7-1165G7, Samsung PM991a MZ9LQ512HBLU-00BD1
9795 Points +3%
Asus Vivobook 15 K513EQ
GeForce MX350, i7-1165G7, Intel SSD 660p SSDPEKNW512G8
9551 Points
Lenovo IdeaPad 5 15ALC05
Vega 7, R5 5500U
9125 Points -4%
Asus VivoBook S15 S533EQ-BQ002T
GeForce MX350, i7-1165G7, Intel SSD 660p 1TB SSDPEKNW010T8
8930 Points -7%
Average Intel Core i7-1165G7, NVIDIA GeForce MX350
  (8026 - 9551, n=5)
8905 Points -7%
PCMark 10 / Productivity
HP Pavilion 15-eg
GeForce MX450, i7-1165G7, Samsung PM991 MZVLQ1T0HALB
9292 Points +7%
Asus Vivobook 15 K513EQ
GeForce MX350, i7-1165G7, Intel SSD 660p SSDPEKNW512G8
8721 Points
Average Intel Core i7-1165G7, NVIDIA GeForce MX350
  (8343 - 9071, n=5)
8655 Points -1%
Asus VivoBook 15 Pro M3500QC-L1062
GeForce RTX 3050 4GB Laptop GPU, R5 5600H, SK Hynix HFM512GD3JX013N
8627 Points -1%
Asus VivoBook S15 S533EQ-BQ002T
GeForce MX350, i7-1165G7, Intel SSD 660p 1TB SSDPEKNW010T8
8519 Points -2%
Lenovo IdeaPad 5 15ALC05
Vega 7, R5 5500U
7942 Points -9%
Dell Inspiron 15 3501
Iris Xe G7 96EUs, i7-1165G7, Samsung PM991a MZ9LQ512HBLU-00BD1
6618 Points -24%
PCMark 10 / Digital Content Creation
Asus VivoBook 15 Pro M3500QC-L1062
GeForce RTX 3050 4GB Laptop GPU, R5 5600H, SK Hynix HFM512GD3JX013N
6486 Points +48%
HP Pavilion 15-eg
GeForce MX450, i7-1165G7, Samsung PM991 MZVLQ1T0HALB
5839 Points +34%
Asus VivoBook S15 S533EQ-BQ002T
GeForce MX350, i7-1165G7, Intel SSD 660p 1TB SSDPEKNW010T8
5330 Points +22%
Lenovo IdeaPad 5 15ALC05
Vega 7, R5 5500U
5320 Points +22%
Dell Inspiron 15 3501
Iris Xe G7 96EUs, i7-1165G7, Samsung PM991a MZ9LQ512HBLU-00BD1
4899 Points +12%
Average Intel Core i7-1165G7, NVIDIA GeForce MX350
  (4373 - 5330, n=5)
4720 Points +8%
Asus Vivobook 15 K513EQ
GeForce MX350, i7-1165G7, Intel SSD 660p SSDPEKNW512G8
4373 Points
PCMark 10 Score
5120 pontos
Ajuda
AIDA64 / Memory Copy
Average Intel Core i7-1165G7
  (20032 - 65446, n=58)
46476 MB/s +30%
HP Pavilion 15-eg
Intel Core i7-1165G7, GeForce MX450
40472 MB/s +14%
Asus VivoBook 15 Pro M3500QC-L1062
AMD Ryzen 5 5600H, GeForce RTX 3050 4GB Laptop GPU
38540 MB/s +8%
Asus VivoBook S15 S533EQ-BQ002T
Intel Core i7-1165G7, GeForce MX350
36317 MB/s +2%
Asus Vivobook 15 K513EQ
Intel Core i7-1165G7, GeForce MX350
35627 MB/s
Lenovo IdeaPad 5 15ALC05
AMD Ryzen 5 5500U, Vega 7
34196 MB/s -4%
Dell Inspiron 15 3501
Intel Core i7-1165G7, Iris Xe G7 96EUs
31351 MB/s -12%
AIDA64 / Memory Read
Average Intel Core i7-1165G7
  (23033 - 64524, n=58)
48851 MB/s +11%
HP Pavilion 15-eg
Intel Core i7-1165G7, GeForce MX450
47539 MB/s +8%
Asus VivoBook 15 Pro M3500QC-L1062
AMD Ryzen 5 5600H, GeForce RTX 3050 4GB Laptop GPU
44470 MB/s +1%
Asus Vivobook 15 K513EQ
Intel Core i7-1165G7, GeForce MX350
43983 MB/s
Asus VivoBook S15 S533EQ-BQ002T
Intel Core i7-1165G7, GeForce MX350
43880 MB/s 0%
Lenovo IdeaPad 5 15ALC05
AMD Ryzen 5 5500U, Vega 7
42872 MB/s -3%
Dell Inspiron 15 3501
Intel Core i7-1165G7, Iris Xe G7 96EUs
37436 MB/s -15%
AIDA64 / Memory Write
Average Intel Core i7-1165G7
  (21736 - 66791, n=58)
49822 MB/s +14%
HP Pavilion 15-eg
Intel Core i7-1165G7, GeForce MX450
46806 MB/s +7%
Asus Vivobook 15 K513EQ
Intel Core i7-1165G7, GeForce MX350
43873 MB/s
Asus VivoBook S15 S533EQ-BQ002T
Intel Core i7-1165G7, GeForce MX350
43816 MB/s 0%
Asus VivoBook 15 Pro M3500QC-L1062
AMD Ryzen 5 5600H, GeForce RTX 3050 4GB Laptop GPU
36270 MB/s -17%
Dell Inspiron 15 3501
Intel Core i7-1165G7, Iris Xe G7 96EUs
35973 MB/s -18%
Lenovo IdeaPad 5 15ALC05
AMD Ryzen 5 5500U, Vega 7
31943 MB/s -27%
AIDA64 / Memory Latency
Lenovo IdeaPad 5 15ALC05
AMD Ryzen 5 5500U, Vega 7
99.4 ns * -18%
Dell Inspiron 15 3501
Intel Core i7-1165G7, Iris Xe G7 96EUs
91.9 ns * -9%
Asus Vivobook 15 K513EQ
Intel Core i7-1165G7, GeForce MX350
84.5 ns *
Asus VivoBook S15 S533EQ-BQ002T
Intel Core i7-1165G7, GeForce MX350
81.8 ns * +3%
Average Intel Core i7-1165G7
  (71.4 - 110, n=65)
76 ns * +10%
Asus VivoBook 15 Pro M3500QC-L1062
AMD Ryzen 5 5600H, GeForce RTX 3050 4GB Laptop GPU
75.2 ns * +11%
HP Pavilion 15-eg
Intel Core i7-1165G7, GeForce MX450
69 ns * +18%

* ... smaller is better

Latência do DPC

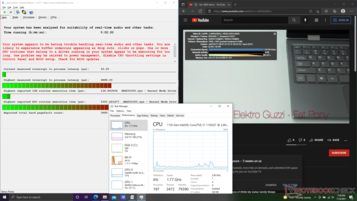
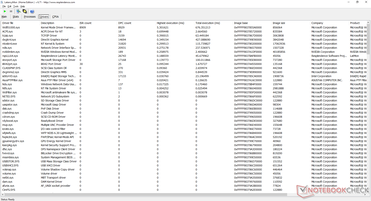
LatencyMon mostra os problemas de DPC ao abrir várias abas do navegador em nossa página inicial. A reprodução de vídeo nativo 4K a 60 FPS é de outra forma suave e sem problemas.

DPC Latencies / LatencyMon - interrupt to process latency (max), Web, Youtube, Prime95
Asus Vivobook 15 K513EQ
GeForce MX350, i7-1165G7, Intel SSD 660p SSDPEKNW512G8
4888 μs *
HP Pavilion 15-eg
GeForce MX450, i7-1165G7, Samsung PM991 MZVLQ1T0HALB
2084 μs * +57%
Dell Inspiron 15 3501
Iris Xe G7 96EUs, i7-1165G7, Samsung PM991a MZ9LQ512HBLU-00BD1
882 μs * +82%
Lenovo IdeaPad 5 15ALC05
Vega 7, R5 5500U
874 μs * +82%
Asus VivoBook S15 S533EQ-BQ002T
GeForce MX350, i7-1165G7, Intel SSD 660p 1TB SSDPEKNW010T8
685 μs * +86%
Asus VivoBook 15 Pro M3500QC-L1062
GeForce RTX 3050 4GB Laptop GPU, R5 5600H, SK Hynix HFM512GD3JX013N
447.7 μs * +91%

* ... smaller is better

Dispositivos de Armazenamento - Espaço só para uma unidade

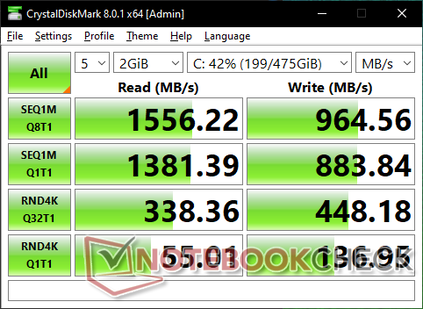
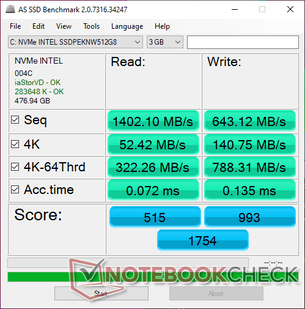
Nossa unidade vem configurada com 512 GB Intel 660p SSDPEKNW512G8 PCIe3 NVMe SSD para taxas teóricas máximas de leitura e escrita de apenas 1500 MB/s e 1000 MB/s, respectivamente, o que é aproximadamente 2x mais lento do que a série mais cara Samsung PM981a. O desempenho provavelmente será suficiente para o público alvo, especialmente dada a CPU ULV série U e GeForce MX gráficos com os quais o drive está emparelhado. Um espalhador de calor não é tão necessário para preservar o desempenho quando sob estresse, uma vez que a Intel 660p é apenas uma solução NVMe de médio alcance.

MDL 8
MDL 8
AS SSD
AS SSD
Apenas um único slot M.2 2280 PCIe3 x2, sem opções secundárias
Intel SSD 660p SSDPEKNW512G8
CDM 5/6 Read Seq Q32T1: 1599 MB/s
CDM 5/6 Write Seq Q32T1: 961 MB/s
CDM 5/6 Read 4K Q32T1: 338 MB/s
CDM 5/6 Write 4K Q32T1: 460.9 MB/s
CDM 5 Read Seq: 1381 MB/s
CDM 5 Write Seq: 906 MB/s
CDM 5/6 Read 4K: 55.6 MB/s
CDM 5/6 Write 4K: 139.1 MB/s
Drive Performance Rating - Percent
Asus VivoBook 15 Pro M3500QC-L1062
SK Hynix HFM512GD3JX013N
93.7 pt
Dell Inspiron 15 3501
Samsung PM991a MZ9LQ512HBLU-00BD1
69.7 pt
Lenovo IdeaPad 5 15ALC05
 
59.7 pt
Asus VivoBook S15 S533EQ-BQ002T
Intel SSD 660p 1TB SSDPEKNW010T8
57.7 pt
HP Pavilion 15-eg
Samsung PM991 MZVLQ1T0HALB
55.6 pt
Asus Vivobook 15 K513EQ
Intel SSD 660p SSDPEKNW512G8
42.1 pt
DiskSpd
seq read
Asus VivoBook 15 Pro M3500QC-L1062
SK Hynix HFM512GD3JX013N
2052 (1985.36min - 2051.76max) MB/s +48%
Dell Inspiron 15 3501
Samsung PM991a MZ9LQ512HBLU-00BD1
2002 (1988.53min - 2002.13max) MB/s +44%
Lenovo IdeaPad 5 15ALC05
 
1684 (1321.21min - 1684.01max) MB/s +21%
Asus VivoBook S15 S533EQ-BQ002T
Intel SSD 660p 1TB SSDPEKNW010T8
1492 (1475.35min - 1491.87max) MB/s +7%
Asus Vivobook 15 K513EQ
Intel SSD 660p SSDPEKNW512G8
1391 (1369.23min - 1391.19max) MB/s
HP Pavilion 15-eg
Samsung PM991 MZVLQ1T0HALB
1204 (1190.48min - 1203.56max) MB/s -13%
seq write
Asus VivoBook 15 Pro M3500QC-L1062
SK Hynix HFM512GD3JX013N
2885 (2677.74min - 2884.84max) MB/s +222%
Dell Inspiron 15 3501
Samsung PM991a MZ9LQ512HBLU-00BD1
1766 (1523.89min - 1766.01max) MB/s +97%
Asus VivoBook S15 S533EQ-BQ002T
Intel SSD 660p 1TB SSDPEKNW010T8
1679 (1675.83min - 1679.4max) MB/s +87%
Lenovo IdeaPad 5 15ALC05
 
1498 (987.97min - 1497.52max) MB/s +67%
HP Pavilion 15-eg
Samsung PM991 MZVLQ1T0HALB
1285 (1262.06min - 1284.72max) MB/s +43%
Asus Vivobook 15 K513EQ
Intel SSD 660p SSDPEKNW512G8
897 (879.46min - 896.63max) MB/s
seq q8 t1 read
Asus VivoBook 15 Pro M3500QC-L1062
SK Hynix HFM512GD3JX013N
3601 (1997.96min - 3600.81max) MB/s +128%
Dell Inspiron 15 3501
Samsung PM991a MZ9LQ512HBLU-00BD1
3028 (2891.34min - 3027.87max) MB/s +92%
Lenovo IdeaPad 5 15ALC05
 
2659 (2544.63min - 2659.19max) MB/s +69%
HP Pavilion 15-eg
Samsung PM991 MZVLQ1T0HALB
1896 (1728.26min - 1896.24max) MB/s +20%
Asus Vivobook 15 K513EQ
Intel SSD 660p SSDPEKNW512G8
1576 (1400.27min - 1576.42max) MB/s
Asus VivoBook S15 S533EQ-BQ002T
Intel SSD 660p 1TB SSDPEKNW010T8
1559 (1386.59min - 1559.47max) MB/s -1%
seq q8 t1 write
Asus VivoBook 15 Pro M3500QC-L1062
SK Hynix HFM512GD3JX013N
2980 (2751.88min - 2980.38max) MB/s +209%
Dell Inspiron 15 3501
Samsung PM991a MZ9LQ512HBLU-00BD1
1791 (1766.25min - 1791.37max) MB/s +86%
Asus VivoBook S15 S533EQ-BQ002T
Intel SSD 660p 1TB SSDPEKNW010T8
1761 (1742.73min - 1761.23max) MB/s +83%
Lenovo IdeaPad 5 15ALC05
 
1603 (1311.14min - 1603.48max) MB/s +66%
HP Pavilion 15-eg
Samsung PM991 MZVLQ1T0HALB
1473 (1467.38min - 1472.83max) MB/s +53%
Asus Vivobook 15 K513EQ
Intel SSD 660p SSDPEKNW512G8
964 (961.3min - 964.44max) MB/s
4k q1 t1 read
Asus VivoBook 15 Pro M3500QC-L1062
SK Hynix HFM512GD3JX013N
58.1 (58.04min - 58.14max) MB/s +6%
Asus VivoBook S15 S533EQ-BQ002T
Intel SSD 660p 1TB SSDPEKNW010T8
57.8 (57.3min - 57.83max) MB/s +5%
Asus Vivobook 15 K513EQ
Intel SSD 660p SSDPEKNW512G8
54.9 (54.55min - 54.85max) MB/s
Dell Inspiron 15 3501
Samsung PM991a MZ9LQ512HBLU-00BD1
53.4 (53.33min - 53.38max) MB/s -3%
HP Pavilion 15-eg
Samsung PM991 MZVLQ1T0HALB
46.4 (46.33min - 46.44max) MB/s -15%
Lenovo IdeaPad 5 15ALC05
 
46 (45.57min - 46.04max) MB/s -16%
4k q1 t1 write
Asus VivoBook S15 S533EQ-BQ002T
Intel SSD 660p 1TB SSDPEKNW010T8
218 (217.52min - 218.14max) MB/s +61%
Dell Inspiron 15 3501
Samsung PM991a MZ9LQ512HBLU-00BD1
183 (182.53min - 183.31max) MB/s +36%
HP Pavilion 15-eg
Samsung PM991 MZVLQ1T0HALB
146 (141.02min - 146.01max) MB/s +8%
Asus Vivobook 15 K513EQ
Intel SSD 660p SSDPEKNW512G8
135 (133.49min - 135.4max) MB/s
Lenovo IdeaPad 5 15ALC05
 
128 (127.16min - 128.1max) MB/s -5%
Asus VivoBook 15 Pro M3500QC-L1062
SK Hynix HFM512GD3JX013N
123 (122.83min - 123.2max) MB/s -9%
4k q32 t16 read
Asus VivoBook 15 Pro M3500QC-L1062
SK Hynix HFM512GD3JX013N
2227 (2222.18min - 2226.53max) MB/s +546%
Dell Inspiron 15 3501
Samsung PM991a MZ9LQ512HBLU-00BD1
1390 (1112.77min - 1390.48max) MB/s +303%
Lenovo IdeaPad 5 15ALC05
 
1068 (1065.87min - 1067.86max) MB/s +210%
HP Pavilion 15-eg
Samsung PM991 MZVLQ1T0HALB
730 (635.76min - 729.62max) MB/s +112%
Asus VivoBook S15 S533EQ-BQ002T
Intel SSD 660p 1TB SSDPEKNW010T8
658 (657.14min - 657.77max) MB/s +91%
Asus Vivobook 15 K513EQ
Intel SSD 660p SSDPEKNW512G8
345 (344.78min - 345.19max) MB/s
4k q32 t16 write
Asus VivoBook 15 Pro M3500QC-L1062
SK Hynix HFM512GD3JX013N
2331 (2324.12min - 2330.72max) MB/s +416%
Lenovo IdeaPad 5 15ALC05
 
1174 (961.12min - 1174.48max) MB/s +160%
Dell Inspiron 15 3501
Samsung PM991a MZ9LQ512HBLU-00BD1
1047 (943.06min - 1047.03max) MB/s +132%
Asus VivoBook S15 S533EQ-BQ002T
Intel SSD 660p 1TB SSDPEKNW010T8
911 (889.17min - 911.15max) MB/s +102%
Asus Vivobook 15 K513EQ
Intel SSD 660p SSDPEKNW512G8
452 (438.46min - 452.17max) MB/s
HP Pavilion 15-eg
Samsung PM991 MZVLQ1T0HALB
438 (405.4min - 437.99max) MB/s -3%
AS SSD
Score Total
Asus VivoBook 15 Pro M3500QC-L1062
SK Hynix HFM512GD3JX013N
5913 Points +237%
Dell Inspiron 15 3501
Samsung PM991a MZ9LQ512HBLU-00BD1
3672 Points +109%
Lenovo IdeaPad 5 15ALC05
 
3398 Points +94%
HP Pavilion 15-eg
Samsung PM991 MZVLQ1T0HALB
3149 Points +80%
Asus VivoBook S15 S533EQ-BQ002T
Intel SSD 660p 1TB SSDPEKNW010T8
2421 Points +38%
Asus Vivobook 15 K513EQ
Intel SSD 660p SSDPEKNW512G8
1754 Points
Score Read
Asus VivoBook 15 Pro M3500QC-L1062
SK Hynix HFM512GD3JX013N
2252 Points +337%
Dell Inspiron 15 3501
Samsung PM991a MZ9LQ512HBLU-00BD1
1560 Points +203%
Lenovo IdeaPad 5 15ALC05
 
1383 Points +169%
HP Pavilion 15-eg
Samsung PM991 MZVLQ1T0HALB
1348 Points +162%
Asus VivoBook S15 S533EQ-BQ002T
Intel SSD 660p 1TB SSDPEKNW010T8
815 Points +58%
Asus Vivobook 15 K513EQ
Intel SSD 660p SSDPEKNW512G8
515 Points
Score Write
Asus VivoBook 15 Pro M3500QC-L1062
SK Hynix HFM512GD3JX013N
2524 Points +154%
Lenovo IdeaPad 5 15ALC05
 
1351 Points +36%
Dell Inspiron 15 3501
Samsung PM991a MZ9LQ512HBLU-00BD1
1345 Points +35%
Asus VivoBook S15 S533EQ-BQ002T
Intel SSD 660p 1TB SSDPEKNW010T8
1182 Points +19%
HP Pavilion 15-eg
Samsung PM991 MZVLQ1T0HALB
1155 Points +16%
Asus Vivobook 15 K513EQ
Intel SSD 660p SSDPEKNW512G8
993 Points
Seq Read
Asus VivoBook 15 Pro M3500QC-L1062
SK Hynix HFM512GD3JX013N
3142 MB/s +124%
Dell Inspiron 15 3501
Samsung PM991a MZ9LQ512HBLU-00BD1
2596 MB/s +85%
Lenovo IdeaPad 5 15ALC05
 
2549 MB/s +82%
HP Pavilion 15-eg
Samsung PM991 MZVLQ1T0HALB
2030 MB/s +45%
Asus VivoBook S15 S533EQ-BQ002T
Intel SSD 660p 1TB SSDPEKNW010T8
1754 MB/s +25%
Asus Vivobook 15 K513EQ
Intel SSD 660p SSDPEKNW512G8
1402 MB/s
Seq Write
Asus VivoBook 15 Pro M3500QC-L1062
SK Hynix HFM512GD3JX013N
2806 MB/s +336%
Dell Inspiron 15 3501
Samsung PM991a MZ9LQ512HBLU-00BD1
1847 MB/s +187%
Lenovo IdeaPad 5 15ALC05
 
1571 MB/s +144%
Asus VivoBook S15 S533EQ-BQ002T
Intel SSD 660p 1TB SSDPEKNW010T8
1567 MB/s +144%
HP Pavilion 15-eg
Samsung PM991 MZVLQ1T0HALB
1003 MB/s +56%
Asus Vivobook 15 K513EQ
Intel SSD 660p SSDPEKNW512G8
643 MB/s
4K Read
Asus VivoBook 15 Pro M3500QC-L1062
SK Hynix HFM512GD3JX013N
54.4 MB/s +4%
Asus VivoBook S15 S533EQ-BQ002T
Intel SSD 660p 1TB SSDPEKNW010T8
53 MB/s +1%
Asus Vivobook 15 K513EQ
Intel SSD 660p SSDPEKNW512G8
52.4 MB/s
Dell Inspiron 15 3501
Samsung PM991a MZ9LQ512HBLU-00BD1
48.12 MB/s -8%
HP Pavilion 15-eg
Samsung PM991 MZVLQ1T0HALB
46.74 MB/s -11%
Lenovo IdeaPad 5 15ALC05
 
41.92 MB/s -20%
4K Write
Asus VivoBook S15 S533EQ-BQ002T
Intel SSD 660p 1TB SSDPEKNW010T8
167.9 MB/s +19%
HP Pavilion 15-eg
Samsung PM991 MZVLQ1T0HALB
164.2 MB/s +17%
Dell Inspiron 15 3501
Samsung PM991a MZ9LQ512HBLU-00BD1
147.8 MB/s +5%
Asus Vivobook 15 K513EQ
Intel SSD 660p SSDPEKNW512G8
140.8 MB/s
Asus VivoBook 15 Pro M3500QC-L1062
SK Hynix HFM512GD3JX013N
125 MB/s -11%
Lenovo IdeaPad 5 15ALC05
 
110.3 MB/s -22%
4K-64 Read
Asus VivoBook 15 Pro M3500QC-L1062
SK Hynix HFM512GD3JX013N
1884 MB/s +485%
Dell Inspiron 15 3501
Samsung PM991a MZ9LQ512HBLU-00BD1
1253 MB/s +289%
HP Pavilion 15-eg
Samsung PM991 MZVLQ1T0HALB
1098 MB/s +241%
Lenovo IdeaPad 5 15ALC05
 
1086 MB/s +237%
Asus VivoBook S15 S533EQ-BQ002T
Intel SSD 660p 1TB SSDPEKNW010T8
586 MB/s +82%
Asus Vivobook 15 K513EQ
Intel SSD 660p SSDPEKNW512G8
322.3 MB/s
4K-64 Write
Asus VivoBook 15 Pro M3500QC-L1062
SK Hynix HFM512GD3JX013N
2118 MB/s +169%
Lenovo IdeaPad 5 15ALC05
 
1083 MB/s +37%
Dell Inspiron 15 3501
Samsung PM991a MZ9LQ512HBLU-00BD1
1012 MB/s +28%
HP Pavilion 15-eg
Samsung PM991 MZVLQ1T0HALB
891 MB/s +13%
Asus VivoBook S15 S533EQ-BQ002T
Intel SSD 660p 1TB SSDPEKNW010T8
858 MB/s +9%
Asus Vivobook 15 K513EQ
Intel SSD 660p SSDPEKNW512G8
788 MB/s
Access Time Read
Lenovo IdeaPad 5 15ALC05
 
0.119 ms * -65%
Asus VivoBook S15 S533EQ-BQ002T
Intel SSD 660p 1TB SSDPEKNW010T8
0.097 ms * -35%
Dell Inspiron 15 3501
Samsung PM991a MZ9LQ512HBLU-00BD1
0.079 ms * -10%
Asus Vivobook 15 K513EQ
Intel SSD 660p SSDPEKNW512G8
0.072 ms *
HP Pavilion 15-eg
Samsung PM991 MZVLQ1T0HALB
0.053 ms * +26%
Asus VivoBook 15 Pro M3500QC-L1062
SK Hynix HFM512GD3JX013N
0.032 ms * +56%
Access Time Write
Asus Vivobook 15 K513EQ
Intel SSD 660p SSDPEKNW512G8
0.135 ms *
HP Pavilion 15-eg
Samsung PM991 MZVLQ1T0HALB
0.062 ms * +54%
Asus VivoBook S15 S533EQ-BQ002T
Intel SSD 660p 1TB SSDPEKNW010T8
0.038 ms * +72%
Lenovo IdeaPad 5 15ALC05
 
0.034 ms * +75%
Asus VivoBook 15 Pro M3500QC-L1062
SK Hynix HFM512GD3JX013N
0.031 ms * +77%
Dell Inspiron 15 3501
Samsung PM991a MZ9LQ512HBLU-00BD1
0.026 ms * +81%

* ... smaller is better

Disk Throttling: DiskSpd Read Loop, Queue Depth 8

No graph data

GPU Performance - Iris Xe vs. GeForce MX350

O desempenho gráfico é onde esperamos que seja relativo a outros laptops equipados com o mesmo GeForce MX350 GPU. A Intel integra a concorrência Iris Xe a plataforma vem melhorando constantemente ao longo do tempo em termos de pilotos e suporte a jogos, ao ponto de estar agora, na maior parte dos casos, no pescoço com a GPU Nvidia. GTA V e DOTA 2 Reborn são duas notáveis exceções onde nosso Vivobook GeForce-powered Vivobook ainda teria notáveis vantagens de desempenho sobre Iris Xe.

Atualização a partir do MX330 para o MX350 irá aumentar o desempenho em cerca de 15 a 20 por cento.

3DMark 11
3DMark 11
Cloud Gate
Cloud Gate
Time Spy
Time Spy
Fire Strike
Fire Strike
Fire Strike Ultra
Fire Strike Ultra
 
3DMark
1920x1080 Fire Strike Graphics
Asus VivoBook 15 Pro M3500QC-L1062
NVIDIA GeForce RTX 3050 4GB Laptop GPU, AMD Ryzen 5 5600H
10497 Points +133%
Asus ZenBook 15 UX534FT-DB77
NVIDIA GeForce GTX 1650 Max-Q, Intel Core i7-8565U
7593 Points +69%
VAIO SX14 VJS144X0111K
Intel Iris Xe Graphics G7 96EUs, Intel Core i7-1195G7
5661 Points +26%
HP Pavilion 15-eg
NVIDIA GeForce MX450, Intel Core i7-1165G7
4753 Points +6%
MSI Summit B15 A11M
Intel Iris Xe Graphics G7 96EUs, Intel Core i7-1165G7
4644 Points +3%
Asus Vivobook 15 K513EQ
NVIDIA GeForce MX350, Intel Core i7-1165G7
4496 Points
Average NVIDIA GeForce MX350
  (3999 - 4656, n=14)
4390 Points -2%
HP Pavilion x360 15-er0155ng
Intel Iris Xe Graphics G7 80EUs, Intel Core i5-1135G7
4126 Points -8%
Microsoft Surface Laptop 4 15 AMD TFF_00028
AMD Radeon RX Vega 8 (Ryzen 4000/5000), AMD Ryzen 7 4980U
3860 Points -14%
HP Envy 17t-cg000
NVIDIA GeForce MX330, Intel Core i7-1065G7
3762 Points -16%
Lenovo ThinkPad E15 G3-20YG003UGE
AMD Radeon RX Vega 8 (Ryzen 4000/5000), AMD Ryzen 7 5700U
3516 Points -22%
HP Pavilion Aero 13 be0097nr
AMD Radeon RX Vega 8 (Ryzen 4000/5000), AMD Ryzen 7 5800U
3399 Points -24%
Lenovo IdeaPad 5 15ALC05
AMD Radeon RX Vega 7, AMD Ryzen 5 5500U
3395 Points -24%
Microsoft Surface Laptop 3 15 i7-1065G7
Intel Iris Plus Graphics G7 (Ice Lake 64 EU), Intel Core i7-1065G7
3062 Points -32%
HP 250 G7-15S40ES
NVIDIA GeForce MX110, Intel Core i5-1035G1
1666 Points -63%
2560x1440 Time Spy Graphics
Asus VivoBook 15 Pro M3500QC-L1062
NVIDIA GeForce RTX 3050 4GB Laptop GPU, AMD Ryzen 5 5600H
3931 Points +195%
Asus ZenBook 15 UX534FT-DB77
NVIDIA GeForce GTX 1650 Max-Q, Intel Core i7-8565U
2836 Points +113%
HP Pavilion 15-eg
NVIDIA GeForce MX450, Intel Core i7-1165G7
1945 Points +46%
VAIO SX14 VJS144X0111K
Intel Iris Xe Graphics G7 96EUs, Intel Core i7-1195G7
1819 Points +36%
MSI Summit B15 A11M
Intel Iris Xe Graphics G7 96EUs, Intel Core i7-1165G7
1406 Points +5%
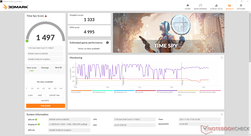
Asus Vivobook 15 K513EQ
NVIDIA GeForce MX350, Intel Core i7-1165G7
1333 Points
Average NVIDIA GeForce MX350
  (1123 - 1595, n=12)
1322 Points -1%
HP Pavilion x360 15-er0155ng
Intel Iris Xe Graphics G7 80EUs, Intel Core i5-1135G7
1276 Points -4%
HP Envy 17t-cg000
NVIDIA GeForce MX330, Intel Core i7-1065G7
1160 Points -13%
Microsoft Surface Laptop 4 15 AMD TFF_00028
AMD Radeon RX Vega 8 (Ryzen 4000/5000), AMD Ryzen 7 4980U
1135 Points -15%
HP Pavilion Aero 13 be0097nr
AMD Radeon RX Vega 8 (Ryzen 4000/5000), AMD Ryzen 7 5800U
1128 Points -15%
Lenovo ThinkPad E15 G3-20YG003UGE
AMD Radeon RX Vega 8 (Ryzen 4000/5000), AMD Ryzen 7 5700U
1118 Points -16%
Lenovo IdeaPad 5 15ALC05
AMD Radeon RX Vega 7, AMD Ryzen 5 5500U
1057 Points -21%
Microsoft Surface Laptop 3 15 i7-1065G7
Intel Iris Plus Graphics G7 (Ice Lake 64 EU), Intel Core i7-1065G7
847 Points -36%
HP 250 G7-15S40ES
NVIDIA GeForce MX110, Intel Core i5-1035G1
437 Points -67%
2560x1440 Time Spy Score
Asus VivoBook 15 Pro M3500QC-L1062
NVIDIA GeForce RTX 3050 4GB Laptop GPU, AMD Ryzen 5 5600H
4118 Points +175%
Asus ZenBook 15 UX534FT-DB77
NVIDIA GeForce GTX 1650 Max-Q, Intel Core i7-8565U
2949 Points +97%
HP Pavilion 15-eg
NVIDIA GeForce MX450, Intel Core i7-1165G7
2103 Points +40%
VAIO SX14 VJS144X0111K
Intel Iris Xe Graphics G7 96EUs, Intel Core i7-1195G7
2029 Points +36%
MSI Summit B15 A11M
Intel Iris Xe Graphics G7 96EUs, Intel Core i7-1165G7
1577 Points +5%
Asus Vivobook 15 K513EQ
NVIDIA GeForce MX350, Intel Core i7-1165G7
1497 Points
Average NVIDIA GeForce MX350
  (1219 - 1752, n=12)
1465 Points -2%
HP Pavilion x360 15-er0155ng
Intel Iris Xe Graphics G7 80EUs, Intel Core i5-1135G7
1419 Points -5%
HP Envy 17t-cg000
NVIDIA GeForce MX330, Intel Core i7-1065G7
1293 Points -14%
Microsoft Surface Laptop 4 15 AMD TFF_00028
AMD Radeon RX Vega 8 (Ryzen 4000/5000), AMD Ryzen 7 4980U
1291 Points -14%
HP Pavilion Aero 13 be0097nr
AMD Radeon RX Vega 8 (Ryzen 4000/5000), AMD Ryzen 7 5800U
1283 Points -14%
Lenovo ThinkPad E15 G3-20YG003UGE
AMD Radeon RX Vega 8 (Ryzen 4000/5000), AMD Ryzen 7 5700U
1274 Points -15%
Lenovo IdeaPad 5 15ALC05
AMD Radeon RX Vega 7, AMD Ryzen 5 5500U
1200 Points -20%
Microsoft Surface Laptop 3 15 i7-1065G7
Intel Iris Plus Graphics G7 (Ice Lake 64 EU), Intel Core i7-1065G7
960 Points -36%
HP 250 G7-15S40ES
NVIDIA GeForce MX110, Intel Core i5-1035G1
500 Points -67%
3DMark 11 - 1280x720 Performance GPU
Asus VivoBook 15 Pro M3500QC-L1062
NVIDIA GeForce RTX 3050 4GB Laptop GPU, AMD Ryzen 5 5600H
13643 Points +117%
Asus ZenBook 15 UX534FT-DB77
NVIDIA GeForce GTX 1650 Max-Q, Intel Core i7-8565U
10761 Points +71%
HP Pavilion 15-eg
NVIDIA GeForce MX450, Intel Core i7-1165G7
8204 Points +30%
VAIO SX14 VJS144X0111K
Intel Iris Xe Graphics G7 96EUs, Intel Core i7-1195G7
6860 Points +9%
MSI Summit B15 A11M
Intel Iris Xe Graphics G7 96EUs, Intel Core i7-1165G7
6550 Points +4%
Asus Vivobook 15 K513EQ
NVIDIA GeForce MX350, Intel Core i7-1165G7
6293 Points
Microsoft Surface Laptop 4 15 AMD TFF_00028
AMD Radeon RX Vega 8 (Ryzen 4000/5000), AMD Ryzen 7 4980U
6275 Points 0%
Average NVIDIA GeForce MX350
  (5191 - 6540, n=13)
6142 Points -2%
HP Pavilion Aero 13 be0097nr
AMD Radeon RX Vega 8 (Ryzen 4000/5000), AMD Ryzen 7 5800U
5842 Points -7%
HP Pavilion x360 15-er0155ng
Intel Iris Xe Graphics G7 80EUs, Intel Core i5-1135G7
5751 Points -9%
Lenovo ThinkPad E15 G3-20YG003UGE
AMD Radeon RX Vega 8 (Ryzen 4000/5000), AMD Ryzen 7 5700U
5667 Points -10%
Lenovo IdeaPad 5 15ALC05
AMD Radeon RX Vega 7, AMD Ryzen 5 5500U
5257 Points -16%
HP Envy 17t-cg000
NVIDIA GeForce MX330, Intel Core i7-1065G7
4839 Points -23%
Microsoft Surface Laptop 3 15 i7-1065G7
Intel Iris Plus Graphics G7 (Ice Lake 64 EU), Intel Core i7-1065G7
4612 Points -27%
HP 250 G7-15S40ES
NVIDIA GeForce MX110, Intel Core i5-1035G1
2115 Points -66%
3DMark 11 Performance
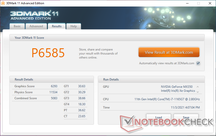
6585 pontos
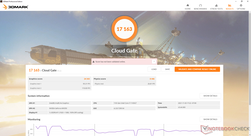
3DMark Cloud Gate Standard Score
17163 pontos
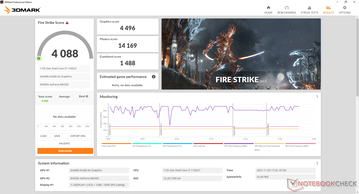
3DMark Fire Strike Score
4088 pontos
3DMark Time Spy Score
1497 pontos
Ajuda
Final Fantasy XV Benchmark
1280x720 Lite Quality
Asus Vivobook 15 K513EQ
Intel Core i7-1165G7, NVIDIA GeForce MX350
48.6 fps
VAIO SX14 VJS144X0111K
Intel Core i7-1195G7, Intel Iris Xe Graphics G7 96EUs
45.3 fps -7%
Average NVIDIA GeForce MX350
  (36.5 - 49.2, n=5)
44.8 fps -8%
Lenovo ThinkPad E15 G3-20YG003UGE
AMD Ryzen 7 5700U, AMD Radeon RX Vega 8 (Ryzen 4000/5000)
33.2 fps -32%
HP Pavilion Aero 13 be0097nr
AMD Ryzen 7 5800U, AMD Radeon RX Vega 8 (Ryzen 4000/5000)
33.1 fps -32%
HP Pavilion x360 15-er0155ng
Intel Core i5-1135G7, Intel Iris Xe Graphics G7 80EUs
31 fps -36%
1920x1080 Standard Quality
VAIO SX14 VJS144X0111K
Intel Core i7-1195G7, Intel Iris Xe Graphics G7 96EUs
24.6 fps +7%
Asus Vivobook 15 K513EQ
Intel Core i7-1165G7, NVIDIA GeForce MX350
23 fps
Average NVIDIA GeForce MX350
  (20.4 - 23.9, n=5)
22.4 fps -3%
HP Pavilion x360 15-er0155ng
Intel Core i5-1135G7, Intel Iris Xe Graphics G7 80EUs
17.4 fps -24%
Lenovo ThinkPad E15 G3-20YG003UGE
AMD Ryzen 7 5700U, AMD Radeon RX Vega 8 (Ryzen 4000/5000)
16.9 fps -27%
HP Pavilion Aero 13 be0097nr
AMD Ryzen 7 5800U, AMD Radeon RX Vega 8 (Ryzen 4000/5000)
16.6 fps -28%
1920x1080 High Quality
VAIO SX14 VJS144X0111K
Intel Core i7-1195G7, Intel Iris Xe Graphics G7 96EUs
17.2 fps +19%
Asus Vivobook 15 K513EQ
Intel Core i7-1165G7, NVIDIA GeForce MX350
14.5 fps
Average NVIDIA GeForce MX350
  (10.7 - 15.1, n=5)
13.8 fps -5%
HP Pavilion x360 15-er0155ng
Intel Core i5-1135G7, Intel Iris Xe Graphics G7 80EUs
13.4 fps -8%
HP Pavilion Aero 13 be0097nr
AMD Ryzen 7 5800U, AMD Radeon RX Vega 8 (Ryzen 4000/5000)
12 fps -17%
Lenovo ThinkPad E15 G3-20YG003UGE
AMD Ryzen 7 5700U, AMD Radeon RX Vega 8 (Ryzen 4000/5000)
11.4 fps -21%
The Witcher 3
1024x768 Low Graphics & Postprocessing
Asus ZenBook 15 UX534FT-DB77
Intel Core i7-8565U, NVIDIA GeForce GTX 1650 Max-Q
156.1 fps +82%
MSI Prestige 15 A10SC
Intel Core i7-10710U, NVIDIA GeForce GTX 1650 Max-Q
155.4 fps +81%
VAIO SX14 VJS144X0111K
Intel Core i7-1195G7, Intel Iris Xe Graphics G7 96EUs
95.8 (45min) fps +11%
Asus Vivobook 15 K513EQ
Intel Core i7-1165G7, NVIDIA GeForce MX350
86 (81min) fps
Average NVIDIA GeForce MX350
  (54.9 - 86, n=12)
77.3 fps -10%
HP Pavilion Aero 13 be0097nr
AMD Ryzen 7 5800U, AMD Radeon RX Vega 8 (Ryzen 4000/5000)
73.4 (66min) fps -15%
HP Pavilion x360 15-er0155ng
Intel Core i5-1135G7, Intel Iris Xe Graphics G7 80EUs
71.4 (33.2min, 38.3P0.1, 53.4P1) fps -17%
Microsoft Surface Laptop 4 15 AMD TFF_00028
AMD Ryzen 7 4980U, AMD Radeon RX Vega 8 (Ryzen 4000/5000)
70.6 fps -18%
Lenovo ThinkPad E15 G3-20YG003UGE
AMD Ryzen 7 5700U, AMD Radeon RX Vega 8 (Ryzen 4000/5000)
64 fps -26%
Lenovo ThinkPad P15s Gen1-20T4000JGE
Intel Core i7-10510U, NVIDIA Quadro P520
61.9 (37min) fps -28%
Microsoft Surface Laptop 3 15 i7-1065G7
Intel Core i7-1065G7, Intel Iris Plus Graphics G7 (Ice Lake 64 EU)
56.4 fps -34%
1366x768 Medium Graphics & Postprocessing
MSI Prestige 15 A10SC
Intel Core i7-10710U, NVIDIA GeForce GTX 1650 Max-Q
94.1 fps +94%
Asus ZenBook 15 UX534FT-DB77
Intel Core i7-8565U, NVIDIA GeForce GTX 1650 Max-Q
93.6 fps +93%
VAIO SX14 VJS144X0111K
Intel Core i7-1195G7, Intel Iris Xe Graphics G7 96EUs
57.5 (54min) fps +18%
Asus Vivobook 15 K513EQ
Intel Core i7-1165G7, NVIDIA GeForce MX350
48.6 (46min) fps
HP Pavilion x360 15-er0155ng
Intel Core i5-1135G7, Intel Iris Xe Graphics G7 80EUs
47.7 (3.46min, 12.3P0.1, 32.1P1) fps -2%
Average NVIDIA GeForce MX350
  (35.2 - 51.9, n=13)
45.2 fps -7%
Microsoft Surface Laptop 4 15 AMD TFF_00028
AMD Ryzen 7 4980U, AMD Radeon RX Vega 8 (Ryzen 4000/5000)
44.4 fps -9%
Microsoft Surface Laptop 3 15 i7-1065G7
Intel Core i7-1065G7, Intel Iris Plus Graphics G7 (Ice Lake 64 EU)
36.8 fps -24%
Lenovo ThinkPad P15s Gen1-20T4000JGE
Intel Core i7-10510U, NVIDIA Quadro P520
26.3 (16min) fps -46%
1920x1080 High Graphics & Postprocessing (Nvidia HairWorks Off)
MSI Prestige 15 A10SC
Intel Core i7-10710U, NVIDIA GeForce GTX 1650 Max-Q
54.8 fps +83%
Asus ZenBook 15 UX534FT-DB77
Intel Core i7-8565U, NVIDIA GeForce GTX 1650 Max-Q
54.3 fps +82%
VAIO SX14 VJS144X0111K
Intel Core i7-1195G7, Intel Iris Xe Graphics G7 96EUs
36.6 (33min) fps +22%
Asus Vivobook 15 K513EQ
Intel Core i7-1165G7, NVIDIA GeForce MX350
29.9 (27min) fps
Average NVIDIA GeForce MX350
  (20.6 - 29.9, n=13)
26.3 fps -12%
HP Pavilion x360 15-er0155ng
Intel Core i5-1135G7, Intel Iris Xe Graphics G7 80EUs
25.9 (13.2min, 13.3P0.1, 13.9P1) fps -13%
HP Pavilion Aero 13 be0097nr
AMD Ryzen 7 5800U, AMD Radeon RX Vega 8 (Ryzen 4000/5000)
23.4 (22min) fps -22%
Lenovo ThinkPad E15 G3-20YG003UGE
AMD Ryzen 7 5700U, AMD Radeon RX Vega 8 (Ryzen 4000/5000)
20.4 fps -32%
Microsoft Surface Laptop 3 15 i7-1065G7
Intel Core i7-1065G7, Intel Iris Plus Graphics G7 (Ice Lake 64 EU)
20.1 fps -33%
Lenovo ThinkPad P15s Gen1-20T4000JGE
Intel Core i7-10510U, NVIDIA Quadro P520
18.7 (15min) fps -37%
Microsoft Surface Laptop 4 15 AMD TFF_00028
AMD Ryzen 7 4980U, AMD Radeon RX Vega 8 (Ryzen 4000/5000)
18.4 fps -38%
1920x1080 Ultra Graphics & Postprocessing (HBAO+)
MSI Prestige 15 A10SC
Intel Core i7-10710U, NVIDIA GeForce GTX 1650 Max-Q
30.8 fps +84%
Asus ZenBook 15 UX534FT-DB77
Intel Core i7-8565U, NVIDIA GeForce GTX 1650 Max-Q
30.7 fps +84%
VAIO SX14 VJS144X0111K
Intel Core i7-1195G7, Intel Iris Xe Graphics G7 96EUs
17.3 (13min) fps +4%
Asus Vivobook 15 K513EQ
Intel Core i7-1165G7, NVIDIA GeForce MX350
16.7 (14min) fps
HP Pavilion Aero 13 be0097nr
AMD Ryzen 7 5800U, AMD Radeon RX Vega 8 (Ryzen 4000/5000)
15.4 (14min) fps -8%
Average NVIDIA GeForce MX350
  (10.1 - 17.5, n=12)
15.4 fps -8%
Microsoft Surface Laptop 4 15 AMD TFF_00028
AMD Ryzen 7 4980U, AMD Radeon RX Vega 8 (Ryzen 4000/5000)
13.6 fps -19%
HP Pavilion x360 15-er0155ng
Intel Core i5-1135G7, Intel Iris Xe Graphics G7 80EUs
13.6 (6.66min, 6.67P0.1, 6.96P1) fps -19%
Lenovo ThinkPad E15 G3-20YG003UGE
AMD Ryzen 7 5700U, AMD Radeon RX Vega 8 (Ryzen 4000/5000)
13.4 (12min, 12P1) fps -20%
Microsoft Surface Laptop 3 15 i7-1065G7
Intel Core i7-1065G7, Intel Iris Plus Graphics G7 (Ice Lake 64 EU)
10 fps -40%
Far Cry 5
1280x720 Low Preset AA:T
VAIO SX14 VJS144X0111K
Intel Core i7-1195G7, Intel Iris Xe Graphics G7 96EUs
60 (53min) fps +2%
Average NVIDIA GeForce MX350
  (58 - 64, n=7)
59.3 fps +1%
Asus Vivobook 15 K513EQ
Intel Core i7-1165G7, NVIDIA GeForce MX350
59 (49min) fps
Microsoft Surface Laptop 4 15 AMD TFF_00028
AMD Ryzen 7 4980U, AMD Radeon RX Vega 8 (Ryzen 4000/5000)
42 fps -29%
HP Pavilion Aero 13 be0097nr
AMD Ryzen 7 5800U, AMD Radeon RX Vega 8 (Ryzen 4000/5000)
42 (34min) fps -29%
HP 250 G7-15S40ES
Intel Core i5-1035G1, NVIDIA GeForce MX110
22 fps -63%
1920x1080 Low Preset AA:T
Average NVIDIA GeForce MX350
  (32 - 34, n=3)
33.3 fps +4%
VAIO SX14 VJS144X0111K
Intel Core i7-1195G7, Intel Iris Xe Graphics G7 96EUs
33 (29min) fps +3%
Asus Vivobook 15 K513EQ
Intel Core i7-1165G7, NVIDIA GeForce MX350
32 (29min) fps
HP Pavilion Aero 13 be0097nr
AMD Ryzen 7 5800U, AMD Radeon RX Vega 8 (Ryzen 4000/5000)
22 (16min) fps -31%
HP 250 G7-15S40ES
Intel Core i5-1035G1, NVIDIA GeForce MX110
12 fps -62%
1920x1080 Medium Preset AA:T
VAIO SX14 VJS144X0111K
Intel Core i7-1195G7, Intel Iris Xe Graphics G7 96EUs
32 (28min) fps +23%
Average NVIDIA GeForce MX350
  (24 - 30, n=7)
27 fps +4%
Asus Vivobook 15 K513EQ
Intel Core i7-1165G7, NVIDIA GeForce MX350
26 (22min) fps
HP Pavilion Aero 13 be0097nr
AMD Ryzen 7 5800U, AMD Radeon RX Vega 8 (Ryzen 4000/5000)
20 (18min) fps -23%
Microsoft Surface Laptop 4 15 AMD TFF_00028
AMD Ryzen 7 4980U, AMD Radeon RX Vega 8 (Ryzen 4000/5000)
19 fps -27%
HP 250 G7-15S40ES
Intel Core i5-1035G1, NVIDIA GeForce MX110
10 fps -62%
1920x1080 High Preset AA:T
VAIO SX14 VJS144X0111K
Intel Core i7-1195G7, Intel Iris Xe Graphics G7 96EUs
30 (27min) fps +30%
Asus Vivobook 15 K513EQ
Intel Core i7-1165G7, NVIDIA GeForce MX350
23 (19min) fps
Average NVIDIA GeForce MX350
  (22 - 25, n=7)
23 fps 0%
HP Pavilion Aero 13 be0097nr
AMD Ryzen 7 5800U, AMD Radeon RX Vega 8 (Ryzen 4000/5000)
18 (16min) fps -22%
HP 250 G7-15S40ES
Intel Core i5-1035G1, NVIDIA GeForce MX110
9 fps -61%
1920x1080 Ultra Preset AA:T
VAIO SX14 VJS144X0111K
Intel Core i7-1195G7, Intel Iris Xe Graphics G7 96EUs
27 (24min) fps +23%
Asus Vivobook 15 K513EQ
Intel Core i7-1165G7, NVIDIA GeForce MX350
22 (16min) fps
Average NVIDIA GeForce MX350
  (20 - 22, n=6)
21 fps -5%
HP Pavilion Aero 13 be0097nr
AMD Ryzen 7 5800U, AMD Radeon RX Vega 8 (Ryzen 4000/5000)
17 (15min) fps -23%
HP 250 G7-15S40ES
Intel Core i5-1035G1, NVIDIA GeForce MX110
8 fps -64%
X-Plane 11.11
1280x720 low (fps_test=1)
Average NVIDIA GeForce MX350
  (49.1 - 90.8, n=14)
68.1 fps +2%
Asus Vivobook 15 K513EQ
Intel Core i7-1165G7, NVIDIA GeForce MX350
66.7 fps
Lenovo ThinkPad P15s Gen1-20T4000JGE
Intel Core i7-10510U, NVIDIA Quadro P520
64.5 fps -3%
HP Pavilion Aero 13 be0097nr
AMD Ryzen 7 5800U, AMD Radeon RX Vega 8 (Ryzen 4000/5000)
44.4 fps -33%
VAIO SX14 VJS144X0111K
Intel Core i7-1195G7, Intel Iris Xe Graphics G7 96EUs
43.7 fps -34%
Lenovo ThinkPad E15 G3-20YG003UGE
AMD Ryzen 7 5700U, AMD Radeon RX Vega 8 (Ryzen 4000/5000)
43.4 fps -35%
HP 250 G7-15S40ES
Intel Core i5-1035G1, NVIDIA GeForce MX110
42.2 fps -37%
HP Pavilion x360 15-er0155ng
Intel Core i5-1135G7, Intel Iris Xe Graphics G7 80EUs
40.6 fps -39%
Microsoft Surface Laptop 4 15 AMD TFF_00028
AMD Ryzen 7 4980U, AMD Radeon RX Vega 8 (Ryzen 4000/5000)
40.4 fps -39%
1920x1080 med (fps_test=2)
Asus Vivobook 15 K513EQ
Intel Core i7-1165G7, NVIDIA GeForce MX350
62.7 fps
Average NVIDIA GeForce MX350
  (35.5 - 72.3, n=14)
55.9 fps -11%
VAIO SX14 VJS144X0111K
Intel Core i7-1195G7, Intel Iris Xe Graphics G7 96EUs
38.5 fps -39%
HP Pavilion x360 15-er0155ng
Intel Core i5-1135G7, Intel Iris Xe Graphics G7 80EUs
34.4 fps -45%
Lenovo ThinkPad E15 G3-20YG003UGE
AMD Ryzen 7 5700U, AMD Radeon RX Vega 8 (Ryzen 4000/5000)
33.3 fps -47%
HP Pavilion Aero 13 be0097nr
AMD Ryzen 7 5800U, AMD Radeon RX Vega 8 (Ryzen 4000/5000)
32.8 fps -48%
Microsoft Surface Laptop 4 15 AMD TFF_00028
AMD Ryzen 7 4980U, AMD Radeon RX Vega 8 (Ryzen 4000/5000)
32.3 fps -48%
HP 250 G7-15S40ES
Intel Core i5-1035G1, NVIDIA GeForce MX110
25.2 fps -60%
Lenovo ThinkPad P15s Gen1-20T4000JGE
Intel Core i7-10510U, NVIDIA Quadro P520
24.5 fps -61%
1920x1080 high (fps_test=3)
Asus Vivobook 15 K513EQ
Intel Core i7-1165G7, NVIDIA GeForce MX350
53.9 fps
Average NVIDIA GeForce MX350
  (30.2 - 63.7, n=14)
48 fps -11%
VAIO SX14 VJS144X0111K
Intel Core i7-1195G7, Intel Iris Xe Graphics G7 96EUs
34.1 fps -37%
HP Pavilion x360 15-er0155ng
Intel Core i5-1135G7, Intel Iris Xe Graphics G7 80EUs
31 fps -42%
HP Pavilion Aero 13 be0097nr
AMD Ryzen 7 5800U, AMD Radeon RX Vega 8 (Ryzen 4000/5000)
29.7 fps -45%
Lenovo ThinkPad E15 G3-20YG003UGE
AMD Ryzen 7 5700U, AMD Radeon RX Vega 8 (Ryzen 4000/5000)
29.6 fps -45%
Microsoft Surface Laptop 4 15 AMD TFF_00028
AMD Ryzen 7 4980U, AMD Radeon RX Vega 8 (Ryzen 4000/5000)
27.3 fps -49%
HP 250 G7-15S40ES
Intel Core i5-1035G1, NVIDIA GeForce MX110
23.6 fps -56%
Lenovo ThinkPad P15s Gen1-20T4000JGE
Intel Core i7-10510U, NVIDIA Quadro P520
18.4 fps -66%
GTA V
1024x768 Lowest Settings possible
Average NVIDIA GeForce MX350
  (141 - 156, n=3)
147.7 fps +5%
Asus Vivobook 15 K513EQ
Intel Core i7-1165G7, NVIDIA GeForce MX350
141 (8.38min, 83.3P1) fps
VAIO SX14 VJS144X0111K
Intel Core i7-1195G7, Intel Iris Xe Graphics G7 96EUs
113 (19.9min, 71.4P1) fps -20%
HP Pavilion Aero 13 be0097nr
AMD Ryzen 7 5800U, AMD Radeon RX Vega 8 (Ryzen 4000/5000)
93.8 (12.8min, 62.5P1) fps -33%
Lenovo ThinkPad E15 G3-20YG003UGE
AMD Ryzen 7 5700U, AMD Radeon RX Vega 8 (Ryzen 4000/5000)
86.7 (30.7min, 58.8P1) fps -39%
HP 250 G7-15S40ES
Intel Core i5-1035G1, NVIDIA GeForce MX110
86 fps -39%
HP Pavilion x360 15-er0155ng
Intel Core i5-1135G7, Intel Iris Xe Graphics G7 80EUs
85.9 (13.4min, 55.6P1) fps -39%
1920x1080 Lowest Settings possible
Average NVIDIA GeForce MX350
  (86.9 - 108.5, n=2)
97.7 fps +12%
VAIO SX14 VJS144X0111K
Intel Core i7-1195G7, Intel Iris Xe Graphics G7 96EUs
93.5 (18.8min, 62.5P1) fps +8%
Asus Vivobook 15 K513EQ
Intel Core i7-1165G7, NVIDIA GeForce MX350
86.9 (24min, 34.5P1) fps
HP Pavilion x360 15-er0155ng
Intel Core i5-1135G7, Intel Iris Xe Graphics G7 80EUs
64.7 (14.8min, 45.5P1) fps -26%
HP Pavilion Aero 13 be0097nr
AMD Ryzen 7 5800U, AMD Radeon RX Vega 8 (Ryzen 4000/5000)
57.5 (7.91min, 40P1) fps -34%
HP 250 G7-15S40ES
Intel Core i5-1035G1, NVIDIA GeForce MX110
49.8 fps -43%
1366x768 Normal/Off AF:4x
Average NVIDIA GeForce MX350
  (115 - 137.3, n=3)
129.6 fps +13%
Asus Vivobook 15 K513EQ
Intel Core i7-1165G7, NVIDIA GeForce MX350
115 (5.06min, 55.6P1) fps
VAIO SX14 VJS144X0111K
Intel Core i7-1195G7, Intel Iris Xe Graphics G7 96EUs
99.3 (13.5min, 62.5P1) fps -14%
Lenovo ThinkPad E15 G3-20YG003UGE
AMD Ryzen 7 5700U, AMD Radeon RX Vega 8 (Ryzen 4000/5000)
80.9 (23.4min, 50P1) fps -30%
HP 250 G7-15S40ES
Intel Core i5-1035G1, NVIDIA GeForce MX110
73.4 fps -36%
HP Pavilion x360 15-er0155ng
Intel Core i5-1135G7, Intel Iris Xe Graphics G7 80EUs
71.4 (11.1min, 43.5P1) fps -38%
1920x1080 Normal/Off AF:4x
Average NVIDIA GeForce MX350
  (69 - 108.7, n=2)
88.9 fps +29%
VAIO SX14 VJS144X0111K
Intel Core i7-1195G7, Intel Iris Xe Graphics G7 96EUs
81.5 (16.8min, 50P1) fps +18%
Asus Vivobook 15 K513EQ
Intel Core i7-1165G7, NVIDIA GeForce MX350
69 (23.7min, 33.3P1) fps
HP Pavilion Aero 13 be0097nr
AMD Ryzen 7 5800U, AMD Radeon RX Vega 8 (Ryzen 4000/5000)
57.2 (6min, 38.5P1) fps -17%
HP Pavilion x360 15-er0155ng
Intel Core i5-1135G7, Intel Iris Xe Graphics G7 80EUs
56.2 (13.6min, 38.5P1) fps -19%
HP 250 G7-15S40ES
Intel Core i5-1035G1, NVIDIA GeForce MX110
51.2 fps -26%
1920x1080 High/On (Advanced Graphics Off) AA:2xMSAA + FX AF:8x
Average NVIDIA GeForce MX350
  (45.8 - 49.5, n=3)
47.4 fps +3%
Asus Vivobook 15 K513EQ
Intel Core i7-1165G7, NVIDIA GeForce MX350
45.8 (0.907min, 20.8P1) fps
VAIO SX14 VJS144X0111K
Intel Core i7-1195G7, Intel Iris Xe Graphics G7 96EUs
32.7 (7.75min, 24.4P1) fps -29%
Lenovo ThinkPad E15 G3-20YG003UGE
AMD Ryzen 7 5700U, AMD Radeon RX Vega 8 (Ryzen 4000/5000)
24.8 (4.64min, 17.2P1) fps -46%
HP Pavilion Aero 13 be0097nr
AMD Ryzen 7 5800U, AMD Radeon RX Vega 8 (Ryzen 4000/5000)
23.7 (3.38min, 16.9P1) fps -48%
HP Pavilion x360 15-er0155ng
Intel Core i5-1135G7, Intel Iris Xe Graphics G7 80EUs
23.4 (7.44min, 16.9P1) fps -49%
HP 250 G7-15S40ES
Intel Core i5-1035G1, NVIDIA GeForce MX110
19.6 fps -57%
1920x1080 Highest Settings possible AA:4xMSAA + FX AF:16x
Asus Vivobook 15 K513EQ
Intel Core i7-1165G7, NVIDIA GeForce MX350
23.7 (1.708min, 15.2P1) fps
Average NVIDIA GeForce MX350
  (9.1 - 23.7, n=3)
18.3 fps -23%
VAIO SX14 VJS144X0111K
Intel Core i7-1195G7, Intel Iris Xe Graphics G7 96EUs
12.9 (4.48min, 9.8P1) fps -46%
Lenovo ThinkPad E15 G3-20YG003UGE
AMD Ryzen 7 5700U, AMD Radeon RX Vega 8 (Ryzen 4000/5000)
10.8 (1.901min, 7.41P1) fps -54%
HP Pavilion x360 15-er0155ng
Intel Core i5-1135G7, Intel Iris Xe Graphics G7 80EUs
9.4 (3.68min, 6.76P1) fps -60%
HP Pavilion Aero 13 be0097nr
AMD Ryzen 7 5800U, AMD Radeon RX Vega 8 (Ryzen 4000/5000)
9.38 (2.33min, 6.54P1) fps -60%
HP 250 G7-15S40ES
Intel Core i5-1035G1, NVIDIA GeForce MX110
6.7 fps -72%
Dota 2 Reborn
1280x720 min (0/3) fastest
VAIO SX14 VJS144X0111K
Intel Core i7-1195G7, Intel Iris Xe Graphics G7 96EUs
136 (118.6min) fps +8%
Lenovo ThinkPad P15s Gen1-20T4000JGE
Intel Core i7-10510U, NVIDIA Quadro P520
135 (116.6min) fps +7%
Asus Vivobook 15 K513EQ
Intel Core i7-1165G7, NVIDIA GeForce MX350
126 (109.8min) fps
Average NVIDIA GeForce MX350
  (102.8 - 145, n=14)
122.9 fps -2%
HP Pavilion Aero 13 be0097nr
AMD Ryzen 7 5800U, AMD Radeon RX Vega 8 (Ryzen 4000/5000)
108 (94.3min) fps -14%
HP 250 G7-15S40ES
Intel Core i5-1035G1, NVIDIA GeForce MX110
95.1 (83.3min) fps -25%
Lenovo ThinkPad E15 G3-20YG003UGE
AMD Ryzen 7 5700U, AMD Radeon RX Vega 8 (Ryzen 4000/5000)
93.4 (83.8min) fps -26%
Microsoft Surface Laptop 4 15 AMD TFF_00028
AMD Ryzen 7 4980U, AMD Radeon RX Vega 8 (Ryzen 4000/5000)
91 (81.5min) fps -28%
HP Pavilion x360 15-er0155ng
Intel Core i5-1135G7, Intel Iris Xe Graphics G7 80EUs
81.6 (52.7min) fps -35%
1366x768 med (1/3)
Asus Vivobook 15 K513EQ
Intel Core i7-1165G7, NVIDIA GeForce MX350
119 (102.7min) fps
Lenovo ThinkPad P15s Gen1-20T4000JGE
Intel Core i7-10510U, NVIDIA Quadro P520
118 (97.9min) fps -1%
Average NVIDIA GeForce MX350
  (93.8 - 130, n=14)
110.6 fps -7%
VAIO SX14 VJS144X0111K
Intel Core i7-1195G7, Intel Iris Xe Graphics G7 96EUs
96.1 (80.5min) fps -19%
HP Pavilion Aero 13 be0097nr
AMD Ryzen 7 5800U, AMD Radeon RX Vega 8 (Ryzen 4000/5000)
85.2 (69.5min) fps -28%
HP 250 G7-15S40ES
Intel Core i5-1035G1, NVIDIA GeForce MX110
82.7 (73.3min) fps -31%
Microsoft Surface Laptop 4 15 AMD TFF_00028
AMD Ryzen 7 4980U, AMD Radeon RX Vega 8 (Ryzen 4000/5000)
75.3 (65.9min) fps -37%
Lenovo ThinkPad E15 G3-20YG003UGE
AMD Ryzen 7 5700U, AMD Radeon RX Vega 8 (Ryzen 4000/5000)
74.9 (64min) fps -37%
HP Pavilion x360 15-er0155ng
Intel Core i5-1135G7, Intel Iris Xe Graphics G7 80EUs
54.2 (37.5min) fps -54%
1920x1080 high (2/3)
Average NVIDIA GeForce MX350
  (64.1 - 88.4, n=14)
81.1 fps +1%
Asus Vivobook 15 K513EQ
Intel Core i7-1165G7, NVIDIA GeForce MX350
80.4 (66.9min) fps
VAIO SX14 VJS144X0111K
Intel Core i7-1195G7, Intel Iris Xe Graphics G7 96EUs
63.1 (54min) fps -22%
Microsoft Surface Laptop 4 15 AMD TFF_00028
AMD Ryzen 7 4980U, AMD Radeon RX Vega 8 (Ryzen 4000/5000)
50.5 (44.4min) fps -37%
HP Pavilion Aero 13 be0097nr
AMD Ryzen 7 5800U, AMD Radeon RX Vega 8 (Ryzen 4000/5000)
49.8 (42.7min) fps -38%
Lenovo ThinkPad E15 G3-20YG003UGE
AMD Ryzen 7 5700U, AMD Radeon RX Vega 8 (Ryzen 4000/5000)
49.5 (45.4min) fps -38%
HP Pavilion x360 15-er0155ng
Intel Core i5-1135G7, Intel Iris Xe Graphics G7 80EUs
40 (27.4min) fps -50%
HP 250 G7-15S40ES
Intel Core i5-1035G1, NVIDIA GeForce MX110
36.2 (32.6min) fps -55%
Lenovo ThinkPad P15s Gen1-20T4000JGE
Intel Core i7-10510U, NVIDIA Quadro P520
33.4 (23.2min) fps -58%
1920x1080 ultra (3/3) best looking
Asus Vivobook 15 K513EQ
Intel Core i7-1165G7, NVIDIA GeForce MX350
73.4 (61.5min) fps
Average NVIDIA GeForce MX350
  (52.3 - 80.6, n=14)
72.5 fps -1%
VAIO SX14 VJS144X0111K
Intel Core i7-1195G7, Intel Iris Xe Graphics G7 96EUs
59.3 (52.6min) fps -19%
Microsoft Surface Laptop 4 15 AMD TFF_00028
AMD Ryzen 7 4980U, AMD Radeon RX Vega 8 (Ryzen 4000/5000)
47.6 (42min) fps -35%
Lenovo ThinkPad E15 G3-20YG003UGE
AMD Ryzen 7 5700U, AMD Radeon RX Vega 8 (Ryzen 4000/5000)
46.3 (42.9min) fps -37%
HP Pavilion Aero 13 be0097nr
AMD Ryzen 7 5800U, AMD Radeon RX Vega 8 (Ryzen 4000/5000)
45.6 (40.9min) fps -38%
HP Pavilion x360 15-er0155ng
Intel Core i5-1135G7, Intel Iris Xe Graphics G7 80EUs
38.9 (26min) fps -47%
HP 250 G7-15S40ES
Intel Core i5-1035G1, NVIDIA GeForce MX110
32.4 (29min) fps -56%
Lenovo ThinkPad P15s Gen1-20T4000JGE
Intel Core i7-10510U, NVIDIA Quadro P520
20.9 (6.3min) fps -72%
Strange Brigade
1280x720 lowest AF:1
Asus Vivobook 15 K513EQ
Intel Core i7-1165G7, NVIDIA GeForce MX350
92.7 (72min, 76.8P1) fps
Average NVIDIA GeForce MX350
  (90.9 - 94.4, n=3)
92.7 fps 0%
HP Pavilion Aero 13 be0097nr
AMD Ryzen 7 5800U, AMD Radeon RX Vega 8 (Ryzen 4000/5000)
77.5 (48.5min, 67P1) fps -16%
HP Pavilion x360 15-er0155ng
Intel Core i5-1135G7, Intel Iris Xe Graphics G7 80EUs
75 (17.3min, 24.2P1) fps -19%
Lenovo ThinkPad E15 G3-20YG003UGE
AMD Ryzen 7 5700U, AMD Radeon RX Vega 8 (Ryzen 4000/5000)
74 fps -20%
1920x1080 medium AA:medium AF:4
Average NVIDIA GeForce MX350
  (31.7 - 35, n=3)
33 fps +2%
Asus Vivobook 15 K513EQ
Intel Core i7-1165G7, NVIDIA GeForce MX350
32.3 (27.7min, 28.5P1) fps
HP Pavilion x360 15-er0155ng
Intel Core i5-1135G7, Intel Iris Xe Graphics G7 80EUs
31.3 (10.6min, 17.9P1) fps -3%
Lenovo ThinkPad E15 G3-20YG003UGE
AMD Ryzen 7 5700U, AMD Radeon RX Vega 8 (Ryzen 4000/5000)
30 fps -7%
HP Pavilion Aero 13 be0097nr
AMD Ryzen 7 5800U, AMD Radeon RX Vega 8 (Ryzen 4000/5000)
29.7 (22min, 26P1) fps -8%
1920x1080 high AA:high AF:8
Average NVIDIA GeForce MX350
  (24.6 - 27.2, n=3)
25.6 fps +2%
HP Pavilion x360 15-er0155ng
Intel Core i5-1135G7, Intel Iris Xe Graphics G7 80EUs
25.2 (6.2min, 9.3P1) fps +1%
Lenovo ThinkPad E15 G3-20YG003UGE
AMD Ryzen 7 5700U, AMD Radeon RX Vega 8 (Ryzen 4000/5000)
25 fps 0%
HP Pavilion Aero 13 be0097nr
AMD Ryzen 7 5800U, AMD Radeon RX Vega 8 (Ryzen 4000/5000)
25 (18.2min, 19.6P1) fps 0%
Asus Vivobook 15 K513EQ
Intel Core i7-1165G7, NVIDIA GeForce MX350
25 (20.5min, 21.4P1) fps
1920x1080 ultra AA:ultra AF:16
Lenovo ThinkPad E15 G3-20YG003UGE
AMD Ryzen 7 5700U, AMD Radeon RX Vega 8 (Ryzen 4000/5000)
22 fps +17%
HP Pavilion Aero 13 be0097nr
AMD Ryzen 7 5800U, AMD Radeon RX Vega 8 (Ryzen 4000/5000)
21.2 (14.6min, 16.1P1) fps +13%
HP Pavilion x360 15-er0155ng
Intel Core i5-1135G7, Intel Iris Xe Graphics G7 80EUs
20.3 (5min, 5.2P1) fps +8%
Average NVIDIA GeForce MX350
  (18.8 - 20.1, n=3)
19.3 fps +3%
Asus Vivobook 15 K513EQ
Intel Core i7-1165G7, NVIDIA GeForce MX350
18.8 (14.8min, 15.1P1) fps

Witcher 3 FPS Chart

05101520253035404550556065707580Tooltip
Asus Vivobook 15 K513EQ: Ø80.7 (75-84)
baixo média alto ultra
GTA V (2015) 141 115 45.8 23.7
The Witcher 3 (2015) 86 48.6 29.9 16.7
Dota 2 Reborn (2015) 126 119 80.4 73.4
Final Fantasy XV Benchmark (2018) 48.6 23 14.5
X-Plane 11.11 (2018) 66.7 62.7 53.9
Far Cry 5 (2018) 59 26 23 22
Strange Brigade (2018) 92.7 32.3 25 18.8

Emissões - Silêncio para a maioria das partes

Ruído do sistema

O ventilador interno faz um ótimo trabalho para permanecer o mais silencioso possível e com o mínimo de comportamento pulsante quando sob baixas cargas de processamento. O ruído do ventilador geralmente é de 27 dB(A) ou menor quando a navegação na web ou o fluxo de vídeo contra um fundo silencioso de 23,4 dB(A). Algum leve ruído eletrônico ou lamentação da bobina em nossa unidade de teste impede que ela seja absolutamente silenciosa

O ruído do ventilador está ligado às três configurações de desempenho (Whisper, Balanced, e Performance) no software MyAsus. Rodando Witcher 3 no modo Balanceado ou Performance resultará em um ruído constante do ventilador de 40,7 dB(A) ou 42,9 dB(A), respectivamente, para ser ligeiramente mais alto do que muitos Ultrabooks alimentados somente por gráficos integrados. Cargas de processamento extremas como Prime95 e FurMark induzirão um ruído ainda mais alto máximo do ventilador de 47 dB(A).

Ventilador simples de ~50 mm com apenas um tubo de calor de cobre tanto para a CPU quanto para a GPU
GPU Discreta Nvidia (esquerda) com CPU Intel (direita)

Barulho

Ocioso
23.6 / 23.6 / 23.6 dB
Carga
41 / 47 dB
  red to green bar
 
 
30 dB
silencioso
40 dB(A)
audível
50 dB(A)
ruidosamente alto
 
min: dark, med: mid, max: light   Earthworks M23R, Arta (15 cm de distância)   environment noise: 23.4 dB(A)
dB(A) 0102030405060708090Deep BassMiddle BassHigh BassLower RangeMidsHigher MidsLower HighsMid HighsUpper HighsSuper Highs2033.731.334.830.131.2252622.826.425.524.23122.423.625.524.821.84021.32423.723.721.35023.119.92522.825.66328.221.421.622.6298025.524.223.622.925.410021.821202025.612522.42117.317.724.216023.620.214.515.224.220022.320.714.114.425.225024.622.314.614.326.431526.327.616.717.12940027.626.313.915.232.7500272512.712.831.76302624.512.211.830.580025.224.39.71029.8100027.525.49.99.730.9125028.927.29.99.633.3160030.628.610.11034.2200031.429.810.310.235250030.528.510.410.333.931503331.110.610.735.7400033.63111.211.137.8500032.630.711.411.637.1630033.932.411.611.538800030.326.712.111.536.71000024.821.713.411.531.61250022.219.914.511.329.11600020.519.510.810.424.5SPL42.94123.623.447N4.23.60.50.55.7median 27median 25.4median 12.1median 11.5median 31.6Delta3.642.224.6hearing rangehide median Fan NoiseAsus Vivobook 15 K513EQ
Asus Vivobook 15 K513EQ
GeForce MX350, i7-1165G7, Intel SSD 660p SSDPEKNW512G8
Asus VivoBook 15 Pro M3500QC-L1062
GeForce RTX 3050 4GB Laptop GPU, R5 5600H, SK Hynix HFM512GD3JX013N
Asus VivoBook S15 S533EQ-BQ002T
GeForce MX350, i7-1165G7, Intel SSD 660p 1TB SSDPEKNW010T8
Lenovo IdeaPad 5 15ALC05
Vega 7, R5 5500U
Dell Inspiron 15 3501
Iris Xe G7 96EUs, i7-1165G7, Samsung PM991a MZ9LQ512HBLU-00BD1
HP Pavilion 15-eg
GeForce MX450, i7-1165G7, Samsung PM991 MZVLQ1T0HALB
Noise
-3%
-0%
-4%
-1%
-1%
off / environment *
23.4
24.8
-6%
25
-7%
26
-11%
26
-11%
25.4
-9%
Idle Minimum *
23.6
24.8
-5%
25
-6%
26
-10%
26
-10%
25.6
-8%
Idle Average *
23.6
24.8
-5%
25
-6%
26
-10%
26
-10%
25.6
-8%
Idle Maximum *
23.6
26.4
-12%
25
-6%
26
-10%
26
-10%
25.6
-8%
Load Average *
41
42.8
-4%
39.5
4%
42.6
-4%
35.9
12%
39.2
4%
Witcher 3 ultra *
42.9
42.8
-0%
39.3
8%
39.1
9%
Load Maximum *
47
42.8
9%
41.6
11%
37.4
20%
35.8
24%
41.5
12%

* ... smaller is better

Temperatura

A metade direita do laptop sempre será mais quente do que a metade esquerda devido ao projeto da solução de resfriamento dentro dela. Os pontos quentes no teclado podem ser tão quentes quanto 42 C quando o jogo é comparável ao HP Pavilion 15 equipado com gráficos Iris Xe integrados. O fundo, no entanto, pode ser ainda mais quente a quase 50 C perto da traseira.

Escape traseiro
Escape traseiro
Adaptador AC após uma hora de jogo
 39.4 °C48.8 °C46.6 °C 
 43.6 °C45.6 °C44 °C 
 28.2 °C27.4 °C27.4 °C 
Máximo: 48.8 °C
Médio: 39 °C
35.6 °C39.6 °C41 °C
28.6 °C41.2 °C42 °C
24.6 °C25 °C28.2 °C
Máximo: 42 °C
Médio: 34 °C
alimentação elétrica  47 °C | Temperatura do quarto 21.8 °C | Fluke 62 Mini IR Thermometer
(-) The average temperature for the upper side under maximal load is 39 °C / 102 F, compared to the average of 31.2 °C / 88 F for the devices in the class Multimedia.
(-) The maximum temperature on the upper side is 48.8 °C / 120 F, compared to the average of 36.9 °C / 98 F, ranging from 21.1 to 71 °C for the class Multimedia.
(±) The bottom heats up to a maximum of 42 °C / 108 F, compared to the average of 39.1 °C / 102 F
(+) In idle usage, the average temperature for the upper side is 25.6 °C / 78 F, compared to the device average of 31.2 °C / 88 F.
(±) Playing The Witcher 3, the average temperature for the upper side is 33.9 °C / 93 F, compared to the device average of 31.2 °C / 88 F.
(+) The palmrests and touchpad are cooler than skin temperature with a maximum of 28.2 °C / 82.8 F and are therefore cool to the touch.
(±) The average temperature of the palmrest area of similar devices was 28.8 °C / 83.8 F (+0.6 °C / 1 F).
Sistema ocioso (topo)
Sistema ocioso (fundo)
Witcher 3 stress (topo)
Witcher 3 stress (fundo)
Prime95+FurMark stress (topo)
Prime95+FurMark stress (fundo)
Asus Vivobook 15 K513EQ
Intel Core i7-1165G7, NVIDIA GeForce MX350
Asus VivoBook 15 Pro M3500QC-L1062
AMD Ryzen 5 5600H, NVIDIA GeForce RTX 3050 4GB Laptop GPU
Asus VivoBook S15 S533EQ-BQ002T
Intel Core i7-1165G7, NVIDIA GeForce MX350
Lenovo IdeaPad 5 15ALC05
AMD Ryzen 5 5500U, AMD Radeon RX Vega 7
Dell Inspiron 15 3501
Intel Core i7-1165G7, Intel Iris Xe Graphics G7 96EUs
HP Pavilion 15-eg
Intel Core i7-1165G7, NVIDIA GeForce MX450
Heat
14%
16%
12%
8%
3%
Maximum Upper Side *
48.8
37.8
23%
38.1
22%
40.5
17%
45.6
7%
44
10%
Maximum Bottom *
42
48.4
-15%
41.3
2%
42
-0%
41
2%
53.4
-27%
Idle Upper Side *
30
24
20%
24.5
18%
26.5
12%
28.2
6%
27.4
9%
Idle Bottom *
35
25.1
28%
26.8
23%
29
17%
29.1
17%
28.8
18%

* ... smaller is better

Teste de estresse

Sistema ocioso
Sistema ocioso

Quando estressada sob Prime95, a CPU aumentaria para 4,1 GHz durante os primeiros 30 segundos ou mais até atingir uma temperatura central de 91 C. As taxas de relógio cairiam então para menos de 3,1 GHz a fim de manter uma temperatura central mais fria de 78 C Estrutura LaptopA unidade de processamento i7-1165G7, que usa a mesma CPU Core i7-1165G7, estabilizaria a uma temperatura ligeiramente mais alta de 82 C quando submetida a cargas similares.

A execução no modo Performance traz um desempenho gráfico ligeiramente mais rápido. A taxa de relógio da GPU ficaria entre 1100 e 1455 MHz quando em funcionamento Witcher 3 no modo Equilibrado em comparação com um constante 1595 MHz ao executar o mesmo jogo no modo Desempenho. Assim, os usuários devem lidar com o ruído mais alto do ventilador associado ao modo Performance se quiserem explorar ao máximo o laptop.

O funcionamento com baterias terá impacto no desempenho. Um teste 3DMark 11 com baterias retornaria pontuações de Física e Gráficos de 8064 e 6075 pontos, respectivamente, em comparação com 11534 e 6293 pontos quando em rede elétrica.

Tensão Prime95
Tensão Prime95
Prime95+FurMark stress
Witcher 3 stress (modo balanceado)
Witcher 3 stress (modo de desempenho)
RelógioCPU (GHz) RelógioGPU (MHz) Temperaturamédiada CPU (°C) Temperaturamédiada GPU (°C)
System Idle -- -- 37 38
Prime95 Stress 1.7 - 2.9 ~82 --61
Prime95 + FurMark Stress 0.7 - 1.1 1354 69 74
Witcher 3 Stress (modo balanceado) 0.6 - 0.8 1100 - 1455 65 70
Witcher 3 Stress (modo de desempenho) 0.8 - 1.2 1595 71 73

Oradores

Ruído rosa no volume máximo. Os alto-falantes são suficientemente altos para encher apenas uma sala pequena ou pequena-média
Alto-falantes estéreo localizados perto dos cantos da frente
dB(A) 0102030405060708090Deep BassMiddle BassHigh BassLower RangeMidsHigher MidsLower HighsMid HighsUpper HighsSuper Highs203532.2352525.726.425.73123.723.723.7402522.8255020.821.220.86319.120.119.18022.223.622.210019.835.219.812517.943.717.916018.748.318.720015.751.515.725015.459.415.431517.665.117.640015.368.215.350013.267.213.263011.970.511.980010.773.810.7100011.371.711.3125012.170.412.1160012.570.212.5200012.768.212.7250011.565.711.5315011.565.811.5400011.768.511.7500011.66711.6630011.966.311.9800012.165.512.11000014.465.214.41250014.762.514.71600011.161.711.1SPL24.680.824.6N0.651.70.6median 12.5median 65.8median 12.5Delta2.35.22.335.335.132.931.831.83236.535.132.428.93328.936.328.848.32761.52752.924.860.92462.822.763.32269.521.267.82174.82075.919.472.718.97117.770.117.86917.671.817.668.117.671.417.673.717.670.417.571.617.671.617.669.617.459.717.583.630.662.51.5median 69.6median 17.84.72.4hearing rangehide median Pink NoiseAsus Vivobook 15 K513EQApple MacBook 12 (Early 2016) 1.1 GHz
Frequency diagram (checkboxes can be checked and unchecked to compare devices)
Asus Vivobook 15 K513EQ audio analysis

(±) | speaker loudness is average but good (80.8 dB)
Bass 100 - 315 Hz
(-) | nearly no bass - on average 15.3% lower than median
(±) | linearity of bass is average (13% delta to prev. frequency)
Mids 400 - 2000 Hz
(+) | balanced mids - only 4.2% away from median
(+) | mids are linear (3.8% delta to prev. frequency)
Highs 2 - 16 kHz
(+) | balanced highs - only 0.8% away from median
(+) | highs are linear (2.3% delta to prev. frequency)
Overall 100 - 16.000 Hz
(+) | overall sound is linear (12.5% difference to median)
Compared to same class
» 17% of all tested devices in this class were better, 3% similar, 80% worse
» The best had a delta of 5%, average was 18%, worst was 45%
Compared to all devices tested
» 8% of all tested devices were better, 2% similar, 90% worse
» The best had a delta of 4%, average was 25%, worst was 134%

Apple MacBook 12 (Early 2016) 1.1 GHz audio analysis

(+) | speakers can play relatively loud (83.6 dB)
Bass 100 - 315 Hz
(±) | reduced bass - on average 11.3% lower than median
(±) | linearity of bass is average (14.2% delta to prev. frequency)
Mids 400 - 2000 Hz
(+) | balanced mids - only 2.4% away from median
(+) | mids are linear (5.5% delta to prev. frequency)
Highs 2 - 16 kHz
(+) | balanced highs - only 2% away from median
(+) | highs are linear (4.5% delta to prev. frequency)
Overall 100 - 16.000 Hz
(+) | overall sound is linear (10.2% difference to median)
Compared to same class
» 5% of all tested devices in this class were better, 2% similar, 93% worse
» The best had a delta of 5%, average was 19%, worst was 53%
Compared to all devices tested
» 3% of all tested devices were better, 1% similar, 96% worse
» The best had a delta of 4%, average was 25%, worst was 134%

Gestão de energia

Consumo de energia - Maior demanda por causa da GPU Nvidia

A manipulação na área de trabalho consome entre 3 W a 9 W, dependendo da configuração de brilho e do perfil de potência. O consumo de energia também depende das cores exibidas, já que nossa unidade utiliza um painel OLED, conforme detalhado pelo nosso resultados aqui.

A execução de cargas maiores como jogos consome entre 51 W e 59 W em comparação com cerca de 40 W cada no IdeaPad 5 15ALC05 ou Iris Xe-powered da Lenovo AMD.Dell Inspiron 15 3501. A discreta GPU Nvidia é a maior responsável pelo notável aumento de 48% no consumo de energia sobre outros Ultrabooks alimentados somente por gráficos integrados. Naturalmente, os proprietários também se beneficiarão do desempenho mais confiável e geralmente mais rápido do GeForce MX350.

Somos capazes de registrar um máximo de 67,6 W ao executar cargas extremas Prime95 e FurMark. O pequeno adaptador (~6,4 x 6,4 x 3 cm) só é classificado para 65 W, o que significa que a taxa de carga da bateria irá diminuir para um rastejamento se a carga for tão alta. O sistema poderia ter se beneficiado potencialmente de um adaptador AC maior e mais capaz.

3DMark 06
3DMark 06
Witcher 3 stress
Witcher 3 stress
O consumo de energia aumentaria para 64,9 W durante cerca de 30 segundos quando o Prime95 funciona, antes de cair e se estabilizar em 48 W devido a limitações térmicas
Consumo constante de energia de 67,6 W ao executar simultaneamente Prime95 e FurMark
Consumo de energia
desligadodarklight 0.24 / 0.67 Watt
Ociosodarkmidlight 3.7 / 6.3 / 9.7 Watt
Carga midlight 59 / 67.7 Watt
 color bar
Key: min: dark, med: mid, max: light        Metrahit Energy
Currently we use the Metrahit Energy, a professional single phase power quality and energy measurement digital multimeter, for our measurements. Find out more about it here. All of our test methods can be found here.
Asus Vivobook 15 K513EQ
i7-1165G7, GeForce MX350, Intel SSD 660p SSDPEKNW512G8, OLED, 1920x1080, 15.60
Asus VivoBook 15 Pro M3500QC-L1062
R5 5600H, GeForce RTX 3050 4GB Laptop GPU, SK Hynix HFM512GD3JX013N, AMOLED, 1920x1080, 15.60
Asus VivoBook S15 S533EQ-BQ002T
i7-1165G7, GeForce MX350, Intel SSD 660p 1TB SSDPEKNW010T8, IPS, 1920x1080, 15.60
Lenovo IdeaPad 5 15ALC05
R5 5500U, Vega 7, , IPS, 1920x1080, 15.60
Dell Inspiron 15 3501
i7-1165G7, Iris Xe G7 96EUs, Samsung PM991a MZ9LQ512HBLU-00BD1, IPS, 1920x1080, 15.60
HP Pavilion 15-eg
i7-1165G7, GeForce MX450, Samsung PM991 MZVLQ1T0HALB, IPS, 1920x1080, 15.60
Power Consumption
-33%
7%
9%
20%
-20%
Idle Minimum *
3.7
4.7
-27%
3
19%
3.7
-0%
3.6
3%
4.9
-32%
Idle Average *
6.3
9.4
-49%
6.4
-2%
7.9
-25%
6.4
-2%
7.9
-25%
Idle Maximum *
9.7
10
-3%
7.9
19%
9.3
4%
7.9
19%
14.2
-46%
Load Average *
59
74.3
-26%
59
-0%
41
31%
39
34%
64.3
-9%
Witcher 3 ultra *
51.4
67.7
-32%
48
7%
41
20%
37.6
27%
55.6
-8%
Load Maximum *
67.7
106.9
-58%
68
-0%
52.2
23%
41.8
38%
65.4
3%

* ... smaller is better

Power Consumption Witcher 3 / Stresstest

05101520253035404550556065Tooltip
Asus Vivobook 15 K513EQ; Witcher 3 ultra: Ø51.4 (49.7-55.2)
Asus Vivobook 15 K513EQ; 1280x720 Prime95 28.10 and Furmark 1.25: Ø67.2 (59.3-67.6)

Vida útil da bateria - Pequena capacidade significa tempos de funcionamento mais curtos

A capacidade da bateria é pequena, com apenas 41 Wh, em comparação com 71 Wh no preço ZenBook 15. Os tempos de execução são apenas em média de cerca de 6 horas de uso da WLAN no mundo real, enquanto o já mencionado ZenBook pode alcançar mais de 12 horas quando sob cargas similares. Como sistema de orçamento, entretanto, 6 horas é comparável a modelos como o HP Pavilion 15 ou Dell Inspiron 15.

O carregamento do vazio para o cheio leva pouco menos de 90 minutos.

Tempo de Execução da Bateria
Ocioso (sem WLAN, min brilho)
13h 19min
WiFi Websurfing
6h 01min
Carga (máximo brilho)
1h 18min
Asus Vivobook 15 K513EQ
i7-1165G7, GeForce MX350, 42 Wh
Asus VivoBook 15 Pro M3500QC-L1062
R5 5600H, GeForce RTX 3050 4GB Laptop GPU, 63 Wh
Asus VivoBook S15 S533EQ-BQ002T
i7-1165G7, GeForce MX350, 50 Wh
Lenovo IdeaPad 5 15ALC05
R5 5500U, Vega 7, 70 Wh
Dell Inspiron 15 3501
i7-1165G7, Iris Xe G7 96EUs, 42 Wh
HP Pavilion 15-eg
i7-1165G7, GeForce MX450, 41 Wh
Battery Runtime
17%
40%
102%
14%
6%
Reader / Idle
799
901
13%
WiFi v1.3
361
498
38%
504
40%
839
132%
410
14%
396
10%
Load
78
75
-4%
134
72%
74
-5%
H.264
725
925
Witcher 3 ultra
74
110

Pro

+ ambos integrados Iris Xe e gráficos discretos GeForce MX
+ painel OLED brilhante com cobertura colorida DCI-P3 completa
+ especificações elevadas para o preço
+ leve para seu tamanho
+ facilidade de manutenção

Contra

- pequena capacidade da bateria; duração média da bateria
- sem DisplayPort-over-USB ou fornecimento de energia
- até PCIe3 x2 NVMe SSD apenas velocidades
- PWM em todos os níveis de luminosidade
- clickpad esponjoso

Veredicto - OLED Acessível

Em revisão: Asus VivoBook 15 K513EQ. Unidade de teste fornecida pela Asus

A palavra "OLED" geralmente evoca uma sensação de luxo ou preços mais altos. O Asus está mudando tudo isso ao introduzir novos painéis OLED 1080p para sua série VivoBook de baixo custo em vez dos painéis OLED 4K mais caros tipicamente encontrados em laptops de alto padrão. Os usuários podem agora possuir um sistema equipado com a última CPU Intel Core i7 série U, gráficos discretos GeForce MX e um display OLED brilhante capaz de reproduzir as cores DCI-P3 por pouco mais de US$900. Os usuários insatisfeitos com "apenas" ~95% de cobertura sRGB na maioria dos Ultrabooks de faixa média como o Lenovo IdeaPad, MSI Modernoou Dell Inspiron achará o novo OLED VivoBook muito atraente por este motivo.

O VivoBook 15 OLED está estabelecendo um novo padrão de orçamento para Ultrabooks de médio porte em termos de qualidade de imagem e perfil de cor. O desempenho também é excelente, enquanto os chassis, na sua maioria plásticos, poderiam usar algumas atualizações.

O restante do laptop é razoavelmente padrão para o melhor ou para o pior. É definitivamente estranho ver uma tela OLED tão nítida e colorida em um laptop de outro modo barato com uma base plástica, um clickpad esponjoso e uma pequena bateria interna. Você terá que jogar mais algumas centenas de dólares em um ZenBook mais elegante para a experiência do carro-chefe completo. No entanto, até os portáteis de médio porte, o VivoBook 15 K513 vem com um dos melhores displays que você pode obter nesta faixa de preço.

Preço e Disponibilidade

A série VivoBook 15 K513 está agora amplamente disponível online, variando de $700 a $1000, dependendo da configuração. Nossa configuração MX350 e OLED pode ser encontrada em Amazon, Newegg, e Walmart.

Asus Vivobook 15 K513EQ - 08/30/2022 v7
Allen Ngo
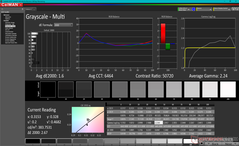
Acabamento
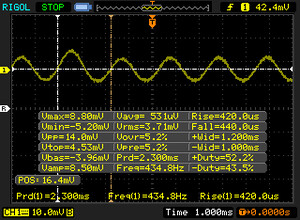
72 / 98 → 74%
Teclado
80%
Mouse
67%
Conectividade
49 / 80 → 61%
Peso
68 / 20-72 → 93%
Bateria
69 / 95 → 73%
Pantalha
87%
Desempenho do jogos
67 / 90 → 74%
Desempenho da aplicação
90 / 90 → 100%
Temperatura
88%
Ruído
88 / 95 → 92%
Audio
82%
Camera
37 / 85 → 44%
Médio
73%
81%
Multimedia - Médio equilibrado

Pricecompare

Please share our article, every link counts!
> Análises e revisões de portáteis e celulares > Análises > Análises > Asus Vivobook 15 K513EQ OLED revisão de laptop: A alternativa Lenovo IdeaPad
Allen Ngo, 2021-11-14 (Update: 2021-11-14)