Veredicto - Fraco desempenho da CPU, desempenho não digno de nota em jogos
É irritante que o desempenho da CPU do Vector 17 caia drasticamente no teste de resistência, especialmente porque o Vector 16 tem um desempenho consistente com uma CPU mais fraca. O desempenho puro em jogos é medíocre, na melhor das hipóteses, mas bastante consistente. Infelizmente, o Vector 17 é bastante barulhento.
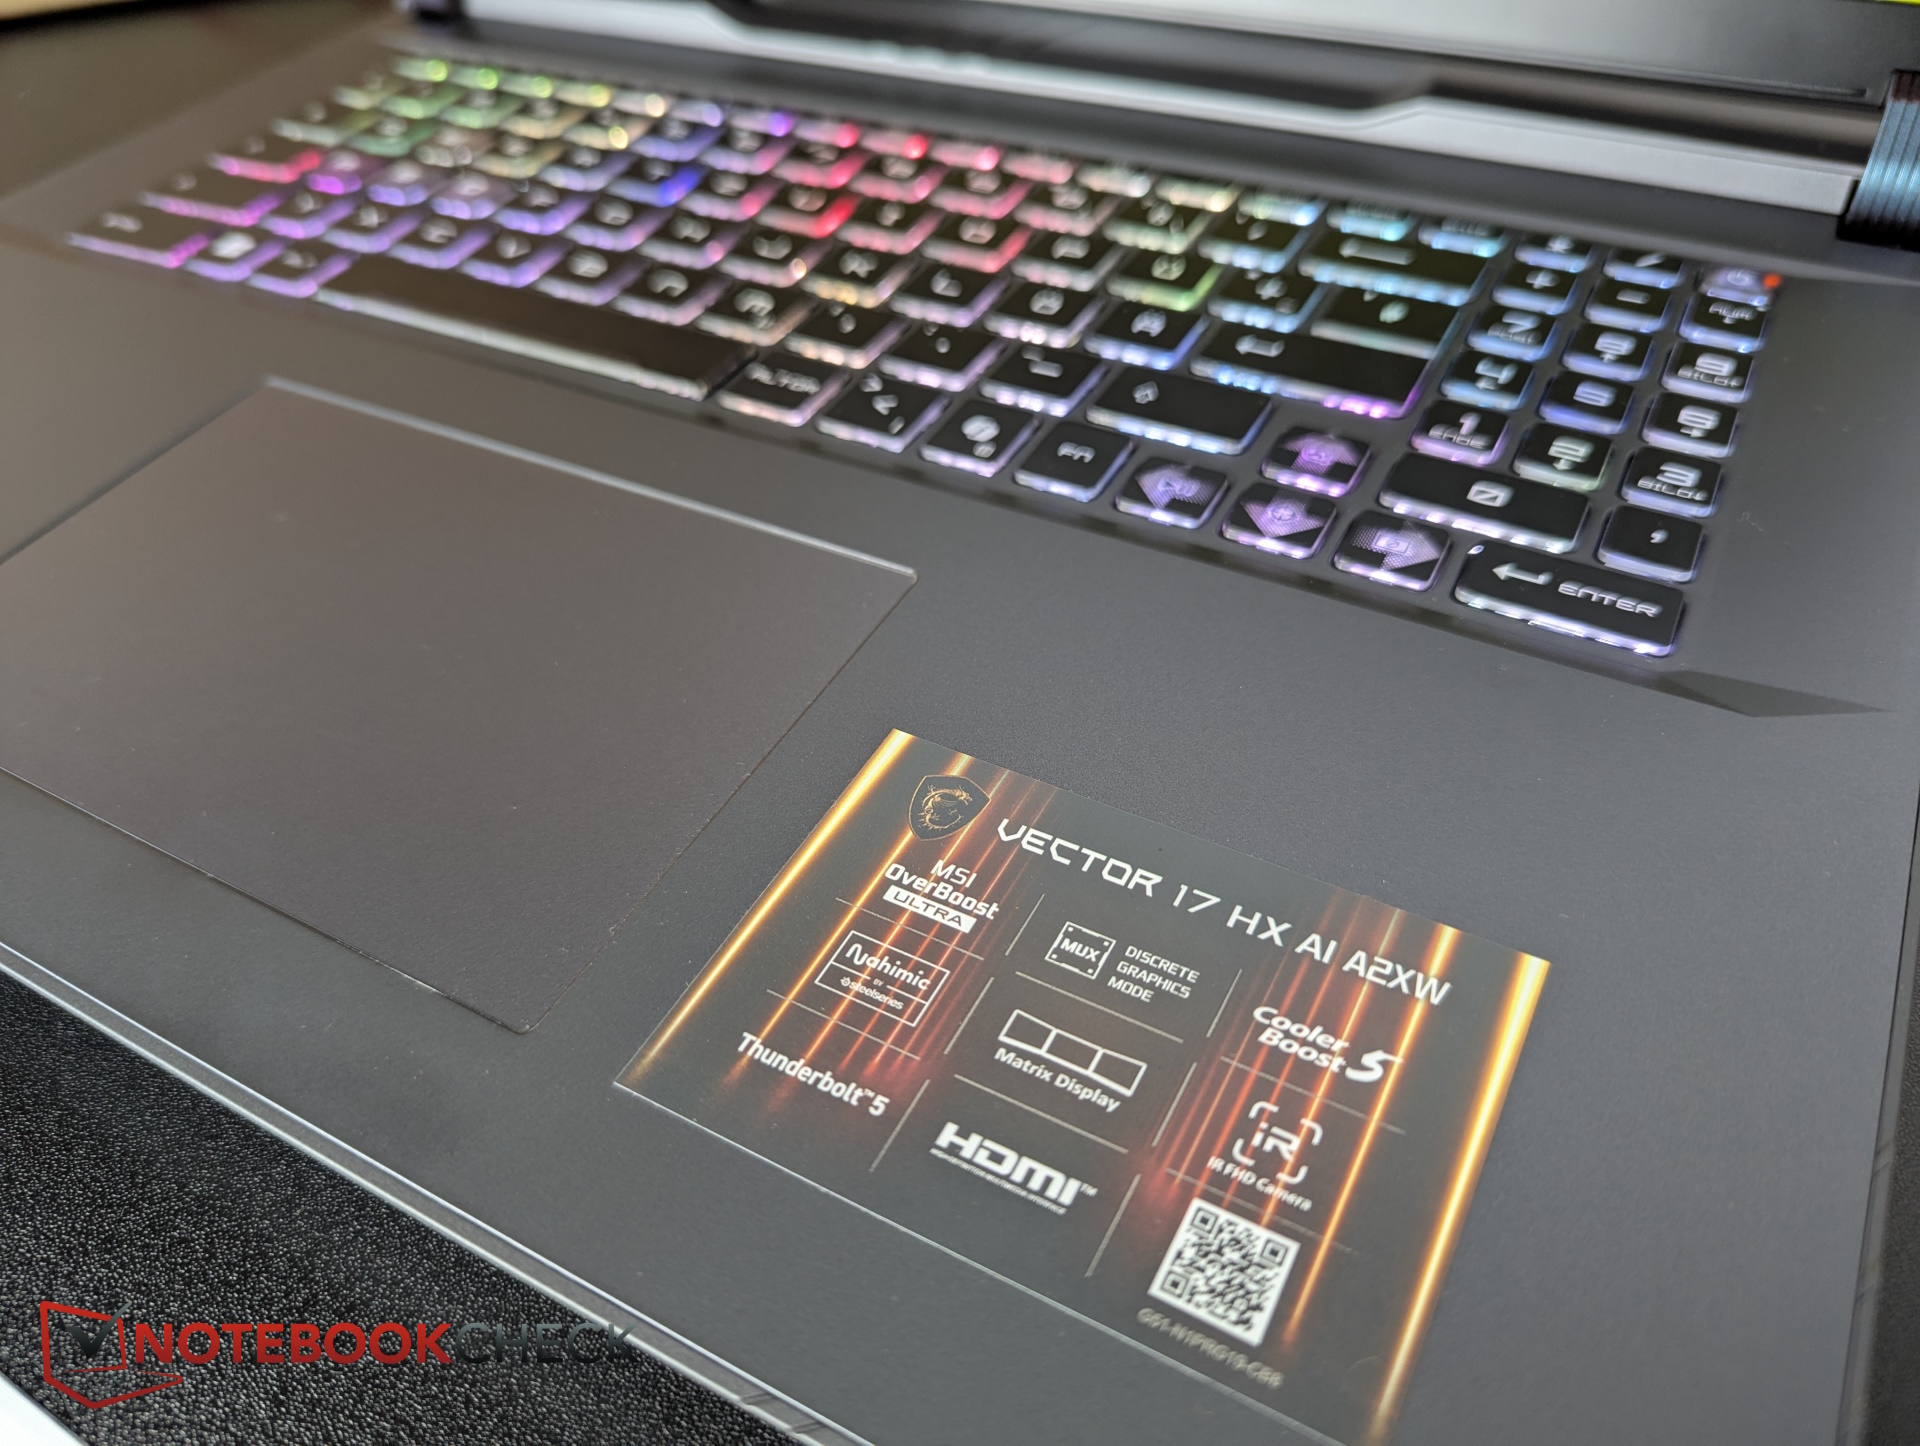
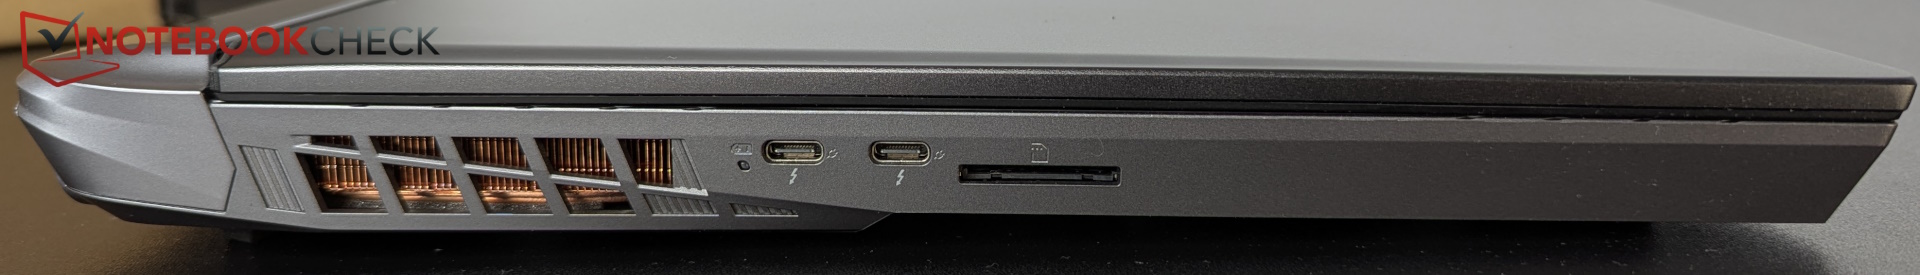
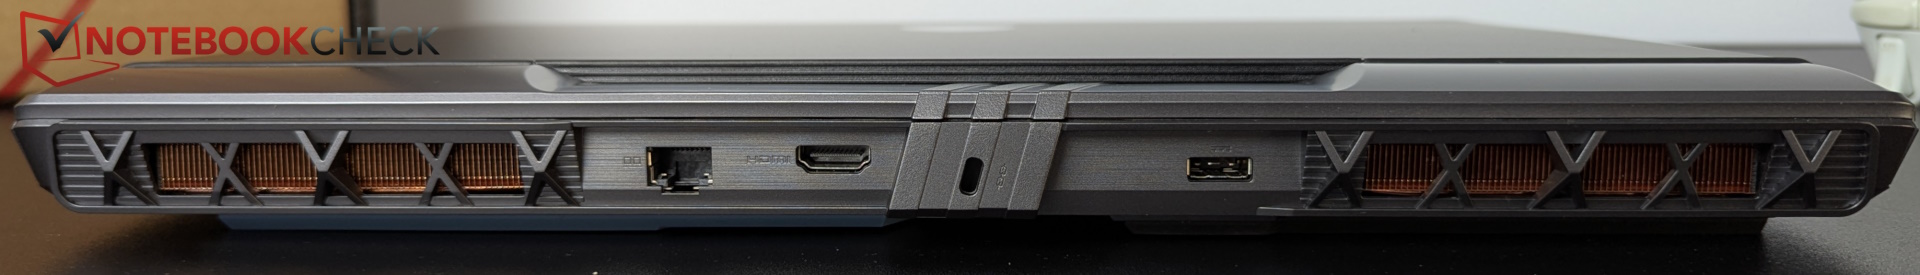
A tela deixa uma impressão ambivalente: Ela pontua com uma luminosidade decente e o espaço de cores P3, mas perde alguma simpatia devido ao valor de preto muito alto. Por outro lado, o equipamento com Thunderbolt 5 duplo, leitor SD completo e Wi-Fi 7 deixa uma impressão positiva.
Ele continua sendo um laptop para jogos de médio a bom que, além de seus recursos, não se destaca da multidão. Por aproximadamente o mesmo preço, o senhor também pode adquirir o Legion Pro 7i Gen 10 com a mesma GPU, que nos impressionou muito mais no teste.
Pro
Contra
Preço e disponibilidade
O Vector 17 com RTX 5080 custa normalmente 3.499 euros (~$4066). Ele acaba de ser reduzido para 3.099 euros (~$3602) na Amazon.
- $99.99400W 20V 20A AC Adapter for MSI Raider Titan 18 HX AI A2XWJG A2XWIG Vector A18 HX A9WIG A9WHG Laptop Charger A23-400P1A A400A001P ADP-400CB B Power Supply
- $1,649.00MSI Vector 16 HX AI A2XWHG-275US 16" Gaming Notebook - Full HD Plus - 144 Hz - Intel Core Ultra 7 255HX - 16 GB - 1 TB SSD - Cosmos Gray
- $2,709.00msi Vector 16 HX AI 400 Gaming Laptop, Intel Ultra 9-275HX, 32 GB DDR5 RAM, 1 TB PCIe SSD, 16" WQXGA (2560x1600) 240Hz Display, Nvidia G-Force RTX 5080, RGB Backlit Keyboard, W11 Pro, Cosmo Gray
Índice
- Veredicto - Fraco desempenho da CPU, desempenho não digno de nota em jogos
- Especificações
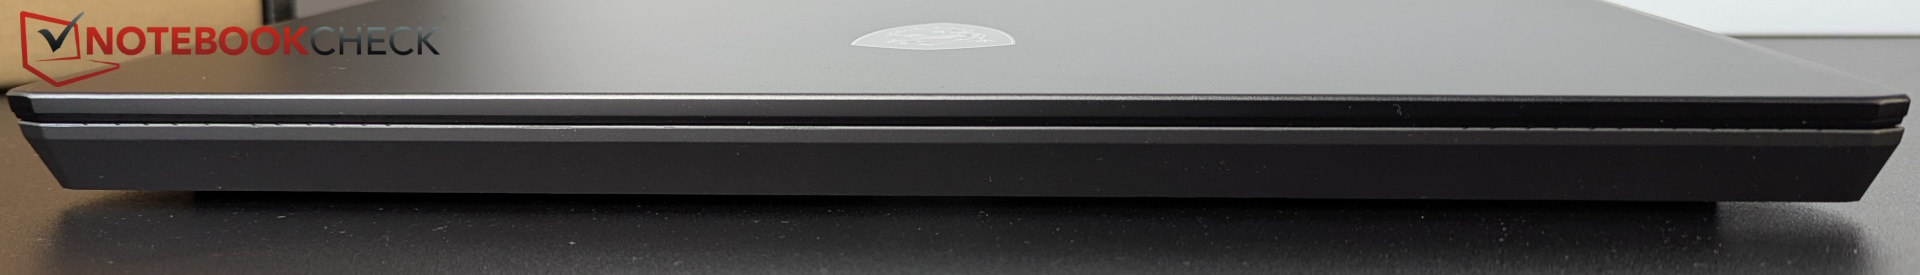
- Case e recursos - Tão grande quanto um Alienware
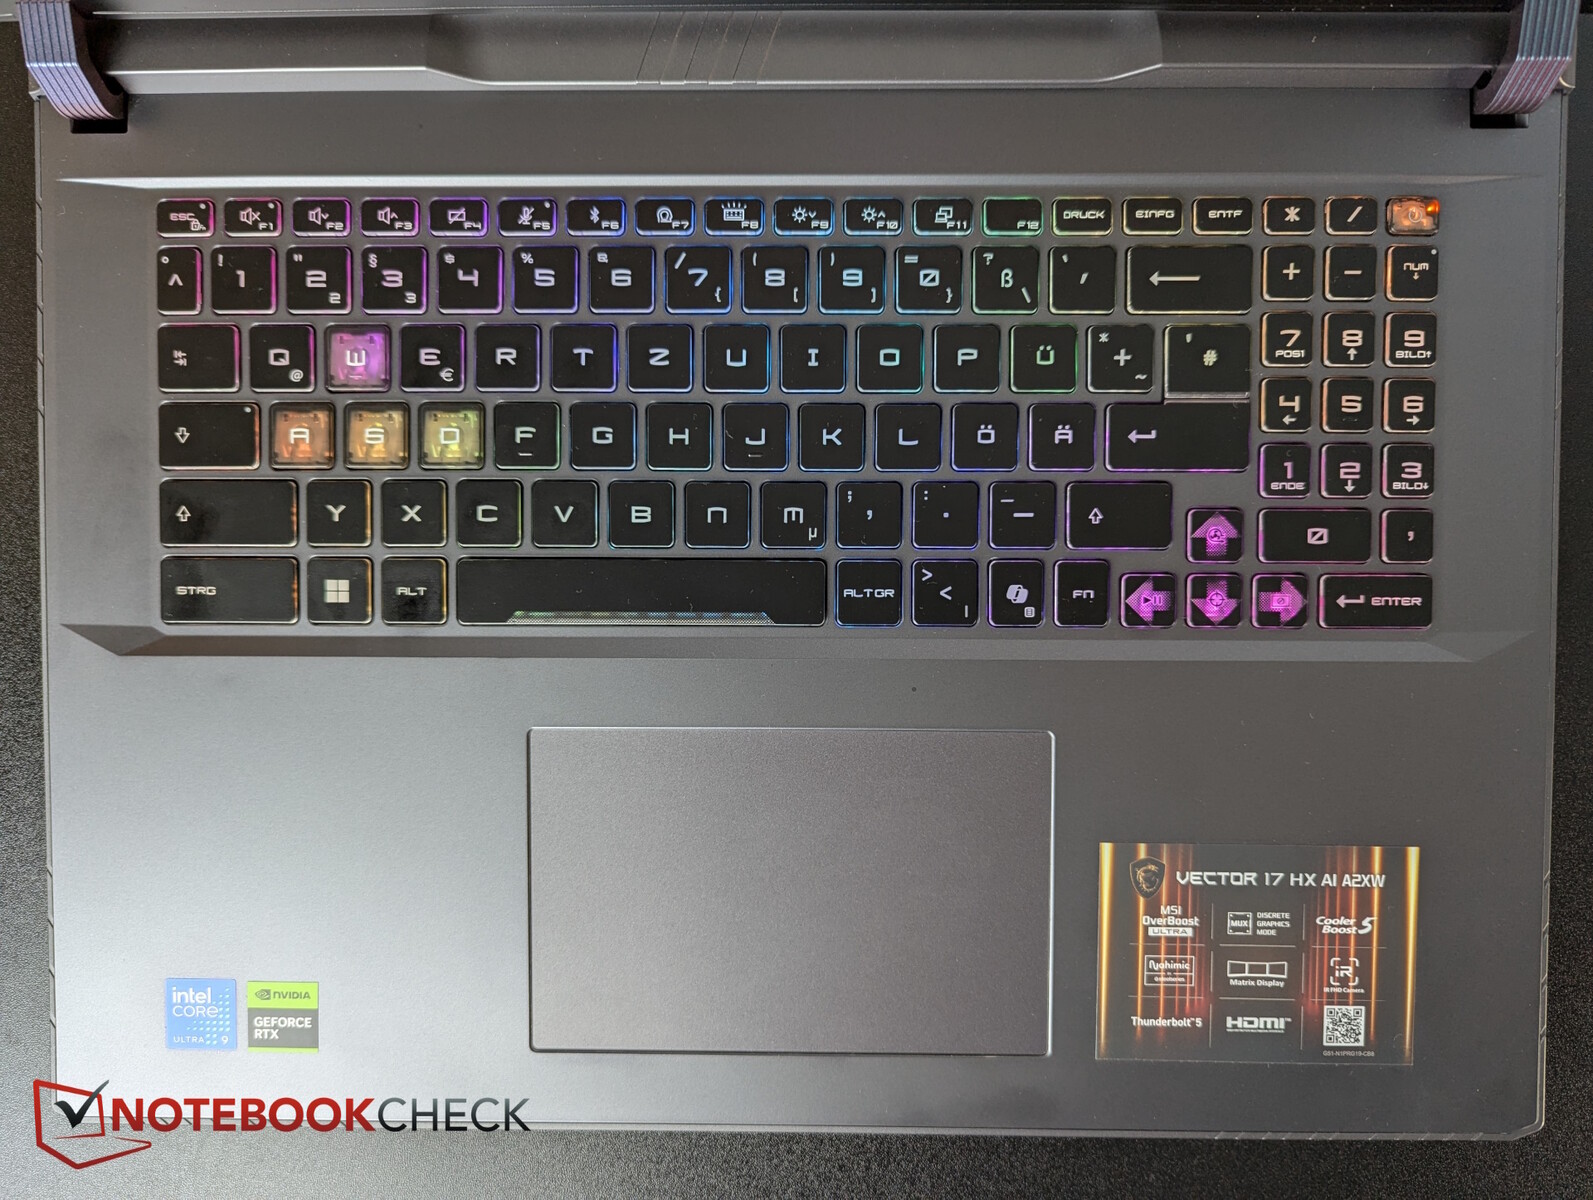
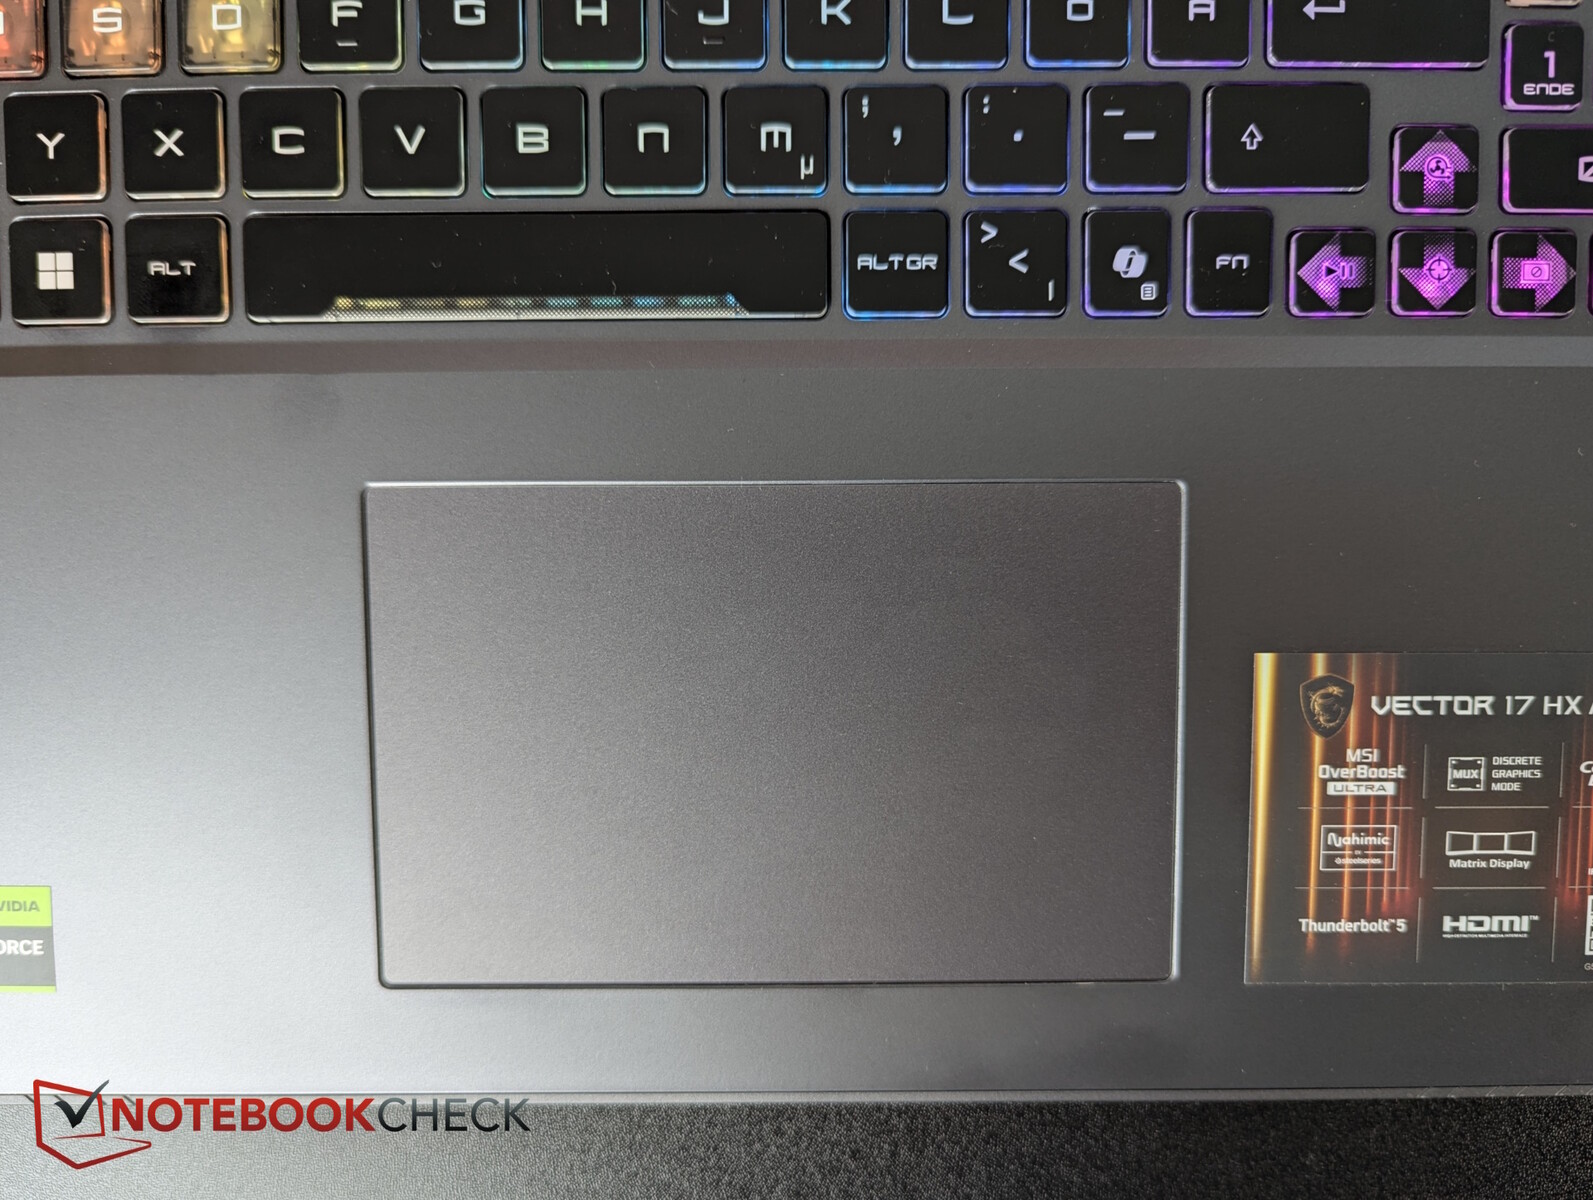
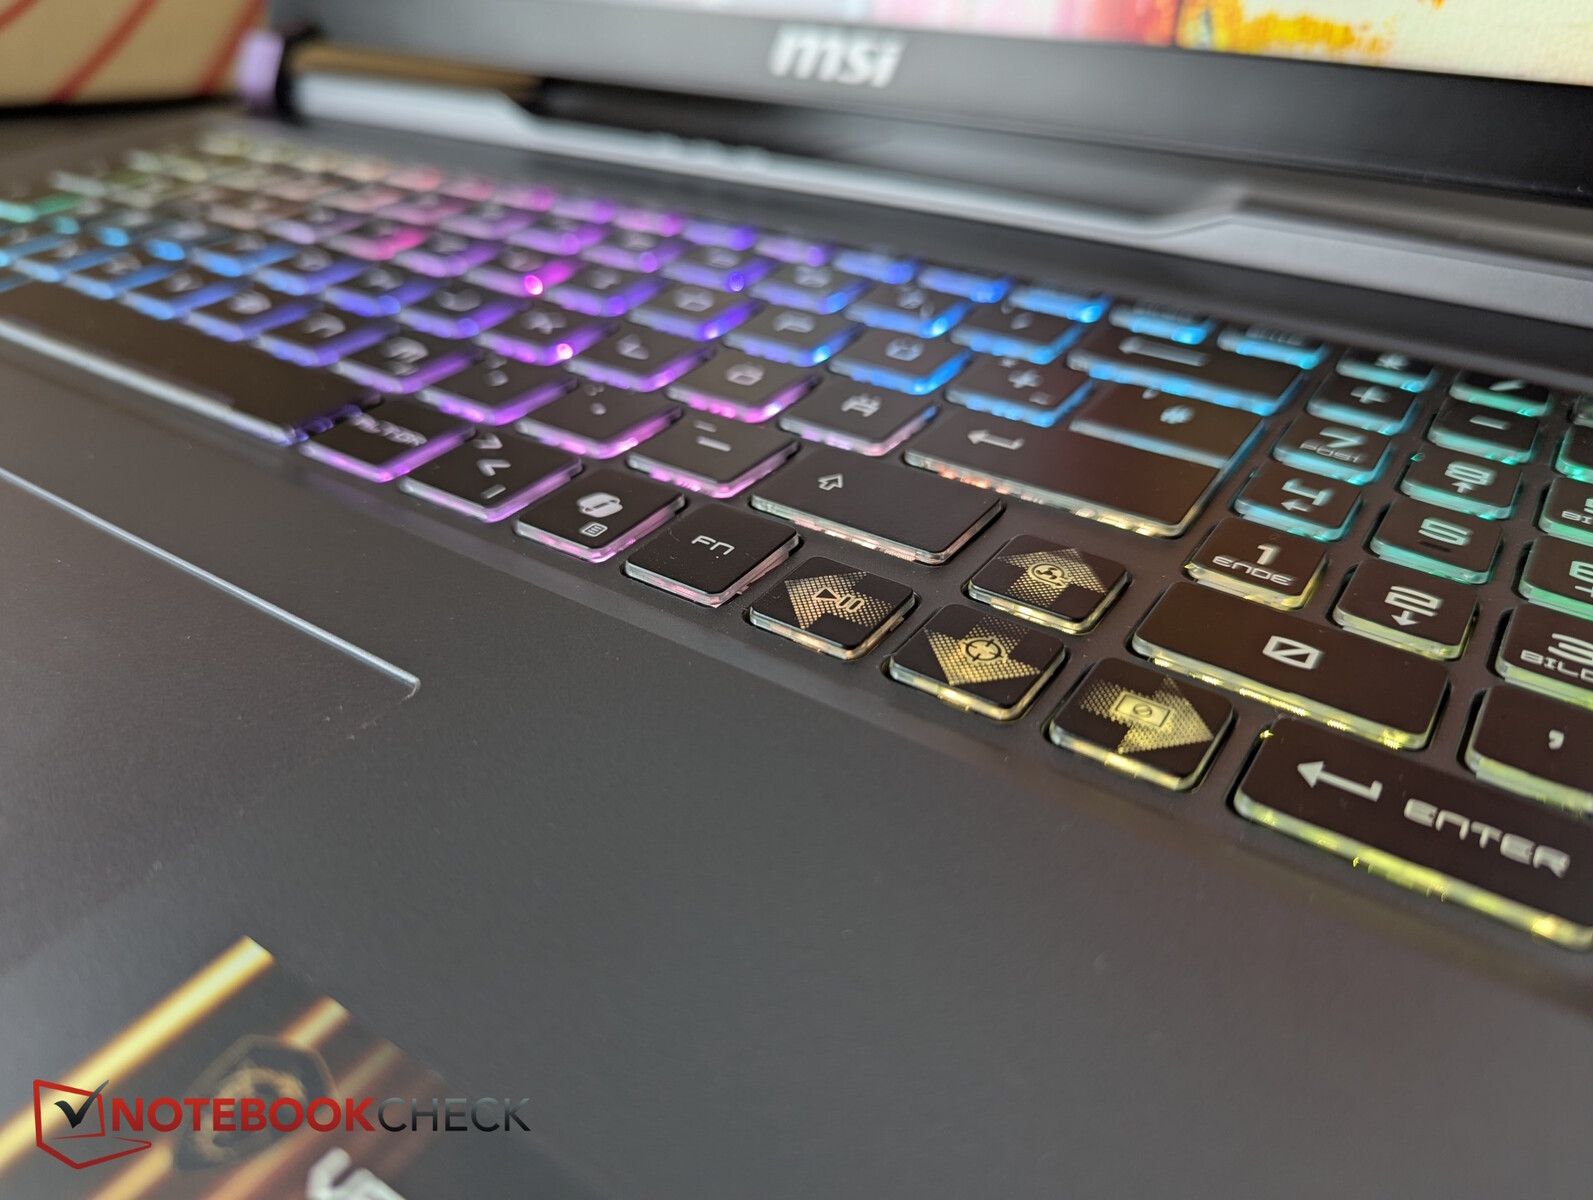
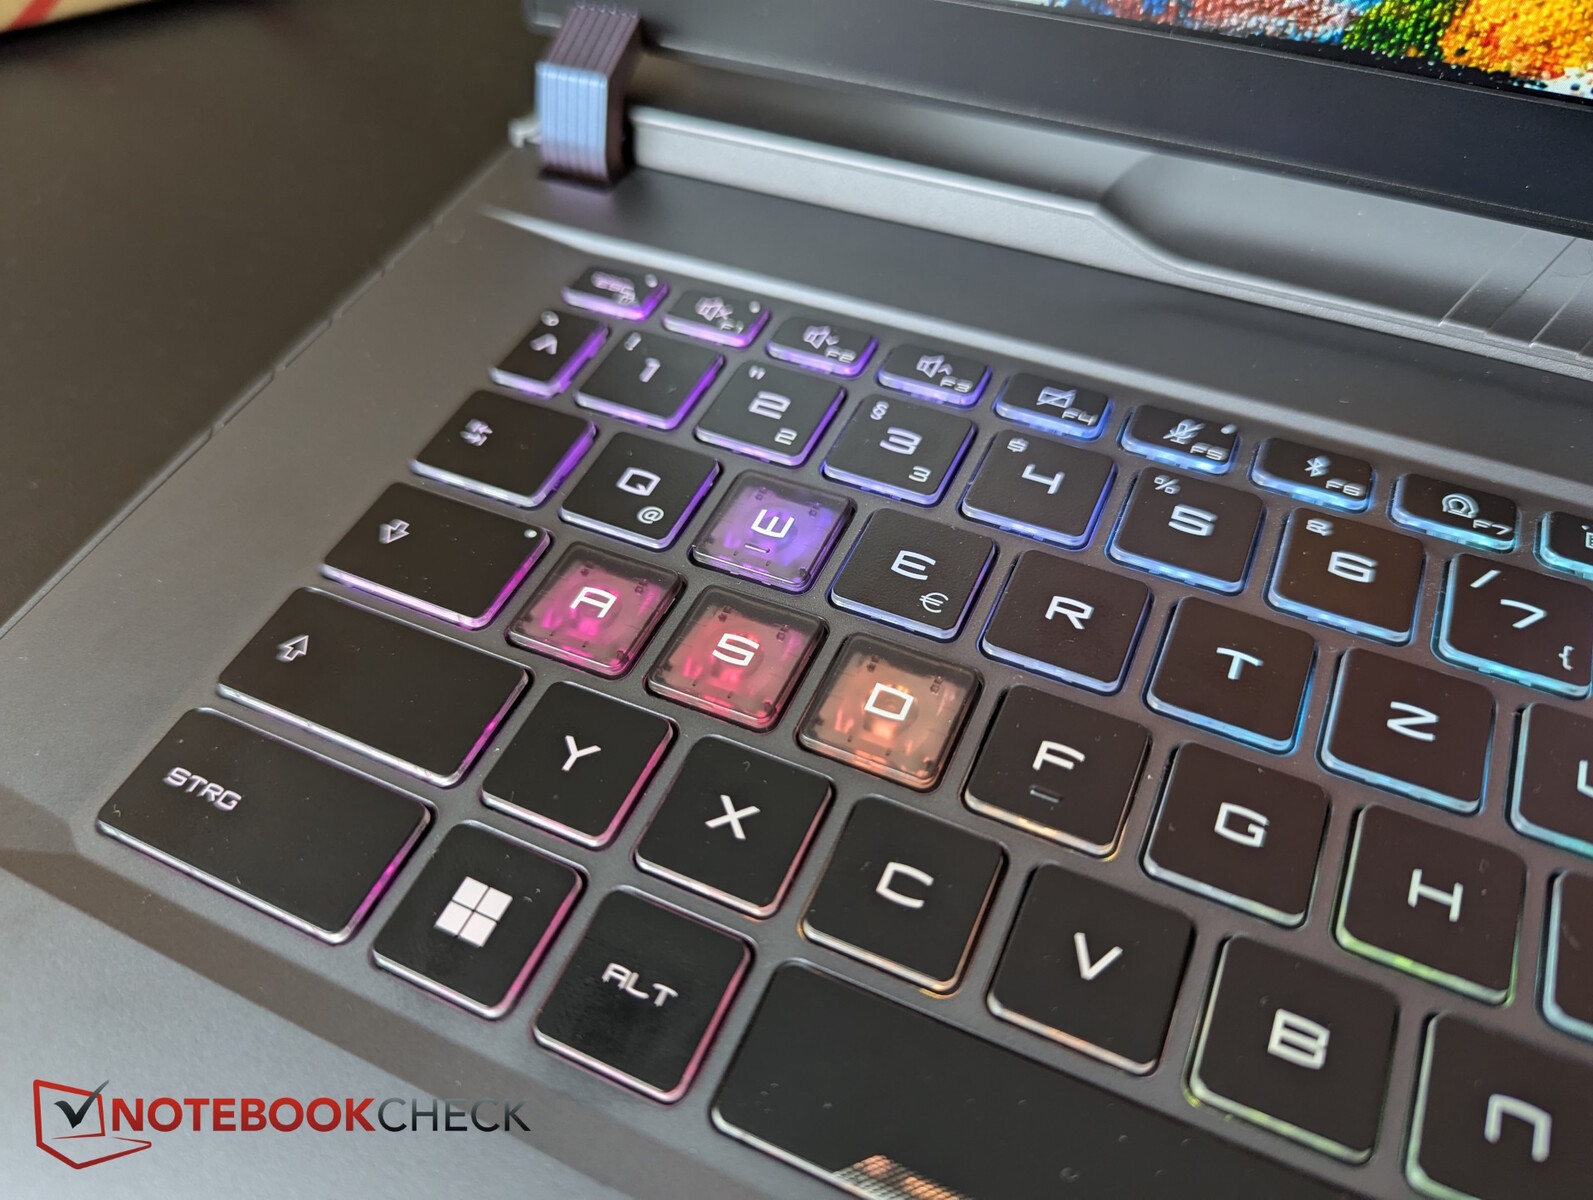
- Dispositivos de entrada - Este layout da MSI!
- Tela - QHD+ IPS com 470 nits
- Desempenho - Colapso da CPU sob carga contínua
- Emissões e energia - Até 60 dB(A) é bastante alto em comparação
- Avaliação geral do Notebookcheck
- Comparação de possíveis alternativas
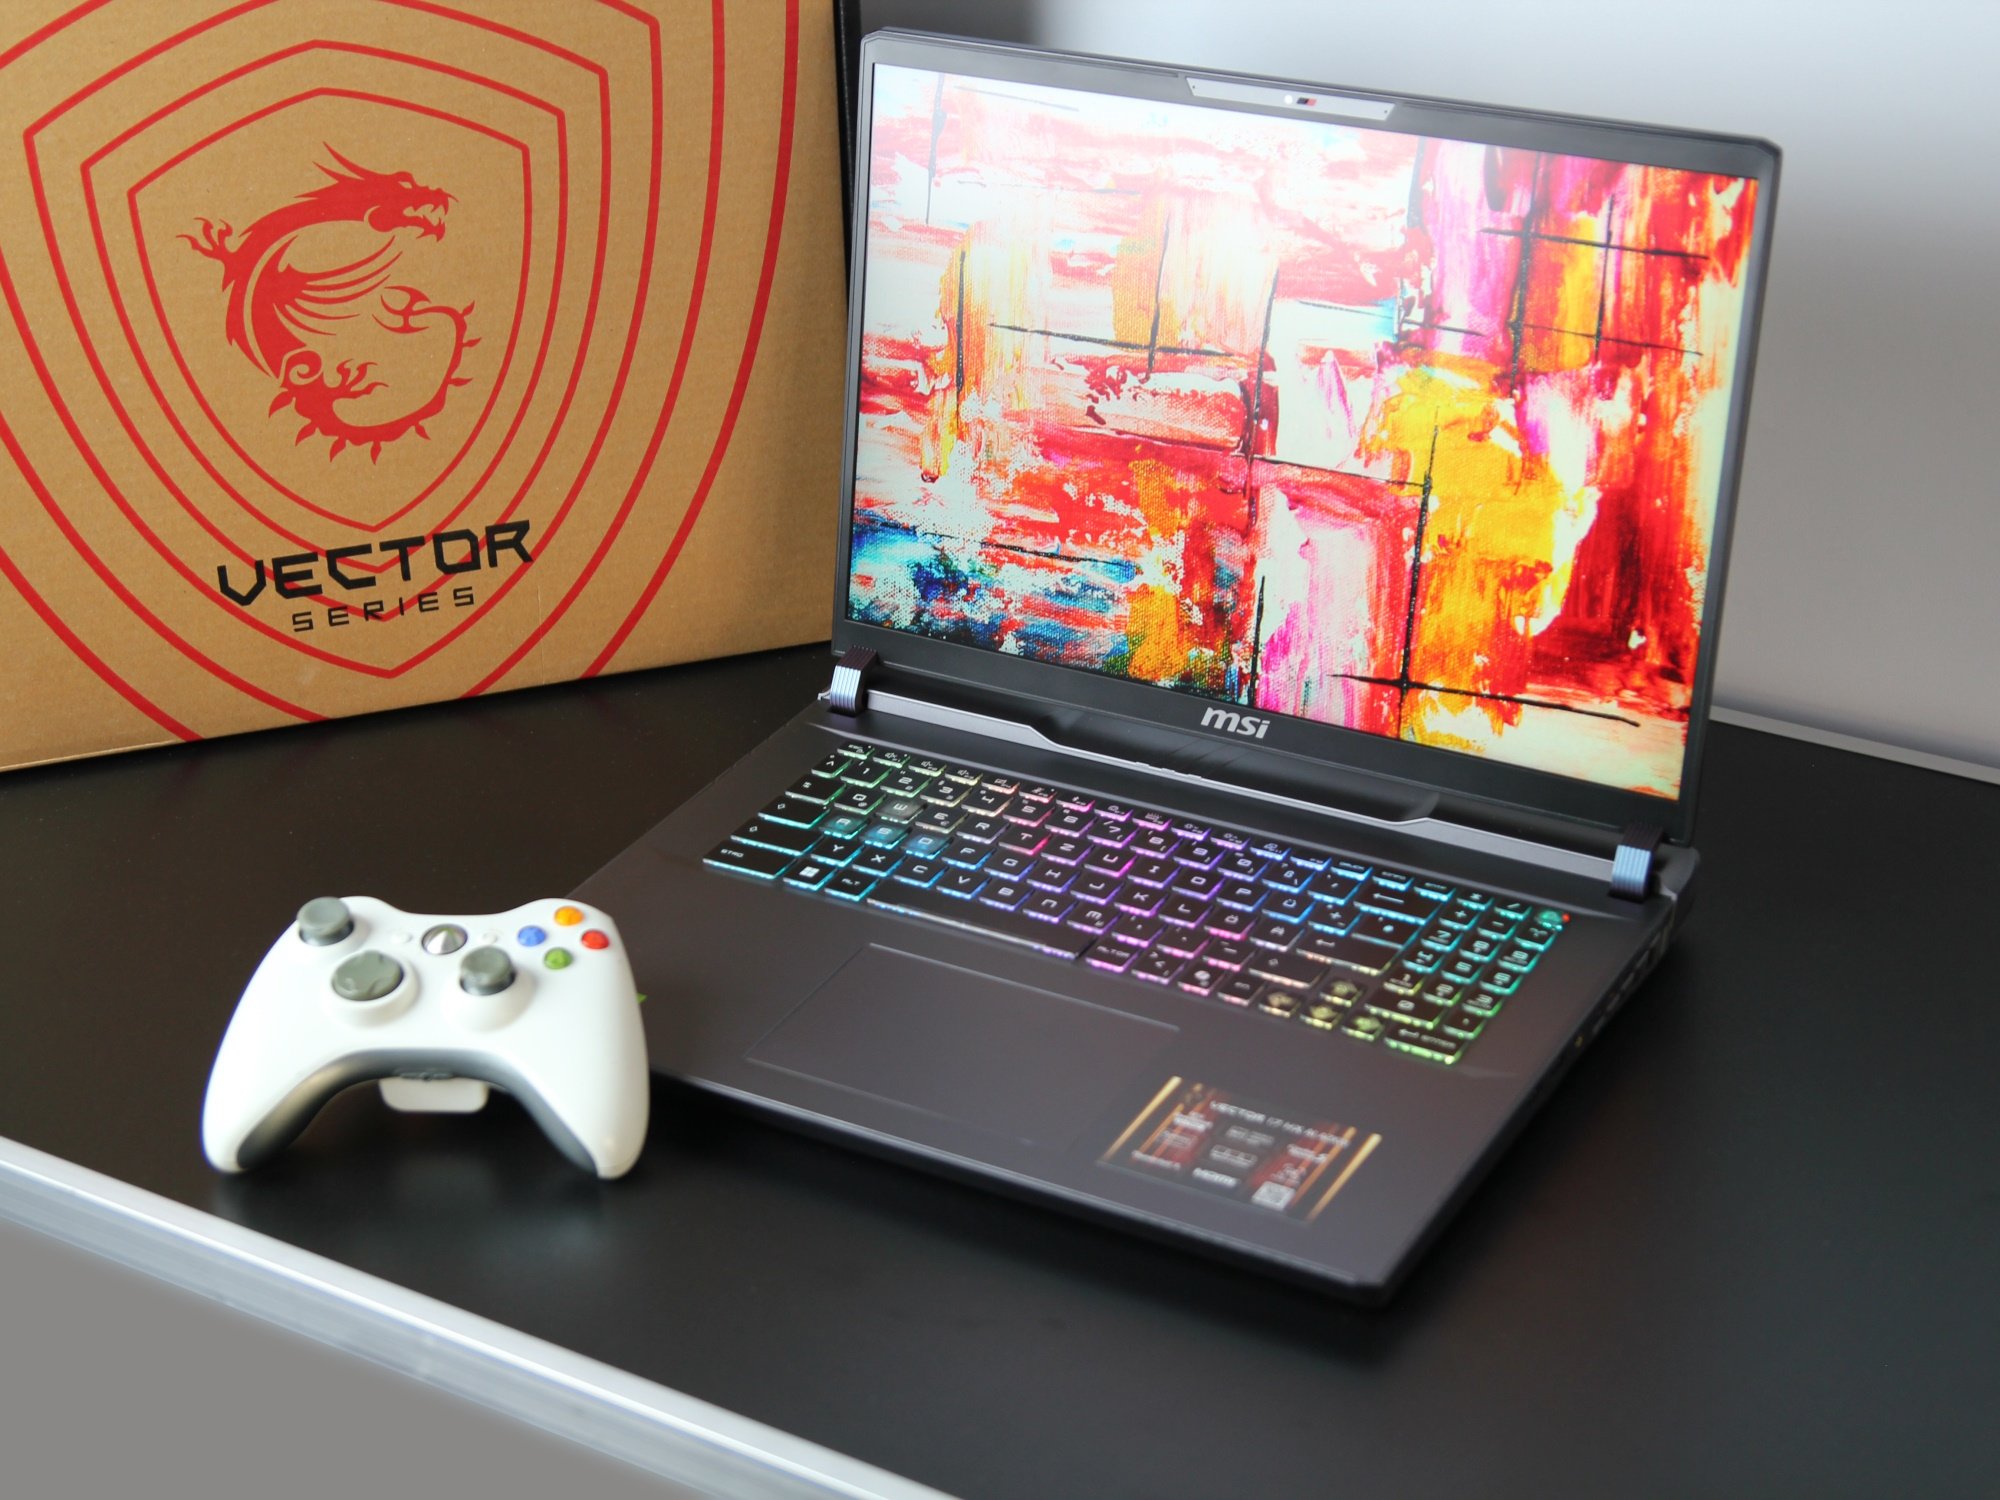
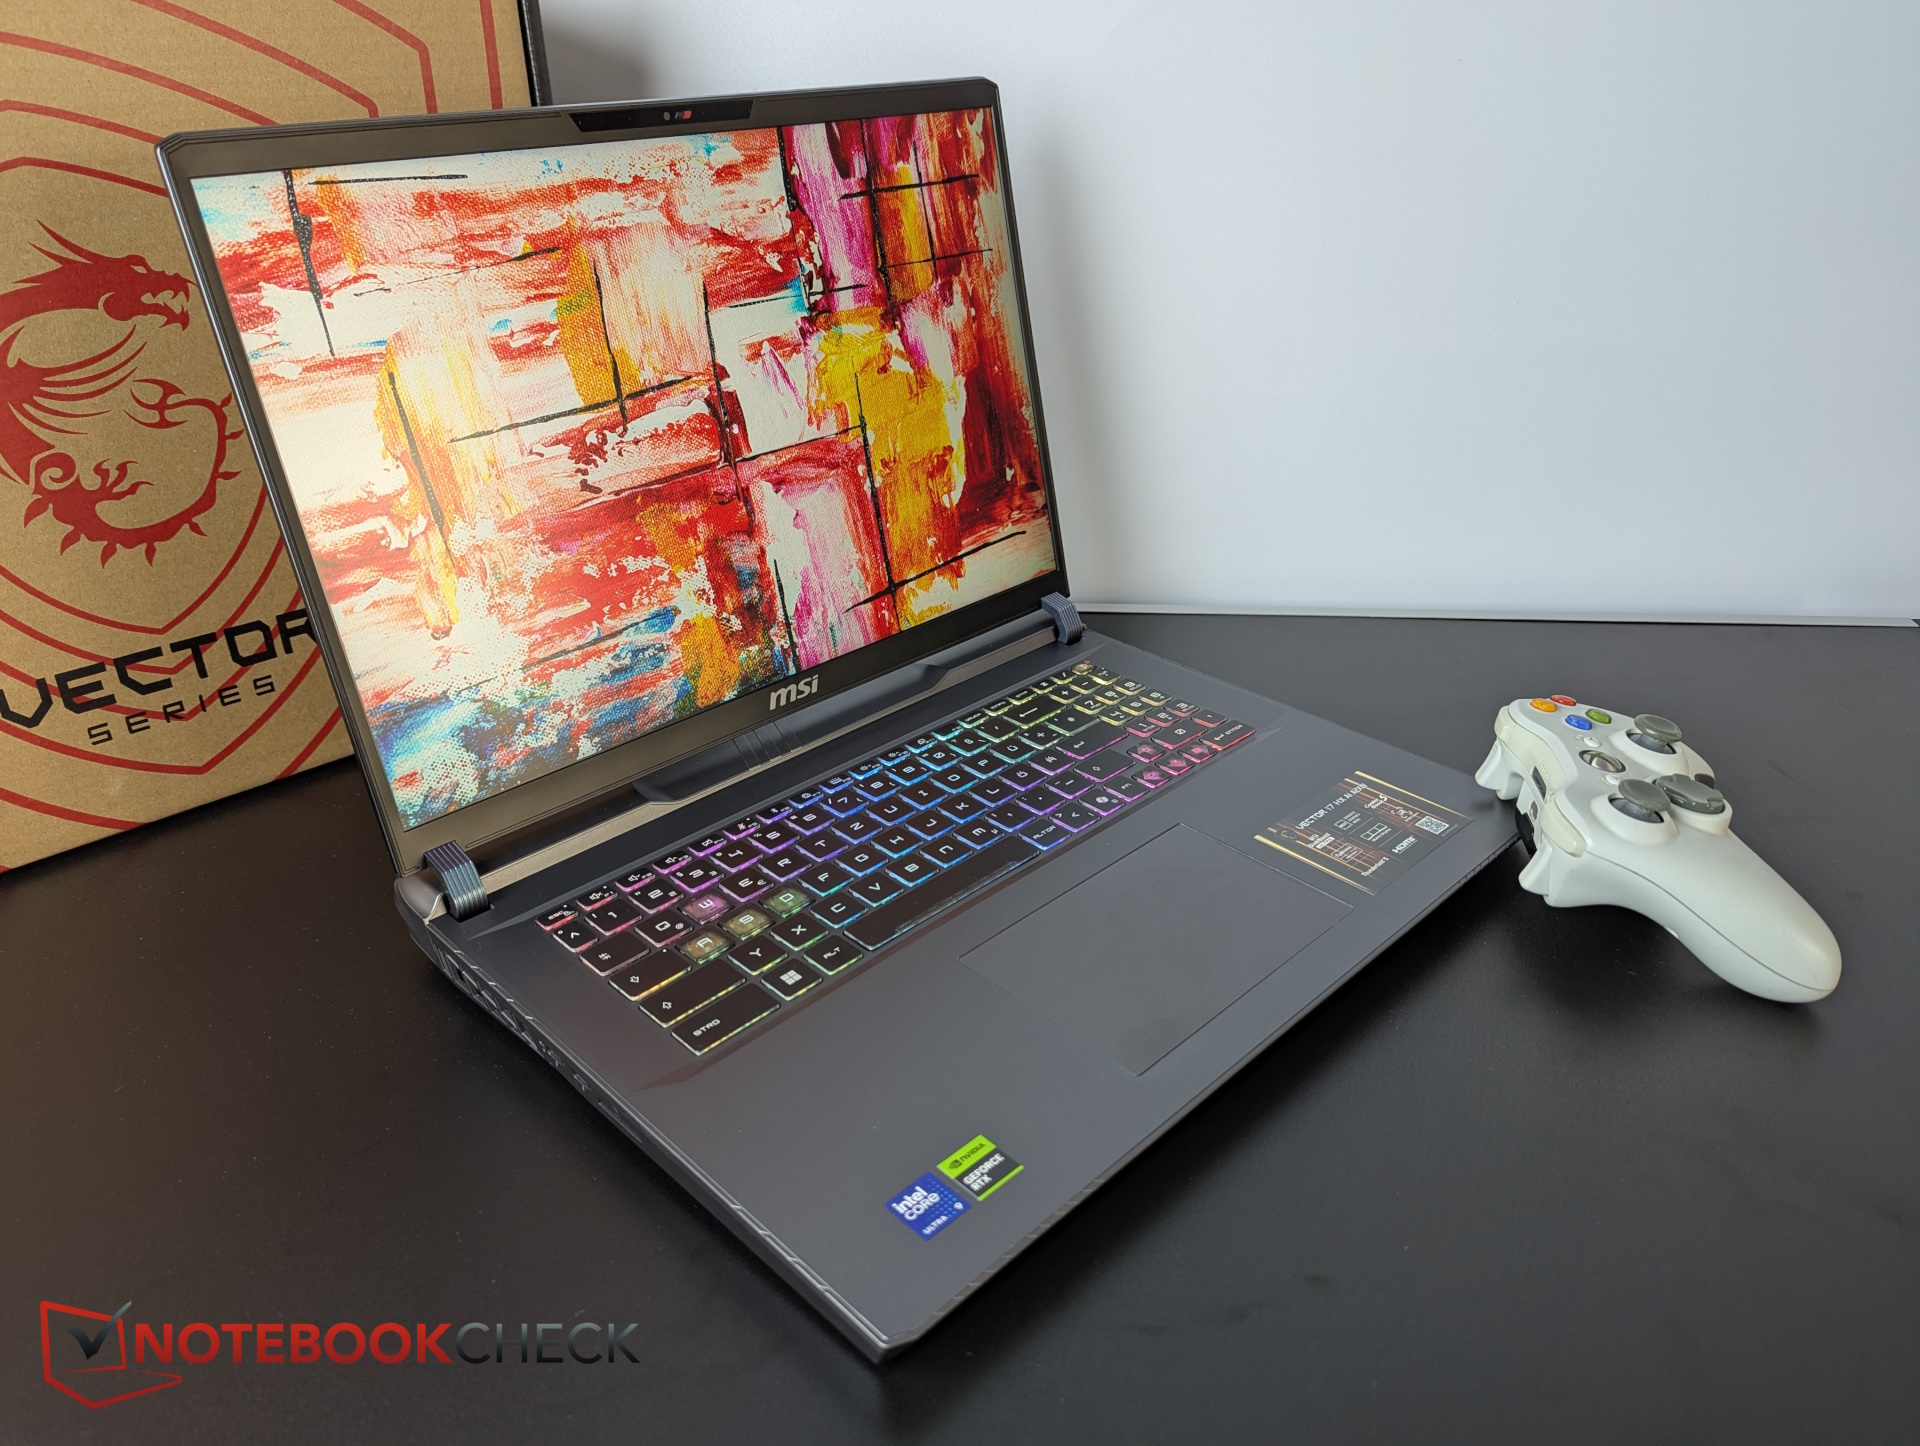
os gamers de 17 polegadas com gráficos Blackwell são extremamente raros e, portanto, o gamer fica entre os muitos dispositivos de 16 e 18 polegadas. Nosso Vector 17 HX AI está disponível com RTX 5090, 5080 ou 5070 Ti, e estamos testando a configuração intermediária.
Especificações
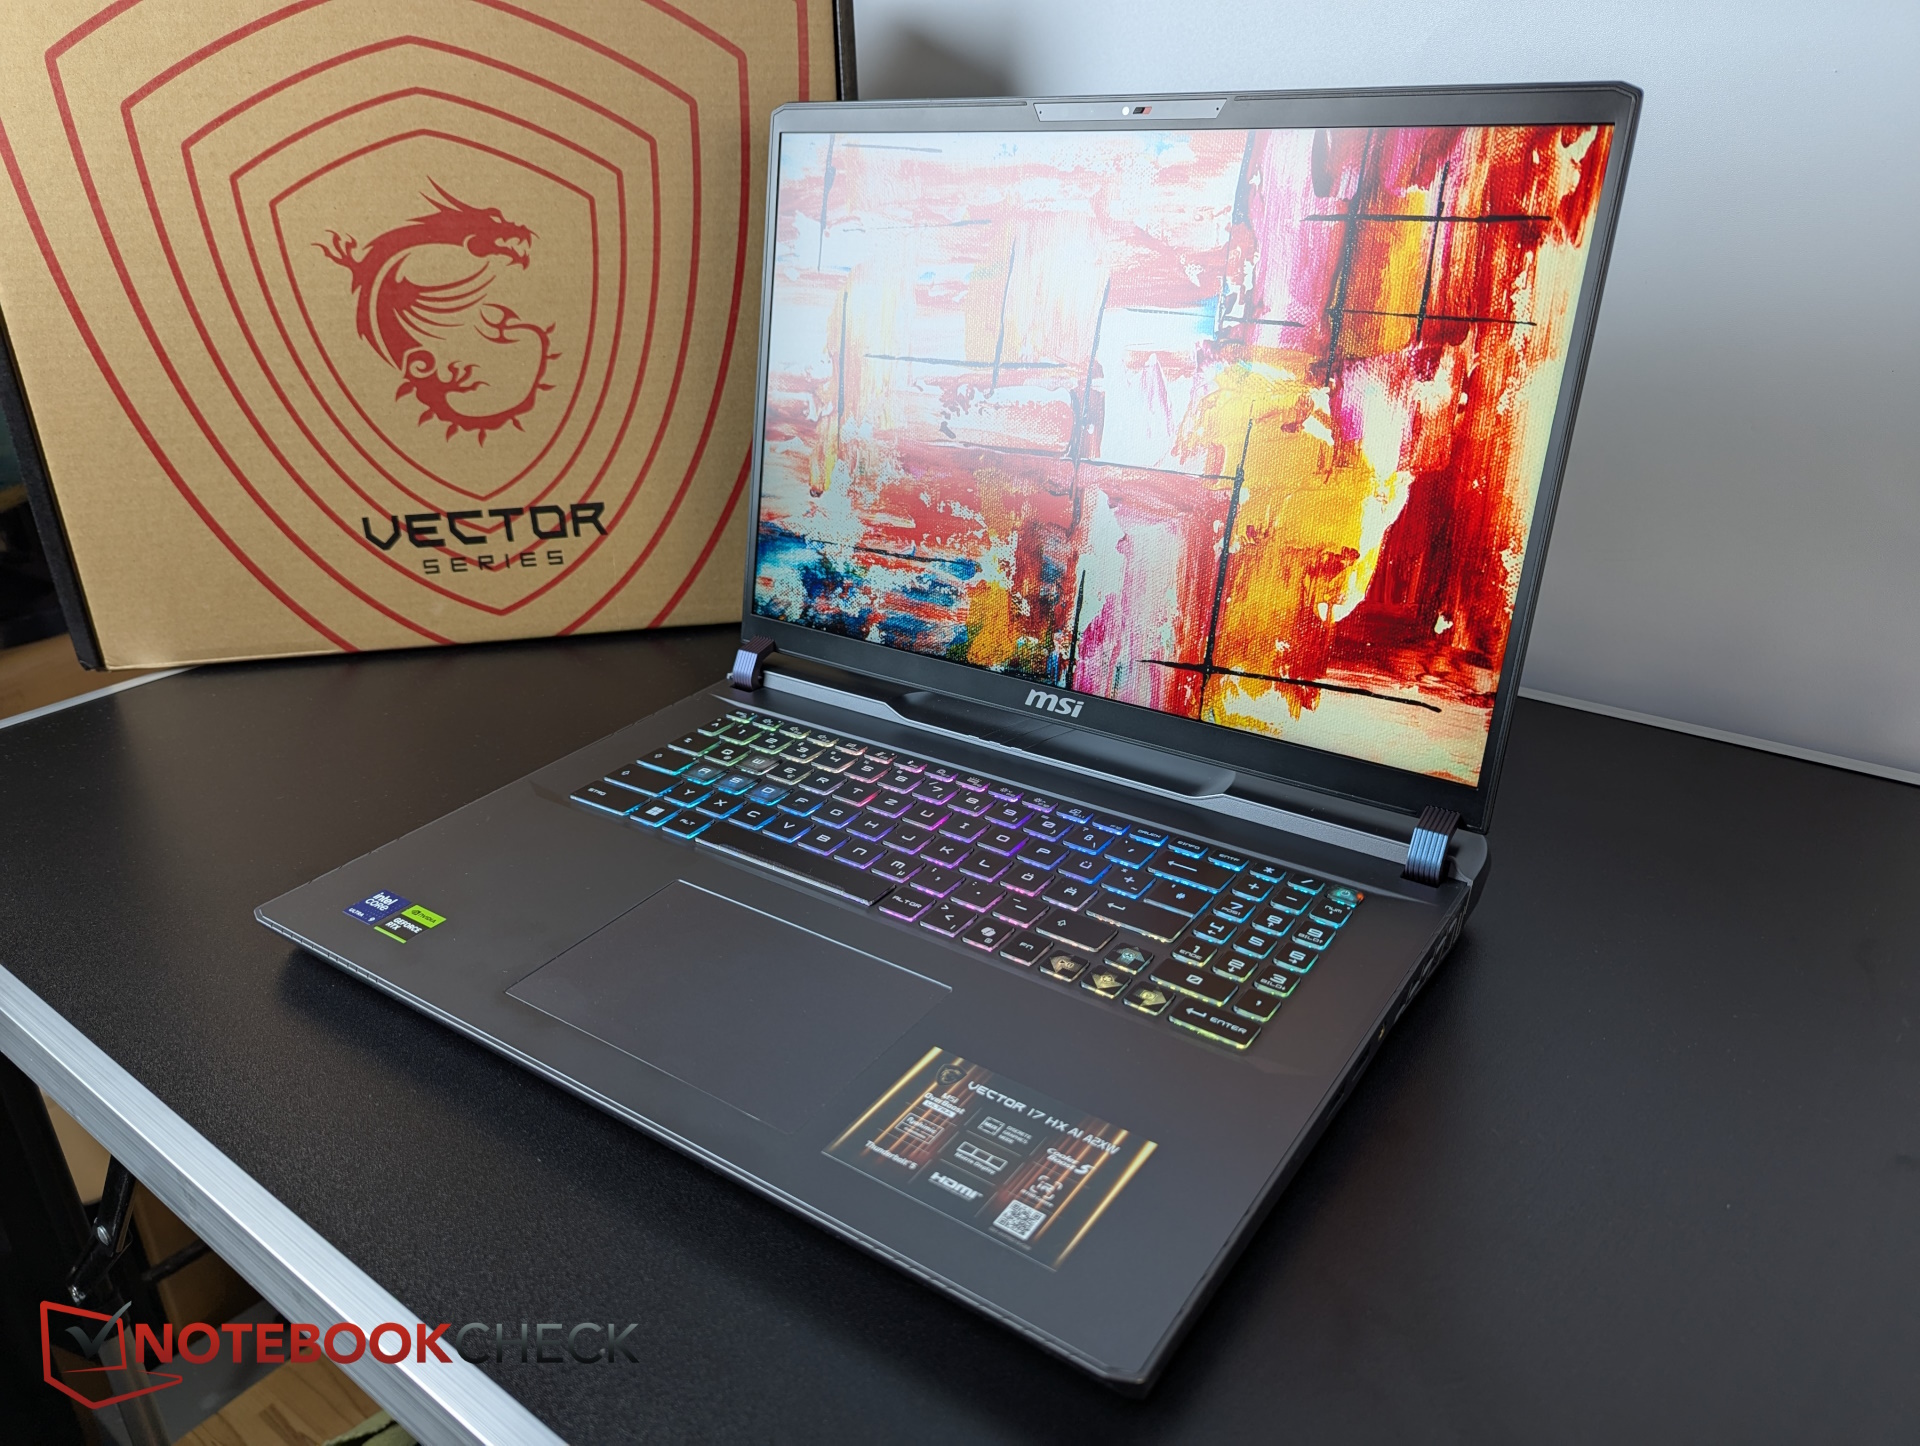
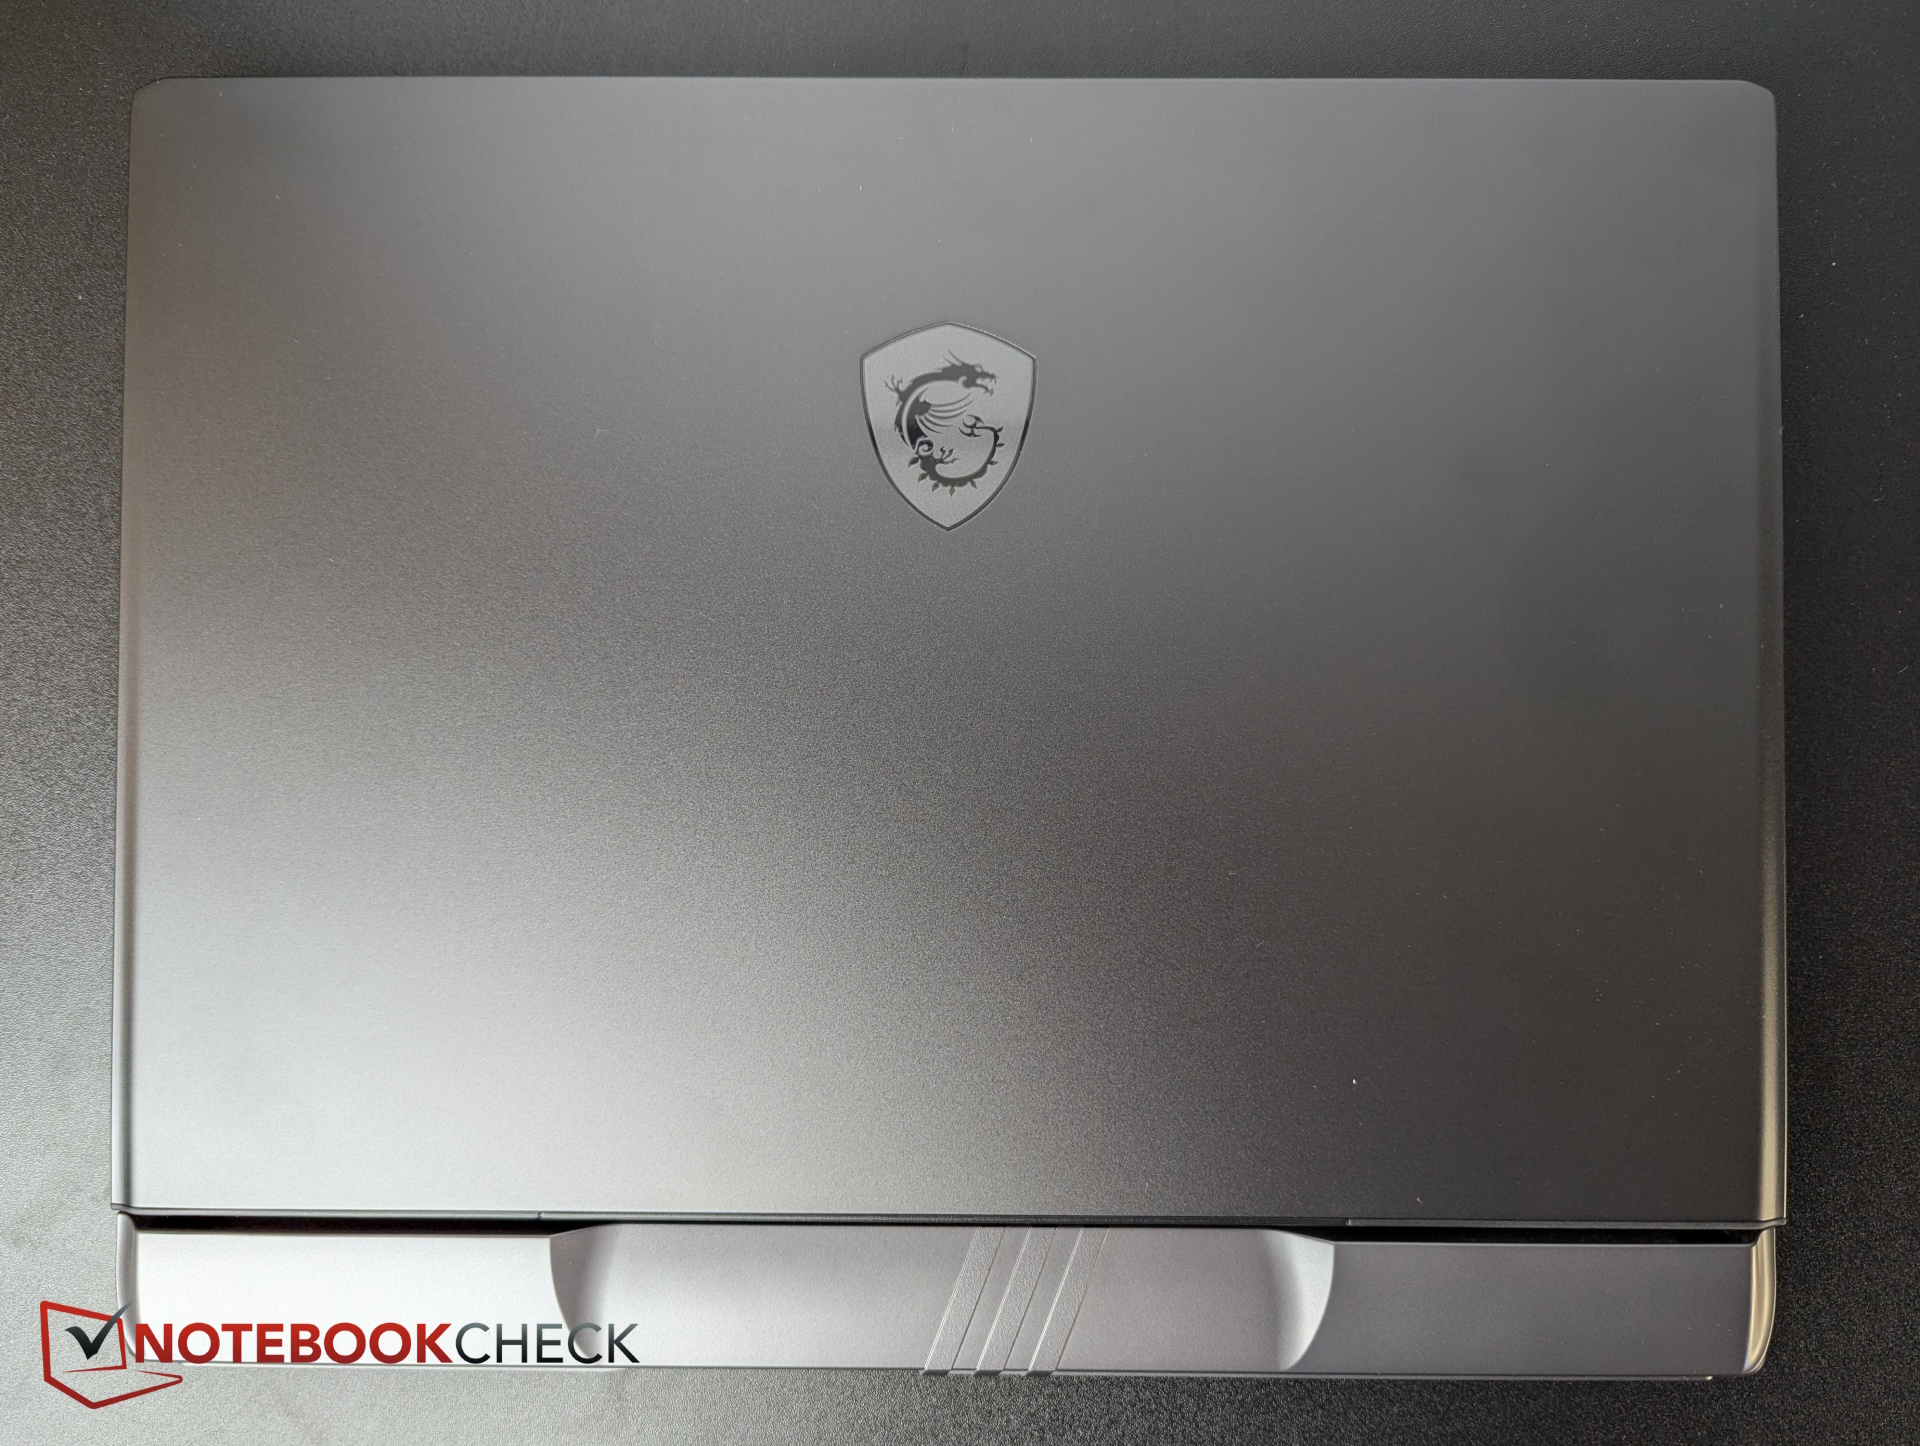
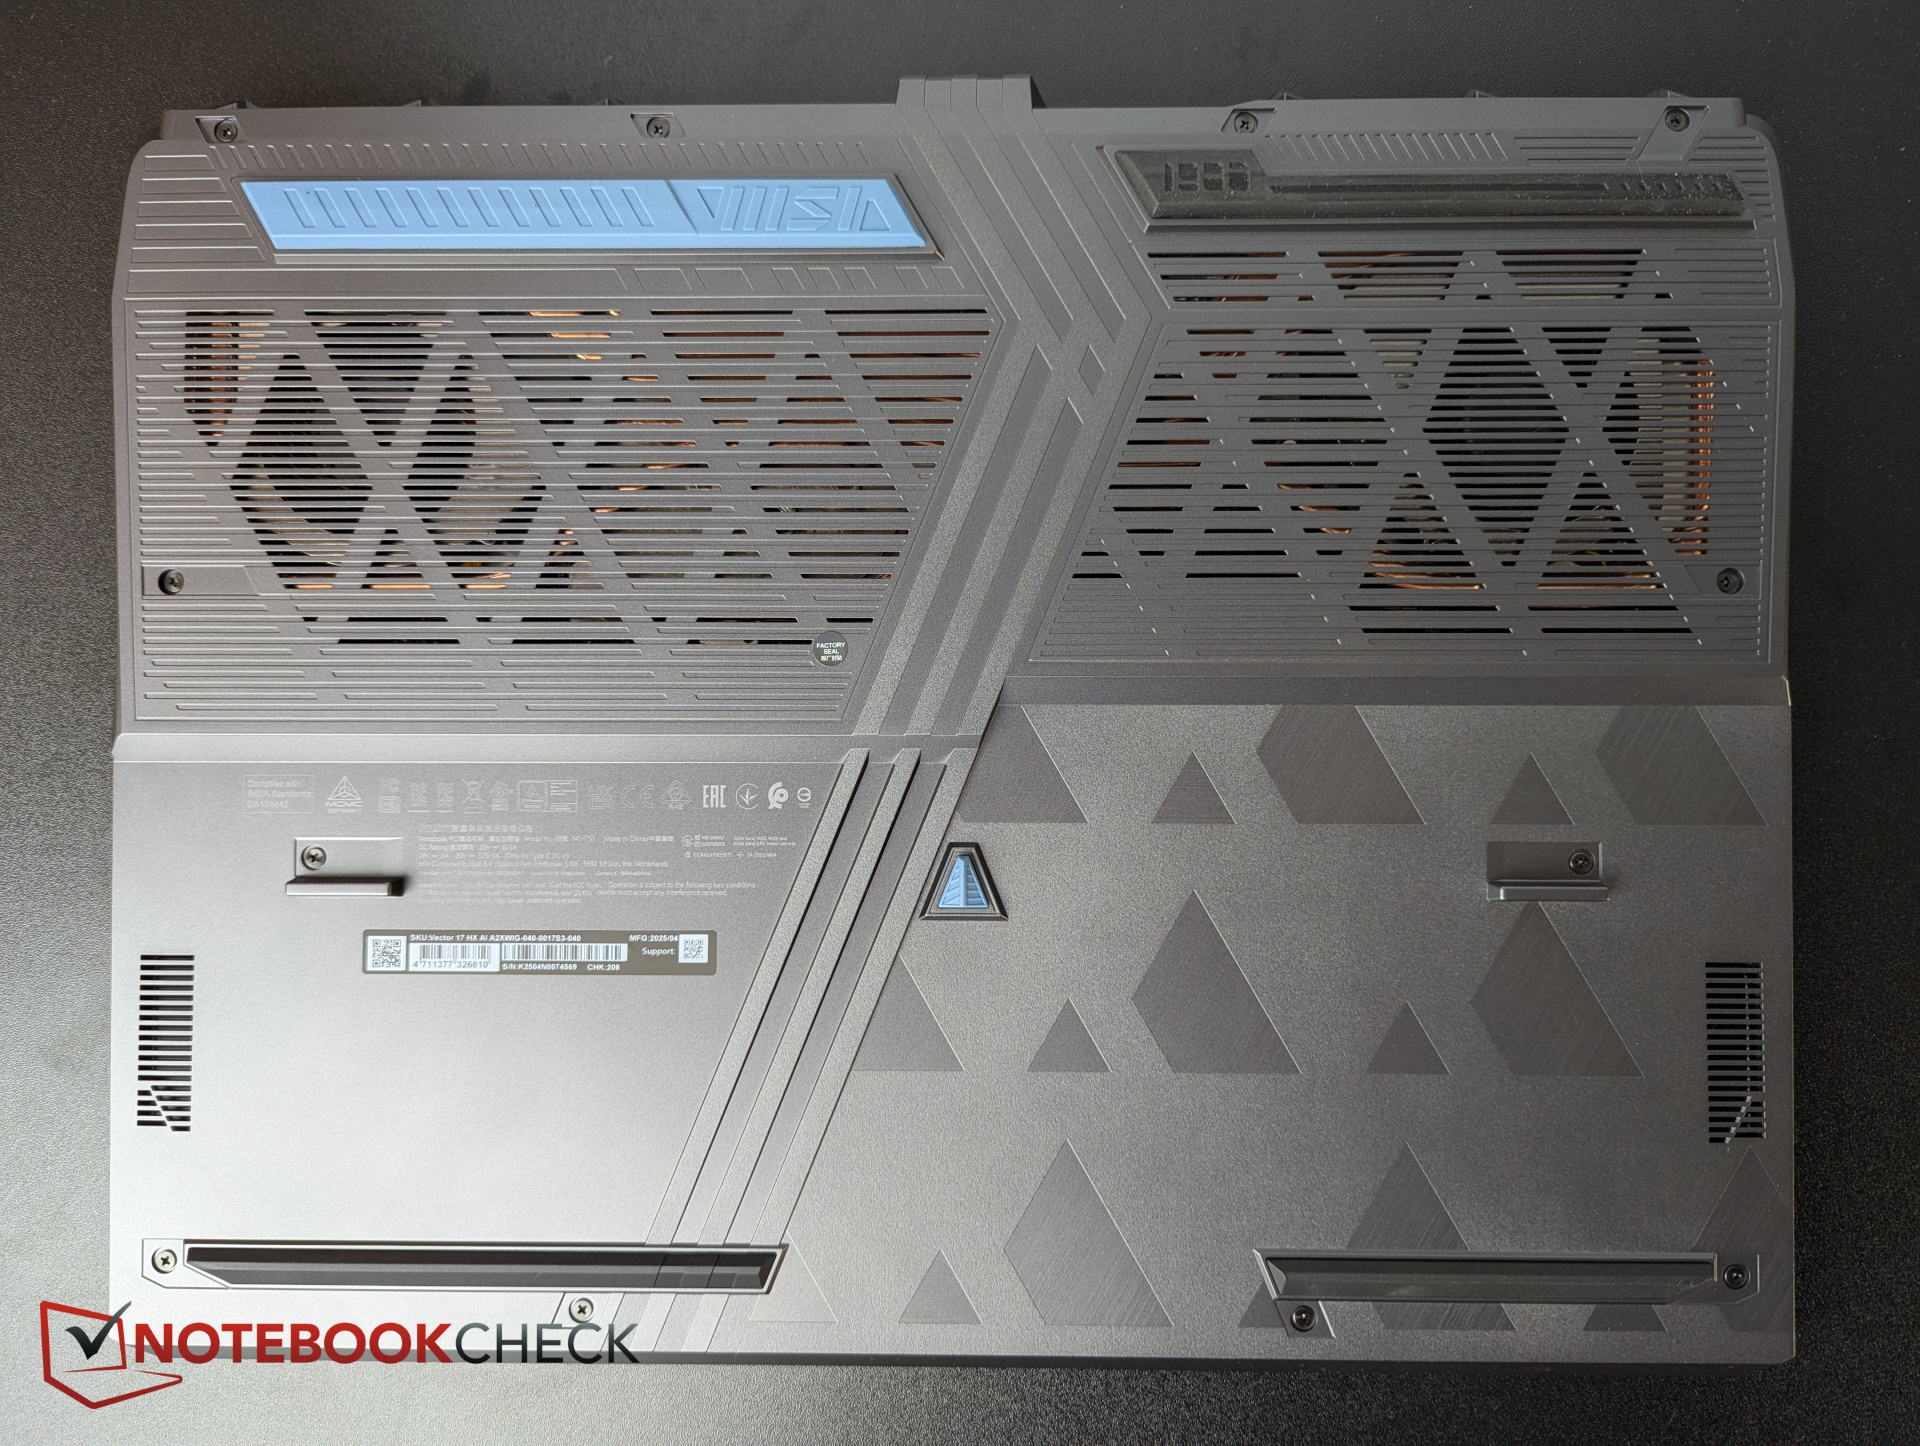
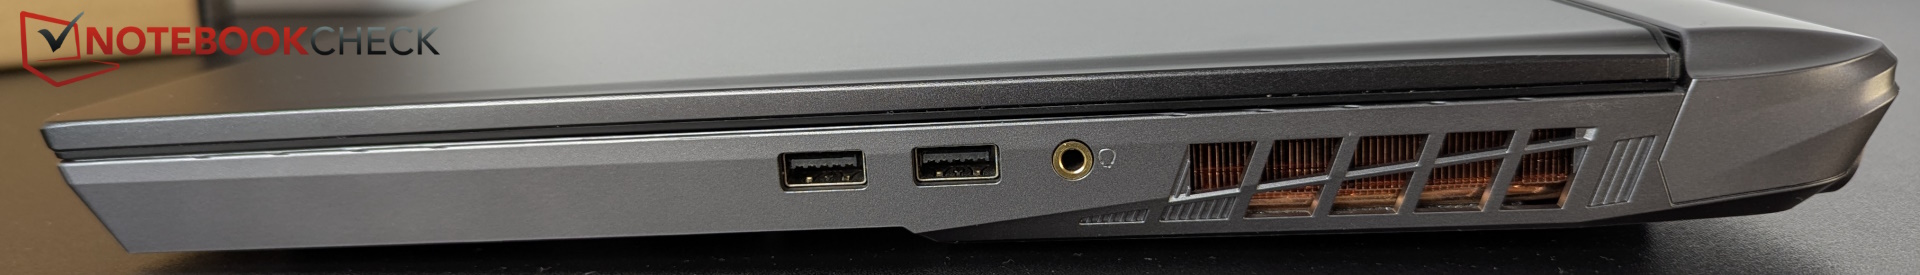
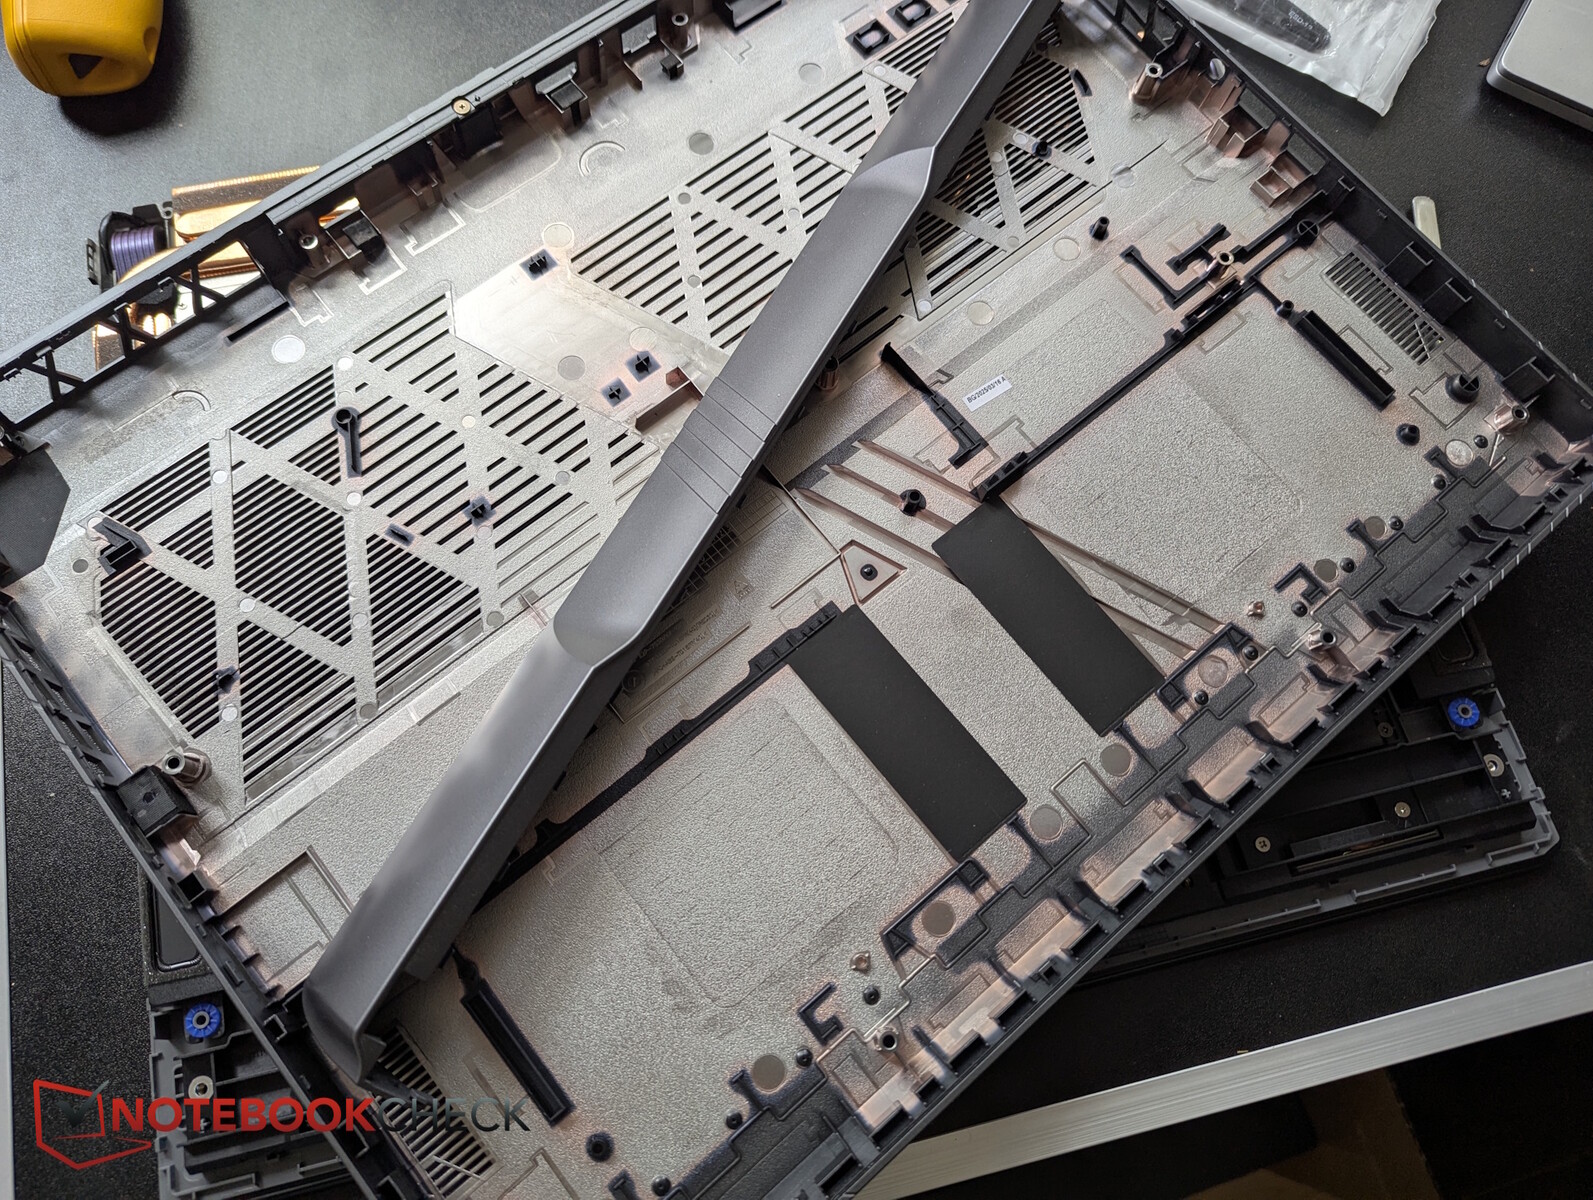
Case e recursos - Tão grande quanto um Alienware
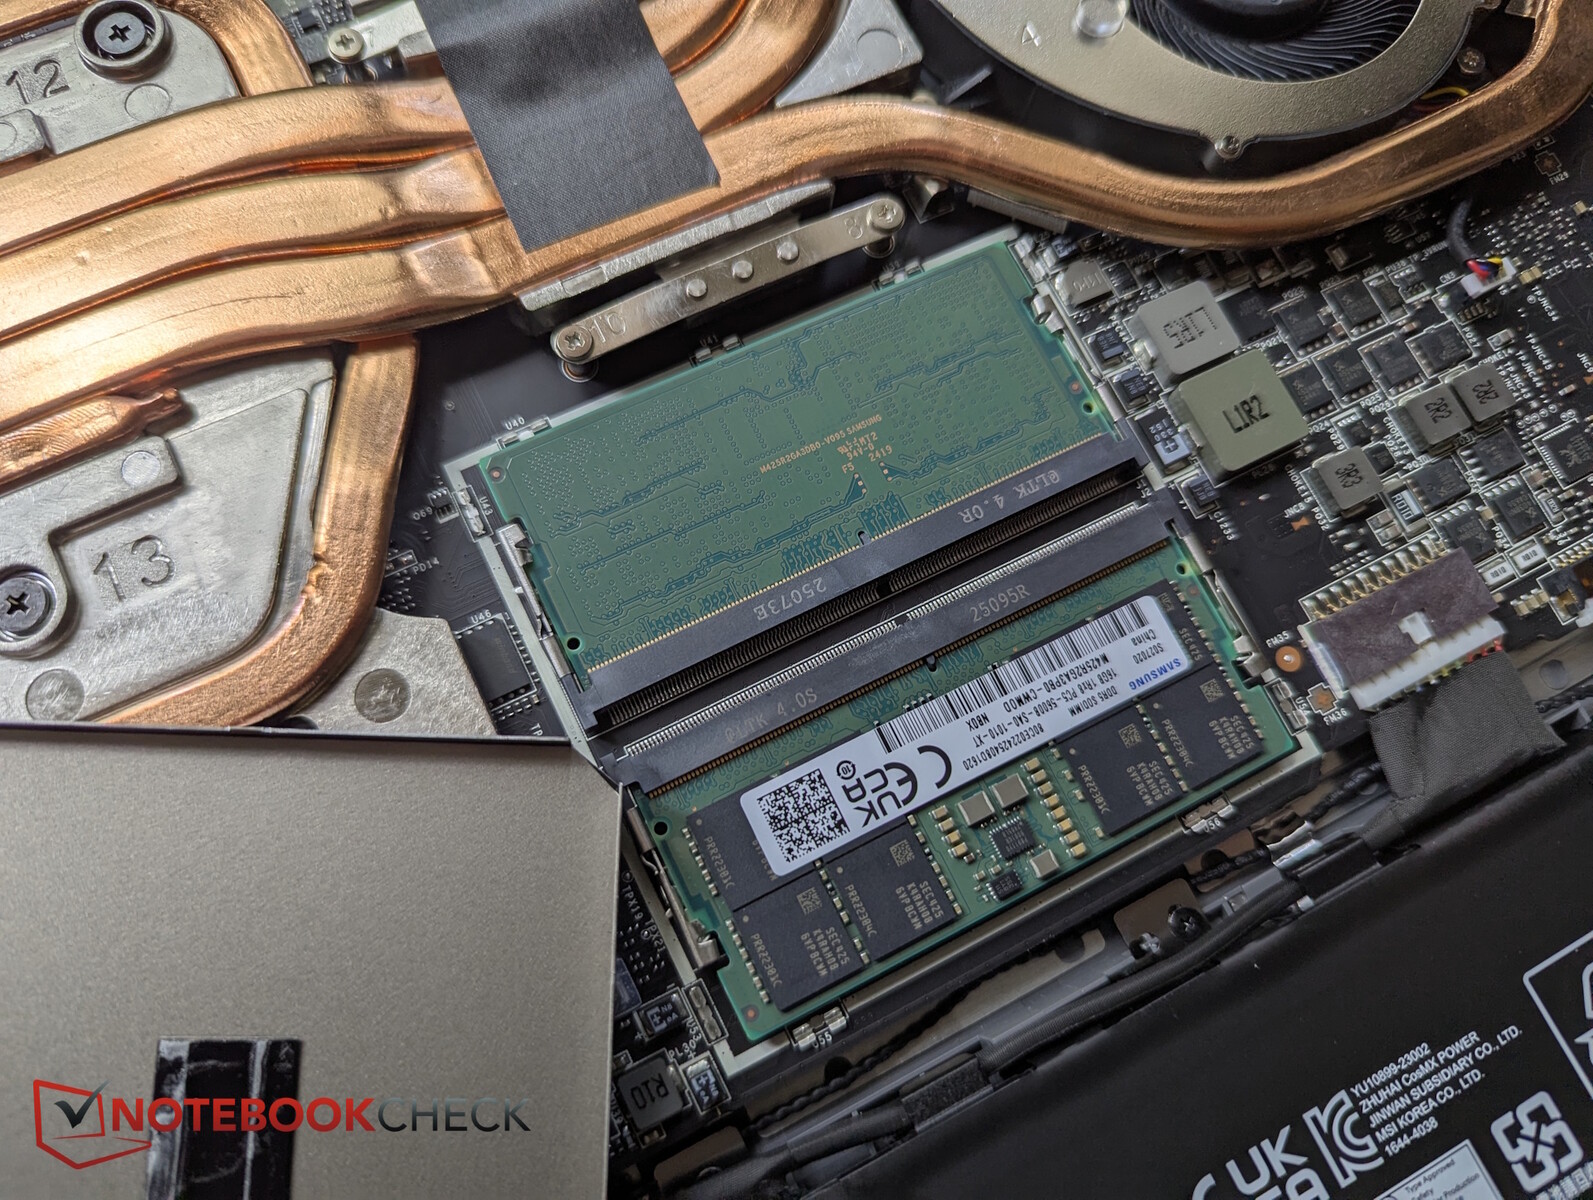
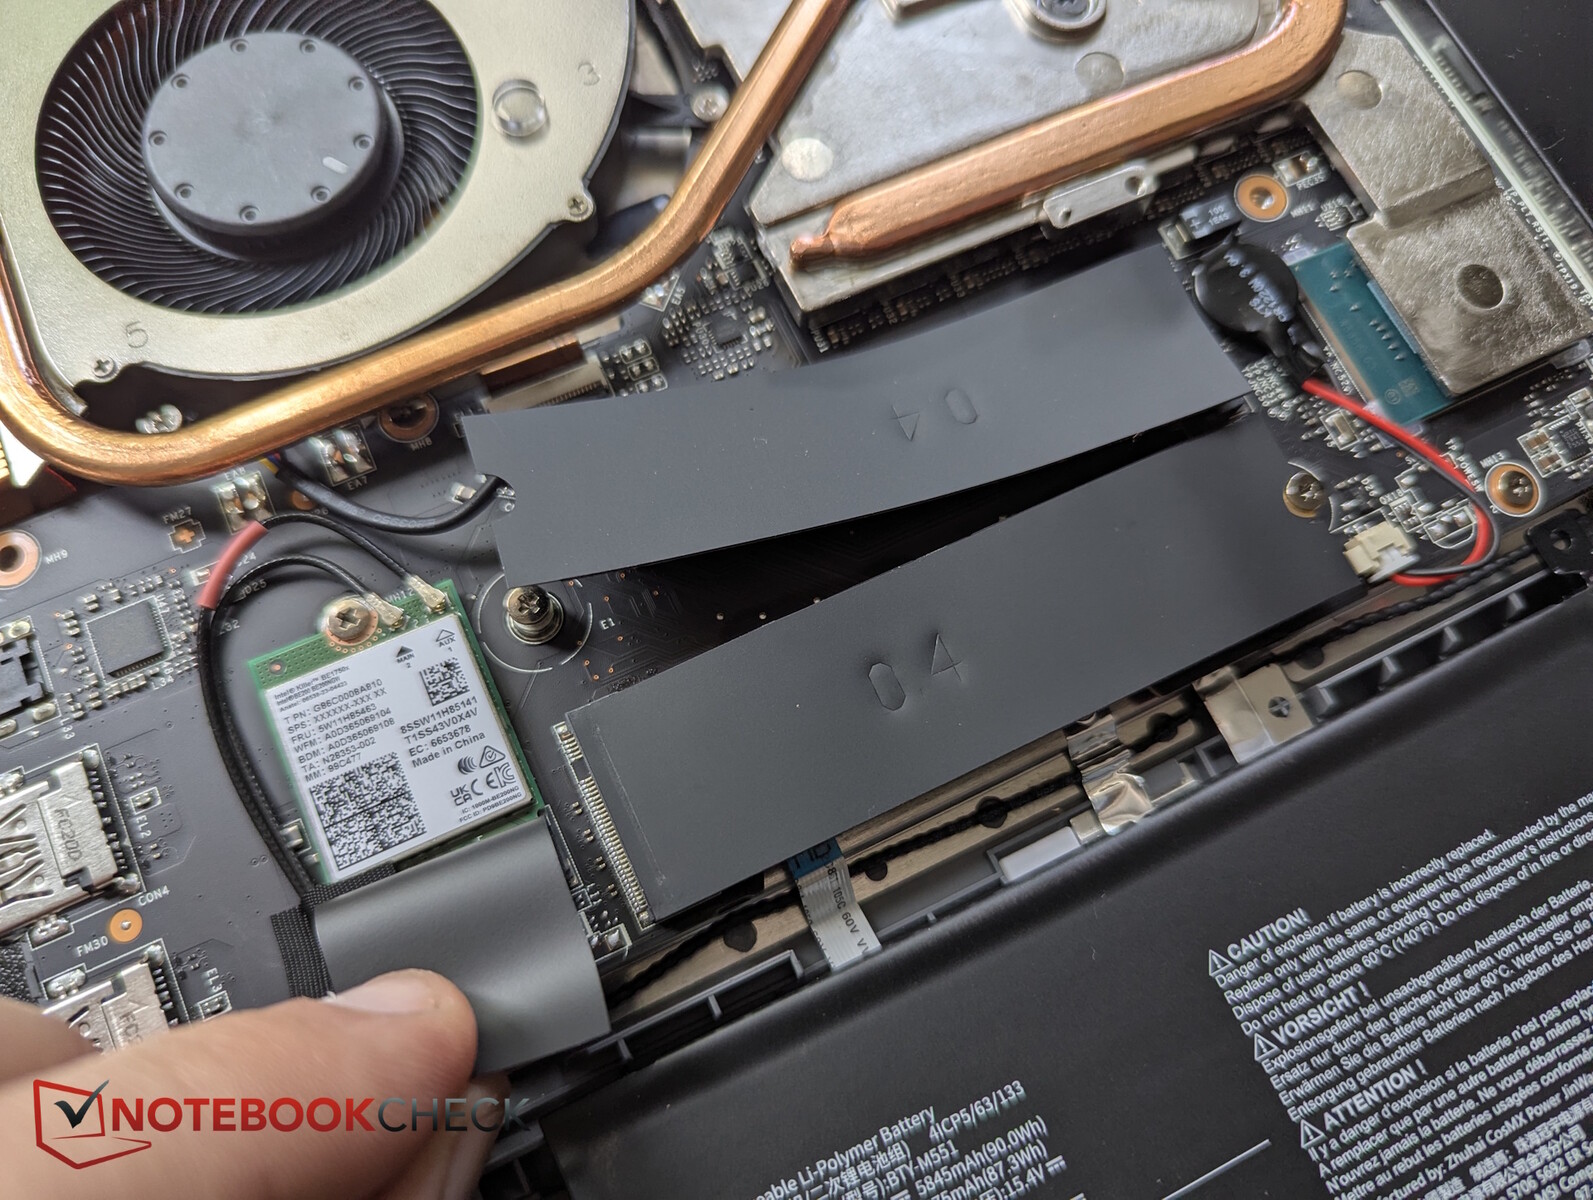
Como já temos o MSI Vector 16 HX AI com quase o mesmo gabinete, neste momento nos referimos ao seu Teste e pularemos as seções sobre o gabinete, a manutenção e os dispositivos de entrada.
| SD Card Reader | |
| average JPG Copy Test (av. of 3 runs) | |
| Alienware 16 Area-51 (Toshiba Exceria Pro SDXC 64 GB UHS-II) | |
| Média da turma Gaming (20.9 - 210, n=54, últimos 2 anos) | |
| Schenker XMG Neo 16 A25 5090 (Angelbird AV Pro V60) | |
| Aorus MASTER 16 AM6H | |
| MSI Vector 17 HX AI A2XWIG | |
| MSI Titan 18 HX AI A2XWJG (AV PRO microSD 128 GB V60) | |
| MSI Raider A18 HX A9WIG-080 | |
| maximum AS SSD Seq Read Test (1GB) | |
| Schenker XMG Neo 16 A25 5090 (Angelbird AV Pro V60) | |
| Alienware 16 Area-51 (Toshiba Exceria Pro SDXC 64 GB UHS-II) | |
| MSI Vector 17 HX AI A2XWIG | |
| Aorus MASTER 16 AM6H | |
| MSI Raider A18 HX A9WIG-080 | |
| Média da turma Gaming (25.5 - 261, n=51, últimos 2 anos) | |
| MSI Titan 18 HX AI A2XWJG (AV PRO microSD 128 GB V60) | |
Webcam
Uma webcam Full HD com obturador manual, boa fidelidade de cores e nitidez média está instalada.


Dispositivos de entrada - Este layout da MSI!
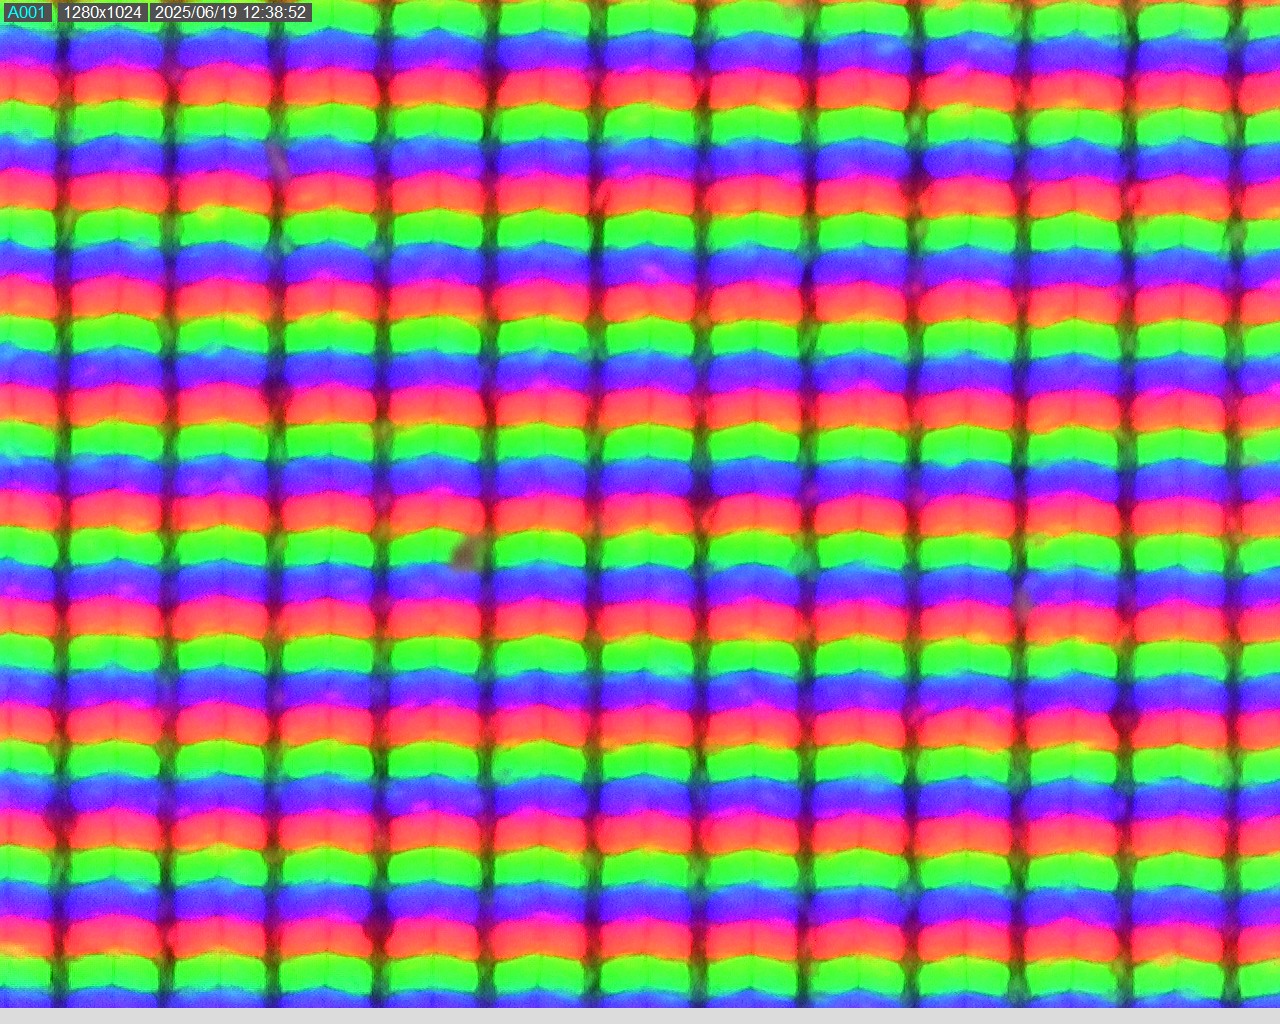
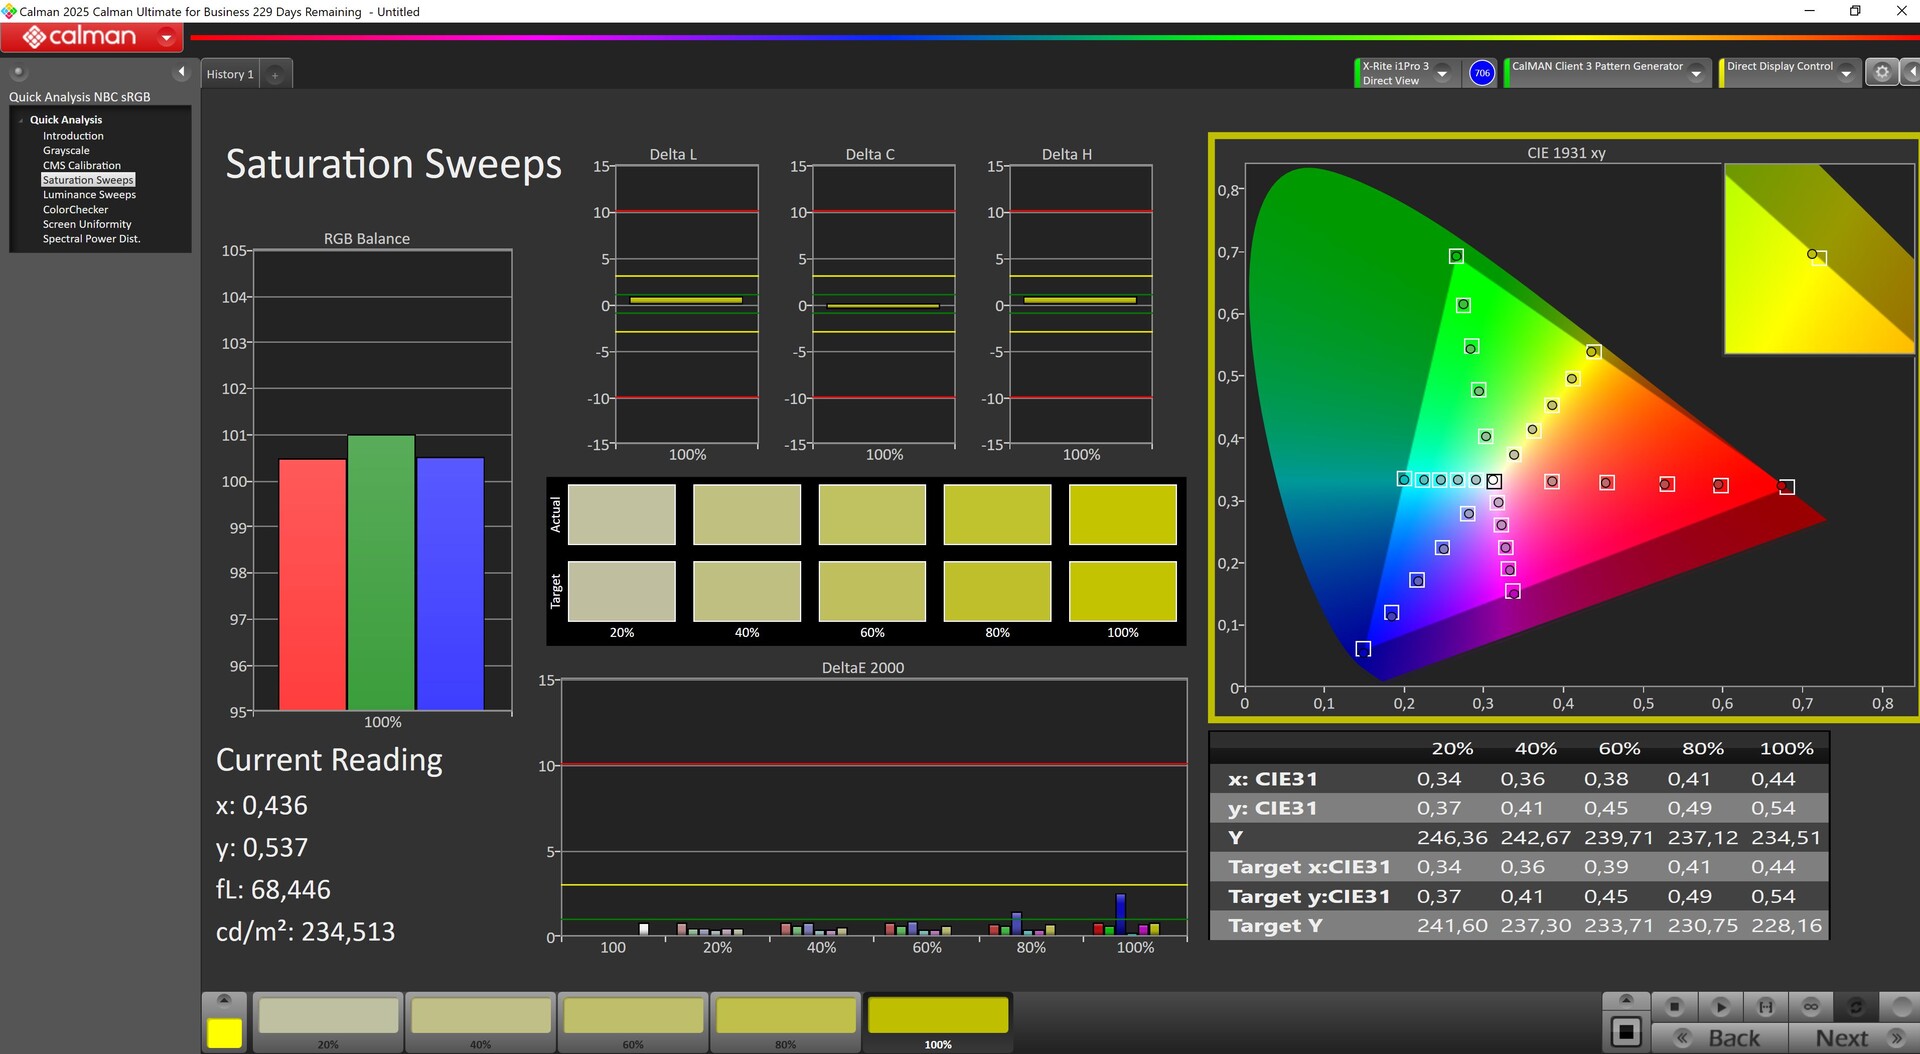
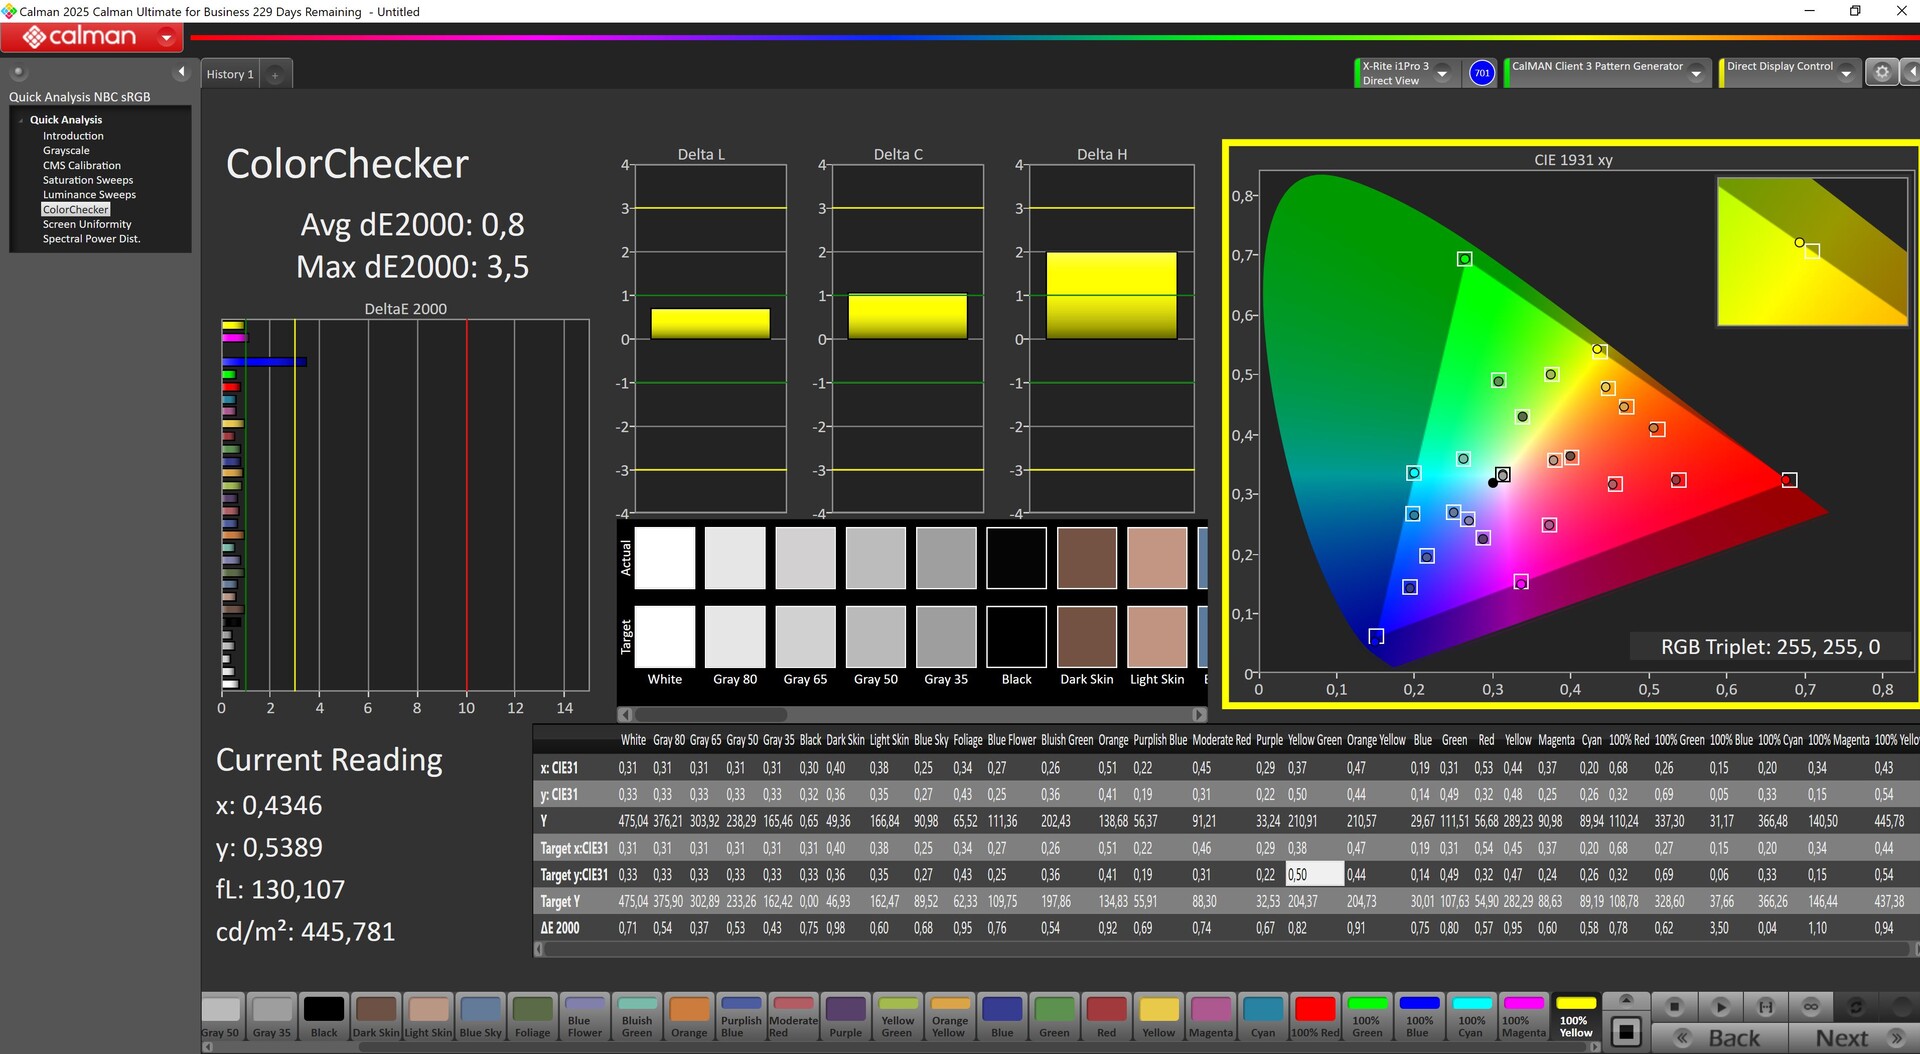
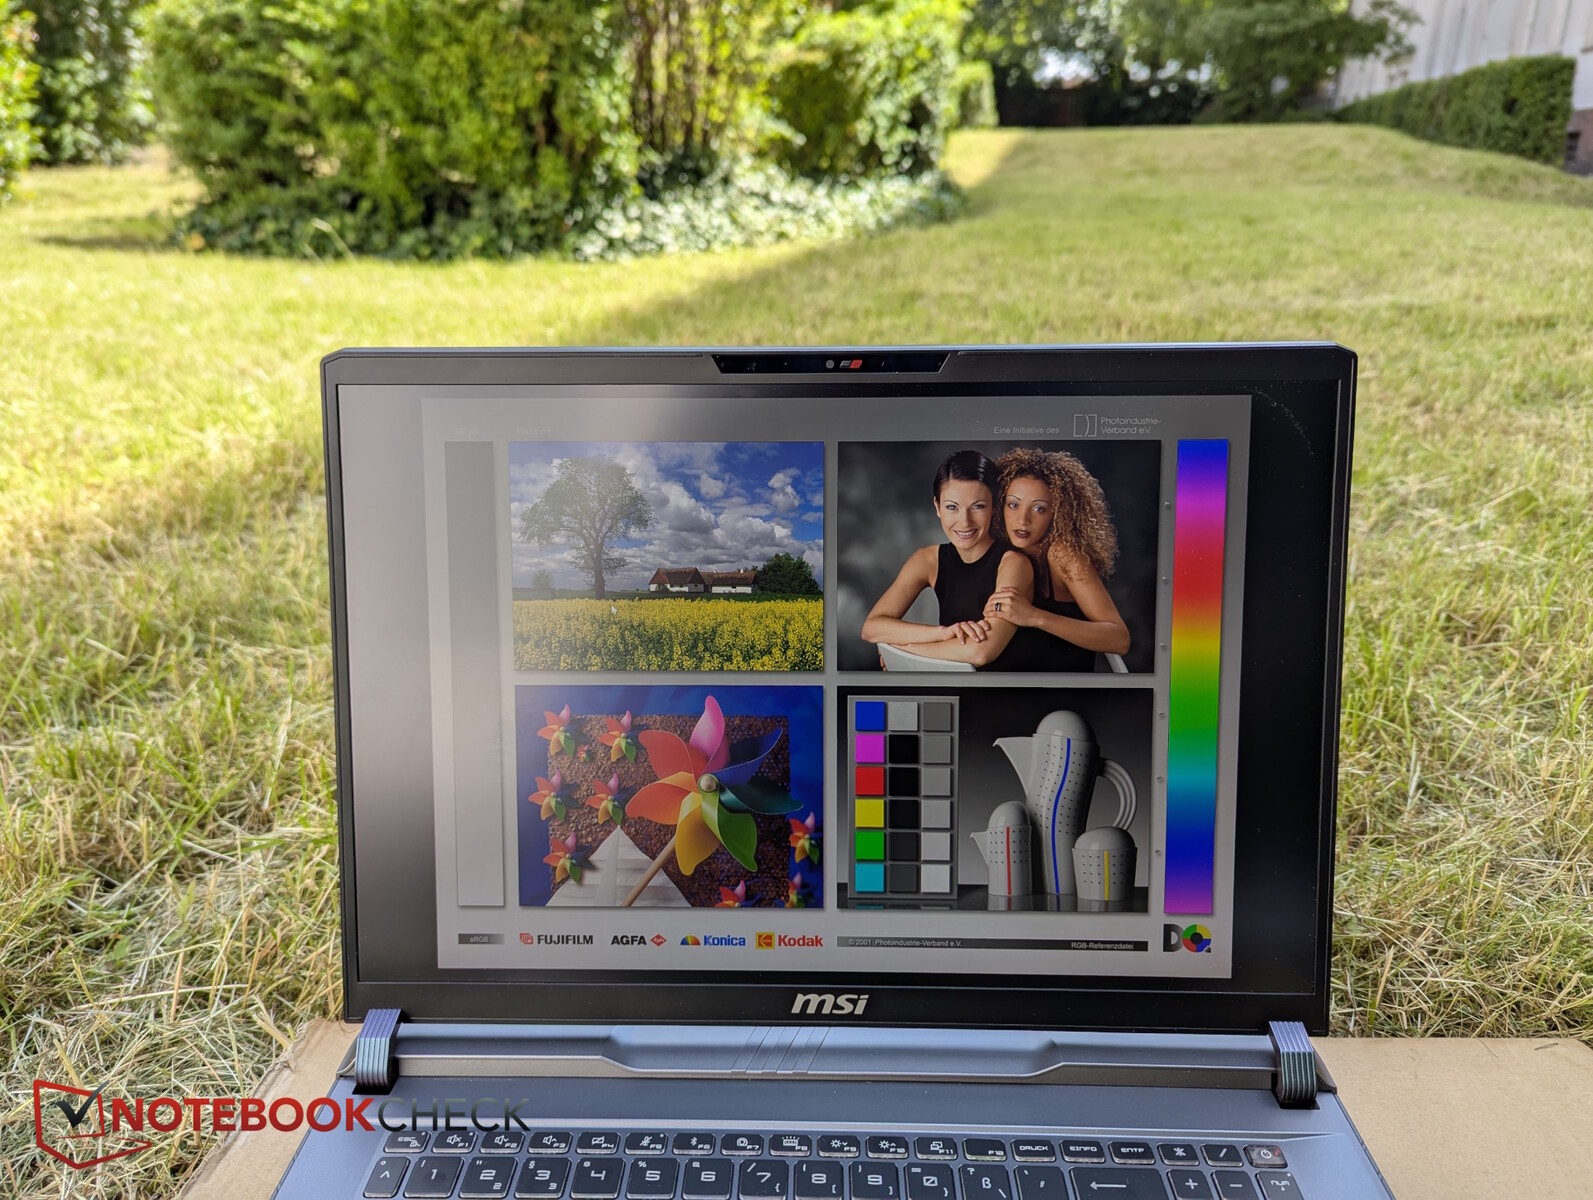
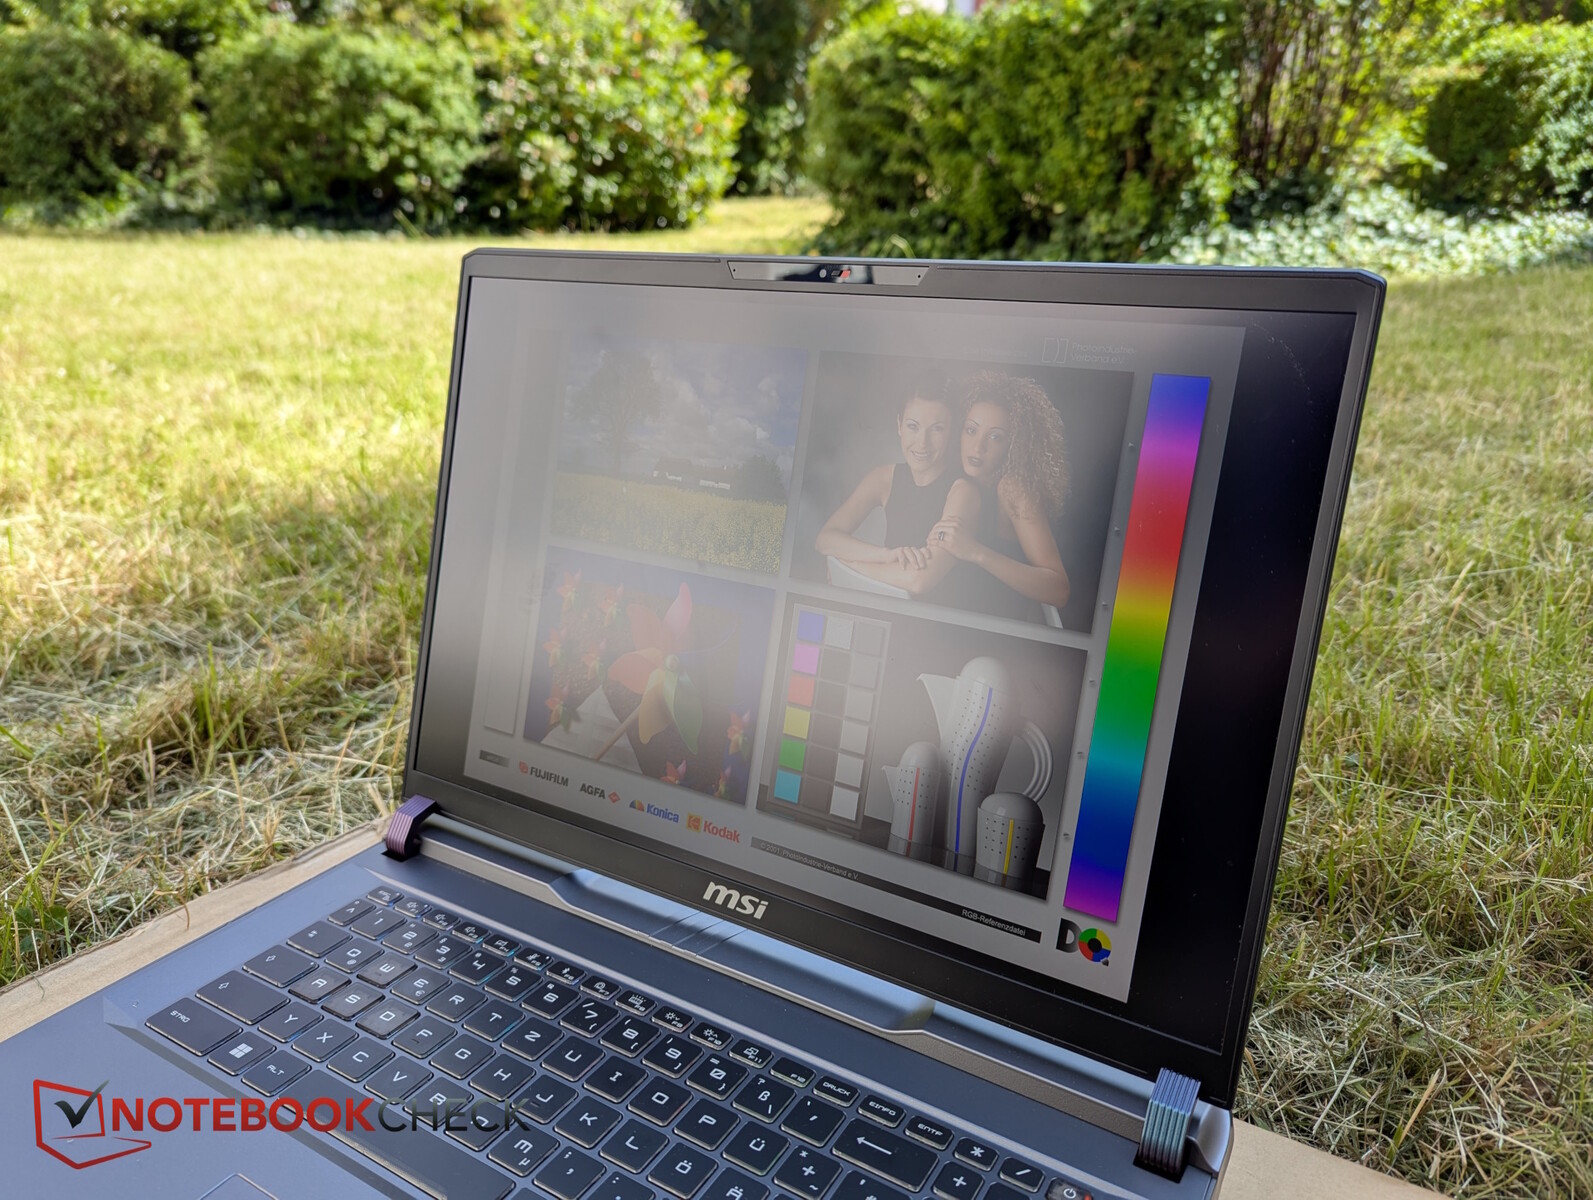
Tela - QHD+ IPS com 470 nits
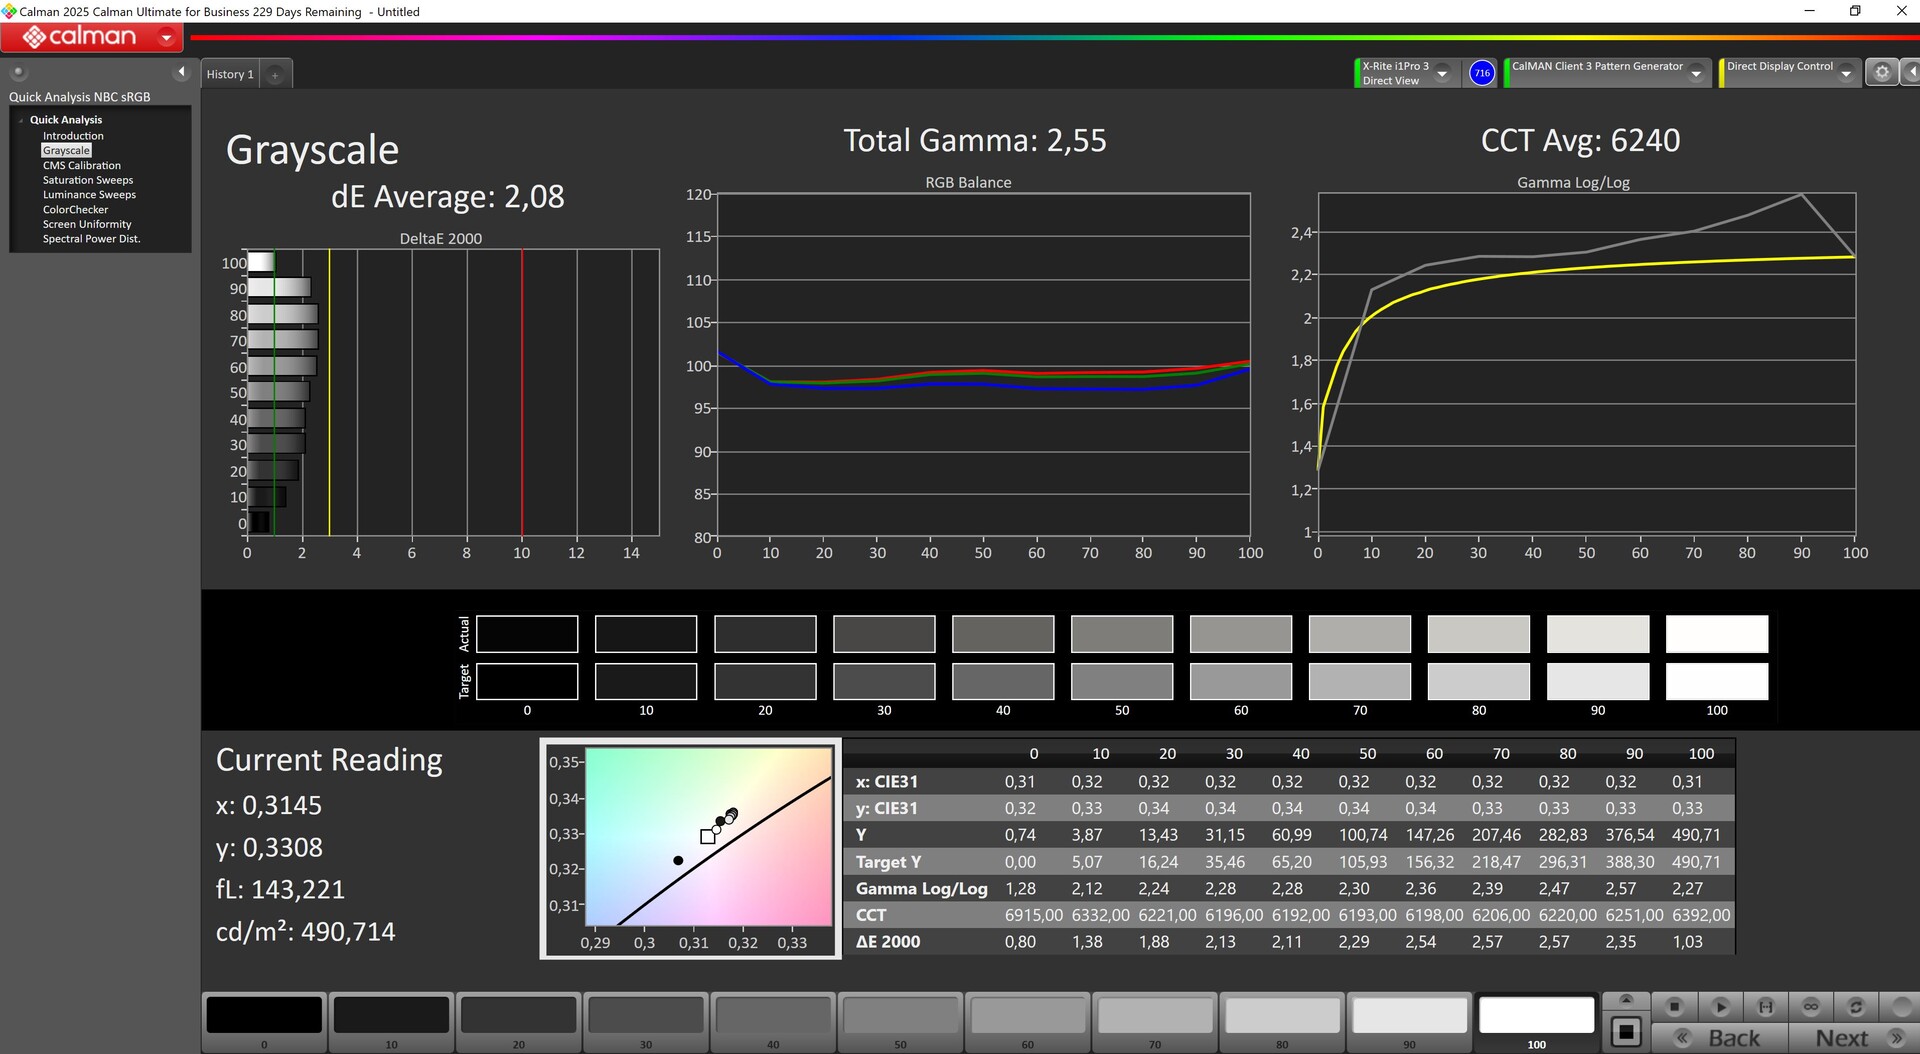
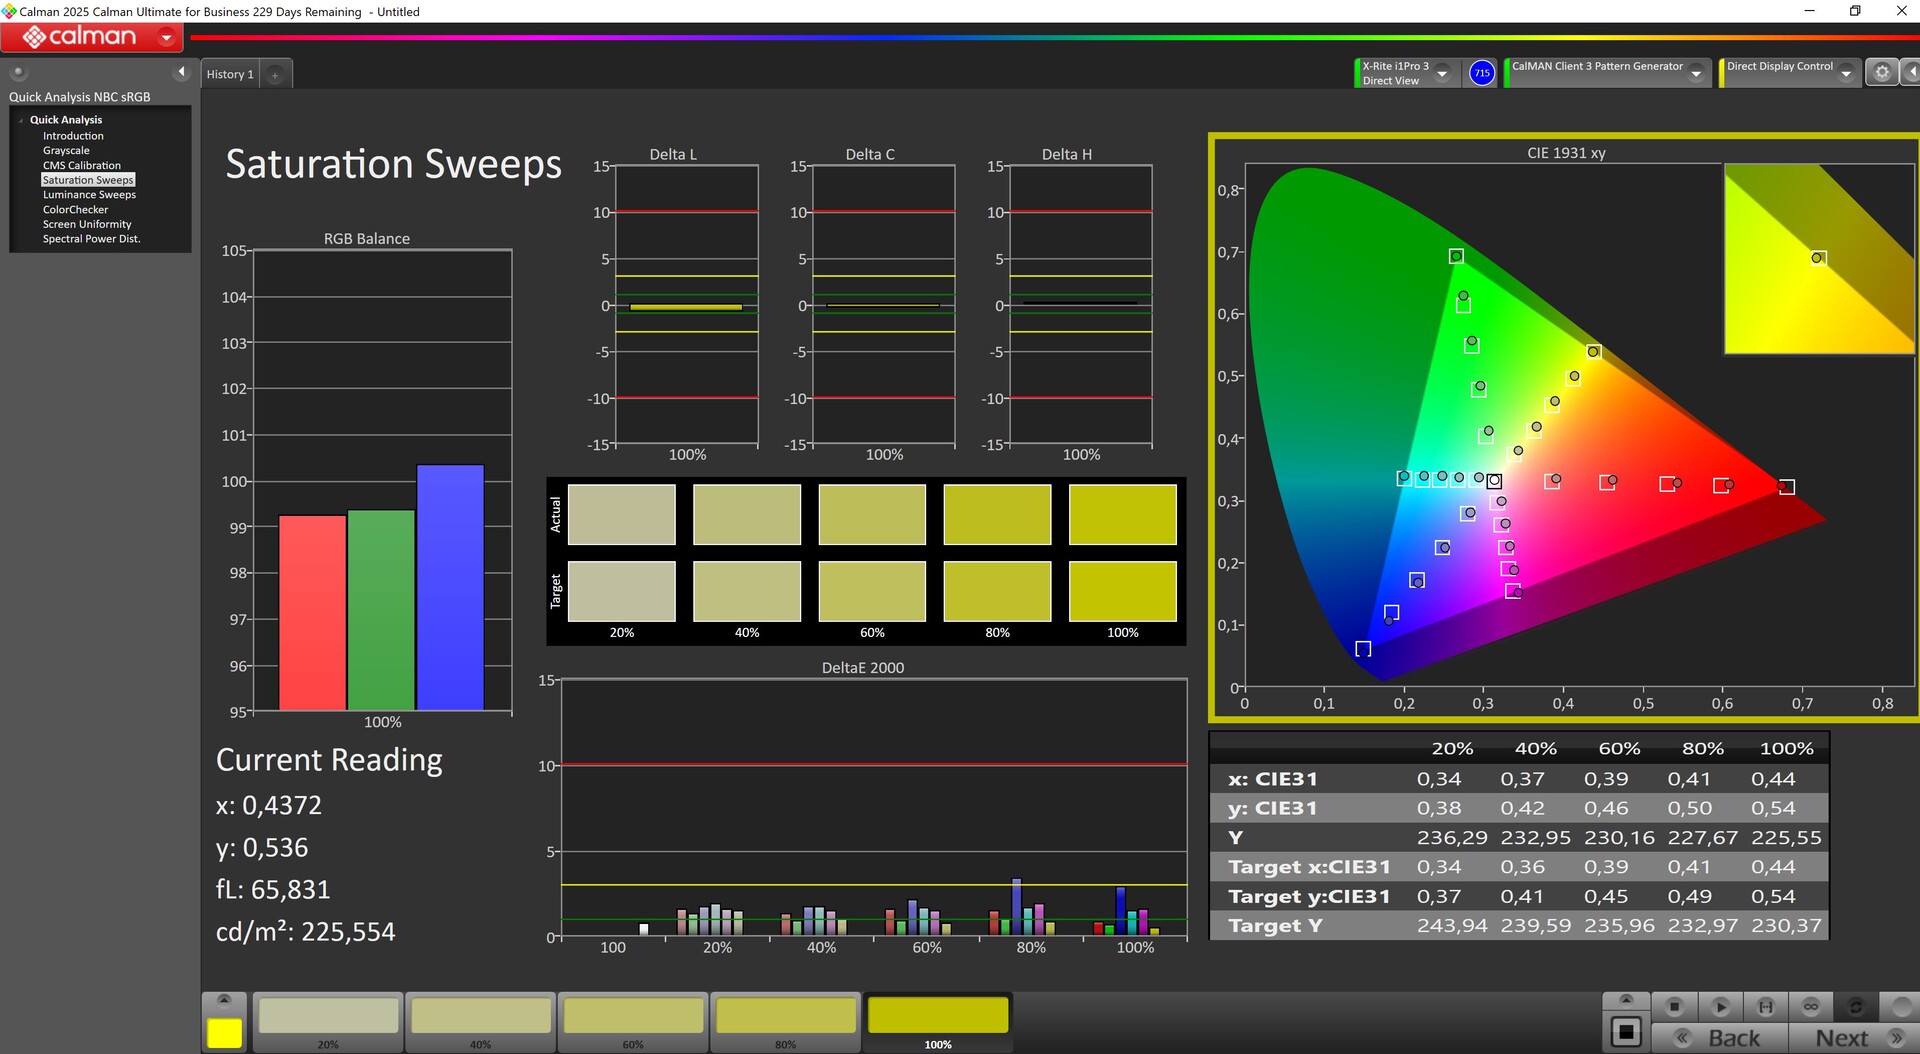
É usada uma tela IPS QHD+ fosca e rápida (aprox. 4 ms) (2.560 x 1.600 pixels) com 240 Hz. O brilho médio é de cerca de 470 nits e a iluminação é bastante uniforme. No entanto, o valor de preto é claramente muito alto, o que prejudica o contraste.
Nota: A MSI também oferece uma tela Full HD IPS com 165 Hz como alternativa.

| |||||||||||||||||||||||||
iluminação: 91 %
iluminação com acumulador: 486 cd/m²
Contraste: 659:1 (Preto: 0.74 cd/m²)
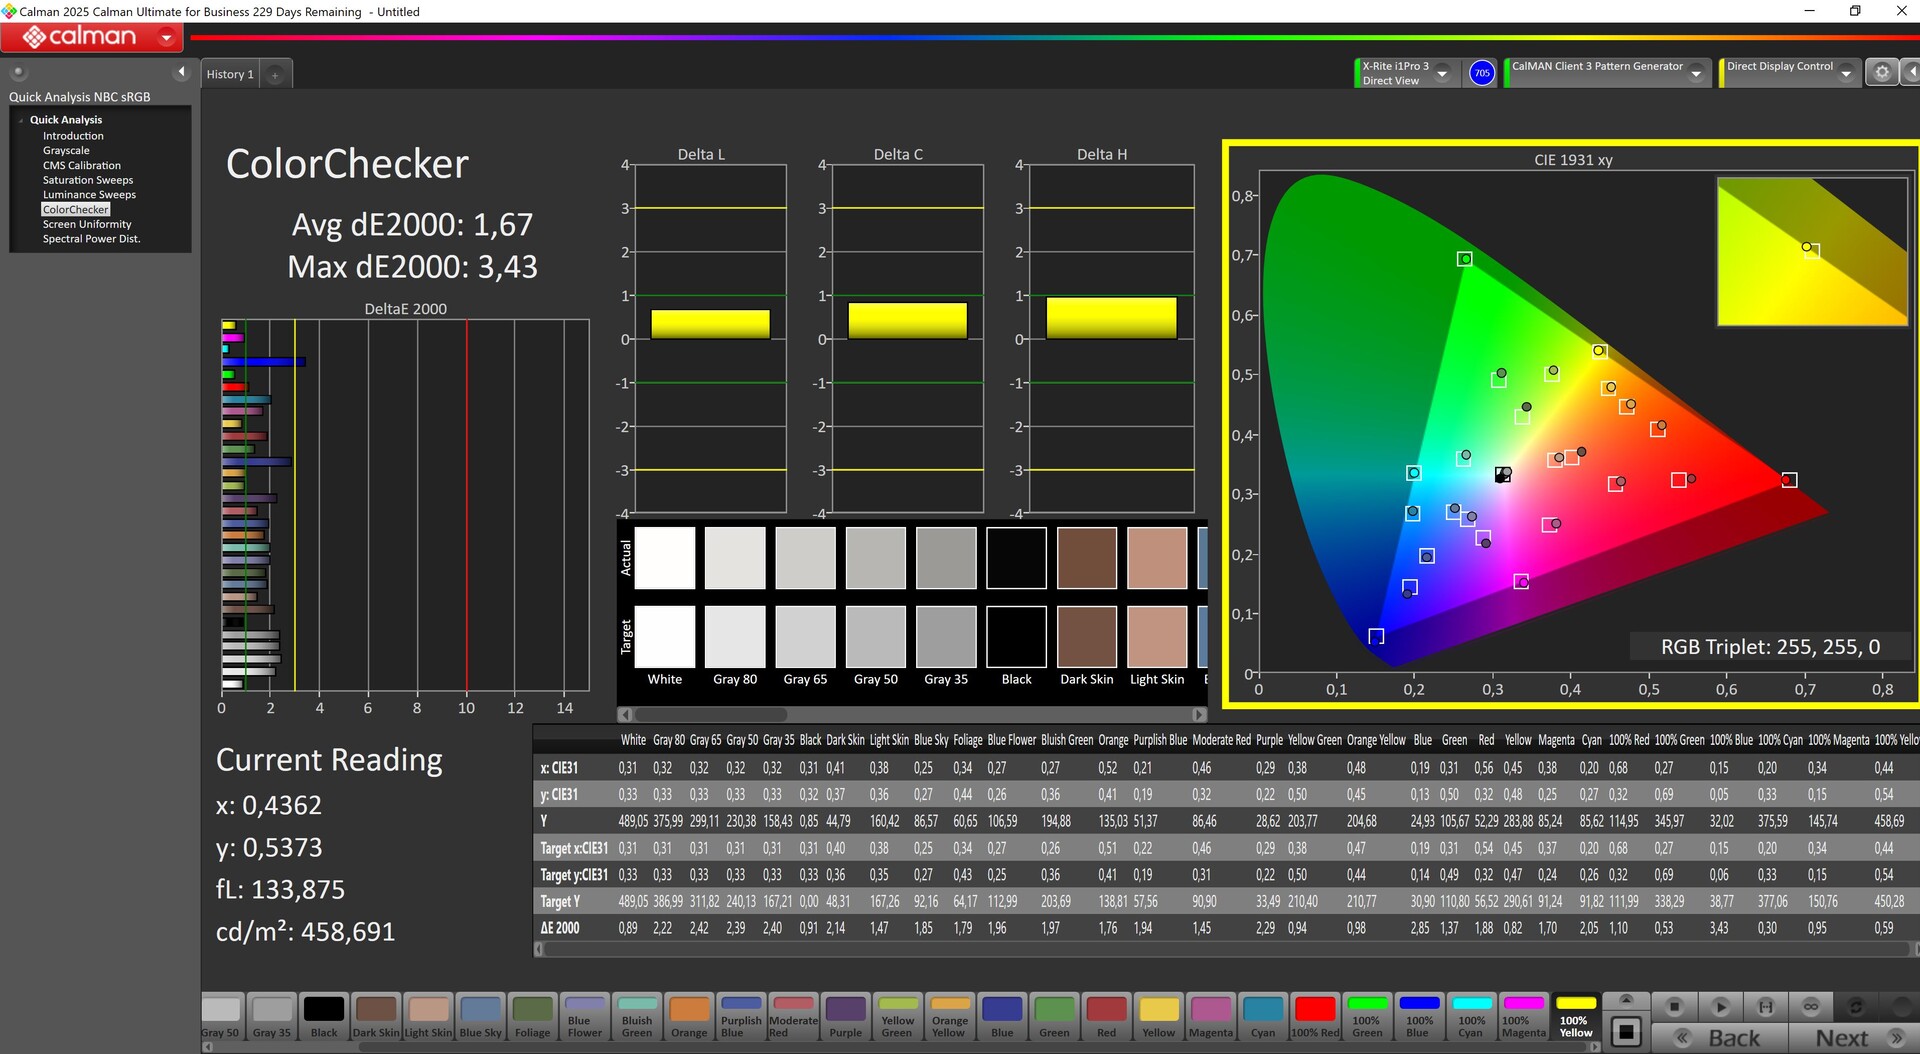
ΔE ColorChecker Calman: 1.67 | ∀{0.5-29.43 Ø4.71}
calibrated: 0.8
ΔE Greyscale Calman: 2.08 | ∀{0.09-98 Ø4.96}
87.4% AdobeRGB 1998 (Argyll 3D)
100% sRGB (Argyll 3D)
99.6% Display P3 (Argyll 3D)
Gamma: 2.55
CCT: 6240 K
| MSI Vector 17 HX AI A2XWIG B170QAN01.2 (AUO84A6), IPS, 2560x1600, 17", 240 Hz | Alienware 16 Area-51 AU Optronics B160QAN, IPS, 2560x1600, 16", 240 Hz | MSI Raider A18 HX A9WIG-080 B180ZAN01.0, MiniLED IPS, 3840x2400, 18", 120 Hz | Aorus MASTER 16 AM6H ATNA60DL03-0 (SDC41AB), OLED, 2560x1600, 16", 240 Hz | MSI Titan 18 HX AI A2XWJG AU Optronics B180ZAN01.0, Mini-LED, 3840x2160, 18", 120 Hz | Schenker XMG Neo 16 A25 5090 NE160QDM-NM9, Mini-LED, 2560x1600, 16", 300 Hz | |
|---|---|---|---|---|---|---|
| Display | -1% | 2% | 1% | 1% | 0% | |
| HDR Peak Brightness (cd/m²) | 1153 | |||||
| Display P3 Coverage (%) | 99.6 | 96 -4% | 99.9 0% | 95.3 -4% | 99.7 0% | 99.9 0% |
| sRGB Coverage (%) | 100 | 100 0% | 100 0% | 98.8 -1% | 99.9 0% | 100 0% |
| AdobeRGB 1998 Coverage (%) | 87.4 | 89.2 2% | 93.9 7% | 94.1 8% | 90.4 3% | 88.5 1% |
| Response Times | -42% | -377% | 92% | -179% | -277% | |
| Response Time Grey 50% / Grey 80% * (ms) | 3.6 ? | 4.8 ? -33% | 23 ? -539% | 0.24 ? 93% | 8.8 ? -144% | 17.4 ? -383% |
| Response Time Black / White * (ms) | 4.8 ? | 7.2 ? -50% | 15.1 ? -215% | 0.43 ? 91% | 15 ? -213% | 13 ? -171% |
| PWM Frequency (Hz) | 15203 | 960 | 15430 ? | 20253 | ||
| PWM Amplitude * (%) | 100 | 47 | 50 | 75 | ||
| Screen | -23% | 759% | 57% | -71% | -23% | |
| Brightness middle (cd/m²) | 488 | 554 14% | 510 5% | 435 -11% | 704 44% | 888 82% |
| Brightness (cd/m²) | 473 | 532 12% | 470 -1% | 437 -8% | 680 44% | 859 82% |
| Brightness Distribution (%) | 91 | 88 -3% | 85 -7% | 96 5% | 88 -3% | 94 3% |
| Black Level * (cd/m²) | 0.74 | 0.52 30% | 0.01 99% | 0.08 89% | ||
| Contrast (:1) | 659 | 1065 62% | 51000 7639% | 5438 725% | ||
| Colorchecker dE 2000 * | 1.67 | 2.81 -68% | 4.5 -169% | 2.42 -45% | 4.11 -146% | 3.3 -98% |
| Colorchecker dE 2000 max. * | 3.43 | 8.32 -143% | 7.3 -113% | 4.81 -40% | 6.43 -87% | 5.5 -60% |
| Colorchecker dE 2000 calibrated * | 0.8 | 0.65 19% | 5.7 -613% | 2.03 -154% | 2.5 -213% | 1.5 -88% |
| Greyscale dE 2000 * | 2.08 | 4.7 -126% | 2.3 -11% | 3.11 -50% | 4.9 -136% | 3.8 -83% |
| Gamma | 2.55 86% | 2.3 96% | 2.08 106% | 2.48 89% | 2.03 108% | 2.46 89% |
| CCT | 6240 104% | 6476 100% | 6648 98% | 6270 104% | 6331 103% | 6267 104% |
| Média Total (Programa/Configurações) | -22% /
-21% | 128% /
434% | 50% /
50% | -83% /
-71% | -100% /
-60% |
* ... menor é melhor
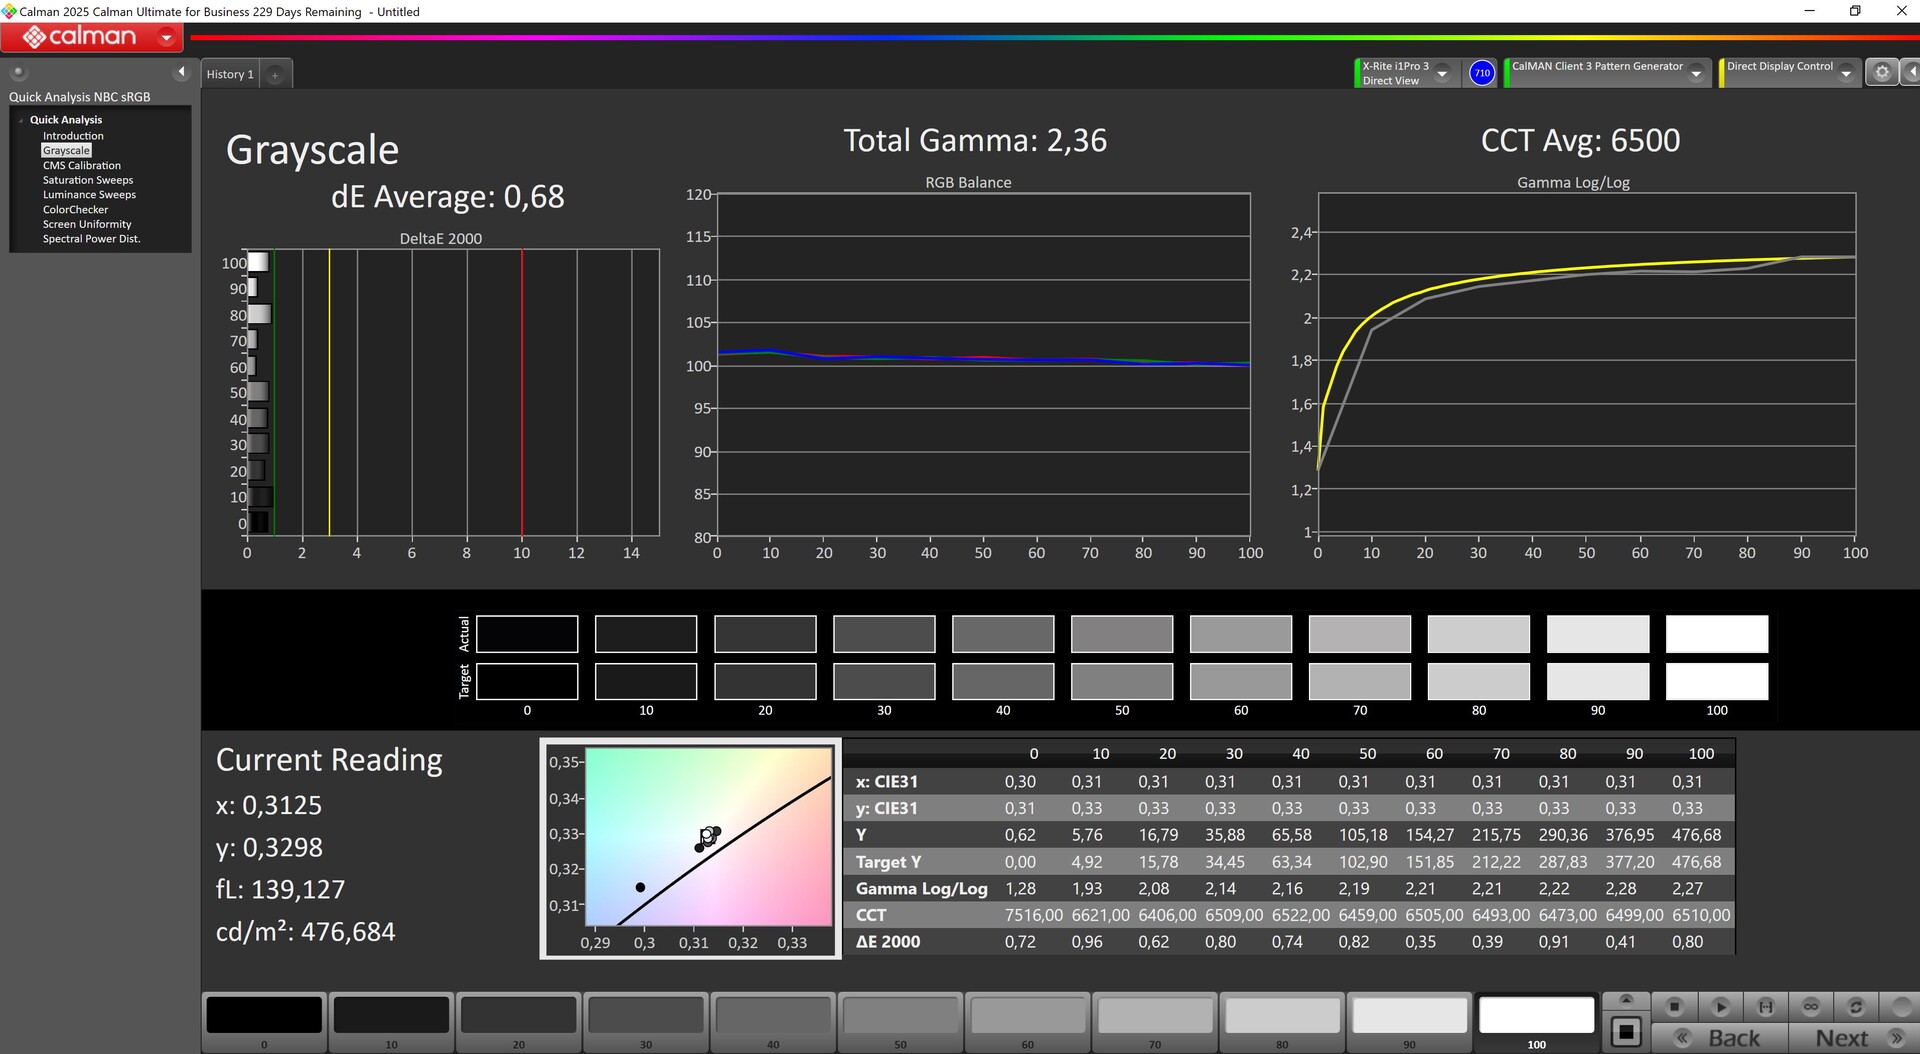
Já medimos valores bem calibrados de fábrica. Após nossa própria calibração, até reduzimos os desvios para menos de 1.
Exibir tempos de resposta
| ↔ Tempo de resposta preto para branco | ||
|---|---|---|
| 4.8 ms ... ascensão ↗ e queda ↘ combinadas | ↗ 1.8 ms ascensão | 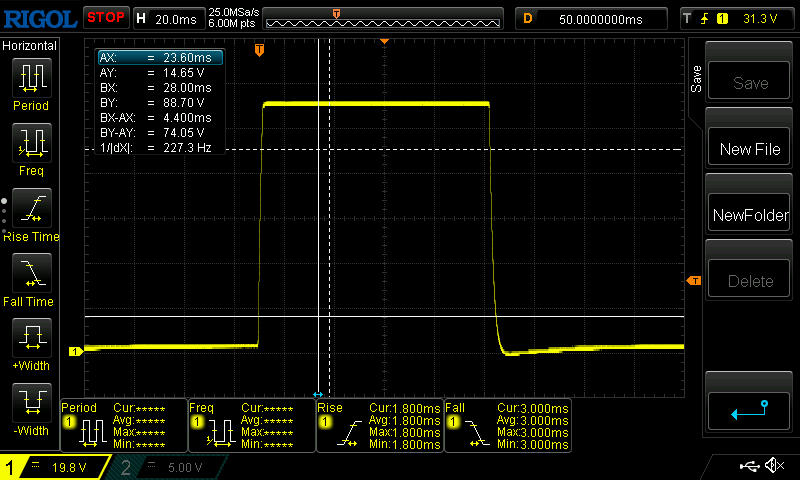 |
| ↘ 3 ms queda | ||
| A tela mostra taxas de resposta muito rápidas em nossos testes e deve ser muito adequada para jogos em ritmo acelerado. Em comparação, todos os dispositivos testados variam de 0.1 (mínimo) a 240 (máximo) ms. » 17 % de todos os dispositivos são melhores. Isso significa que o tempo de resposta medido é melhor que a média de todos os dispositivos testados (19.8 ms). | ||
| ↔ Tempo de resposta 50% cinza a 80% cinza | ||
| 3.6 ms ... ascensão ↗ e queda ↘ combinadas | ↗ 1.8 ms ascensão | 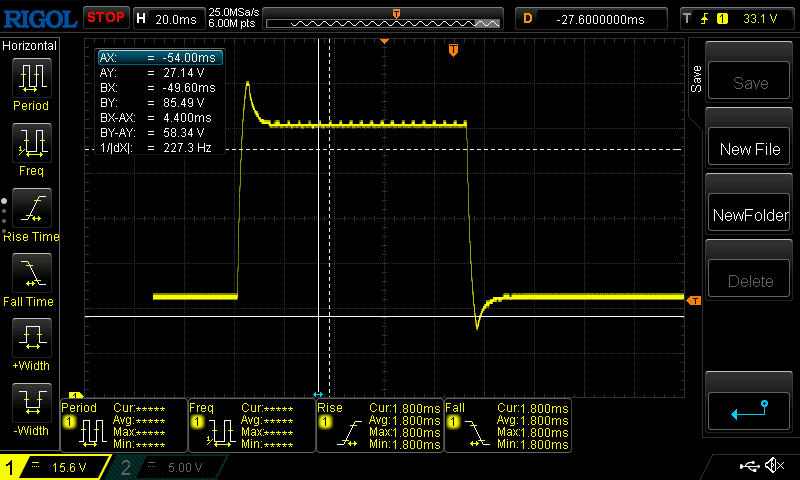 |
| ↘ 1.8 ms queda | ||
| A tela mostra taxas de resposta muito rápidas em nossos testes e deve ser muito adequada para jogos em ritmo acelerado. Em comparação, todos os dispositivos testados variam de 0.165 (mínimo) a 636 (máximo) ms. » 14 % de todos os dispositivos são melhores. Isso significa que o tempo de resposta medido é melhor que a média de todos os dispositivos testados (31 ms). | ||
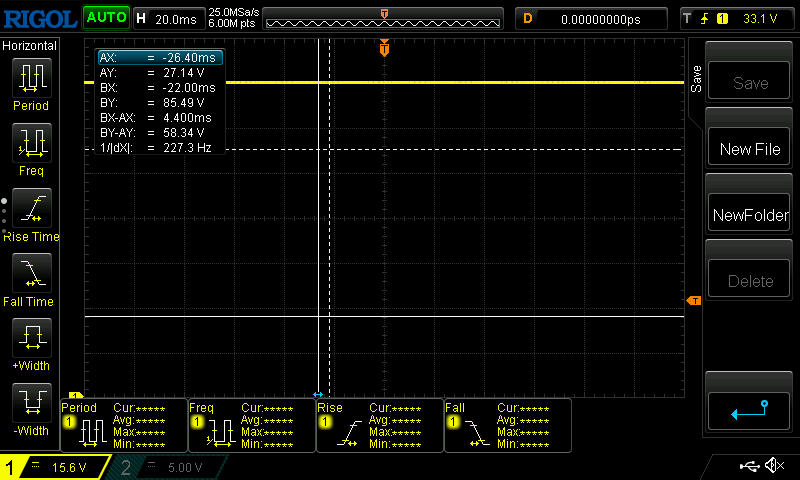
Cintilação da tela / PWM (modulação por largura de pulso)
| Tela tremeluzindo / PWM não detectado |  | ||
[pwm_comparison] Em comparação: 52 % de todos os dispositivos testados não usam PWM para escurecer a tela. Se PWM foi detectado, uma média de 7747 (mínimo: 5 - máximo: 343500) Hz foi medida. | |||

Desempenho - Colapso da CPU sob carga contínua
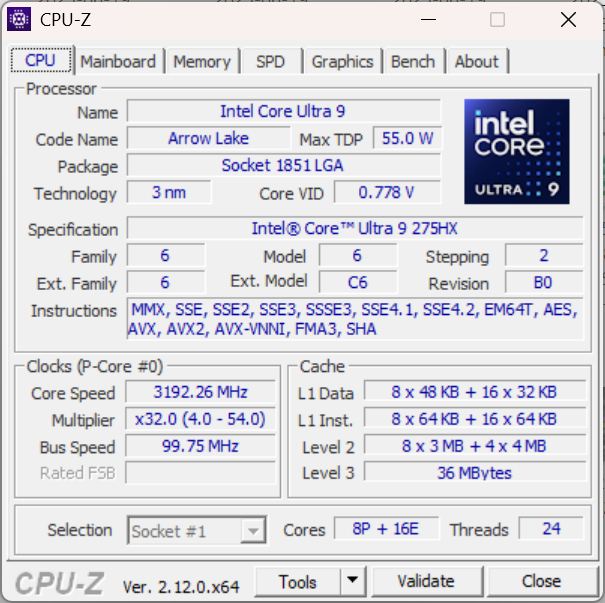
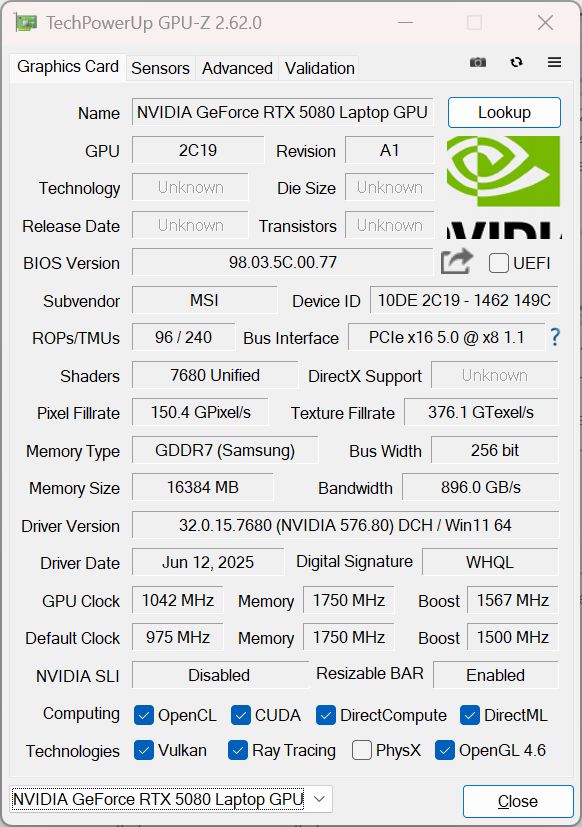
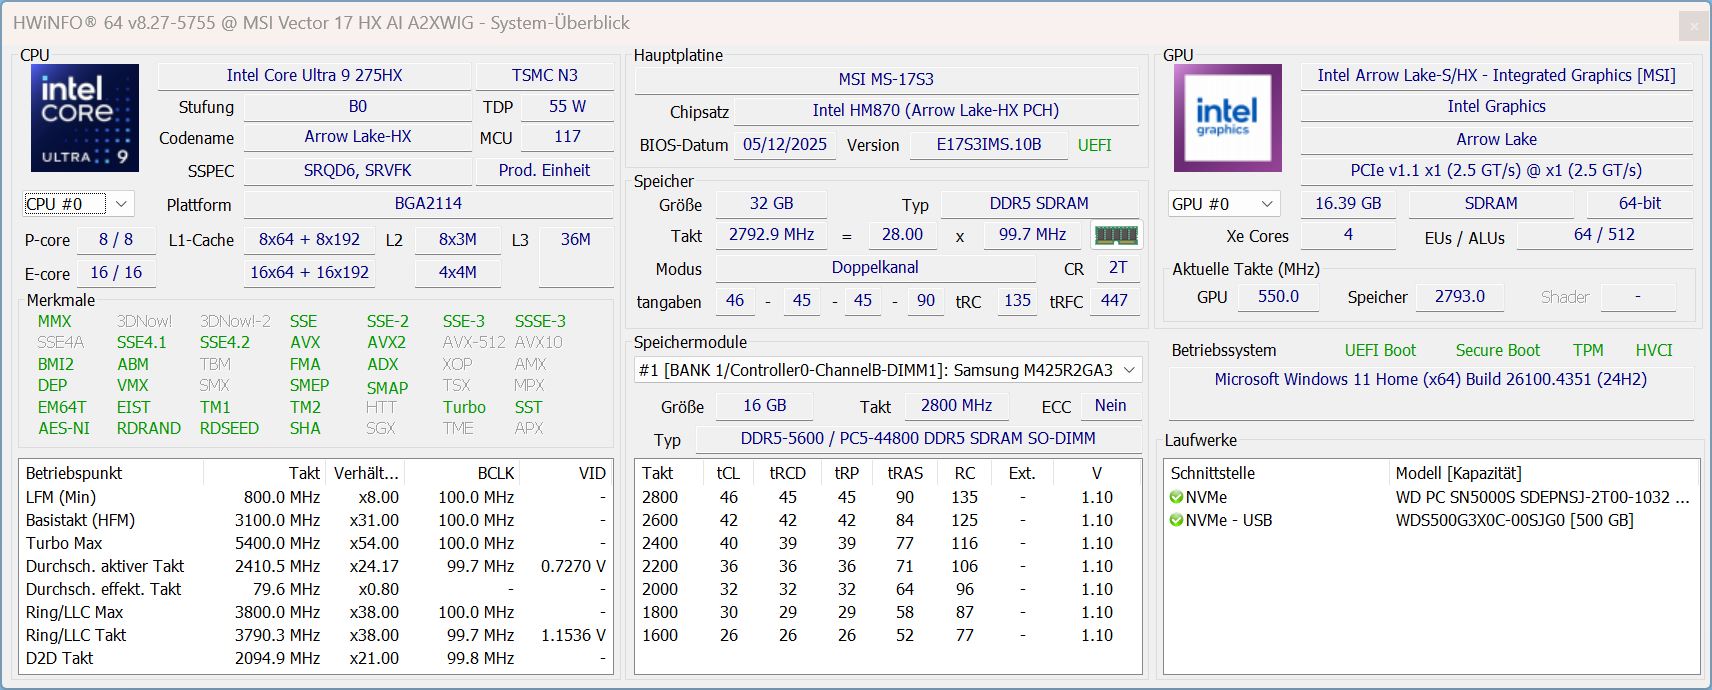
Com Intel Core Ultra 9 275HX, Laptop RTX 50802 TB SSD e 32 GB de RAM, o Vector 17 HX é um gamer de ponta e deve estar equipado para todos os títulos atuais.
Condições de teste
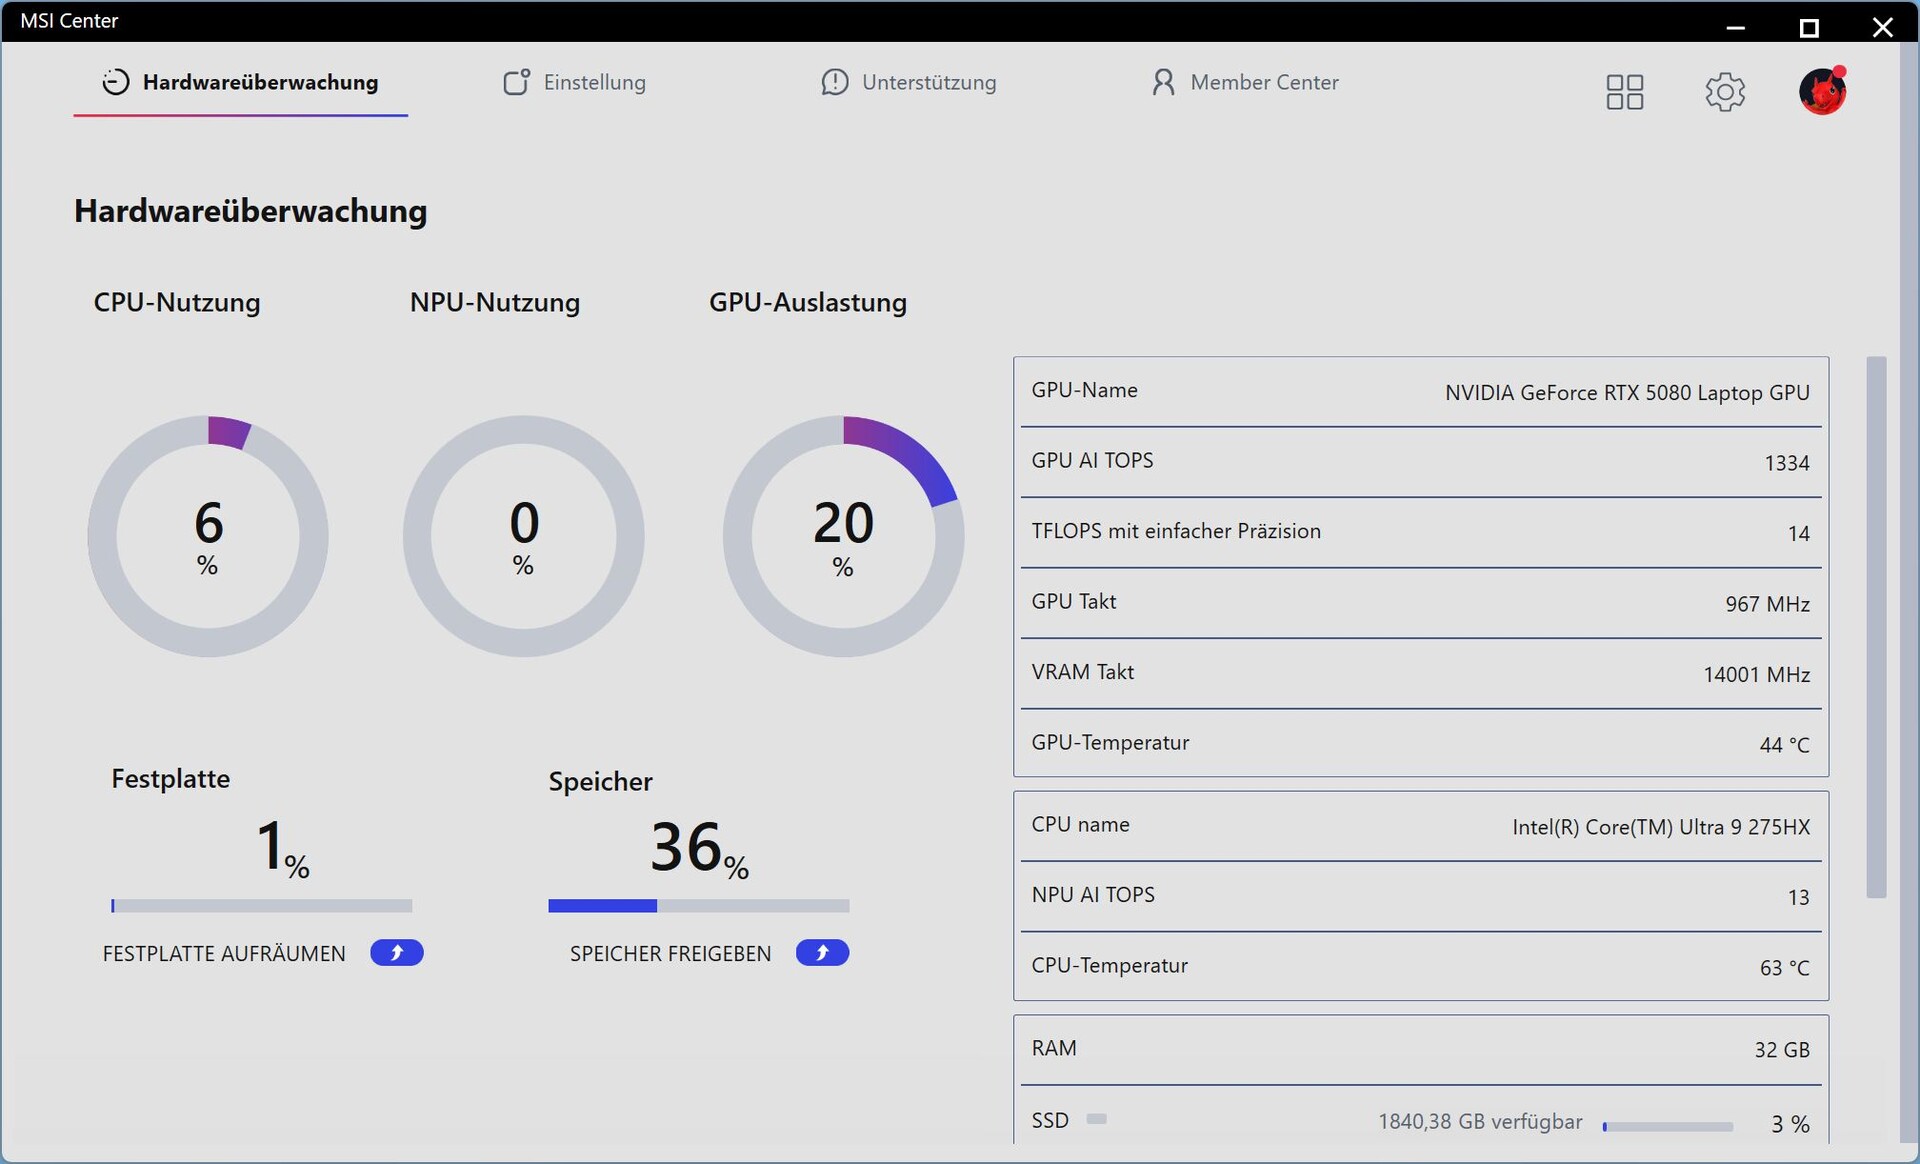
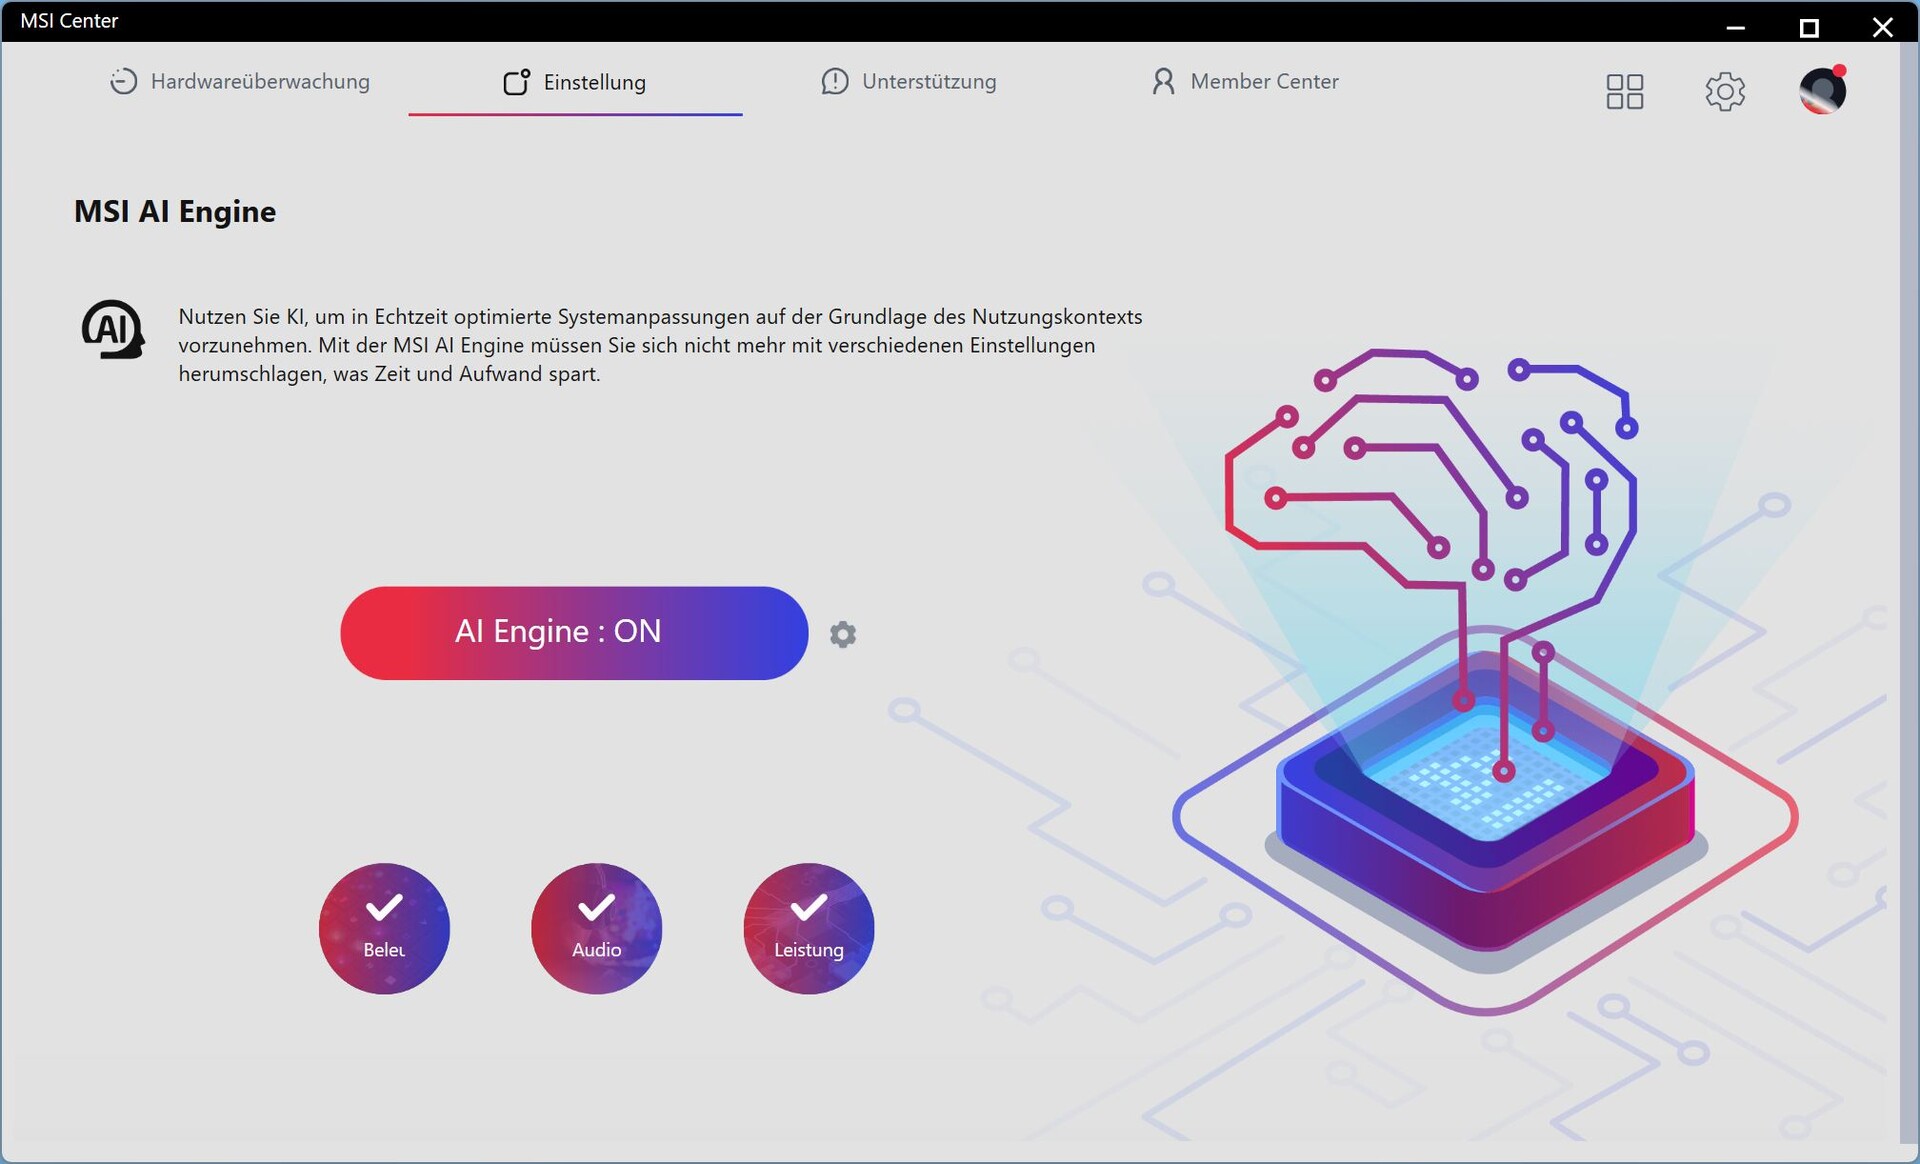
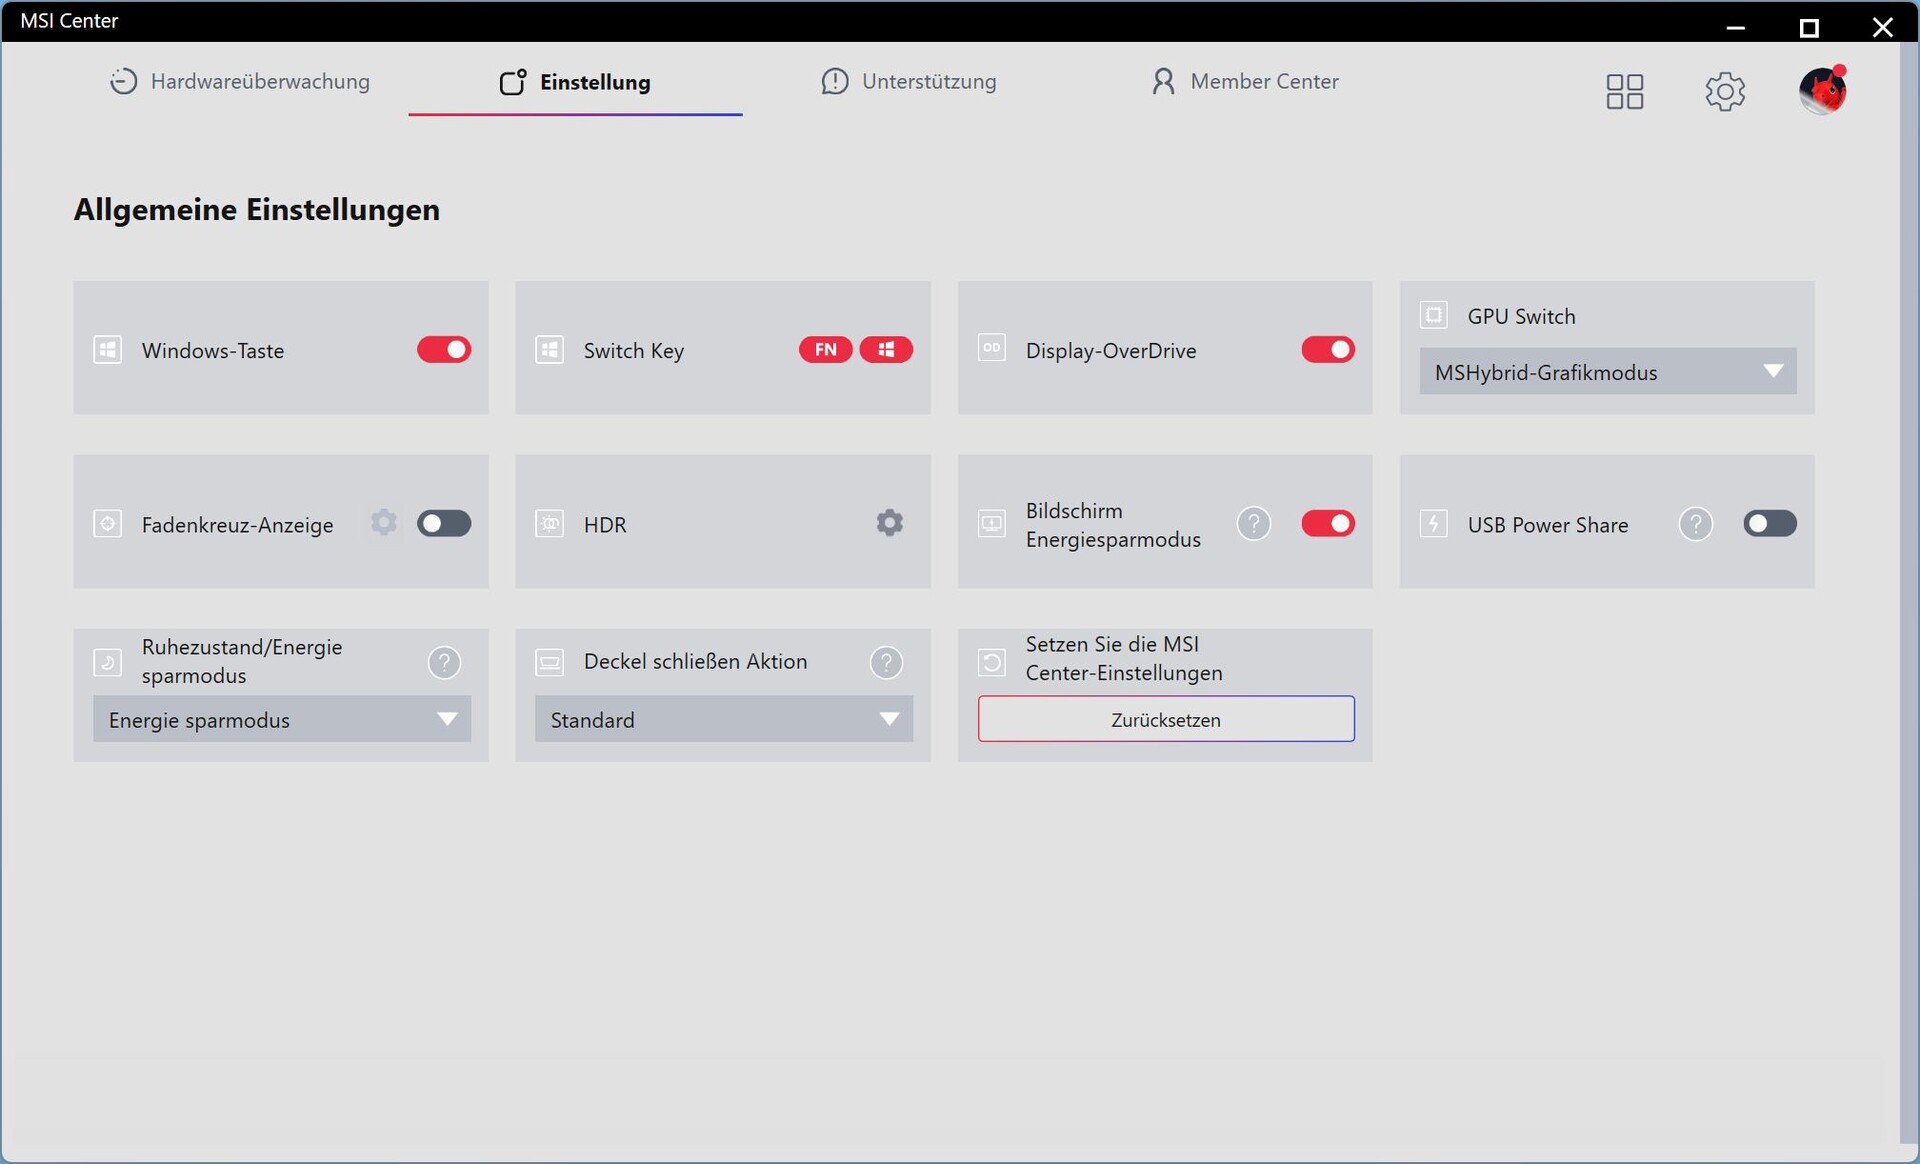
Dos quatro perfis de desempenho, selecionamos o mecanismo de IA; um MUX também está integrado ao MSI Center.
Originalmente, tivemos que lidar com um consumo ocioso muito alto de até 60 W e níveis de ruído excessivos no teste. Inicialmente, uma atualização do BIOS e do MSI Center não trouxe nenhuma melhoria. O problema só foi resolvido após a reinstalação adicional do Windows. Tivemos que realizar várias medições novamente.
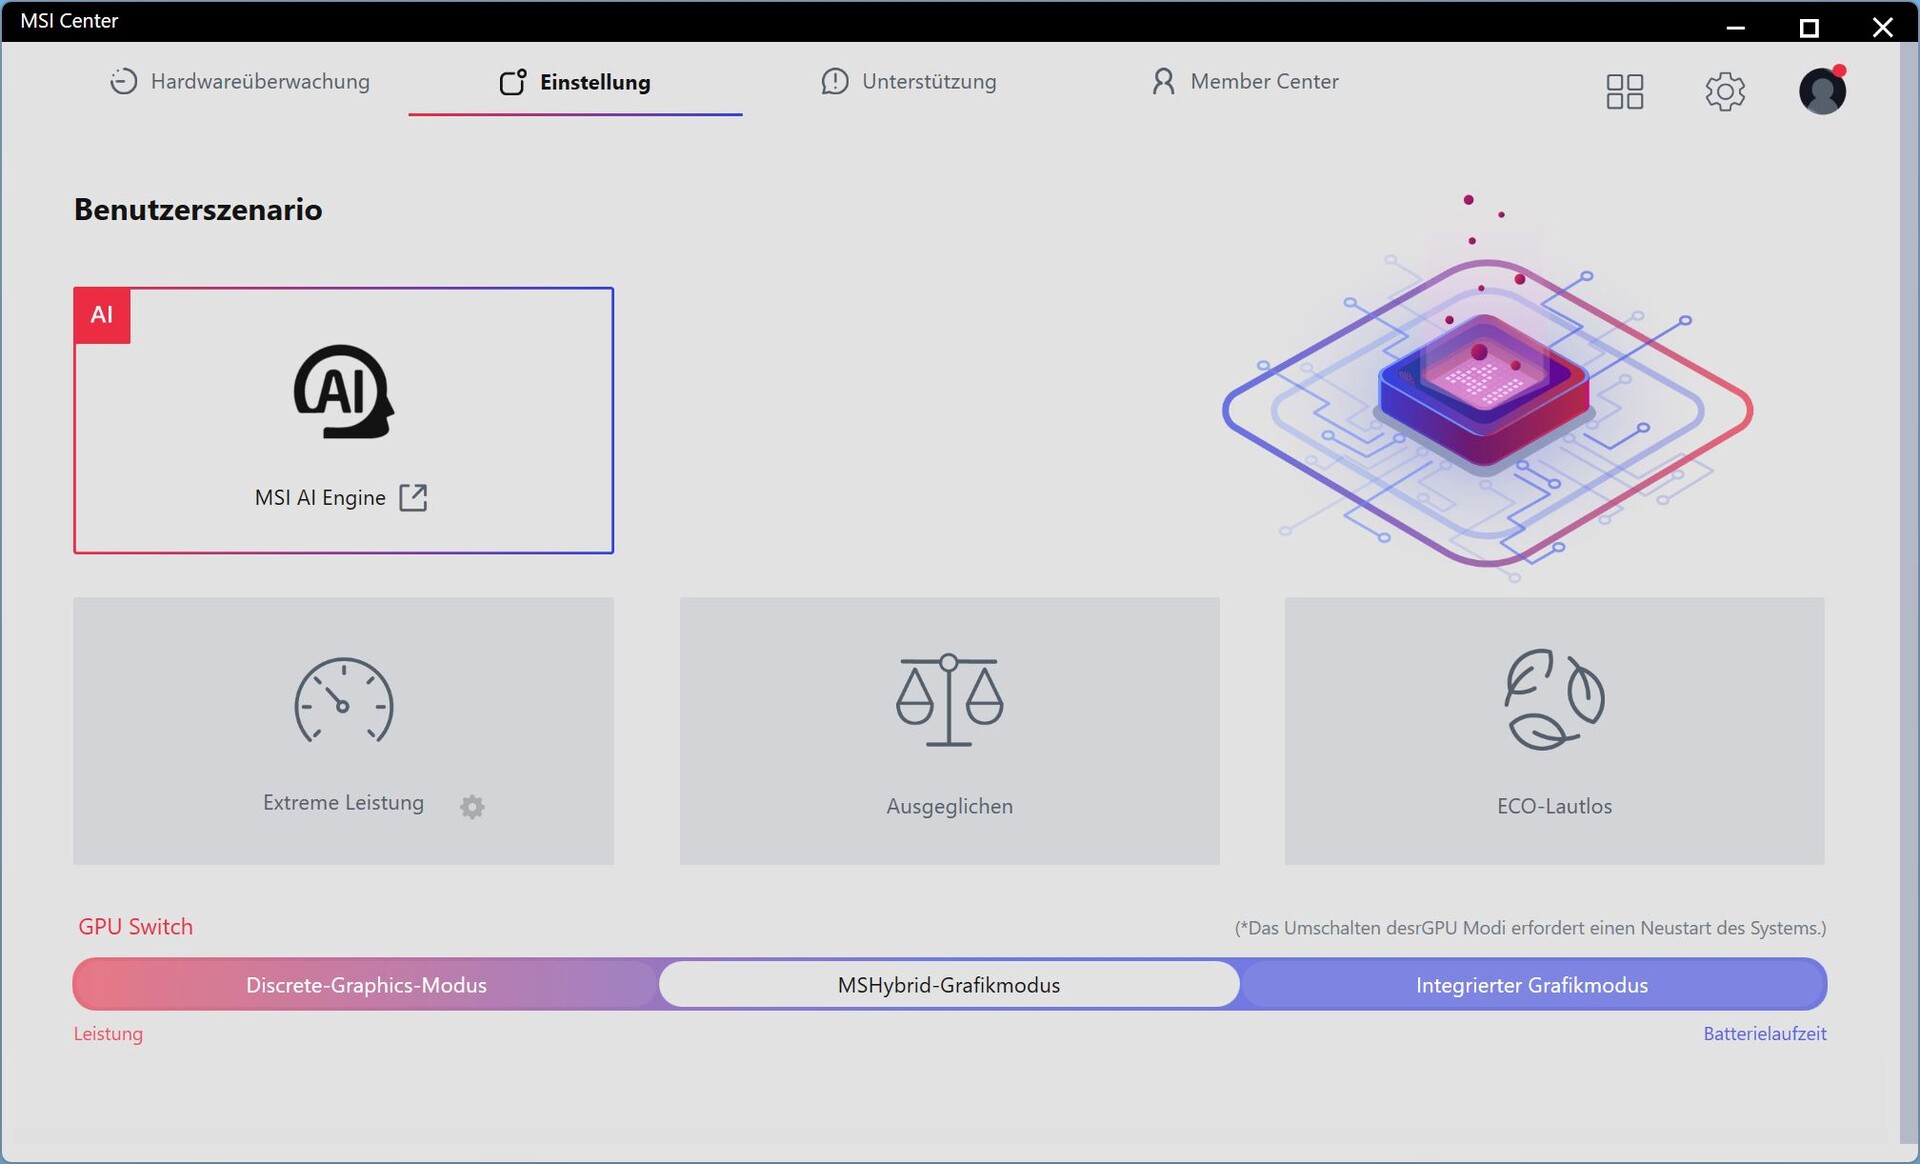
| MSI Center Mode | MSI AI Engine | Extreme performance | Balanced | ECO Silent |
| Cyberpunk 2077 Ruído em dB(A) | 60.35 | 60.35 | 47.4 | 36.21 |
| Consumo de energia Cyberpunk | 313 W | 313 W | 253 W | 134 W |
| Consumo de energia da GPU | 160 W | 160 W | 130 W | 80 W |
| Desempenho do Cyberpunk 2077 (FHD/Ultra) | 134,6 fps | 134,5 fps | 123 fps | 78,4 fps |
| Cinebench R15 Multi Score | 5112 Points | 5430 Points | 4813 Points | 2019 Points |
| CPU PL1 | 110 watts | 150 watts | 65 watts | 20 watts |
| CPU PL2 | 150 watts | 150 watts | 110 watts | 25 watts |
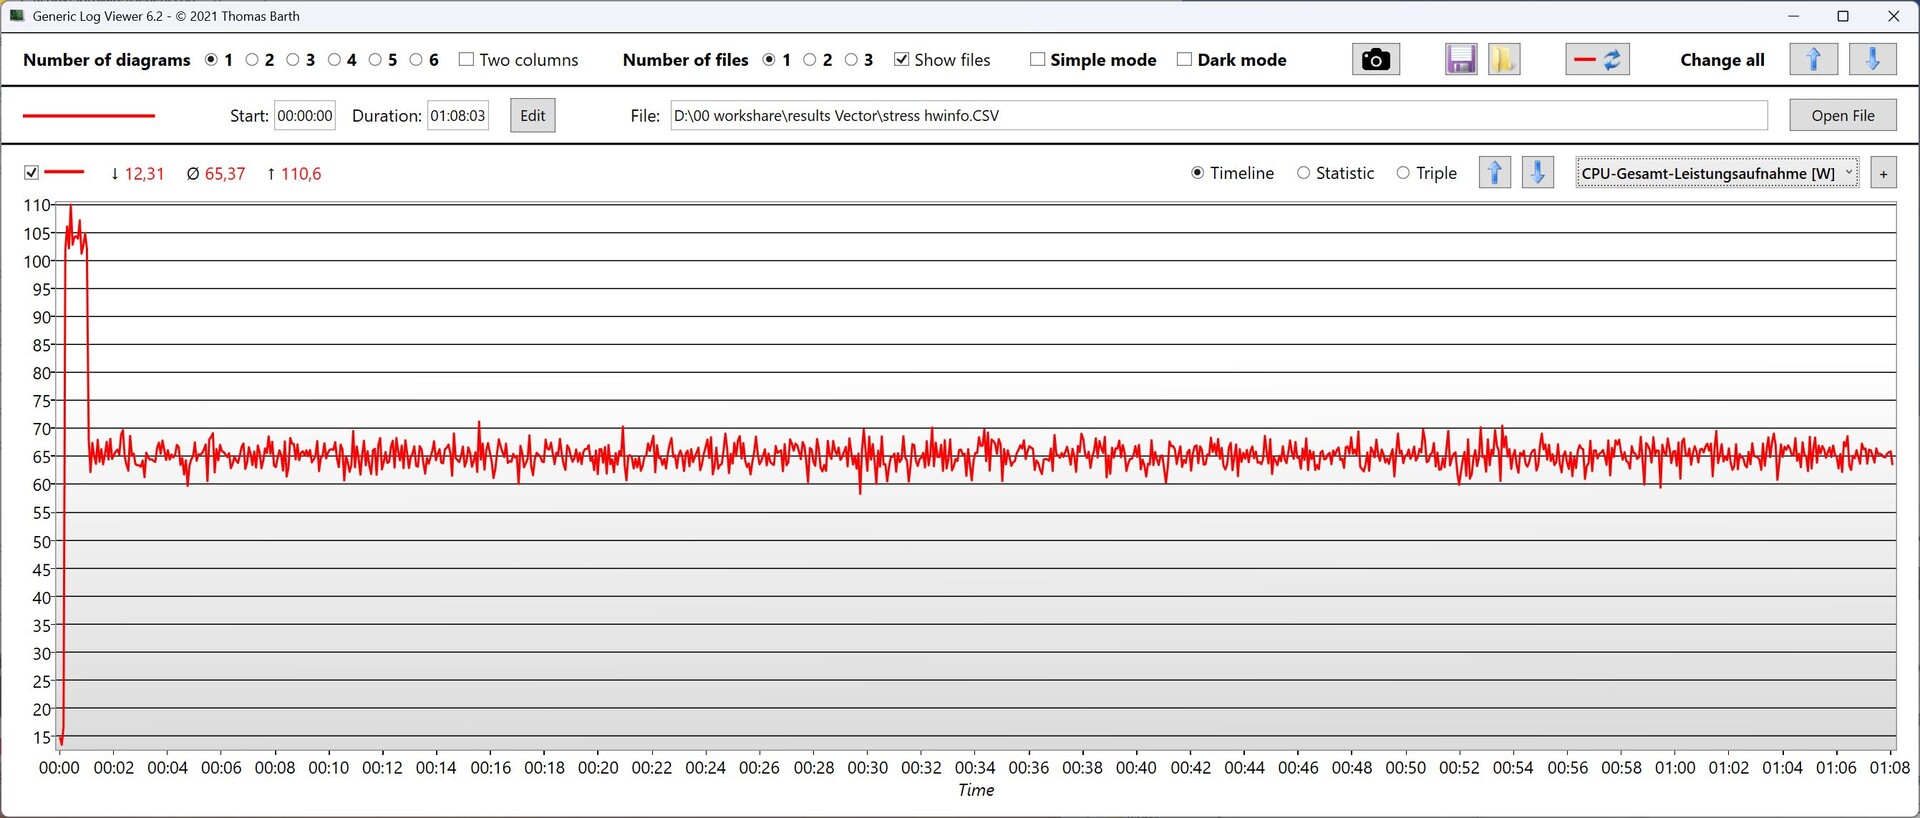
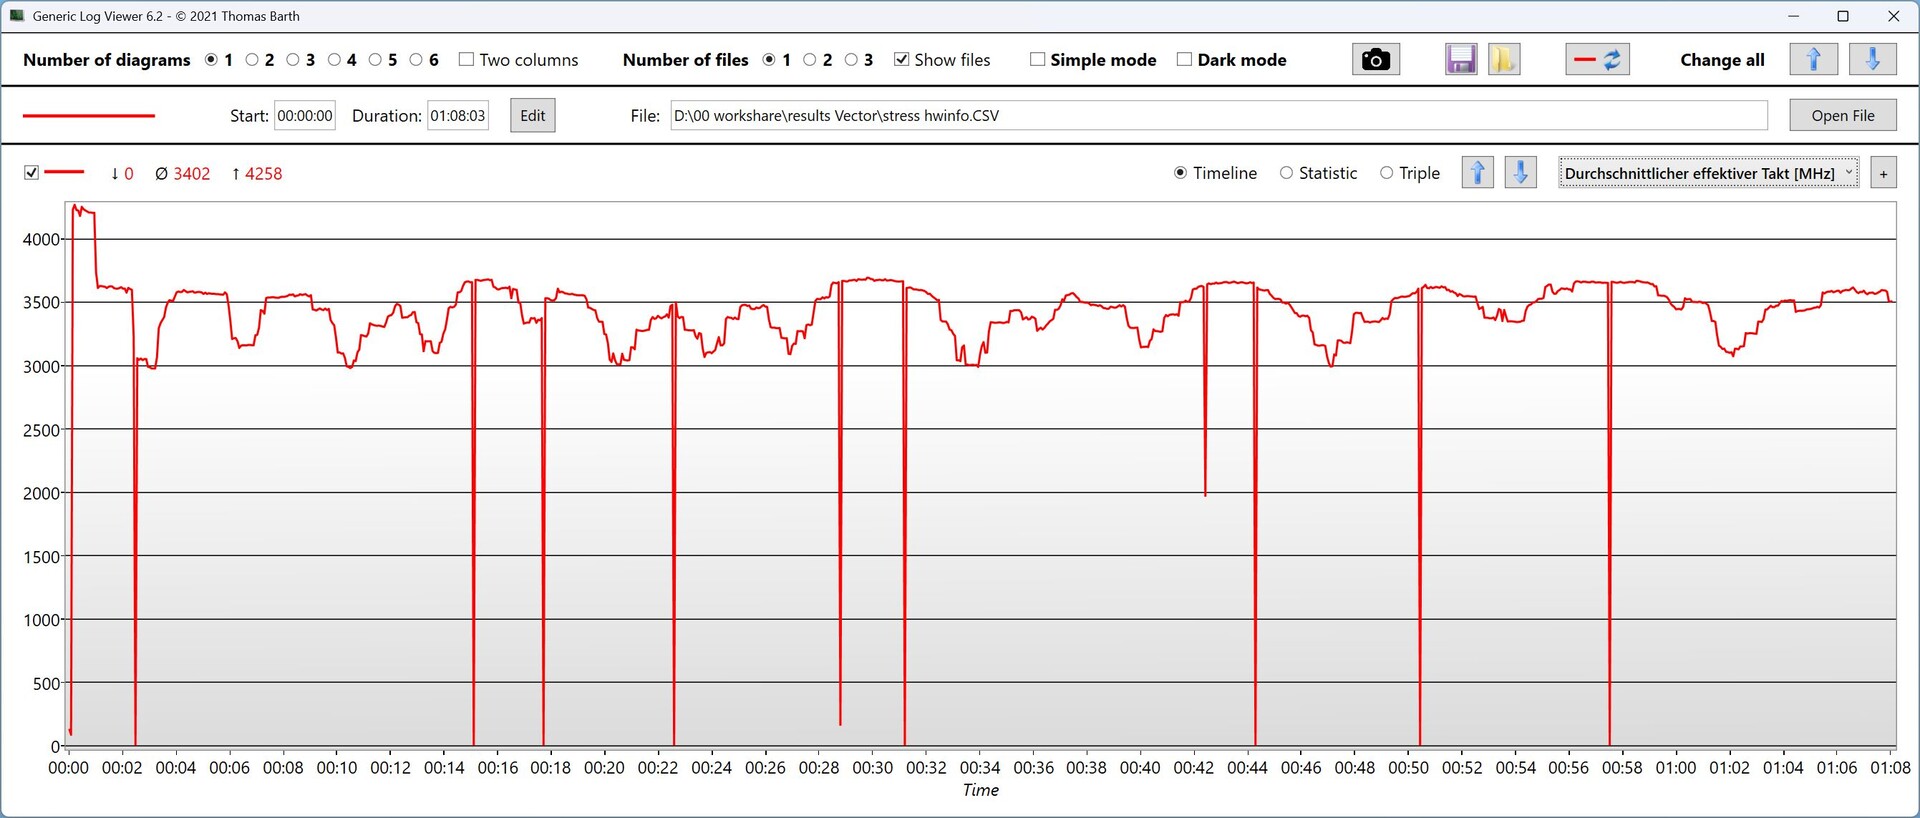
Processador
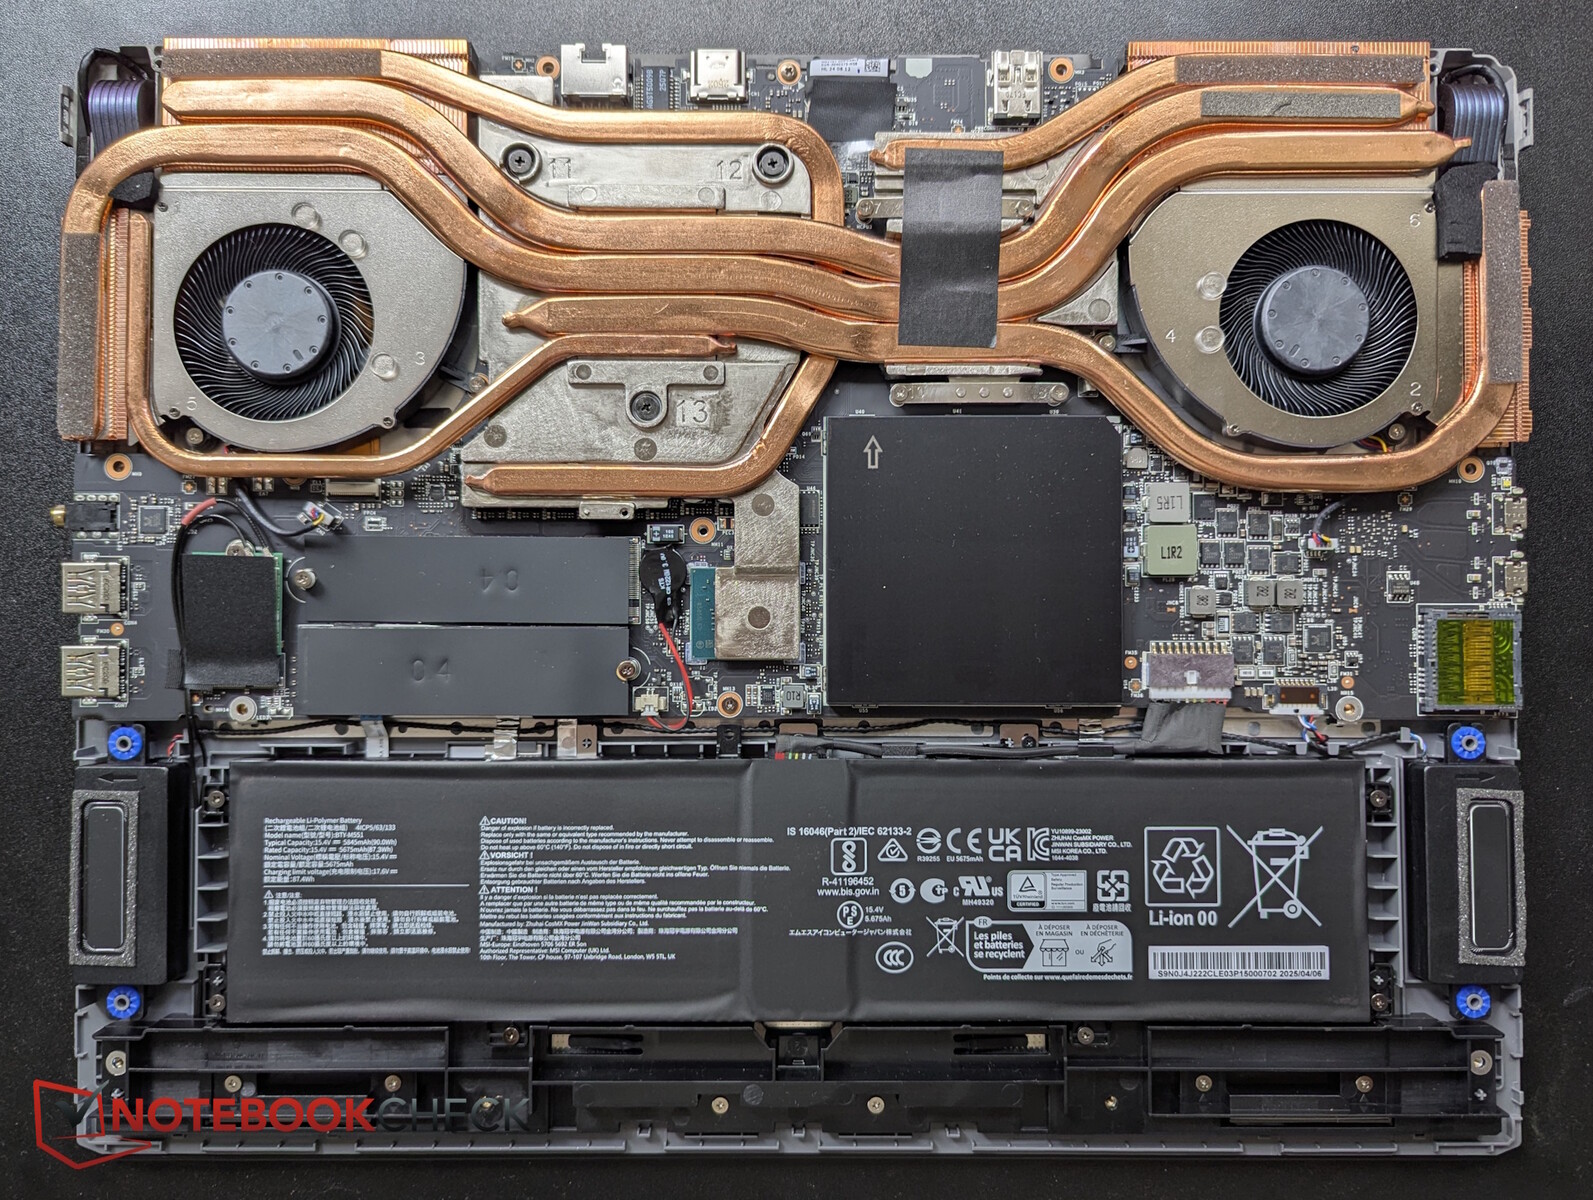
O Core Ultra 9 275HX com 24 núcleos (8 núcleos P e 16 núcleos E, até 5,4 GHz) é estrangulado sob carga contínua: ele mantém um desempenho médio por 2 ciclos, após os quais cai mais de 1.000 pontos. Portanto, o desempenho a longo prazo é mais fraco do que o de um Core Ultra 7 255HX. No entanto, no modo Extreme Performance, o desempenho é estável.
Em todos os testes de CPU, o Vector 17 HX está cerca de 6% atrás da média com a mesma CPU. Cerca de 59% do desempenho da CPU é perdido no modo de bateria.
Cinebench R15 Multi Endurance test
Cinebench R23: Multi Core | Single Core
Cinebench R20: CPU (Multi Core) | CPU (Single Core)
Cinebench R15: CPU Multi 64Bit | CPU Single 64Bit
Blender: v2.79 BMW27 CPU
7-Zip 18.03: 7z b 4 | 7z b 4 -mmt1
Geekbench 6.7: Multi-Core | Single-Core
Geekbench 5.5: Multi-Core | Single-Core
HWBOT x265 Benchmark v2.2: 4k Preset
LibreOffice : 20 Documents To PDF
R Benchmark 2.5: Overall mean
| CPU Performance rating | |
| Schenker XMG Neo 16 A25 5090 | |
| MSI Raider A18 HX A9WIG-080 | |
| MSI Titan 18 HX AI A2XWJG | |
| Aorus MASTER 16 AM6H | |
| Média Intel Core Ultra 9 275HX | |
| MSI Vector 17 HX AI A2XWIG | |
| Alienware 16 Area-51 | |
| Média da turma Gaming | |
| Cinebench R23 / Multi Core | |
| MSI Titan 18 HX AI A2XWJG | |
| Schenker XMG Neo 16 A25 5090 | |
| MSI Raider A18 HX A9WIG-080 | |
| Aorus MASTER 16 AM6H | |
| Média Intel Core Ultra 9 275HX (30712 - 40970, n=31) | |
| MSI Vector 17 HX AI A2XWIG | |
| Alienware 16 Area-51 | |
| Média da turma Gaming (10488 - 42661, n=107, últimos 2 anos) | |
| Cinebench R23 / Single Core | |
| Aorus MASTER 16 AM6H | |
| Média Intel Core Ultra 9 275HX (2009 - 2267, n=31) | |
| MSI Titan 18 HX AI A2XWJG | |
| MSI Vector 17 HX AI A2XWIG | |
| Schenker XMG Neo 16 A25 5090 | |
| MSI Raider A18 HX A9WIG-080 | |
| Média da turma Gaming (1166 - 2415, n=107, últimos 2 anos) | |
| Alienware 16 Area-51 | |
| Cinebench R20 / CPU (Multi Core) | |
| MSI Titan 18 HX AI A2XWJG | |
| Schenker XMG Neo 16 A25 5090 | |
| MSI Raider A18 HX A9WIG-080 | |
| Aorus MASTER 16 AM6H | |
| Média Intel Core Ultra 9 275HX (12026 - 16108, n=30) | |
| Alienware 16 Area-51 | |
| MSI Vector 17 HX AI A2XWIG | |
| Média da turma Gaming (4029 - 16433, n=106, últimos 2 anos) | |
| Cinebench R20 / CPU (Single Core) | |
| Aorus MASTER 16 AM6H | |
| MSI Raider A18 HX A9WIG-080 | |
| Schenker XMG Neo 16 A25 5090 | |
| Média Intel Core Ultra 9 275HX (774 - 870, n=30) | |
| MSI Titan 18 HX AI A2XWJG | |
| MSI Vector 17 HX AI A2XWIG | |
| Média da turma Gaming (442 - 913, n=106, últimos 2 anos) | |
| Alienware 16 Area-51 | |
| Cinebench R15 / CPU Multi 64Bit | |
| MSI Titan 18 HX AI A2XWJG | |
| Schenker XMG Neo 16 A25 5090 | |
| MSI Raider A18 HX A9WIG-080 | |
| Aorus MASTER 16 AM6H | |
| Média Intel Core Ultra 9 275HX (4737 - 6271, n=30) | |
| MSI Vector 17 HX AI A2XWIG | |
| Alienware 16 Area-51 | |
| Média da turma Gaming (1578 - 6330, n=105, últimos 2 anos) | |
| Cinebench R15 / CPU Single 64Bit | |
| MSI Vector 17 HX AI A2XWIG | |
| MSI Vector 17 HX AI A2XWIG | |
| Schenker XMG Neo 16 A25 5090 | |
| Aorus MASTER 16 AM6H | |
| Média Intel Core Ultra 9 275HX (306 - 343, n=31) | |
| MSI Titan 18 HX AI A2XWJG | |
| MSI Raider A18 HX A9WIG-080 | |
| Alienware 16 Area-51 | |
| Média da turma Gaming (188.8 - 350, n=106, últimos 2 anos) | |
| Blender / v2.79 BMW27 CPU | |
| Média da turma Gaming (79 - 330, n=104, últimos 2 anos) | |
| MSI Vector 17 HX AI A2XWIG | |
| Alienware 16 Area-51 | |
| Média Intel Core Ultra 9 275HX (82 - 116, n=29) | |
| Aorus MASTER 16 AM6H | |
| MSI Titan 18 HX AI A2XWJG | |
| MSI Raider A18 HX A9WIG-080 | |
| Schenker XMG Neo 16 A25 5090 | |
| 7-Zip 18.03 / 7z b 4 | |
| Schenker XMG Neo 16 A25 5090 | |
| MSI Raider A18 HX A9WIG-080 | |
| MSI Titan 18 HX AI A2XWJG | |
| Média Intel Core Ultra 9 275HX (98236 - 124155, n=30) | |
| Aorus MASTER 16 AM6H | |
| Alienware 16 Area-51 | |
| MSI Vector 17 HX AI A2XWIG | |
| Média da turma Gaming (33491 - 148086, n=105, últimos 2 anos) | |
| 7-Zip 18.03 / 7z b 4 -mmt1 | |
| Schenker XMG Neo 16 A25 5090 | |
| MSI Raider A18 HX A9WIG-080 | |
| MSI Titan 18 HX AI A2XWJG | |
| Média Intel Core Ultra 9 275HX (6026 - 7149, n=30) | |
| Aorus MASTER 16 AM6H | |
| MSI Vector 17 HX AI A2XWIG | |
| Média da turma Gaming (4199 - 7436, n=105, últimos 2 anos) | |
| Alienware 16 Area-51 | |
| Geekbench 6.7 / Multi-Core | |
| MSI Titan 18 HX AI A2XWJG | |
| Schenker XMG Neo 16 A25 5090 | |
| MSI Raider A18 HX A9WIG-080 | |
| Média Intel Core Ultra 9 275HX (16033 - 21668, n=33) | |
| Aorus MASTER 16 AM6H | |
| MSI Vector 17 HX AI A2XWIG | |
| Alienware 16 Area-51 | |
| Média da turma Gaming (6625 - 22850, n=106, últimos 2 anos) | |
| Geekbench 6.7 / Single-Core | |
| Schenker XMG Neo 16 A25 5090 | |
| MSI Raider A18 HX A9WIG-080 | |
| MSI Vector 17 HX AI A2XWIG | |
| MSI Titan 18 HX AI A2XWJG | |
| Aorus MASTER 16 AM6H | |
| Média Intel Core Ultra 9 275HX (2843 - 3160, n=33) | |
| Alienware 16 Area-51 | |
| Média da turma Gaming (1490 - 3259, n=106, últimos 2 anos) | |
| Geekbench 5.5 / Multi-Core | |
| MSI Titan 18 HX AI A2XWJG | |
| Schenker XMG Neo 16 A25 5090 | |
| MSI Raider A18 HX A9WIG-080 | |
| Média Intel Core Ultra 9 275HX (19105 - 25855, n=31) | |
| Aorus MASTER 16 AM6H | |
| Alienware 16 Area-51 | |
| MSI Vector 17 HX AI A2XWIG | |
| Média da turma Gaming (6460 - 28263, n=105, últimos 2 anos) | |
| Geekbench 5.5 / Single-Core | |
| MSI Raider A18 HX A9WIG-080 | |
| Schenker XMG Neo 16 A25 5090 | |
| MSI Titan 18 HX AI A2XWJG | |
| MSI Vector 17 HX AI A2XWIG | |
| Aorus MASTER 16 AM6H | |
| Média Intel Core Ultra 9 275HX (2033 - 2292, n=31) | |
| Alienware 16 Area-51 | |
| Média da turma Gaming (986 - 2474, n=105, últimos 2 anos) | |
| HWBOT x265 Benchmark v2.2 / 4k Preset | |
| MSI Titan 18 HX AI A2XWJG | |
| MSI Raider A18 HX A9WIG-080 | |
| Schenker XMG Neo 16 A25 5090 | |
| Média Intel Core Ultra 9 275HX (30.7 - 43.8, n=30) | |
| Aorus MASTER 16 AM6H | |
| MSI Vector 17 HX AI A2XWIG | |
| Alienware 16 Area-51 | |
| Média da turma Gaming (11.5 - 44.4, n=105, últimos 2 anos) | |
| LibreOffice / 20 Documents To PDF | |
| Média da turma Gaming (33.2 - 88.8, n=105, últimos 2 anos) | |
| MSI Titan 18 HX AI A2XWJG | |
| Schenker XMG Neo 16 A25 5090 | |
| MSI Raider A18 HX A9WIG-080 | |
| Média Intel Core Ultra 9 275HX (33.2 - 62.1, n=30) | |
| Aorus MASTER 16 AM6H | |
| MSI Vector 17 HX AI A2XWIG | |
| Alienware 16 Area-51 | |
| R Benchmark 2.5 / Overall mean | |
| Aorus MASTER 16 AM6H | |
| Alienware 16 Area-51 | |
| Média da turma Gaming (0.3439 - 0.759, n=106, últimos 2 anos) | |
| Média Intel Core Ultra 9 275HX (0.3943 - 0.4568, n=30) | |
| MSI Vector 17 HX AI A2XWIG | |
| MSI Titan 18 HX AI A2XWJG | |
| MSI Raider A18 HX A9WIG-080 | |
| Schenker XMG Neo 16 A25 5090 | |
* ... menor é melhor
AIDA64: FP32 Ray-Trace | FPU Julia | CPU SHA3 | CPU Queen | FPU SinJulia | FPU Mandel | CPU AES | CPU ZLib | FP64 Ray-Trace | CPU PhotoWorxx
| Performance rating | |
| Schenker XMG Neo 16 E25 RTX 5090 Laptop | |
| Medion Erazer Beast 16 X1 Ultimate | |
| Aorus MASTER 16 AM6H | |
| Lenovo Legion 5 Pro 16IAX10H | |
| Média Intel Core Ultra 9 275HX | |
| Alienware 16 Area-51 | |
| Média da turma Gaming | |
| MSI Vector 17 HX AI A2XWIG | |
| MSI Vector 16 HX AI A2XWHG | |
| AIDA64 / FP32 Ray-Trace | |
| Schenker XMG Neo 16 E25 RTX 5090 Laptop | |
| Medion Erazer Beast 16 X1 Ultimate | |
| Aorus MASTER 16 AM6H | |
| Média Intel Core Ultra 9 275HX (28039 - 39895, n=30) | |
| Lenovo Legion 5 Pro 16IAX10H | |
| Alienware 16 Area-51 | |
| Média da turma Gaming (10227 - 85542, n=105, últimos 2 anos) | |
| MSI Vector 17 HX AI A2XWIG | |
| MSI Vector 16 HX AI A2XWHG | |
| AIDA64 / FPU Julia | |
| Schenker XMG Neo 16 E25 RTX 5090 Laptop | |
| Medion Erazer Beast 16 X1 Ultimate | |
| Aorus MASTER 16 AM6H | |
| Lenovo Legion 5 Pro 16IAX10H | |
| Média Intel Core Ultra 9 275HX (140254 - 200744, n=30) | |
| Alienware 16 Area-51 | |
| MSI Vector 17 HX AI A2XWIG | |
| MSI Vector 16 HX AI A2XWHG | |
| Média da turma Gaming (51376 - 238426, n=105, últimos 2 anos) | |
| AIDA64 / CPU SHA3 | |
| Schenker XMG Neo 16 E25 RTX 5090 Laptop | |
| Medion Erazer Beast 16 X1 Ultimate | |
| Aorus MASTER 16 AM6H | |
| Média Intel Core Ultra 9 275HX (6710 - 9817, n=30) | |
| Lenovo Legion 5 Pro 16IAX10H | |
| Alienware 16 Area-51 | |
| MSI Vector 17 HX AI A2XWIG | |
| MSI Vector 16 HX AI A2XWHG | |
| Média da turma Gaming (2180 - 10115, n=105, últimos 2 anos) | |
| AIDA64 / CPU Queen | |
| Schenker XMG Neo 16 E25 RTX 5090 Laptop | |
| Medion Erazer Beast 16 X1 Ultimate | |
| Lenovo Legion 5 Pro 16IAX10H | |
| Aorus MASTER 16 AM6H | |
| Média Intel Core Ultra 9 275HX (113887 - 140937, n=30) | |
| Alienware 16 Area-51 | |
| MSI Vector 17 HX AI A2XWIG | |
| Média da turma Gaming (49785 - 173351, n=90, últimos 2 anos) | |
| MSI Vector 16 HX AI A2XWHG | |
| AIDA64 / FPU SinJulia | |
| Média da turma Gaming (4424 - 33636, n=105, últimos 2 anos) | |
| Medion Erazer Beast 16 X1 Ultimate | |
| Schenker XMG Neo 16 E25 RTX 5090 Laptop | |
| Lenovo Legion 5 Pro 16IAX10H | |
| Alienware 16 Area-51 | |
| Aorus MASTER 16 AM6H | |
| Média Intel Core Ultra 9 275HX (11172 - 14425, n=30) | |
| MSI Vector 17 HX AI A2XWIG | |
| MSI Vector 16 HX AI A2XWHG | |
| AIDA64 / FPU Mandel | |
| Schenker XMG Neo 16 E25 RTX 5090 Laptop | |
| Aorus MASTER 16 AM6H | |
| Medion Erazer Beast 16 X1 Ultimate | |
| Média Intel Core Ultra 9 275HX (72596 - 104508, n=30) | |
| Lenovo Legion 5 Pro 16IAX10H | |
| Alienware 16 Area-51 | |
| MSI Vector 17 HX AI A2XWIG | |
| Média da turma Gaming (25115 - 128721, n=105, últimos 2 anos) | |
| MSI Vector 16 HX AI A2XWHG | |
| AIDA64 / CPU AES | |
| Schenker XMG Neo 16 E25 RTX 5090 Laptop | |
| Medion Erazer Beast 16 X1 Ultimate | |
| Lenovo Legion 5 Pro 16IAX10H | |
| Média Intel Core Ultra 9 275HX (105608 - 247074, n=30) | |
| Alienware 16 Area-51 | |
| Aorus MASTER 16 AM6H | |
| Média da turma Gaming (39258 - 247074, n=105, últimos 2 anos) | |
| MSI Vector 17 HX AI A2XWIG | |
| MSI Vector 16 HX AI A2XWHG | |
| AIDA64 / CPU ZLib | |
| Schenker XMG Neo 16 E25 RTX 5090 Laptop | |
| Medion Erazer Beast 16 X1 Ultimate | |
| Lenovo Legion 5 Pro 16IAX10H | |
| Aorus MASTER 16 AM6H | |
| Média Intel Core Ultra 9 275HX (1582 - 2263, n=30) | |
| Alienware 16 Area-51 | |
| MSI Vector 17 HX AI A2XWIG | |
| Média da turma Gaming (574 - 2531, n=105, últimos 2 anos) | |
| MSI Vector 16 HX AI A2XWHG | |
| AIDA64 / FP64 Ray-Trace | |
| Schenker XMG Neo 16 E25 RTX 5090 Laptop | |
| Medion Erazer Beast 16 X1 Ultimate | |
| Aorus MASTER 16 AM6H | |
| Média Intel Core Ultra 9 275HX (14847 - 21854, n=30) | |
| Lenovo Legion 5 Pro 16IAX10H | |
| Alienware 16 Area-51 | |
| Média da turma Gaming (5509 - 45446, n=105, últimos 2 anos) | |
| MSI Vector 16 HX AI A2XWHG | |
| MSI Vector 17 HX AI A2XWIG | |
| AIDA64 / CPU PhotoWorxx | |
| Schenker XMG Neo 16 E25 RTX 5090 Laptop | |
| Alienware 16 Area-51 | |
| Média Intel Core Ultra 9 275HX (37482 - 62916, n=30) | |
| Lenovo Legion 5 Pro 16IAX10H | |
| Medion Erazer Beast 16 X1 Ultimate | |
| MSI Vector 17 HX AI A2XWIG | |
| Aorus MASTER 16 AM6H | |
| Média da turma Gaming (12271 - 89891, n=105, últimos 2 anos) | |
| MSI Vector 16 HX AI A2XWHG | |
Desempenho do sistema
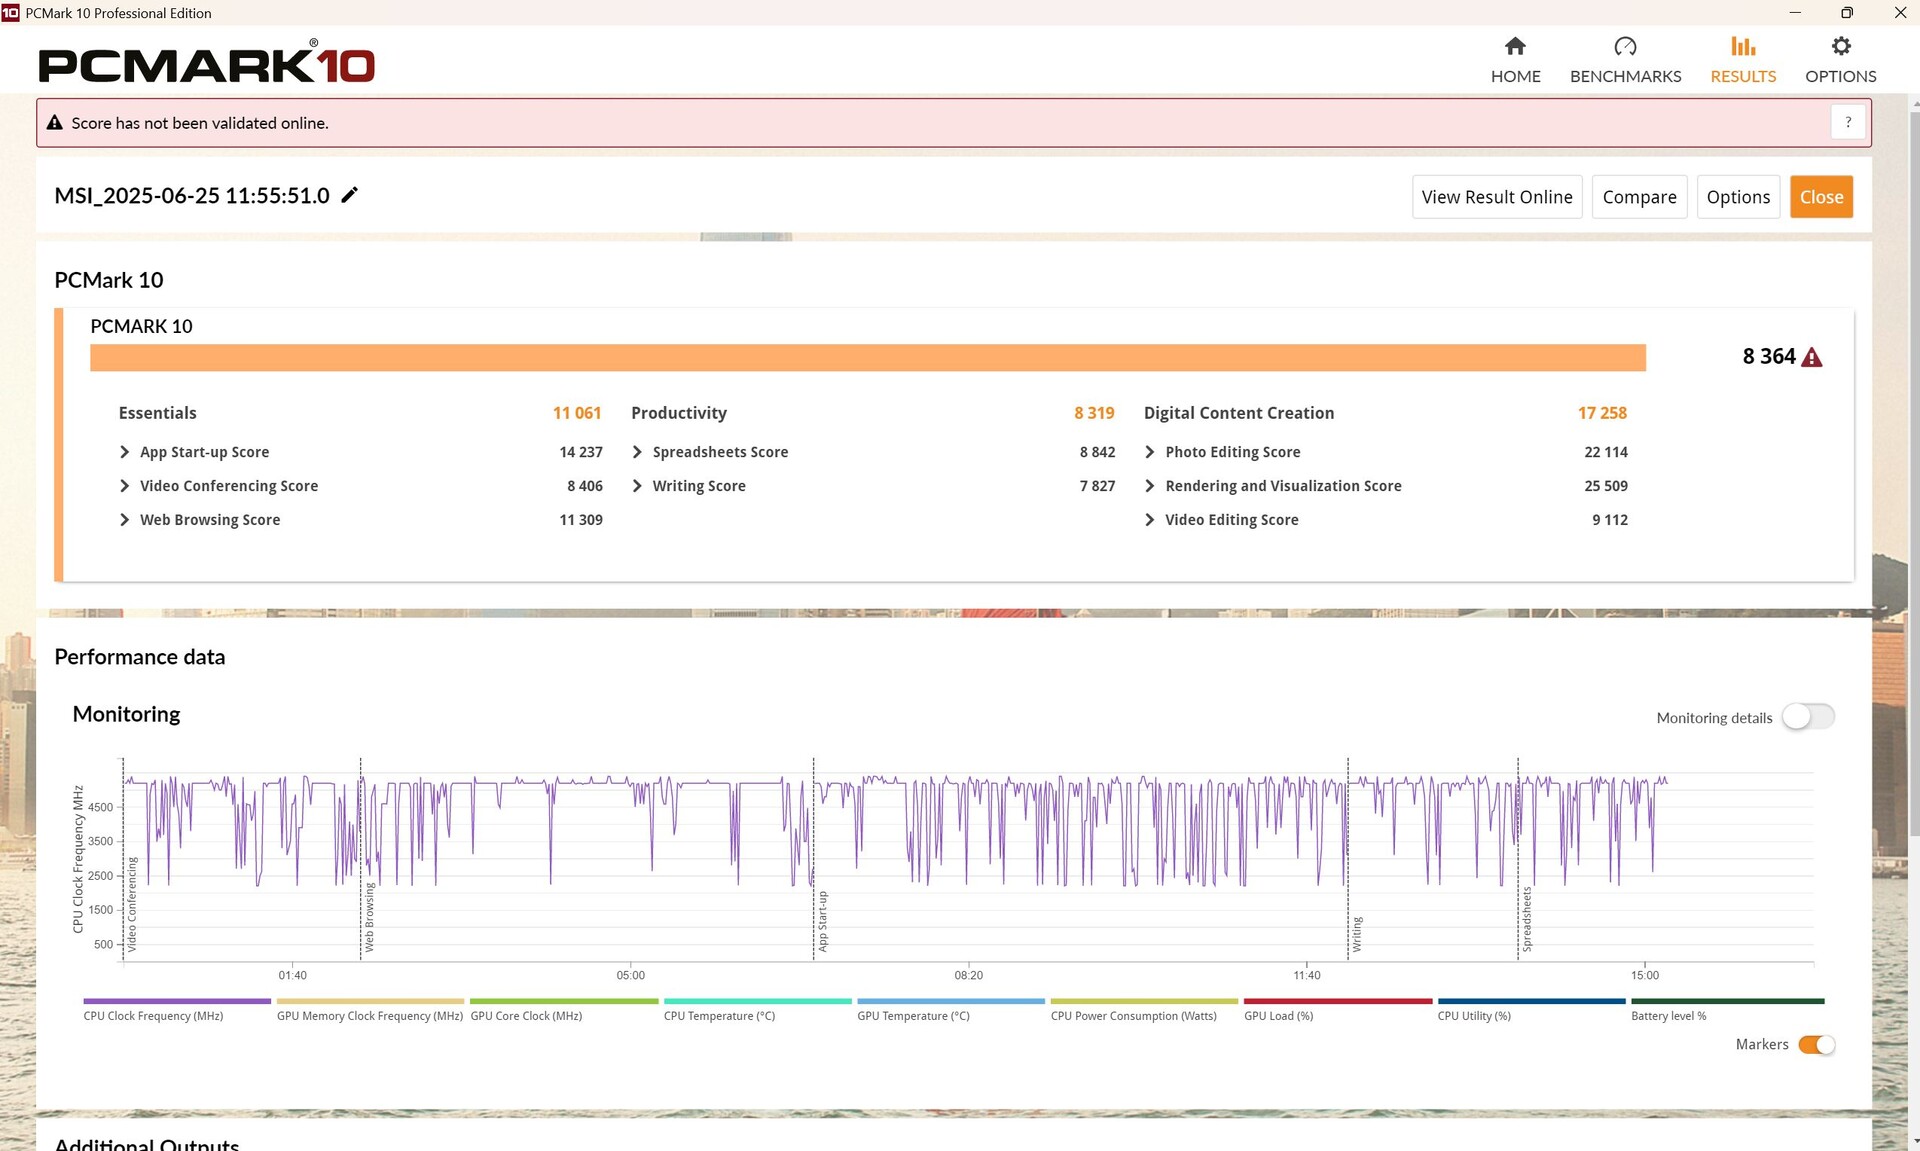
O Vector 17 tem um desempenho ligeiramente abaixo da média no PCMark 10, mas ligeiramente acima da média no CrossMark, de modo que vemos um desempenho geral no nível esperado.
PCMark 10: Score | Essentials | Productivity | Digital Content Creation
CrossMark: Overall | Productivity | Creativity | Responsiveness
WebXPRT 3: Overall
WebXPRT 4: Overall
Mozilla Kraken 1.1: Total
| Performance rating | |
| MSI Raider A18 HX A9WIG-080 | |
| Lenovo Legion 5 Pro 16IAX10H | |
| Alienware 16 Area-51 | |
| Média Intel Core Ultra 9 275HX, NVIDIA GeForce RTX 5080 Laptop | |
| Lenovo Legion Pro 7i 16 Gen 10 | |
| MSI Vector 17 HX AI A2XWIG | |
| Média da turma Gaming | |
| Medion Erazer Beast 18 X1 MD62731 | |
| MSI Vector 16 HX AI A2XWHG | |
| PCMark 10 / Score | |
| Lenovo Legion Pro 7i 16 Gen 10 | |
| MSI Raider A18 HX A9WIG-080 | |
| Alienware 16 Area-51 | |
| Média Intel Core Ultra 9 275HX, NVIDIA GeForce RTX 5080 Laptop (7805 - 10409, n=9) | |
| Média da turma Gaming (5828 - 12414, n=93, últimos 2 anos) | |
| Medion Erazer Beast 18 X1 MD62731 | |
| MSI Vector 17 HX AI A2XWIG | |
| Lenovo Legion 5 Pro 16IAX10H | |
| MSI Vector 16 HX AI A2XWHG | |
| PCMark 10 / Essentials | |
| MSI Raider A18 HX A9WIG-080 | |
| Lenovo Legion Pro 7i 16 Gen 10 | |
| Alienware 16 Area-51 | |
| MSI Vector 17 HX AI A2XWIG | |
| Média Intel Core Ultra 9 275HX, NVIDIA GeForce RTX 5080 Laptop (10206 - 11472, n=9) | |
| Lenovo Legion 5 Pro 16IAX10H | |
| MSI Vector 16 HX AI A2XWHG | |
| Média da turma Gaming (8810 - 11935, n=97, últimos 2 anos) | |
| Medion Erazer Beast 18 X1 MD62731 | |
| PCMark 10 / Productivity | |
| Média da turma Gaming (6845 - 25323, n=95, últimos 2 anos) | |
| MSI Raider A18 HX A9WIG-080 | |
| Média Intel Core Ultra 9 275HX, NVIDIA GeForce RTX 5080 Laptop (8319 - 20616, n=9) | |
| Medion Erazer Beast 18 X1 MD62731 | |
| Lenovo Legion 5 Pro 16IAX10H | |
| Lenovo Legion Pro 7i 16 Gen 10 | |
| MSI Vector 16 HX AI A2XWHG | |
| Alienware 16 Area-51 | |
| MSI Vector 17 HX AI A2XWIG | |
| PCMark 10 / Digital Content Creation | |
| Lenovo Legion Pro 7i 16 Gen 10 | |
| Alienware 16 Area-51 | |
| MSI Vector 17 HX AI A2XWIG | |
| Média Intel Core Ultra 9 275HX, NVIDIA GeForce RTX 5080 Laptop (10505 - 19351, n=9) | |
| Medion Erazer Beast 18 X1 MD62731 | |
| Lenovo Legion 5 Pro 16IAX10H | |
| MSI Raider A18 HX A9WIG-080 | |
| Média da turma Gaming (7602 - 19954, n=95, últimos 2 anos) | |
| MSI Vector 16 HX AI A2XWHG | |
| CrossMark / Overall | |
| MSI Raider A18 HX A9WIG-080 | |
| MSI Vector 17 HX AI A2XWIG | |
| Lenovo Legion 5 Pro 16IAX10H | |
| Alienware 16 Area-51 | |
| Média Intel Core Ultra 9 275HX, NVIDIA GeForce RTX 5080 Laptop (1857 - 2244, n=9) | |
| Lenovo Legion Pro 7i 16 Gen 10 | |
| Média da turma Gaming (1366 - 2409, n=94, últimos 2 anos) | |
| MSI Vector 16 HX AI A2XWHG | |
| Medion Erazer Beast 18 X1 MD62731 | |
| CrossMark / Productivity | |
| MSI Vector 17 HX AI A2XWIG | |
| Lenovo Legion 5 Pro 16IAX10H | |
| Alienware 16 Area-51 | |
| MSI Raider A18 HX A9WIG-080 | |
| Média Intel Core Ultra 9 275HX, NVIDIA GeForce RTX 5080 Laptop (1764 - 2122, n=9) | |
| Lenovo Legion Pro 7i 16 Gen 10 | |
| Média da turma Gaming (1386 - 2254, n=94, últimos 2 anos) | |
| MSI Vector 16 HX AI A2XWHG | |
| Medion Erazer Beast 18 X1 MD62731 | |
| CrossMark / Creativity | |
| MSI Raider A18 HX A9WIG-080 | |
| Lenovo Legion 5 Pro 16IAX10H | |
| MSI Vector 17 HX AI A2XWIG | |
| Alienware 16 Area-51 | |
| Média Intel Core Ultra 9 275HX, NVIDIA GeForce RTX 5080 Laptop (2115 - 2498, n=9) | |
| Lenovo Legion Pro 7i 16 Gen 10 | |
| MSI Vector 16 HX AI A2XWHG | |
| Média da turma Gaming (1343 - 2786, n=94, últimos 2 anos) | |
| Medion Erazer Beast 18 X1 MD62731 | |
| CrossMark / Responsiveness | |
| Alienware 16 Area-51 | |
| MSI Vector 17 HX AI A2XWIG | |
| Lenovo Legion 5 Pro 16IAX10H | |
| Média Intel Core Ultra 9 275HX, NVIDIA GeForce RTX 5080 Laptop (1466 - 2096, n=9) | |
| MSI Raider A18 HX A9WIG-080 | |
| Média da turma Gaming (1226 - 2334, n=94, últimos 2 anos) | |
| Lenovo Legion Pro 7i 16 Gen 10 | |
| MSI Vector 16 HX AI A2XWHG | |
| Medion Erazer Beast 18 X1 MD62731 | |
| WebXPRT 3 / Overall | |
| Lenovo Legion 5 Pro 16IAX10H | |
| MSI Raider A18 HX A9WIG-080 | |
| Lenovo Legion Pro 7i 16 Gen 10 | |
| Alienware 16 Area-51 | |
| Média Intel Core Ultra 9 275HX, NVIDIA GeForce RTX 5080 Laptop (306 - 378, n=9) | |
| Medion Erazer Beast 18 X1 MD62731 | |
| MSI Vector 17 HX AI A2XWIG | |
| MSI Vector 16 HX AI A2XWHG | |
| Média da turma Gaming (220 - 532, n=98, últimos 2 anos) | |
| WebXPRT 4 / Overall | |
| MSI Vector 17 HX AI A2XWIG | |
| Lenovo Legion Pro 7i 16 Gen 10 | |
| MSI Raider A18 HX A9WIG-080 | |
| Alienware 16 Area-51 | |
| Lenovo Legion 5 Pro 16IAX10H | |
| Medion Erazer Beast 18 X1 MD62731 | |
| Média Intel Core Ultra 9 275HX, NVIDIA GeForce RTX 5080 Laptop (285 - 336, n=9) | |
| MSI Vector 16 HX AI A2XWHG | |
| Média da turma Gaming (165 - 354, n=98, últimos 2 anos) | |
| Mozilla Kraken 1.1 / Total | |
| Média da turma Gaming (391 - 590, n=100, últimos 2 anos) | |
| MSI Vector 16 HX AI A2XWHG | |
| MSI Vector 17 HX AI A2XWIG | |
| Medion Erazer Beast 18 X1 MD62731 | |
| Média Intel Core Ultra 9 275HX, NVIDIA GeForce RTX 5080 Laptop (405 - 432, n=9) | |
| Lenovo Legion 5 Pro 16IAX10H | |
| Alienware 16 Area-51 | |
| Lenovo Legion Pro 7i 16 Gen 10 | |
| MSI Raider A18 HX A9WIG-080 | |
* ... menor é melhor
| PCMark 10 Score | 8364 pontos | |
Ajuda | ||
| AIDA64 / Memory Copy | |
| Alienware 16 Area-51 | |
| Lenovo Legion Pro 7i 16 Gen 10 | |
| Média Intel Core Ultra 9 275HX (56003 - 94460, n=30) | |
| Lenovo Legion 5 Pro 16IAX10H | |
| MSI Vector 17 HX AI A2XWIG | |
| Medion Erazer Beast 18 X1 MD62731 | |
| Média da turma Gaming (21750 - 129946, n=105, últimos 2 anos) | |
| MSI Vector 16 HX AI A2XWHG | |
| MSI Raider A18 HX A9WIG-080 | |
| AIDA64 / Memory Read | |
| Lenovo Legion Pro 7i 16 Gen 10 | |
| Alienware 16 Area-51 | |
| Lenovo Legion 5 Pro 16IAX10H | |
| Medion Erazer Beast 18 X1 MD62731 | |
| MSI Vector 17 HX AI A2XWIG | |
| Média Intel Core Ultra 9 275HX (55795 - 97151, n=30) | |
| MSI Vector 16 HX AI A2XWHG | |
| Média da turma Gaming (22956 - 118858, n=105, últimos 2 anos) | |
| MSI Raider A18 HX A9WIG-080 | |
| AIDA64 / Memory Write | |
| Lenovo Legion Pro 7i 16 Gen 10 | |
| Alienware 16 Area-51 | |
| Média Intel Core Ultra 9 275HX (55663 - 116129, n=30) | |
| Lenovo Legion 5 Pro 16IAX10H | |
| Medion Erazer Beast 18 X1 MD62731 | |
| MSI Vector 17 HX AI A2XWIG | |
| Média da turma Gaming (22297 - 135096, n=105, últimos 2 anos) | |
| MSI Vector 16 HX AI A2XWHG | |
| MSI Raider A18 HX A9WIG-080 | |
| AIDA64 / Memory Latency | |
| Alienware 16 Area-51 | |
| Média Intel Core Ultra 9 275HX (105.8 - 161.6, n=30) | |
| MSI Vector 17 HX AI A2XWIG | |
| Lenovo Legion 5 Pro 16IAX10H | |
| Medion Erazer Beast 18 X1 MD62731 | |
| Lenovo Legion Pro 7i 16 Gen 10 | |
| Média da turma Gaming (75.3 - 259, n=105, últimos 2 anos) | |
| MSI Vector 16 HX AI A2XWHG | |
| MSI Raider A18 HX A9WIG-080 | |
* ... menor é melhor
Latências de DPC
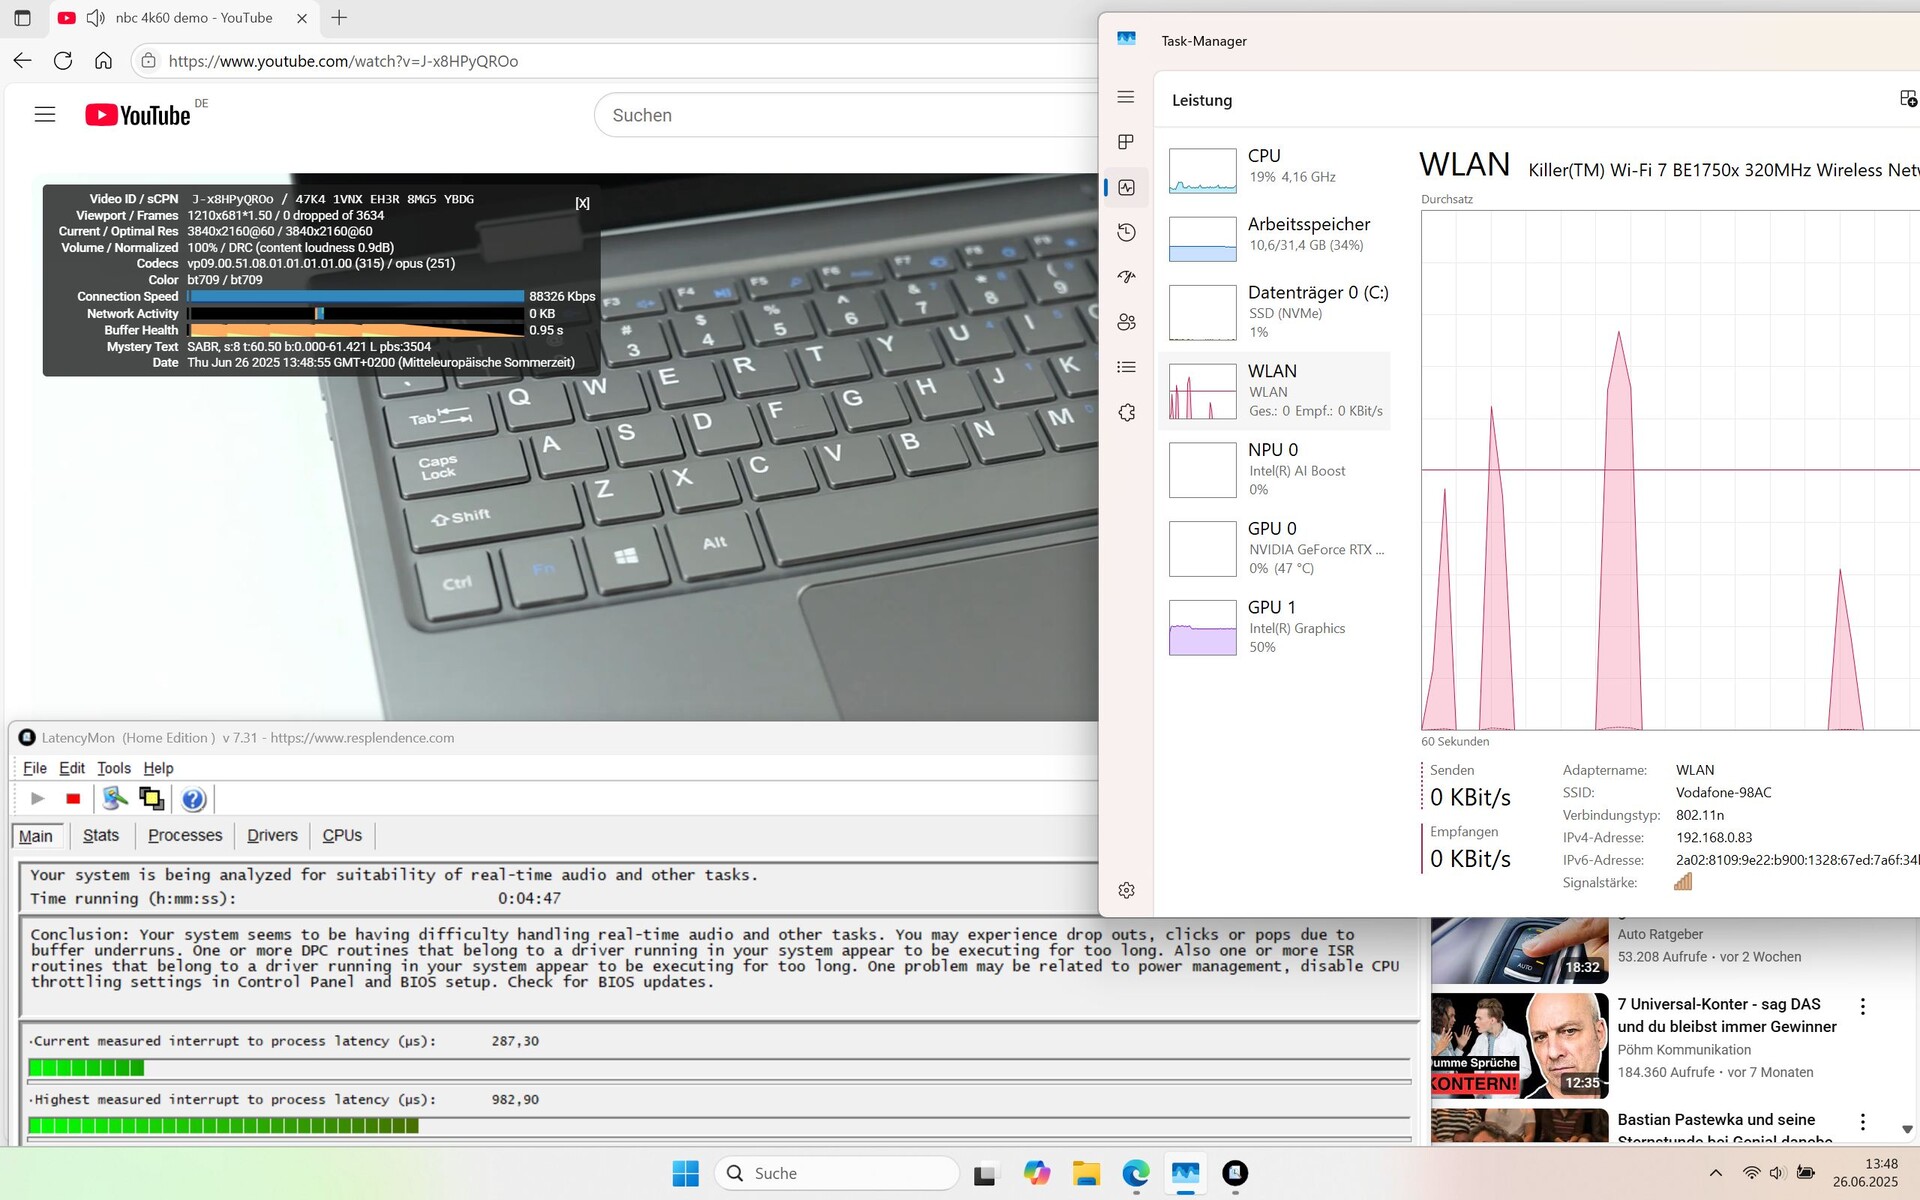
As latências só ocorrem ao abrir várias guias do navegador e são relativamente baixas mesmo depois disso. Nosso vídeo 4K/60 fps é reproduzido sem nenhuma queda de quadros.
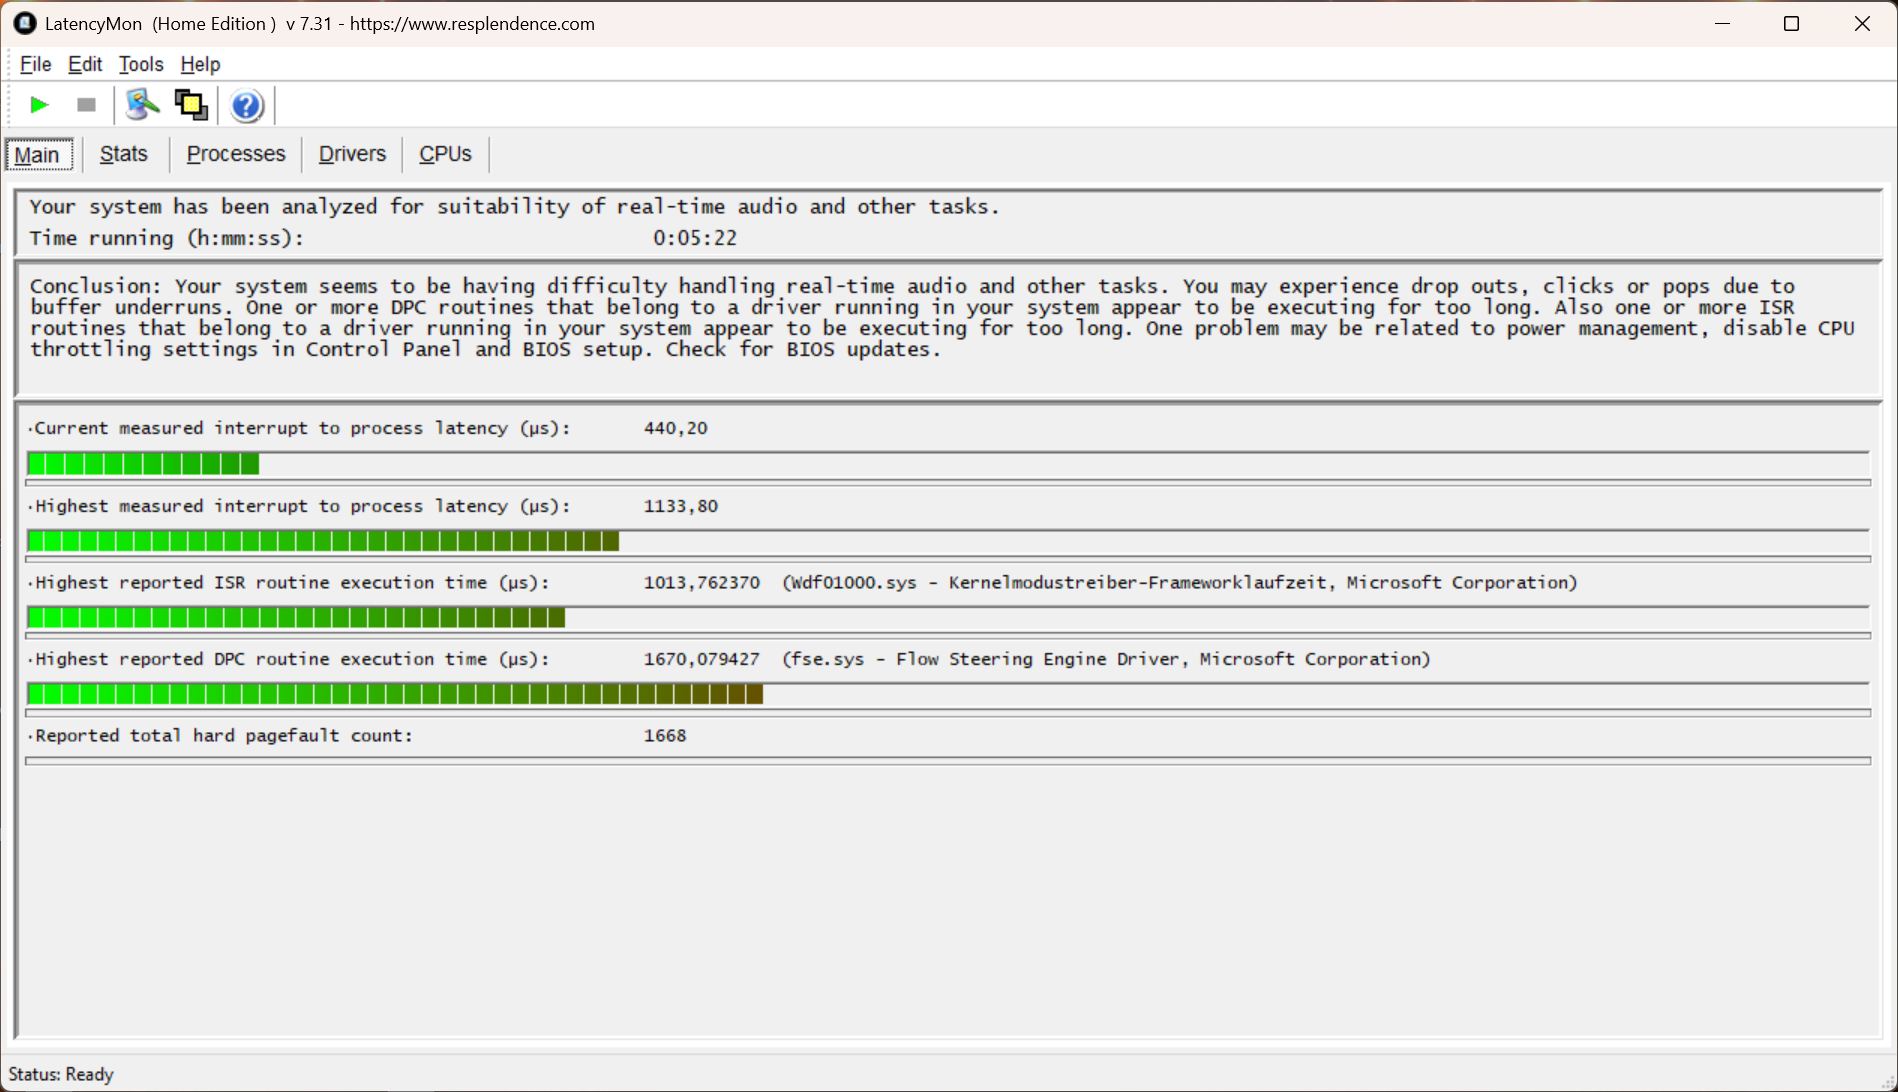
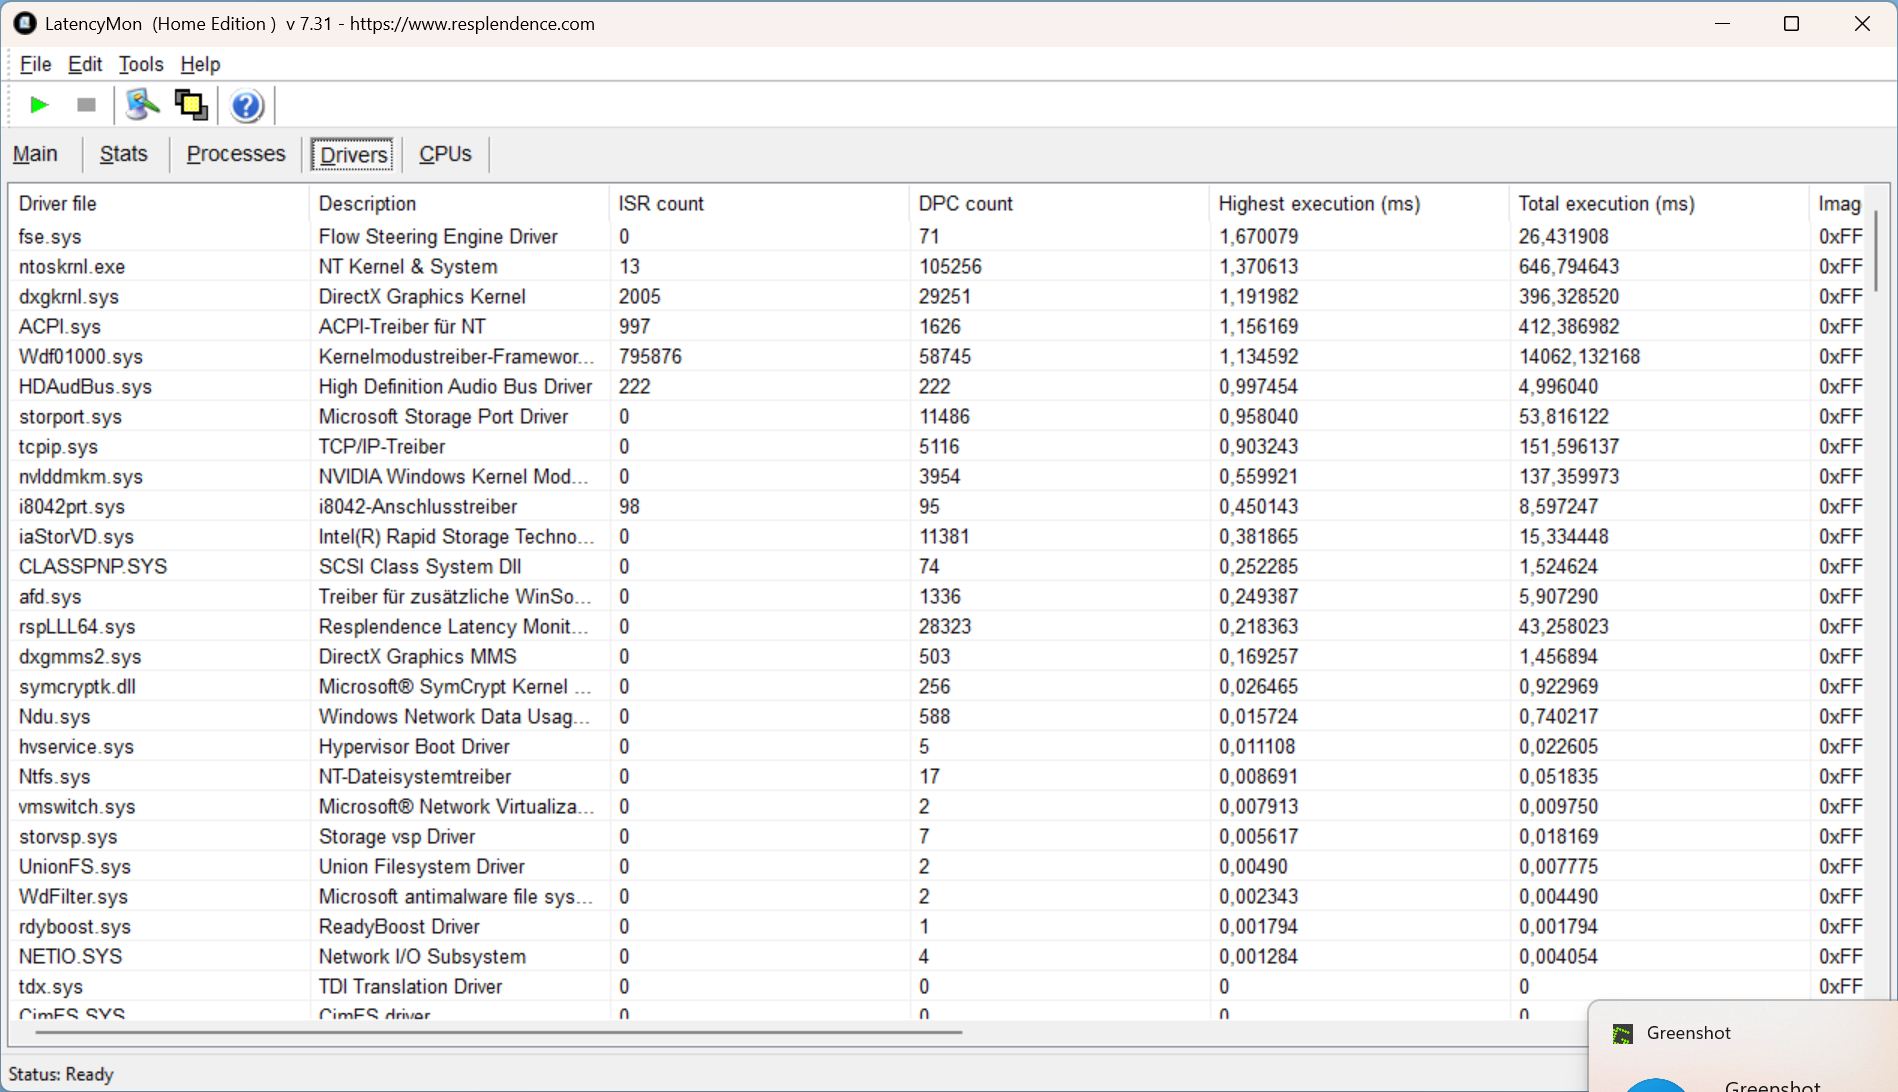
| DPC Latencies / LatencyMon - interrupt to process latency (max), Web, Youtube, Prime95 | |
| Medion Erazer Beast 18 X1 MD62731 | |
| MSI Vector 16 HX AI A2XWHG | |
| Alienware 16 Area-51 | |
| MSI Vector 17 HX AI A2XWIG | |
| Lenovo Legion 5 Pro 16IAX10H | |
| MSI Raider A18 HX A9WIG-080 | |
| Lenovo Legion Pro 7i 16 Gen 10 | |
* ... menor é melhor
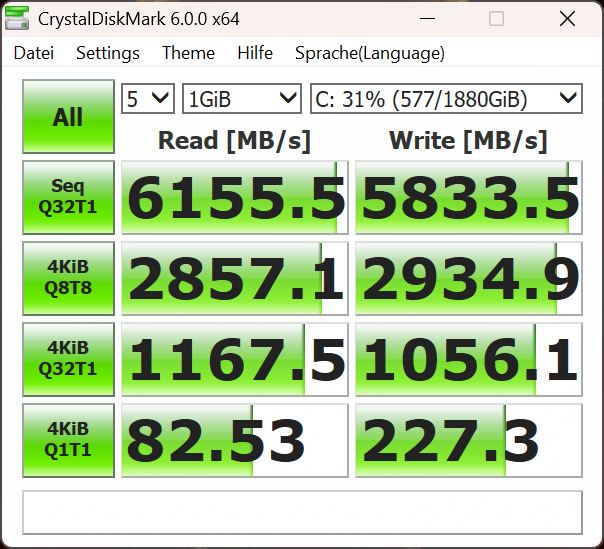
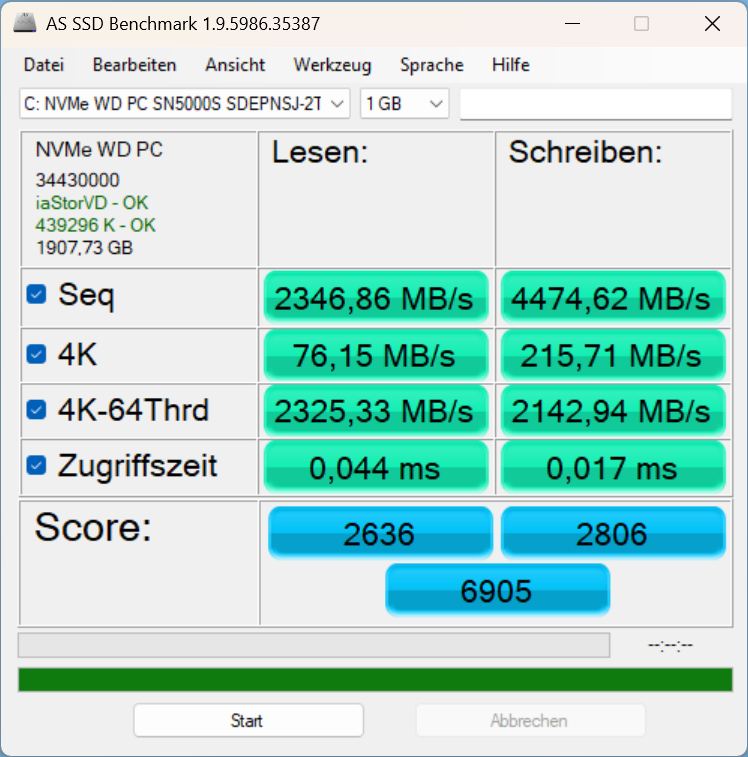
Armazenamento em massa
O SSD da Western Digital com 2 TB atinge valores médios a bons e não sofre aceleração mesmo sob carga prolongada.
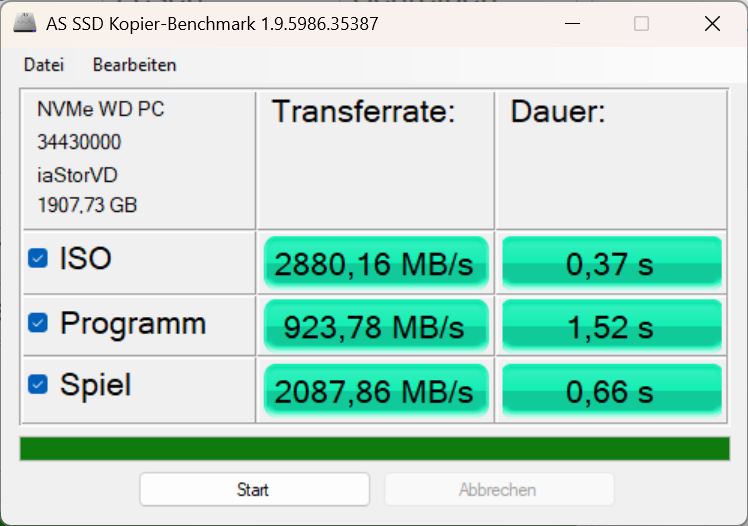

* ... menor é melhor
Continuous Reading: DiskSpd Read Loop, Queue Depth 8
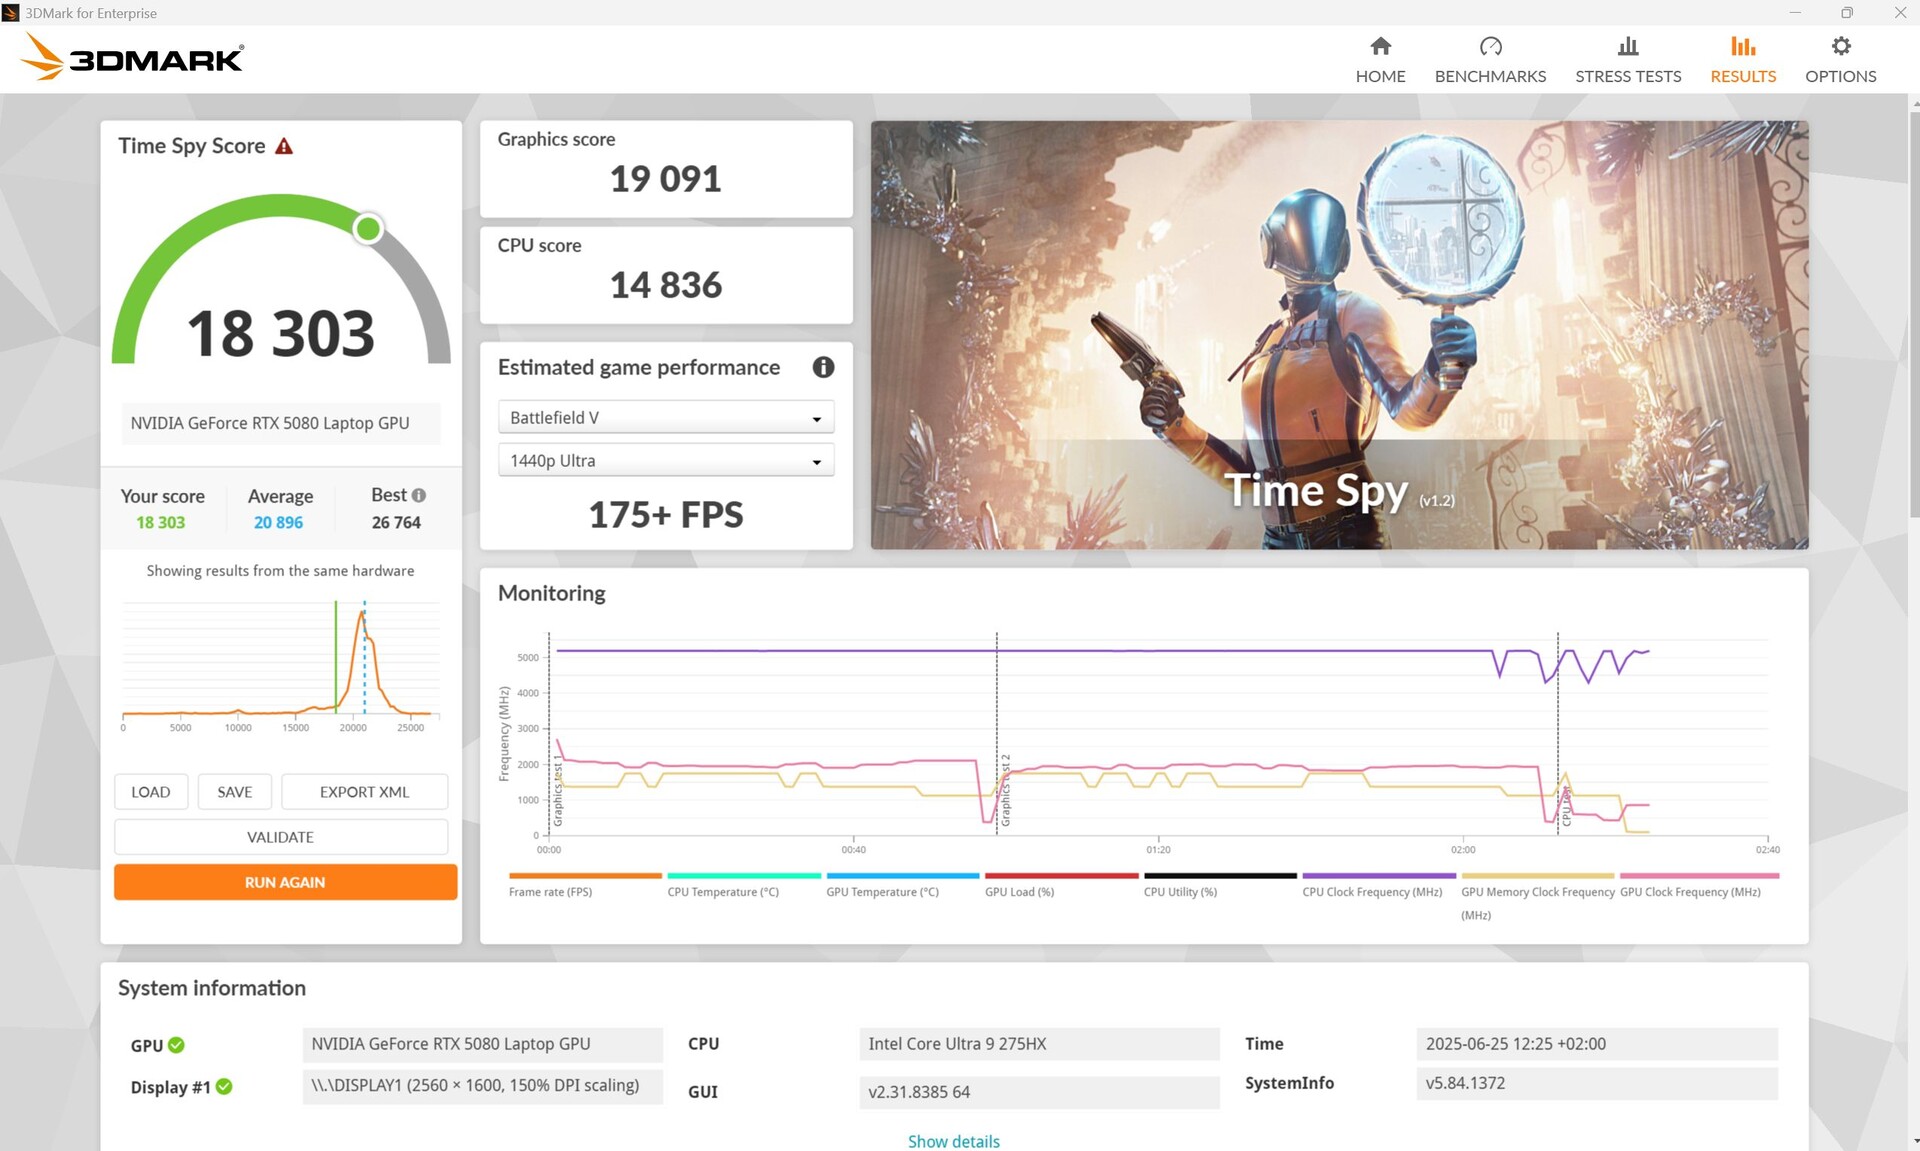
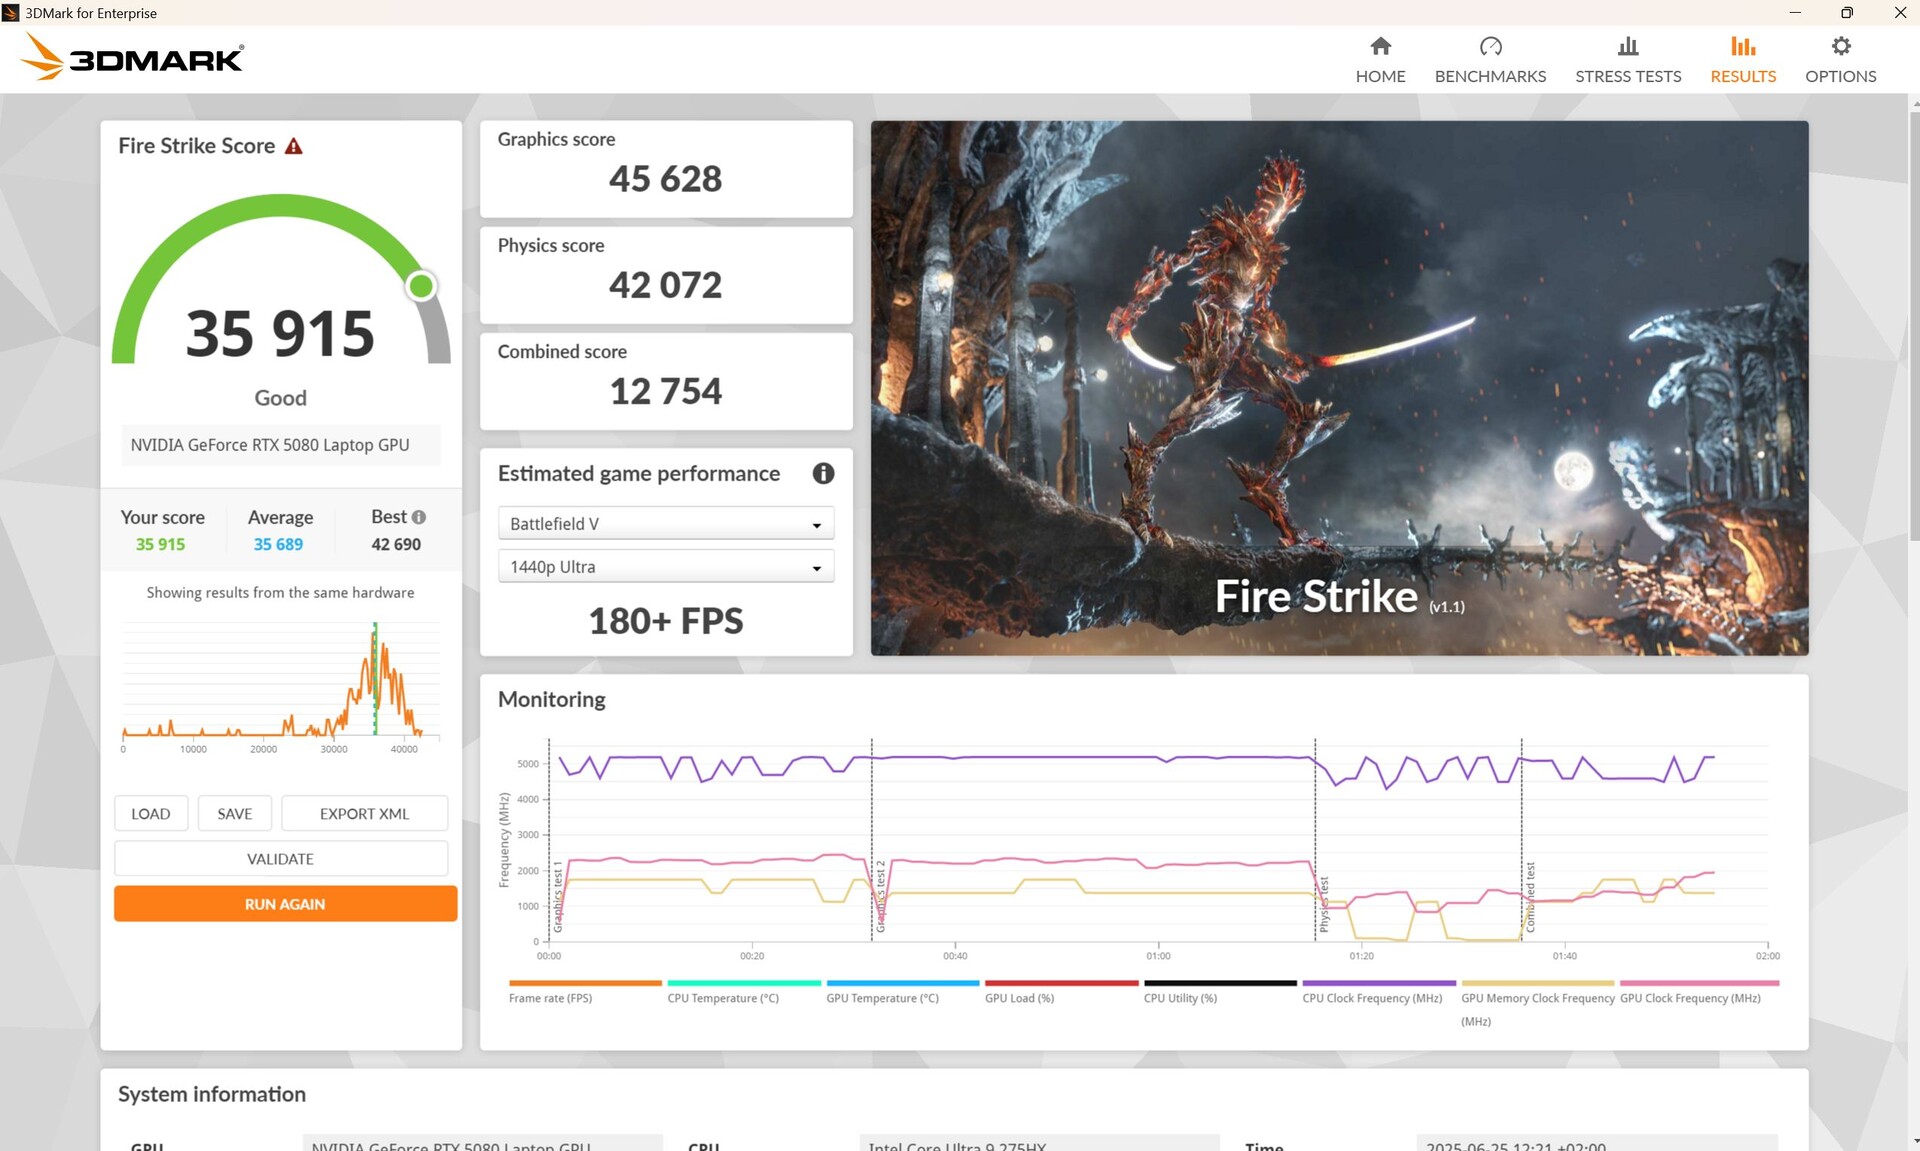
Desempenho da GPU
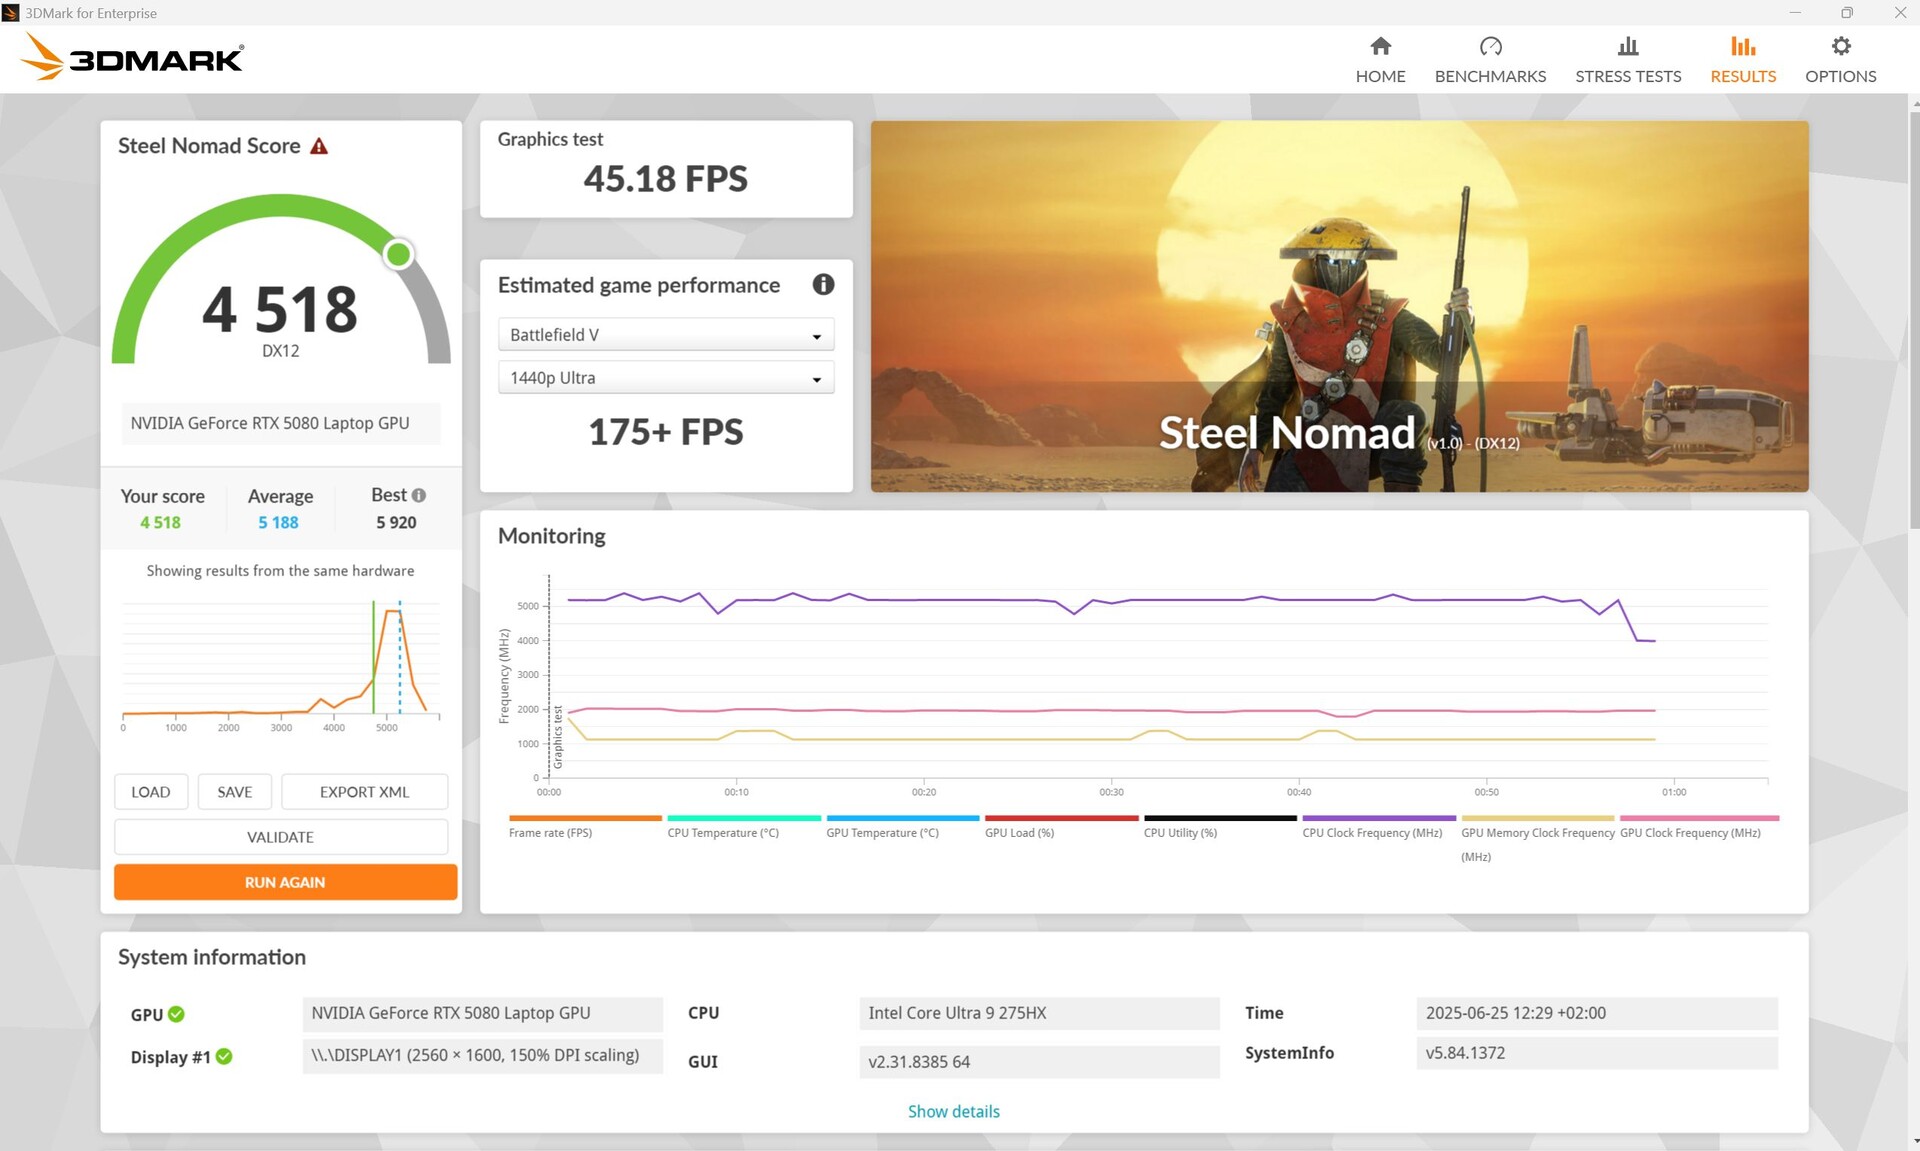
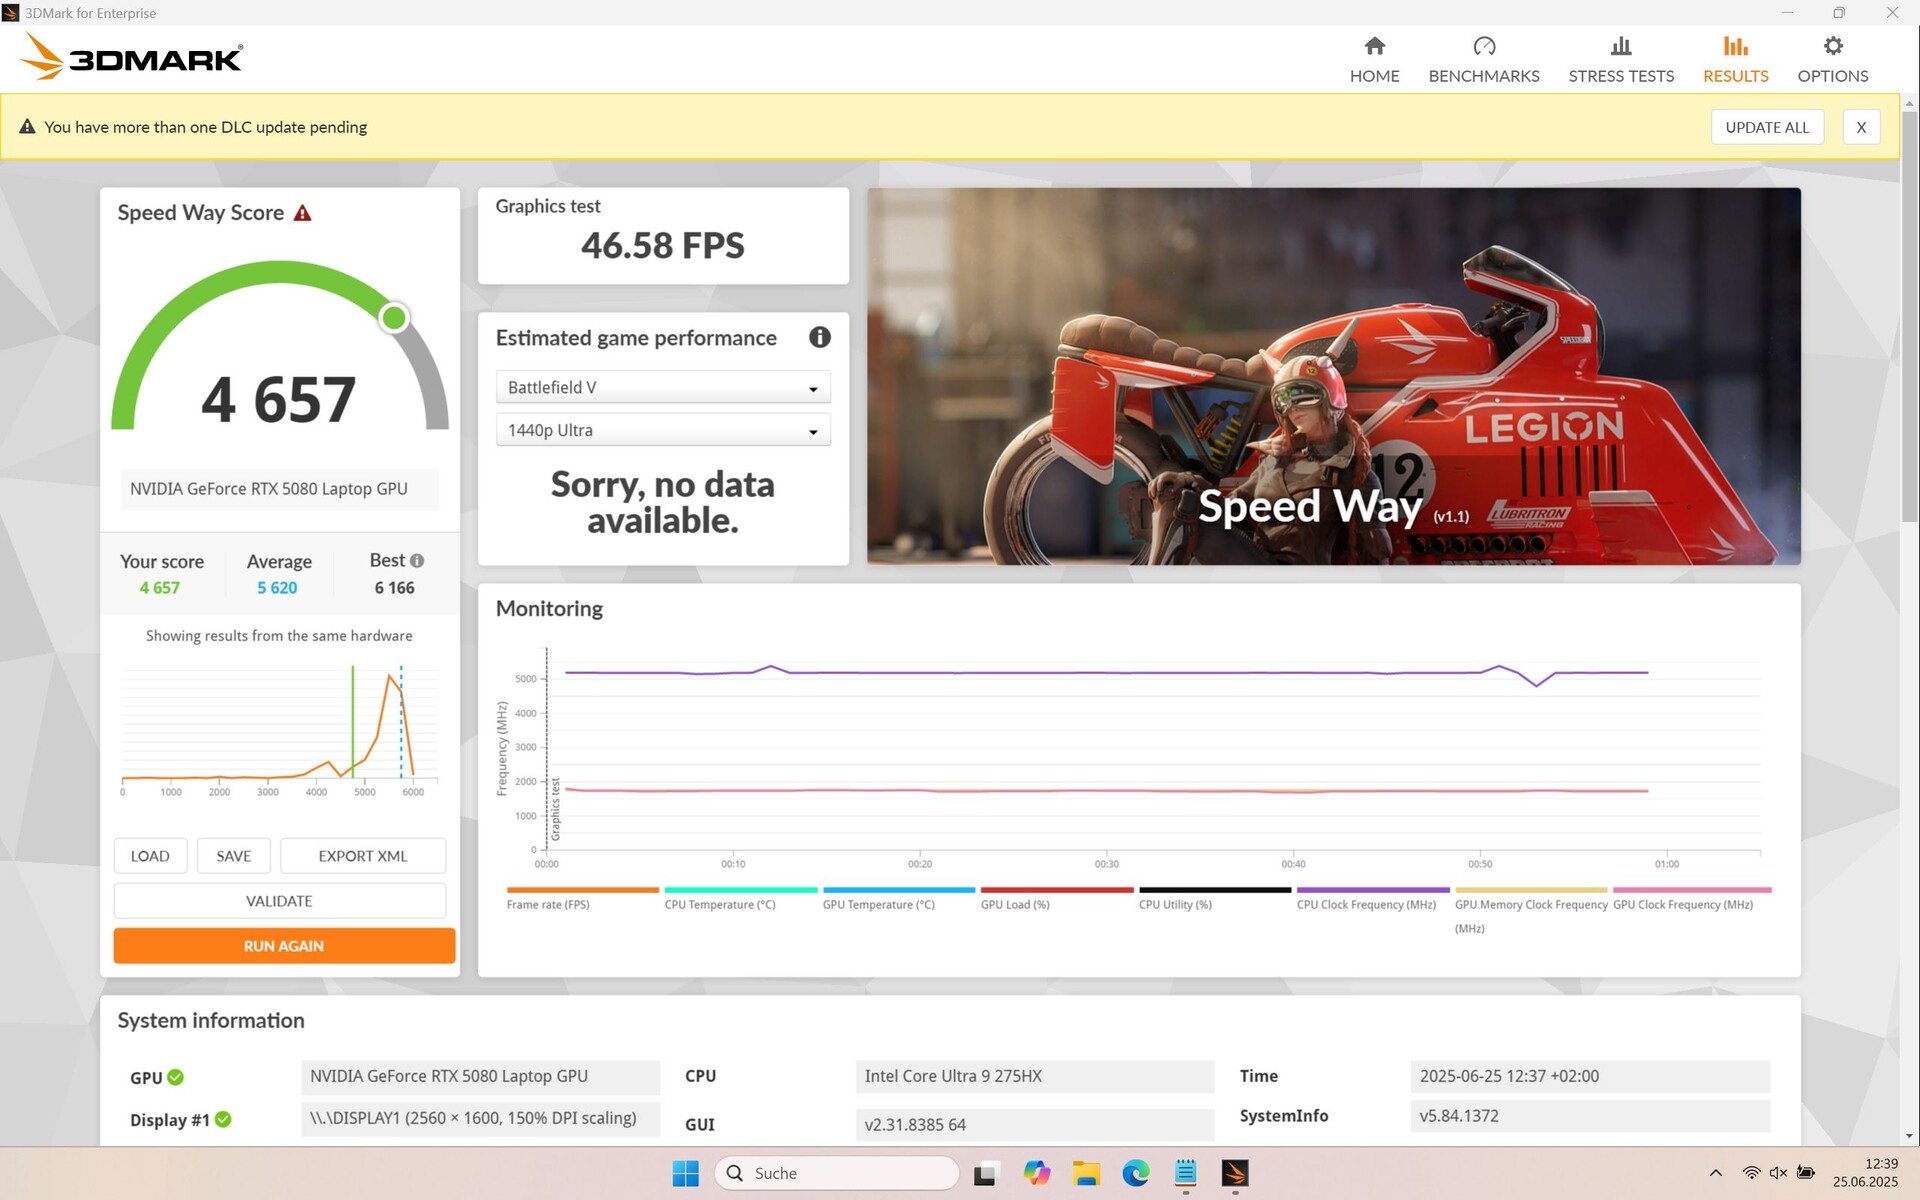
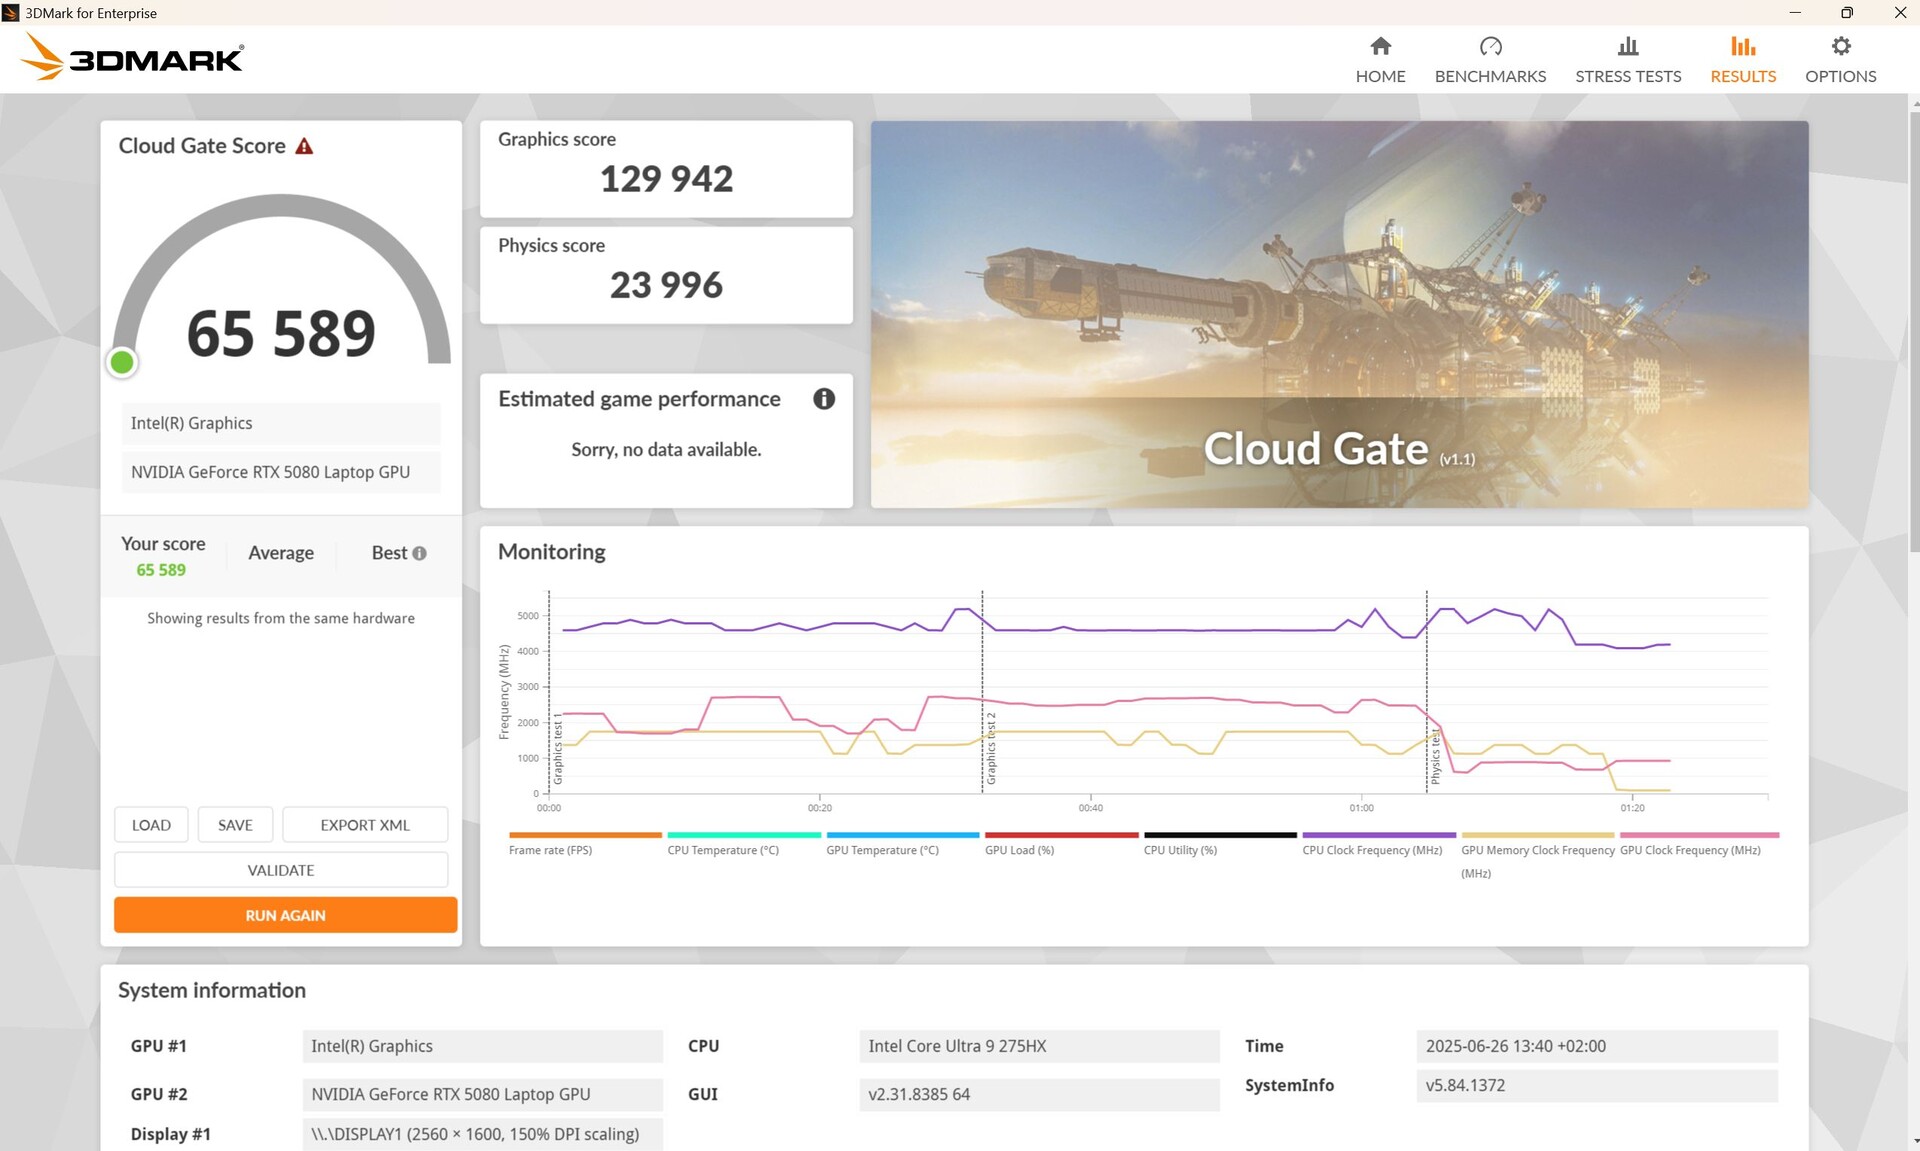
O Laptop RTX 5080 tem desempenho 4% abaixo da média no 3DMarks. Um teste em Fire Strike no modo de bateria revela uma perda de desempenho 3D de 50%.
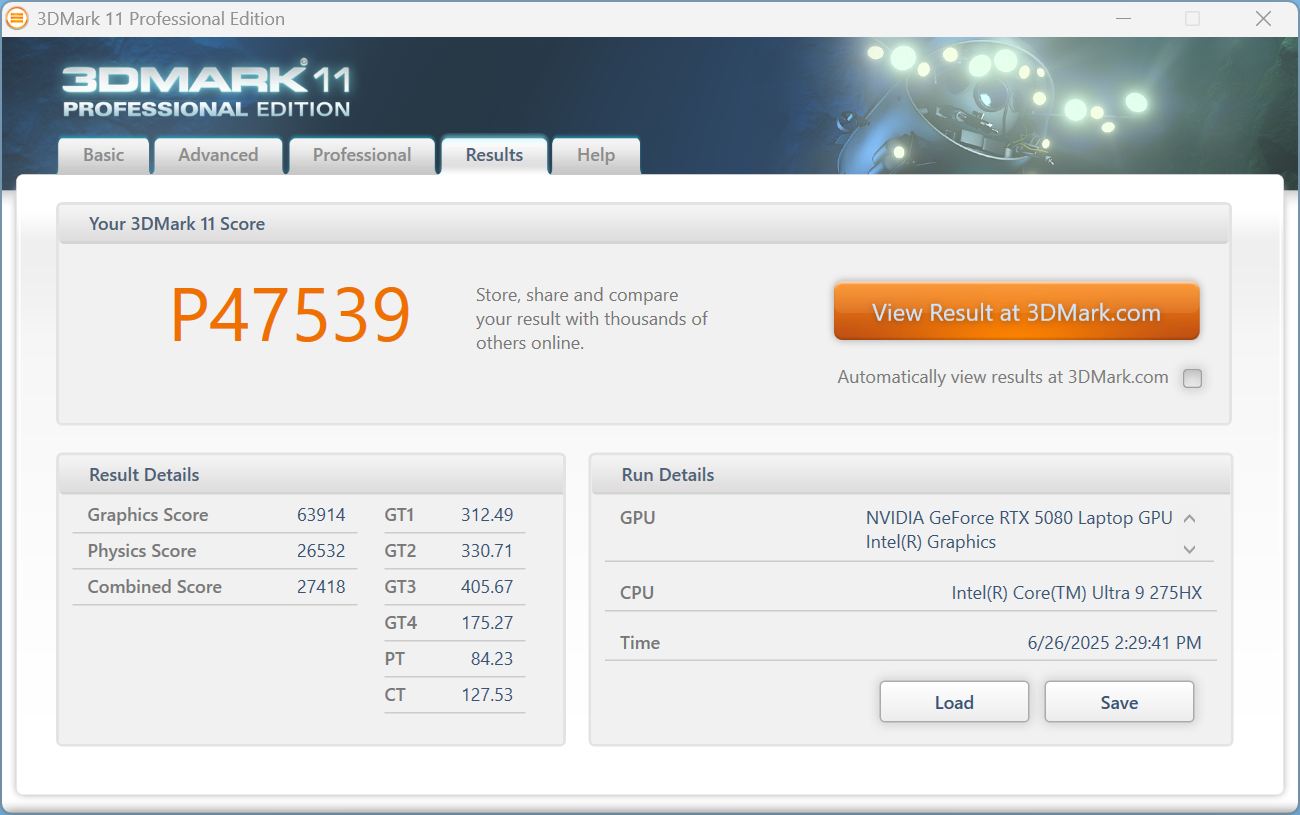
| 3DMark 11 Performance | 47539 pontos | |
| 3DMark Cloud Gate Standard Score | 65589 pontos | |
| 3DMark Fire Strike Score | 35915 pontos | |
| 3DMark Time Spy Score | 18303 pontos | |
| 3DMark Steel Nomad Score | 4518 pontos | |
Ajuda | ||
* ... menor é melhor
Desempenho em jogos
Em nossos jogos, o Vector 17 em Full HD está no mesmo nível de um Medion Erazer Beast 18 X1 e, portanto, um pouco abaixo da média dos gamers da RTX 5080. O desempenho contínuo no Cyberpunk é muito consistente.
Ele se sente mais à vontade em QHD, principalmente graças ao DLSS. Por exemplo, o Doom: The Dark Ages pode ser jogado em QHD com DLSS com praticamente a mesma taxa de quadros que em Full HD (85 a 88 fps). Combinado com a geração de quadros de 4x, nosso Vector 17 consegue até mesmo 214 fps, o que se aproxima da taxa de atualização nativa do monitor. Não notamos nenhum aumento na latência, mas a experiência subjetiva pode variar nesse caso.
| GTA V - 1920x1080 Highest AA:4xMSAA + FX AF:16x | |
| MSI Raider A18 HX A9WIG-080 | |
| MSI Vector 17 HX AI A2XWIG | |
| Lenovo Legion 5 Pro 16IAX10H | |
| MSI Vector 16 HX AI A2XWHG | |
| Medion Erazer Beast 18 X1 MD62731 | |
| Média da turma Gaming (48.3 - 186.9, n=93, últimos 2 anos) | |
| Strange Brigade - 1920x1080 ultra AA:ultra AF:16 | |
| Lenovo Legion Pro 7i 16 Gen 10 | |
| Alienware 16 Area-51 | |
| Medion Erazer Beast 18 X1 MD62731 | |
| MSI Vector 17 HX AI A2XWIG | |
| Lenovo Legion 5 Pro 16IAX10H | |
| Média da turma Gaming (76.3 - 456, n=86, últimos 2 anos) | |
Cyberpunk 2077 ultra FPS-Diagram
Dados de GPU do Cyberpunk 2077

| baixo | média | alto | ultra | QHD DLSS | QHD | 4K DLSS | 4K | |
|---|---|---|---|---|---|---|---|---|
| GTA V (2015) | 186.5 | 184.1 | 181.5 | 158.7 | 151.7 | |||
| Dota 2 Reborn (2015) | 220 | 193.1 | 185.9 | 171.7 | 167.9 | |||
| Final Fantasy XV Benchmark (2018) | 231 | 207 | 183.7 | 111.2 | 68.6 | |||
| X-Plane 11.11 (2018) | 163.7 | 139.5 | 108.8 | 98.7 | ||||
| Strange Brigade (2018) | 549 | 429 | 393 | 356 | 265 | 144 | ||
| Baldur's Gate 3 (2023) | 203 | 160 | 141 | 166.3 | 167.3 | 118.3 | 83.2 | 55.7 |
| Cyberpunk 2077 (2023) | 171.8 | 136.6 | 103.9 | 90 | 39.1 | |||
| Doom: The Dark Ages (2025) | 88 | 85 | 64 |
Emissões e energia - Até 60 dB(A) é bastante alto em comparação
Emissões de ruído
Os ventiladores costumam ficar desligados em marcha lenta, mas não se desligam completamente por muito tempo após uma carga, nem mesmo no modo Eco. Nos jogos, elas tendem a funcionar mais alto do que a concorrência, apesar do desempenho médio em 3D.
Barulho
| Ocioso |
| 24 / 30.82 / 31.31 dB |
| Carga |
| 31.12 / 59.24 dB |
 | ||
30 dB silencioso 40 dB(A) audível 50 dB(A) ruidosamente alto |
||
min: | ||
| MSI Vector 17 HX AI A2XWIG GeForce RTX 5080 Laptop, Ultra 9 275HX, Western Digital PC SN5000S SDEPNSJ-2T00-1032 | Alienware 16 Area-51 GeForce RTX 5080 Laptop, Ultra 9 275HX, Samsung PM9C1a MZ9L81T0HDLB | MSI Vector 16 HX AI A2XWHG GeForce RTX 5070 Ti Laptop, Ultra 7 255HX, Micron 2400 MTFDKBA512QFM | Lenovo Legion Pro 7i 16 Gen 10 GeForce RTX 5080 Laptop, Ultra 9 275HX, SK Hynix HFS001TEJ9X115N | Lenovo Legion 5 Pro 16IAX10H GeForce RTX 5070 Ti Laptop, Ultra 9 275HX, Western Digital PC SN8000S SDEPNRK-1T00 | MSI Raider A18 HX A9WIG-080 GeForce RTX 5080 Laptop, R9 9955HX3D, Samsung PM9E1 MZVLC2T0HBLD | Medion Erazer Beast 18 X1 MD62731 GeForce RTX 5080 Laptop, Ultra 9 275HX, Phison E31 2 TB | |
|---|---|---|---|---|---|---|---|
| Noise | 6% | -12% | 12% | -7% | -4% | -17% | |
| desligado / ambiente * (dB) | 24 | 23.6 2% | 25 -4% | 22.9 5% | 24 -0% | 25.1 -5% | 25 -4% |
| Idle Minimum * (dB) | 24 | 25.4 -6% | 33 -38% | 22.9 5% | 24 -0% | 28.6 -19% | 25 -4% |
| Idle Average * (dB) | 30.82 | 27.8 10% | 34 -10% | 22.9 26% | 24 22% | 28.9 6% | 39 -27% |
| Idle Maximum * (dB) | 31.31 | 28.1 10% | 38 -21% | 26.3 16% | 30.9 1% | 29.2 7% | 42 -34% |
| Load Average * (dB) | 31.12 | 28.8 7% | 46 -48% | 27.8 11% | 55.9 -80% | 45.6 -47% | 52 -67% |
| Cyberpunk 2077 ultra * (dB) | 59.24 | 50.4 15% | 47 21% | 54.2 9% | 56.72 4% | 55.6 6% | 53 11% |
| Load Maximum * (dB) | 59.24 | 56.4 5% | 49 17% | 53.9 9% | 56.72 4% | 45.8 23% | 55 7% |
* ... menor é melhor
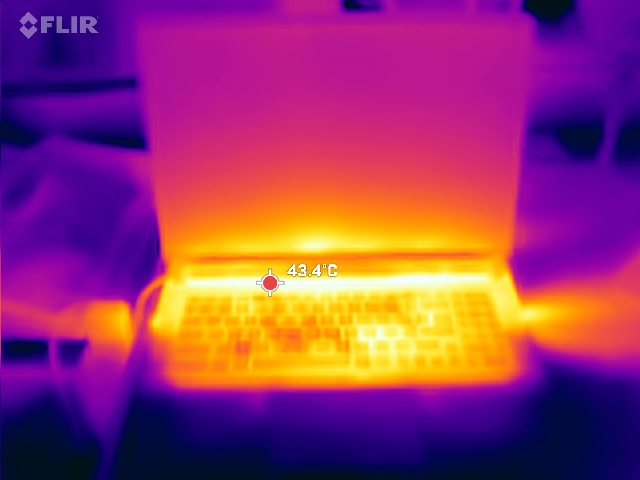
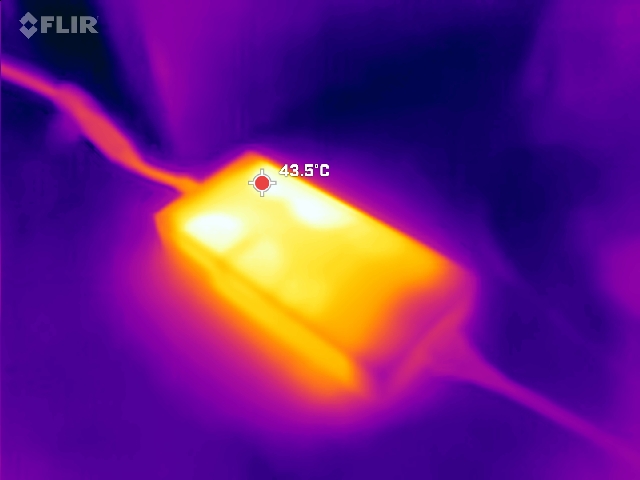
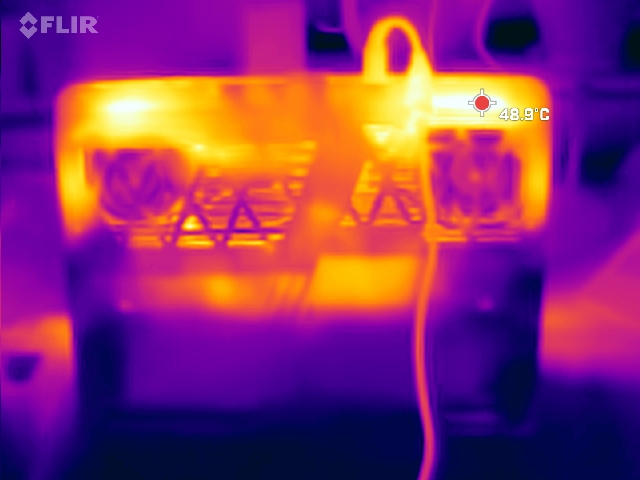
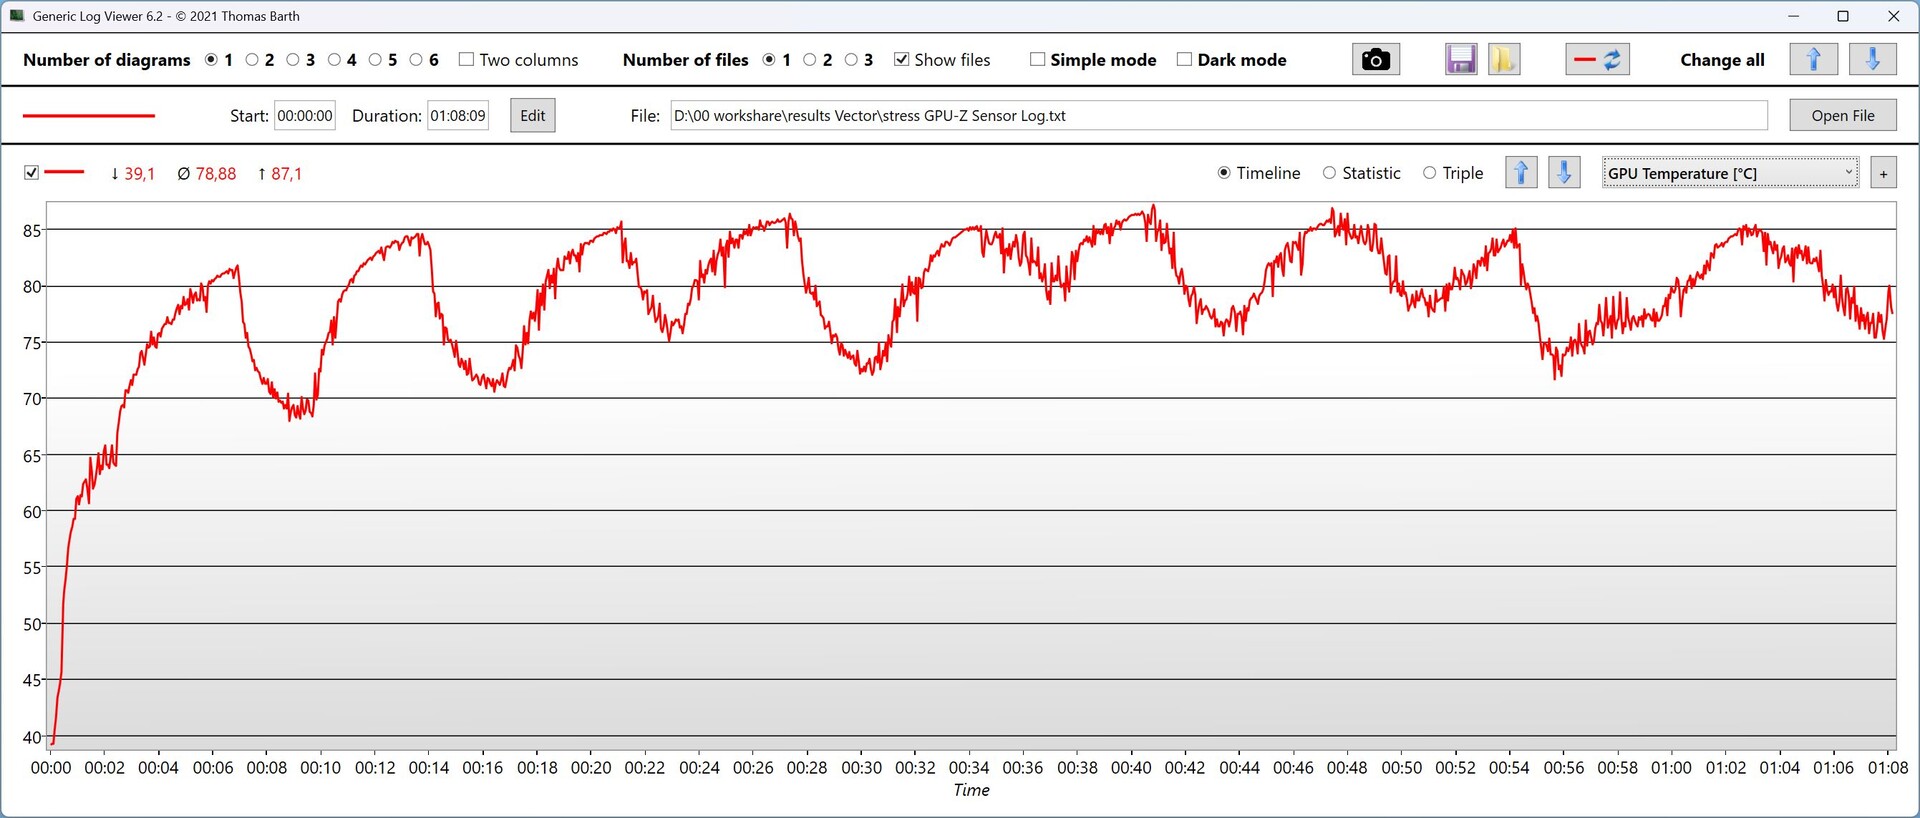
Temperatura
Sob estresse, as temperaturas da superfície atingem até 53 °C (127,4 °F), enquanto as temperaturas dos jogos são mais moderadas, 47 °C (116,6 °F), com a área principal do WASD a 38 °C (100,4 °F).
(-) A temperatura máxima no lado superior é 53 °C / 127 F, em comparação com a média de 40.4 °C / 105 F , variando de 21.2 a 68.8 °C para a classe Gaming.
(-) A parte inferior aquece até um máximo de 54 °C / 129 F, em comparação com a média de 43.2 °C / 110 F
(+) Em uso inativo, a temperatura média para o lado superior é 31.4 °C / 89 F, em comparação com a média do dispositivo de 33.9 °C / ### class_avg_f### F.
(±) 3: The average temperature for the upper side is 36.4 °C / 98 F, compared to the average of 33.9 °C / 93 F for the class Gaming.
(+) Os apoios para as mãos e o touchpad são mais frios que a temperatura da pele, com um máximo de 29 °C / 84.2 F e, portanto, são frios ao toque.
(±) A temperatura média da área do apoio para as mãos de dispositivos semelhantes foi 28.8 °C / 83.8 F (-0.2 °C / -0.4 F).
| MSI Vector 17 HX AI A2XWIG Intel Core Ultra 9 275HX, NVIDIA GeForce RTX 5080 Laptop | Alienware 16 Area-51 Intel Core Ultra 9 275HX, NVIDIA GeForce RTX 5080 Laptop | MSI Vector 16 HX AI A2XWHG Intel Core Ultra 7 255HX, NVIDIA GeForce RTX 5070 Ti Laptop | Lenovo Legion Pro 7i 16 Gen 10 Intel Core Ultra 9 275HX, NVIDIA GeForce RTX 5080 Laptop | Lenovo Legion 5 Pro 16IAX10H Intel Core Ultra 9 275HX, NVIDIA GeForce RTX 5070 Ti Laptop | MSI Raider A18 HX A9WIG-080 AMD Ryzen 9 9955HX3D, NVIDIA GeForce RTX 5080 Laptop | Medion Erazer Beast 18 X1 MD62731 Intel Core Ultra 9 275HX, NVIDIA GeForce RTX 5080 Laptop | |
|---|---|---|---|---|---|---|---|
| Heat | 12% | 9% | 16% | -1% | 6% | 13% | |
| Maximum Upper Side * (°C) | 53 | 43.8 17% | 53 -0% | 42.6 20% | 48 9% | 49.3 7% | 47 11% |
| Maximum Bottom * (°C) | 54 | 40 26% | 52 4% | 41.2 24% | 50 7% | 50.9 6% | 48 11% |
| Idle Upper Side * (°C) | 39 | 35.8 8% | 33 15% | 32.6 16% | 38 3% | 35.2 10% | 29 26% |
| Idle Bottom * (°C) | 34 | 35.2 -4% | 29 15% | 32.4 5% | 42 -24% | 33.5 1% | 33 3% |
* ... menor é melhor
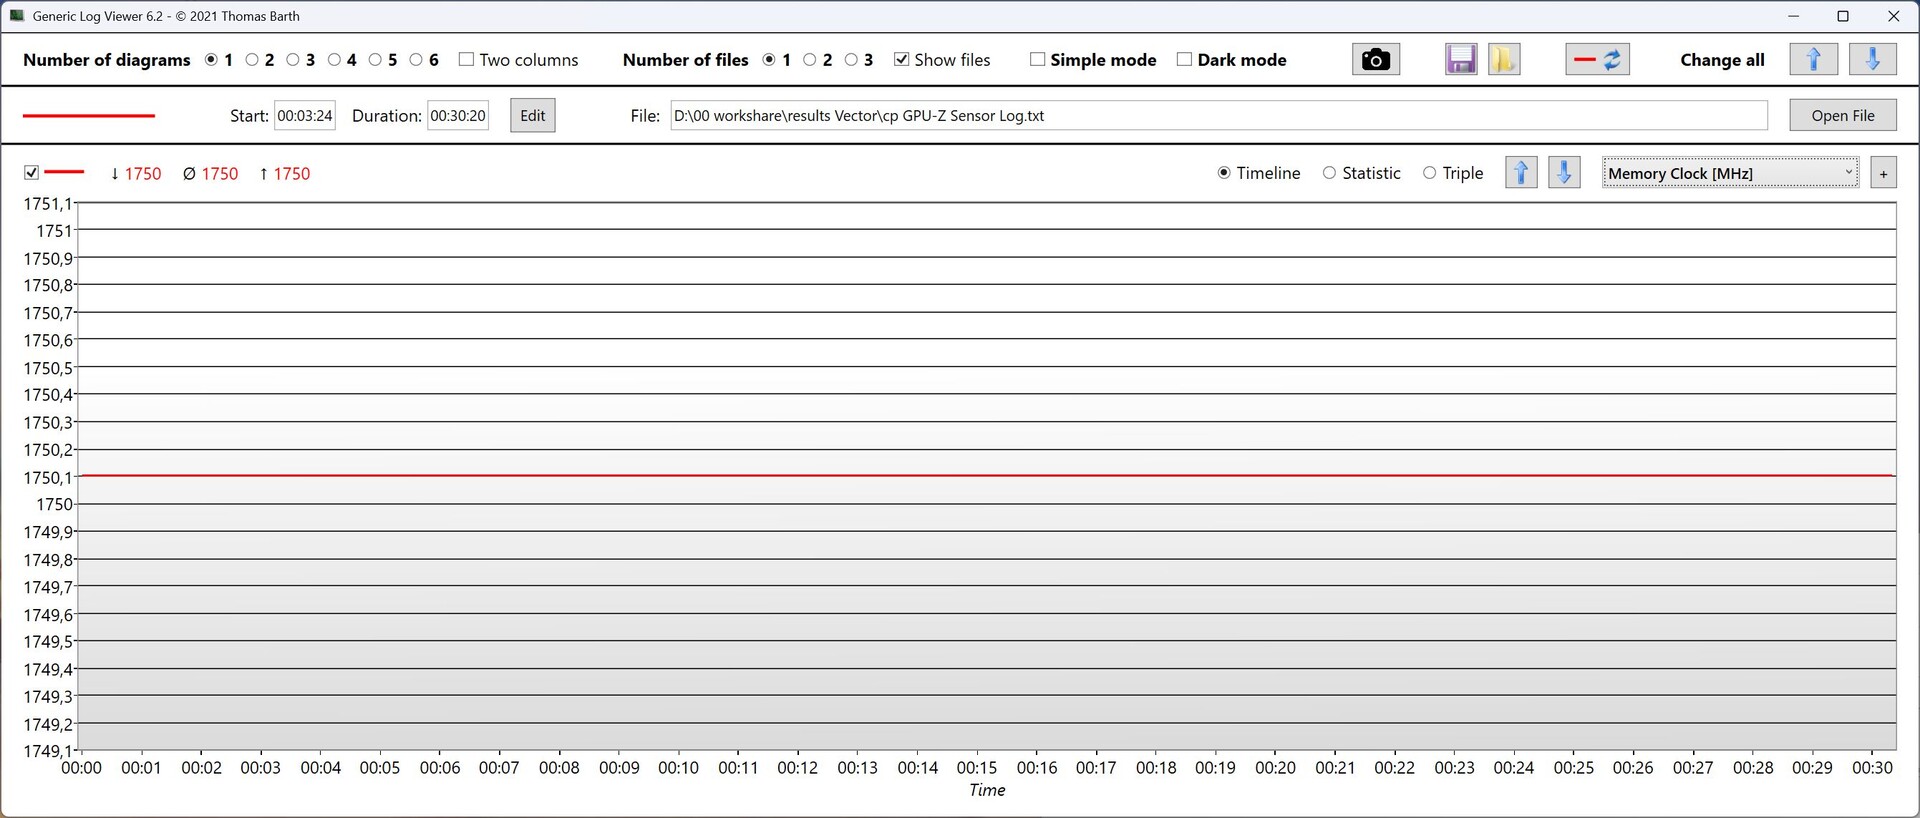
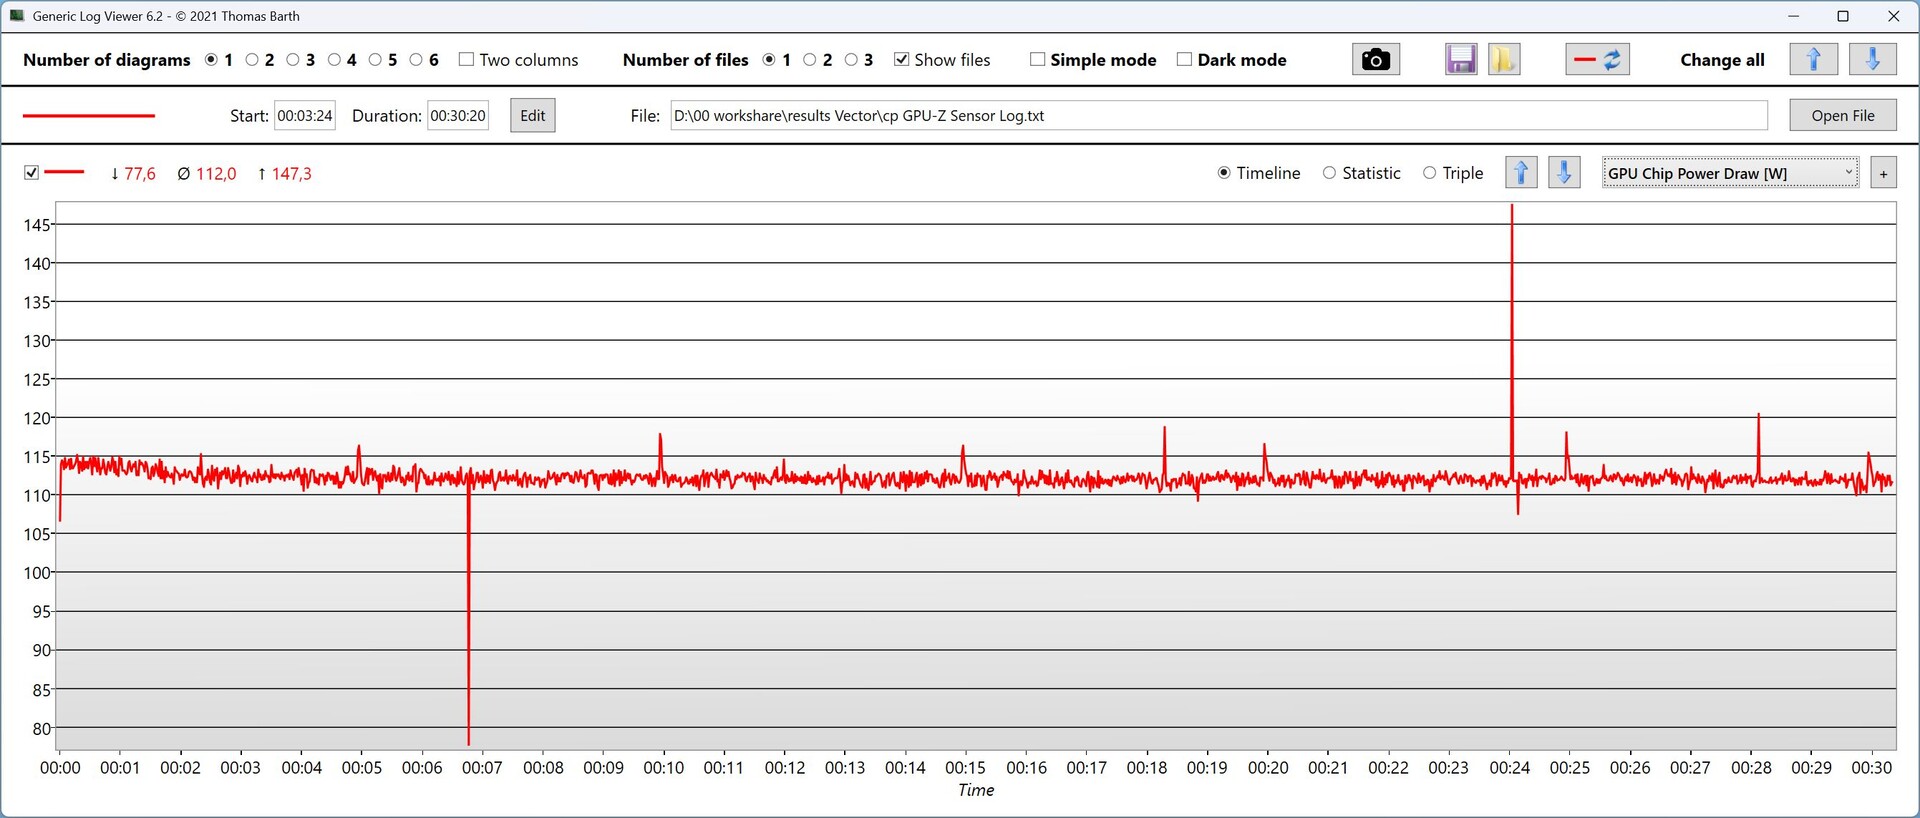
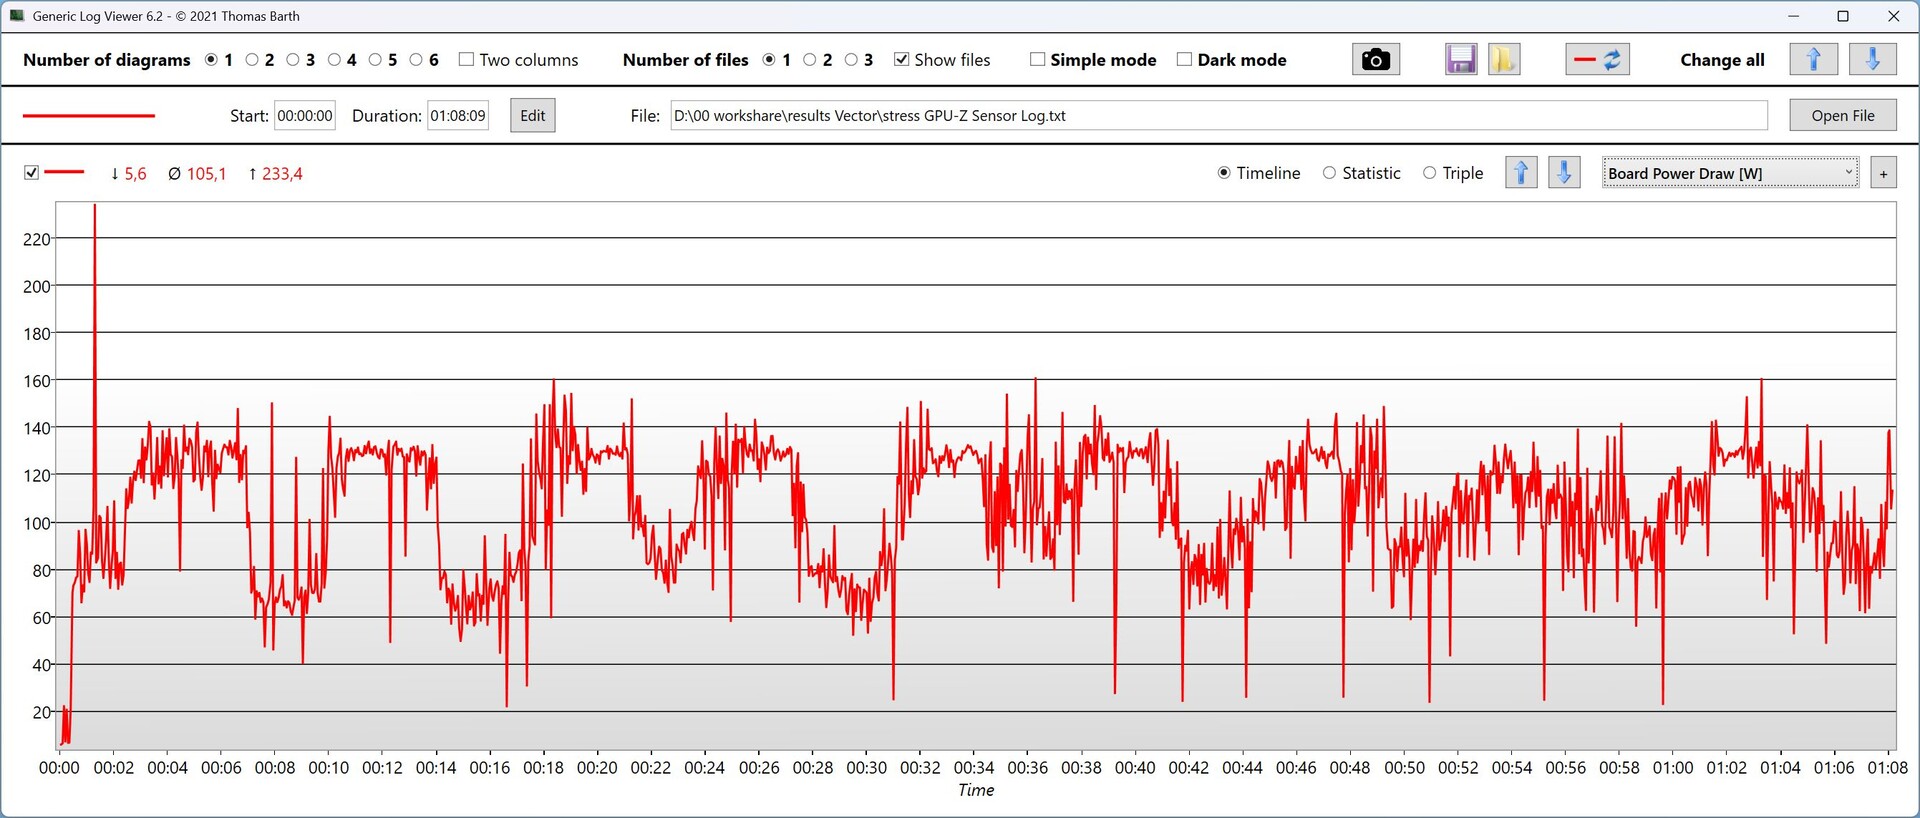
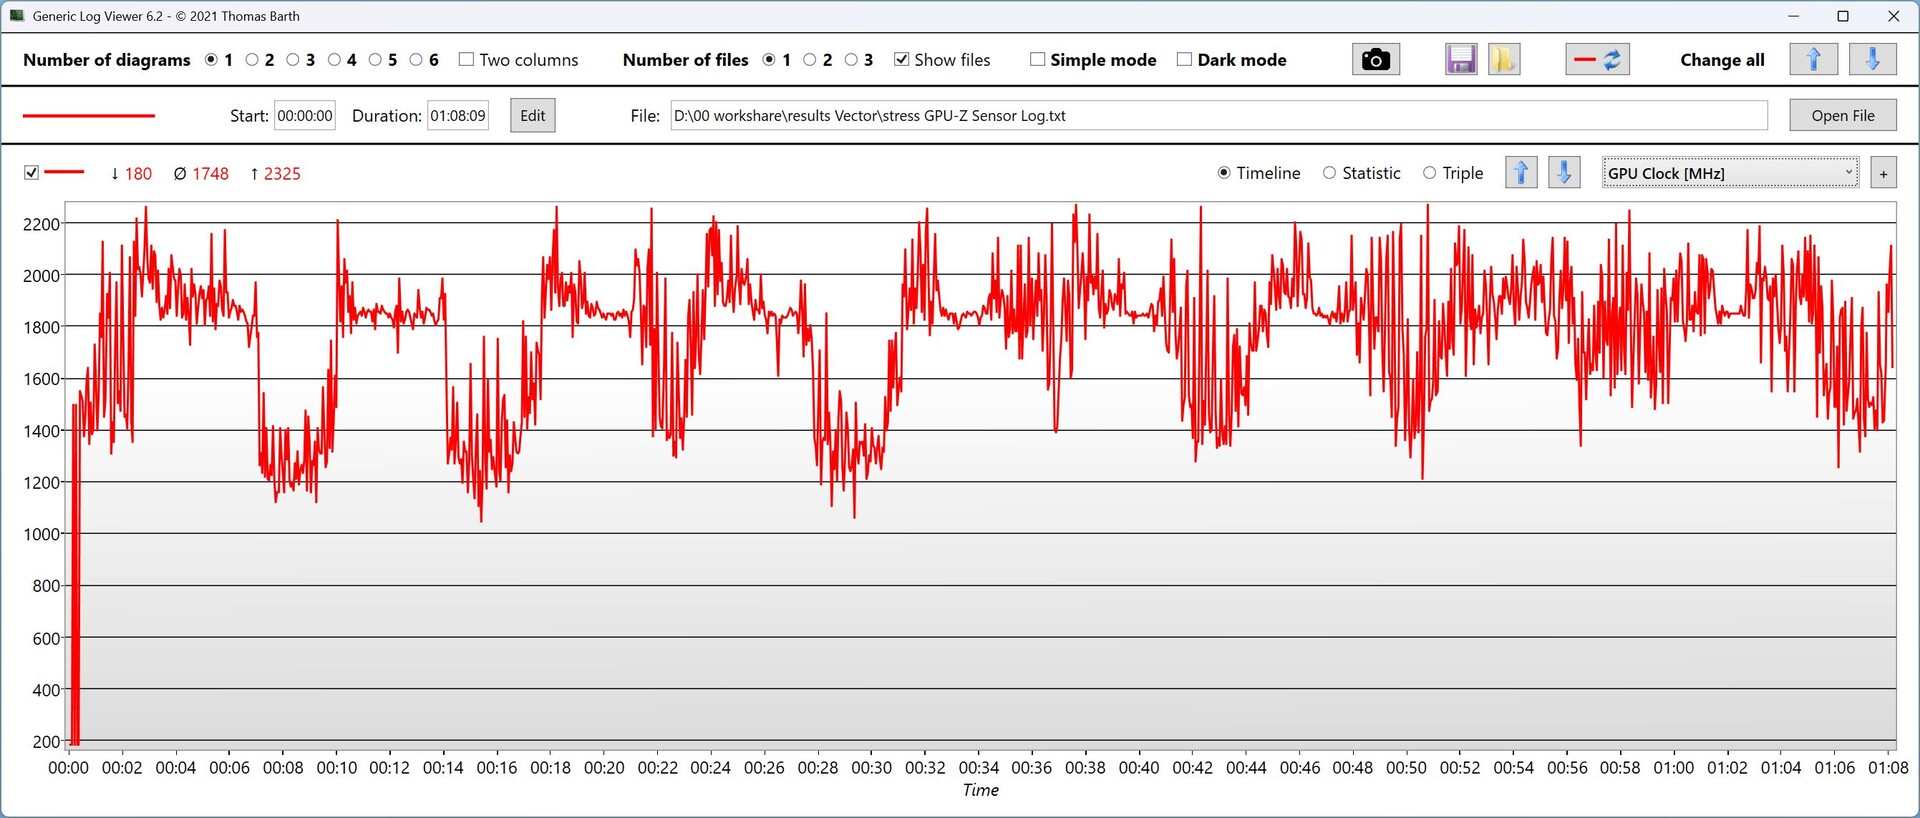
| Clock da CPU (GHz) | Clock da GPU (MHz) | Temperatura média da CPU (°C) | Temperatura média da GPU (°C) | |
| Prime95 Stress | 4.25 | 750 | 80 | 45 |
| Estresse do Prime95 + FurMark | 3.4 | 1,750 | 74 - 81 | 70 - 87 |
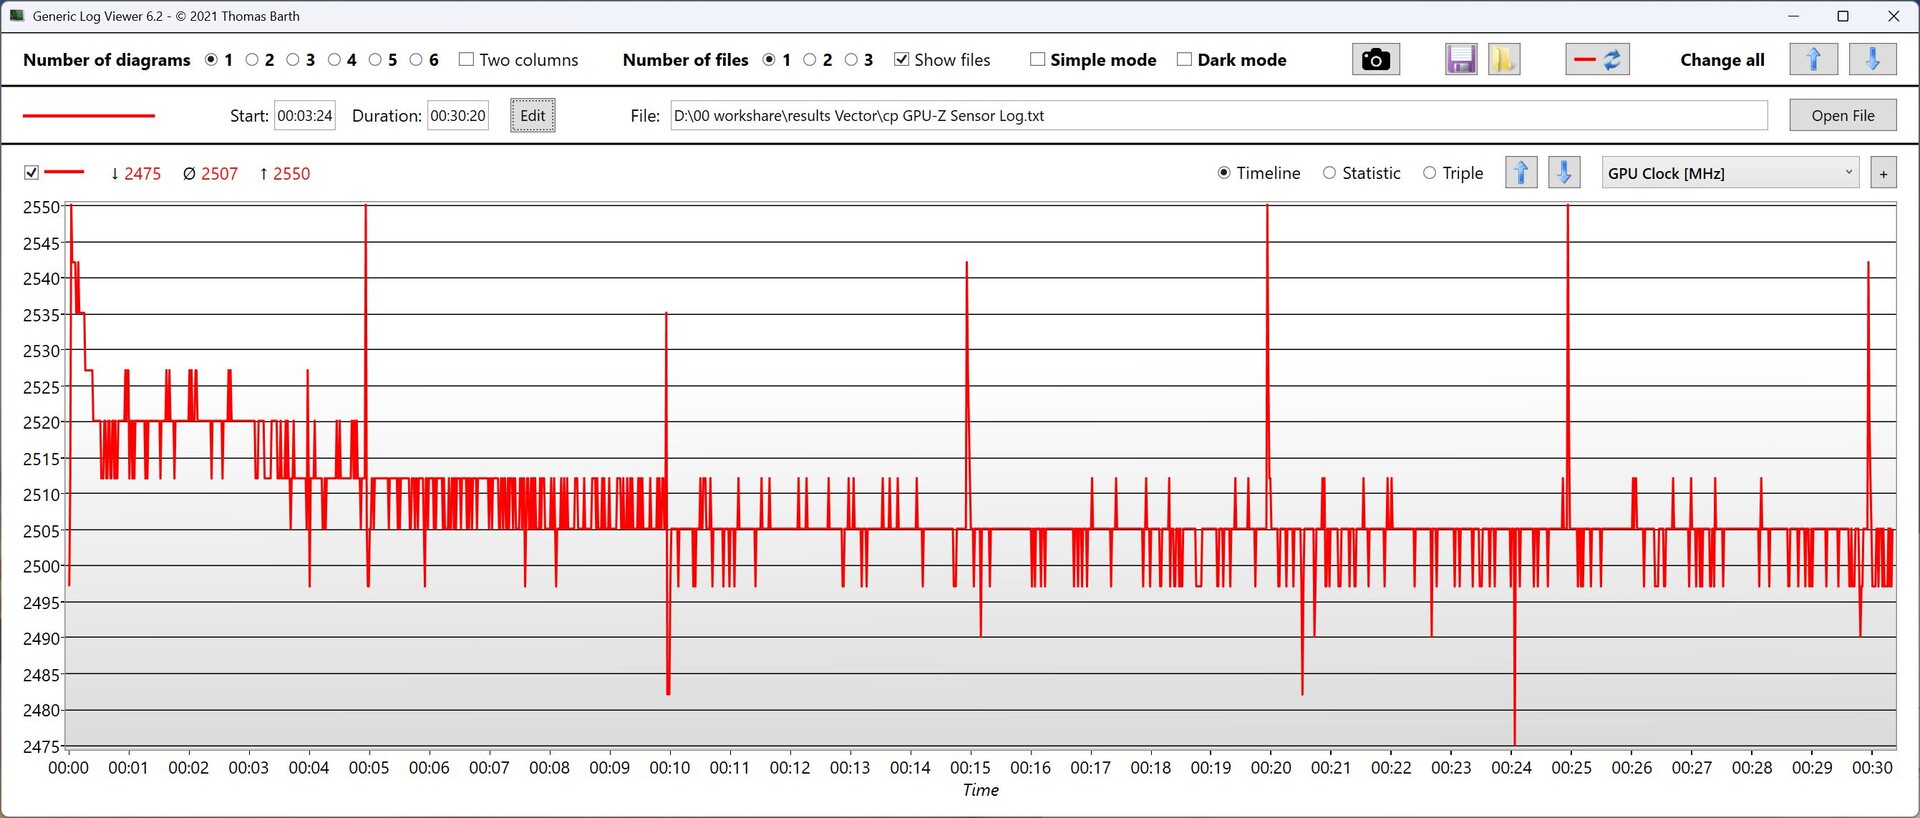
| Cyberpunk 2077 Stress | 1.9 | 2.500 | 81 - 89 | até 80 |
Teste de estresse

Alto-falante
Os alto-falantes fazem um trabalho mediano. Há uma porta jack de 3,5 mm disponível para fones de ouvido e similares.
MSI Vector 17 HX AI A2XWIG análise de áudio
(±) | o volume do alto-falante é médio, mas bom (###valor### dB)
Graves 100 - 315Hz
(±) | graves reduzidos - em média 10.4% menor que a mediana
(±) | a linearidade dos graves é média (7.4% delta para a frequência anterior)
Médios 400 - 2.000 Hz
(±) | médios mais altos - em média 6.2% maior que a mediana
(+) | médios são lineares (4.7% delta para frequência anterior)
Altos 2 - 16 kHz
(+) | agudos equilibrados - apenas 4.3% longe da mediana
(±) | a linearidade dos máximos é média (8.7% delta para frequência anterior)
Geral 100 - 16.000 Hz
(±) | a linearidade do som geral é média (15.6% diferença em relação à mediana)
Comparado com a mesma classe
» 36% de todos os dispositivos testados nesta classe foram melhores, 6% semelhantes, 58% piores
» O melhor teve um delta de 6%, a média foi 18%, o pior foi 132%
Comparado com todos os dispositivos testados
» 23% de todos os dispositivos testados foram melhores, 5% semelhantes, 72% piores
» O melhor teve um delta de 4%, a média foi 23%, o pior foi 134%
Lenovo Legion 5 Pro 16IAX10H análise de áudio
(±) | o volume do alto-falante é médio, mas bom (###valor### dB)
Graves 100 - 315Hz
(-) | quase nenhum baixo - em média 21.1% menor que a mediana
(±) | a linearidade dos graves é média (8% delta para a frequência anterior)
Médios 400 - 2.000 Hz
(±) | médios mais altos - em média 6.3% maior que a mediana
(+) | médios são lineares (6.5% delta para frequência anterior)
Altos 2 - 16 kHz
(+) | agudos equilibrados - apenas 1.6% longe da mediana
(+) | os máximos são lineares (4.9% delta da frequência anterior)
Geral 100 - 16.000 Hz
(±) | a linearidade do som geral é média (18.3% diferença em relação à mediana)
Comparado com a mesma classe
» 58% de todos os dispositivos testados nesta classe foram melhores, 9% semelhantes, 33% piores
» O melhor teve um delta de 6%, a média foi 18%, o pior foi 132%
Comparado com todos os dispositivos testados
» 40% de todos os dispositivos testados foram melhores, 8% semelhantes, 52% piores
» O melhor teve um delta de 4%, a média foi 23%, o pior foi 134%
Consumo de energia
Após as atualizações, o consumo ocioso agora é aceitável. Em jogos, ele ainda é muito alto em vista do desempenho oferecido. Se um monitor externo for conectado via HDMI, a dGPU estará ativa e mais energia será consumida no modo inativo.
| desligado | |
| Ocioso | |
| Carga |
|
Key:
min: | |
| MSI Vector 17 HX AI A2XWIG Ultra 9 275HX, GeForce RTX 5080 Laptop, Western Digital PC SN5000S SDEPNSJ-2T00-1032, IPS, 2560x1600, 17" | Alienware 16 Area-51 Ultra 9 275HX, GeForce RTX 5080 Laptop, Samsung PM9C1a MZ9L81T0HDLB, IPS, 2560x1600, 16" | MSI Vector 16 HX AI A2XWHG Ultra 7 255HX, GeForce RTX 5070 Ti Laptop, Micron 2400 MTFDKBA512QFM, IPS, 2560x1600, 16" | Lenovo Legion Pro 7i 16 Gen 10 Ultra 9 275HX, GeForce RTX 5080 Laptop, SK Hynix HFS001TEJ9X115N, OLED, 2560x1600, 16" | Lenovo Legion 5 Pro 16IAX10H Ultra 9 275HX, GeForce RTX 5070 Ti Laptop, Western Digital PC SN8000S SDEPNRK-1T00, OLED, 2560x1600, 16" | MSI Raider A18 HX A9WIG-080 R9 9955HX3D, GeForce RTX 5080 Laptop, Samsung PM9E1 MZVLC2T0HBLD, MiniLED IPS, 3840x2400, 18" | Medion Erazer Beast 18 X1 MD62731 Ultra 9 275HX, GeForce RTX 5080 Laptop, Phison E31 2 TB, IPS, 2560x1600, 18" | Média NVIDIA GeForce RTX 5080 Laptop | Média da turma Gaming | |
|---|---|---|---|---|---|---|---|---|---|
| Power Consumption | -61% | -3% | -80% | -14% | -119% | 6% | -52% | -17% | |
| Idle Minimum * (Watt) | 10 | 27 -170% | 7.1 29% | 28.5 -185% | 14 -40% | 41.5 -315% | 7.9 21% | 19.1 ? -91% | 13 ? -30% |
| Idle Average * (Watt) | 15.4 | 33.5 -118% | 15.9 -3% | 38.8 -152% | 14.3 7% | 53.5 -247% | 11.5 25% | 25.3 ? -64% | 18.7 ? -21% |
| Idle Maximum * (Watt) | 18.7 | 41.4 -121% | 29.5 -58% | 45.6 -144% | 20.1 -7% | 53.8 -188% | 16.6 11% | 30.4 ? -63% | 24.3 ? -30% |
| Load Average * (Watt) | 89.7 | 124.7 -39% | 124 -38% | 132.2 -47% | 177 -97% | 168.5 -88% | 130 -45% | 128.5 ? -43% | 110.2 ? -23% |
| Cyberpunk 2077 ultra * (Watt) | 308 | 256 17% | 222 28% | 318 -3% | 255 17% | 298 3% | 253 18% | ||
| Cyberpunk 2077 ultra external monitor * (Watt) | 300 | 249 17% | 217 28% | 319 -6% | 255 15% | 295 2% | 245 18% | ||
| Load Maximum * (Watt) | 321 | 367.2 -14% | 336 -5% | 384 -20% | 294 8% | 323.7 -1% | 330 -3% | 314 ? 2% | 258 ? 20% |
* ... menor é melhor
Energy consumption Cyberpunk / Stress test
Energy consumption with external Monitor
Duração da bateria
Com a bateria de 90 Wh, o Vector 17 atinge cerca de 6,75 horas em nosso teste de Wi-Fi com o brilho reduzido (modo Eco). Esse é um bom valor em comparação.
| MSI Vector 17 HX AI A2XWIG Ultra 9 275HX, GeForce RTX 5080 Laptop, 90 Wh | Alienware 16 Area-51 Ultra 9 275HX, GeForce RTX 5080 Laptop, 96 Wh | MSI Vector 16 HX AI A2XWHG Ultra 7 255HX, GeForce RTX 5070 Ti Laptop, 90 Wh | Lenovo Legion Pro 7i 16 Gen 10 Ultra 9 275HX, GeForce RTX 5080 Laptop, 99 Wh | Lenovo Legion 5 Pro 16IAX10H Ultra 9 275HX, GeForce RTX 5070 Ti Laptop, 80 Wh | MSI Raider A18 HX A9WIG-080 R9 9955HX3D, GeForce RTX 5080 Laptop, 99 Wh | Medion Erazer Beast 18 X1 MD62731 Ultra 9 275HX, GeForce RTX 5080 Laptop, 99 Wh | Média da turma Gaming | |
|---|---|---|---|---|---|---|---|---|
| Duração da bateria | -58% | 4% | -39% | -19% | -56% | 18% | -8% | |
| WiFi v1.3 (h) | 6.7 | 2.8 -58% | 7 4% | 5.4 -19% | 4.9 -27% | 2.1 -69% | 7.9 18% | 7.11 ? 6% |
| Load (h) | 1.9 | 0.8 -58% | 1.7 -11% | 1.1 -42% | 1.502 ? -21% | |||
| Reader / Idle (h) | 3.1 | 8.71 ? | ||||||
| H.264 (h) | 4.8 | 8.64 ? |
Avaliação geral do Notebookcheck
O MSI Vector 17 HX AI é um laptop médio para jogos que ganha alguns pontos extras graças ao Thunderbolt 5 duplo e ao Wi-Fi 7.
MSI Vector 17 HX AI A2XWIG
- 07/16/2025 v8
Christian Hintze
 Total Sustainability Score:
 Comparação de possíveis alternativas
Imagem | Modelo / Análises | Preço | Peso | Altura | Tela |
|---|---|---|---|---|---|
1. 84.3%  | MSI Vector 17 HX AI A2XWIG Intel Core Ultra 9 275HX ⎘ NVIDIA GeForce RTX 5080 Laptop ⎘ 32 GB Memória, 2048 GB SSD | Amazon: Preço de tabela: 3499 Euro | 3 kg | 28.8 mm | 17.00" 2560x1600 178 PPI IPS |
2. 85.7%  | Alienware 16 Area-51 Intel Core Ultra 9 275HX ⎘ NVIDIA GeForce RTX 5080 Laptop ⎘ 32 GB Memória, 1024 GB SSD | Amazon: 1. $2,549.99 Alienware 16 Area-51 Gaming ... 2. $3,899.99 Alienware 16 Area-51 Gaming ... 3. $3,799.99 Alienware 16 Area-51 Gaming ... Preço de tabela: 3500 USD | 3.3 kg | 28.5 mm | 16.00" 2560x1600 189 PPI IPS |
3. 84%  | MSI Vector 16 HX AI A2XWHG Intel Core Ultra 7 255HX ⎘ NVIDIA GeForce RTX 5070 Ti Laptop ⎘ 16 GB Memória, 512 GB SSD | Amazon: Preço de tabela: 2000 EUR | 2.6 kg | 28.6 mm | 16.00" 2560x1600 189 PPI IPS |
4. 87.5%  | Lenovo Legion Pro 7i 16 Gen 10 Intel Core Ultra 9 275HX ⎘ NVIDIA GeForce RTX 5080 Laptop ⎘ 32 GB Memória, 1024 GB SSD | Amazon: Preço de tabela: 4200 USD | 2.6 kg | 26.65 mm | 16.00" 2560x1600 189 PPI OLED |
5. 84.5%  | Lenovo Legion 5 Pro 16IAX10H Intel Core Ultra 9 275HX ⎘ NVIDIA GeForce RTX 5070 Ti Laptop ⎘ 32 GB Memória, 1024 GB SSD | Amazon: 1. $2,999.00 Lenovo Legion Pro 5i Gen 10 ... 2. $3,450.00 Lenovo Legion Pro 7 16IAX10H... 3. $1,749.00 Lenovo Legion 5 16" WQXGA 24... Preço de tabela: 2500 Euro | 2.4 kg | 25.95 mm | 16.00" 2560x1600 189 PPI OLED |
6. 85.1%  | MSI Raider A18 HX A9WIG-080 AMD Ryzen 9 9955HX3D ⎘ NVIDIA GeForce RTX 5080 Laptop ⎘ 64 GB Memória, 2048 GB SSD | Amazon: Preço de tabela: 4350 Euro | 3.6 kg | 34 mm | 18.00" 3840x2400 252 PPI MiniLED IPS |
7. 82.5%  | Medion Erazer Beast 18 X1 MD62731 Intel Core Ultra 9 275HX ⎘ NVIDIA GeForce RTX 5080 Laptop ⎘ 32 GB Memória, SSD | Amazon: Preço de tabela: 3700 EUR | 3.6 kg | 30.4 mm | 18.00" 2560x1600 168 PPI IPS |
Transparência
A seleção dos dispositivos a serem analisados é feita pela nossa equipe editorial. A amostra de teste foi fornecida ao autor como empréstimo pelo fabricante ou varejista para fins desta revisão. O credor não teve influência nesta revisão, nem o fabricante recebeu uma cópia desta revisão antes da publicação. Não houve obrigação de publicar esta revisão. Como empresa de mídia independente, a Notebookcheck não está sujeita à autoridade de fabricantes, varejistas ou editores.
É assim que o Notebookcheck está testando
Todos os anos, o Notebookcheck analisa de forma independente centenas de laptops e smartphones usando procedimentos padronizados para garantir que todos os resultados sejam comparáveis. Desenvolvemos continuamente nossos métodos de teste há cerca de 20 anos e definimos padrões da indústria no processo. Em nossos laboratórios de teste, equipamentos de medição de alta qualidade são utilizados por técnicos e editores experientes. Esses testes envolvem um processo de validação em vários estágios. Nosso complexo sistema de classificação é baseado em centenas de medições e benchmarks bem fundamentados, o que mantém a objetividade.