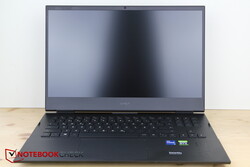
Revisão do laptop HP Omen 16: Poderoso laptop para jogos RTX 3070 com inconvenientes desnecessários

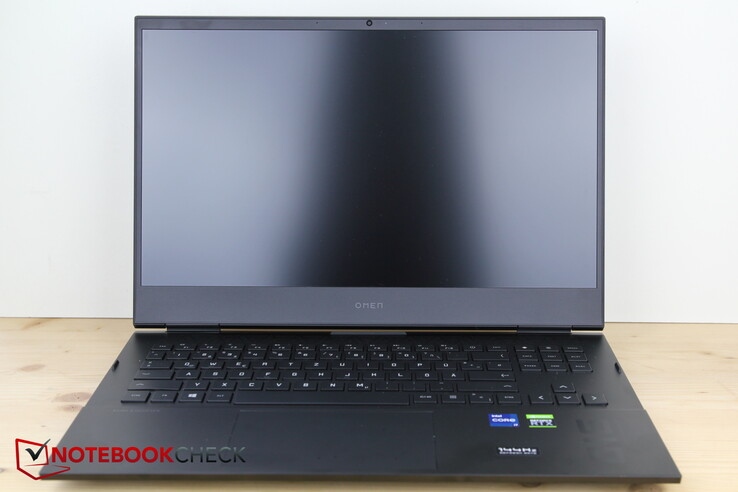
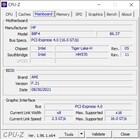
O HP Omen 16 foi introduzido recentemente este ano. O antigo Omen 15 ainda não viu um sucessor direto. Ao invés disso, a HP equipou um chassi de 15,6 polegadas com uma tela de 16,1 polegadas. Como resultado, as luneiras são agora menores e há pequenas diferenças na construção da caixa. Em comparação com o modelo do ano passado, é claro que há também atualizações de CPU (Tiger Lake) e GPU (RTX 3000)
Naturalmente, vamos comparar nosso dispositivo de teste com seu predecessor, o HP Omen 15 (Ryzen 4000 e RTX 2060)e seu novo irmão, o HP Victus 16 (Ryzen 5000 e RTX 3060). Além disso, selecionamos o equipamento similar Lenovo Legion 5 Pro 16mais caro Alienware x15 R1 e o MSI Katana GF66 11UG como dispositivos para nossa comparação
Potential competitors in comparison
Avaliação | Data | Modelo | Peso | Altura | Size | Resolução | Preço |
|---|---|---|---|---|---|---|---|
| 86.6 % v7 (old) | 10/2021 | HP Omen 16-b0085ng i7-11800H, GeForce RTX 3070 Laptop GPU | 2.4 kg | 23 mm | 16.10" | 1920x1080 | |
| 82.8 % v7 (old) | 01/2021 | HP Omen 15-en0375ng R7 4800H, GeForce RTX 2060 Mobile | 2.2 kg | 23 mm | 15.60" | 1920x1080 | |
| 84.3 % v7 (old) | 09/2021 | HP Victus 16-e0179ng R7 5800H, GeForce RTX 3060 Laptop GPU | 2.5 kg | 23.5 mm | 16.10" | 1920x1080 | |
| 87.4 % v7 (old) | 08/2021 | Lenovo Legion 5 Pro 16ACH6H (82JQ001PGE) R7 5800H, GeForce RTX 3070 Laptop GPU | 2.6 kg | 26.85 mm | 16.00" | 2560x1600 | |
| 87.2 % v7 (old) | 09/2021 | Alienware x15 RTX 3070 P111F i7-11800H, GeForce RTX 3070 Laptop GPU | 2.4 kg | 15.9 mm | 15.60" | 2560x1440 | |
| 79.2 % v7 (old) | 09/2021 | MSI Katana GF66 11UG-220 i7-11800H, GeForce RTX 3070 Laptop GPU | 2.3 kg | 25 mm | 15.60" | 1920x1080 |
Os Top 10
» Os Top 10 Portáteis Multimídia
» Os Top 10 Portáteis de Jogos
» Os Top 10 Portáteis Leves para Jogos
» Os Top 10 Portáteis Acessíveis de Escritório/Empresariais
» Os Top 10 Portáteis Premium de Escritório/Empresariais
» Os Top 10 dos Portáteis Workstation
» Os Top 10 Subportáteis
» Os Top 10 Ultrabooks
» Os Top 10 Conversíveis
» Os Top 10 Tablets
» Os Top 10 Smartphones
» A melhores Telas de Portáteis Analisadas Pela Notebookcheck
» Top 10 dos portáteis abaixo dos 500 Euros da Notebookcheck
» Top 10 dos Portáteis abaixo dos 300 Euros
Chassis - Pequenas atualizações para o HP Omen
O chassi quase não difere do modelo do ano passado. As diferenças, por exemplo, nos materiais, no layout do porto ou nas mudanças de projeto só se tornam aparentes após uma inspeção mais detalhada.
A base agora consiste quase exclusivamente de metal preto e a moldura do display é feita de plástico duro, enquanto as moldura são feitas de plástico mais macio que é um verdadeiro imã de impressões digitais. Embora a base de metal ceda ligeiramente sob pequenas quantidades de pressão e a tela seja bastante suscetível a torção, o que então causa um sangramento leve e pesado na tela IPS, ela causa uma impressão geral muito sólida.
Embora a tampa possa ser aberta com uma só mão, as duas dobradiças poderiam ter sido mais firmes para melhor evitar a formação de tetas
Em comparação com o Omen 15, o Omen 16 é um pouco mais amplo e profundo. Embora esteja em torno da mesma largura, o HP Victus é mais longo em profundidade em cerca de 1 cm. Entretanto, outros concorrentes de 15 polegadas não são necessariamente mais compactos. Enquanto o Omen 16 e o Victus 16 são mais largos que os modelos de 15 polegadas, tanto o Legion 5 Pro quanto o Alienware são mais compridos em profundidade.
Finalmente, o Omen 16 ganhou 200 g em comparação com o Omen 15, o que ainda o torna mais leve do que a maioria dos concorrentes
Conectividade - Thunderbolt 4, caso contrário somente USB 3.0
Embora os usuários destros ficarão felizes em saber que existem apenas duas portas USB-A na parte superior direita do chassi, há tão pouco espaço entre elas que mesmo apenas uma pequena unidade flash USB deslizante não caberia ao lado de um cabo de mouse USB ainda menor.
O restante das portas estão localizadas à esquerda e muito espaçadas também, o que pode resultar em cabos que obstruem as interfaces próximas. Felizmente, a distribuição (como o miniDP ao lado do USB-A) deve em sua maioria contrariar este problema. Não há portas na frente ou atrás.
A porta USB 4 com Thunderbolt 4 e o fator de forma tipo C é uma vantagem. Mesmo que as três portas USB-A restantes tenham sido rotuladas "Superspeed" pela HP, suportam apenas o padrão 3.0.
O leitor de cartões carregado com mola aceita cartões SD de tamanho completo. Eles desaparecem quase totalmente dentro da caixa e não se sobressaem desnecessariamente da mesma
Leitor de cartões SD
A transferência do leitor de cartões SD tende a estar abaixo da média. Copiar 1 GB de fotos de nosso cartão de memória de referência AV PRO microSD 128 GB V60 para a área de trabalho leva quase 18 segundos. Em média, os laptops para jogos do nosso banco de dados são equipados com modelos significativamente mais rápidos com o Alienware mais caro mostrando o que é possível em termos de velocidade. Na outra ponta do espectro estão a Lenovo e a MSI, ambas sem um leitor de cartão SD
| SD Card Reader | |
| average JPG Copy Test (av. of 3 runs) | |
| Alienware x15 RTX 3070 P111F (AV Pro V60) | |
| Média da turma Gaming (20 - 210, n=69, últimos 2 anos) | |
| HP Victus 16-e0179ng (AV PRO microSD 128 GB V60) | |
| HP Omen 15-en0375ng (Toshiba Exceria Pro SDXC 64 GB UHS-II) | |
| HP Omen 16-b0085ng (AV PRO microSD 128 GB V60) | |
| maximum AS SSD Seq Read Test (1GB) | |
| Alienware x15 RTX 3070 P111F (AV Pro V60) | |
| Média da turma Gaming (25.5 - 261, n=65, últimos 2 anos) | |
| HP Omen 15-en0375ng (Toshiba Exceria Pro SDXC 64 GB UHS-II) | |
| HP Omen 16-b0085ng (AV PRO microSD 128 GB V60) | |
| HP Victus 16-e0179ng (AV PRO microSD 128 GB V60) | |
Comunicação
Além da LAN de 1-Gbps, o Omen 16 também suporta Wi-Fi 6E através de seu módulo Intel AX210. Este último é capaz de velocidades Gigabit e só fica aquém de nossas expectativas por uma pequena margem
Webcam
A HP se contentou com uma webcam de 720p. Com a HP Wide Vision, a câmera captura um ângulo de 88 graus, resultando em muito do ambiente ser visível ao invés de uma pessoa enchendo a tela. Isto pode ou não ser desejável para chamadas de vídeo
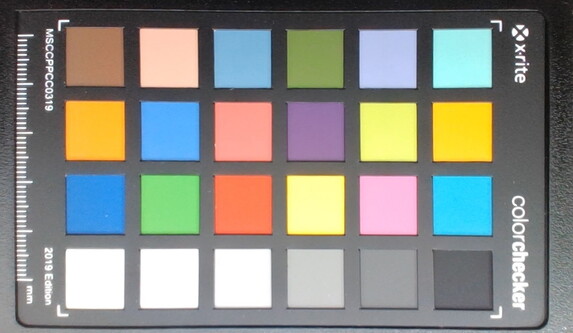
Caso contrário, a qualidade corresponde aos baixos padrões do mercado com uma imagem relativamente granulosa e cores desbotadas. O brilho automático age de forma estranha, inicialmente rostos sobre-expostos apenas para ajustar severamente o perfil de brilho um momento depois, o que faz com que os fundos em particular pareçam muito escuros
Segurança
Ao Omen 16 falta uma fechadura Kensington e um sensor de impressões digitais. Graças à CPU, o TPM 2.0 é, naturalmente, suportado
Acessórios e Garantia
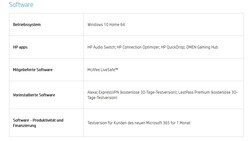
O pacote não continha acessórios adicionais. O Omen 16 inclui desnecessariamente versões de avaliação de software pré-instaladas por padrão, como ExpressVPN (versão de avaliação gratuita por 30 dias), LastPass Premium (versão de avaliação gratuita por 30 dias) e uma licença de 1 mês para Microsoft 365. Os usuários incomodados com isso terão de instalar manualmente os aplicativos
Manutenção
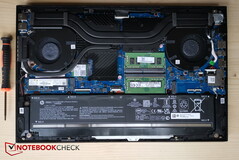
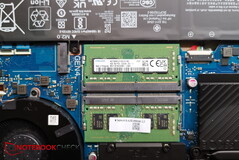
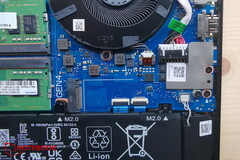
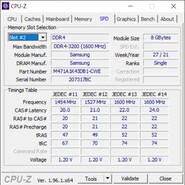
A placa inferior é fixada com 8 tamanhos diferentes de parafusos Phillips e vários clipes. Apesar dos grampos plásticos, a placa inferior pode ser removida sem nenhuma ferramenta - ótimo! Posteriormente, os usuários têm acesso aos dois ventiladores, slots RAM, o módulo Wi-Fi (parcialmente coberto por tubos de calor), a bateria, o SSD e um slot SSD adicional e desocupado
Waranty
A HP oferece uma garantia padrão de hardware limitada de 12 meses com 1 ano de suporte técnico limitado para software e configuração inicial. A garantia pode ser estendida com opções tais como suporte de hardware no local, se desejado.
Dispositivos de entrada - Usuário para Touchpad, Por favor responda!
Teclado
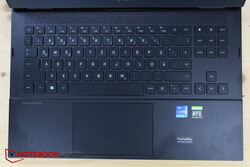
Ao contrário do HP Victus 16, o Omen 16 não vem com um teclado numérico, o que significa que há mais espaço para a seta, pos1, final e outras teclas, bem como a tecla de impressão dedicada da tela no canto superior direito, que é muito conveniente para tirar screenshots. O layout do teclado parece muito organizado, o que pode ser uma conseqüência do espaço disponível, e os símbolos das teclas são fáceis de ler. Há uma chave especial para o lançamento do Omen Gaming Hub, onde as configurações de desempenho podem ser ajustadas (ventiladores, perfil de desempenho).
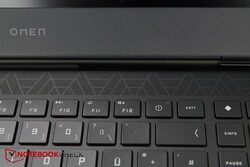
A localização do botão de energia na linha superior da chave especial entre as chaves F12 e Del não parece ser ideal, mas não causou problemas durante nossos testes
As teclas oferecem uma viagem medíocre e um feedback sólido. O ponto de atuação distinto é alcançado muito rapidamente e o restante do pressionamento das teclas parece suave para uma digitação confortável e rápida. O ruído das teclas é moderado
A HP instalou uma retroiluminação RGB com quatro zonas. Na prática, há três grandes zonas com as teclas WASD que são freqüentemente usadas enquanto se joga como quarta zona. As cores podem ser personalizadas através do Centro de Jogos.
Touchpad
Experimentamos alguns problemas com o touchpad, o que pode, de fato, ser defeituoso e complicar uma classificação neste ponto. Mesmo depois de desinstalar e reinstalar os motoristas, houve várias desistências. Tanto os cliques quanto os movimentos às vezes simplesmente não eram reconhecidos.
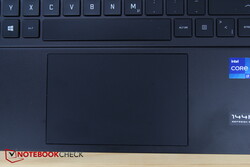
Pelo contrário, não temos críticas quando se trata do tamanho ou textura do clickpad, uma vez que as propriedades de deslizamento são muito boas mesmo em velocidades lentas e os cliques produzem um feedback acústico moderado
Display - Bom modelo Full HD com 144 Hz
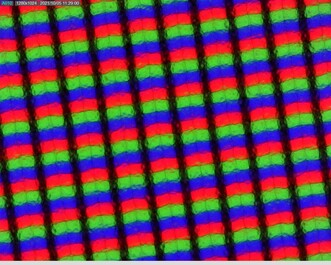
O Omen 16 usa o mesmo painel IPS FHD 144-Hz BOE de 16 polegadas, fosco, de 16,1 polegadas, como o painel IPS Victus 16. Portanto, os resultados são semelhantes. O painel atinge um nível de brilho de quase 400 lêndeas com uma iluminação de 87 por cento - um resultado decente. Em comparação com o Omen 15 mais antigo, esta é uma melhoria significativa.
Embora o painel sofra de algum sangramento de luz de fundo ao longo das bordas, ele só se torna aparente sob condições de iluminação ambiente muito escuras
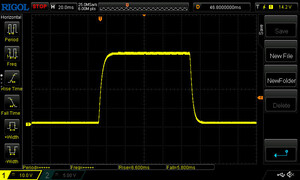
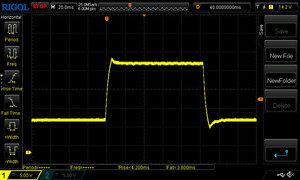
Os tempos de resposta muito curtos correspondem às expectativas para esta classe e o display não usa PWM para ajustes de luminosidade
| |||||||||||||||||||||||||
iluminação: 87 %
iluminação com acumulador: 407 cd/m²
Contraste: 1191:1 (Preto: 0.34 cd/m²)
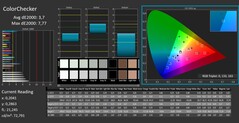
ΔE ColorChecker Calman: 3.7 | ∀{0.5-29.43 Ø4.77}
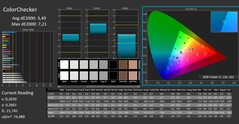
calibrated: 3.49
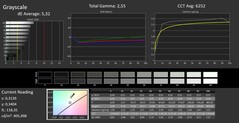
ΔE Greyscale Calman: 5.88 | ∀{0.09-98 Ø5}
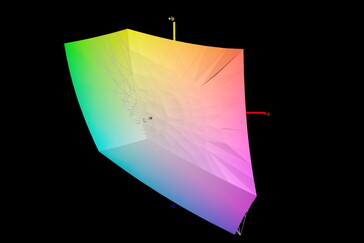
99.47% sRGB (Calman 2D)
99.47% sRGB (Argyll 1.6.3 3D)
73.76% AdobeRGB 1998 (Argyll 1.6.3 3D)
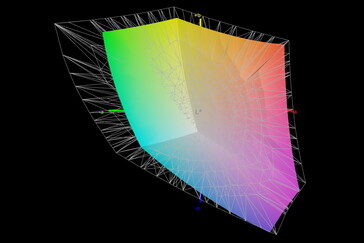
73.8% AdobeRGB 1998 (Argyll 3D)
99.5% sRGB (Argyll 3D)
72.3% Display P3 (Argyll 3D)
Gamma: 2.57
CCT: 6342 K
| HP Omen 16-b0085ng BOE09BE, IPS, 1920x1080, 16.1" | HP Omen 15-en0375ng BOE0852, IPS, 1920x1080, 15.6" | HP Victus 16-e0179ng BOE09BE, IPS, 1920x1080, 16.1" | Lenovo Legion 5 Pro 16ACH6H (82JQ001PGE) CSOT T3 MNG007DA1-1, IPS, 2560x1600, 16" | Alienware x15 RTX 3070 P111F LG Philips 156QHG, IPS, 2560x1440, 15.6" | MSI Katana GF66 11UG-220 AU Optronics B156HAN08.0, IPS, 1920x1080, 15.6" | |
|---|---|---|---|---|---|---|
| Display | -44% | 0% | -1% | 18% | -9% | |
| Display P3 Coverage (%) | 72.3 | 39.12 -46% | 72.6 0% | 97.8 35% | 65.4 -10% | |
| sRGB Coverage (%) | 99.5 | 57.6 -42% | 100 1% | 99 -1% | 99.9 0% | 91.3 -8% |
| AdobeRGB 1998 Coverage (%) | 73.8 | 40.42 -45% | 73.5 0% | 73 -1% | 66.7 -10% | |
| Response Times | -174% | -18% | 23% | -17% | 9% | |
| Response Time Grey 50% / Grey 80% * (ms) | 8 ? | 30.4 ? -280% | 9.6 ? -20% | 9.2 ? -15% | 12 ? -50% | 7.4 ? 7% |
| Response Time Black / White * (ms) | 12.4 ? | 20.8 ? -68% | 14.4 ? -16% | 4.8 61% | 10.4 ? 16% | 11.2 ? 10% |
| PWM Frequency (Hz) | 200 ? | |||||
| Screen | -27% | 15% | 22% | 6% | 0% | |
| Brightness middle (cd/m²) | 405 | 297 -27% | 361 -11% | 551 36% | 409.5 1% | 307 -24% |
| Brightness (cd/m²) | 378 | 275 -27% | 341 -10% | 523 38% | 390 3% | 321 -15% |
| Brightness Distribution (%) | 87 | 88 1% | 88 1% | 88 1% | 88 1% | 83 -5% |
| Black Level * (cd/m²) | 0.34 | 0.33 3% | 0.3 12% | 0.54 -59% | 0.47 -38% | 0.27 21% |
| Contrast (:1) | 1191 | 900 -24% | 1203 1% | 1020 -14% | 871 -27% | 1137 -5% |
| Colorchecker dE 2000 * | 3.7 | 4.54 -23% | 2.44 34% | 1.8 51% | 3.48 6% | 4.67 -26% |
| Colorchecker dE 2000 max. * | 7.77 | 18.92 -144% | 6.37 18% | 2.53 67% | 6.31 19% | 7.53 3% |
| Colorchecker dE 2000 calibrated * | 3.49 | 4.66 -34% | 1.26 64% | 1.66 52% | 0.89 74% | 2.41 31% |
| Greyscale dE 2000 * | 5.88 | 2.1 64% | 4.6 22% | 1.85 69% | 5 15% | 4.5 23% |
| Gamma | 2.57 86% | 2.066 106% | 2.268 97% | 2.3 96% | 2.16 102% | 2.276 97% |
| CCT | 6342 102% | 6291 103% | 6609 98% | 6338 103% | 6591 99% | 6824 95% |
| Color Space (Percent of AdobeRGB 1998) (%) | 73.76 | 40 -46% | 72.81 -1% | |||
| Color Space (Percent of sRGB) (%) | 99.47 | 58 -42% | 99.41 0% | |||
| Média Total (Programa/Configurações) | -82% /
-49% | -1% /
7% | 15% /
19% | 2% /
4% | 0% /
-1% |
* ... menor é melhor
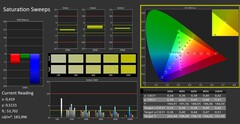
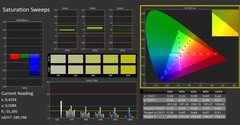
A relação de contraste e os valores de preto são competitivos em comparação com as médias de classe e o espaço de cor sRGB é essencialmente totalmente coberto. Enquanto isso, a tela ainda cobre 73% dos espaços de cor AdobeRGB e DCI-P3
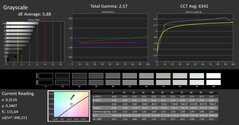
Embora o display esteja bem calibrado à saída da fábrica, conseguimos melhorar ainda mais as cores realizando uma calibração manual do display
Exibir tempos de resposta
| ↔ Tempo de resposta preto para branco | ||
|---|---|---|
| 12.4 ms ... ascensão ↗ e queda ↘ combinadas | ↗ 6.6 ms ascensão | |
| ↘ 5.8 ms queda | ||
| A tela mostra boas taxas de resposta em nossos testes, mas pode ser muito lenta para jogadores competitivos. Em comparação, todos os dispositivos testados variam de 0.1 (mínimo) a 240 (máximo) ms. » 32 % de todos os dispositivos são melhores. Isso significa que o tempo de resposta medido é melhor que a média de todos os dispositivos testados (20.2 ms). | ||
| ↔ Tempo de resposta 50% cinza a 80% cinza | ||
| 8 ms ... ascensão ↗ e queda ↘ combinadas | ↗ 4.2 ms ascensão | |
| ↘ 3.8 ms queda | ||
| A tela mostra taxas de resposta rápidas em nossos testes e deve ser adequada para jogos. Em comparação, todos os dispositivos testados variam de 0.165 (mínimo) a 636 (máximo) ms. » 19 % de todos os dispositivos são melhores. Isso significa que o tempo de resposta medido é melhor que a média de todos os dispositivos testados (31.5 ms). | ||
Cintilação da tela / PWM (modulação por largura de pulso)
| Tela tremeluzindo / PWM não detectado | ||
[pwm_comparison] Em comparação: 53 % de todos os dispositivos testados não usam PWM para escurecer a tela. Se PWM foi detectado, uma média de 8070 (mínimo: 5 - máximo: 343500) Hz foi medida. | ||
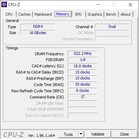
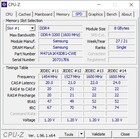
Desempenho - Rápido!
O Omen 16 é um sistema de jogo. O octa-core Intel Core i7-11800H e, mais importante ainda, o NVIDIA GeForce RTX 3070 GPU para notebook bem como a tela 144-Hz são pistas bastante óbvias a este respeito. Com 16 GB, a capacidade de RAM também deve ser suficiente. Com seu design elegante, mas sutil, o Omen foi feito principalmente para os jogadores que preferem um design mais descontraído ao invés do exterior mais comum e pegajoso.
No Omen Gaming Hub, os usuários podem escolher entre alguns perfis de desempenho padrão. Para os padrões de desempenho bruto, selecionamos o perfil de desempenho "Performance" e definimos o comutador gráfico como dedicado, para garantir que a GPU dedicada esteja sempre habilitada. Em seguida, voltamos ao modo híbrido (Optimus) para os testes de bateria
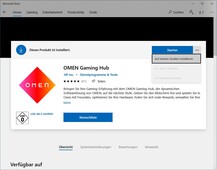
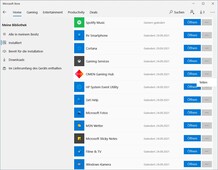
Encontramos um problema frustrante com o software Gaming Hub, que nos lembrou que estávamos usando uma versão antiga em cada lançamento. Entretanto, tentar atualizar nos redirecionaria para a Loja do Windows. Aqui, o software aparece como "já instalado", sem opção para qualquer atualização
Processador
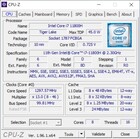
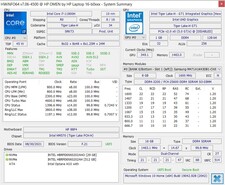
O Omen vem com um Intel Core i7-11800Hum processador octa-core com velocidades teóricas de relógio de 2,3 a 4,6 GHz. Ele apresenta o Thunderbolt 4, que ainda está notavelmente ausente nas plataformas concorrentes da AMD.
Durante nosso loop Cinebench R15, o desempenho permanece muito consistente, sem nenhum mergulho inicial. Enquanto o TDP começa acima de 95 W, ele cai após o segundo loop e permanece relativamente constante em torno de 80 W. O desempenho é semelhante ao do Legion 5 Pro e do Alienware x15 e corresponde às nossas expectativas. A vitória mais barata é cerca de 15% mais lenta nos benchmarks do Cinebench
Em todos os benchmarks, o desempenho da CPU é rápido e semelhante ao do Legion 5 Pro, sendo o Alienware um pouco mais rápido em alguns benchmarks. Em contraste, o Omen coloca primeiro no Geekbench e em alguns outros benchmarks
No modo de bateria, o desempenho da CPU cai em 40%
Cinebench R15 Multi Dauertest
Cinebench R20: CPU (Multi Core) | CPU (Single Core)
Cinebench R15: CPU Multi 64Bit | CPU Single 64Bit
Blender: v2.79 BMW27 CPU
7-Zip 18.03: 7z b 4 | 7z b 4 -mmt1
Geekbench 5.5: Multi-Core | Single-Core
HWBOT x265 Benchmark v2.2: 4k Preset
LibreOffice : 20 Documents To PDF
R Benchmark 2.5: Overall mean
| Cinebench R23 / Multi Core | |
| Média da turma Gaming (5668 - 40970, n=145, últimos 2 anos) | |
| Alienware x15 RTX 3070 P111F | |
| Lenovo Legion 5 Pro 16ACH6H (82JQ001PGE) | |
| Lenovo Legion 5 Pro 16ACH6H (82JQ001PGE) | |
| HP Omen 16-b0085ng | |
| Média Intel Core i7-11800H (6508 - 14088, n=48) | |
| HP Omen 15-en0375ng | |
| HP Victus 16-e0179ng | |
| MSI Katana GF66 11UG-220 | |
| Cinebench R23 / Single Core | |
| Média da turma Gaming (1136 - 2267, n=145, últimos 2 anos) | |
| MSI Katana GF66 11UG-220 | |
| HP Omen 16-b0085ng | |
| Alienware x15 RTX 3070 P111F | |
| Média Intel Core i7-11800H (1386 - 1522, n=45) | |
| HP Victus 16-e0179ng | |
| Lenovo Legion 5 Pro 16ACH6H (82JQ001PGE) | |
| Lenovo Legion 5 Pro 16ACH6H (82JQ001PGE) | |
| HP Omen 15-en0375ng | |
| Cinebench R20 / CPU (Multi Core) | |
| Média da turma Gaming (2179 - 16108, n=144, últimos 2 anos) | |
| Alienware x15 RTX 3070 P111F | |
| Lenovo Legion 5 Pro 16ACH6H (82JQ001PGE) | |
| Lenovo Legion 5 Pro 16ACH6H (82JQ001PGE) | |
| HP Omen 16-b0085ng | |
| Média Intel Core i7-11800H (2498 - 5408, n=50) | |
| HP Omen 15-en0375ng | |
| HP Victus 16-e0179ng | |
| MSI Katana GF66 11UG-220 | |
| Cinebench R20 / CPU (Single Core) | |
| Média da turma Gaming (439 - 870, n=144, últimos 2 anos) | |
| HP Omen 16-b0085ng | |
| MSI Katana GF66 11UG-220 | |
| Alienware x15 RTX 3070 P111F | |
| Média Intel Core i7-11800H (520 - 586, n=47) | |
| HP Victus 16-e0179ng | |
| Lenovo Legion 5 Pro 16ACH6H (82JQ001PGE) | |
| Lenovo Legion 5 Pro 16ACH6H (82JQ001PGE) | |
| HP Omen 15-en0375ng | |
| Cinebench R15 / CPU Multi 64Bit | |
| Média da turma Gaming (1537 - 6271, n=144, últimos 2 anos) | |
| Alienware x15 RTX 3070 P111F | |
| HP Omen 16-b0085ng | |
| MSI Katana GF66 11UG-220 | |
| MSI Katana GF66 11UG-220 | |
| Lenovo Legion 5 Pro 16ACH6H (82JQ001PGE) | |
| HP Victus 16-e0179ng | |
| HP Omen 15-en0375ng | |
| Média Intel Core i7-11800H (1342 - 2173, n=50) | |
| Cinebench R15 / CPU Single 64Bit | |
| Média da turma Gaming (188.8 - 343, n=143, últimos 2 anos) | |
| HP Victus 16-e0179ng | |
| Lenovo Legion 5 Pro 16ACH6H (82JQ001PGE) | |
| Lenovo Legion 5 Pro 16ACH6H (82JQ001PGE) | |
| MSI Katana GF66 11UG-220 | |
| MSI Katana GF66 11UG-220 | |
| HP Omen 16-b0085ng | |
| Alienware x15 RTX 3070 P111F | |
| Média Intel Core i7-11800H (201 - 231, n=46) | |
| HP Omen 15-en0375ng | |
| Blender / v2.79 BMW27 CPU | |
| MSI Katana GF66 11UG-220 | |
| Média Intel Core i7-11800H (217 - 454, n=46) | |
| HP Omen 15-en0375ng | |
| HP Victus 16-e0179ng | |
| Lenovo Legion 5 Pro 16ACH6H (82JQ001PGE) | |
| Lenovo Legion 5 Pro 16ACH6H (82JQ001PGE) | |
| HP Omen 16-b0085ng | |
| Alienware x15 RTX 3070 P111F | |
| Média da turma Gaming (80 - 517, n=140, últimos 2 anos) | |
| 7-Zip 18.03 / 7z b 4 | |
| Média da turma Gaming (23795 - 148086, n=142, últimos 2 anos) | |
| HP Victus 16-e0179ng | |
| Lenovo Legion 5 Pro 16ACH6H (82JQ001PGE) | |
| Lenovo Legion 5 Pro 16ACH6H (82JQ001PGE) | |
| HP Omen 16-b0085ng | |
| Alienware x15 RTX 3070 P111F | |
| HP Omen 15-en0375ng | |
| Média Intel Core i7-11800H (33718 - 56758, n=46) | |
| MSI Katana GF66 11UG-220 | |
| 7-Zip 18.03 / 7z b 4 -mmt1 | |
| Média da turma Gaming (4199 - 7508, n=142, últimos 2 anos) | |
| HP Omen 16-b0085ng | |
| HP Victus 16-e0179ng | |
| MSI Katana GF66 11UG-220 | |
| Lenovo Legion 5 Pro 16ACH6H (82JQ001PGE) | |
| Lenovo Legion 5 Pro 16ACH6H (82JQ001PGE) | |
| Média Intel Core i7-11800H (5138 - 5732, n=46) | |
| Alienware x15 RTX 3070 P111F | |
| HP Omen 15-en0375ng | |
| Geekbench 5.5 / Multi-Core | |
| Média da turma Gaming (4557 - 27010, n=141, últimos 2 anos) | |
| HP Omen 16-b0085ng | |
| Média Intel Core i7-11800H (4655 - 9851, n=40) | |
| Lenovo Legion 5 Pro 16ACH6H (82JQ001PGE) | |
| Lenovo Legion 5 Pro 16ACH6H (82JQ001PGE) | |
| HP Omen 15-en0375ng | |
| HP Victus 16-e0179ng | |
| MSI Katana GF66 11UG-220 | |
| Geekbench 5.5 / Single-Core | |
| Média da turma Gaming (986 - 2474, n=141, últimos 2 anos) | |
| HP Omen 16-b0085ng | |
| MSI Katana GF66 11UG-220 | |
| Média Intel Core i7-11800H (1429 - 1625, n=40) | |
| HP Victus 16-e0179ng | |
| Lenovo Legion 5 Pro 16ACH6H (82JQ001PGE) | |
| Lenovo Legion 5 Pro 16ACH6H (82JQ001PGE) | |
| HP Omen 15-en0375ng | |
| HWBOT x265 Benchmark v2.2 / 4k Preset | |
| Média da turma Gaming (7.7 - 44.3, n=142, últimos 2 anos) | |
| HP Omen 16-b0085ng | |
| Alienware x15 RTX 3070 P111F | |
| Lenovo Legion 5 Pro 16ACH6H (82JQ001PGE) | |
| Lenovo Legion 5 Pro 16ACH6H (82JQ001PGE) | |
| HP Victus 16-e0179ng | |
| Média Intel Core i7-11800H (7.38 - 17.4, n=46) | |
| HP Omen 15-en0375ng | |
| MSI Katana GF66 11UG-220 | |
| LibreOffice / 20 Documents To PDF | |
| Lenovo Legion 5 Pro 16ACH6H (82JQ001PGE) | |
| Lenovo Legion 5 Pro 16ACH6H (82JQ001PGE) | |
| HP Omen 15-en0375ng | |
| HP Victus 16-e0179ng | |
| MSI Katana GF66 11UG-220 | |
| Alienware x15 RTX 3070 P111F | |
| Média da turma Gaming (19 - 88.8, n=141, últimos 2 anos) | |
| Média Intel Core i7-11800H (38.6 - 59.9, n=45) | |
| HP Omen 16-b0085ng | |
| R Benchmark 2.5 / Overall mean | |
| HP Omen 15-en0375ng | |
| Alienware x15 RTX 3070 P111F | |
| Média Intel Core i7-11800H (0.548 - 0.615, n=46) | |
| Lenovo Legion 5 Pro 16ACH6H (82JQ001PGE) | |
| Lenovo Legion 5 Pro 16ACH6H (82JQ001PGE) | |
| HP Omen 16-b0085ng | |
| MSI Katana GF66 11UG-220 | |
| HP Victus 16-e0179ng | |
| Média da turma Gaming (0.3439 - 0.759, n=142, últimos 2 anos) | |
* ... menor é melhor
Desempenho do sistema
| PCMark 10 / Score | |
| Média da turma Gaming (5776 - 10060, n=119, últimos 2 anos) | |
| HP Omen 16-b0085ng | |
| Alienware x15 RTX 3070 P111F | |
| Média Intel Core i7-11800H, NVIDIA GeForce RTX 3070 Laptop GPU (6126 - 7311, n=11) | |
| Lenovo Legion 5 Pro 16ACH6H (82JQ001PGE) | |
| MSI Katana GF66 11UG-220 | |
| HP Victus 16-e0179ng | |
| HP Omen 15-en0375ng | |
| PCMark 10 / Essentials | |
| HP Omen 16-b0085ng | |
| Média da turma Gaming (8810 - 12600, n=123, últimos 2 anos) | |
| Alienware x15 RTX 3070 P111F | |
| Média Intel Core i7-11800H, NVIDIA GeForce RTX 3070 Laptop GPU (9248 - 10832, n=11) | |
| HP Victus 16-e0179ng | |
| Lenovo Legion 5 Pro 16ACH6H (82JQ001PGE) | |
| MSI Katana GF66 11UG-220 | |
| HP Omen 15-en0375ng | |
| PCMark 10 / Productivity | |
| Média da turma Gaming (6662 - 16716, n=121, últimos 2 anos) | |
| MSI Katana GF66 11UG-220 | |
| Média Intel Core i7-11800H, NVIDIA GeForce RTX 3070 Laptop GPU (8571 - 9669, n=11) | |
| Alienware x15 RTX 3070 P111F | |
| HP Omen 16-b0085ng | |
| HP Victus 16-e0179ng | |
| Lenovo Legion 5 Pro 16ACH6H (82JQ001PGE) | |
| HP Omen 15-en0375ng | |
| PCMark 10 / Digital Content Creation | |
| Média da turma Gaming (7440 - 19351, n=121, últimos 2 anos) | |
| Alienware x15 RTX 3070 P111F | |
| HP Omen 16-b0085ng | |
| Média Intel Core i7-11800H, NVIDIA GeForce RTX 3070 Laptop GPU (7627 - 10851, n=11) | |
| Lenovo Legion 5 Pro 16ACH6H (82JQ001PGE) | |
| MSI Katana GF66 11UG-220 | |
| HP Victus 16-e0179ng | |
| HP Omen 15-en0375ng | |
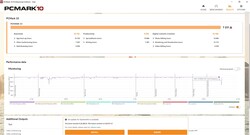
| PCMark 10 Score | 7231 pontos | |
Ajuda | ||
Latências DPC
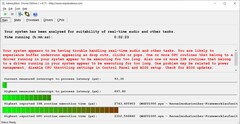
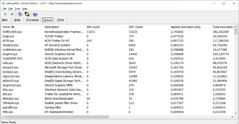
Mesmo apenas abrir nossa homepage no navegador Edge causa latências DPC problemáticas de acordo com o LatencyMon. Pelo menos apenas 1 frame foi solto durante a reprodução de nosso vídeo 4K60FPS no YouTube. Esperamos que a HP dê uma segunda olhada em seus drivers e lance versões atualizadas
| DPC Latencies / LatencyMon - interrupt to process latency (max), Web, Youtube, Prime95 | |
| HP Omen 16-b0085ng | |
* ... menor é melhor
Solução de armazenamento
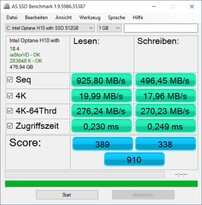
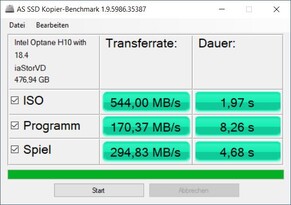
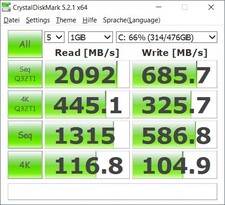
Quando se trata da solução de armazenamento, nosso dispositivo de teste utiliza uma solução combinada que consiste na memória Intel Optane H10 32GB + 512GB. 32 GB de cache Optane só é vantajoso após repetidas execuções da mesma carga de trabalho e o SSD da Intel não tem um desempenho espectacular de outra forma - alguns concorrentes são até duas vezes mais rápidos
Com isso em mente, os excelentes resultados de desempenho do sistema são um tanto surpreendentes. Talvez, a memória Optane ultra-rápida seja capaz de compensar as desvantagens de desempenho do SSD primário instalado. Em nosso Tabela HDD/SSDAs pobres medidas sintéticas do SSD o colocam na posição 262
| HP Omen 16-b0085ng Intel Optane Memory H10 with Solid State Storage 32GB + 512GB HBRPEKNX0202A(L/H) | HP Omen 15-en0375ng WDC PC SN730 SDBPNTY-512G | HP Victus 16-e0179ng WDC PC SN730 SDBPNTY-1T00 | Lenovo Legion 5 Pro 16ACH6H (82JQ001PGE) WDC PC SN730 SDBPNTY-1T00 | Alienware x15 RTX 3070 P111F WDC PC SN730 SDBPNTY-512G | MSI Katana GF66 11UG-220 Kingston OM8PDP3512B-AI1 | Média Intel Optane Memory H10 with Solid State Storage 32GB + 512GB HBRPEKNX0202A(L/H) | |
|---|---|---|---|---|---|---|---|
| CrystalDiskMark 5.2 / 6 | 96% | 113% | 57% | 89% | -14% | 13% | |
| Write 4K (MB/s) | 104.9 | 119.6 14% | 157.3 50% | 89.9 -14% | 179.6 71% | 138.2 32% | 110.3 ? 5% |
| Read 4K (MB/s) | 116.8 | 47.4 -59% | 49 -58% | 30.98 -73% | 49.21 -58% | 31.31 -73% | 131.9 ? 13% |
| Write Seq (MB/s) | 587 | 2677 356% | 2983 408% | 2062 251% | 459.3 -22% | 569 ? -3% | |
| Read Seq (MB/s) | 1316 | 2220 69% | 2247 71% | 1849 41% | 1283 -3% | 1372 ? 4% | |
| Write 4K Q32T1 (MB/s) | 325.7 | 427.4 31% | 395 21% | 371.6 14% | 462.9 42% | 321 -1% | 387 ? 19% |
| Read 4K Q32T1 (MB/s) | 445.1 | 549 23% | 557 25% | 470.6 6% | 470.2 6% | 394.5 -11% | 375 ? -16% |
| Write Seq Q32T1 (MB/s) | 686 | 2706 294% | 3094 351% | 3065 347% | 2702 294% | 436 -36% | 1141 ? 66% |
| Read Seq Q32T1 (MB/s) | 2092 | 2869 37% | 2871 37% | 3370 61% | 3371 61% | 2222 6% | 2439 ? 17% |
| Write 4K Q8T8 (MB/s) | 1619 | ||||||
| Read 4K Q8T8 (MB/s) | 1670 | ||||||
| AS SSD | 377% | 377% | 176% | 249% | 48% | 119% | |
| Seq Read (MB/s) | 925 | 2255 144% | 2383 158% | 2695 191% | 2871 210% | 1978 114% | 1056 ? 14% |
| Seq Write (MB/s) | 496 | 2129 329% | 2466 397% | 2384 381% | 1511 205% | 308.3 -38% | 429 ? -14% |
| 4K Read (MB/s) | 19.99 | 49.5 148% | 44.14 121% | 29.75 49% | 44.3 122% | 24.04 20% | 61.9 ? 210% |
| 4K Write (MB/s) | 17.96 | 175.1 875% | 117.5 554% | 52 190% | 162 802% | 113.7 533% | 105 ? 485% |
| 4K-64 Read (MB/s) | 276.2 | 1463 430% | 1734 528% | 1193 332% | 1038 276% | 256.5 -7% | 459 ? 66% |
| 4K-64 Write (MB/s) | 270.2 | 2061 663% | 2088 673% | 1107 310% | 966 258% | 242.8 -10% | 644 ? 138% |
| Access Time Read * (ms) | 0.23 | 0.138 40% | 0.049 79% | 0.136 41% | 0.077 67% | 0.15 35% | 0.1019 ? 56% |
| Access Time Write * (ms) | 0.249 | 0.022 91% | 0.032 87% | 0.36 -45% | 0.066 73% | 0.353 -42% | 0.09417 ? 62% |
| Score Read (Points) | 389 | 1738 347% | 2017 419% | 1493 284% | 1370 252% | 478 23% | 627 ? 61% |
| Score Write (Points) | 338 | 2449 625% | 2452 625% | 1397 313% | 1279 278% | 387 14% | 792 ? 134% |
| Score Total (Points) | 910 | 5075 458% | 5503 505% | 3636 300% | 3288 261% | 1033 14% | 1732 ? 90% |
| Copy ISO MB/s (MB/s) | 544 | 1007 85% | 1962 261% | 278.1 -49% | 782 ? 44% | ||
| Copy Program MB/s (MB/s) | 170.4 | 43.11 -75% | 407.9 139% | 282.3 66% | 464 ? 172% | ||
| Copy Game MB/s (MB/s) | 294.8 | 621 111% | 1105 275% | 284.2 -4% | 722 ? 145% | ||
| Média Total (Programa/Configurações) | 237% /
259% | 245% /
266% | 117% /
140% | 169% /
190% | 17% /
26% | 66% /
80% |
* ... menor é melhor
Dauerleistung Lesen: DiskSpd Read Loop, Queue Depth 8
Desempenho da GPU
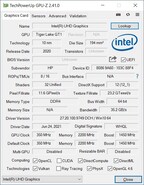
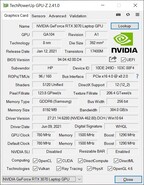
No modo híbrido, o integrado UHD Graphics e o dedicado NVIDIA GeForce GPU para laptop RTX 3070 com 8 GB de VRAM se revezam, dependendo da carga. O TGP deste último está ajustado para 115 W. Com um espectro possível de 80 W a 125 W, ele pertence à categoria de alto desempenho. Alternativamente, um Omen 16 com um RTX 3060 também está disponível
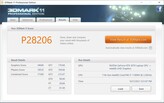
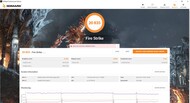
Os resultados 3DMark do Omen 16 são bons e muito semelhantes aos do Alienware e do Legion 5 Pro. Enquanto isso, o RTX 3060 dentro da HP Victus é cerca de 30% mais lento
No modo de bateria, o desempenho gráfico do sistema diminui em 64%
| 3DMark 11 Performance | 28206 pontos | |
| 3DMark Cloud Gate Standard Score | 54319 pontos | |
| 3DMark Fire Strike Score | 20835 pontos | |
| 3DMark Time Spy Score | 10126 pontos | |
Ajuda | ||
Desempenho nos jogos
O Omen 16 é um peso pesado quando se trata de nossos benchmarks de jogo e concorre pelo primeiro lugar com o Alienware. Entretanto, este último tende a superar nosso Omen 16 por uma pequena margem, particularmente em resoluções mais altas e ajustes de qualidade
| New World | |
| 1920x1080 Low Video Quality | |
| HP Omen 16-b0085ng | |
| Média NVIDIA GeForce RTX 3070 Laptop GPU (99.8 - 120.5, n=3) | |
| 1920x1080 Medium Video Quality | |
| HP Omen 16-b0085ng | |
| Média NVIDIA GeForce RTX 3070 Laptop GPU (84.6 - 96.8, n=4) | |
| 1920x1080 High Video Quality | |
| HP Omen 16-b0085ng | |
| Média NVIDIA GeForce RTX 3070 Laptop GPU (81.7 - 94.8, n=4) | |
| 1920x1080 Very High Video Quality | |
| Média NVIDIA GeForce RTX 3070 Laptop GPU (79.4 - 86.8, n=4) | |
| HP Omen 16-b0085ng | |
Durante nossos 60 minutos Witcher 3 teste ocioso, as taxas de quadros não são totalmente constantes. Aqui, o desempenho flutua ligeiramente, embora o gráfico não mostre uma diminuição significativa no desempenho a longo prazo
Witcher 3 FPS-Diagramm
| baixo | média | alto | ultra | |
|---|---|---|---|---|
| GTA V (2015) | 185 | 181 | 172 | 103 |
| The Witcher 3 (2015) | 416 | 304.5 | 184.4 | 98.6 |
| Dota 2 Reborn (2015) | 171 | 151 | 145 | 137 |
| X-Plane 11.11 (2018) | 136 | 121 | 96.7 | |
| Far Cry 5 (2018) | 156 | 129 | 123 | 115 |
| Strange Brigade (2018) | 482 | 254 | 205 | 178 |
| Shadow of the Tomb Raider (2018) | 159 | 140 | 135 | 126 |
| New World (2021) | 128 | 96.8 | 94.8 | 81.8 |
Emissões - Presságios Fortes não podem ser ignorados
Ruído do sistema
No modo híbrido, os ventiladores tendem a não se ligar durante a inatividade do sistema. Após selecionar o modo de desempenho dentro do software do Centro de Jogos, os ventiladores giram silenciosamente na maioria das vezes - mas nem sempre. Sob carga, ambos os ventiladores se tornam muito barulhentos com níveis de ruído que excedem os da concorrência. Subjetivamente, porém, o laptop não é visivelmente mais alto do que seus concorrentes.
Dito isto, há algum choramingar de bobina que ocorre esporadicamente. Isto parece corellate com cenários de alta carga, como o lançamento Witcher 3 em altas ressalvas e ajustes de qualidade. Felizmente, os ruídos eletrônicos relativamente silenciosos são temporários e apenas perceptíveis às vezes
Barulho
| Ocioso |
| 23 / 23 / 34.81 dB |
| Carga |
| 35.02 / 56 dB |
 | ||
30 dB silencioso 40 dB(A) audível 50 dB(A) ruidosamente alto |
||
min: | ||
| HP Omen 16-b0085ng GeForce RTX 3070 Laptop GPU, i7-11800H, Intel Optane Memory H10 with Solid State Storage 32GB + 512GB HBRPEKNX0202A(L/H) | HP Omen 15-en0375ng GeForce RTX 2060 Mobile, R7 4800H, WDC PC SN730 SDBPNTY-512G | HP Victus 16-e0179ng GeForce RTX 3060 Laptop GPU, R7 5800H, WDC PC SN730 SDBPNTY-1T00 | Lenovo Legion 5 Pro 16ACH6H (82JQ001PGE) GeForce RTX 3070 Laptop GPU, R7 5800H, WDC PC SN730 SDBPNTY-1T00 | Alienware x15 RTX 3070 P111F GeForce RTX 3070 Laptop GPU, i7-11800H, WDC PC SN730 SDBPNTY-512G | MSI Katana GF66 11UG-220 GeForce RTX 3070 Laptop GPU, i7-11800H, Kingston OM8PDP3512B-AI1 | |
|---|---|---|---|---|---|---|
| Noise | -5% | -4% | 4% | 1% | -18% | |
| desligado / ambiente * (dB) | 23 | 24 -4% | 24 -4% | 23 -0% | 24.1 -5% | 25 -9% |
| Idle Minimum * (dB) | 23 | 24 -4% | 24 -4% | 25 -9% | 26.6 -16% | 34 -48% |
| Idle Average * (dB) | 23 | 25 -9% | 25 -9% | 25 -9% | 26.6 -16% | 35 -52% |
| Idle Maximum * (dB) | 34.81 | 37 -6% | 34 2% | 25 28% | 26.6 24% | 36 -3% |
| Load Average * (dB) | 35.02 | 45 -28% | 44 -26% | 35.5 -1% | 30.9 12% | 48 -37% |
| Witcher 3 ultra * (dB) | 52 | 48 8% | 50 4% | 46.67 10% | 49.9 4% | 46 12% |
| Load Maximum * (dB) | 56 | 51 9% | 52 7% | 50.35 10% | 53.5 4% | 49 12% |
* ... menor é melhor
Temperatura
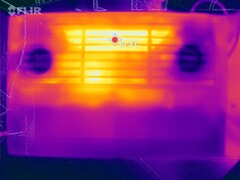
O Omen 16 aquece principalmente no fundo, onde grelhas extensas servem tanto como entrada quanto como saída de dissipação de calor
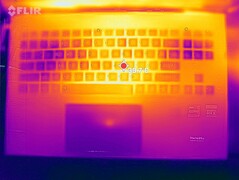
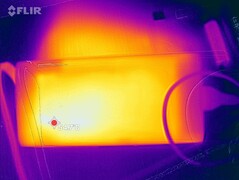
Na parte superior, o Omen permanece relativamente frio. Os pontos quentes na parte inferior atingem até 55 C, o que é bastante manso comparativamente. Aqui, a solução de resfriamento altamente dinâmica com altos níveis de ruído sob carga total demonstra do que ela é capaz. Apesar de estar equipado com uma solução de resfriamento ainda mais espaçosa, o Alienware atinge temperaturas ainda mais altas, enquanto alcança apenas um desempenho marginalmente mais rápido
Os apoios de palma permanecem confortavelmente frescos e até mesmo a temperatura das chaves WASD é surpreendentemente baixa. Nesse sentido, a HP conseguiu equilibrar com sucesso a distribuição de calor de uma forma que deveria fazer os jogadores felizes
(-) A temperatura máxima no lado superior é 48 °C / 118 F, em comparação com a média de 40.4 °C / 105 F , variando de 21.2 a 68.8 °C para a classe Gaming.
(-) A parte inferior aquece até um máximo de 55 °C / 131 F, em comparação com a média de 43.3 °C / 110 F
(+) Em uso inativo, a temperatura média para o lado superior é 30.9 °C / 88 F, em comparação com a média do dispositivo de 33.9 °C / ### class_avg_f### F.
(±) Jogando The Witcher 3, a temperatura média para o lado superior é 36.2 °C / 97 F, em comparação com a média do dispositivo de 33.9 °C / ## #class_avg_f### F.
(+) Os apoios para as mãos e o touchpad estão atingindo a temperatura máxima da pele (33 °C / 91.4 F) e, portanto, não estão quentes.
(-) A temperatura média da área do apoio para as mãos de dispositivos semelhantes foi 28.8 °C / 83.8 F (-4.2 °C / -7.6 F).
| HP Omen 16-b0085ng GeForce RTX 3070 Laptop GPU, i7-11800H, Intel Optane Memory H10 with Solid State Storage 32GB + 512GB HBRPEKNX0202A(L/H) | HP Omen 15-en0375ng GeForce RTX 2060 Mobile, R7 4800H, WDC PC SN730 SDBPNTY-512G | HP Victus 16-e0179ng GeForce RTX 3060 Laptop GPU, R7 5800H, WDC PC SN730 SDBPNTY-1T00 | Lenovo Legion 5 Pro 16ACH6H (82JQ001PGE) GeForce RTX 3070 Laptop GPU, R7 5800H, WDC PC SN730 SDBPNTY-1T00 | Alienware x15 RTX 3070 P111F GeForce RTX 3070 Laptop GPU, i7-11800H, WDC PC SN730 SDBPNTY-512G | MSI Katana GF66 11UG-220 GeForce RTX 3070 Laptop GPU, i7-11800H, Kingston OM8PDP3512B-AI1 | |
|---|---|---|---|---|---|---|
| Heat | 14% | -11% | -1% | 3% | 3% | |
| Maximum Upper Side * (°C) | 48 | 42 12% | 51 -6% | 50 -4% | 59.2 -23% | 56 -17% |
| Maximum Bottom * (°C) | 55 | 54 2% | 52 5% | 55 -0% | 58 -5% | 49 11% |
| Idle Upper Side * (°C) | 33 | 28 15% | 46 -39% | 34 -3% | 28.4 14% | 36 -9% |
| Idle Bottom * (°C) | 39 | 29 26% | 41 -5% | 37 5% | 29 26% | 28 28% |
* ... menor é melhor
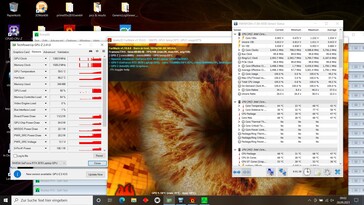
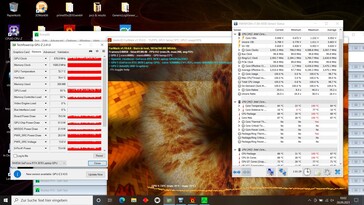
A CPU começa nosso teste de estresse em aproximadamente 4,2 GHz. Após menos de um minuto, a velocidade do relógio cai para 3,5 GHz. Este nível de desempenho é então mantido durante o restante do teste de estresse, apesar das temperaturas flutuantes. A média foi de 84 C com picos curtos e temporários até 100 C que podem fazer com que as velocidades do relógio diminuam ligeiramente e (mais provavelmente) com que a solução de resfriamento aumente
Em contraste, a GPU cicla fortemente durante toda a duração do teste de estresse com velocidades de relógio registradas que variam de 690 a 1425 MHz, mesmo depois de uma hora passada. Aparentemente, a GPU acelera termicamente temporariamente ao atingir 75 C
Oradores
Os alto-falantes estéreo podem ficar bem alto e oferecer médias e agudos equilibrados. Naturalmente, eles estão faltando em termos de graves. A única saída analógica no laptop é um conector de fone de ouvido combinado
HP Omen 16-b0085ng análise de áudio
(+) | os alto-falantes podem tocar relativamente alto (###valor### dB)
Graves 100 - 315Hz
(-) | quase nenhum baixo - em média 17.4% menor que a mediana
(±) | a linearidade dos graves é média (13.9% delta para a frequência anterior)
Médios 400 - 2.000 Hz
(+) | médios equilibrados - apenas 3.2% longe da mediana
(+) | médios são lineares (2.9% delta para frequência anterior)
Altos 2 - 16 kHz
(+) | agudos equilibrados - apenas 1.5% longe da mediana
(+) | os máximos são lineares (3.9% delta da frequência anterior)
Geral 100 - 16.000 Hz
(+) | o som geral é linear (12.1% diferença em relação à mediana)
Comparado com a mesma classe
» 12% de todos os dispositivos testados nesta classe foram melhores, 4% semelhantes, 84% piores
» O melhor teve um delta de 6%, a média foi 18%, o pior foi 132%
Comparado com todos os dispositivos testados
» 9% de todos os dispositivos testados foram melhores, 2% semelhantes, 89% piores
» O melhor teve um delta de 4%, a média foi 24%, o pior foi 134%
Lenovo Legion 5 Pro 16ACH6H (82JQ001PGE) análise de áudio
(±) | o volume do alto-falante é médio, mas bom (###valor### dB)
Graves 100 - 315Hz
(±) | graves reduzidos - em média 10.8% menor que a mediana
(±) | a linearidade dos graves é média (14.7% delta para a frequência anterior)
Médios 400 - 2.000 Hz
(±) | médios mais altos - em média 6.7% maior que a mediana
(±) | a linearidade dos médios é média (7.8% delta para frequência anterior)
Altos 2 - 16 kHz
(±) | máximos reduzidos - em média 5.2% menor que a mediana
(±) | a linearidade dos máximos é média (8.6% delta para frequência anterior)
Geral 100 - 16.000 Hz
(±) | a linearidade do som geral é média (17.4% diferença em relação à mediana)
Comparado com a mesma classe
» 48% de todos os dispositivos testados nesta classe foram melhores, 12% semelhantes, 40% piores
» O melhor teve um delta de 6%, a média foi 18%, o pior foi 132%
Comparado com todos os dispositivos testados
» 32% de todos os dispositivos testados foram melhores, 8% semelhantes, 59% piores
» O melhor teve um delta de 4%, a média foi 24%, o pior foi 134%
Gerenciamento de energia - Boa vida útil da bateria
Consumo de energia
Durante o ocioso, concorrentes equipados de maneira semelhante mostram valores de consumo semelhantes com o desenho Alienware um pouco mais e o desenho da Lenovo Legion Pro um pouco menos de potência. Ao jogar Witcher 3, o consumo de energia da Omen é menor e durante o teste de estresse é ligeiramente maior em comparação com seus concorrentes. Os valores de consumo correspondem às nossas expectativas em geral.
| Ocioso | |
| Carga |
|
Key:
min: | |
| HP Omen 16-b0085ng i7-11800H, GeForce RTX 3070 Laptop GPU, Intel Optane Memory H10 with Solid State Storage 32GB + 512GB HBRPEKNX0202A(L/H), IPS, 1920x1080, 16.1" | HP Omen 15-en0375ng R7 4800H, GeForce RTX 2060 Mobile, WDC PC SN730 SDBPNTY-512G, IPS, 1920x1080, 15.6" | HP Victus 16-e0179ng R7 5800H, GeForce RTX 3060 Laptop GPU, WDC PC SN730 SDBPNTY-1T00, IPS, 1920x1080, 16.1" | Lenovo Legion 5 Pro 16ACH6H (82JQ001PGE) R7 5800H, GeForce RTX 3070 Laptop GPU, WDC PC SN730 SDBPNTY-1T00, IPS, 2560x1600, 16" | Alienware x15 RTX 3070 P111F i7-11800H, GeForce RTX 3070 Laptop GPU, WDC PC SN730 SDBPNTY-512G, IPS, 2560x1440, 15.6" | MSI Katana GF66 11UG-220 i7-11800H, GeForce RTX 3070 Laptop GPU, Kingston OM8PDP3512B-AI1, IPS, 1920x1080, 15.6" | Média NVIDIA GeForce RTX 3070 Laptop GPU | Média da turma Gaming | |
|---|---|---|---|---|---|---|---|---|
| Power Consumption | 22% | 16% | 2% | -26% | 12% | -22% | -18% | |
| Idle Minimum * (Watt) | 12 | 4 67% | 5 58% | 10.45 13% | 15.7 -31% | 8 33% | 15.6 ? -30% | 13.6 ? -13% |
| Idle Average * (Watt) | 18 | 9 50% | 10 44% | 14.92 17% | 20.3 -13% | 12 33% | 20.1 ? -12% | 19.3 ? -7% |
| Idle Maximum * (Watt) | 21 | 22 -5% | 20 5% | 16.02 24% | 43 -105% | 22 -5% | 29.4 ? -40% | 25.7 ? -22% |
| Load Average * (Watt) | 94 | 102 -9% | 108 -15% | 119.65 -27% | 94.4 -0% | 98 -4% | 110.8 ? -18% | 110.1 ? -17% |
| Witcher 3 ultra * (Watt) | 147 | 119 19% | 145 1% | 174.9 -19% | 167 -14% | 152 -3% | ||
| Load Maximum * (Watt) | 199 | 182 9% | 189 5% | 187.26 6% | 183.4 8% | 162 19% | 214 ? -8% | 258 ? -30% |
* ... menor é melhor
Energy Consumption Witcher 3 / Stress Test
Vida útil da bateria
A HP instalou uma bateria de 83-Wh. Para os testes da bateria, mudamos para o modo híbrido, permitindo a Optimus. Apesar de estar equipado com baterias ligeiramente maiores em alguns casos, nem o Alienware, nem o Legion, nem o MSI Katana duram tanto tempo quanto nosso Omen. A Victus vem com uma bateria menor de 70-Wh e uma vida útil significativamente mais curta, apesar de seu hardware mais fraco.
Nosso dispositivo de teste permite cerca de 7,5 horas de navegação Wi-Fi com brilho reduzido e, às 5,5 horas, as noites de cinema também não são um problema. Para um dispositivo de jogo, os tempos de funcionamento da bateria são decentes e quase correspondem às médias da classe, que normalmente não são atendidas pelos laptops nesta categoria de preço, como mostra a concorrência direta
| HP Omen 16-b0085ng i7-11800H, GeForce RTX 3070 Laptop GPU, 83 Wh | HP Omen 15-en0375ng R7 4800H, GeForce RTX 2060 Mobile, 70.9 Wh | HP Victus 16-e0179ng R7 5800H, GeForce RTX 3060 Laptop GPU, 70 Wh | Lenovo Legion 5 Pro 16ACH6H (82JQ001PGE) R7 5800H, GeForce RTX 3070 Laptop GPU, 80 Wh | Alienware x15 RTX 3070 P111F i7-11800H, GeForce RTX 3070 Laptop GPU, 87 Wh | MSI Katana GF66 11UG-220 i7-11800H, GeForce RTX 3070 Laptop GPU, 90 Wh | Média da turma Gaming | |
|---|---|---|---|---|---|---|---|
| Duração da bateria | 34% | -15% | -29% | -28% | -22% | 15% | |
| H.264 (h) | 5.4 | 8.13 ? 51% | |||||
| WiFi v1.3 (h) | 7.6 | 10.5 38% | 5.9 -22% | 7 -8% | 6.1 -20% | 5.3 -30% | 6.75 ? -11% |
| Load (h) | 1.4 | 1.8 29% | 1.3 -7% | 0.7 -50% | 0.9 -36% | 1.2 -14% | 1.45 ? 4% |
| Reader / Idle (h) | 20 | 8.5 | 9.1 | 9.7 | 9.1 | 9.17 ? |
Pro
Contra
Veredicto - Forte com Pequenos Erros
O Omen 16 provou ser um laptop de gama média razoavelmente bom, com todas as melhorias em comparação com o Omen 15. O alto nível de desempenho geral em todos os casos de uso, a longa duração da bateria e a boa tela FHD constituem as principais vantagens deste laptop HP. Os principais inconvenientes são o touchpad defeituoso (um de?) e as altas latências que podem ser observadas mesmo depois de apenas abrir o navegador. Além disso, as versões de teste inúteis e pré-instaladas de 30 dias de vários softwares também se enquadram na categoria "desnecessário".
O Omen 16 é um bom laptop para jogos em geral e atinge um nível de desempenho muito alto. No entanto, ainda há trabalho a ser feito quando se trata dos drivers e do touchpad.
Comparado ao Victus 16 da HP, mais barato, o preço premium do Omen 16 pode ser justificável devido a sua base metálica, melhor conectividade (USB 4 com Thunderbolt 4), um desempenho GPU cerca de 30% mais rápido, melhor layout de teclado (embora sem numpad) e construção um pouco mais leve apesar do hardware mais potente. Enquanto isso, ambos os modelos compartilham uma boa exibição e uma performance de CPU semelhante.
Preço e disponibilidade
Uma configuração HP Omen 16 semelhante à nossa com um RTX 3070 é listada no BestBuy por cerca de $1800 USD e espera-se que esteja disponível nas próximas semanas
HP Omen 16-b0085ng
- 10/06/2021 v7 (old)
Christian Hintze


