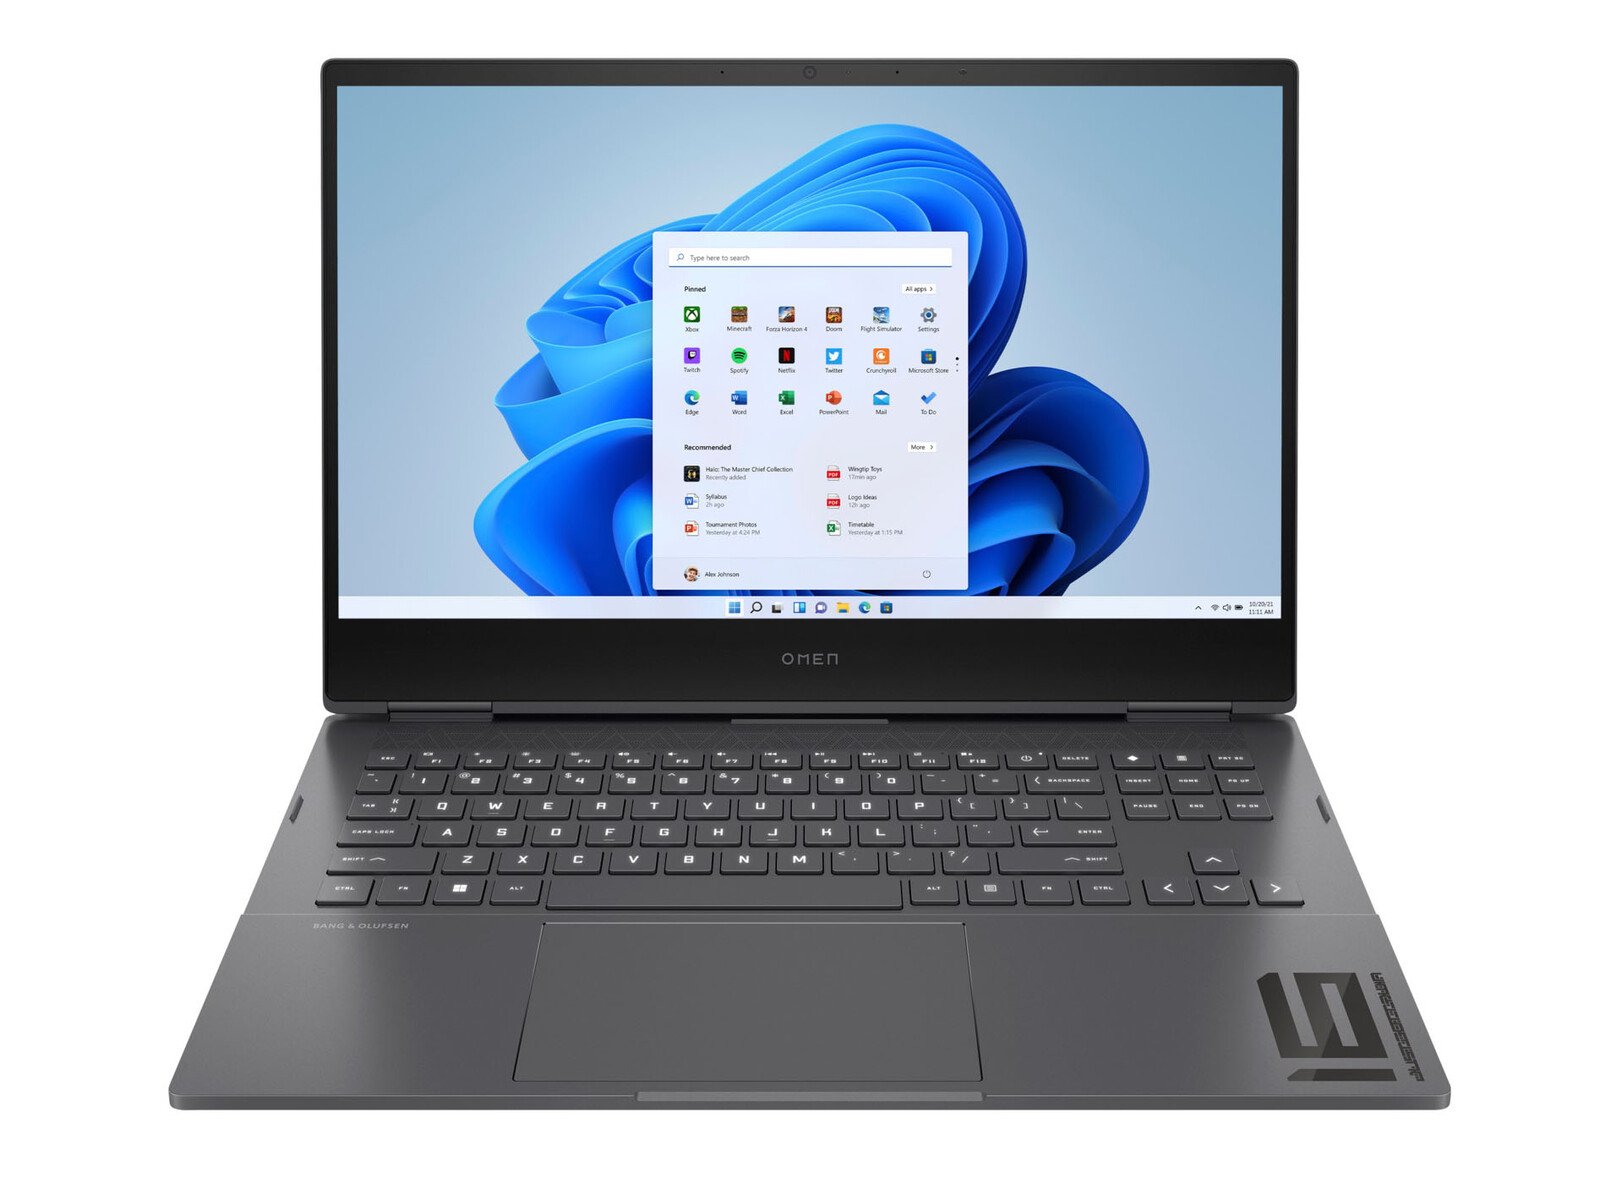
Radeon RX 6650M estreia de desempenho: Revisão do laptop HP Omen 16 2022
Embora a série HP Omen 16 tenha apenas um ano de idade, o último modelo de 2022 já é uma atualização significativa do modelo original, tanto por dentro como por fora. A versão mais recente adiciona as opções de CPU Intel 12th gen Alder Lake-H e AMD Zen 3+, GeForce RTX 3070 Ti e Radeon RX 6000M GPU opções, e várias mudanças no exterior
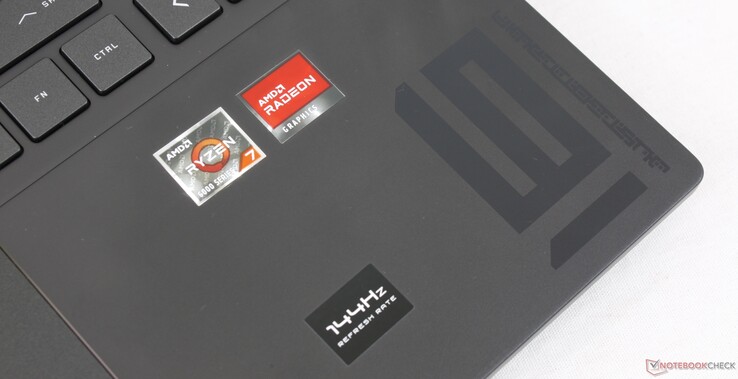
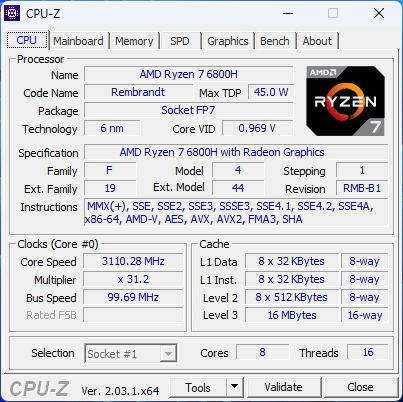
.Nossa configuração em revisão é toda a AMD SKU com a tela Ryzen 7 6800H, Radeon RX 6650M TGP 105 W e IPS 144 Hz 1080p por aproximadamente $1600 USD no varejo. Este também é um dos poucos laptops que apresenta os gráficos Radeon RX 6650M.
O Omen 16 compete diretamente com outros laptops de médio alcance superior de 16 polegadas como o Dell G16 7620, Lenovo Legion S7 16, ou o Asus Zephyrus M16. Para uma alternativa mais amigável ao orçamento, os usuários podem considerar o segmento inferior HP Victus 16.
Mais opiniões da HP:
Possíveis concorrentes em comparação
Avaliação | Data | Modelo | Peso | Altura | Size | Resolução | Preço |
|---|---|---|---|---|---|---|---|
| 86.4 % v7 (old) | 12/2022 | HP Omen 16-n0033dx R7 6800H, Radeon RX 6650M | 2.4 kg | 22.6 mm | 16.10" | 1920x1080 | |
| 86.9 % v7 (old) | 09/2022 | HP Envy 16 h0112nr i7-12700H, GeForce RTX 3060 Laptop GPU | 2.3 kg | 19.8 mm | 16.00" | 3840x2400 | |
| 85.5 % v7 (old) | 05/2022 | HP Omen 16-b1090ng i7-12700H, GeForce RTX 3070 Ti Laptop GPU | 2.3 kg | 23 mm | 16.10" | 2560x1440 | |
| 82.3 % v7 (old) | 05/2022 | HP Victus 16-e0145ng R5 5600H, GeForce RTX 3050 Ti Laptop GPU | 2.4 kg | 23.5 mm | 16.10" | 1920x1080 | |
| 89.3 % v7 (old) | 01/2023 | Lenovo Legion S7 16ARHA7 R9 6900HX, Radeon RX 6800S | 2.2 kg | 16.9 mm | 16.00" | 2560x1600 | |
| 86.1 % v7 (old) | 10/2022 | Dell G16 7620 i7-12700H, GeForce RTX 3060 Laptop GPU | 2.6 kg | 26.9 mm | 16.00" | 2560x1600 |
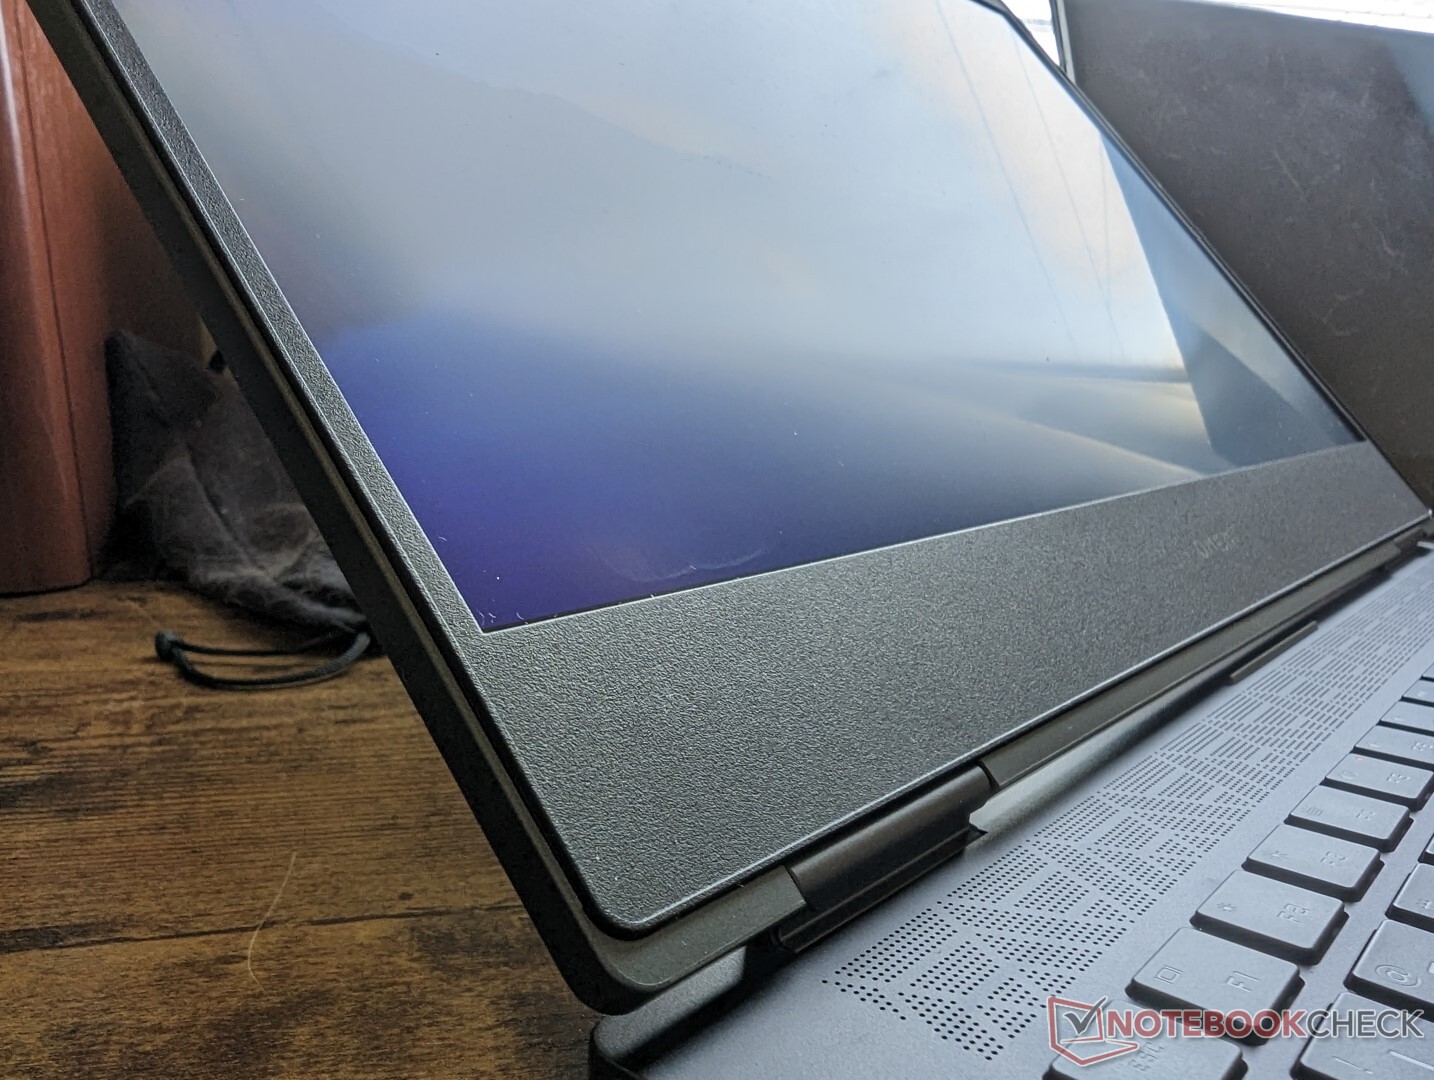
Caso - Inspirado pela inveja 16
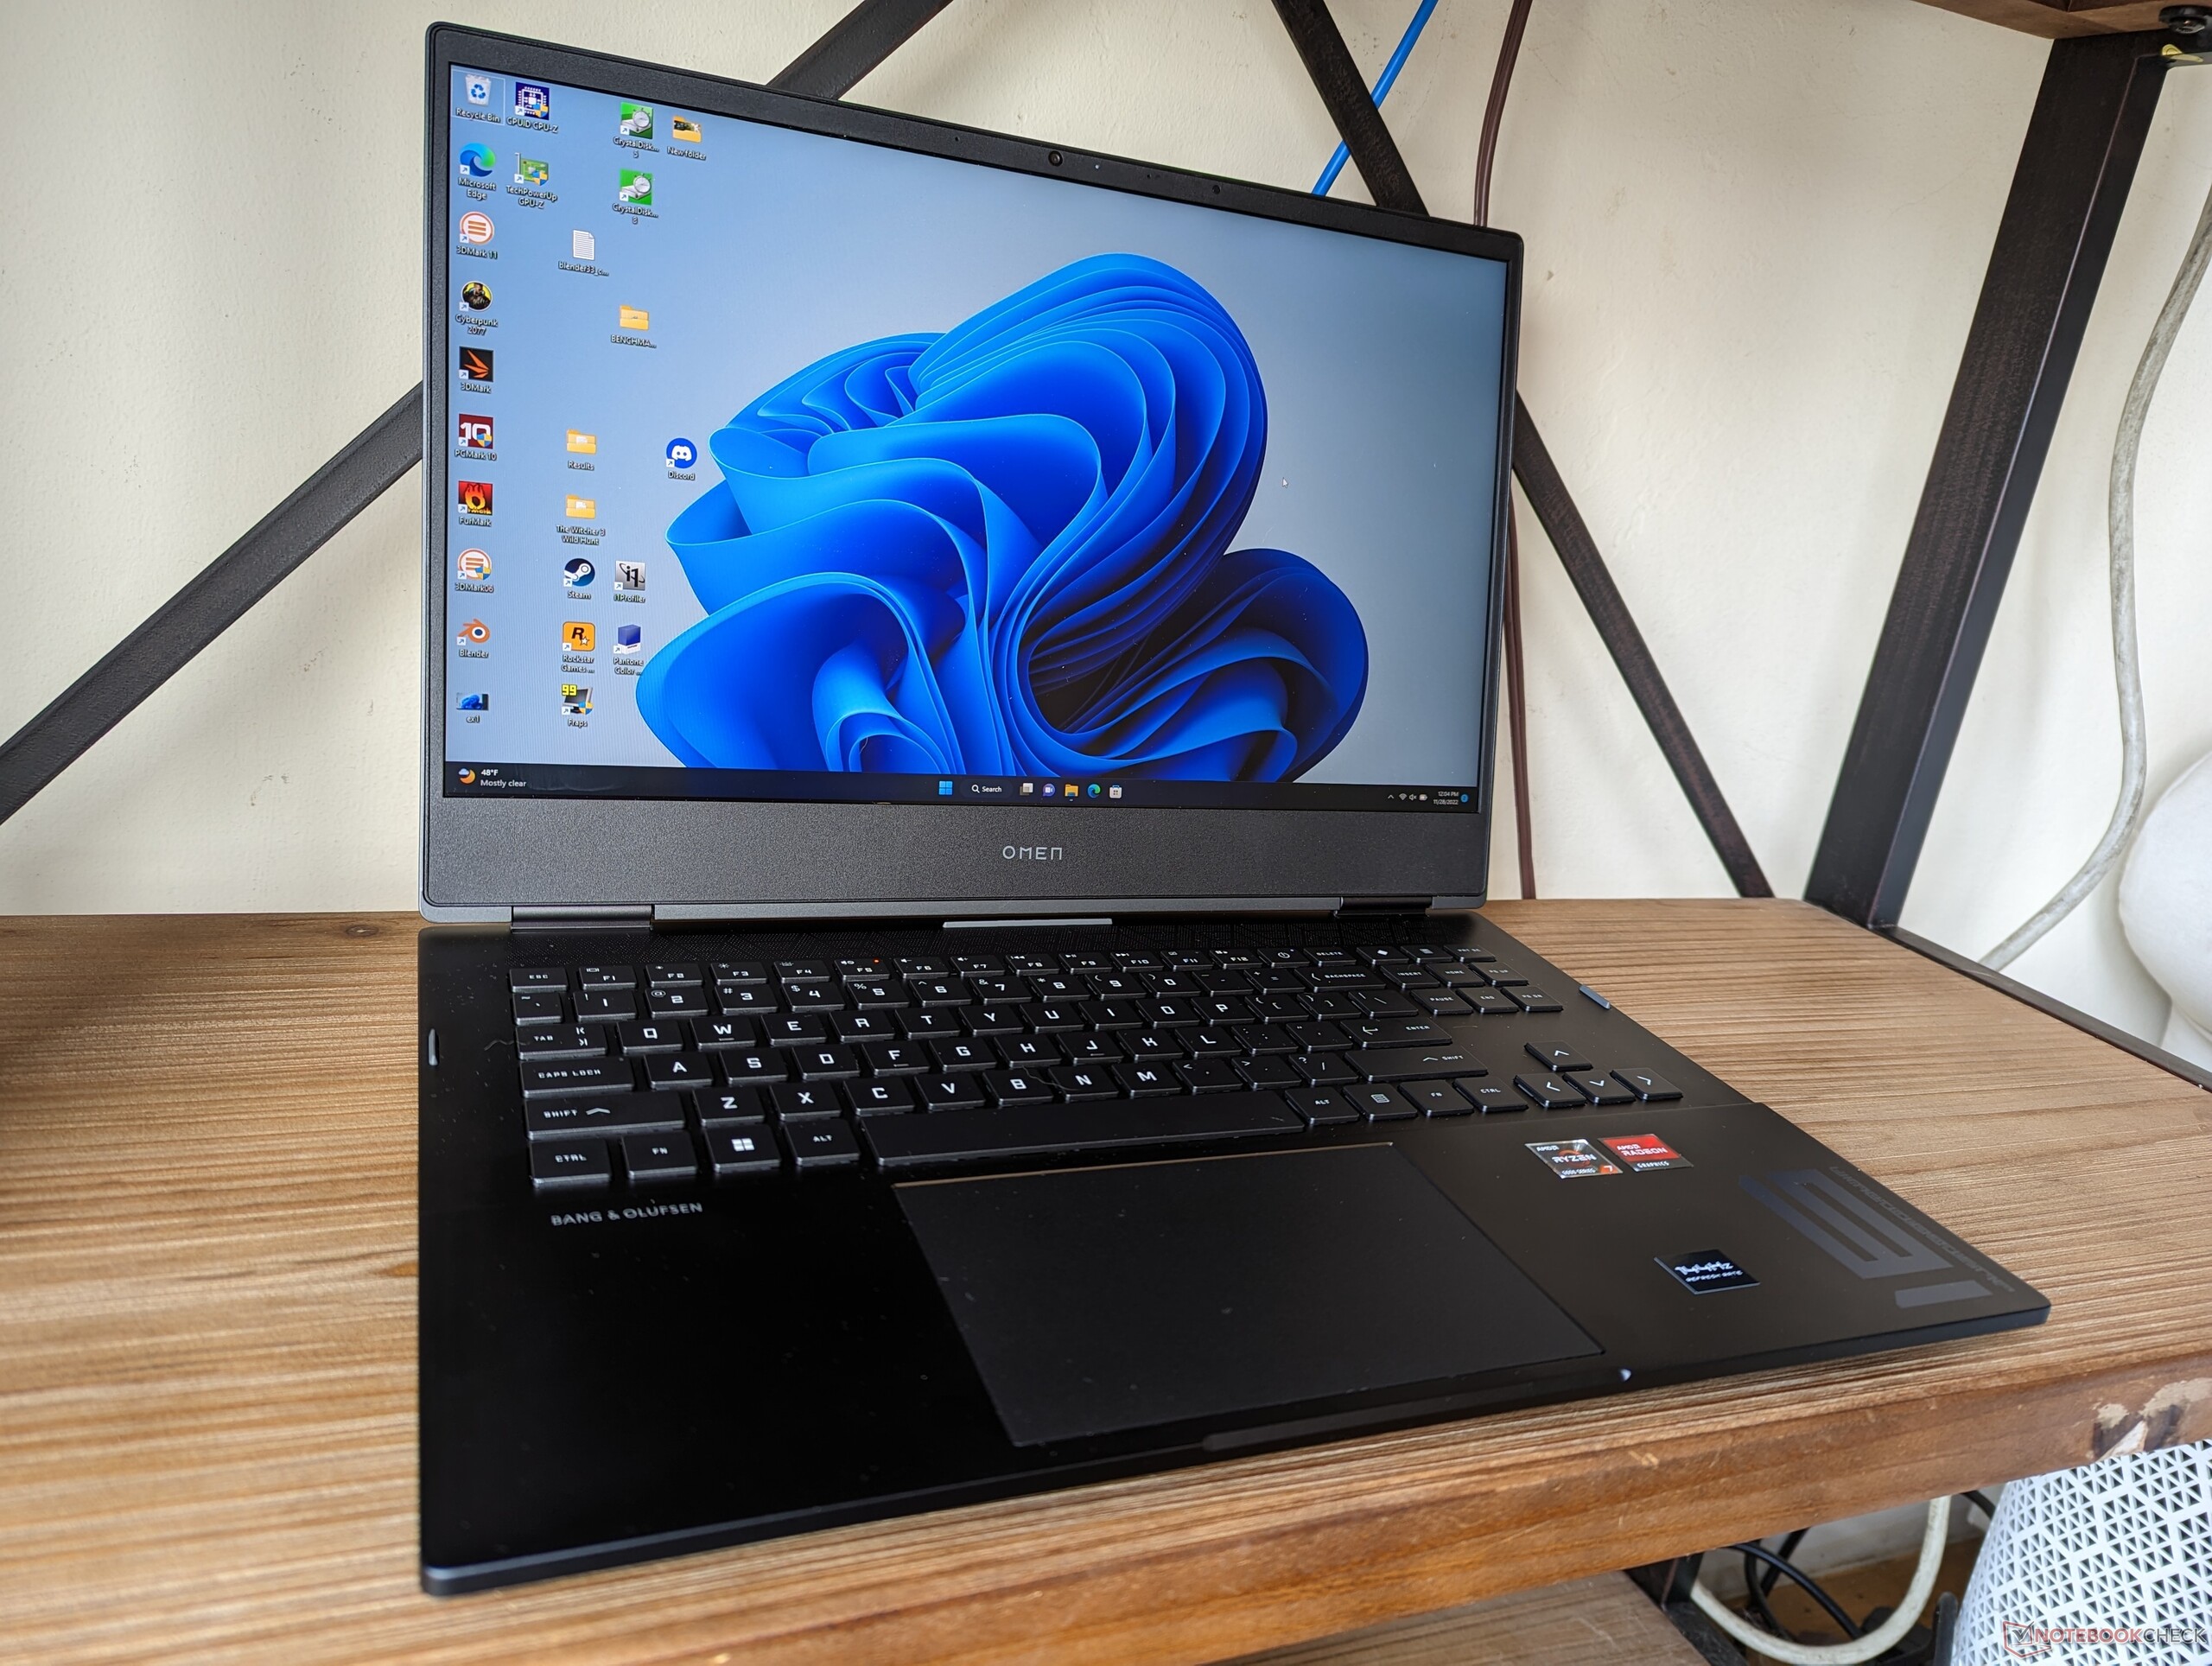
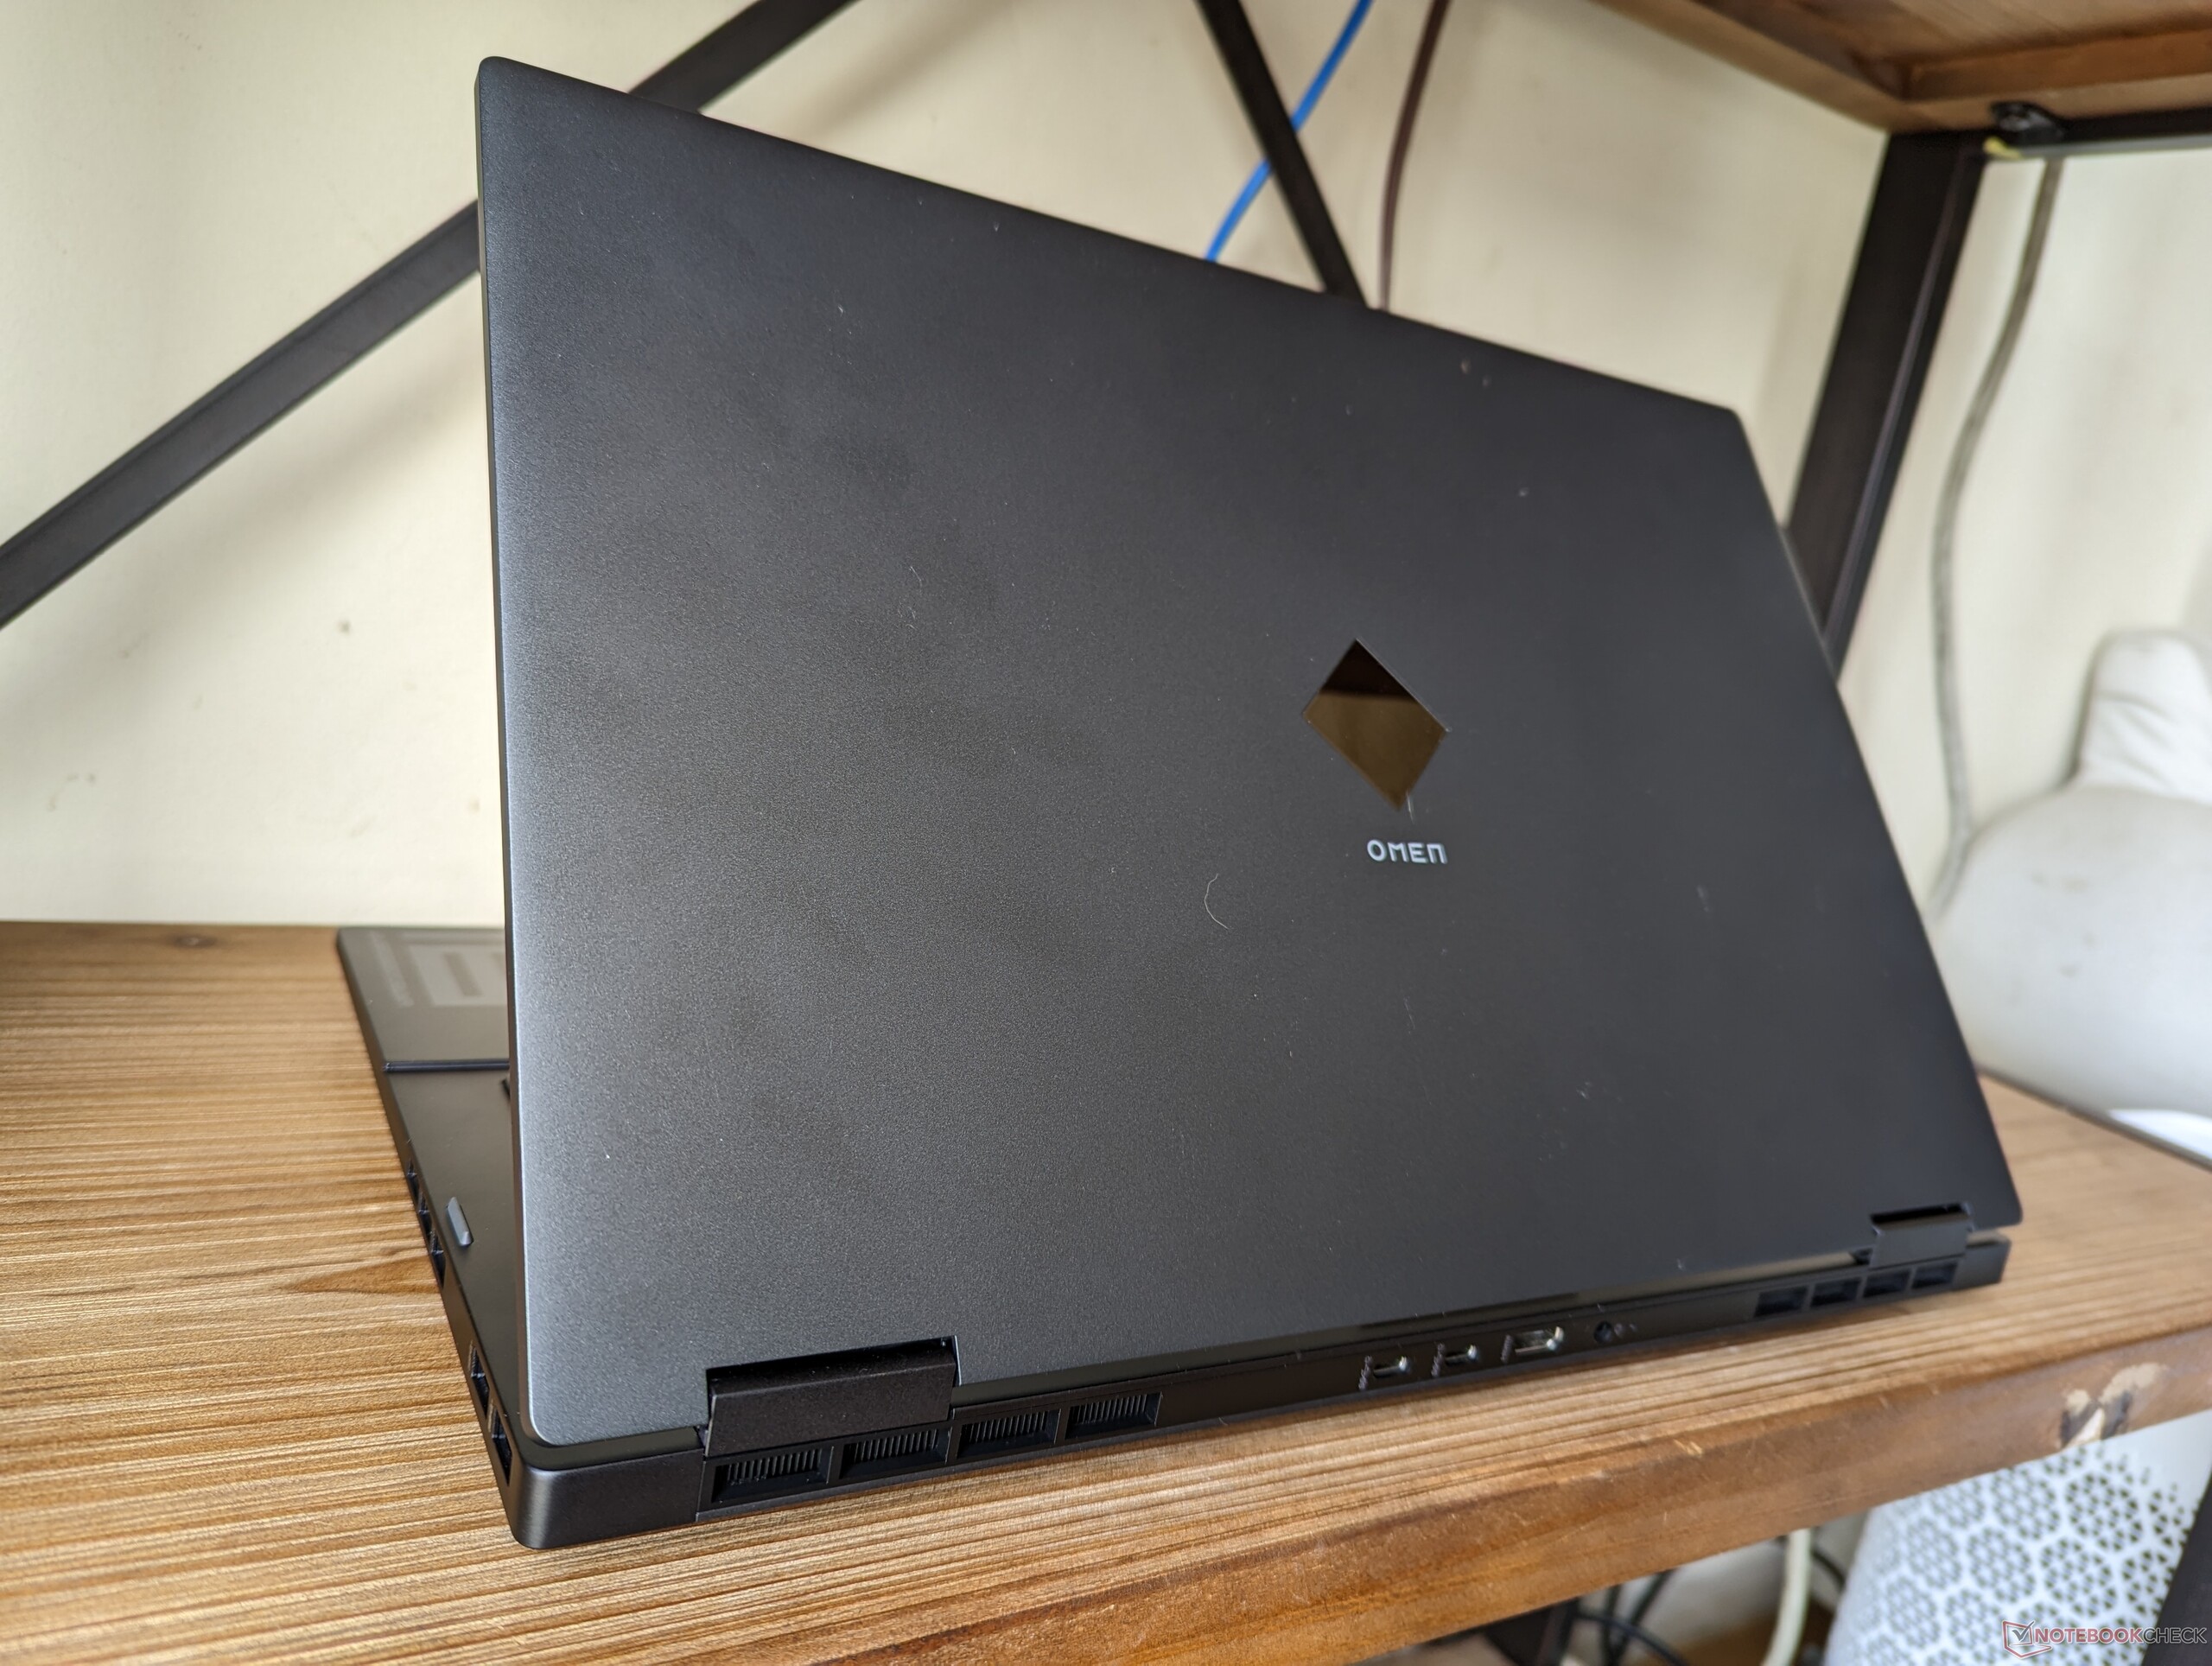
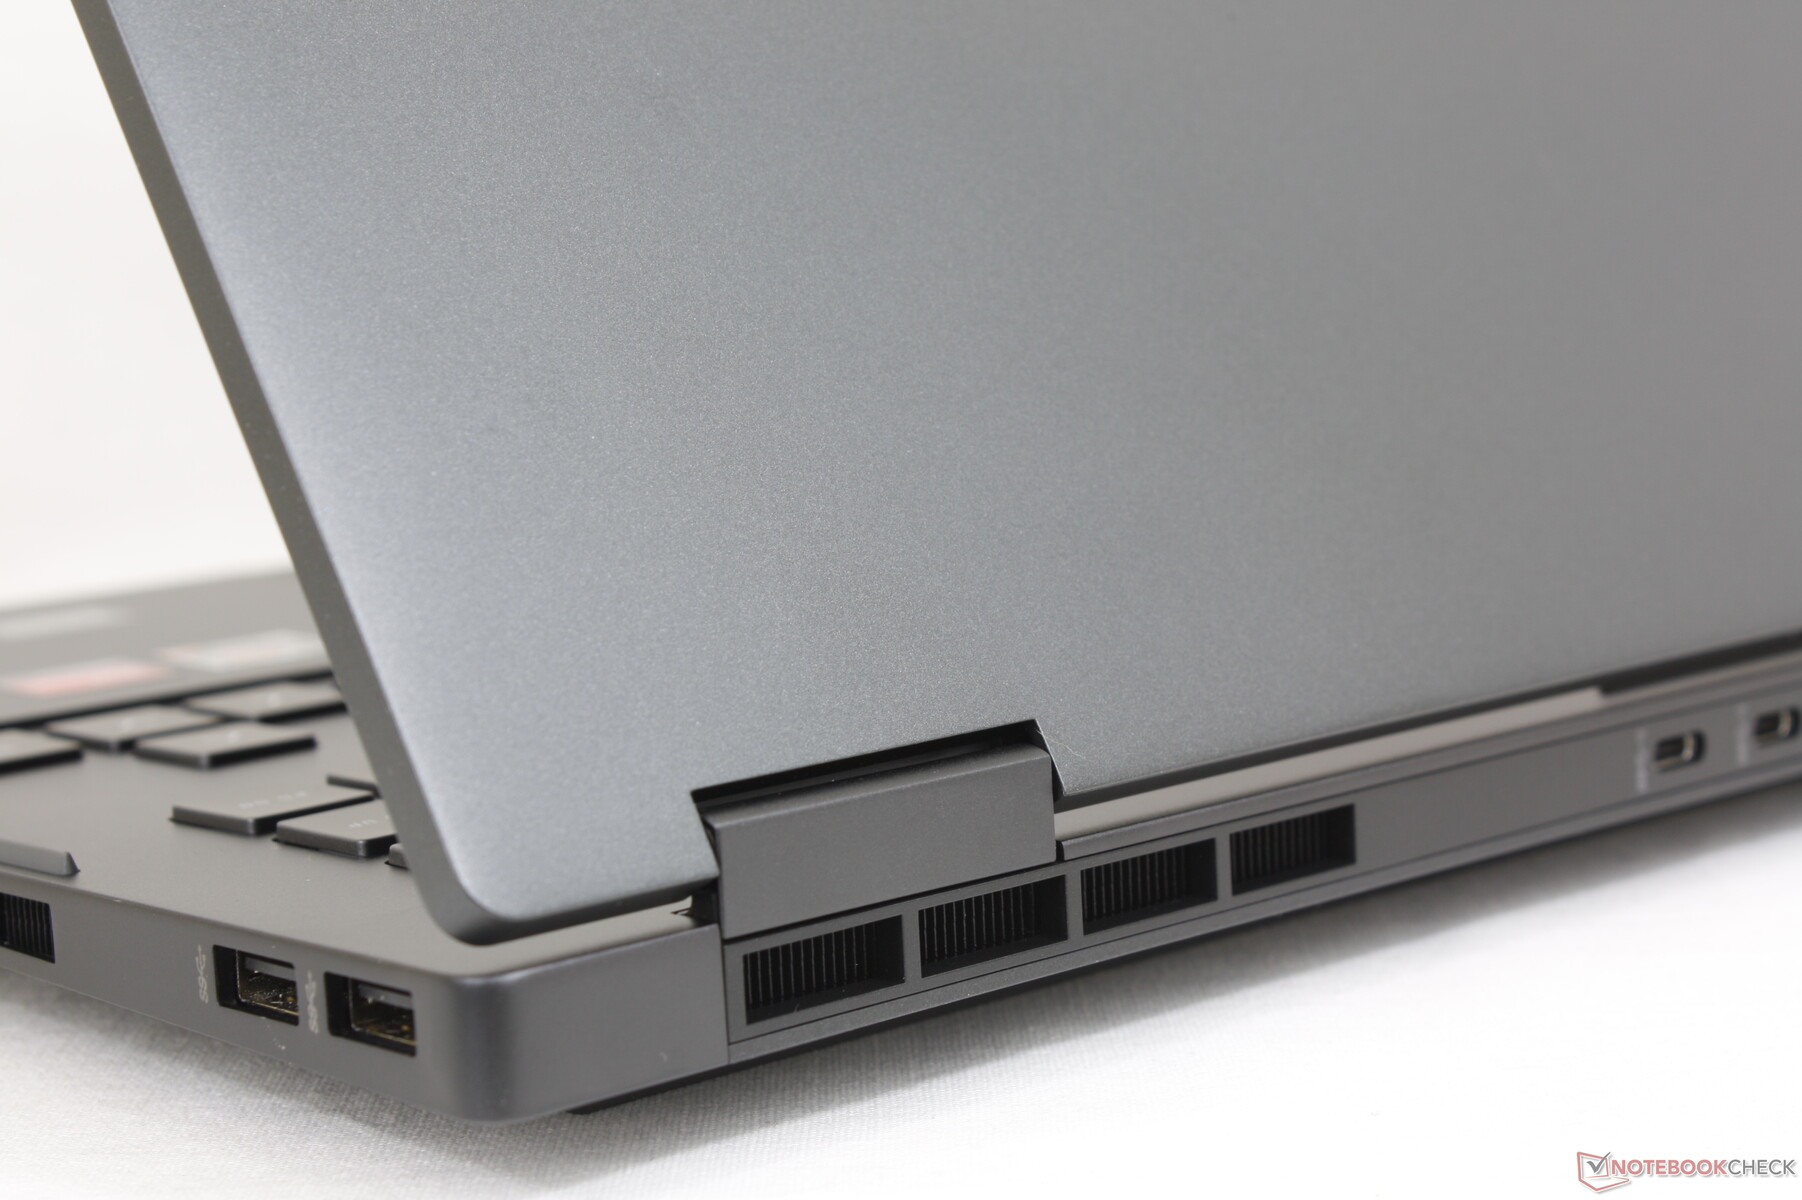
O Omen 16 de 2022 parece quase exatamente como o modelo 2021 da frente, mas os detalhes ao redor da parte de trás e de baixo mudaram. Os portos já não estão mais onde estavam, por exemplo, enquanto os cantos traseiros estão agora mais arredondados do que antes. A ventilação e as grelhas dos alto-falantes também foram redesenhadas e a placa inferior em particular tem um respiro ainda maior
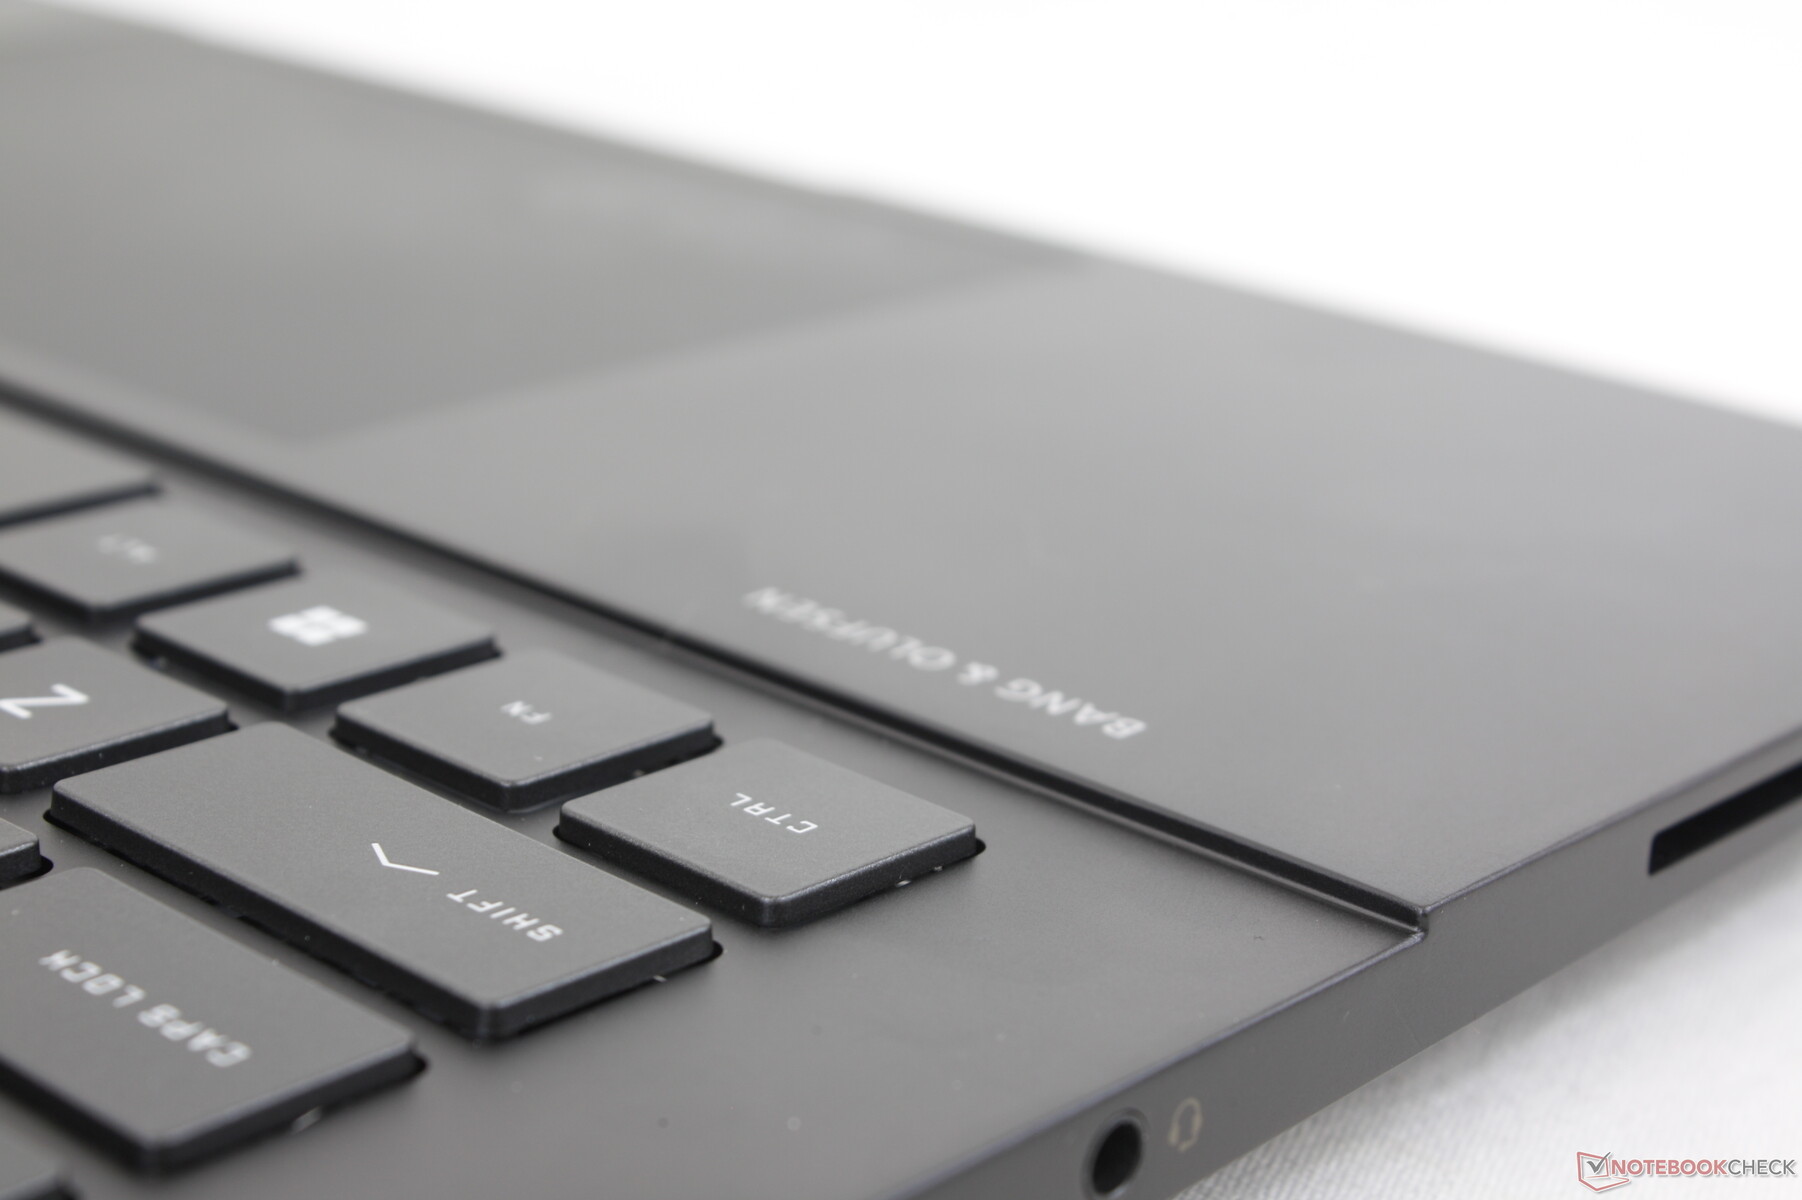
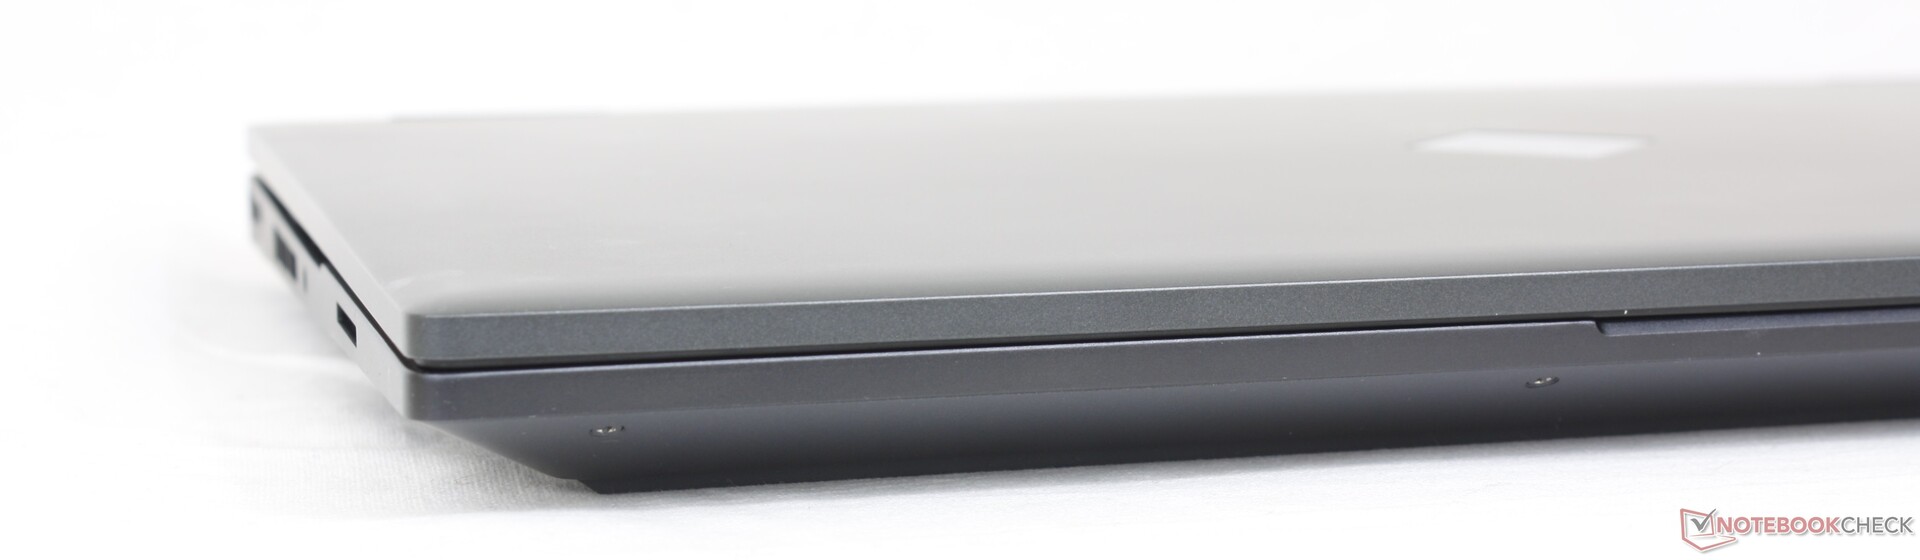
Os materiais do chassi metálico são os mesmos que no modelo do ano passado para uma sensação e impressão semelhante. A base ainda é rígida e quase invejosa, mas a tampa tende a balançar ao ajustar os ângulos. As pequenas dobradiças também são suscetíveis de quebrar quando abertas em seu ângulo máximo. As dobradiças sobre a Dell G16 sentir-se mais forte em comparação.
As dimensões e o peso são quase inalterados em relação ao modelo do ano passado, apesar de todas as atualizações externas. O modelo encontra-se confortavelmente entre o Lenovo mais fino e mais leve Legion S7 16 e o Dell G16 mais grosso e mais pesado. O Asus Zephyrus M16 é significativamente mais leve por meio quilograma se os usuários quiserem um laptop de 16 polegadas mais portátil para jogos.
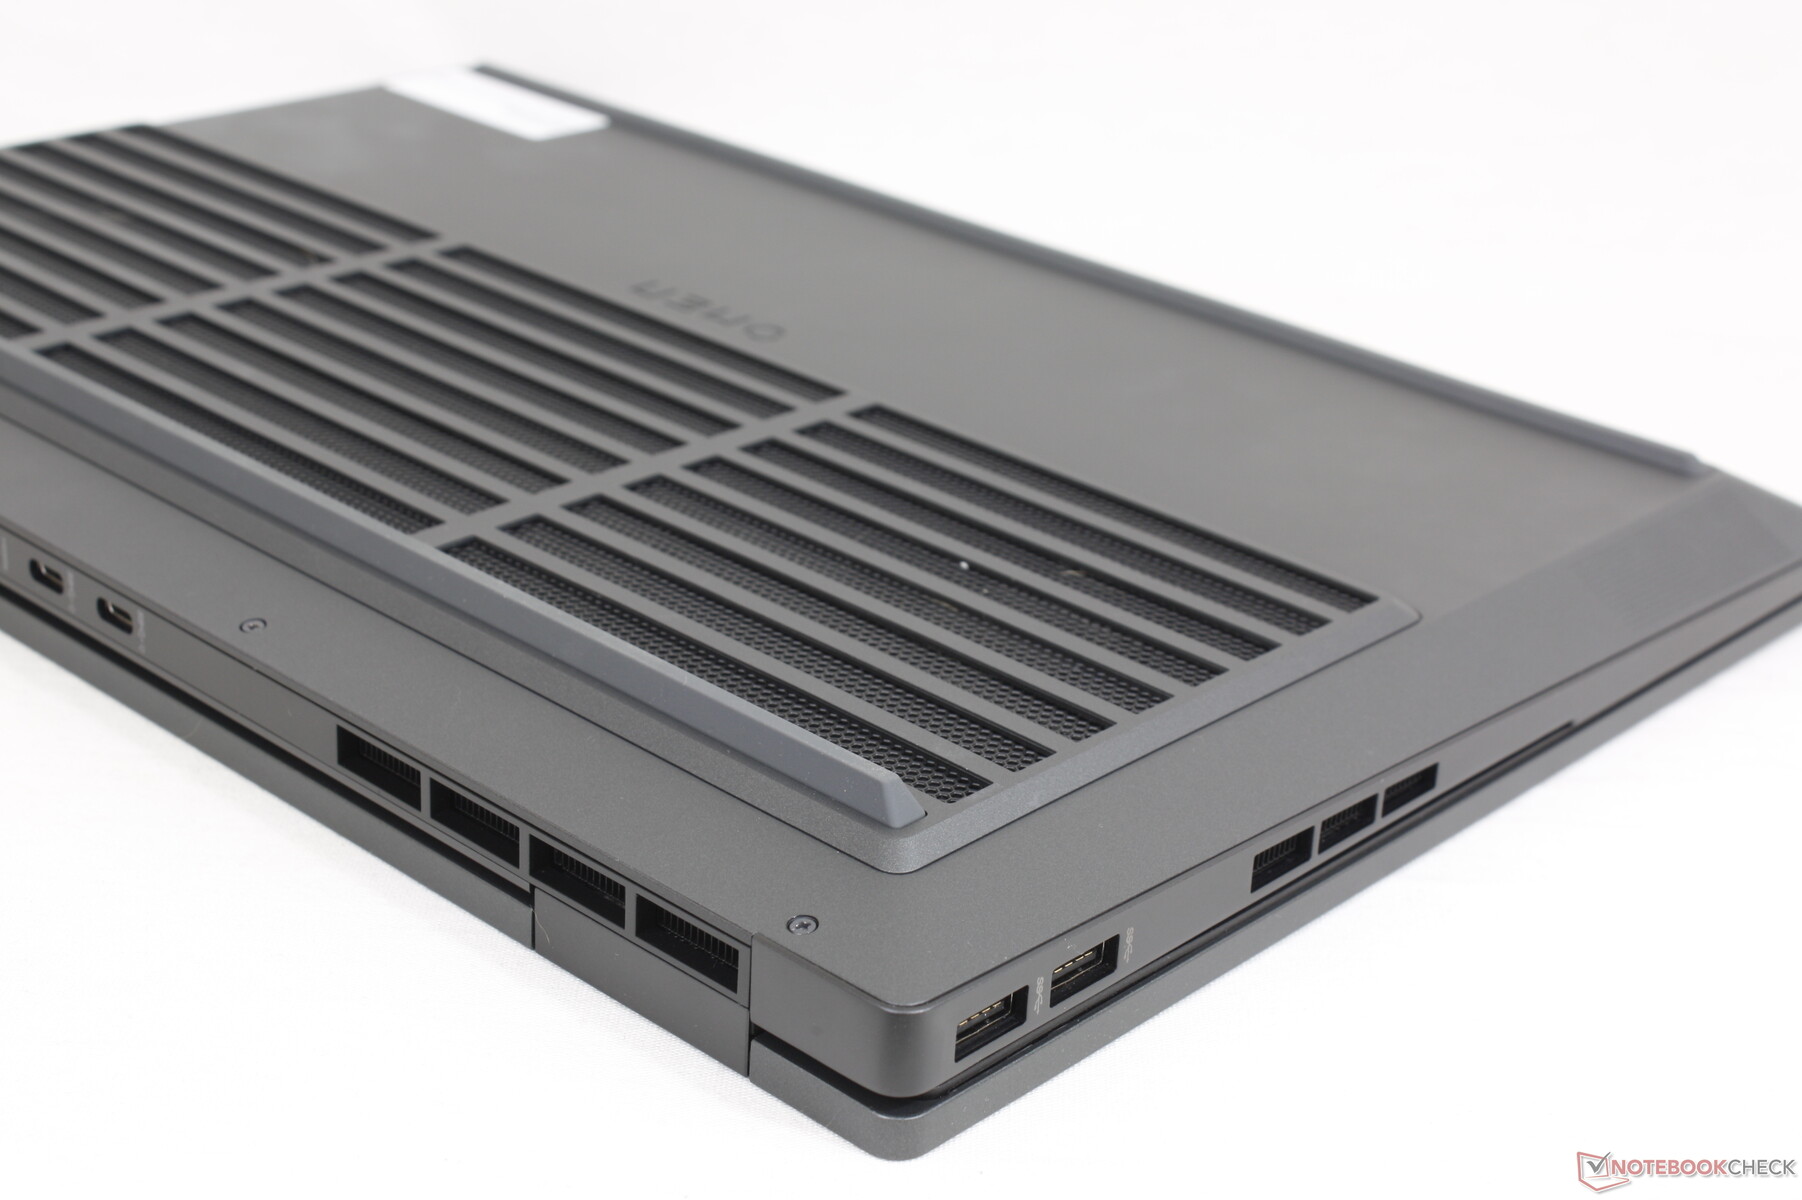
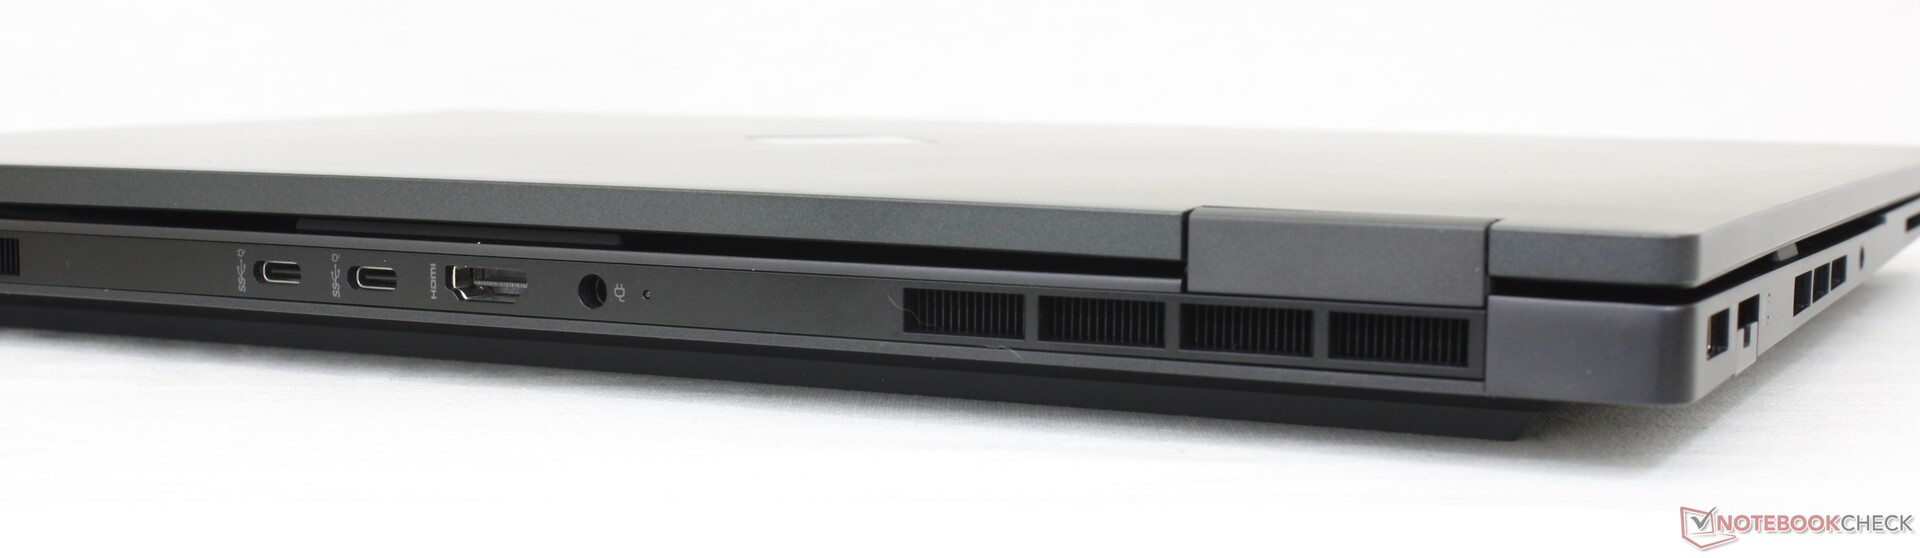
Conectividade - Sem suporte de relâmpagos
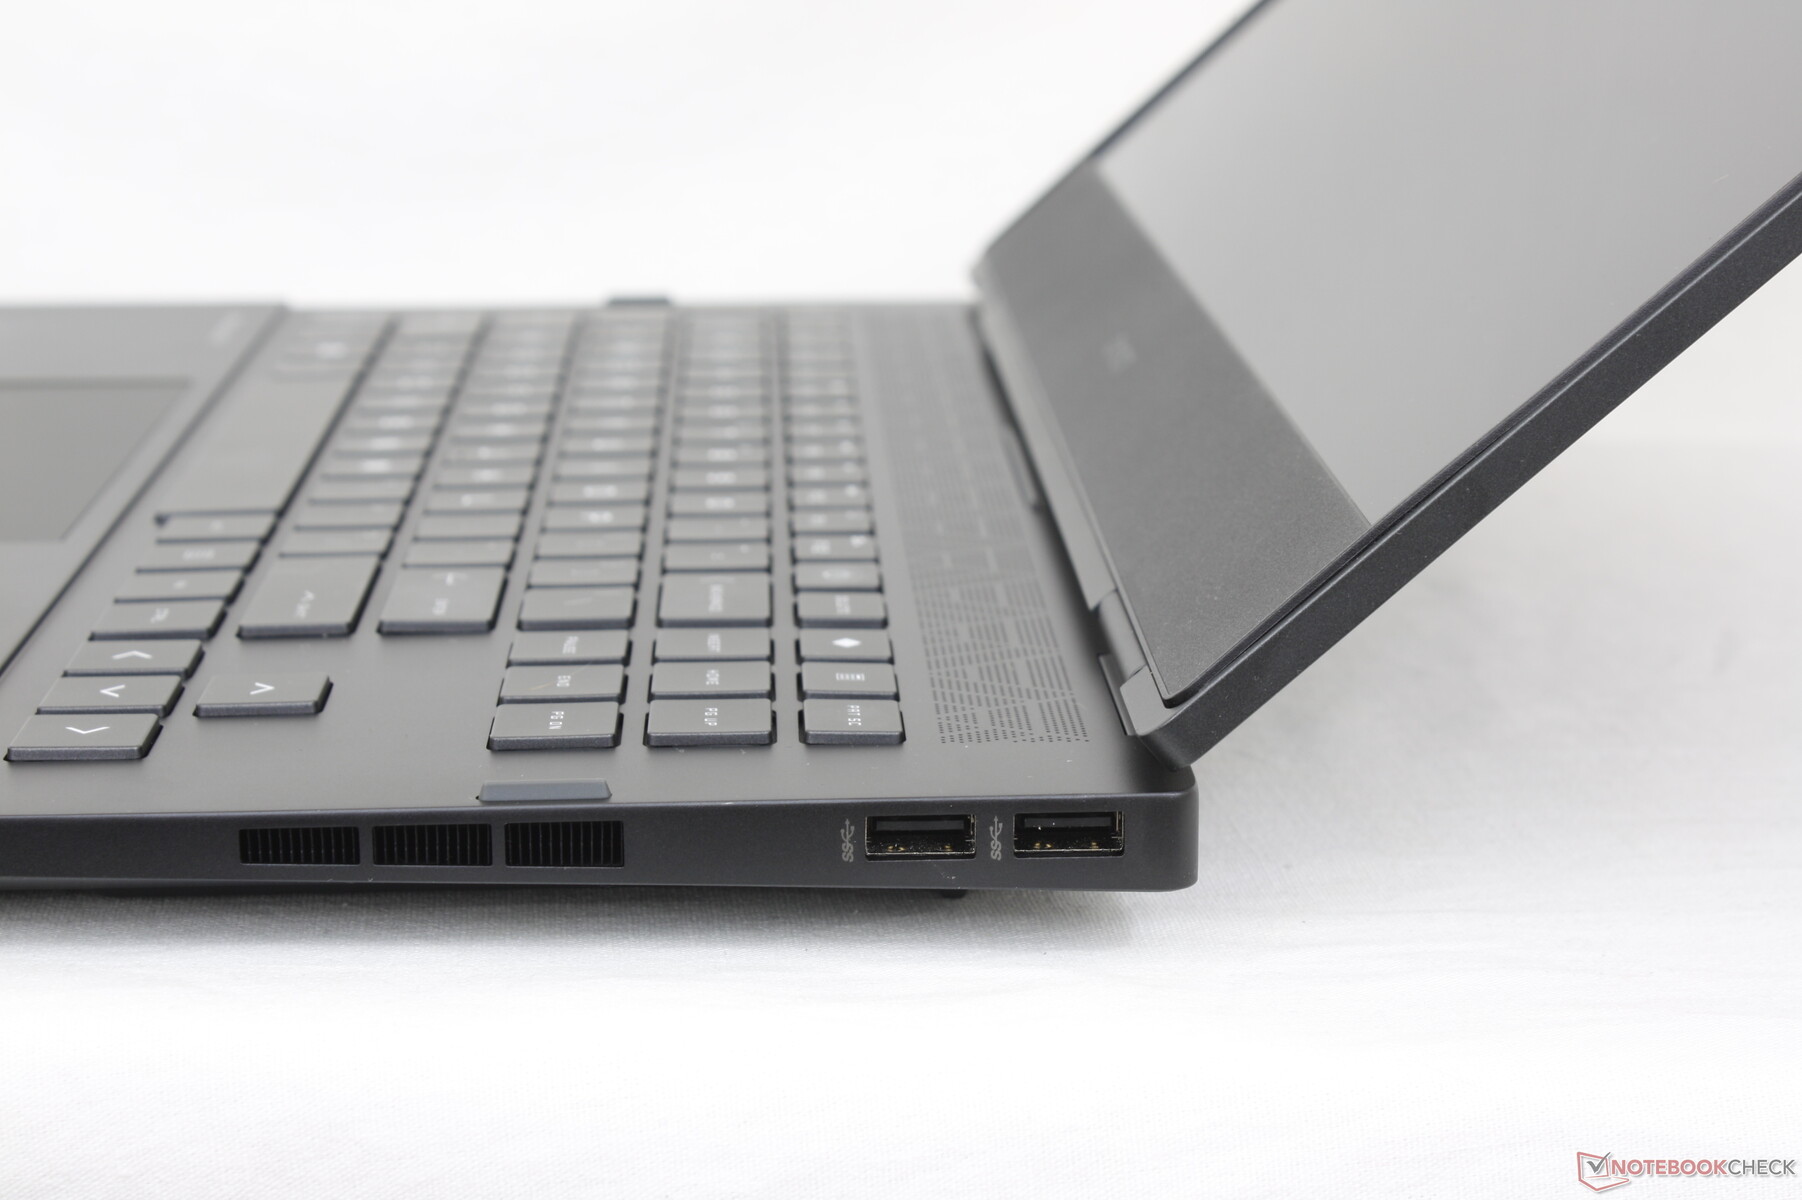
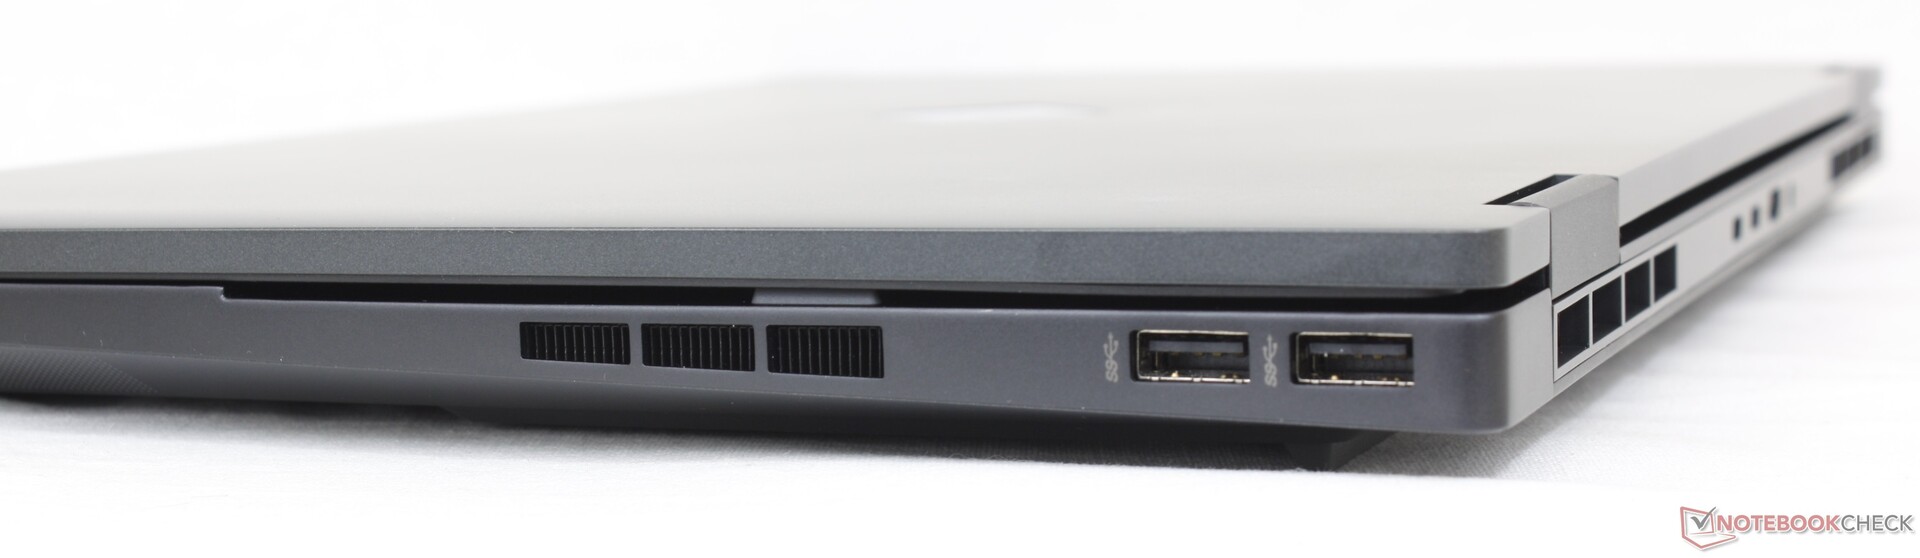
O modelo deste ano trocou o mini-DisplayPort em favor de uma segunda porta USB-C quando comparado com o modelo 2021. As opções de porta são, de outra forma, essencialmente as mesmas entre os dois modelos
A mudança de ano para ano mais notória envolve o posicionamento das portas. As portas do modelo do ano passado estavam muito lotadas ao longo da borda esquerda e por isso algumas foram reatribuídas à borda traseira em seu lugar. Embora não seja particularmente ideal, isto ainda é preferível a ter menos portas ao todo.
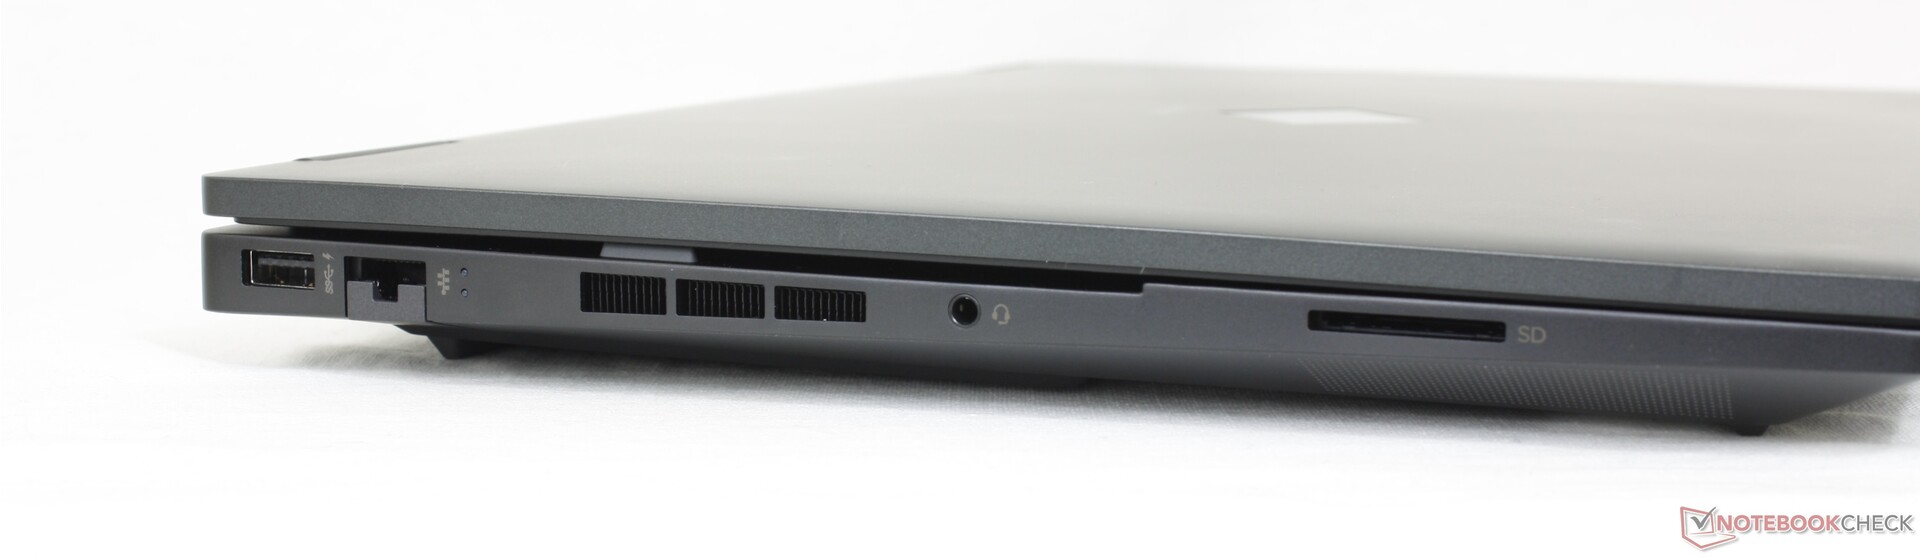
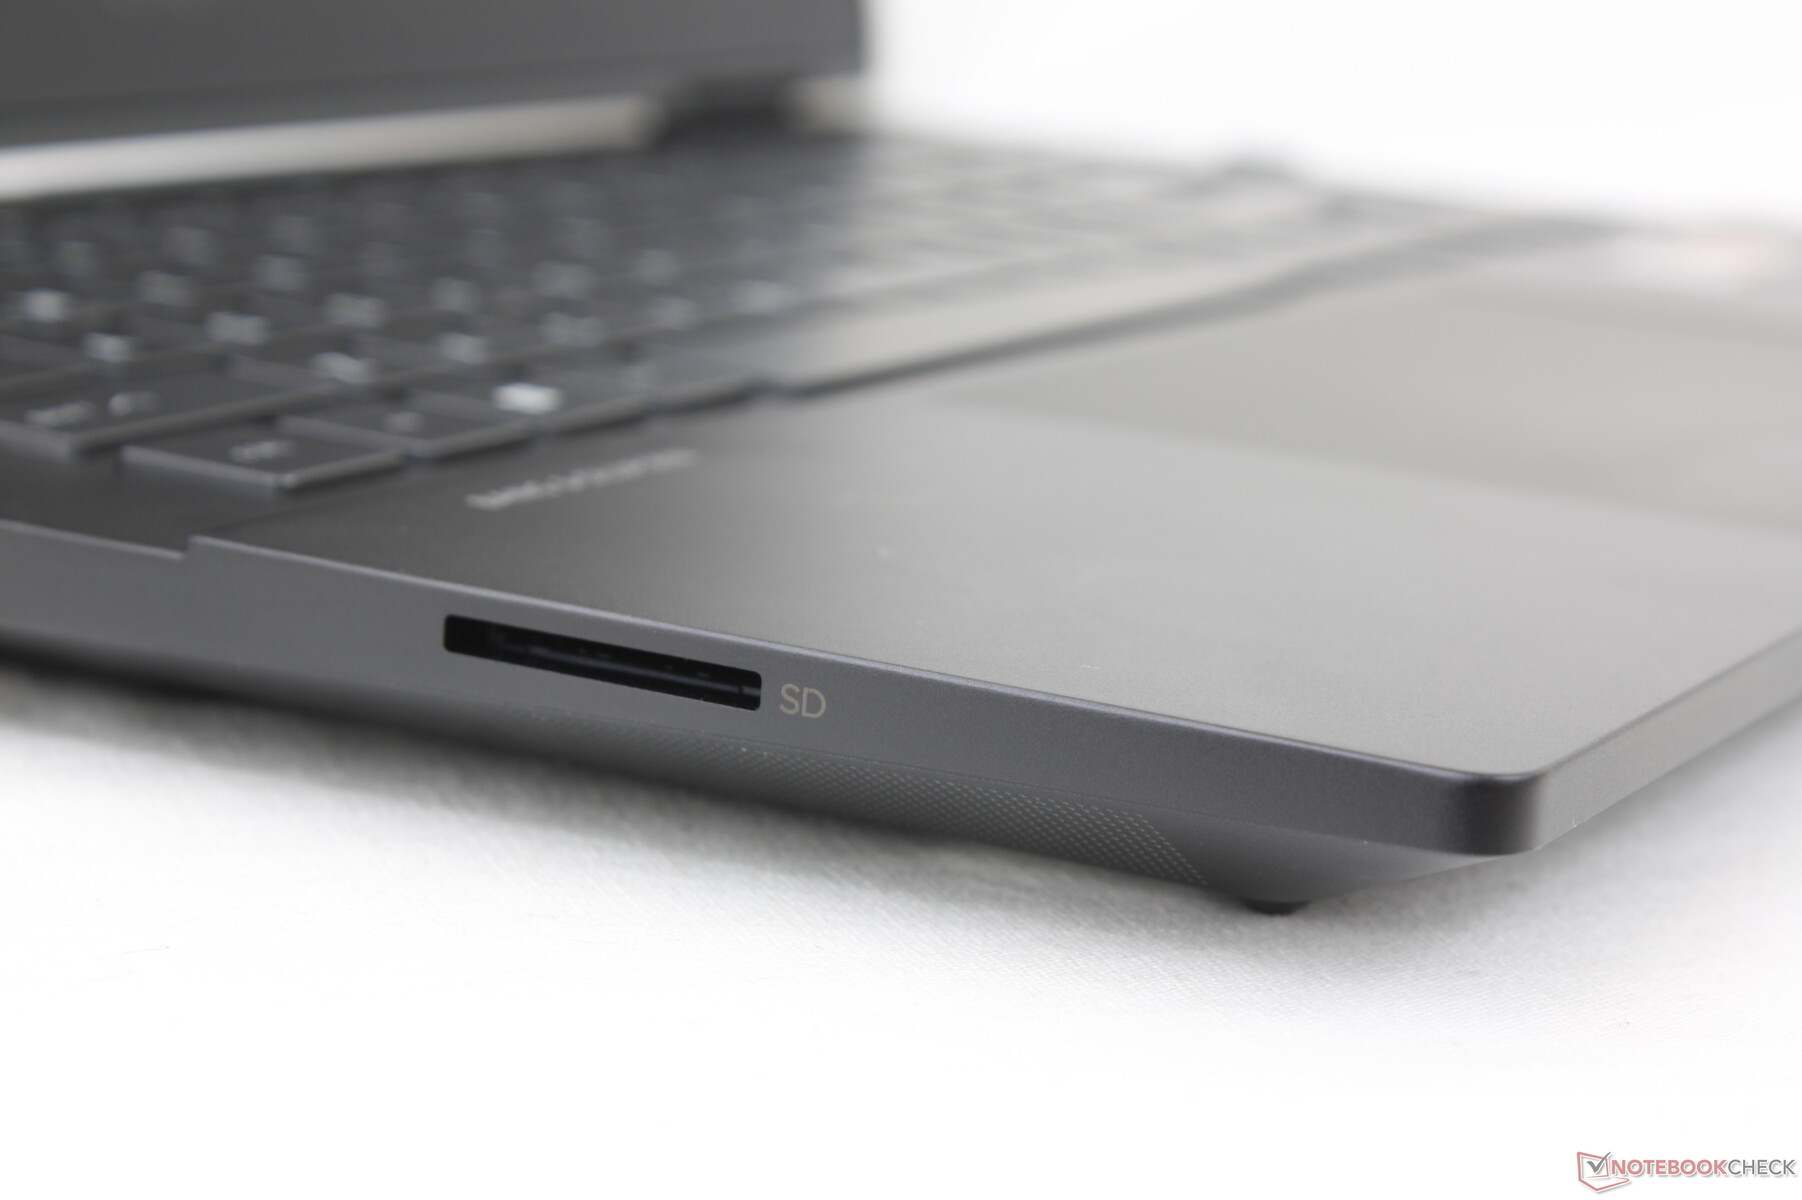
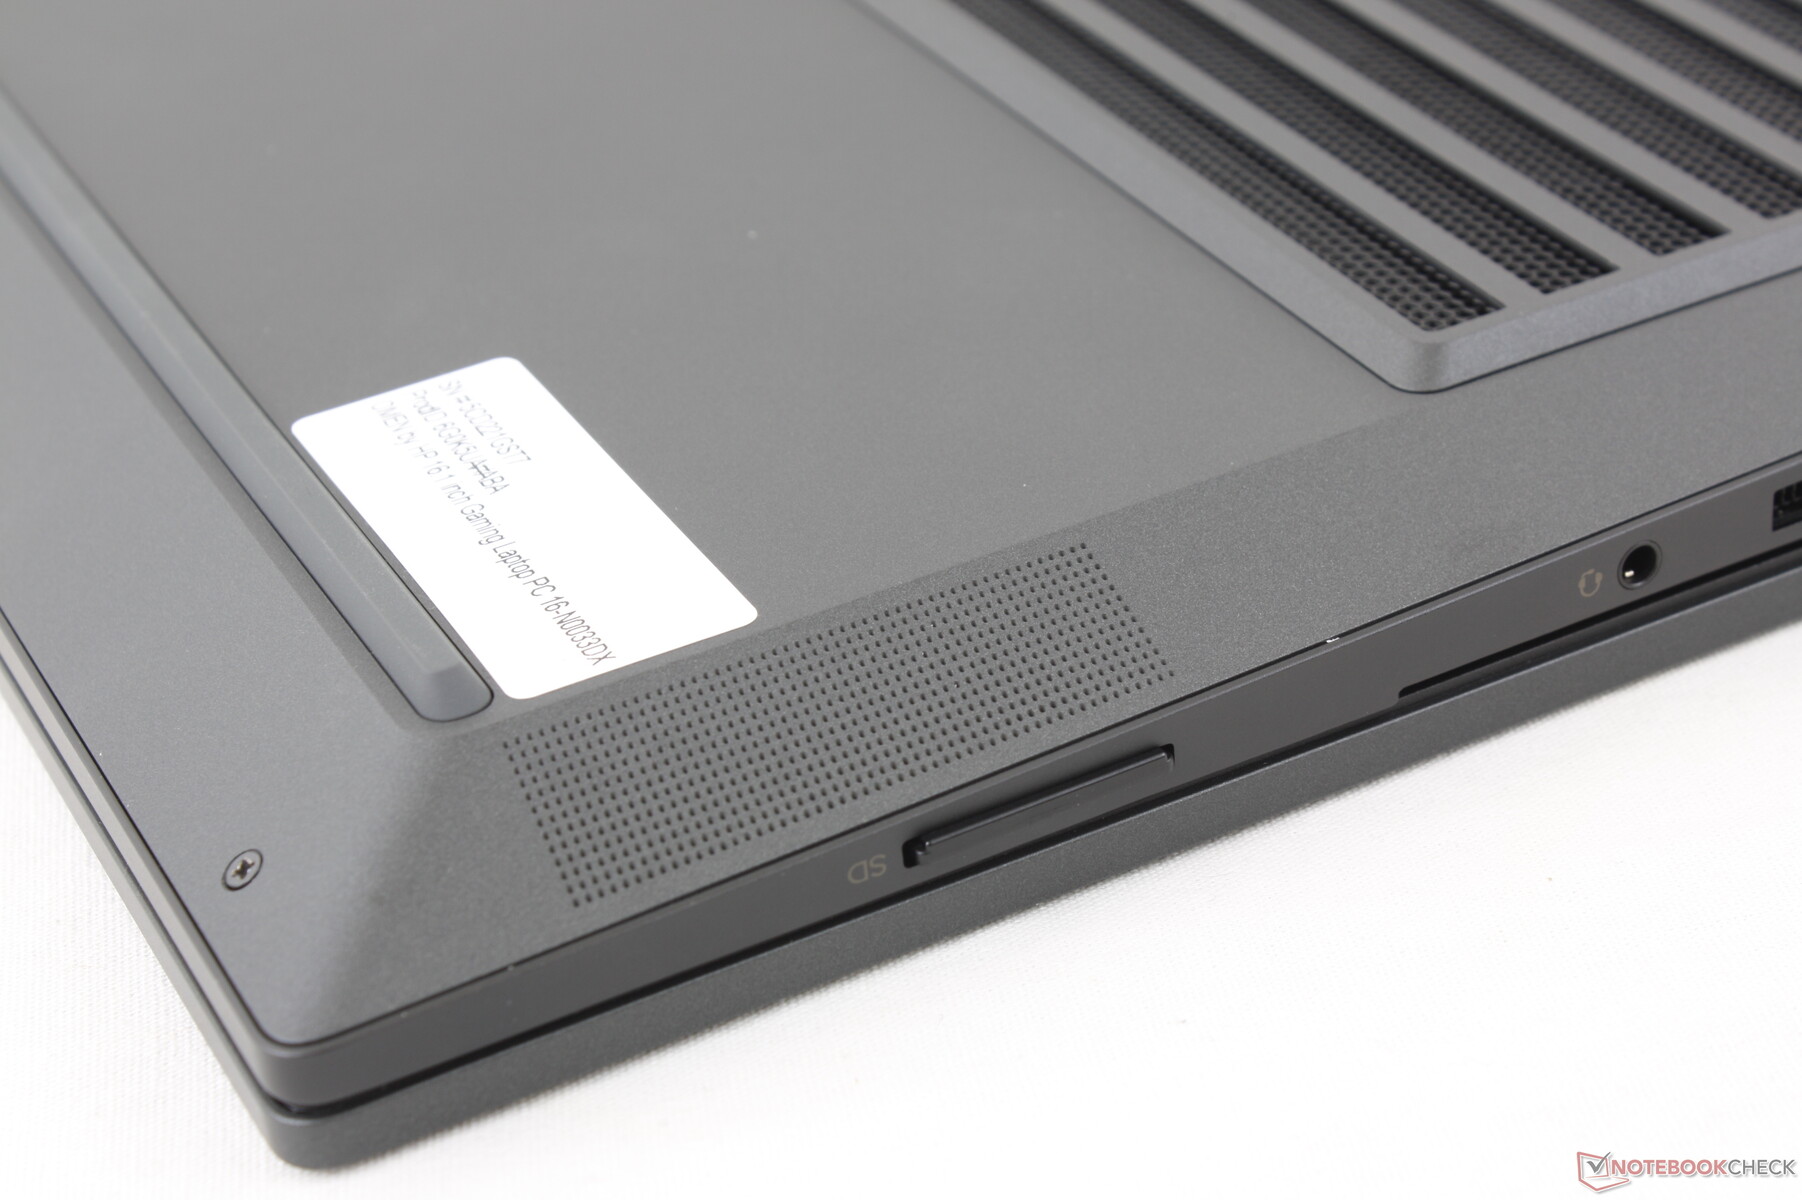
Leitor de cartões SD
As taxas de transferência com o leitor SD permanecem inalteradas em relação ao modelo do ano passado. Muitos laptops de jogos concorrentes, como o Dell G16, omitem completamente o leitor de cartões. Enquanto isso, o leitor SD no Lâmina Razer 15 oferece 2x o desempenho.
| SD Card Reader | |
| average JPG Copy Test (av. of 3 runs) | |
| Lenovo Legion S7 16ARHA7 (AV PRO microSD 128 GB V60) | |
| HP Omen 16-n0033dx (AV PRO microSD 128 GB V60) | |
| HP Victus 16-e0145ng (AV PRO microSD 128 GB V60) | |
| HP Envy 16 h0112nr (AV Pro SD microSD 128 GB V60) | |
| HP Omen 16-b1090ng (AV PRO microSD 128 GB V60) | |
| maximum AS SSD Seq Read Test (1GB) | |
| Lenovo Legion S7 16ARHA7 (AV PRO microSD 128 GB V60) | |
| HP Omen 16-n0033dx (AV PRO microSD 128 GB V60) | |
| HP Envy 16 h0112nr (AV Pro SD microSD 128 GB V60) | |
Comunicação
Um MediaTek MT7922 vem como padrão para conectividade Wi-Fi 6E e Bluetooth 5.2. A maioria dos outros laptops para jogos são fornecidos com a série Intel AX201/210, mas a solução MediaTek é provavelmente a opção mais acessível. As taxas de transferência são excelentes e sem problemas de desempenho quando conectadas à nossa rede de 6 GHz.
| Networking | |
| iperf3 receive AXE11000 6GHz | |
| Lenovo Legion S7 16ARHA7 | |
| HP Omen 16-n0033dx | |
| HP Envy 16 h0112nr | |
| iperf3 receive AXE11000 | |
| HP Omen 16-n0033dx | |
| Dell G16 7620 | |
| HP Omen 16-b1090ng | |
| HP Victus 16-e0145ng | |
| iperf3 transmit AXE11000 | |
| HP Omen 16-n0033dx | |
| HP Omen 16-b1090ng | |
| Dell G16 7620 | |
| HP Victus 16-e0145ng | |
| iperf3 transmit AXE11000 6GHz | |
| Lenovo Legion S7 16ARHA7 | |
| HP Omen 16-n0033dx | |
| HP Envy 16 h0112nr | |
Webcam
A webcam é decepcionante com apenas 720p ou 1 MP, enquanto outros laptops como o Razer Blade 15 têm webcams de 1080p ou 2 MP. Além disso, ao modelo falta tanto um obturador de webcam quanto um sensor IR.


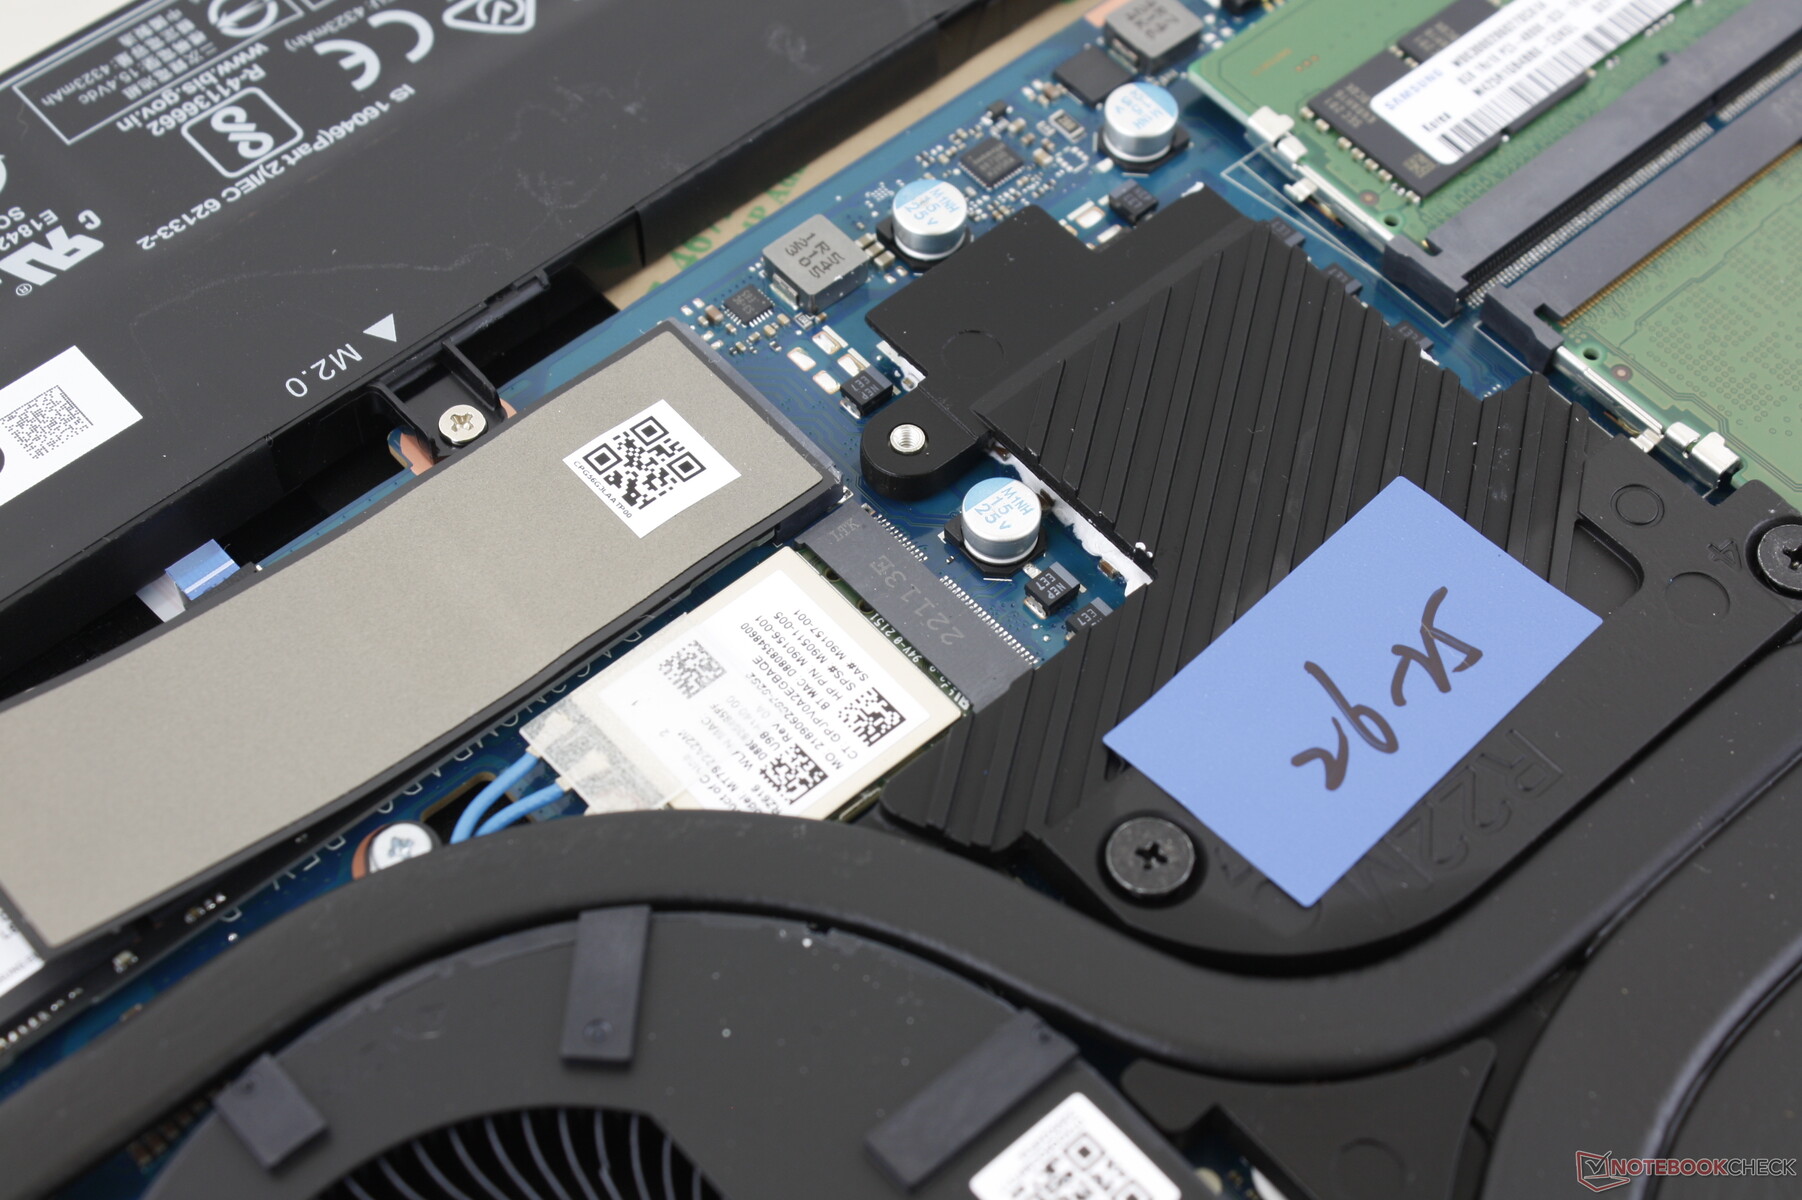
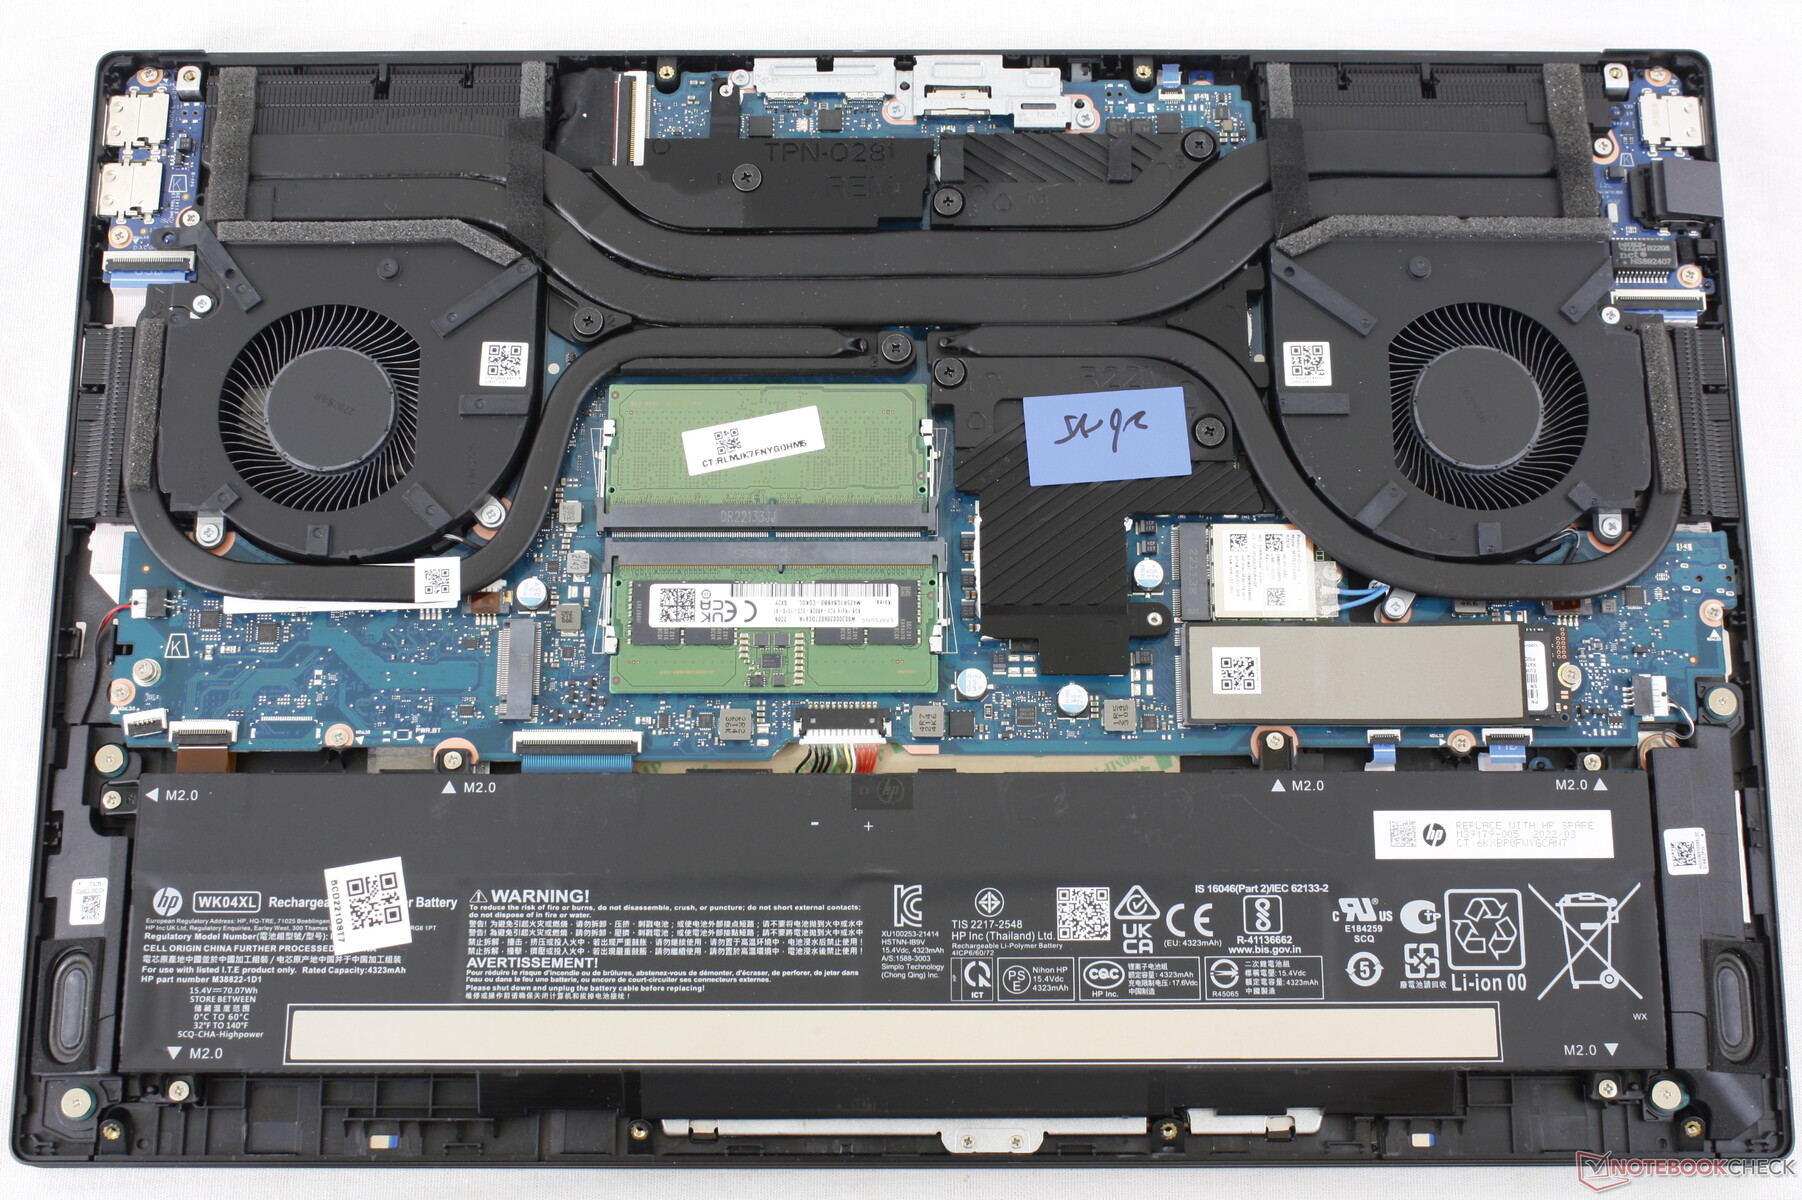
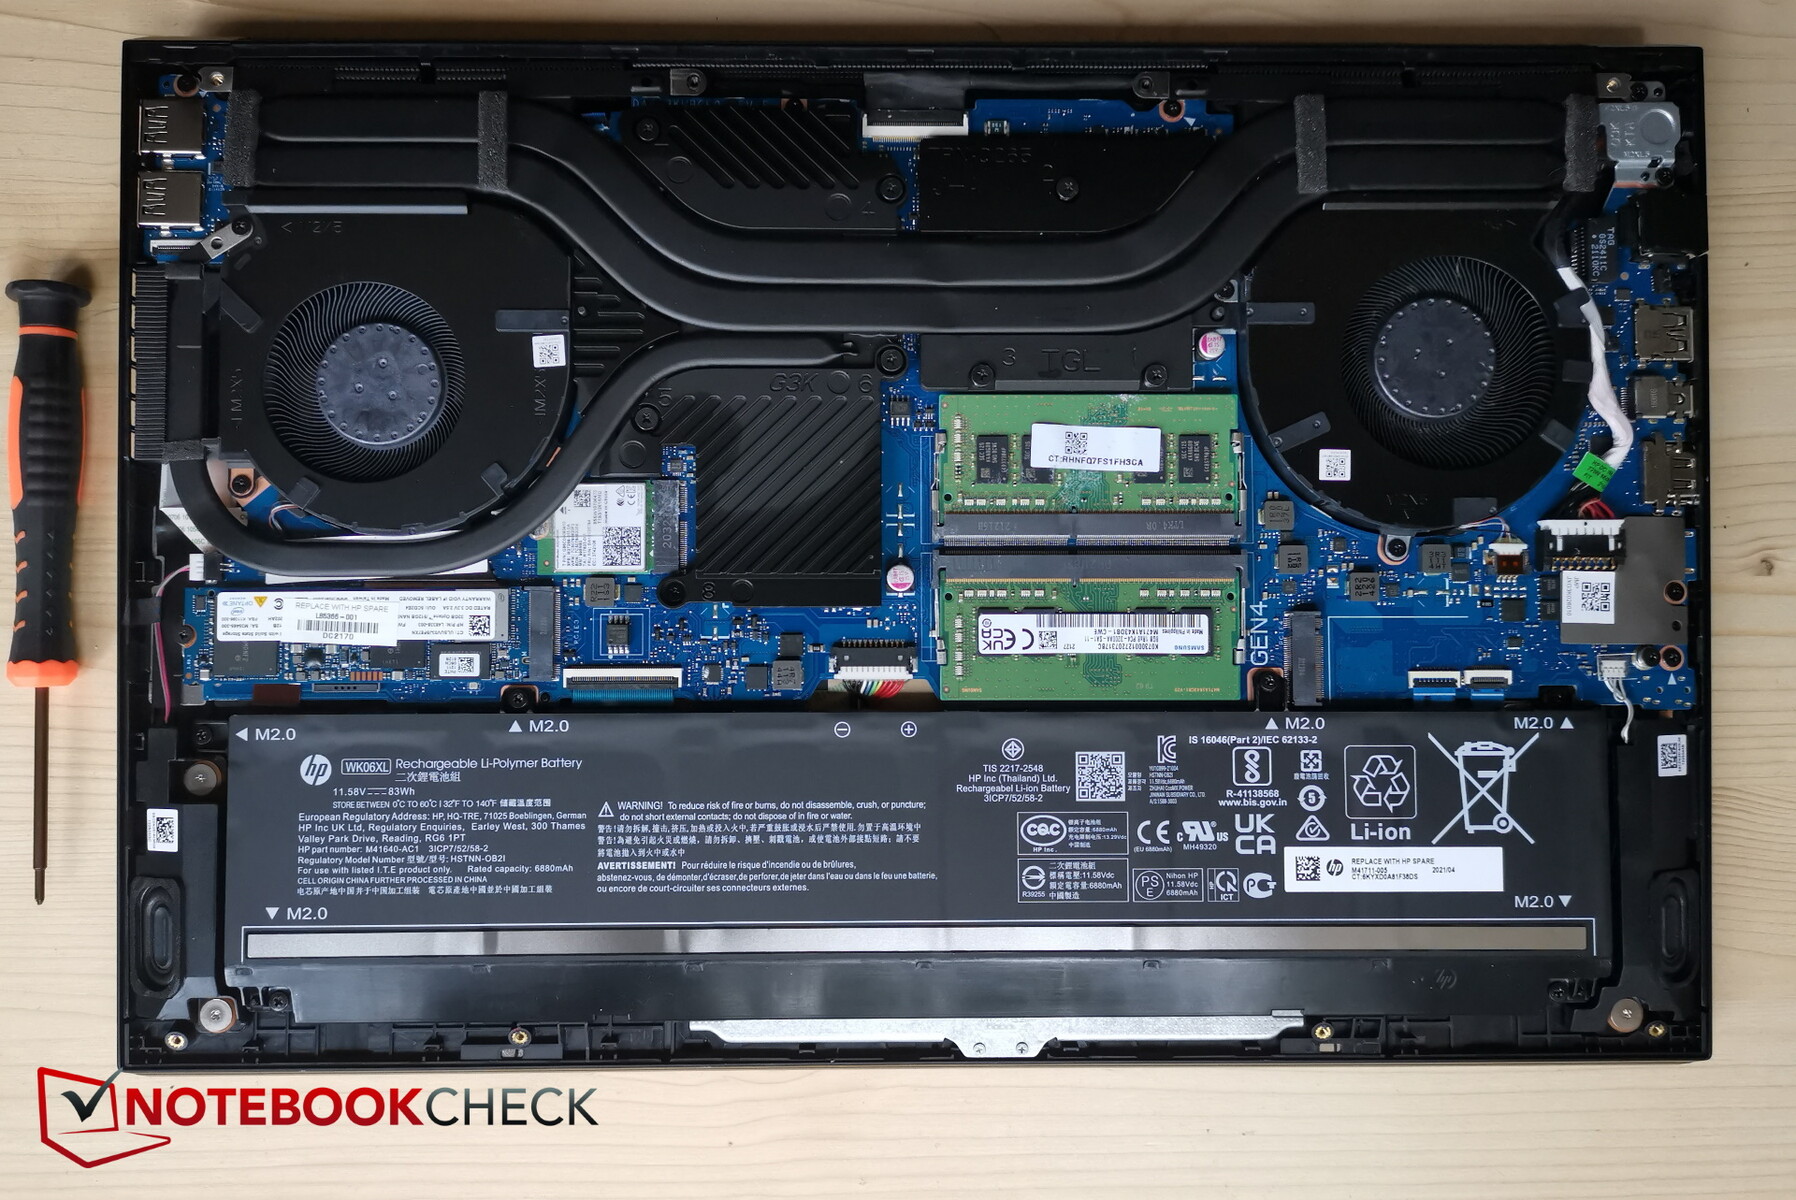
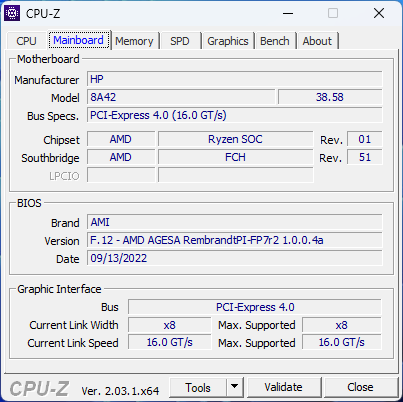
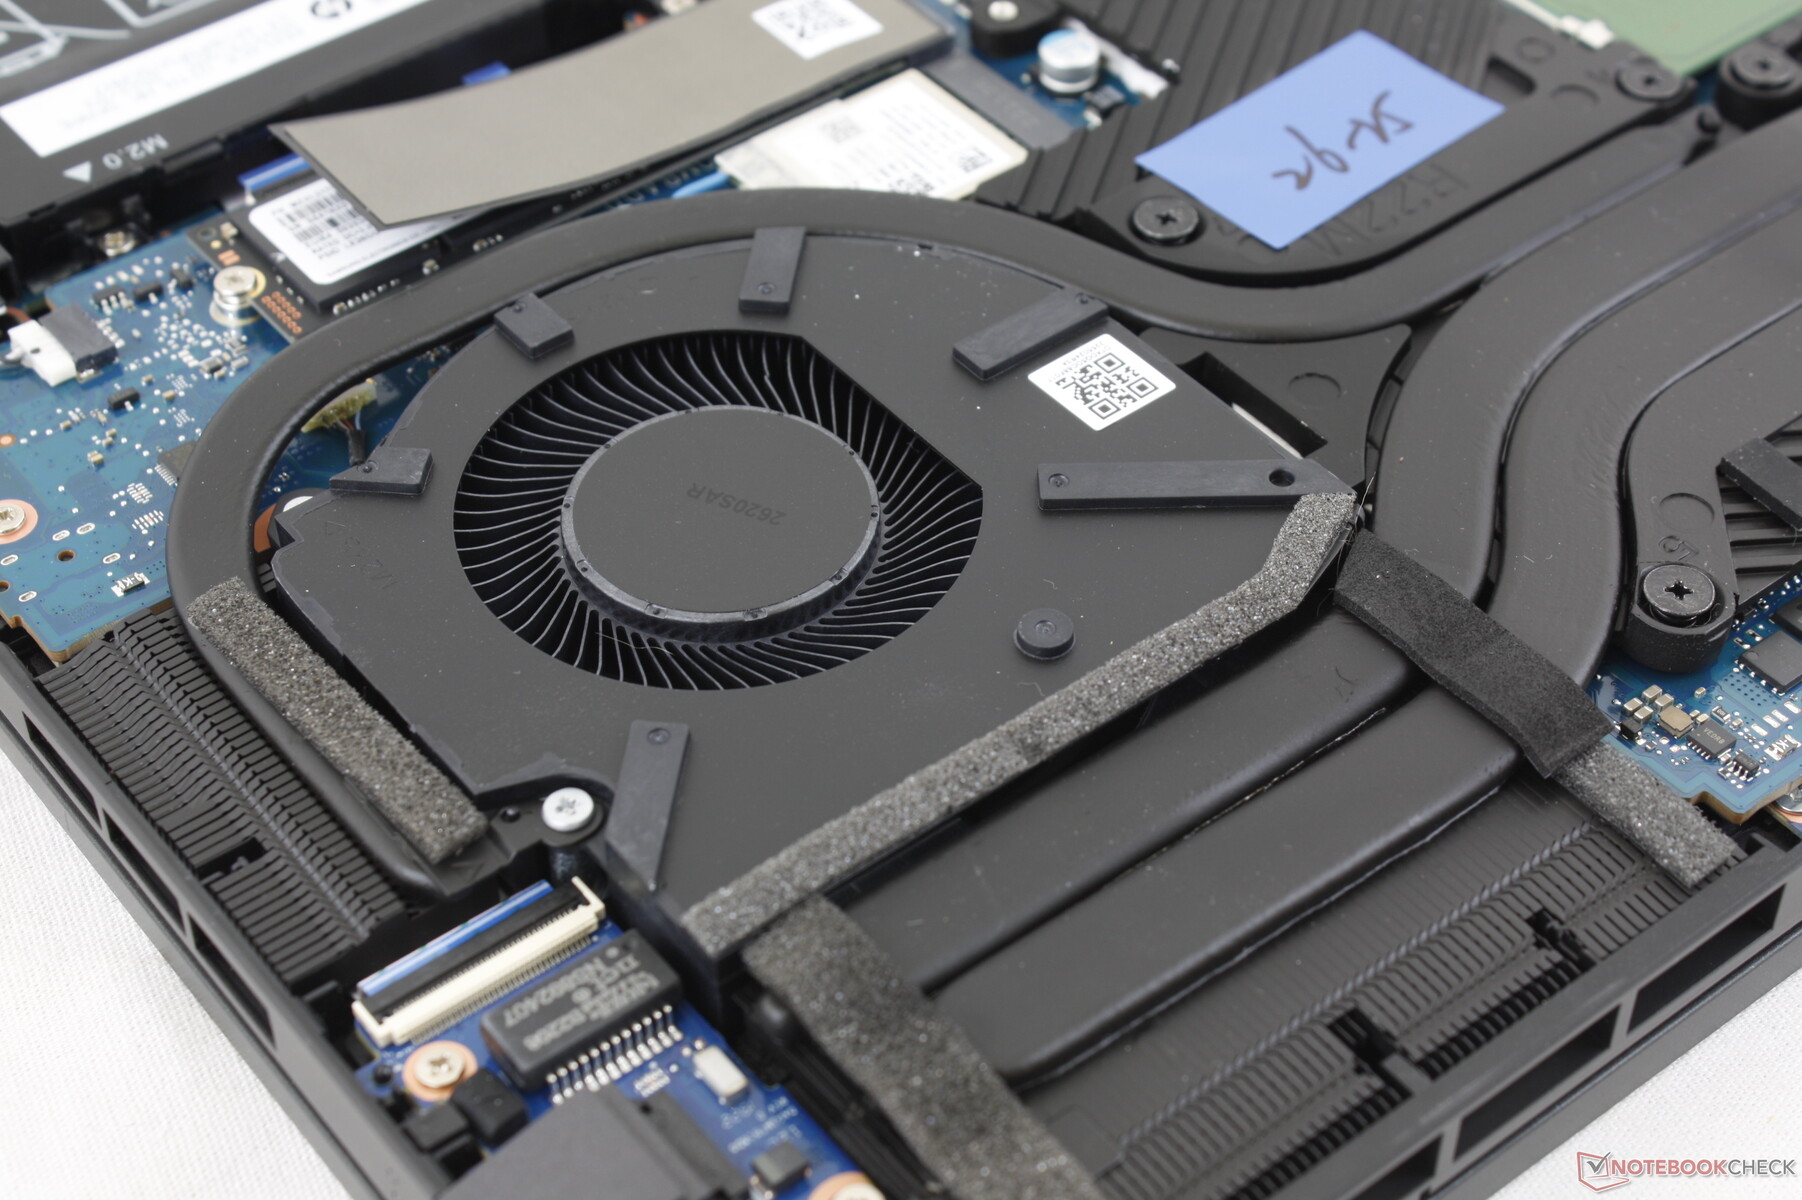
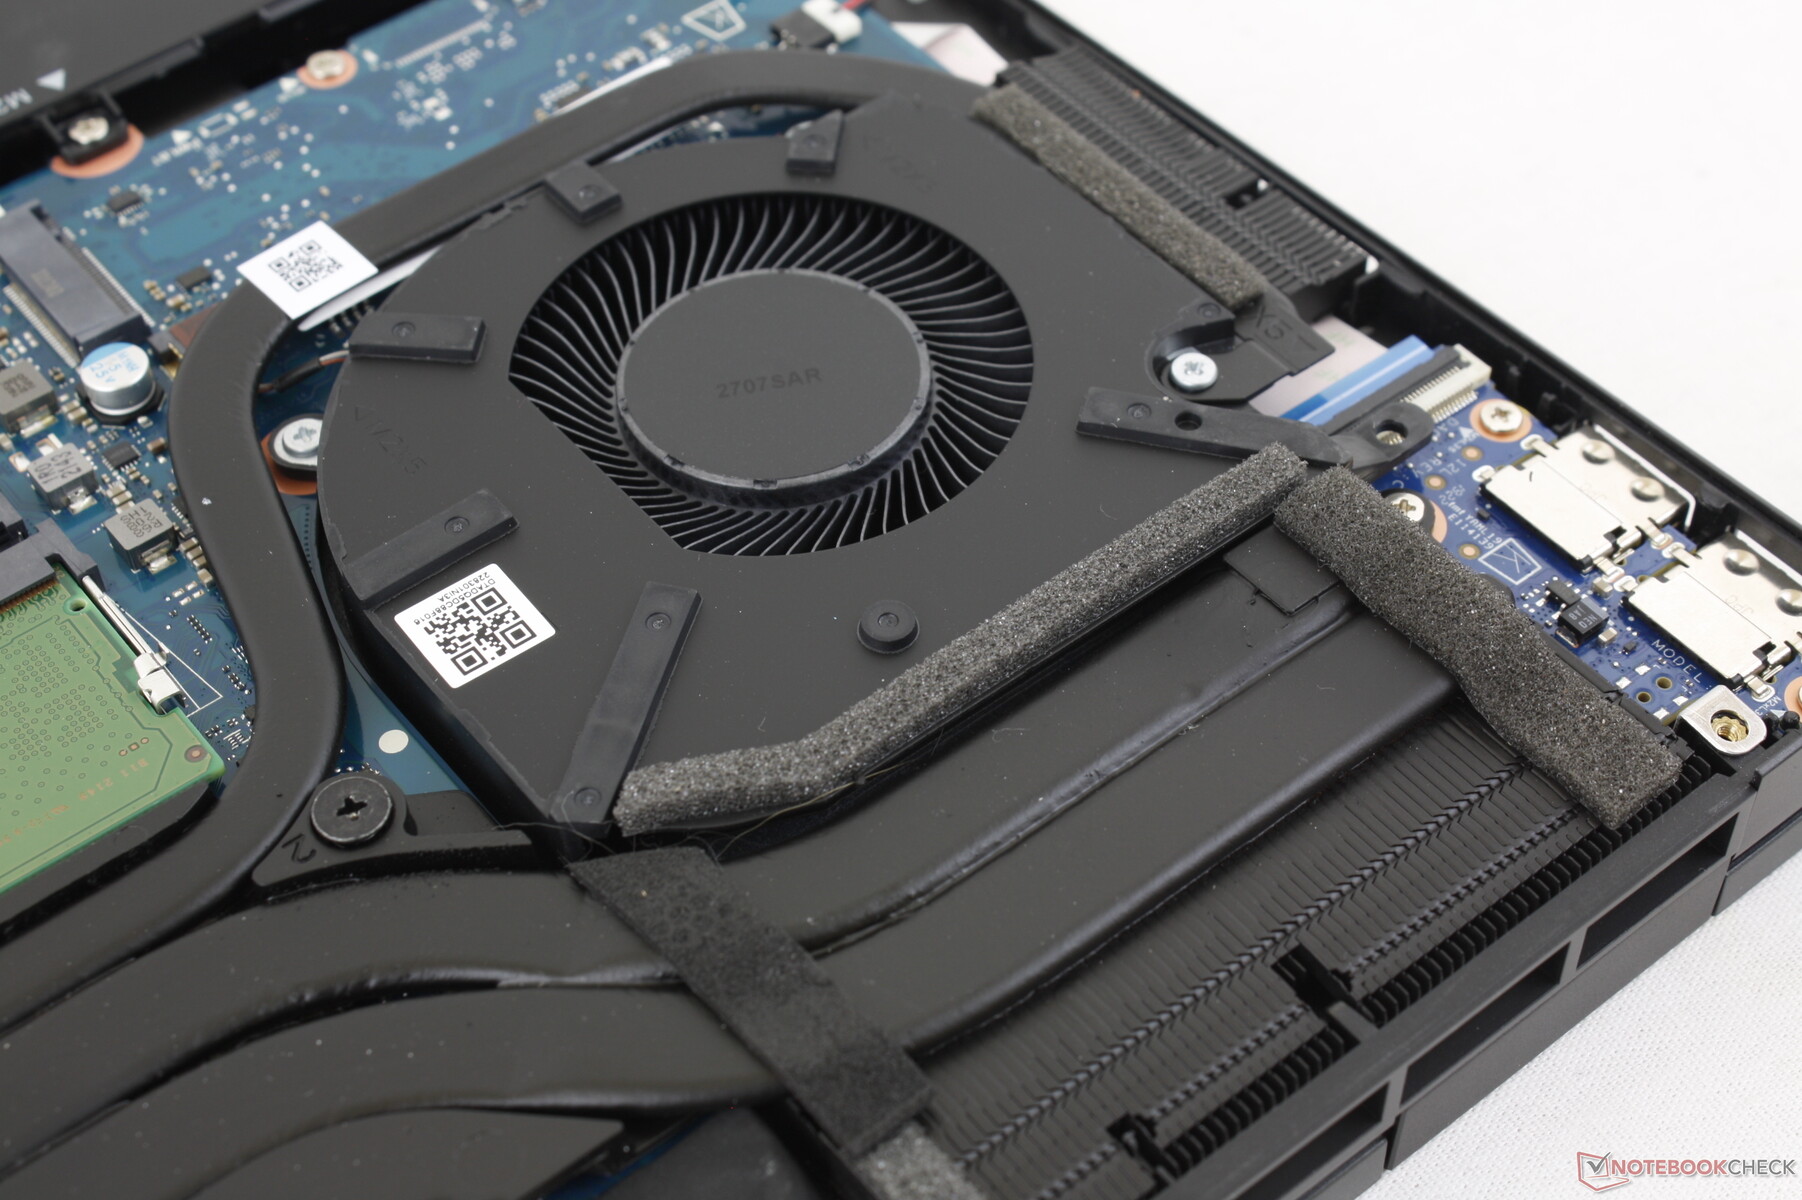
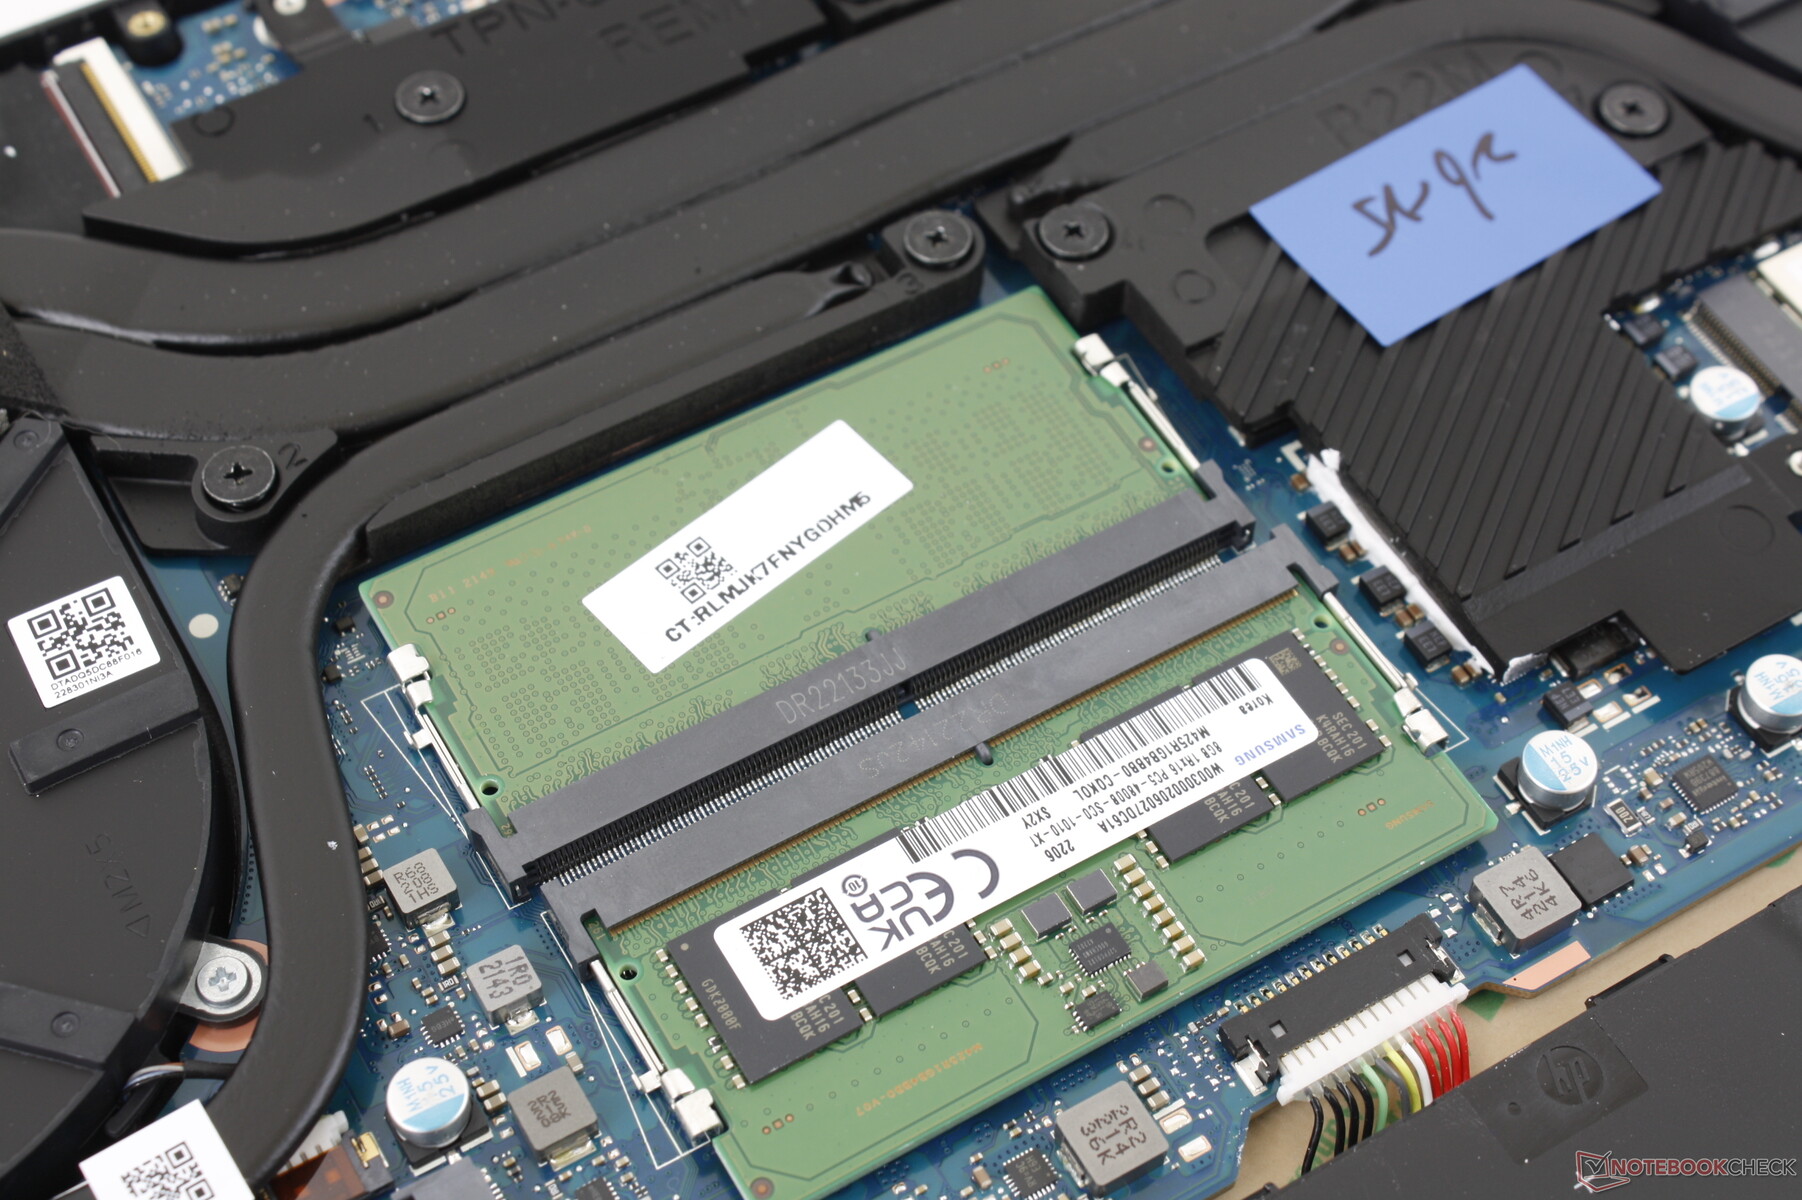
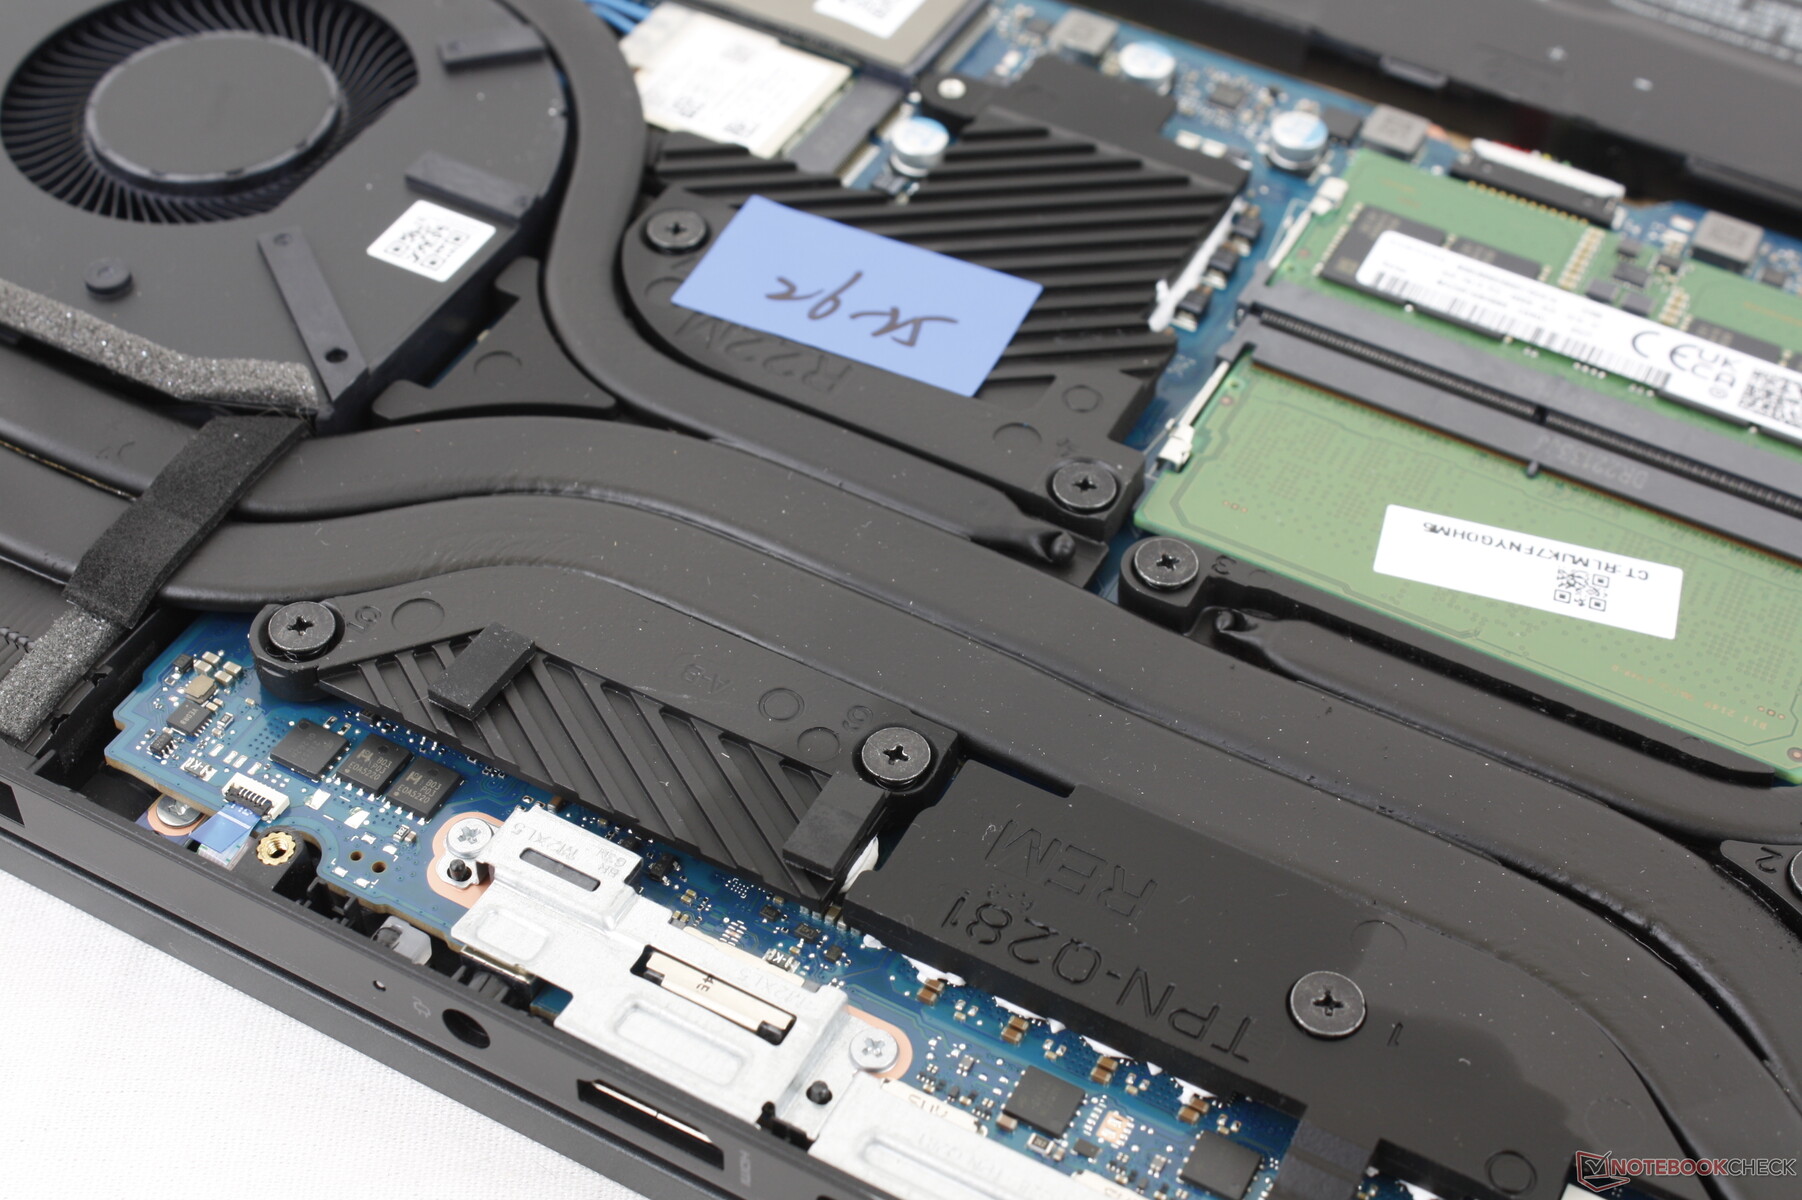
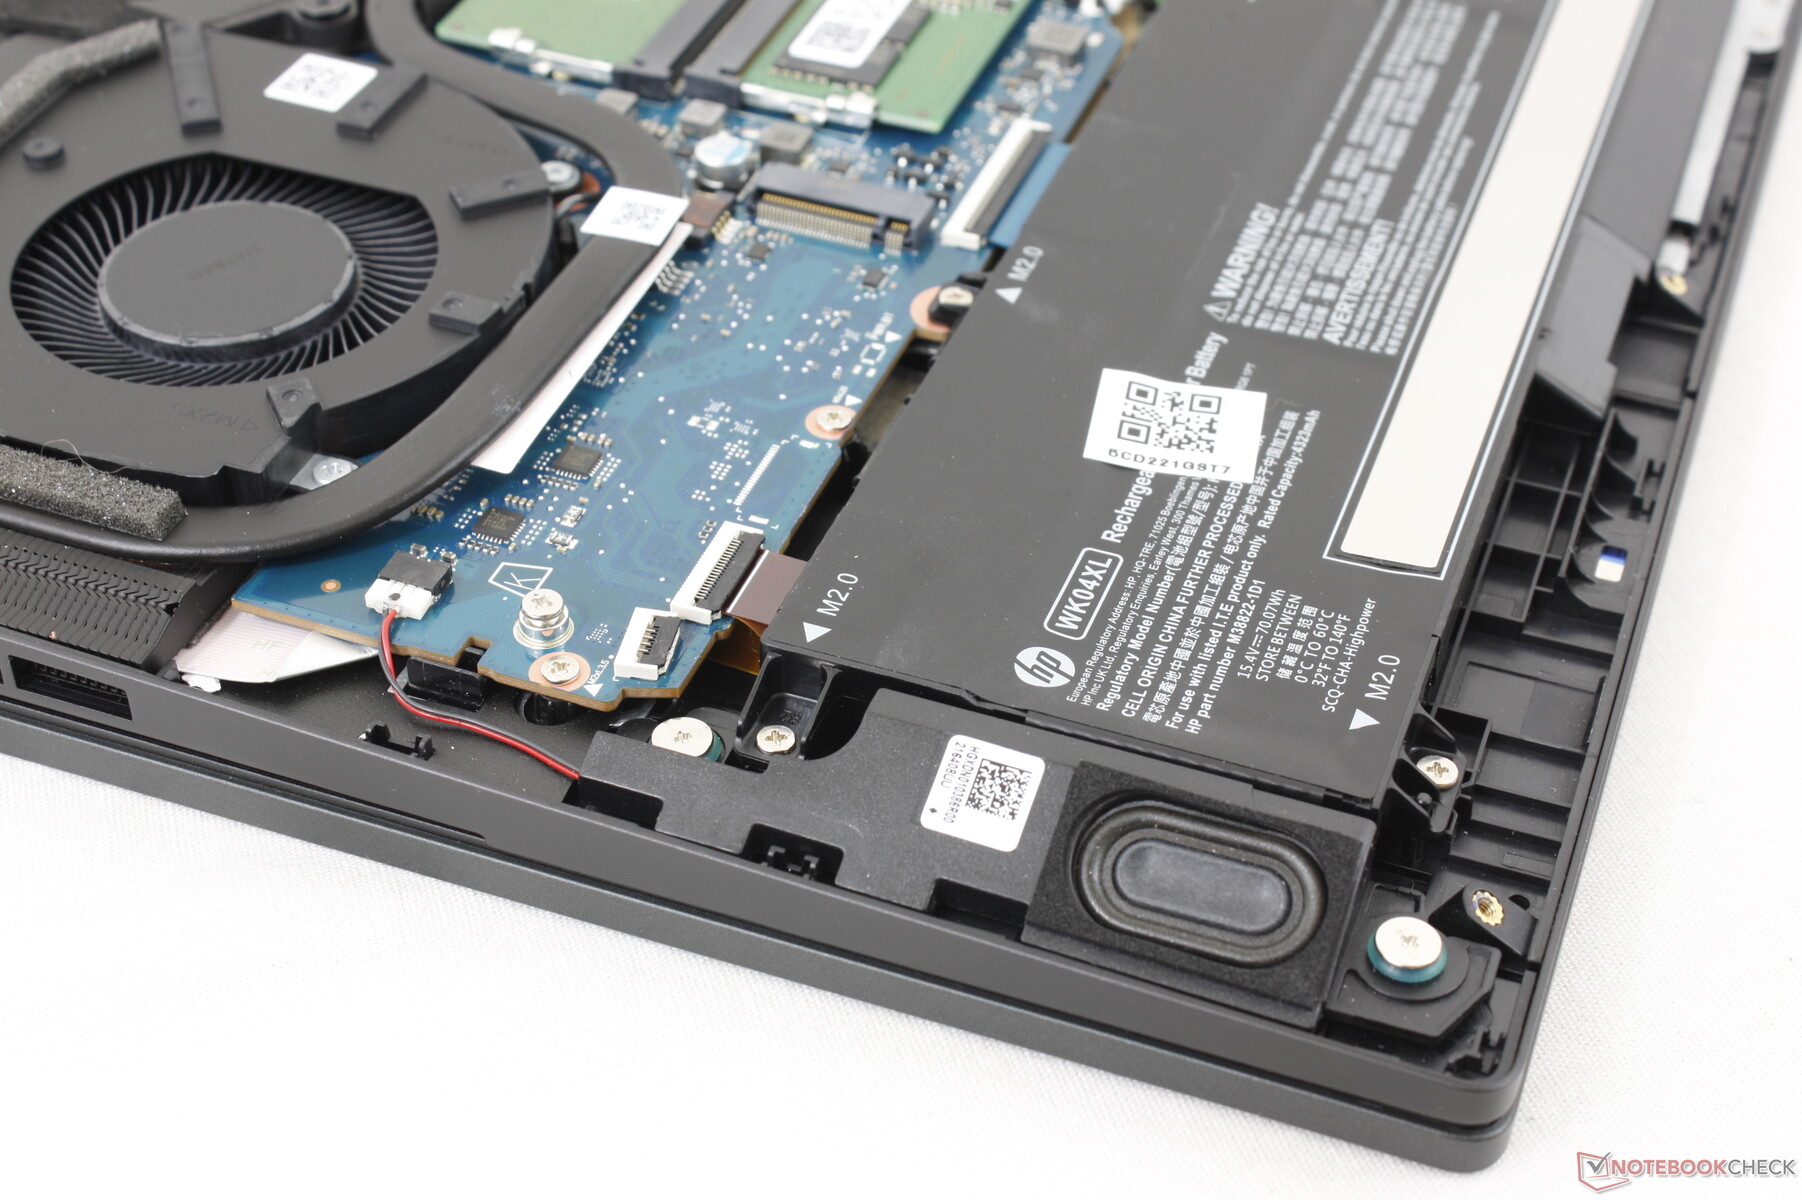
Manutenção
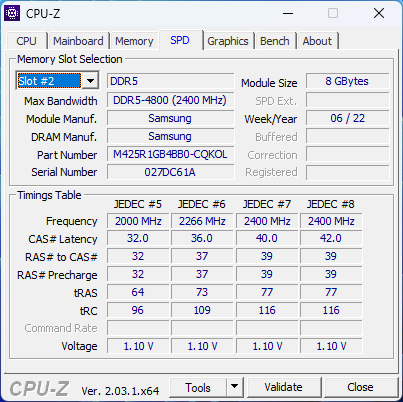
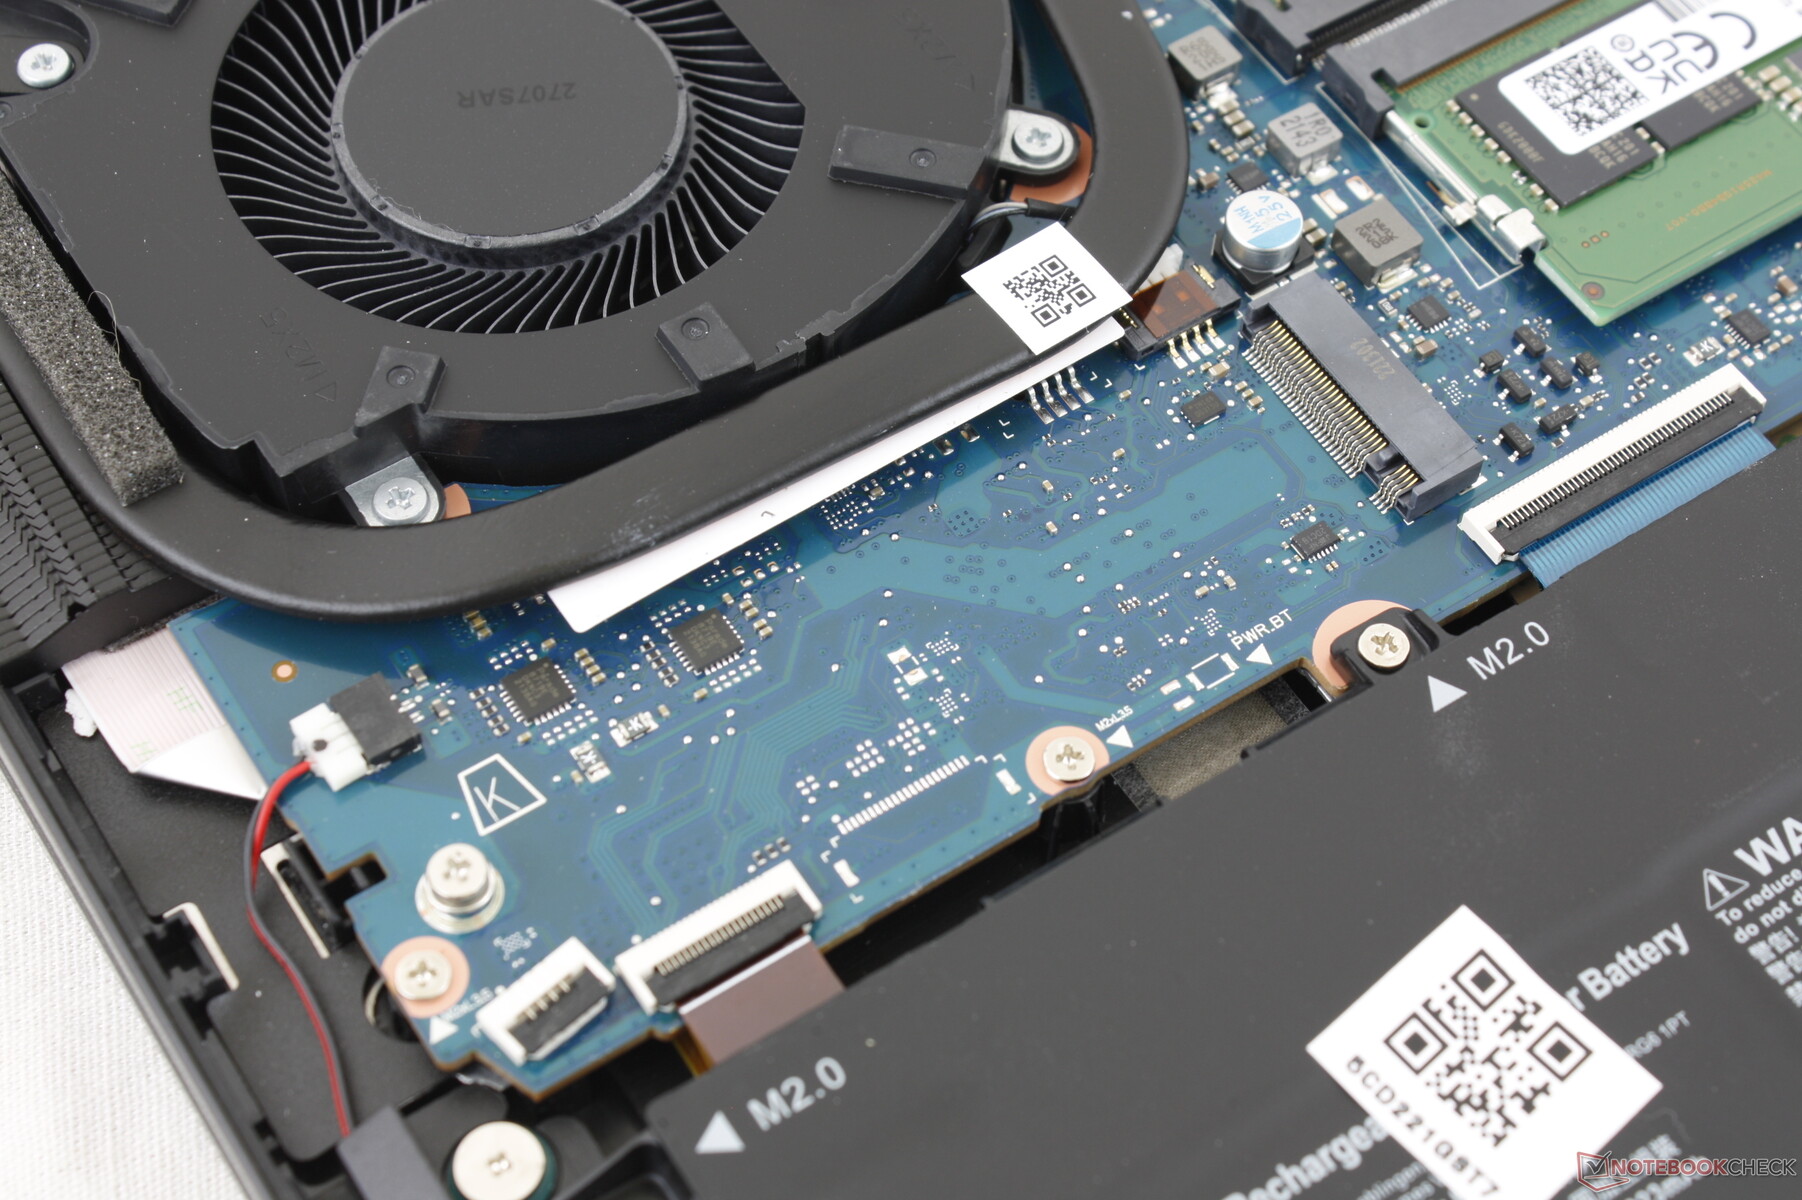
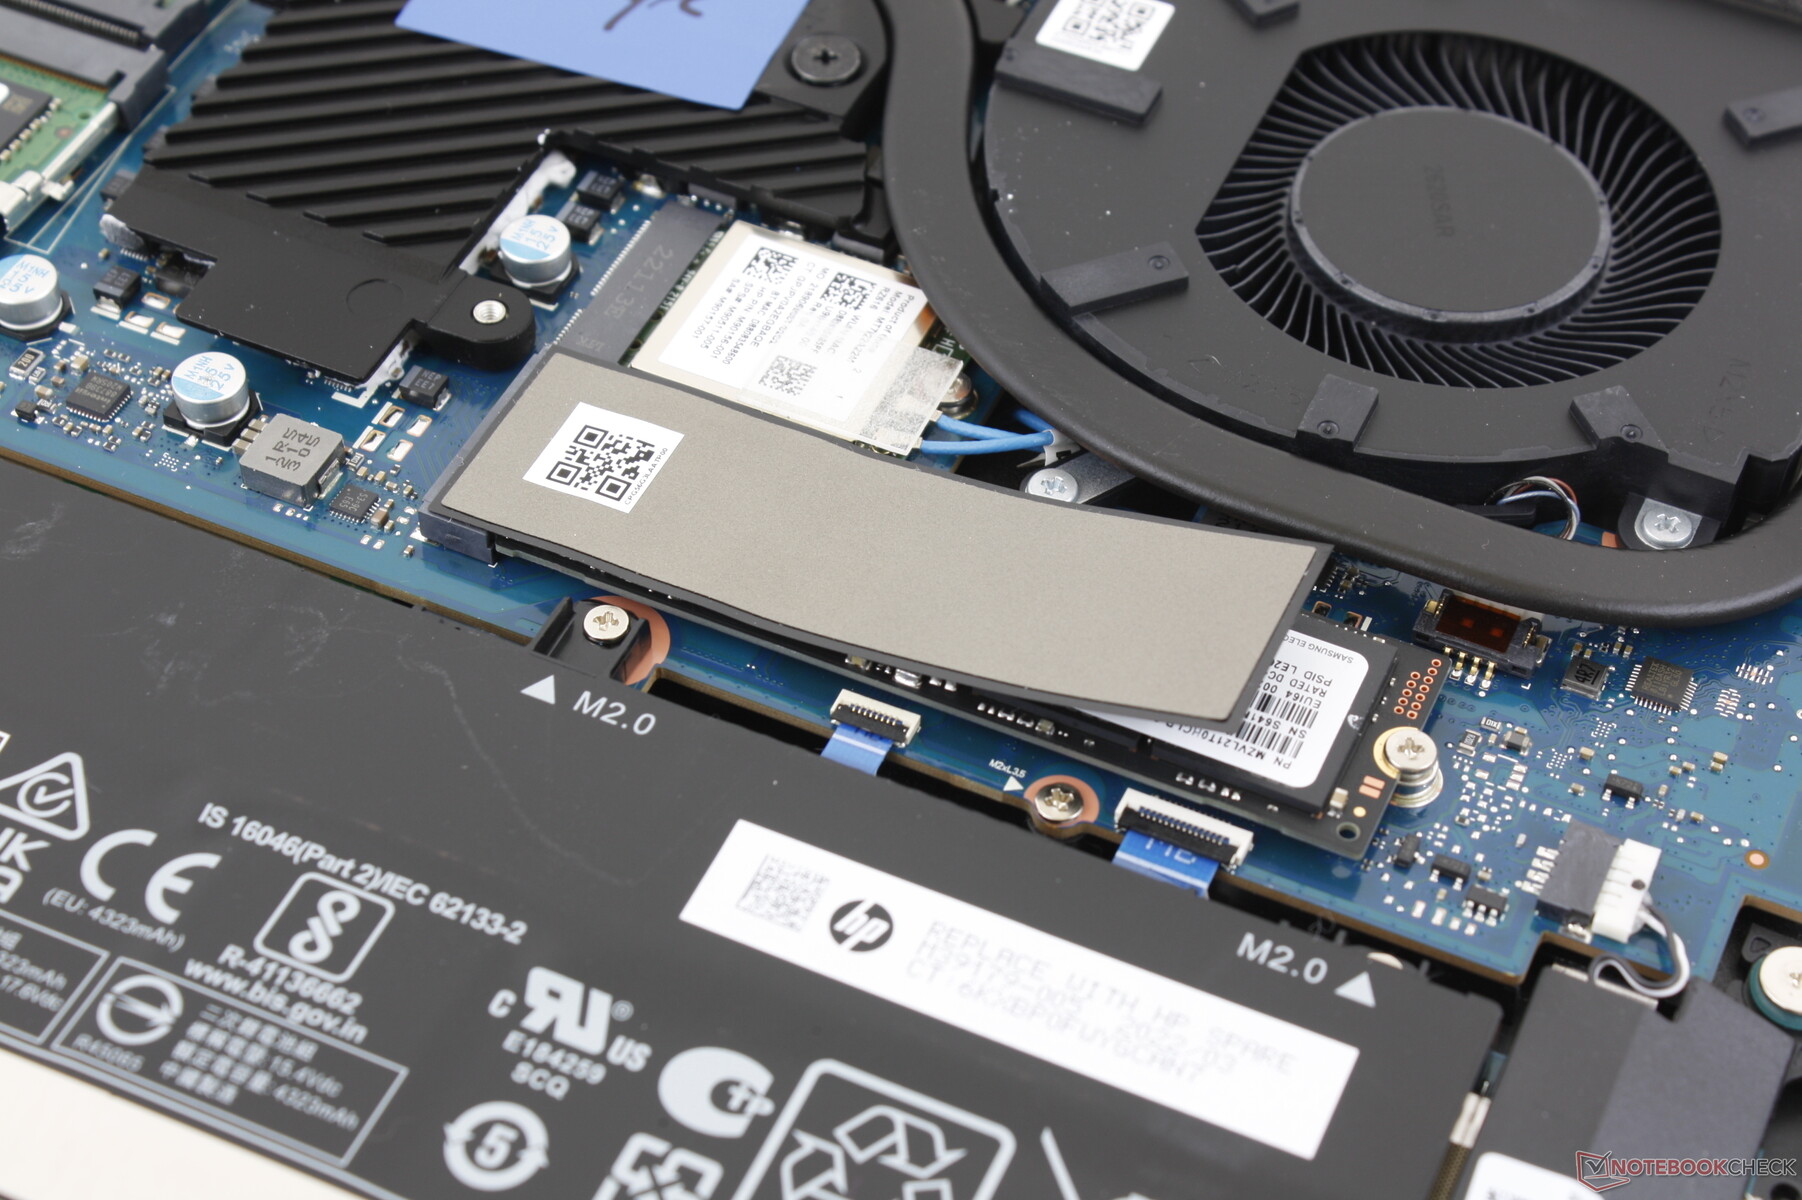
O painel inferior é fixado por oito parafusos Philips para facilitar a manutenção. Os usuários têm acesso direto a 2x compartimentos de armazenamento M.2, 2x slots DDR5 SODIMM, o módulo WLAN removível e a bateria principal.
Acessórios e Garantia
Não há extras na caixa além do adaptador AC e da papelada. Aplica-se a garantia limitada usual de um ano.
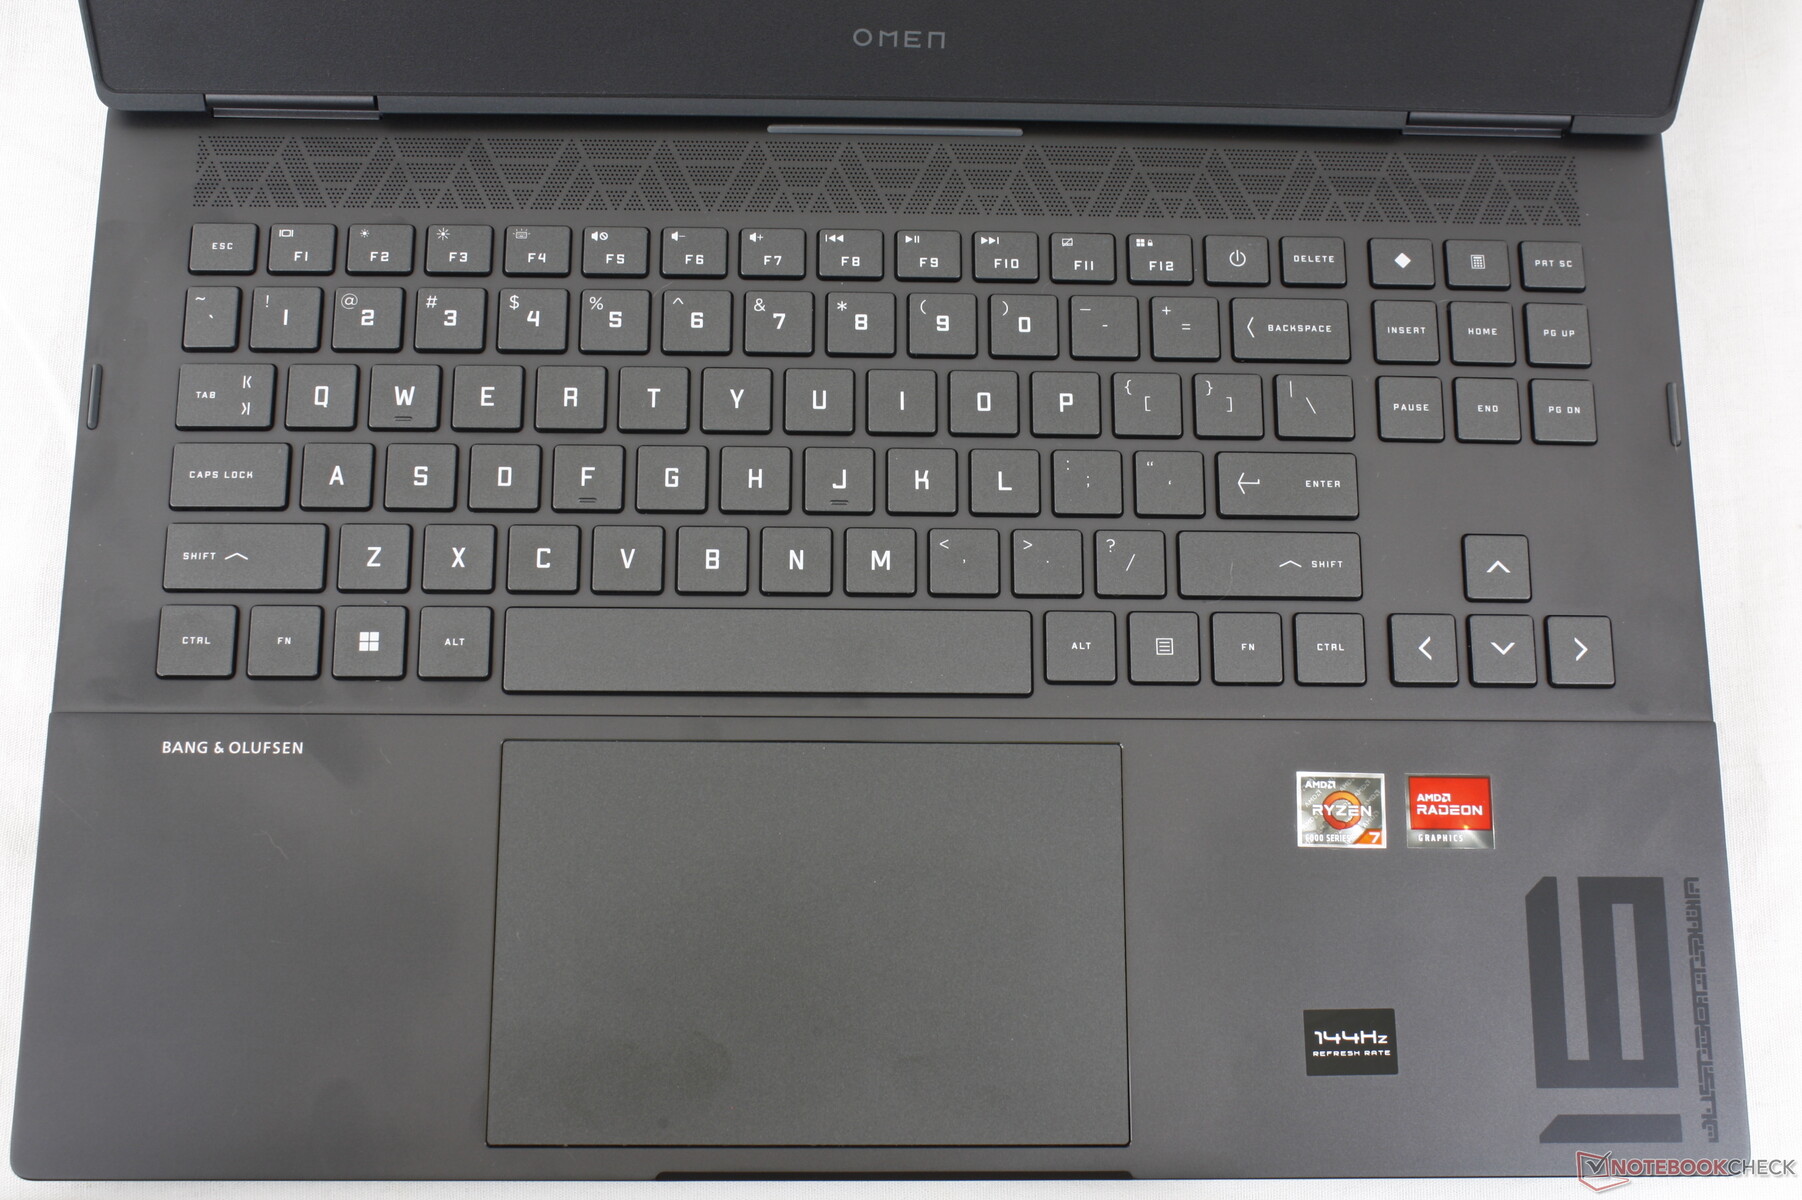
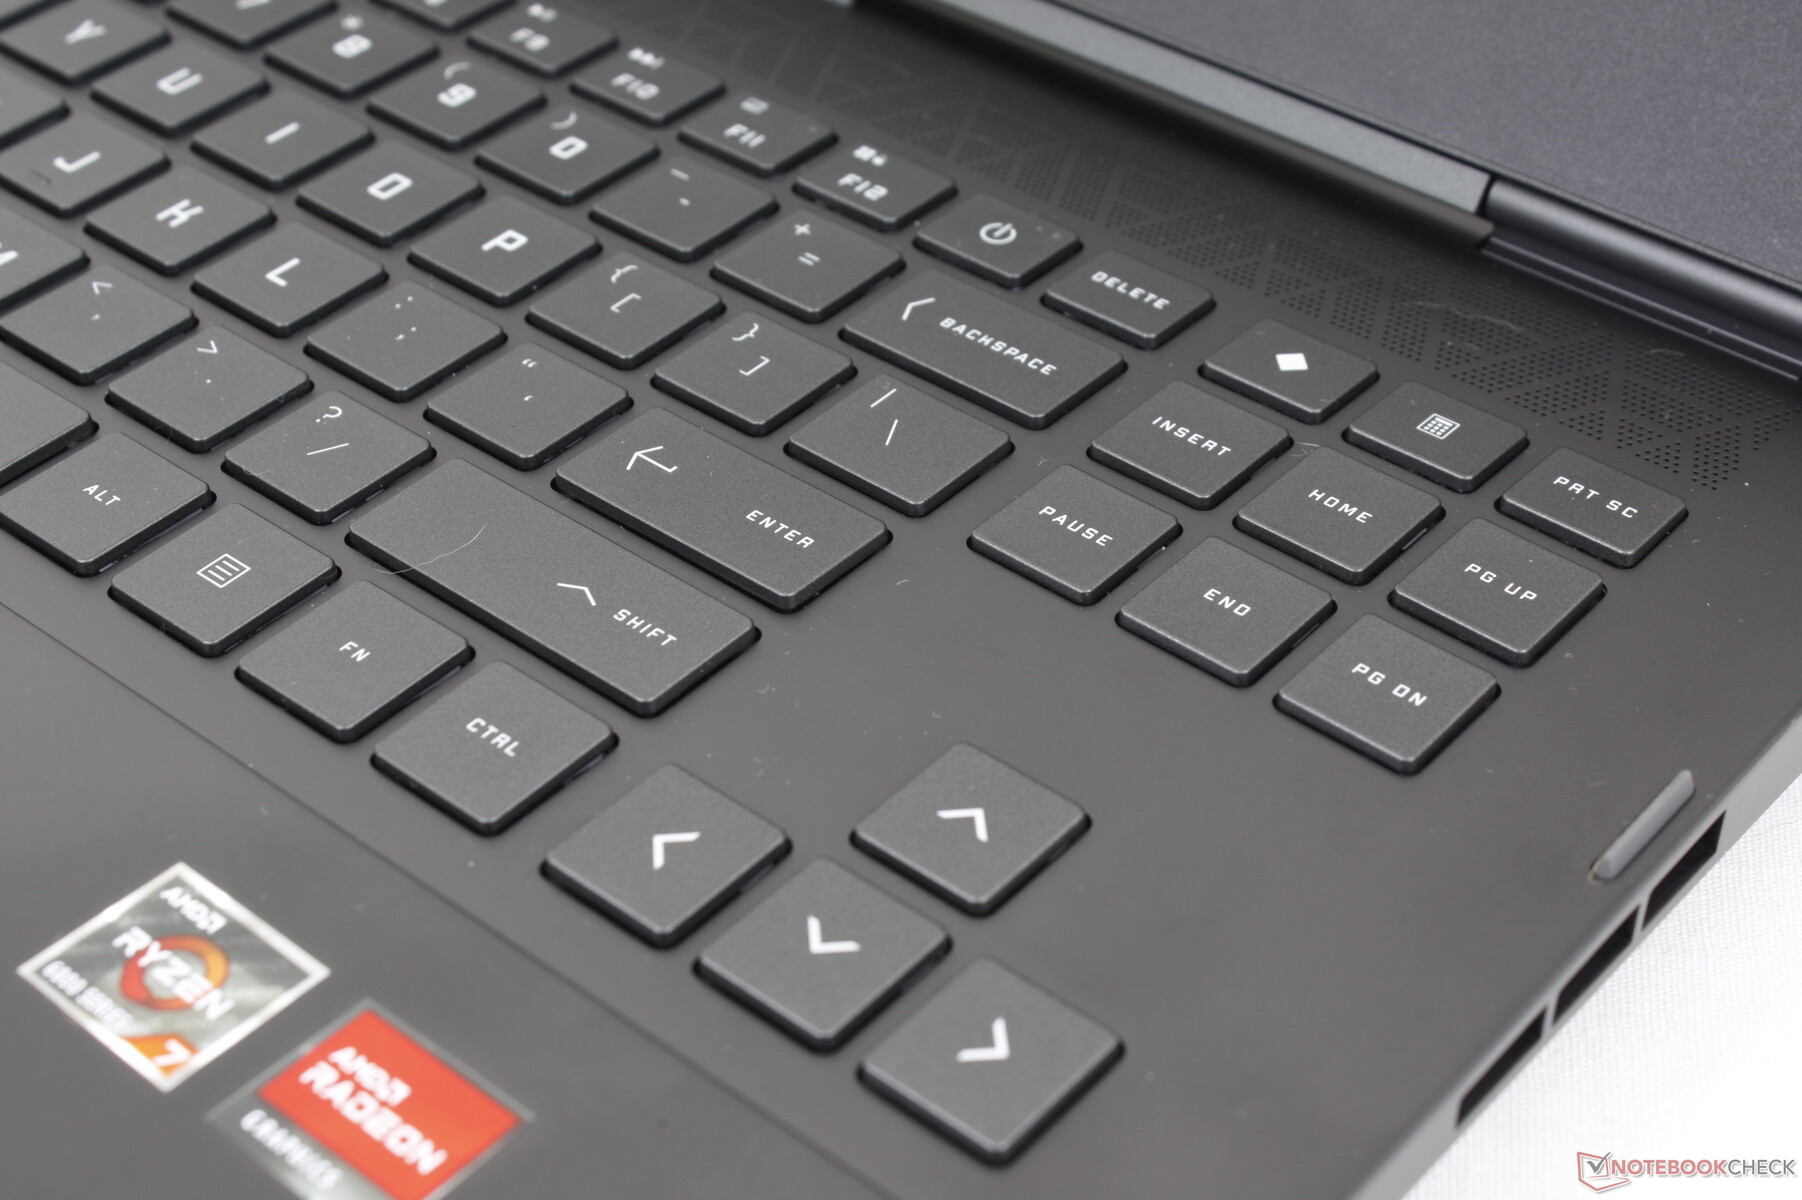
Dispositivos de Entrada - Teclado Confortável, Clickpad Incomfortável
Teclado
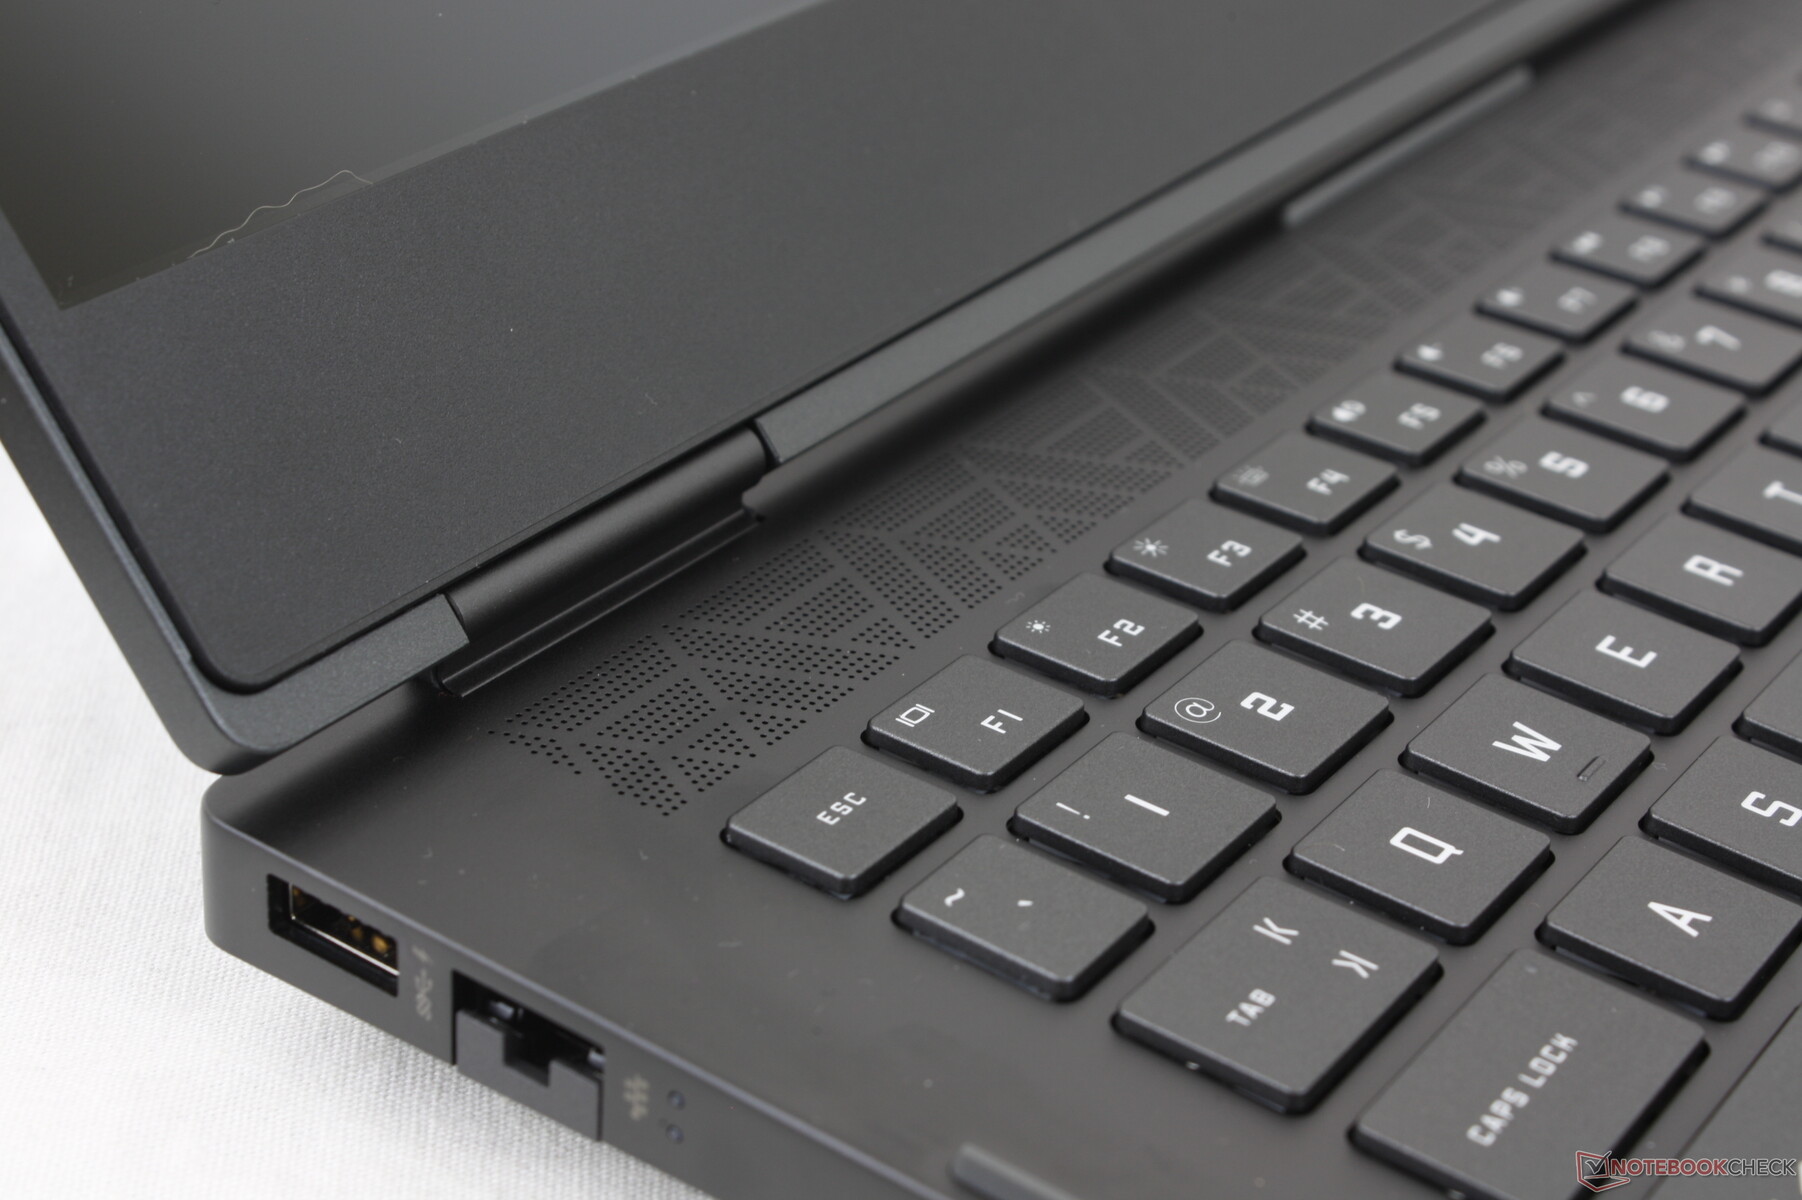
A experiência de digitação permanece idêntica à de Omen 16 do ano passado, uma vez que não há mudanças no teclado. O deslocamento da chave é raso e Ultrabook-like, mas o feedback firme e a chave de espaço extra-grande compensam isso. Gostaríamos de ver o botão Power mover-se para outro lugar em futuras revisões, já que sua localização atual ao lado das teclas Backspace e Del torna fácil pressionar acidentalmente.
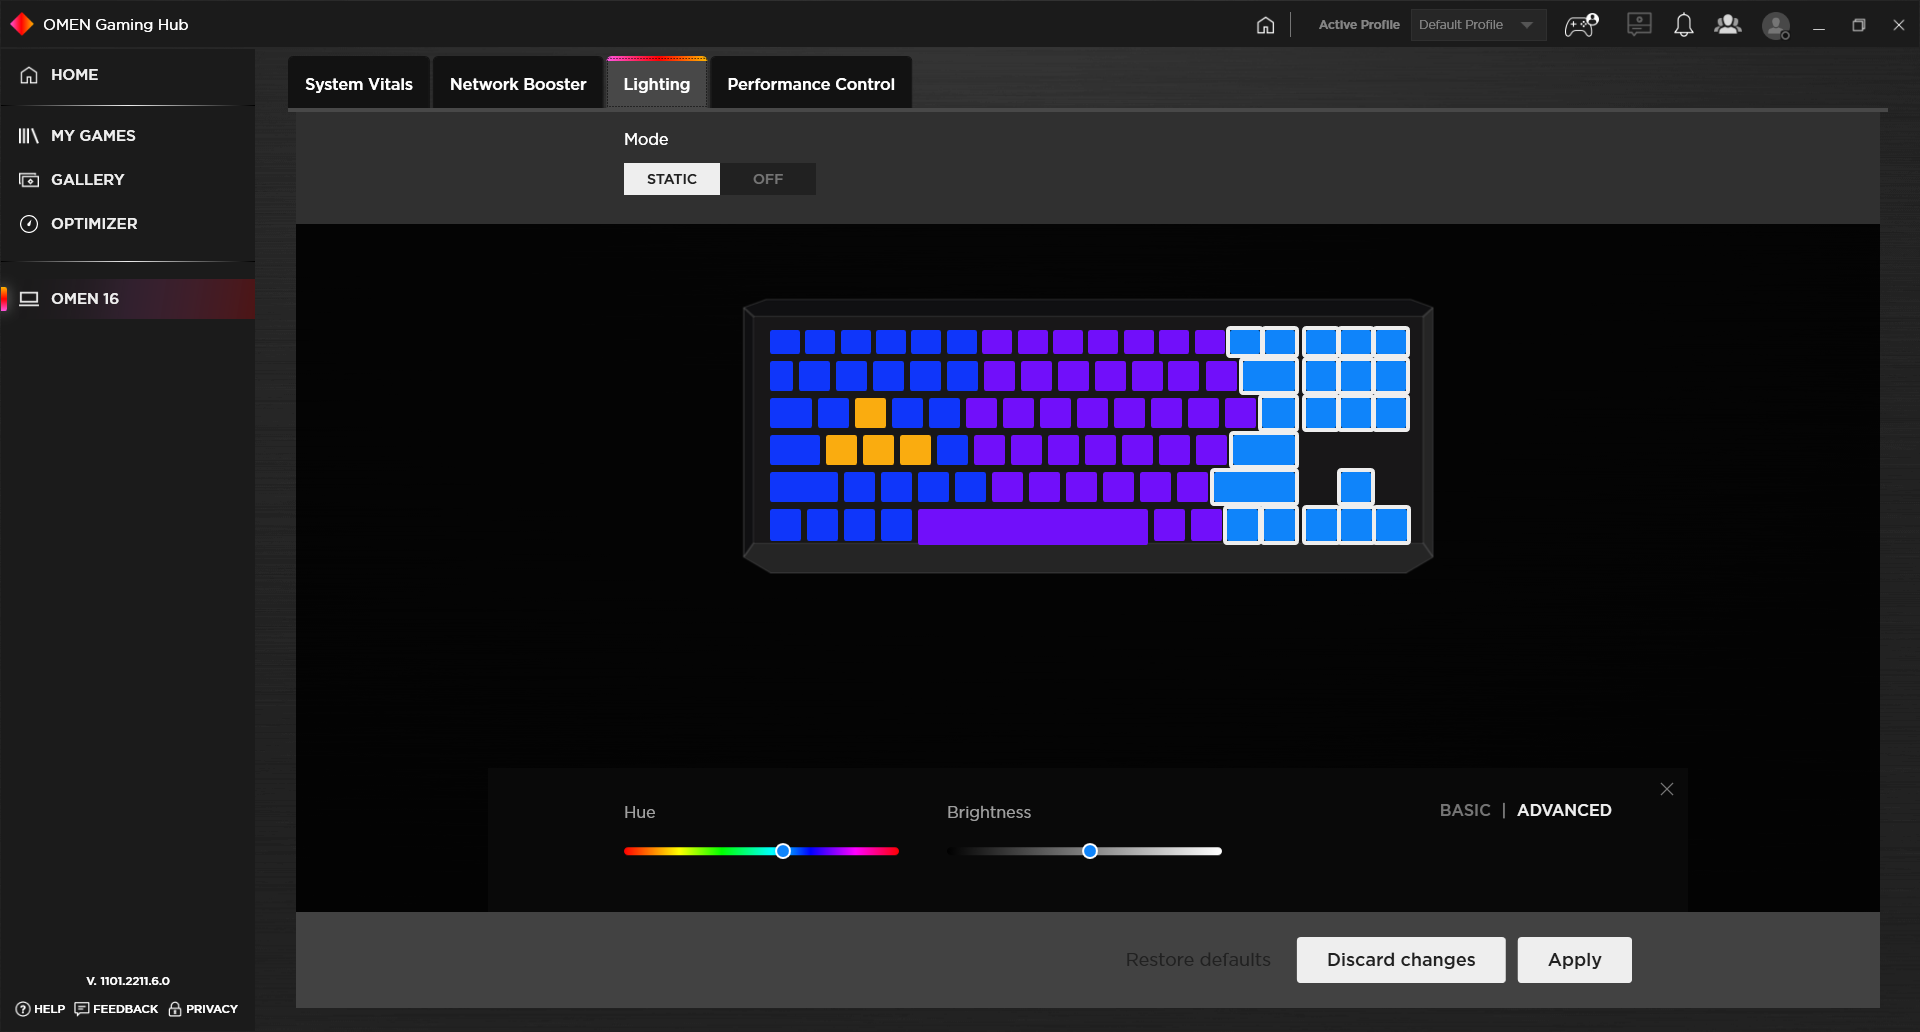
A retroiluminação do teclado é dividida em quatro zonas diferentes, ao contrário do RGB por tecla, o que é decepcionante considerando o alto ponto de preço e os níveis de desempenho do Omen 16.
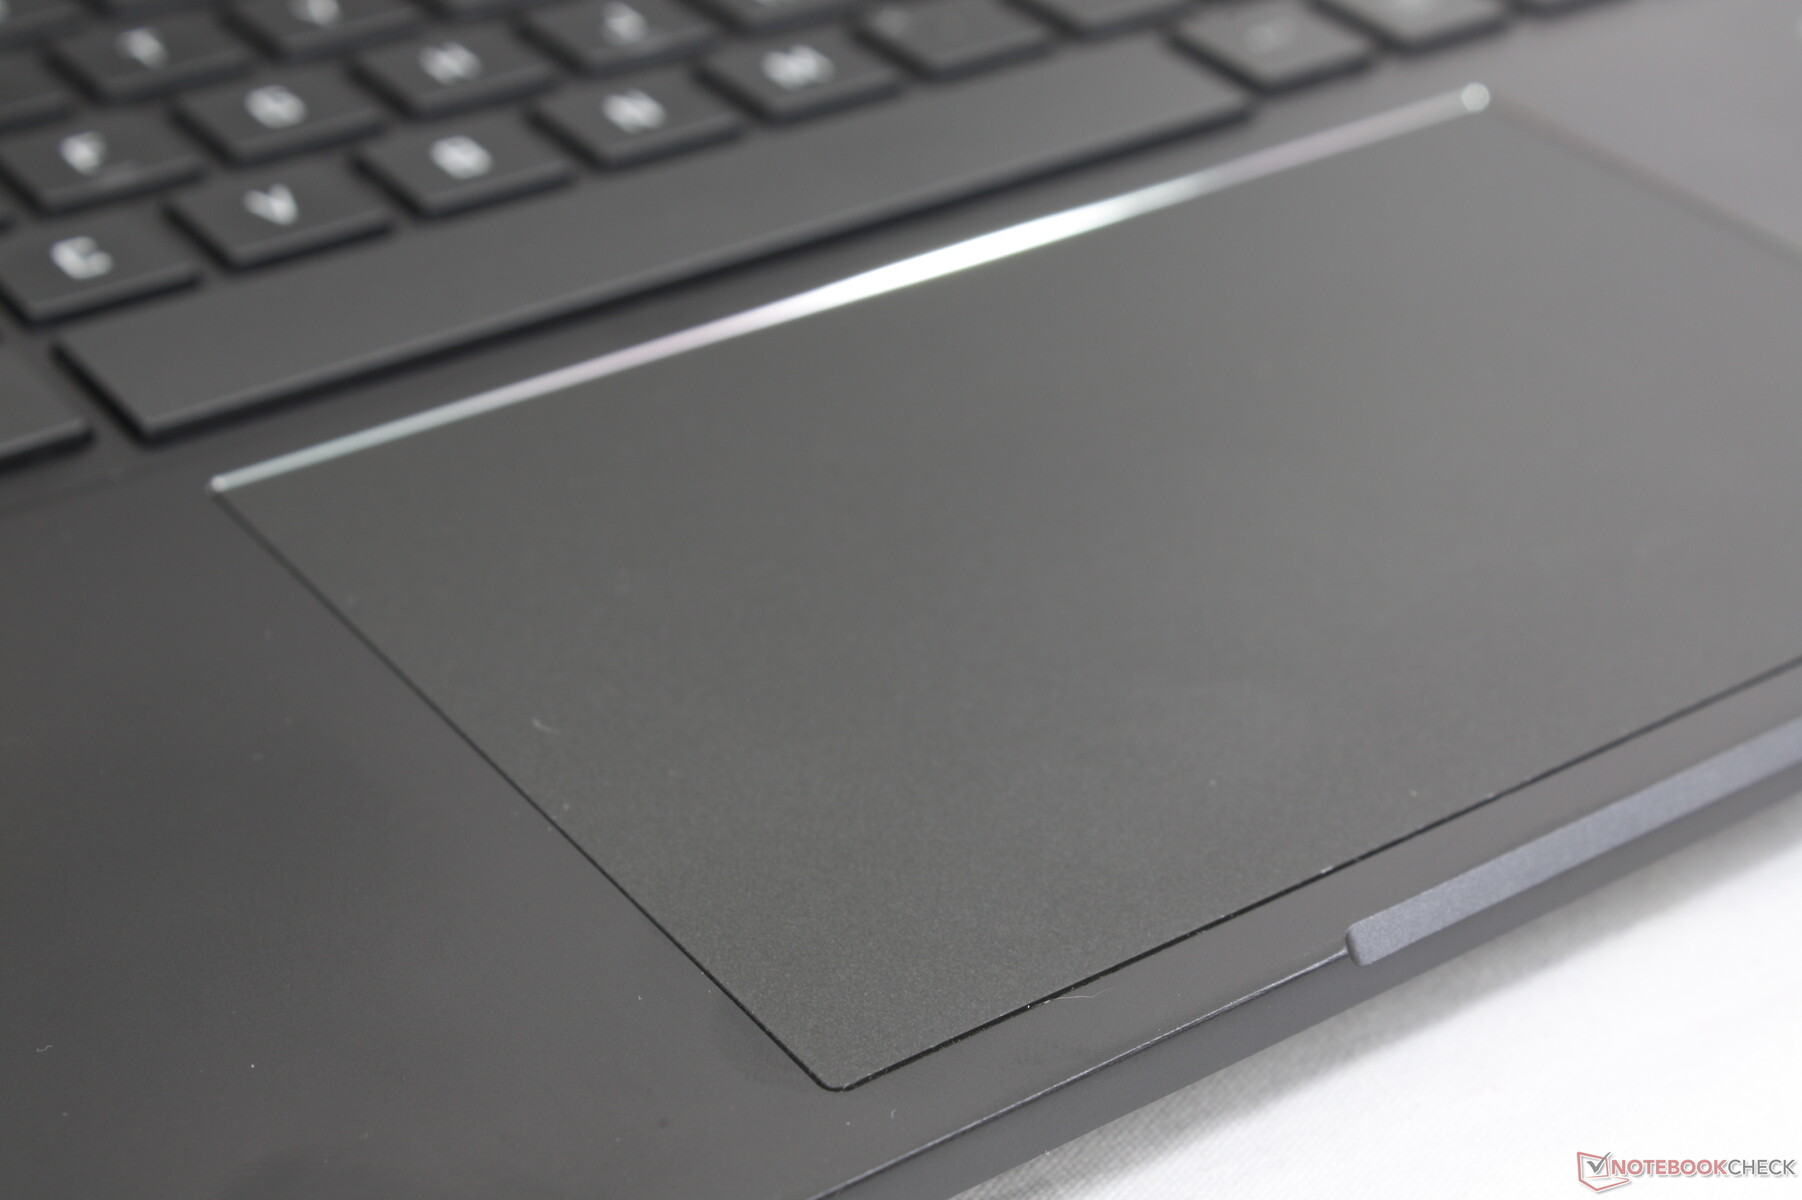
Touchpad
O clickpad é muito maior que o do Dell G16 (13 x 8,6 cm vs. 10,5 x 6 cm) para entradas multi-toque mais fáceis. A tração é suave e com o mínimo de aderência, como na tampa externa ou nos apoios das palmas ao redor
Infelizmente, uma grande desvantagem para o clickpad aqui é sua hipersensibilidade à pressão. Ao rolar com um dedo, por exemplo, torna-se muito fácil introduzir acidentalmente um clique, o que torna o laptop inteiro muito irritante de usar sem um mouse externo. Os clickpads em outros laptops para jogos são muito menos sensíveis em comparação.

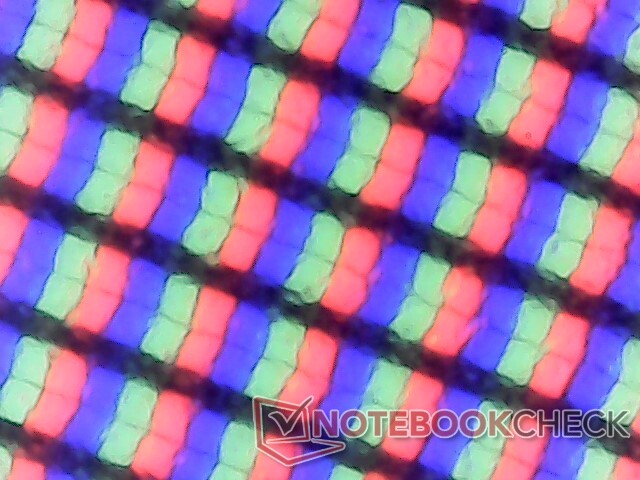
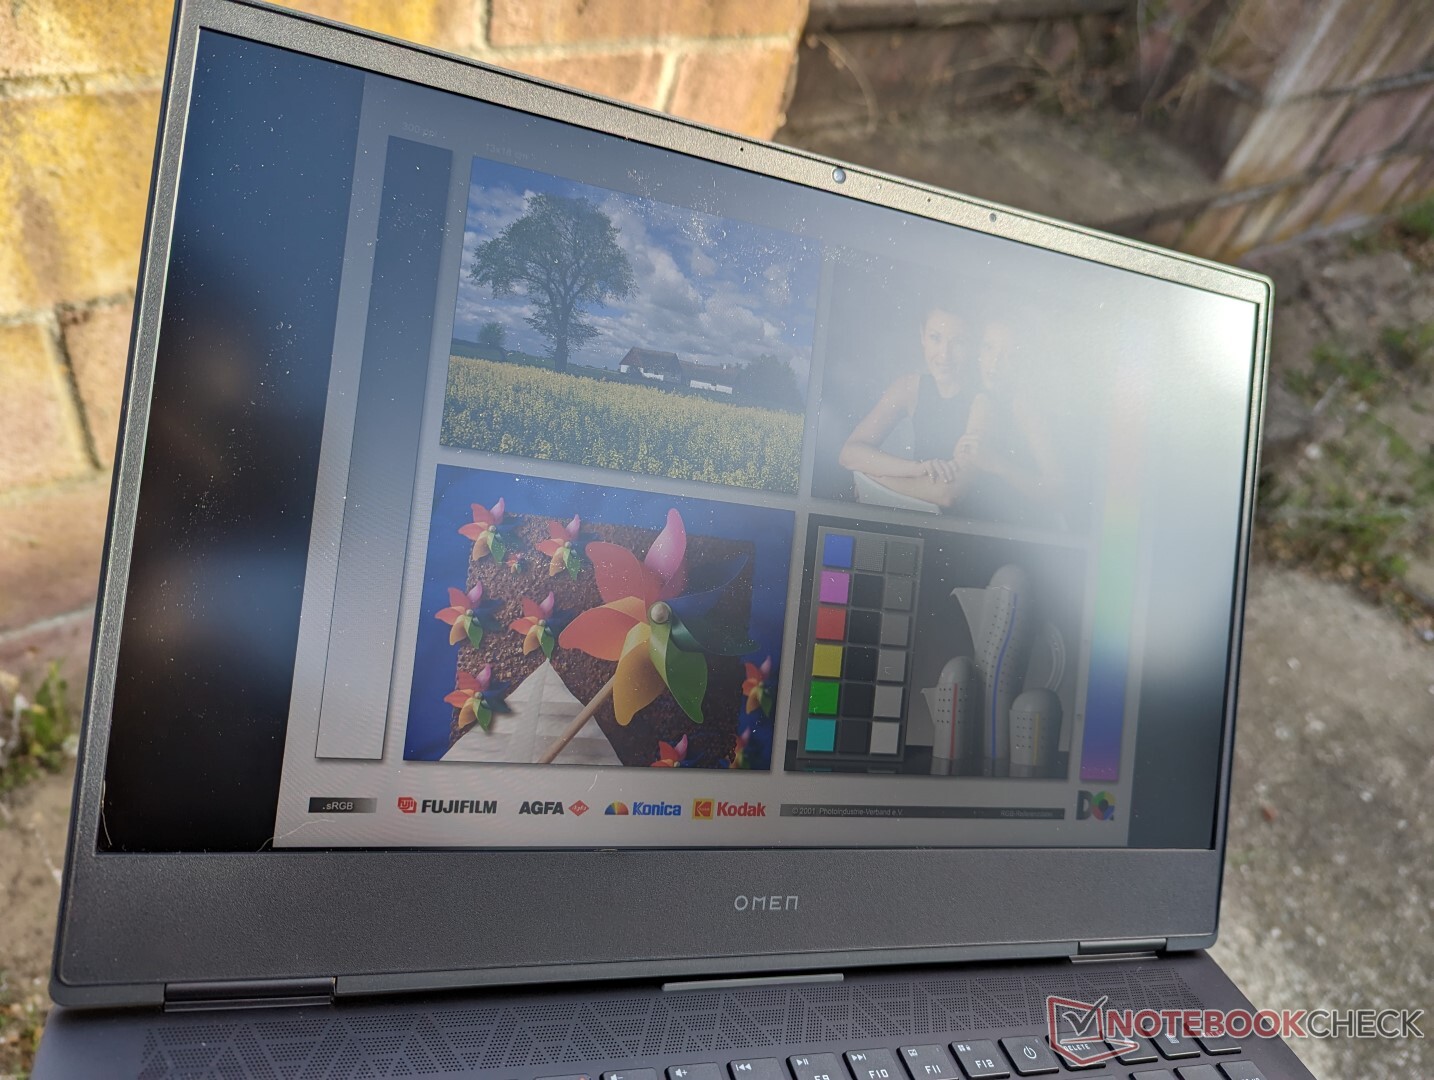
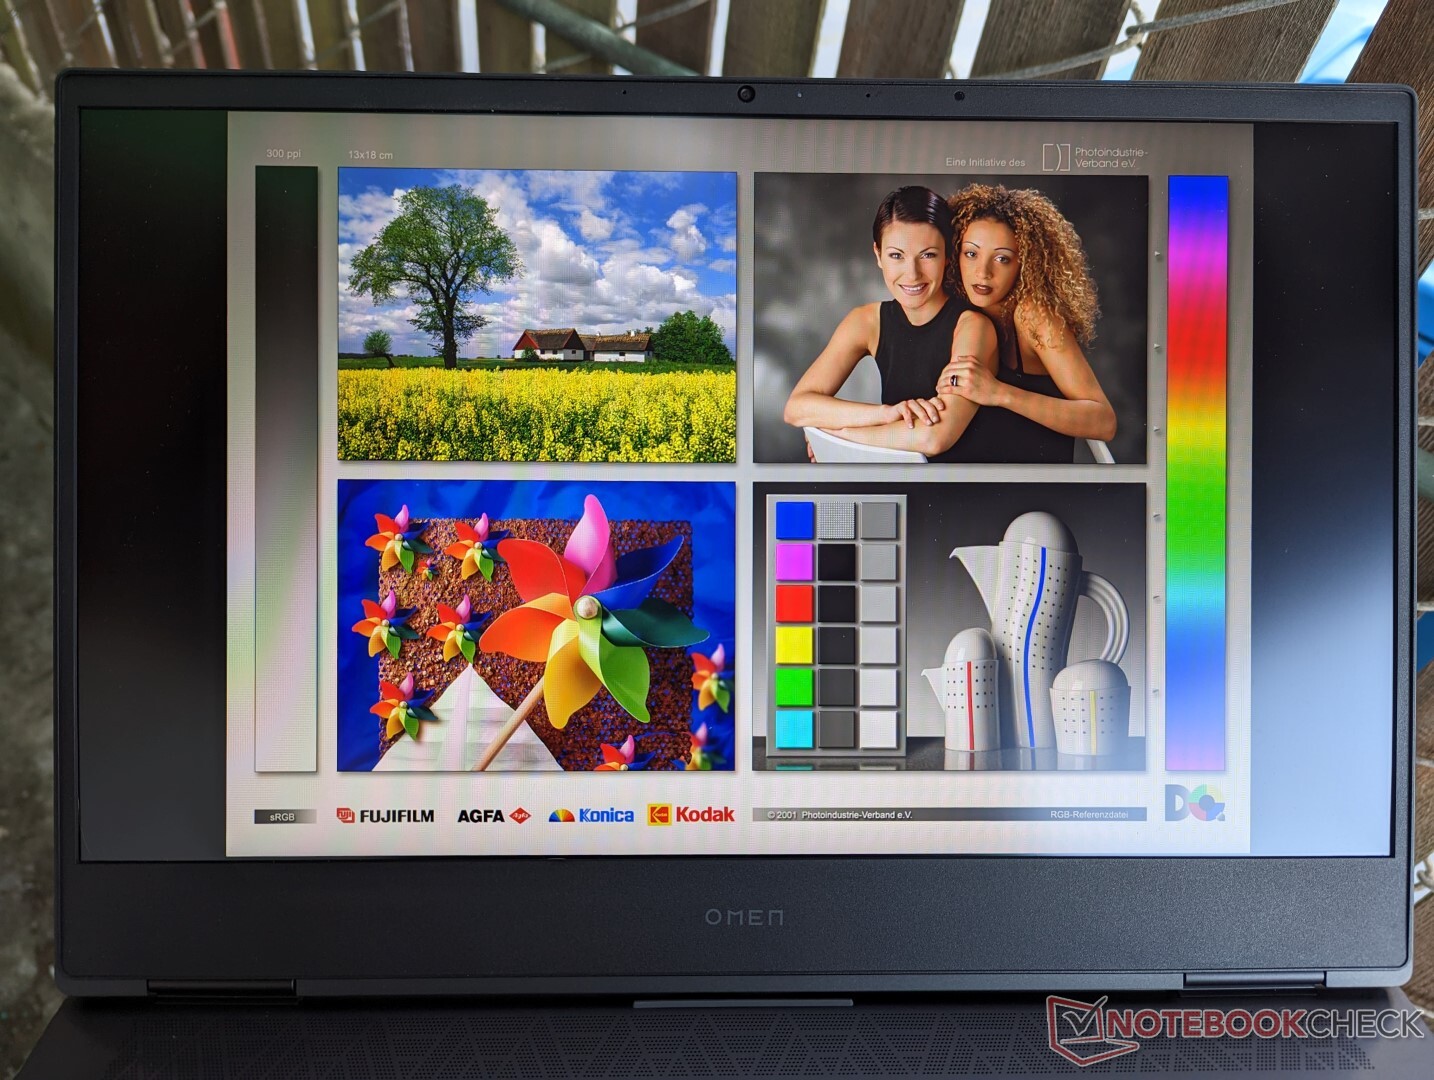
Display - FreeSync com 144 Hz e 100% sRGB
Há três opções de exibição a escolher, como segue:
- 1080p, 144 Hz, 250 lêndeas
- 1080p, 144 Hz, 300 nits
- 1440p, 165 Hz, 300 nits
Nossas medidas de exibição aqui refletem apenas a opção em negrito acima. A opção mais alta de 165 Hz está disponível tanto na Intel como na AMD Omen 16 SKUs.
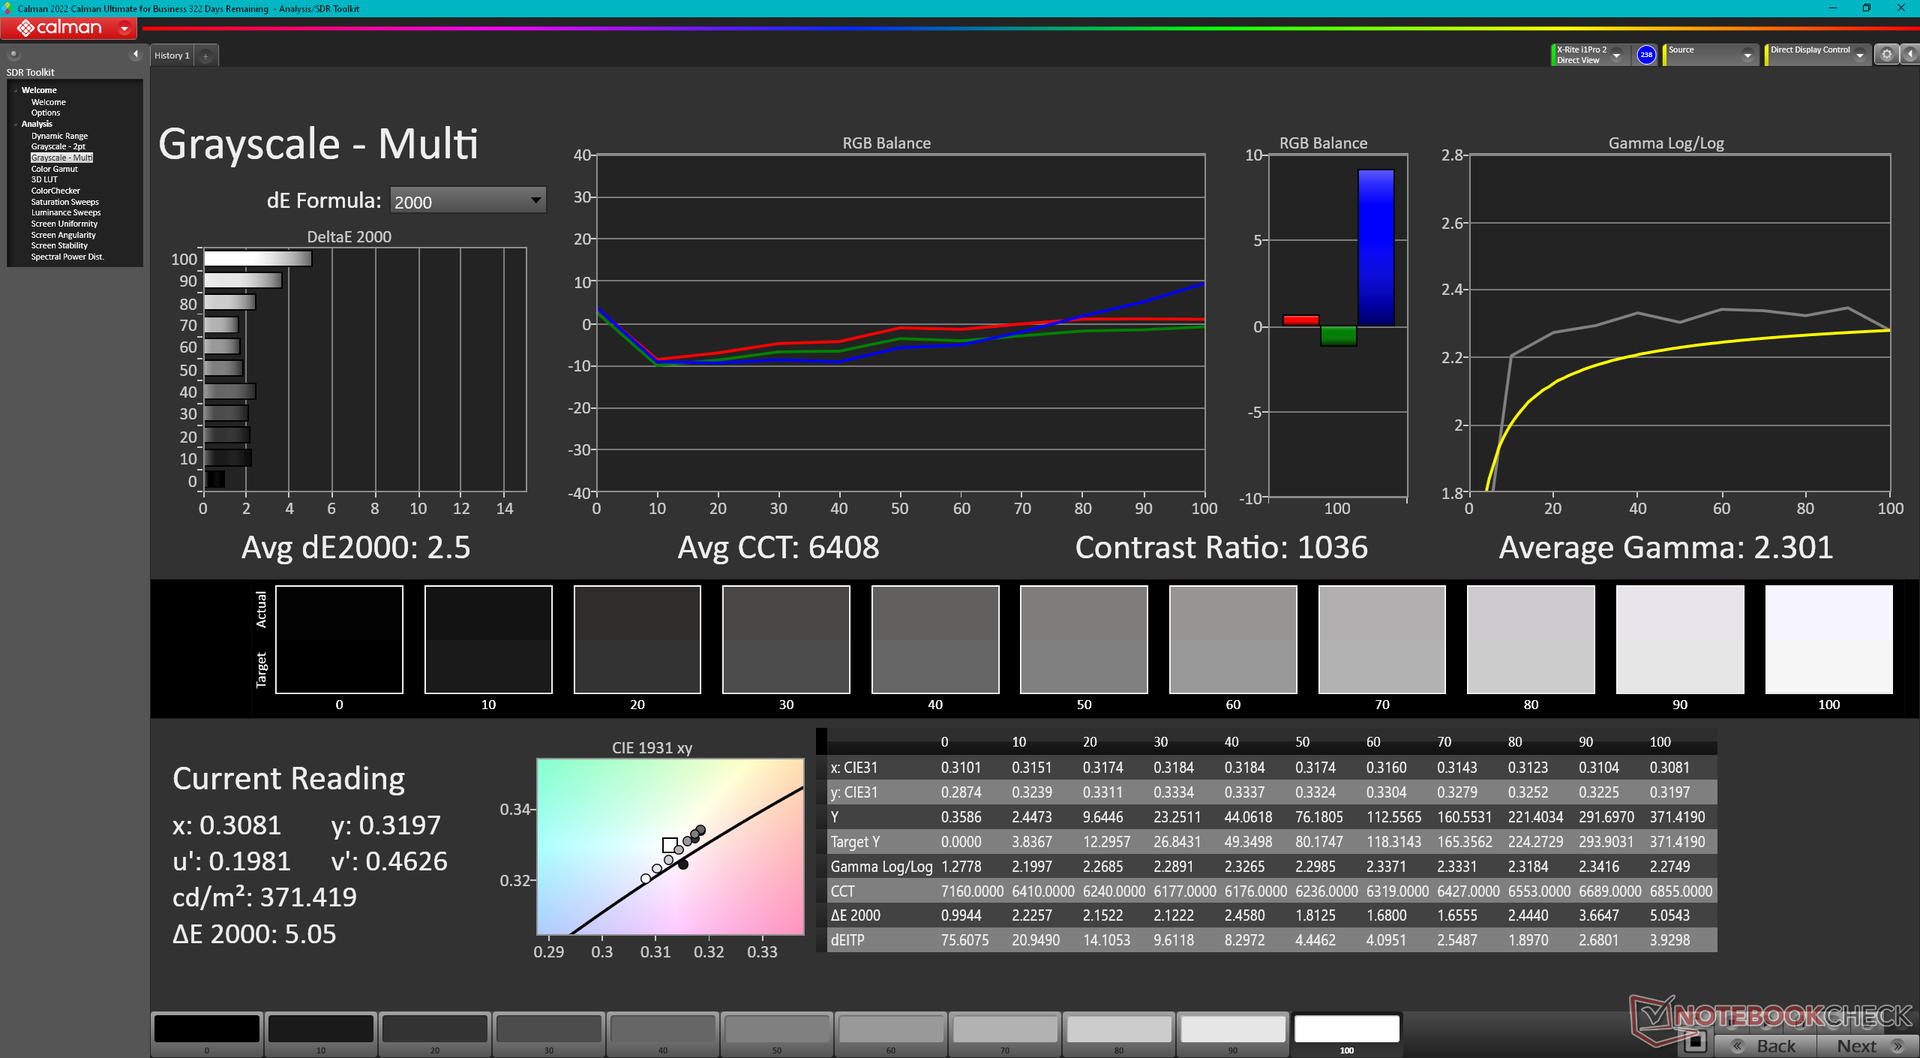
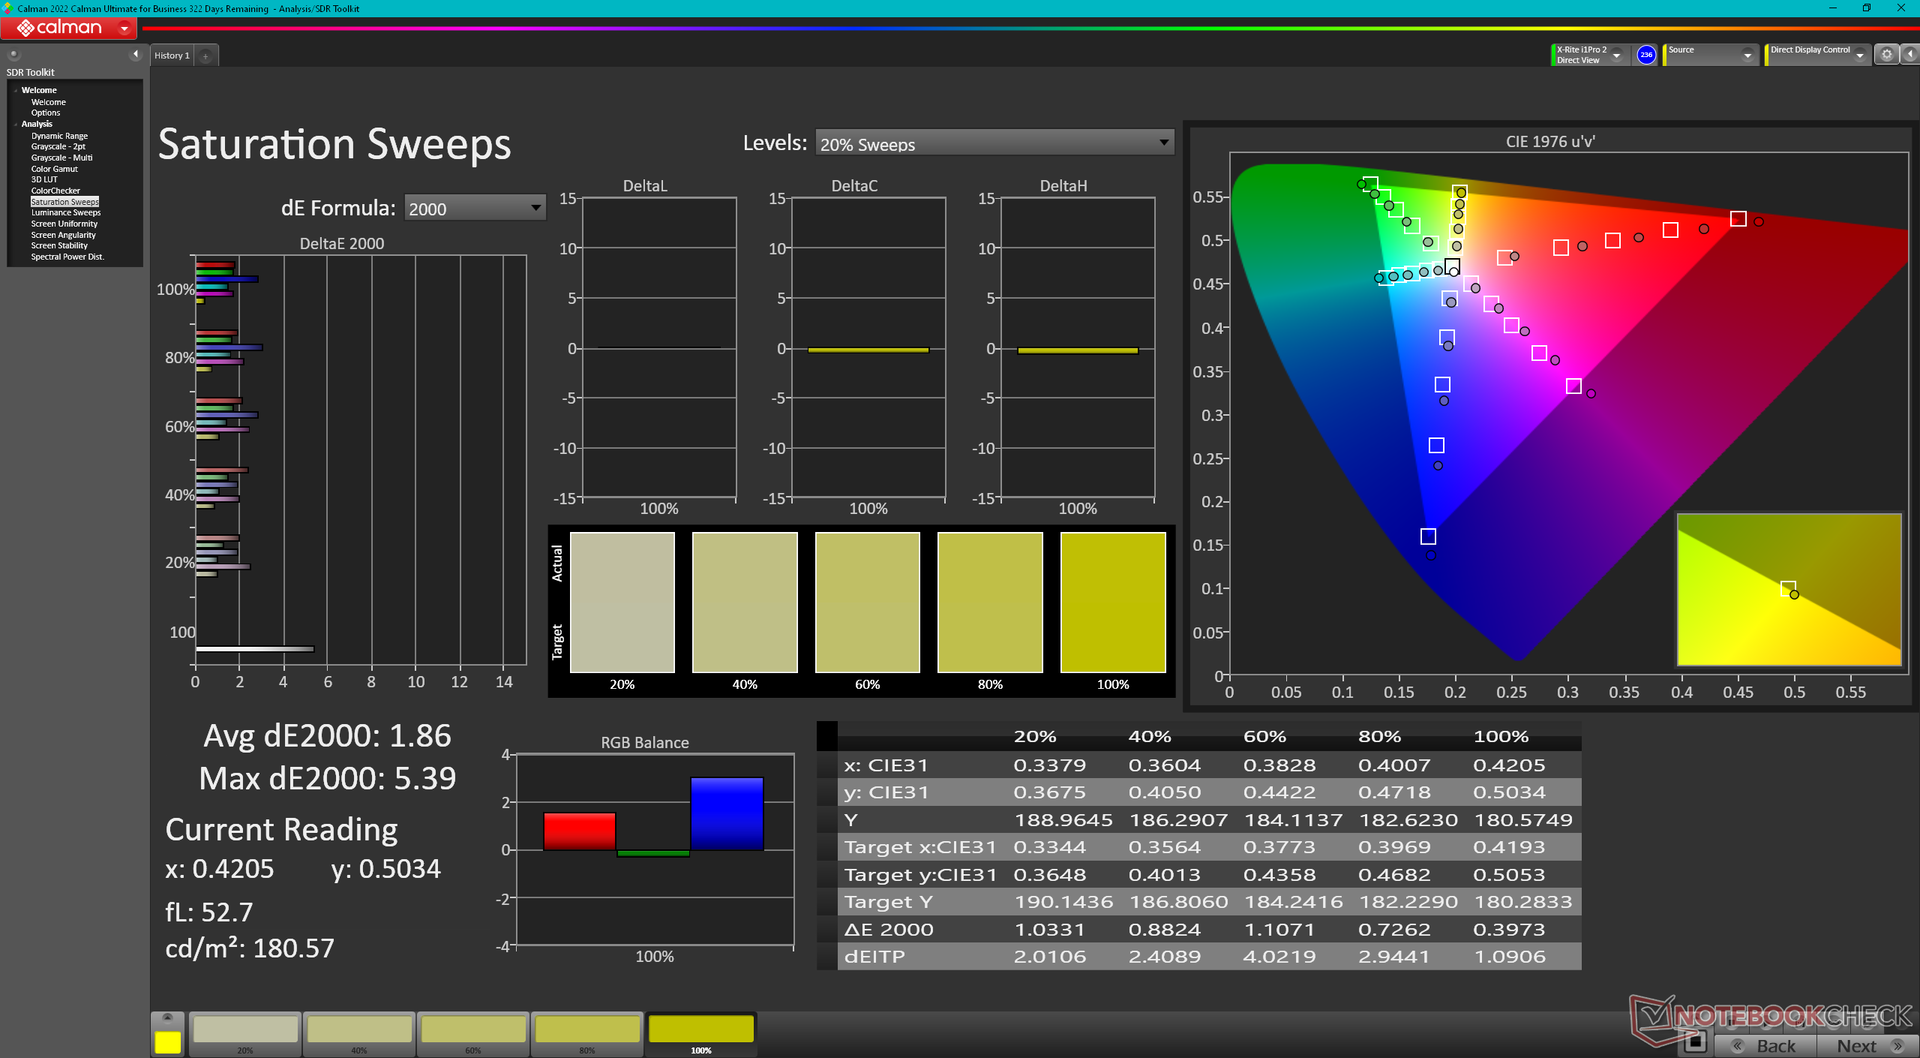
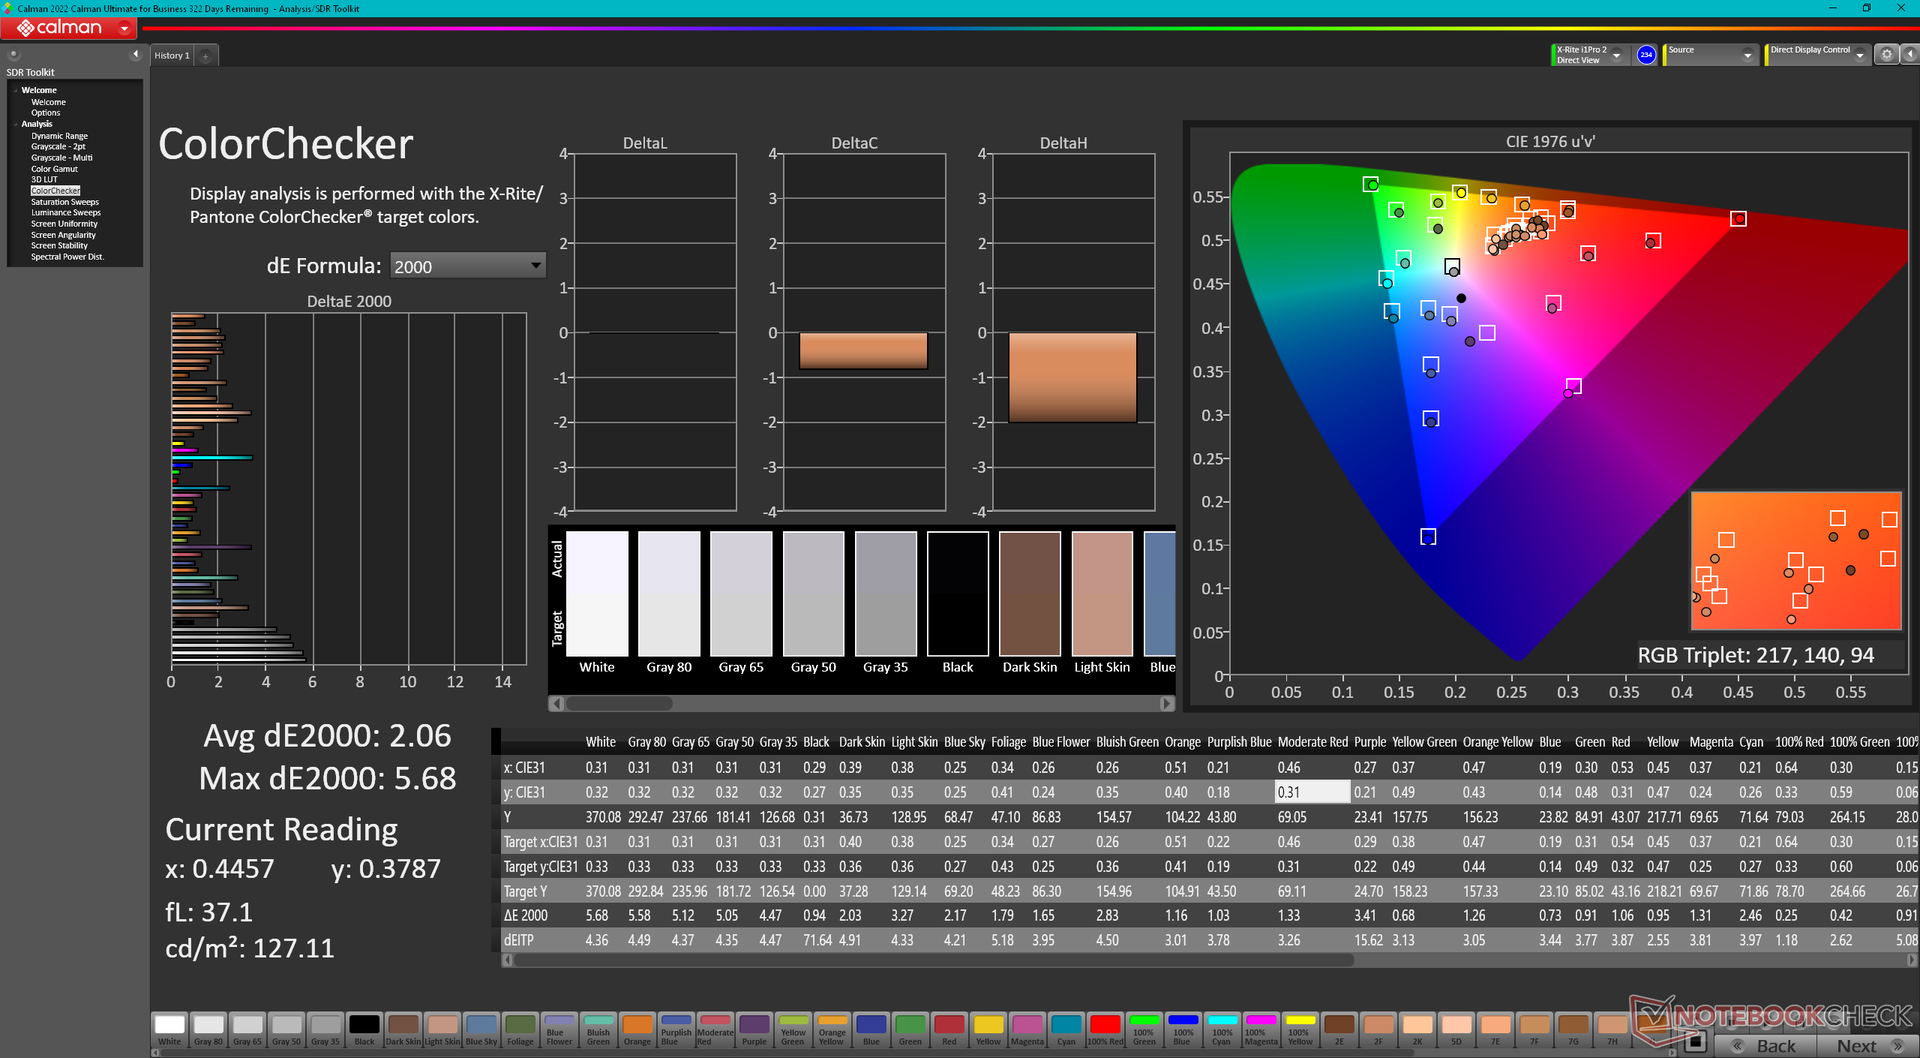
O painel IPS em nossa unidade AMD ainda é muito bom, no entanto, com sua cobertura completa de sRGB, taxa de contraste decente e tempos de resposta decentes de preto e branco. Mesmo o brilho máximo da tela é 20% maior do que o que a HP está anunciando de acordo com nosso próprio colorímetro X-Rite. A qualidade geral da imagem é significativamente melhor do que no HP Victus 16, que usa um painel Chi Mei muito mais barato, com cores piores e fantasmas mais perceptíveis.


| |||||||||||||||||||||||||
iluminação: 79 %
iluminação com acumulador: 373.3 cd/m²
Contraste: 848:1 (Preto: 0.44 cd/m²)
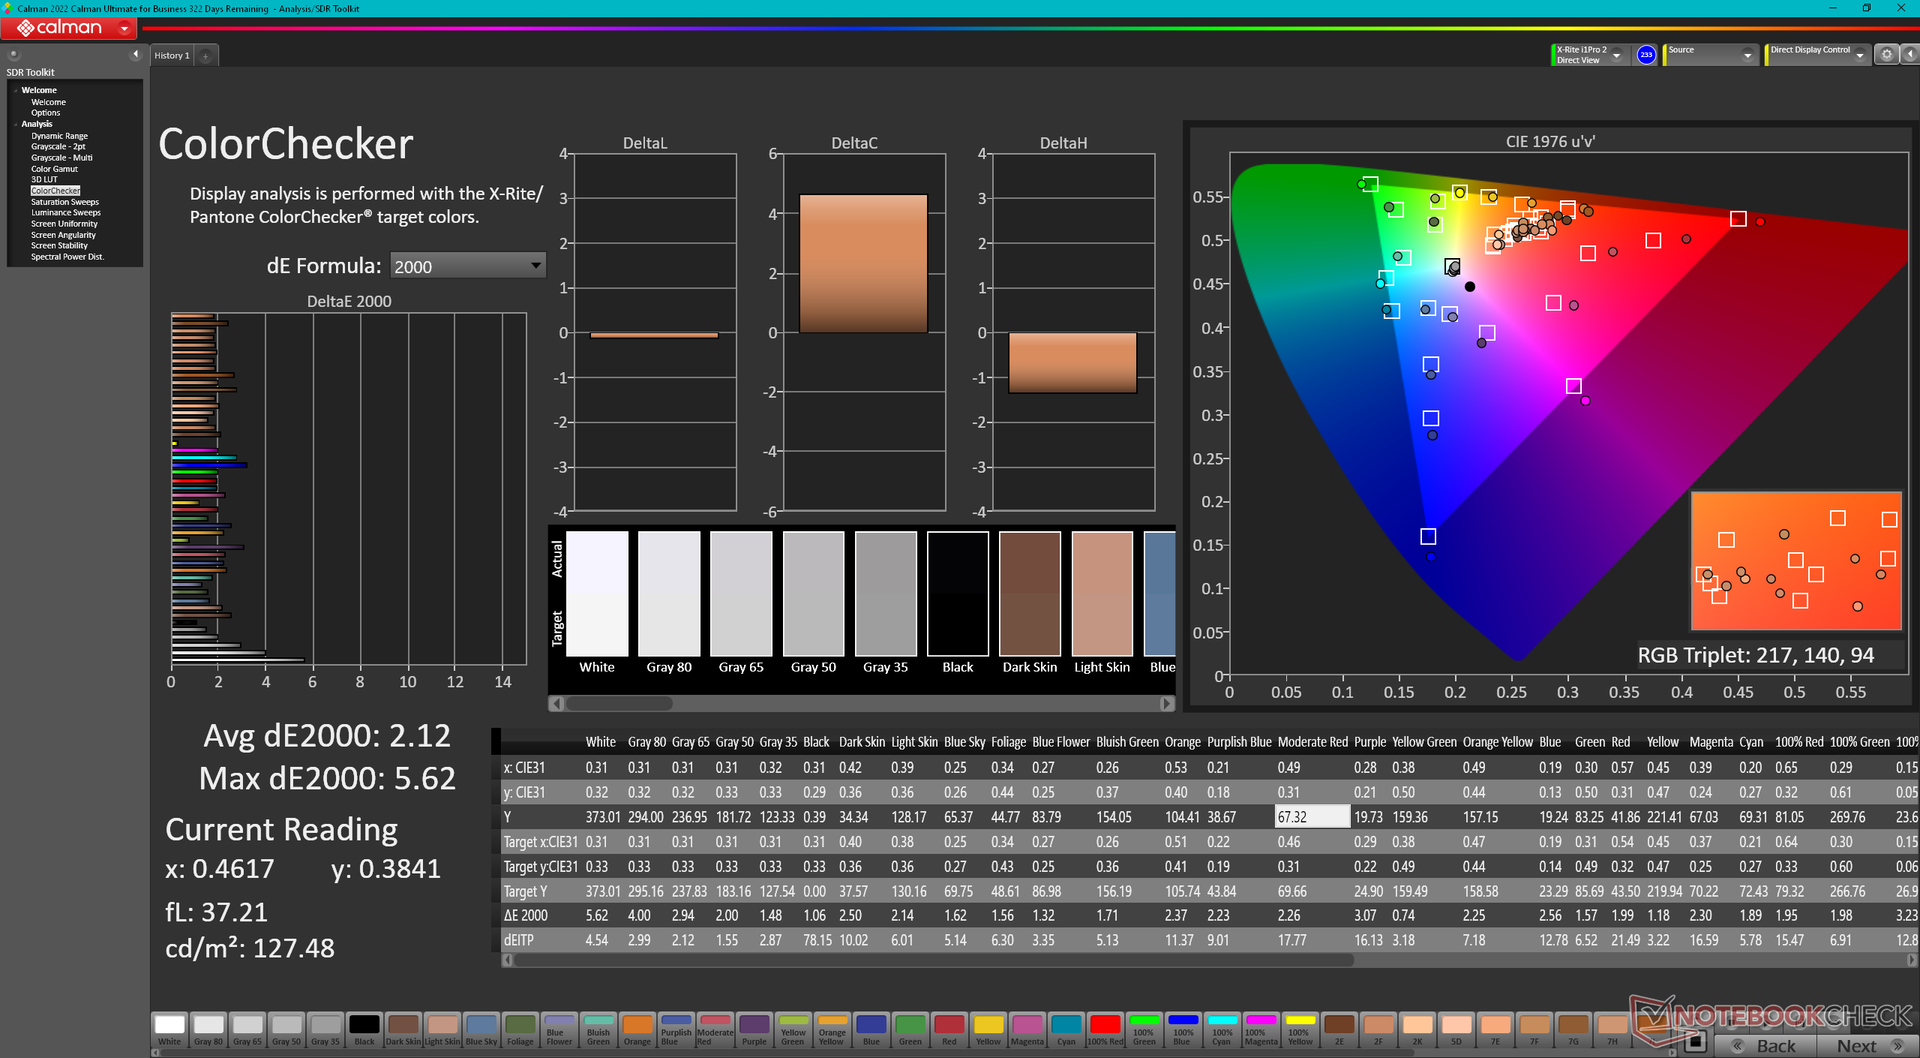
ΔE ColorChecker Calman: 2.12 | ∀{0.5-29.43 Ø4.71}
calibrated: 2.06
ΔE Greyscale Calman: 2.5 | ∀{0.09-98 Ø4.96}
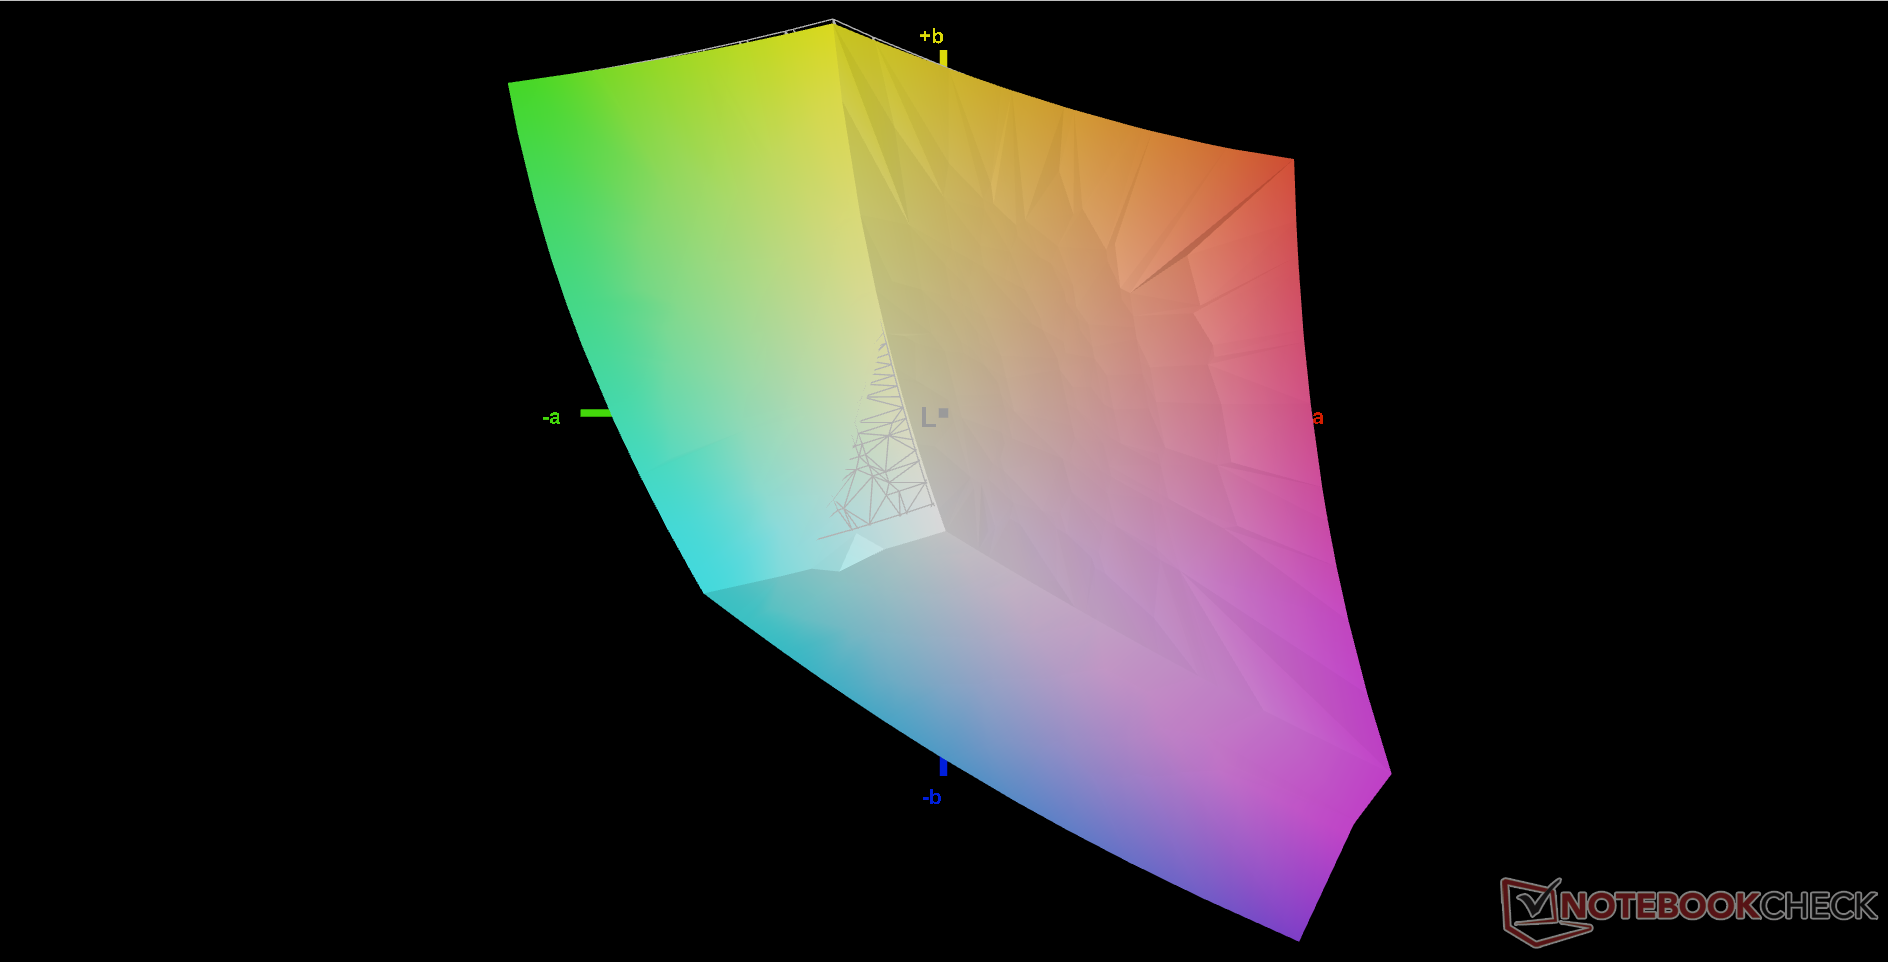
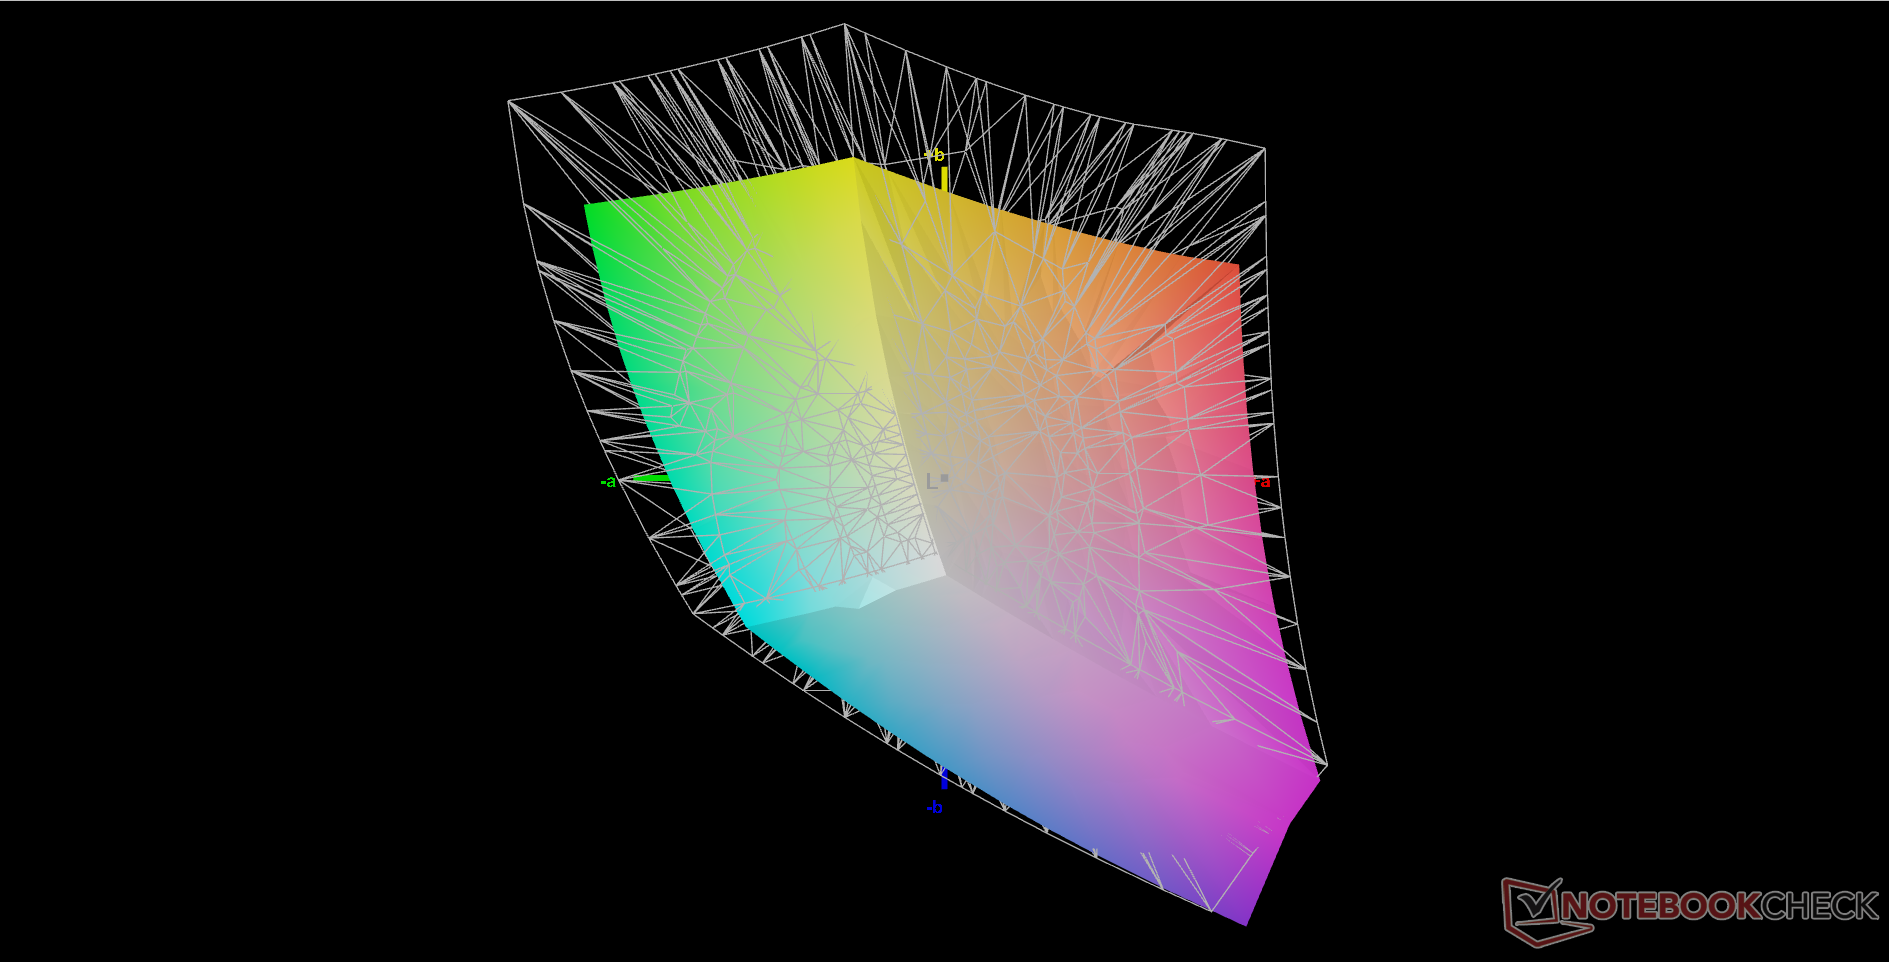
73.4% AdobeRGB 1998 (Argyll 3D)
99.2% sRGB (Argyll 3D)
74.4% Display P3 (Argyll 3D)
Gamma: 2.3
CCT: 6408 K
| HP Omen 16-n0033dx BOE0AAE, IPS, 1920x1080, 16.1" | HP Envy 16 h0112nr Samsung SDC4174, OLED, 3840x2400, 16" | HP Omen 16-b1090ng BOE09E5, IPS, 2560x1440, 16.1" | HP Victus 16-e0145ng CMN1609, IPS, 1920x1080, 16.1" | Lenovo Legion S7 16ARHA7 BOE CQ NE160QDM-NY1, IPS, 2560x1600, 16" | Dell G16 7620 BOE NE16QDM, IPS, 2560x1600, 16" | |
|---|---|---|---|---|---|---|
| Display | 18% | -2% | -41% | -3% | -4% | |
| Display P3 Coverage (%) | 74.4 | 99.3 33% | 71 -5% | 41.6 -44% | 69.8 -6% | 68.3 -8% |
| sRGB Coverage (%) | 99.2 | 100 1% | 97.9 -1% | 61.9 -38% | 98.1 -1% | 98 -1% |
| AdobeRGB 1998 Coverage (%) | 73.4 | 88 20% | 73.3 0% | 43 -41% | 71.9 -2% | 70.5 -4% |
| Response Times | 86% | 17% | -71% | 15% | 29% | |
| Response Time Grey 50% / Grey 80% * (ms) | 17.6 ? | 2 ? 89% | 14.5 ? 18% | 29.6 ? -68% | 10 ? 43% | 8.6 ? 51% |
| Response Time Black / White * (ms) | 11.2 ? | 1.9 ? 83% | 9.4 ? 16% | 19.4 ? -73% | 12.8 ? -14% | 10.4 ? 7% |
| PWM Frequency (Hz) | 240.4 ? | |||||
| Screen | 12% | -28% | -87% | 28% | 13% | |
| Brightness middle (cd/m²) | 373.3 | 328.8 -12% | 335 -10% | 257 -31% | 492.4 32% | 369.4 -1% |
| Brightness (cd/m²) | 361 | 332 -8% | 319 -12% | 239 -34% | 471 30% | 348 -4% |
| Brightness Distribution (%) | 79 | 97 23% | 90 14% | 88 11% | 90 14% | 83 5% |
| Black Level * (cd/m²) | 0.44 | 0.28 36% | 0.25 43% | 0.4 9% | 0.32 27% | |
| Contrast (:1) | 848 | 1196 41% | 1028 21% | 1231 45% | 1154 36% | |
| Colorchecker dE 2000 * | 2.12 | 1.53 28% | 4.38 -107% | 6.91 -226% | 1.9 10% | 1.78 16% |
| Colorchecker dE 2000 max. * | 5.62 | 6.04 -7% | 9.48 -69% | 22.27 -296% | 3.81 32% | 4.41 22% |
| Colorchecker dE 2000 calibrated * | 2.06 | 1.33 35% | 3.61 -75% | 0.99 52% | 1.22 41% | |
| Greyscale dE 2000 * | 2.5 | 1.3 48% | 7 -180% | 7.5 -200% | 1.7 32% | 3.2 -28% |
| Gamma | 2.3 96% | 2.18 101% | 2.103 105% | 2.125 104% | 2.36 93% | 2.2 100% |
| CCT | 6408 101% | 6362 102% | 6244 104% | 6025 108% | 6497 100% | 6750 96% |
| Média Total (Programa/Configurações) | 39% /
27% | -4% /
-16% | -66% /
-75% | 13% /
20% | 13% /
11% |
* ... menor é melhor
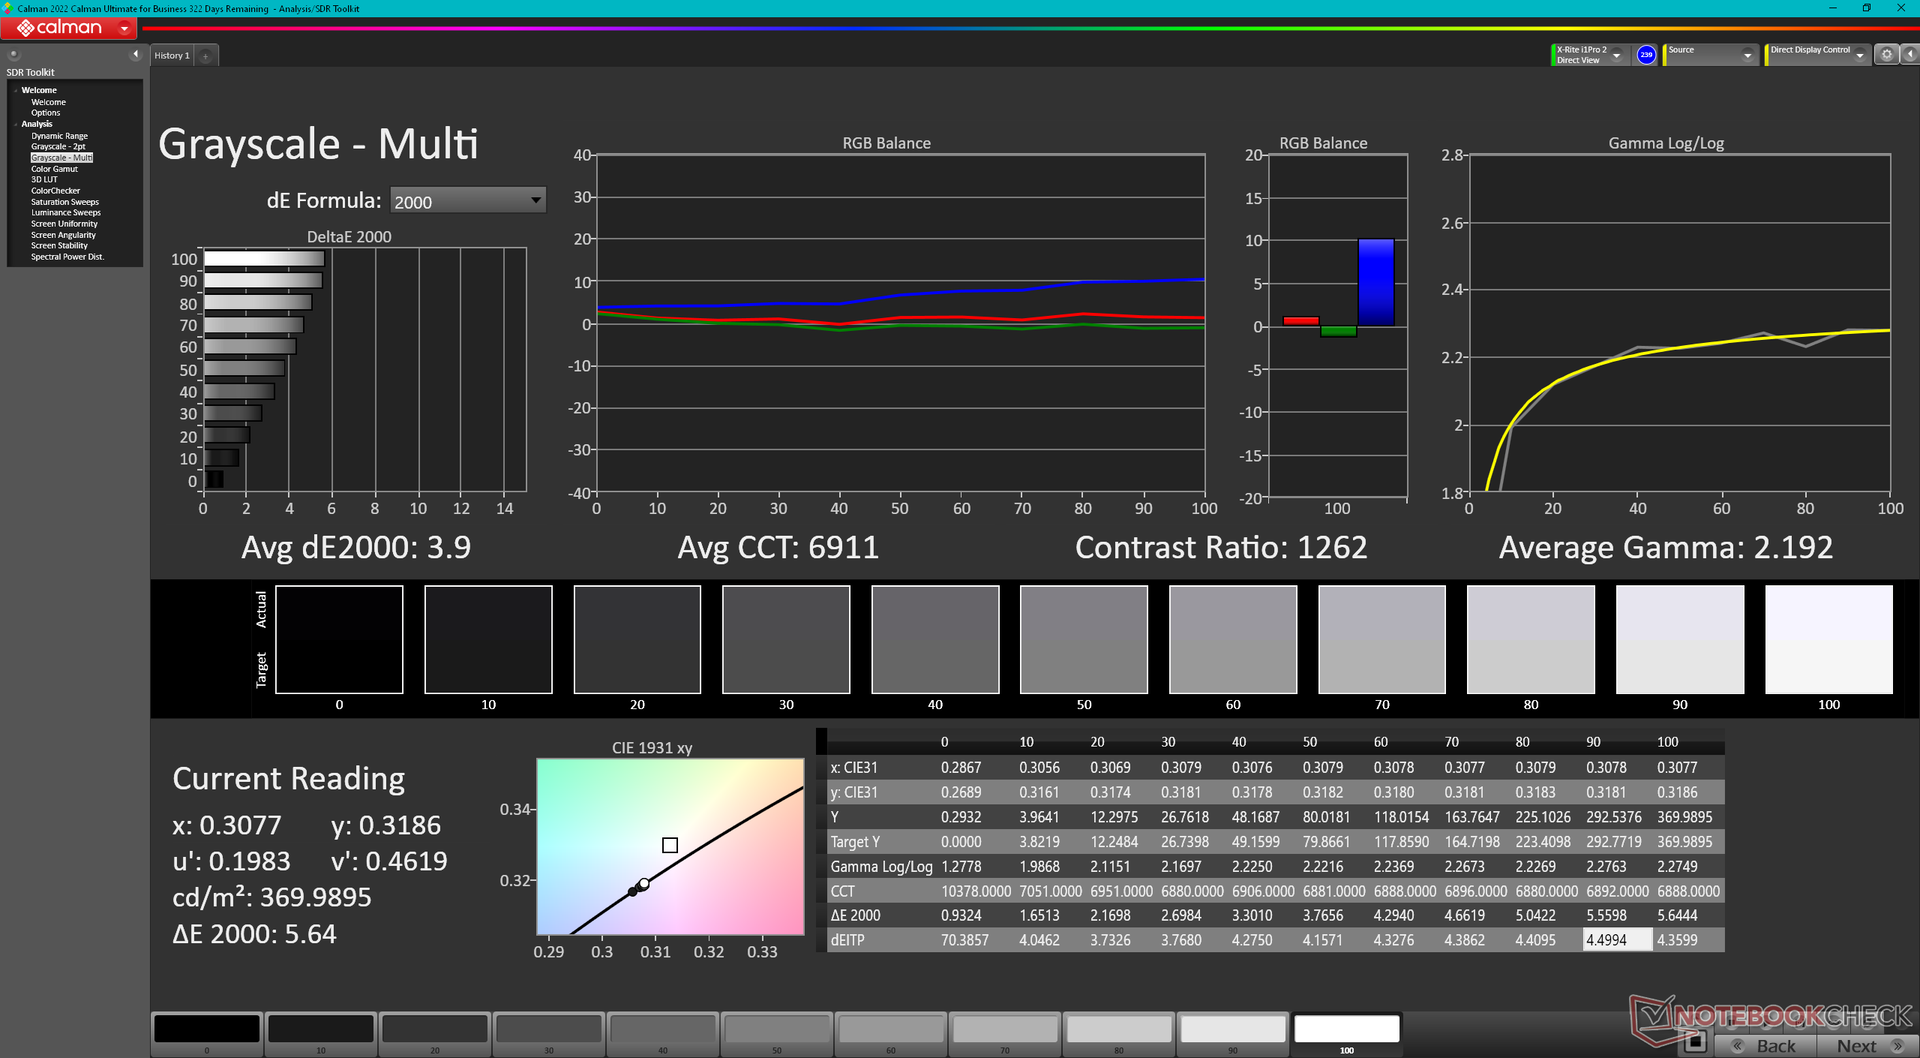
O display já está decentemente calibrado fora da caixa com valores médios de escala de cinza e deltaE de cor de apenas 2,5 e 2,12, respectivamente. Tentar calibrá-lo ainda mais com nosso colorímetro X-Rite melhoraria as cores apenas ligeiramente, mas não o suficiente para tornar a calibração do usuário final essencial.

Exibir tempos de resposta
| ↔ Tempo de resposta preto para branco | ||
|---|---|---|
| 11.2 ms ... ascensão ↗ e queda ↘ combinadas | ↗ 6.8 ms ascensão | 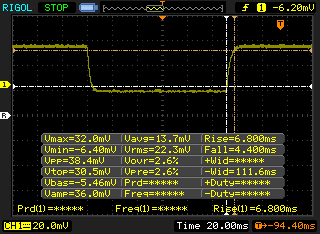 |
| ↘ 4.4 ms queda | ||
| A tela mostra boas taxas de resposta em nossos testes, mas pode ser muito lenta para jogadores competitivos. Em comparação, todos os dispositivos testados variam de 0.1 (mínimo) a 240 (máximo) ms. » 30 % de todos os dispositivos são melhores. Isso significa que o tempo de resposta medido é melhor que a média de todos os dispositivos testados (19.8 ms). | ||
| ↔ Tempo de resposta 50% cinza a 80% cinza | ||
| 17.6 ms ... ascensão ↗ e queda ↘ combinadas | ↗ 10 ms ascensão | 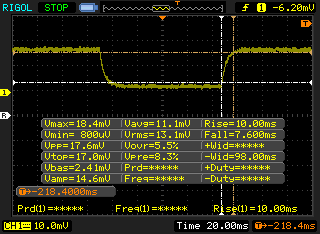 |
| ↘ 7.6 ms queda | ||
| A tela mostra boas taxas de resposta em nossos testes, mas pode ser muito lenta para jogadores competitivos. Em comparação, todos os dispositivos testados variam de 0.165 (mínimo) a 636 (máximo) ms. » 32 % de todos os dispositivos são melhores. Isso significa que o tempo de resposta medido é melhor que a média de todos os dispositivos testados (31 ms). | ||
Cintilação da tela / PWM (modulação por largura de pulso)
| Tela tremeluzindo / PWM não detectado | 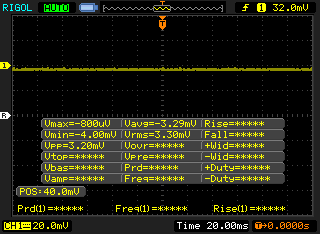 | ||
[pwm_comparison] Em comparação: 52 % de todos os dispositivos testados não usam PWM para escurecer a tela. Se PWM foi detectado, uma média de 7754 (mínimo: 5 - máximo: 343500) Hz foi medida. | |||
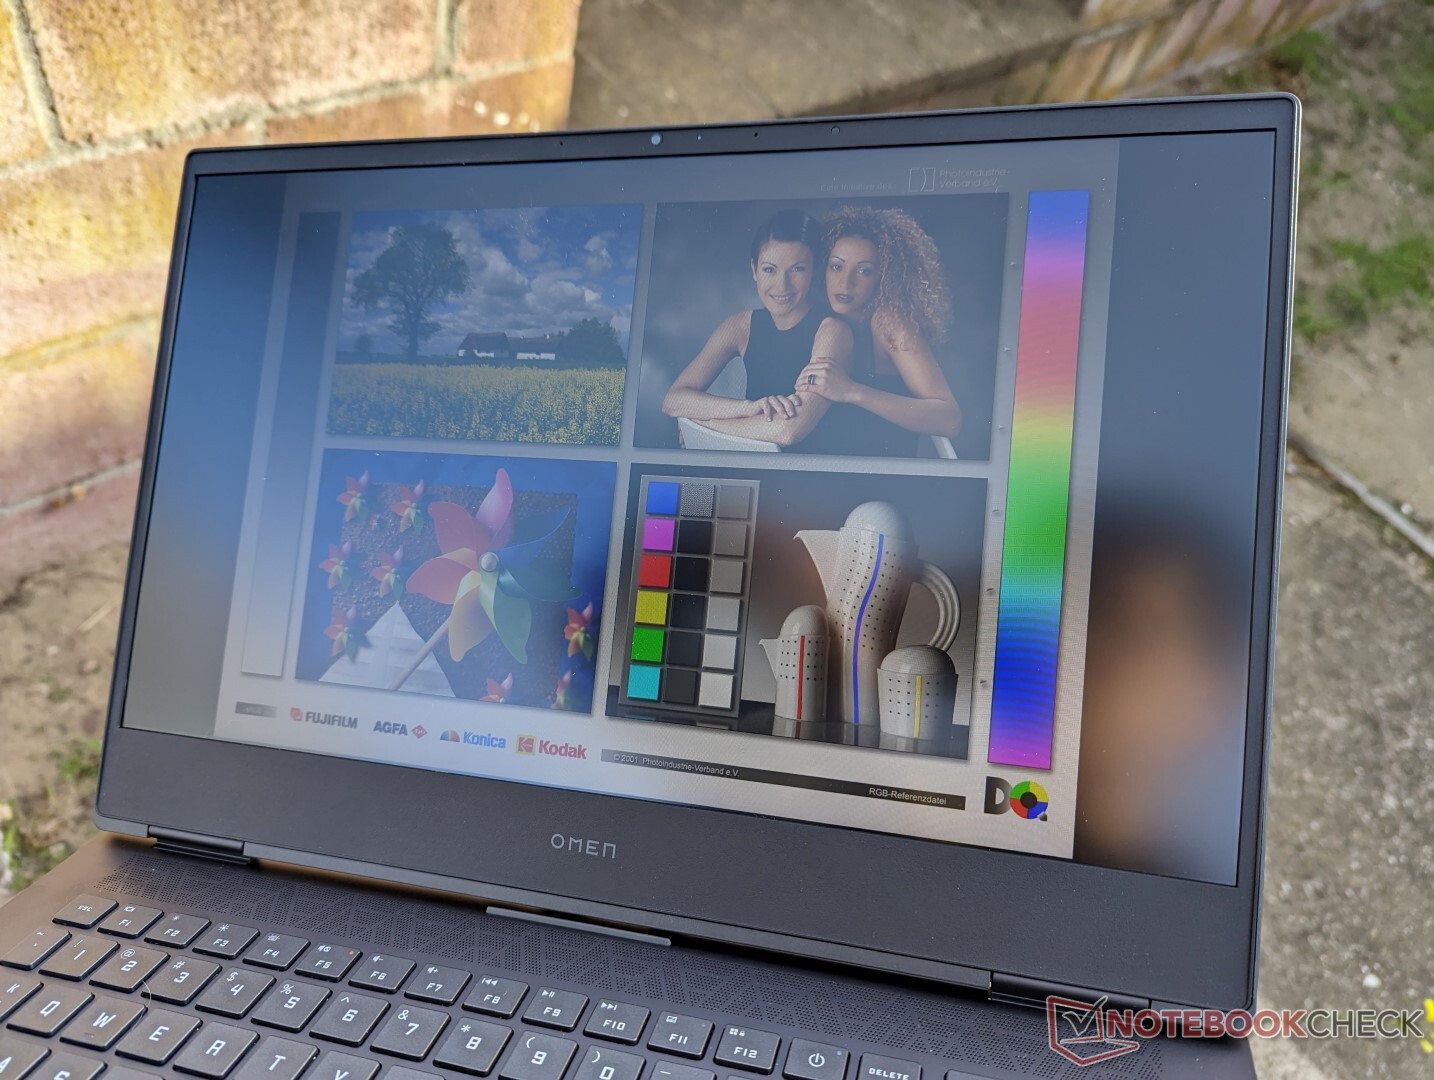
A visibilidade ao ar livre é boa sob a sombra enquanto qualquer coisa mais brilhante lavará a tela. A tela da Lenovo Legion S7 16 pode alcançar quase 500 lêndeas em comparação a apenas 370 lêndeas em nosso HP para ser a melhor opção se a visibilidade ao ar livre for uma preocupação. Certifique-se de desativar o AMD Vari-Bright no HP ou então a luminosidade máxima cairá automaticamente quando a bateria estiver ligada.
Desempenho
Condições de teste
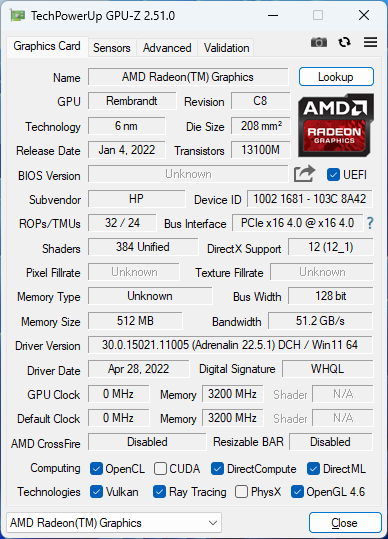
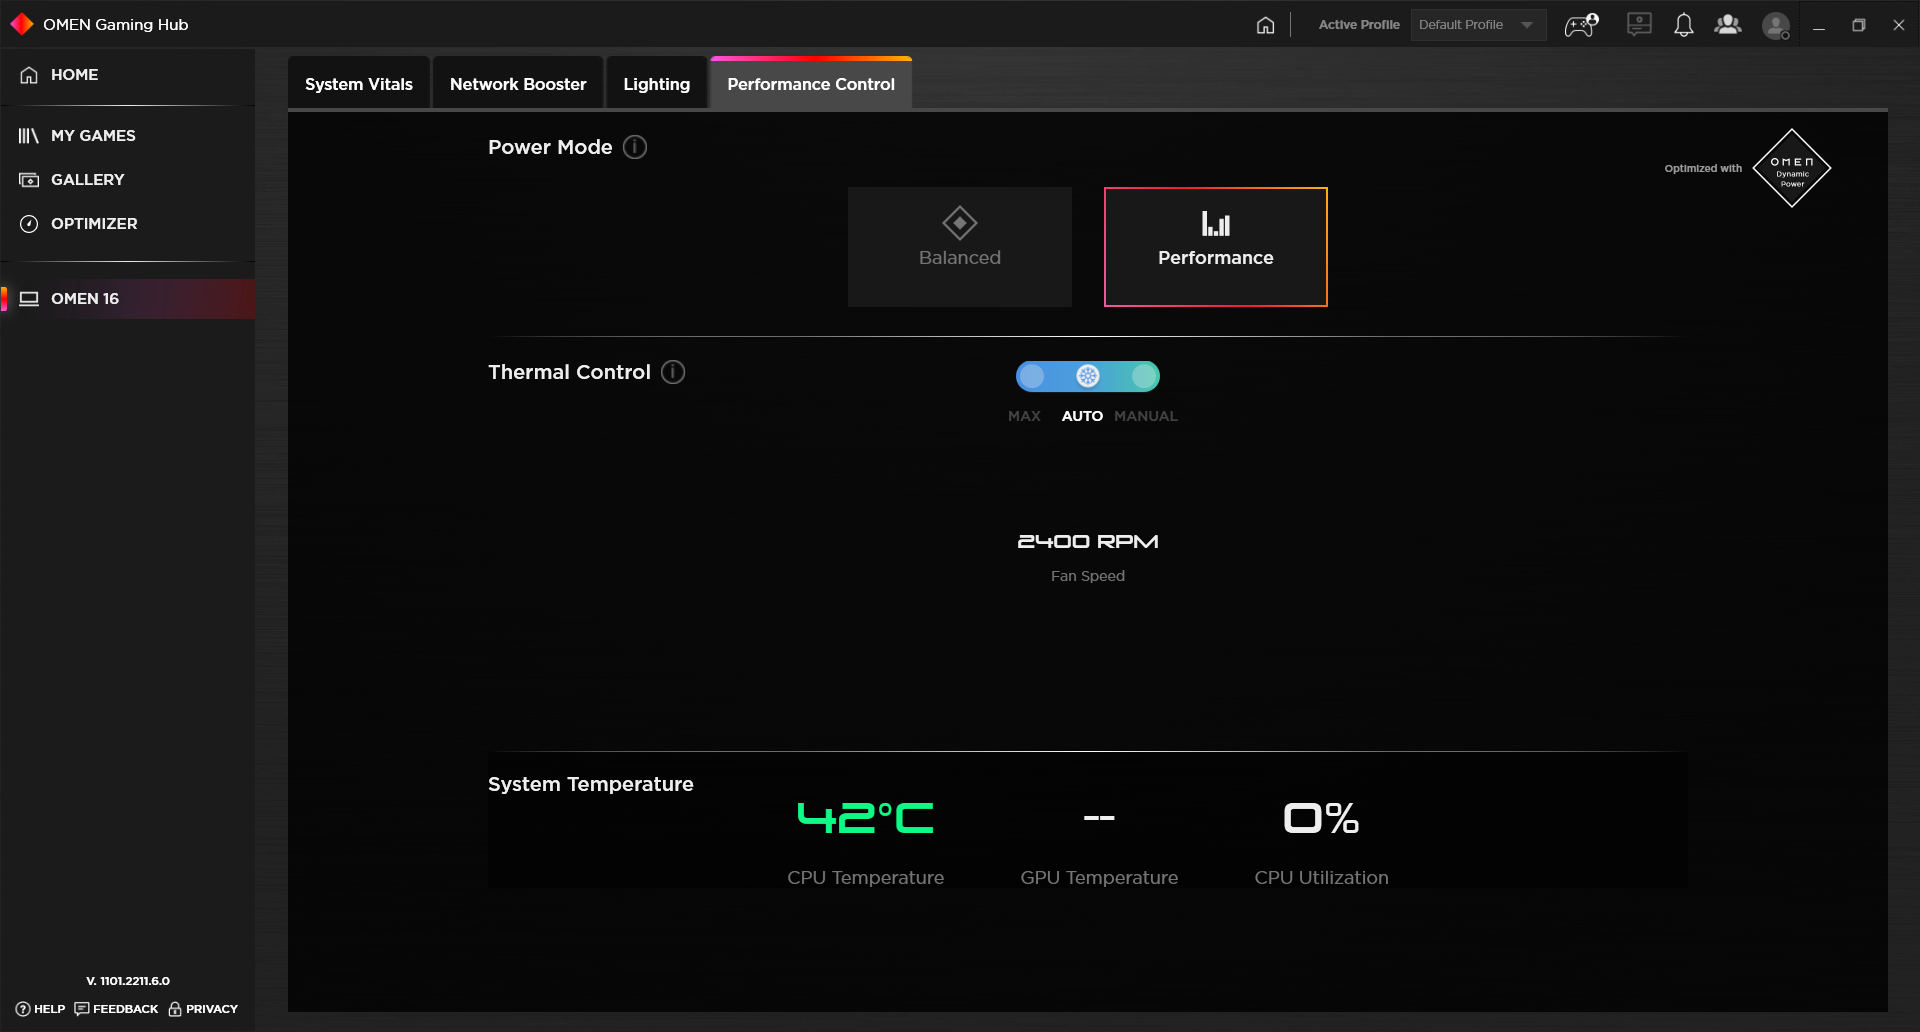
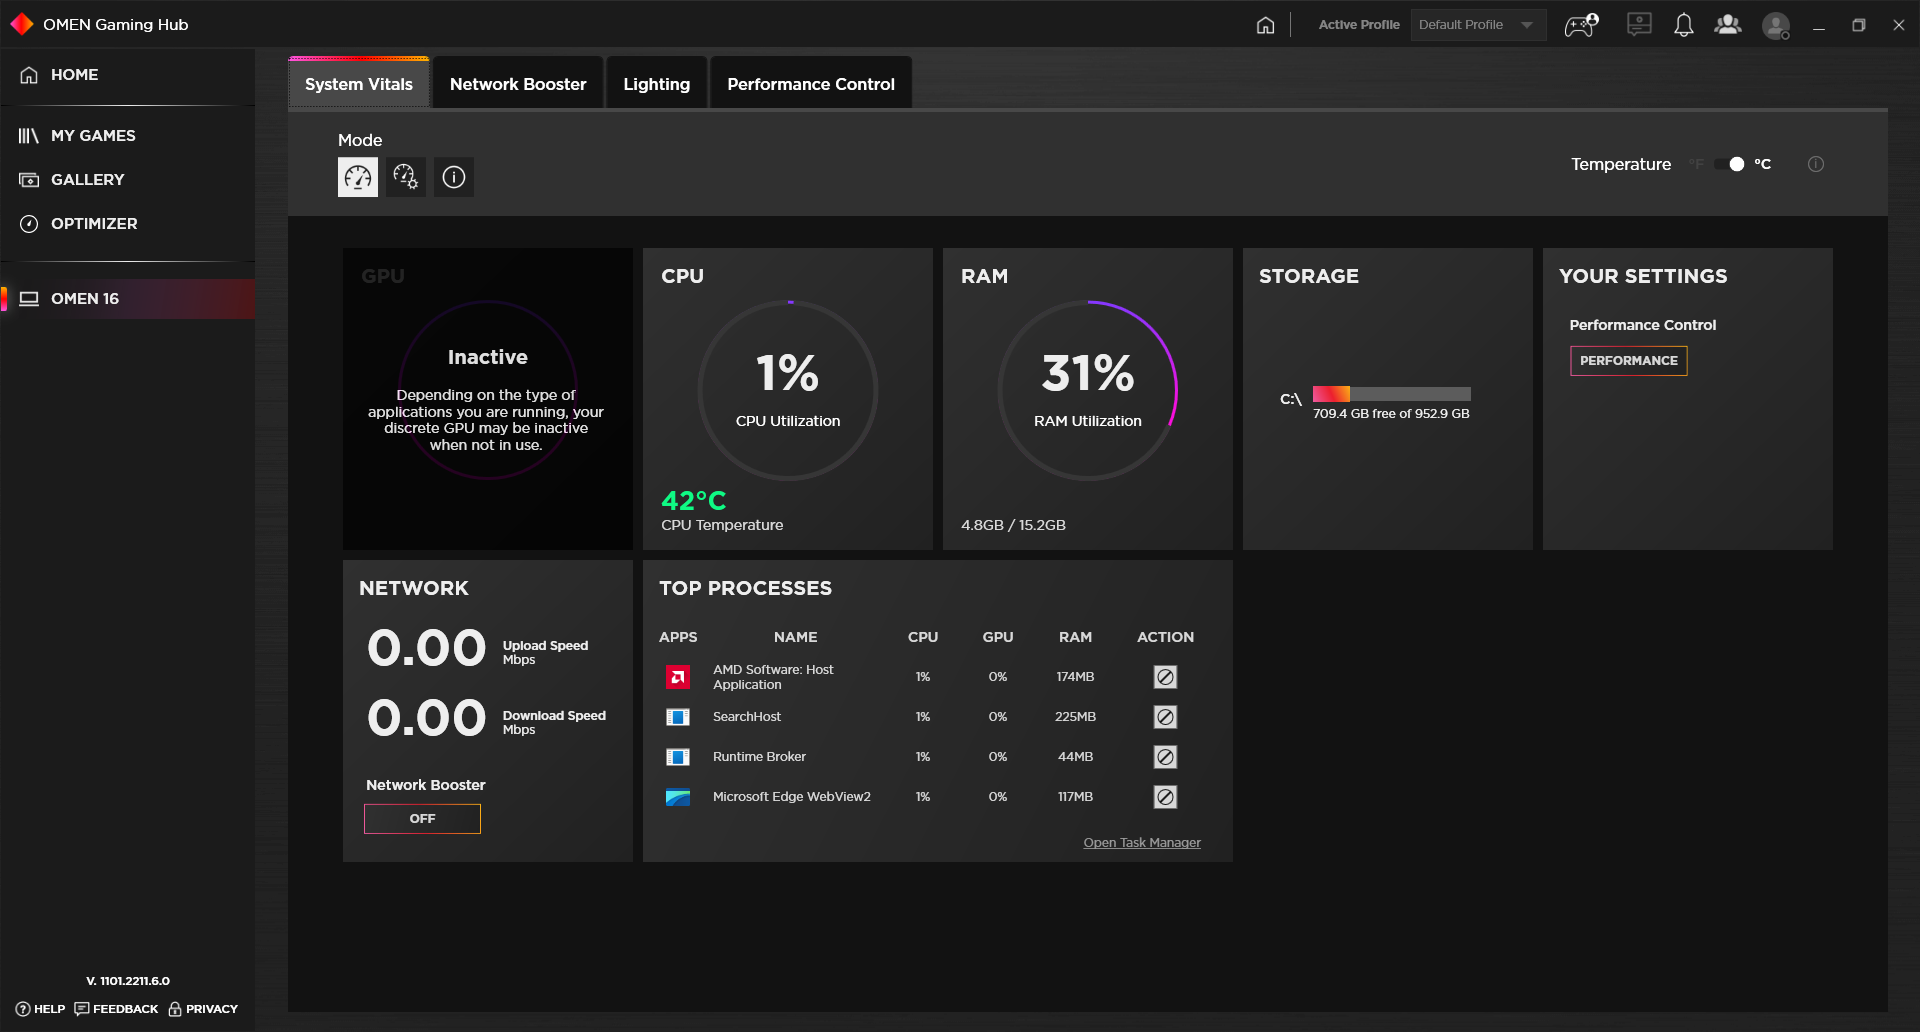
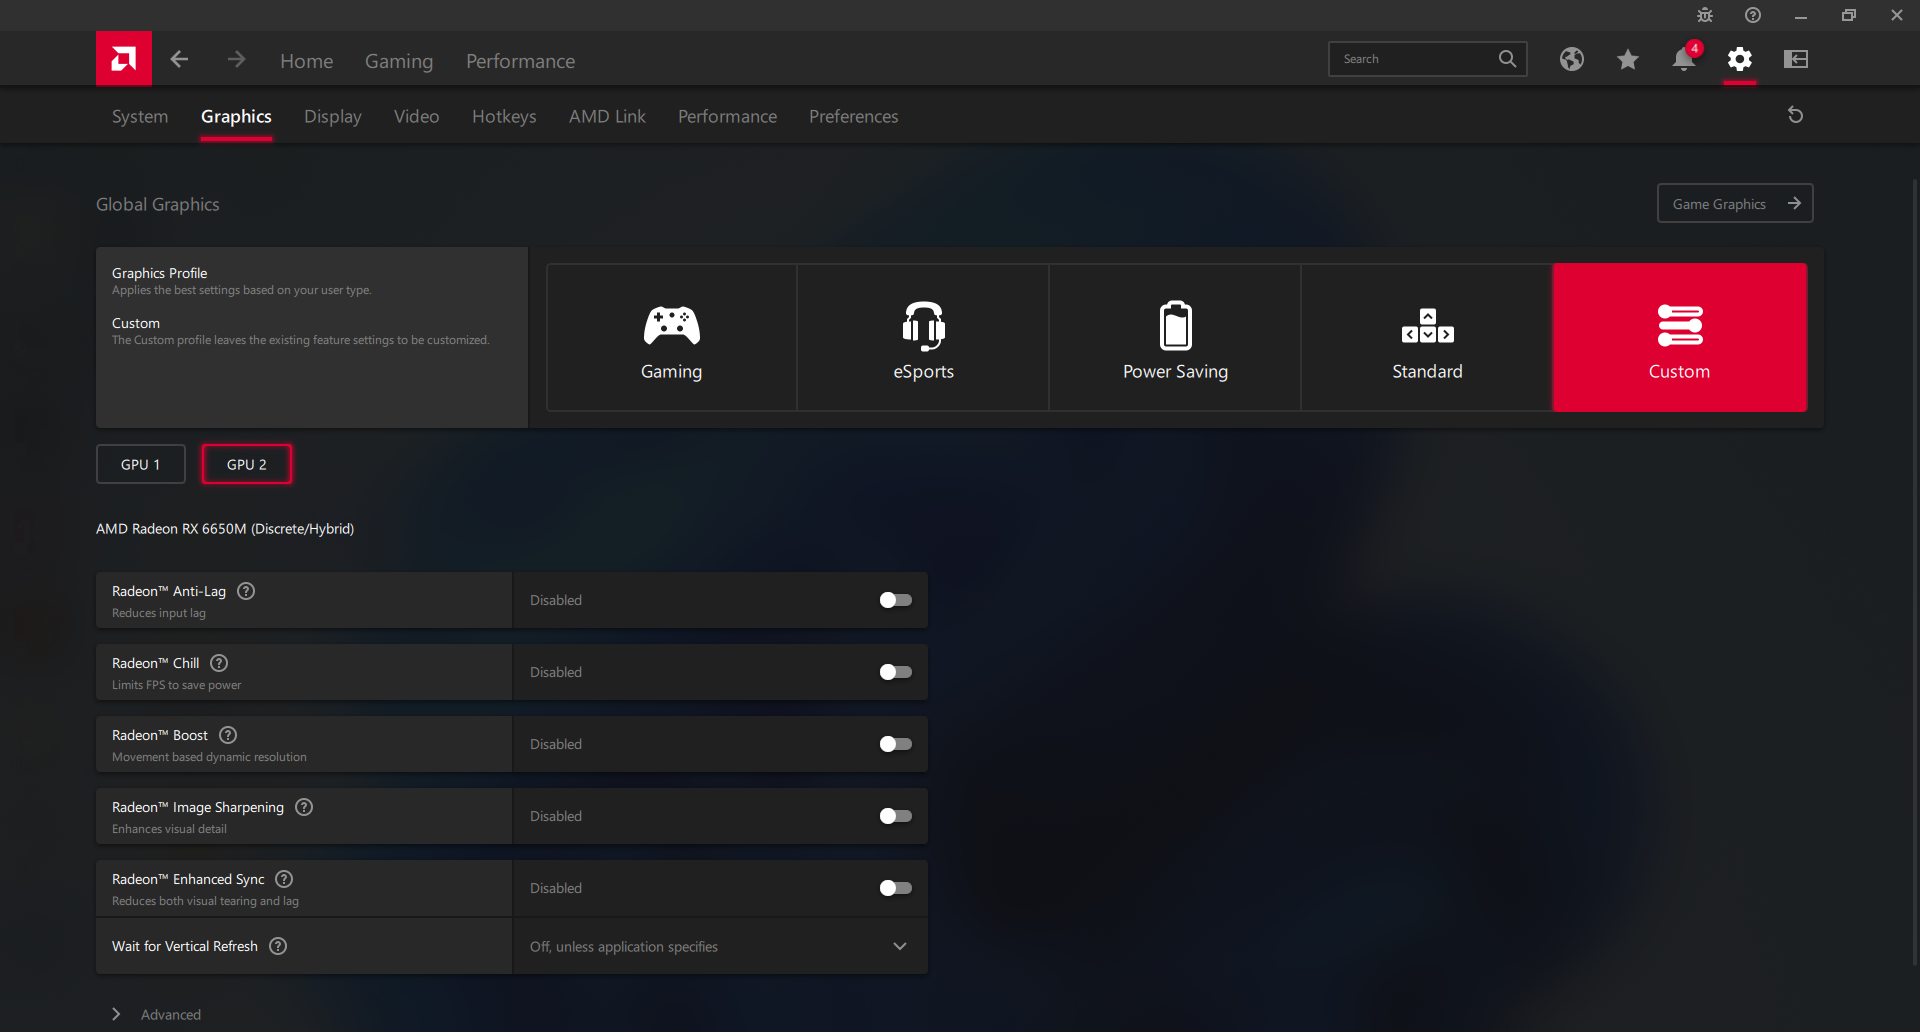
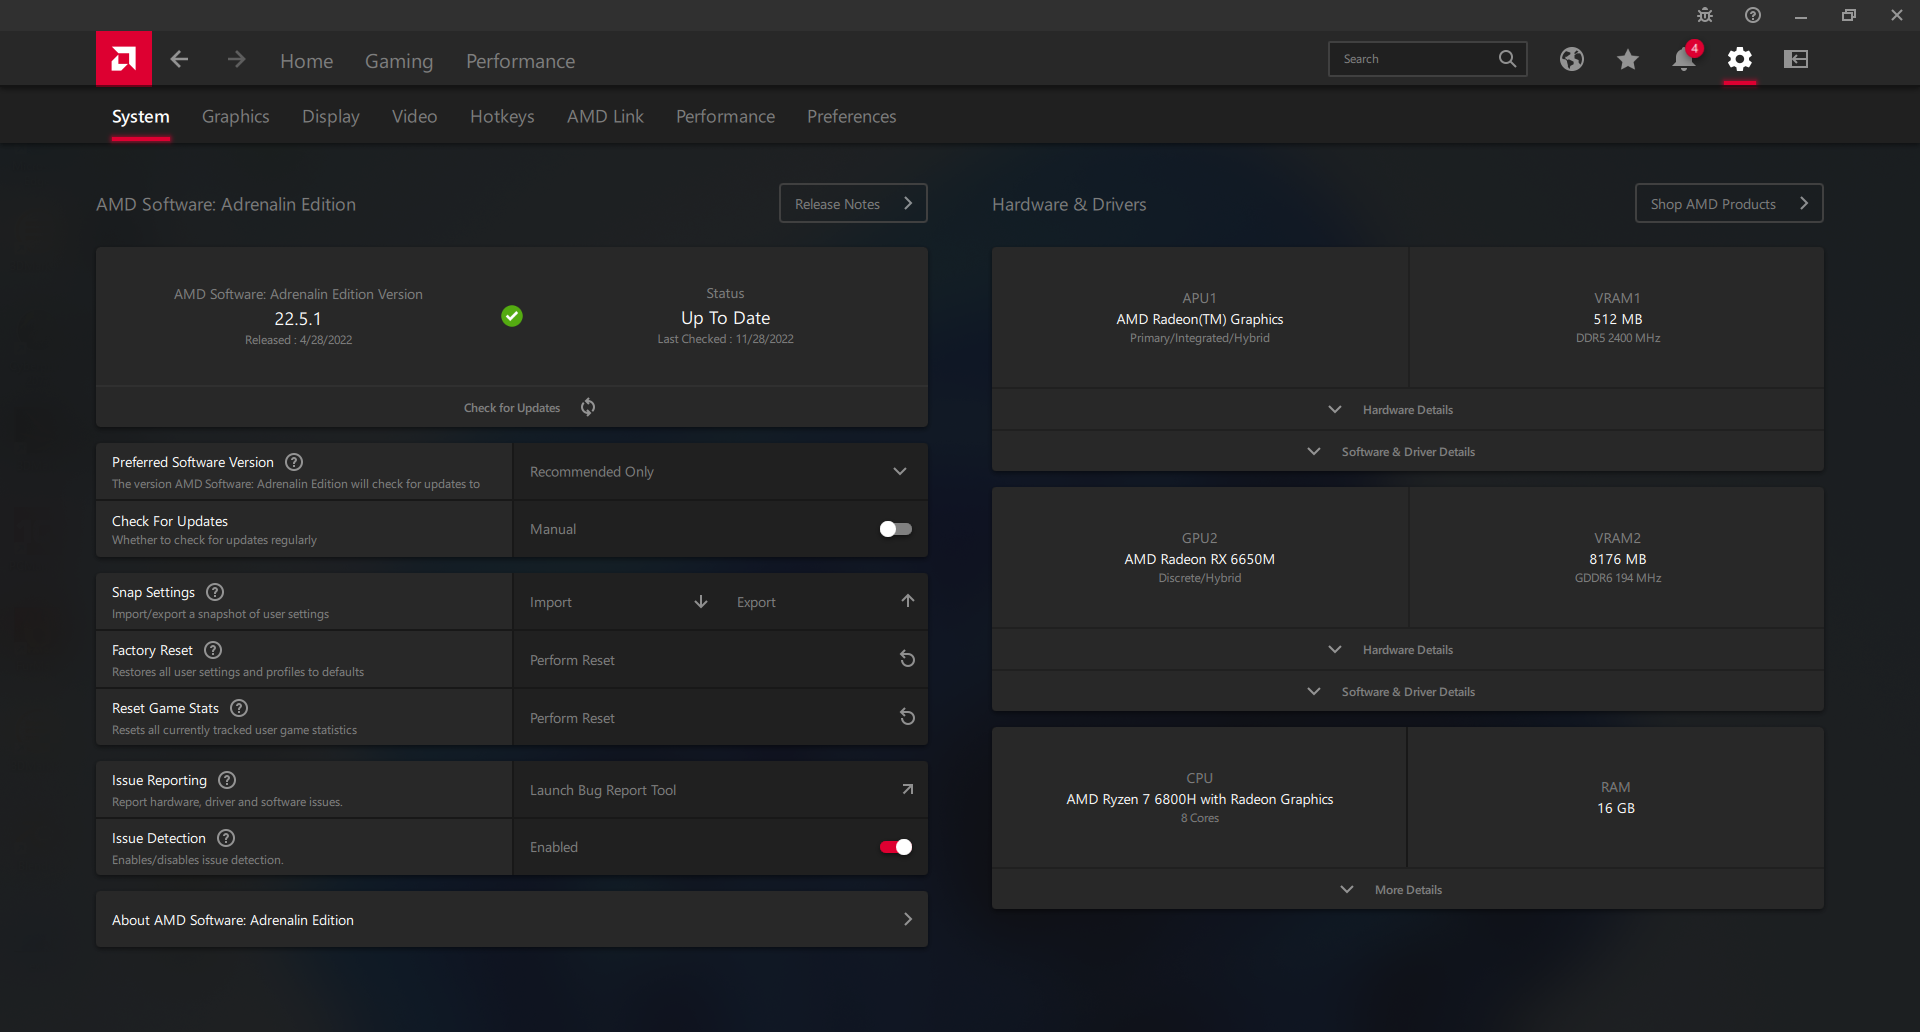
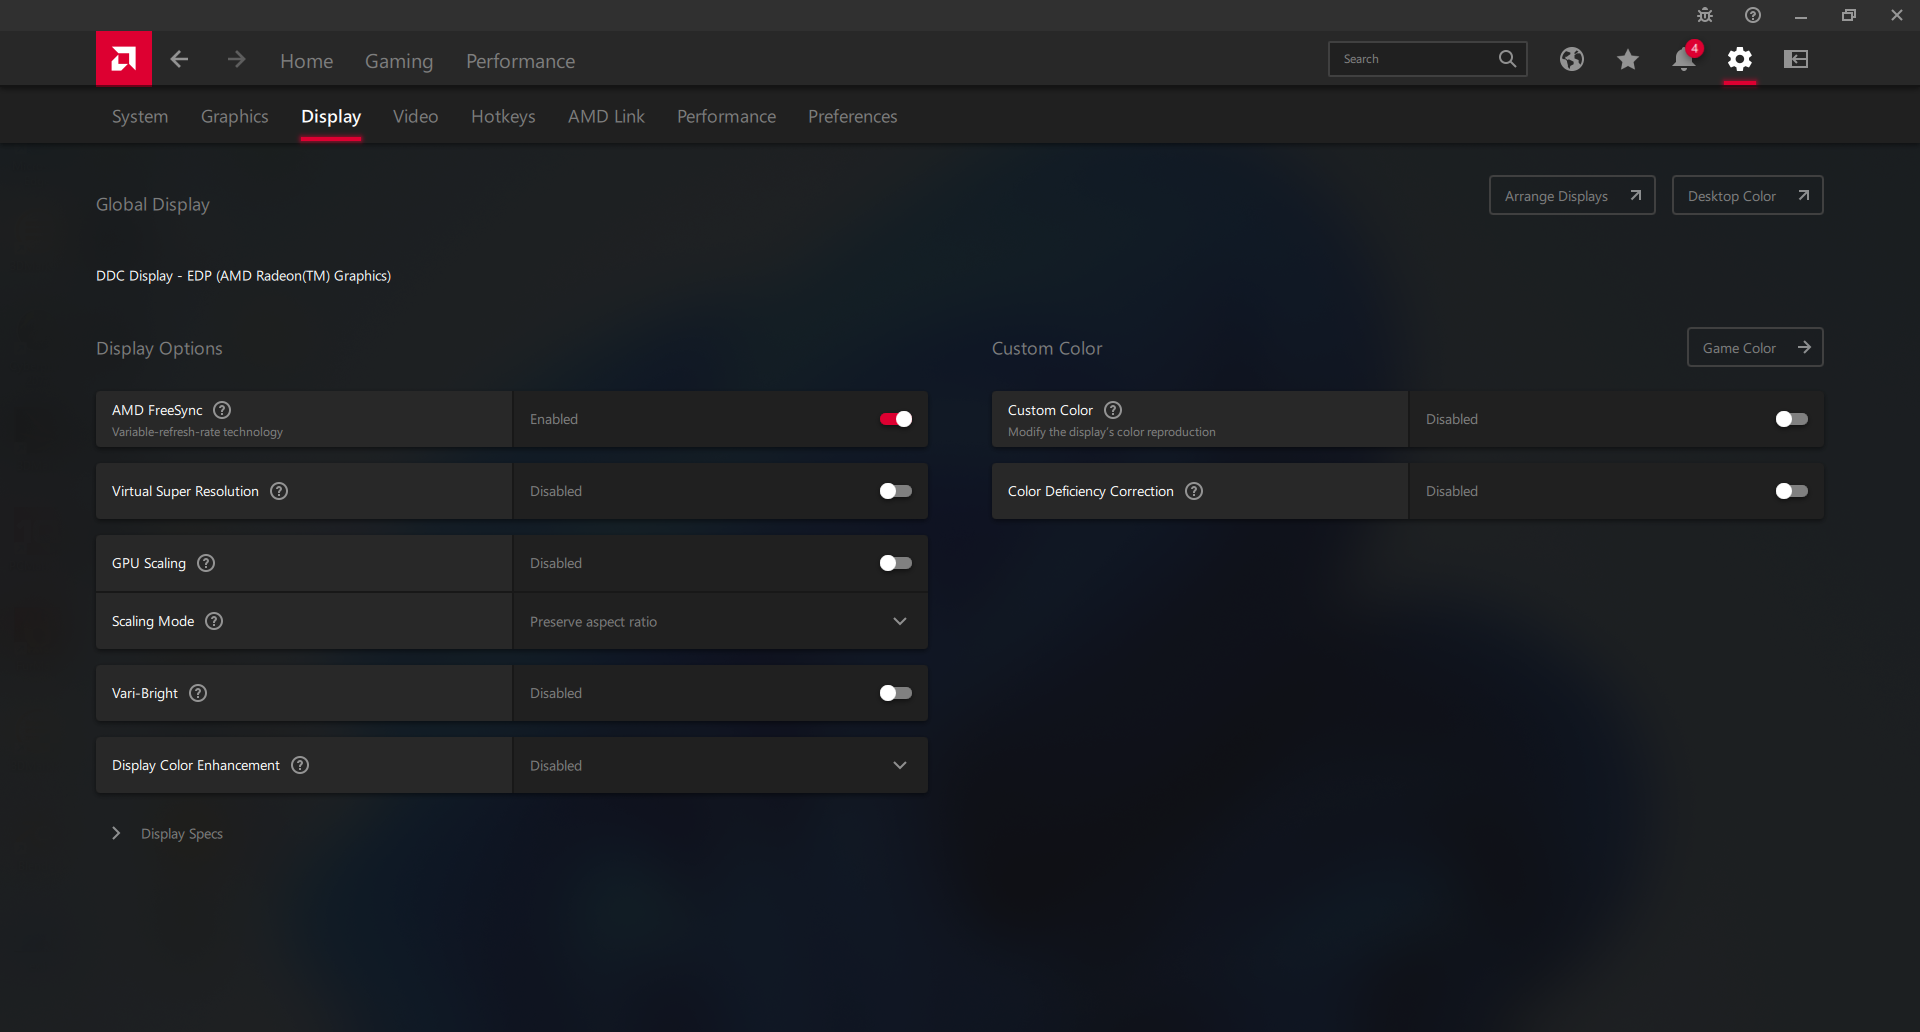
Definimos nossa unidade para o modo "Melhor Desempenho" via Windows e "Desempenho" via software Omen Gaming Hub antes de executar qualquer benchmarks de desempenho abaixo. Recomendamos vivamente que nos acostumemos aos aplicativos Omen Gaming Hub e Radeon Adrenalin, pois ambos são hubs de controle para ajustar perfis de potência, iluminação do teclado, sincronização adaptativa, Vari-Bright, e muito mais, como mostram as capturas de tela abaixo.
Não encontramos nenhuma chave MUX em nenhum lugar do laptop, seja na tela BIOS ou no software Omen Gamingmen Hub.
Processador
O desempenho bruto da CPU é cerca de 5% mais lento do que a média dos portáteis em nosso banco de dados equipados com o mesmo Ryzen 7 6800H processador. Nossa CPU é, portanto, apenas cerca de 10% mais rápida do que a do ano passado Ryzen 7 5800H para ser uma atualização marginal ano após ano. A maior diferença entre Zen 3 e Zen 3+ móvel reside em suas soluções gráficas integradas, mas isto é quase irrelevante em laptops de jogos como o Omen 16, pois eles quase sempre vêm com GPUs dedicados mais rápidos.
O desempenho de rosca única e rosca múltipla é cerca de 10% e 25% mais lento, respectivamente, do que os concorrentes Núcleo i7-12700H na Dell G16 7620. Optando pelo preço Núcleo i9-12900H A configuração Omen 16 aumentaria o desempenho em 30 a 35 por cento em relação à nossa SKU Ryzen.
Cinebench R15 Multi Loop
Cinebench R23: Multi Core | Single Core
Cinebench R15: CPU Multi 64Bit | CPU Single 64Bit
Blender: v2.79 BMW27 CPU
7-Zip 18.03: 7z b 4 | 7z b 4 -mmt1
Geekbench 5.5: Multi-Core | Single-Core
HWBOT x265 Benchmark v2.2: 4k Preset
LibreOffice : 20 Documents To PDF
R Benchmark 2.5: Overall mean
Cinebench R23: Multi Core | Single Core
Cinebench R15: CPU Multi 64Bit | CPU Single 64Bit
Blender: v2.79 BMW27 CPU
7-Zip 18.03: 7z b 4 | 7z b 4 -mmt1
Geekbench 5.5: Multi-Core | Single-Core
HWBOT x265 Benchmark v2.2: 4k Preset
LibreOffice : 20 Documents To PDF
R Benchmark 2.5: Overall mean
* ... menor é melhor
AIDA64: FP32 Ray-Trace | FPU Julia | CPU SHA3 | CPU Queen | FPU SinJulia | FPU Mandel | CPU AES | CPU ZLib | FP64 Ray-Trace | CPU PhotoWorxx
| Performance rating | |
| Lenovo Legion S7 16ARHA7 | |
| HP Omen 16-n0033dx | |
| Média AMD Ryzen 7 6800H | |
| Dell G16 7620 | |
| HP Envy 16 h0112nr | |
| HP Omen 16-b1090ng | |
| HP Victus 16-e0145ng | |
| AIDA64 / FP32 Ray-Trace | |
| Lenovo Legion S7 16ARHA7 | |
| HP Omen 16-n0033dx | |
| Média AMD Ryzen 7 6800H (12876 - 17031, n=8) | |
| Dell G16 7620 | |
| HP Envy 16 h0112nr | |
| HP Victus 16-e0145ng | |
| HP Omen 16-b1090ng | |
| AIDA64 / FPU Julia | |
| Lenovo Legion S7 16ARHA7 | |
| HP Omen 16-n0033dx | |
| Média AMD Ryzen 7 6800H (82673 - 105987, n=8) | |
| Dell G16 7620 | |
| HP Victus 16-e0145ng | |
| HP Envy 16 h0112nr | |
| HP Omen 16-b1090ng | |
| AIDA64 / CPU SHA3 | |
| Dell G16 7620 | |
| Lenovo Legion S7 16ARHA7 | |
| HP Omen 16-n0033dx | |
| Média AMD Ryzen 7 6800H (2886 - 3634, n=8) | |
| HP Envy 16 h0112nr | |
| HP Omen 16-b1090ng | |
| HP Victus 16-e0145ng | |
| AIDA64 / CPU Queen | |
| Lenovo Legion S7 16ARHA7 | |
| HP Omen 16-n0033dx | |
| Dell G16 7620 | |
| HP Envy 16 h0112nr | |
| HP Omen 16-b1090ng | |
| Média AMD Ryzen 7 6800H (75117 - 106322, n=8) | |
| HP Victus 16-e0145ng | |
| AIDA64 / FPU SinJulia | |
| Lenovo Legion S7 16ARHA7 | |
| HP Omen 16-n0033dx | |
| Média AMD Ryzen 7 6800H (11771 - 13120, n=8) | |
| Dell G16 7620 | |
| HP Omen 16-b1090ng | |
| HP Victus 16-e0145ng | |
| HP Envy 16 h0112nr | |
| AIDA64 / FPU Mandel | |
| Lenovo Legion S7 16ARHA7 | |
| HP Omen 16-n0033dx | |
| Média AMD Ryzen 7 6800H (45287 - 58327, n=8) | |
| HP Victus 16-e0145ng | |
| Dell G16 7620 | |
| HP Envy 16 h0112nr | |
| HP Omen 16-b1090ng | |
| AIDA64 / CPU AES | |
| Lenovo Legion S7 16ARHA7 | |
| HP Omen 16-n0033dx | |
| Média AMD Ryzen 7 6800H (67816 - 137383, n=8) | |
| HP Envy 16 h0112nr | |
| HP Omen 16-b1090ng | |
| Dell G16 7620 | |
| HP Victus 16-e0145ng | |
| AIDA64 / CPU ZLib | |
| Dell G16 7620 | |
| HP Omen 16-b1090ng | |
| Lenovo Legion S7 16ARHA7 | |
| HP Omen 16-n0033dx | |
| Média AMD Ryzen 7 6800H (732 - 901, n=8) | |
| HP Envy 16 h0112nr | |
| HP Victus 16-e0145ng | |
| AIDA64 / FP64 Ray-Trace | |
| Lenovo Legion S7 16ARHA7 | |
| HP Omen 16-n0033dx | |
| Média AMD Ryzen 7 6800H (6917 - 8980, n=8) | |
| Dell G16 7620 | |
| HP Envy 16 h0112nr | |
| HP Victus 16-e0145ng | |
| HP Omen 16-b1090ng | |
| AIDA64 / CPU PhotoWorxx | |
| HP Omen 16-b1090ng | |
| HP Envy 16 h0112nr | |
| Dell G16 7620 | |
| Média AMD Ryzen 7 6800H (26496 - 30360, n=8) | |
| Lenovo Legion S7 16ARHA7 | |
| HP Omen 16-n0033dx | |
| HP Victus 16-e0145ng | |
Desempenho do sistema
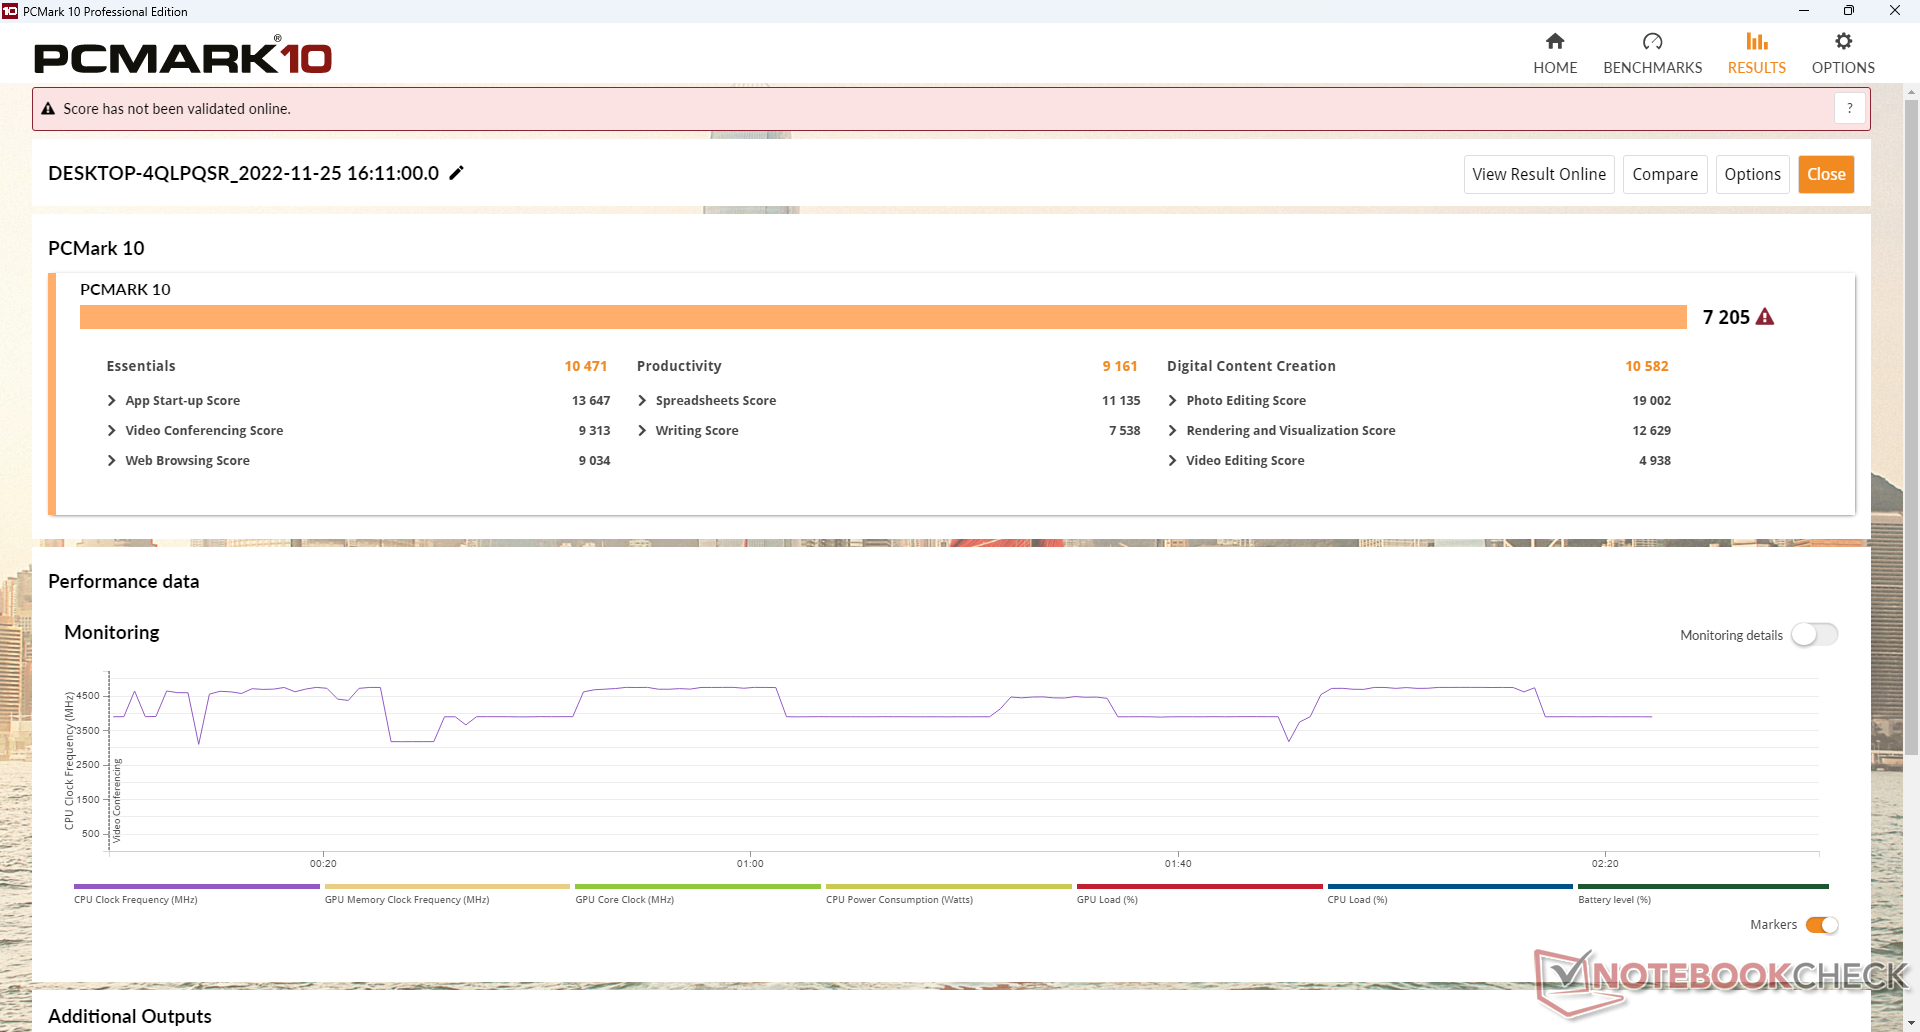
As pontuações PCMark são comparáveis aos últimos laptops para jogos executados nas CPUs Intel do 12º gênero e Nvidia GeForce RTX GPUs. Os resultados estão consistentemente à frente dos Vitória 16 que é uma série de jogos mais amigável ao orçamento da HP.
CrossMark: Overall | Productivity | Creativity | Responsiveness
| PCMark 10 / Score | |
| Lenovo Legion S7 16ARHA7 | |
| HP Envy 16 h0112nr | |
| HP Omen 16-b1090ng | |
| Dell G16 7620 | |
| HP Omen 16-n0033dx | |
| HP Victus 16-e0145ng | |
| PCMark 10 / Essentials | |
| HP Envy 16 h0112nr | |
| Lenovo Legion S7 16ARHA7 | |
| HP Omen 16-n0033dx | |
| Dell G16 7620 | |
| HP Omen 16-b1090ng | |
| HP Victus 16-e0145ng | |
| PCMark 10 / Productivity | |
| Lenovo Legion S7 16ARHA7 | |
| HP Omen 16-b1090ng | |
| HP Envy 16 h0112nr | |
| HP Omen 16-n0033dx | |
| Dell G16 7620 | |
| HP Victus 16-e0145ng | |
| PCMark 10 / Digital Content Creation | |
| Lenovo Legion S7 16ARHA7 | |
| Dell G16 7620 | |
| HP Omen 16-b1090ng | |
| HP Envy 16 h0112nr | |
| HP Omen 16-n0033dx | |
| HP Victus 16-e0145ng | |
| CrossMark / Overall | |
| HP Envy 16 h0112nr | |
| Dell G16 7620 | |
| Lenovo Legion S7 16ARHA7 | |
| HP Omen 16-n0033dx | |
| CrossMark / Productivity | |
| HP Envy 16 h0112nr | |
| Dell G16 7620 | |
| Lenovo Legion S7 16ARHA7 | |
| HP Omen 16-n0033dx | |
| CrossMark / Creativity | |
| HP Envy 16 h0112nr | |
| Dell G16 7620 | |
| Lenovo Legion S7 16ARHA7 | |
| HP Omen 16-n0033dx | |
| CrossMark / Responsiveness | |
| Dell G16 7620 | |
| HP Envy 16 h0112nr | |
| Lenovo Legion S7 16ARHA7 | |
| HP Omen 16-n0033dx | |
| PCMark 10 Score | 7205 pontos | |
Ajuda | ||
| AIDA64 / Memory Copy | |
| HP Omen 16-b1090ng | |
| HP Envy 16 h0112nr | |
| Dell G16 7620 | |
| Média AMD Ryzen 7 6800H (48209 - 51186, n=8) | |
| Lenovo Legion S7 16ARHA7 | |
| HP Omen 16-n0033dx | |
| HP Victus 16-e0145ng | |
| AIDA64 / Memory Read | |
| HP Omen 16-b1090ng | |
| HP Envy 16 h0112nr | |
| Dell G16 7620 | |
| Lenovo Legion S7 16ARHA7 | |
| HP Omen 16-n0033dx | |
| Média AMD Ryzen 7 6800H (43828 - 51778, n=8) | |
| HP Victus 16-e0145ng | |
| AIDA64 / Memory Write | |
| HP Omen 16-b1090ng | |
| HP Envy 16 h0112nr | |
| Dell G16 7620 | |
| Lenovo Legion S7 16ARHA7 | |
| HP Omen 16-n0033dx | |
| Média AMD Ryzen 7 6800H (51116 - 55307, n=8) | |
| HP Victus 16-e0145ng | |
| AIDA64 / Memory Latency | |
| Dell G16 7620 | |
| HP Envy 16 h0112nr | |
| HP Omen 16-b1090ng | |
| Média AMD Ryzen 7 6800H (83.1 - 104.1, n=8) | |
| HP Omen 16-n0033dx | |
| Lenovo Legion S7 16ARHA7 | |
| HP Victus 16-e0145ng | |
* ... menor é melhor
Latência do DPC
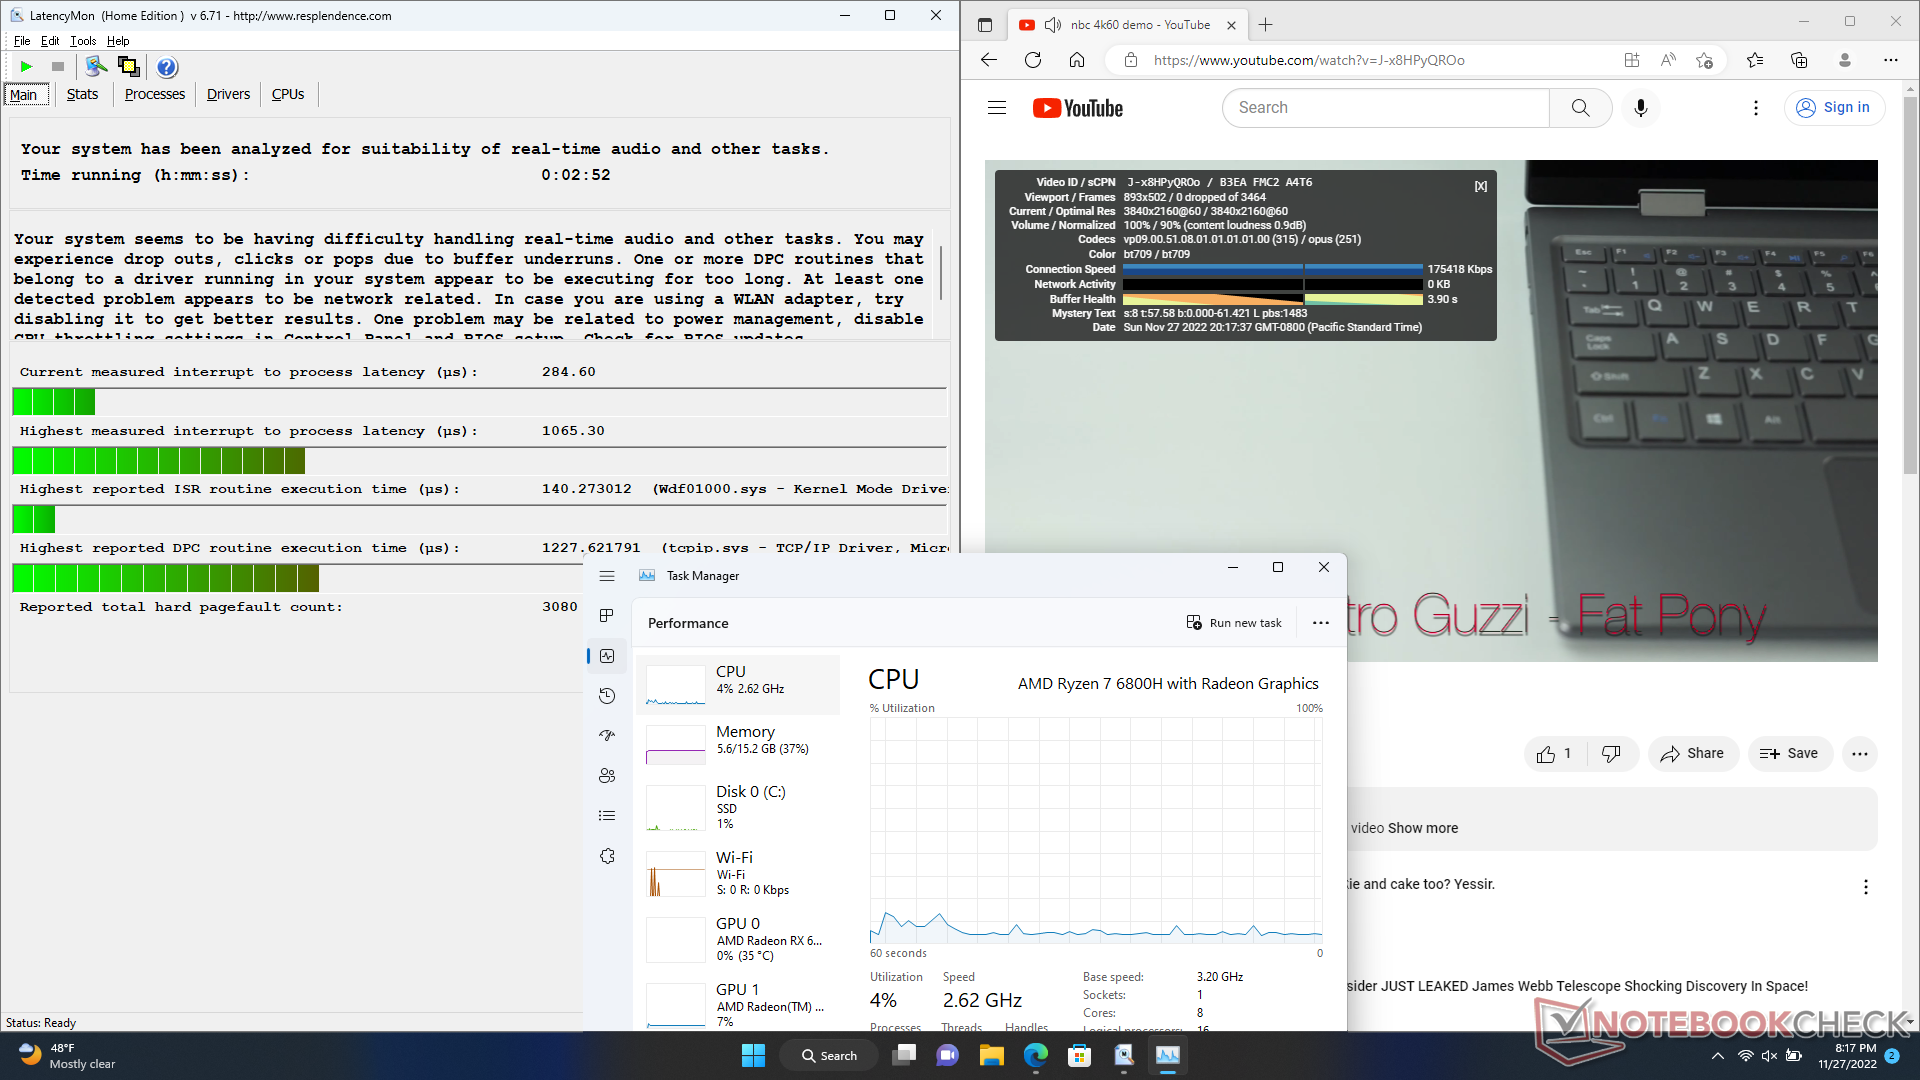
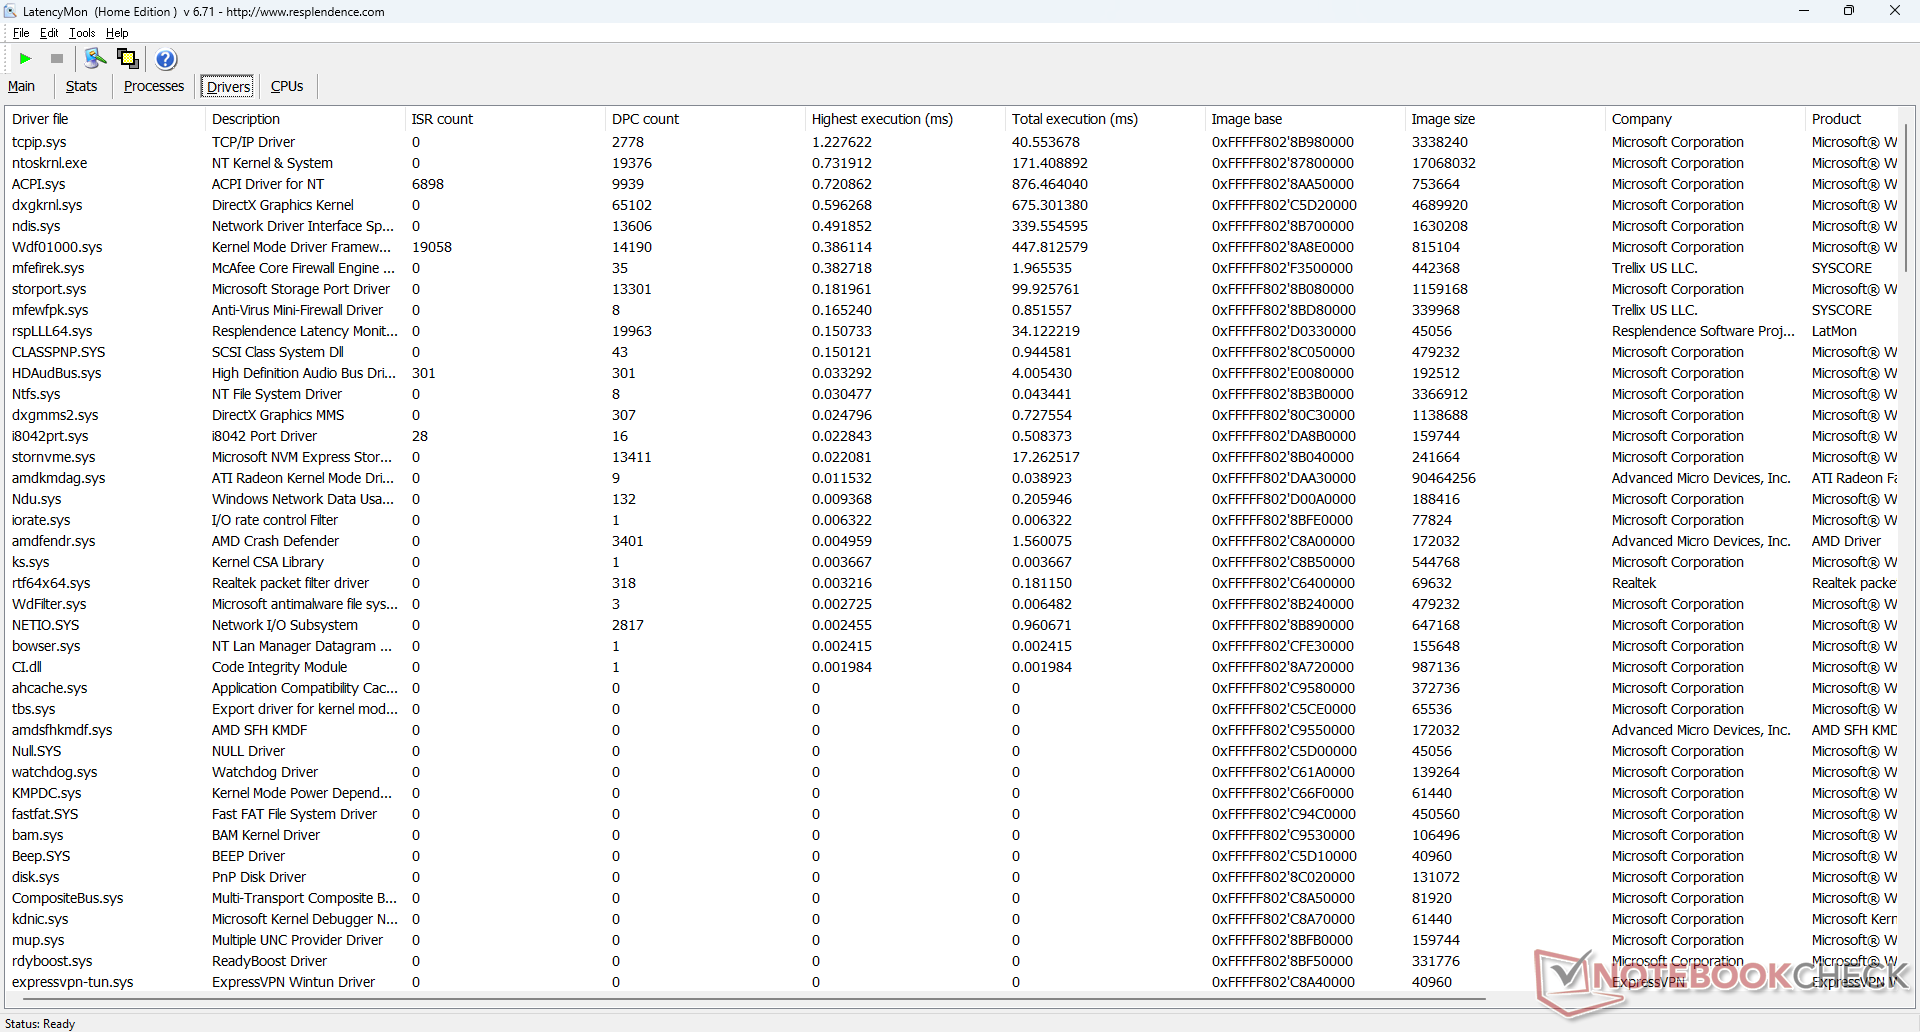
LatencyMon revela problemas de DPC ao abrir várias abas do navegador em nossa página inicial. a reprodução de vídeo 4K a 60 FPS é perfeita com baixa utilização de CPU/GPU e sem queda de quadros.
| DPC Latencies / LatencyMon - interrupt to process latency (max), Web, Youtube, Prime95 | |
| HP Omen 16-n0033dx | |
| Lenovo Legion S7 16ARHA7 | |
| Dell G16 7620 | |
| HP Victus 16-e0145ng | |
| HP Envy 16 h0112nr | |
| HP Omen 16-b1090ng | |
* ... menor é melhor
Dispositivos de armazenamento - Até duas SSDs PCIe4 x4 NVMe
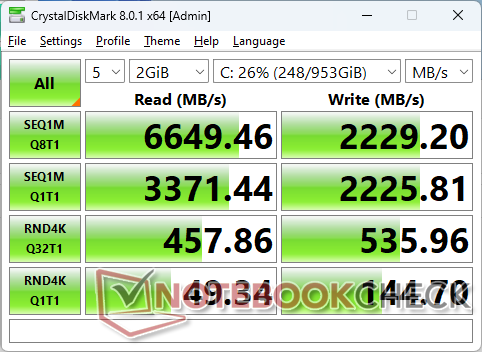
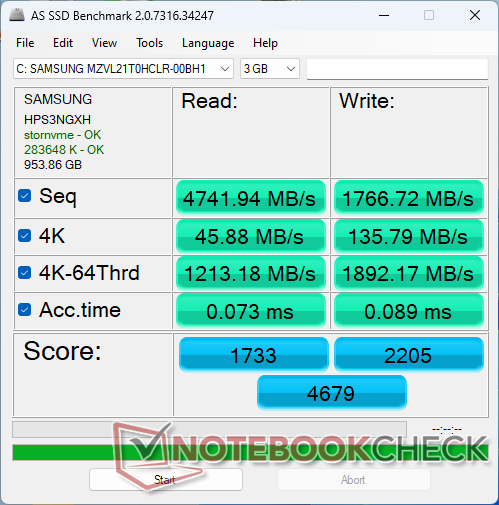
Nossa unidade de teste é enviada com um TB de 1 TB Samsung PM9A1 SSD prometendo 7000 MB/s e 5100 MB/s seqüenciais de leitura e escrita, respectivamente. O sistema é capaz de manter uma taxa de leitura do mundo real de cerca de 6700 MB/s indefinidamente, mas a unidade ocasionalmente mergulharia para a faixa baixa de 3000 MB/s antes de saltar de volta, como mostram os resultados de nossos testes de loop abaixo. Isto é provavelmente um bug com o sistema e não uma medida de estrangulamento de desempenho. Cada um dos dois slots M.2 2280 tem sua própria almofada térmica para dissipar o calor no painel inferior metálico e, portanto, o superaquecimento do SSD não deve ser um problema.

| Drive Performance rating - Percent | |
| Dell G16 7620 | |
| HP Omen 16-b1090ng | |
| Lenovo Legion S7 16ARHA7 | |
| HP Envy 16 h0112nr | |
| HP Victus 16-e0145ng | |
| HP Omen 16-n0033dx | |
* ... menor é melhor
Disk Throttling: DiskSpd Read Loop, Queue Depth 8
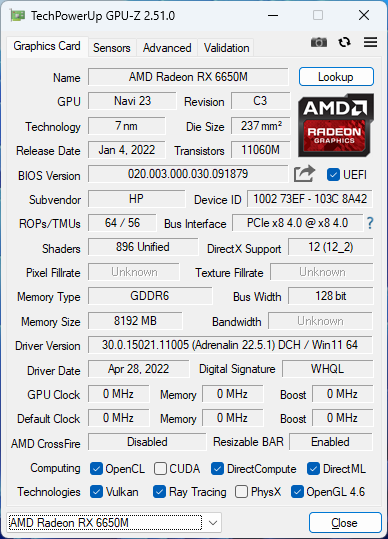
GPU Performance - Edging Out The GeForce RTX 3060
O Radeon RX 6650M está situado entre o móvel GeForce RTX 3060 e móvel GeForce RTX 3070 quando se trata de desempenho. Infelizmente está mais próximo do RTX 3060 do que do RTX 3070, no entanto, e assim os usuários devem esperar apenas taxas de quadros que são apenas 5 a 10% maiores do que a média do laptop RTX 3060 quando jogando a maioria dos jogos.
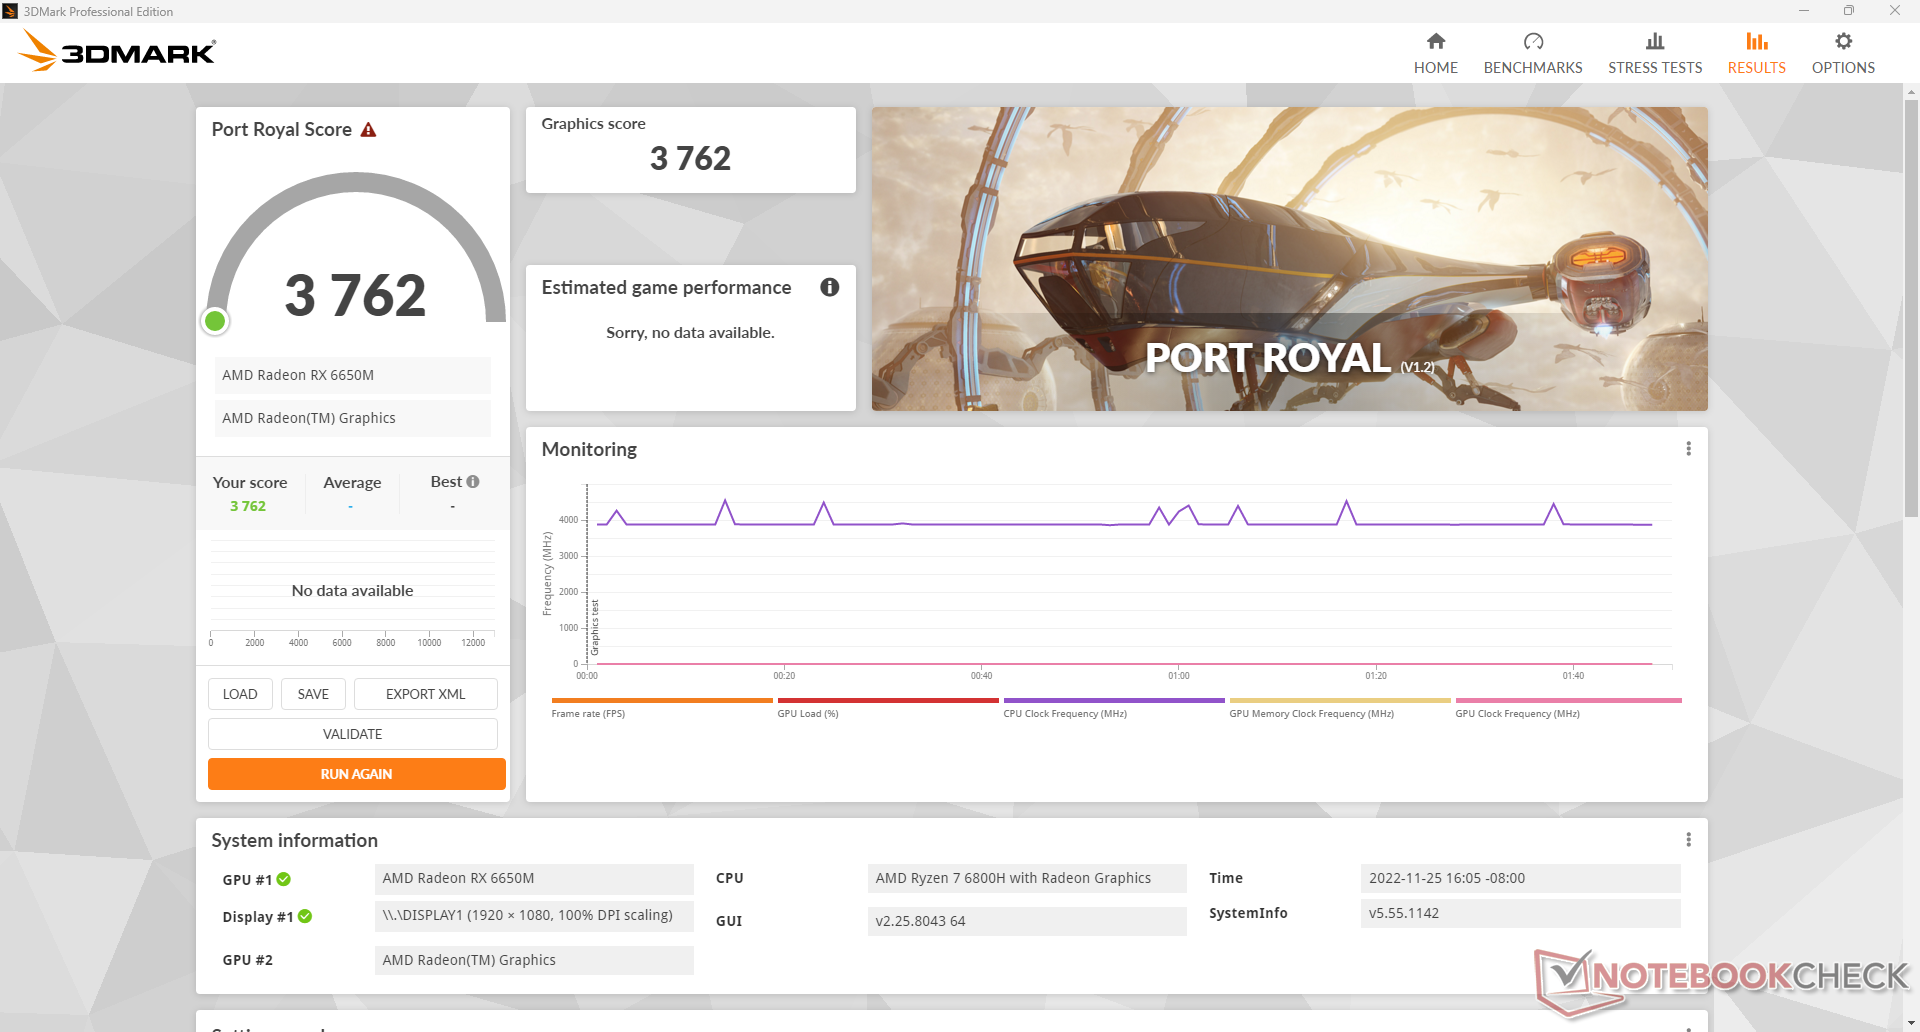
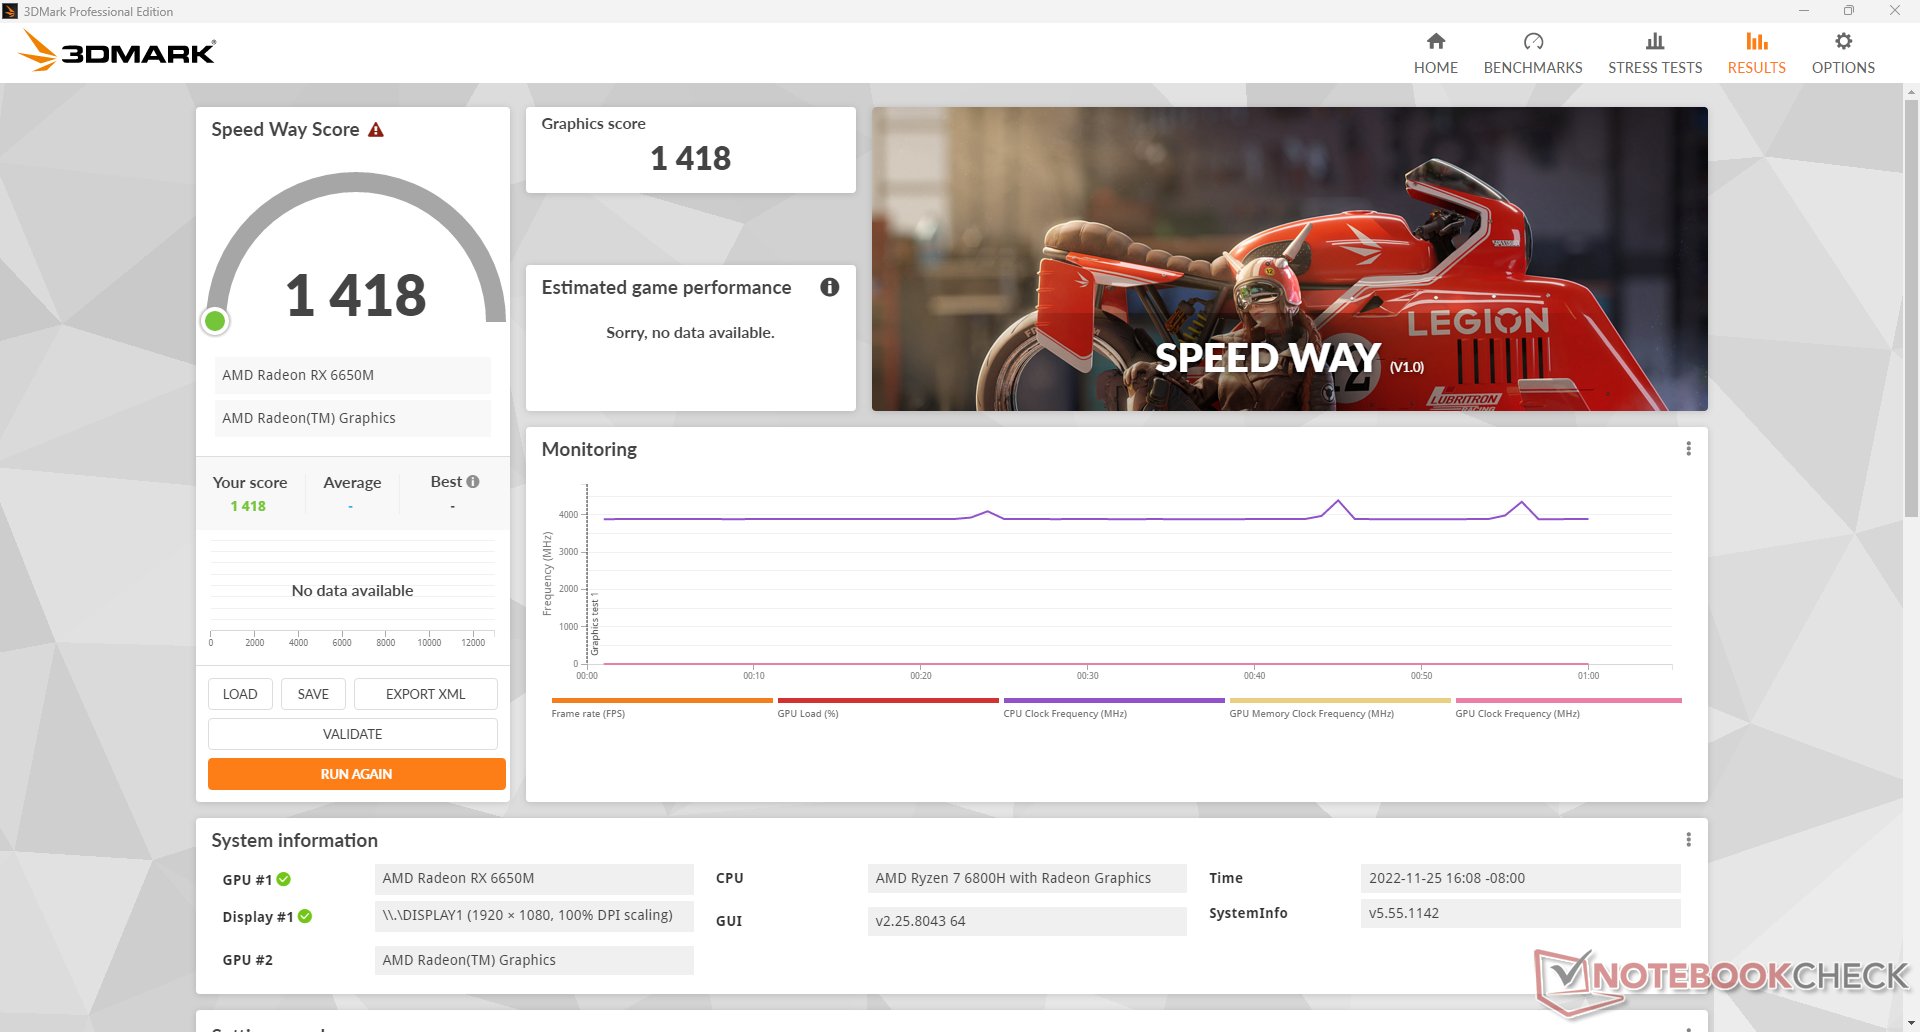
Embora o Radeon RX 6650M tenha um desempenho ligeiramente superior ao dos laptops RTX 3060 quando se trata de desempenho de rasterização, ele é significativamente mais lento quando se trata de desempenho de traçado de raio em tempo real. os resultados do 3DMark Port Royal são quase 30% inferiores aos do Dell G16 alimentado pelo RTX 3060. Para testar isto em um jogo real, nós rodaríamos F1 22 em configurações de 1080p com e sem RT em nosso laptop HP alimentado por AMD. Quando o RT é desativado, as taxas de quadros estariam consistentemente à frente de qualquer laptop RTX 3060. Quando o RT é desativado, as taxas de quadros cairiam para ser cerca de 15% mais lentas do que aqueles mesmos laptops RTX 3060. Se o desempenho do RT for importante para você, então você definitivamente vai querer considerar um Nvidia SKU.
A execução no modo Balanceado ao invés do modo Performance irá reduzir a performance da GPU em cerca de 11%.
A GPU, infelizmente, não está sem alguns problemas. A renderização HIP do Blender e o Horizon Zero Dawn, por exemplo, travariam o programa e teriam problemas de lançamento, respectivamente, apesar de estarem nos últimos drivers gráficos no momento da revisão.
Mais detalhes técnicos e benchmarks podem ser encontrados em nossa página dedicada Radeon RX 6650M aqui.
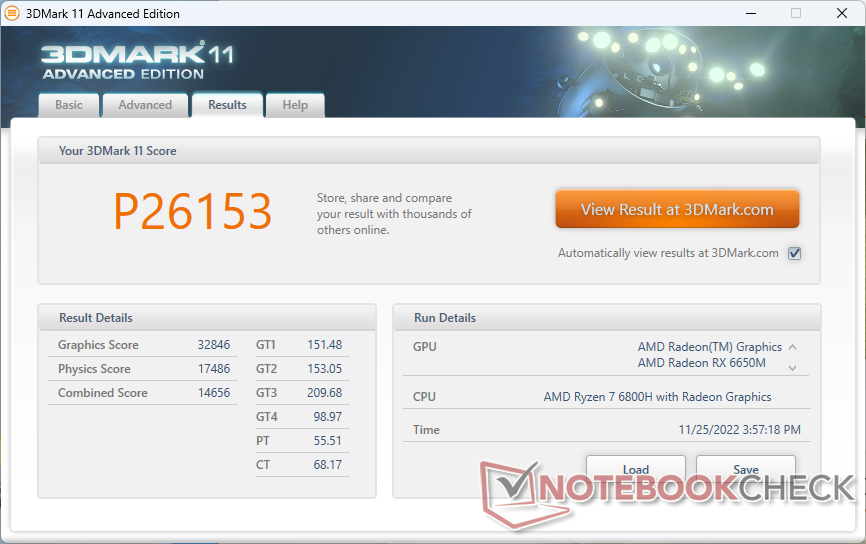
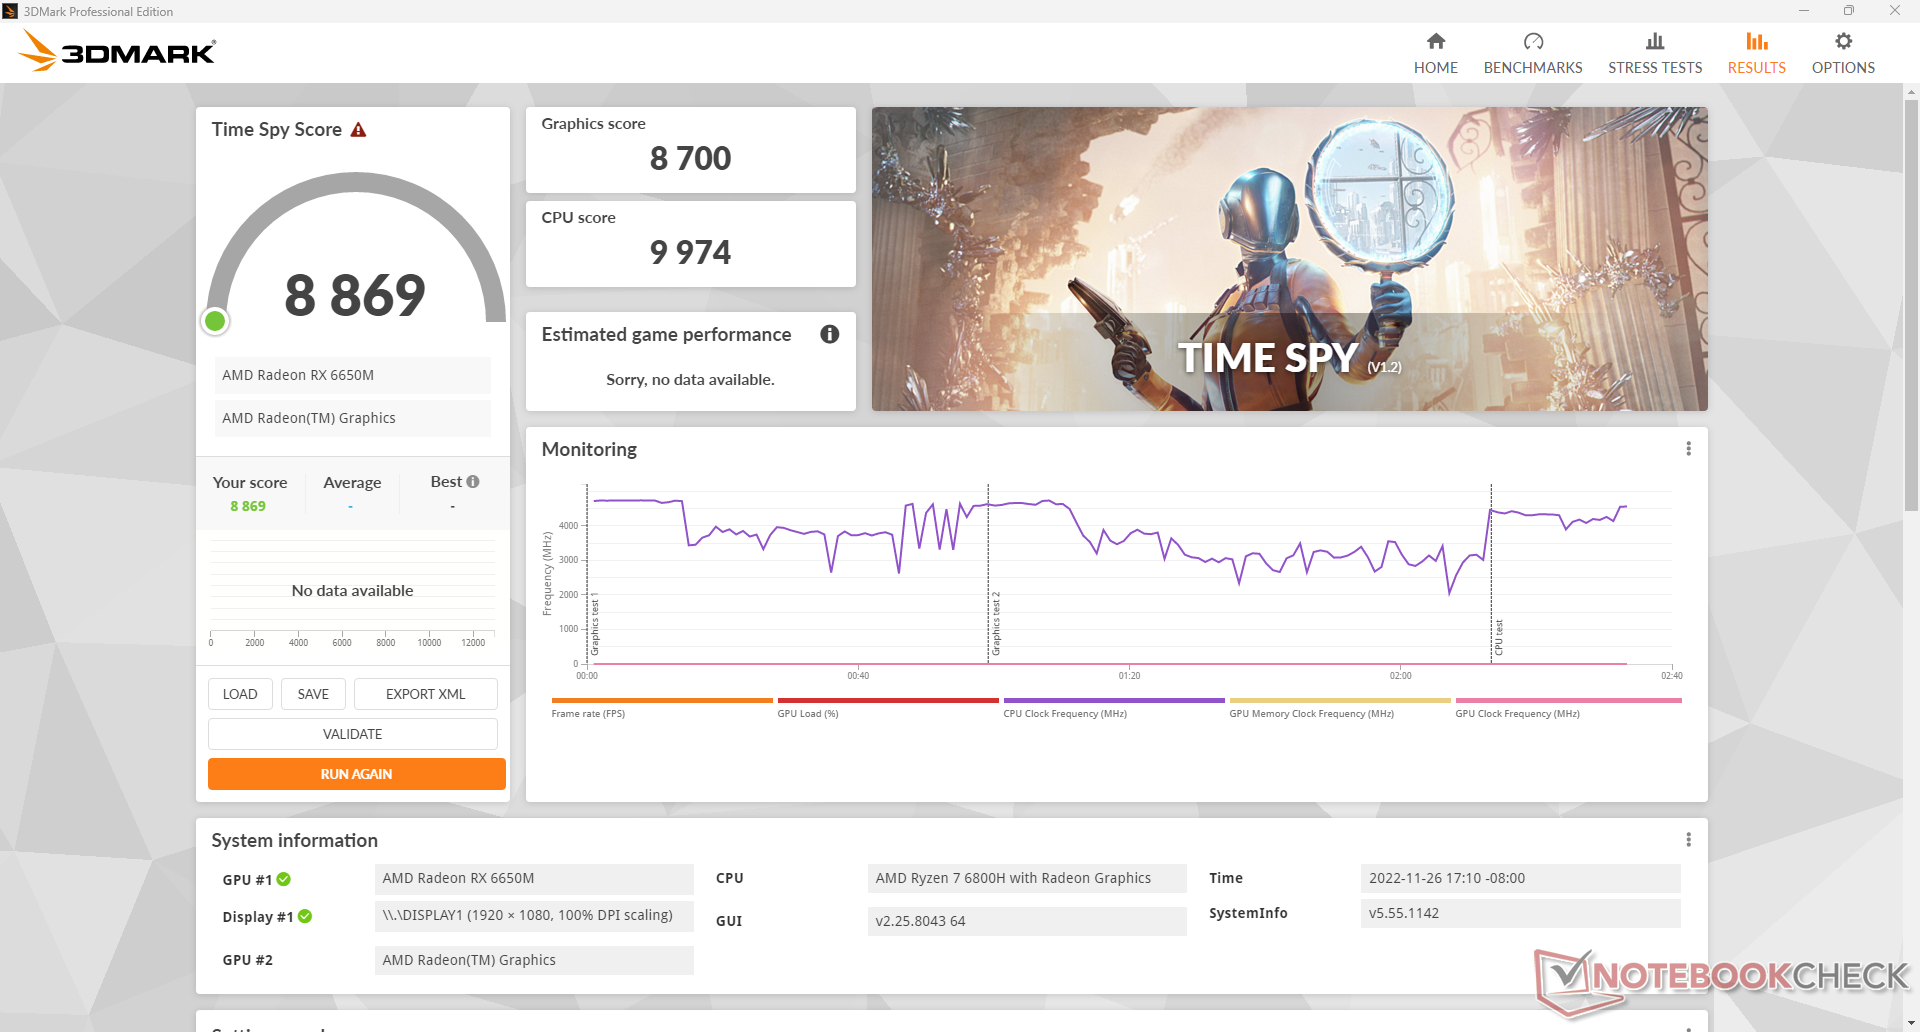
| 3DMark 11 Performance | 26153 pontos | |
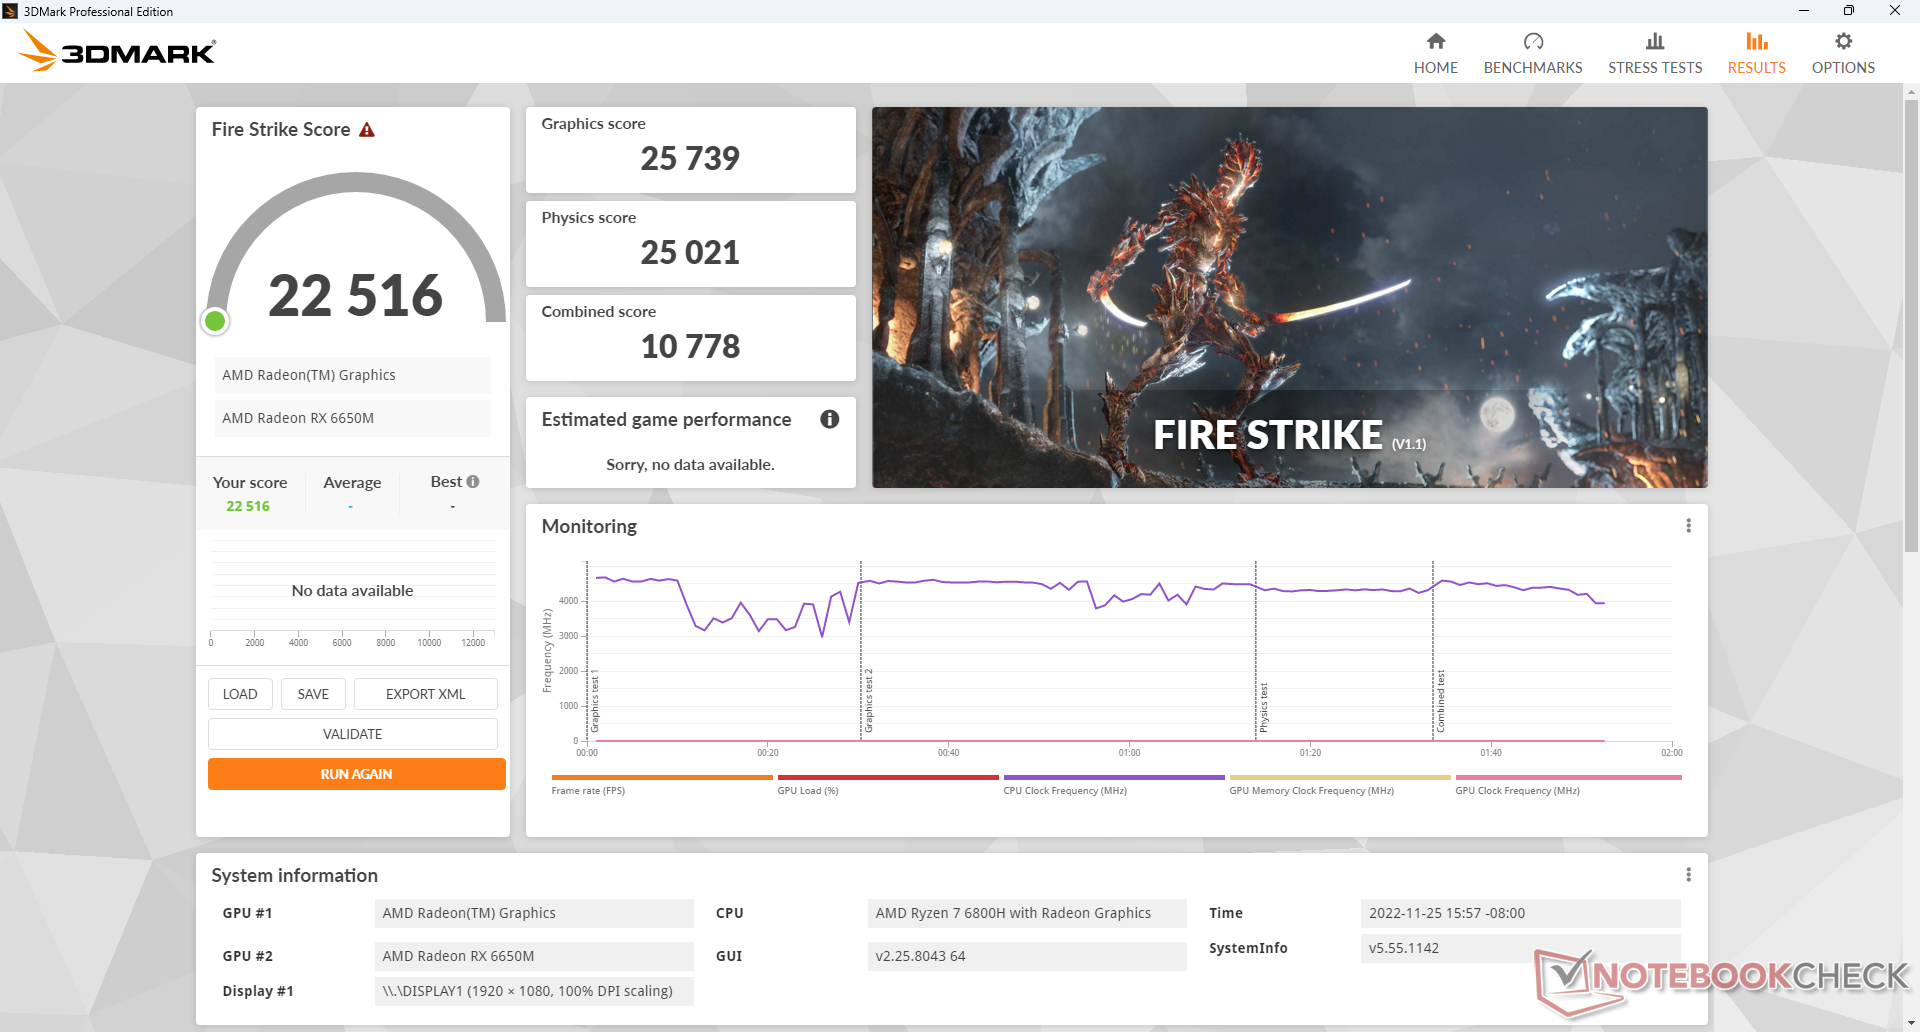
| 3DMark Fire Strike Score | 22516 pontos | |
| 3DMark Time Spy Score | 8869 pontos | |
Ajuda | ||
| Blender - v3.3 Classroom CPU | |
| HP Envy 16 h0112nr | |
| HP Omen 16-n0033dx | |
| Lenovo Legion S7 16ARHA7 | |
| Dell G16 7620 | |
| Lenovo Legion 7 16IAX7-82TD004SGE | |
* ... menor é melhor
As taxas de quadros quando ociosos em Witcher 3 são geralmente estáveis, exceto por uma queda de curta duração para 13 FPS. Isto pode ser devido a um bug ou à priorização deficiente da atividade de fundo semelhante às quedas de desempenho que observamos acima quando testamos o SSD.
Witcher 3 FPS Chart
| baixo | média | alto | ultra | |
|---|---|---|---|---|
| The Witcher 3 (2015) | 276.5 | 217.4 | 167 | 90.1 |
| Dota 2 Reborn (2015) | 141 | 130.7 | 118 | 100 |
| Overwatch (2016) | 507.9 | 481.9 | 350.9 | 150 |
| Fortnite (2018) | 95.5 | 54.1 | 46 | 40.4 |
| Final Fantasy XV Benchmark (2018) | 164.7 | 113.3 | 83.2 | |
| X-Plane 11.11 (2018) | 66.4 | 52.7 | 46.4 | |
| Strange Brigade (2018) | 337 | 222 | 190 | 167.2 |
| Metro Exodus (2019) | 138.8 | 111.5 | 81 | 65.8 |
| Borderlands 3 (2019) | 110.4 | 95.9 | 85.2 | 67.4 |
| Gears Tactics (2020) | 162.8 | 205.9 | 124.2 | 100.4 |
| Watch Dogs Legion (2020) | 109 | 104 | 94 | 62 |
| Dirt 5 (2020) | 236.6 | 135.4 | 109.1 | 83.6 |
| Hitman 3 (2021) | 224.8 | 178.8 | 165.5 | 156.3 |
| F1 2021 (2021) | 315 | 247 | 216 | 100 |
| Far Cry 6 (2021) | 111 | 105 | 96 | 88 |
| Guardians of the Galaxy (2021) | 117 | 110 | 111 | 105 |
| God of War (2022) | 69.3 | 68.4 | 64.3 | 51.5 |
| Cyberpunk 2077 1.6 (2022) | 126.8 | 106.3 | 78.9 | 63.8 |
| F1 22 (2022) | 217 | 215 | 178.2 | 40.6 |
Emissões
Ruído do sistema - Alto no modo de desempenho
Os ventiladores internos estão sempre ativos a uma baixa de 27 dB(A) contra um fundo silencioso de 24 dB(A). No entanto, eles são bons em permanecer silenciosos por períodos mais longos de estresse e, portanto, os pulsos RPM ocorrem com muito menos freqüência quando se navega na web ou em fluxo de vídeo.
O ruído do ventilador está ligado ao perfil de potência quando se joga. Rodando Witcher 3 no modo Balanceado, por exemplo, resulta em um ruído do ventilador de apenas 39,4 dB(A) contra 54,1 dB(A) quando no modo Performance. A faixa média de 50 dB(A) é visivelmente mais alta do que na Dell G16 quando em condições semelhantes. Os usuários devem suportar os ventiladores muito mais altos se quiserem executar a GPU em seu alvo TGP mais alto.
Barulho
| Ocioso |
| 27.4 / 27.4 / 28.9 dB |
| Carga |
| 32.3 / 57.6 dB |
 | ||
30 dB silencioso 40 dB(A) audível 50 dB(A) ruidosamente alto |
||
min: | ||
| HP Omen 16-n0033dx Radeon RX 6650M, R7 6800H, Samsung PM9A1 MZVL21T0HCLR | HP Envy 16 h0112nr GeForce RTX 3060 Laptop GPU, i7-12700H, Micron 3400 1TB MTFDKBA1T0TFH | HP Omen 16-b1090ng GeForce RTX 3070 Ti Laptop GPU, i7-12700H, WDC PC SN810 1TB | HP Victus 16-e0145ng GeForce RTX 3050 Ti Laptop GPU, R5 5600H, Samsung SSD PM981a MZVLB512HBJQ | Lenovo Legion S7 16ARHA7 Radeon RX 6800S, R9 6900HX, SK Hynix HFS001TEJ9X115N | Dell G16 7620 GeForce RTX 3060 Laptop GPU, i7-12700H, WDC PC SN810 512GB | |
|---|---|---|---|---|---|---|
| Noise | 3% | -13% | -6% | 11% | 3% | |
| desligado / ambiente * (dB) | 24.2 | 22.8 6% | 26 -7% | 26 -7% | 23.1 5% | 23.2 4% |
| Idle Minimum * (dB) | 27.4 | 22.9 16% | 30 -9% | 26 5% | 23.1 16% | 28.3 -3% |
| Idle Average * (dB) | 27.4 | 22.9 16% | 31 -13% | 28 -2% | 23.1 16% | 28.8 -5% |
| Idle Maximum * (dB) | 28.9 | 30.5 -6% | 33 -14% | 34 -18% | 23.1 20% | 28.9 -0% |
| Load Average * (dB) | 32.3 | 41.4 -28% | 49 -52% | 44 -36% | 31.4 3% | 32.4 -0% |
| Witcher 3 ultra * (dB) | 54.1 | 51.1 6% | 53 2% | 48 11% | 51.4 5% | 48.3 11% |
| Load Maximum * (dB) | 57.6 | 51.4 11% | 57 1% | 53 8% | 51.2 11% | 48.1 16% |
* ... menor é melhor
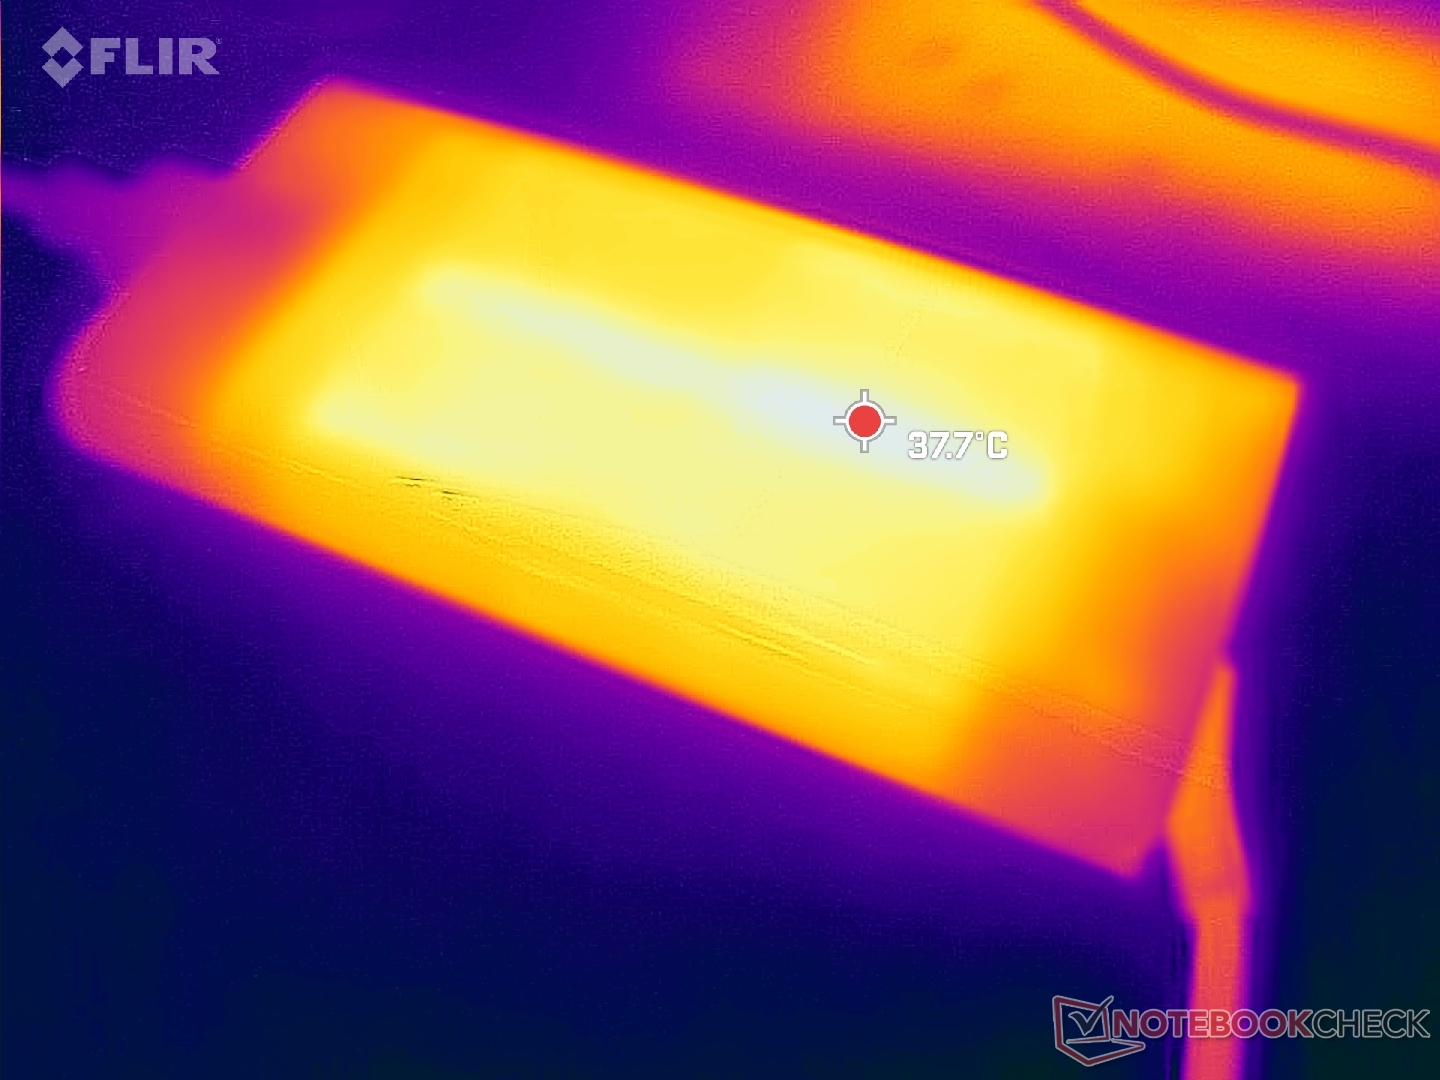
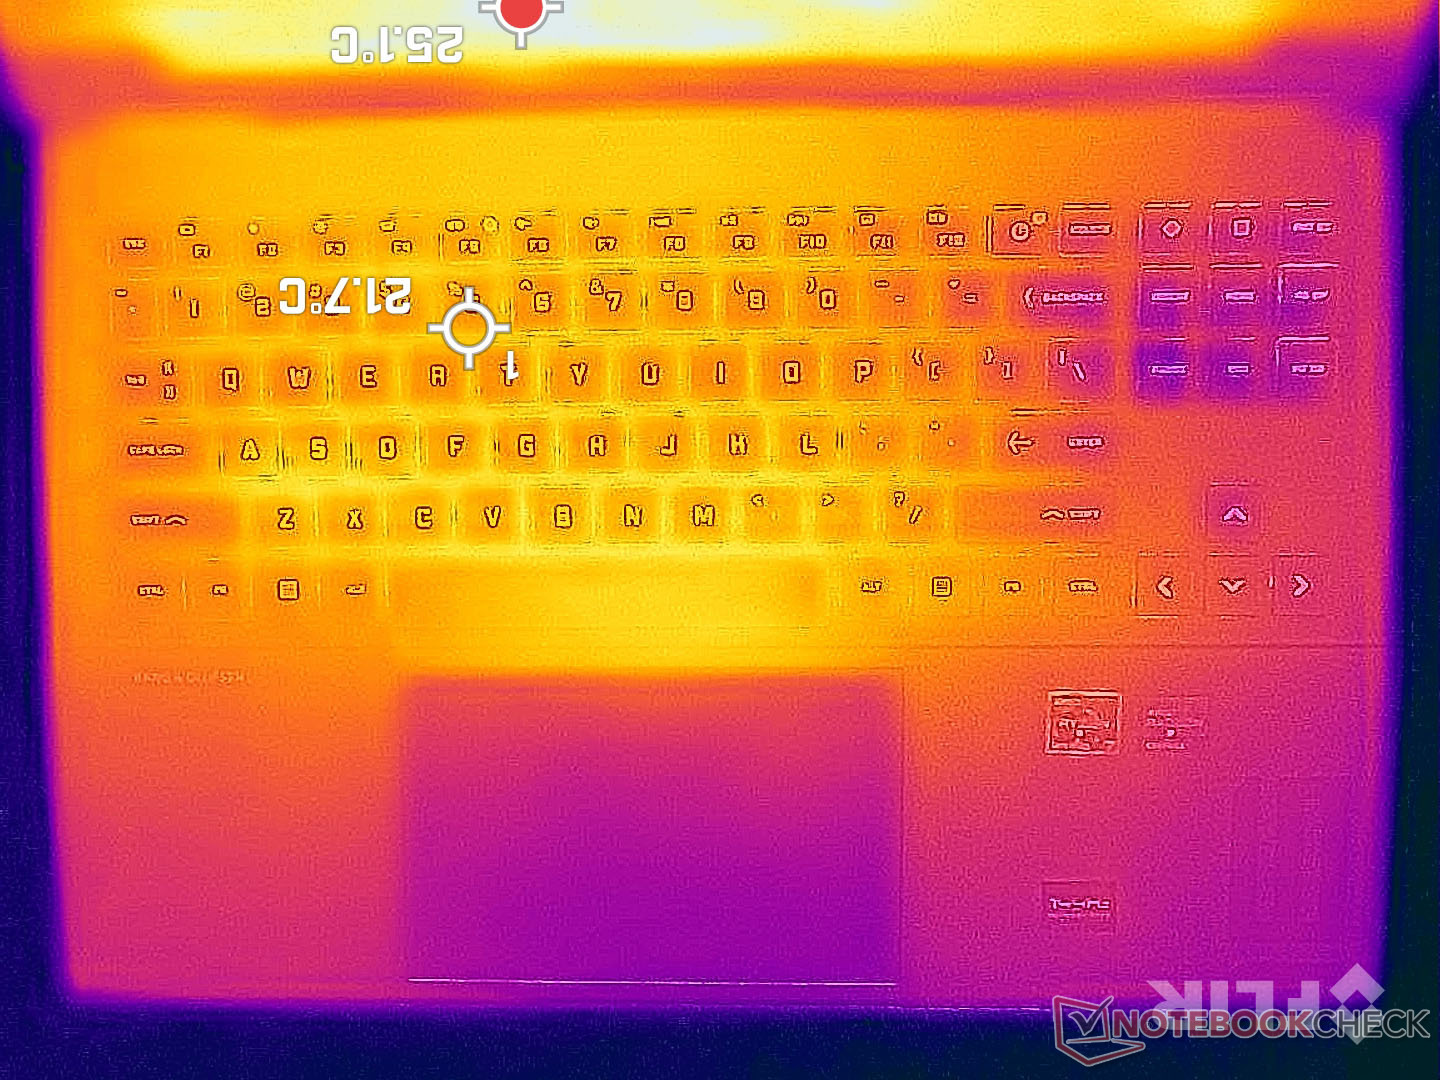
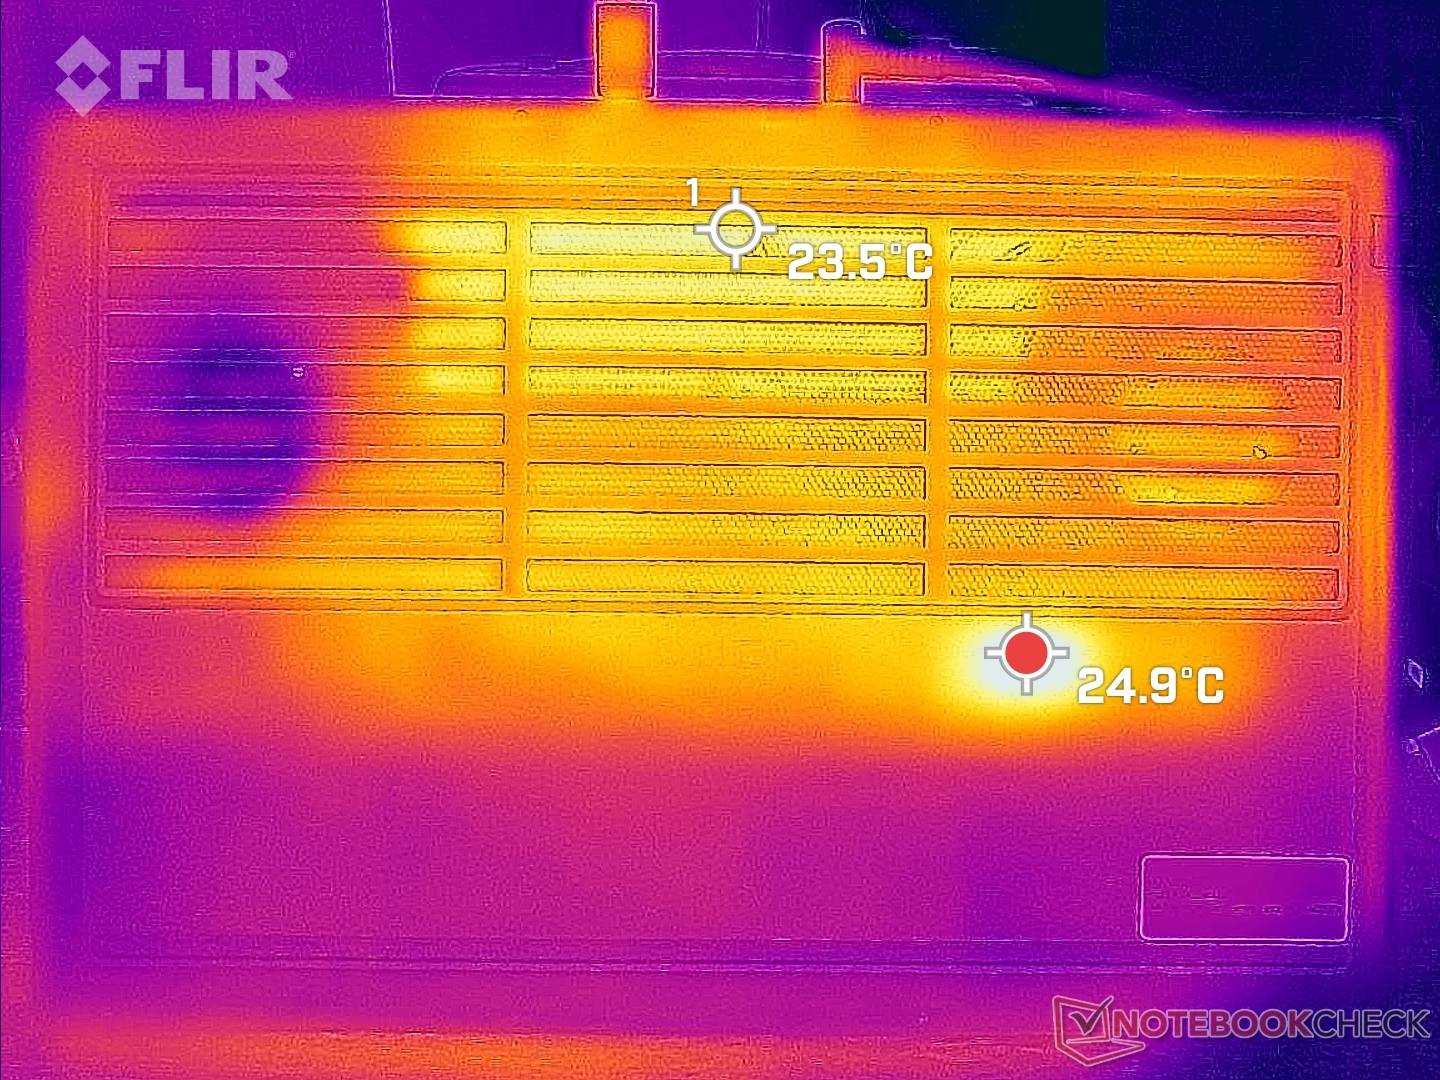
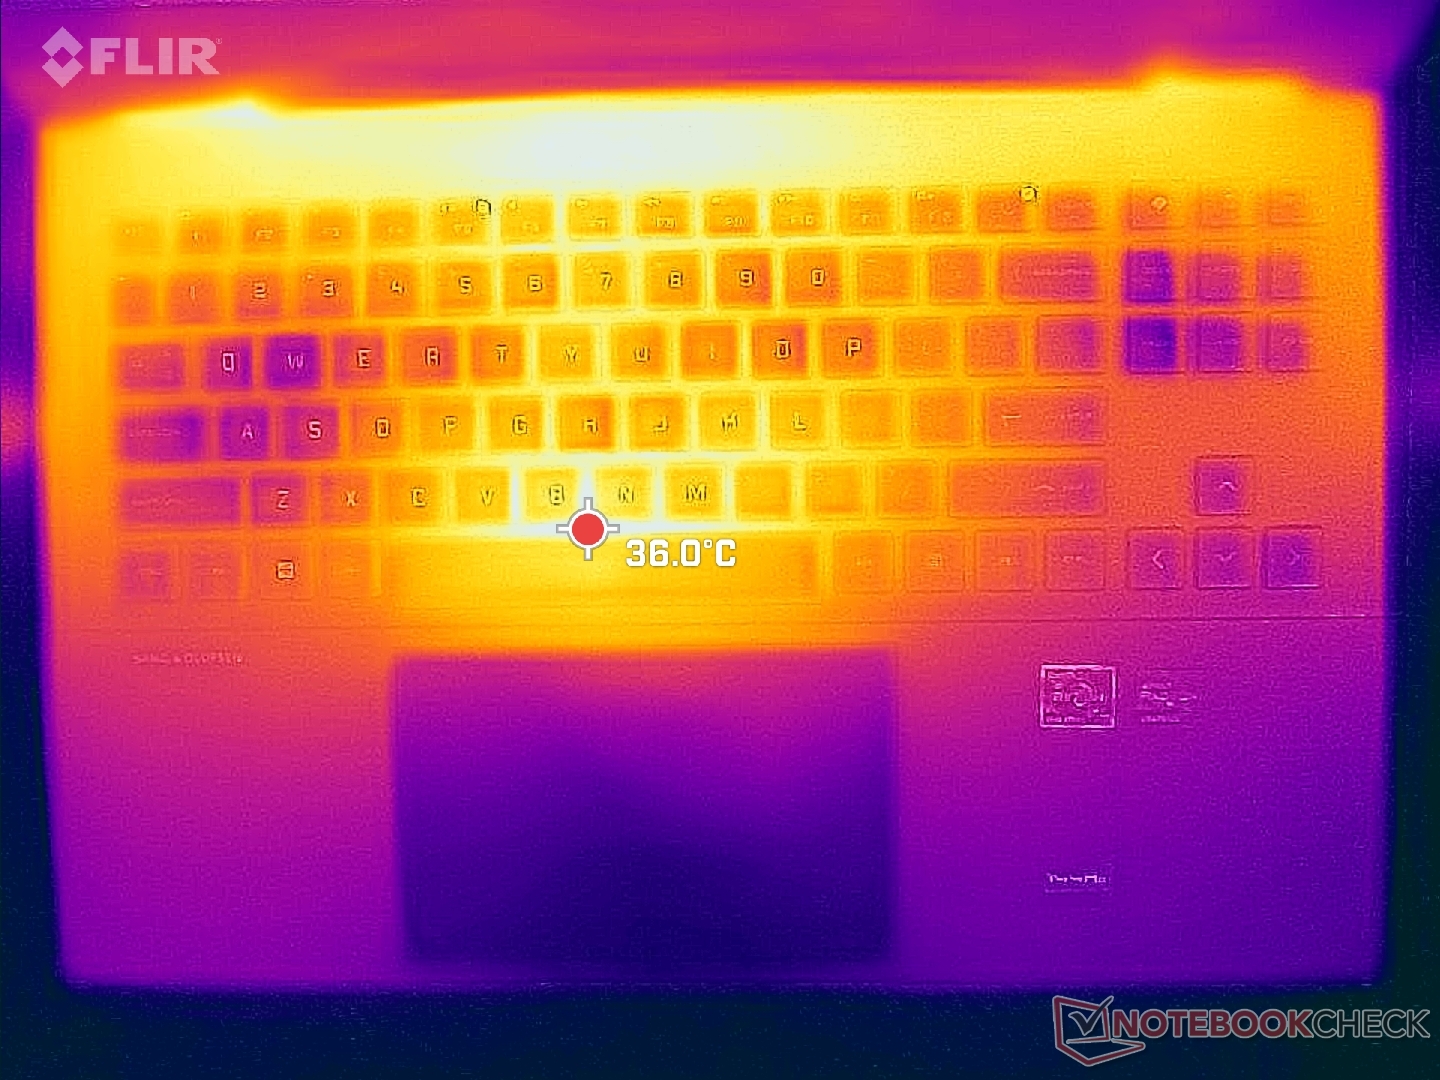
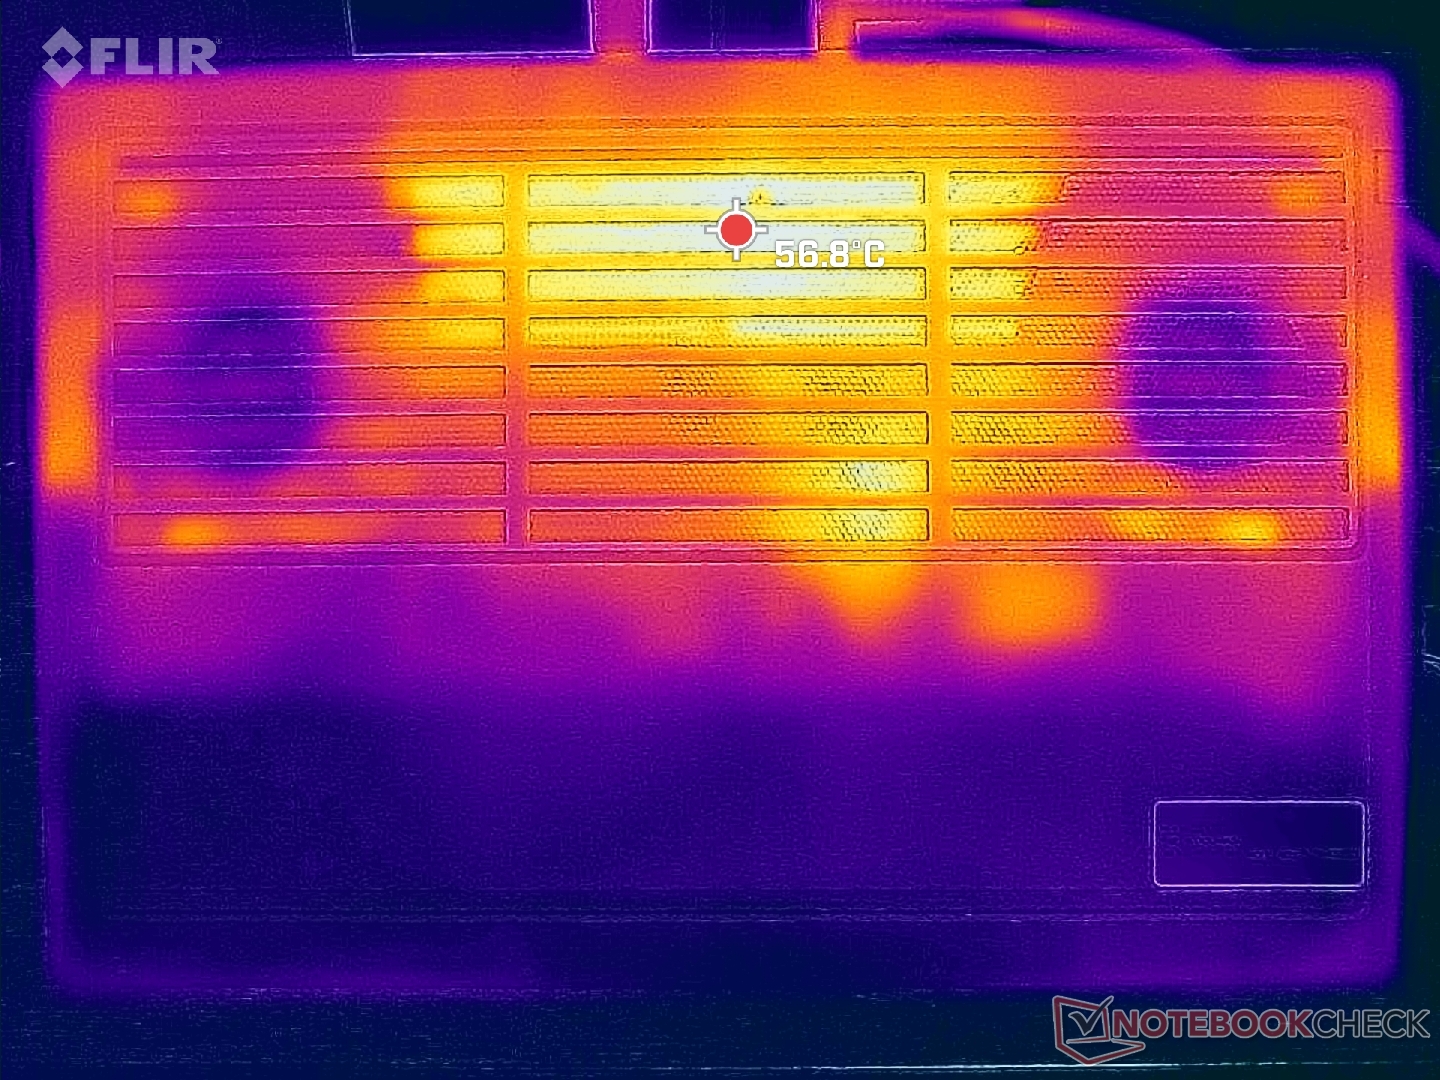
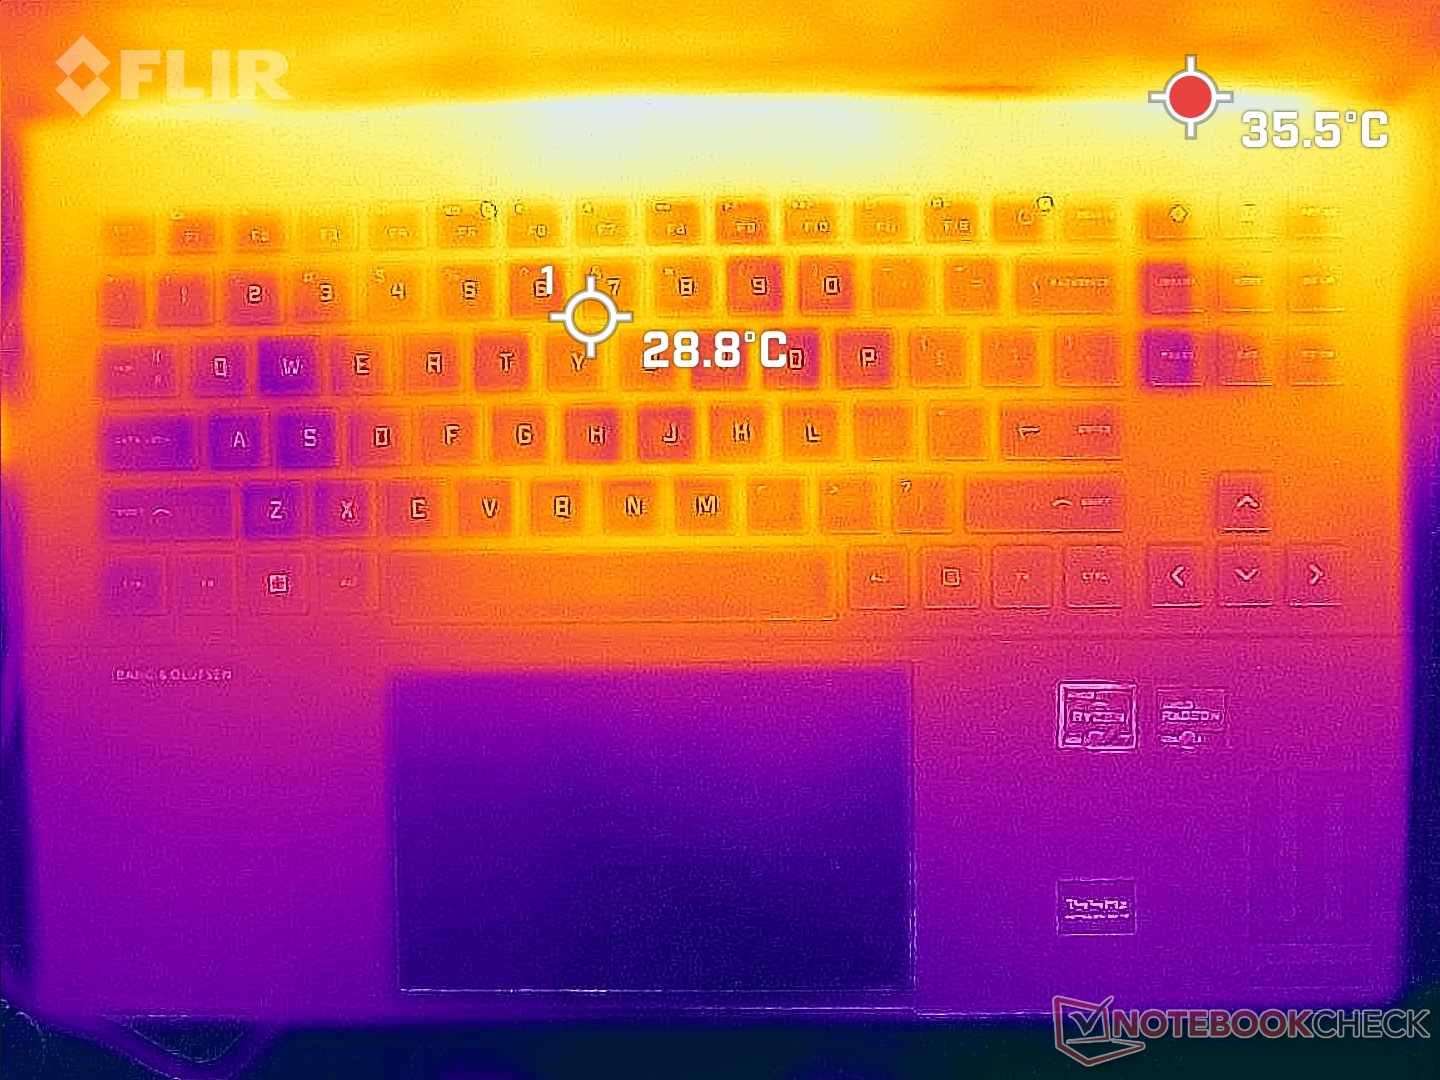
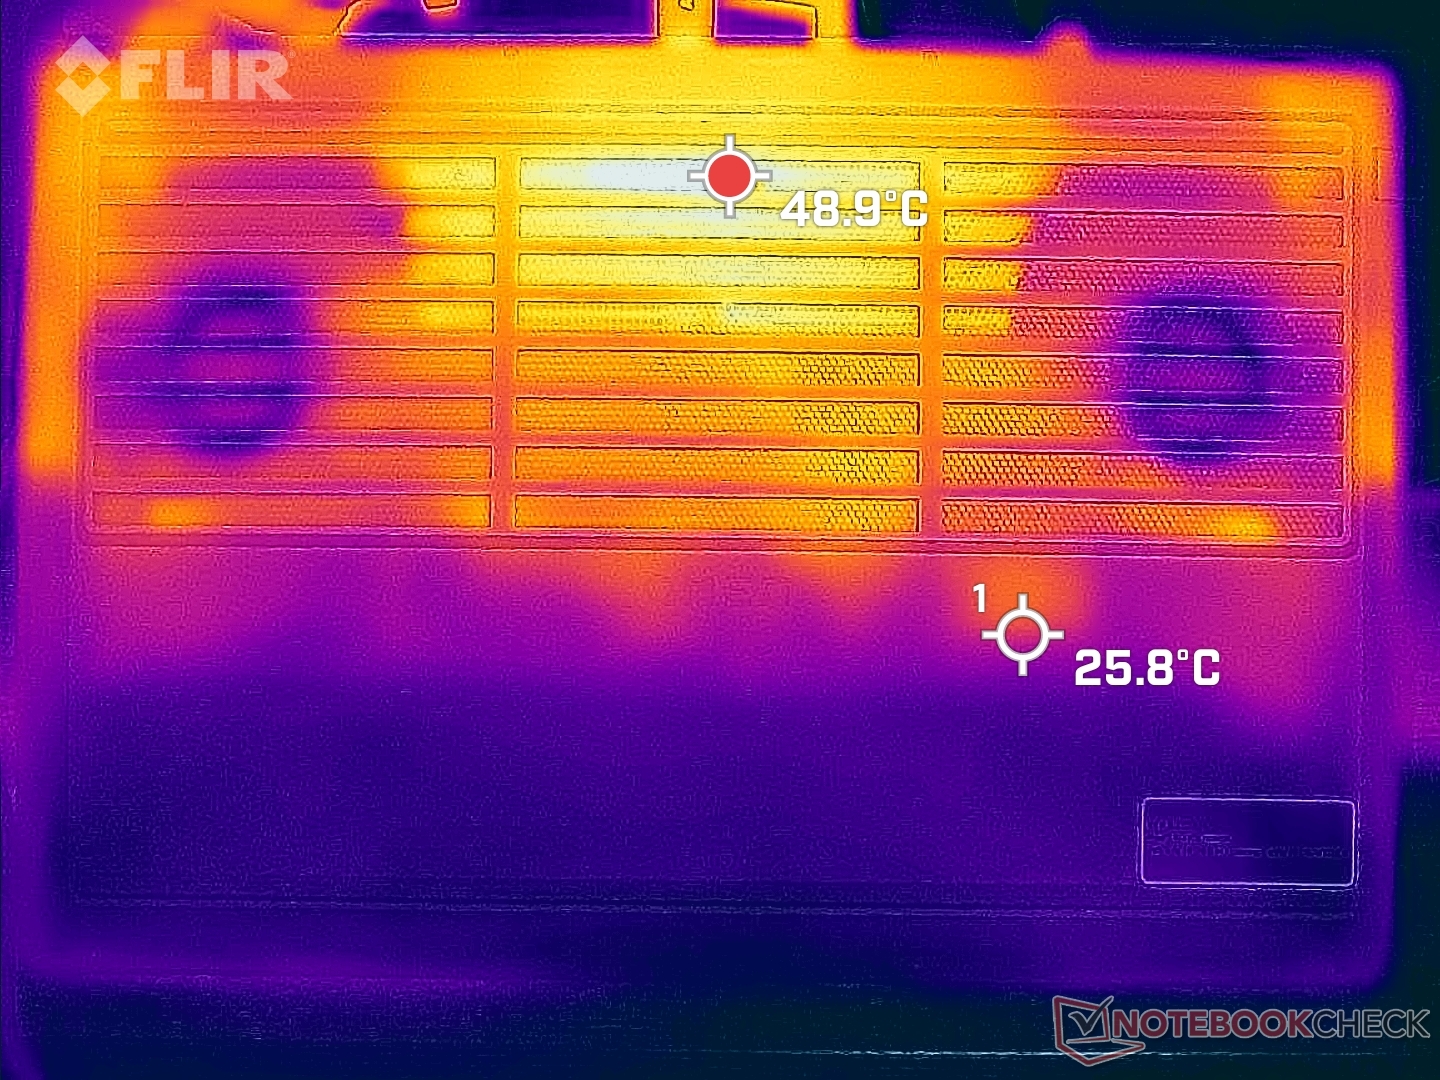
Temperatura
As temperaturas superficiais são muito mais frias no deck do teclado quando comparadas com o deck inferior. Os pontos quentes na parte superior atingem cerca de 40 C quando se joga, em comparação com mais de 50 C na parte inferior. O Omen 16 - Intel pode ser ainda mais quente a até 60 C quando em condições similares. Estes pontos quentes são em direção à parte traseira do chassi, onde é improvável que os dedos e as palmas das mãos se toquem.
Tenha em mente que a maior parte do fundo e traseira do modelo é dedicada ao resfriamento. pode ser fácil bloquear acidentalmente as grelhas de ventilação se você não for cuidadoso.
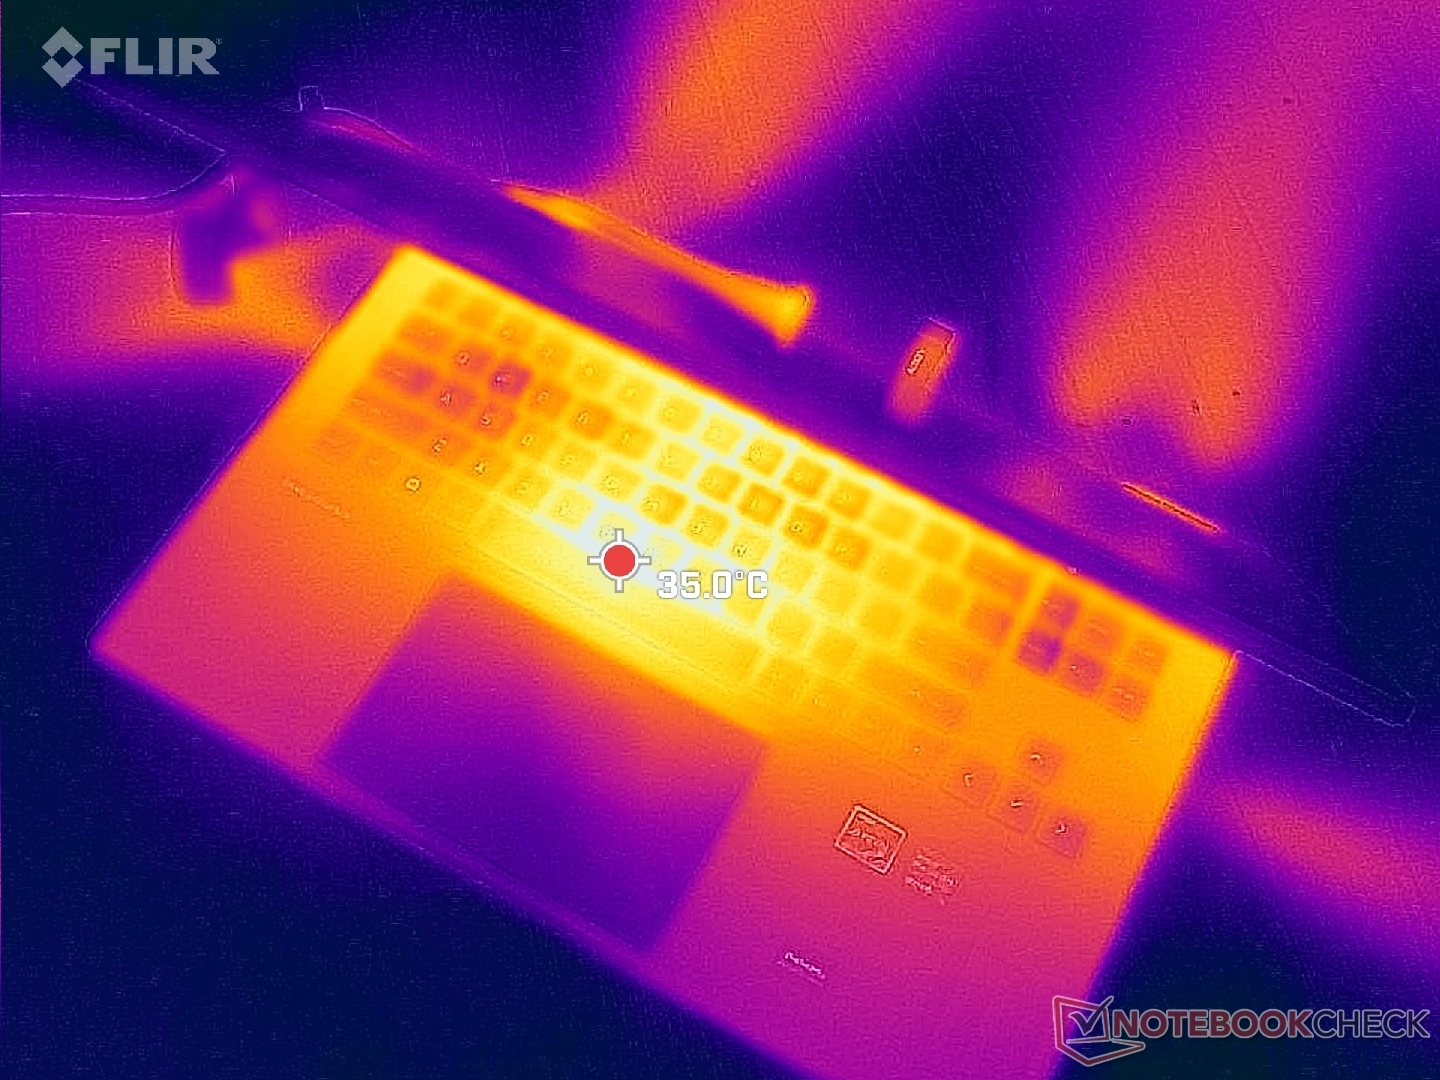
(±) A temperatura máxima no lado superior é 41.2 °C / 106 F, em comparação com a média de 40.4 °C / 105 F , variando de 21.2 a 68.8 °C para a classe Gaming.
(-) A parte inferior aquece até um máximo de 53.2 °C / 128 F, em comparação com a média de 43.2 °C / 110 F
(+) Em uso inativo, a temperatura média para o lado superior é 24.4 °C / 76 F, em comparação com a média do dispositivo de 33.9 °C / ### class_avg_f### F.
(±) Jogando The Witcher 3, a temperatura média para o lado superior é 32.3 °C / 90 F, em comparação com a média do dispositivo de 33.9 °C / ## #class_avg_f### F.
(+) Os apoios para as mãos e o touchpad são mais frios que a temperatura da pele, com um máximo de 26.2 °C / 79.2 F e, portanto, são frios ao toque.
(+) A temperatura média da área do apoio para as mãos de dispositivos semelhantes foi 28.8 °C / 83.8 F (+2.6 °C / 4.6 F).
| HP Omen 16-n0033dx AMD Ryzen 7 6800H, AMD Radeon RX 6650M | HP Envy 16 h0112nr Intel Core i7-12700H, NVIDIA GeForce RTX 3060 Laptop GPU | HP Omen 16-b1090ng Intel Core i7-12700H, NVIDIA GeForce RTX 3070 Ti Laptop GPU | HP Victus 16-e0145ng AMD Ryzen 5 5600H, NVIDIA GeForce RTX 3050 Ti Laptop GPU | Lenovo Legion S7 16ARHA7 AMD Ryzen 9 6900HX, AMD Radeon RX 6800S | Dell G16 7620 Intel Core i7-12700H, NVIDIA GeForce RTX 3060 Laptop GPU | |
|---|---|---|---|---|---|---|
| Heat | -9% | -2% | -22% | -2% | 2% | |
| Maximum Upper Side * (°C) | 41.2 | 45.2 -10% | 41 -0% | 54 -31% | 46.6 -13% | 47.6 -16% |
| Maximum Bottom * (°C) | 53.2 | 44 17% | 62 -17% | 47 12% | 50.8 5% | 54 -2% |
| Idle Upper Side * (°C) | 26.4 | 33.6 -27% | 25 5% | 41 -55% | 26.4 -0% | 23 13% |
| Idle Bottom * (°C) | 27.8 | 32.6 -17% | 26 6% | 31 -12% | 27.2 2% | 24.6 12% |
* ... menor é melhor
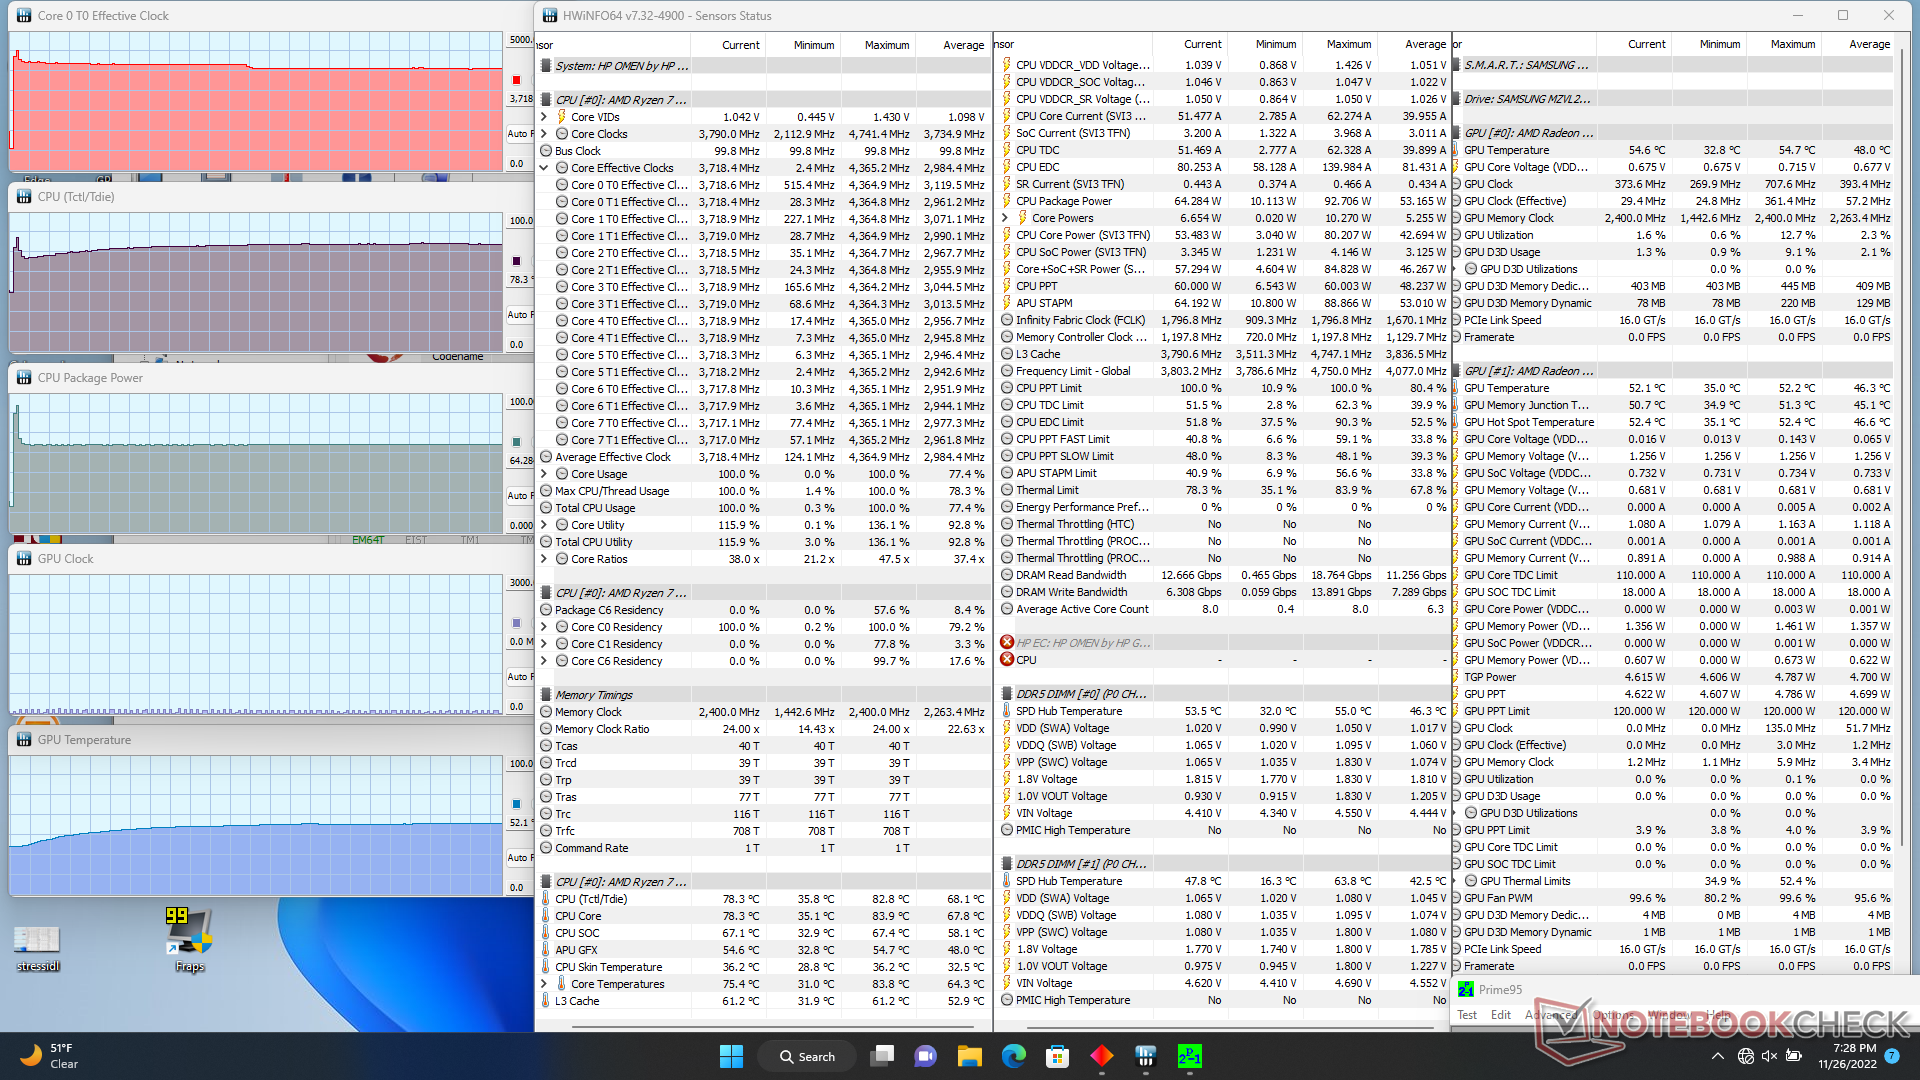
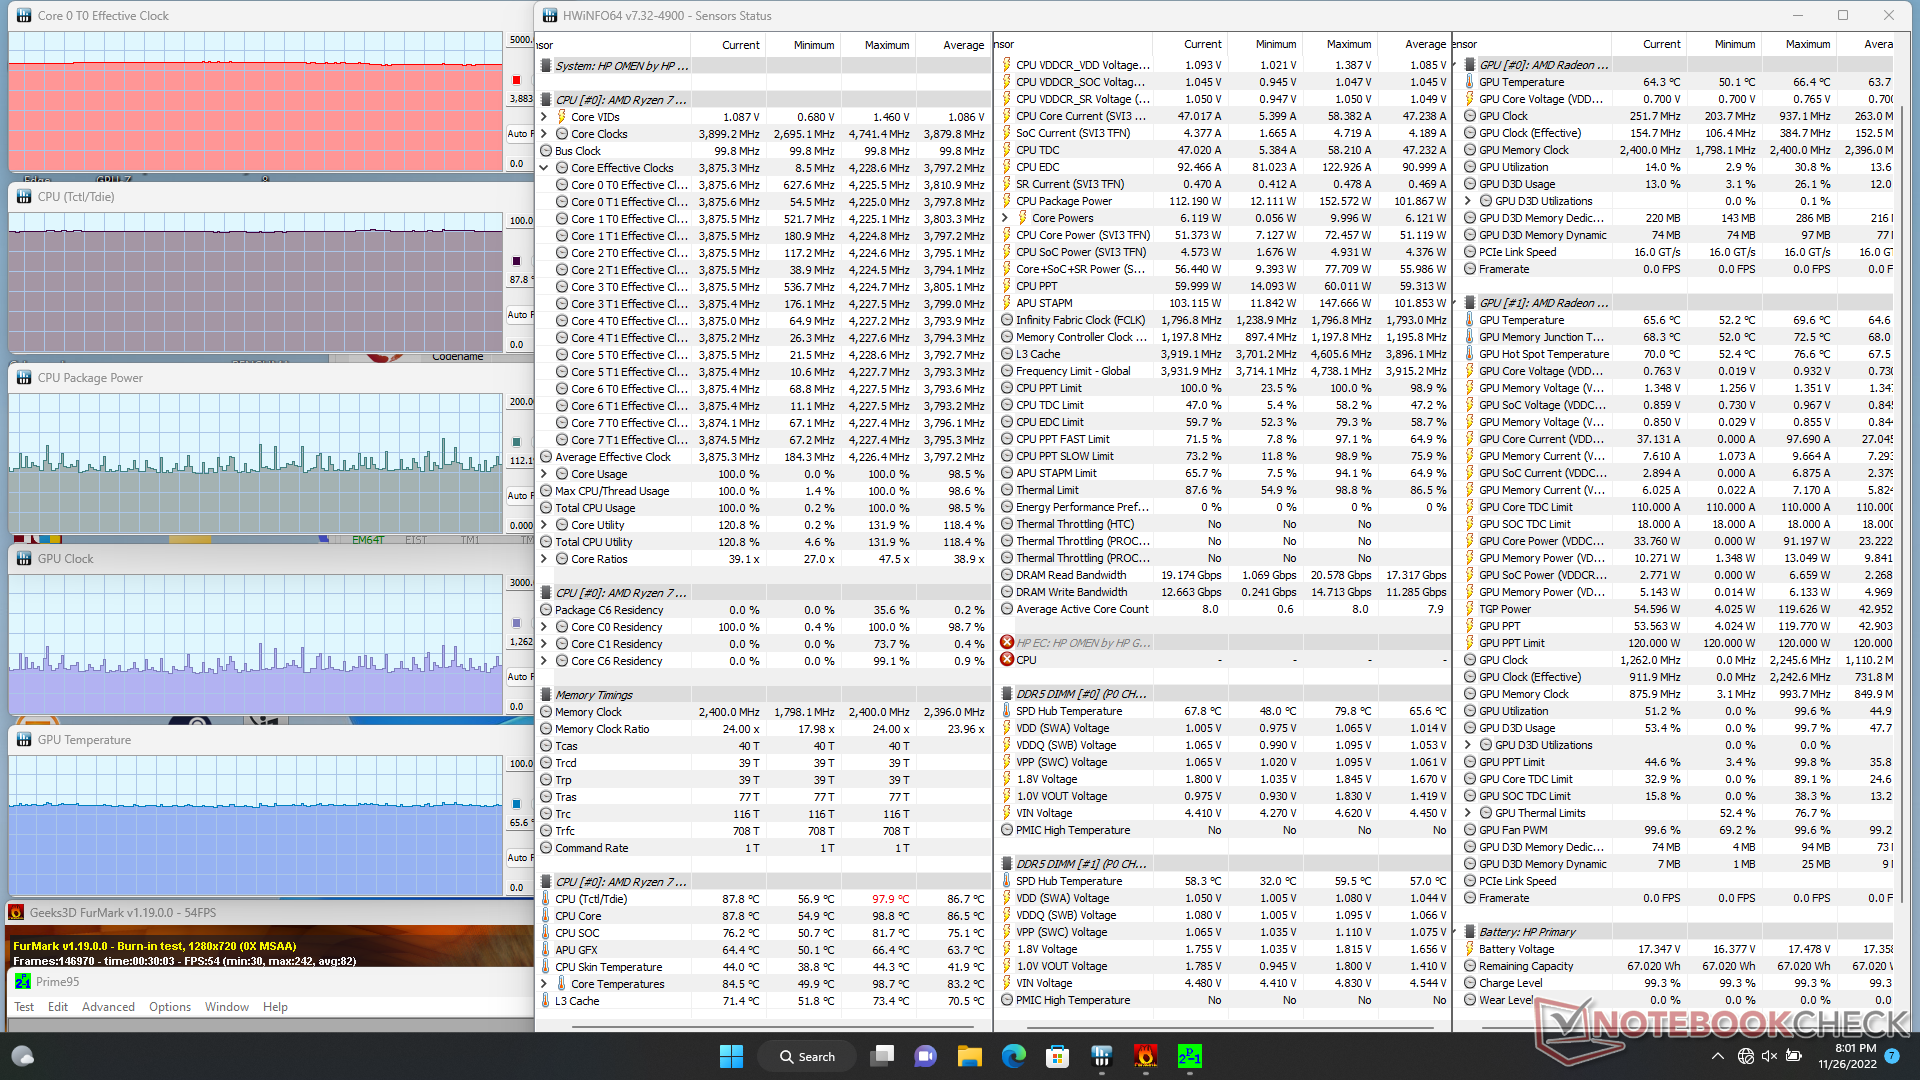
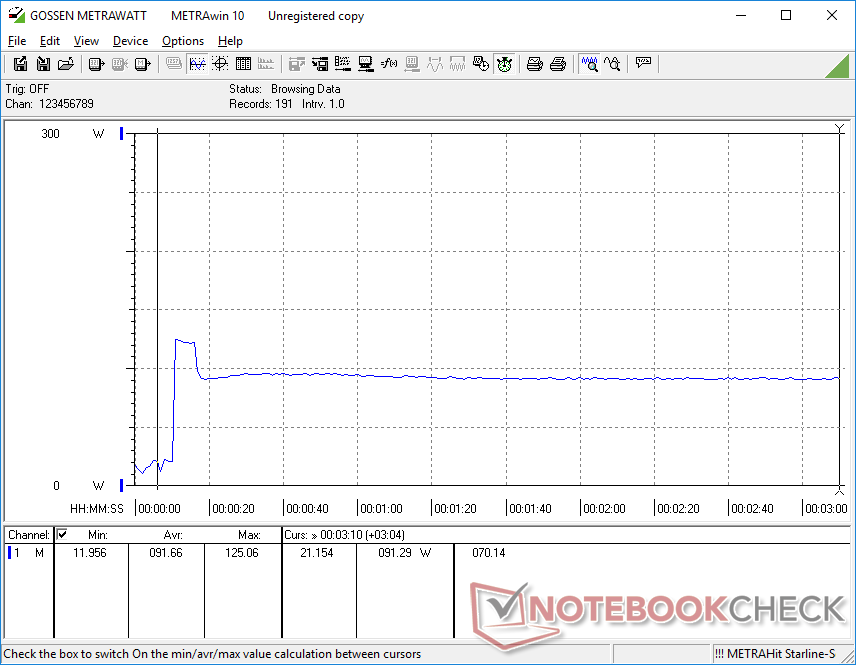
Teste de estresse
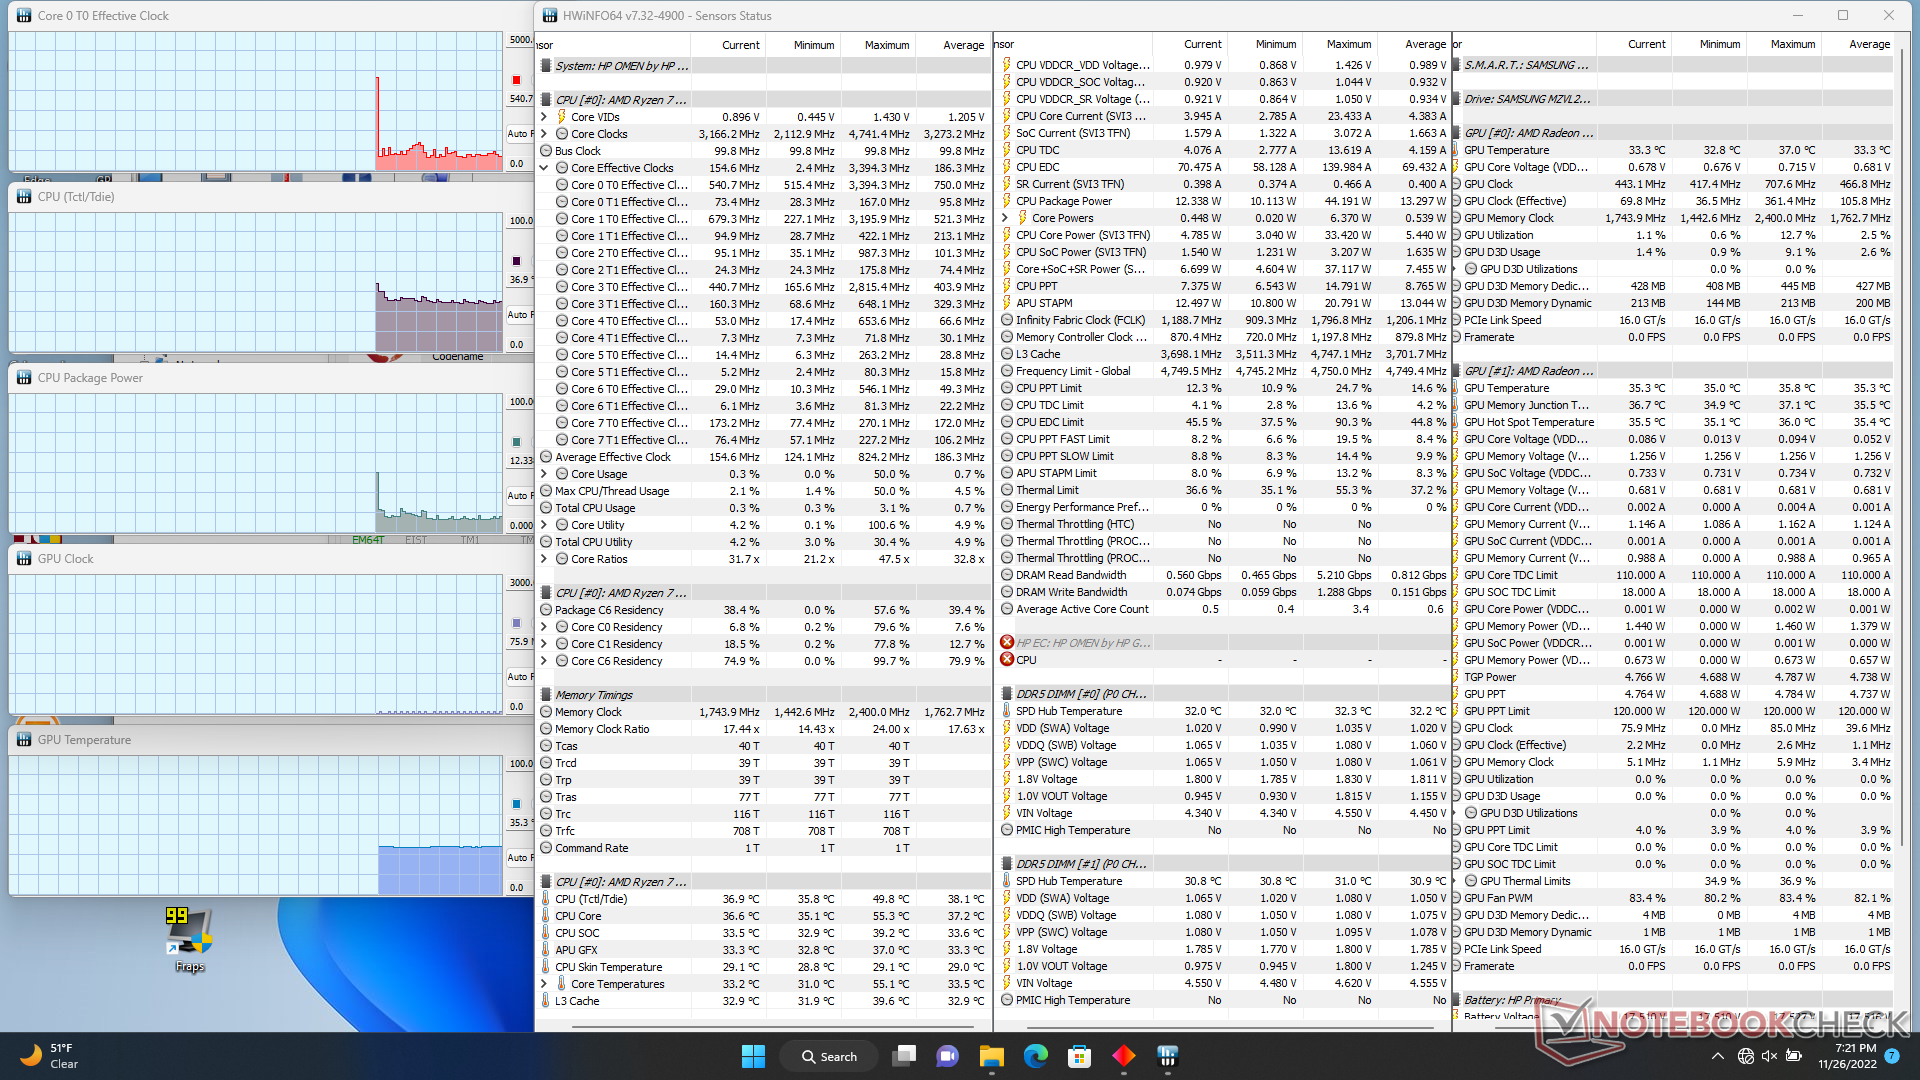
Quando estressada sob Prime95, a CPU aumentaria para 4,4 GHz e 93 W por apenas alguns segundos antes de cair e se estabilizar em 3,7 GHz e 64 W. As taxas máximas de impulso do relógio são, portanto, apenas de curta duração no Omen 16. Repetindo este mesmo teste noLenovo Legion 5 Pro Gen 7 com a mesma CPU Ryzen 7 6800H resultaria em uma taxa de relógio e temperatura estáveis mais altas de 4,1 GHz e 93 C, respectivamente, em comparação com apenas 3,7 GHz e 78 C em nosso HP.
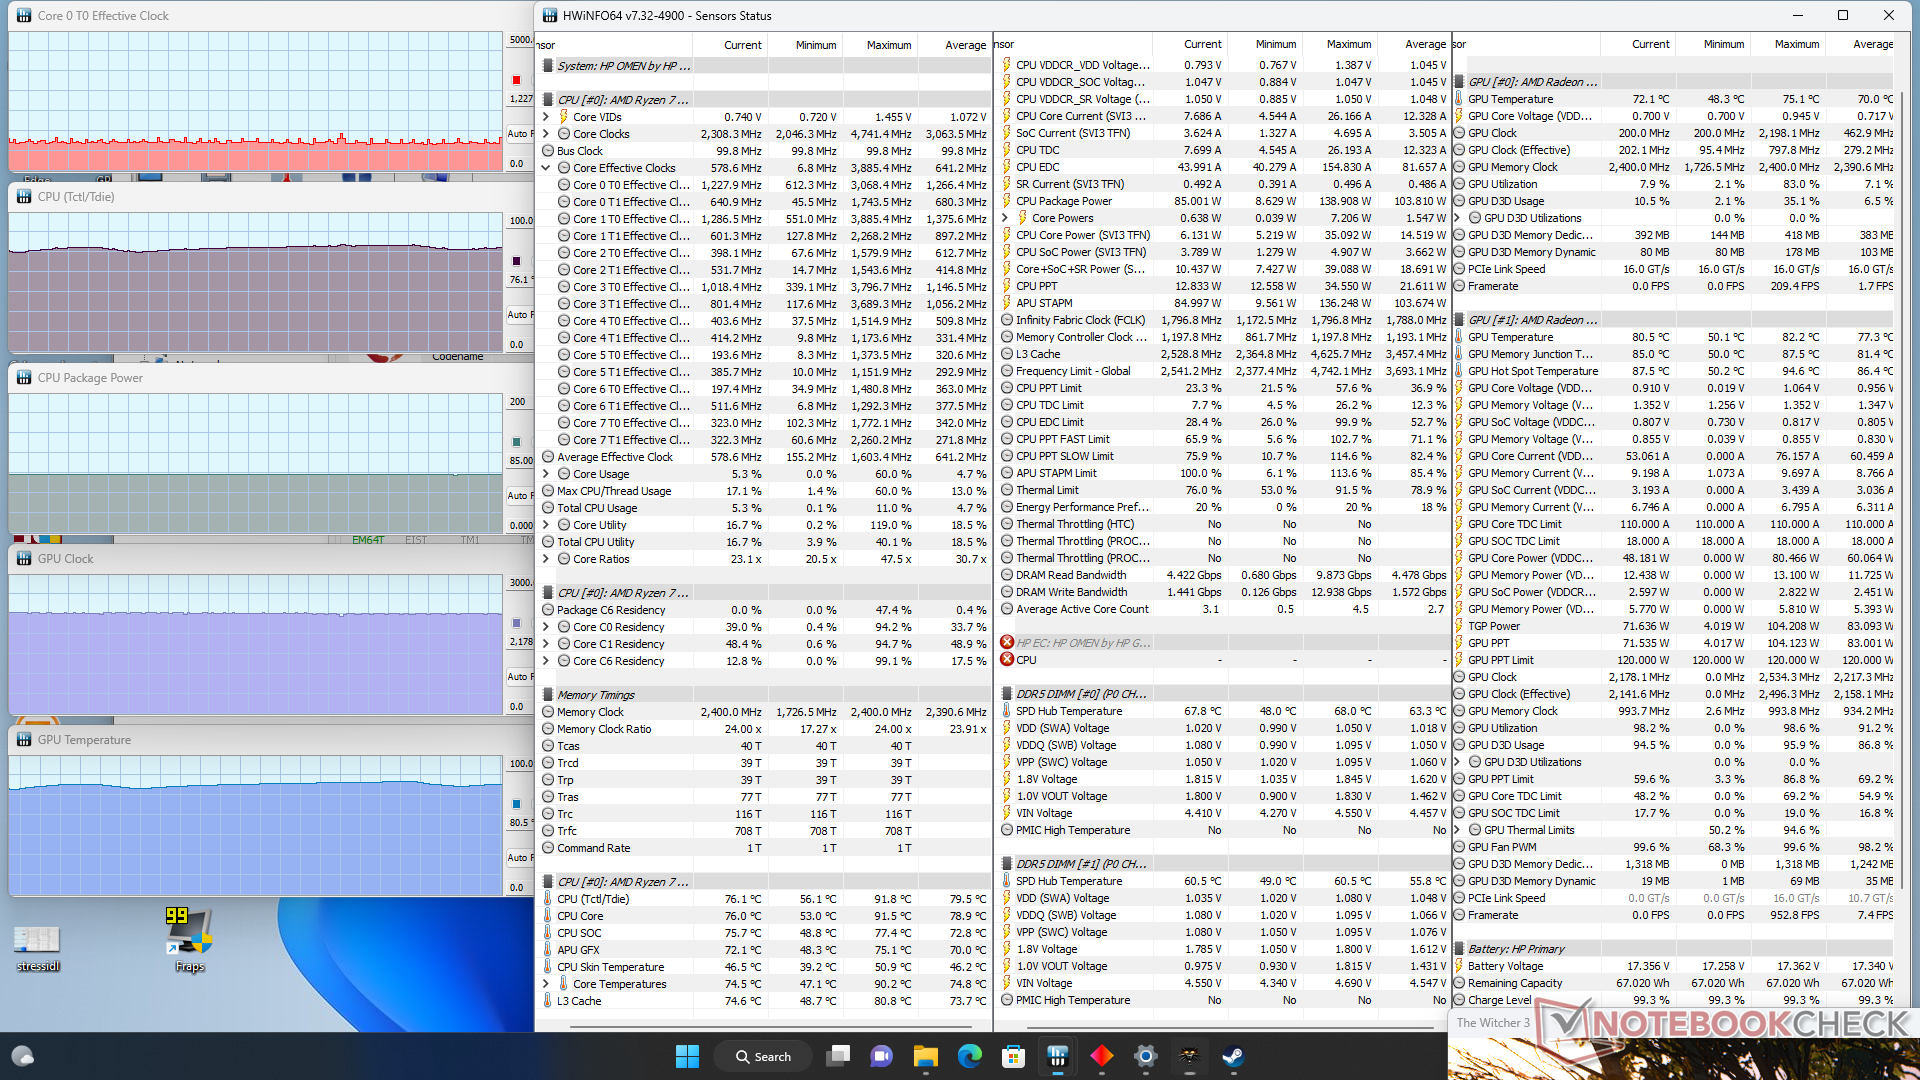
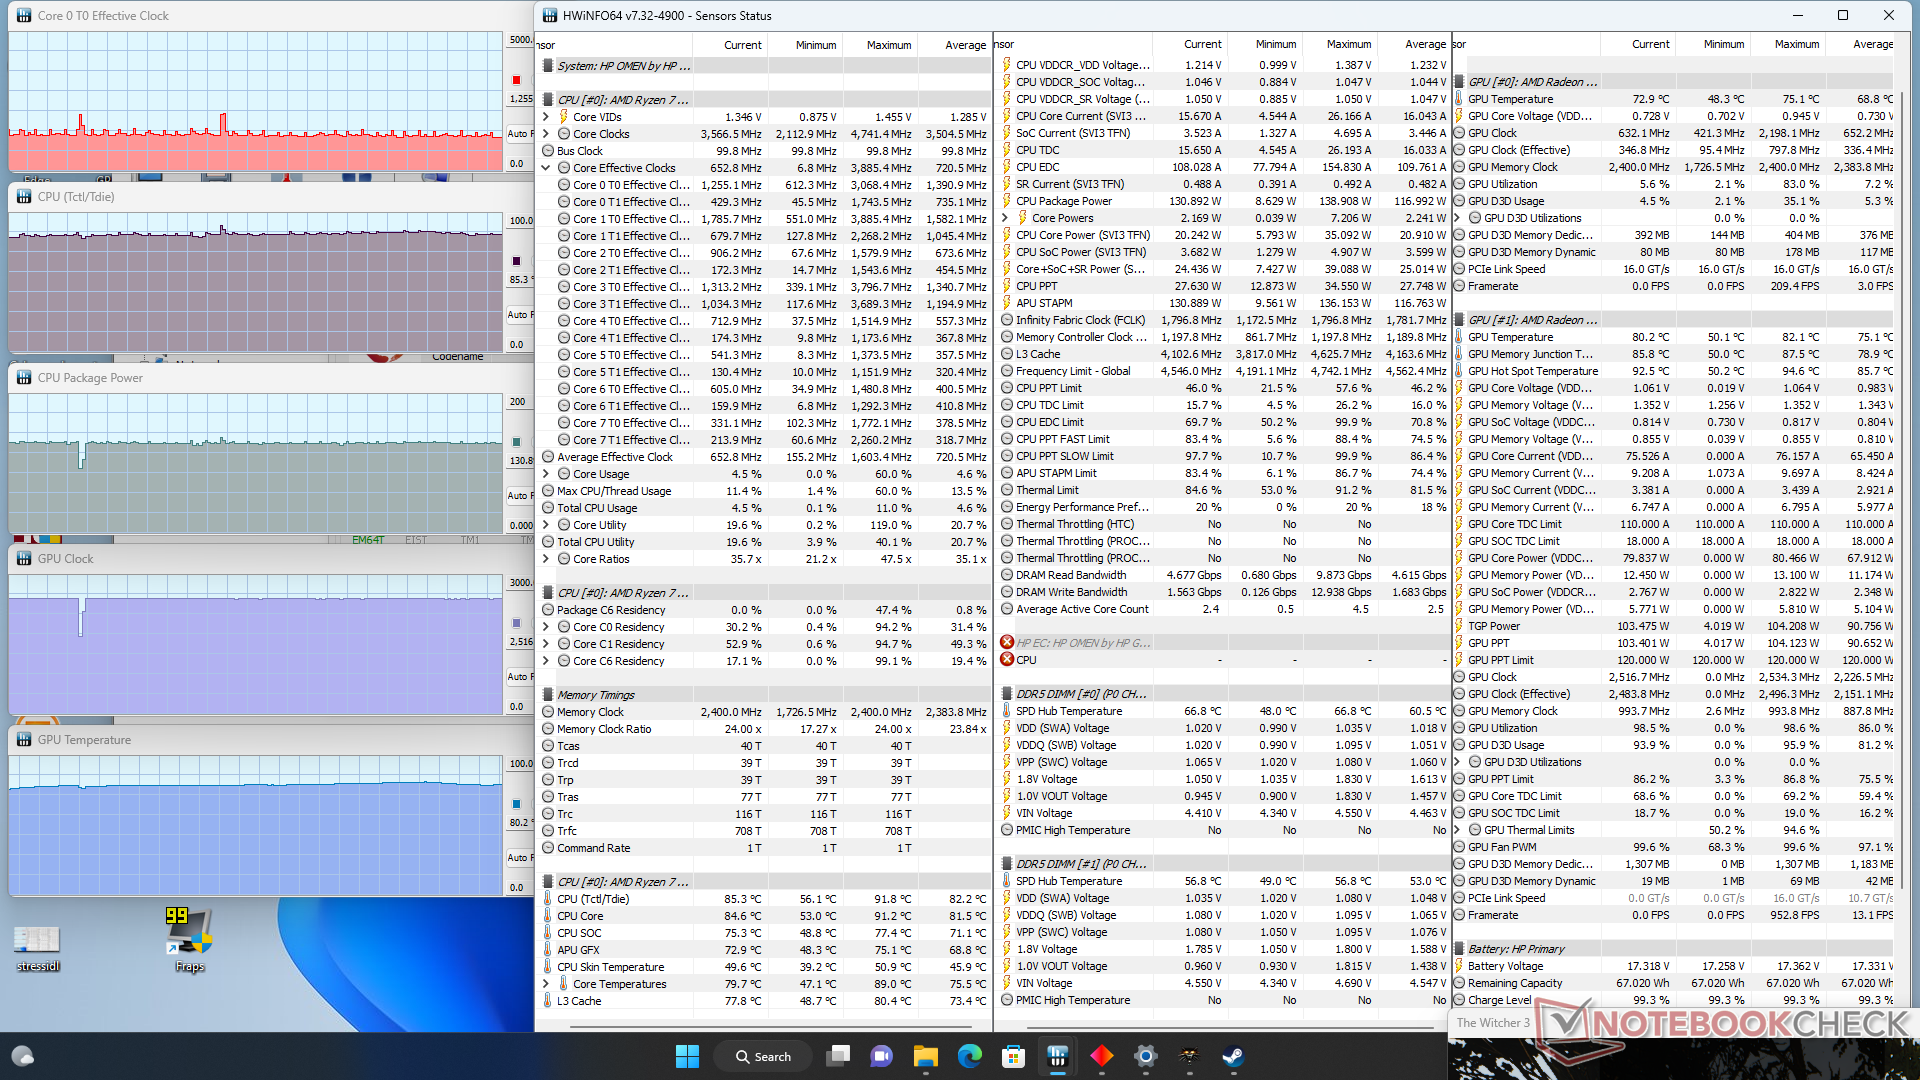
Quando em funcionamento Witcher 3 no modo Performance para representar cargas de jogo típicas, a GPU se estabilizaria em 2516 MHz, 80 C e 103 W. Caindo para o modo Balanceado resultaria em um relógio GPU mais baixo de 2178 MHz e um TGP mais baixo de 72 W, mas sem mudanças significativas na temperatura central. Portanto, os usuários devem se lembrar de ativar o modo Performance através do software Omen Gaming Hub a fim de explorar totalmente a GPU.
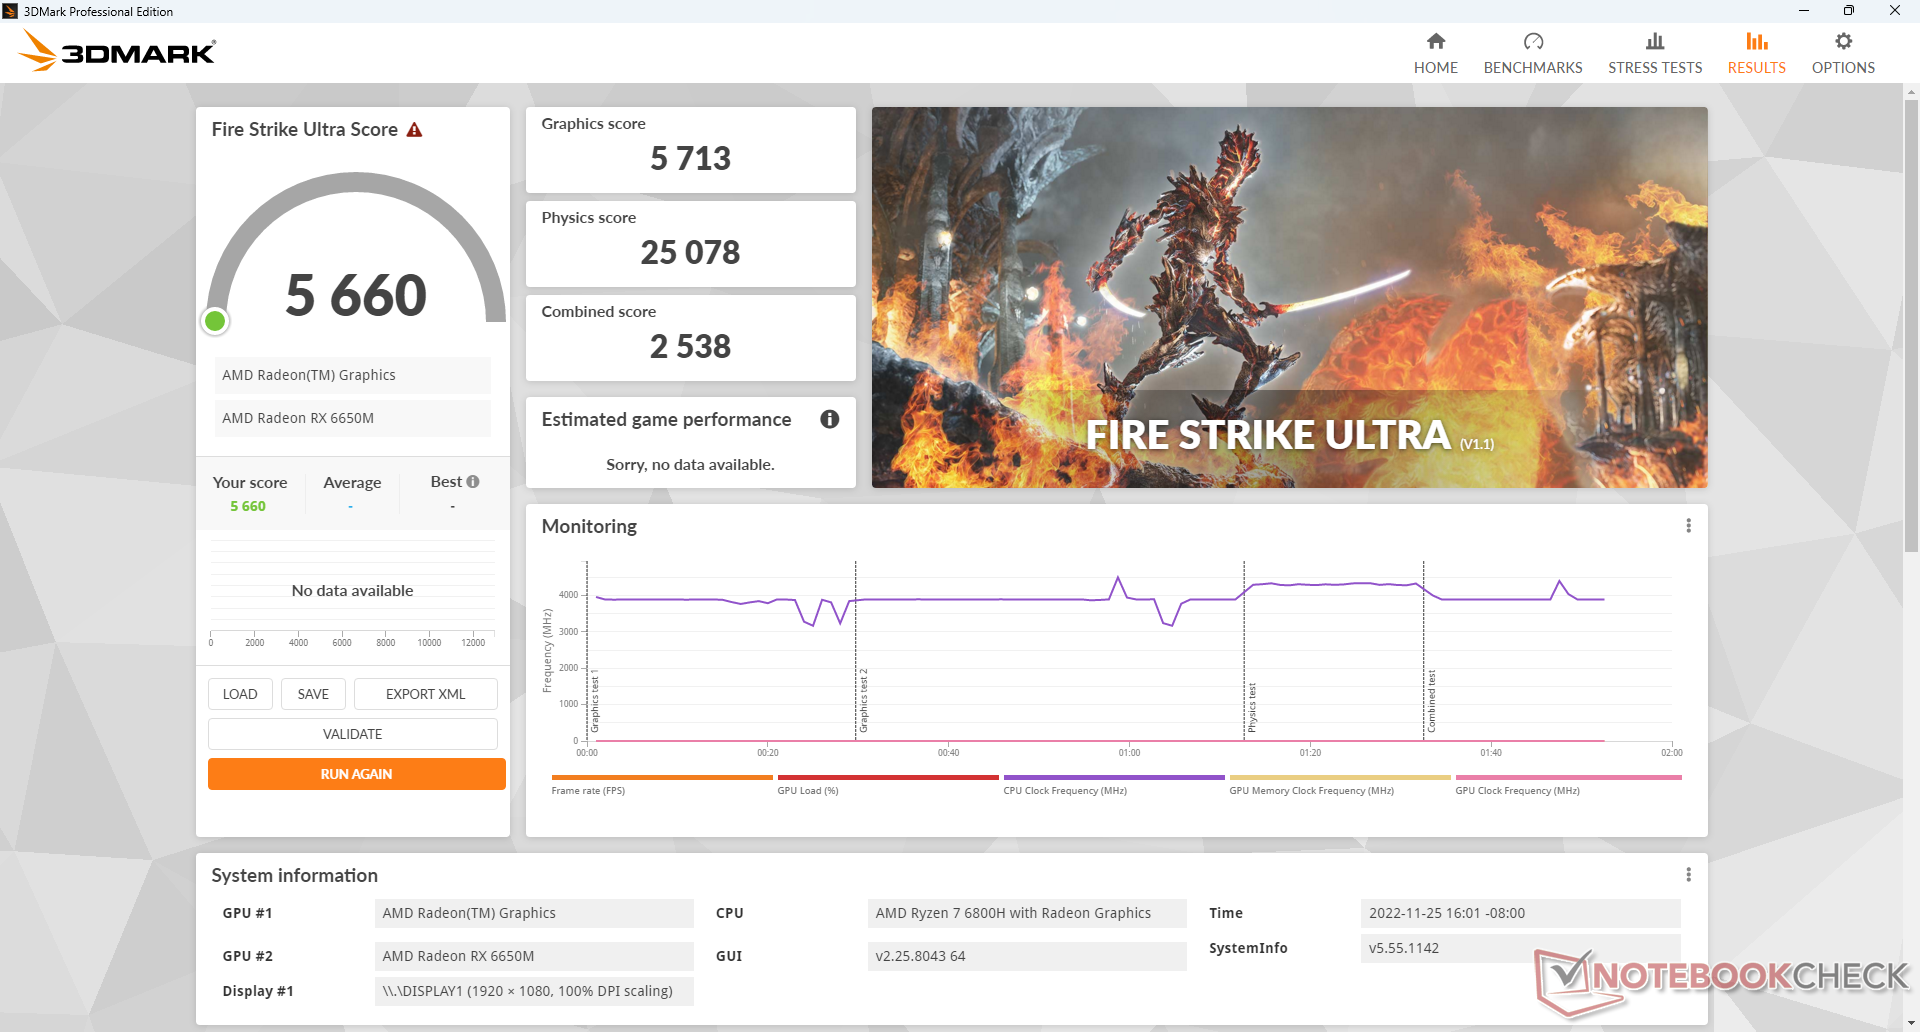
Funcionando com bateria limita o desempenho. Um teste Fire Strike em baterias retornaria pontuações de Física e Gráficos de apenas 21063 e 5722 pontos, respectivamente, em comparação com 25021 e 25739 pontos quando em rede elétrica.
| Relógio CPU (GHz) | Relógio GPU (MHz) | Temperatura média da CPU (°C) | Temperatura média da GPU (°C) | |
| System Idle | -- | -- | 37 | 35 |
| Prime95 Stress | 3.7 | -- | 79 | 52 |
| Prime95 + FurMark Stress | 3.9 | ~1262 | 88 | 66 |
| Witcher 3 Stress (modo equilibrado) | ~1.1 | 2178 | 76 | 81 |
| Witcher 3 Estresse (modo de desempenho) | ~1.1 | 2516 | 85 | 80 |
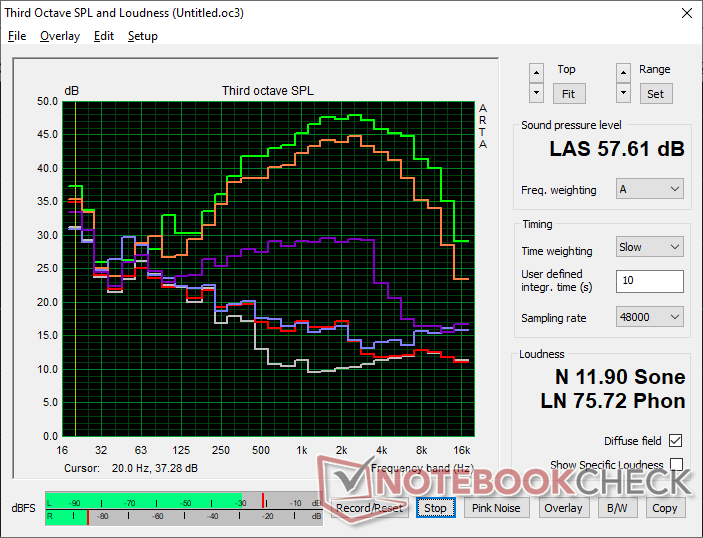
Oradores
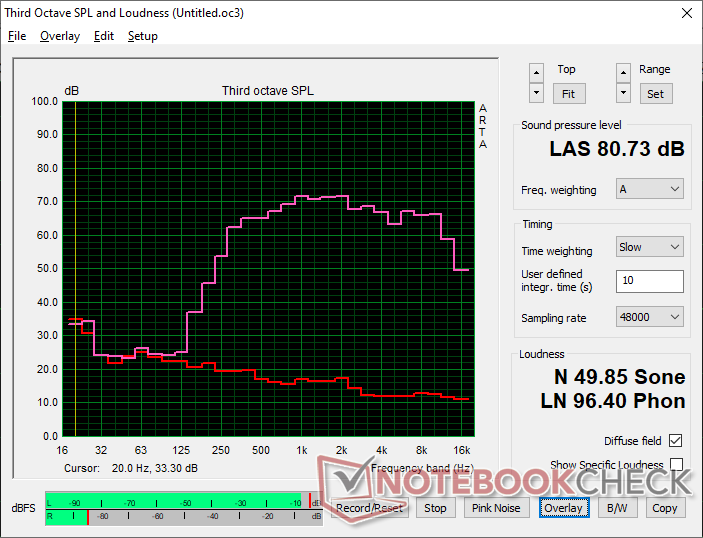
HP Omen 16-n0033dx análise de áudio
(±) | o volume do alto-falante é médio, mas bom (###valor### dB)
Graves 100 - 315Hz
(-) | quase nenhum baixo - em média 24.7% menor que a mediana
(±) | a linearidade dos graves é média (13% delta para a frequência anterior)
Médios 400 - 2.000 Hz
(+) | médios equilibrados - apenas 3.4% longe da mediana
(+) | médios são lineares (2.8% delta para frequência anterior)
Altos 2 - 16 kHz
(+) | agudos equilibrados - apenas 1.3% longe da mediana
(+) | os máximos são lineares (4.4% delta da frequência anterior)
Geral 100 - 16.000 Hz
(±) | a linearidade do som geral é média (19.3% diferença em relação à mediana)
Comparado com a mesma classe
» 65% de todos os dispositivos testados nesta classe foram melhores, 8% semelhantes, 27% piores
» O melhor teve um delta de 6%, a média foi 18%, o pior foi 132%
Comparado com todos os dispositivos testados
» 47% de todos os dispositivos testados foram melhores, 8% semelhantes, 46% piores
» O melhor teve um delta de 4%, a média foi 23%, o pior foi 134%
Apple MacBook Pro 16 2021 M1 Pro análise de áudio
(+) | os alto-falantes podem tocar relativamente alto (###valor### dB)
Graves 100 - 315Hz
(+) | bons graves - apenas 3.8% longe da mediana
(+) | o baixo é linear (5.2% delta para a frequência anterior)
Médios 400 - 2.000 Hz
(+) | médios equilibrados - apenas 1.3% longe da mediana
(+) | médios são lineares (2.1% delta para frequência anterior)
Altos 2 - 16 kHz
(+) | agudos equilibrados - apenas 1.9% longe da mediana
(+) | os máximos são lineares (2.7% delta da frequência anterior)
Geral 100 - 16.000 Hz
(+) | o som geral é linear (4.6% diferença em relação à mediana)
Comparado com a mesma classe
» 0% de todos os dispositivos testados nesta classe foram melhores, 0% semelhantes, 100% piores
» O melhor teve um delta de 5%, a média foi 17%, o pior foi 45%
Comparado com todos os dispositivos testados
» 0% de todos os dispositivos testados foram melhores, 0% semelhantes, 100% piores
» O melhor teve um delta de 4%, a média foi 23%, o pior foi 134%
Gestão de Energia - Jogador Exigente
Consumo de energia
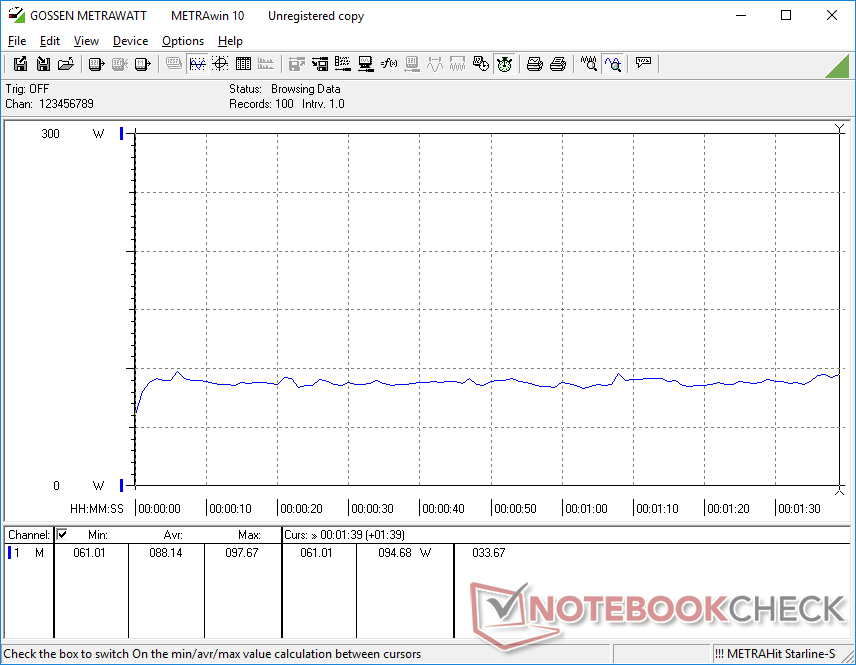
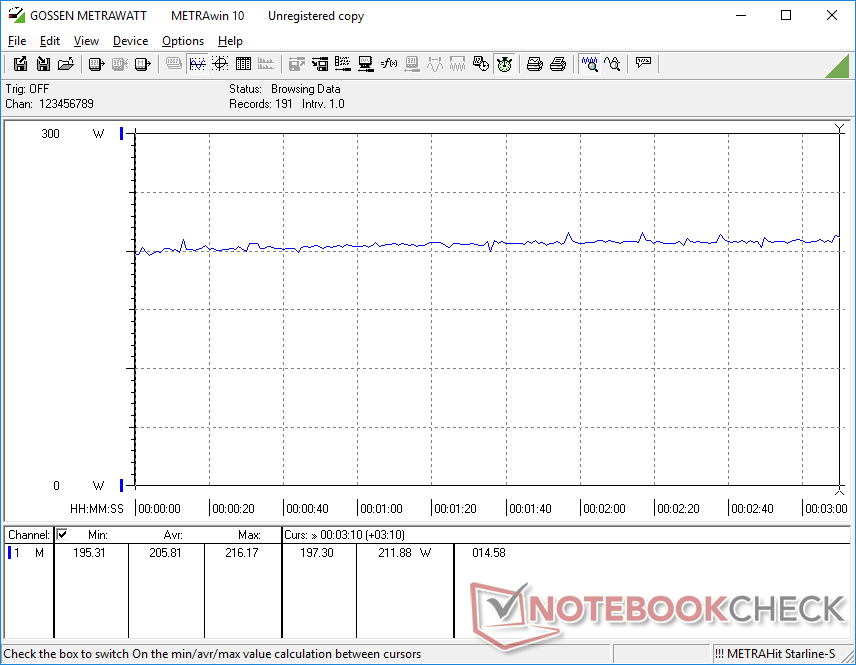
Como o Radeon RX 6650M é ligeiramente mais rápido que o RTX 3060, devemos esperar que o consumo médio de energia seja também um pouco mais alto. Infelizmente para a AMD, a realidade é que nosso Omen 16 pode ter muito mais fome de energia do que a maioria dos outros laptops RTX 2060 quando se joga. Rodando Witcher 3por exemplo, exige 206 W em comparação com 177 W, 187 W, e 155 W no G16 da Dell RTX 3060,Lenovo Legion 5 15, e Lenovo Legion Slim 7 16, respectivamente. Estas mesmas alternativas podem até mesmo oferecer um desempenho mais rápido da CPU com seus processadores Intel do 12º gênero
Felizmente, o consumo de energia é comparável a muitos laptops Intel-Nvidia quando não executam nenhuma aplicação exigente. Isto significa que a duração da bateria não será dramaticamente menor do que a maioria das alternativas Intel-Nvidia ao navegar na web ou fazer streaming, apesar de quão faminto de energia o laptop pode estar quando estiver jogando
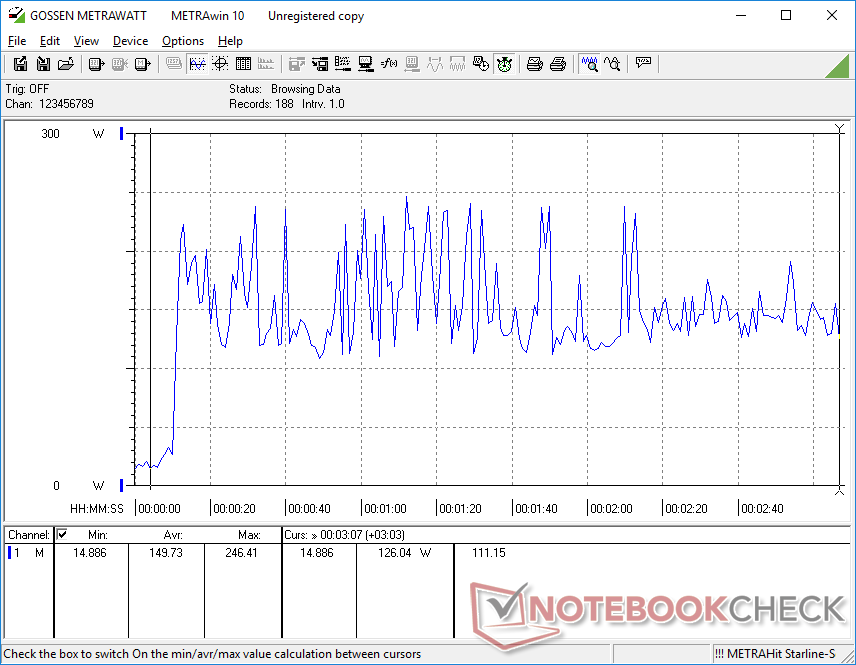
Somos capazes de registrar um consumo máximo temporário de 246 W do adaptador AC de 280 W quando tanto a CPU quanto a GPU estão em 100% de utilização.
| desligado | |
| Ocioso | |
| Carga |
|
Key:
min: | |
| HP Omen 16-n0033dx R7 6800H, Radeon RX 6650M, Samsung PM9A1 MZVL21T0HCLR, IPS, 1920x1080, 16.1" | HP Envy 16 h0112nr i7-12700H, GeForce RTX 3060 Laptop GPU, Micron 3400 1TB MTFDKBA1T0TFH, OLED, 3840x2400, 16" | HP Omen 16-b1090ng i7-12700H, GeForce RTX 3070 Ti Laptop GPU, WDC PC SN810 1TB, IPS, 2560x1440, 16.1" | HP Victus 16-e0145ng R5 5600H, GeForce RTX 3050 Ti Laptop GPU, Samsung SSD PM981a MZVLB512HBJQ, IPS, 1920x1080, 16.1" | Lenovo Legion S7 16ARHA7 R9 6900HX, Radeon RX 6800S, SK Hynix HFS001TEJ9X115N, IPS, 2560x1600, 16" | Dell G16 7620 i7-12700H, GeForce RTX 3060 Laptop GPU, WDC PC SN810 512GB, IPS, 2560x1600, 16" | |
|---|---|---|---|---|---|---|
| Power Consumption | -9% | 8% | 18% | -3% | -35% | |
| Idle Minimum * (Watt) | 7.9 | 10 -27% | 4 49% | 7 11% | 8.8 -11% | 14.4 -82% |
| Idle Average * (Watt) | 11.5 | 10.9 5% | 10 13% | 9 22% | 14.7 -28% | 17.8 -55% |
| Idle Maximum * (Watt) | 18.3 | 27.8 -52% | 19 -4% | 15 18% | 19.8 -8% | 31.5 -72% |
| Load Average * (Watt) | 88.1 | 116.4 -32% | 114 -29% | 93 -6% | 85.3 3% | 101.2 -15% |
| Witcher 3 ultra * (Watt) | 206 | 133.7 35% | 183.2 11% | 134.5 35% | 167.5 19% | 176.9 14% |
| Load Maximum * (Watt) | 246.4 | 209.8 15% | 221 10% | 185 25% | 230.7 6% | 242.9 1% |
* ... menor é melhor
Power Consumption Witcher 3 / Stresstest
Power Consumption external Monitor
Vida útil da bateria
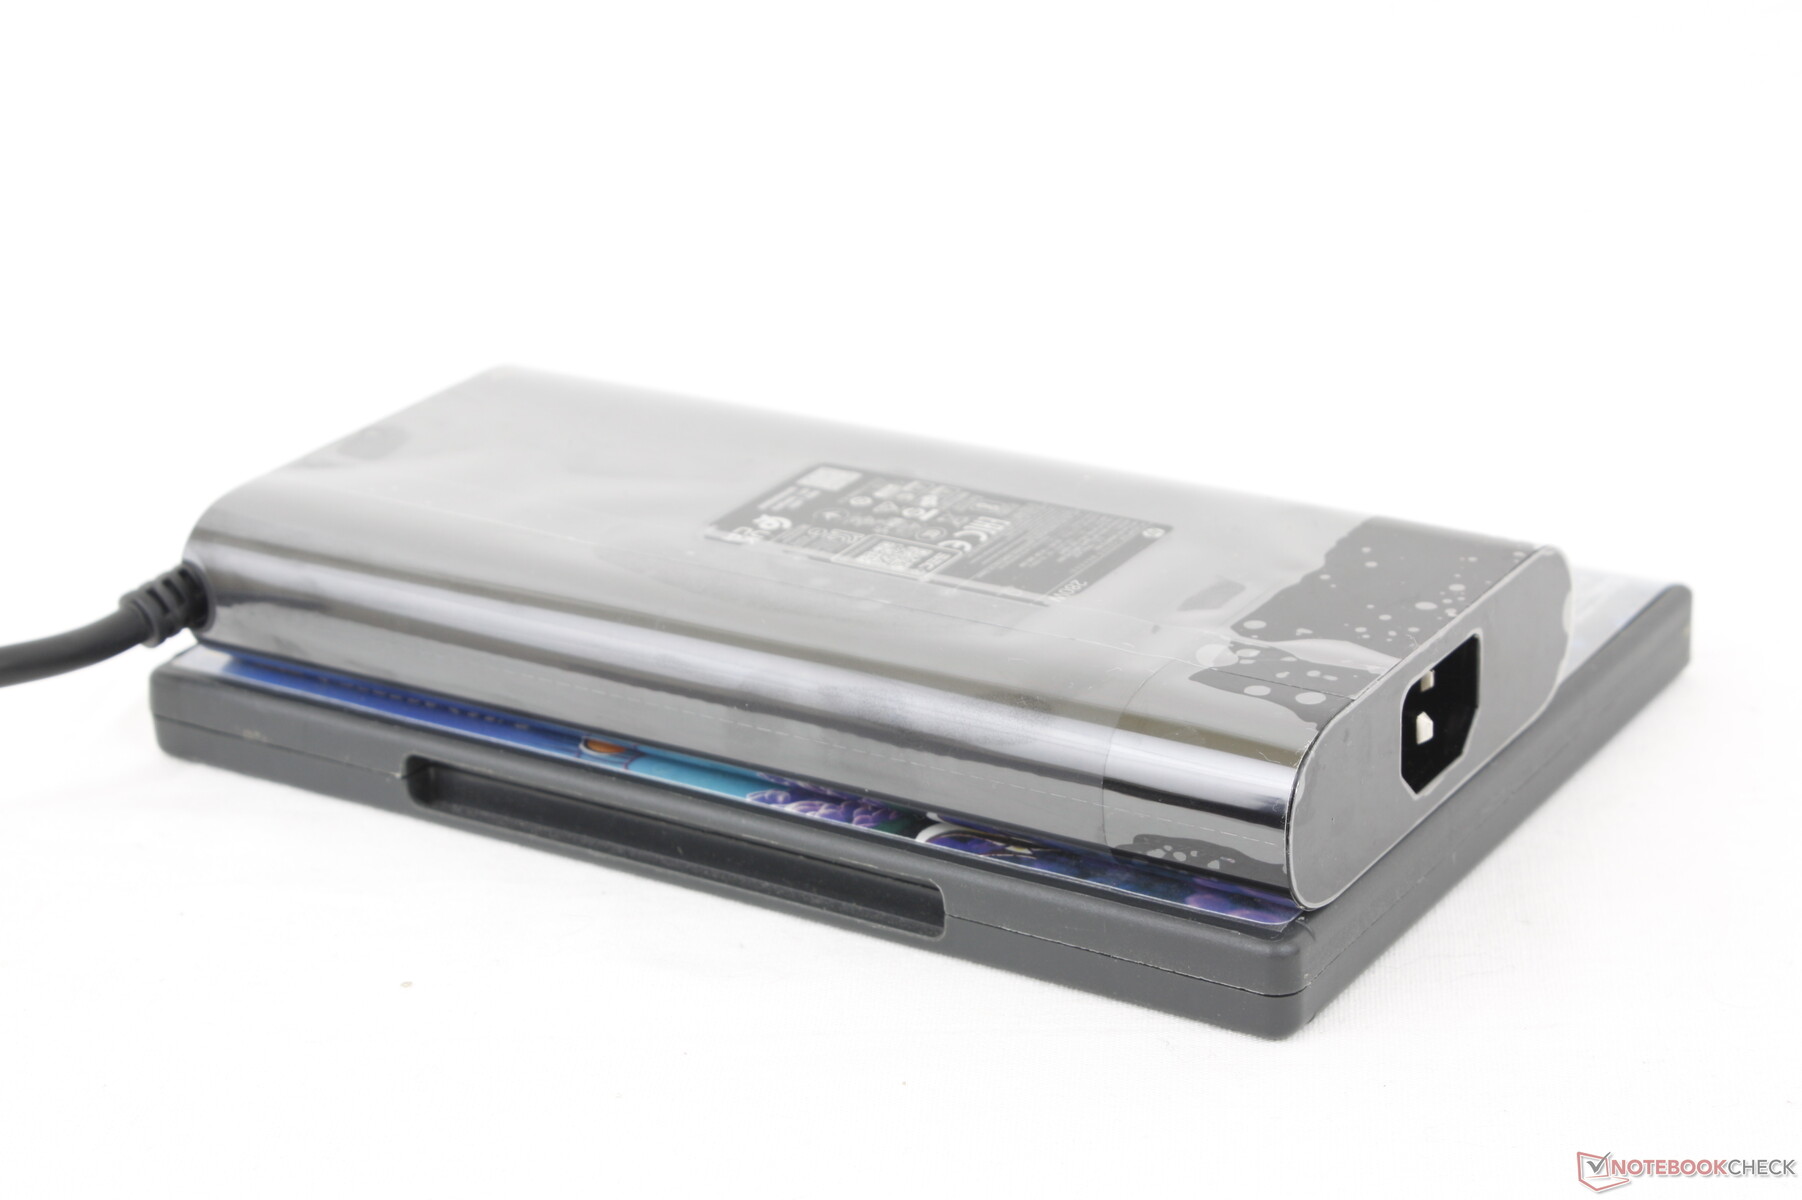
A capacidade da bateria é notavelmente menor do que nas versões mais antigas do Omen 16 (68 Wh vs. 83 Wh) da Intel. No entanto, o tempo total de execução não é significativamente menor em nosso modelo AMD. Somos capazes de registrar um tempo de execução WLAN no mundo real de quase 7 horas no perfil de potência Balanceado que está acima da média para um laptop de jogos
A carga de capacidade vazia a plena com o adaptador AC incluído é relativamente lenta de 2 a 2,5 horas em comparação com 1,5 horas na maioria dos laptops. Além disso, o laptop não é compatível com a maioria dos carregadores AC USB-C de terceiros. A HP anuncia que o modelo suporta fornecimento de energia USB-C, mas conectar nosso próprio adaptador USB-C AC de 100 W resultaria na mensagem de aviso "O adaptador AC não é compatível com o sistema". Em comparação, os laptops para jogos habilitados para PD da Razer, MSI ou Asus funcionariam com todos os nossos adaptadores USB-C AC testados.
| HP Omen 16-n0033dx R7 6800H, Radeon RX 6650M, 68 Wh | HP Envy 16 h0112nr i7-12700H, GeForce RTX 3060 Laptop GPU, 83 Wh | HP Omen 16-b1090ng i7-12700H, GeForce RTX 3070 Ti Laptop GPU, 83 Wh | HP Victus 16-e0145ng R5 5600H, GeForce RTX 3050 Ti Laptop GPU, 70 Wh | Lenovo Legion S7 16ARHA7 R9 6900HX, Radeon RX 6800S, 71 Wh | Dell G16 7620 i7-12700H, GeForce RTX 3060 Laptop GPU, 84 Wh | |
|---|---|---|---|---|---|---|
| Duração da bateria | 45% | 18% | 1% | -11% | -31% | |
| Reader / Idle (h) | 10 | 17.8 78% | 10.1 1% | 7.1 -29% | ||
| WiFi v1.3 (h) | 7 | 7.9 13% | 5.6 -20% | 7.1 1% | 6.2 -11% | 5 -29% |
| Load (h) | 1.1 | 1.6 45% | 1.9 73% | 0.7 -36% |
Pro
Contra
Veredicto - Alternativa Competente para o GeForce RTX 3060
Como a maioria dos laptops baseados em AMD, o AMD Omen 16 varejistas por várias centenas de dólares a menos do que um laptop Intel Core i7 e GeForce RTX equivalente. O Ryzen 7 6800H não pode competir com as últimas CPUs Core do 12º gênero em desempenho bruto, mas o Radeon RX 6650M se mantém melhor do que o esperado contra o RTX 3060. Uma vez que a maioria dos jogos é ligada à GPU, o déficit de CPU entre a Intel e a AMD, neste caso, importa muito menos quando se está rodando jogos reais. Os proprietários estariam obtendo um desempenho de jogo ligeiramente melhor do que um RTX 3060 por notavelmente menos dinheiro, o que é o principal apelo do AMD Omen 16.
Outros pontos positivos incluem o teclado confortável, ampla seleção de portas, tela de 144 Hz de boa qualidade, e um chassi suave tipo Envy 16. Alguns usuários também podem apreciar a falta de LEDs ou designs de jogadores superficiais, ao contrário da maioria das alternativas MSI ou Asus.
O AMD Omen 16 oferece melhor desempenho por dólar do que a maioria dos laptops alimentados pelo GeForce RTX 3060. No entanto, se você valoriza um desempenho superior da CPU e um potencial de rastreamento de raios, então você ainda vai querer investir em uma solução Intel-Nvidia.
No entanto, ainda há muito a melhorar. A moldura do queixo da tela, por exemplo, é muito grossa, levando a uma pegada maior e a um peso maior do que os concorrentes como aAsus Zephyrus M16 ou Lenovo Legion S7. O clickpad é muito sensível e os ventiladores ainda são mais altos do que a média se estiver no modo Performance. Os usuários podem querer considerar jogos no modo Equilibrado para os ventiladores significativamente mais silenciosos, mesmo que isso implique um leve golpe no desempenho.
Preço e Disponibilidade
Nossa unidade de revisão conforme configurada é agora enviando na Best Buy por $1580 USD. Entretanto, a HP está realizando uma venda na mesma configuração por por apenas $900 USD no momento da publicação. As variantes Intel-Nvidia do Omen 16 também estão amplamente disponíveis.
HP Omen 16-n0033dx
- 11/29/2022 v7 (old)
Allen Ngo
Price comparison

