Veredicto - a diferença de preço de 500 euros se justifica?
A versão Versão RTX 5070 Ti foi um dos laptops mais rápidos com essa GPU, e o mesmo pode ser dito sobre o modelo RTX 5070 padrão, embora a vantagem sobre os rivais não seja tão grande. O Aurora 16X da Alienware da Alienware, consegue até mesmo superá-lo ligeiramente.
Há uma diferença de aproximadamente 500 a 700 euros entre as duas variantes do Legion e, em troca, o senhor obtém até 25% a mais de desempenho da GPU. Isso parece significativo no papel, mas o impacto no mundo real varia muito, dependendo do jogo. O modelo Ti também se beneficia da memória de vídeo extra, o que ajuda a garantir o futuro. Por outro lado, a versão "menor" é mais silenciosa, mais fria e consome menos energia.
Mesmo sem a GPU mais potente, esse ainda é um laptop para jogos muito capaz e de alta qualidade a um preço relativamente moderado.
Pro
Contra
- $1,849.00Lenovo Legion Pro 5 16IAX10 Gaming Laptop 2025 16” WQXGA 2560 x 1600 Display IPS Intel Core Ultra 7 255HX NVIDIA GeForce RTX 5070 8GB GDDR7 16GB DDR5 1TB SSD Backlit KB Wi-Fi 7 Windows 11 Home
- $2,129.00Lenovo 2025 Gaming Laptop | Legion Pro 5 | Intel 20-Core Ultra 7 255HX | NVIDIA GeForce RTX 5070 | 32GB DDR5 | 1TB SSD | 16" 2560x1600 165Hz | Win11 Pro - Wi-Fi 7 - BT 5.4 - RGB Backlit KB - Grey
- $1,899.00Lenovo Legion Pro 5 16IAX10 Gaming Laptop 2025 16” WQXGA 2560 x 1600 Display IPS Intel Core Ultra 7 255HX NVIDIA GeForce RTX 5070 8GB GDDR7 16GB DDR5 1TB SSD Backlit KB Wi-Fi 7 Windows 11 Pro
Índice
- Veredicto - a diferença de preço de 500 euros se justifica?
- Especificações
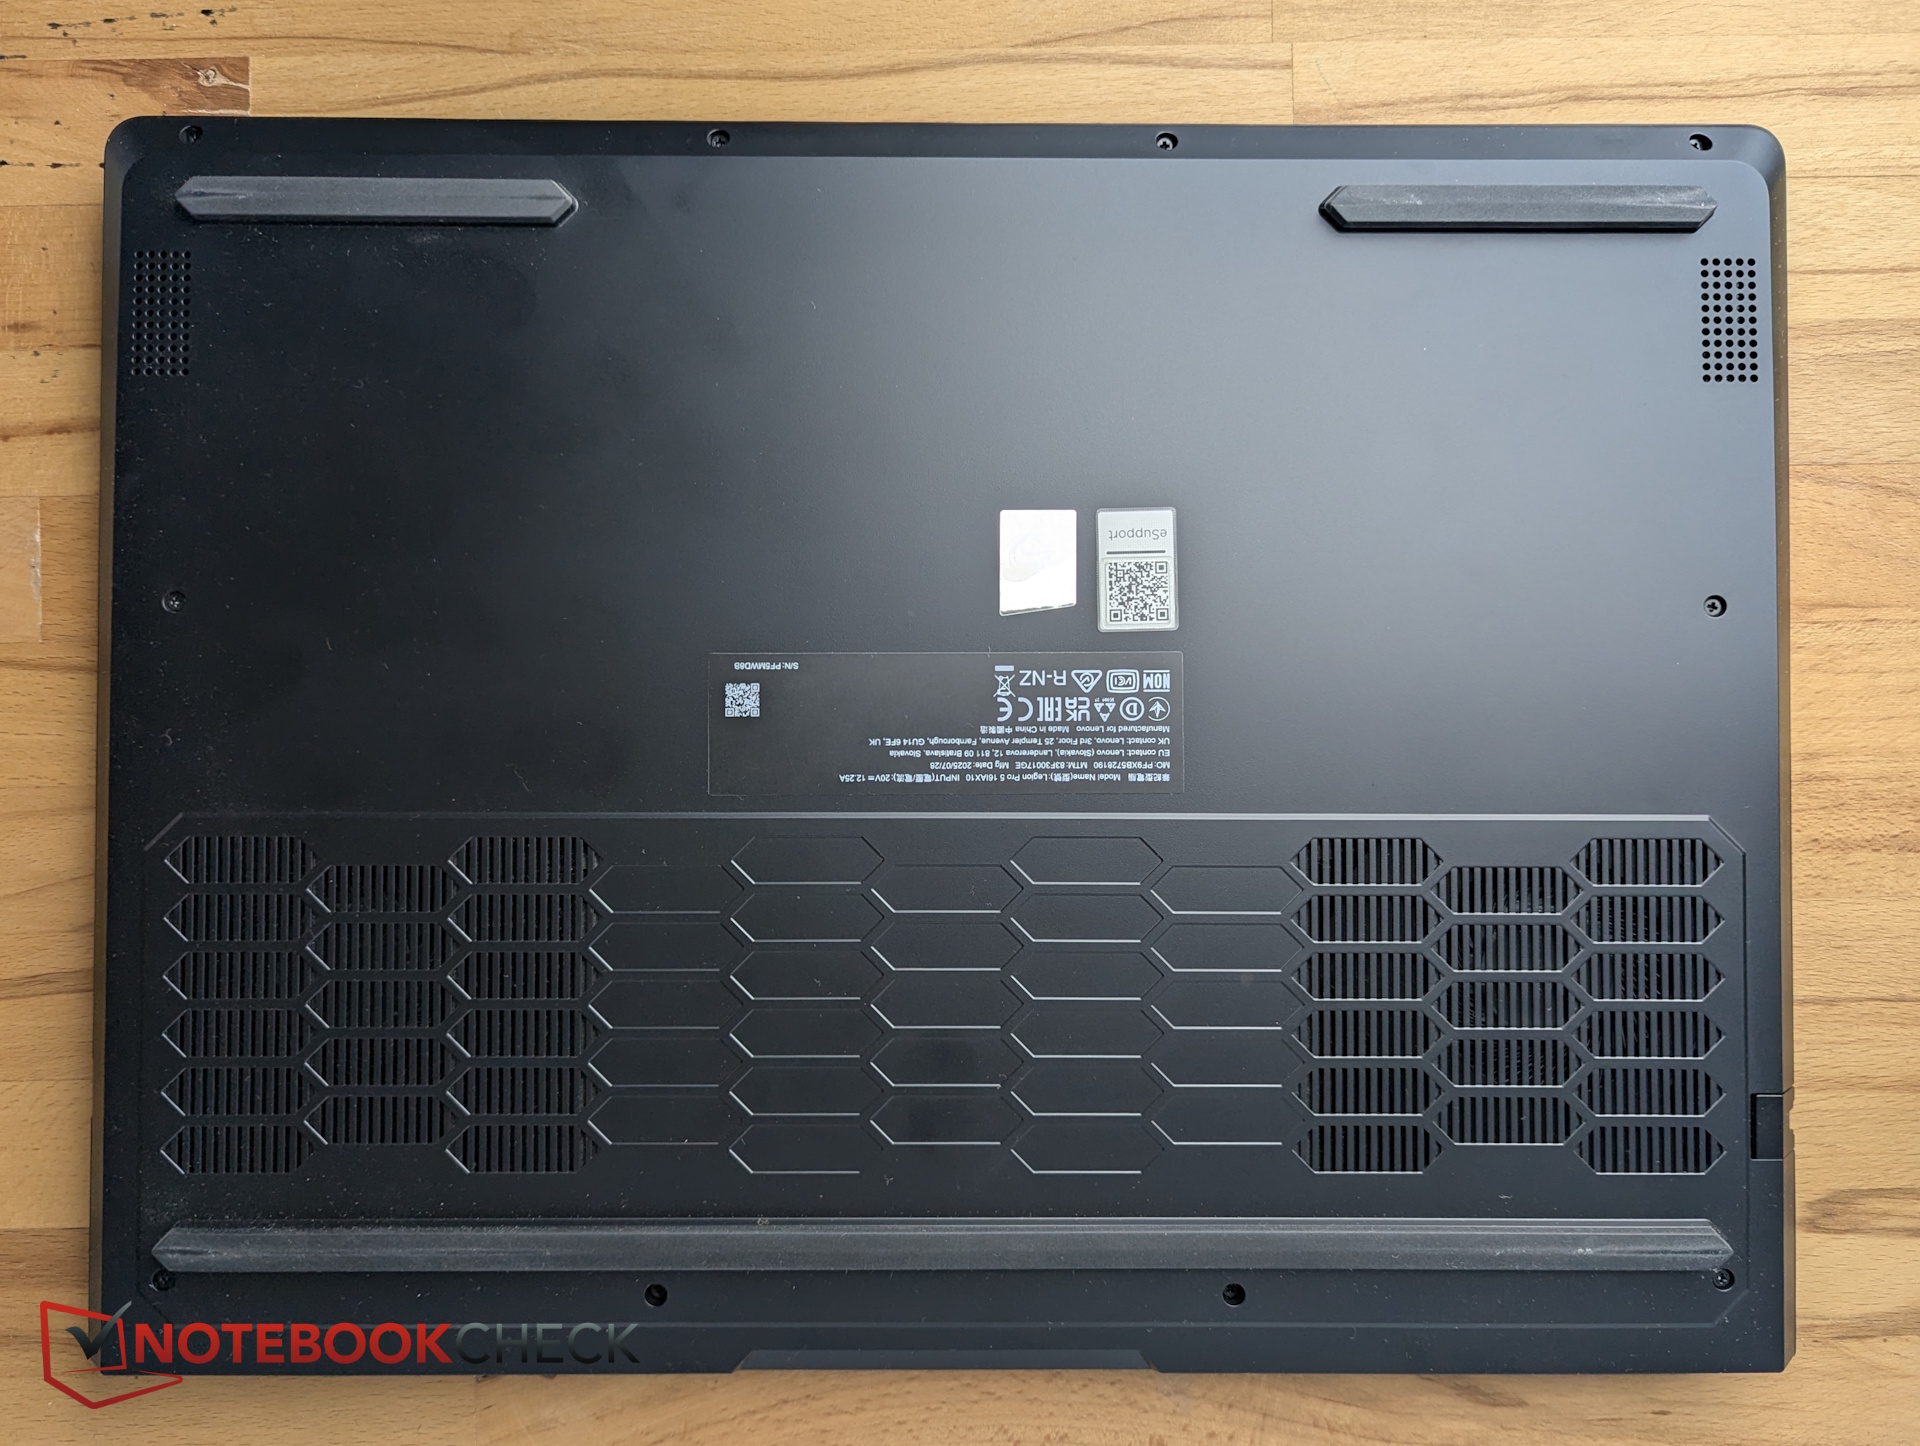
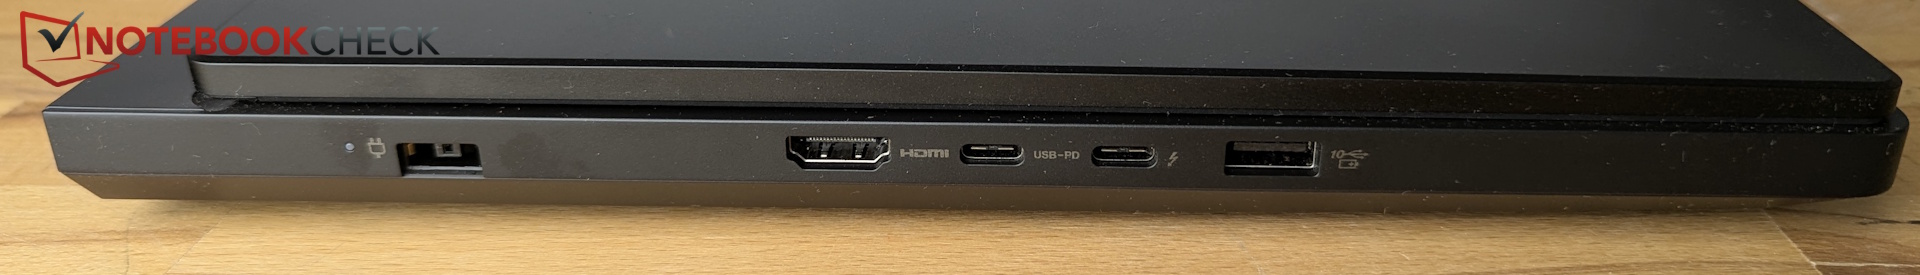
- Chassi e recursos - elegante, mas com ímã de impressões digitais
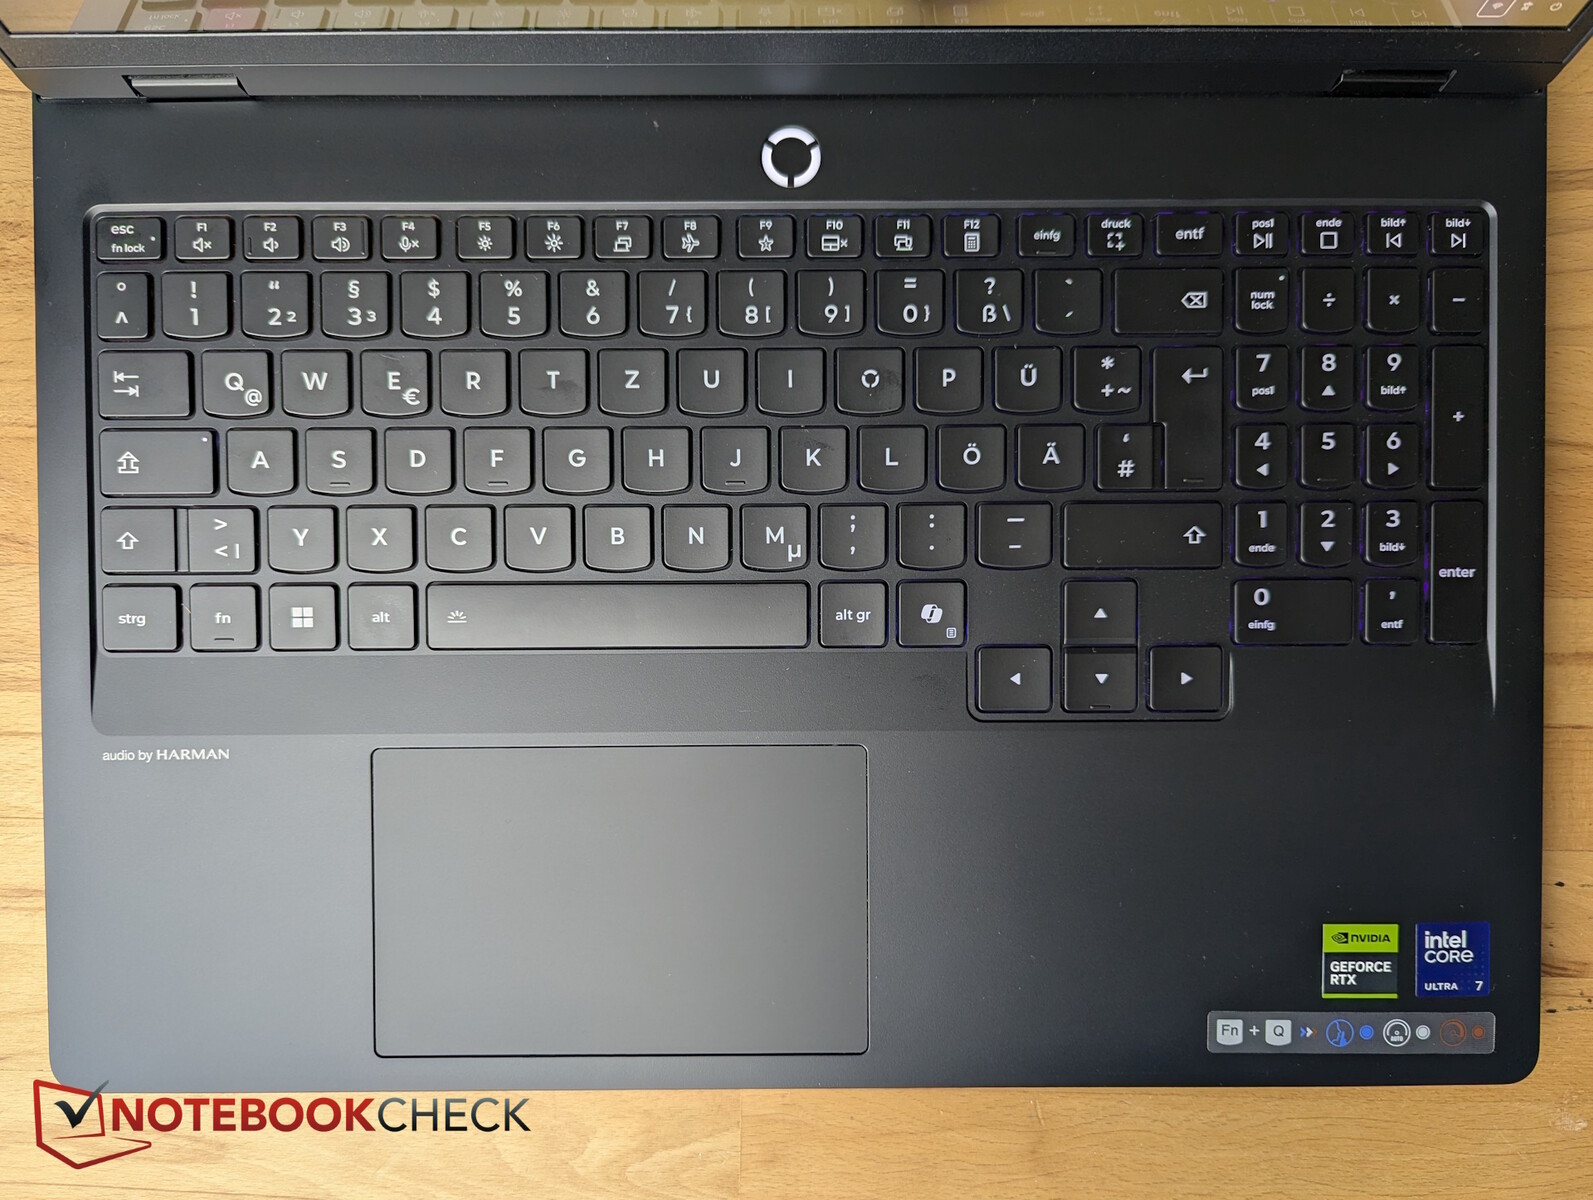
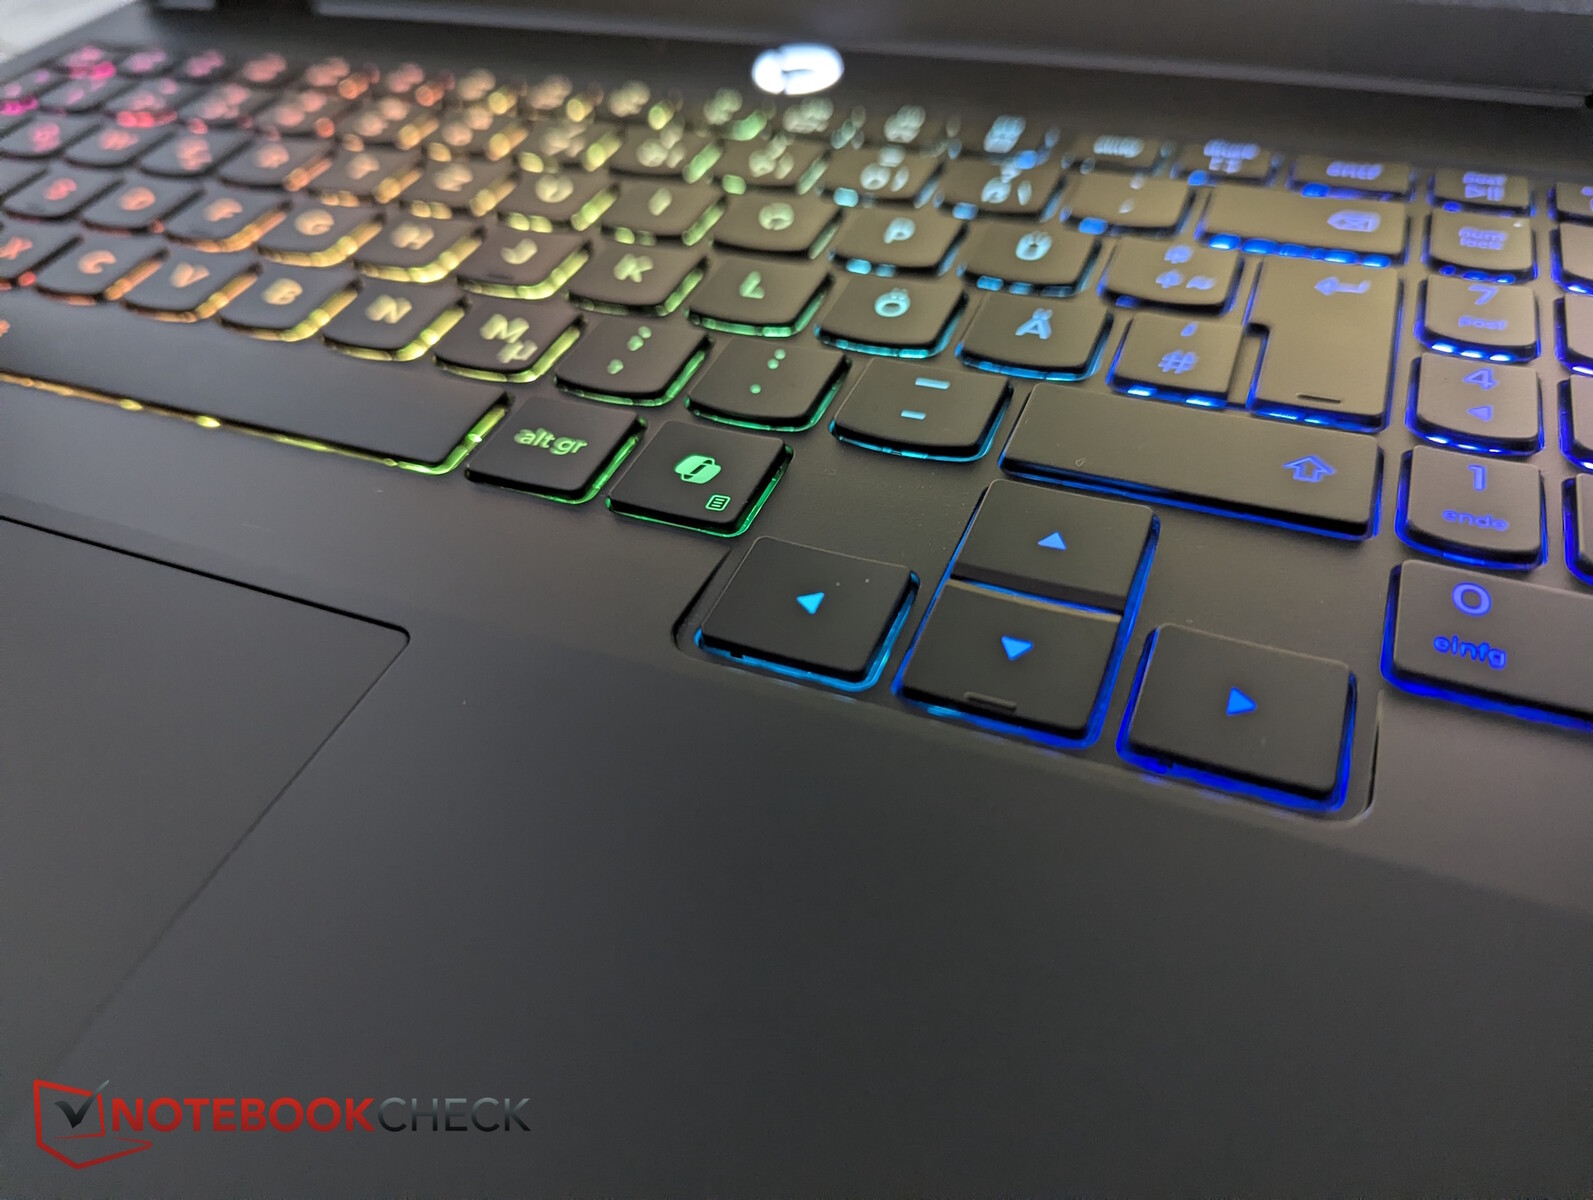
- Dispositivos de entrada - sólidos, para um laptop para jogos
- Tela - OLED brilhante
- Desempenho - A RTX 5070 mantém o Legion rápido
- Emissões e energia - mais silencioso, mais frio, mais eficiente
- Impressões gerais do Notebookcheck
- Alternativas potenciais em comparação
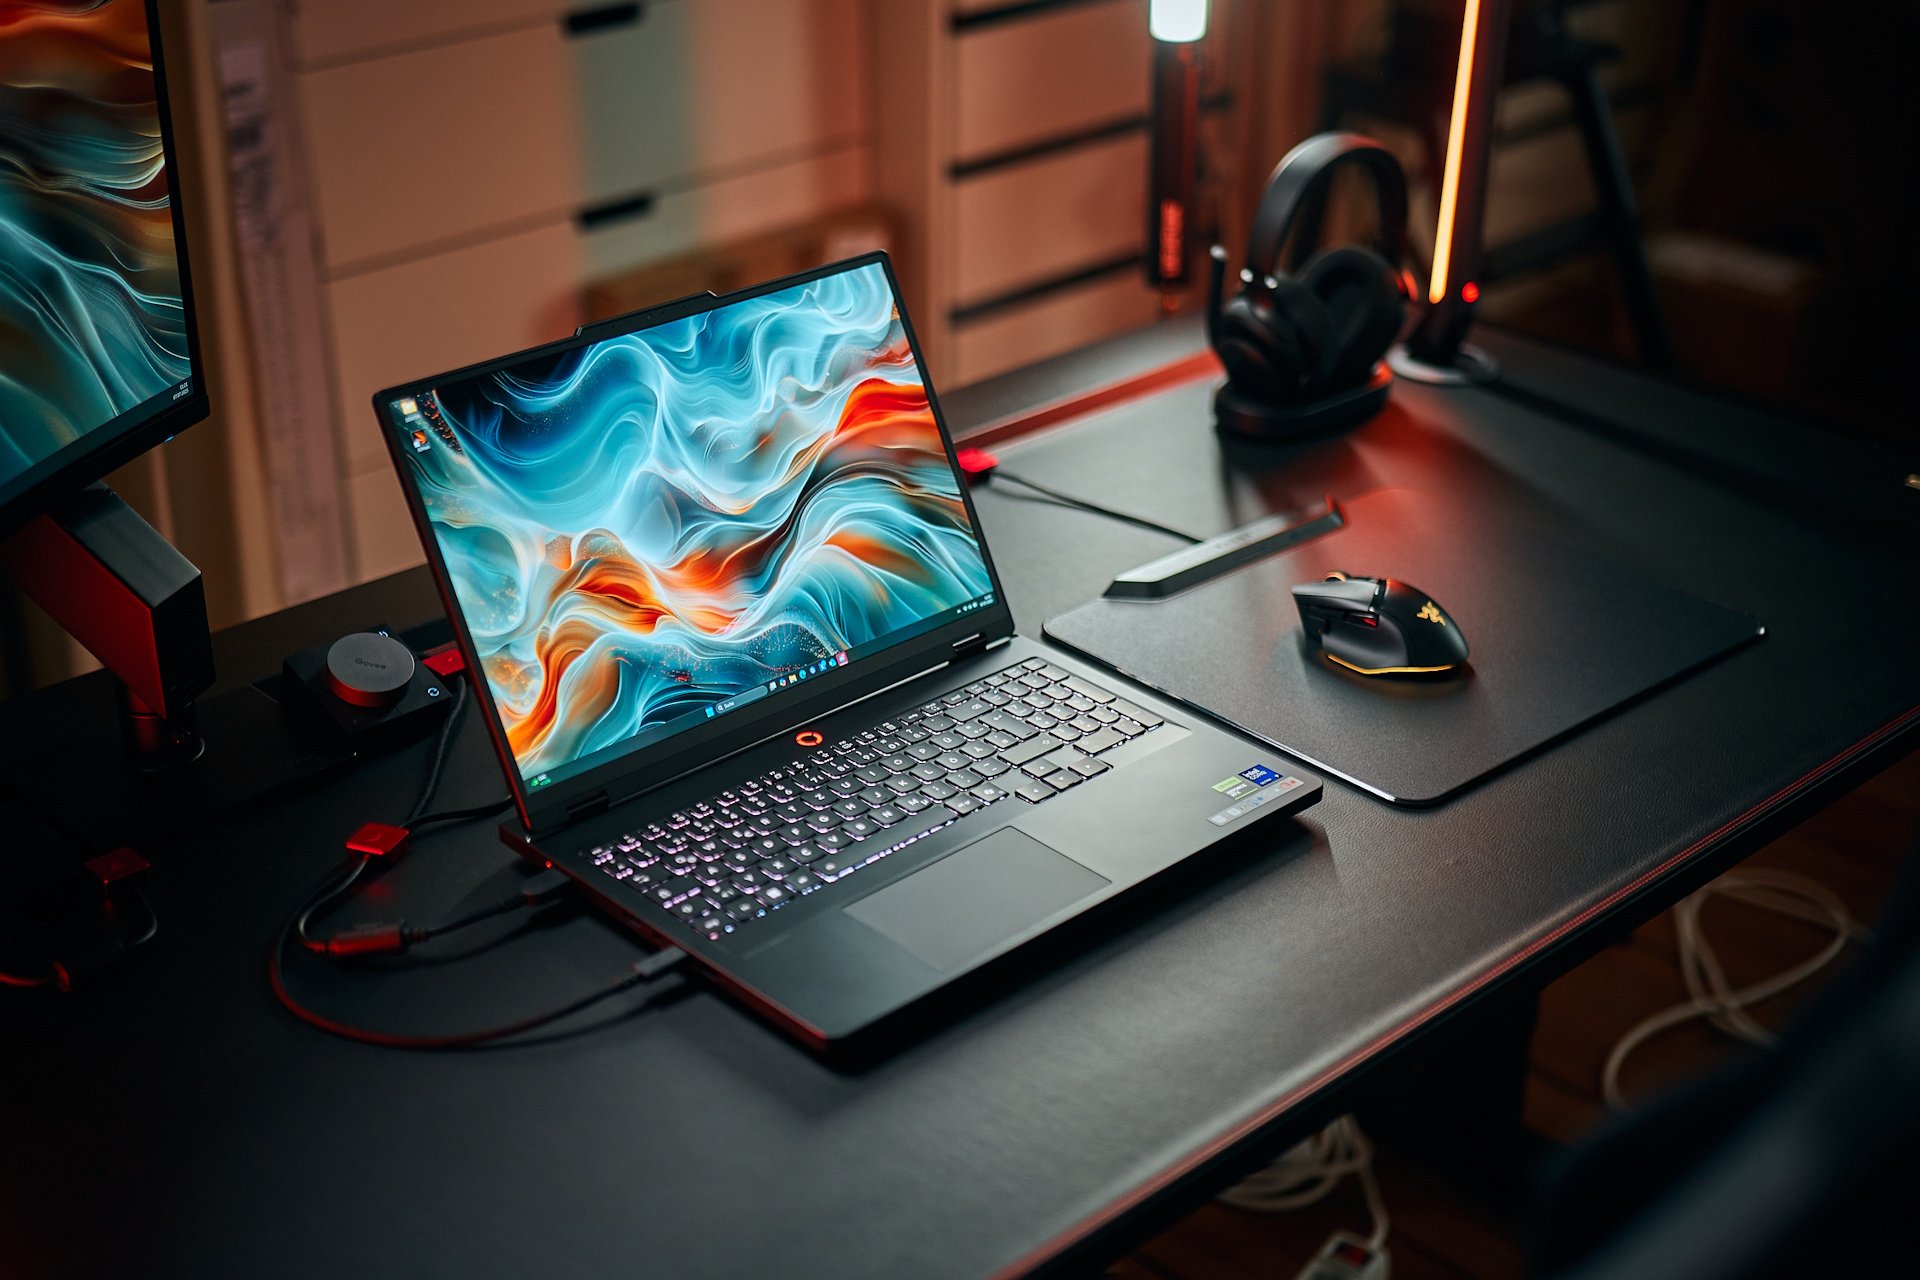
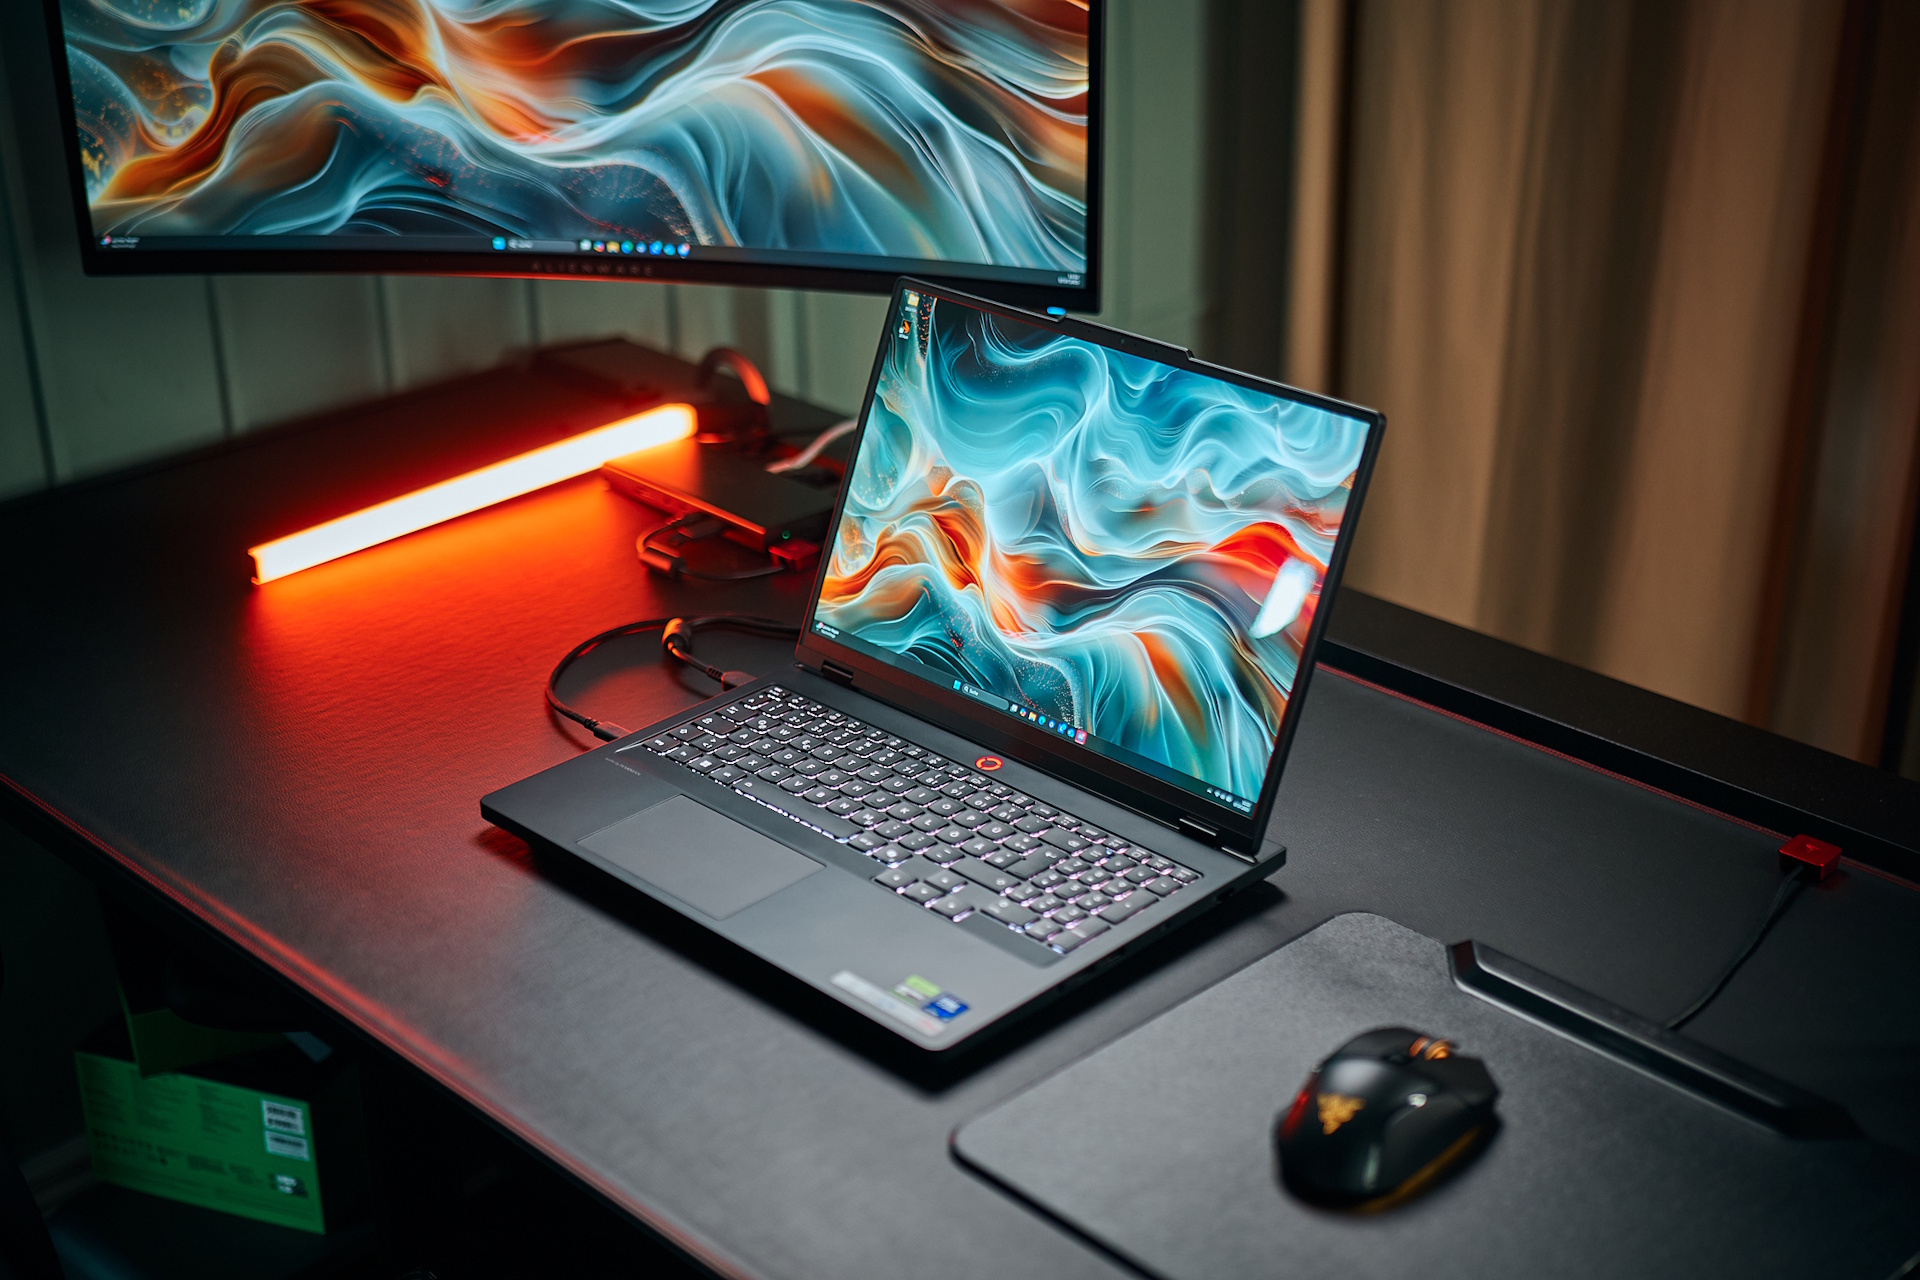
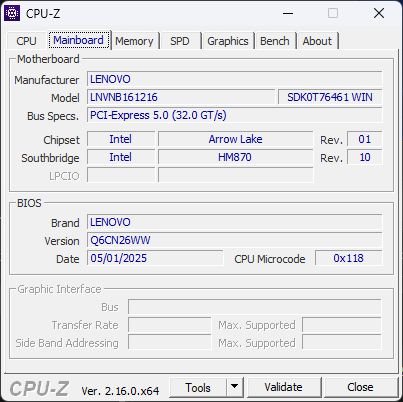
Juntamente com o modelo Modelo RTX 5070 Tia Lenovo também oferece o Legion Pro 5 16 com um modelo padrão RTX 5070. Mas será que os usuários realmente sentem a diferença - além da carteira? Quão próximas são as versões RTX 5070 Ti e RTX 5070 na prática? Como o restante do sistema é praticamente idêntico, vamos nos concentrar no desempenho, no ruído e nas condições térmicas e consultar nossa análise original para o chassi, dispositivos de entrada e seções semelhantes.
Especificações
Chassi e recursos - elegante, mas com ímã de impressões digitais


Dispositivos de entrada - sólidos, para um laptop para jogos
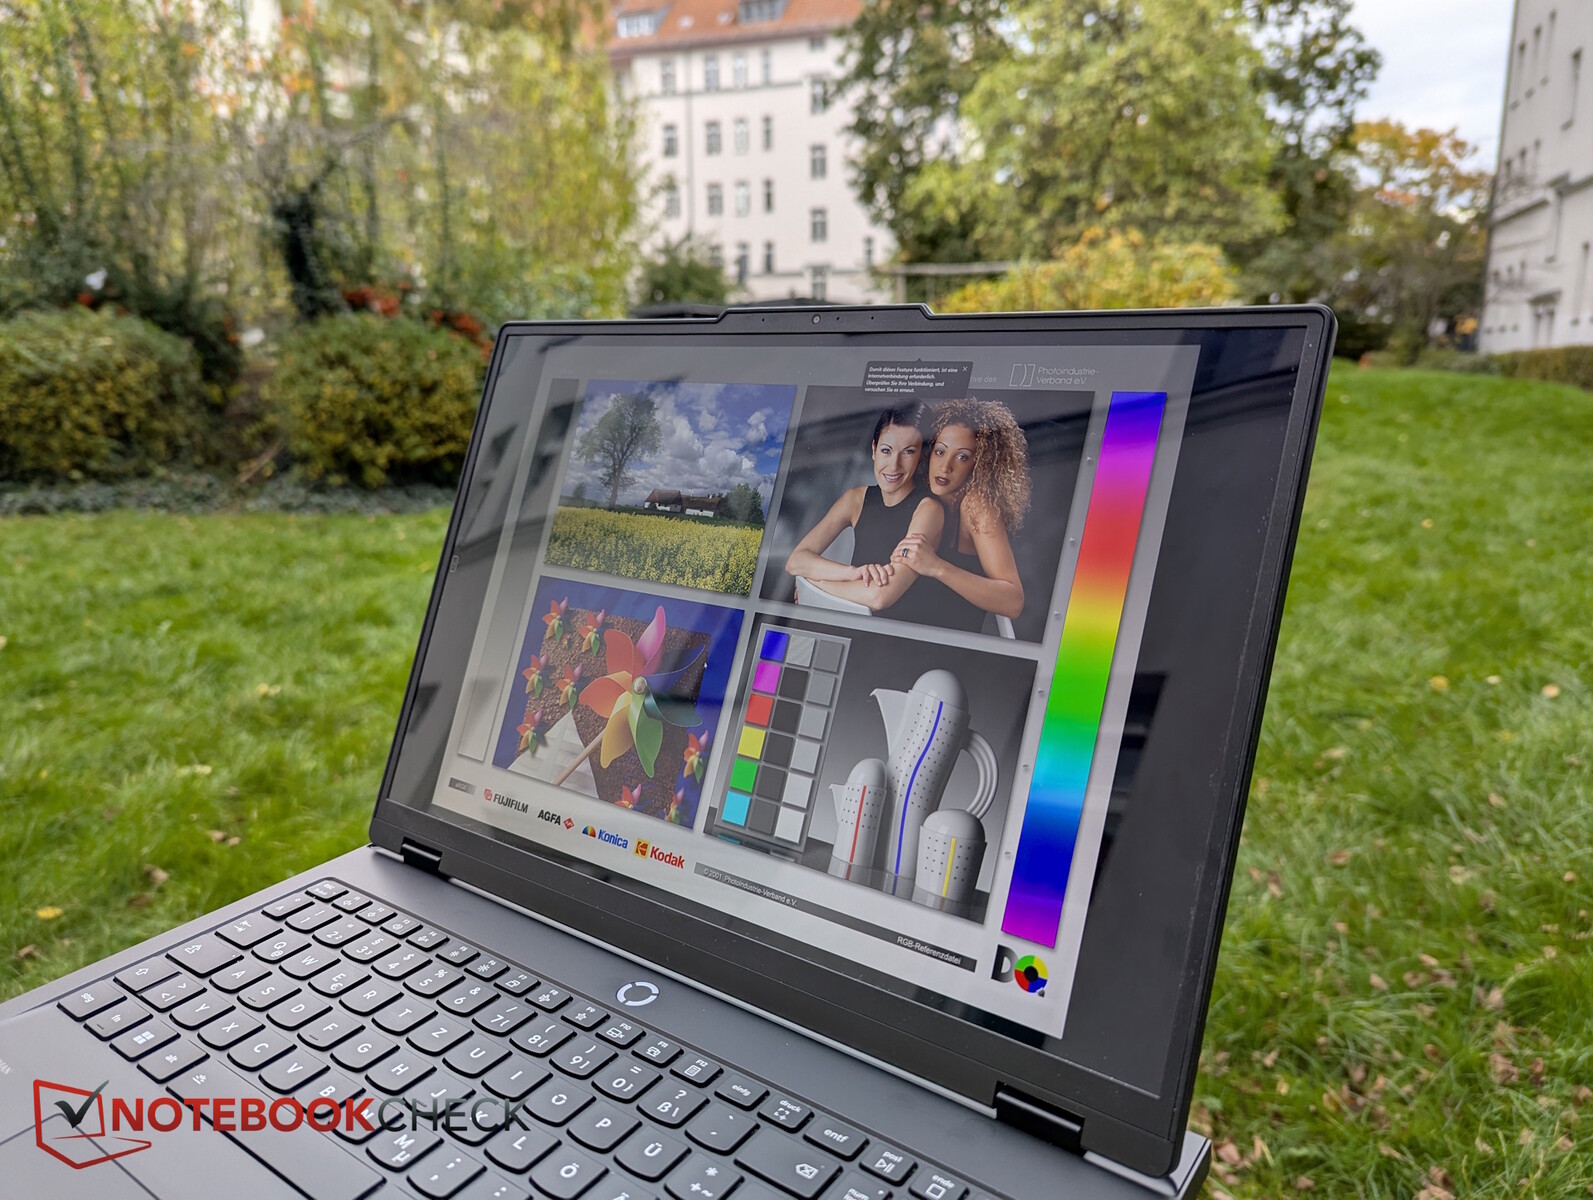
Tela - OLED brilhante

O painel OLED de 16 polegadas (2560 × 1600 px, DisplayHDR True Black 1000, Dolby Vision, G-SYNC) é um dos recursos de destaque do Legion Pro 5.
Entre os concorrentes, o OLED Legion oferece uma das melhores telas dessa categoria: mais de 500 nits de brilho, tempos de resposta rápidos, ampla cobertura de cores e contraste profundo - algo que poucos notebooks para jogos oferecem por esse preço.
| |||||||||||||||||||||||||
iluminação: 98 %
iluminação com acumulador: 521 cd/m²
Contraste: 6947:1 (Preto: 0.075 cd/m²)
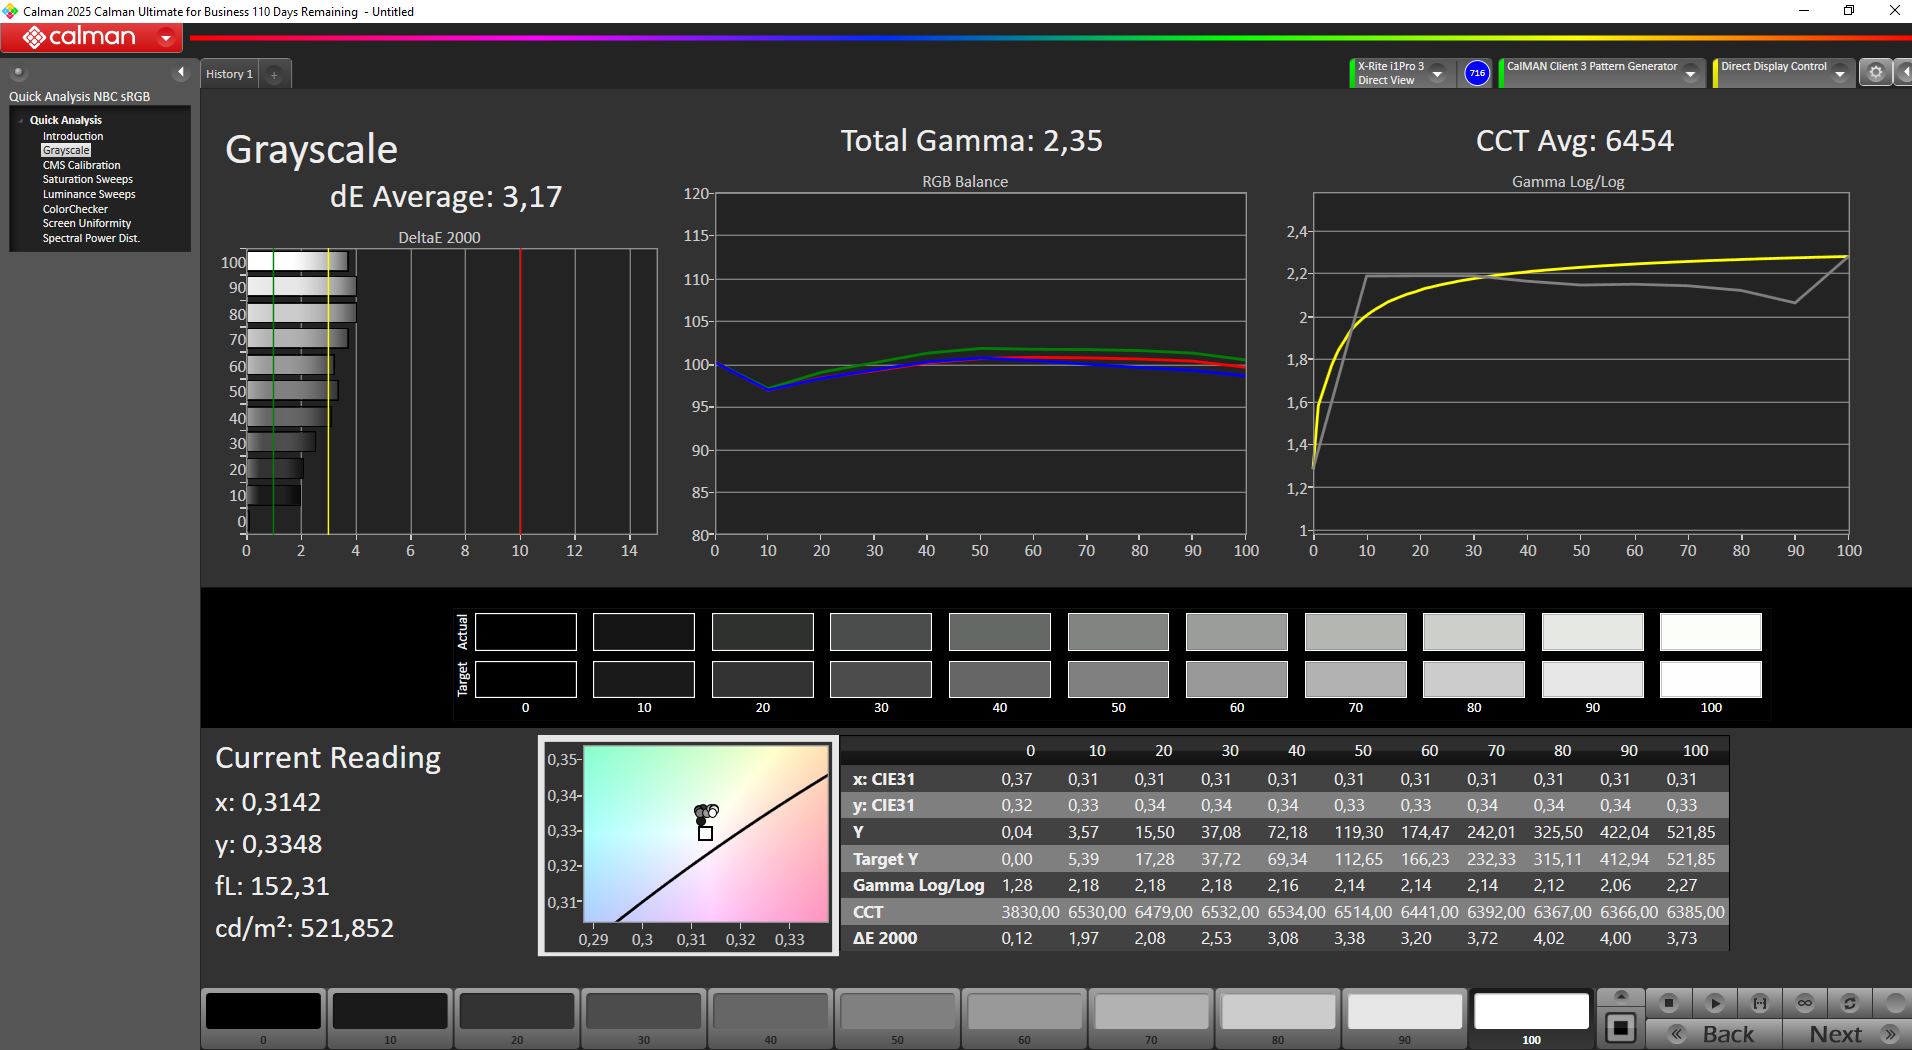
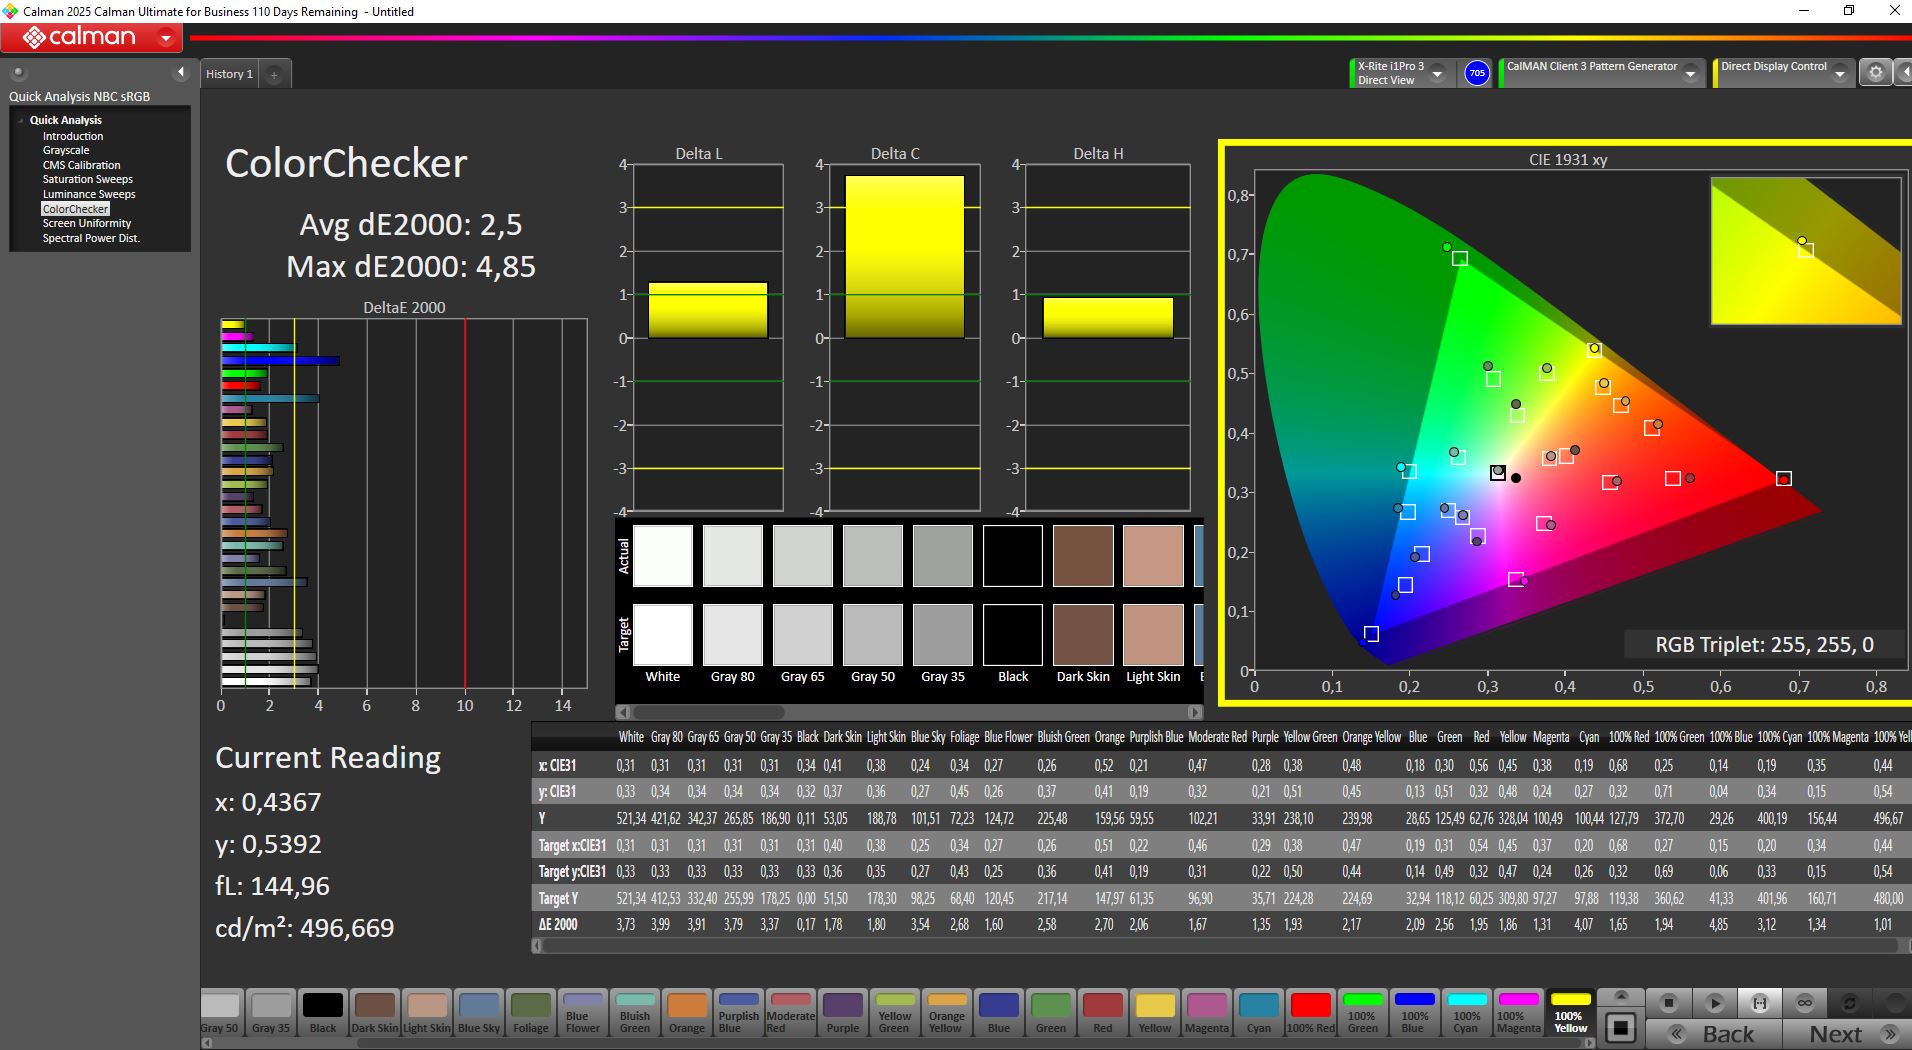
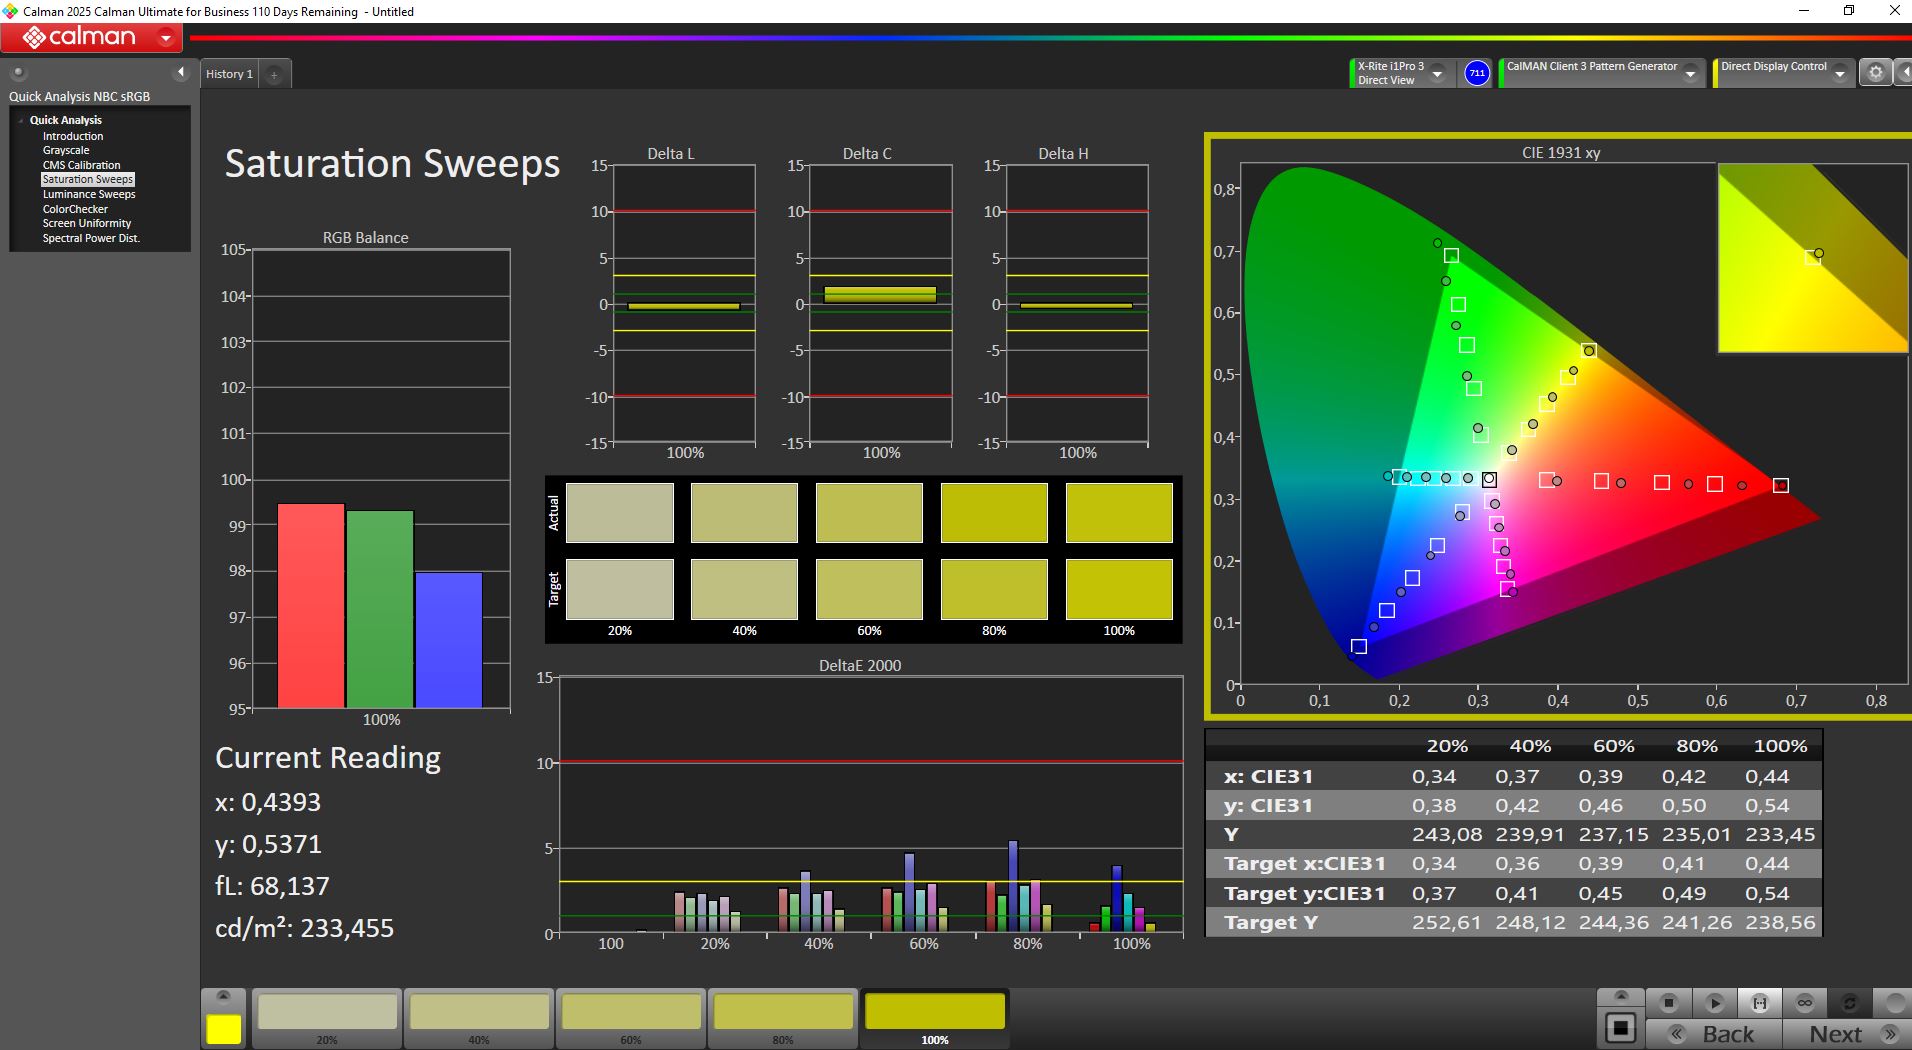
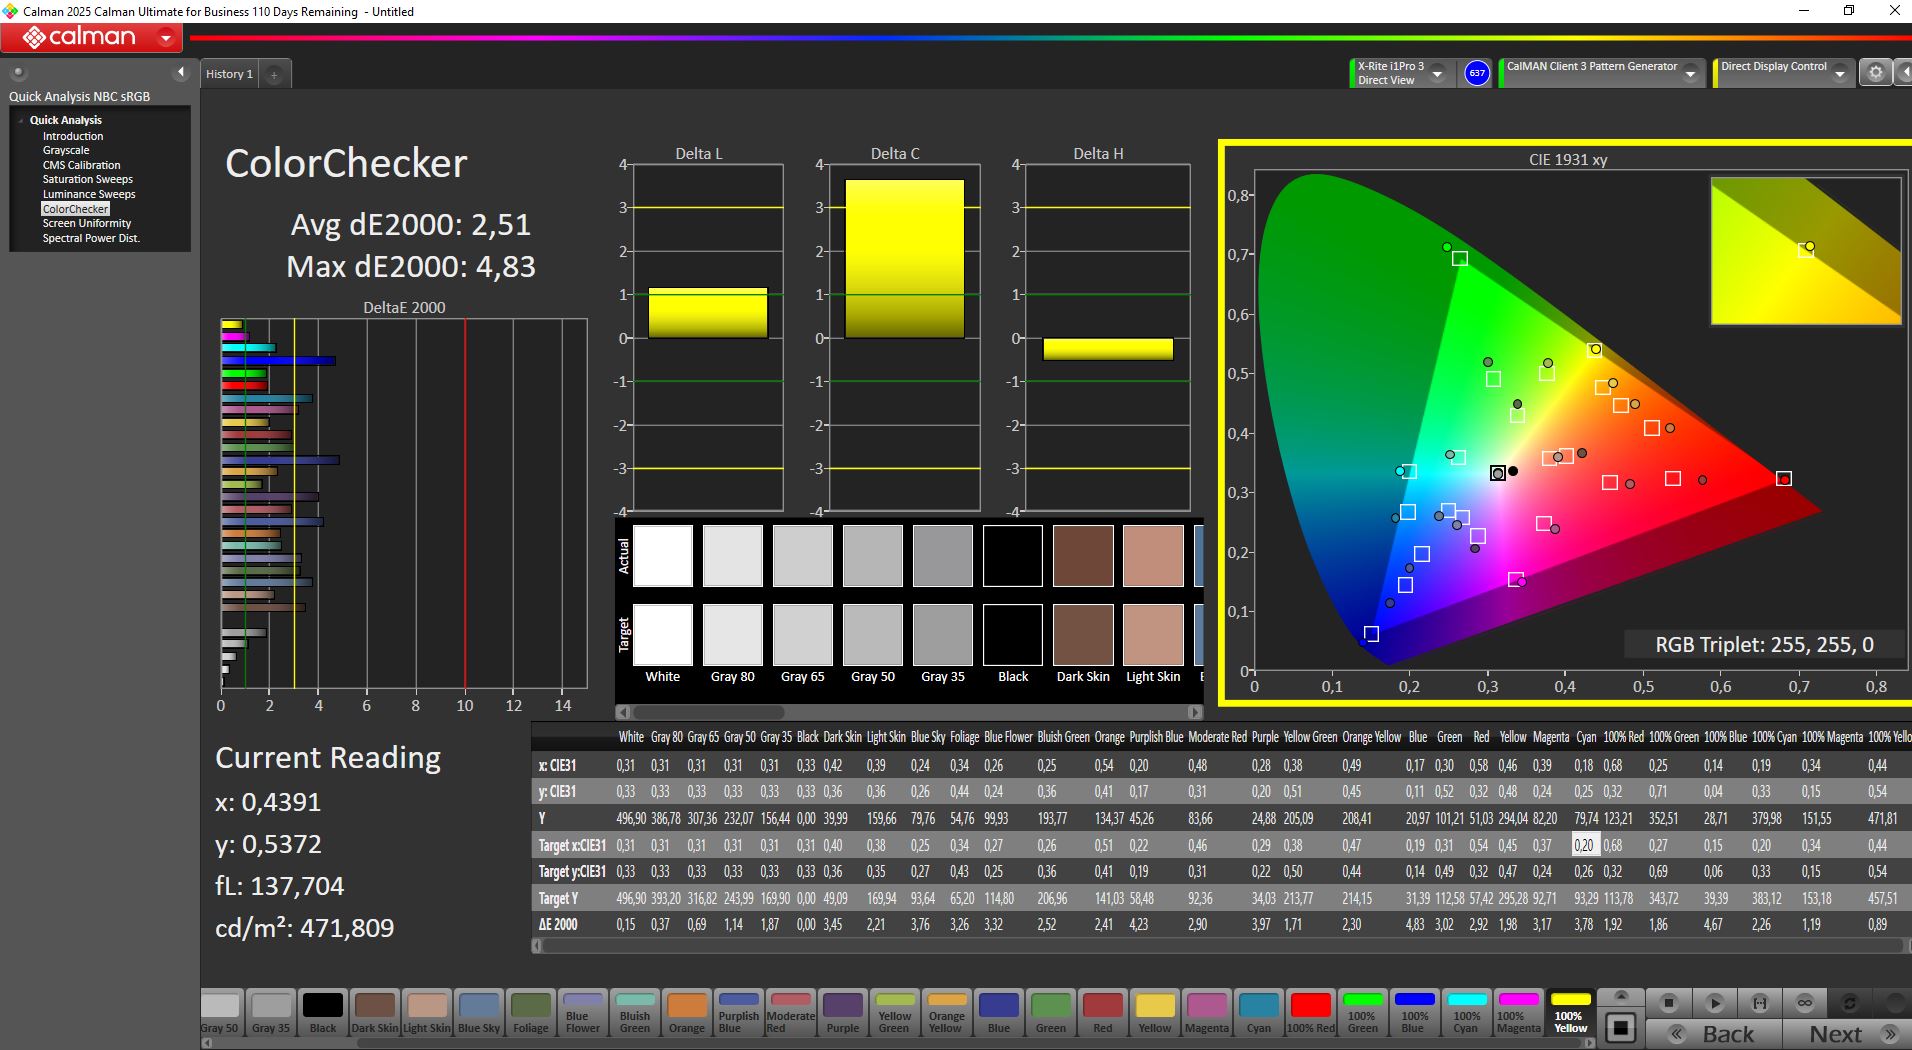
ΔE ColorChecker Calman: 2.5 | ∀{0.5-29.43 Ø4.71}
calibrated: 2.5
ΔE Greyscale Calman: 3.17 | ∀{0.09-98 Ø4.96}
93.9% AdobeRGB 1998 (Argyll 3D)
100% sRGB (Argyll 3D)
99.3% Display P3 (Argyll 3D)
Gamma: 2.35
CCT: 6454 K
| Lenovo Legion Pro 5 16IAX10, RTX 5070 ATNA60HS01-0 (Samsung SDC420A), OLED, 2650x1600, 16", 165 Hz | Lenovo Legion 5 Pro 16IAX10H ATNA60HS01-0 (Samsung SDC420A), OLED, 2560x1600, 16", 165 Hz | Alienware 16X Aurora, RTX 5070 LG Philips 160WQG, IPS, 2560x1600, 16", 240 Hz | Gigabyte Aero X16 1WH MNG007DA5-1, IPS, 2560x1600, 16", 165 Hz | Asus TUF Gaming A16 FA608UP MNG007DA5-3, IPS, 2560x1600, 16", 165 Hz | Schenker XMG Core 16 M25 MNG007DA6-4, IPS, 2560x1600, 16", 300 Hz | Gigabyte Gaming A16 GA6H NE160QDM-NYJ (BOE0C80), IPS, 2560x1600, 16", 165 Hz | |
|---|---|---|---|---|---|---|---|
| Display | 0% | -2% | -20% | -19% | -2% | -18% | |
| Display P3 Coverage (%) | 99.3 | 99.9 1% | 96.9 -2% | 68.7 -31% | 69.4 -30% | 98.8 -1% | 69.4 -30% |
| sRGB Coverage (%) | 100 | 100 0% | 99.8 0% | 96.1 -4% | 97.2 -3% | 100 0% | 99.5 0% |
| AdobeRGB 1998 Coverage (%) | 93.9 | 94.1 0% | 89.7 -4% | 71.2 -24% | 71.9 -23% | 88.4 -6% | 71.6 -24% |
| Response Times | 0% | -318% | -400% | -229% | -343% | -508% | |
| Response Time Grey 50% / Grey 80% * (ms) | 2 ? | 2 ? -0% | 4.3 ? -115% | 12 ? -500% | 6.3 ? -215% | 10.7 ? -435% | 14.3 ? -615% |
| Response Time Black / White * (ms) | 1.4 ? | 1.4 ? -0% | 8.7 ? -521% | 5.6 ? -300% | 4.8 ? -243% | 4.9 ? -250% | 7 ? -400% |
| PWM Frequency (Hz) | 1300 | 1300 | |||||
| PWM Amplitude * (%) | 16.7 | 16.7 -0% | |||||
| Screen | 1% | -78% | -31% | -26% | -53% | -81% | |
| Brightness middle (cd/m²) | 521 | 518 -1% | 493.2 -5% | 395 -24% | 480 -8% | 512 -2% | 432 -17% |
| Brightness (cd/m²) | 519 | 522 1% | 477 -8% | 398 -23% | 456 -12% | 483 -7% | 425 -18% |
| Brightness Distribution (%) | 98 | 97 -1% | 93 -5% | 97 -1% | 91 -7% | 91 -7% | 91 -7% |
| Black Level * (cd/m²) | 0.075 | 0.5 -567% | 0.32 -327% | 0.32 -327% | 0.43 -473% | 0.37 -393% | |
| Contrast (:1) | 6947 | 986 -86% | 1234 -82% | 1500 -78% | 1191 -83% | 1168 -83% | |
| Colorchecker dE 2000 * | 2.5 | 2.49 -0% | 3.57 -43% | 1.3 48% | 1.4 44% | 2.4 4% | 4.76 -90% |
| Colorchecker dE 2000 max. * | 4.85 | 5.25 -8% | 7.03 -45% | 2.8 42% | 2.5 48% | 3.8 22% | 8.59 -77% |
| Colorchecker dE 2000 calibrated * | 2.5 | 2.15 14% | 0.68 73% | 1.4 44% | 1.3 48% | 0.9 64% | 1.18 53% |
| Greyscale dE 2000 * | 3.17 | 3.02 5% | 3.7 -17% | 1.8 43% | 1.2 62% | 3.1 2% | 6.2 -96% |
| Gamma | 2.35 94% | 2.37 93% | 2.16 102% | 2.2 100% | 2.16 102% | 2.41 91% | 2.079 106% |
| CCT | 6454 101% | 6426 101% | 5876 111% | 6842 95% | 6620 98% | 6534 99% | 6690 97% |
| Média Total (Programa/Configurações) | 0% /
1% | -133% /
-96% | -150% /
-81% | -91% /
-53% | -133% /
-84% | -202% /
-128% |
* ... menor é melhor
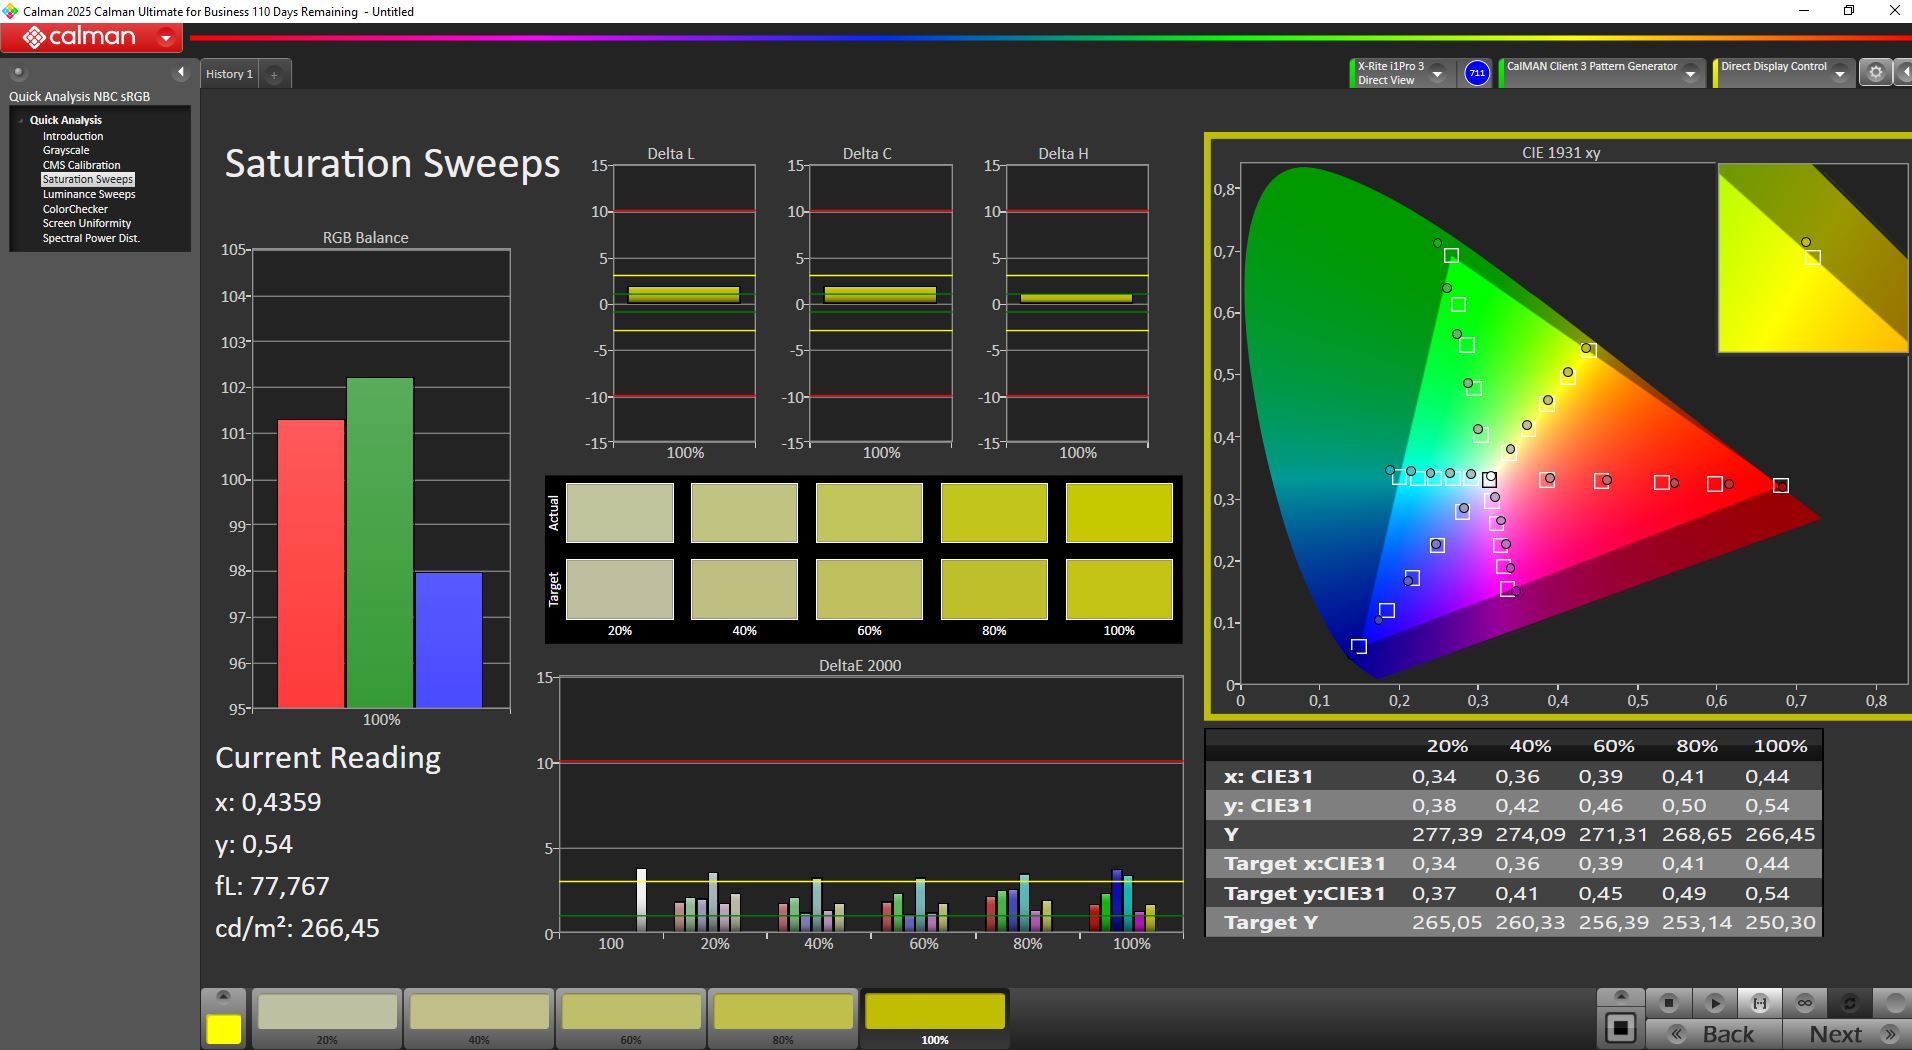
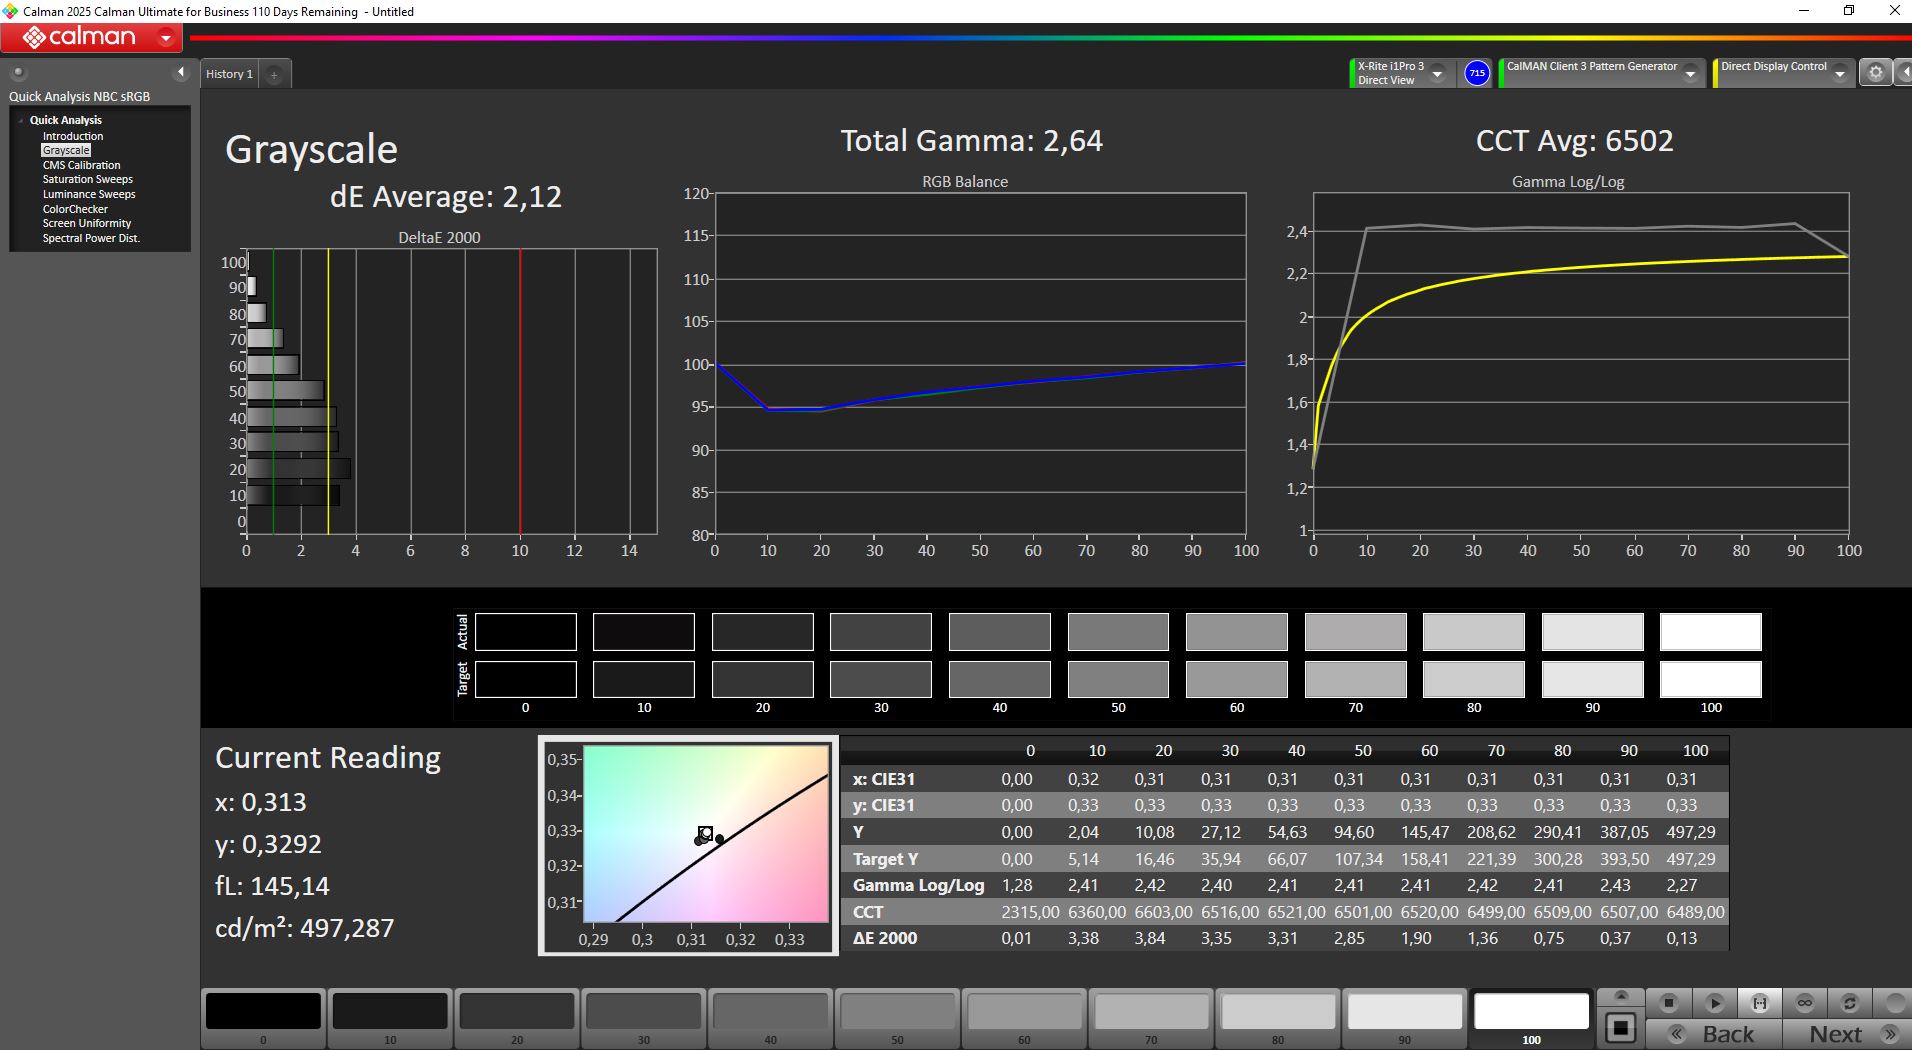
A calibração de fábrica já é excelente; nosso ajuste fino manual melhorou ligeiramente a escala de cinza, com os desvios de cor permanecendo de baixos a moderados.
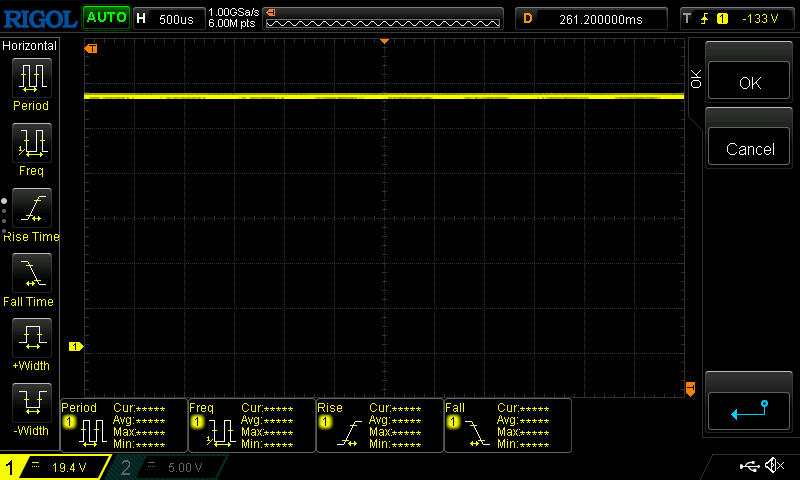
Exibir tempos de resposta
| ↔ Tempo de resposta preto para branco | ||
|---|---|---|
| 1.4 ms ... ascensão ↗ e queda ↘ combinadas | ↗ 0.8 ms ascensão | 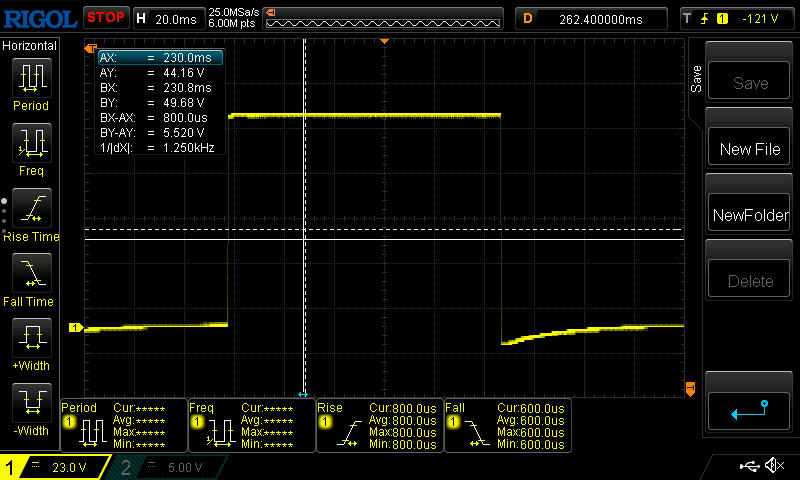 |
| ↘ 0.6 ms queda | ||
| A tela mostra taxas de resposta muito rápidas em nossos testes e deve ser muito adequada para jogos em ritmo acelerado. Em comparação, todos os dispositivos testados variam de 0.1 (mínimo) a 240 (máximo) ms. » 8 % de todos os dispositivos são melhores. Isso significa que o tempo de resposta medido é melhor que a média de todos os dispositivos testados (19.8 ms). | ||
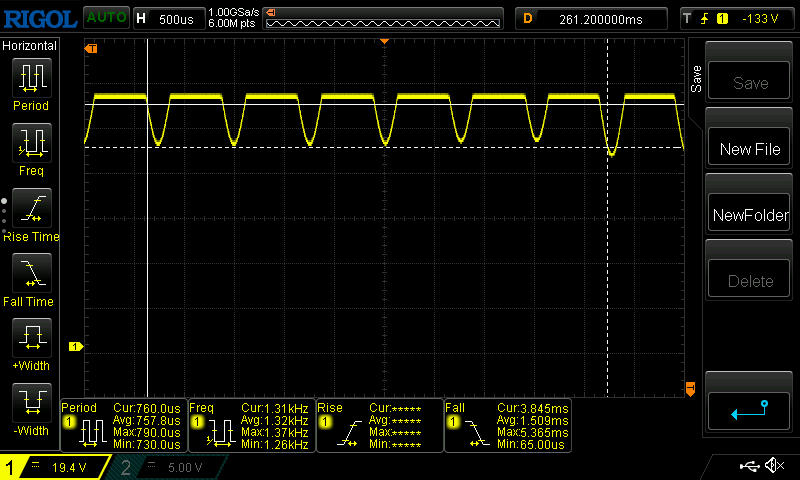
| ↔ Tempo de resposta 50% cinza a 80% cinza | ||
| 2 ms ... ascensão ↗ e queda ↘ combinadas | ↗ 1 ms ascensão | 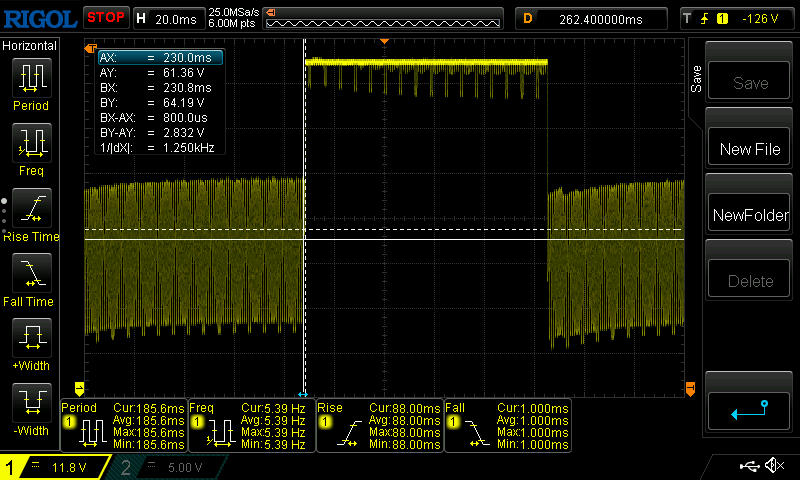 |
| ↘ 1 ms queda | ||
| A tela mostra taxas de resposta muito rápidas em nossos testes e deve ser muito adequada para jogos em ritmo acelerado. Em comparação, todos os dispositivos testados variam de 0.165 (mínimo) a 636 (máximo) ms. » 10 % de todos os dispositivos são melhores. Isso significa que o tempo de resposta medido é melhor que a média de todos os dispositivos testados (31 ms). | ||
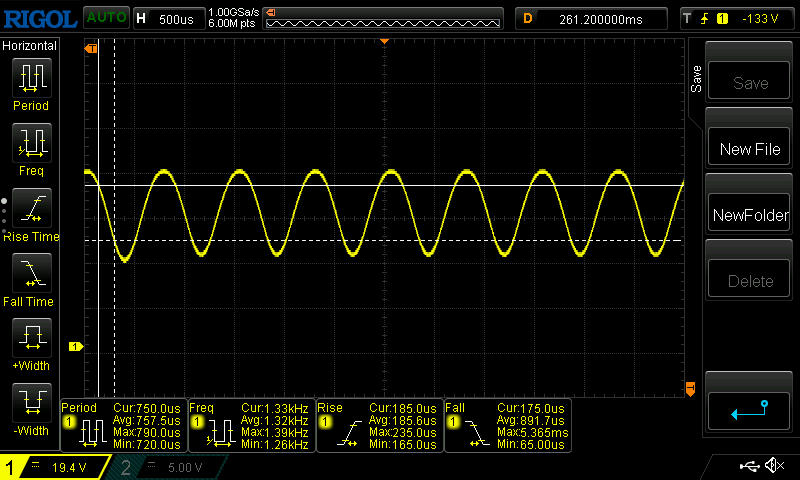
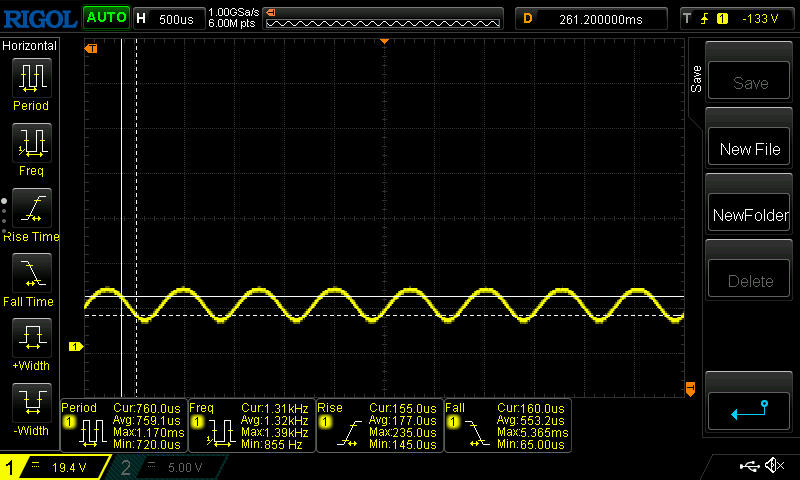
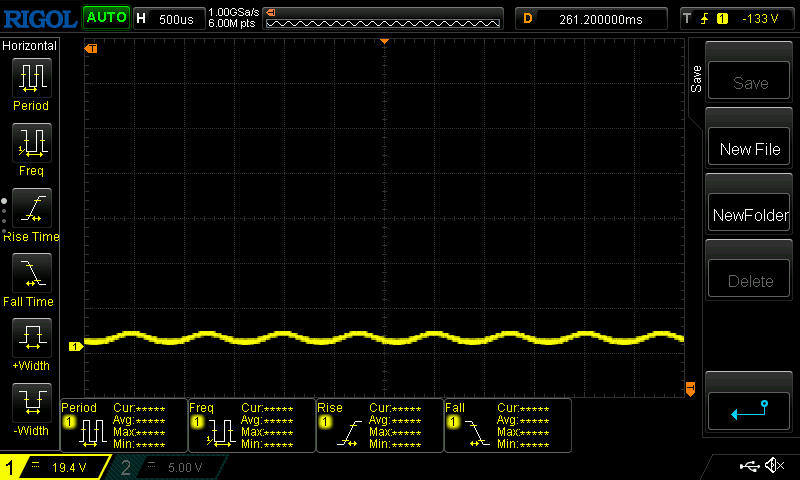
Cintilação da tela / PWM (modulação por largura de pulso)
| Tela tremeluzindo/PWM detectado | 1300 Hz Amplitude: 16.7 % | 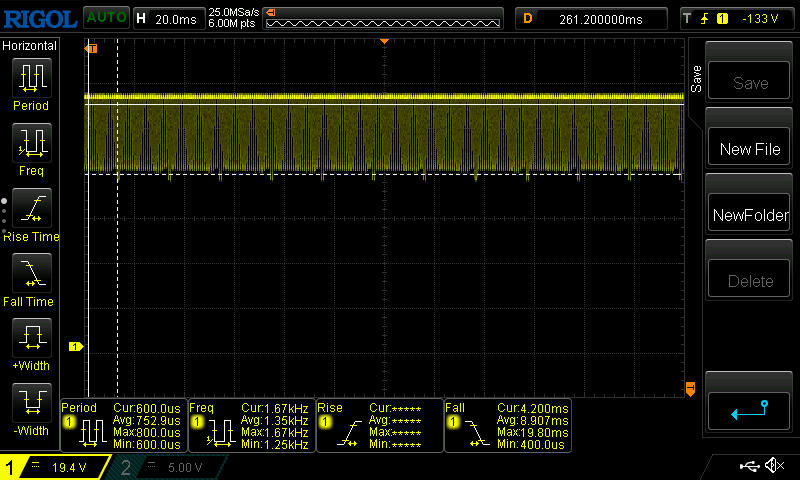 | |
A luz de fundo da tela pisca em 1300 Hz (pior caso, por exemplo, utilizando PWM) . A frequência de 1300 Hz é bastante alta, então a maioria dos usuários sensíveis ao PWM não deve notar nenhuma oscilação. [pwm_comparison] Em comparação: 52 % de todos os dispositivos testados não usam PWM para escurecer a tela. Se PWM foi detectado, uma média de 7747 (mínimo: 5 - máximo: 343500) Hz foi medida. | |||
O brilho de 500 nits ajuda em ambientes externos, embora a superfície brilhante não o faça. Fique na sombra e minimize os reflexos diretos, e o uso em ambientes externos funciona bem.


Desempenho - A RTX 5070 mantém o Legion rápido
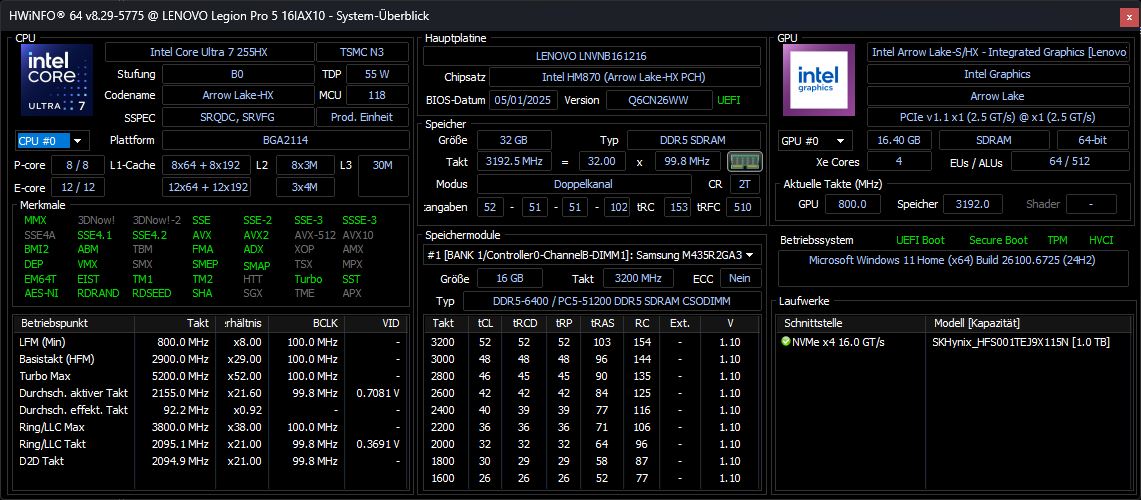
Com uma RTX 5070, Core Ultra 7 255HXe 32 GB de RAM, o Legion Pro 5 16 se posiciona como um forte jogador de médio porte que, graças à sua excelente tela, desempenho e design discreto, também pode atrair os criadores de conteúdo.

Condições de teste
A Lenovo pré-instala dois utilitários importantes: Vantage para gerenciamento do sistema, varreduras de hardware e configurações gerais, e Legion Space, o hub de jogos com modos de desempenho e controle MUX. Ambos os aplicativos incluem anúncios, e o Vantage pode ser intrusivo com pop-ups frequentes. O Lenovo Now, outro aplicativo, é quase totalmente promocional - é melhor desinstalá-lo.
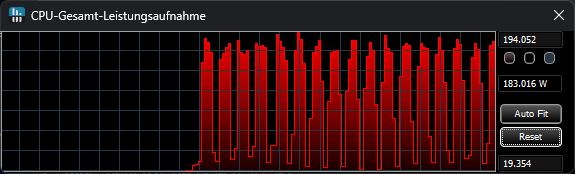
Todos os benchmarks foram executados no modo Desempenho.

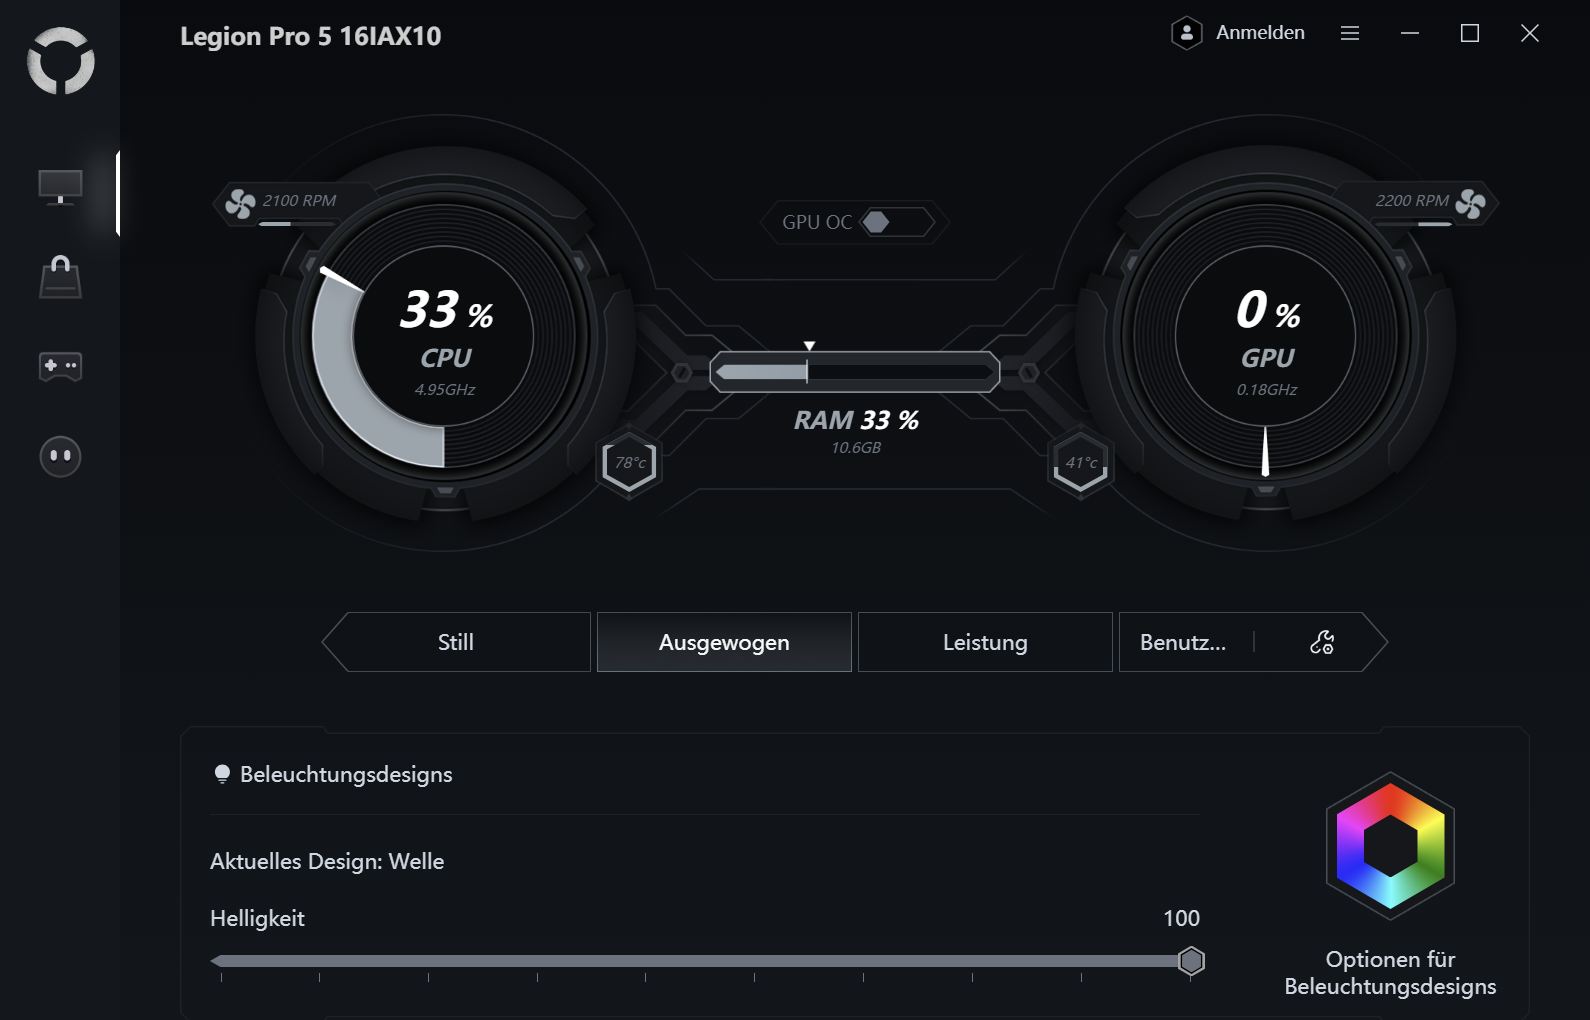
| Modo | Cinebench R15 | Potência da CPU | Cyberpunk 2077 Ultra | Potência da GPU | Nível de ruído (Cyberpunk) |
|---|---|---|---|---|---|
| Desempenho | 5190 | 194 → 183 W | 107 fps | 103 W | 50,27 dB |
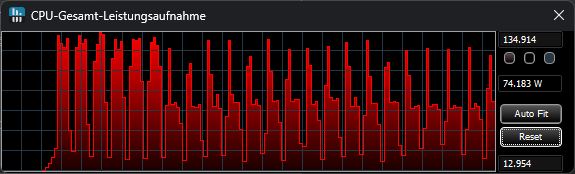
| Equilibrado | 4463 | 135 → 75 W | 94,2 fps | 93 W | 47,34 dB |
| Eco | 3731 | 65 W | 72 fps | 55 W | 38,44 dB |
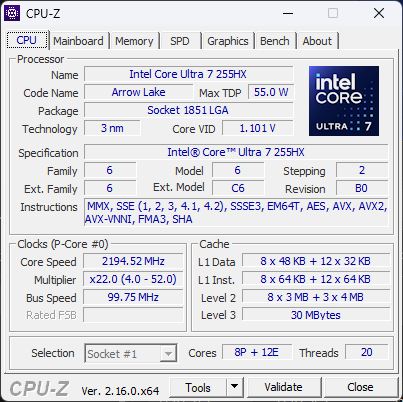
Processador
O Intel Core Ultra 7 255HX tem quatro E-cores a menos do que o Ultra 9 275HX e velocidades de clock ligeiramente mais baixas.
Em nossos benchmarks de CPU, o desempenho está acima da média, apenas alguns pontos percentuais atrás do Ultra 9 275HX. No loop do Cinebench, ele mantém uma saída estável com apenas uma pequena queda (~7%) ao longo do tempo.
A execução com bateria reduz o desempenho da CPU em cerca de 43%.
Cinebench R15 Multi stress test
Cinebench R23: Multi Core | Single Core
Cinebench R20: CPU (Multi Core) | CPU (Single Core)
Cinebench R15: CPU Multi 64Bit | CPU Single 64Bit
Blender: v2.79 BMW27 CPU
7-Zip 18.03: 7z b 4 | 7z b 4 -mmt1
Geekbench 6.7: Multi-Core | Single-Core
Geekbench 5.5: Multi-Core | Single-Core
HWBOT x265 Benchmark v2.2: 4k Preset
LibreOffice : 20 Documents To PDF
R Benchmark 2.5: Overall mean
| CPU Performance rating | |
| Lenovo Legion 5 Pro 16IAX10H | |
| Alienware 16X Aurora, RTX 5070 | |
| Lenovo Legion Pro 5 16IAX10, RTX 5070 | |
| Média Intel Core Ultra 7 255HX | |
| Média da turma Gaming | |
| Schenker XMG Core 16 M25 | |
| Gigabyte Aero X16 1WH | |
| Asus TUF Gaming A16 FA608UP | |
| Gigabyte Gaming A16 GA6H | |
| Cinebench R23 / Multi Core | |
| Lenovo Legion 5 Pro 16IAX10H | |
| Alienware 16X Aurora, RTX 5070 | |
| Lenovo Legion Pro 5 16IAX10, RTX 5070 | |
| Média Intel Core Ultra 7 255HX (27129 - 34005, n=5) | |
| Média da turma Gaming (10488 - 42661, n=107, últimos 2 anos) | |
| Schenker XMG Core 16 M25 | |
| Gigabyte Aero X16 1WH | |
| Asus TUF Gaming A16 FA608UP | |
| Gigabyte Gaming A16 GA6H | |
| Cinebench R23 / Single Core | |
| Lenovo Legion 5 Pro 16IAX10H | |
| Alienware 16X Aurora, RTX 5070 | |
| Lenovo Legion Pro 5 16IAX10, RTX 5070 | |
| Média Intel Core Ultra 7 255HX (2111 - 2171, n=5) | |
| Schenker XMG Core 16 M25 | |
| Média da turma Gaming (1166 - 2415, n=107, últimos 2 anos) | |
| Gigabyte Aero X16 1WH | |
| Gigabyte Gaming A16 GA6H | |
| Asus TUF Gaming A16 FA608UP | |
| Cinebench R20 / CPU (Multi Core) | |
| Lenovo Legion 5 Pro 16IAX10H | |
| Alienware 16X Aurora, RTX 5070 | |
| Lenovo Legion Pro 5 16IAX10, RTX 5070 | |
| Média Intel Core Ultra 7 255HX (10626 - 13056, n=5) | |
| Média da turma Gaming (4029 - 16433, n=106, últimos 2 anos) | |
| Schenker XMG Core 16 M25 | |
| Asus TUF Gaming A16 FA608UP | |
| Gigabyte Aero X16 1WH | |
| Gigabyte Gaming A16 GA6H | |
| Cinebench R20 / CPU (Single Core) | |
| Lenovo Legion 5 Pro 16IAX10H | |
| Alienware 16X Aurora, RTX 5070 | |
| Lenovo Legion Pro 5 16IAX10, RTX 5070 | |
| Média Intel Core Ultra 7 255HX (822 - 835, n=5) | |
| Schenker XMG Core 16 M25 | |
| Média da turma Gaming (442 - 913, n=106, últimos 2 anos) | |
| Gigabyte Aero X16 1WH | |
| Gigabyte Gaming A16 GA6H | |
| Asus TUF Gaming A16 FA608UP | |
| Cinebench R15 / CPU Multi 64Bit | |
| Lenovo Legion 5 Pro 16IAX10H | |
| Alienware 16X Aurora, RTX 5070 | |
| Lenovo Legion Pro 5 16IAX10, RTX 5070 | |
| Média Intel Core Ultra 7 255HX (4114 - 5190, n=5) | |
| Média da turma Gaming (1578 - 6330, n=105, últimos 2 anos) | |
| Schenker XMG Core 16 M25 | |
| Asus TUF Gaming A16 FA608UP | |
| Gigabyte Aero X16 1WH | |
| Gigabyte Gaming A16 GA6H | |
| Cinebench R15 / CPU Single 64Bit | |
| Lenovo Legion 5 Pro 16IAX10H | |
| Alienware 16X Aurora, RTX 5070 | |
| Lenovo Legion Pro 5 16IAX10, RTX 5070 | |
| Média Intel Core Ultra 7 255HX (322 - 328, n=5) | |
| Média da turma Gaming (188.8 - 350, n=106, últimos 2 anos) | |
| Asus TUF Gaming A16 FA608UP | |
| Gigabyte Gaming A16 GA6H | |
| Gigabyte Aero X16 1WH | |
| Schenker XMG Core 16 M25 | |
| Blender / v2.79 BMW27 CPU | |
| Gigabyte Gaming A16 GA6H | |
| Gigabyte Aero X16 1WH | |
| Asus TUF Gaming A16 FA608UP | |
| Média da turma Gaming (79 - 330, n=104, últimos 2 anos) | |
| Schenker XMG Core 16 M25 | |
| Média Intel Core Ultra 7 255HX (104 - 122, n=5) | |
| Lenovo Legion Pro 5 16IAX10, RTX 5070 | |
| Alienware 16X Aurora, RTX 5070 | |
| Lenovo Legion 5 Pro 16IAX10H | |
| 7-Zip 18.03 / 7z b 4 | |
| Lenovo Legion 5 Pro 16IAX10H | |
| Alienware 16X Aurora, RTX 5070 | |
| Lenovo Legion Pro 5 16IAX10, RTX 5070 | |
| Média Intel Core Ultra 7 255HX (87806 - 104055, n=5) | |
| Média da turma Gaming (33491 - 148086, n=105, últimos 2 anos) | |
| Schenker XMG Core 16 M25 | |
| Asus TUF Gaming A16 FA608UP | |
| Gigabyte Aero X16 1WH | |
| Gigabyte Gaming A16 GA6H | |
| 7-Zip 18.03 / 7z b 4 -mmt1 | |
| Lenovo Legion 5 Pro 16IAX10H | |
| Alienware 16X Aurora, RTX 5070 | |
| Lenovo Legion Pro 5 16IAX10, RTX 5070 | |
| Média Intel Core Ultra 7 255HX (6407 - 6576, n=5) | |
| Schenker XMG Core 16 M25 | |
| Média da turma Gaming (4199 - 7436, n=105, últimos 2 anos) | |
| Asus TUF Gaming A16 FA608UP | |
| Gigabyte Aero X16 1WH | |
| Gigabyte Gaming A16 GA6H | |
| Geekbench 6.7 / Multi-Core | |
| Lenovo Legion 5 Pro 16IAX10H | |
| Lenovo Legion Pro 5 16IAX10, RTX 5070 | |
| Alienware 16X Aurora, RTX 5070 | |
| Média Intel Core Ultra 7 255HX (16396 - 19623, n=6) | |
| Schenker XMG Core 16 M25 | |
| Média da turma Gaming (6625 - 22850, n=106, últimos 2 anos) | |
| Gigabyte Aero X16 1WH | |
| Asus TUF Gaming A16 FA608UP | |
| Gigabyte Gaming A16 GA6H | |
| Geekbench 6.7 / Single-Core | |
| Lenovo Legion 5 Pro 16IAX10H | |
| Alienware 16X Aurora, RTX 5070 | |
| Lenovo Legion Pro 5 16IAX10, RTX 5070 | |
| Média Intel Core Ultra 7 255HX (2917 - 3028, n=6) | |
| Schenker XMG Core 16 M25 | |
| Gigabyte Aero X16 1WH | |
| Média da turma Gaming (1490 - 3259, n=106, últimos 2 anos) | |
| Asus TUF Gaming A16 FA608UP | |
| Gigabyte Gaming A16 GA6H | |
| Geekbench 5.5 / Multi-Core | |
| Lenovo Legion 5 Pro 16IAX10H | |
| Alienware 16X Aurora, RTX 5070 | |
| Lenovo Legion Pro 5 16IAX10, RTX 5070 | |
| Média Intel Core Ultra 7 255HX (18263 - 21014, n=5) | |
| Média da turma Gaming (6460 - 28263, n=105, últimos 2 anos) | |
| Schenker XMG Core 16 M25 | |
| Gigabyte Aero X16 1WH | |
| Asus TUF Gaming A16 FA608UP | |
| Gigabyte Gaming A16 GA6H | |
| Geekbench 5.5 / Single-Core | |
| Lenovo Legion 5 Pro 16IAX10H | |
| Alienware 16X Aurora, RTX 5070 | |
| Lenovo Legion Pro 5 16IAX10, RTX 5070 | |
| Média Intel Core Ultra 7 255HX (2112 - 2211, n=5) | |
| Gigabyte Aero X16 1WH | |
| Schenker XMG Core 16 M25 | |
| Média da turma Gaming (986 - 2474, n=105, últimos 2 anos) | |
| Asus TUF Gaming A16 FA608UP | |
| Gigabyte Gaming A16 GA6H | |
| HWBOT x265 Benchmark v2.2 / 4k Preset | |
| Lenovo Legion 5 Pro 16IAX10H | |
| Alienware 16X Aurora, RTX 5070 | |
| Lenovo Legion Pro 5 16IAX10, RTX 5070 | |
| Média Intel Core Ultra 7 255HX (30.4 - 36.9, n=5) | |
| Média da turma Gaming (11.5 - 44.4, n=105, últimos 2 anos) | |
| Schenker XMG Core 16 M25 | |
| Gigabyte Aero X16 1WH | |
| Asus TUF Gaming A16 FA608UP | |
| Gigabyte Gaming A16 GA6H | |
| LibreOffice / 20 Documents To PDF | |
| Asus TUF Gaming A16 FA608UP | |
| Gigabyte Gaming A16 GA6H | |
| Gigabyte Aero X16 1WH | |
| Schenker XMG Core 16 M25 | |
| Média da turma Gaming (33.2 - 88.8, n=105, últimos 2 anos) | |
| Lenovo Legion Pro 5 16IAX10, RTX 5070 | |
| Média Intel Core Ultra 7 255HX (35.4 - 45.9, n=5) | |
| Alienware 16X Aurora, RTX 5070 | |
| Lenovo Legion 5 Pro 16IAX10H | |
| R Benchmark 2.5 / Overall mean | |
| Gigabyte Gaming A16 GA6H | |
| Asus TUF Gaming A16 FA608UP | |
| Média da turma Gaming (0.3439 - 0.759, n=106, últimos 2 anos) | |
| Lenovo Legion Pro 5 16IAX10, RTX 5070 | |
| Média Intel Core Ultra 7 255HX (0.4209 - 0.4287, n=5) | |
| Alienware 16X Aurora, RTX 5070 | |
| Lenovo Legion 5 Pro 16IAX10H | |
| Gigabyte Aero X16 1WH | |
| Schenker XMG Core 16 M25 | |
* ... menor é melhor
AIDA64: FP32 Ray-Trace | FPU Julia | CPU SHA3 | CPU Queen | FPU SinJulia | FPU Mandel | CPU AES | CPU ZLib | FP64 Ray-Trace | CPU PhotoWorxx
| Performance rating | |
| Lenovo Legion 5 Pro 16IAX10H | |
| Lenovo Legion Pro 5 16IAX10, RTX 5070 | |
| Alienware 16X Aurora, RTX 5070 | |
| Schenker XMG Core 16 M25 | |
| Média Intel Core Ultra 7 255HX | |
| Média da turma Gaming | |
| Asus TUF Gaming A16 FA608UP | |
| Gigabyte Aero X16 1WH | |
| Gigabyte Gaming A16 GA6H | |
| AIDA64 / FP32 Ray-Trace | |
| Schenker XMG Core 16 M25 | |
| Lenovo Legion 5 Pro 16IAX10H | |
| Lenovo Legion Pro 5 16IAX10, RTX 5070 | |
| Alienware 16X Aurora, RTX 5070 | |
| Média da turma Gaming (10227 - 85542, n=105, últimos 2 anos) | |
| Média Intel Core Ultra 7 255HX (27732 - 34250, n=5) | |
| Asus TUF Gaming A16 FA608UP | |
| Gigabyte Aero X16 1WH | |
| Gigabyte Gaming A16 GA6H | |
| AIDA64 / FPU Julia | |
| Lenovo Legion 5 Pro 16IAX10H | |
| Lenovo Legion Pro 5 16IAX10, RTX 5070 | |
| Alienware 16X Aurora, RTX 5070 | |
| Média Intel Core Ultra 7 255HX (140290 - 167758, n=5) | |
| Schenker XMG Core 16 M25 | |
| Média da turma Gaming (51376 - 238426, n=105, últimos 2 anos) | |
| Asus TUF Gaming A16 FA608UP | |
| Gigabyte Aero X16 1WH | |
| Gigabyte Gaming A16 GA6H | |
| AIDA64 / CPU SHA3 | |
| Lenovo Legion 5 Pro 16IAX10H | |
| Alienware 16X Aurora, RTX 5070 | |
| Lenovo Legion Pro 5 16IAX10, RTX 5070 | |
| Média Intel Core Ultra 7 255HX (6445 - 7694, n=5) | |
| Média da turma Gaming (2180 - 10115, n=105, últimos 2 anos) | |
| Schenker XMG Core 16 M25 | |
| Asus TUF Gaming A16 FA608UP | |
| Gigabyte Aero X16 1WH | |
| Gigabyte Gaming A16 GA6H | |
| AIDA64 / CPU Queen | |
| Lenovo Legion 5 Pro 16IAX10H | |
| Lenovo Legion Pro 5 16IAX10, RTX 5070 | |
| Alienware 16X Aurora, RTX 5070 | |
| Média Intel Core Ultra 7 255HX (115802 - 135237, n=5) | |
| Asus TUF Gaming A16 FA608UP | |
| Média da turma Gaming (49785 - 173351, n=90, últimos 2 anos) | |
| Schenker XMG Core 16 M25 | |
| Gigabyte Aero X16 1WH | |
| Gigabyte Gaming A16 GA6H | |
| AIDA64 / FPU SinJulia | |
| Schenker XMG Core 16 M25 | |
| Asus TUF Gaming A16 FA608UP | |
| Média da turma Gaming (4424 - 33636, n=105, últimos 2 anos) | |
| Lenovo Legion 5 Pro 16IAX10H | |
| Gigabyte Aero X16 1WH | |
| Alienware 16X Aurora, RTX 5070 | |
| Lenovo Legion Pro 5 16IAX10, RTX 5070 | |
| Média Intel Core Ultra 7 255HX (11066 - 12286, n=5) | |
| Gigabyte Gaming A16 GA6H | |
| AIDA64 / FPU Mandel | |
| Lenovo Legion 5 Pro 16IAX10H | |
| Lenovo Legion Pro 5 16IAX10, RTX 5070 | |
| Alienware 16X Aurora, RTX 5070 | |
| Média Intel Core Ultra 7 255HX (72938 - 87947, n=5) | |
| Schenker XMG Core 16 M25 | |
| Média da turma Gaming (25115 - 128721, n=105, últimos 2 anos) | |
| Asus TUF Gaming A16 FA608UP | |
| Gigabyte Aero X16 1WH | |
| Gigabyte Gaming A16 GA6H | |
| AIDA64 / CPU AES | |
| Lenovo Legion 5 Pro 16IAX10H | |
| Alienware 16X Aurora, RTX 5070 | |
| Schenker XMG Core 16 M25 | |
| Lenovo Legion Pro 5 16IAX10, RTX 5070 | |
| Média Intel Core Ultra 7 255HX (96832 - 116158, n=5) | |
| Média da turma Gaming (39258 - 247074, n=105, últimos 2 anos) | |
| Asus TUF Gaming A16 FA608UP | |
| Gigabyte Aero X16 1WH | |
| Gigabyte Gaming A16 GA6H | |
| AIDA64 / CPU ZLib | |
| Lenovo Legion 5 Pro 16IAX10H | |
| Alienware 16X Aurora, RTX 5070 | |
| Lenovo Legion Pro 5 16IAX10, RTX 5070 | |
| Média Intel Core Ultra 7 255HX (1510 - 1850, n=5) | |
| Média da turma Gaming (574 - 2531, n=105, últimos 2 anos) | |
| Schenker XMG Core 16 M25 | |
| Gigabyte Aero X16 1WH | |
| Asus TUF Gaming A16 FA608UP | |
| Gigabyte Gaming A16 GA6H | |
| AIDA64 / FP64 Ray-Trace | |
| Schenker XMG Core 16 M25 | |
| Lenovo Legion 5 Pro 16IAX10H | |
| Lenovo Legion Pro 5 16IAX10, RTX 5070 | |
| Alienware 16X Aurora, RTX 5070 | |
| Média da turma Gaming (5509 - 45446, n=105, últimos 2 anos) | |
| Média Intel Core Ultra 7 255HX (15137 - 18315, n=5) | |
| Asus TUF Gaming A16 FA608UP | |
| Gigabyte Aero X16 1WH | |
| Gigabyte Gaming A16 GA6H | |
| AIDA64 / CPU PhotoWorxx | |
| Lenovo Legion Pro 5 16IAX10, RTX 5070 | |
| Schenker XMG Core 16 M25 | |
| Lenovo Legion 5 Pro 16IAX10H | |
| Alienware 16X Aurora, RTX 5070 | |
| Média Intel Core Ultra 7 255HX (39697 - 54070, n=5) | |
| Média da turma Gaming (12271 - 89891, n=105, últimos 2 anos) | |
| Gigabyte Aero X16 1WH | |
| Asus TUF Gaming A16 FA608UP | |
| Gigabyte Gaming A16 GA6H | |
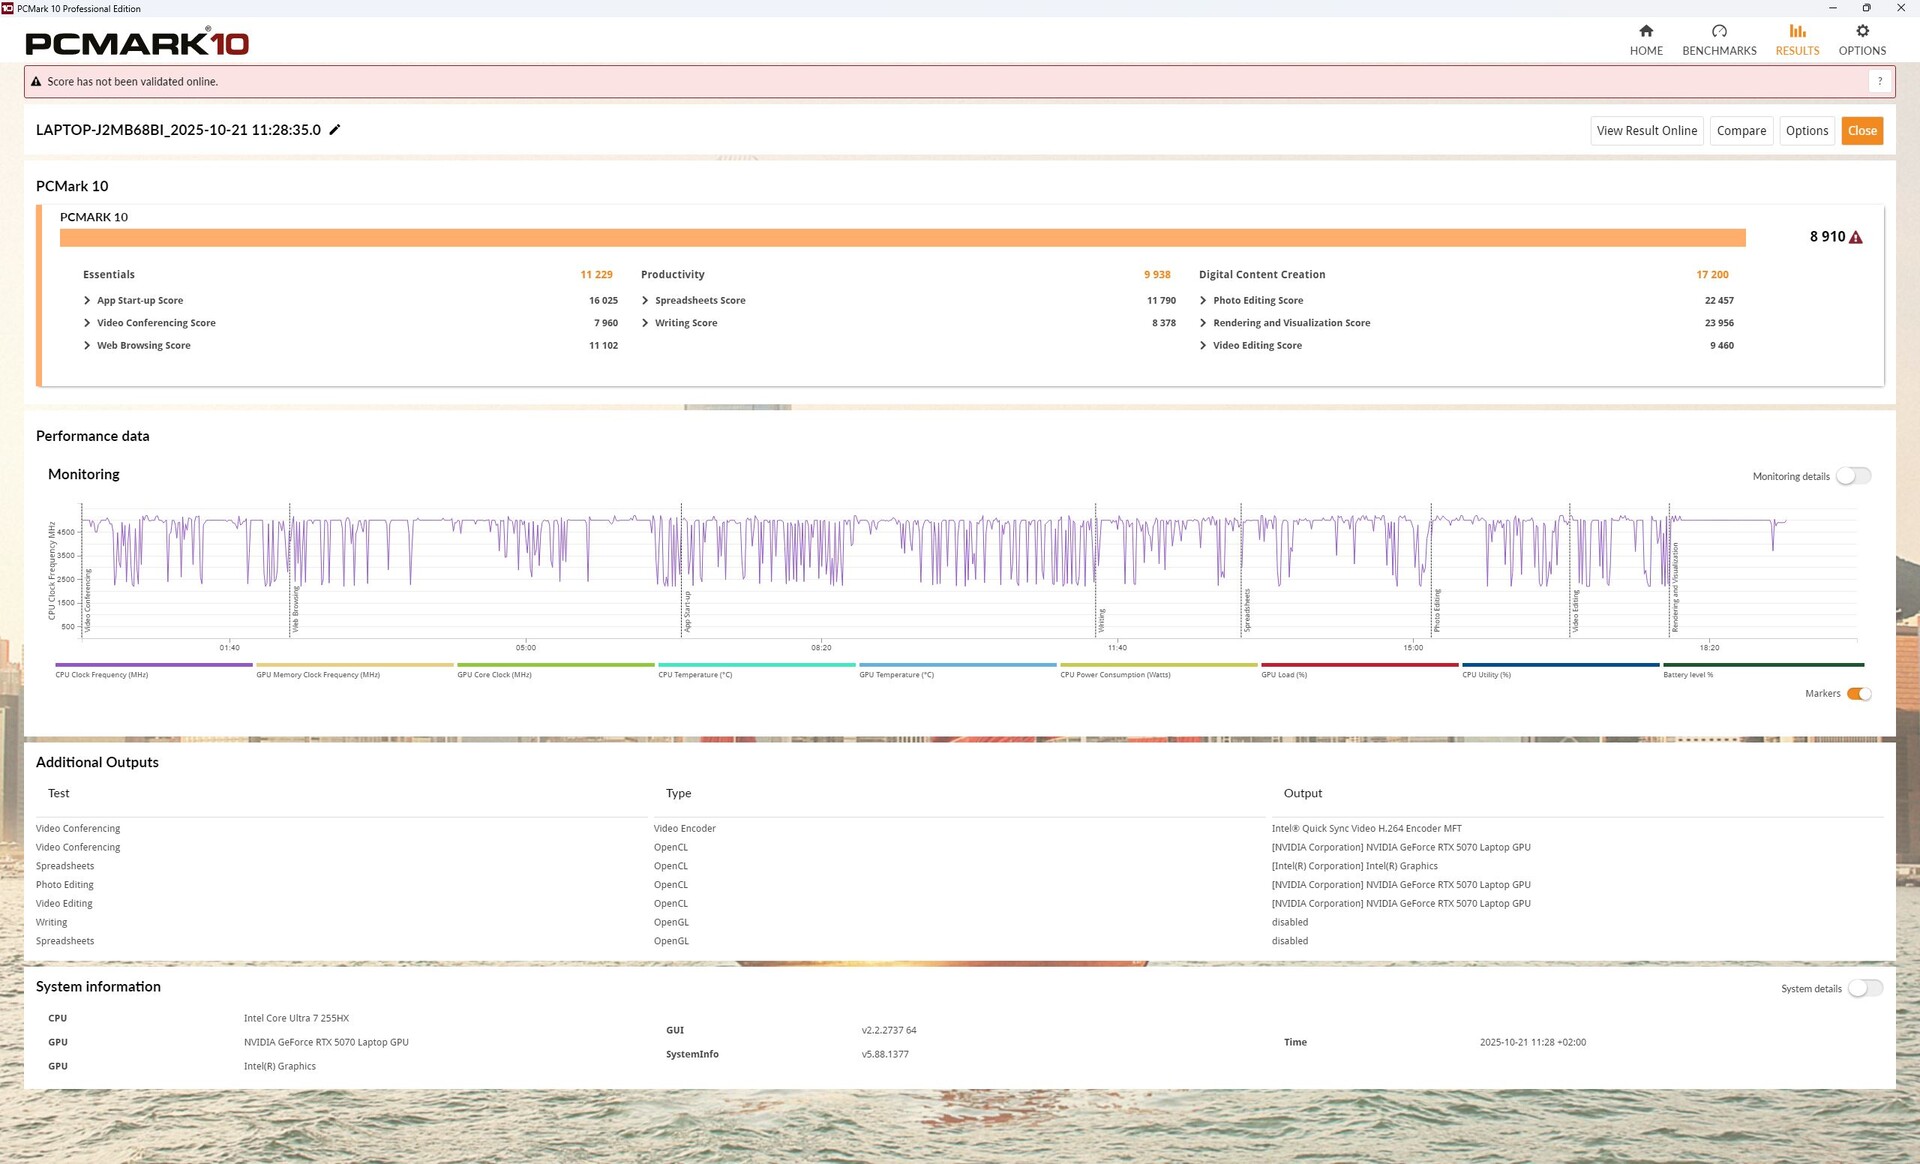
Desempenho do sistema
O Legion Pro 5 16 oferece um excelente desempenho geral do sistema, liderando a maioria dos concorrentes e ficando atrás de seu irmão Ti por apenas uma pequena margem.
PCMark 10: Score | Essentials | Productivity | Digital Content Creation
CrossMark: Overall | Productivity | Creativity | Responsiveness
WebXPRT 3: Overall
WebXPRT 4: Overall
Mozilla Kraken 1.1: Total
| Performance rating | |
| Lenovo Legion 5 Pro 16IAX10H | |
| Alienware 16X Aurora, RTX 5070 -4! | |
| Lenovo Legion Pro 5 16IAX10, RTX 5070 | |
| Média Intel Core Ultra 7 255HX, NVIDIA GeForce RTX 5070 Laptop | |
| Média da turma Gaming | |
| Schenker XMG Core 16 M25 -4! | |
| Gigabyte Aero X16 1WH | |
| Gigabyte Gaming A16 GA6H | |
| Asus TUF Gaming A16 FA608UP -4! | |
| PCMark 10 / Score | |
| Lenovo Legion Pro 5 16IAX10, RTX 5070 | |
| Média Intel Core Ultra 7 255HX, NVIDIA GeForce RTX 5070 Laptop (n=1) | |
| Média da turma Gaming (5828 - 12414, n=93, últimos 2 anos) | |
| Lenovo Legion 5 Pro 16IAX10H | |
| Gigabyte Aero X16 1WH | |
| Gigabyte Gaming A16 GA6H | |
| PCMark 10 / Essentials | |
| Lenovo Legion Pro 5 16IAX10, RTX 5070 | |
| Média Intel Core Ultra 7 255HX, NVIDIA GeForce RTX 5070 Laptop (n=1) | |
| Lenovo Legion 5 Pro 16IAX10H | |
| Média da turma Gaming (8810 - 11935, n=97, últimos 2 anos) | |
| Gigabyte Aero X16 1WH | |
| Gigabyte Gaming A16 GA6H | |
| PCMark 10 / Productivity | |
| Média da turma Gaming (6845 - 25323, n=95, últimos 2 anos) | |
| Gigabyte Aero X16 1WH | |
| Lenovo Legion Pro 5 16IAX10, RTX 5070 | |
| Média Intel Core Ultra 7 255HX, NVIDIA GeForce RTX 5070 Laptop (n=1) | |
| Lenovo Legion 5 Pro 16IAX10H | |
| Gigabyte Gaming A16 GA6H | |
| PCMark 10 / Digital Content Creation | |
| Lenovo Legion Pro 5 16IAX10, RTX 5070 | |
| Média Intel Core Ultra 7 255HX, NVIDIA GeForce RTX 5070 Laptop (n=1) | |
| Lenovo Legion 5 Pro 16IAX10H | |
| Média da turma Gaming (7602 - 19954, n=95, últimos 2 anos) | |
| Gigabyte Aero X16 1WH | |
| Gigabyte Gaming A16 GA6H | |
| CrossMark / Overall | |
| Alienware 16X Aurora, RTX 5070 | |
| Lenovo Legion 5 Pro 16IAX10H | |
| Lenovo Legion Pro 5 16IAX10, RTX 5070 | |
| Média Intel Core Ultra 7 255HX, NVIDIA GeForce RTX 5070 Laptop (n=1) | |
| Schenker XMG Core 16 M25 | |
| Média da turma Gaming (1366 - 2409, n=94, últimos 2 anos) | |
| Gigabyte Gaming A16 GA6H | |
| Gigabyte Aero X16 1WH | |
| Asus TUF Gaming A16 FA608UP | |
| CrossMark / Productivity | |
| Alienware 16X Aurora, RTX 5070 | |
| Lenovo Legion 5 Pro 16IAX10H | |
| Lenovo Legion Pro 5 16IAX10, RTX 5070 | |
| Média Intel Core Ultra 7 255HX, NVIDIA GeForce RTX 5070 Laptop (n=1) | |
| Média da turma Gaming (1386 - 2254, n=94, últimos 2 anos) | |
| Schenker XMG Core 16 M25 | |
| Gigabyte Gaming A16 GA6H | |
| Gigabyte Aero X16 1WH | |
| Asus TUF Gaming A16 FA608UP | |
| CrossMark / Creativity | |
| Lenovo Legion 5 Pro 16IAX10H | |
| Schenker XMG Core 16 M25 | |
| Alienware 16X Aurora, RTX 5070 | |
| Lenovo Legion Pro 5 16IAX10, RTX 5070 | |
| Média Intel Core Ultra 7 255HX, NVIDIA GeForce RTX 5070 Laptop (n=1) | |
| Média da turma Gaming (1343 - 2786, n=94, últimos 2 anos) | |
| Gigabyte Aero X16 1WH | |
| Asus TUF Gaming A16 FA608UP | |
| Gigabyte Gaming A16 GA6H | |
| CrossMark / Responsiveness | |
| Alienware 16X Aurora, RTX 5070 | |
| Lenovo Legion 5 Pro 16IAX10H | |
| Gigabyte Gaming A16 GA6H | |
| Lenovo Legion Pro 5 16IAX10, RTX 5070 | |
| Média Intel Core Ultra 7 255HX, NVIDIA GeForce RTX 5070 Laptop (n=1) | |
| Média da turma Gaming (1226 - 2334, n=94, últimos 2 anos) | |
| Schenker XMG Core 16 M25 | |
| Gigabyte Aero X16 1WH | |
| Asus TUF Gaming A16 FA608UP | |
| WebXPRT 3 / Overall | |
| Lenovo Legion 5 Pro 16IAX10H | |
| Alienware 16X Aurora, RTX 5070 | |
| Schenker XMG Core 16 M25 | |
| Gigabyte Aero X16 1WH | |
| Lenovo Legion Pro 5 16IAX10, RTX 5070 | |
| Média Intel Core Ultra 7 255HX, NVIDIA GeForce RTX 5070 Laptop (n=1) | |
| Média da turma Gaming (220 - 532, n=98, últimos 2 anos) | |
| Asus TUF Gaming A16 FA608UP | |
| Gigabyte Gaming A16 GA6H | |
| WebXPRT 4 / Overall | |
| Schenker XMG Core 16 M25 | |
| Alienware 16X Aurora, RTX 5070 | |
| Lenovo Legion Pro 5 16IAX10, RTX 5070 | |
| Média Intel Core Ultra 7 255HX, NVIDIA GeForce RTX 5070 Laptop (n=1) | |
| Lenovo Legion 5 Pro 16IAX10H | |
| Média da turma Gaming (165 - 354, n=98, últimos 2 anos) | |
| Gigabyte Aero X16 1WH | |
| Gigabyte Gaming A16 GA6H | |
| Asus TUF Gaming A16 FA608UP | |
| Mozilla Kraken 1.1 / Total | |
| Asus TUF Gaming A16 FA608UP | |
| Gigabyte Gaming A16 GA6H | |
| Média da turma Gaming (391 - 590, n=100, últimos 2 anos) | |
| Gigabyte Aero X16 1WH | |
| Lenovo Legion Pro 5 16IAX10, RTX 5070 | |
| Média Intel Core Ultra 7 255HX, NVIDIA GeForce RTX 5070 Laptop (n=1) | |
| Schenker XMG Core 16 M25 | |
| Lenovo Legion 5 Pro 16IAX10H | |
| Alienware 16X Aurora, RTX 5070 | |
* ... menor é melhor
| PCMark 10 Score | 8910 pontos | |
Ajuda | ||
| AIDA64 / Memory Copy | |
| Lenovo Legion Pro 5 16IAX10, RTX 5070 | |
| Média Intel Core Ultra 7 255HX (68939 - 104987, n=5) | |
| Lenovo Legion 5 Pro 16IAX10H | |
| Alienware 16X Aurora, RTX 5070 | |
| Schenker XMG Core 16 M25 | |
| Gigabyte Aero X16 1WH | |
| Média da turma Gaming (21750 - 129946, n=105, últimos 2 anos) | |
| Asus TUF Gaming A16 FA608UP | |
| Gigabyte Gaming A16 GA6H | |
| AIDA64 / Memory Read | |
| Lenovo Legion Pro 5 16IAX10, RTX 5070 | |
| Média Intel Core Ultra 7 255HX (82336 - 95821, n=5) | |
| Lenovo Legion 5 Pro 16IAX10H | |
| Alienware 16X Aurora, RTX 5070 | |
| Schenker XMG Core 16 M25 | |
| Média da turma Gaming (22956 - 118858, n=105, últimos 2 anos) | |
| Gigabyte Aero X16 1WH | |
| Asus TUF Gaming A16 FA608UP | |
| Gigabyte Gaming A16 GA6H | |
| AIDA64 / Memory Write | |
| Média Intel Core Ultra 7 255HX (66479 - 133486, n=5) | |
| Asus TUF Gaming A16 FA608UP | |
| Gigabyte Aero X16 1WH | |
| Lenovo Legion Pro 5 16IAX10, RTX 5070 | |
| Schenker XMG Core 16 M25 | |
| Alienware 16X Aurora, RTX 5070 | |
| Lenovo Legion 5 Pro 16IAX10H | |
| Média da turma Gaming (22297 - 135096, n=105, últimos 2 anos) | |
| Gigabyte Gaming A16 GA6H | |
| AIDA64 / Memory Latency | |
| Alienware 16X Aurora, RTX 5070 | |
| Lenovo Legion 5 Pro 16IAX10H | |
| Média da turma Gaming (75.3 - 259, n=105, últimos 2 anos) | |
| Média Intel Core Ultra 7 255HX (104.2 - 110, n=5) | |
| Lenovo Legion Pro 5 16IAX10, RTX 5070 | |
| Gigabyte Gaming A16 GA6H | |
| Gigabyte Aero X16 1WH | |
| Asus TUF Gaming A16 FA608UP | |
| Schenker XMG Core 16 M25 | |
* ... menor é melhor
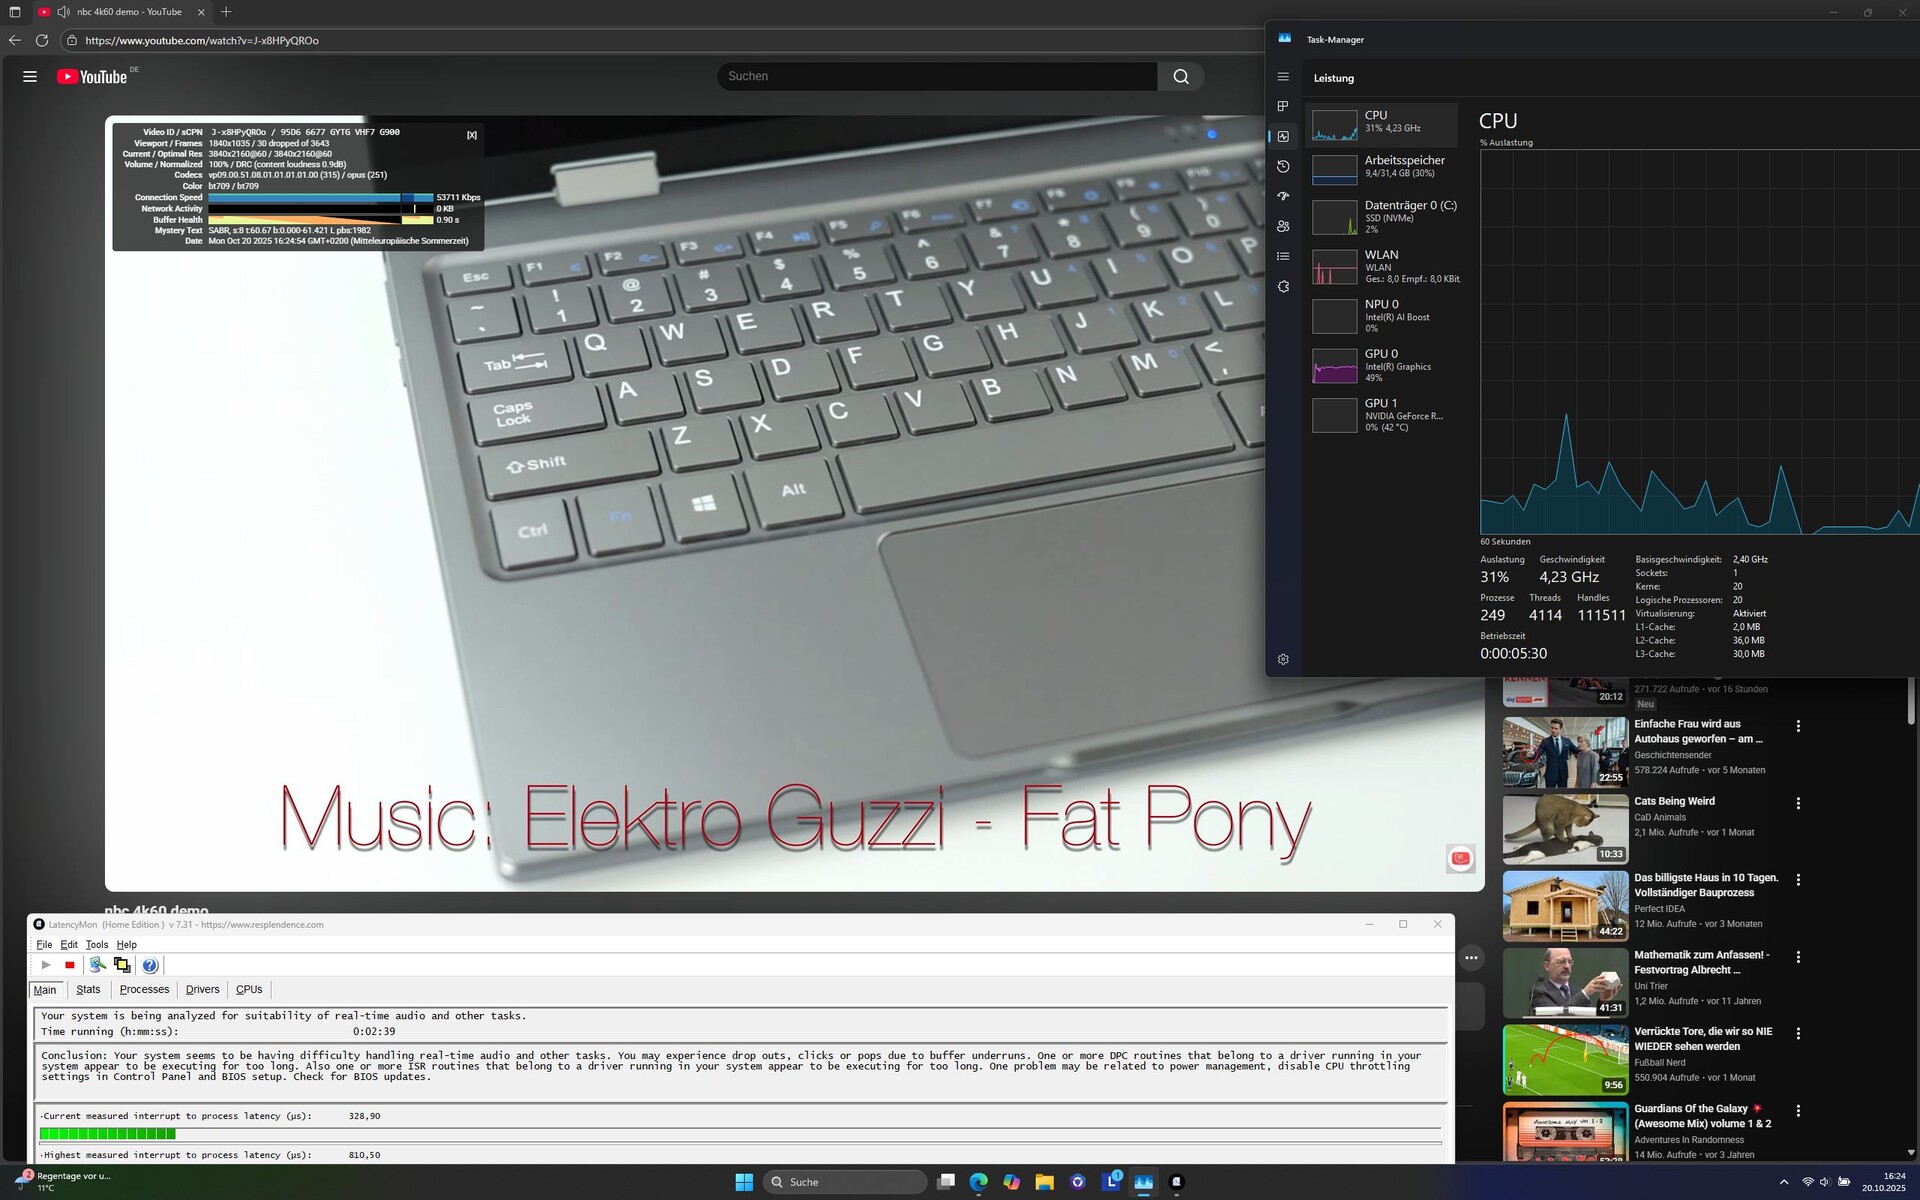
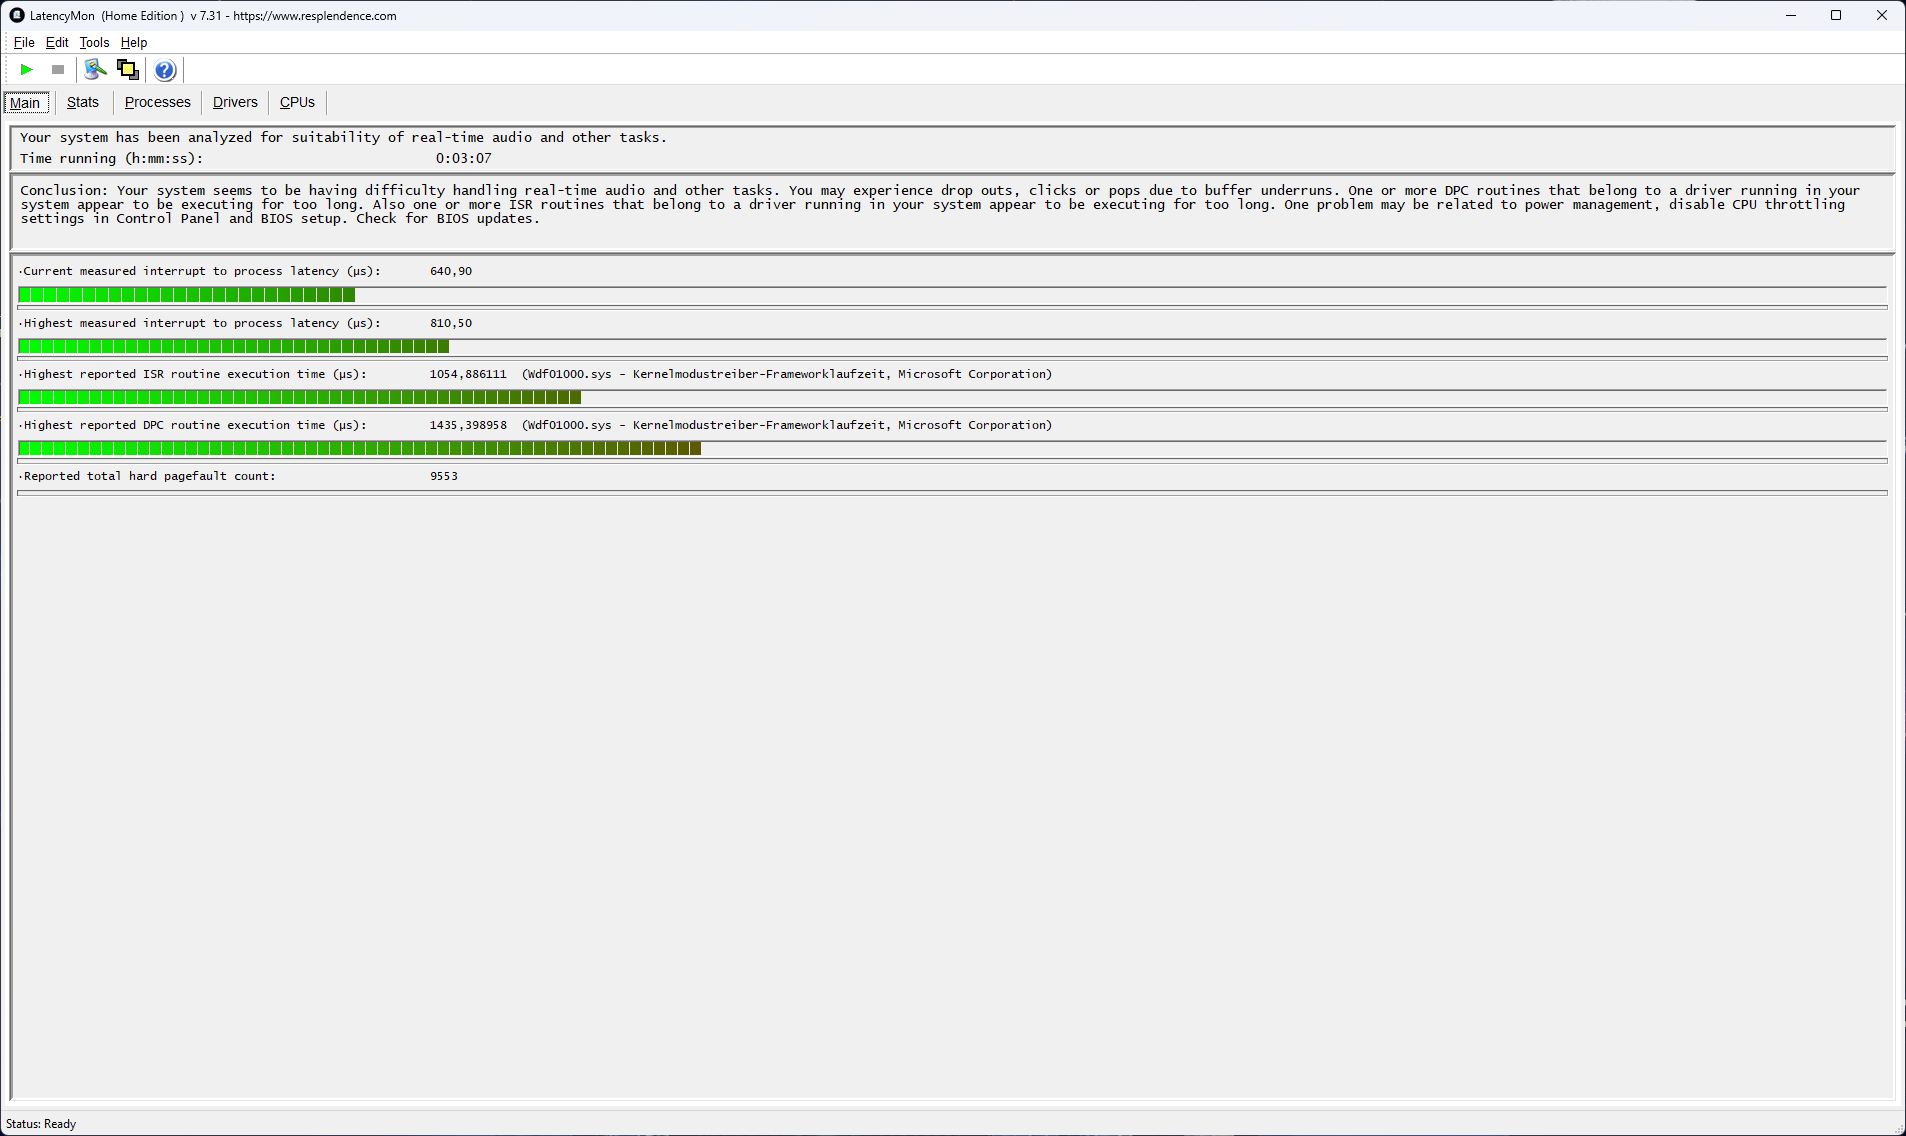
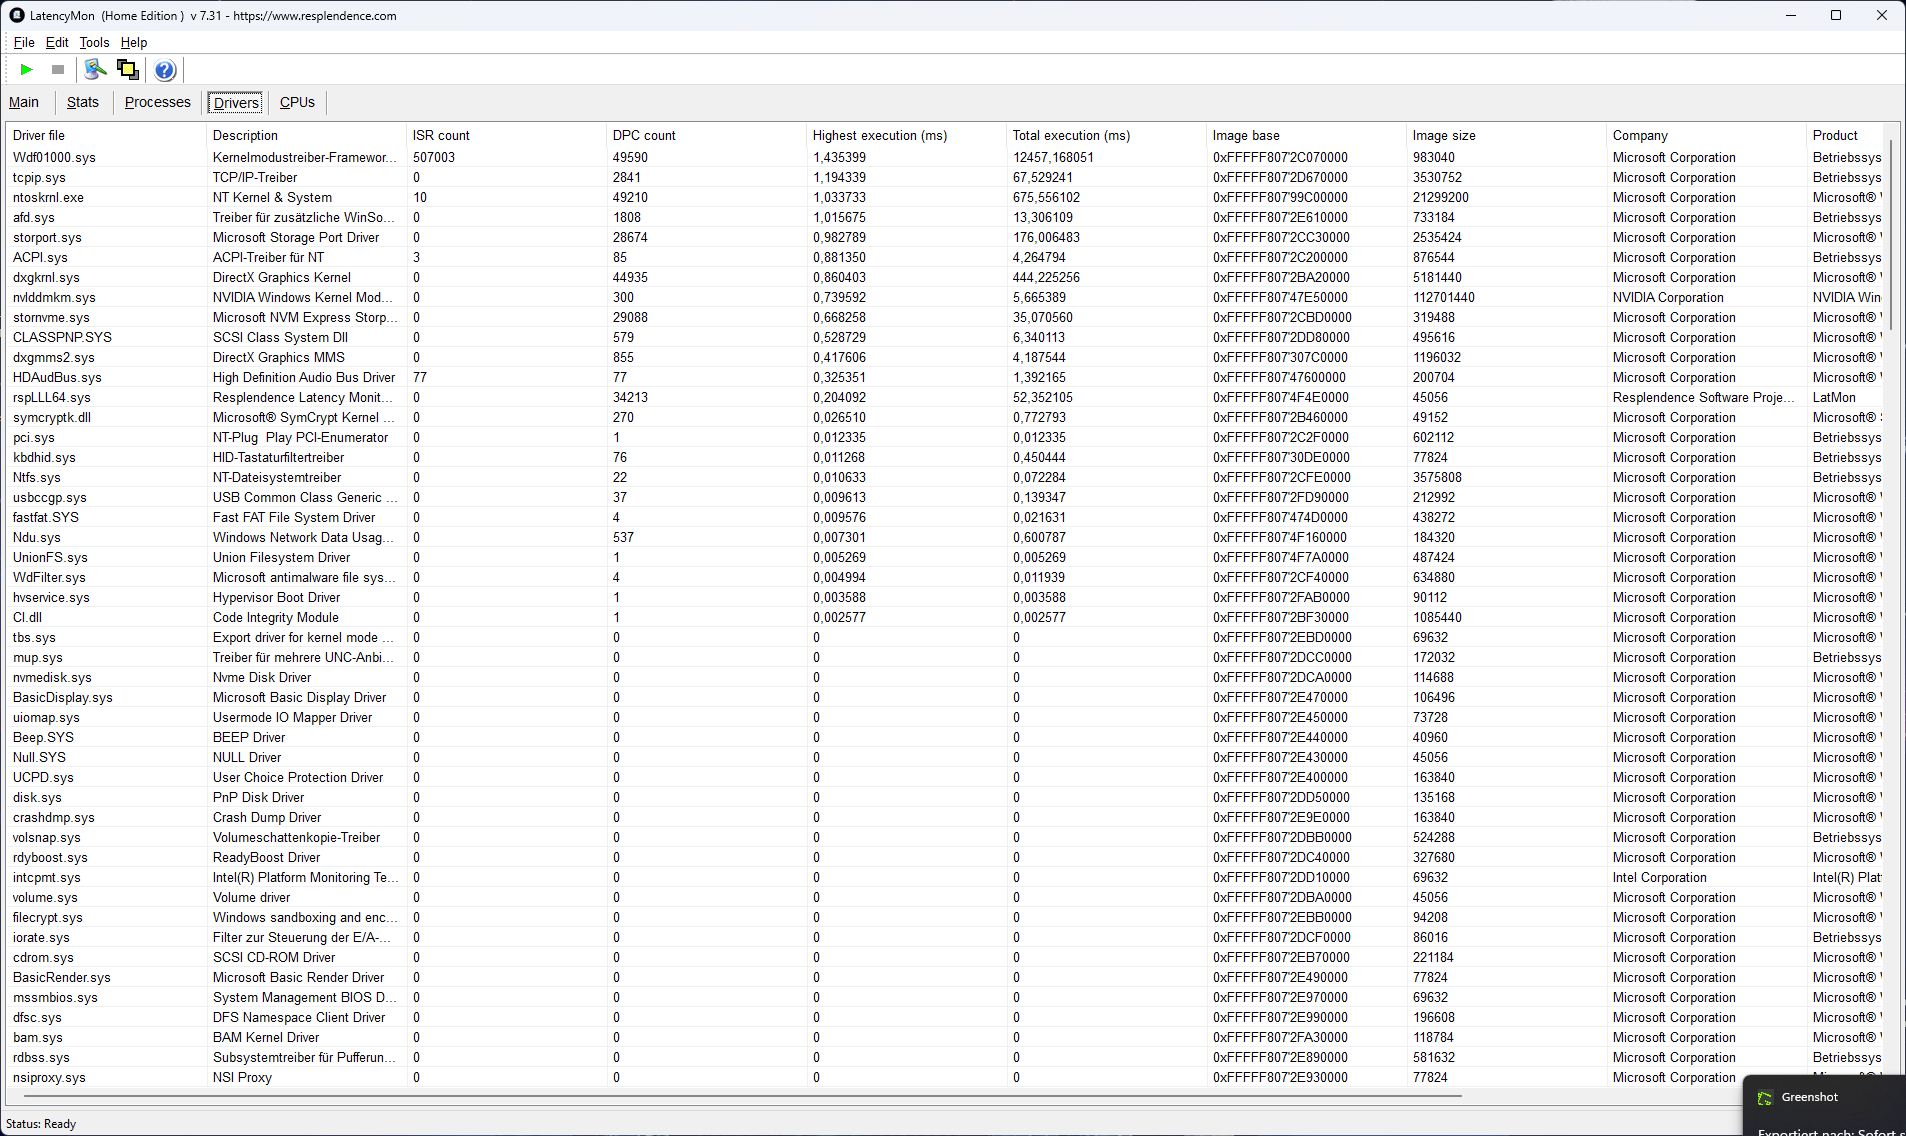
Latência DPC
Pequenos picos de latência aparecem ao iniciar o navegador, mas a abertura de várias guias não os piora. A reprodução de um vídeo de teste do YouTube causa cerca de 30 quadros perdidos, embora a latência geral permaneça baixa em comparação com outros sistemas.
| DPC Latencies / LatencyMon - interrupt to process latency (max), Web, Youtube, Prime95 | |
| Gigabyte Gaming A16 GA6H | |
| Gigabyte Aero X16 1WH | |
| Alienware 16X Aurora, RTX 5070 | |
| Lenovo Legion 5 Pro 16IAX10H | |
| Lenovo Legion Pro 5 16IAX10, RTX 5070 | |
| Schenker XMG Core 16 M25 | |
| Asus TUF Gaming A16 FA608UP | |
* ... menor é melhor
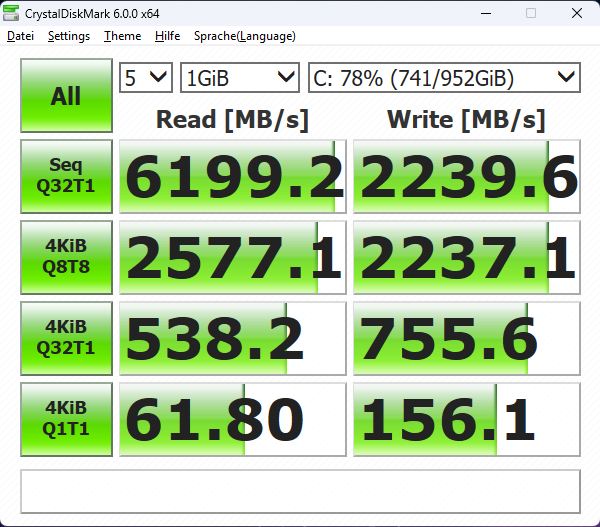
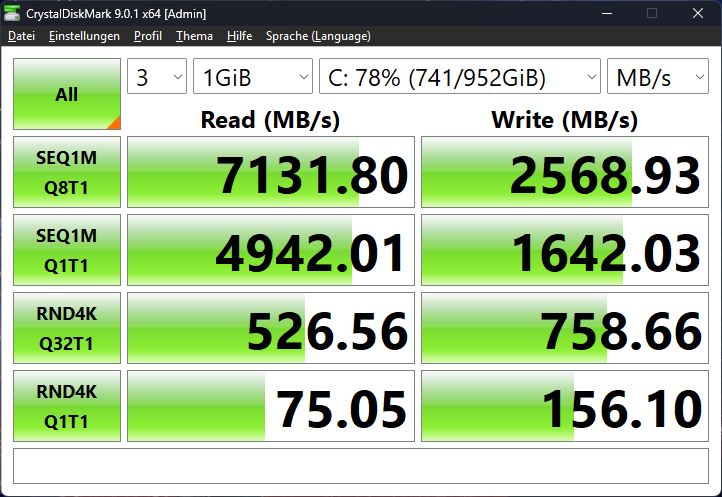
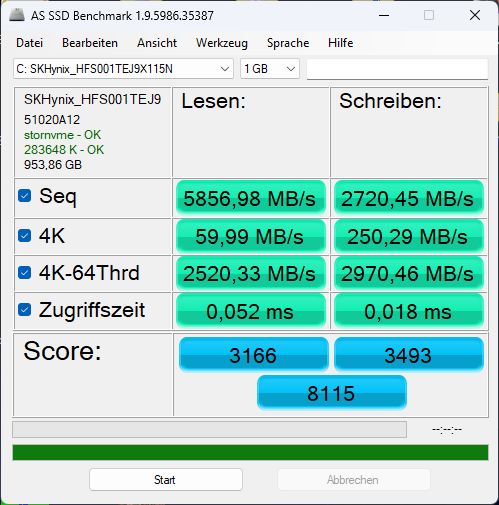
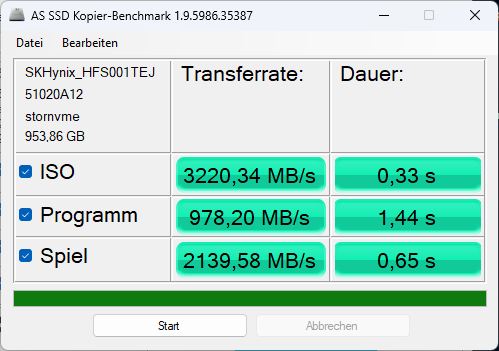
Armazenamento em massa
Nossa unidade usa um SSD PCIe 4.0 da SK Hynix; o modelo Modelo Ti usou uma unidade Western Digital. O Hynix é um pouco mais rápido no geral, mas começa a se desgastar termicamente no final do nosso longo teste de estresse.

* ... menor é melhor
Desempenho contínuo de leitura: Loop de leitura do DiskSpd, profundidade da fila 8
Desempenho da GPU
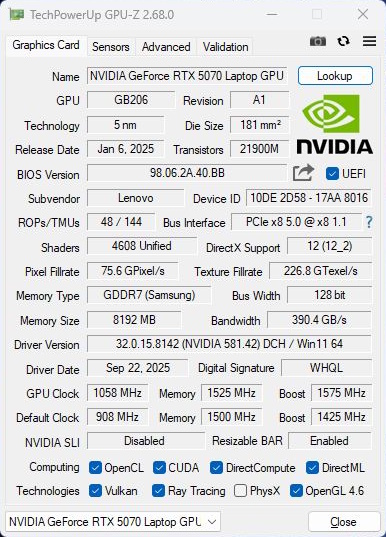
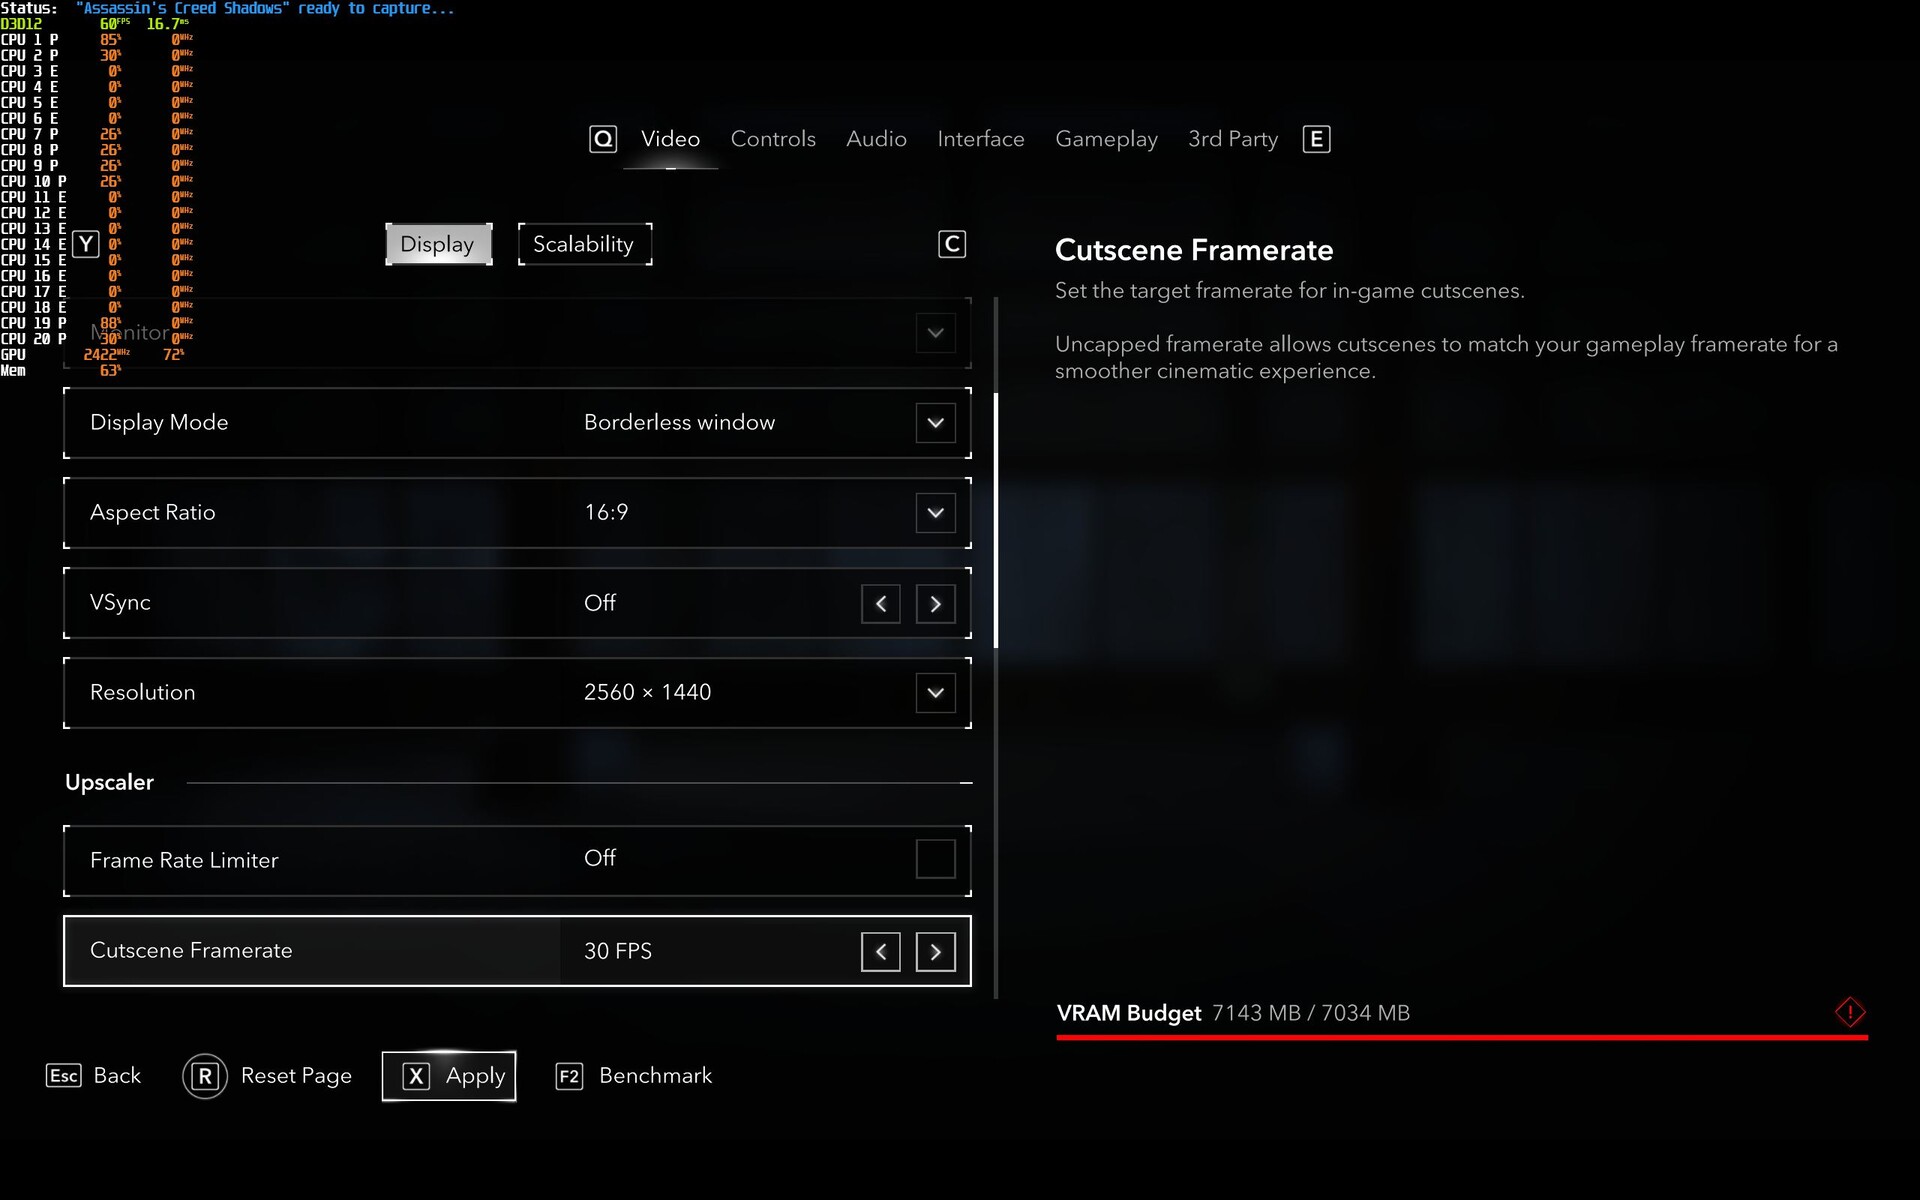
A RTX 5070 vem com 8 GB de VRAM contra 12 GB na RTX 5070 Ti. Em determinados jogos com resoluções ou configurações mais altas, isso pode se tornar uma limitação (veja a captura de tela abaixo), embora em nossos testes isso não tenha causado travamentos - os tempos dos quadros foram consistentes.
Em Indiana Jones and the Great Circle, o jogo já sinaliza um estouro de VRAM em Full HD em configurações baixas; a jogabilidade permanece suave até detalhes médios, mas em configurações altas ou ultra, ele travou repetidamente no lançamento.
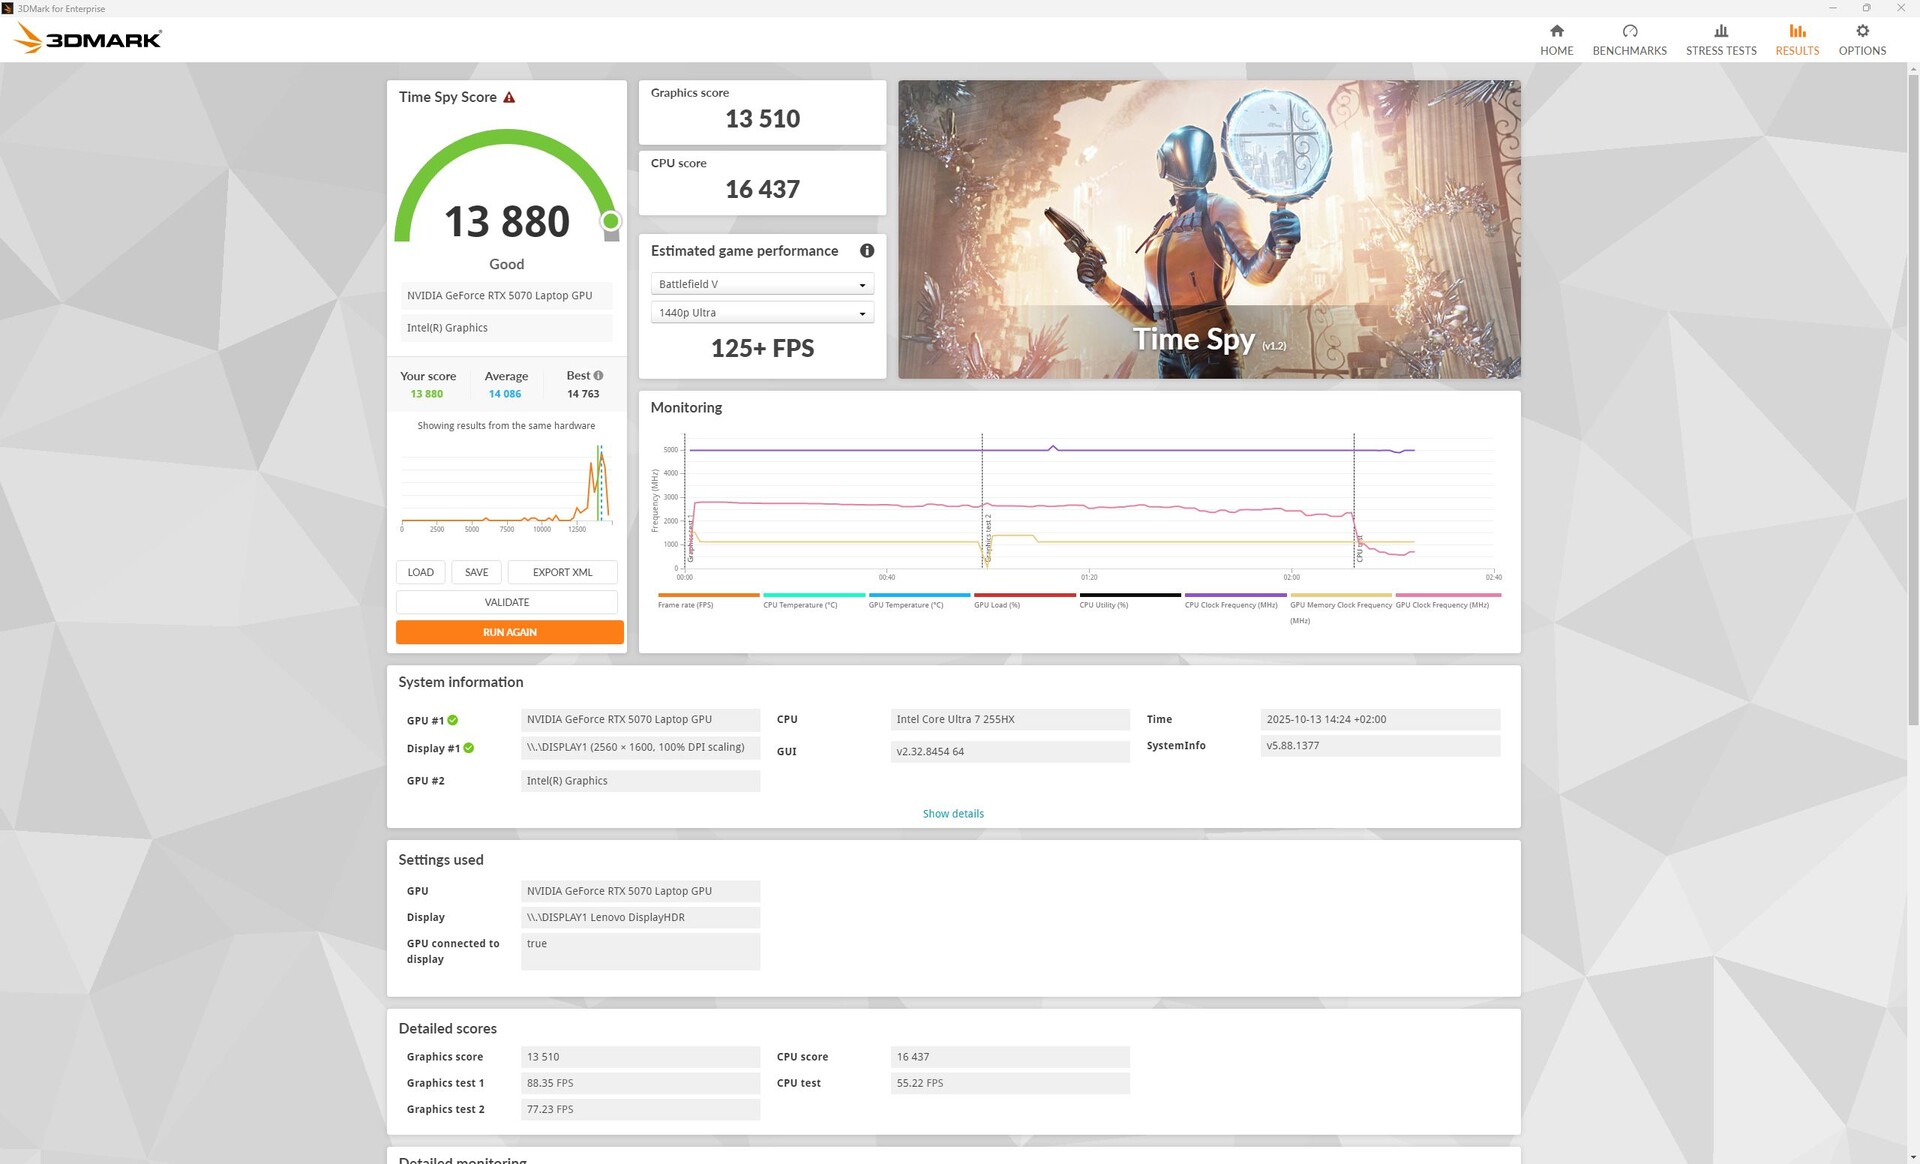
Os testes sintéticos do 3DMark mostram pontuações cerca de 25% mais altas para a variante Ti.
As comparações entre os jogos variam: Títulos com CPU, como Dota 2 Reborn, quase não se beneficiam, enquanto títulos com muita GPU, como Cyberpunk 2077 ou Strange Brigade, refletem toda a vantagem da Ti vista no 3DMark.
Mesmo assim, a RTX 5070 lida com a maioria dos jogos modernos sem problemas em configurações altas - QHD não é um problema, e até mesmo 4K é jogável em muitos casos. A versão Ti só consegue extrair alguns quadros em títulos muito exigentes (Cyberpunk 2077 sem DLSS, F1 25). Abaixo de 30 fps, não medimos mais, por exemplo, F1 25 em QHD não era mais jogável sem problemas.
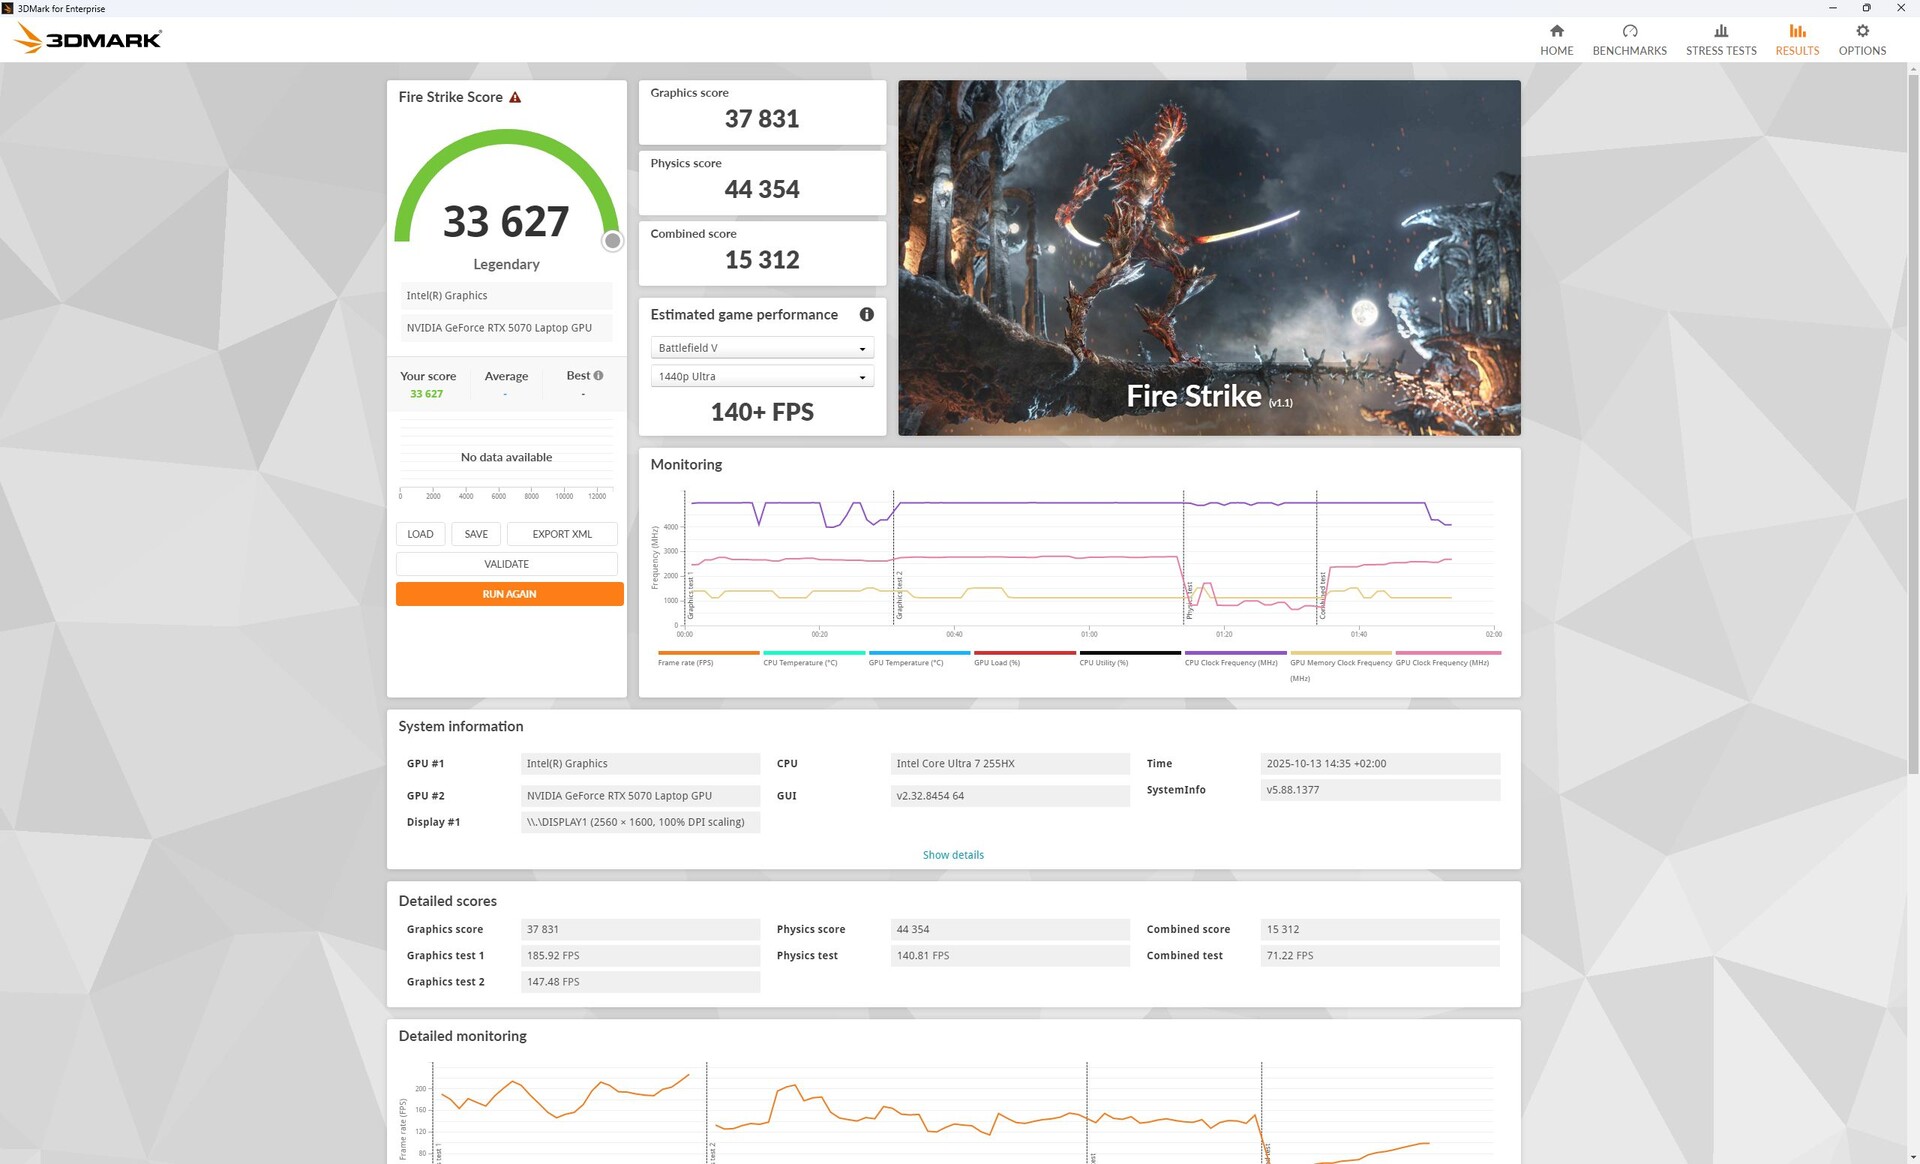
Desconectado, o desempenho 3D cai drasticamente - 82% (Fire Strike).
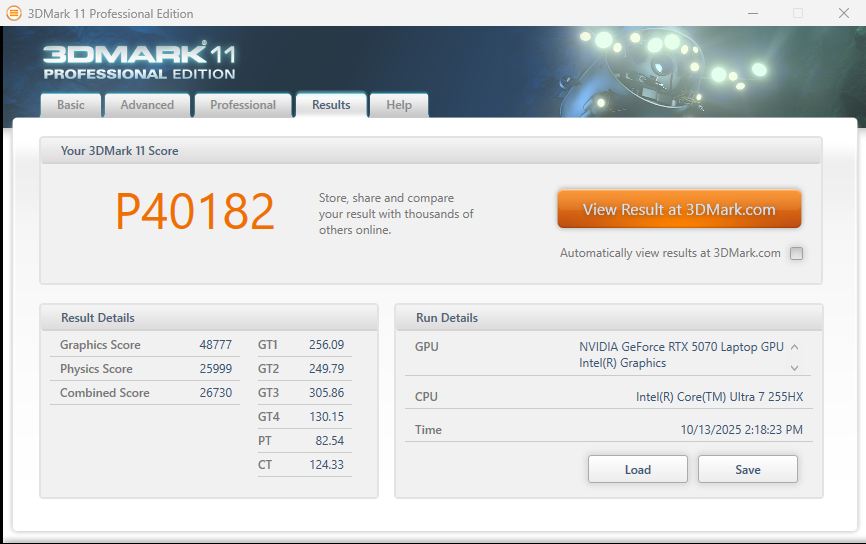
| 3DMark 11 Performance | 40182 pontos | |
| 3DMark Fire Strike Score | 33627 pontos | |
| 3DMark Time Spy Score | 13880 pontos | |
Ajuda | ||
* ... menor é melhor
| F1 25 | |
| 1920x1080 Ultra High Preset AA:T AF:16x | |
| Média da turma Gaming (46.3 - 120.6, n=26, últimos 2 anos) | |
| Lenovo Legion Pro 5 16IAX10, RTX 5070 | |
| Lenovo Legion 5 Pro 16IAX10H | |
| Média NVIDIA GeForce RTX 5070 Laptop (48.5 - 64.5, n=10) | |
| 1920x1080 Ultra Max Preset AA:T AF:16x | |
| Lenovo Legion 5 Pro 16IAX10H | |
| Média da turma Gaming (12.5 - 62.3, n=33, últimos 2 anos) | |
| Lenovo Legion Pro 5 16IAX10, RTX 5070 | |
| Média NVIDIA GeForce RTX 5070 Laptop (25.8 - 31.6, n=11) | |
Gráfico de ultra fps do Cyberpunk 2077
| baixo | média | alto | ultra | QHD DLSS | QHD | 4K DLSS | 4K | |
|---|---|---|---|---|---|---|---|---|
| GTA V (2015) | 187.6 | 186.4 | 184.1 | 153.2 | 126 | 119 | ||
| Dota 2 Reborn (2015) | 203 | 184.2 | 178.1 | 162.4 | 131 | |||
| Final Fantasy XV Benchmark (2018) | 232 | 191.3 | 144.5 | 106.8 | 59.1 | |||
| X-Plane 11.11 (2018) | 135.5 | 117.6 | 101.6 | 80 | ||||
| Strange Brigade (2018) | 560 | 349 | 295 | 246 | 177.4 | 95.8 | ||
| Baldur's Gate 3 (2023) | 192.4 | 153.1 | 134.6 | 130.6 | 135.8 | 90 | 77.6 | 46 |
| Cyberpunk 2077 (2023) | 171.8 | 146.4 | 122 | 107 | 80.7 | 68.3 | 30.2 | |
| Indiana Jones and the Great Circle (2024) | 131.6 | |||||||
| Assassin's Creed Shadows (2025) | 75 | 70 | 60 | 46 | 45 | 38 | ||
| Doom: The Dark Ages (2025) | 96.2 | 88.4 | 74.2 | 72.2 | 70 | 49.4 | 33.2 | |
| F1 25 (2025) | 242 | 227 | 191.9 | 31.6 |
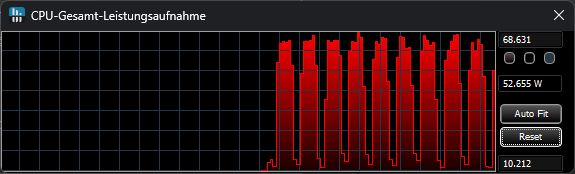
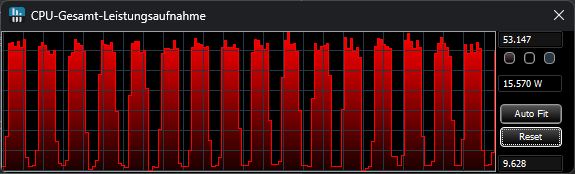
Emissões e energia - mais silencioso, mais frio, mais eficiente
Ruído
No modo inativo, as ventoinhas geralmente permanecem desligadas, embora girem silenciosamente mesmo com cargas leves, como navegação na Web.
Sob carga contínua, elas são um pouco mais silenciosas do que no modelo Modelo Tienquanto os rivais apresentam números semelhantes. Para cerca de 12% menos potência da GPU no modo balanceado, o ruído da ventoinha no Cyberpunk 2077 é cerca de metade do volume (lembre-se: +3 dB ≈ o dobro do volume percebido).
Barulho
| Ocioso |
| 23 / 23 / 23 dB |
| Carga |
| 43.85 / 52.9 dB |
 | ||
30 dB silencioso 40 dB(A) audível 50 dB(A) ruidosamente alto |
||
min: | ||
| Lenovo Legion Pro 5 16IAX10, RTX 5070 Ultra 7 255HX, GeForce RTX 5070 Laptop | Lenovo Legion 5 Pro 16IAX10H Ultra 9 275HX, GeForce RTX 5070 Ti Laptop | Alienware 16X Aurora, RTX 5070 Ultra 9 275HX, GeForce RTX 5070 Laptop | Gigabyte Aero X16 1WH Ryzen AI 7 350, GeForce RTX 5070 Laptop | Asus TUF Gaming A16 FA608UP R7 260, GeForce RTX 5070 Laptop | Schenker XMG Core 16 M25 Ryzen AI 9 HX 370, GeForce RTX 5070 Laptop | Gigabyte Gaming A16 GA6H i7-13620H, GeForce RTX 5070 Laptop | |
|---|---|---|---|---|---|---|---|
| Noise | -13% | 0% | 2% | -19% | -4% | -11% | |
| desligado / ambiente * (dB) | 23 | 24 -4% | 23.7 -3% | 23.9 -4% | 25.1 -9% | 24.8 -8% | 24 -4% |
| Idle Minimum * (dB) | 23 | 24 -4% | 23.9 -4% | 23.9 -4% | 32.2 -40% | 24.8 -8% | 25 -9% |
| Idle Average * (dB) | 23 | 24 -4% | 23.9 -4% | 23.9 -4% | 32.2 -40% | 24.8 -8% | 26 -13% |
| Idle Maximum * (dB) | 23 | 30.9 -34% | 26.1 -13% | 23.9 -4% | 32.2 -40% | 27.1 -18% | 27 -17% |
| Load Average * (dB) | 43.85 | 55.9 -27% | 26.8 39% | 33.2 24% | 38.1 13% | 40.2 8% | 54 -23% |
| Cyberpunk 2077 ultra * (dB) | 50.27 | 56.72 -13% | 51.8 -3% | 50.2 -0% | 53.9 -7% | 49.2 2% | 54 -7% |
| Load Maximum * (dB) | 52.9 | 56.72 -7% | 58 -10% | 50.2 5% | 57.1 -8% | 49.2 7% | 55 -4% |
* ... menor é melhor
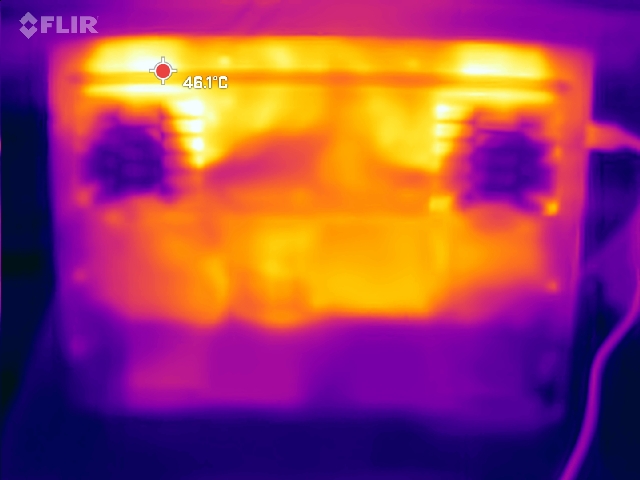
Temperatura
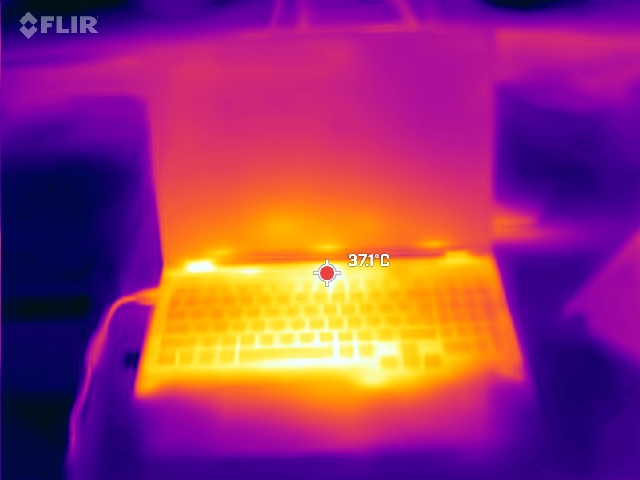
Sob carga, esse modelo funciona mais frio do que a variante Variante Ti. Medimos pontos de acesso de 44 °C na parte inferior traseira (contra 50 °C no Ti). As teclas WASD permanecem a 37 °C, e os apoios para as mãos continuam confortáveis.
(±) A temperatura máxima no lado superior é 42 °C / 108 F, em comparação com a média de 40.4 °C / 105 F , variando de 21.2 a 68.8 °C para a classe Gaming.
(±) A parte inferior aquece até um máximo de 44 °C / 111 F, em comparação com a média de 43.2 °C / 110 F
(+) Em uso inativo, a temperatura média para o lado superior é 29.8 °C / 86 F, em comparação com a média do dispositivo de 33.9 °C / ### class_avg_f### F.
(±) 3: The average temperature for the upper side is 34.3 °C / 94 F, compared to the average of 33.9 °C / 93 F for the class Gaming.
(+) Os apoios para as mãos e o touchpad são mais frios que a temperatura da pele, com um máximo de 31 °C / 87.8 F e, portanto, são frios ao toque.
(-) A temperatura média da área do apoio para as mãos de dispositivos semelhantes foi 28.8 °C / 83.8 F (-2.2 °C / -4 F).
| Lenovo Legion Pro 5 16IAX10, RTX 5070 Ultra 7 255HX, GeForce RTX 5070 Laptop | Lenovo Legion 5 Pro 16IAX10H Ultra 9 275HX, GeForce RTX 5070 Ti Laptop | Alienware 16X Aurora, RTX 5070 Ultra 9 275HX, GeForce RTX 5070 Laptop | Gigabyte Aero X16 1WH Ryzen AI 7 350, GeForce RTX 5070 Laptop | Asus TUF Gaming A16 FA608UP R7 260, GeForce RTX 5070 Laptop | Schenker XMG Core 16 M25 Ryzen AI 9 HX 370, GeForce RTX 5070 Laptop | Gigabyte Gaming A16 GA6H i7-13620H, GeForce RTX 5070 Laptop | |
|---|---|---|---|---|---|---|---|
| Heat | -17% | 1% | 5% | 13% | -5% | -9% | |
| Maximum Upper Side * (°C) | 42 | 48 -14% | 51 -21% | 43.3 -3% | 39.5 6% | 46.7 -11% | 50 -19% |
| Maximum Bottom * (°C) | 44 | 50 -14% | 45.6 -4% | 50.3 -14% | 45.1 -3% | 58.5 -33% | 49 -11% |
| Idle Upper Side * (°C) | 33 | 38 -15% | 29.8 10% | 27 18% | 25.7 22% | 28.3 14% | 35 -6% |
| Idle Bottom * (°C) | 34 | 42 -24% | 27.4 19% | 28.3 17% | 25.5 25% | 29.9 12% | 34 -0% |
* ... menor é melhor
Alto-falantes
Conforme observado em nossa análise originalos alto-falantes são um pouco silenciosos e não têm graves, embora os agudos sejam equilibrados. Há um conector de 3,5 mm para dispositivos de áudio externos.
Lenovo Legion Pro 5 16IAX10, RTX 5070 análise de áudio
(±) | o volume do alto-falante é médio, mas bom (###valor### dB)
Graves 100 - 315Hz
(-) | quase nenhum baixo - em média 20% menor que a mediana
(±) | a linearidade dos graves é média (9.3% delta para a frequência anterior)
Médios 400 - 2.000 Hz
(±) | médios mais altos - em média 6.1% maior que a mediana
(±) | a linearidade dos médios é média (7.9% delta para frequência anterior)
Altos 2 - 16 kHz
(+) | agudos equilibrados - apenas 2.2% longe da mediana
(+) | os máximos são lineares (6.3% delta da frequência anterior)
Geral 100 - 16.000 Hz
(±) | a linearidade do som geral é média (19.4% diferença em relação à mediana)
Comparado com a mesma classe
» 67% de todos os dispositivos testados nesta classe foram melhores, 7% semelhantes, 26% piores
» O melhor teve um delta de 6%, a média foi 18%, o pior foi 132%
Comparado com todos os dispositivos testados
» 48% de todos os dispositivos testados foram melhores, 7% semelhantes, 45% piores
» O melhor teve um delta de 4%, a média foi 23%, o pior foi 134%
Apple MacBook Pro 16 2021 M1 Pro análise de áudio
(+) | os alto-falantes podem tocar relativamente alto (###valor### dB)
Graves 100 - 315Hz
(+) | bons graves - apenas 3.8% longe da mediana
(+) | o baixo é linear (5.2% delta para a frequência anterior)
Médios 400 - 2.000 Hz
(+) | médios equilibrados - apenas 1.3% longe da mediana
(+) | médios são lineares (2.1% delta para frequência anterior)
Altos 2 - 16 kHz
(+) | agudos equilibrados - apenas 1.9% longe da mediana
(+) | os máximos são lineares (2.7% delta da frequência anterior)
Geral 100 - 16.000 Hz
(+) | o som geral é linear (4.6% diferença em relação à mediana)
Comparado com a mesma classe
» 0% de todos os dispositivos testados nesta classe foram melhores, 0% semelhantes, 100% piores
» O melhor teve um delta de 5%, a média foi 17%, o pior foi 45%
Comparado com todos os dispositivos testados
» 0% de todos os dispositivos testados foram melhores, 0% semelhantes, 100% piores
» O melhor teve um delta de 4%, a média foi 23%, o pior foi 134%
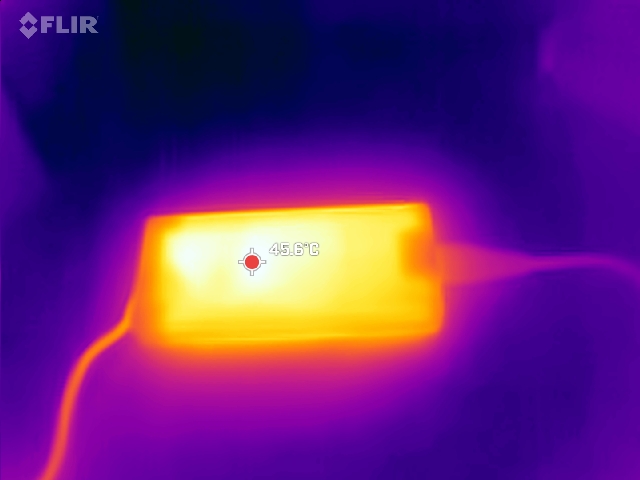
Consumo de energia
Como esperado, o consumo de energia é menor do que o da versão Ti da versão. Entre os concorrentes, o Legion Pro 5 ainda consome bastante durante os jogos, mas também está entre os de melhor desempenho.
A conexão de um monitor externo via DisplayPort/Thunderbolt mantém a RTX 5070 ativa, aumentando o consumo de energia em modo inativo.
| desligado | |
| Ocioso | |
| Carga |
|
Key:
min: | |
| Lenovo Legion Pro 5 16IAX10, RTX 5070 Ultra 7 255HX, GeForce RTX 5070 Laptop, SK Hynix HFS001TEJ9X115N, OLED, 2650x1600, 16" | Lenovo Legion 5 Pro 16IAX10H Ultra 9 275HX, GeForce RTX 5070 Ti Laptop, Western Digital PC SN8000S SDEPNRK-1T00, OLED, 2560x1600, 16" | Alienware 16X Aurora, RTX 5070 Ultra 9 275HX, GeForce RTX 5070 Laptop, , IPS, 2560x1600, 16" | Gigabyte Aero X16 1WH Ryzen AI 7 350, GeForce RTX 5070 Laptop, Kingston OM8PGP41024Q-A0, IPS, 2560x1600, 16" | Asus TUF Gaming A16 FA608UP R7 260, GeForce RTX 5070 Laptop, Western Digital PC SN5000S SDEQNSJ-1T00, IPS, 2560x1600, 16" | Schenker XMG Core 16 M25 Ryzen AI 9 HX 370, GeForce RTX 5070 Laptop, Samsung 990 Pro 2 TB MZVL72T0HDLB, IPS, 2560x1600, 16" | Gigabyte Gaming A16 GA6H i7-13620H, GeForce RTX 5070 Laptop, Kingston OM8PGP41024Q-A0, IPS, 2560x1600, 16" | Média NVIDIA GeForce RTX 5070 Laptop | Média da turma Gaming | |
|---|---|---|---|---|---|---|---|---|---|
| Power Consumption | -24% | -40% | 34% | 26% | 10% | 20% | -5% | -23% | |
| Idle Minimum * (Watt) | 10.6 | 14 -32% | 20.1 -90% | 5.8 45% | 4.6 57% | 7.4 30% | 9 15% | 10.8 ? -2% | 13 ? -23% |
| Idle Average * (Watt) | 12.3 | 14.3 -16% | 27.6 -124% | 10.9 11% | 9.8 20% | 14.9 -21% | 11 11% | 15.4 ? -25% | 18.7 ? -52% |
| Idle Maximum * (Watt) | 18.6 | 20.1 -8% | 31.8 -71% | 11.2 40% | 10.2 45% | 15.2 18% | 23 -24% | 21 ? -13% | 24.3 ? -31% |
| Load Average * (Watt) | 104 | 177 -70% | 102.7 1% | 91.3 12% | 76.1 27% | 100.8 3% | 91 12% | 98.7 ? 5% | 110.2 ? -6% |
| Cyberpunk 2077 ultra * (Watt) | 231 | 255 -10% | 217 6% | 123.8 46% | 198.9 14% | 184.8 20% | 132.5 43% | ||
| Cyberpunk 2077 ultra external monitor * (Watt) | 227 | 255 -12% | 192.3 15% | 117.9 48% | 198.1 13% | 181.4 20% | 130 43% | ||
| Load Maximum * (Watt) | 248 | 294 -19% | 292 -18% | 155.3 37% | 235.2 5% | 251.1 -1% | 155 37% | 218 ? 12% | 258 ? -4% |
* ... menor é melhor
Consumo de energia Cyberpunk / teste de estresse
Consumo de energia com monitor externo
Duração da bateria
A bateria de 80 Wh permanece inalterada. O laptop dura cerca de 6 horas em nossos testes de Wi-Fi e reprodução de vídeo, aproximadamente uma hora a mais do que o modelo Modelo Ti.
| Lenovo Legion Pro 5 16IAX10, RTX 5070 Ultra 7 255HX, GeForce RTX 5070 Laptop, 80 Wh | Lenovo Legion 5 Pro 16IAX10H Ultra 9 275HX, GeForce RTX 5070 Ti Laptop, 80 Wh | Alienware 16X Aurora, RTX 5070 Ultra 9 275HX, GeForce RTX 5070 Laptop, 96 Wh | Gigabyte Aero X16 1WH Ryzen AI 7 350, GeForce RTX 5070 Laptop, 76 Wh | Asus TUF Gaming A16 FA608UP R7 260, GeForce RTX 5070 Laptop, 90 Wh | Schenker XMG Core 16 M25 Ryzen AI 9 HX 370, GeForce RTX 5070 Laptop, 99.8 Wh | Gigabyte Gaming A16 GA6H i7-13620H, GeForce RTX 5070 Laptop, 76 Wh | Média da turma Gaming | |
|---|---|---|---|---|---|---|---|---|
| Duração da bateria | -16% | -31% | 39% | 110% | 76% | 24% | 13% | |
| H.264 (h) | 6.1 | 4.8 -21% | 8.64 ? 42% | |||||
| WiFi v1.3 (h) | 6.2 | 4.9 -21% | 4.3 -31% | 8.6 39% | 13 110% | 10.9 76% | 7.7 24% | 7.11 ? 15% |
| Load (h) | 1.8 | 1.7 -6% | 1.502 ? -17% |
Impressões gerais do Notebookcheck
Mesmo com a RTX 5070 não Ti, o Lenovo Legion Pro 5 16 é um poderoso laptop para jogos - e por 500-700 euros a menos do que a variante Ti, é um negócio muito atraente.
Lenovo Legion Pro 5 16IAX10, RTX 5070
- 10/22/2025 v8
Christian Hintze
 Total Sustainability Score:
 Alternativas potenciais em comparação
Imagem | Modelo / Análises | Preço | Peso | Altura | Tela |
|---|---|---|---|---|---|
1. 86.2%  | Lenovo Legion Pro 5 16IAX10, RTX 5070 Intel Core Ultra 7 255HX ⎘ NVIDIA GeForce RTX 5070 Laptop ⎘ 32 GB Memória, 1024 GB SSD | Amazon: Preço de tabela: 1800 Euro | 2.3 kg | 25.95 mm | 16.00" 2650x1600 189 PPI OLED |
2. 84.5%  | Lenovo Legion 5 Pro 16IAX10H Intel Core Ultra 9 275HX ⎘ NVIDIA GeForce RTX 5070 Ti Laptop ⎘ 32 GB Memória, 1024 GB SSD | Amazon: 1. $2,999.00 Lenovo Legion Pro 5i Gen 10 ... 2. $3,450.00 Lenovo Legion Pro 7 16IAX10H... 3. $1,749.00 Lenovo Legion 5 16" WQXGA 24... Preço de tabela: 2500 Euro | 2.4 kg | 25.95 mm | 16.00" 2560x1600 189 PPI OLED |
3. 84.9%  | Alienware 16X Aurora, RTX 5070 Intel Core Ultra 9 275HX ⎘ NVIDIA GeForce RTX 5070 Laptop ⎘ 32 GB Memória | Amazon: Preço de tabela: 1800 USD | 2.5 kg | 23.4 mm | 16.00" 2560x1600 189 PPI IPS |
4. 83.7%  | Gigabyte Aero X16 1WH AMD Ryzen AI 7 350 ⎘ NVIDIA GeForce RTX 5070 Laptop ⎘ 32 GB Memória, 1024 GB SSD | Amazon: Preço de tabela: 1799€ | 2 kg | 19.9 mm | 16.00" 2560x1600 189 PPI IPS |
5. 83.8%  | Asus TUF Gaming A16 FA608UP AMD Ryzen 7 260 ⎘ NVIDIA GeForce RTX 5070 Laptop ⎘ 32 GB Memória, 1024 GB SSD | Amazon: Preço de tabela: 2199€ | 2.2 kg | 25.7 mm | 16.00" 2560x1600 189 PPI IPS |
6. 86.2%  | Schenker XMG Core 16 M25 AMD Ryzen AI 9 HX 370 ⎘ NVIDIA GeForce RTX 5070 Laptop ⎘ 64 GB Memória, 2048 GB SSD | Amazon: Preço de tabela: 2100€ | 2.1 kg | 23 mm | 16.00" 2560x1600 189 PPI IPS |
7. 80.1%  | Gigabyte Gaming A16 GA6H Intel Core i7-13620H ⎘ NVIDIA GeForce RTX 5070 Laptop ⎘ 16 GB Memória, 1024 GB SSD | Amazon: 1. $1,091.55 GIGABYTE - Gaming A16 Gaming... 2. $1,067.59 GIGABYTE - Gaming A16 Gaming... 3. $1,221.98 GIGABYTE - Gaming A16 Gaming... Preço de tabela: 1700 EUR | 2.3 kg | 23 mm | 16.00" 2560x1600 189 PPI IPS |
Transparência
A seleção dos dispositivos a serem analisados é feita pela nossa equipe editorial. A amostra de teste foi fornecida ao autor como empréstimo pelo fabricante ou varejista para fins desta revisão. O credor não teve influência nesta revisão, nem o fabricante recebeu uma cópia desta revisão antes da publicação. Não houve obrigação de publicar esta revisão. Como empresa de mídia independente, a Notebookcheck não está sujeita à autoridade de fabricantes, varejistas ou editores.
É assim que o Notebookcheck está testando
Todos os anos, o Notebookcheck analisa de forma independente centenas de laptops e smartphones usando procedimentos padronizados para garantir que todos os resultados sejam comparáveis. Desenvolvemos continuamente nossos métodos de teste há cerca de 20 anos e definimos padrões da indústria no processo. Em nossos laboratórios de teste, equipamentos de medição de alta qualidade são utilizados por técnicos e editores experientes. Esses testes envolvem um processo de validação em vários estágios. Nosso complexo sistema de classificação é baseado em centenas de medições e benchmarks bem fundamentados, o que mantém a objetividade.
