Análise do laptop Razer Blade 16 (2024): Agora com Samsung OLED super-rápido

O que há de novo no Razer Blade em relação ao seu antecessor do ano passado? Em resumo: WiFi 7, Intel Gen 14 e uma tela OLED. Este último é o que a Razer anuncia como sua grande novidade. Mesmo assim, as já excelentes opções de Mini-LED do modelo anterior foram mantidas, o que significa que agora o senhor pode escolher entre OLED e Mini-LED. Portanto, nesta análise, analisaremos de perto a tela do notebook em particular. Além disso, verificaremos o desempenho que a Intel Gen 14 pode oferecer dentro do Blade 16 em comparação com a Gen 13.
Nosso Razer Blade 16 2024 competirá com outros gamers de 16 polegadas com uma RTX 4090, principalmente com o carro-chefe da Lenovo Legion 9i Gen 8 16IRX8- mas também com o Schenker XMG Neo 16 E23 e o Asus ROG Zephyrus M16. E, é claro, também o compararemos com seu antecessor Revisão Razer Blade 16 Early 2023 RTX 4090: Núcleo da besta i9-13950HX com o primeiro visor de modo dual mini-LED UHD+ do mundo com a CPU Gen-13-HX e a RTX 4090. Para ter pelo menos um laptop com uma nova CPU Gen-14 no campo de comparação, também o compararemos com o Lenovo Legion 5i 16 G9 com o i7-14650HX.
Possíveis concorrentes em comparação
Avaliação | Data | Modelo | Peso | Altura | Size | Resolução | Preço |
|---|---|---|---|---|---|---|---|
| 91.1 % v7 (old) | 02/2024 | Razer Blade 16 2024, RTX 4090 i9-14900HX, GeForce RTX 4090 Laptop GPU | 2.5 kg | 22 mm | 16.00" | 2560x1600 | |
| 89.8 % v7 (old) | 03/2023 | Razer Blade 16 Early 2023 RTX 4090 i9-13950HX, GeForce RTX 4090 Laptop GPU | 2.5 kg | 21.99 mm | 16.00" | 3840x2400 | |
| 90.2 % v7 (old) | 10/2023 | Lenovo Legion 9 16IRX8 i9-13980HX, GeForce RTX 4090 Laptop GPU | 2.6 kg | 22.7 mm | 16.00" | 3200x2000 | |
| 87.7 % v7 (old) | 04/2023 | Schenker XMG Neo 16 E23 i9-13900HX, GeForce RTX 4090 Laptop GPU | 2.5 kg | 29.9 mm | 16.00" | 2560x1600 | |
| 89.1 % v7 (old) | 02/2024 | Lenovo Legion 5 16IRX G9 i7-14650HX, GeForce RTX 4060 Laptop GPU | 2.4 kg | 25.2 mm | 16.00" | 2560x1600 |
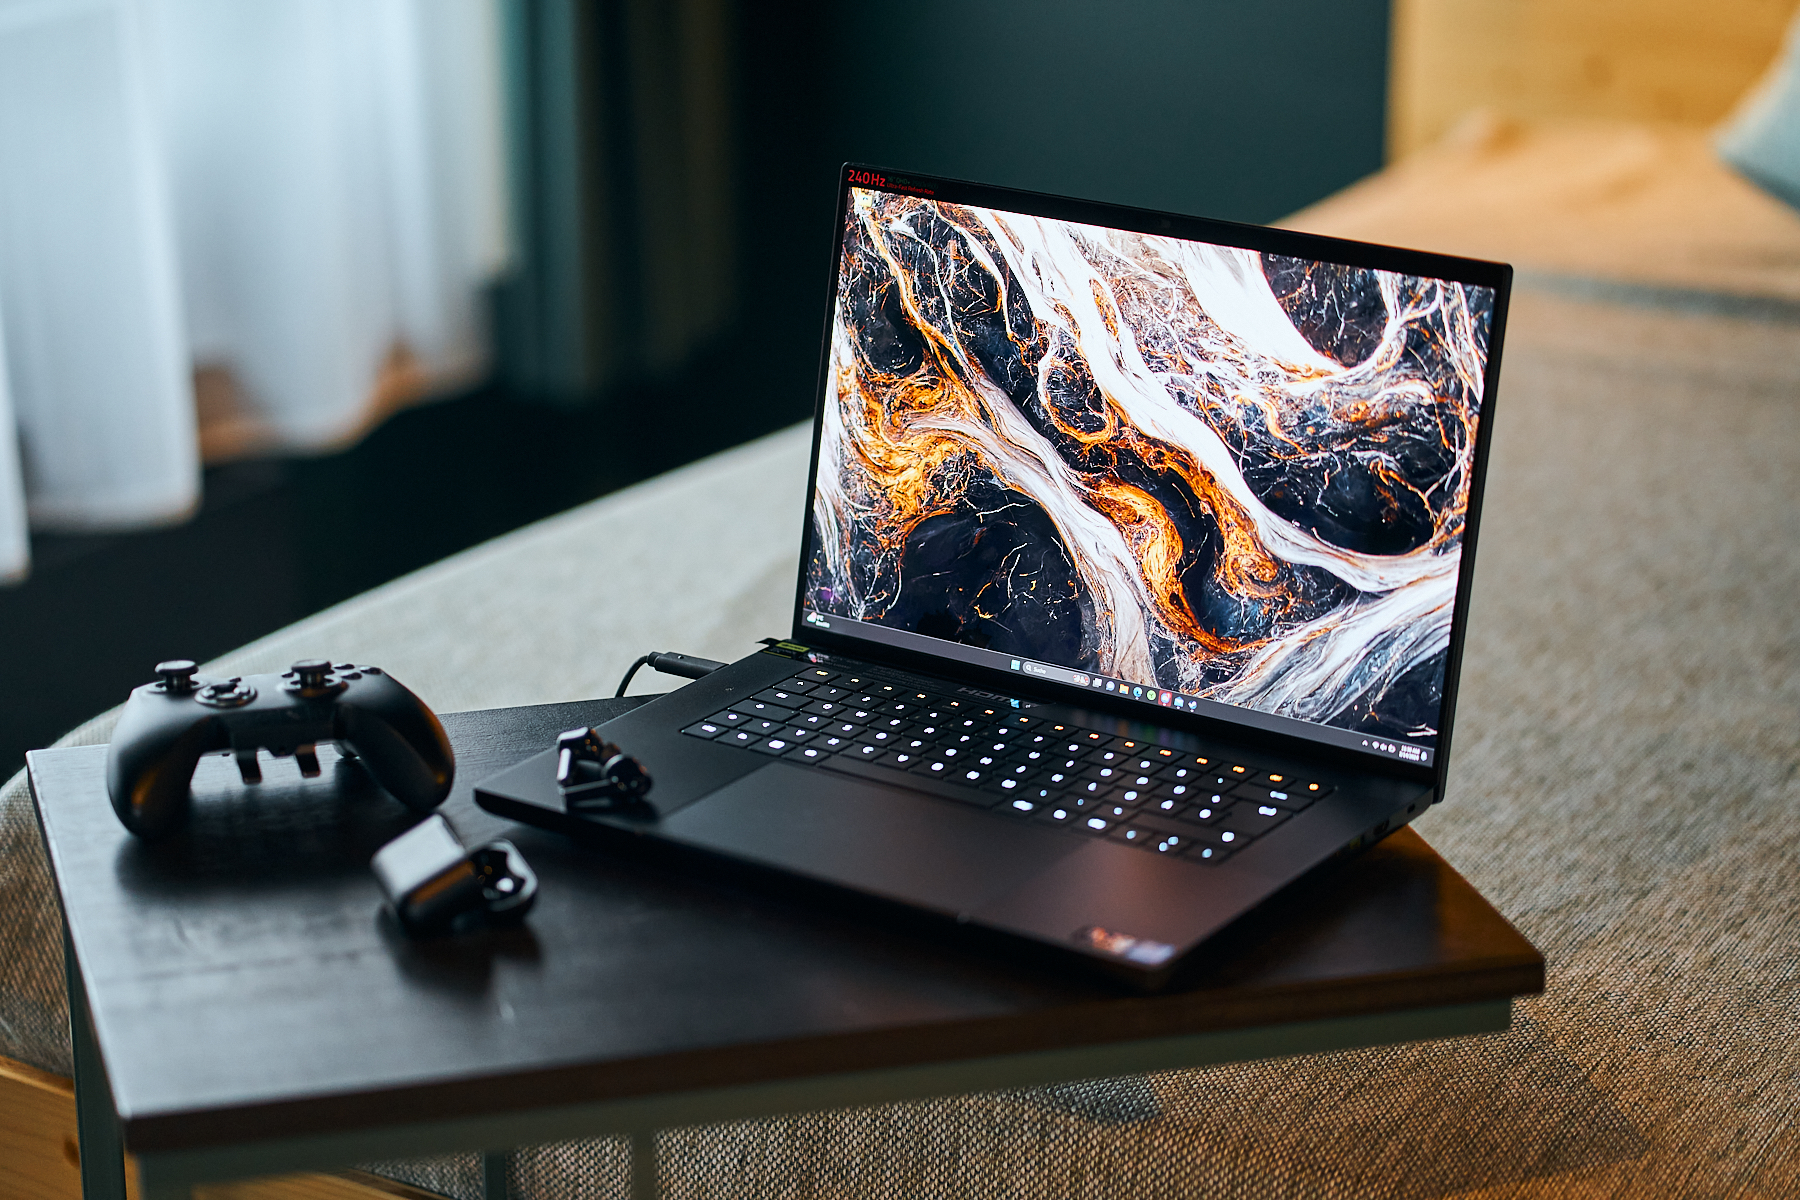
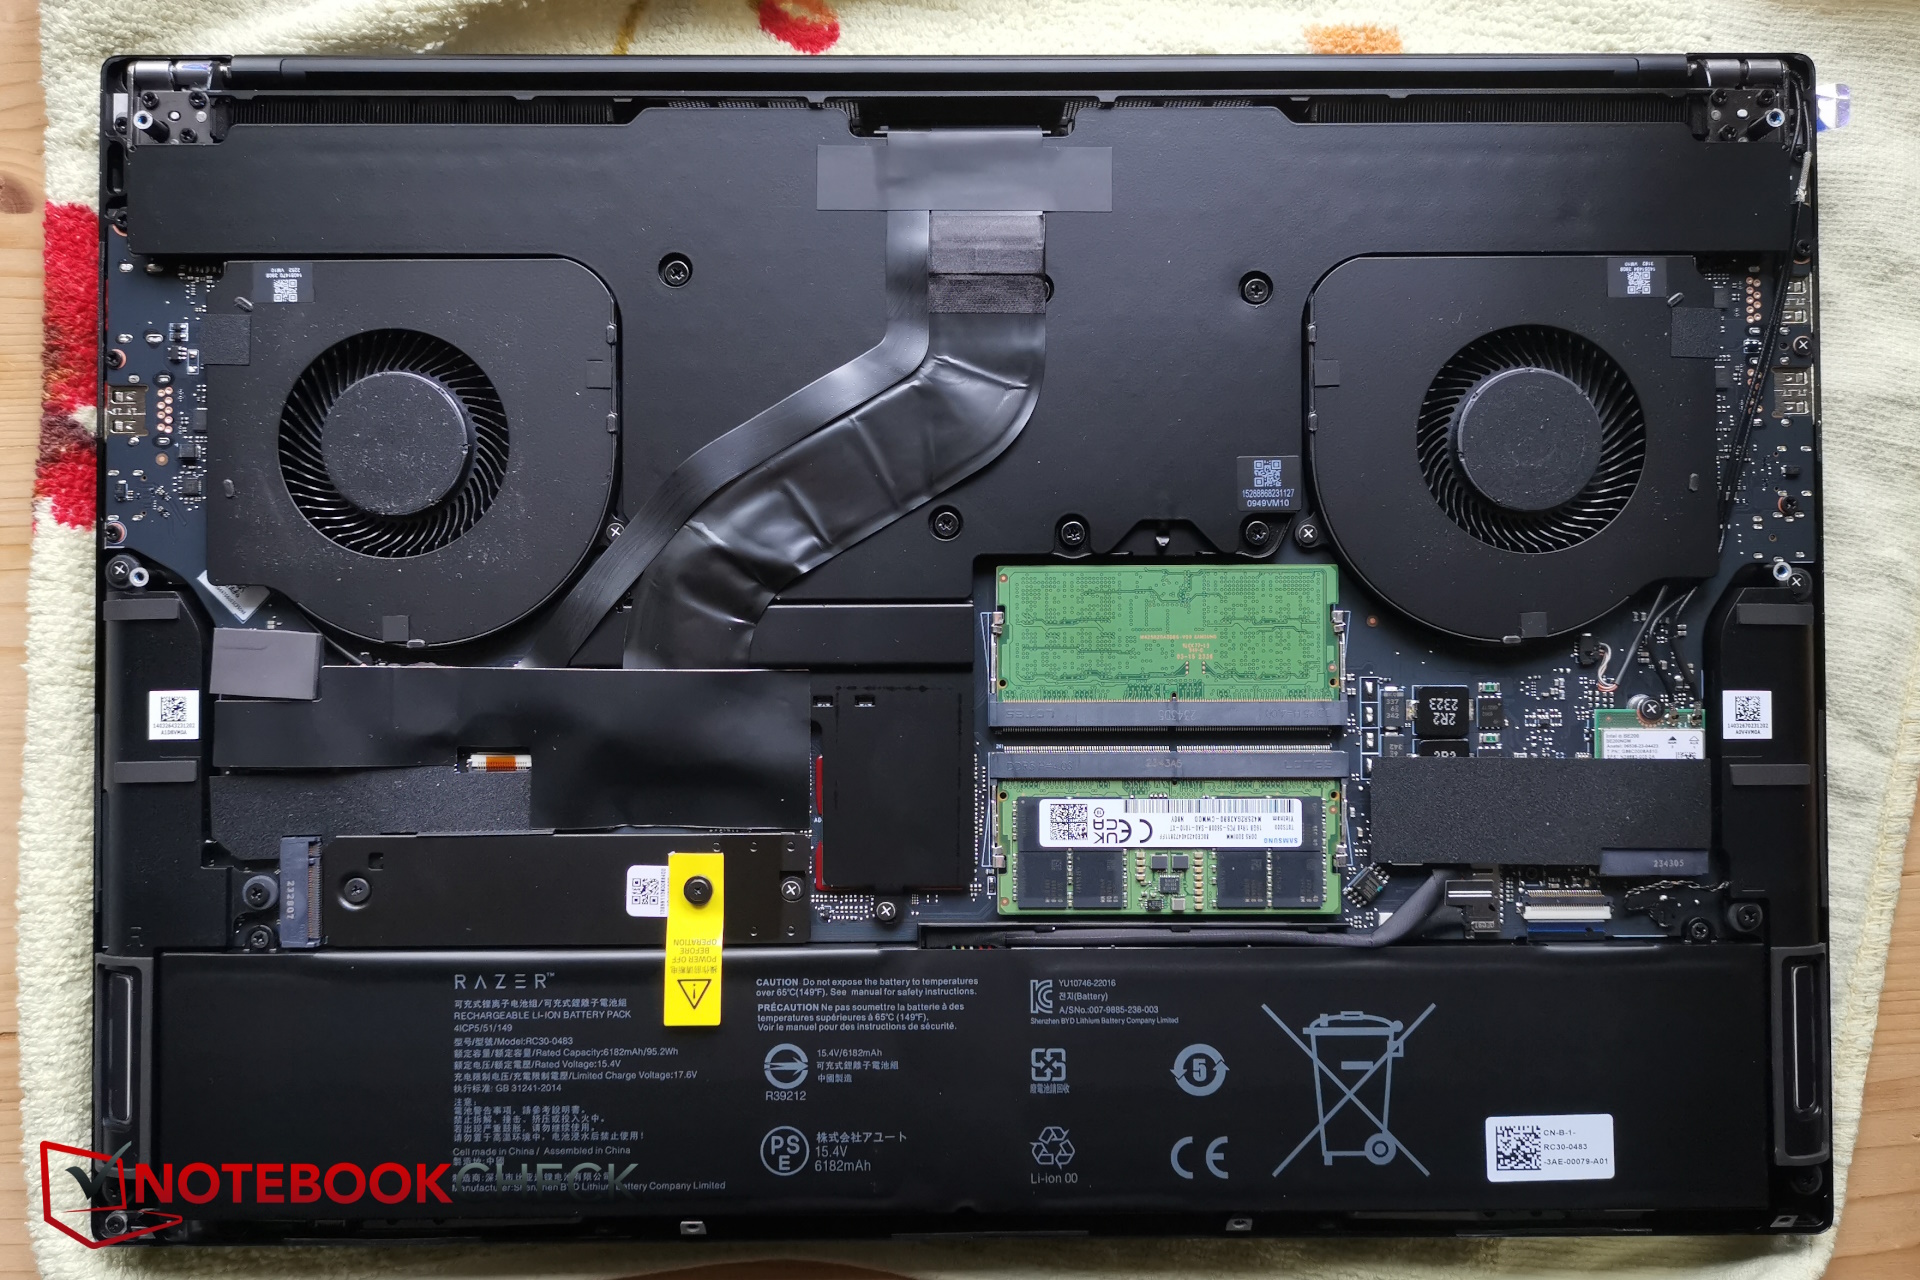
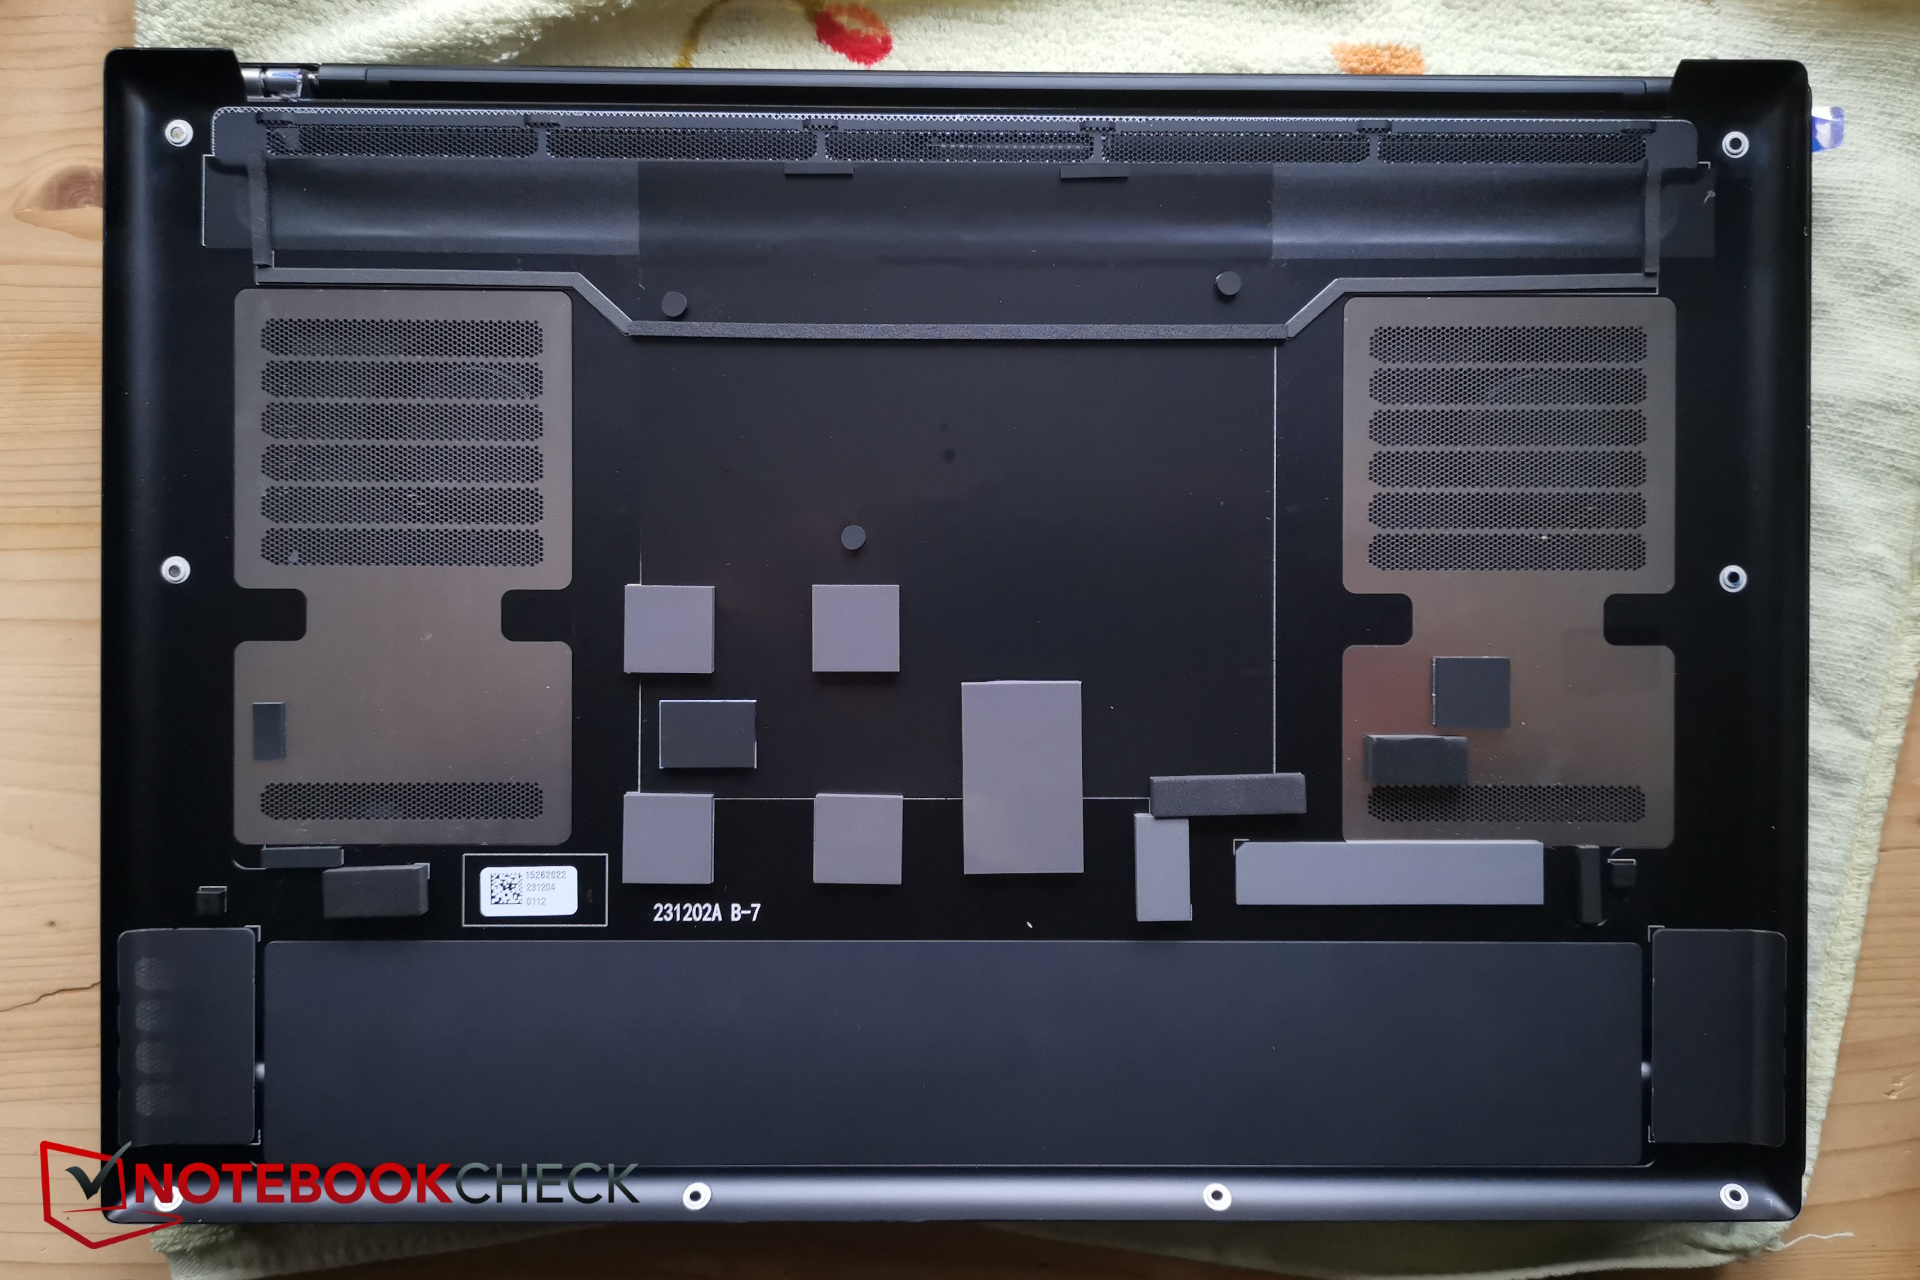
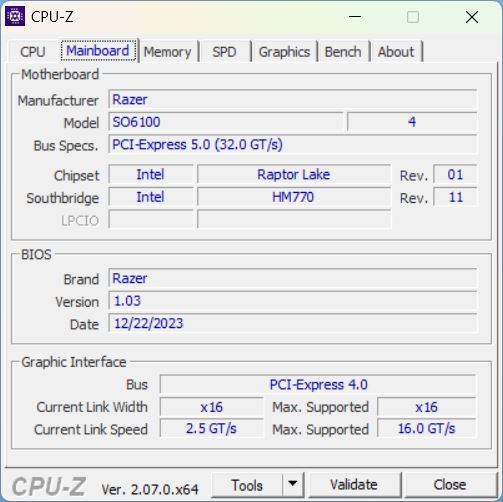
Case e conectividade - Monobloco de metal com uma placa de titânio
Praticamente nada mudou em relação ao gabinete do laptop - o hardware continua alojado em um gabinete monobloco de alumínio e uma placa de titânio fica na frente da base para aumentar sua resistência. O gabinete e o teclado continuam a ser verdadeiros ímãs de impressões digitais.
No entanto, houve uma mudança: agora o senhor pode optar pela edição "Mercury" do Blade, que apresenta um design leve.
Mais informações sobre o case do dispositivo, a conectividade e os dispositivos de entrada podem ser encontradas em nossas análises dos modelos 2023.


| SD Card Reader | |
| average JPG Copy Test (av. of 3 runs) | |
| Razer Blade 16 Early 2023 RTX 4090 (Angelbird AV PRO 128 GB V60) | |
| Razer Blade 16 2024, RTX 4090 | |
| Média da turma Gaming (20.9 - 210, n=54, últimos 2 anos) | |
| Lenovo Legion 9 16IRX8 (Toshiba Exceria Pro SDXC 64 GB UHS-II) | |
| Schenker XMG Neo 16 E23 (AV PRO microSD 128 GB V60) | |
| Lenovo Legion 5 16IRX G9 | |
| maximum AS SSD Seq Read Test (1GB) | |
| Razer Blade 16 Early 2023 RTX 4090 (Angelbird AV PRO 128 GB V60) | |
| Razer Blade 16 2024, RTX 4090 | |
| Média da turma Gaming (25.5 - 261, n=51, últimos 2 anos) | |
| Lenovo Legion 9 16IRX8 (Toshiba Exceria Pro SDXC 64 GB UHS-II) | |
| Schenker XMG Neo 16 E23 (AV PRO microSD 128 GB V60) | |
| Lenovo Legion 5 16IRX G9 | |


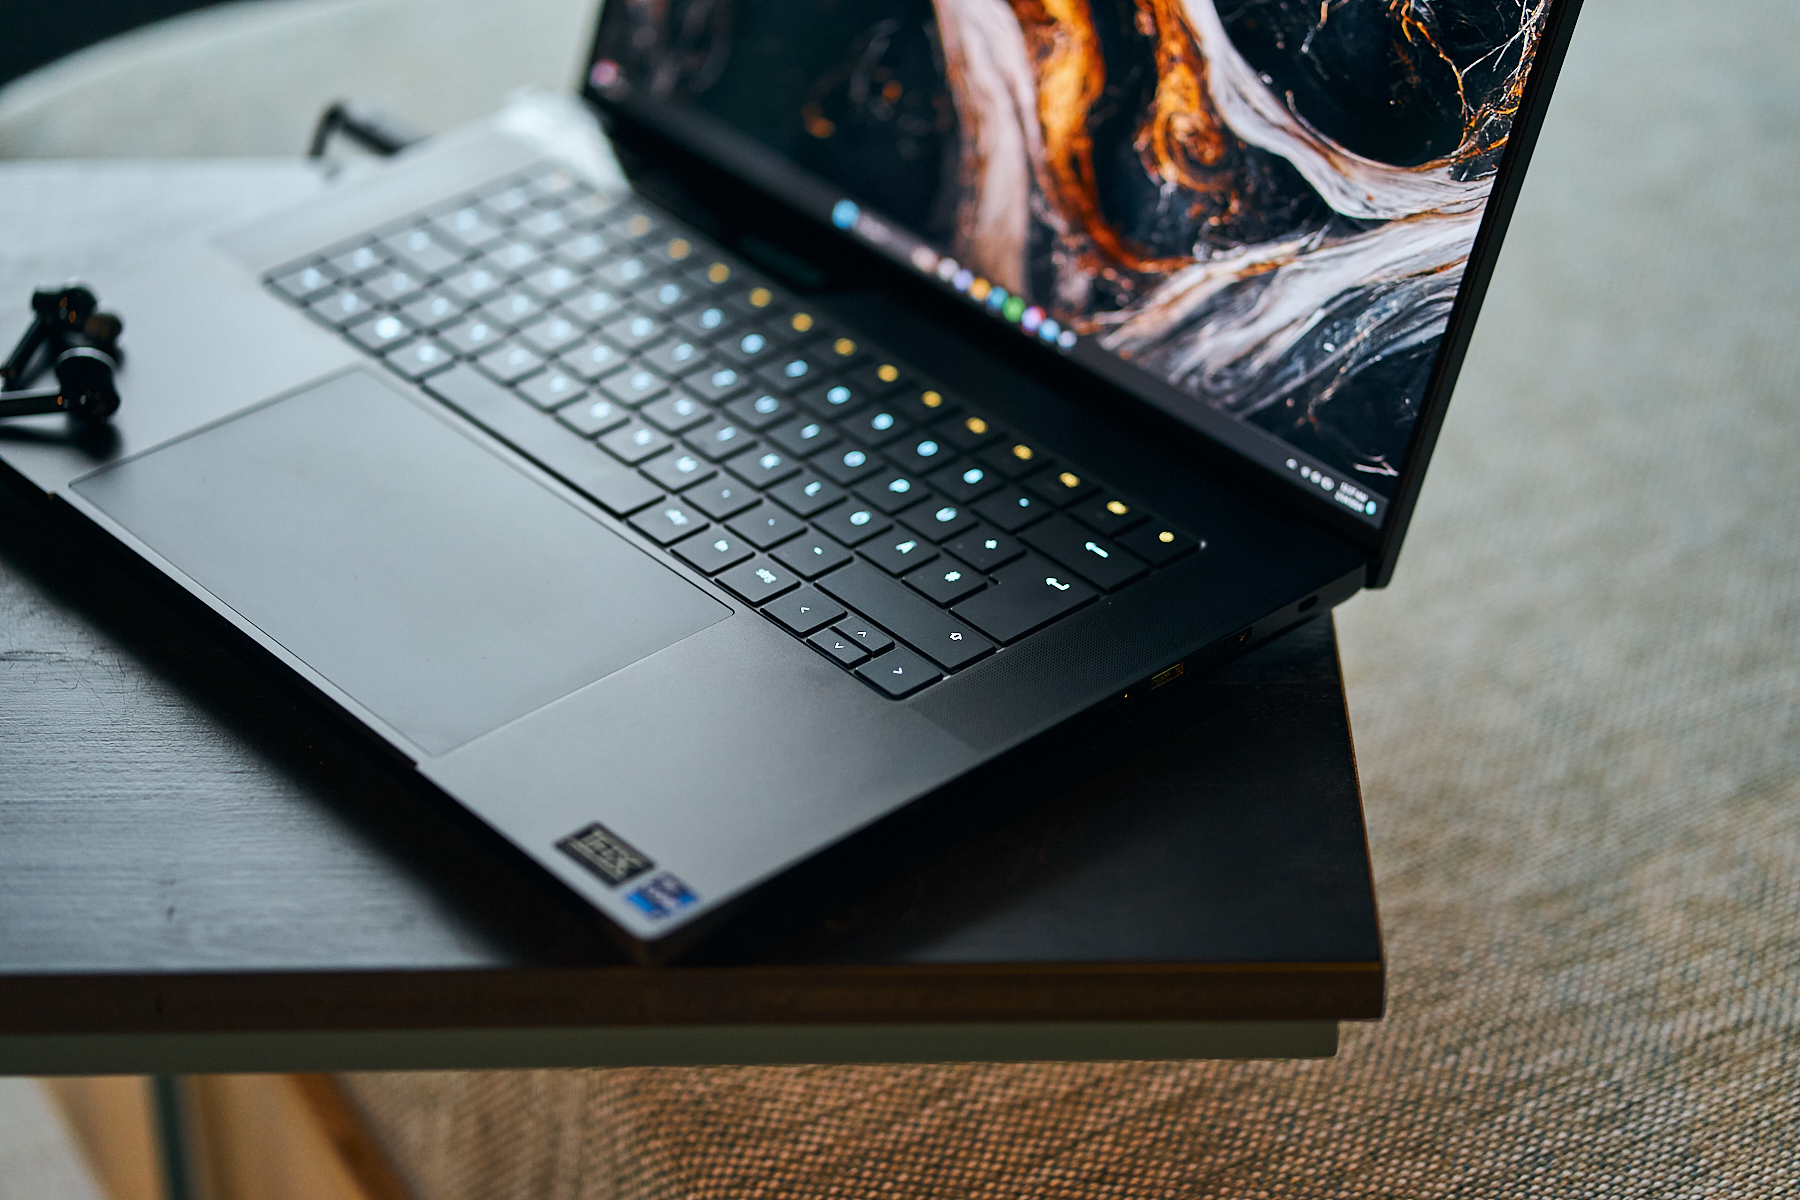
Dispositivos de entrada - O touchpad é quase grande demais?
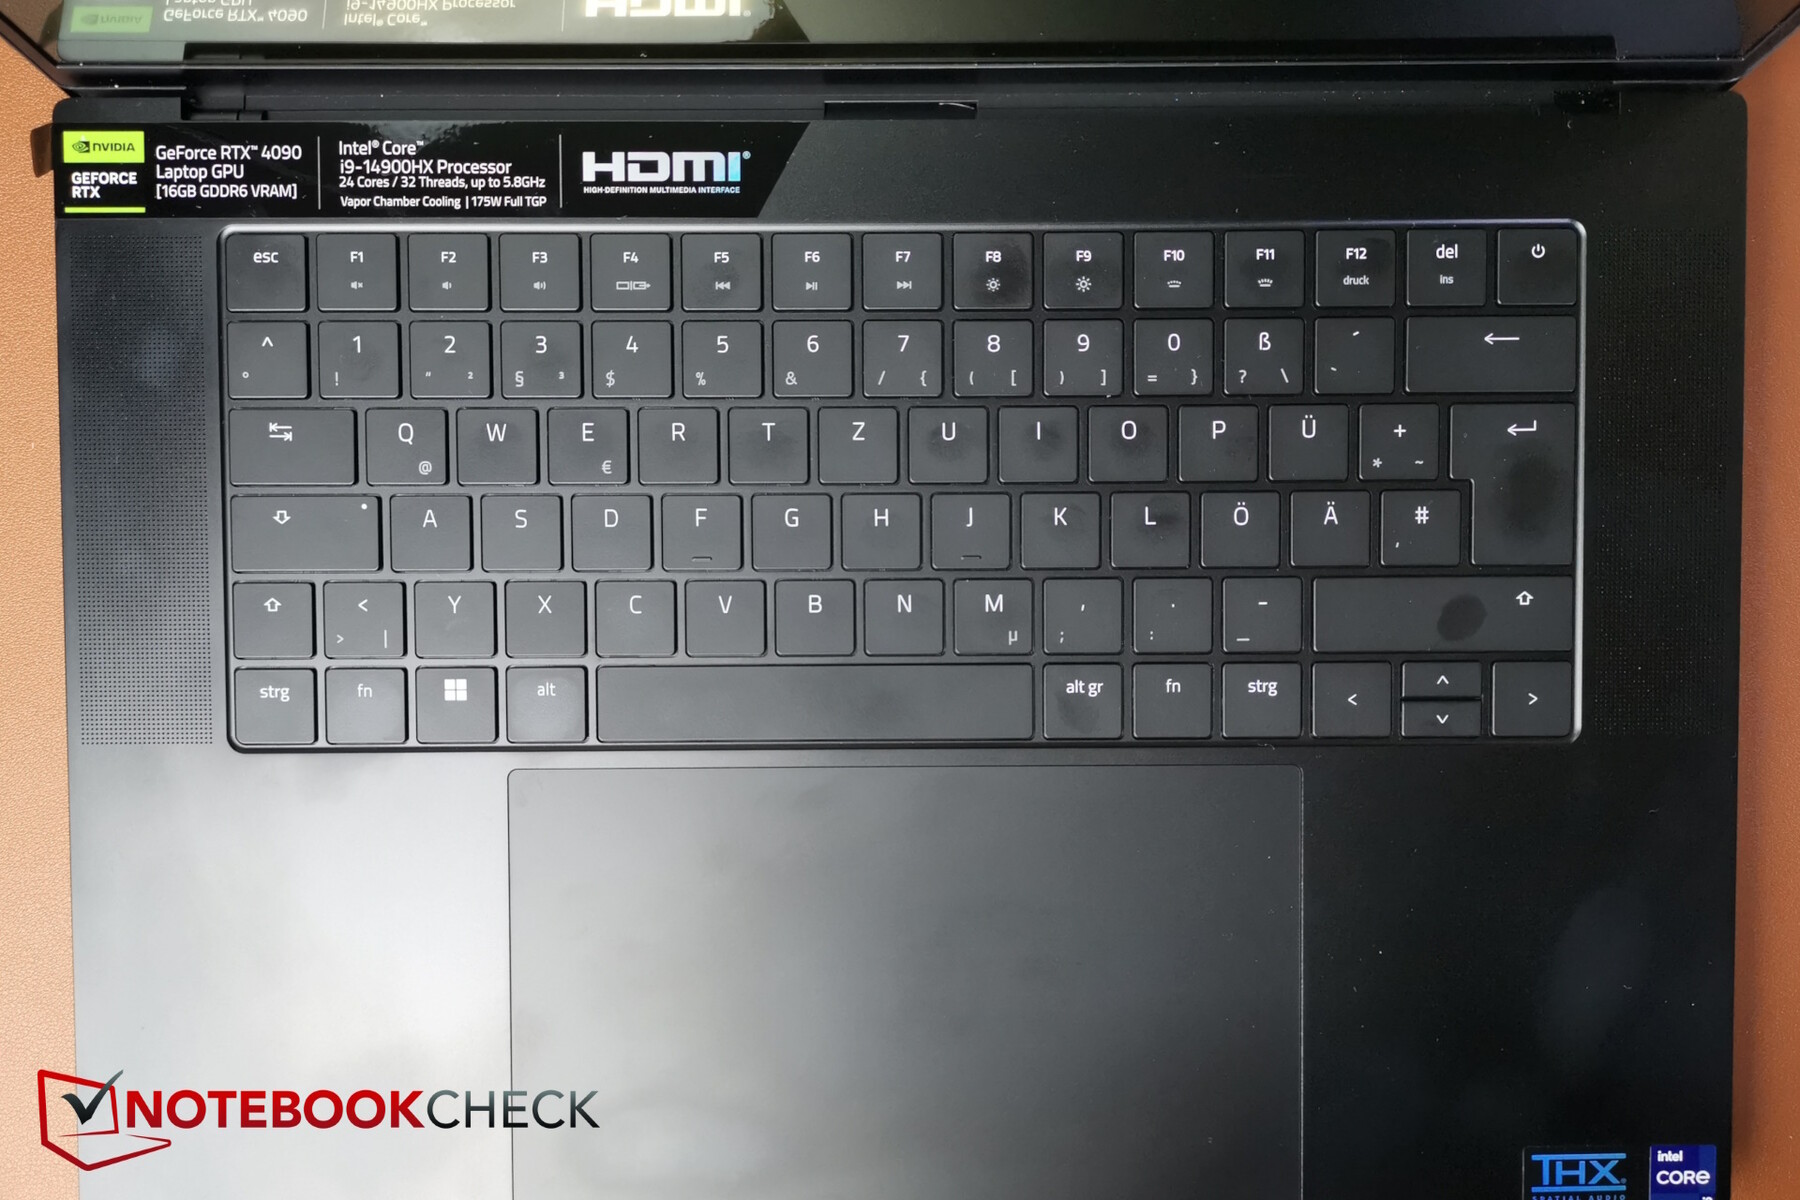
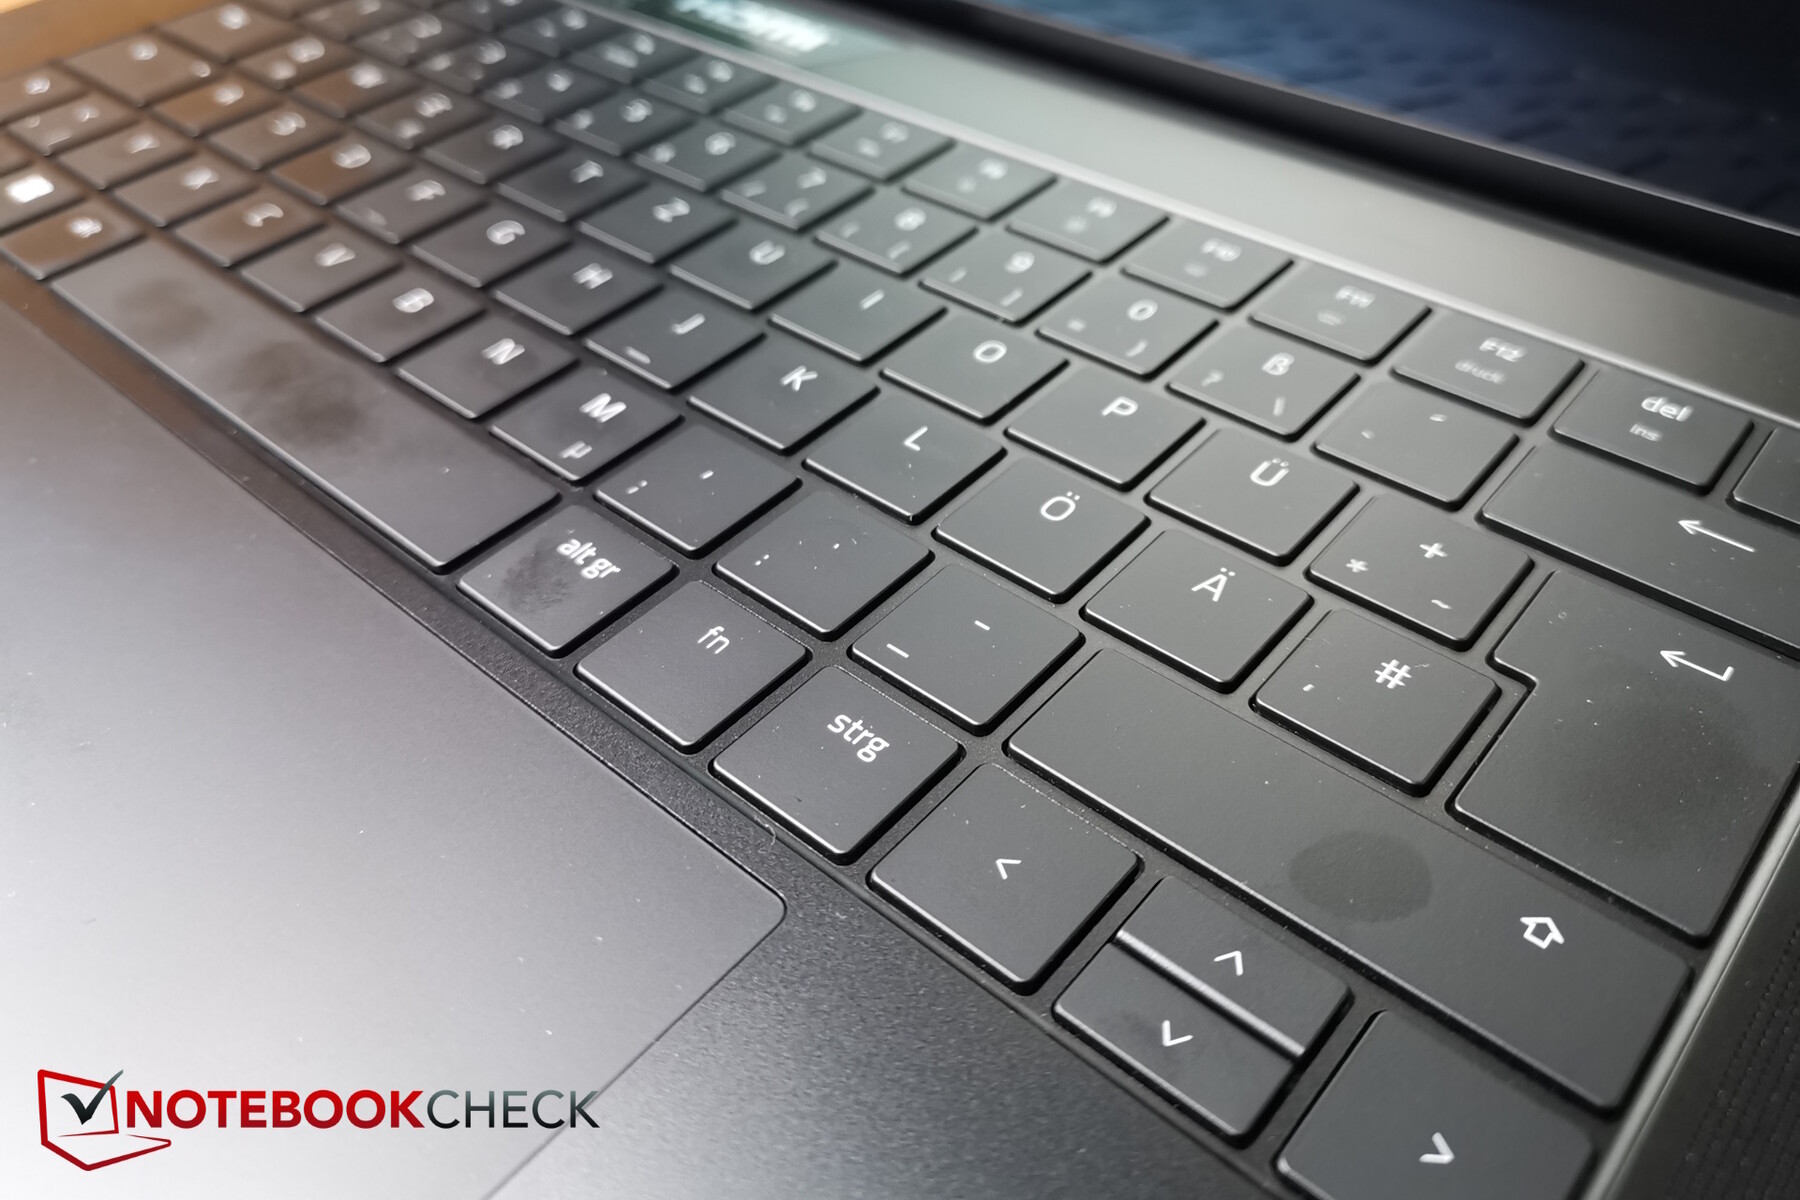
As teclas de membrana do laptop são bem grandes e têm um pequeno espaço entre elas. Por sua vez, a Razer decidiu não instalar um teclado numérico.
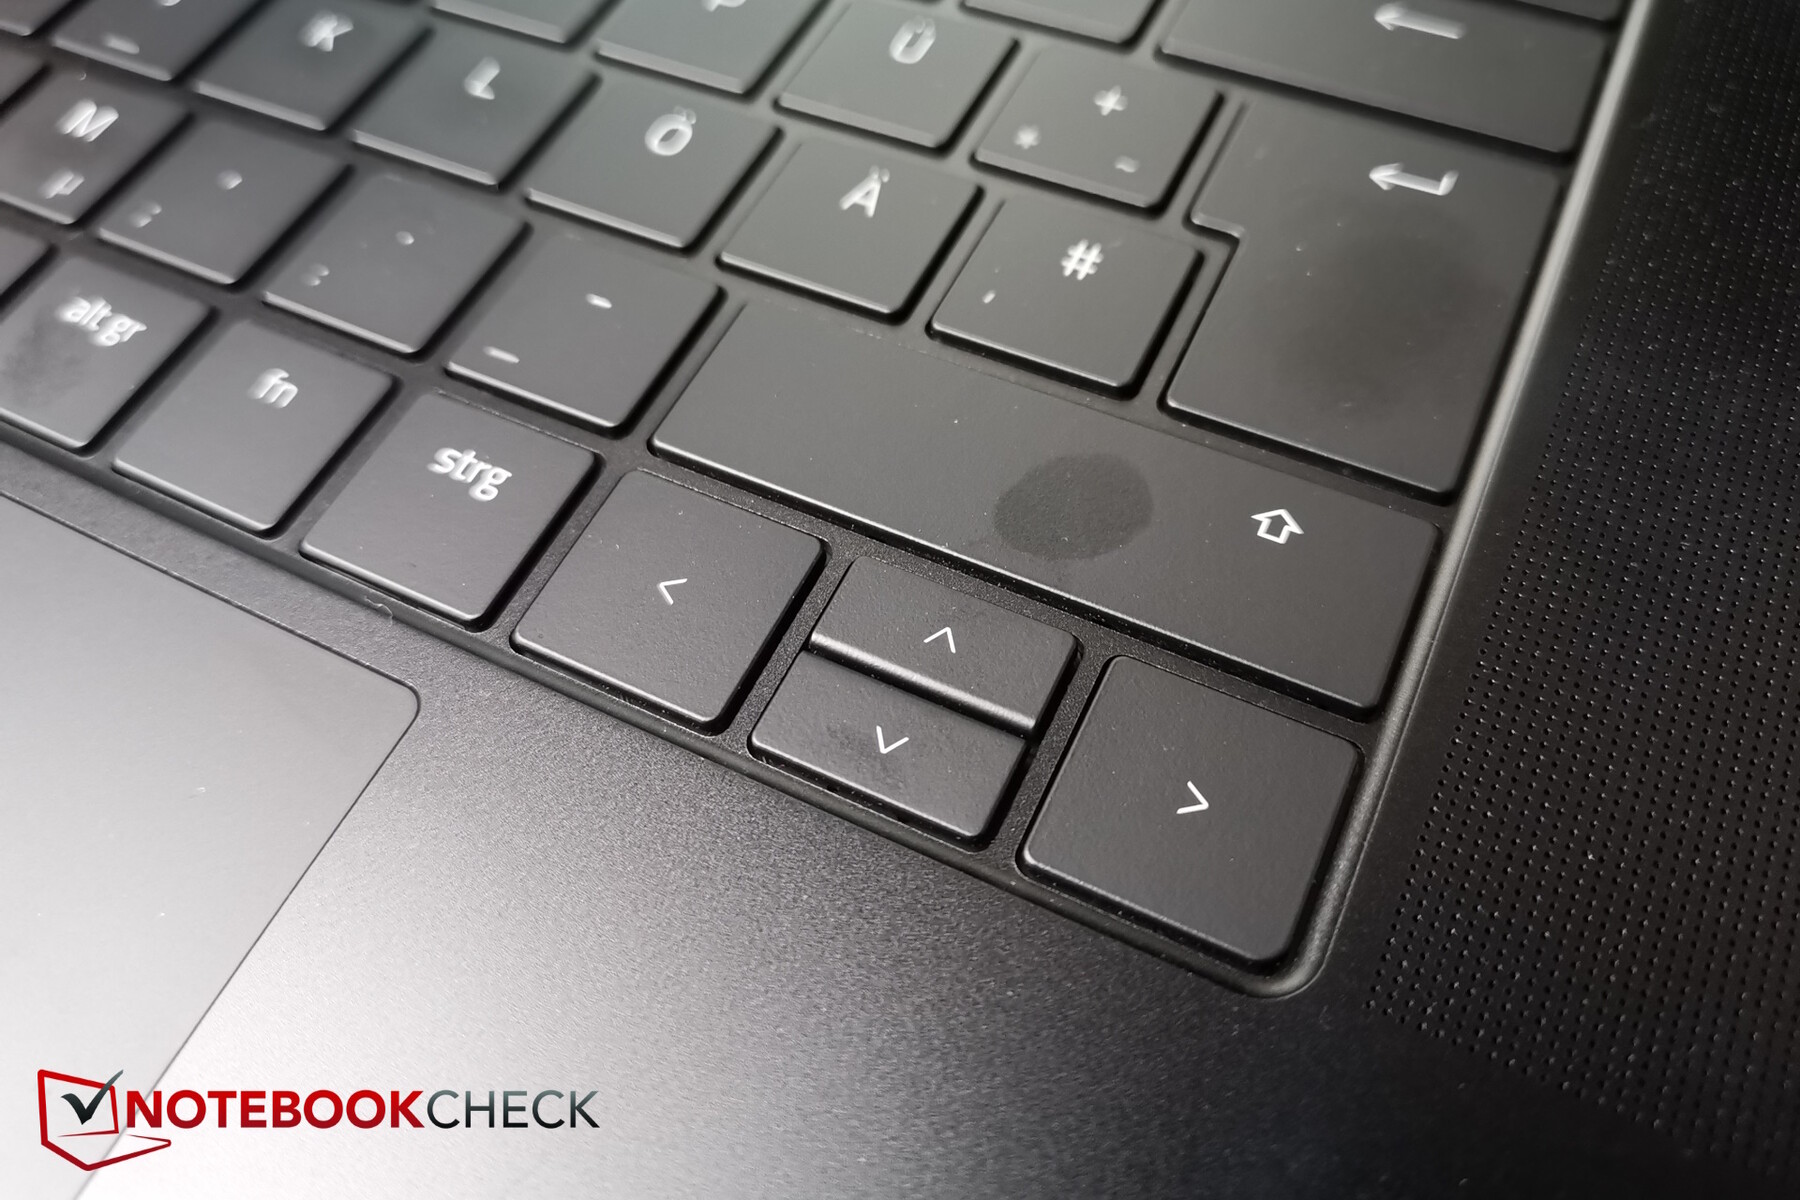
A elevação das teclas é de curta a média e o feedback é decente. Infelizmente, as teclas de seta para cima/para baixo têm a altura reduzida pela metade, mas, fora isso, o layout é agradável e espaçoso.
A iluminação de fundo RGB por botão (Razer Chroma) pode ser amplamente configurada por meio do aplicativo Synapse, como é típico da Razer.
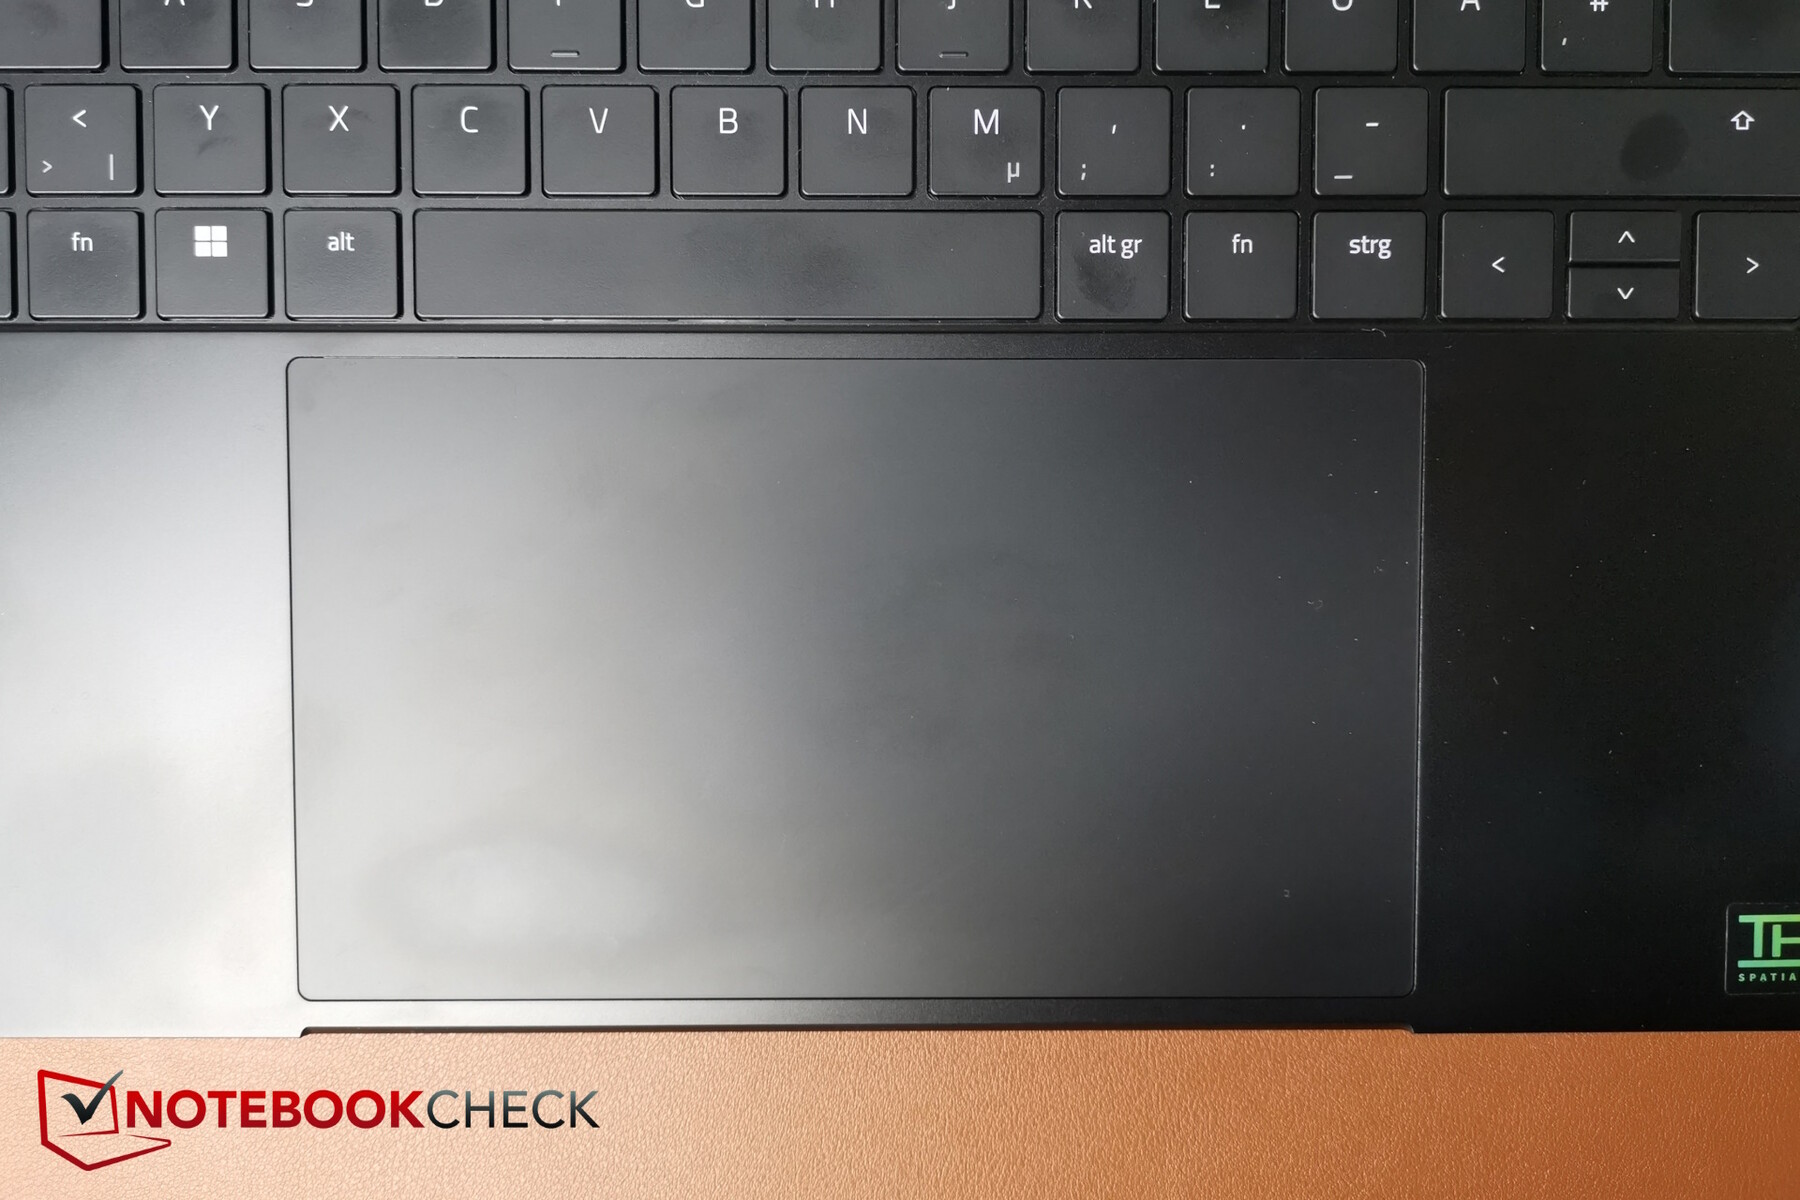
O touchpad é enorme! Tão grande que os apoios para as mãos ao lado dele quase parecem pequenos demais. Isso às vezes faz com que as entradas do touchpad falhem porque sua mão tocou acidentalmente o pad quando o senhor estava simplesmente apoiando-o na lateral. Menos teria sido melhor nesse aspecto.
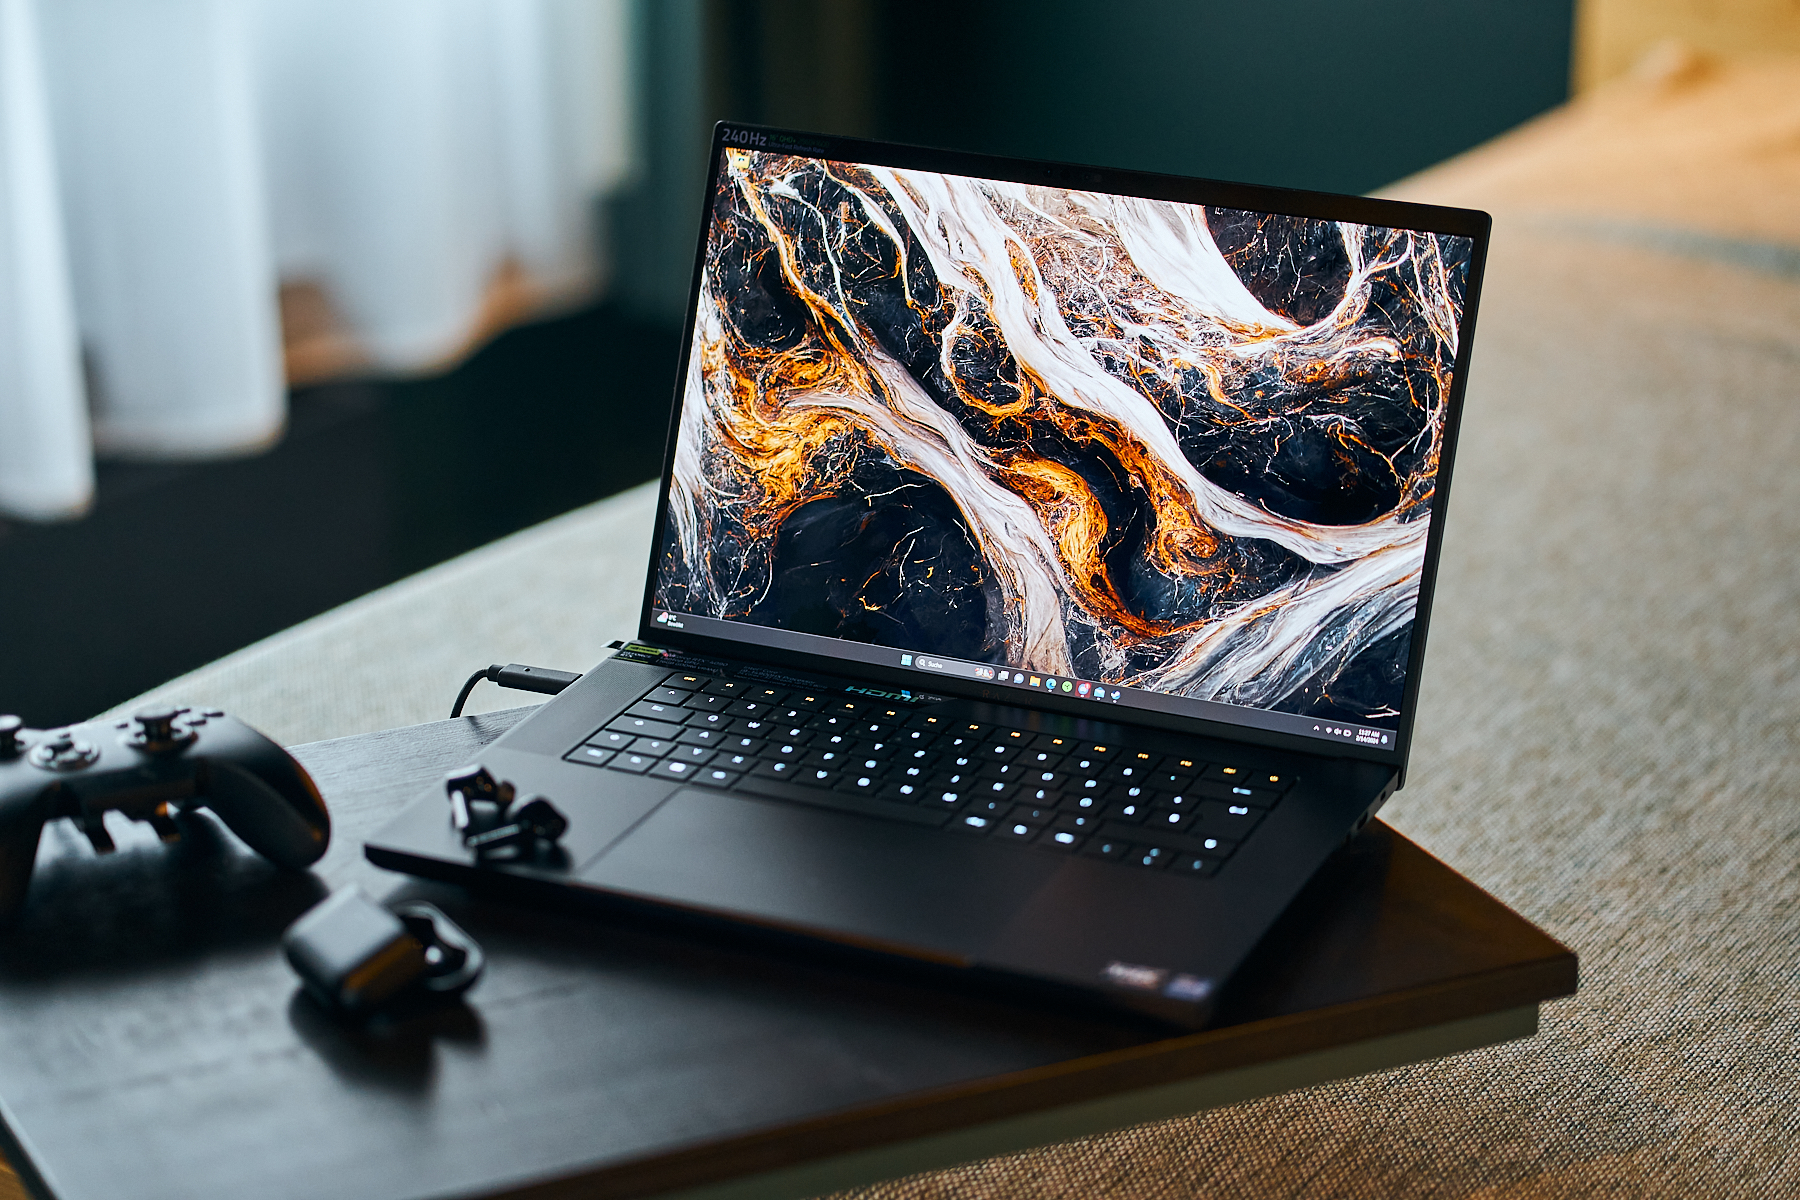
Tela - O Blade 16 com OLED ou Mini-LED?
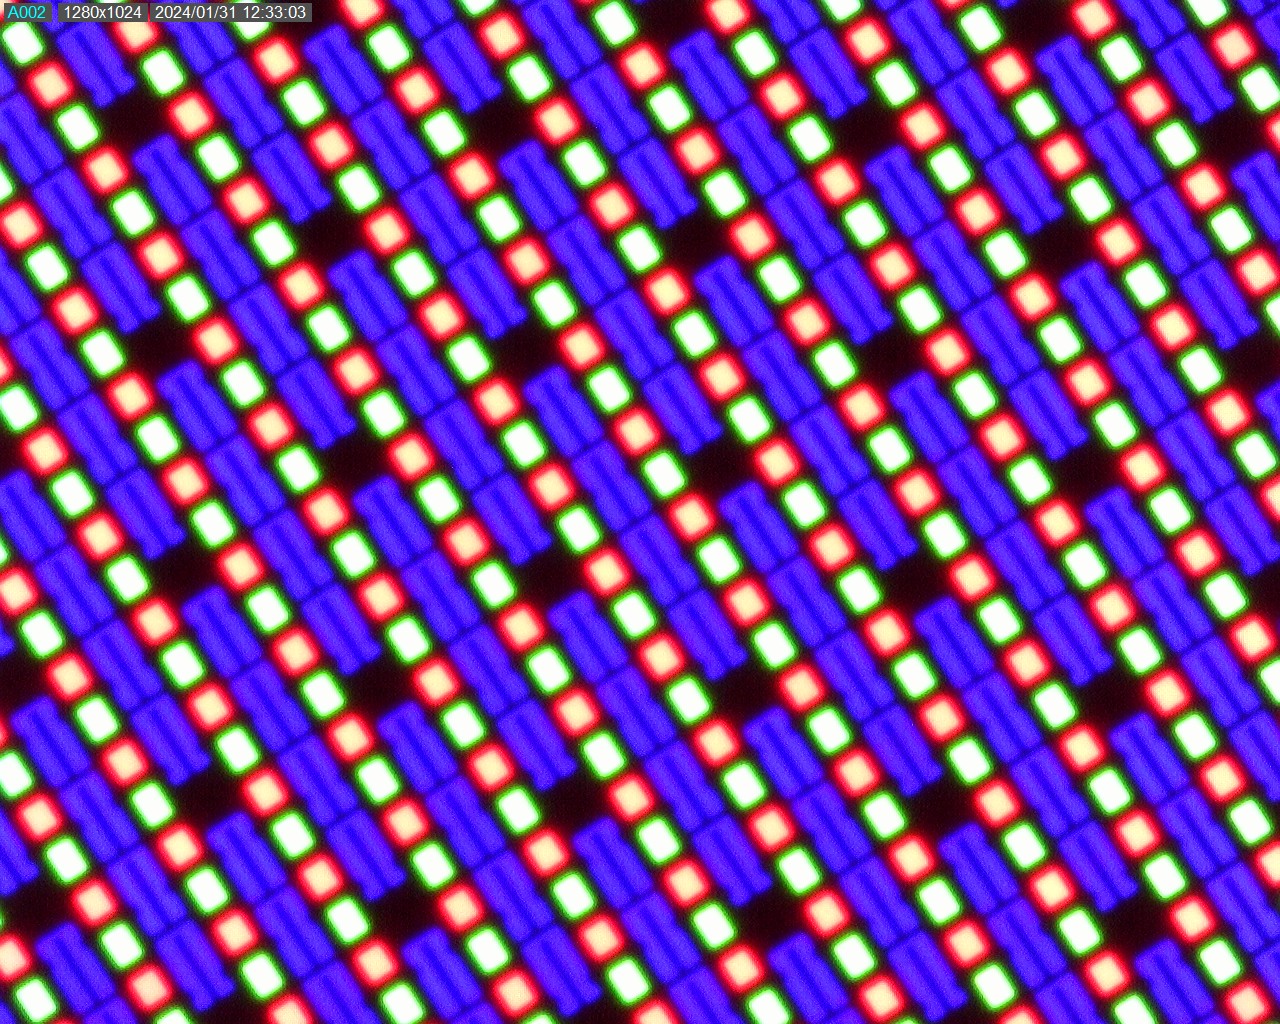
O novo OLED da Samsung está instalado em nosso modelo de teste, que é aquele do qual a Razer fala tão bem. No entanto, o senhor também pode optar por adquirir o laptop com as boas telas Mini-LED. O cliente se depara com uma decisão difícil, pois os dois tipos de painel têm suas próprias vantagens e desvantagens.
Os Mini-LEDs podem atingir até 1.000 nits (HDR) e o modelo anterior ainda conseguia mais de 700 nits no modo SDR. Nosso OLED "apenas" alcançou uma média de 420 nits, mas, por sua vez, apresenta um valor de preto perfeito e, como resultado, altos contrastes. Ele pode escurecer perfeitamente áreas individuais da tela.
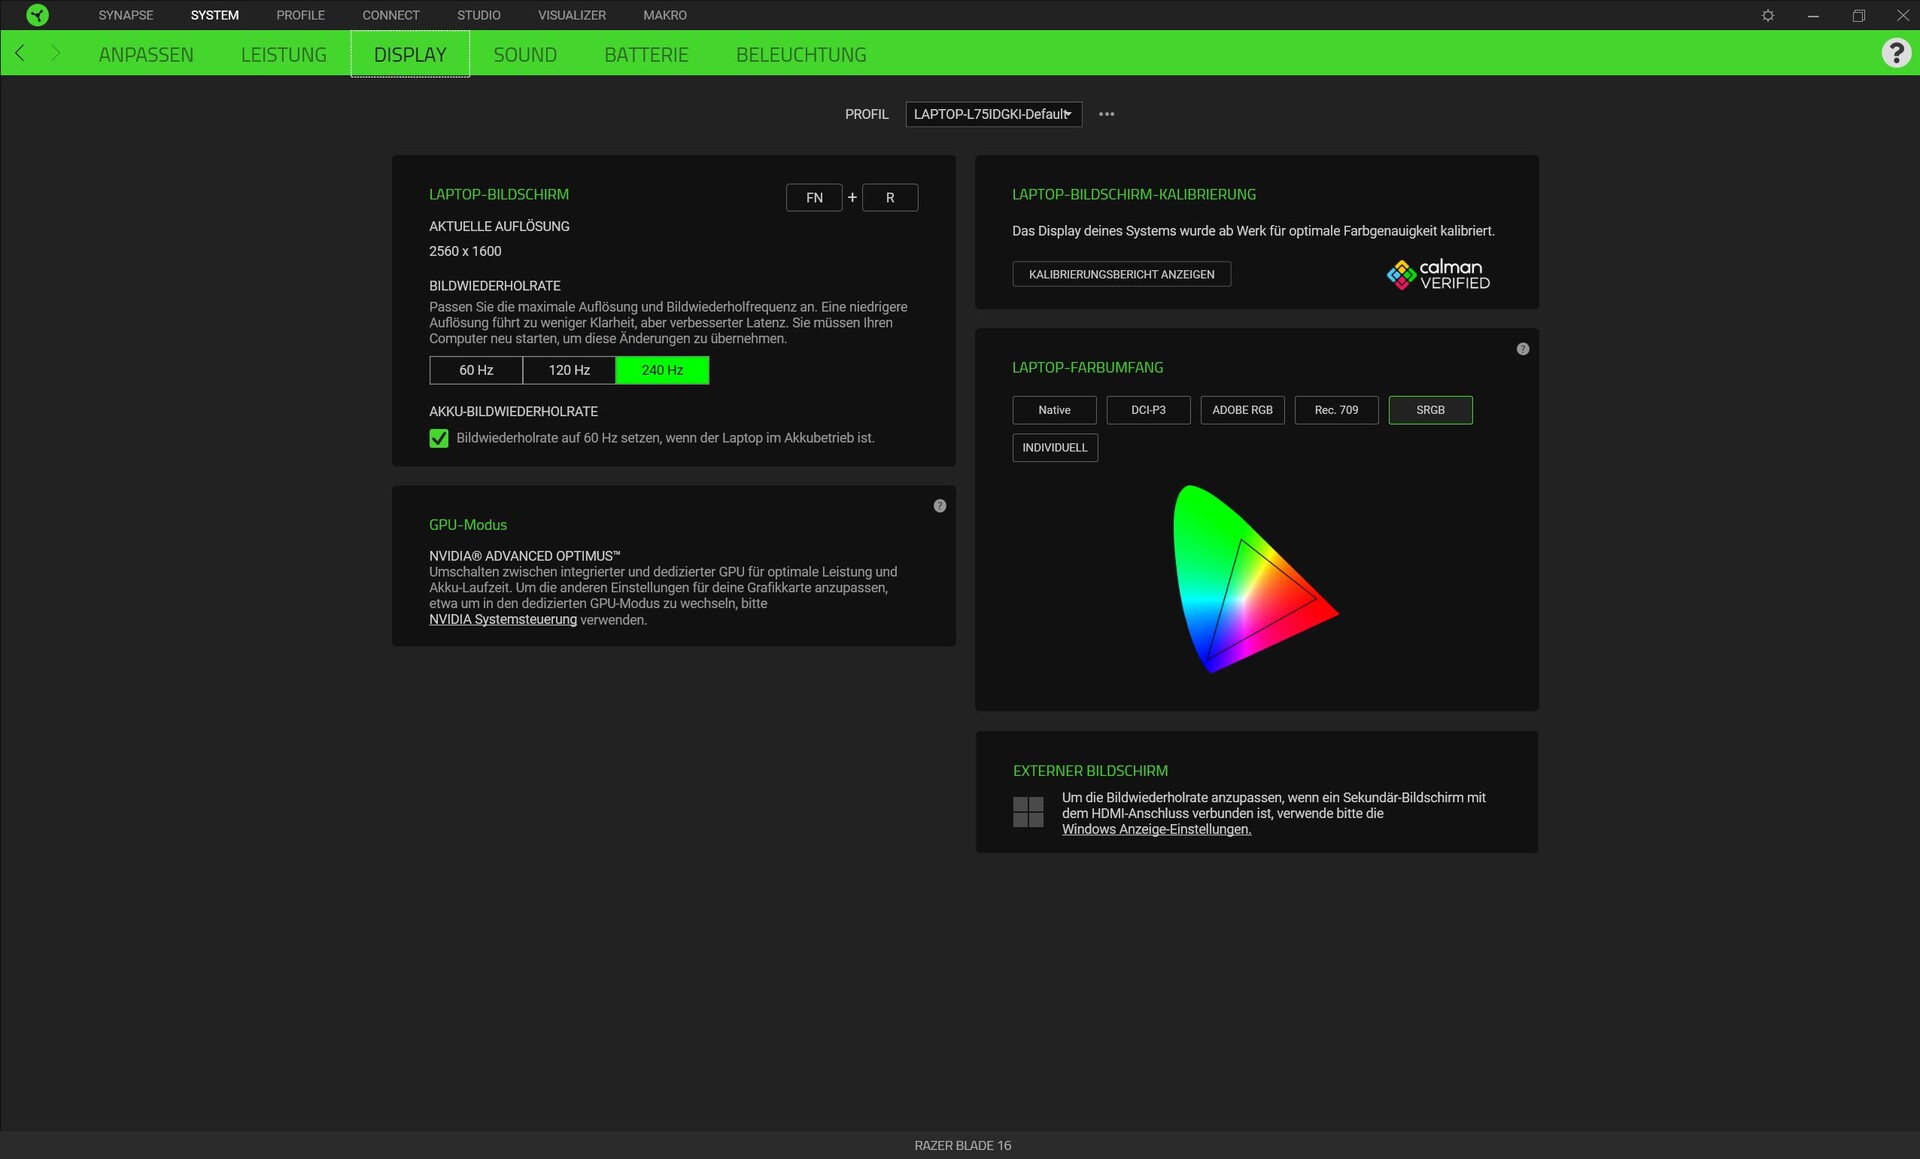
A tela Mini-LED apresenta dois modos de resolução nativa, ou seja, FHD+ e UHD+. O OLED é "limitado" a 1.600p (QHD+), mas tem tempos de resposta extremamente rápidos entre 0,2 (cinza para cinza) e 0,4 milissegundos (preto para branco). Independentemente da tela que o senhor escolher, certamente não terá uma tela ruim com a Razer.
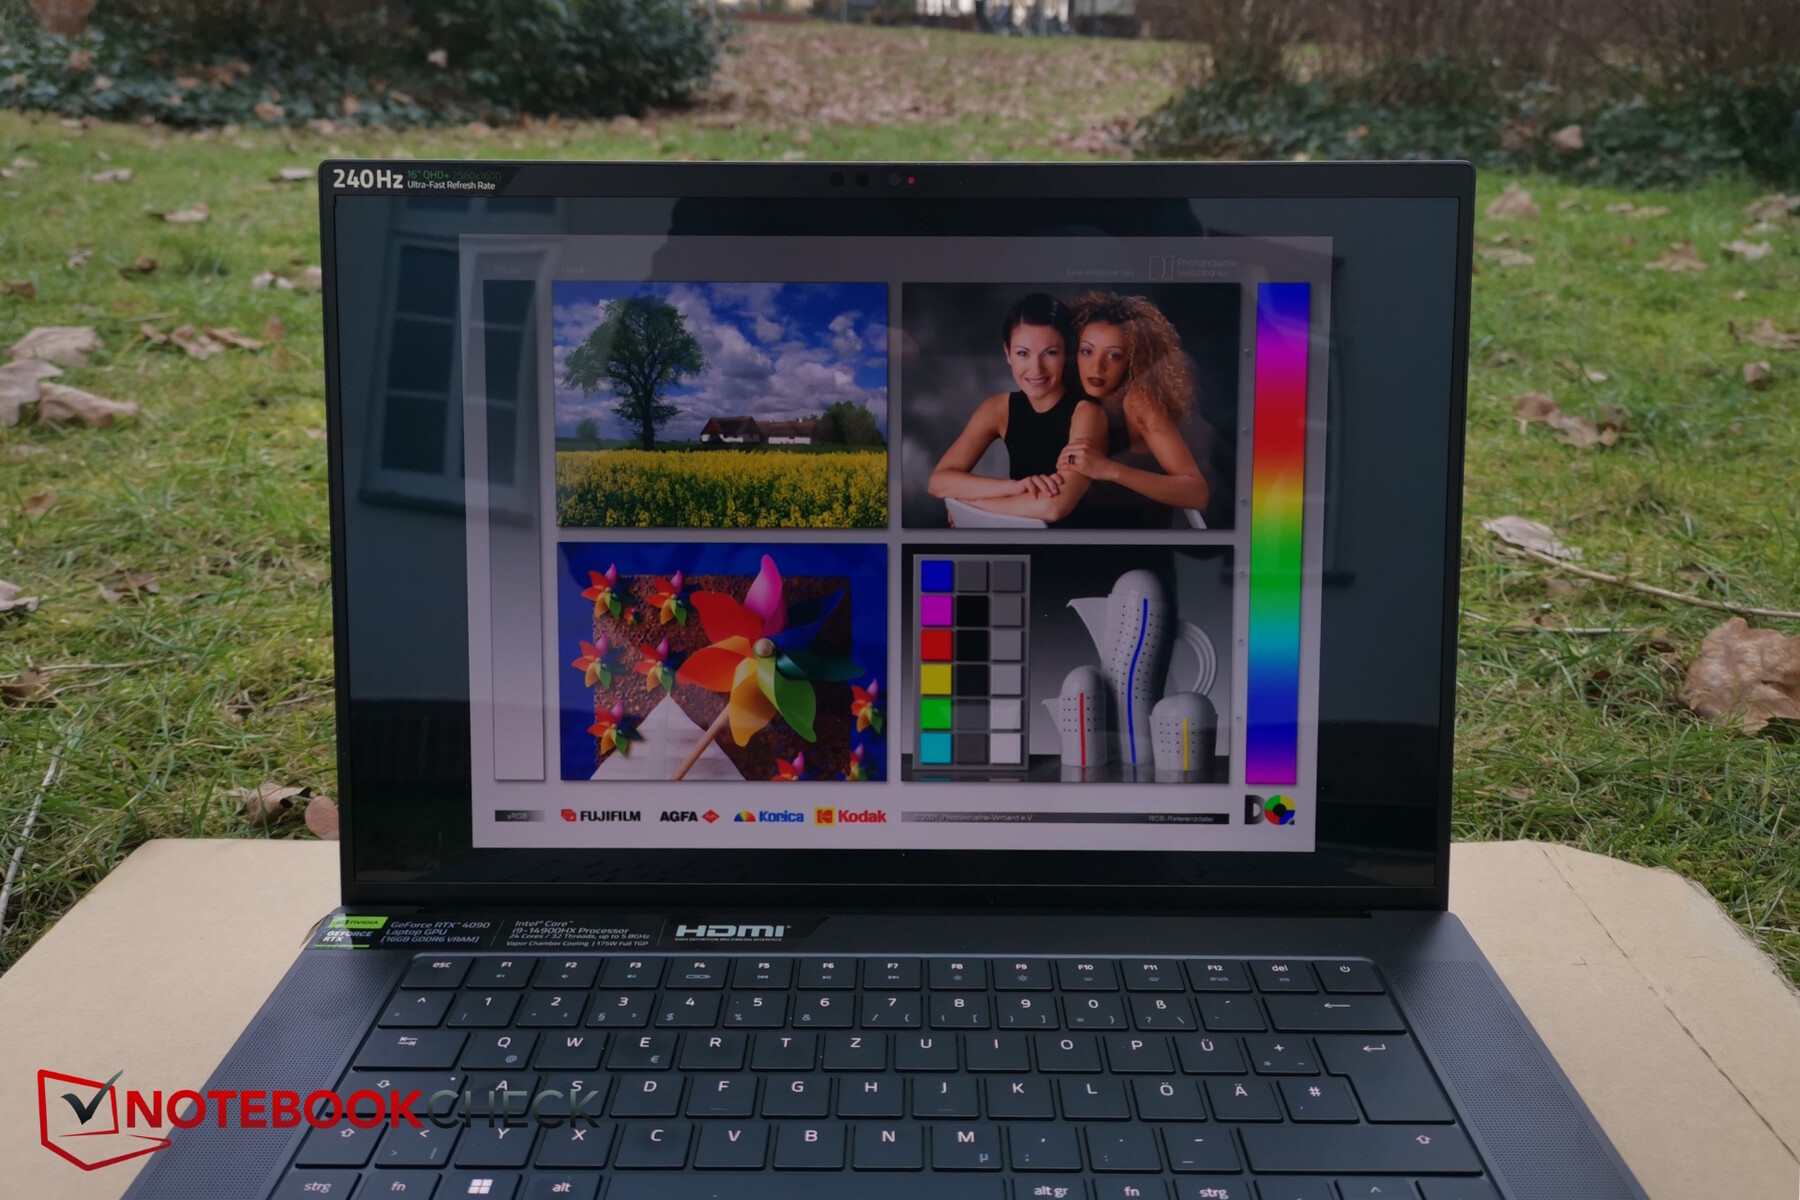
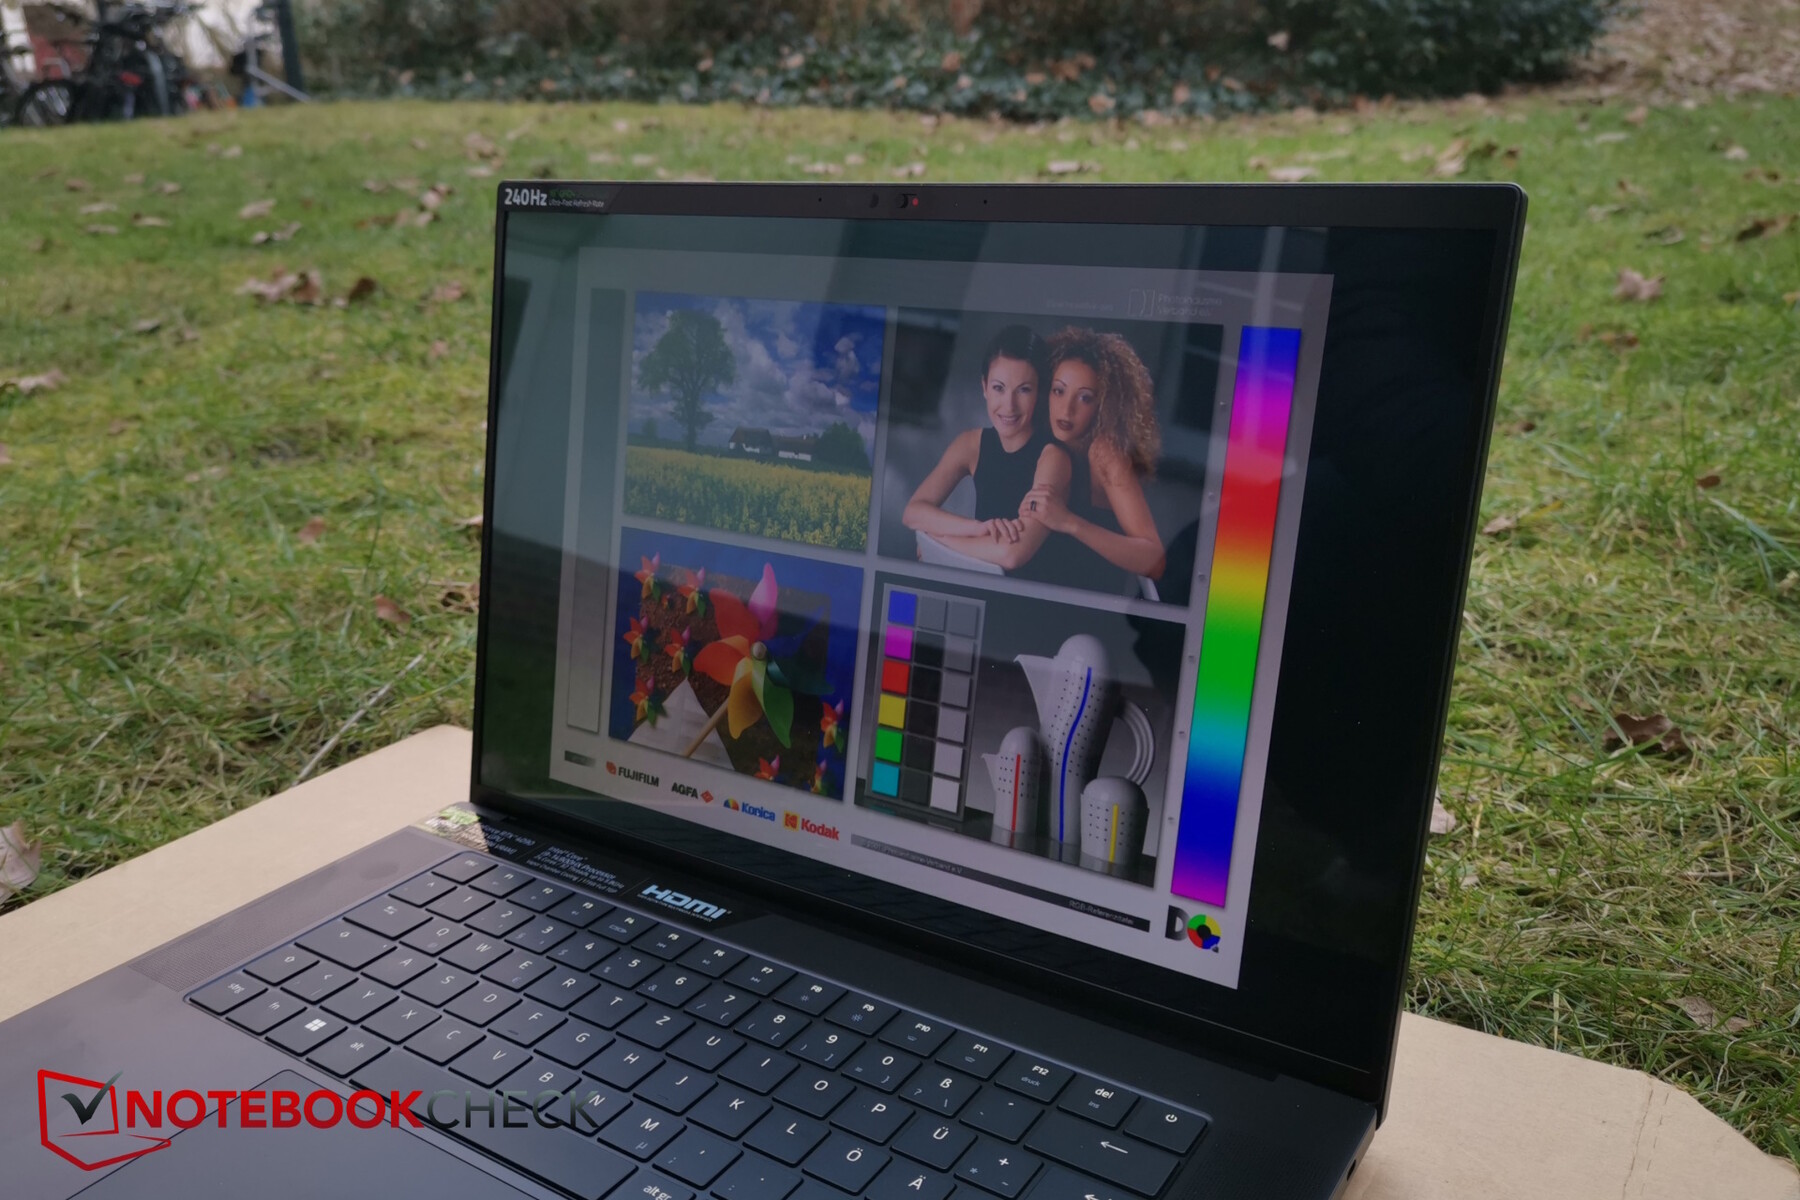
O OLED da Samsung em nosso modelo de teste do Blade tem uma superfície clara e reflexiva. A Razer anuncia o modelo com todos os tipos de certificados, incluindo VESA ClearMR 11000 (maior clareza de exibição com objetos em movimento na tela a 240 Hz), Calman Verified (calibrado por cor) e VESA DisplayHDR True Black 500.
Além dos inúmeros certificados, o OLED 16:10 com resolução de 2.560 x 1.600 pixels é compatível com G-Sync e vem pré-calibrado. Não há sangramento de luz de fundo com OLEDs.
| |||||||||||||||||||||||||
iluminação: 98 %
iluminação com acumulador: 416 cd/m²
Contraste: 20900:1 (Preto: 0.02 cd/m²)
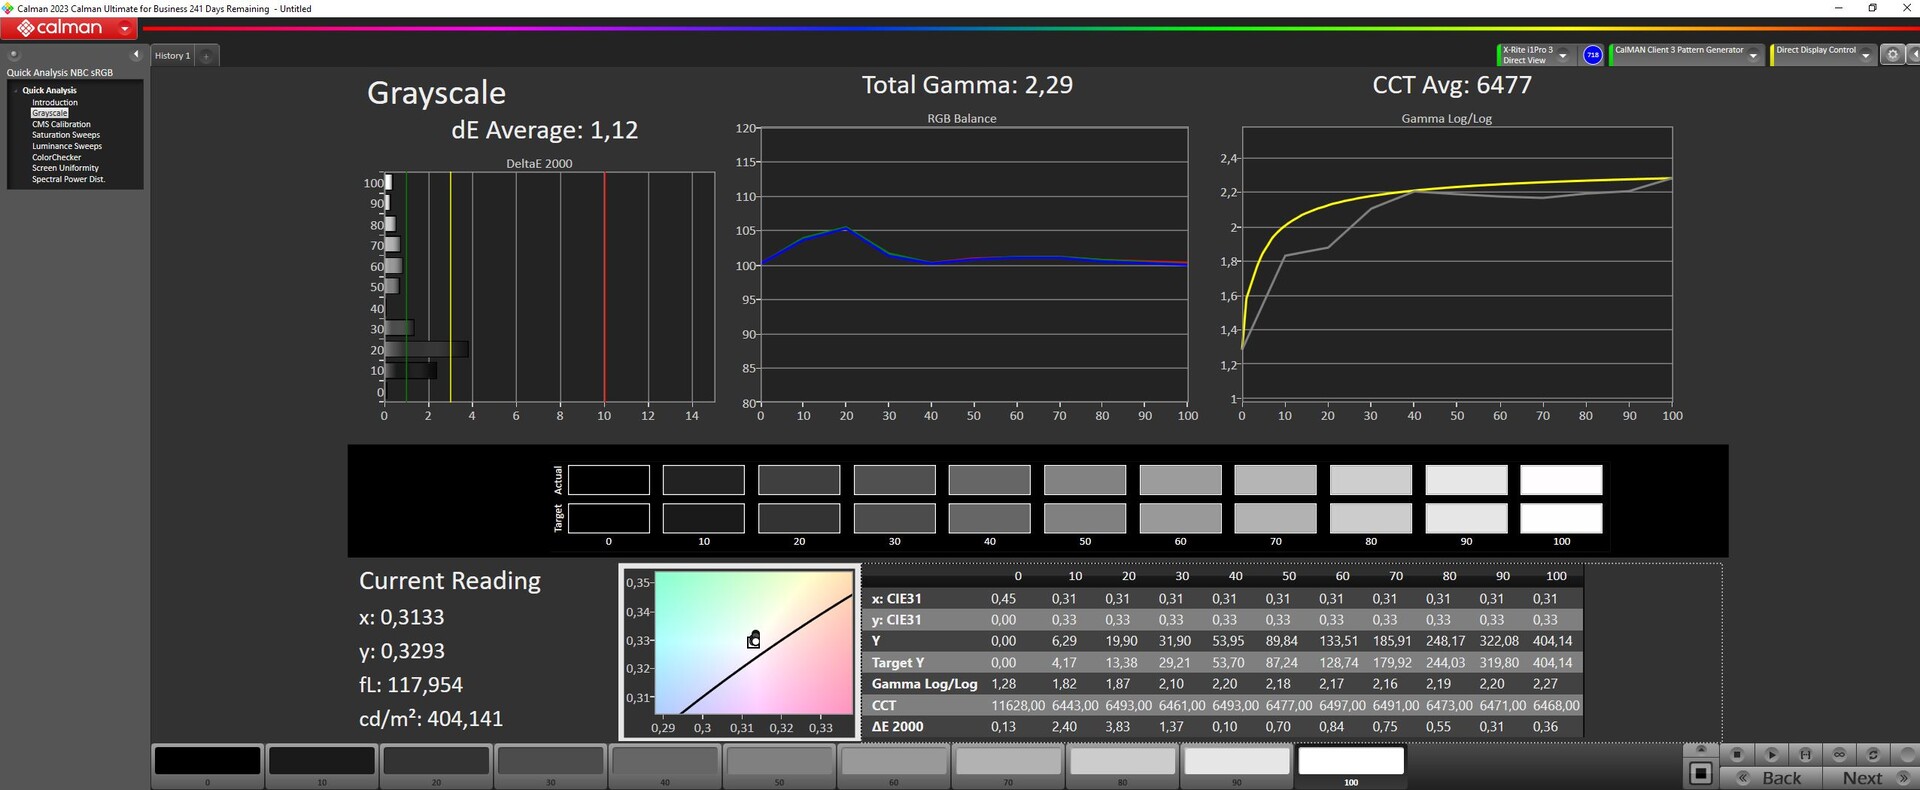
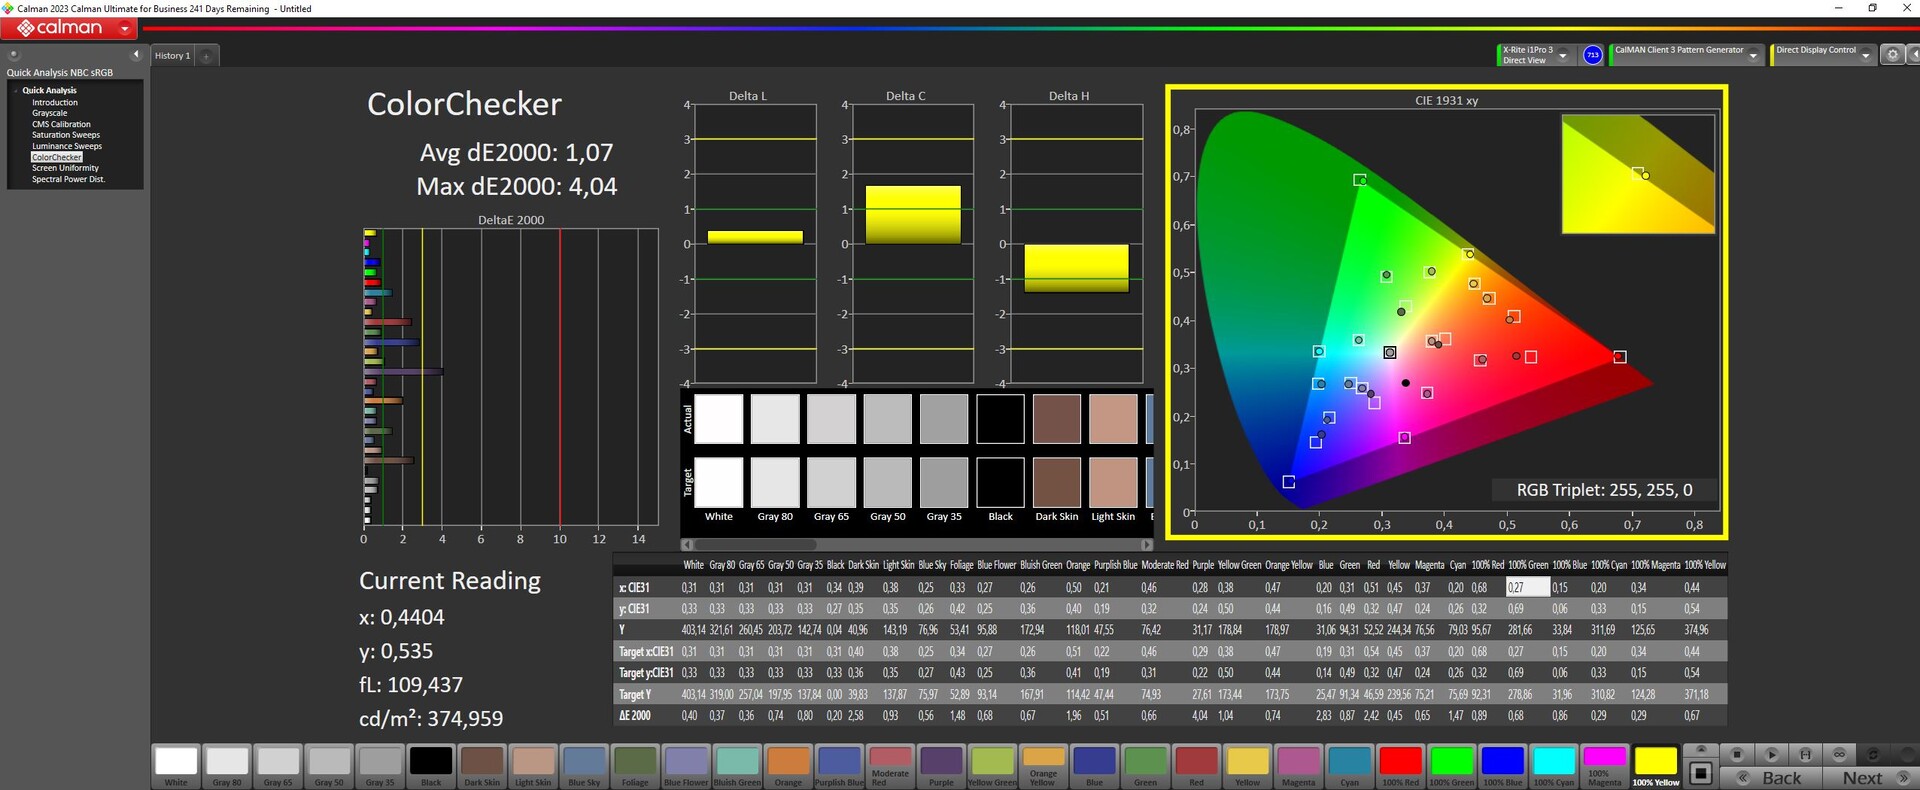
ΔE ColorChecker Calman: 1.07 | ∀{0.5-29.43 Ø4.71}
calibrated: 1.07
ΔE Greyscale Calman: 1.12 | ∀{0.09-98 Ø4.96}
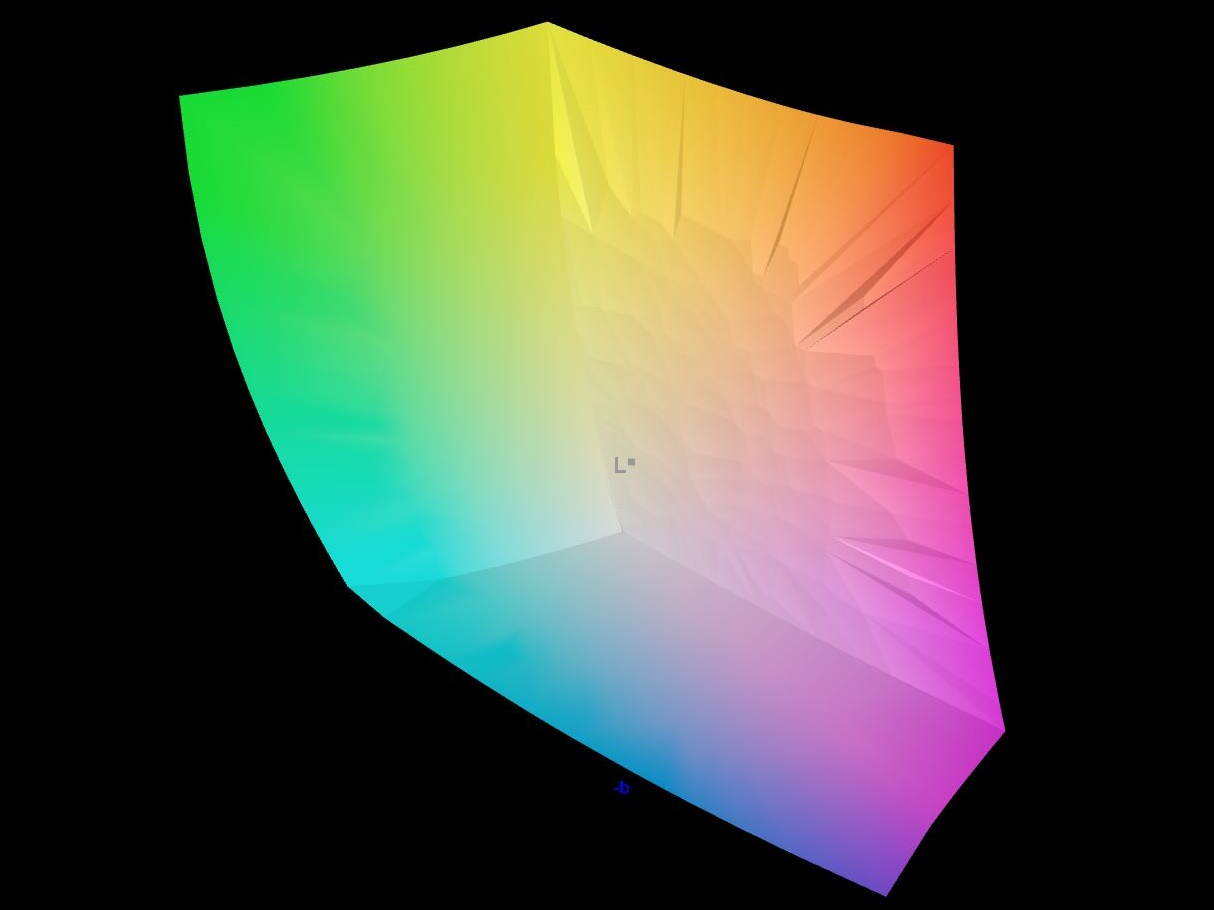
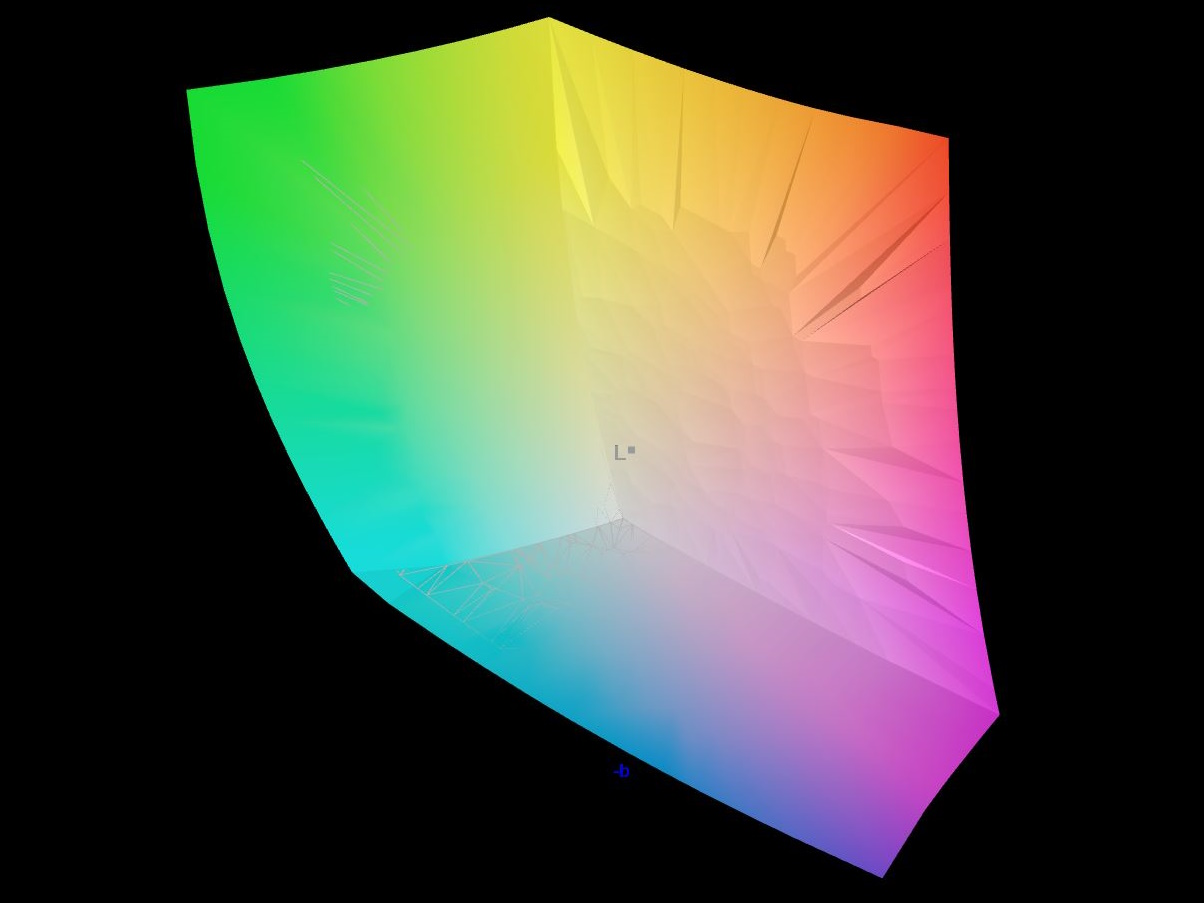
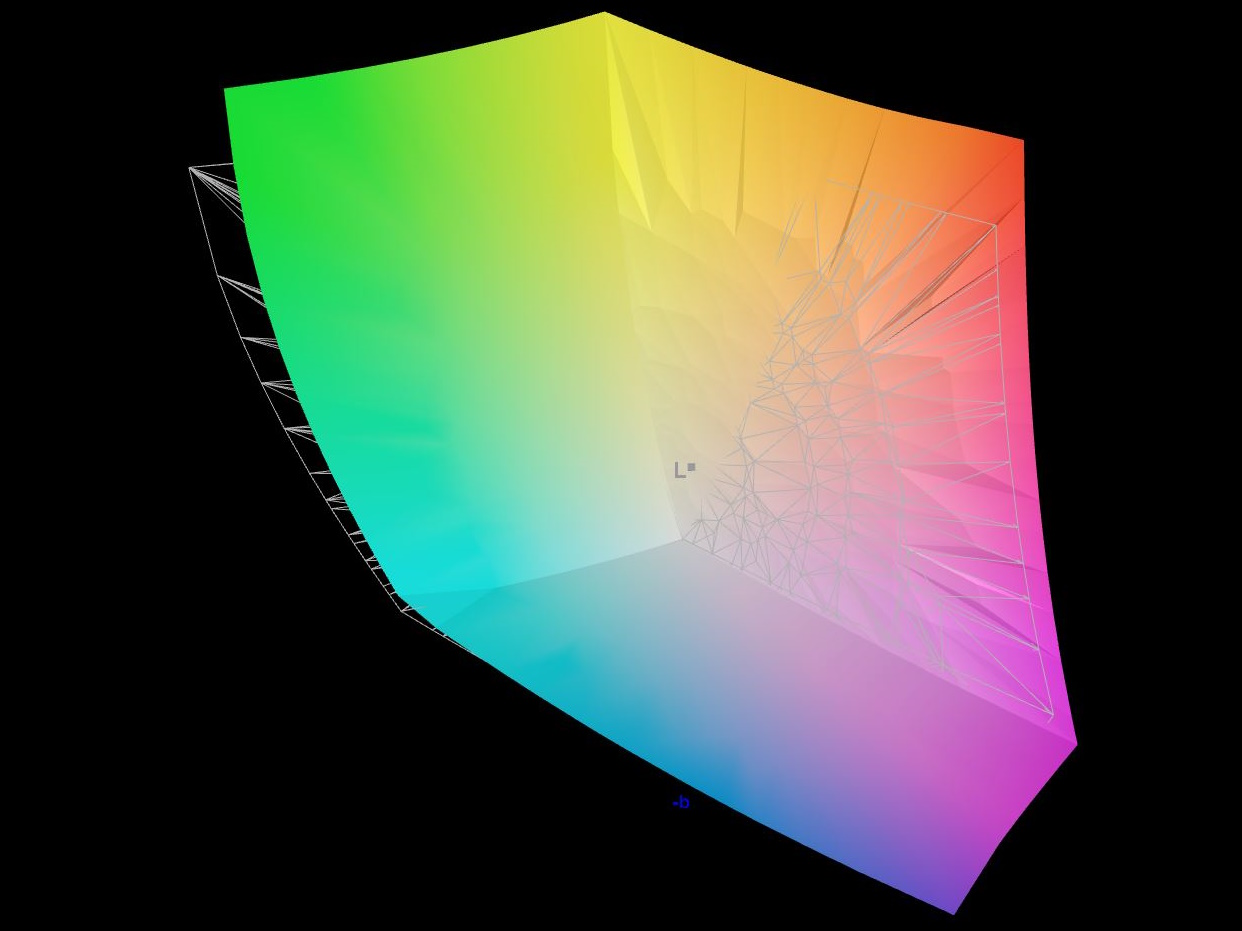
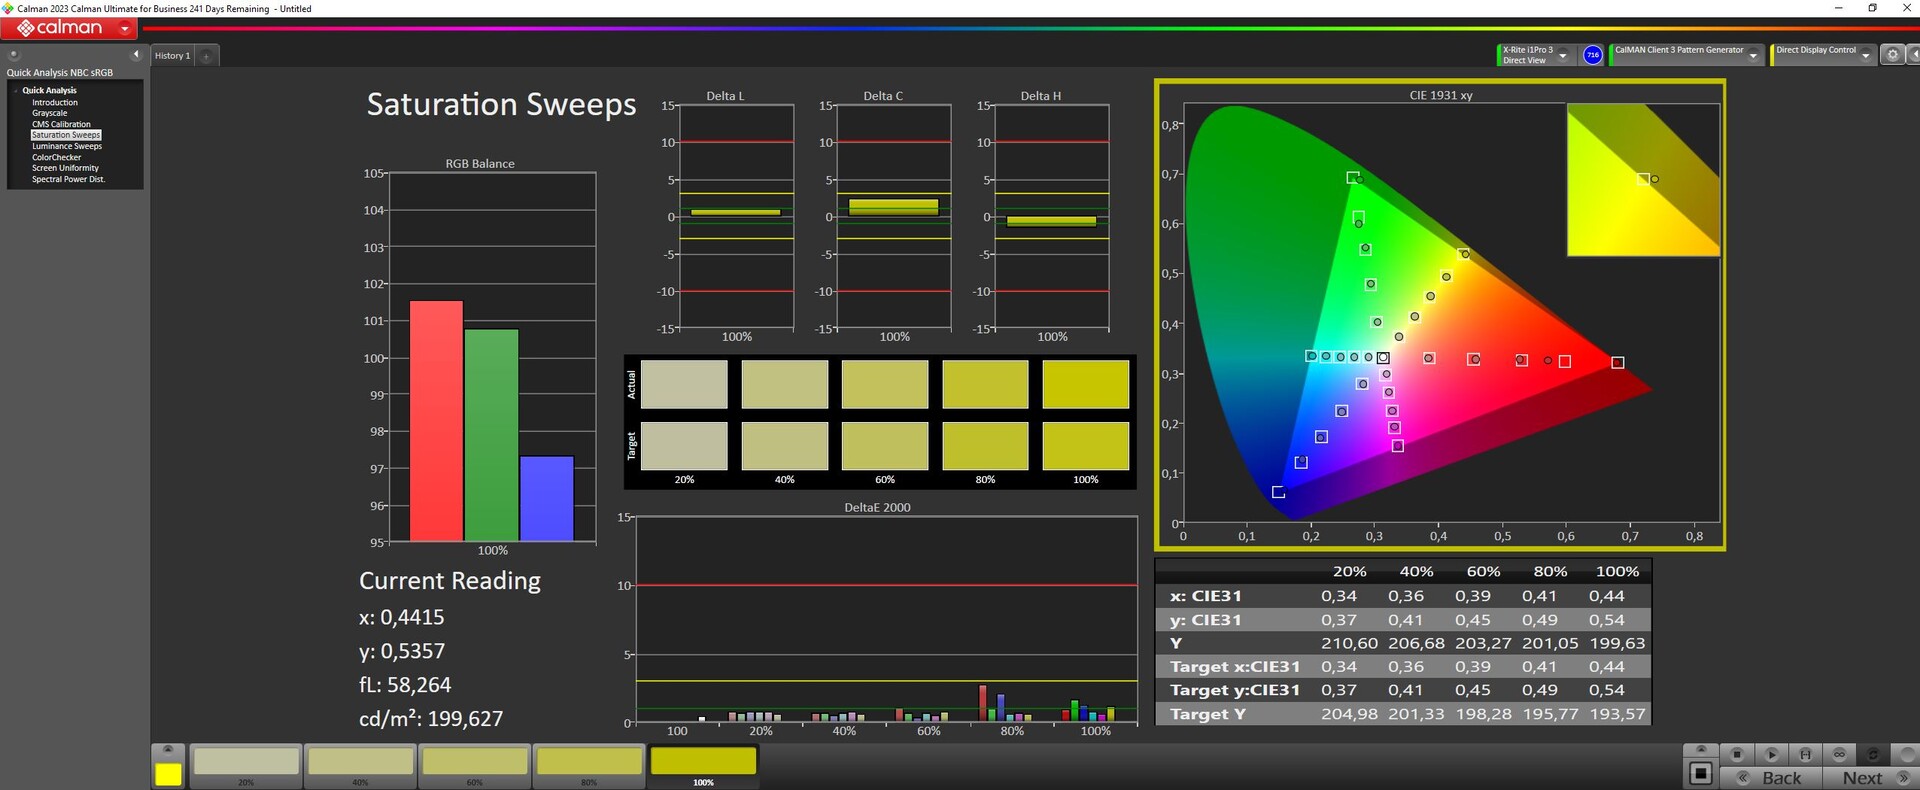
95.6% AdobeRGB 1998 (Argyll 3D)
99.9% sRGB (Argyll 3D)
99.1% Display P3 (Argyll 3D)
Gamma: 2.29
CCT: 6417 K
| Razer Blade 16 2024, RTX 4090 Samsung SDC41AB (ATNA60DL03-0), OLED, 2560x1600, 16" | Razer Blade 16 Early 2023 RTX 4090 AUO B160ZAN01.U, mini-LED, 3840x2400, 16" | Lenovo Legion 9 16IRX8 CSOT T3 MNG007ZA2-2, Mini-LED, 3200x2000, 16" | Schenker XMG Neo 16 E23 BOE0AF0 NE160QDM-NZ1, IPS, 2560x1600, 16" | Lenovo Legion 5 16IRX G9 NE160QDM-NZ3, IPS, 2560x1600, 16" | |
|---|---|---|---|---|---|
| Display | -1% | -4% | -21% | -16% | |
| Display P3 Coverage (%) | 99.1 | 99.9 1% | 97.2 -2% | 67.3 -32% | 72.4 -27% |
| sRGB Coverage (%) | 99.9 | 100 0% | 99.9 0% | 96.7 -3% | 100 0% |
| AdobeRGB 1998 Coverage (%) | 95.6 | 90.9 -5% | 87 -9% | 68.9 -28% | 74.1 -22% |
| Response Times | -9780% | -4121% | -3996% | -3592% | |
| Response Time Grey 50% / Grey 80% * (ms) | 0.24 ? | 10.2 ? -4150% | 13.3 ? -5442% | 14.5 ? -5942% | 12.5 ? -5108% |
| Response Time Black / White * (ms) | 0.4 ? | 62.04 ? -15410% | 11.6 ? -2800% | 8.6 ? -2050% | 8.7 ? -2075% |
| PWM Frequency (Hz) | 960 | 2420 ? | 4742 | ||
| Screen | -42% | -49% | -201% | -176% | |
| Brightness middle (cd/m²) | 418 | 730 75% | 674.9 61% | 372 -11% | 526 26% |
| Brightness (cd/m²) | 420 | 729 74% | 682 62% | 349 -17% | 500 19% |
| Brightness Distribution (%) | 98 | 94 -4% | 96 -2% | 88 -10% | 87 -11% |
| Black Level * (cd/m²) | 0.02 | 0.0045 78% | 0.04 -100% | 0.32 -1500% | 0.33 -1550% |
| Contrast (:1) | 20900 | 162222 676% | 16873 -19% | 1163 -94% | 1594 -92% |
| Colorchecker dE 2000 * | 1.07 | 5.65 -428% | 2.56 -139% | 2.06 -93% | 1.2 -12% |
| Colorchecker dE 2000 max. * | 4.04 | 10.11 -150% | 4.16 -3% | 3 26% | 2.1 48% |
| Colorchecker dE 2000 calibrated * | 1.07 | 1.85 -73% | 2.47 -131% | 1.5 -40% | 1 7% |
| Greyscale dE 2000 * | 1.12 | 8.1 -623% | 3 -168% | 1.9 -70% | 1.3 -16% |
| Gamma | 2.29 96% | 1.98 111% | 2.38 92% | 2.312 95% | 2.23 99% |
| CCT | 6417 101% | 5874 111% | 6799 96% | 6747 96% | 6391 102% |
| Média Total (Programa/Configurações) | -3274% /
-1424% | -1391% /
-621% | -1406% /
-705% | -1261% /
-630% |
* ... menor é melhor
Como prometido, o painel cobre o DisplayP3 praticamente em sua totalidade e, é claro, o sRGB também. Além disso, o AdobeRGB é coberto por cerca de 96%.
De acordo com a Razer, todos os modelos do Blade de 16 polegadas vêm pré-calibrados e nossas medições confirmaram isso. Seus desvios de escala de cinza e cor são muito baixos - apenas cerca de 1. Isso significa que o Blade 16 é perfeito para editar fotos e vídeos.
O fabricante também configura vários perfis de cores para isso em seu software Synapse, como DCI-P3, Adobe RGB, Rec. 709 e sRGB. Há também a opção de ajustar o modo de cor individualmente e há um modo de cor nativo. Selecionamos o DCI-P3 para nossas medições.
No total, classificaríamos o painel OLED como ligeiramente superior ao monitor Mini-LED, o que se deve principalmente à sua excelente cobertura do espaço de cores, precisão de cores, pretos profundos, altos contrastes e tempos de resposta rápidos.
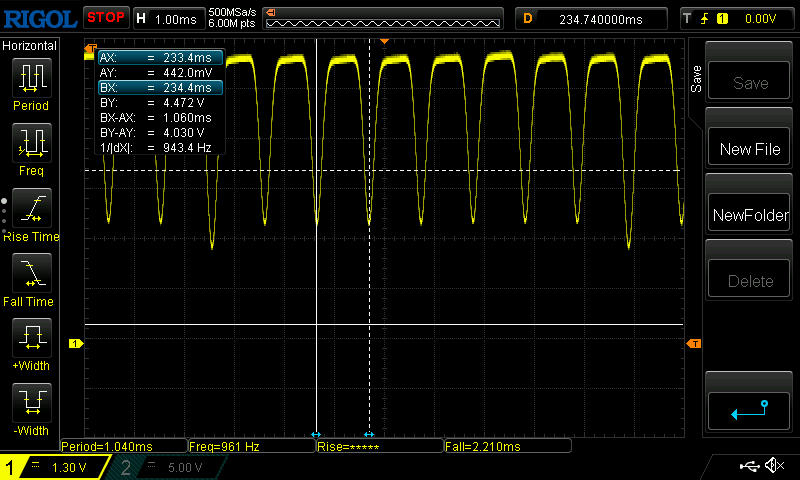
Exibir tempos de resposta
| ↔ Tempo de resposta preto para branco | ||
|---|---|---|
| 0.4 ms ... ascensão ↗ e queda ↘ combinadas | ↗ 0.2 ms ascensão | 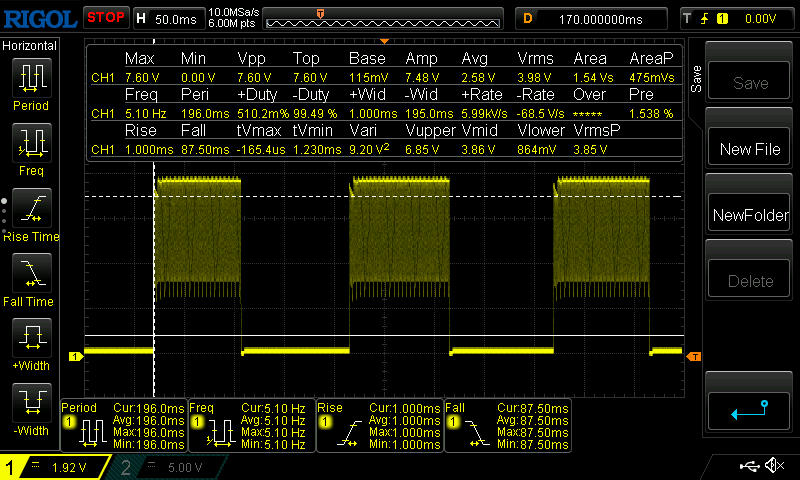 |
| ↘ 0.2 ms queda | ||
| A tela mostra taxas de resposta muito rápidas em nossos testes e deve ser muito adequada para jogos em ritmo acelerado. Em comparação, todos os dispositivos testados variam de 0.1 (mínimo) a 240 (máximo) ms. » 0 % de todos os dispositivos são melhores. Isso significa que o tempo de resposta medido é melhor que a média de todos os dispositivos testados (19.8 ms). | ||
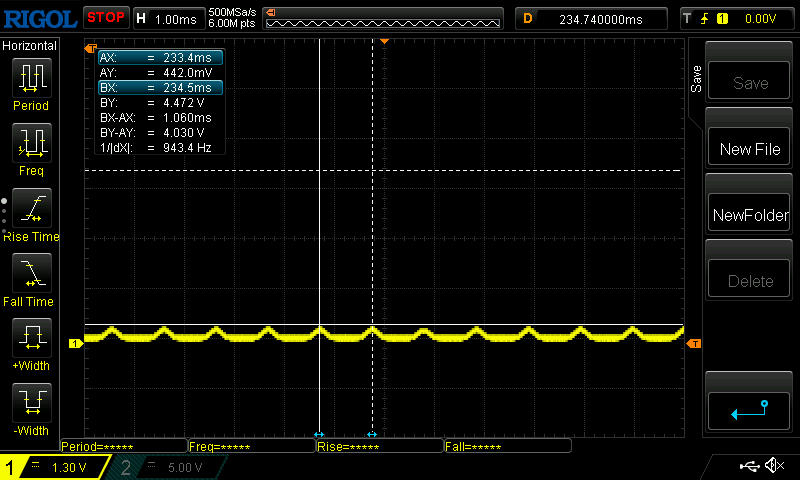
| ↔ Tempo de resposta 50% cinza a 80% cinza | ||
| 0.24 ms ... ascensão ↗ e queda ↘ combinadas | ↗ 0.15 ms ascensão | 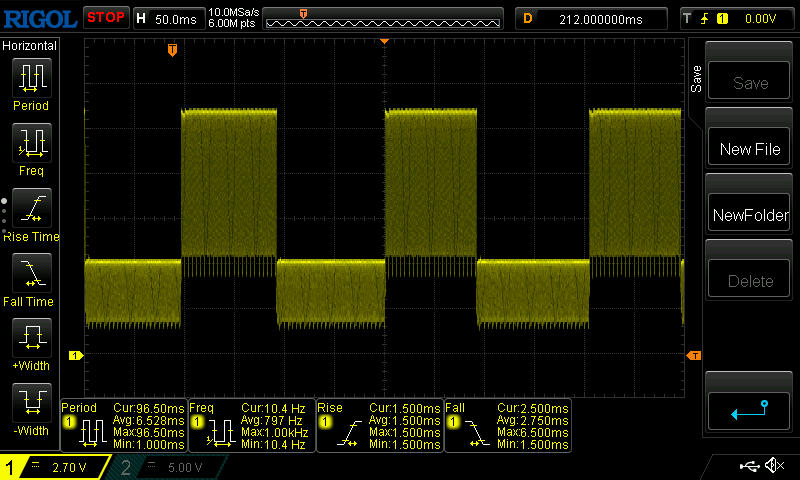 |
| ↘ 0.09 ms queda | ||
| A tela mostra taxas de resposta muito rápidas em nossos testes e deve ser muito adequada para jogos em ritmo acelerado. Em comparação, todos os dispositivos testados variam de 0.165 (mínimo) a 636 (máximo) ms. » 0 % de todos os dispositivos são melhores. Isso significa que o tempo de resposta medido é melhor que a média de todos os dispositivos testados (31 ms). | ||
Cintilação da tela / PWM (modulação por largura de pulso)
| Tela tremeluzindo/PWM detectado | 960 Hz | 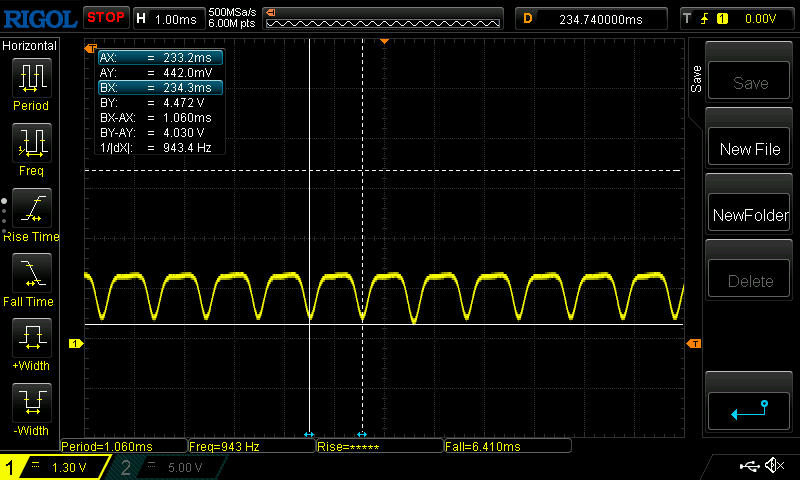 | |
A luz de fundo da tela pisca em 960 Hz (pior caso, por exemplo, utilizando PWM) . A frequência de 960 Hz é bastante alta, então a maioria dos usuários sensíveis ao PWM não deve notar nenhuma oscilação. [pwm_comparison] Em comparação: 52 % de todos os dispositivos testados não usam PWM para escurecer a tela. Se PWM foi detectado, uma média de 7747 (mínimo: 5 - máximo: 343500) Hz foi medida. | |||
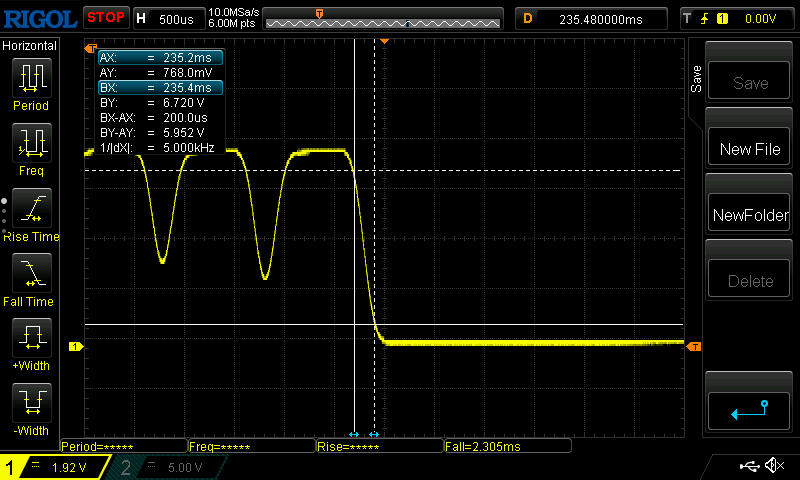
Os tempos de resposta do laptop de 0,2 e 0,4 ms são muito rápidos - rápidos demais para o modo de gravação automática do nosso dispositivo de teste. Abaixo está nosso registro manual dos tempos de subida e descida.

Em ambientes externos, pode ser um pouco difícil usar o Blade 16 devido à sua superfície reflexiva. Mesmo assim, seu forte contraste compensa um pouco isso. Na sombra, não há problema em trabalhar ao ar livre.

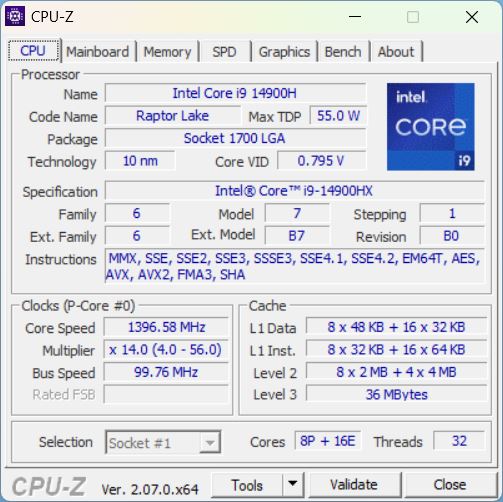
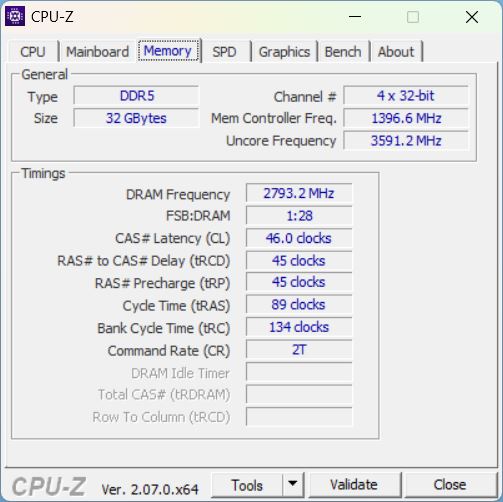
Desempenho - Estagnação apesar da nova geração de CPU
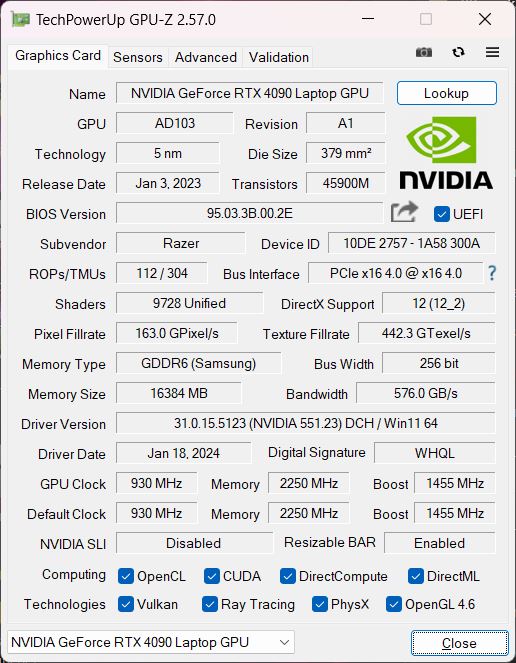
Com sua poderosa RTX 4090 e o não menos poderoso Intel Core i9-14900HXo Blade 16 é, obviamente, voltado principalmente para os gamers. Mas com sua boa tela e design elegante e fino, a Razer sempre visou deliberadamente os profissionais criativos também. 32 GB de RAM, WiFi 7 e um SSD de 2 TB completam as características de nossa amostra de teste.
Condições de teste
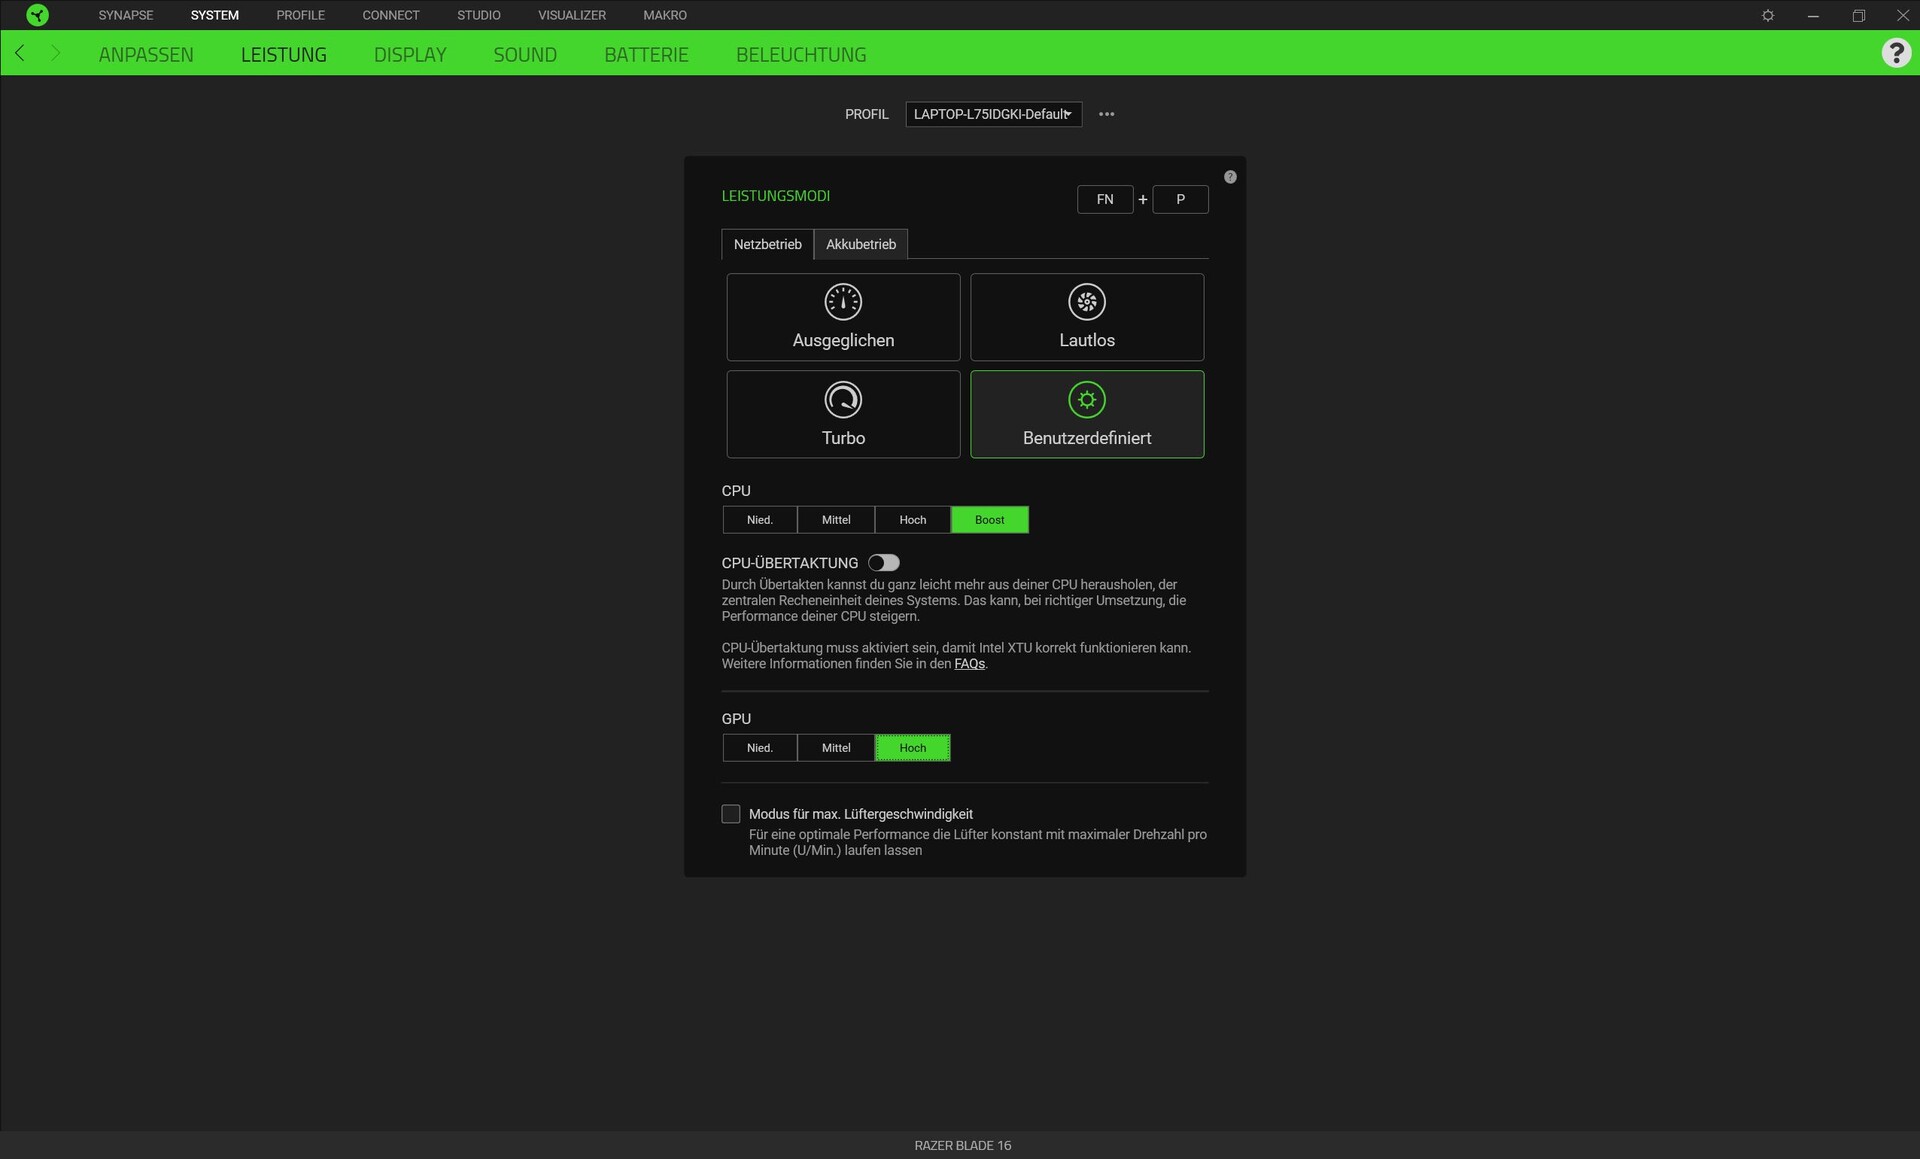
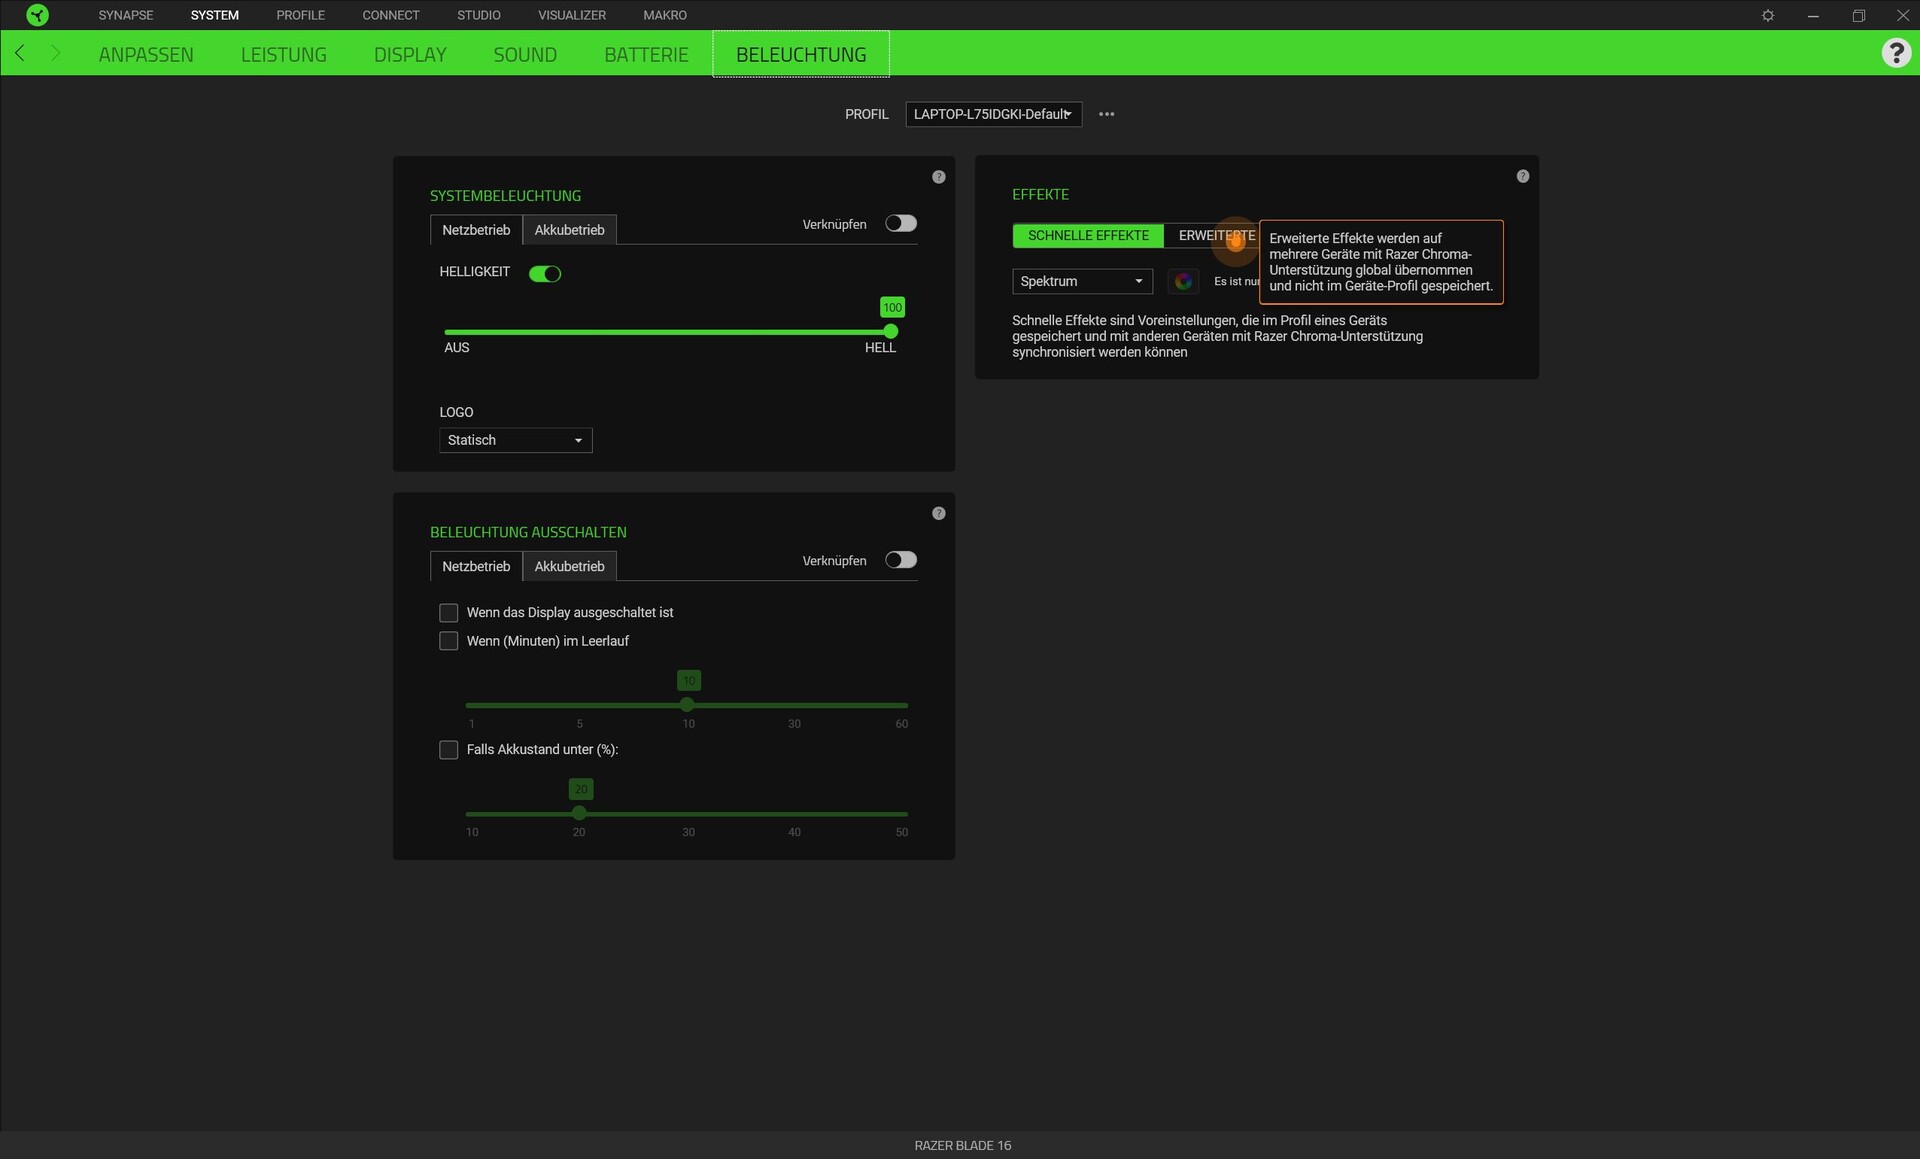
O Razer Synapse funciona como o centro de comando e controle nos modelos Blade. Ele permite que o senhor defina um dos quatro modos de desempenho(silencioso, equilibrado, turbo, personalizado), bem como os efeitos de iluminação e faça outros ajustes.
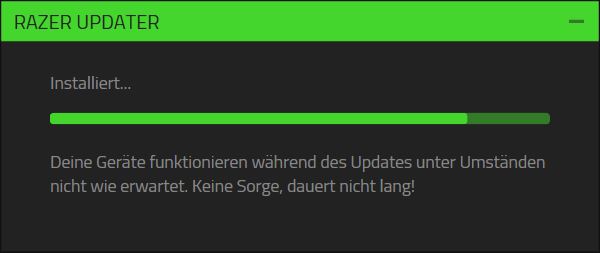
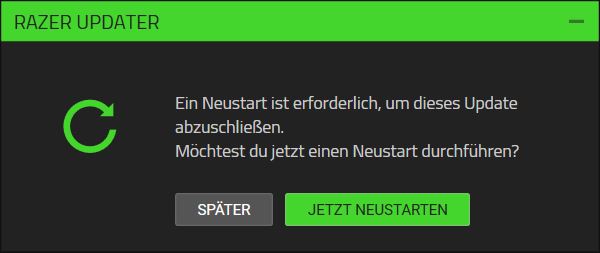
Às vezes, o software tem que se atualizar sozinho, o que leva um tempo excepcionalmente longo; tivemos até que reiniciar o dispositivo depois, o que foi um pouco irritante. As opções não podem ser acessadas durante a atualização longa e não solicitada. A tela inicial também não é das melhores. Embora o software lembre a última guia aberta durante uma sessão do Windows (por exemplo, desempenho), sempre temos que reiniciar o dispositivo antes de acessar a tela inicial. Aqui, primeiro temos que selecionar nosso dispositivo (mesmo que seja nosso único dispositivo Razer) e depois clicar na guia correta; "personalizar" é selecionado por padrão (definir teclas de função) - uma guia que provavelmente raramente é usada.
Para nossos benchmarks, usamos o modo personalizado para maximizar o desempenho da CPU e da GPU. Entretanto, deixamos as ventoinhas no modo automático, caso contrário, elas sempre aumentariam o volume máximo. Às vezes, houve alguns problemas com a troca de gráficos, que falhou em determinados aplicativos. Por exemplo, o 3DMark 06 só foi iniciado no modo dGPU.
Processador
O Core i9-14900HX é o atual líder da série Raptor-Lake-Refresh para notebooks. Em comparação com o Raptor Lake do ano passado, no entanto, a arquitetura permaneceu a mesma - apenas a taxa de clock turbo está um pouco mais alta. Agora, o clock é de até 5,8 GHz e, além disso, a principal CPU da Intel apresenta 24 núcleos (8 núcleos P, 16 núcleos E; 32 threads).
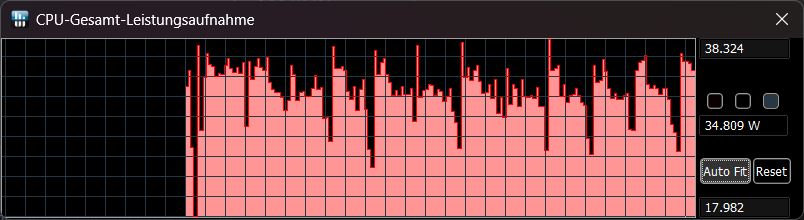
Durante o loop do Cinebench R15, a CPU apresentou um desempenho muito alto e constante, sem a habitual queda de desempenho após as primeiras 1 ou 3 execuções. Mesmo assim, a Legion 9 com o modelo superior do ano passado, o Core i9-13980HXfoi igualmente rápido e as outras CPUs topo de linha da geração 13 da Intel só ficaram um pouco atrás. O mais fraco i7-14650HX mais fraco da atual geração de Legion 5 ficou um pouco mais atrás. Em comparação com seu antecessoros resultados da CPU atual foram cerca de 8% melhores. Apesar desse excelente desempenho, não há muitos argumentos que justifiquem gastar muito dinheiro com a Intel Gen 14, já que a Gen 13 é quase identicamente rápida. Dê uma olhada em nossa análise das novas CPUs da Geração 14 para obter mais informações.
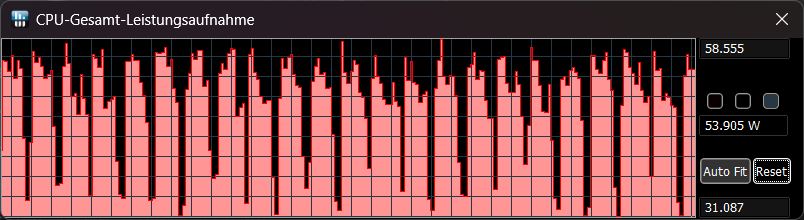
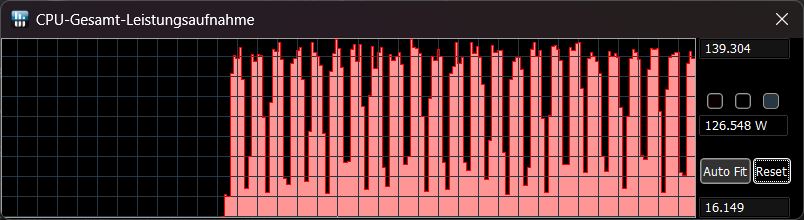
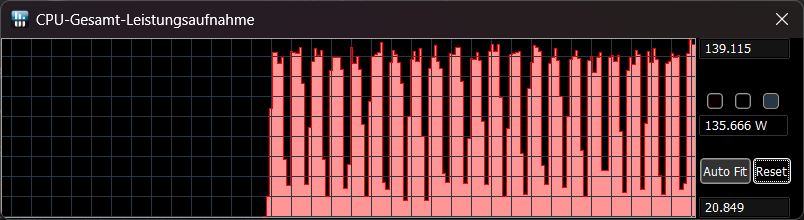
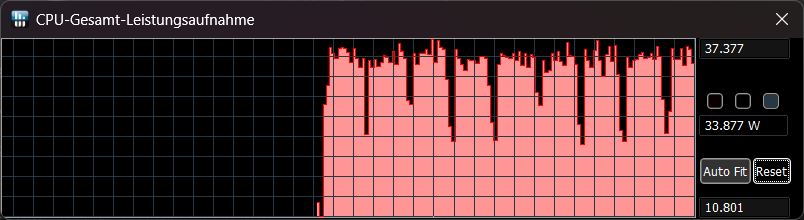
Na tabela abaixo, listamos o consumo de energia durante o Cinebench R15 usando os diferentes modos de desempenho e as capturas de tela à direita ilustram esses valores. Se desconectarmos a alimentação, o Synapse mudará automaticamente para o modo balanceado, que não pode ser alterado. No entanto, os valores de TDP foram ainda mais baixos do que no mesmo modo quando conectado - eles são mais semelhantes aos valores do modo silencioso.
| Modo/valor de desempenho | Pontuação do Cinebench R15, primeira execução | TDP no início da execução | TDP no final da execução |
|---|---|---|---|
| Definido pelo usuário (boost/high) | 4.456 | 139 | 135 |
| Turbo | 4.305 | 139 | 126 |
| Balanceado | 2.678 | 58 | 54 |
| Silencioso | 1.888 | 38 | 35 |
| Bateria | 1.835 | 37 | 34 |
Cinebench R15 Multi continuous test
Cinebench R23: Multi Core | Single Core
Cinebench R20: CPU (Multi Core) | CPU (Single Core)
Cinebench R15: CPU Multi 64Bit | CPU Single 64Bit
Blender: v2.79 BMW27 CPU
7-Zip 18.03: 7z b 4 | 7z b 4 -mmt1
Geekbench 6.7: Multi-Core | Single-Core
Geekbench 5.5: Multi-Core | Single-Core
HWBOT x265 Benchmark v2.2: 4k Preset
LibreOffice : 20 Documents To PDF
R Benchmark 2.5: Overall mean
| CPU Performance rating | |
| Lenovo Legion 9 16IRX8 | |
| Razer Blade 16 2024, RTX 4090 | |
| Média Intel Core i9-14900HX | |
| Schenker XMG Neo 16 E23 -2! | |
| Razer Blade 16 Early 2023 RTX 4090 -2! | |
| Média da turma Gaming | |
| Lenovo Legion 5 16IRX G9 | |
| Cinebench R23 / Multi Core | |
| Lenovo Legion 9 16IRX8 | |
| Schenker XMG Neo 16 E23 | |
| Razer Blade 16 2024, RTX 4090 | |
| Média Intel Core i9-14900HX (17078 - 36249, n=37) | |
| Razer Blade 16 Early 2023 RTX 4090 | |
| Média da turma Gaming (10488 - 42661, n=107, últimos 2 anos) | |
| Lenovo Legion 5 16IRX G9 | |
| Cinebench R23 / Single Core | |
| Média Intel Core i9-14900HX (1720 - 2245, n=37) | |
| Lenovo Legion 9 16IRX8 | |
| Razer Blade 16 2024, RTX 4090 | |
| Schenker XMG Neo 16 E23 | |
| Média da turma Gaming (1166 - 2415, n=107, últimos 2 anos) | |
| Lenovo Legion 5 16IRX G9 | |
| Razer Blade 16 Early 2023 RTX 4090 | |
| Cinebench R20 / CPU (Multi Core) | |
| Lenovo Legion 9 16IRX8 | |
| Schenker XMG Neo 16 E23 | |
| Média Intel Core i9-14900HX (6579 - 13832, n=37) | |
| Razer Blade 16 2024, RTX 4090 | |
| Razer Blade 16 Early 2023 RTX 4090 | |
| Média da turma Gaming (4029 - 16433, n=106, últimos 2 anos) | |
| Lenovo Legion 5 16IRX G9 | |
| Cinebench R20 / CPU (Single Core) | |
| Média Intel Core i9-14900HX (657 - 859, n=37) | |
| Razer Blade 16 2024, RTX 4090 | |
| Schenker XMG Neo 16 E23 | |
| Média da turma Gaming (442 - 913, n=106, últimos 2 anos) | |
| Razer Blade 16 Early 2023 RTX 4090 | |
| Lenovo Legion 5 16IRX G9 | |
| Lenovo Legion 9 16IRX8 | |
| Cinebench R15 / CPU Multi 64Bit | |
| Schenker XMG Neo 16 E23 | |
| Lenovo Legion 9 16IRX8 | |
| Razer Blade 16 2024, RTX 4090 | |
| Média Intel Core i9-14900HX (3263 - 5589, n=38) | |
| Razer Blade 16 Early 2023 RTX 4090 | |
| Média da turma Gaming (1578 - 6330, n=105, últimos 2 anos) | |
| Lenovo Legion 5 16IRX G9 | |
| Cinebench R15 / CPU Single 64Bit | |
| Razer Blade 16 2024, RTX 4090 | |
| Média Intel Core i9-14900HX (247 - 323, n=37) | |
| Lenovo Legion 9 16IRX8 | |
| Schenker XMG Neo 16 E23 | |
| Média da turma Gaming (188.8 - 350, n=106, últimos 2 anos) | |
| Lenovo Legion 5 16IRX G9 | |
| Razer Blade 16 Early 2023 RTX 4090 | |
| Blender / v2.79 BMW27 CPU | |
| Média da turma Gaming (79 - 330, n=104, últimos 2 anos) | |
| Lenovo Legion 5 16IRX G9 | |
| Média Intel Core i9-14900HX (91 - 206, n=37) | |
| Razer Blade 16 Early 2023 RTX 4090 | |
| Schenker XMG Neo 16 E23 | |
| Razer Blade 16 2024, RTX 4090 | |
| Lenovo Legion 9 16IRX8 | |
| 7-Zip 18.03 / 7z b 4 | |
| Lenovo Legion 9 16IRX8 | |
| Razer Blade 16 2024, RTX 4090 | |
| Schenker XMG Neo 16 E23 | |
| Média Intel Core i9-14900HX (66769 - 136645, n=37) | |
| Razer Blade 16 Early 2023 RTX 4090 | |
| Lenovo Legion 5 16IRX G9 | |
| Média da turma Gaming (33491 - 148086, n=105, últimos 2 anos) | |
| 7-Zip 18.03 / 7z b 4 -mmt1 | |
| Schenker XMG Neo 16 E23 | |
| Média Intel Core i9-14900HX (5452 - 7545, n=37) | |
| Razer Blade 16 2024, RTX 4090 | |
| Lenovo Legion 9 16IRX8 | |
| Razer Blade 16 Early 2023 RTX 4090 | |
| Lenovo Legion 5 16IRX G9 | |
| Média da turma Gaming (4199 - 7436, n=105, últimos 2 anos) | |
| Geekbench 6.7 / Multi-Core | |
| Razer Blade 16 2024, RTX 4090 | |
| Lenovo Legion 9 16IRX8 | |
| Média Intel Core i9-14900HX (13158 - 19665, n=37) | |
| Lenovo Legion 5 16IRX G9 | |
| Média da turma Gaming (6625 - 22850, n=106, últimos 2 anos) | |
| Geekbench 6.7 / Single-Core | |
| Média Intel Core i9-14900HX (2419 - 3129, n=37) | |
| Razer Blade 16 2024, RTX 4090 | |
| Lenovo Legion 9 16IRX8 | |
| Média da turma Gaming (1490 - 3259, n=106, últimos 2 anos) | |
| Lenovo Legion 5 16IRX G9 | |
| Geekbench 5.5 / Multi-Core | |
| Schenker XMG Neo 16 E23 | |
| Lenovo Legion 9 16IRX8 | |
| Média Intel Core i9-14900HX (8618 - 23194, n=37) | |
| Razer Blade 16 2024, RTX 4090 | |
| Média da turma Gaming (6460 - 28263, n=105, últimos 2 anos) | |
| Lenovo Legion 5 16IRX G9 | |
| Razer Blade 16 Early 2023 RTX 4090 | |
| Geekbench 5.5 / Single-Core | |
| Lenovo Legion 9 16IRX8 | |
| Razer Blade 16 2024, RTX 4090 | |
| Média Intel Core i9-14900HX (1669 - 2210, n=37) | |
| Média da turma Gaming (986 - 2474, n=105, últimos 2 anos) | |
| Schenker XMG Neo 16 E23 | |
| Razer Blade 16 Early 2023 RTX 4090 | |
| Lenovo Legion 5 16IRX G9 | |
| HWBOT x265 Benchmark v2.2 / 4k Preset | |
| Lenovo Legion 9 16IRX8 | |
| Schenker XMG Neo 16 E23 | |
| Razer Blade 16 Early 2023 RTX 4090 | |
| Razer Blade 16 2024, RTX 4090 | |
| Média Intel Core i9-14900HX (16.8 - 38.9, n=37) | |
| Média da turma Gaming (11.5 - 44.4, n=105, últimos 2 anos) | |
| Lenovo Legion 5 16IRX G9 | |
| LibreOffice / 20 Documents To PDF | |
| Razer Blade 16 Early 2023 RTX 4090 | |
| Média da turma Gaming (33.2 - 88.8, n=105, últimos 2 anos) | |
| Razer Blade 16 2024, RTX 4090 | |
| Lenovo Legion 5 16IRX G9 | |
| Média Intel Core i9-14900HX (19 - 85.1, n=37) | |
| Schenker XMG Neo 16 E23 | |
| Lenovo Legion 9 16IRX8 | |
| R Benchmark 2.5 / Overall mean | |
| Média da turma Gaming (0.3439 - 0.759, n=106, últimos 2 anos) | |
| Lenovo Legion 5 16IRX G9 | |
| Razer Blade 16 Early 2023 RTX 4090 | |
| Média Intel Core i9-14900HX (0.3604 - 0.4859, n=37) | |
| Lenovo Legion 9 16IRX8 | |
| Razer Blade 16 2024, RTX 4090 | |
| Schenker XMG Neo 16 E23 | |
* ... menor é melhor
AIDA64: FP32 Ray-Trace | FPU Julia | CPU SHA3 | CPU Queen | FPU SinJulia | FPU Mandel | CPU AES | CPU ZLib | FP64 Ray-Trace | CPU PhotoWorxx
| Performance rating | |
| Lenovo Legion 9 16IRX8 | |
| Média da turma Gaming | |
| Razer Blade 16 2024, RTX 4090 | |
| Schenker XMG Neo 16 E23 | |
| Média Intel Core i9-14900HX | |
| Razer Blade 16 Early 2023 RTX 4090 | |
| Lenovo Legion 5 16IRX G9 | |
| AIDA64 / FP32 Ray-Trace | |
| Média da turma Gaming (10227 - 85542, n=105, últimos 2 anos) | |
| Lenovo Legion 9 16IRX8 | |
| Razer Blade 16 2024, RTX 4090 | |
| Média Intel Core i9-14900HX (13098 - 33474, n=36) | |
| Schenker XMG Neo 16 E23 | |
| Lenovo Legion 5 16IRX G9 | |
| Razer Blade 16 Early 2023 RTX 4090 | |
| AIDA64 / FPU Julia | |
| Média da turma Gaming (51376 - 238426, n=105, últimos 2 anos) | |
| Lenovo Legion 9 16IRX8 | |
| Razer Blade 16 2024, RTX 4090 | |
| Média Intel Core i9-14900HX (67573 - 166040, n=36) | |
| Schenker XMG Neo 16 E23 | |
| Razer Blade 16 Early 2023 RTX 4090 | |
| Lenovo Legion 5 16IRX G9 | |
| AIDA64 / CPU SHA3 | |
| Lenovo Legion 9 16IRX8 | |
| Média da turma Gaming (2180 - 10115, n=105, últimos 2 anos) | |
| Razer Blade 16 2024, RTX 4090 | |
| Média Intel Core i9-14900HX (3589 - 7979, n=36) | |
| Schenker XMG Neo 16 E23 | |
| Razer Blade 16 Early 2023 RTX 4090 | |
| Lenovo Legion 5 16IRX G9 | |
| AIDA64 / CPU Queen | |
| Razer Blade 16 2024, RTX 4090 | |
| Média Intel Core i9-14900HX (118405 - 148966, n=36) | |
| Razer Blade 16 Early 2023 RTX 4090 | |
| Schenker XMG Neo 16 E23 | |
| Lenovo Legion 9 16IRX8 | |
| Média da turma Gaming (49785 - 173351, n=90, últimos 2 anos) | |
| Lenovo Legion 5 16IRX G9 | |
| AIDA64 / FPU SinJulia | |
| Razer Blade 16 2024, RTX 4090 | |
| Lenovo Legion 9 16IRX8 | |
| Média Intel Core i9-14900HX (10475 - 18517, n=36) | |
| Schenker XMG Neo 16 E23 | |
| Média da turma Gaming (4424 - 33636, n=105, últimos 2 anos) | |
| Razer Blade 16 Early 2023 RTX 4090 | |
| Lenovo Legion 5 16IRX G9 | |
| AIDA64 / FPU Mandel | |
| Média da turma Gaming (25115 - 128721, n=105, últimos 2 anos) | |
| Lenovo Legion 9 16IRX8 | |
| Razer Blade 16 2024, RTX 4090 | |
| Média Intel Core i9-14900HX (32543 - 83662, n=36) | |
| Schenker XMG Neo 16 E23 | |
| Lenovo Legion 5 16IRX G9 | |
| Razer Blade 16 Early 2023 RTX 4090 | |
| AIDA64 / CPU AES | |
| Schenker XMG Neo 16 E23 | |
| Razer Blade 16 Early 2023 RTX 4090 | |
| Média Intel Core i9-14900HX (86964 - 241777, n=36) | |
| Lenovo Legion 9 16IRX8 | |
| Razer Blade 16 2024, RTX 4090 | |
| Média da turma Gaming (39258 - 247074, n=105, últimos 2 anos) | |
| Lenovo Legion 5 16IRX G9 | |
| AIDA64 / CPU ZLib | |
| Lenovo Legion 9 16IRX8 | |
| Razer Blade 16 2024, RTX 4090 | |
| Média Intel Core i9-14900HX (1054 - 2292, n=36) | |
| Schenker XMG Neo 16 E23 | |
| Razer Blade 16 Early 2023 RTX 4090 | |
| Média da turma Gaming (574 - 2531, n=105, últimos 2 anos) | |
| Lenovo Legion 5 16IRX G9 | |
| AIDA64 / FP64 Ray-Trace | |
| Média da turma Gaming (5509 - 45446, n=105, últimos 2 anos) | |
| Lenovo Legion 9 16IRX8 | |
| Razer Blade 16 2024, RTX 4090 | |
| Média Intel Core i9-14900HX (6809 - 18349, n=36) | |
| Schenker XMG Neo 16 E23 | |
| Lenovo Legion 5 16IRX G9 | |
| Razer Blade 16 Early 2023 RTX 4090 | |
| AIDA64 / CPU PhotoWorxx | |
| Razer Blade 16 Early 2023 RTX 4090 | |
| Lenovo Legion 9 16IRX8 | |
| Razer Blade 16 2024, RTX 4090 | |
| Schenker XMG Neo 16 E23 | |
| Média Intel Core i9-14900HX (23903 - 54702, n=36) | |
| Média da turma Gaming (12271 - 89891, n=105, últimos 2 anos) | |
| Lenovo Legion 5 16IRX G9 | |
Desempenho do sistema
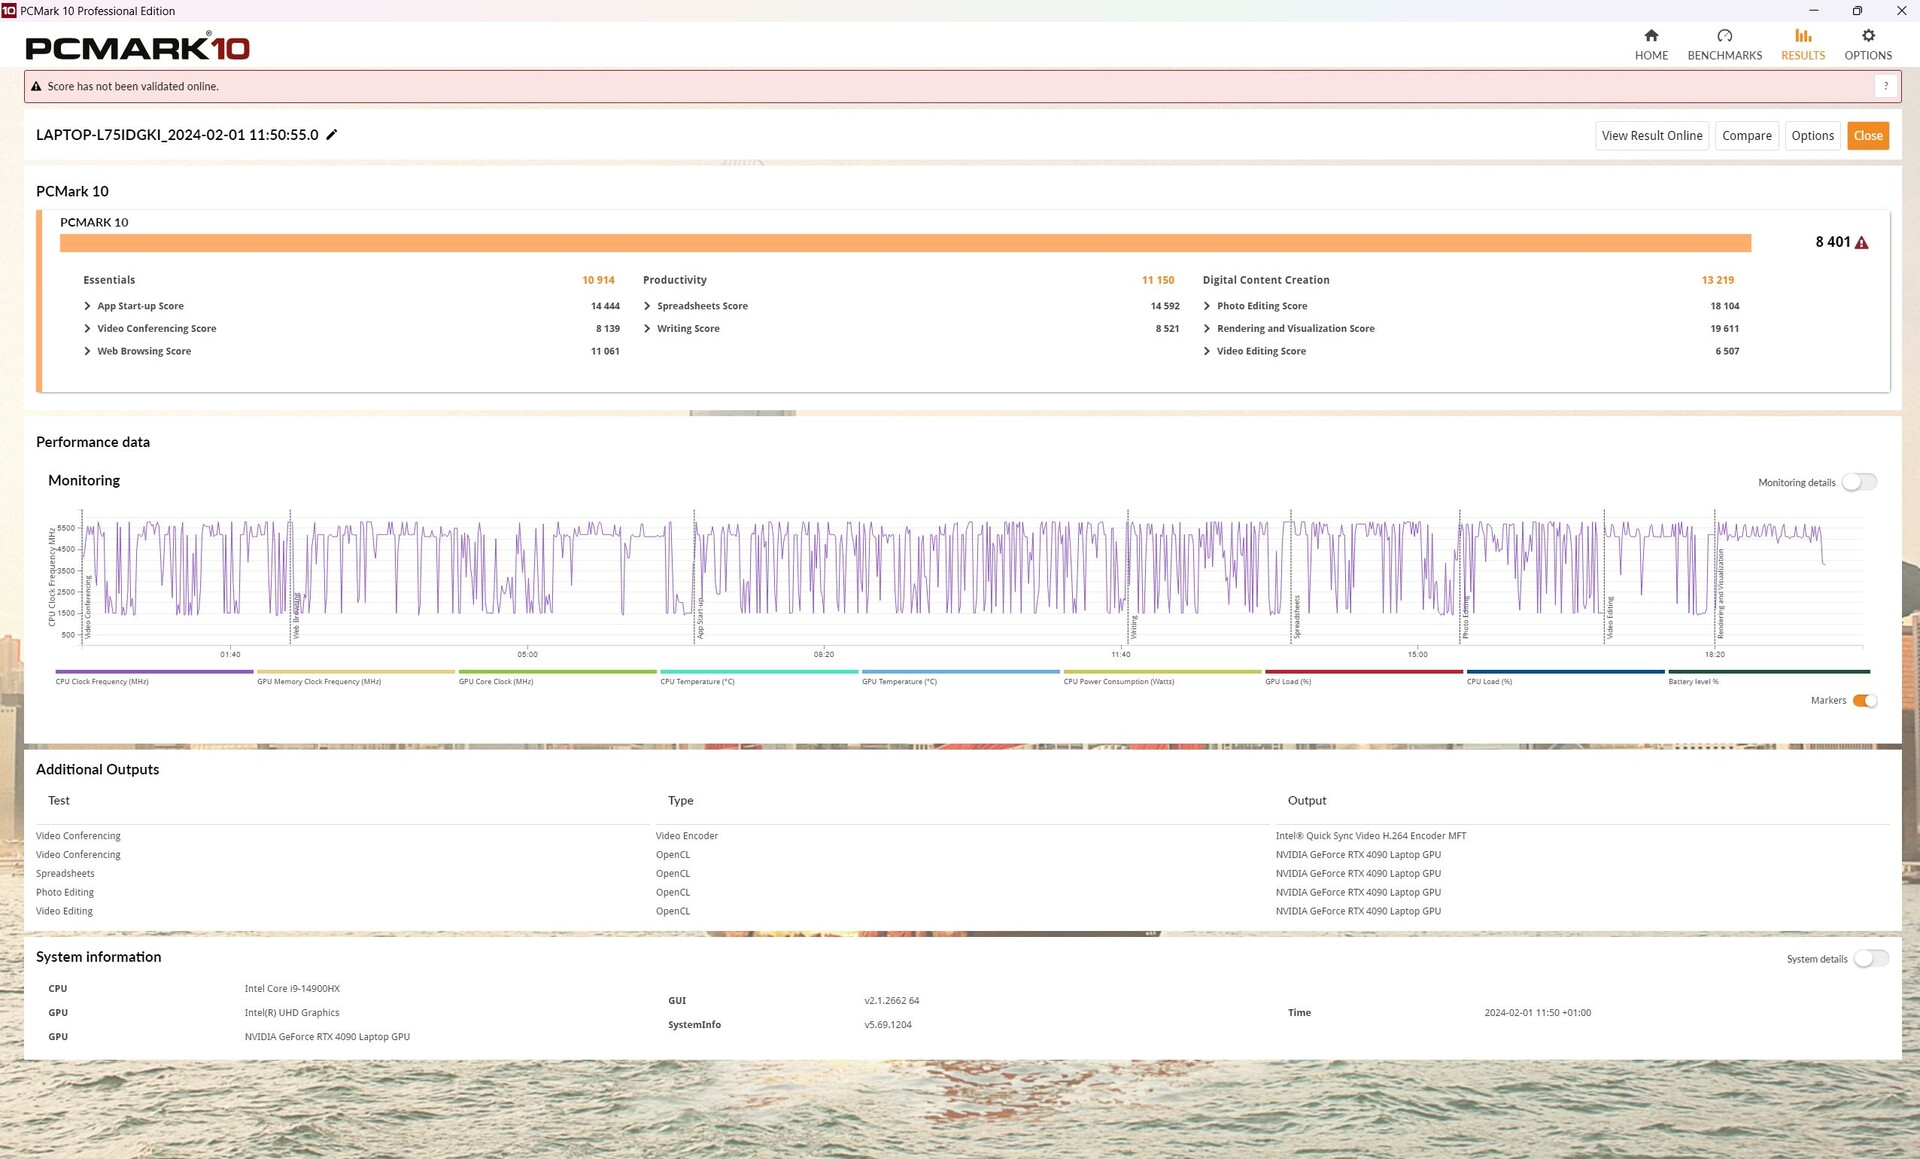
Durante o CrossMark, o Blade 16 assumiu a liderança sobre os dispositivos de comparação, enquanto no PCMark 10, o gamer ficou cerca de 3% atrás do laptop médio com a mesma combinação de CPU/GPU. No total, todos os dispositivos de comparação alcançaram valores semelhantes.
Subjetivamente, o sistema funciona sem problemas - apenas a troca de gráficos faz com que ele congele por alguns segundos ao iniciar os aplicativos, mas esse também é o caso de muitos outros gamers com dGPUs.
CrossMark: Overall | Productivity | Creativity | Responsiveness
WebXPRT 3: Overall
WebXPRT 4: Overall
Mozilla Kraken 1.1: Total
| PCMark 10 / Score | |
| Lenovo Legion 9 16IRX8 | |
| Média Intel Core i9-14900HX, NVIDIA GeForce RTX 4090 Laptop GPU (8230 - 9234, n=13) | |
| Média da turma Gaming (5828 - 12414, n=93, últimos 2 anos) | |
| Razer Blade 16 2024, RTX 4090 | |
| Schenker XMG Neo 16 E23 | |
| Lenovo Legion 5 16IRX G9 | |
| Razer Blade 16 Early 2023 RTX 4090 | |
| PCMark 10 / Essentials | |
| Lenovo Legion 9 16IRX8 | |
| Média Intel Core i9-14900HX, NVIDIA GeForce RTX 4090 Laptop GPU (10778 - 11628, n=13) | |
| Schenker XMG Neo 16 E23 | |
| Razer Blade 16 2024, RTX 4090 | |
| Razer Blade 16 Early 2023 RTX 4090 | |
| Lenovo Legion 5 16IRX G9 | |
| Média da turma Gaming (8810 - 11935, n=97, últimos 2 anos) | |
| PCMark 10 / Productivity | |
| Média da turma Gaming (6845 - 25323, n=95, últimos 2 anos) | |
| Razer Blade 16 2024, RTX 4090 | |
| Lenovo Legion 9 16IRX8 | |
| Média Intel Core i9-14900HX, NVIDIA GeForce RTX 4090 Laptop GPU (9458 - 11759, n=13) | |
| Schenker XMG Neo 16 E23 | |
| Lenovo Legion 5 16IRX G9 | |
| Razer Blade 16 Early 2023 RTX 4090 | |
| PCMark 10 / Digital Content Creation | |
| Lenovo Legion 9 16IRX8 | |
| Média Intel Core i9-14900HX, NVIDIA GeForce RTX 4090 Laptop GPU (13219 - 16462, n=13) | |
| Schenker XMG Neo 16 E23 | |
| Média da turma Gaming (7602 - 19954, n=95, últimos 2 anos) | |
| Razer Blade 16 2024, RTX 4090 | |
| Razer Blade 16 Early 2023 RTX 4090 | |
| Lenovo Legion 5 16IRX G9 | |
| CrossMark / Overall | |
| Razer Blade 16 2024, RTX 4090 | |
| Média Intel Core i9-14900HX, NVIDIA GeForce RTX 4090 Laptop GPU (1877 - 2344, n=10) | |
| Schenker XMG Neo 16 E23 | |
| Lenovo Legion 5 16IRX G9 | |
| Razer Blade 16 Early 2023 RTX 4090 | |
| Média da turma Gaming (1366 - 2409, n=94, últimos 2 anos) | |
| Lenovo Legion 9 16IRX8 | |
| CrossMark / Productivity | |
| Razer Blade 16 2024, RTX 4090 | |
| Média Intel Core i9-14900HX, NVIDIA GeForce RTX 4090 Laptop GPU (1738 - 2162, n=10) | |
| Schenker XMG Neo 16 E23 | |
| Lenovo Legion 5 16IRX G9 | |
| Razer Blade 16 Early 2023 RTX 4090 | |
| Média da turma Gaming (1386 - 2254, n=94, últimos 2 anos) | |
| Lenovo Legion 9 16IRX8 | |
| CrossMark / Creativity | |
| Schenker XMG Neo 16 E23 | |
| Razer Blade 16 2024, RTX 4090 | |
| Média Intel Core i9-14900HX, NVIDIA GeForce RTX 4090 Laptop GPU (2195 - 2660, n=10) | |
| Lenovo Legion 5 16IRX G9 | |
| Lenovo Legion 9 16IRX8 | |
| Média da turma Gaming (1343 - 2786, n=94, últimos 2 anos) | |
| Razer Blade 16 Early 2023 RTX 4090 | |
| CrossMark / Responsiveness | |
| Lenovo Legion 5 16IRX G9 | |
| Média Intel Core i9-14900HX, NVIDIA GeForce RTX 4090 Laptop GPU (1478 - 2327, n=10) | |
| Razer Blade 16 2024, RTX 4090 | |
| Razer Blade 16 Early 2023 RTX 4090 | |
| Schenker XMG Neo 16 E23 | |
| Média da turma Gaming (1226 - 2334, n=94, últimos 2 anos) | |
| Lenovo Legion 9 16IRX8 | |
| WebXPRT 3 / Overall | |
| Lenovo Legion 9 16IRX8 | |
| Schenker XMG Neo 16 E23 | |
| Razer Blade 16 2024, RTX 4090 | |
| Média Intel Core i9-14900HX, NVIDIA GeForce RTX 4090 Laptop GPU (279 - 339, n=10) | |
| Média da turma Gaming (220 - 532, n=98, últimos 2 anos) | |
| Lenovo Legion 5 16IRX G9 | |
| Razer Blade 16 Early 2023 RTX 4090 | |
| Razer Blade 16 Early 2023 RTX 4090 | |
| WebXPRT 4 / Overall | |
| Lenovo Legion 9 16IRX8 | |
| Schenker XMG Neo 16 E23 | |
| Média Intel Core i9-14900HX, NVIDIA GeForce RTX 4090 Laptop GPU (246 - 309, n=8) | |
| Média da turma Gaming (165 - 354, n=98, últimos 2 anos) | |
| Razer Blade 16 Early 2023 RTX 4090 | |
| Razer Blade 16 Early 2023 RTX 4090 | |
| Razer Blade 16 Early 2023 RTX 4090 | |
| Lenovo Legion 5 16IRX G9 | |
| Mozilla Kraken 1.1 / Total | |
| Lenovo Legion 5 16IRX G9 | |
| Razer Blade 16 Early 2023 RTX 4090 | |
| Razer Blade 16 Early 2023 RTX 4090 | |
| Média da turma Gaming (391 - 590, n=100, últimos 2 anos) | |
| Média Intel Core i9-14900HX, NVIDIA GeForce RTX 4090 Laptop GPU (428 - 535, n=11) | |
| Schenker XMG Neo 16 E23 | |
| Razer Blade 16 2024, RTX 4090 | |
| Lenovo Legion 9 16IRX8 | |
* ... menor é melhor
| PCMark 10 Score | 8401 pontos | |
Ajuda | ||
| AIDA64 / Memory Copy | |
| Razer Blade 16 2024, RTX 4090 | |
| Razer Blade 16 Early 2023 RTX 4090 | |
| Lenovo Legion 9 16IRX8 | |
| Schenker XMG Neo 16 E23 | |
| Média Intel Core i9-14900HX (38028 - 83392, n=36) | |
| Média da turma Gaming (21750 - 129946, n=105, últimos 2 anos) | |
| Lenovo Legion 5 16IRX G9 | |
| AIDA64 / Memory Read | |
| Razer Blade 16 2024, RTX 4090 | |
| Lenovo Legion 9 16IRX8 | |
| Razer Blade 16 Early 2023 RTX 4090 | |
| Schenker XMG Neo 16 E23 | |
| Média Intel Core i9-14900HX (43306 - 87568, n=36) | |
| Média da turma Gaming (22956 - 118858, n=105, últimos 2 anos) | |
| Lenovo Legion 5 16IRX G9 | |
| AIDA64 / Memory Write | |
| Razer Blade 16 Early 2023 RTX 4090 | |
| Lenovo Legion 9 16IRX8 | |
| Média da turma Gaming (22297 - 135096, n=105, últimos 2 anos) | |
| Razer Blade 16 2024, RTX 4090 | |
| Média Intel Core i9-14900HX (37146 - 80589, n=36) | |
| Schenker XMG Neo 16 E23 | |
| Lenovo Legion 5 16IRX G9 | |
| AIDA64 / Memory Latency | |
| Média da turma Gaming (75.3 - 259, n=105, últimos 2 anos) | |
| Lenovo Legion 5 16IRX G9 | |
| Razer Blade 16 Early 2023 RTX 4090 | |
| Schenker XMG Neo 16 E23 | |
| Média Intel Core i9-14900HX (76.1 - 105, n=36) | |
| Lenovo Legion 9 16IRX8 | |
| Razer Blade 16 2024, RTX 4090 | |
* ... menor é melhor
Latência DPC
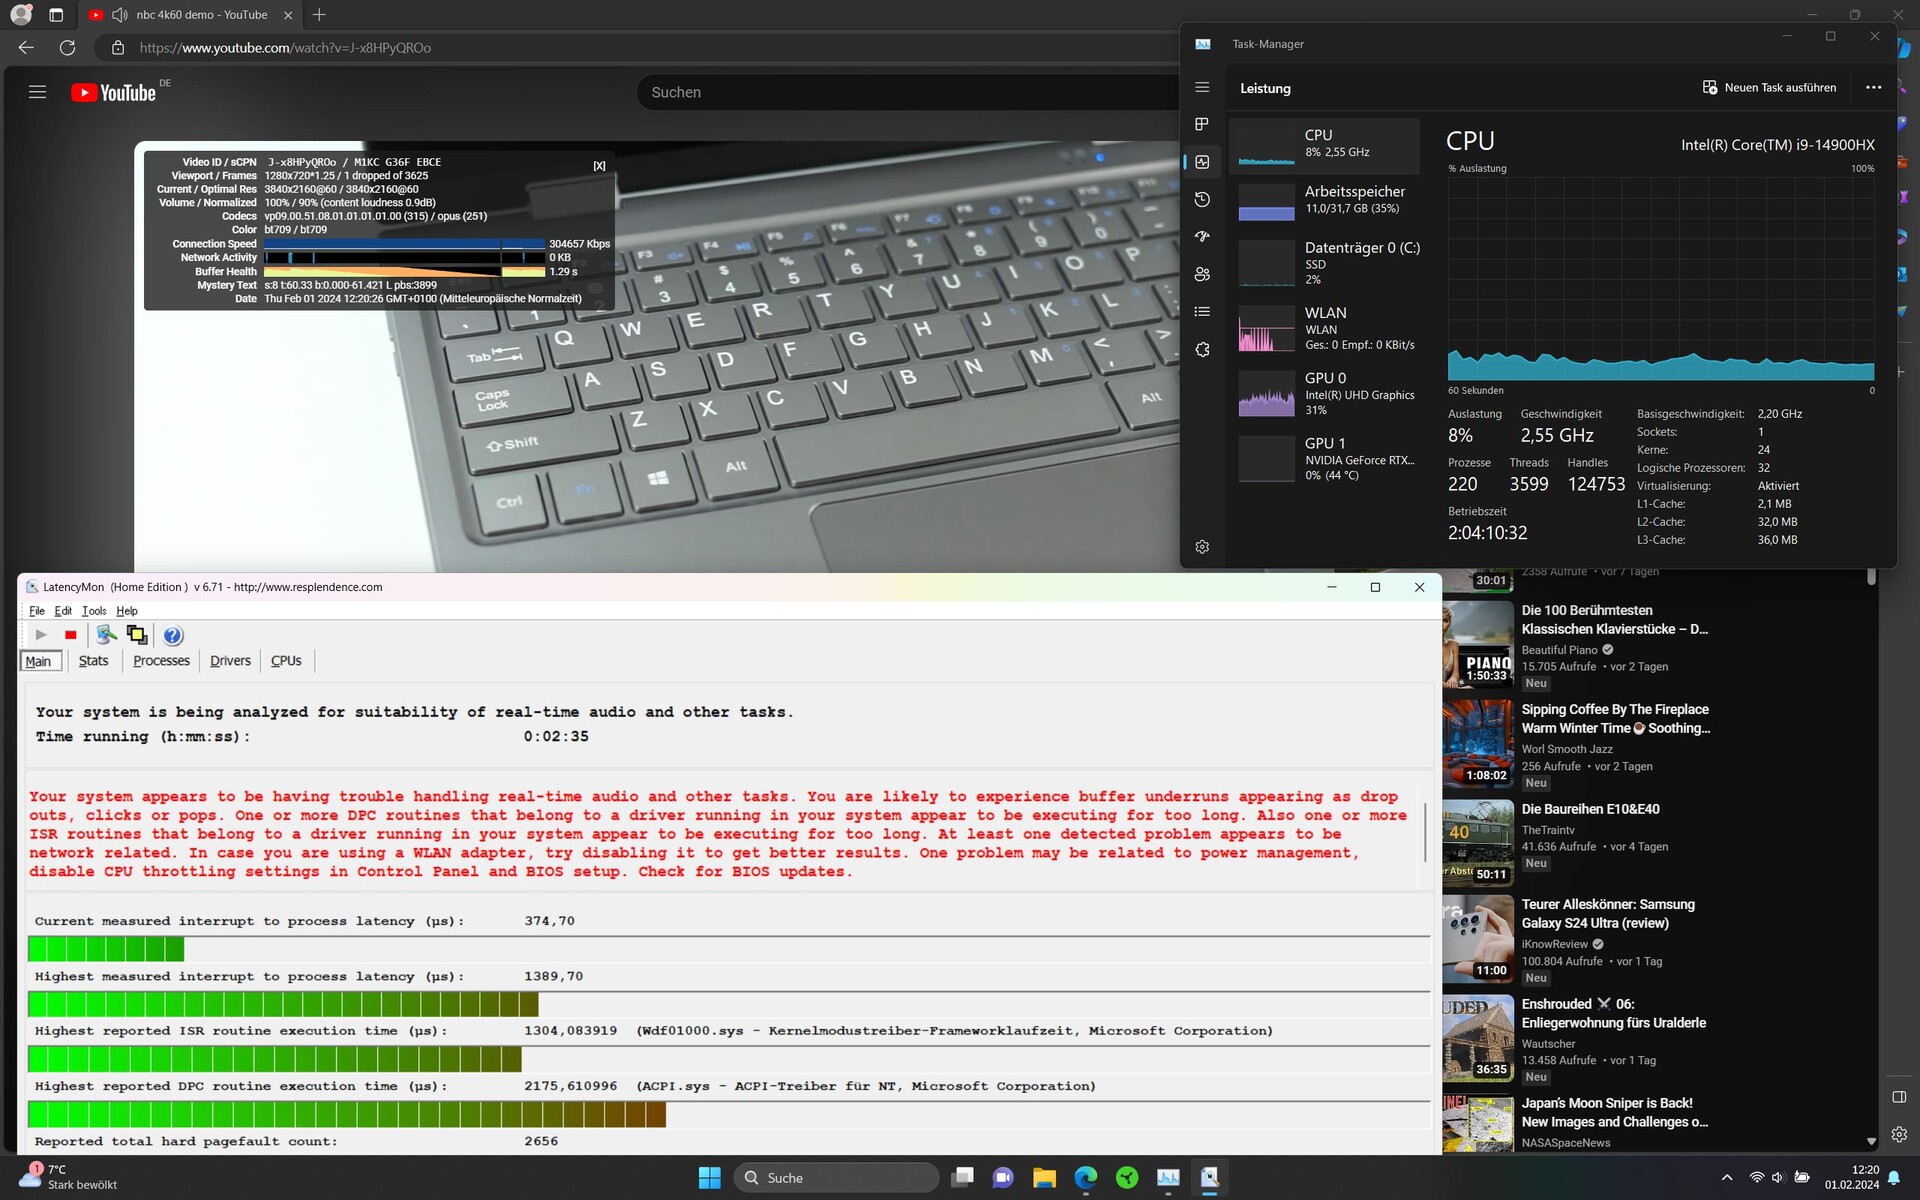
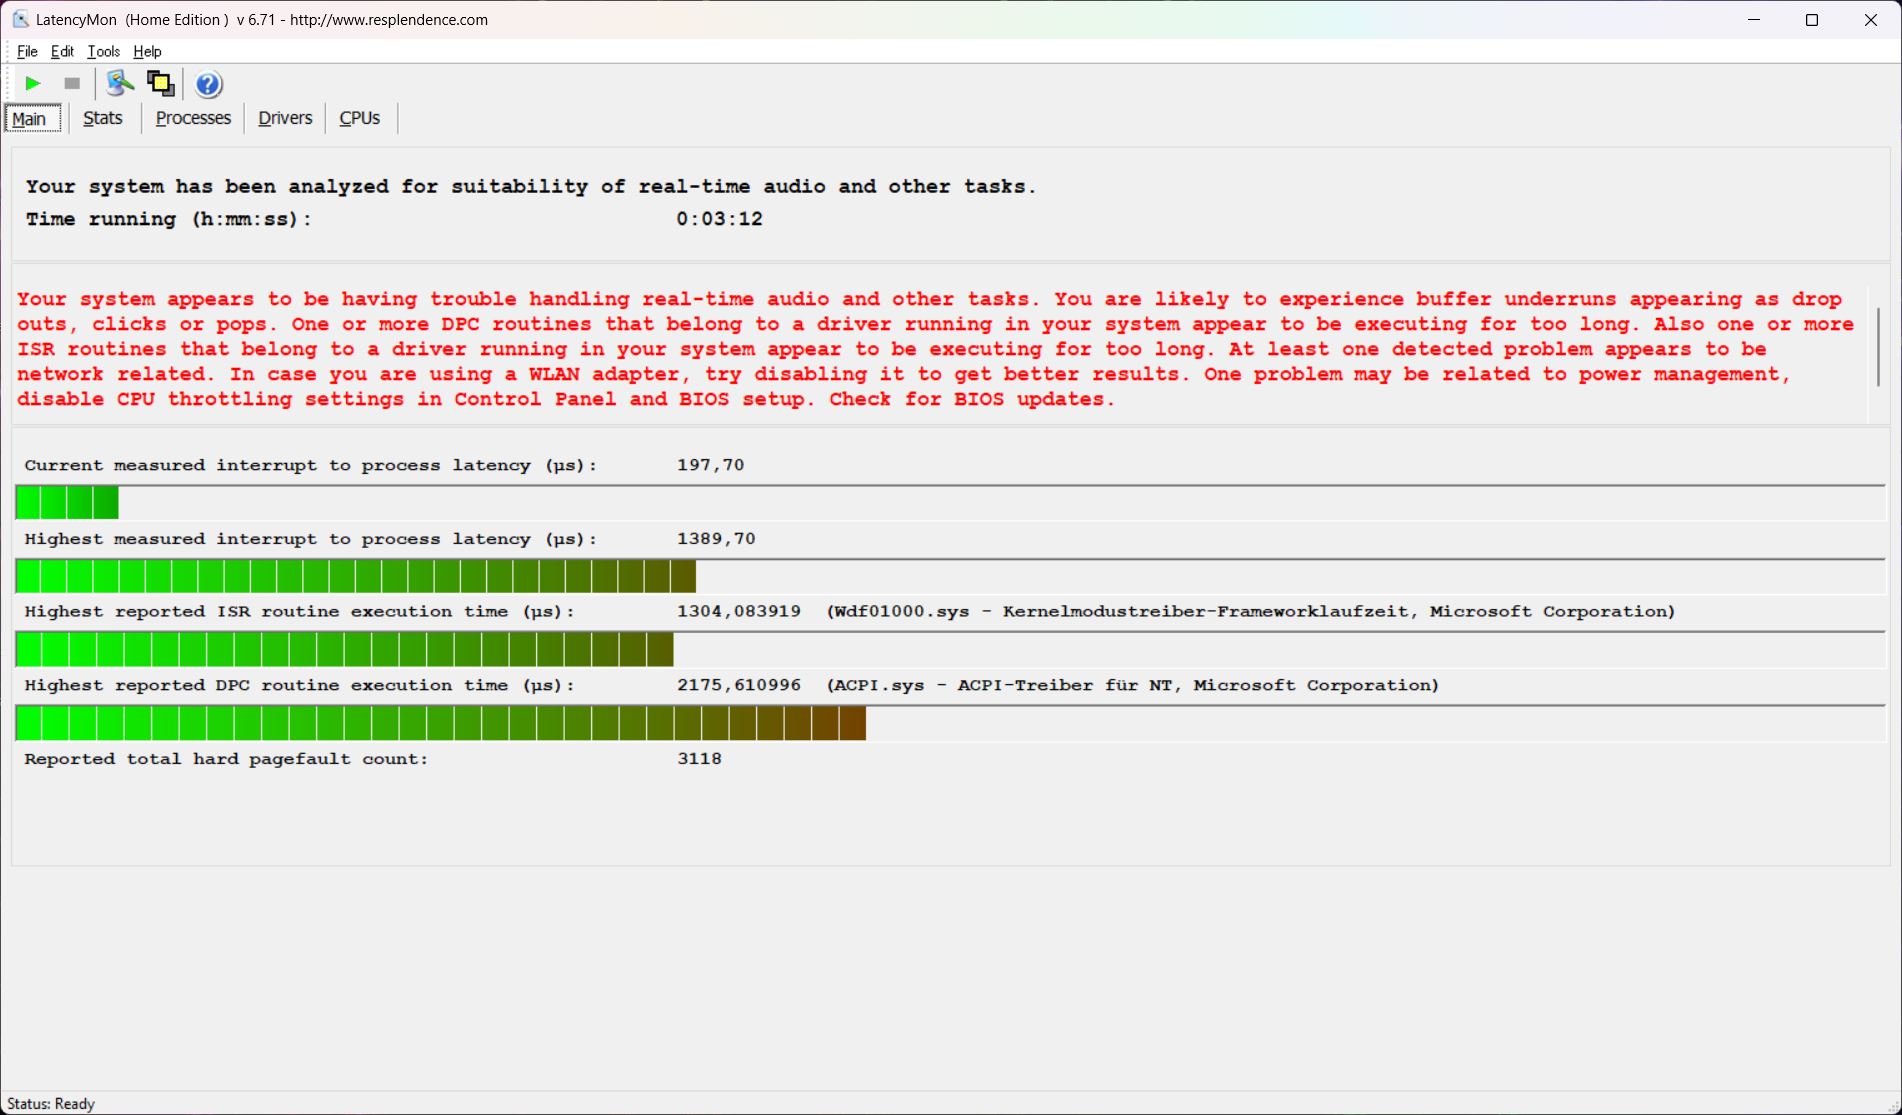
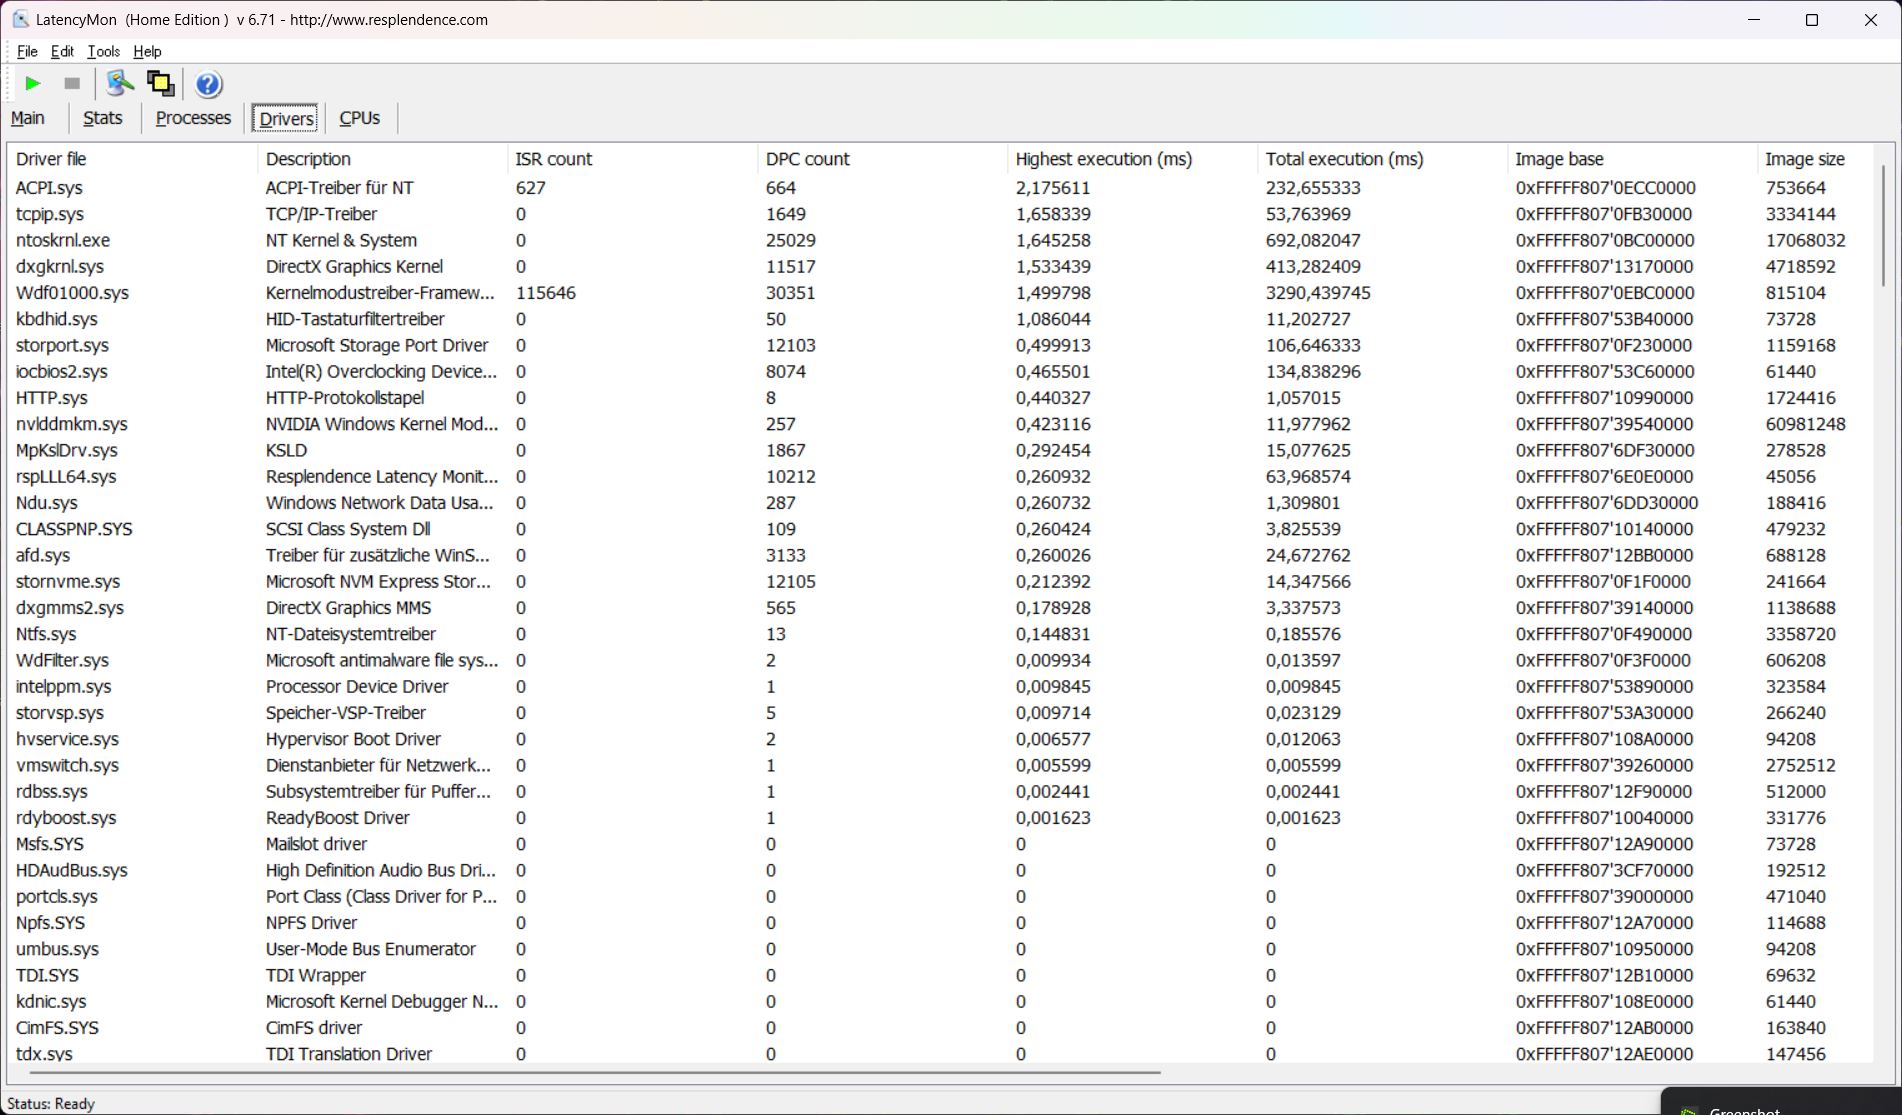
O software LatencyMon detectou pequenas latências assim que o navegador foi aberto. Essas latências aumentaram ao abrir várias guias em nosso site. Nosso vídeo 4K/60 fps do YouTube foi reproduzido sem problemas, mas com um quadro perdido.
| DPC Latencies / LatencyMon - interrupt to process latency (max), Web, Youtube, Prime95 | |
| Razer Blade 16 Early 2023 RTX 4090 | |
| Razer Blade 16 Early 2023 RTX 4090 | |
| Schenker XMG Neo 16 E23 | |
| Lenovo Legion 9 16IRX8 | |
| Lenovo Legion 5 16IRX G9 | |
| Razer Blade 16 2024, RTX 4090 | |
* ... menor é melhor
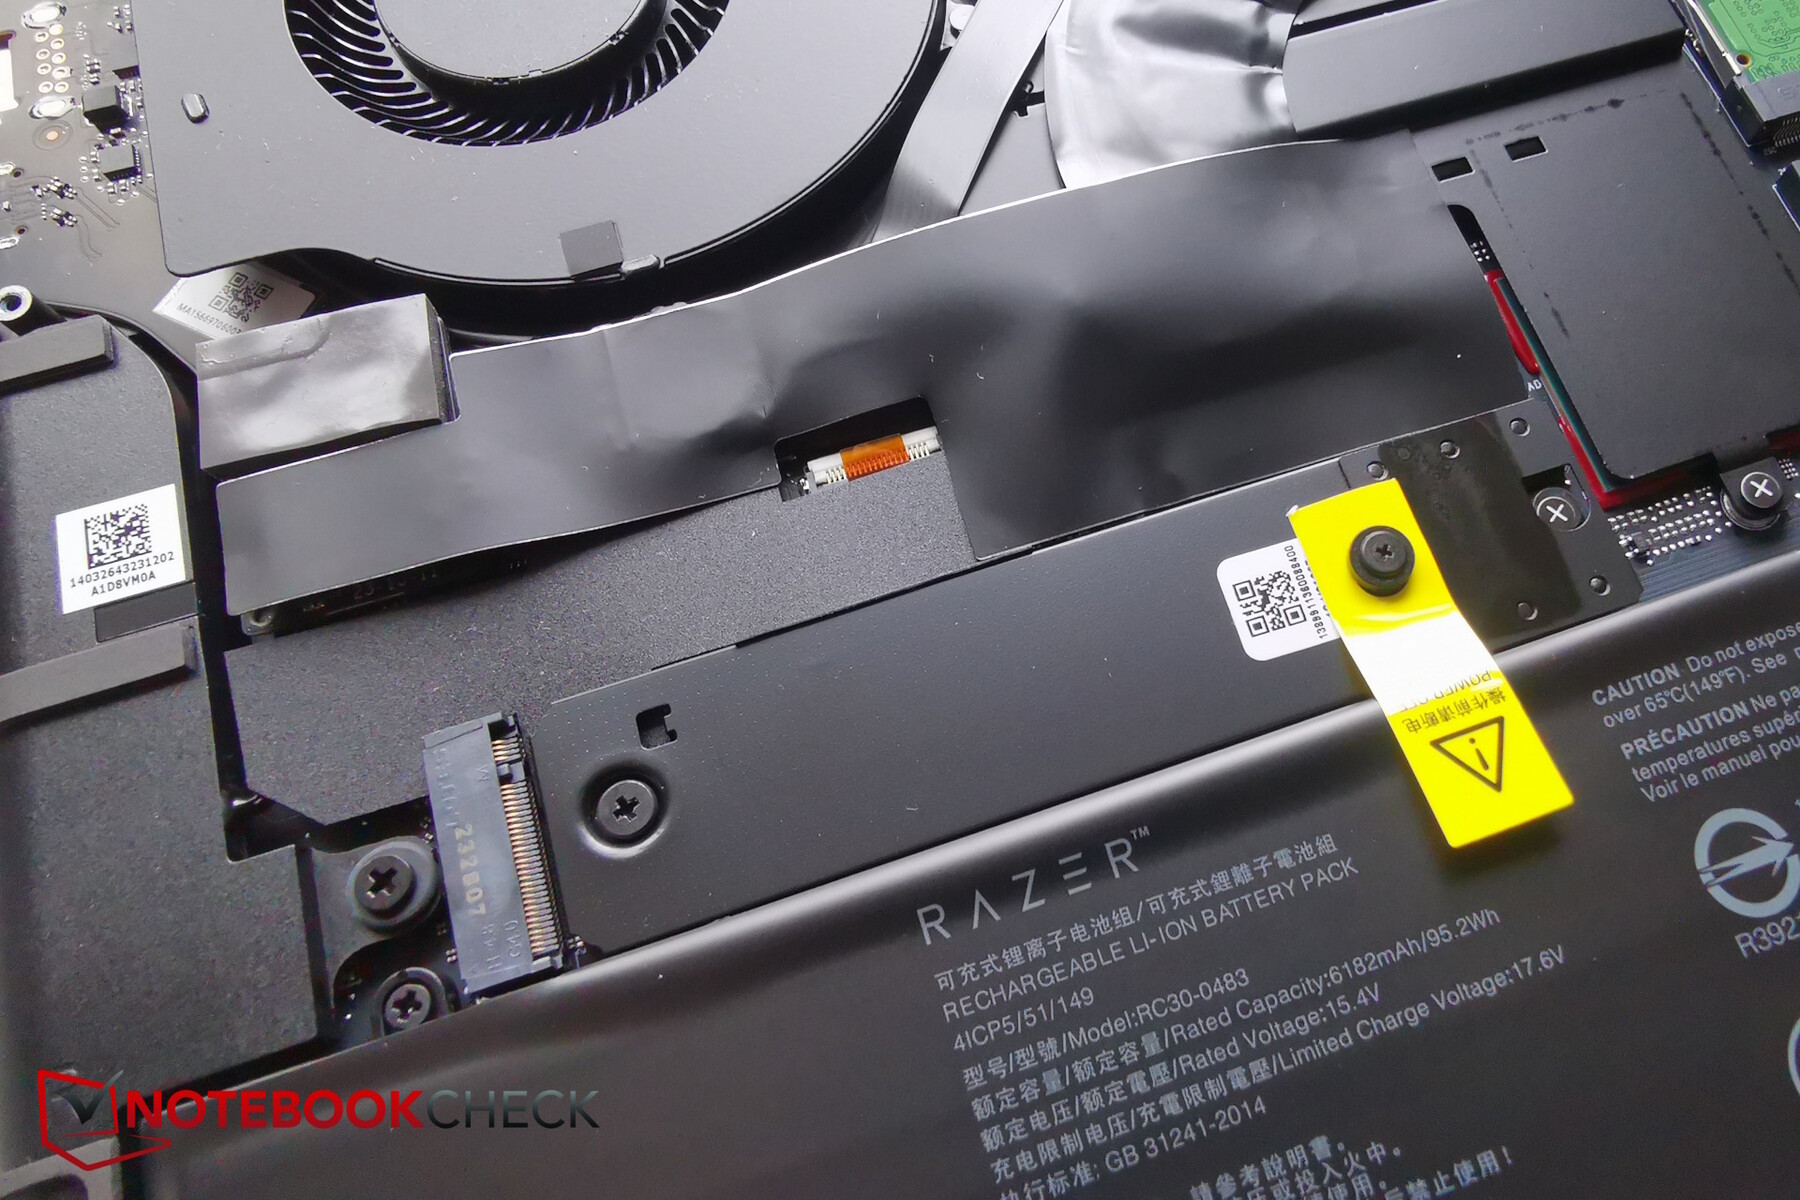
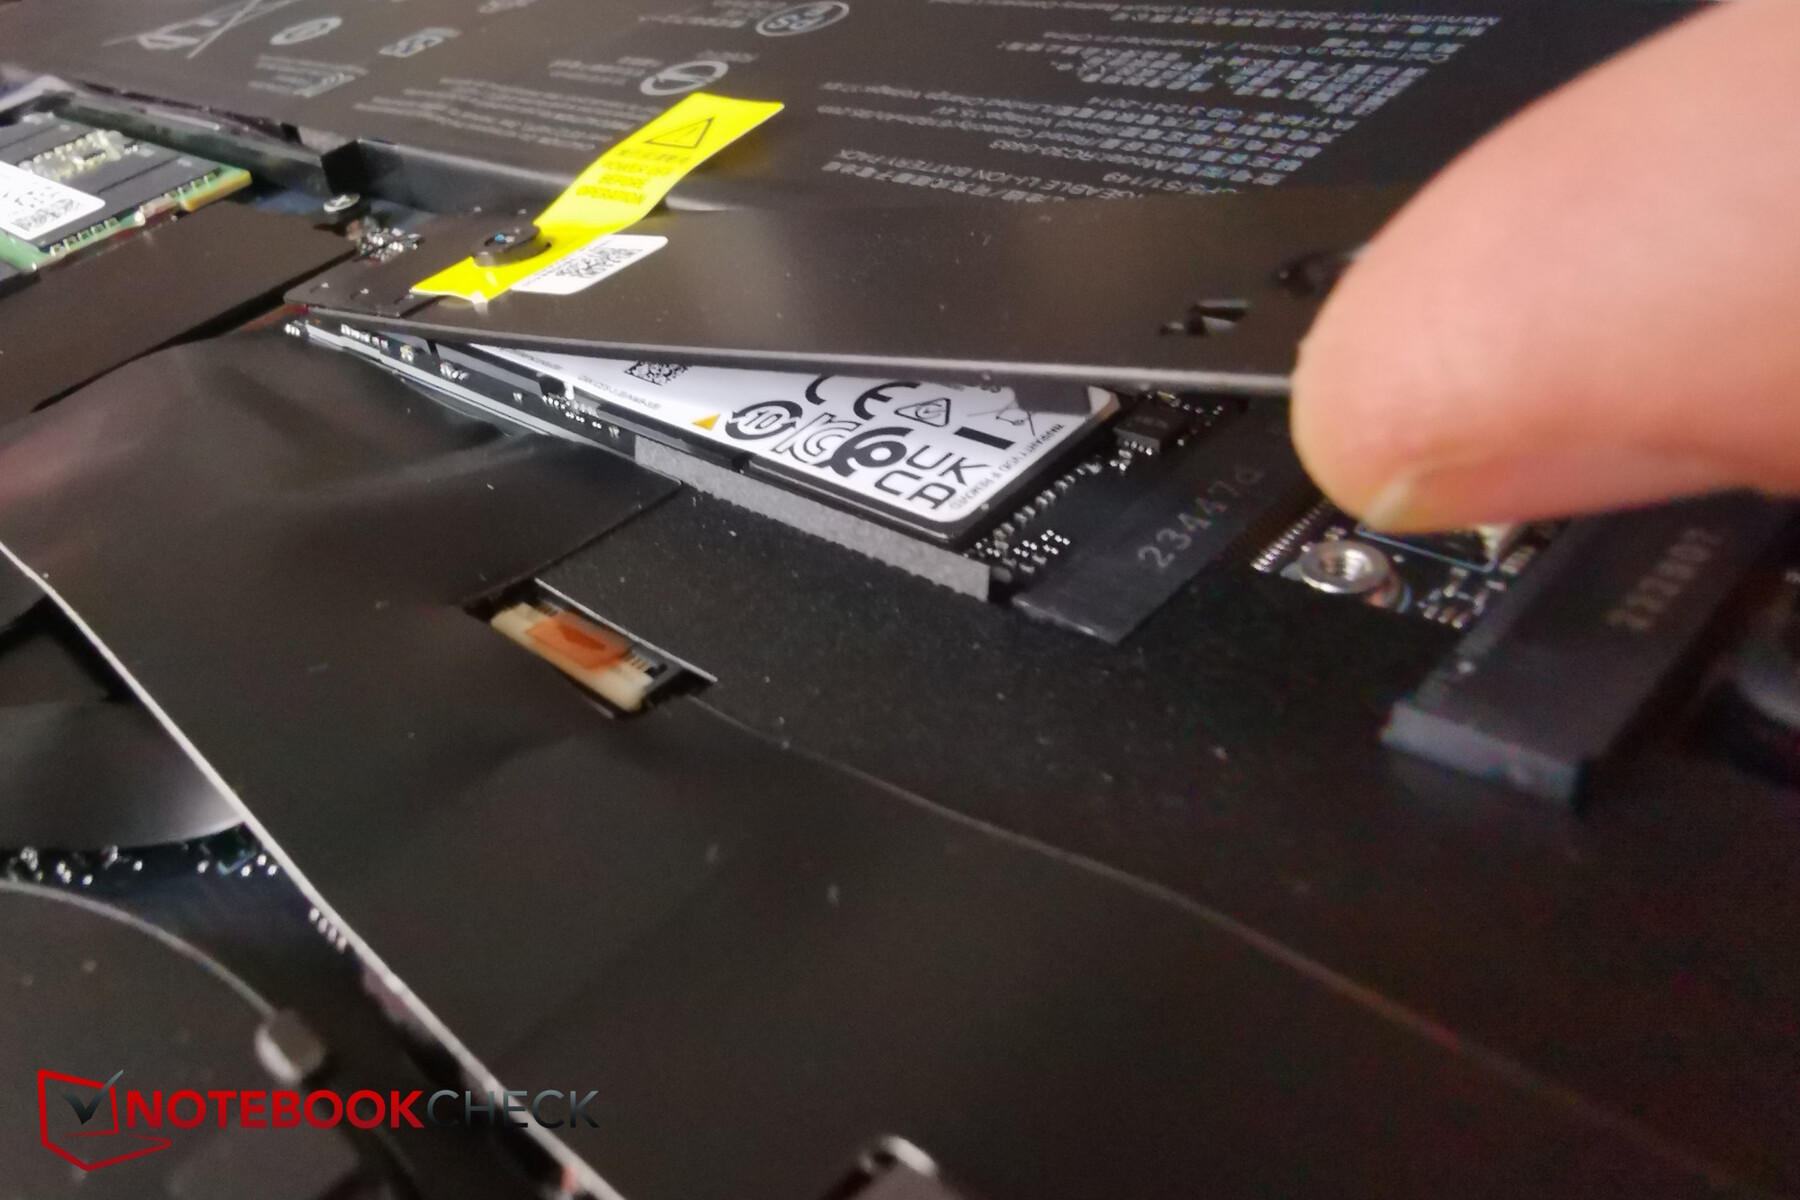
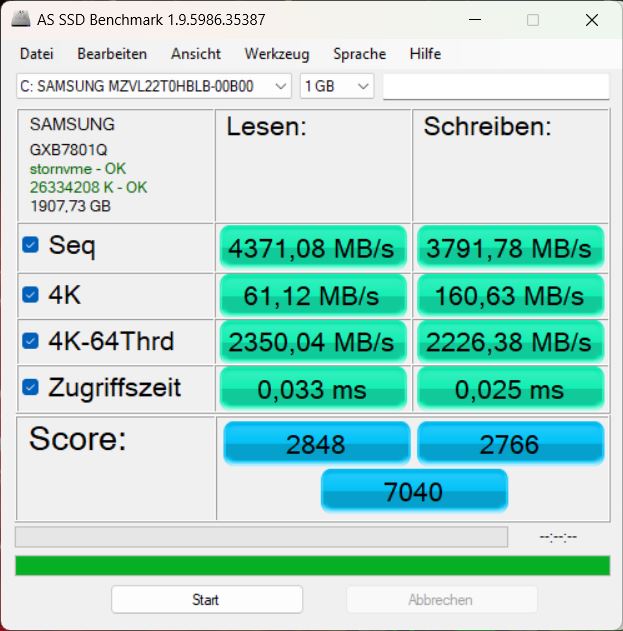
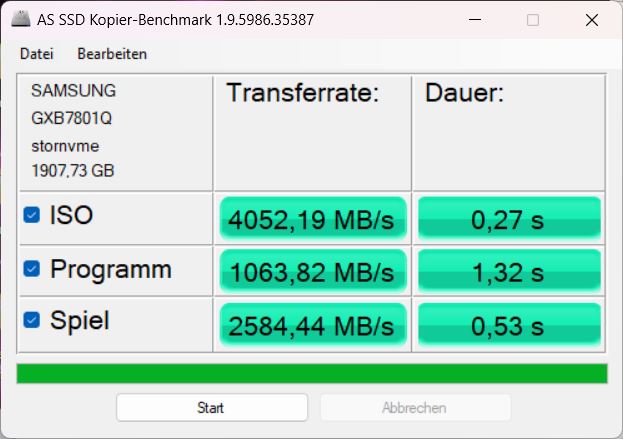
Dispositivos de armazenamento
A Razer instalou um SSD PCIe-4-NVMe de 2 TB da Samsung em nosso dispositivo de teste. O dispositivo de armazenamento relativamente rápido alcançou a posição 13 em nossa lista dos melhores. No Blade, o SSD funcionou inicialmente em velocidades ideais, mas não conseguiu mantê-las estáveis por períodos mais longos - suas taxas de transferência caíram cerca de 30% depois de algum tempo devido à limitação térmica. Posteriormente, ele ainda permaneceu um modelo rápido, mas a Razer deveria tomar medidas para garantir que a limitação térmica não ocorra.

* ... menor é melhor
Reading continuous performance: DiskSpd Read Loop, Queue Depth 8
Placa de vídeo
A RTX 4090 é atualmente a GPU mais potente para laptops. Dentro do Blade 16, ela pode até mesmo usar o máximo de 175 watts (150 watts + 25 watts de Dynamic Boost, dependendo do modo). Ele também possui 16 GB de RAM.
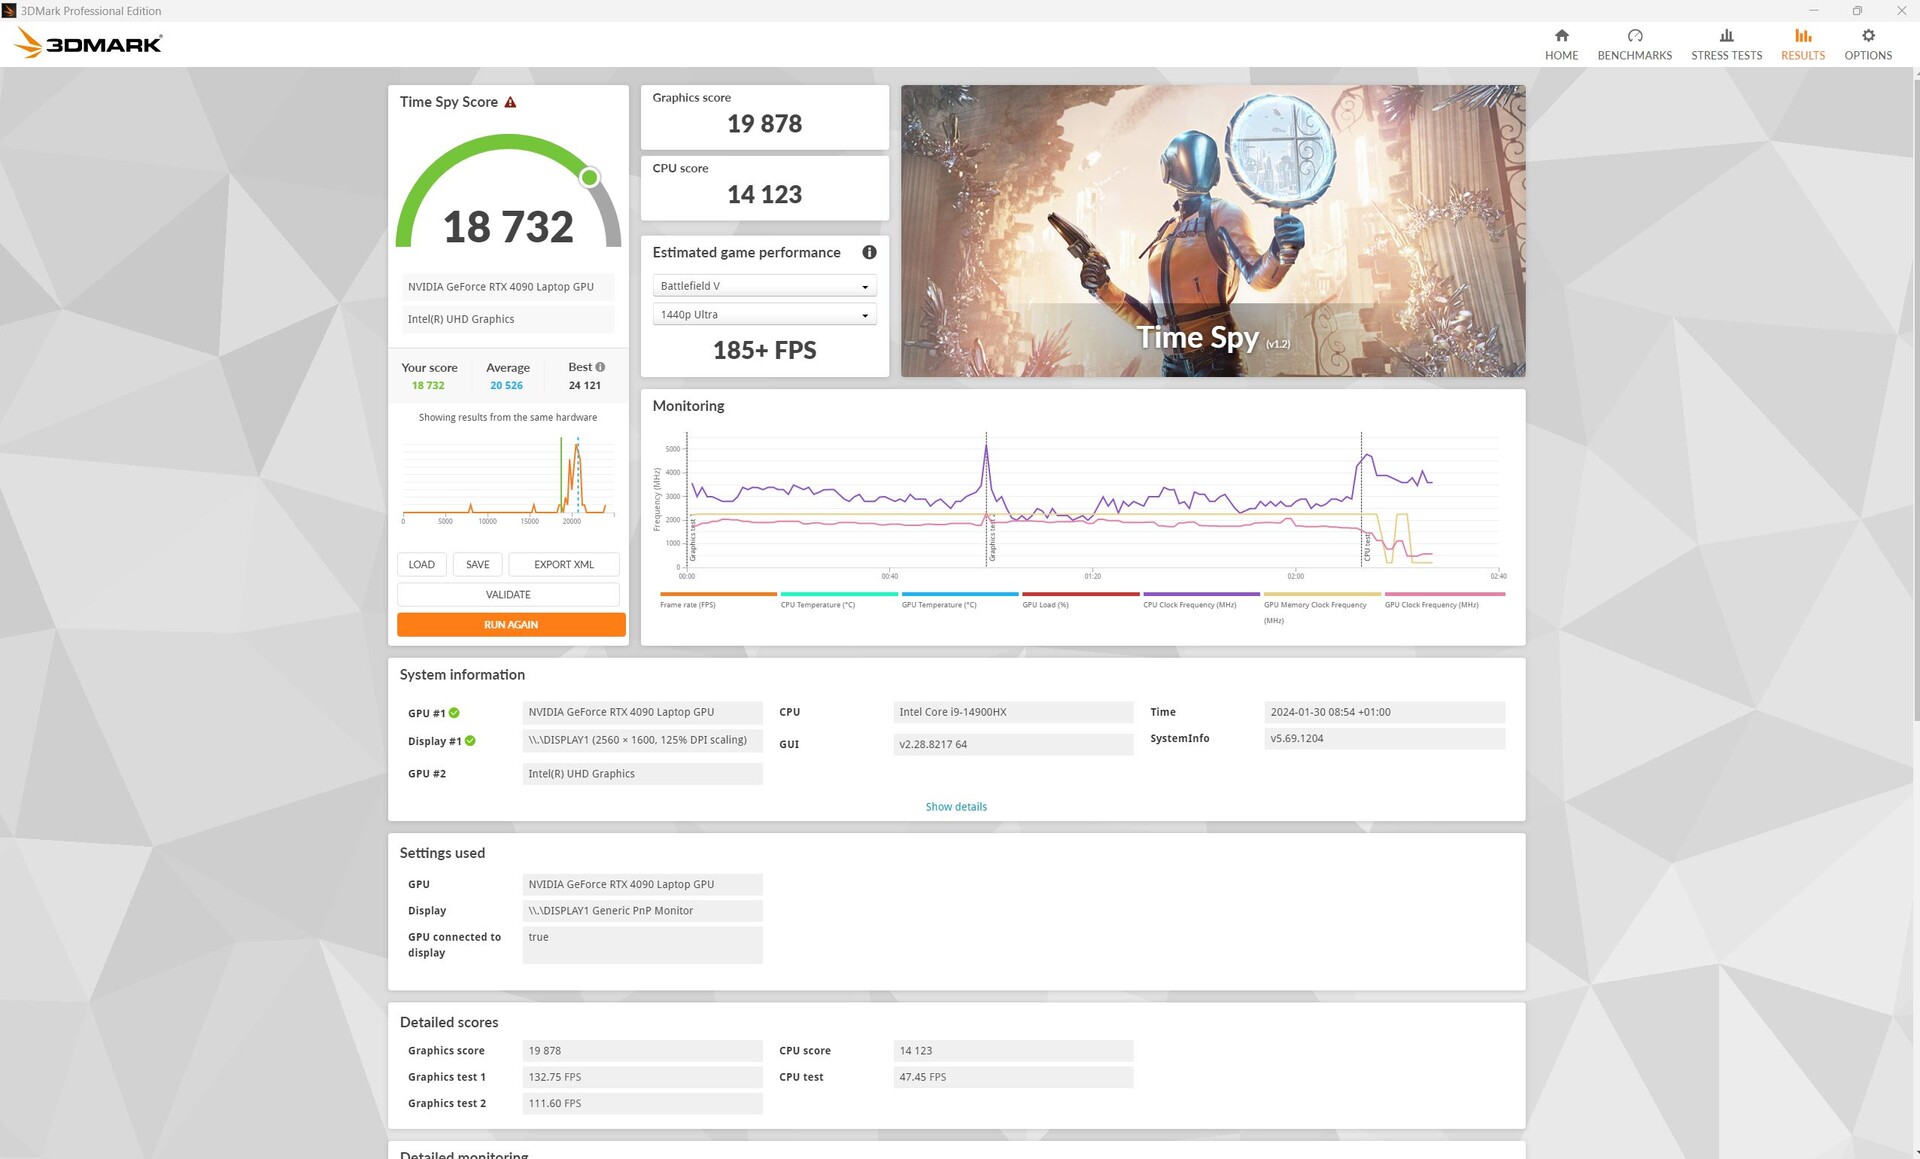
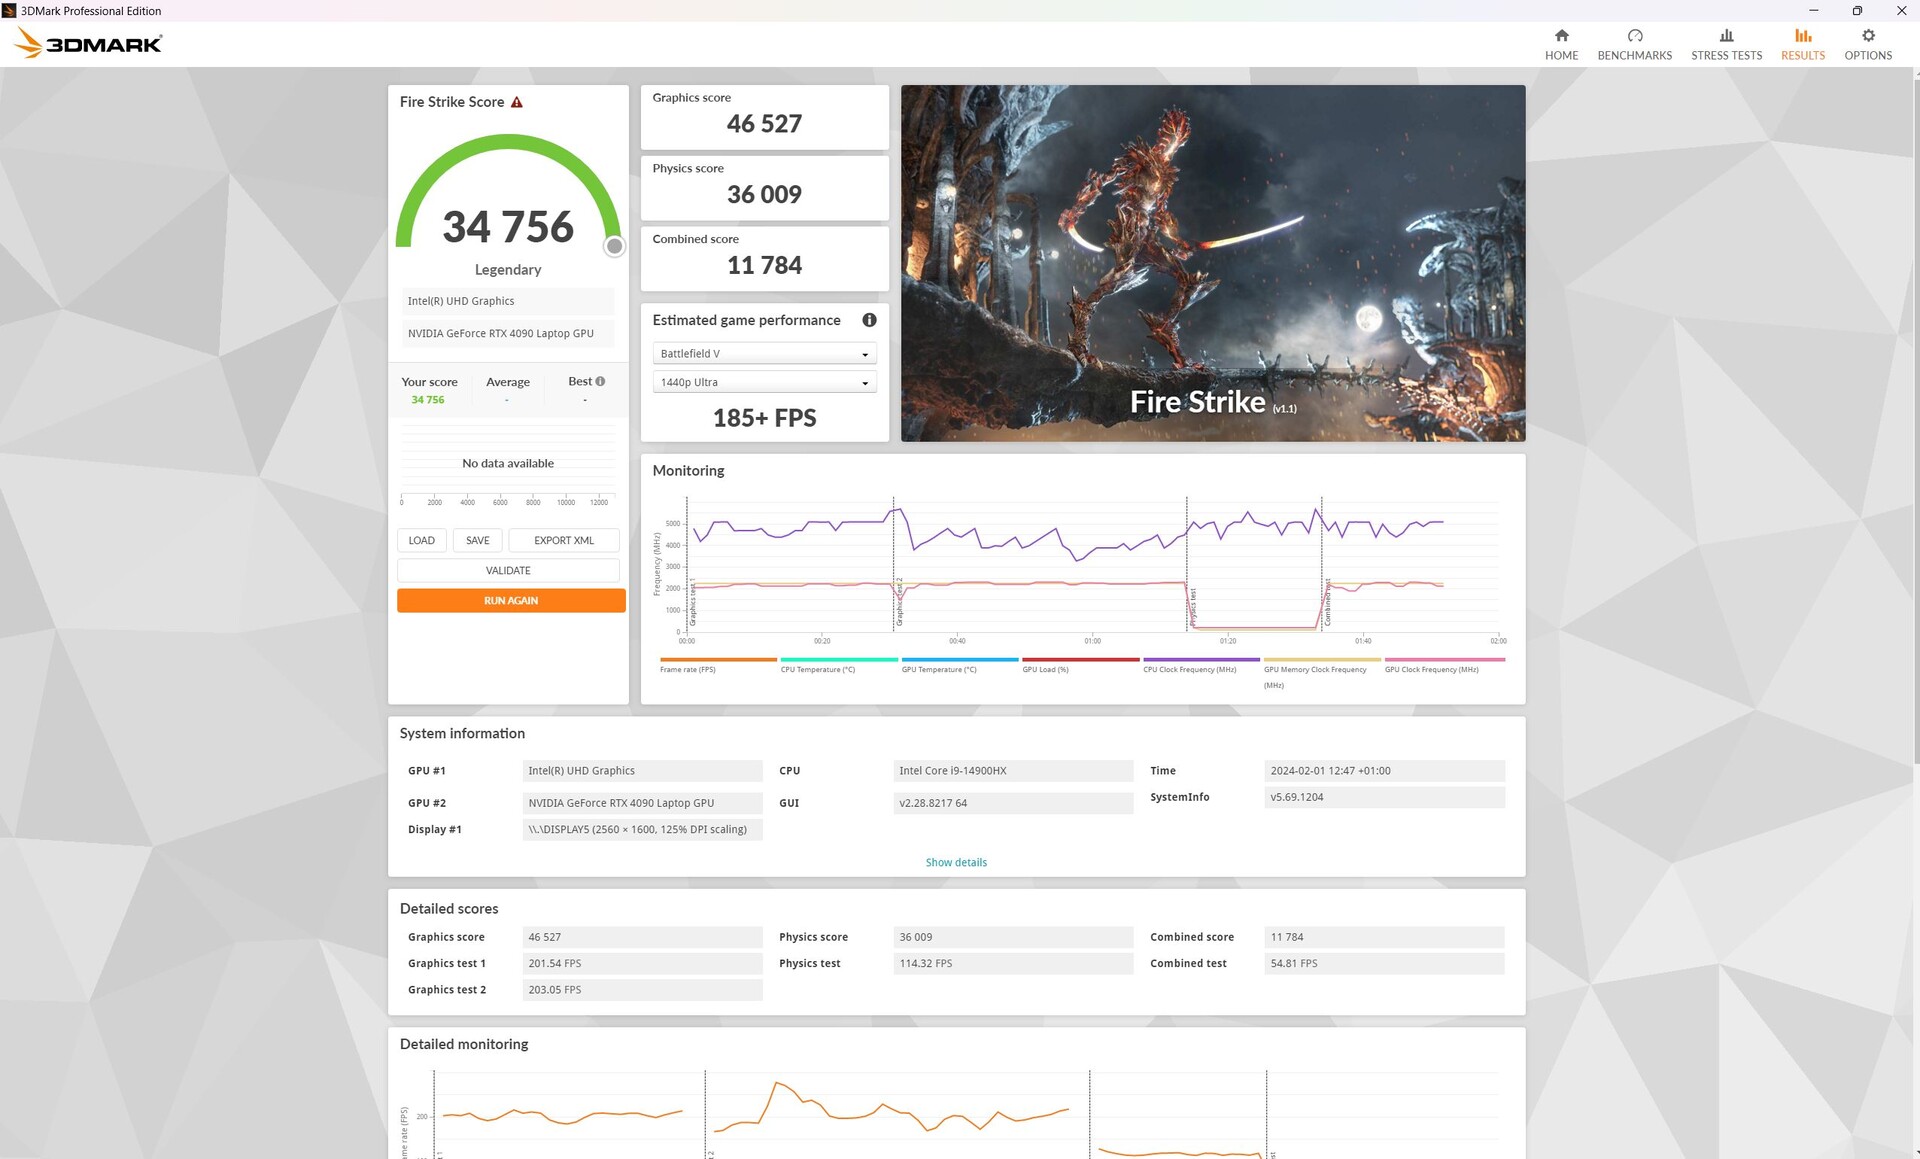
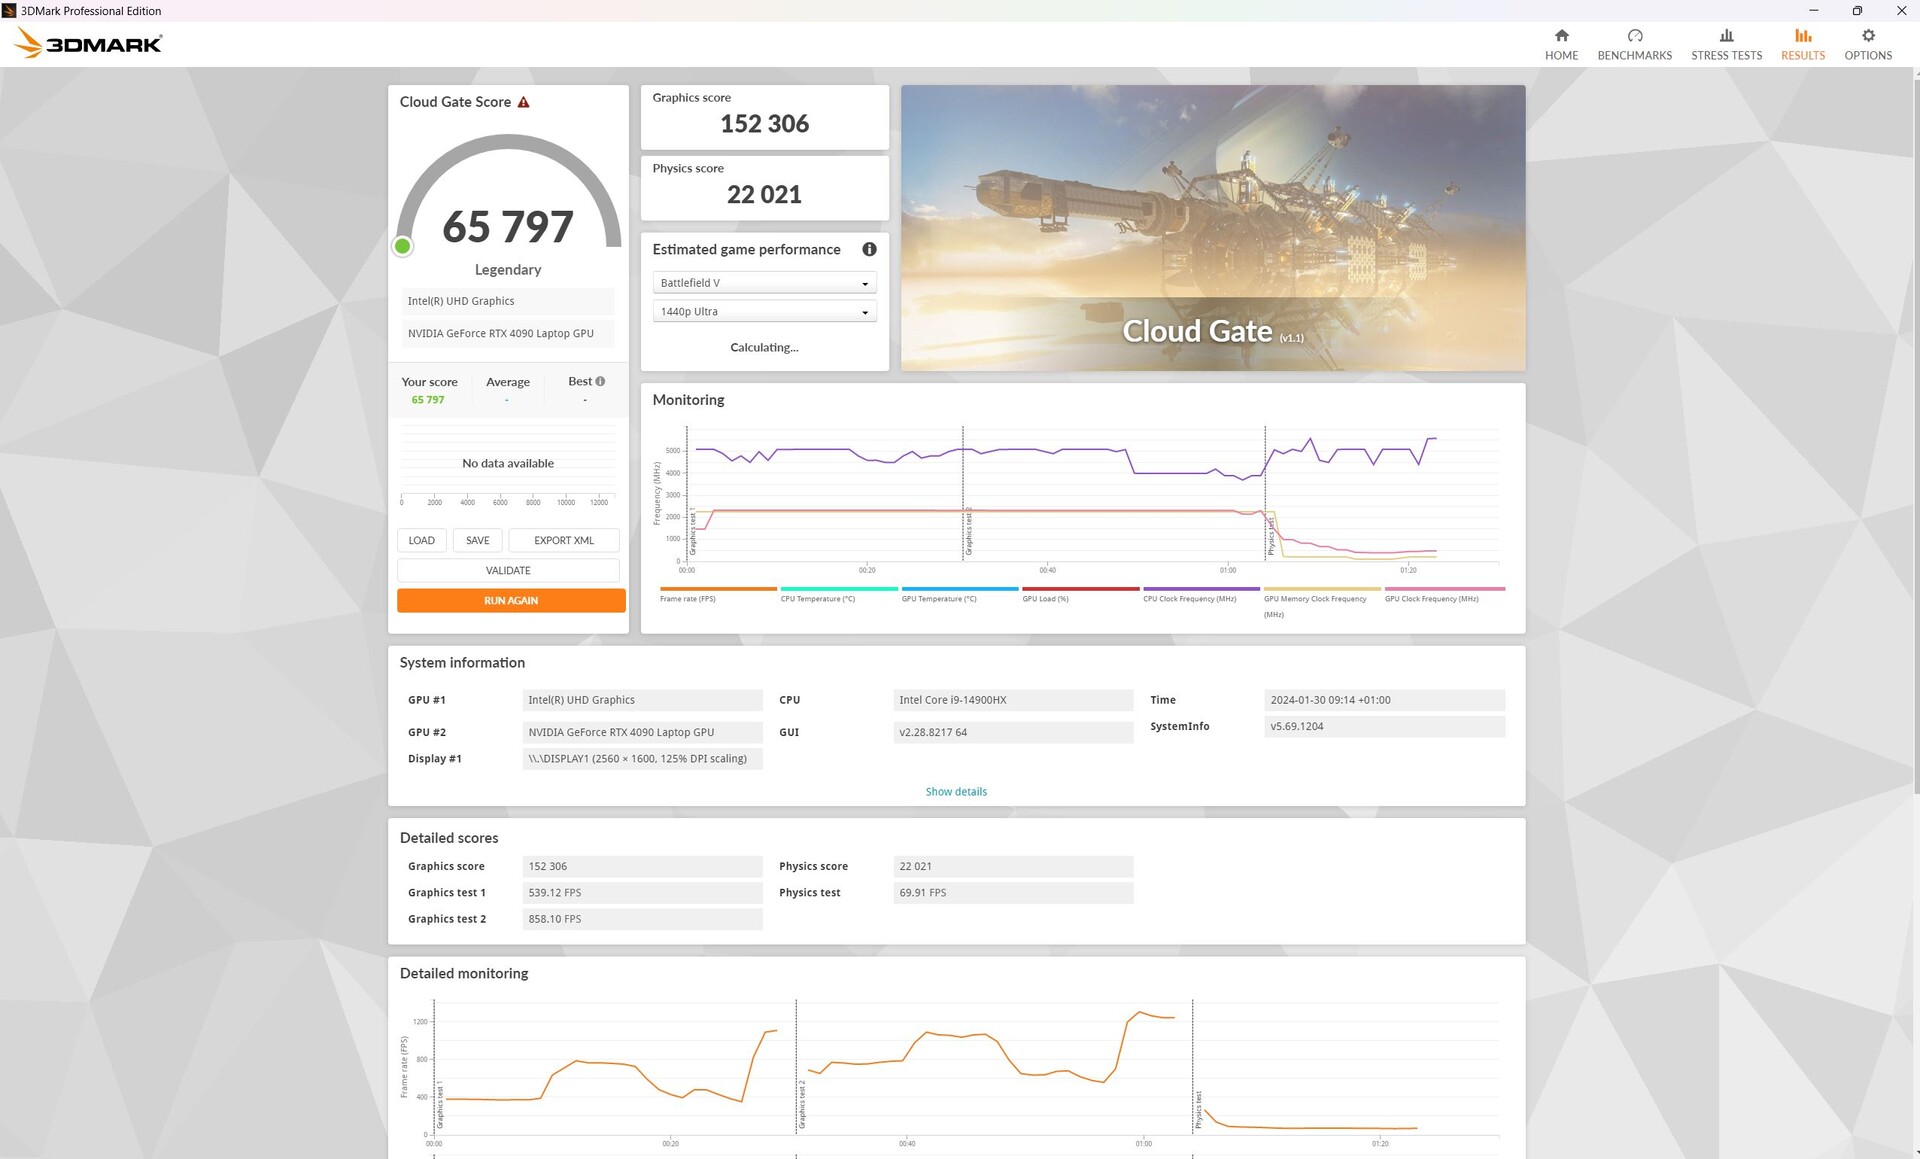
Durante os benchmarks sintéticos do 3DMark, todos os concorrentes RTX-4090 se saíram igualmente bem, apenas o XMG Neo 16 E23 foi cerca de 7 por cento mais rápido. Em suma, a RTX 4090 do Blade 16 obteve resultados comparáveis à média de todos os notebooks em nosso banco de dados que possuem uma RTX 4090. Em comparação com o 2023 Blade 16de 2023, ela foi apenas 5% melhor.
A repetição de outra execução do Fire-Strike no modo de bateria fez com que a pontuação gráfica do notebook caísse 85%!
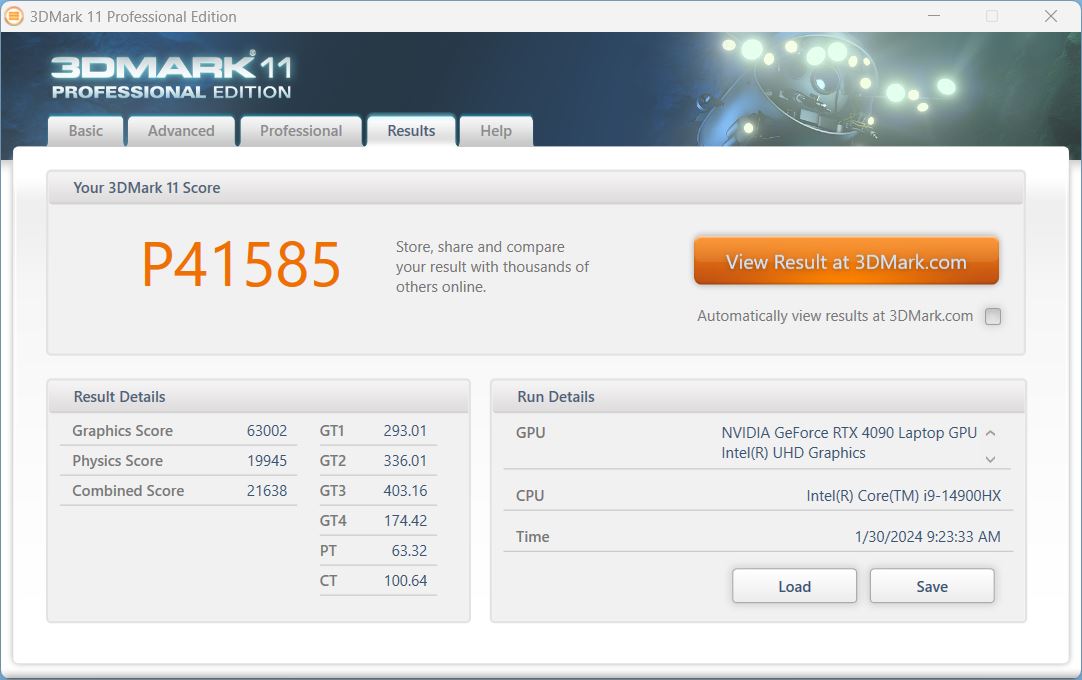
| 3DMark 11 Performance | 44454 pontos | |
| 3DMark Cloud Gate Standard Score | 65797 pontos | |
| 3DMark Fire Strike Score | 34756 pontos | |
| 3DMark Time Spy Score | 18732 pontos | |
Ajuda | ||
* ... menor é melhor
Jogos
Nos jogos, o laptop apresentou um quadro semelhante. Novamente, o Blade alcançou uma vantagem de cerca de 7% em comparação com seu antecessor. Outros concorrentes de última geração, como o XMG Neo 16 ou o Legion 9 chegaram a ficar à frente do Blade nos jogos.
Em suma, o Blade 16 tem potência suficiente para exibir todos os jogos em 4K. No entanto, sua taxa de quadros às vezes caía abaixo da marca de 60 fps ao executar o Dying Light.
Ao jogar Cyberpunk 2077 1.6, o novo Blade 16 conseguiu cerca de 52 fps em 4K Ultra. Em 4K, suas taxas de quadros caíram para valores impossíveis de jogar com a qualidade máxima de RT, com a melhor GPU ou não.
Mesmo com DLSS ou Frame Generation (FG), não é possível igualar a taxa de atualização da tela, pelo menos em sua resolução nativa de 1.600p. No Cyberpunk, medimos 53,42 fps (DLSS) e cerca de 85 fps (FG). Em Call of Duty: Modern Warfare III, o sistema atingiu 161 fps (DLSS) e 183 fps (FG) e em Alan Wake II medimos 73,5 (DLSS) e 112,6 fps (FG).
A tabela abaixo mostra os valores de FPS, consumo e volume do The Witcher 3 FHD Ultra usando os vários modos de desempenho.
| Modo/valor de desempenho | Witcher 3 fps (Max / Avg) | emissões de ruído em dB | consumo de energia em watts |
|---|---|---|---|
| Definido pelo usuário (boost/high) | 211 / 193 | 46.81 | 243 |
| Turbo | 203 / 191 | 46.81 | 242 |
| Balanceado | 177 / 169 | 42,99 | 196 |
| Silencioso | 141 / 132 | 32.16 | 141 |
| Performance rating - Percent | |
| Lenovo Legion 9 16IRX8 | |
| Schenker XMG Neo 16 E23 | |
| Razer Blade 16 2024, RTX 4090 | |
| Razer Blade 16 Early 2023 RTX 4090 | |
| Média da turma Gaming | |
| Lenovo Legion 5 16IRX G9 | |
| The Witcher 3 - 1920x1080 Ultra Graphics & Postprocessing (HBAO+) | |
| Schenker XMG Neo 16 E23 | |
| Lenovo Legion 9 16IRX8 | |
| Razer Blade 16 2024, RTX 4090 | |
| Média da turma Gaming (104.7 - 240, n=6, últimos 2 anos) | |
| Razer Blade 16 Early 2023 RTX 4090 | |
| Lenovo Legion 5 16IRX G9 | |
| GTA V - 1920x1080 Highest AA:4xMSAA + FX AF:16x | |
| Lenovo Legion 9 16IRX8 | |
| Schenker XMG Neo 16 E23 | |
| Razer Blade 16 2024, RTX 4090 | |
| Média da turma Gaming (48.3 - 186.9, n=93, últimos 2 anos) | |
| Razer Blade 16 Early 2023 RTX 4090 | |
| Lenovo Legion 5 16IRX G9 | |
| Final Fantasy XV Benchmark - 1920x1080 High Quality | |
| Schenker XMG Neo 16 E23 | |
| Lenovo Legion 9 16IRX8 | |
| Média da turma Gaming (41 - 215, n=95, últimos 2 anos) | |
| Razer Blade 16 2024, RTX 4090 | |
| Razer Blade 16 Early 2023 RTX 4090 | |
| Lenovo Legion 5 16IRX G9 | |
| Strange Brigade - 1920x1080 ultra AA:ultra AF:16 | |
| Lenovo Legion 9 16IRX8 | |
| Schenker XMG Neo 16 E23 | |
| Razer Blade 16 2024, RTX 4090 | |
| Razer Blade 16 Early 2023 RTX 4090 | |
| Média da turma Gaming (76.3 - 456, n=86, últimos 2 anos) | |
| Lenovo Legion 5 16IRX G9 | |
| Dota 2 Reborn - 1920x1080 ultra (3/3) best looking | |
| Lenovo Legion 9 16IRX8 | |
| Razer Blade 16 2024, RTX 4090 | |
| Razer Blade 16 Early 2023 RTX 4090 | |
| Schenker XMG Neo 16 E23 | |
| Lenovo Legion 5 16IRX G9 | |
| Média da turma Gaming (84.8 - 248, n=107, últimos 2 anos) | |
| X-Plane 11.11 - 1920x1080 high (fps_test=3) | |
| Razer Blade 16 2024, RTX 4090 | |
| Lenovo Legion 9 16IRX8 | |
| Razer Blade 16 Early 2023 RTX 4090 | |
| Schenker XMG Neo 16 E23 | |
| Lenovo Legion 5 16IRX G9 | |
| Média da turma Gaming (55.5 - 143.5, n=109, últimos 2 anos) | |
| Cyberpunk 2077 1.6 | |
| 1920x1080 Ultra Preset | |
| Schenker XMG Neo 16 E23 | |
| Lenovo Legion 9 16IRX8 | |
| Média NVIDIA GeForce RTX 4090 Laptop GPU (91 - 159.7, n=20) | |
| Razer Blade 16 2024, RTX 4090 | |
| Razer Blade 16 Early 2023 RTX 4090 | |
| 2560x1440 Ultra Preset | |
| Schenker XMG Neo 16 E23 | |
| Lenovo Legion 9 16IRX8 | |
| Média NVIDIA GeForce RTX 4090 Laptop GPU (75.7 - 116, n=21) | |
| Razer Blade 16 Early 2023 RTX 4090 | |
| Razer Blade 16 2024, RTX 4090 | |
| 3840x2160 Ultra Preset | |
| Média NVIDIA GeForce RTX 4090 Laptop GPU (38.8 - 56, n=16) | |
| Razer Blade 16 2024, RTX 4090 | |
| Razer Blade 16 Early 2023 RTX 4090 | |
| 1920x1080 Ray Tracing Ultra Preset (DLSS off) | |
| Média NVIDIA GeForce RTX 4090 Laptop GPU (56.5 - 74, n=8) | |
| Razer Blade 16 Early 2023 RTX 4090 | |
| Razer Blade 16 2024, RTX 4090 | |
| 3840x2160 Ray Tracing Ultra Preset (DLSS off) | |
| Razer Blade 16 Early 2023 RTX 4090 | |
| Média NVIDIA GeForce RTX 4090 Laptop GPU (16.5 - 22.4, n=7) | |
| Razer Blade 16 2024, RTX 4090 | |
Witcher 3 FPS diagram
| baixo | média | alto | ultra | QHD DLSS | QHD | 4K DLSS | 4K | |
|---|---|---|---|---|---|---|---|---|
| GTA V (2015) | 184 | 181.9 | 181.6 | 138.1 | 126.9 | 168 | ||
| The Witcher 3 (2015) | 567 | 425 | 354 | 200 | 164 | |||
| Dota 2 Reborn (2015) | 233 | 210 | 201 | 188.1 | 187.3 | |||
| Final Fantasy XV Benchmark (2018) | 171.7 | 155.7 | 137.5 | 126.8 | ||||
| X-Plane 11.11 (2018) | 204 | 182.3 | 146.2 | 145.5 | ||||
| Far Cry 5 (2018) | 173 | 140 | 134 | 127 | 125 | 103 | ||
| Strange Brigade (2018) | 487 | 372 | 368 | 359.8 | 279 | 157 | ||
| Dying Light 2 (2022) | 223.1 | 196.6 | 155.6 | 117.3 | 59.8 | |||
| Cyberpunk 2077 1.6 (2022) | 146.7 | 138.51 | 123.6 | 103.58 | 86.59 | 46.1 | ||
| F1 23 (2023) | 113.2 | 72.4 | 36.9 | |||||
| Baldur's Gate 3 (2023) | 175.8 | 134 | 74 | |||||
| Cyberpunk 2077 (2023) | 95.35 | 83.39 | 39.61 | |||||
| Assassin's Creed Mirage (2023) | 130 | 117 | 74 | |||||
| Alan Wake 2 (2023) | 108.6 | 78.4 | 41.6 | |||||
| Call of Duty Modern Warfare 3 2023 (2023) | 179 | 138 | 91 | |||||
| Avatar Frontiers of Pandora (2023) | 98 | 67 | 34 | |||||
| Black Myth: Wukong (2024) | 53 | 58 | 39 | 23 | ||||
| Call of Duty Black Ops 6 (2024) | 124 | 111 | 103 | 71 | 68 | |||
| Indiana Jones and the Great Circle (2024) | 122.4 | 109.3 | 95.4 | 58 | ||||
| Monster Hunter Wilds (2025) | 70.56 | 70.41 | 63.11 | 40.46 | ||||
| Assassin's Creed Shadows (2025) | 64 | 58 | 52 | 34 |
Emissões e potência - O Razer Blade oferece muitas opções de personalização
Emissões de ruído
No modo personalizado com desempenho maximizado da CPU e da GPU, as ventoinhas às vezes ficavam paradas, mas, na maioria das vezes, zumbiam em torno de 27 dB, mesmo quando ociosas.
No cenário de carga média (3DMark 06), elas aumentaram a velocidade em duas etapas. Nos primeiros 30 segundos, elas aumentaram lentamente e mantiveram esse nível médio de ruído por cerca de um minuto antes de aumentarem novamente para mais de 43 dB. Aqui, por exemplo, o significativamente mais barato Dell G16 significativamente mais barato, permaneceu muito mais silencioso, não alterando seu volume de saída de 27 dB durante toda a execução do teste. O antecessor do laptop também permaneceu mais silencioso nesse cenário.
O modo turbo não trouxe nenhuma vantagem em termos de desempenho ou emissões de ruído quando o senhor olha para os resultados, mas o Blade é resfriado por um sistema de refrigeração que não é muito potente Witcher 3 resultados, mas o Blade tem um resfriamento melhor.
Apesar de quase o mesmo desempenho, o novo Blade é minimamente mais barulhento do que seu antecessor, mesmo sob estresse máximo. No entanto, o concorrente é ainda mais barulhento em jogos.
Barulho
| Ocioso |
| 23 / 23 / 27.66 dB |
| Carga |
| 43.76 / 50.37 dB |
 | ||
30 dB silencioso 40 dB(A) audível 50 dB(A) ruidosamente alto |
||
min: | ||
| Razer Blade 16 2024, RTX 4090 GeForce RTX 4090 Laptop GPU, i9-14900HX, Samsung PM9A1 MZVL22T0HBLB | Razer Blade 16 Early 2023 RTX 4090 GeForce RTX 4090 Laptop GPU, i9-13950HX, SSSTC CA6-8D1024 | Lenovo Legion 9 16IRX8 GeForce RTX 4090 Laptop GPU, i9-13980HX, 2x SK Hynix HFS001TEJ9X115N (RAID 0) | Schenker XMG Neo 16 E23 GeForce RTX 4090 Laptop GPU, i9-13900HX, Crucial P5 Plus 1TB CT1000P5PSSD8 | Lenovo Legion 5 16IRX G9 GeForce RTX 4060 Laptop GPU, i7-14650HX, Samsung PM9A1 MZVL21T0HCLR | |
|---|---|---|---|---|---|
| Noise | 4% | -2% | -30% | -11% | |
| desligado / ambiente * (dB) | 23 | 20.84 9% | 23.7 -3% | 25 -9% | 24 -4% |
| Idle Minimum * (dB) | 23 | 23.65 -3% | 24 -4% | 31 -35% | 24 -4% |
| Idle Average * (dB) | 23 | 23.65 -3% | 24 -4% | 33 -43% | 28.8 -25% |
| Idle Maximum * (dB) | 27.66 | 23.65 14% | 30.4 -10% | 42 -52% | 32 -16% |
| Load Average * (dB) | 43.76 | 43.35 1% | 30.4 31% | 58 -33% | 45.5 -4% |
| Witcher 3 ultra * (dB) | 46.81 | 46.7 -0% | 52.2 -12% | 57 -22% | 53.1 -13% |
| Load Maximum * (dB) | 50.37 | 46.72 7% | 54.9 -9% | 59 -17% | 55.7 -11% |
* ... menor é melhor
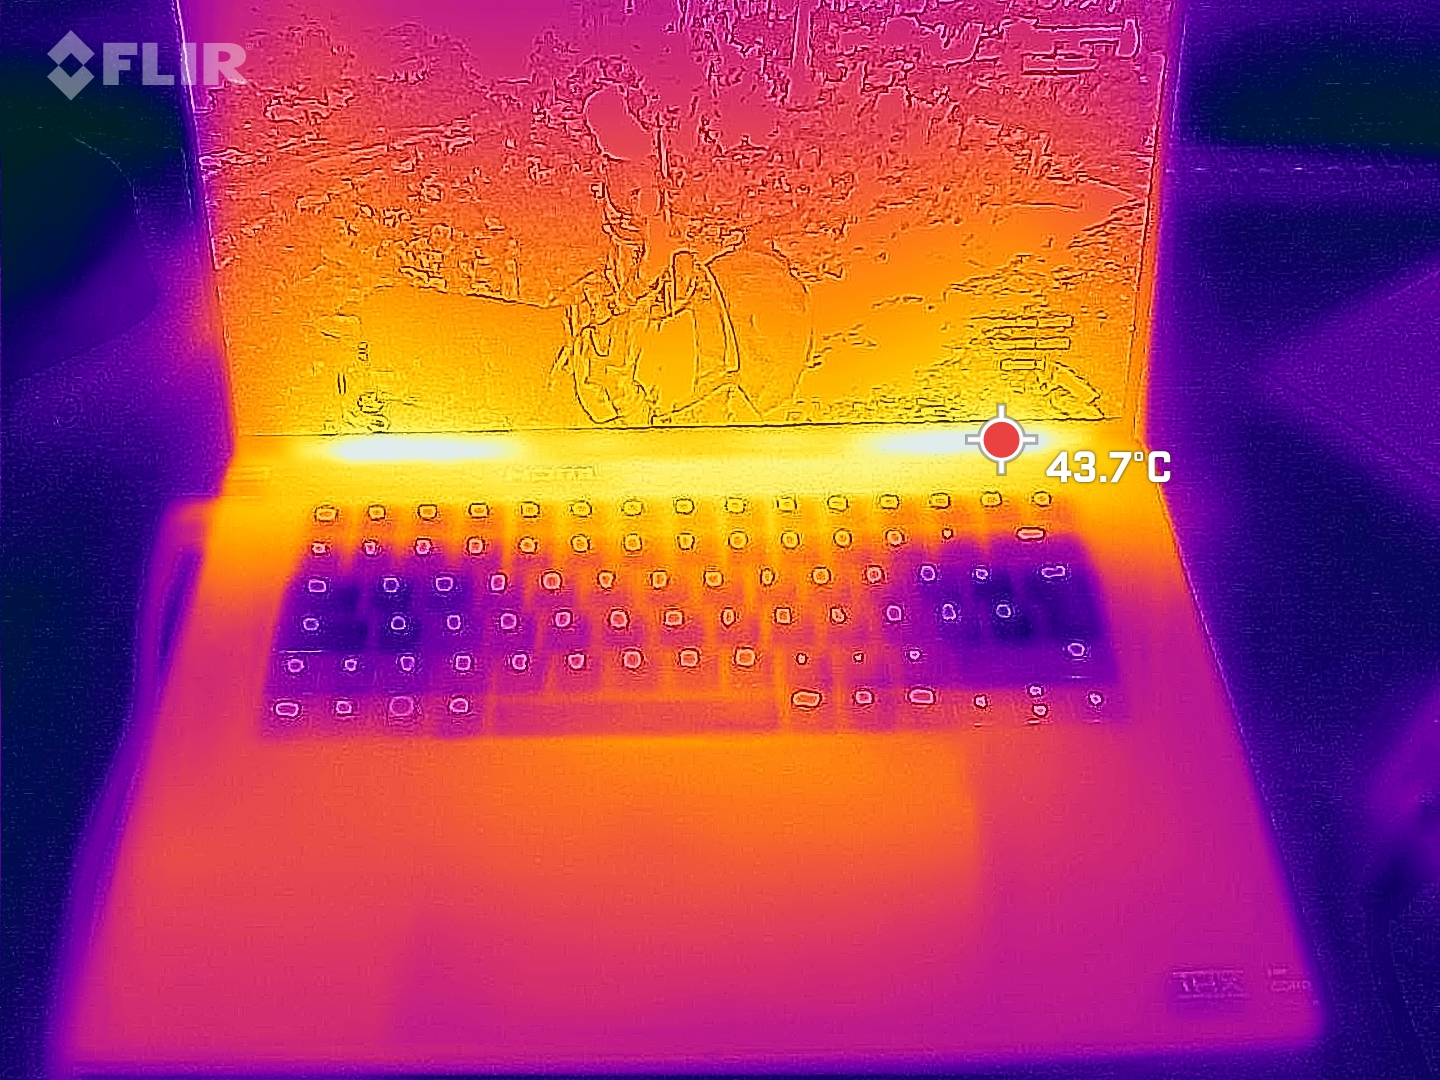
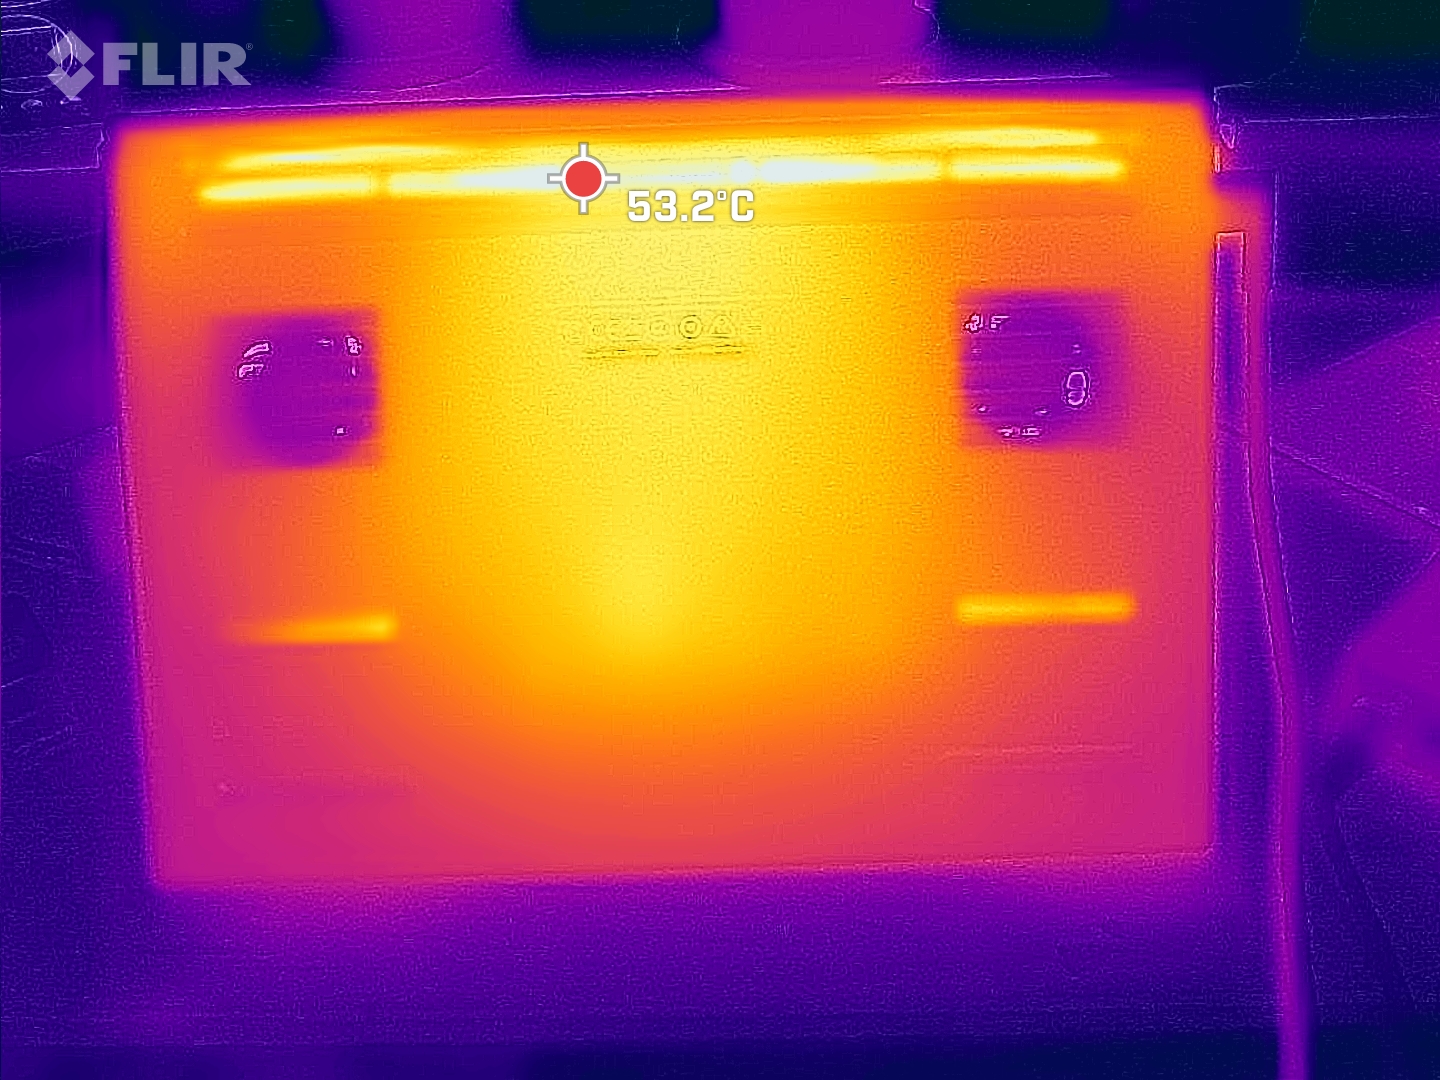
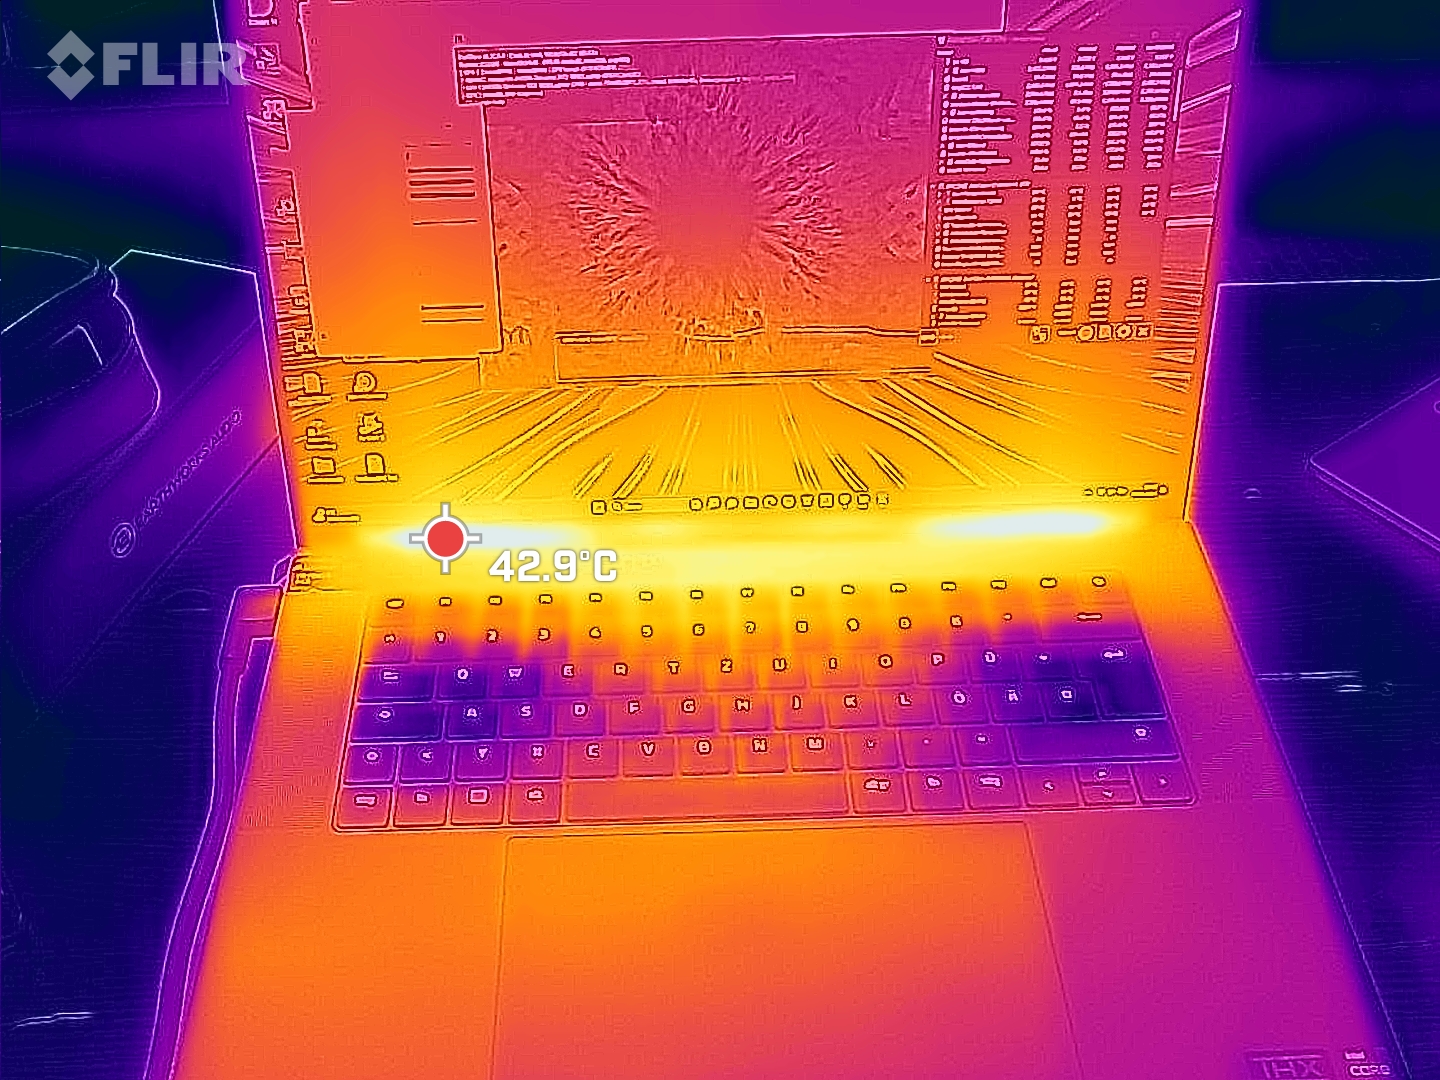
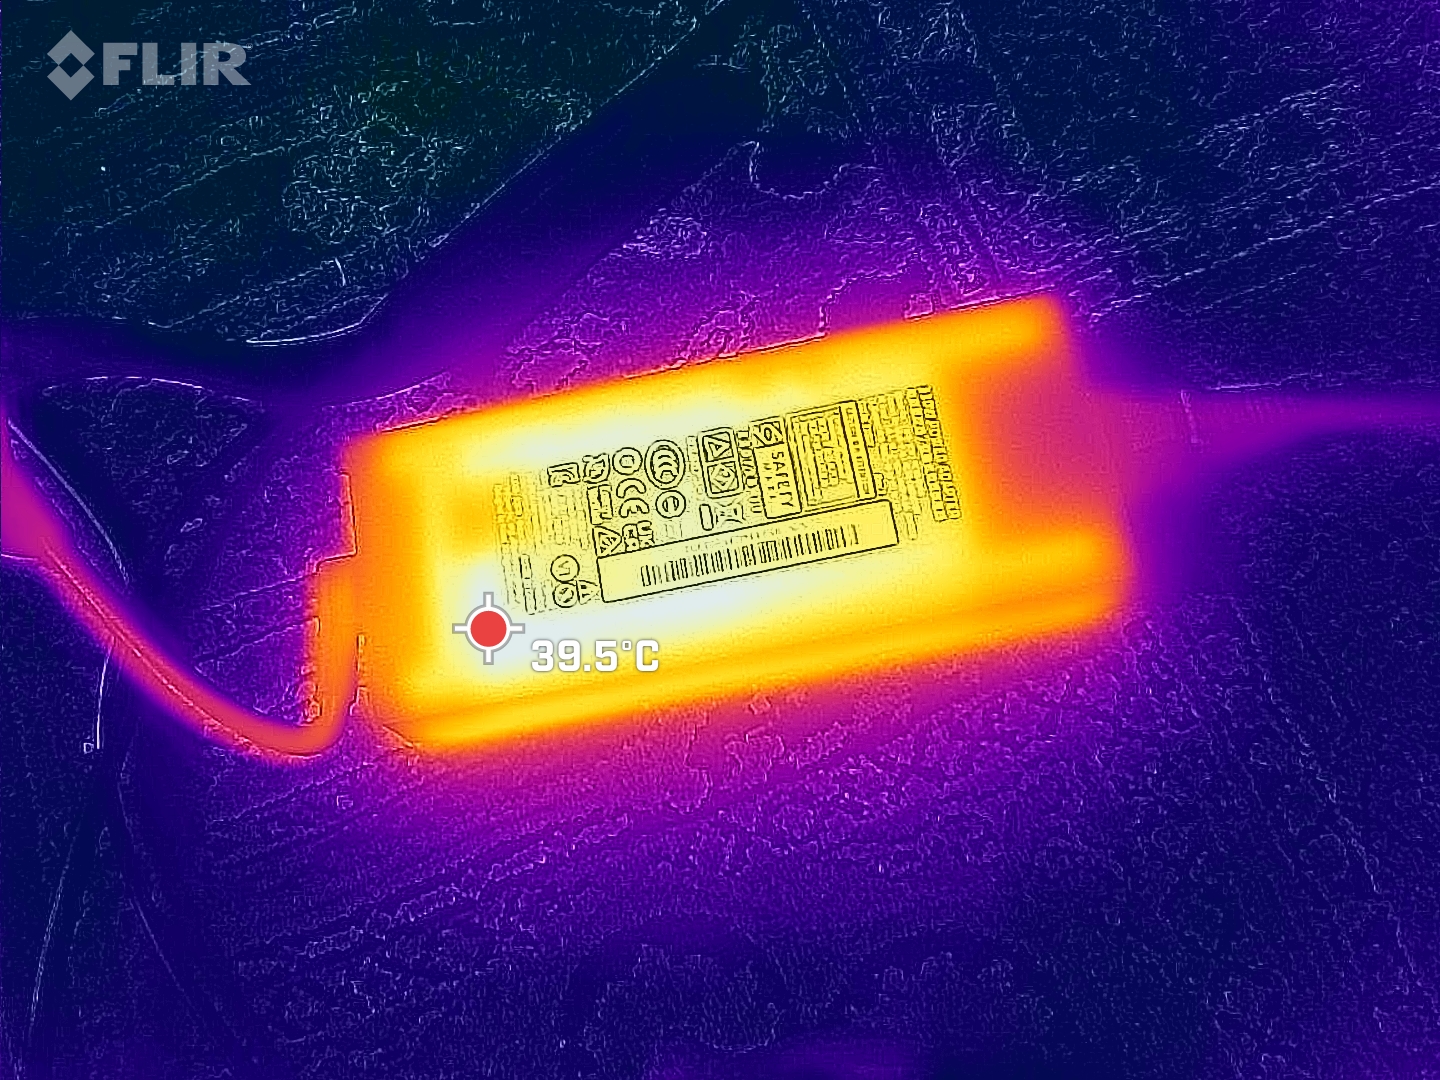
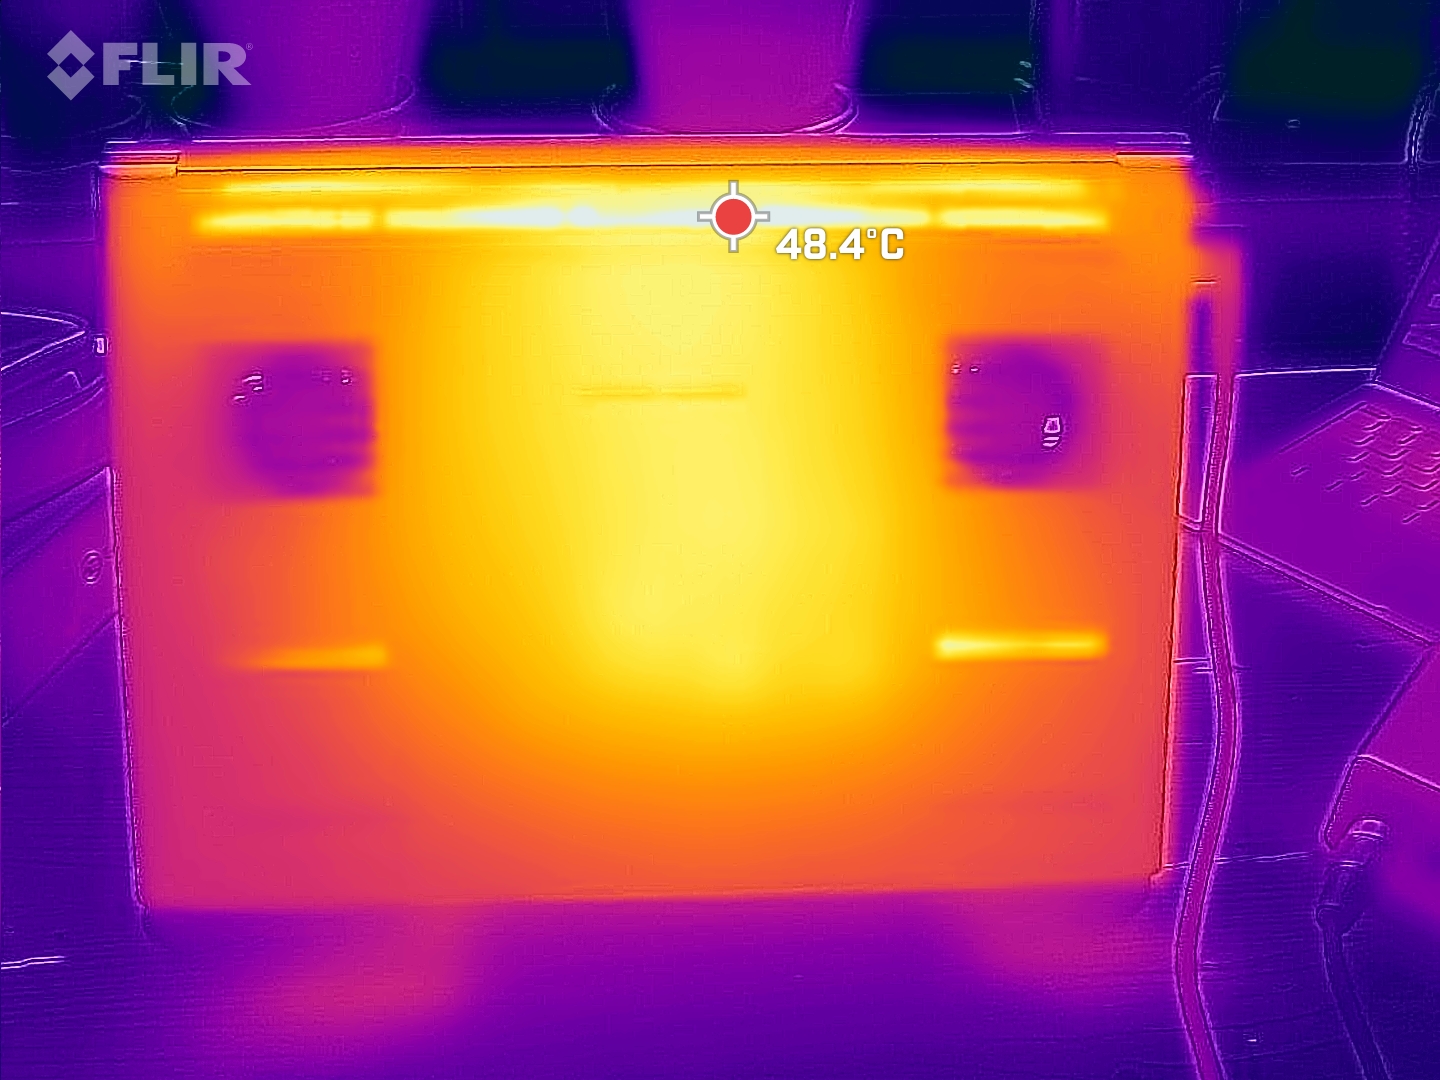
Temperatura
Sob estresse máximo, medimos pontos quentes de até 47 °C. Isso é muito quente para colocar o dispositivo no colo, mas ainda é relativamente frio em comparação com a concorrência.
(±) A temperatura máxima no lado superior é 45 °C / 113 F, em comparação com a média de 40.4 °C / 105 F , variando de 21.2 a 68.8 °C para a classe Gaming.
(±) A parte inferior aquece até um máximo de 45 °C / 113 F, em comparação com a média de 43.2 °C / 110 F
(+) Em uso inativo, a temperatura média para o lado superior é 26.8 °C / 80 F, em comparação com a média do dispositivo de 33.9 °C / ### class_avg_f### F.
(±) Jogando The Witcher 3, a temperatura média para o lado superior é 35.9 °C / 97 F, em comparação com a média do dispositivo de 33.9 °C / ## #class_avg_f### F.
(+) Os apoios para as mãos e o touchpad estão atingindo a temperatura máxima da pele (34 °C / 93.2 F) e, portanto, não estão quentes.
(-) A temperatura média da área do apoio para as mãos de dispositivos semelhantes foi 28.8 °C / 83.8 F (-5.2 °C / -9.4 F).
| Razer Blade 16 2024, RTX 4090 Intel Core i9-14900HX, NVIDIA GeForce RTX 4090 Laptop GPU | Razer Blade 16 Early 2023 RTX 4090 Intel Core i9-13950HX, NVIDIA GeForce RTX 4090 Laptop GPU | Lenovo Legion 9 16IRX8 Intel Core i9-13980HX, NVIDIA GeForce RTX 4090 Laptop GPU | Schenker XMG Neo 16 E23 Intel Core i9-13900HX, NVIDIA GeForce RTX 4090 Laptop GPU | Lenovo Legion 5 16IRX G9 Intel Core i7-14650HX, NVIDIA GeForce RTX 4060 Laptop GPU | |
|---|---|---|---|---|---|
| Heat | -10% | -12% | -2% | -2% | |
| Maximum Upper Side * (°C) | 45 | 52 -16% | 49.6 -10% | 50 -11% | 40.4 10% |
| Maximum Bottom * (°C) | 45 | 47.6 -6% | 48.6 -8% | 51 -13% | 43.8 3% |
| Idle Upper Side * (°C) | 29 | 33 -14% | 33.2 -14% | 28 3% | 30.3 -4% |
| Idle Bottom * (°C) | 30 | 30.6 -2% | 34.2 -14% | 26 13% | 35.3 -18% |
* ... menor é melhor
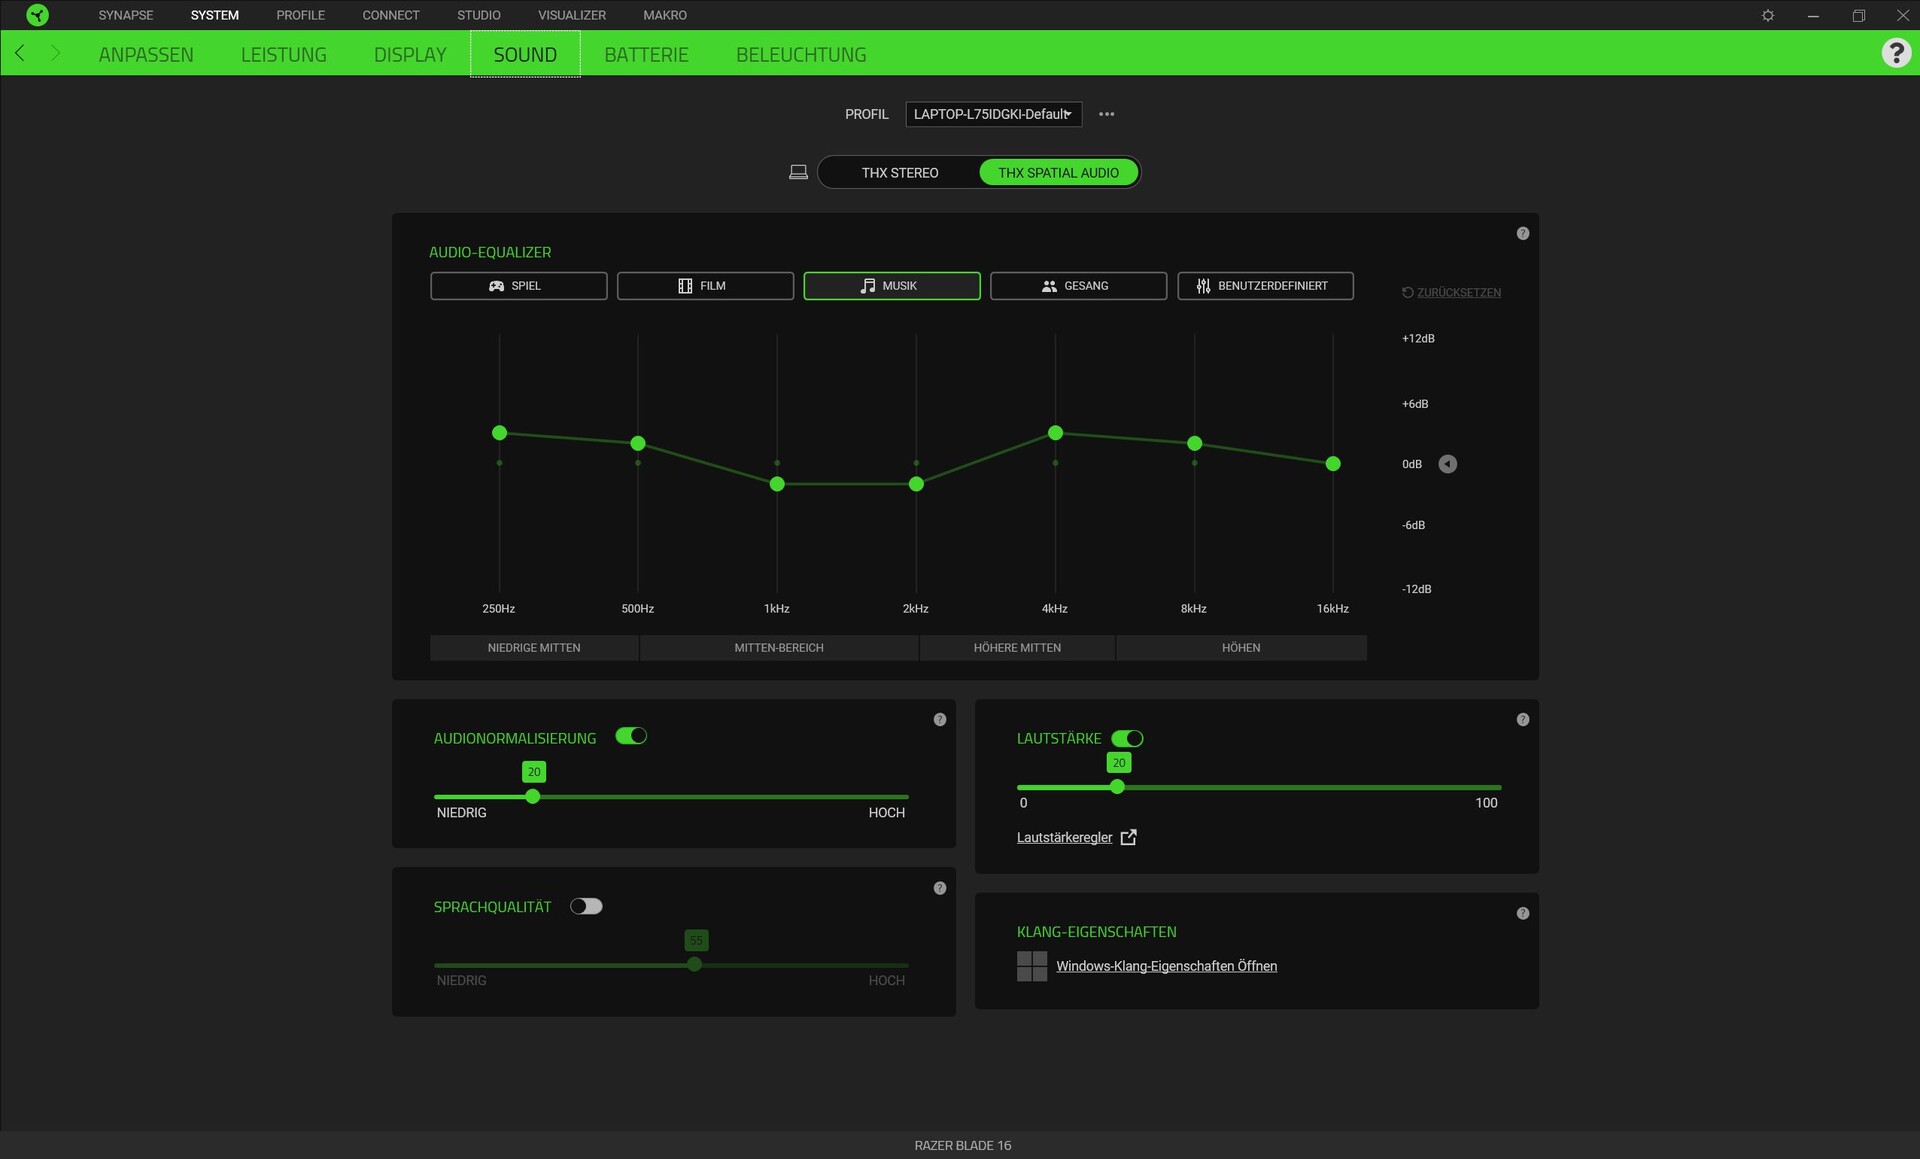
Alto-falantes
Em contraste com muitos outros notebooks para jogos, o Blade 16 tem quatro alto-falantes, dois tweeters e dois woofers. Isso proporciona ao ouvinte agudos e médios equilibrados e, ao contrário de muitos concorrentes, até mesmo os graves são perceptíveis.
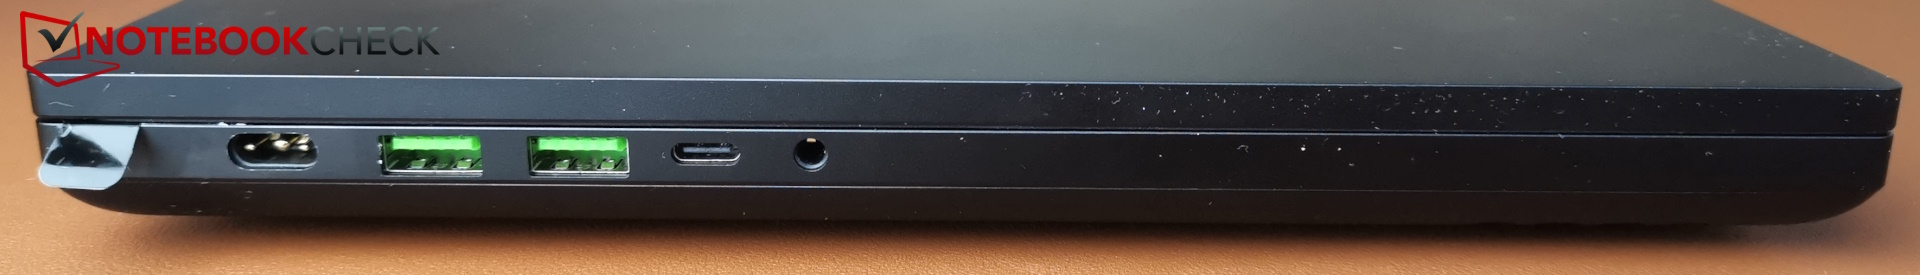
No entanto, isso tem seus limites e os alto-falantes ainda não são excessivamente altos. Apenas uma conexão jack de 3,5 mm está disponível para conectar dispositivos analógicos.
Razer Blade 16 2024, RTX 4090 análise de áudio
(±) | o volume do alto-falante é médio, mas bom (###valor### dB)
Graves 100 - 315Hz
(±) | graves reduzidos - em média 8.2% menor que a mediana
(±) | a linearidade dos graves é média (7.4% delta para a frequência anterior)
Médios 400 - 2.000 Hz
(+) | médios equilibrados - apenas 3.3% longe da mediana
(+) | médios são lineares (5.9% delta para frequência anterior)
Altos 2 - 16 kHz
(+) | agudos equilibrados - apenas 1.6% longe da mediana
(+) | os máximos são lineares (3.1% delta da frequência anterior)
Geral 100 - 16.000 Hz
(+) | o som geral é linear (9.2% diferença em relação à mediana)
Comparado com a mesma classe
» 3% de todos os dispositivos testados nesta classe foram melhores, 1% semelhantes, 96% piores
» O melhor teve um delta de 6%, a média foi 18%, o pior foi 132%
Comparado com todos os dispositivos testados
» 3% de todos os dispositivos testados foram melhores, 1% semelhantes, 96% piores
» O melhor teve um delta de 4%, a média foi 23%, o pior foi 134%
Lenovo Legion 9 16IRX8 análise de áudio
(+) | os alto-falantes podem tocar relativamente alto (###valor### dB)
Graves 100 - 315Hz
(±) | graves reduzidos - em média 13.5% menor que a mediana
(±) | a linearidade dos graves é média (9% delta para a frequência anterior)
Médios 400 - 2.000 Hz
(+) | médios equilibrados - apenas 1.5% longe da mediana
(+) | médios são lineares (5.7% delta para frequência anterior)
Altos 2 - 16 kHz
(+) | agudos equilibrados - apenas 2.4% longe da mediana
(+) | os máximos são lineares (3.7% delta da frequência anterior)
Geral 100 - 16.000 Hz
(+) | o som geral é linear (11% diferença em relação à mediana)
Comparado com a mesma classe
» 7% de todos os dispositivos testados nesta classe foram melhores, 3% semelhantes, 89% piores
» O melhor teve um delta de 6%, a média foi 18%, o pior foi 132%
Comparado com todos os dispositivos testados
» 6% de todos os dispositivos testados foram melhores, 2% semelhantes, 92% piores
» O melhor teve um delta de 4%, a média foi 23%, o pior foi 134%
Consumo de energia
O novo Blade fez um grande progresso em termos de consumo de energia. Especialmente quando em marcha lenta, seu consumo agora cai para um nível esperado; o modelo anterior consumia muita energia nesse cenário.
Mesmo ao jogar The Witcher, o consumo caiu um pouco, apesar do mesmo desempenho, se não um pouco melhor. Somente o consumo máximo teórico e temporário de 328 watts agora é maior.
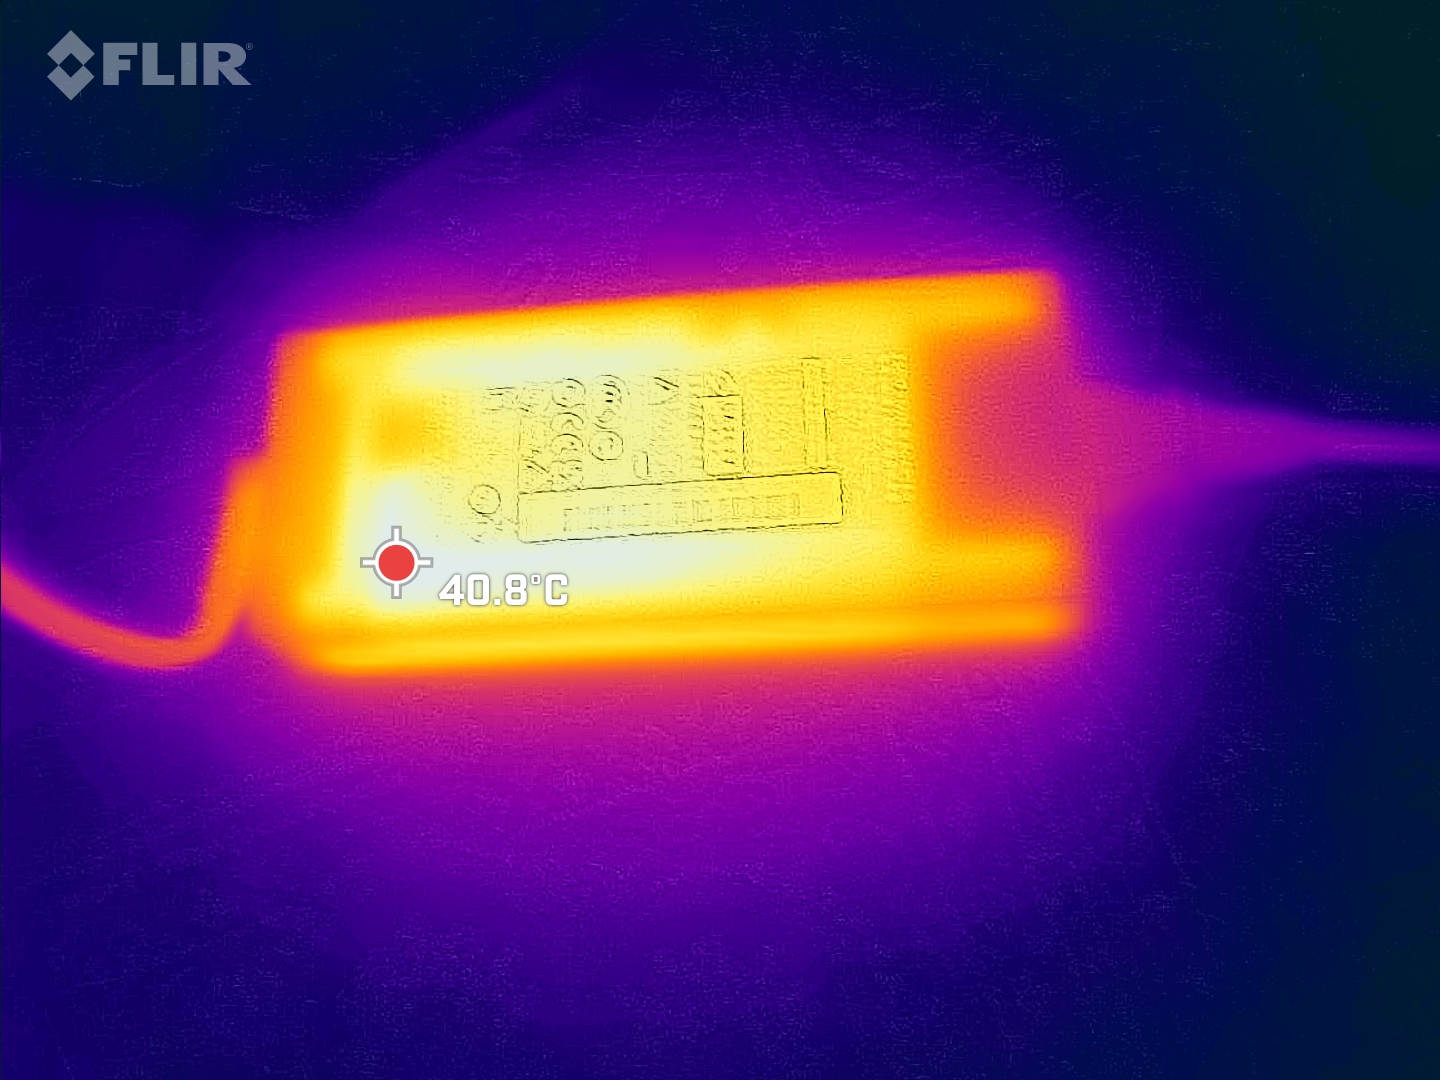
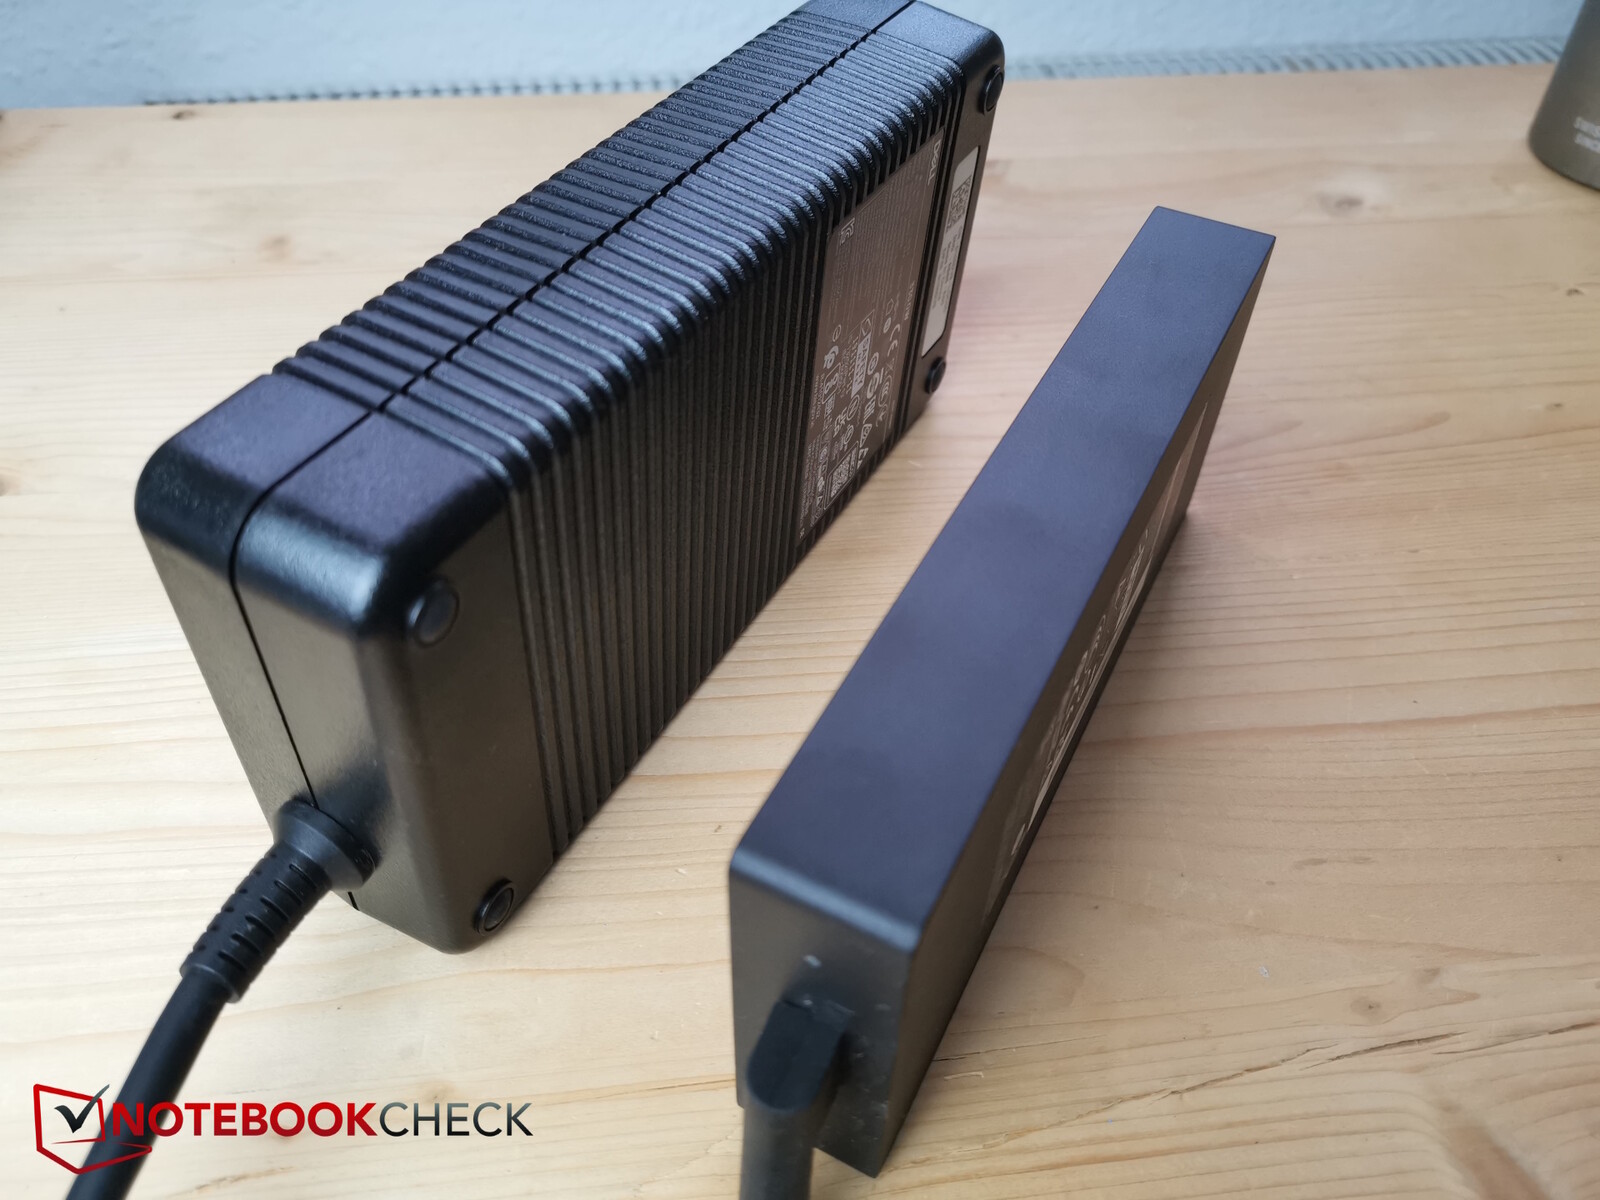
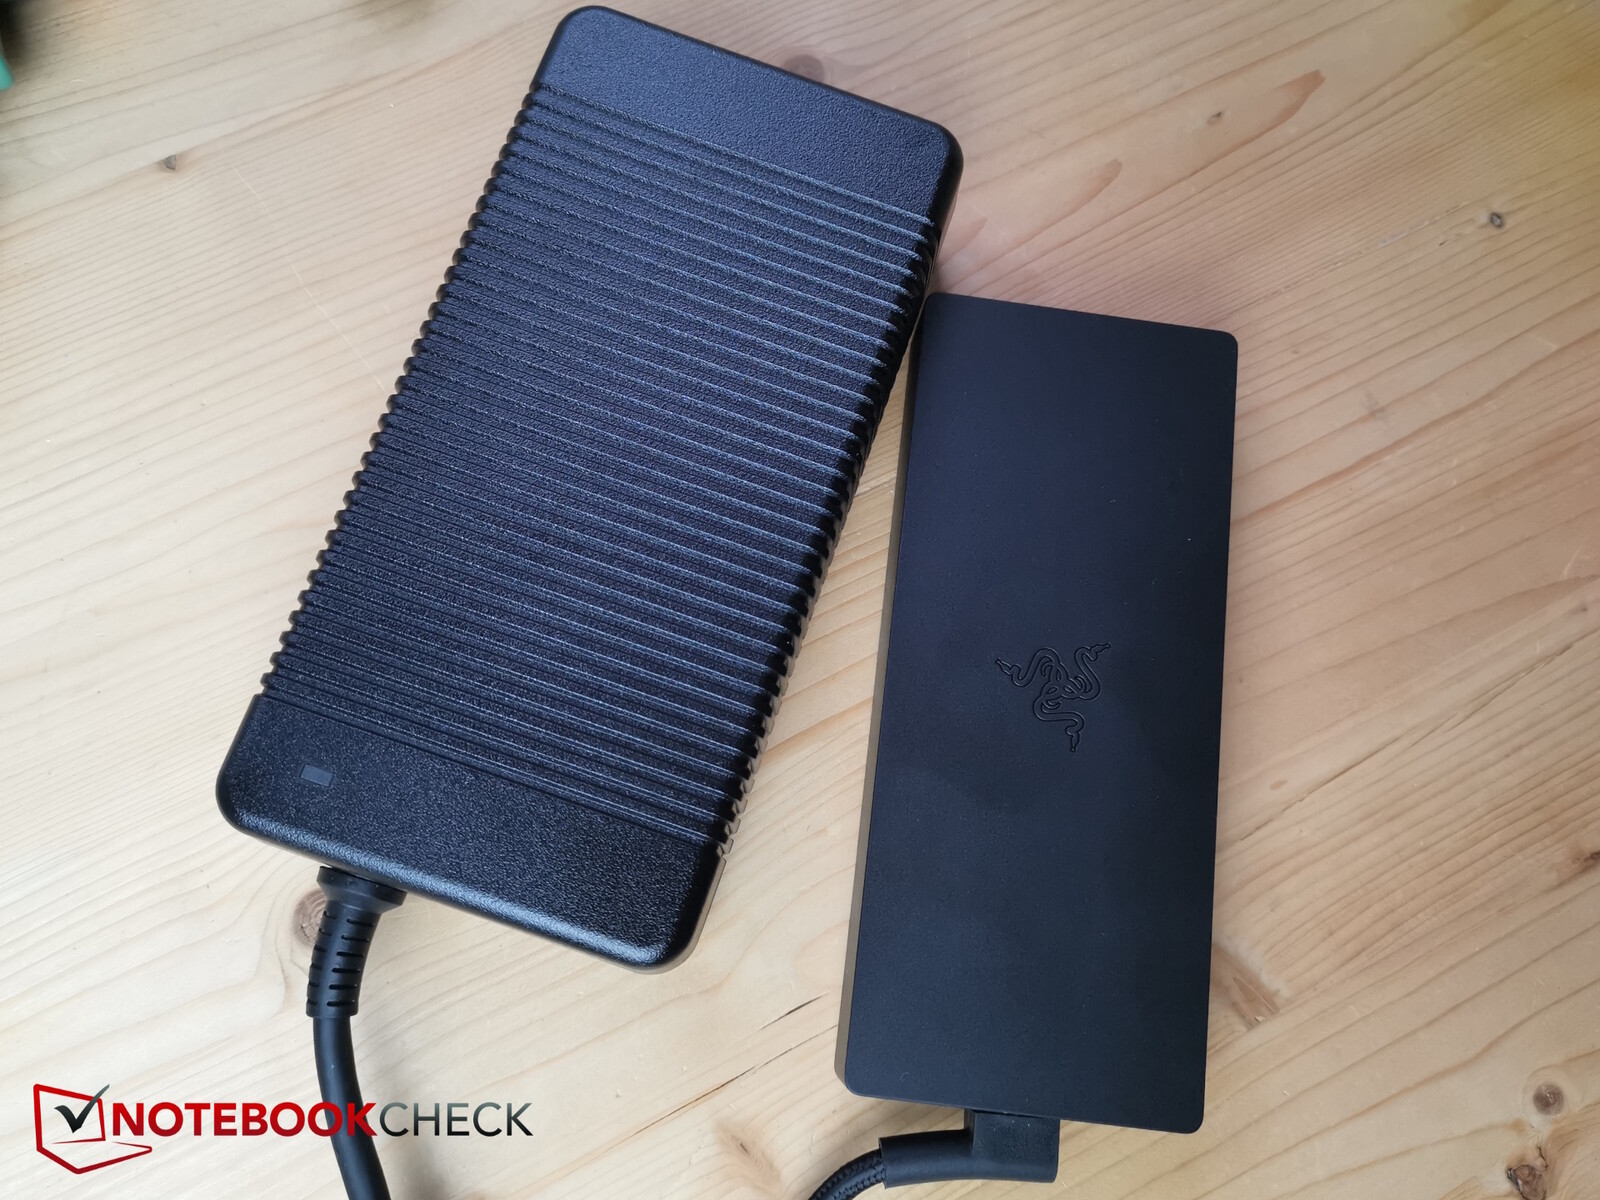
A Razer se orgulha, com razão, de suas fontes de alimentação, que geralmente são menores do que as soluções comparáveis de fabricantes de terceiros genéricos, mas oferecem o mesmo desempenho. A fonte de alimentação de 330 watts incluída tem o tamanho certo para absorver cargas de pico e, de acordo com a Razer, economizou cerca de 60% do tamanho em comparação com soluções comparáveis. Na verdade, a fonte de alimentação da Razer é significativamente menor do que a de 330 watts fornecida com o Dell G16 (2024), por exemplo.
| desligado | |
| Ocioso | |
| Carga |
|
Key:
min: | |
| Razer Blade 16 2024, RTX 4090 i9-14900HX, GeForce RTX 4090 Laptop GPU, Samsung PM9A1 MZVL22T0HBLB, OLED, 2560x1600, 16" | Razer Blade 16 Early 2023 RTX 4090 i9-13950HX, GeForce RTX 4090 Laptop GPU, SSSTC CA6-8D1024, mini-LED, 3840x2400, 16" | Lenovo Legion 9 16IRX8 i9-13980HX, GeForce RTX 4090 Laptop GPU, 2x SK Hynix HFS001TEJ9X115N (RAID 0), Mini-LED, 3200x2000, 16" | Schenker XMG Neo 16 E23 i9-13900HX, GeForce RTX 4090 Laptop GPU, Crucial P5 Plus 1TB CT1000P5PSSD8, IPS, 2560x1600, 16" | Lenovo Legion 5 16IRX G9 i7-14650HX, GeForce RTX 4060 Laptop GPU, Samsung PM9A1 MZVL21T0HCLR, IPS, 2560x1600, 16" | Média NVIDIA GeForce RTX 4090 Laptop GPU | Média da turma Gaming | |
|---|---|---|---|---|---|---|---|
| Power Consumption | -41% | -69% | -6% | 10% | -20% | 6% | |
| Idle Minimum * (Watt) | 16.9 | 27.5 -63% | 32.3 -91% | 8 53% | 15.4 9% | 16.2 ? 4% | 13 ? 23% |
| Idle Average * (Watt) | 17.8 | 34.4 -93% | 42.6 -139% | 18 -1% | 19.7 -11% | 23.1 ? -30% | 18.7 ? -5% |
| Idle Maximum * (Watt) | 19.6 | 35.4 -81% | 57.9 -195% | 28 -43% | 20.7 -6% | 34.2 ? -74% | 24.3 ? -24% |
| Load Average * (Watt) | 128 | 147.8 -15% | 121 5% | 133 -4% | 102.6 20% | 130.5 ? -2% | 110.2 ? 14% |
| Witcher 3 ultra * (Watt) | 243 | 256 -5% | 254 -5% | 294 -21% | 191.3 21% | ||
| Load Maximum * (Watt) | 328 | 286.7 13% | 297.7 9% | 399 -22% | 246.6 25% | 324 ? 1% | 258 ? 21% |
* ... menor é melhor
Power consumption Witcher 3 / stress test
Power consumption with external monitor
Tempos de execução
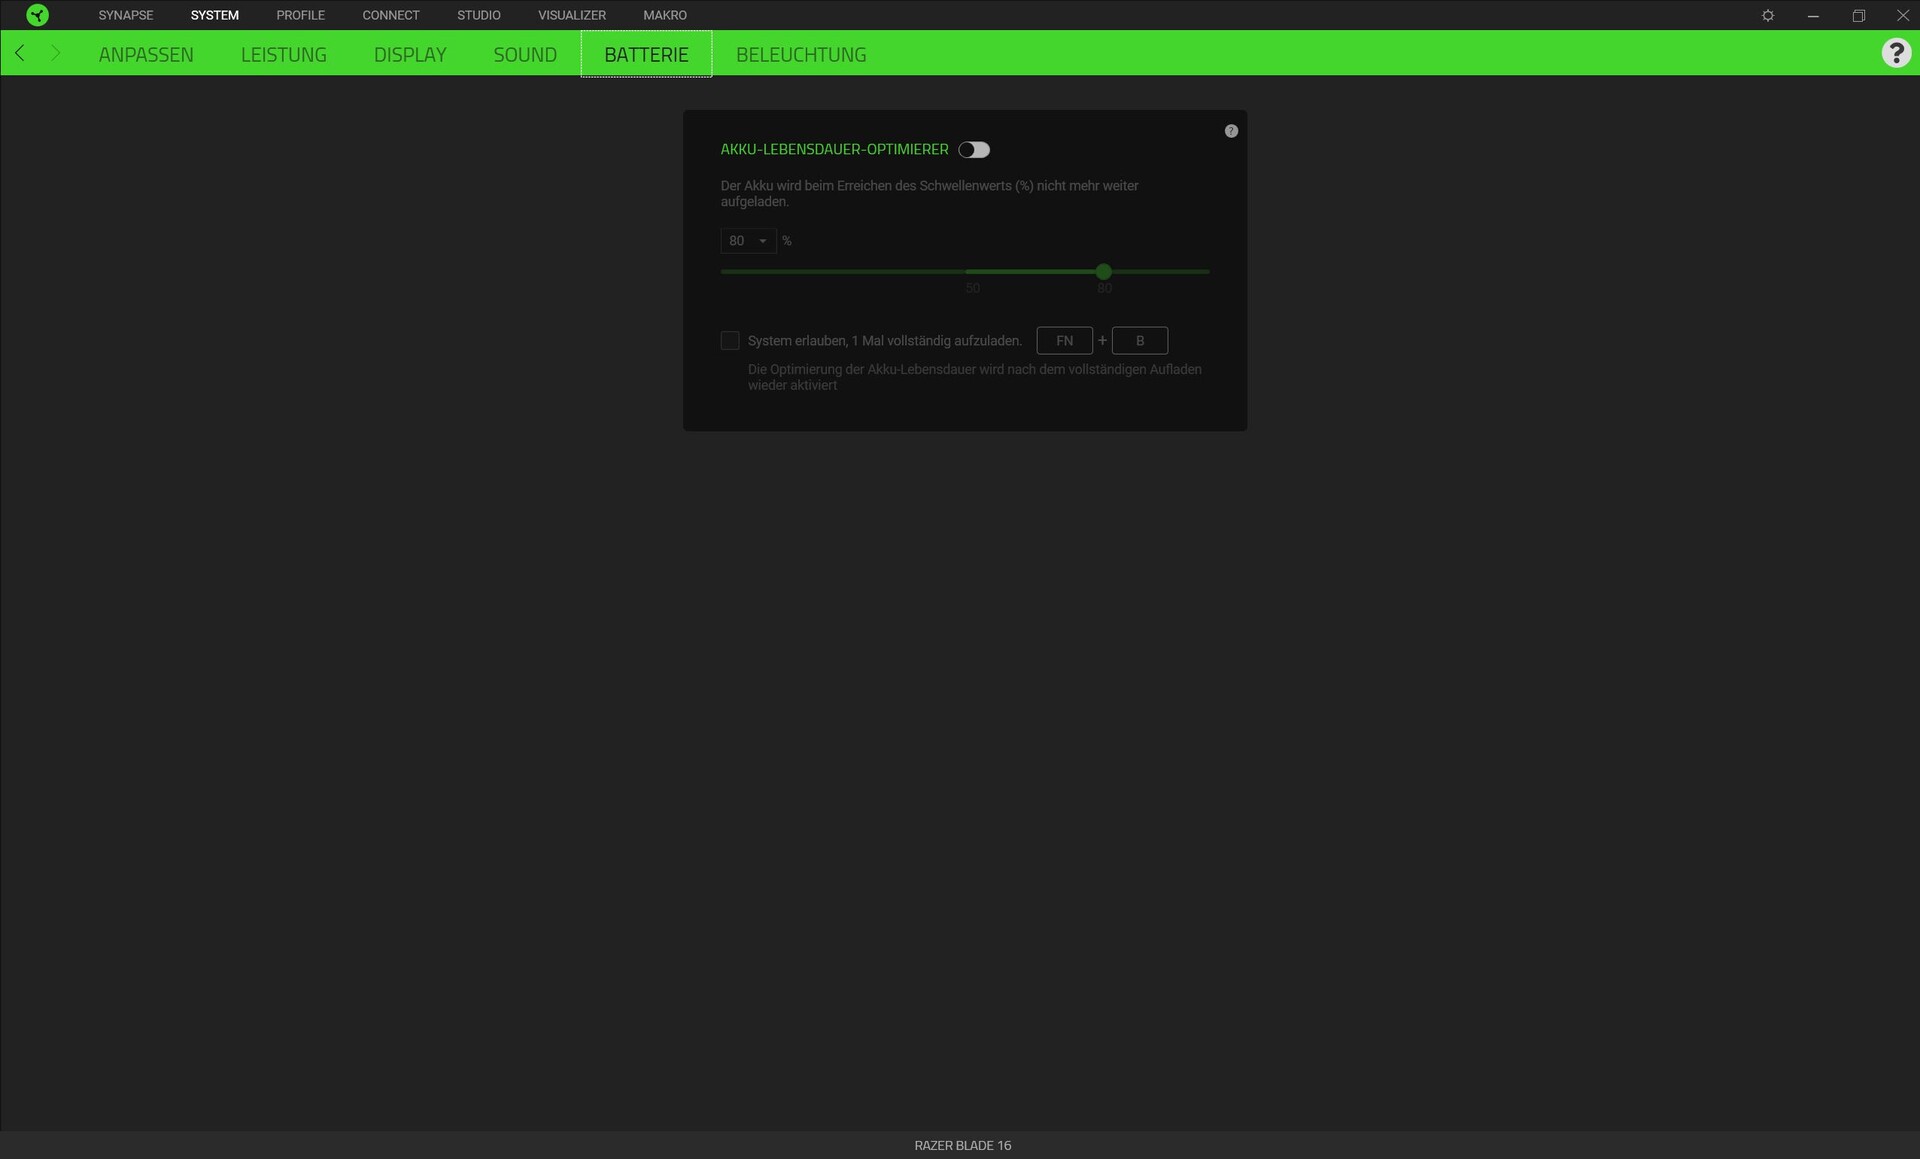
A capacidade da bateria do laptop permaneceu a mesma, com 95,2 Ah. O mesmo pode ser dito sobre o tempo de execução. Medimos cerca de 5,5 horas de navegação e 6,5 horas de exibição de vídeos.
| Razer Blade 16 2024, RTX 4090 i9-14900HX, GeForce RTX 4090 Laptop GPU, 95.2 Wh | Razer Blade 16 Early 2023 RTX 4090 i9-13950HX, GeForce RTX 4090 Laptop GPU, 95.2 Wh | Lenovo Legion 9 16IRX8 i9-13980HX, GeForce RTX 4090 Laptop GPU, 99.9 Wh | Schenker XMG Neo 16 E23 i9-13900HX, GeForce RTX 4090 Laptop GPU, 99 Wh | Lenovo Legion 5 16IRX G9 i7-14650HX, GeForce RTX 4060 Laptop GPU, 80 Wh | Média da turma Gaming | |
|---|---|---|---|---|---|---|
| Duração da bateria | 8% | -37% | -1% | 8% | 20% | |
| H.264 (h) | 7.6 | 8.4 11% | 5.8 -24% | 9.6 26% | 8.64 ? 14% | |
| WiFi v1.3 (h) | 5.5 | 5.8 5% | 2.7 -51% | 6.7 22% | 7.4 35% | 7.11 ? 29% |
| Load (h) | 1.3 | 1.4 8% | 1 -23% | 0.8 -38% | 1.502 ? 16% | |
| Witcher 3 ultra (h) | 1.6 | 1.4 | ||||
| Reader / Idle (h) | 6.7 | 8.71 ? |
Pro
Contra
Veredicto - Poucos argumentos que justificam a atualização do modelo 2023

O Razer Blade 16 é mais uma vez um laptop para jogos de muito sucesso. Ele é compacto, fino, mas poderoso e tem um acabamento de alta qualidade. Com sua tela OLED rápida e bonita, as configurações foram enriquecidas com uma bela alternativa de tela.
No entanto, os proprietários dos modelos 2023, que também apresentam telas Mini-LED muito boas, não têm realmente nenhum motivo para fazer um upgrade - seu desempenho quase não foi aprimorado com a atualização Raptor Lake e nenhum recurso obrigatório foi adicionado a esse modelo.
Assim como seu antecessor, a versão 2024 do Razer Blade 16 é um gamer de alto nível muito bem-sucedido. No entanto, quase não há motivos para fazer um upgrade em relação ao seu antecessor quase equivalente.
Preço e disponibilidade
O novo Blade 16 pode ser encontrado atualmente na Amazon por US$ 4.699,99.
Razer Blade 16 2024, RTX 4090
- 02/19/2024 v7 (old)
Christian Hintze
Transparência
A seleção dos dispositivos a serem analisados é feita pela nossa equipe editorial. A amostra de teste foi fornecida ao autor como empréstimo pelo fabricante ou varejista para fins desta revisão. O credor não teve influência nesta revisão, nem o fabricante recebeu uma cópia desta revisão antes da publicação. Não houve obrigação de publicar esta revisão. Como empresa de mídia independente, a Notebookcheck não está sujeita à autoridade de fabricantes, varejistas ou editores.
É assim que o Notebookcheck está testando
Todos os anos, o Notebookcheck analisa de forma independente centenas de laptops e smartphones usando procedimentos padronizados para garantir que todos os resultados sejam comparáveis. Desenvolvemos continuamente nossos métodos de teste há cerca de 20 anos e definimos padrões da indústria no processo. Em nossos laboratórios de teste, equipamentos de medição de alta qualidade são utilizados por técnicos e editores experientes. Esses testes envolvem um processo de validação em vários estágios. Nosso complexo sistema de classificação é baseado em centenas de medições e benchmarks bem fundamentados, o que mantém a objetividade.Price comparison

