Conclusão
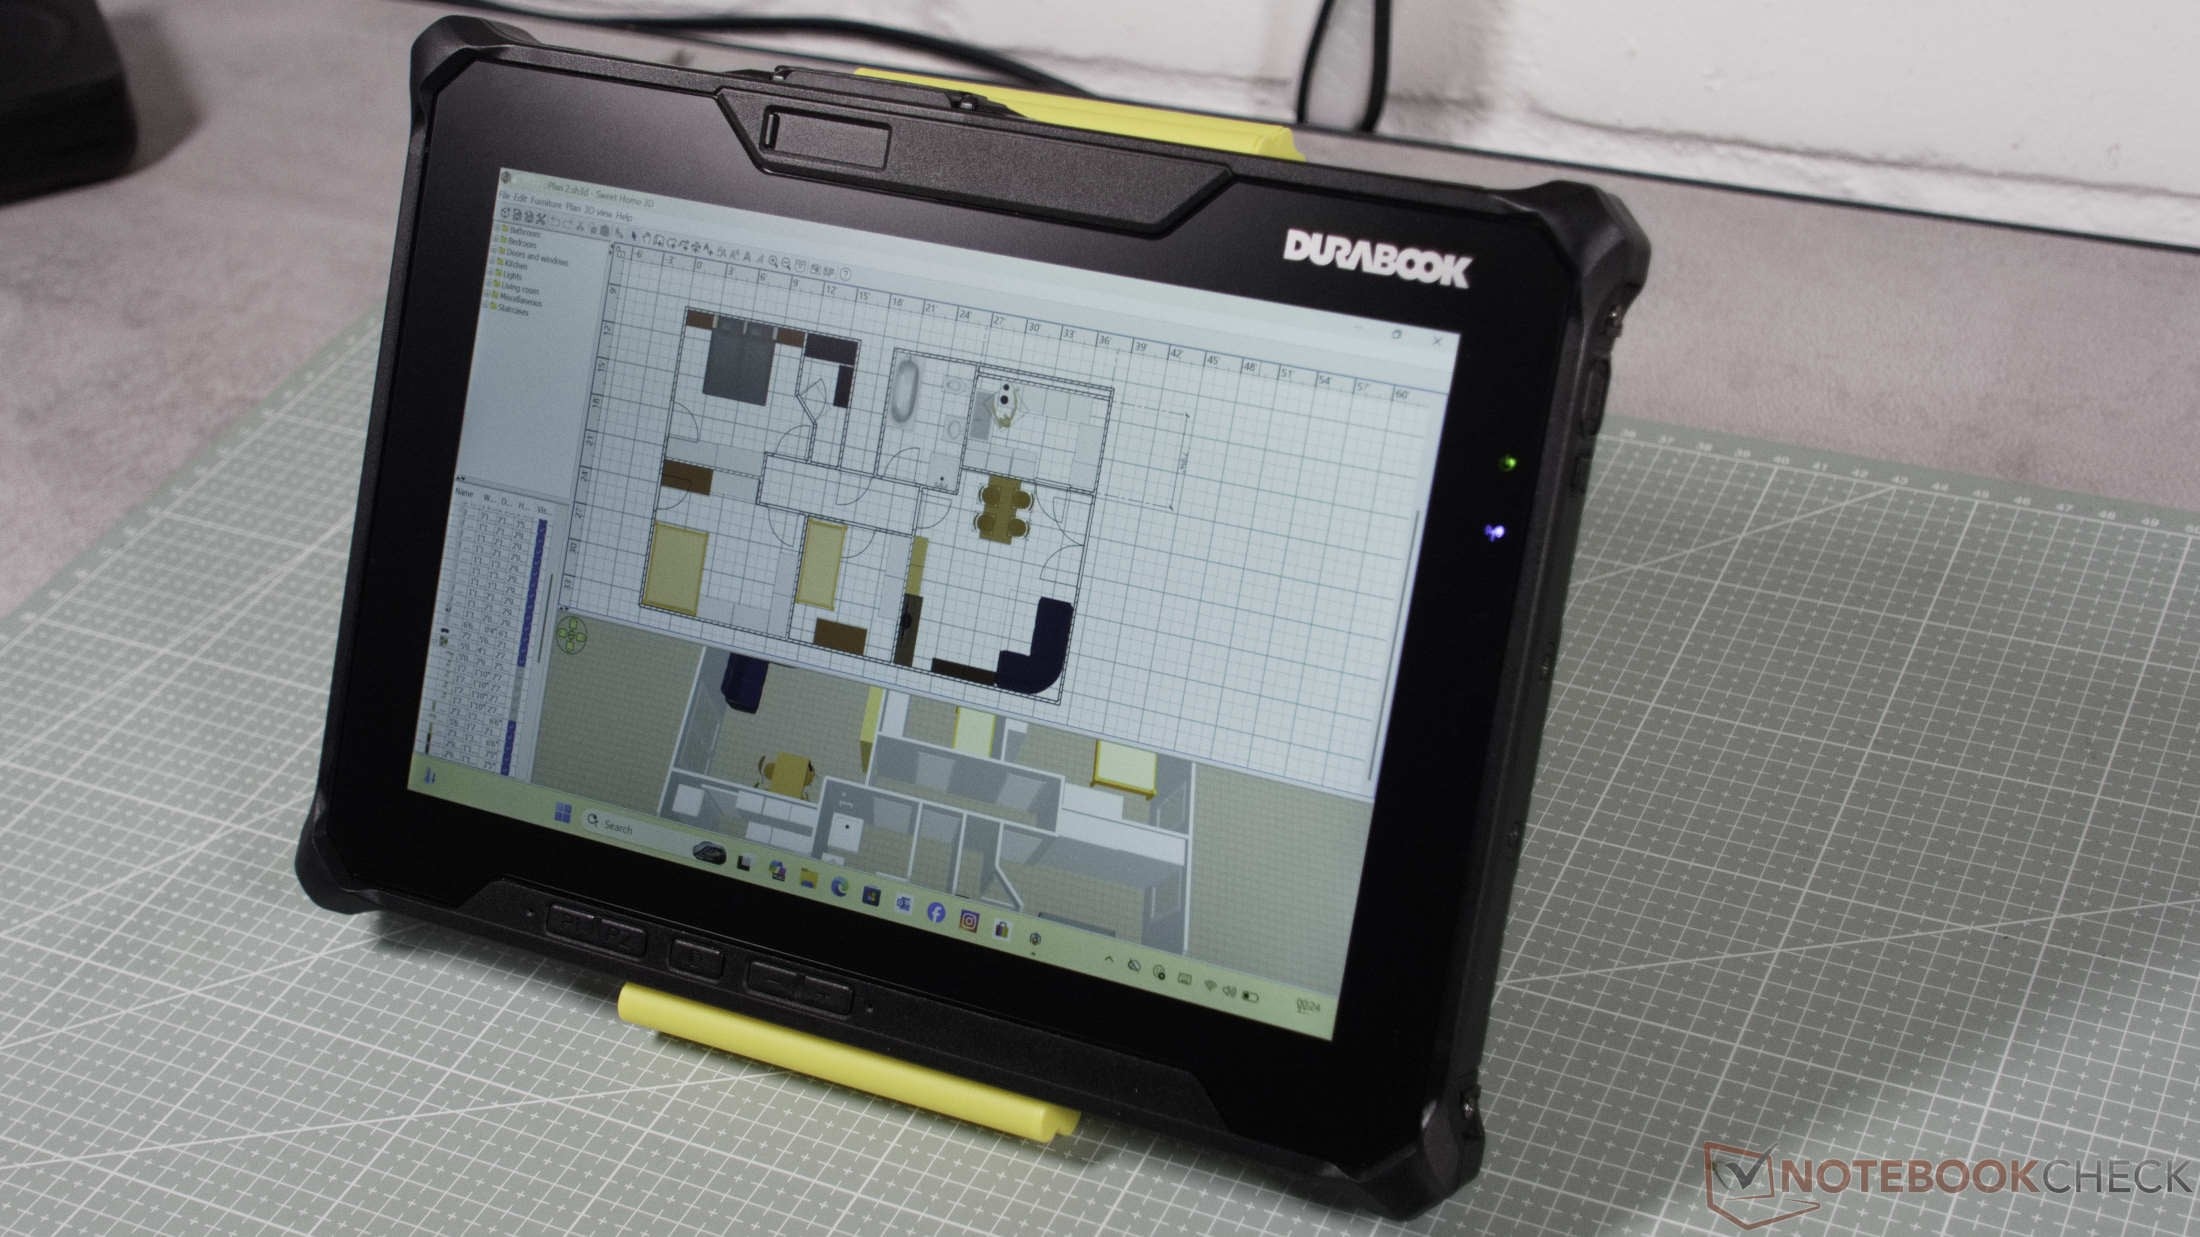
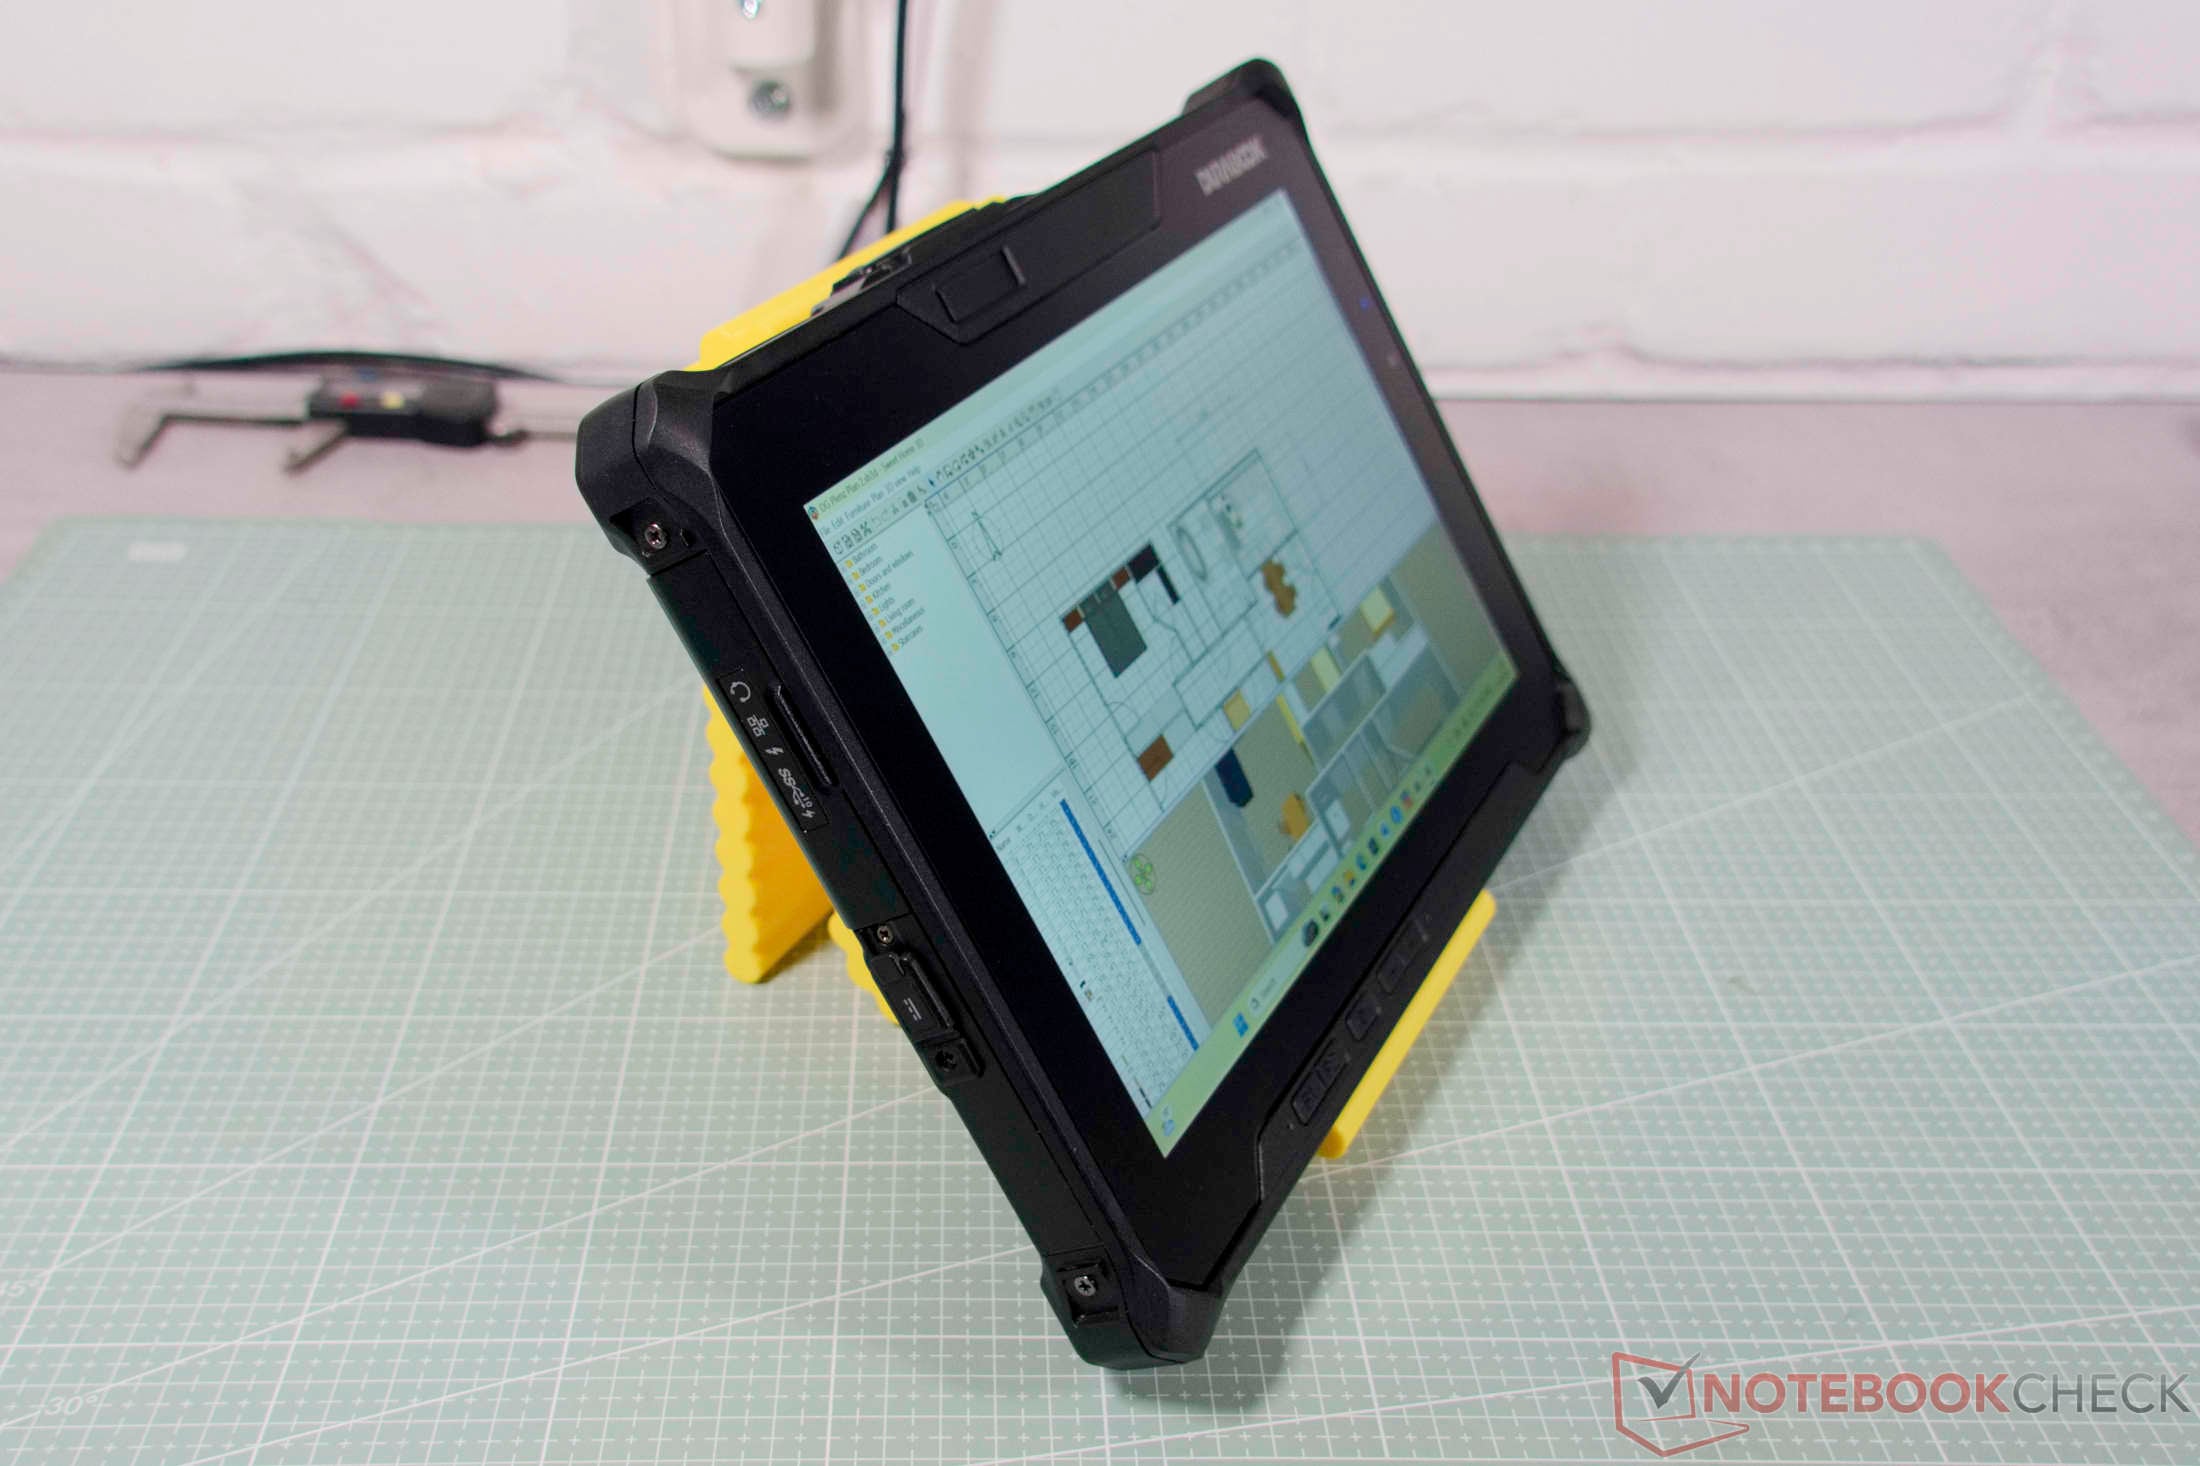
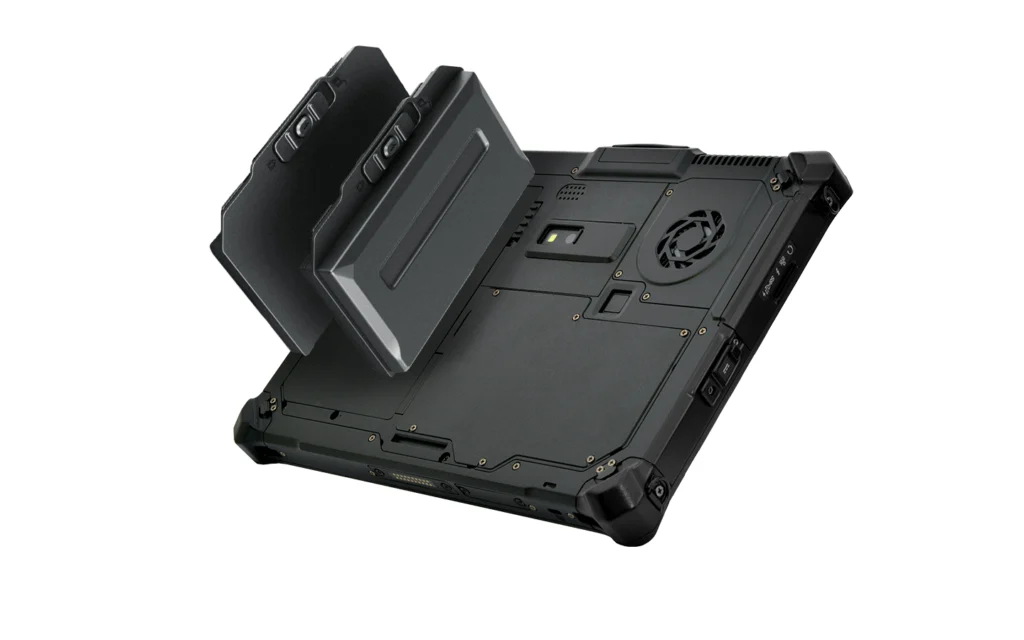
Quando se olha para o Durabook R10, ele parece um tijolo em comparação com os tablets convencionais de consumo. Com uma altura de pouco menos de três centímetros, molduras grossas na tela e um peso superior a 1,2 quilogramas (~2,65 lbs), o dispositivo de 10,1 polegadas parece pesado na mão. Fino e leve como uma pluma não são os objetivos aqui. O fabricante produz ferramentas sem concessões para uso em ambientes extremamente exigentes — seja em um canteiro de obras empoeirado, em uma instalação industrial ou em campo.
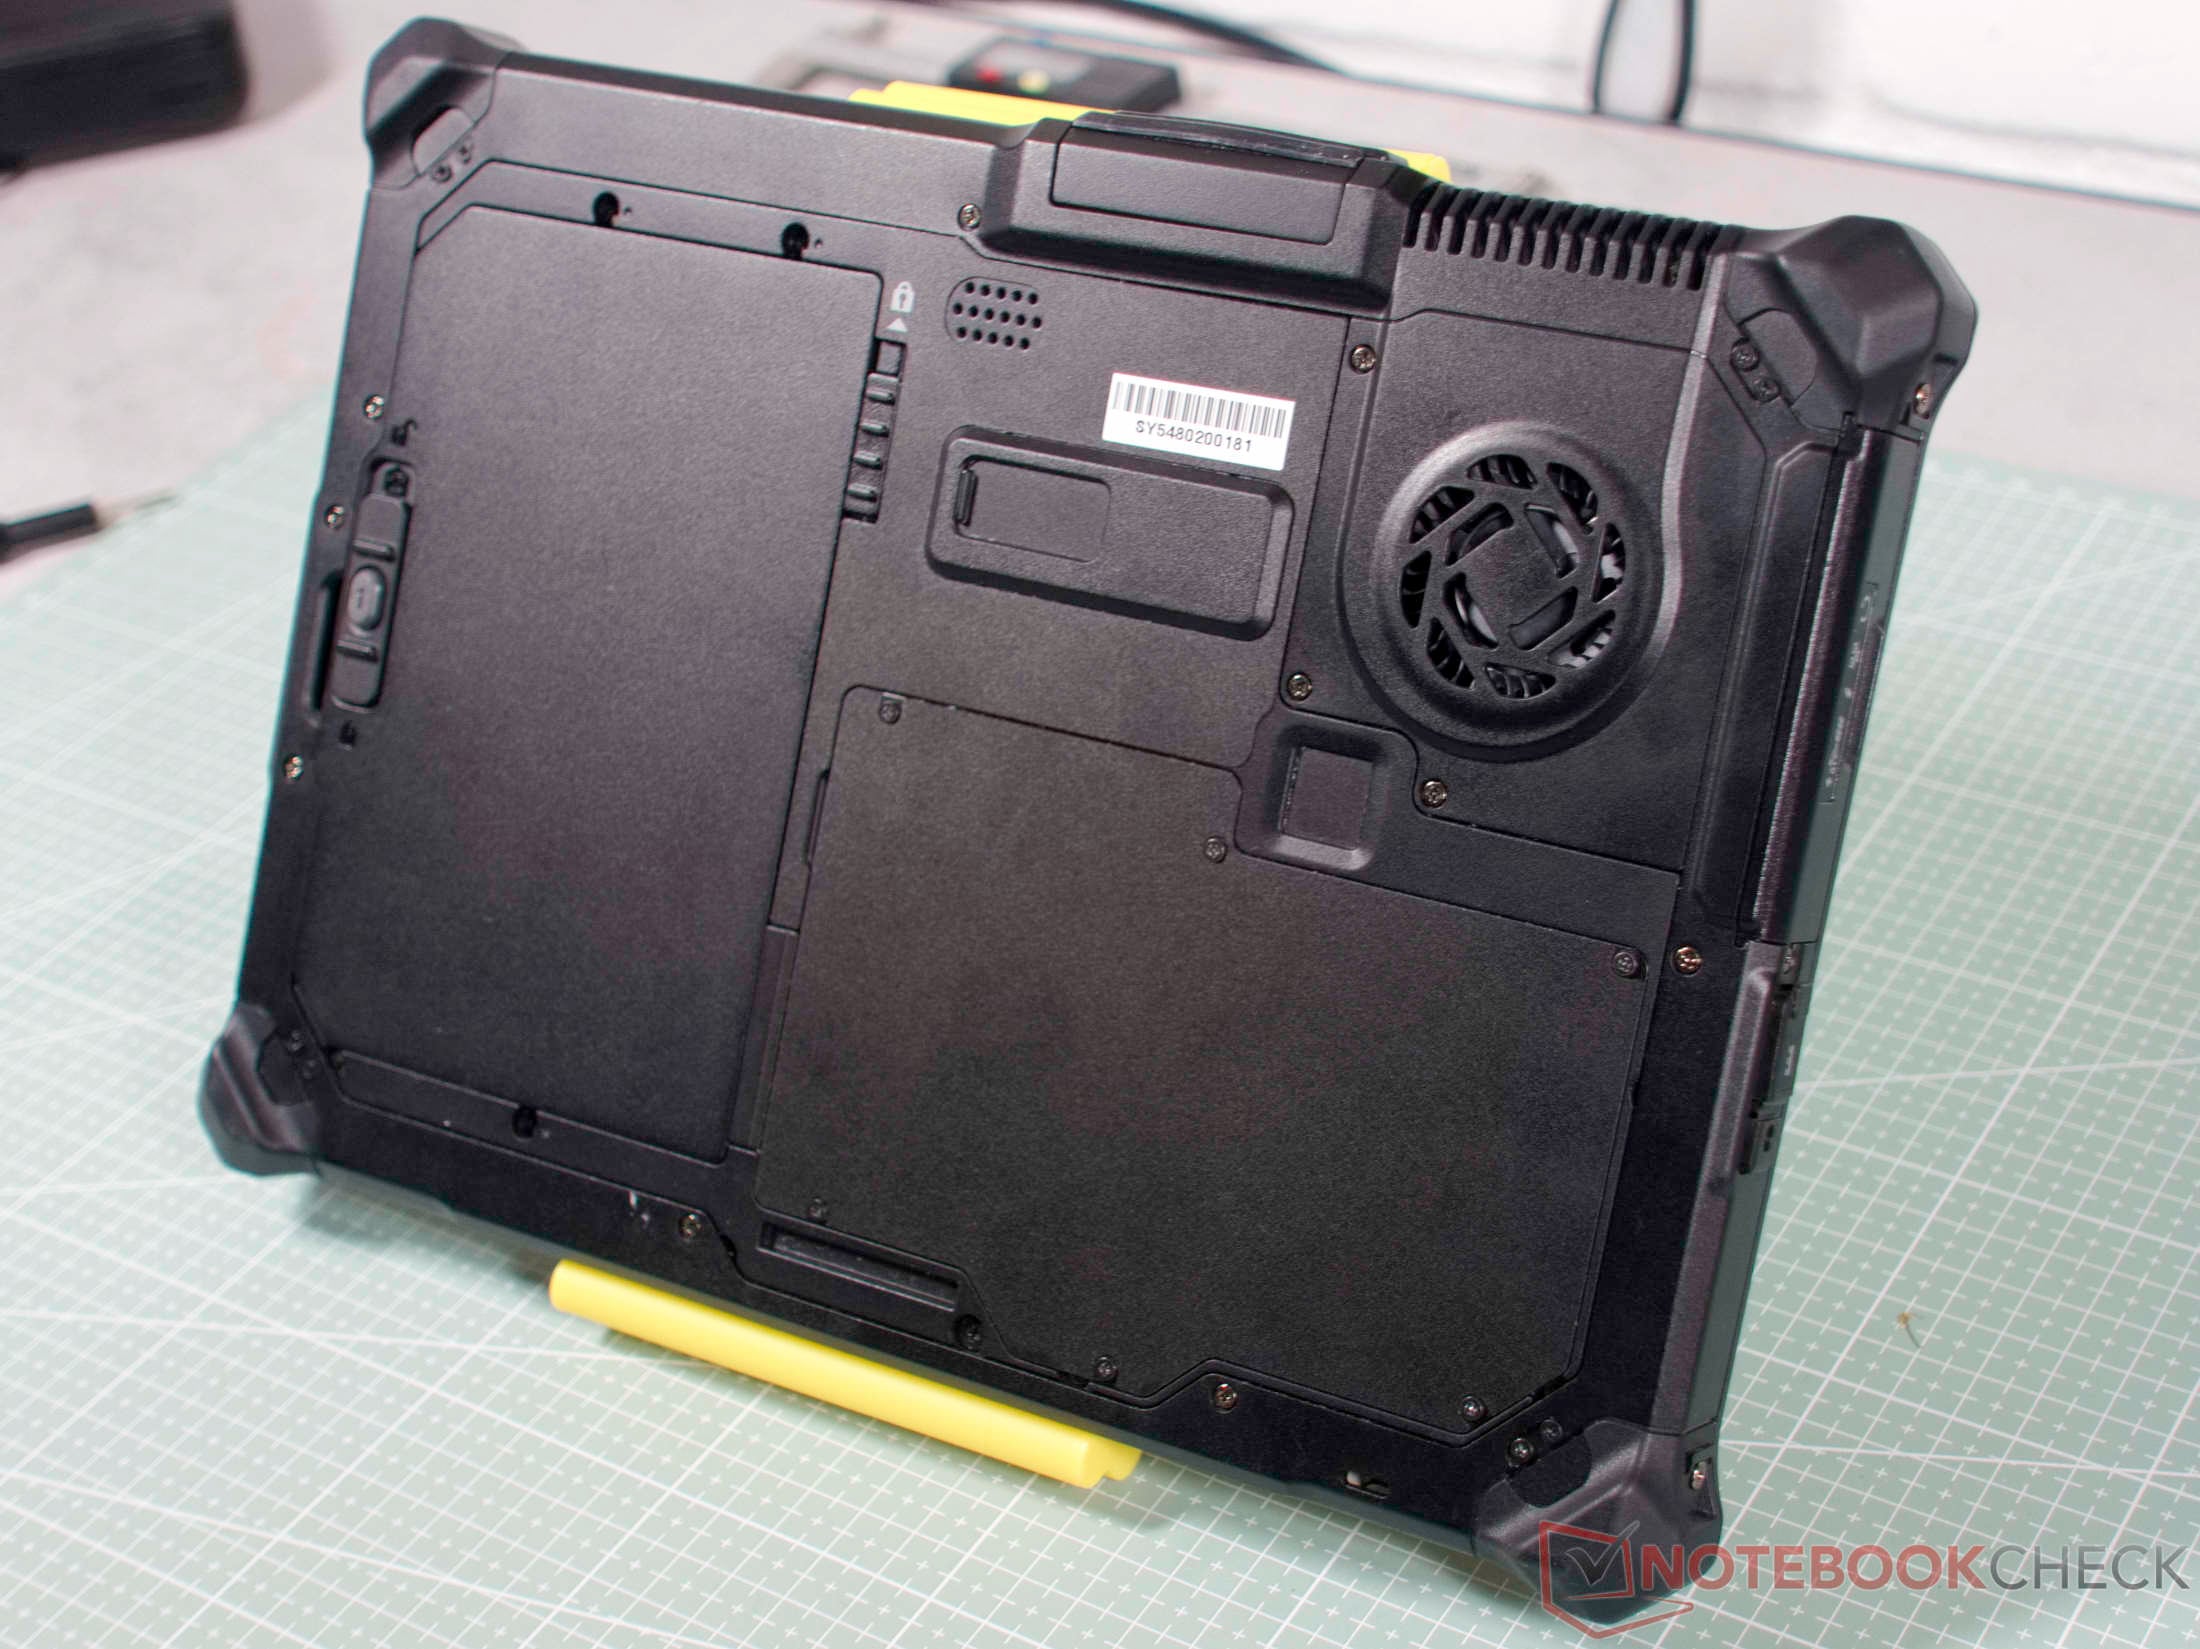
O R10 foi projetado precisamente para essas condições adversas. O invólucro de liga de magnésio é robusto como um tanque, resiste facilmente a quedas violentas e é rigorosamente vedado contra água e sujeira. Os recursos que mais se destacam para uso ao ar livre, no entanto, são a tela e o sistema de alimentação. Com um brilho bem superior a 1.000 cd/m² — confirmado em nosso teste —, o tablet robusto resiste sem esforço até mesmo à luz solar direta. Ele também possui uma bateria de reserva integrada para troca a quente de verdade. Isso significa que a bateria principal pode ser facilmente removida do dispositivo e substituída enquanto ele ainda estiver em funcionamento.
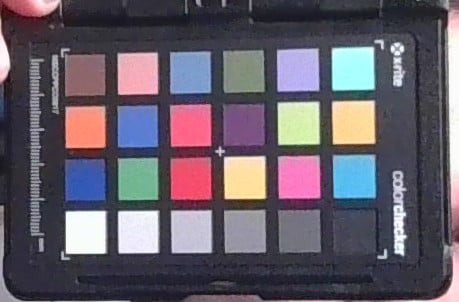
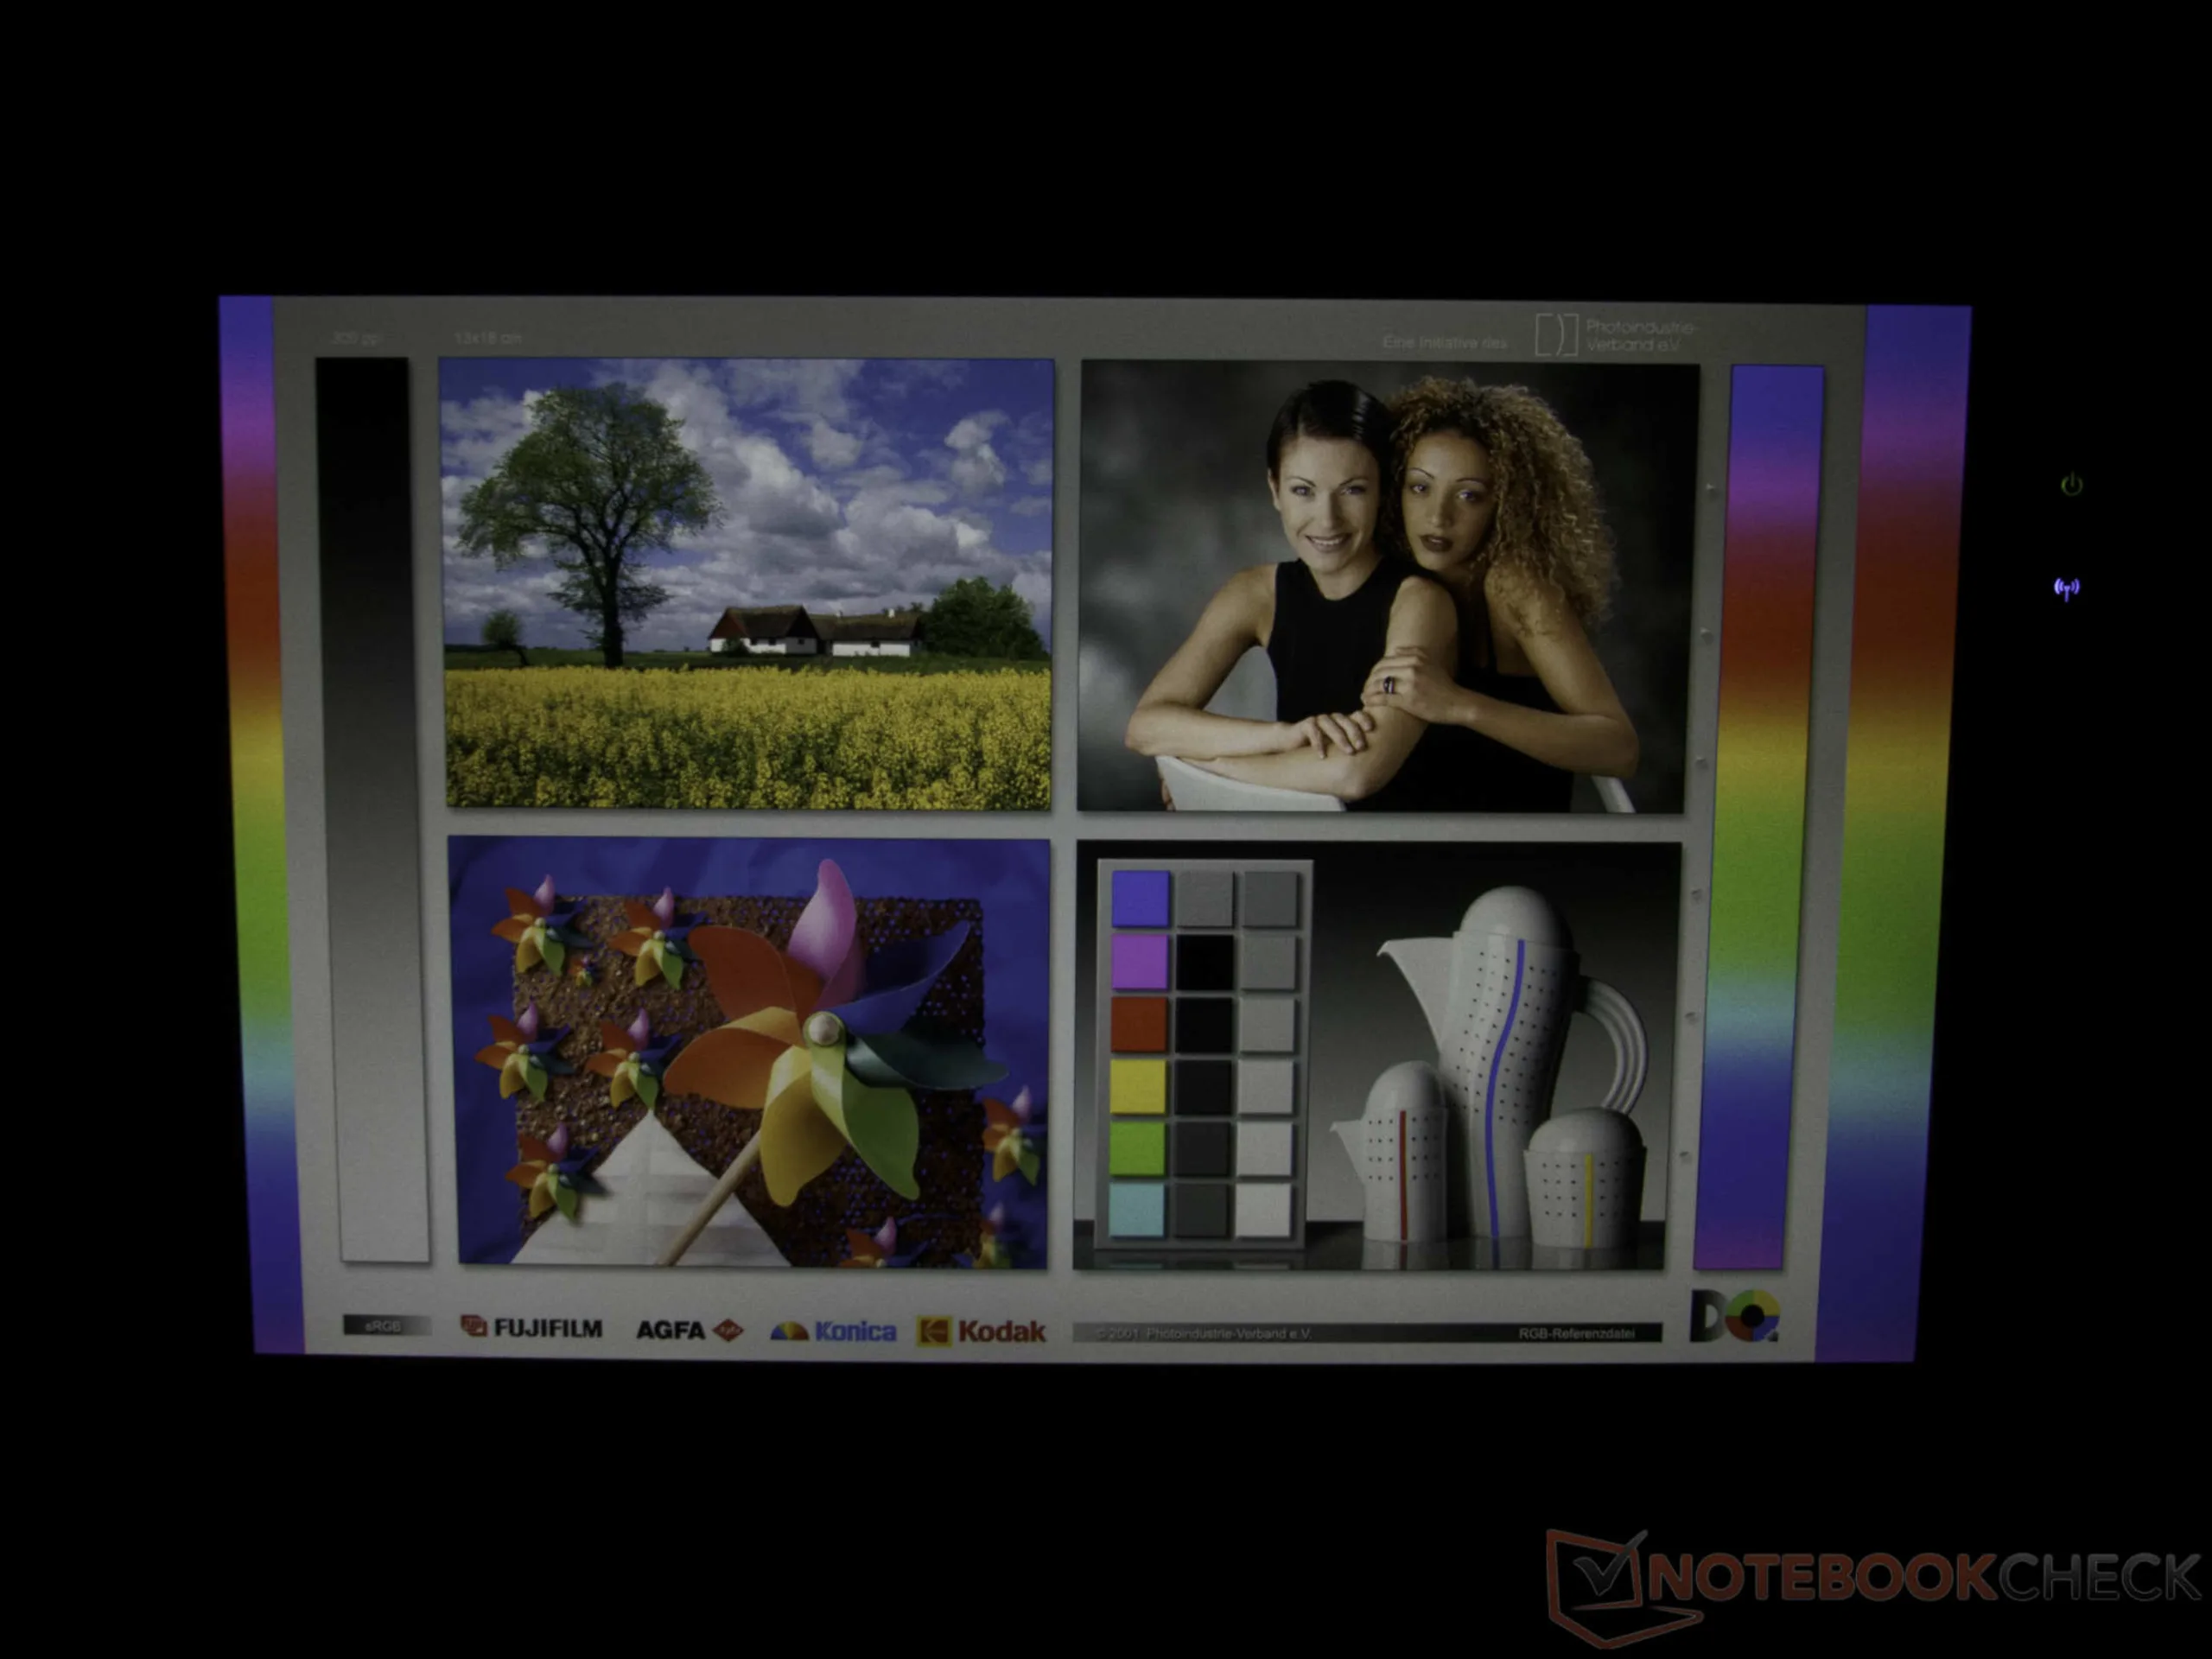
É claro que esse nível de especialização exige concessões. Para trabalhos em que a precisão das cores é fundamental, a tela — com seu tom esverdeado visível — é inutilizável, e as câmeras e o alto-falante mono integrado atendem apenas a necessidades básicas. O processador Intel Core Ultra 7 258V integrado lida com facilidade com tarefas diárias de escritório e de documentos, mas apresenta dificuldades com altas latências de DPC nos testes, o que pode causar problemas durante a captura de dados em tempo real. Além disso, o leitor de cartões está incomodamente escondido atrás da bateria. Por outro lado, o chassi volumoso não esquenta demais mesmo sob carga pesada, enquanto o ventilador interno emite um zumbido agradavelmente silencioso em segundo plano.
Preço e disponibilidade
Os preços e a disponibilidade do Durabook R10 são voltados principalmente para clientes profissionais. O fabricante não divulga os preços em seu site; em vez disso, os preços são calculados exclusivamente mediante solicitação individual. Isso se deve também ao fato de que muitas das configurações altamente especializadas — adaptadas às necessidades específicas de cada cliente — são vendidas exclusivamente diretamente pela Durabook. O tablet robusto pode, ocasionalmente, ser encontrado em lojas especializadas. Por exemplo, a loja Ruggedbooks apresenta o modelo básico com um Intel Core Ultra 5 226V por cerca de 2.759 euros (~$3.146). No site Elmark-Automation , uma configuração comparável com o mesmo processador custa a partir de cerca de 2.730 euros (~$3.113).
Especificações
Gabinete, acessórios e dispositivos de entrada
A estrutura do Durabook R10 é feita de uma liga de magnésio resistente e é perfeitamente adequada para os ambientes de trabalho mais adversos. Certificado de acordo com a norma militar norte-americana MIL-STD-810H, o tablet foi projetado para resistir a quedas de alturas de até 1,8 metros (~5,9 pés) e a condições ambientais extremas. Além disso, sua certificação IP66 garante proteção contra poeira e jatos de água de alta pressão. Para aplicações sensíveis, a certificação MIL-STD-461F também garante excelente compatibilidade eletromagnética.
Durabook Z14I-HG: Potência da IA para condições extremas
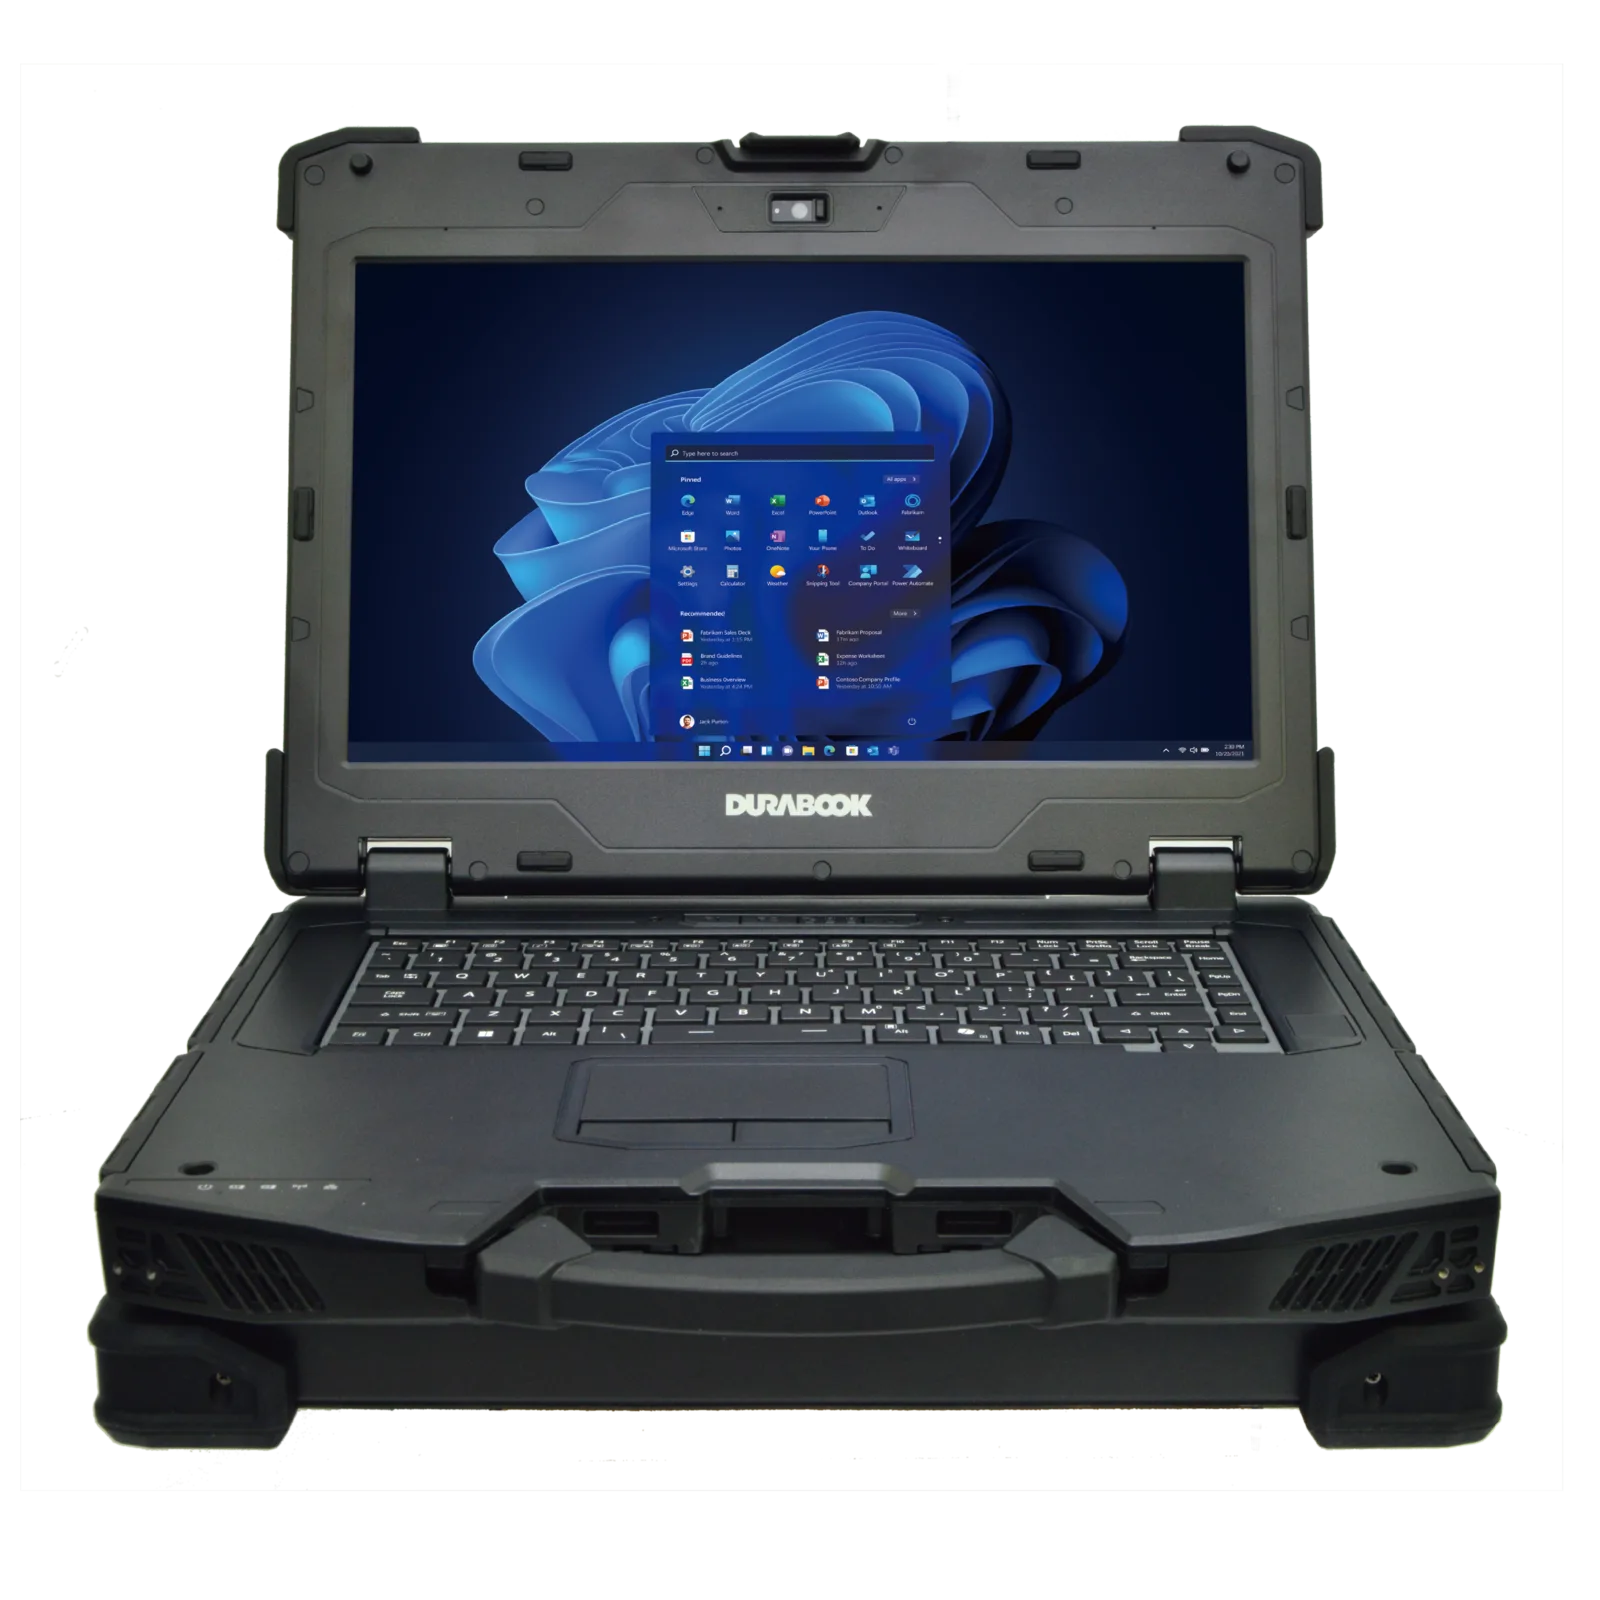
Com o Z14I-HG, a Durabook apresenta uma nova geração de estações de trabalho móveis: totalmente resistentes, preparadas para IA e projetadas para as aplicações mais exigentes diretamente no local de trabalho. O sistema de 14 polegadas combina desempenho de IA de ponta de até 682 TOPS com os potentes processadores Intel® Core™ Ultra. Ele também conta com uma NPU AI Boost e, opcionalmente, uma GPU NVIDIA® RTX™ 3500 Ada (12 GB) ou RTX™ 5000 Ada (16 GB). Qualquer pessoa que dependa de hardware potente e robusto — como em automação industrial, serviços de campo ou pesquisa técnica — se beneficia da análise rápida de IA e do desempenho gráfico de nível profissional para computação móvel de alto desempenho.
Seja renderização 3D em tempo real, inferência de IA ou simulações com uso intensivo de dados — o Z14I-HG processa cargas de trabalho exigentes localmente. Isso reduz a latência. Ao mesmo tempo, a independência em relação aos provedores de nuvem aumenta a segurança dos dados, por exemplo, durante inspeções, manutenção preditiva ou aplicações de gêmeos digitais.
O sistema possui certificação MIL-STD-810H, MIL-STD-461G e IP66. Ele resiste a temperaturas extremas, umidade e interferência eletromagnética. Além disso, a tela DynaVue® de 1.200 nits permanece perfeitamente legível mesmo sob luz solar direta e oferece suporte a vários modos de entrada, bem como a configurações com múltiplas telas.
A estação de trabalho Z14I-HG já está disponível e pode ser encomendada diretamente da Durabook.
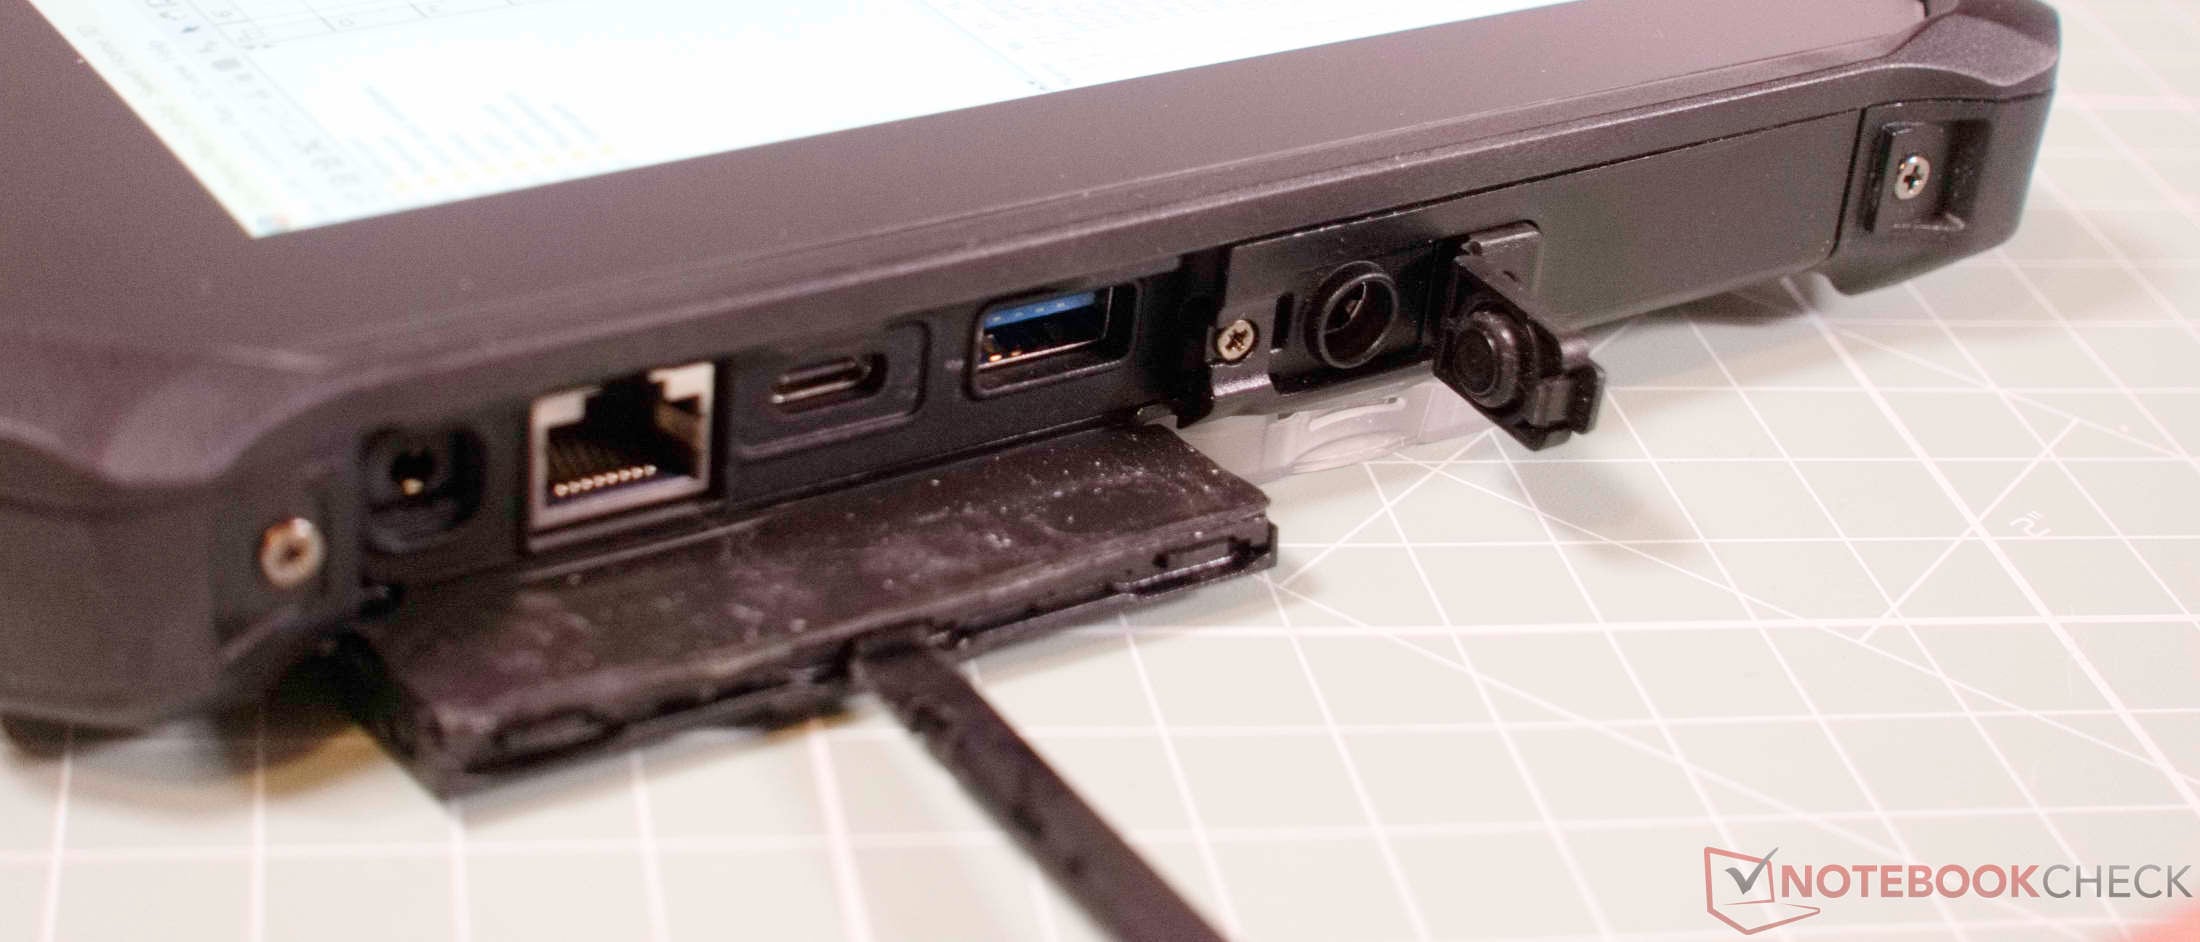
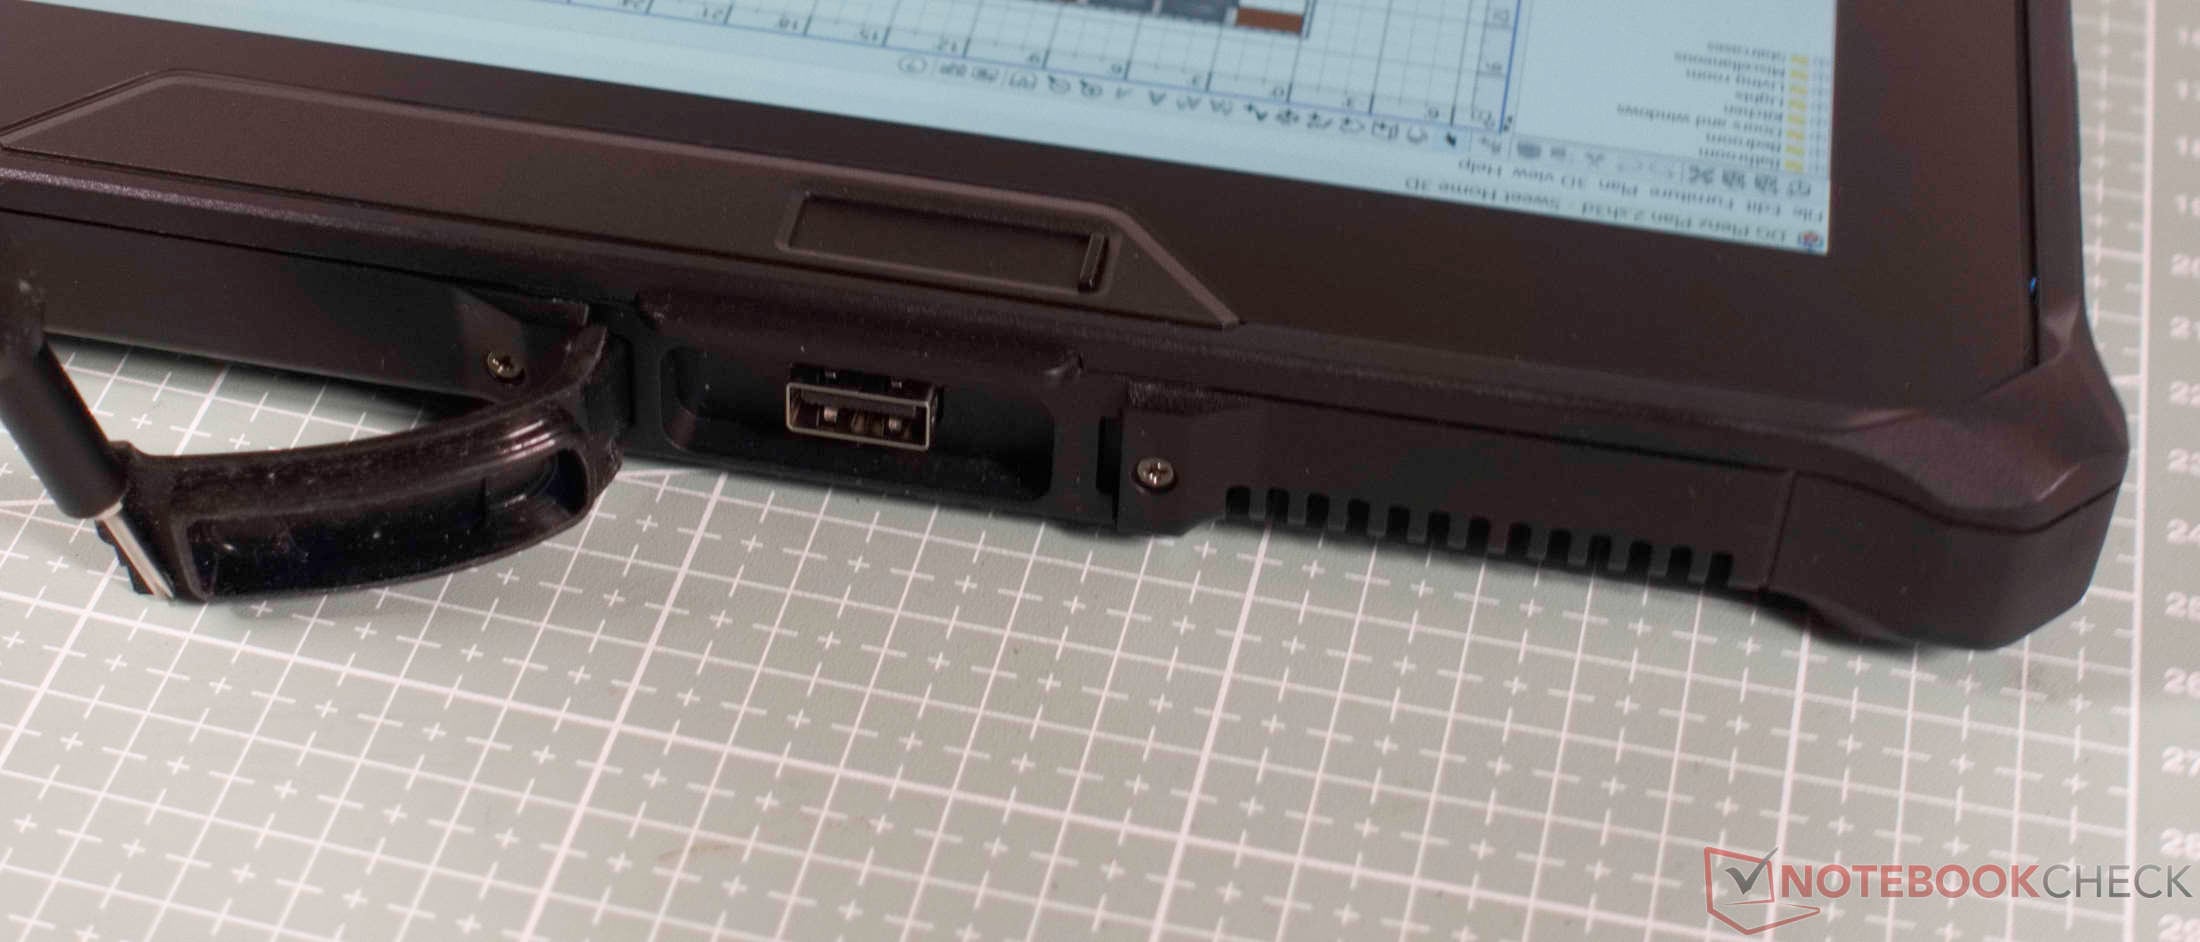
Conectividade
Todas as portas estão ocultas atrás de tampas protetoras resistentes. O tablet possui uma moderna porta USB-C com Thunderbolt, DisplayPort e Power Delivery. Ele também inclui uma porta RJ-45 Gigabit Ethernet, um conector para fone de ouvido e um conector de alimentação padrão.
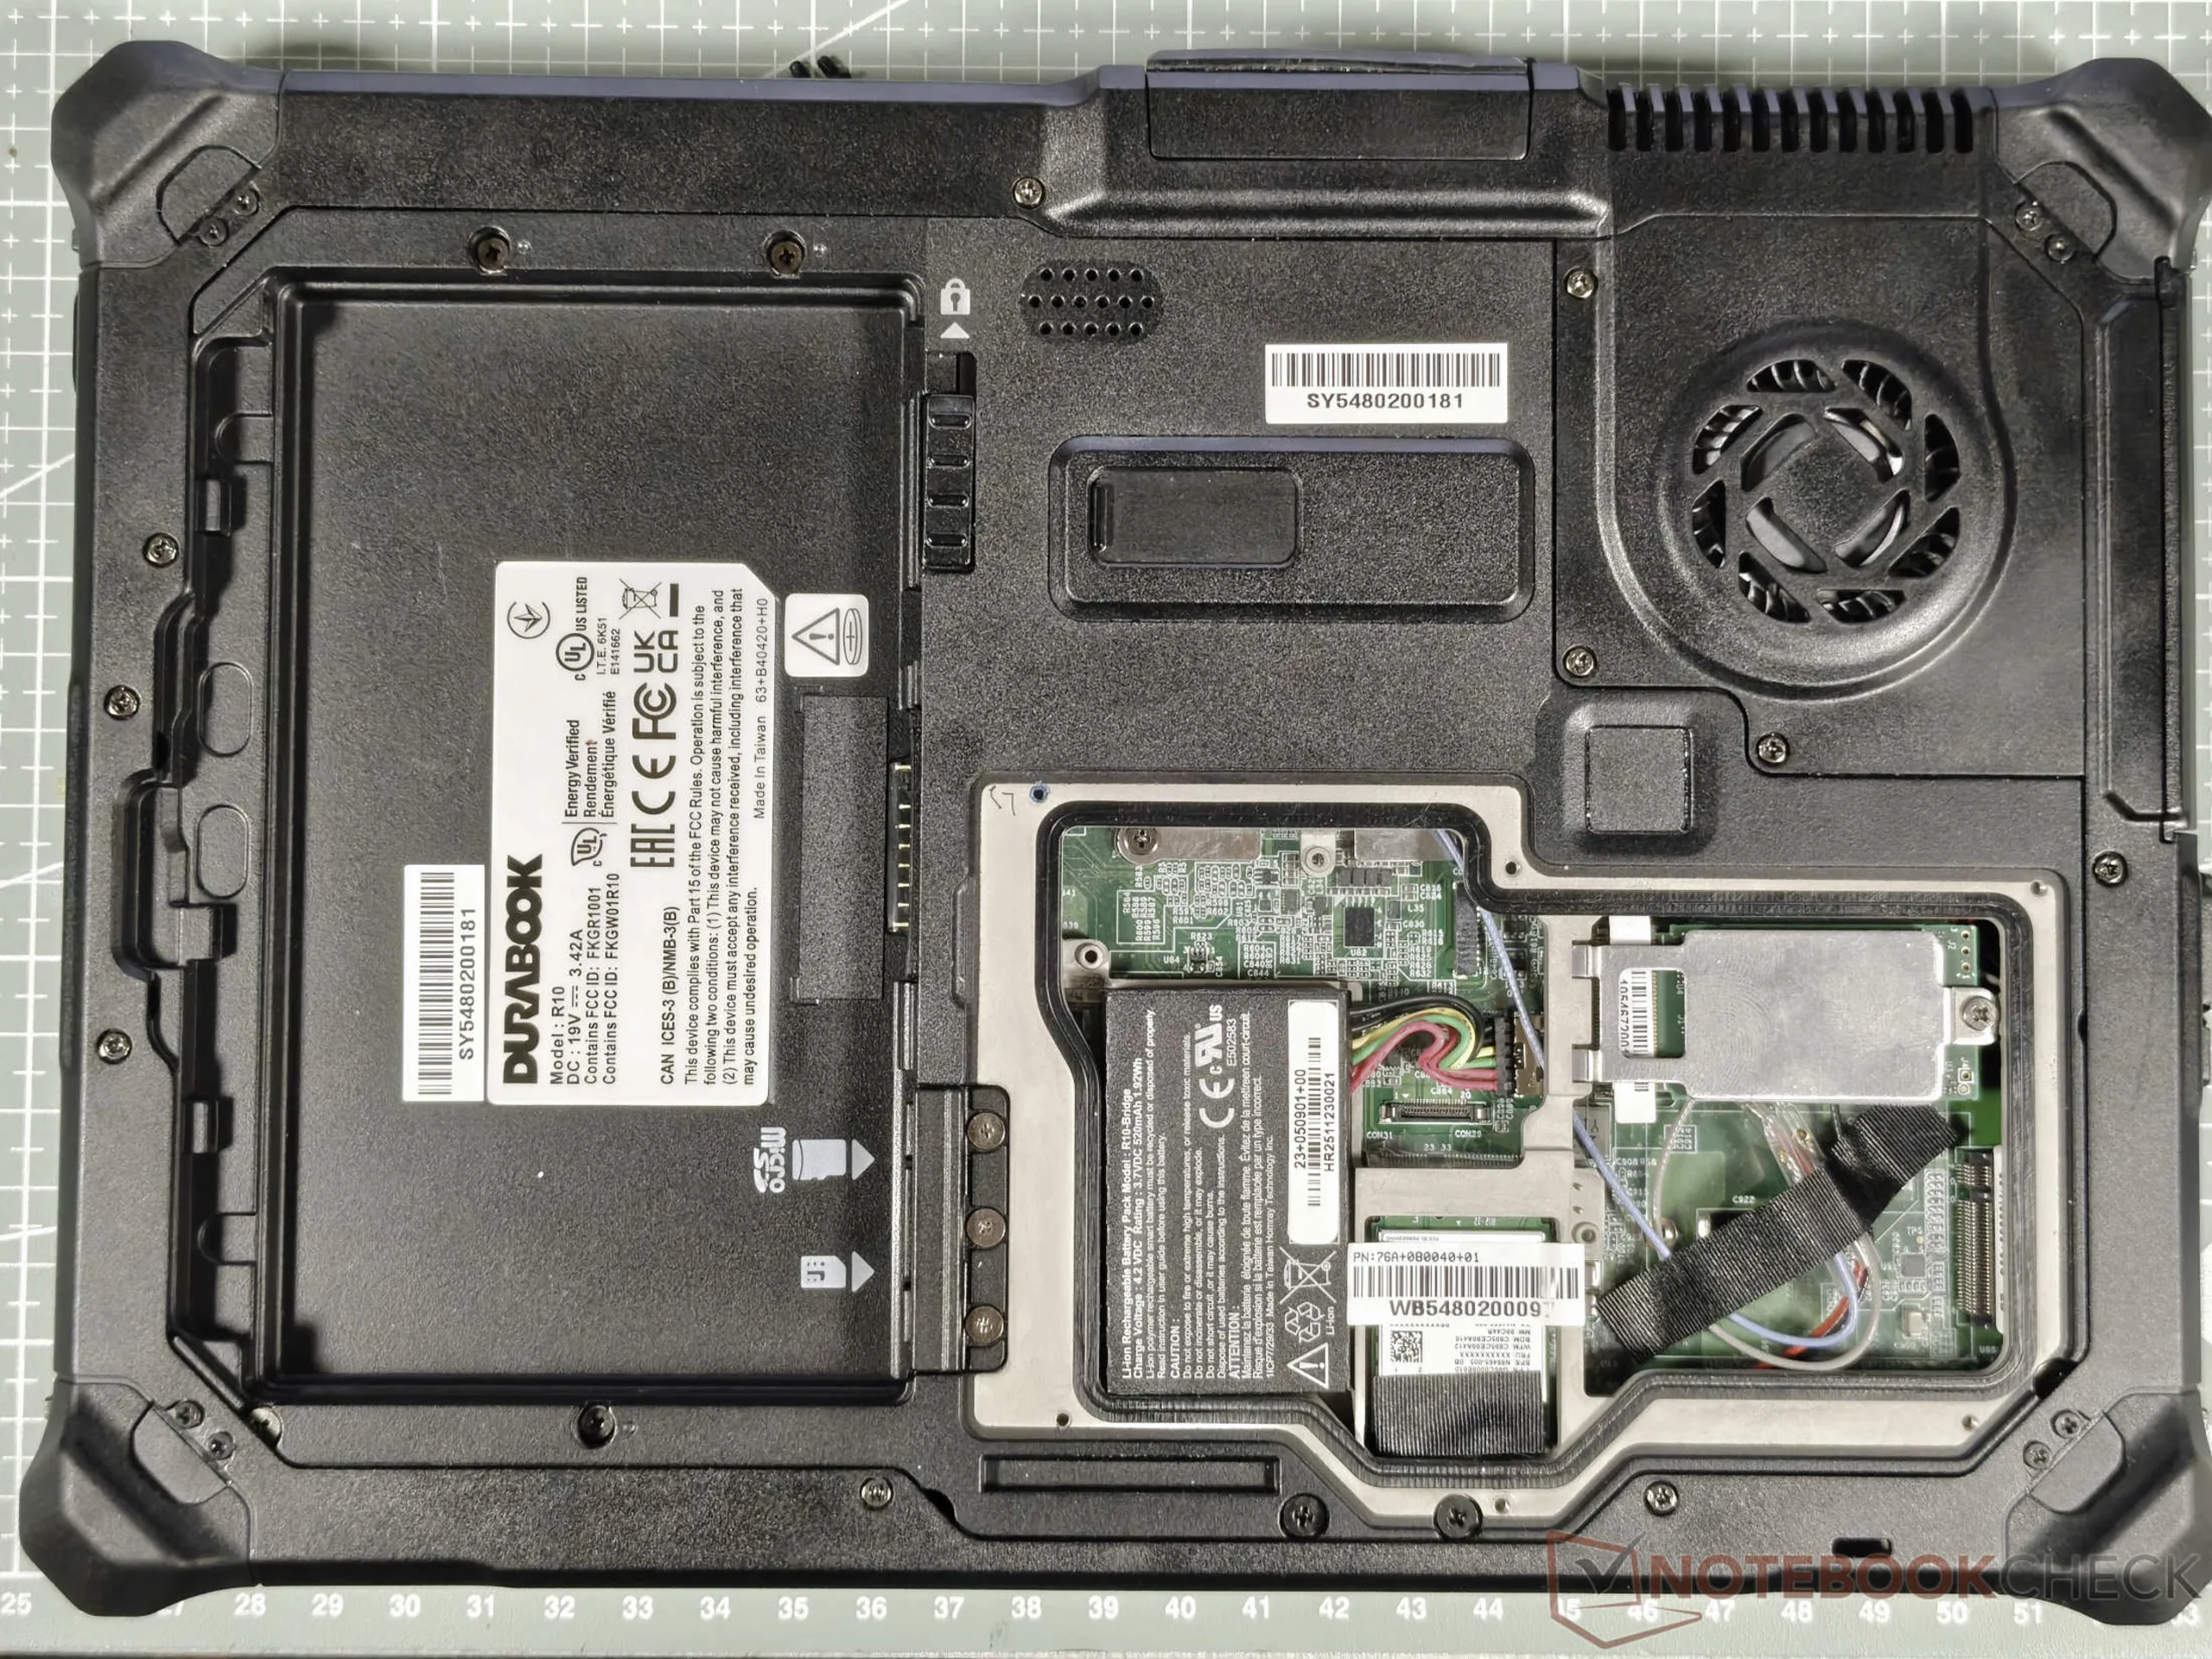
A parte traseira do tablet também conta com um leitor biométrico de impressão digital para acesso seguro ao sistema. Infelizmente, o leitor de cartão SD integrado é um tanto inacessível, pois está localizado no interior, atrás da bateria. No entanto, ele é razoavelmente rápido. No interior do tablet, há também slots vazios para cartões de expansão. Em termos de conectividade sem fio, o tablet robusto oferece Wi-Fi 7 e Bluetooth 5.4.
| SD Card Reader | |
| average JPG Copy Test (av. of 3 runs) | |
| Durabook R10 | |
| Dell Latitude 7030 Rugged Extreme (AV Pro V60) | |
| Durabook R8 Tablet (AV Pro V60) | |
| Média da turma Tablet (10.2 - 79.2, n=44, últimos 2 anos) | |
| Dynabook Portege Z40L-N (AV PRO microSD 128 GB V60) | |
| maximum AS SSD Seq Read Test (1GB) | |
| Dell Latitude 7030 Rugged Extreme (AV Pro V60) | |
| Durabook R10 | |
| Dynabook Portege Z40L-N (AV PRO microSD 128 GB V60) | |
| Média da turma Tablet (n=1últimos 2 anos) | |
| Durabook R8 Tablet (AV Pro V60) | |
Câmera
A câmera frontal Full HD é mais do que adequada para videoconferências. A câmera principal de 11 megapixels na parte traseira tira fotos macro impressionantemente boas, mas apresenta dificuldades em fotos de grande angular devido ao autofoco lento e a uma faixa dinâmica limitada. Graças ao flash embutido, a câmera continua sendo utilizável em ambientes escuros.


Dispositivos de entrada
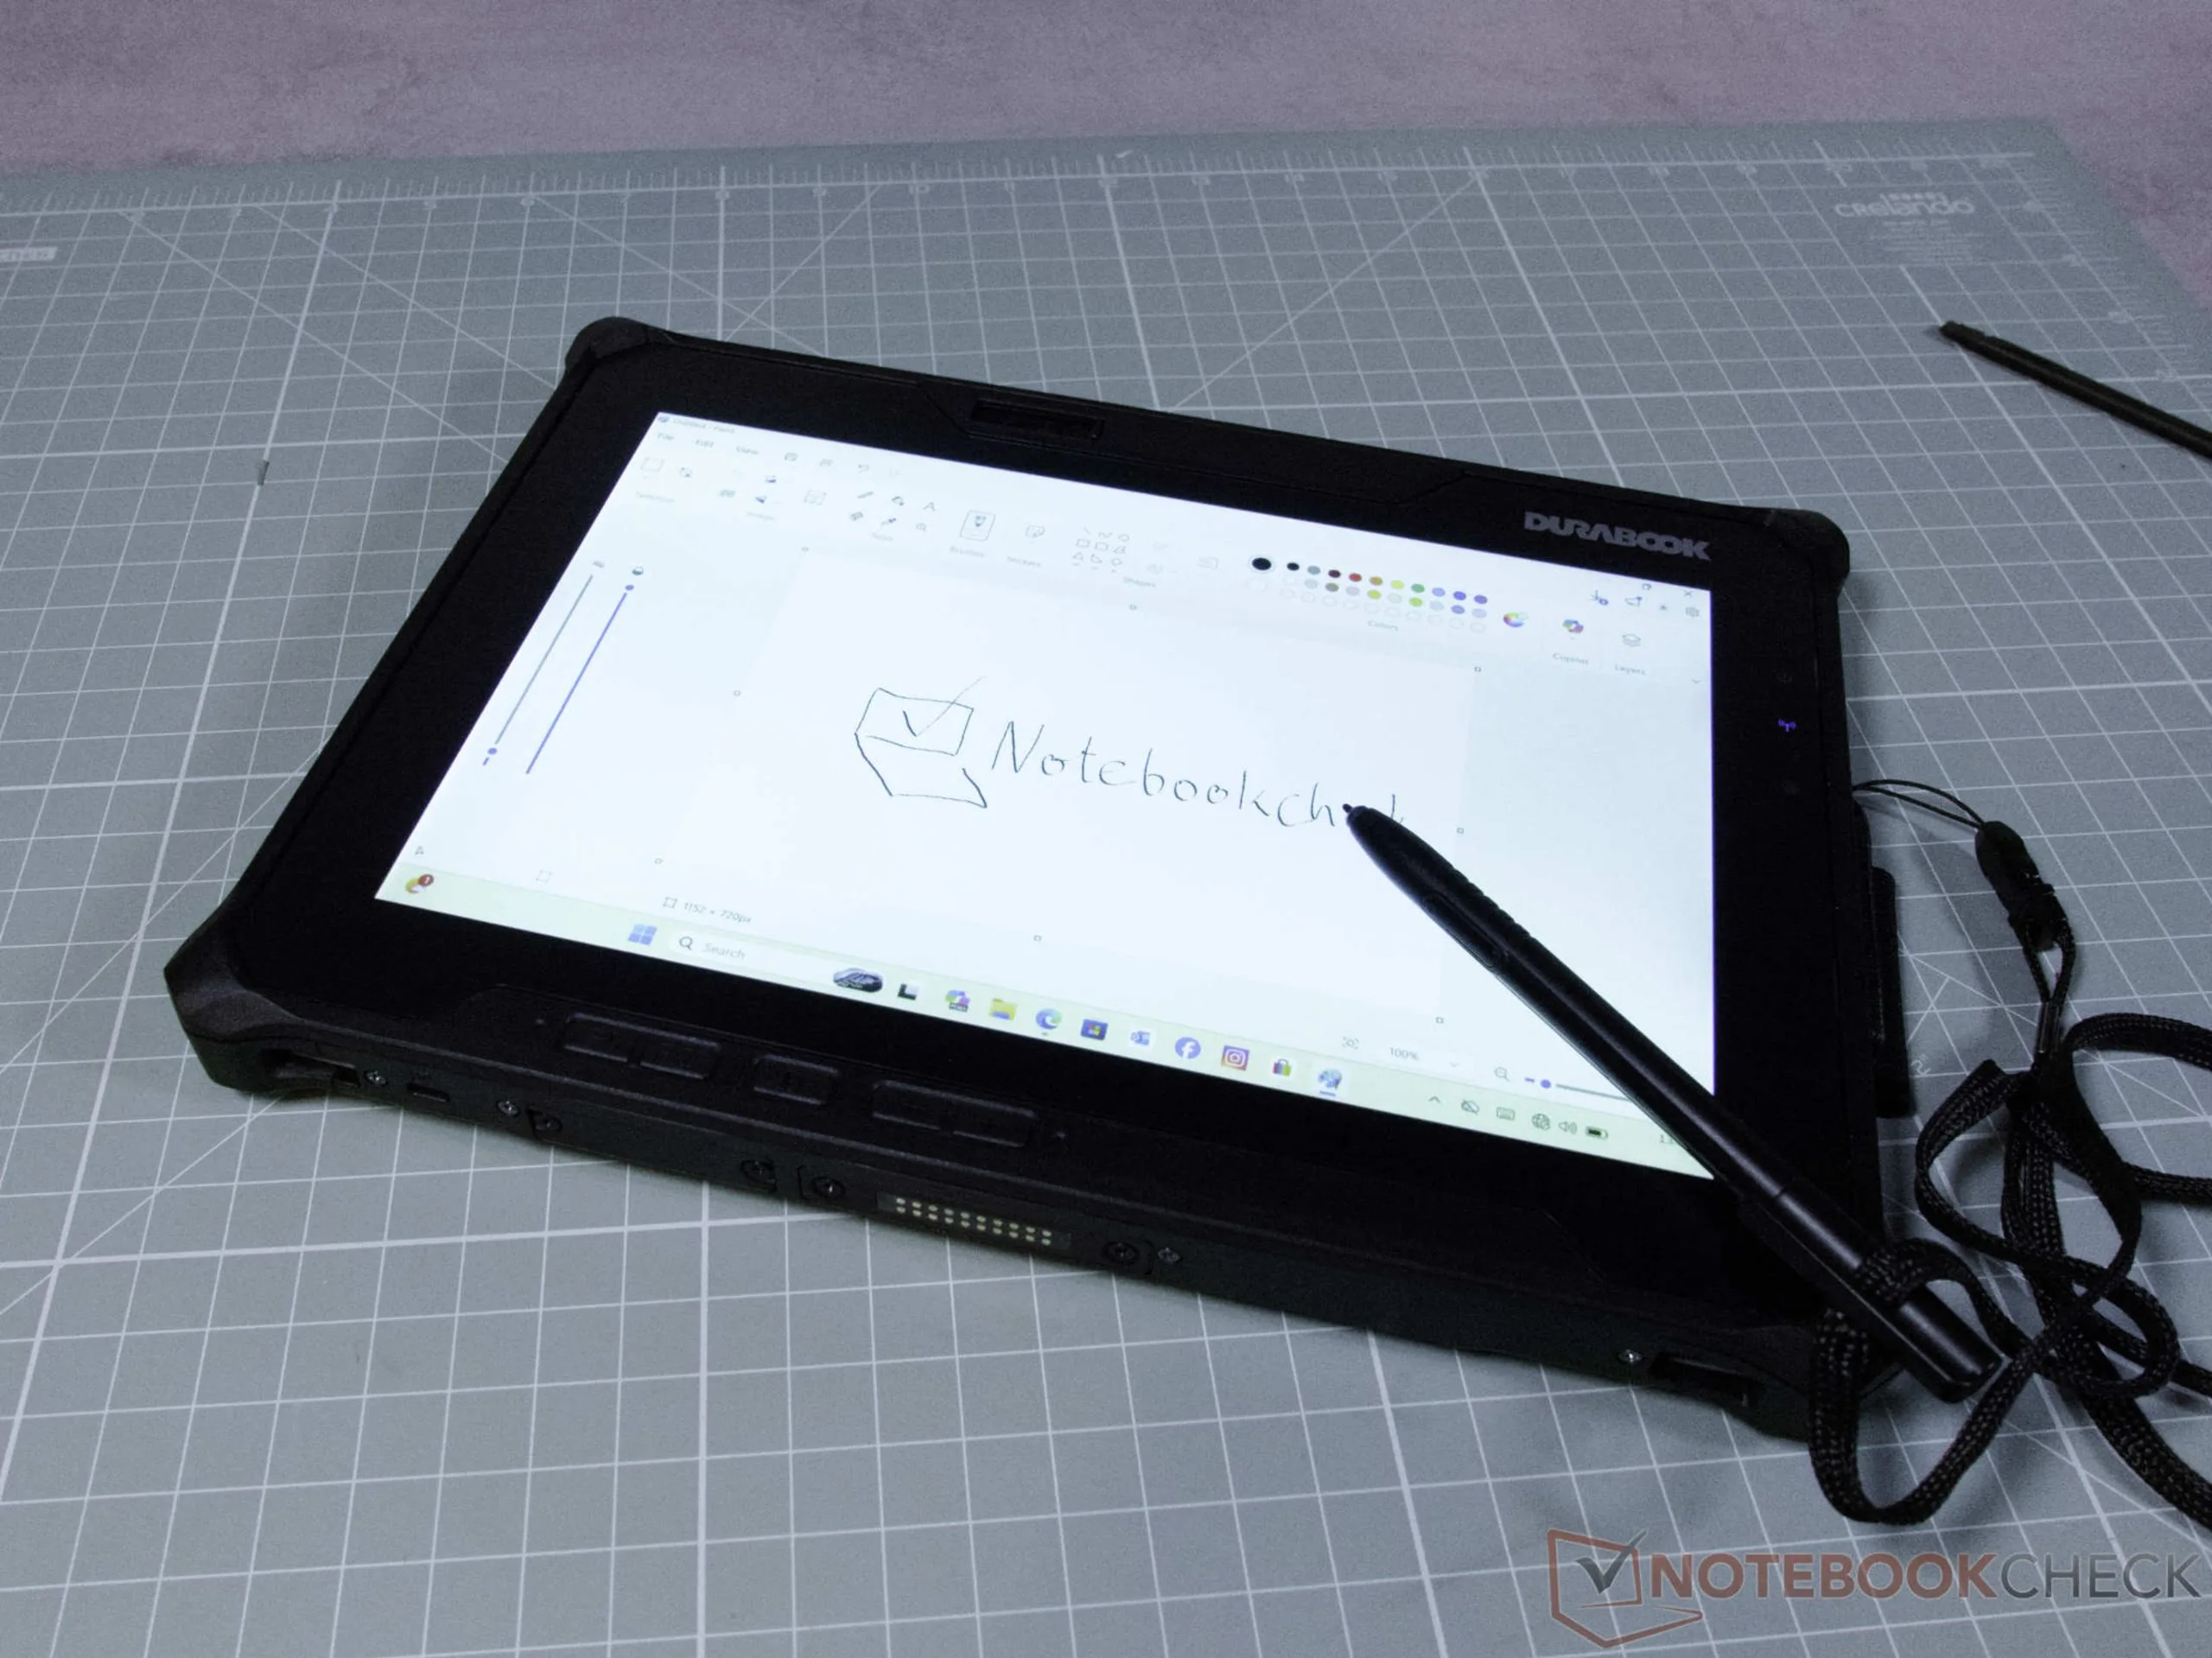
Além da tela sensível ao toque, o Durabook R10 possui seis botões cujas funções podem ser personalizadas. A tela sensível ao toque continua sendo o elemento central de controle, no entanto, e pode ser otimizada de forma flexível para ambientes de trabalho adversos. Por exemplo, o modo de toque pode ser ajustado para que a tela reconheça de forma confiável as entradas, seja com o uso de luvas de proteção grossas ou em condições de umidade. Para desenhos técnicos detalhados ou esboços, a tela é compatível com o Microsoft Pen Protocol 1.51.
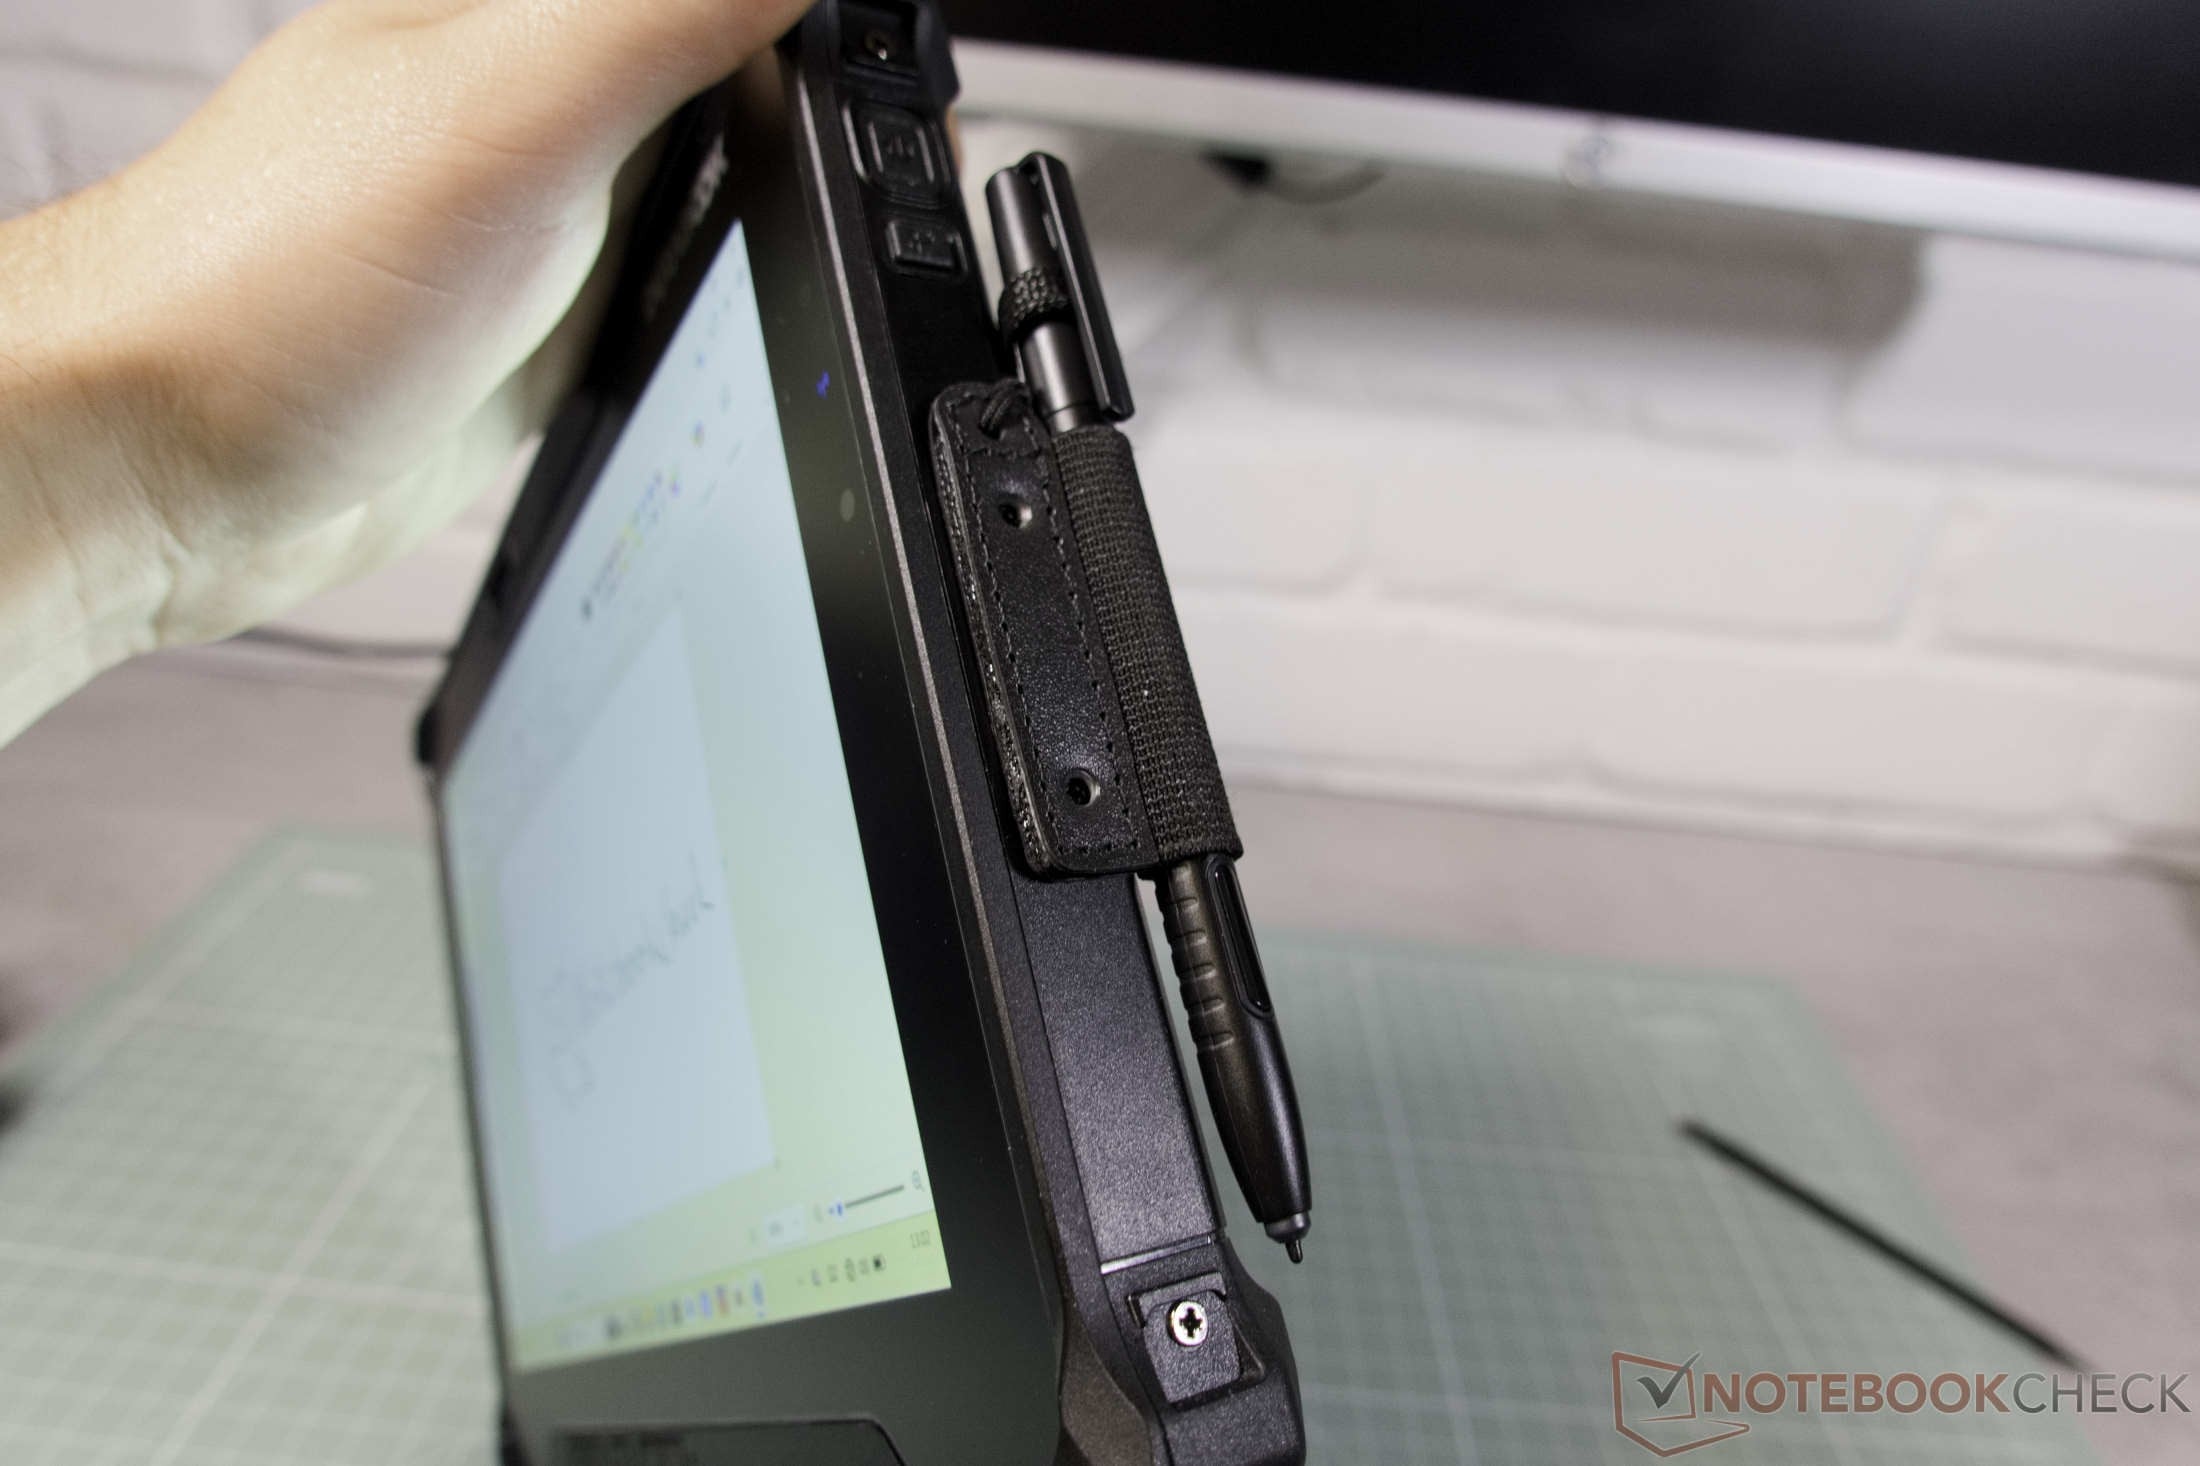
A caneta do Durabook é surpreendentemente leve, mas precisa. Um suporte opcional para a caneta pode ser aparafusado ao tablet; ele também inclui uma alça de segurança para a caneta.
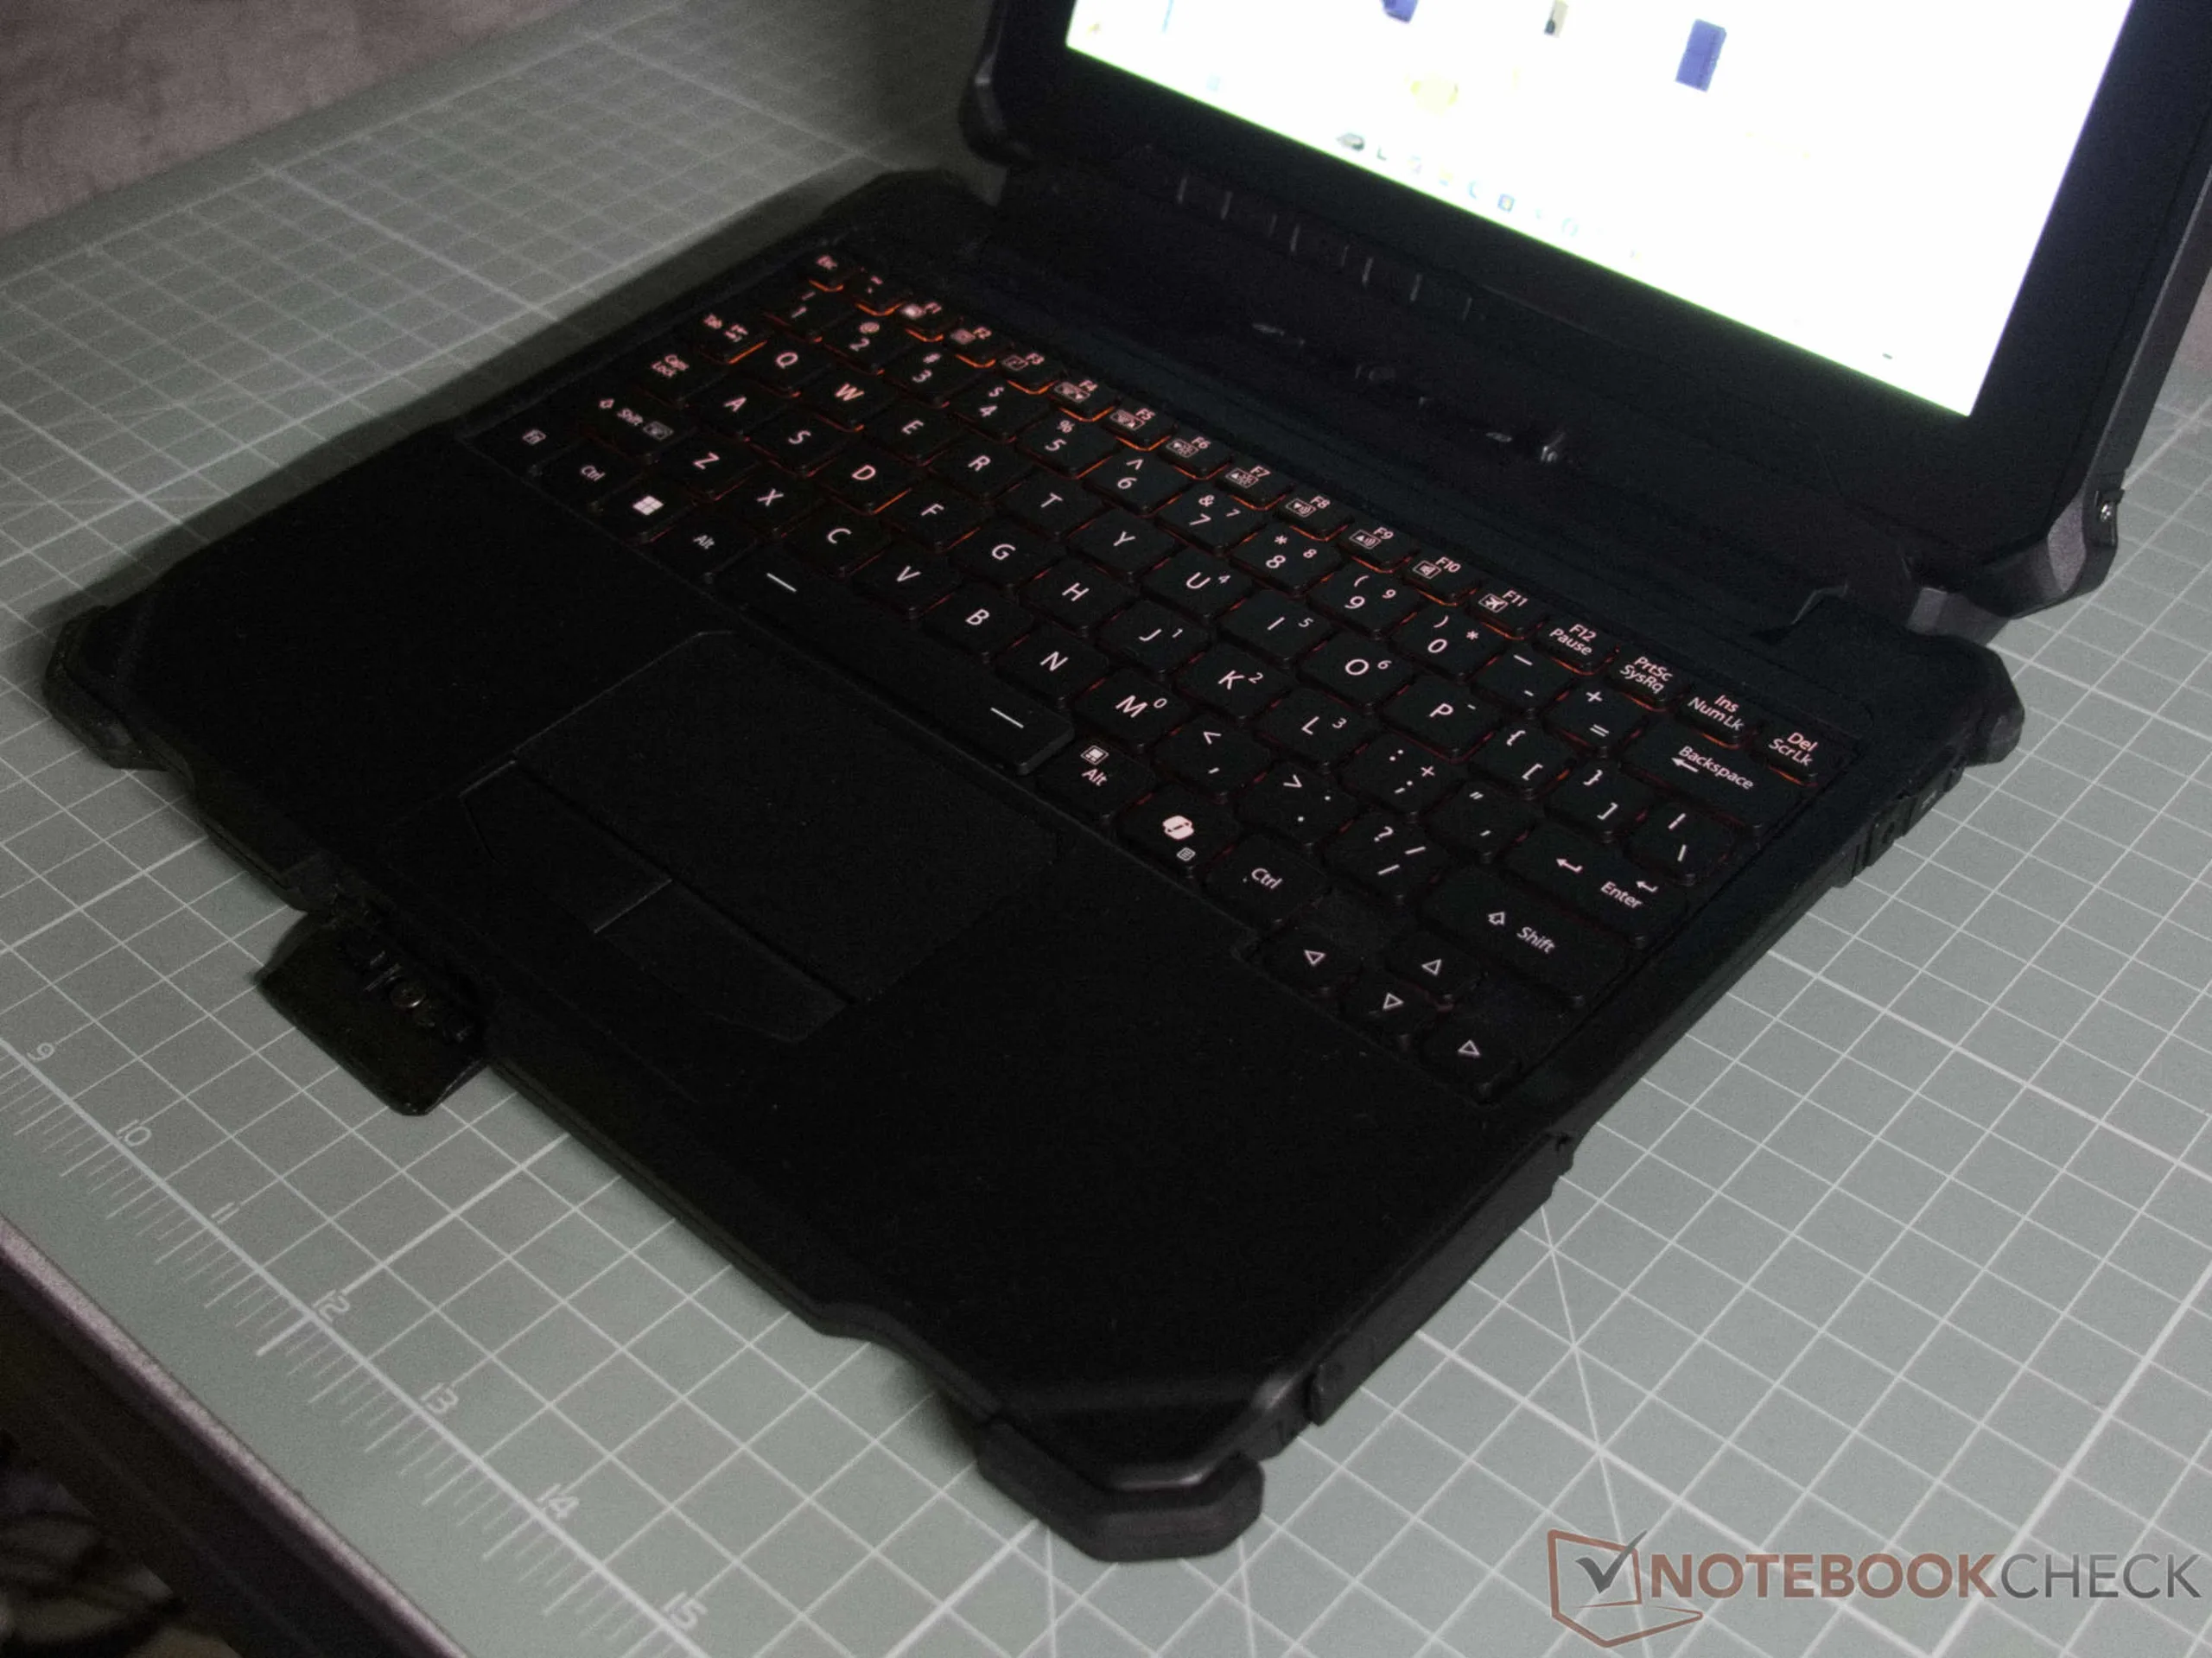
Opcionalmente, o tablet pode ser atualizado para um modelo destacável. O módulo de teclado que o acompanha oferece retroiluminação vermelha que não cansa os olhos, bem como várias portas adicionais. Duas portas USB-A 3.2 vêm de fábrica, e portas HDMI ou LAN podem ser configuradas conforme necessário. A unidade de teclado também possui uma porta de carregamento adicional.
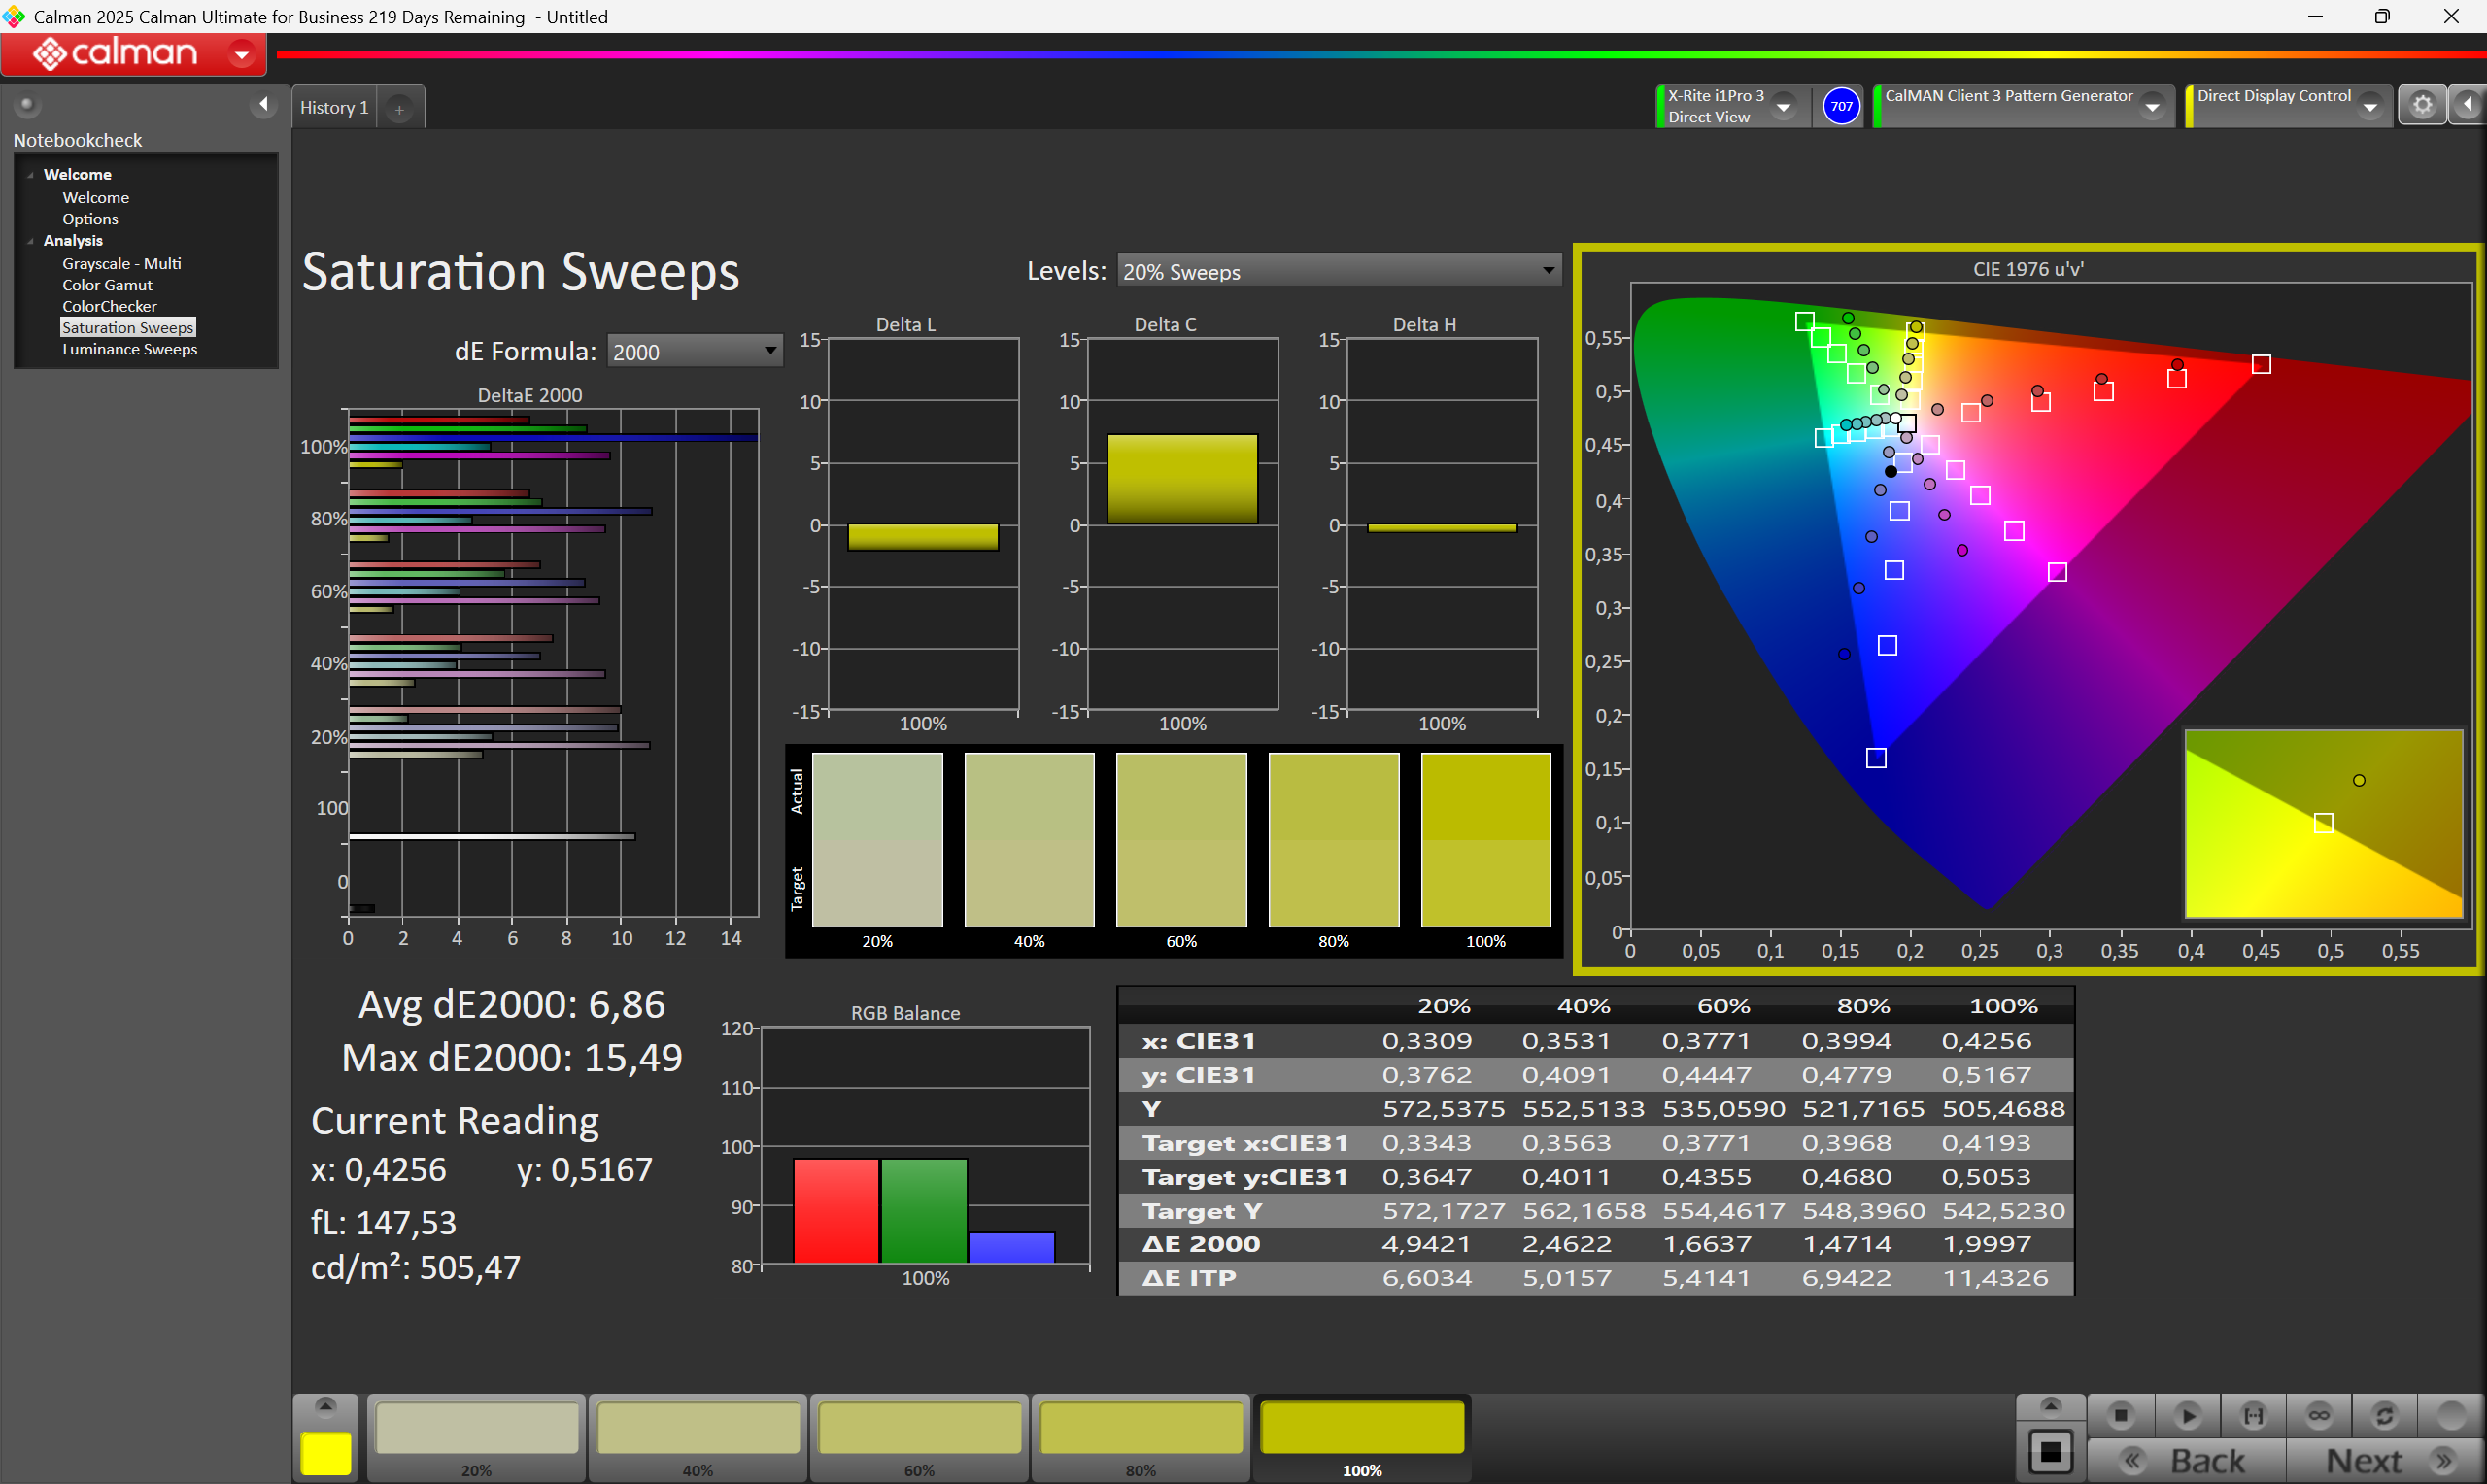
Exibição
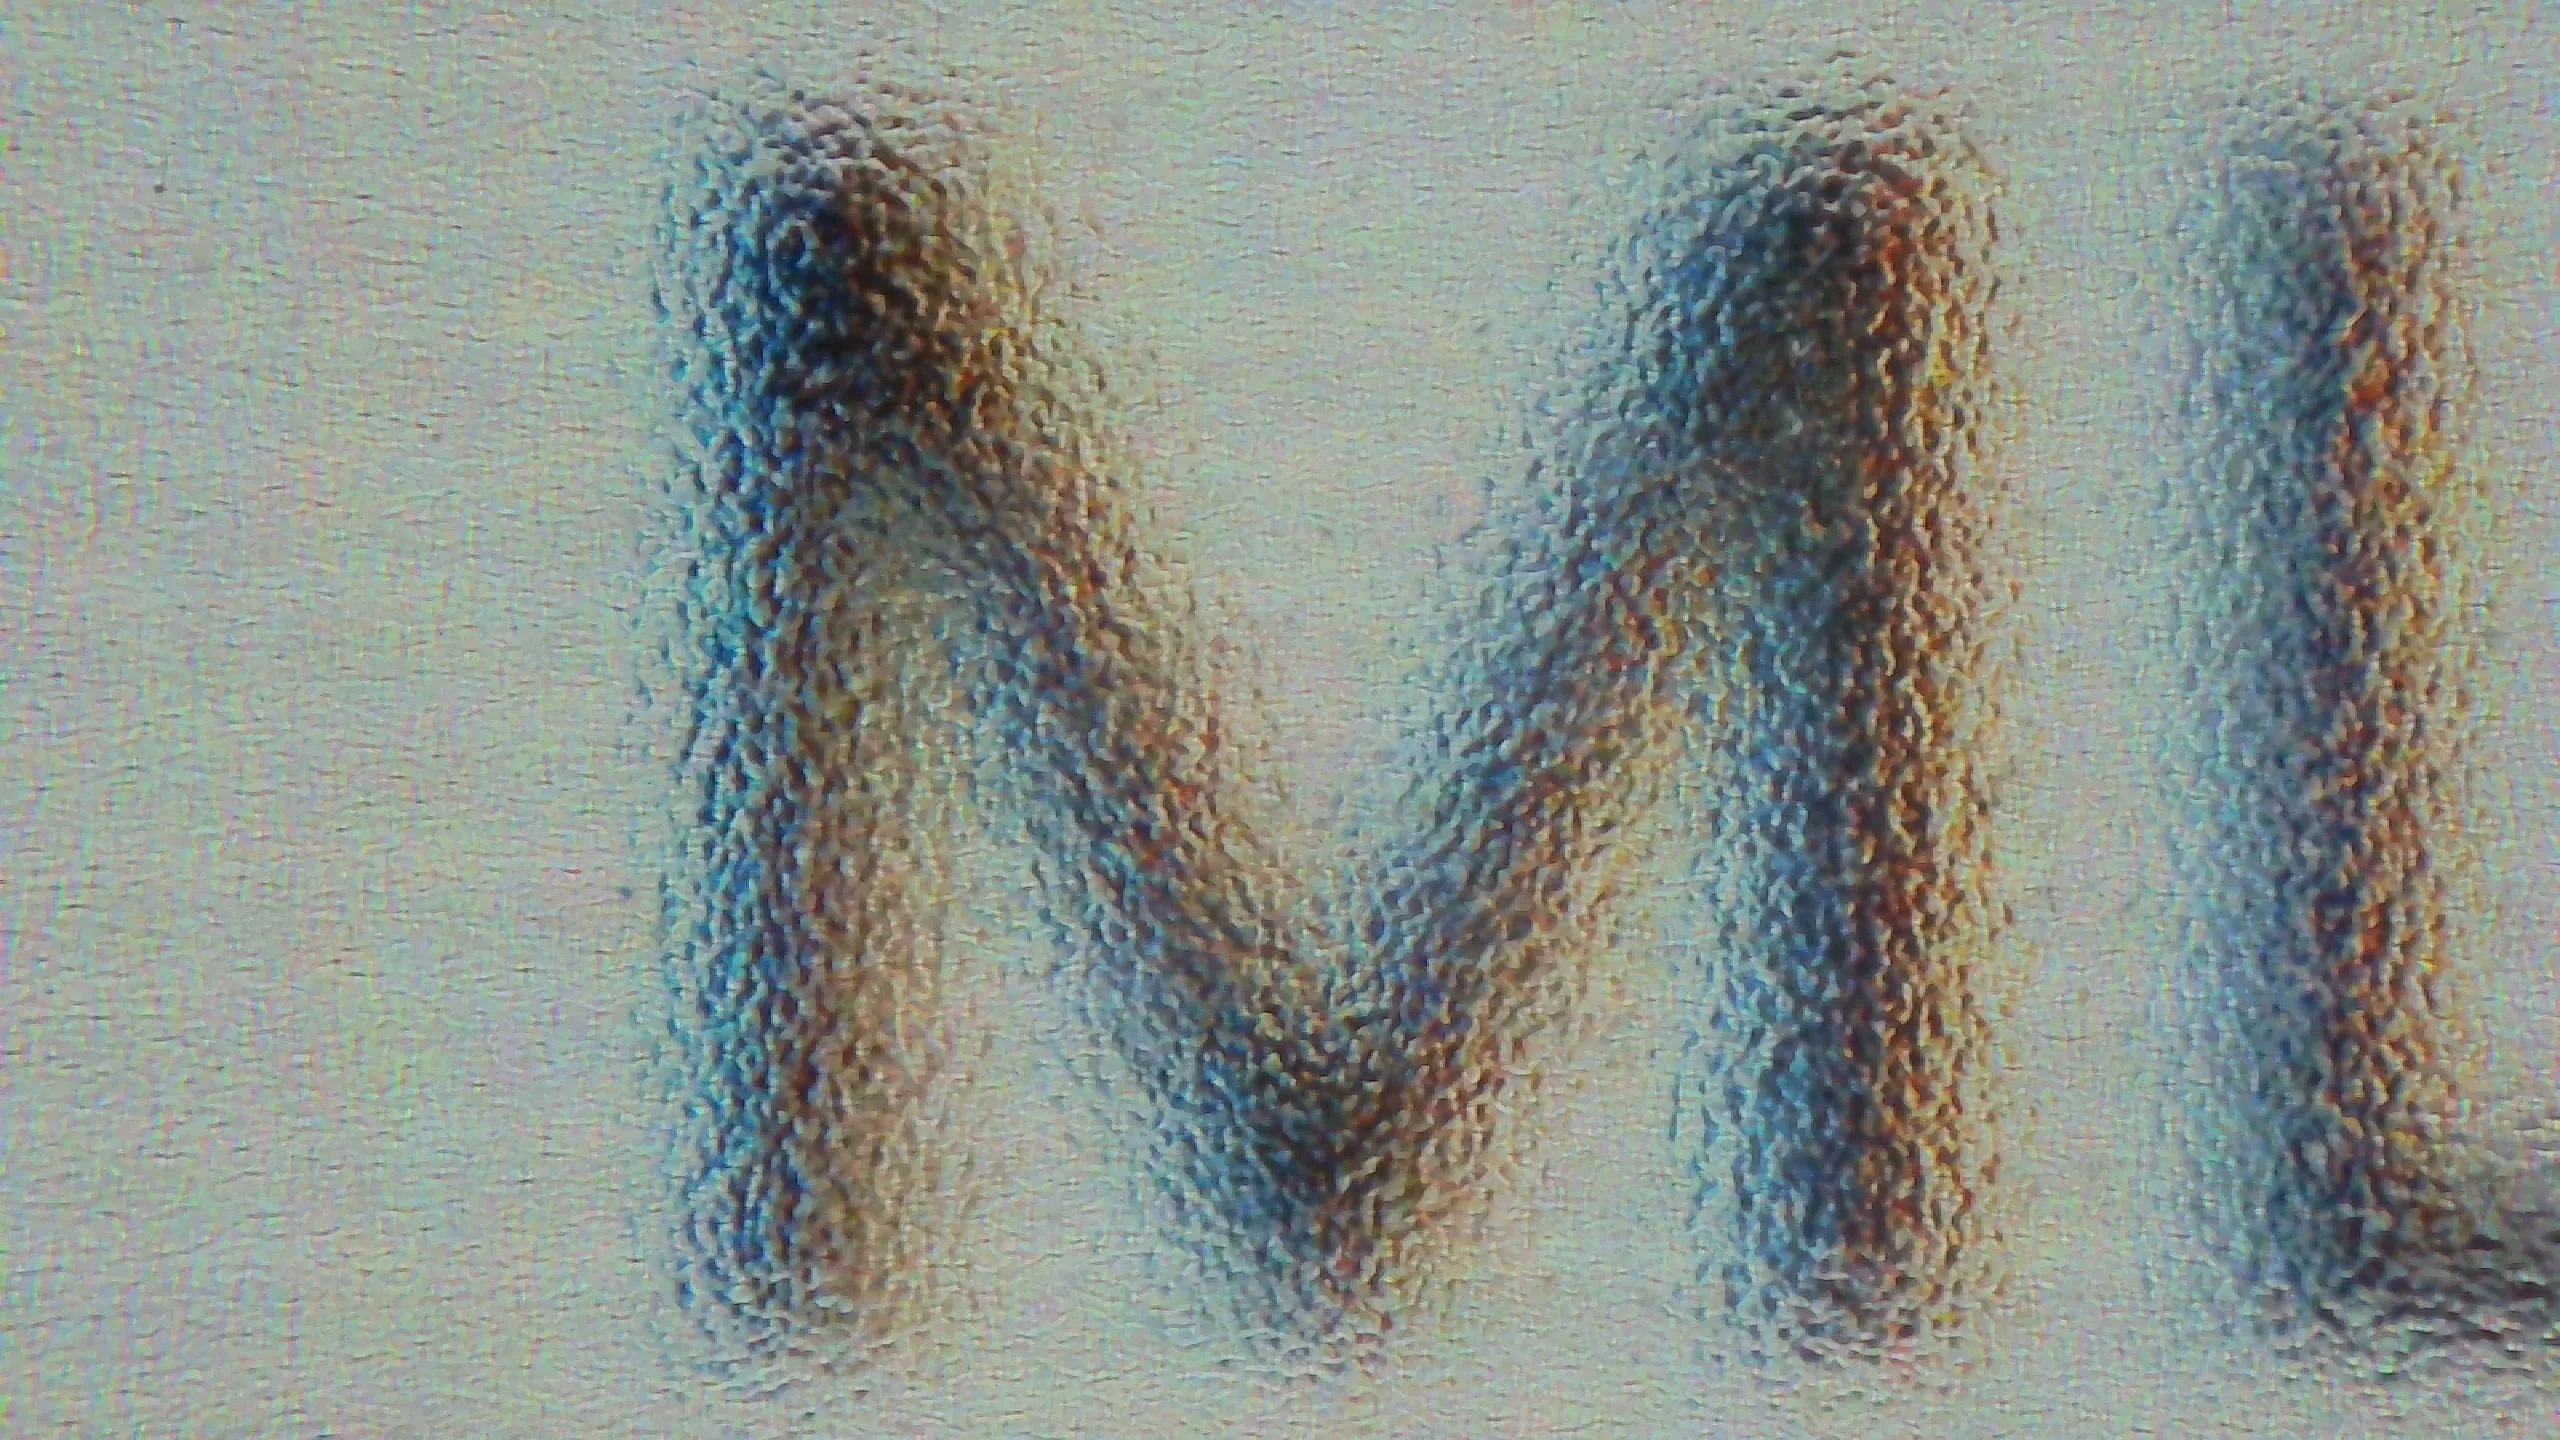
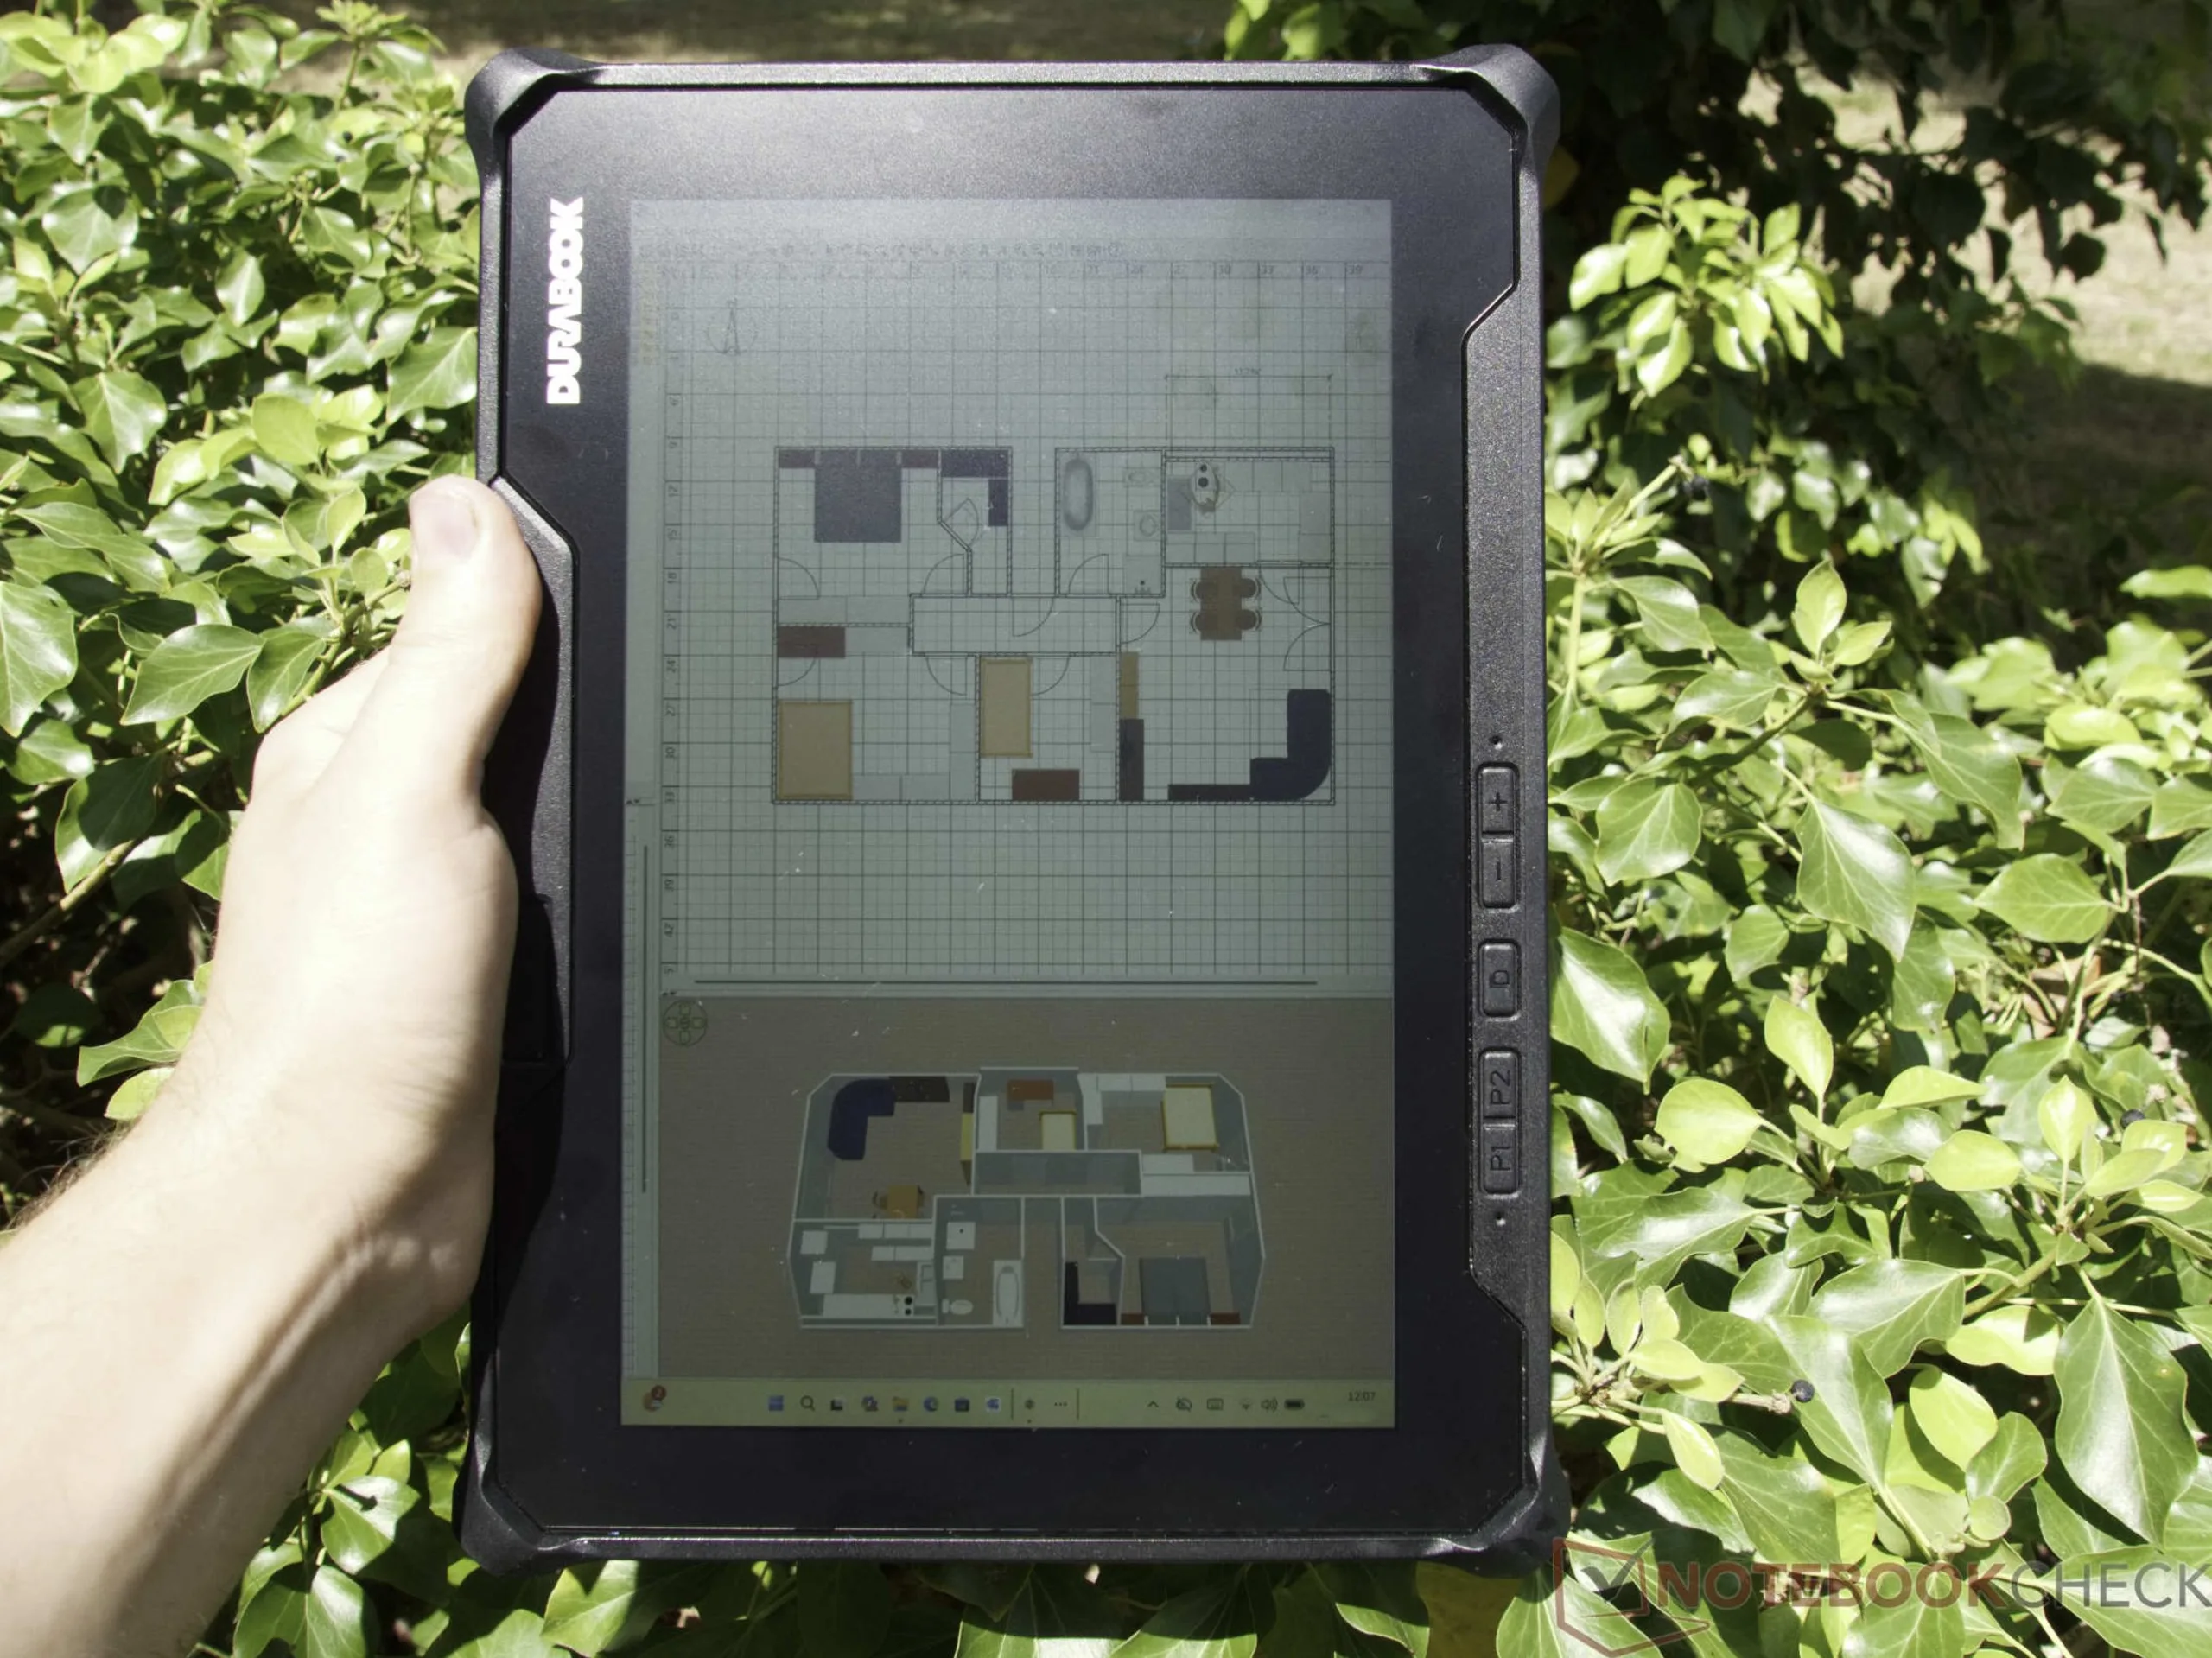
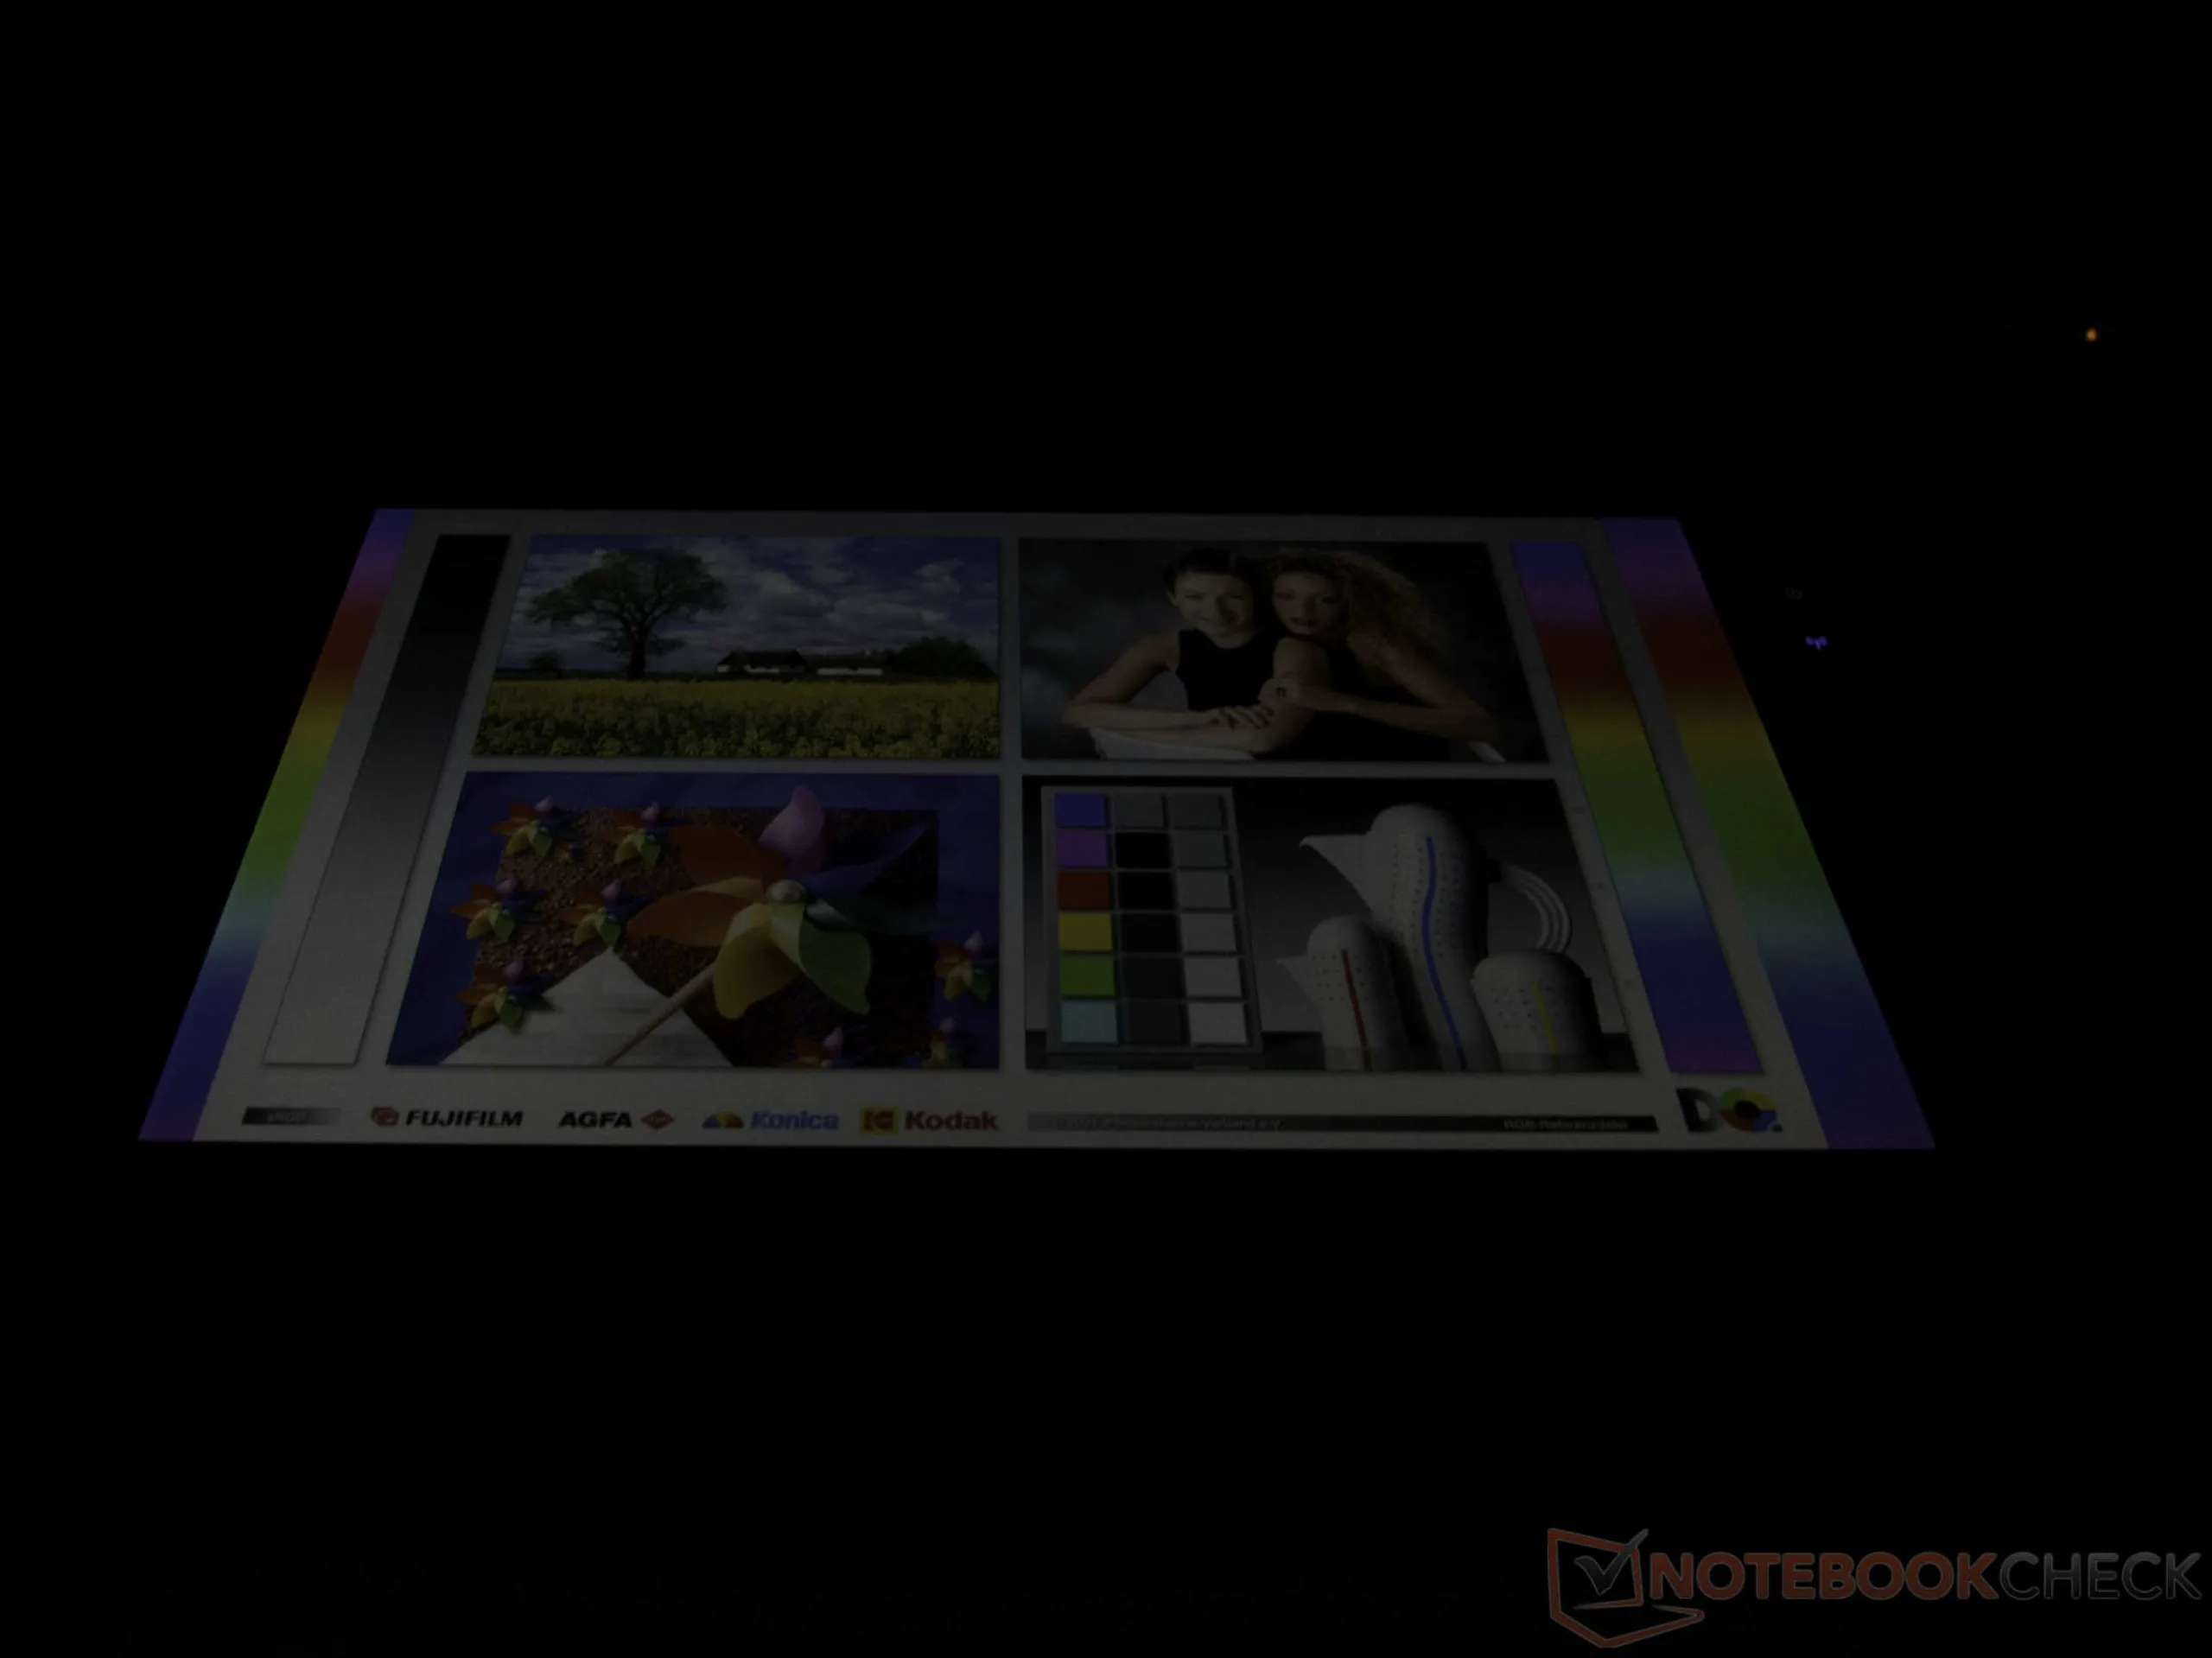
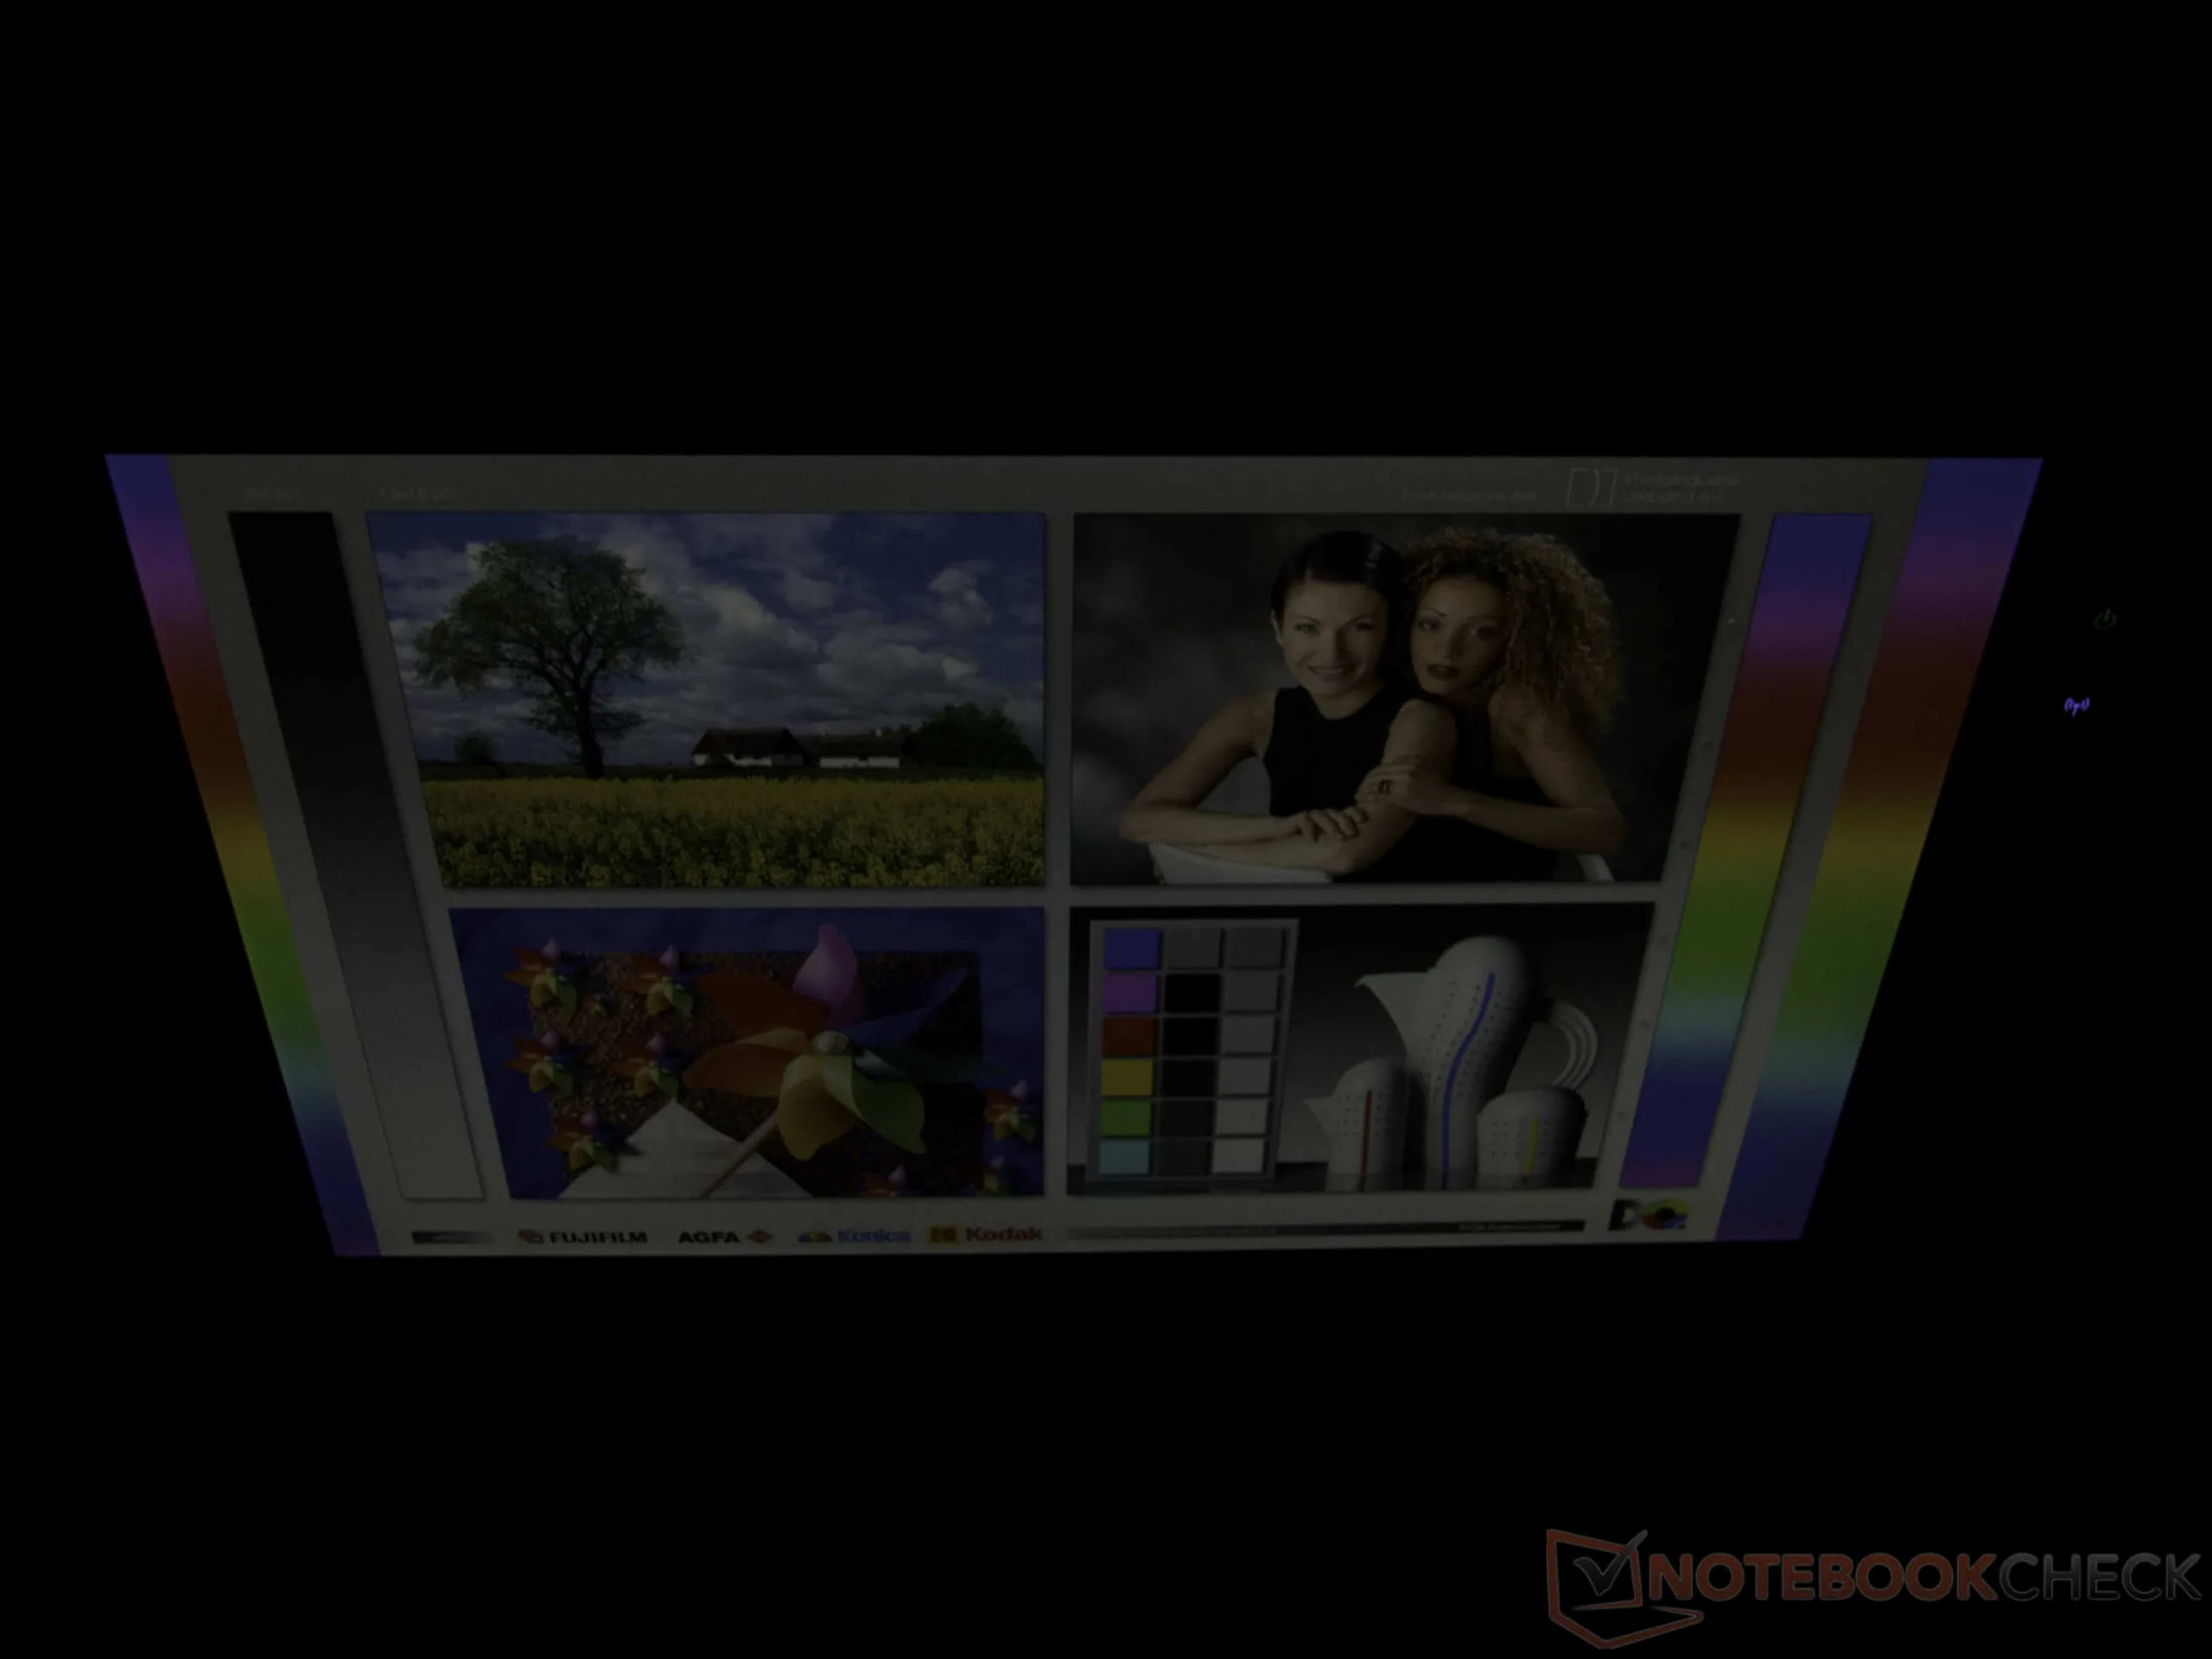
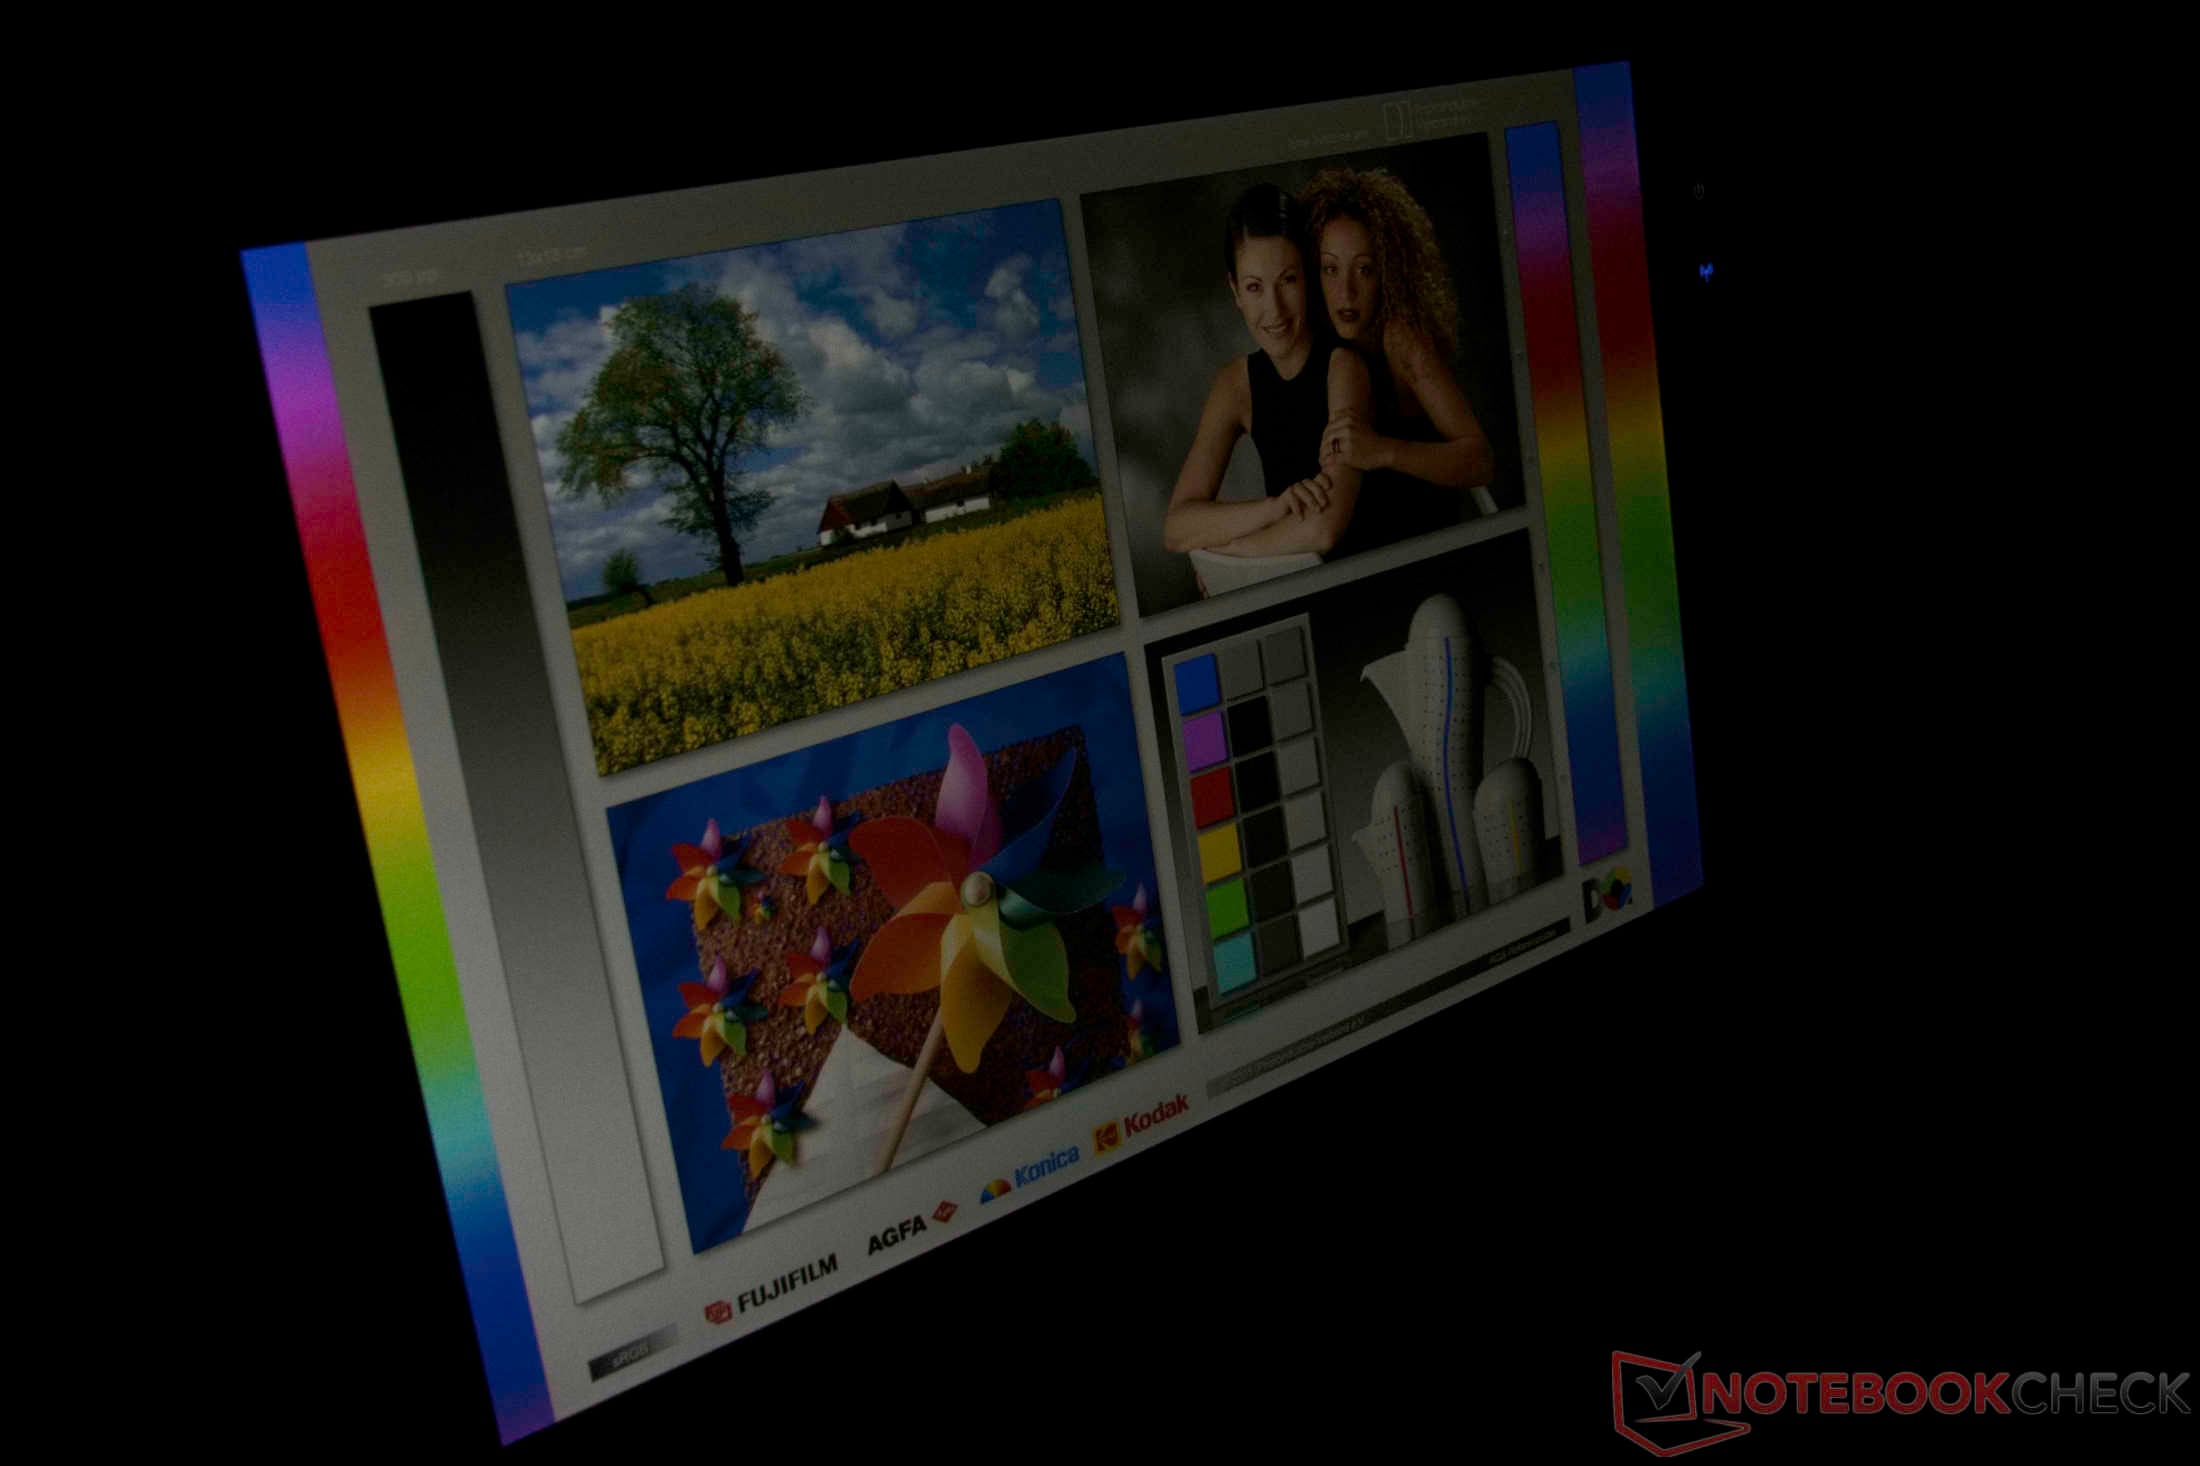
A tela WUXGA de 10,1 polegadas foi projetada sem concessões para uso ao ar livre. Com uma luminância impressionante de mais de 1.000 cd/m², o painel é tão brilhante que todo o conteúdo exibido na tela permanece perfeitamente legível, mesmo sob luz solar direta. Um protetor de tela fosco pré-instalado reduz efetivamente os reflexos que causam distração, embora confira às áreas claras um leve efeito de arco-íris. O brilho adaptativo é um recurso prático e conveniente.
| |||||||||||||||||||||||||
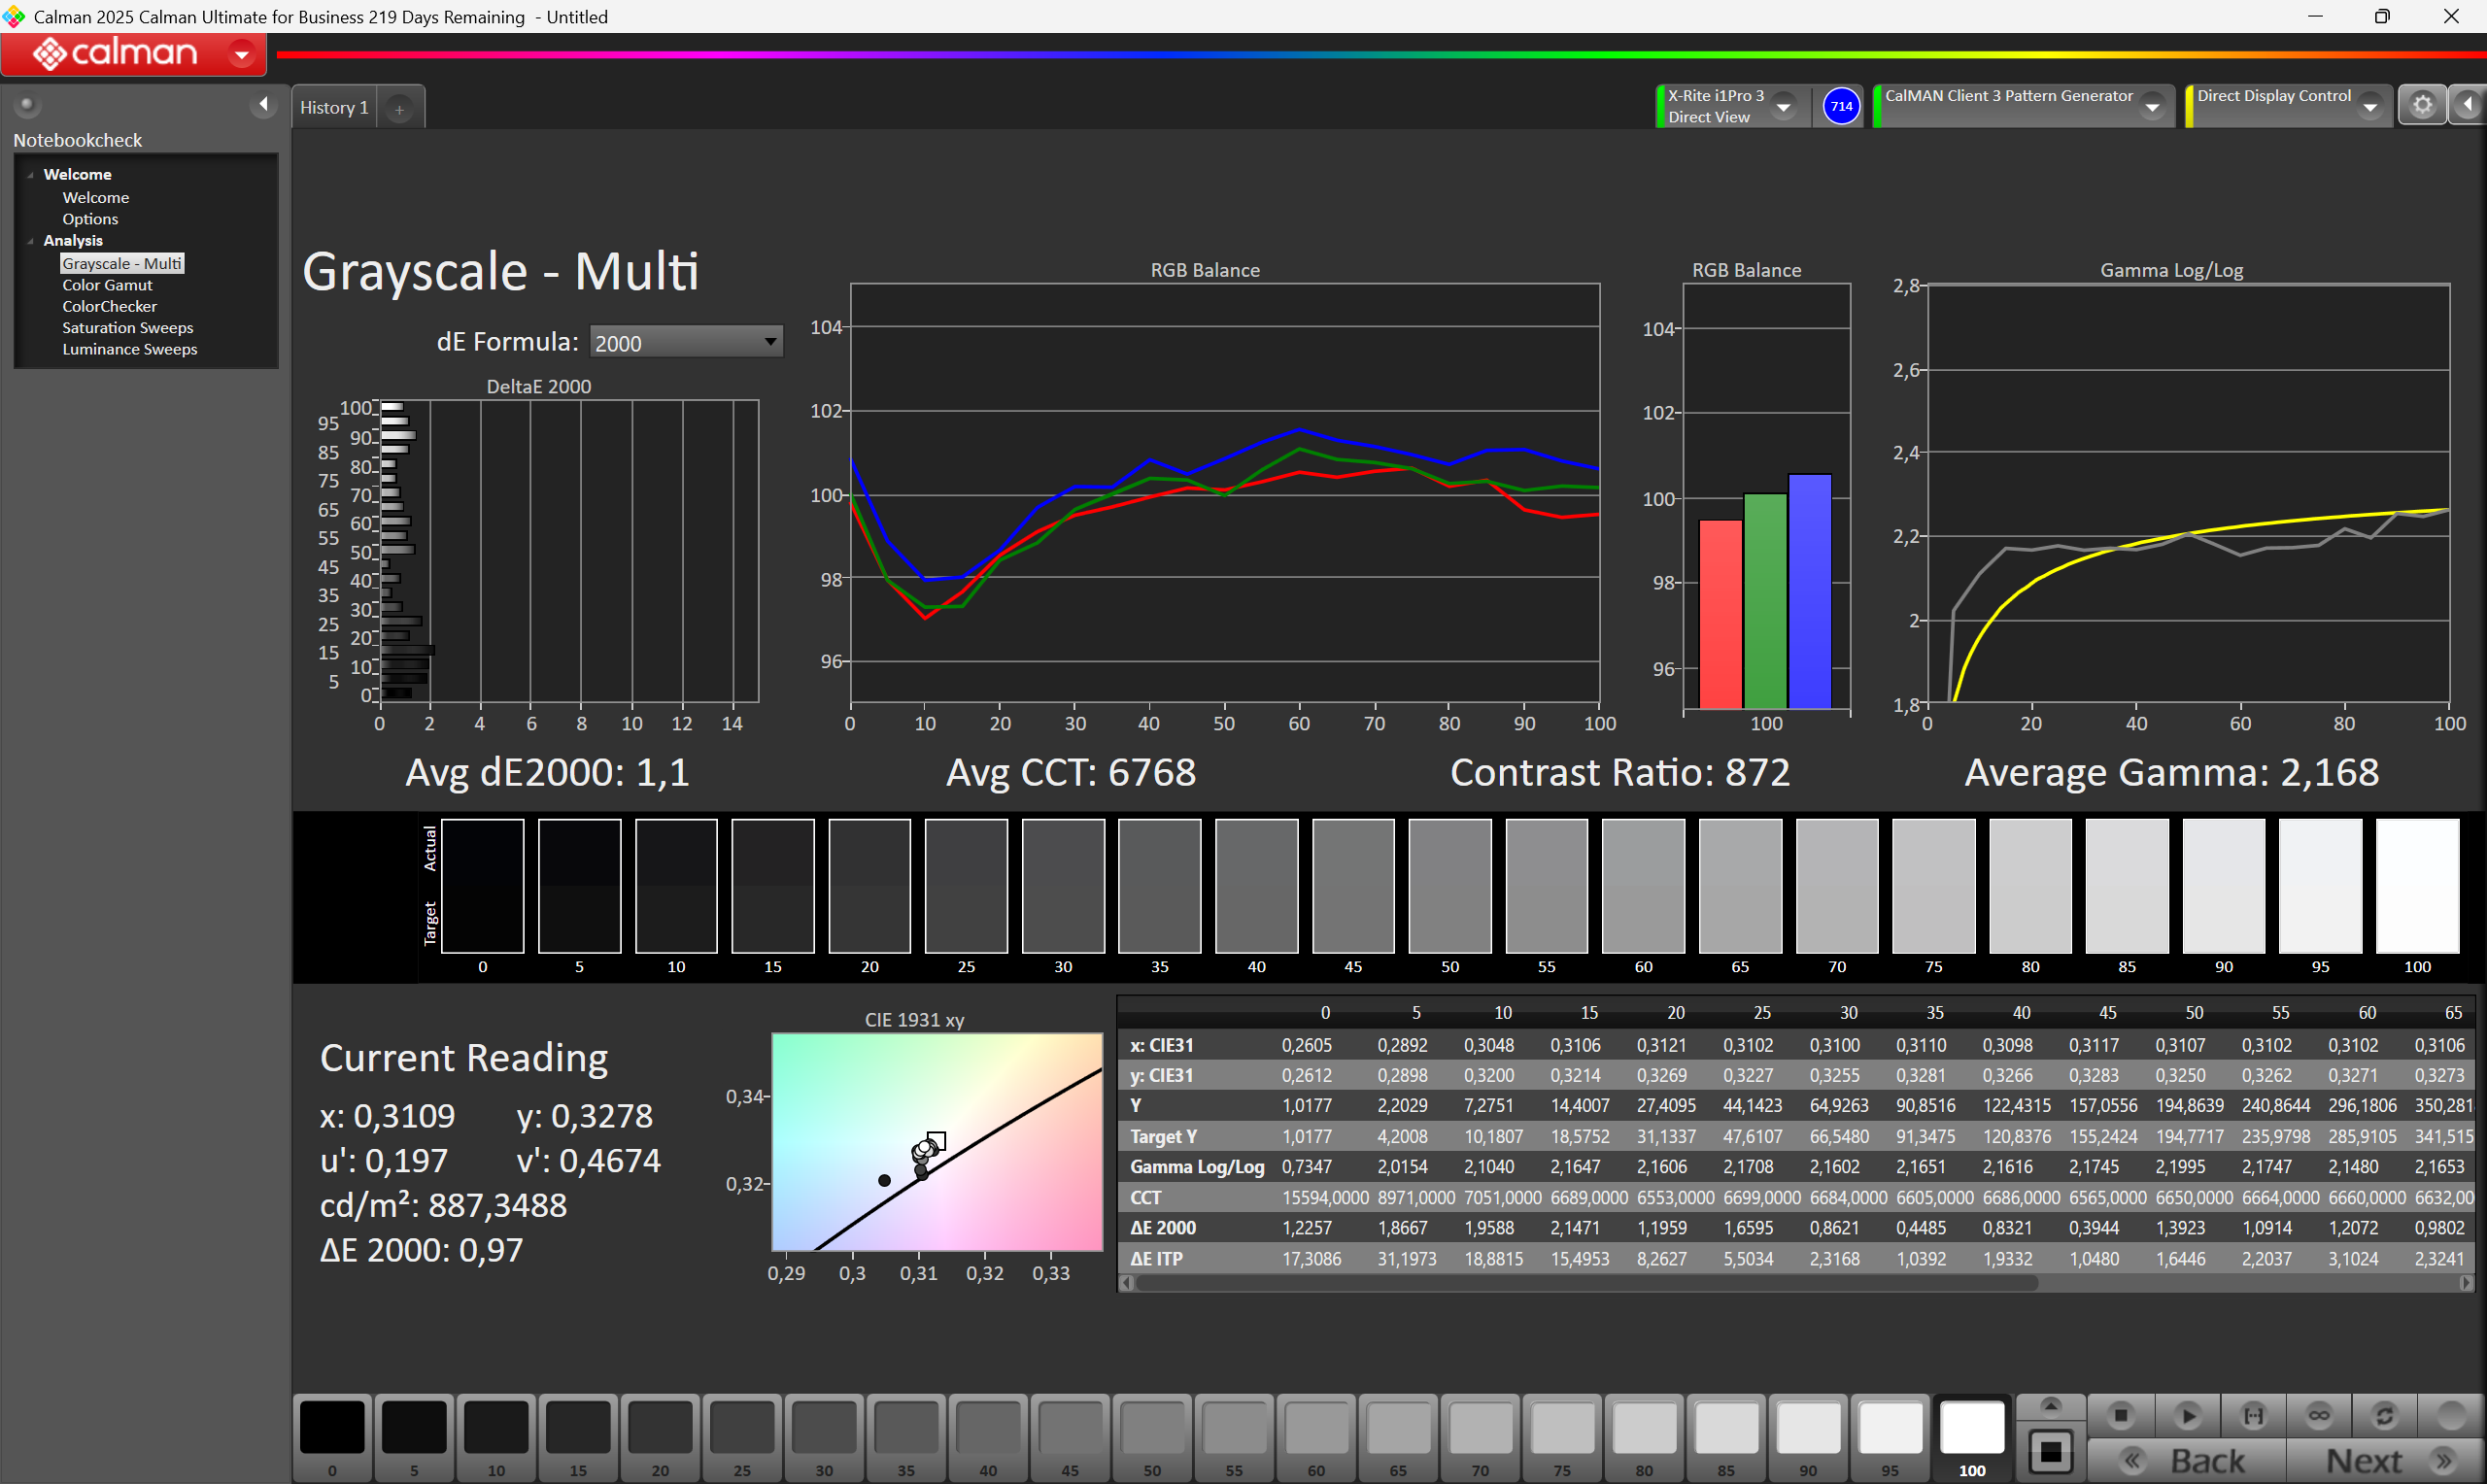
iluminação: 92 %
iluminação com acumulador: 1040 cd/m²
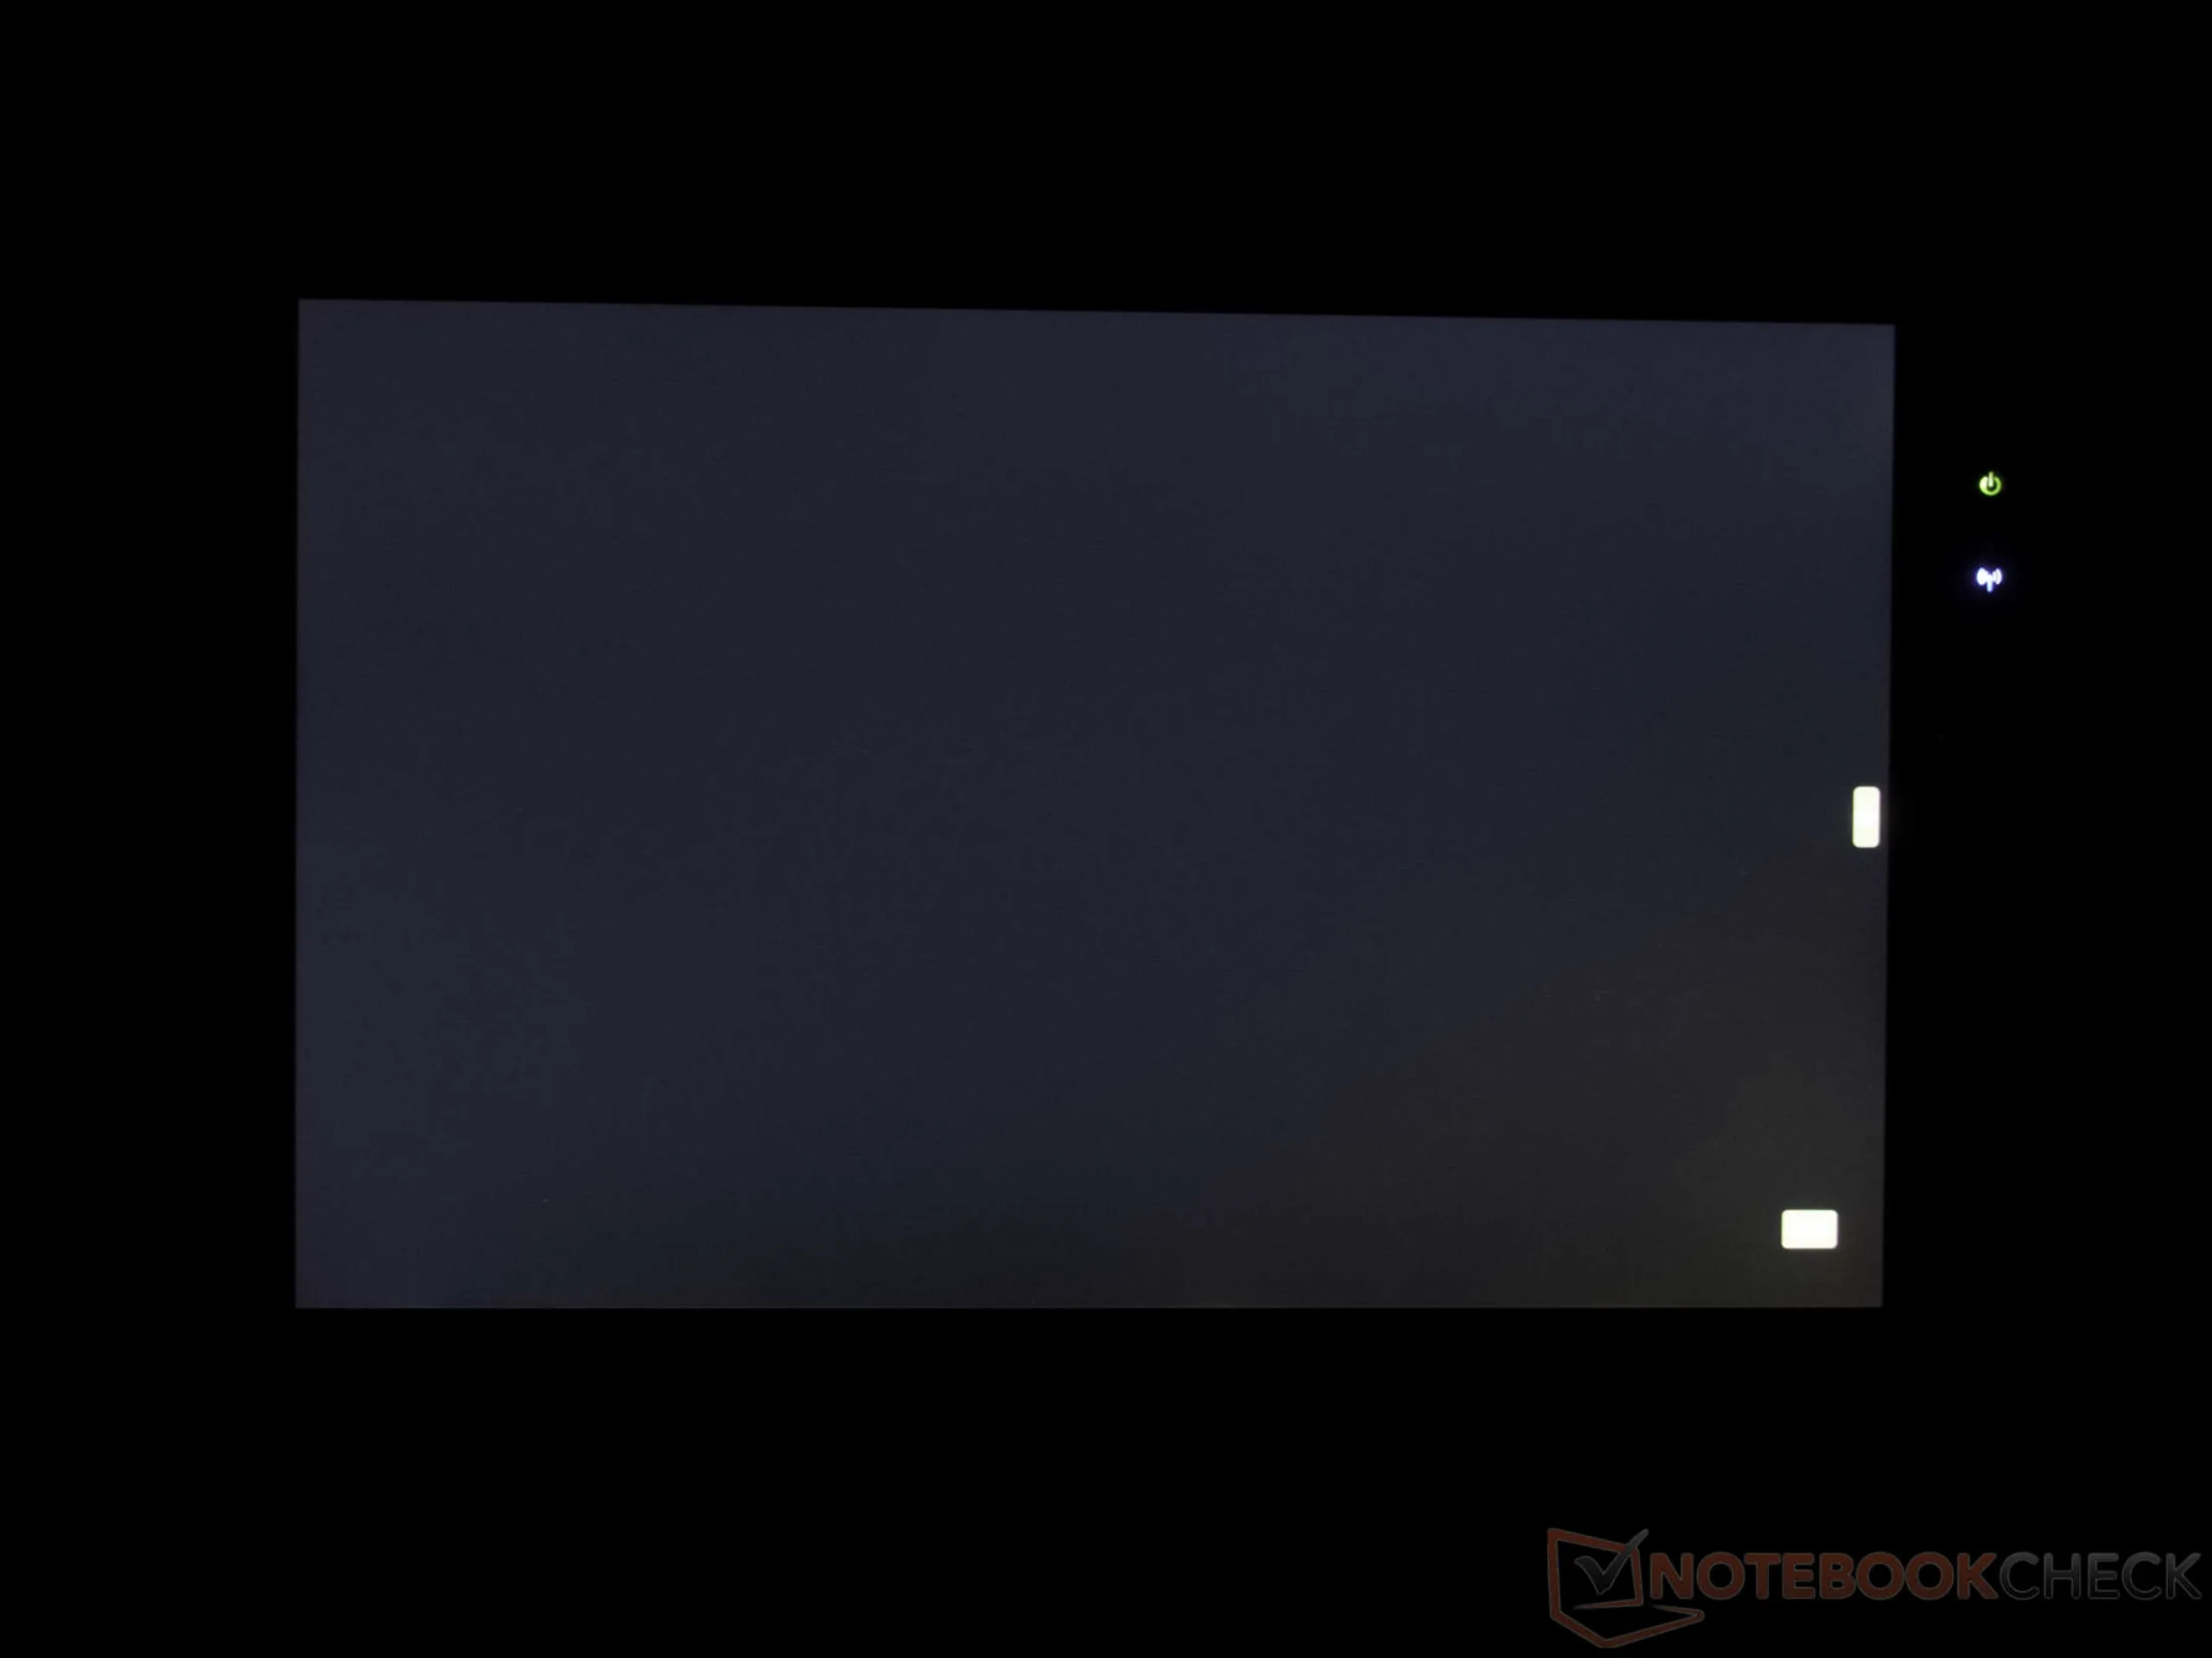
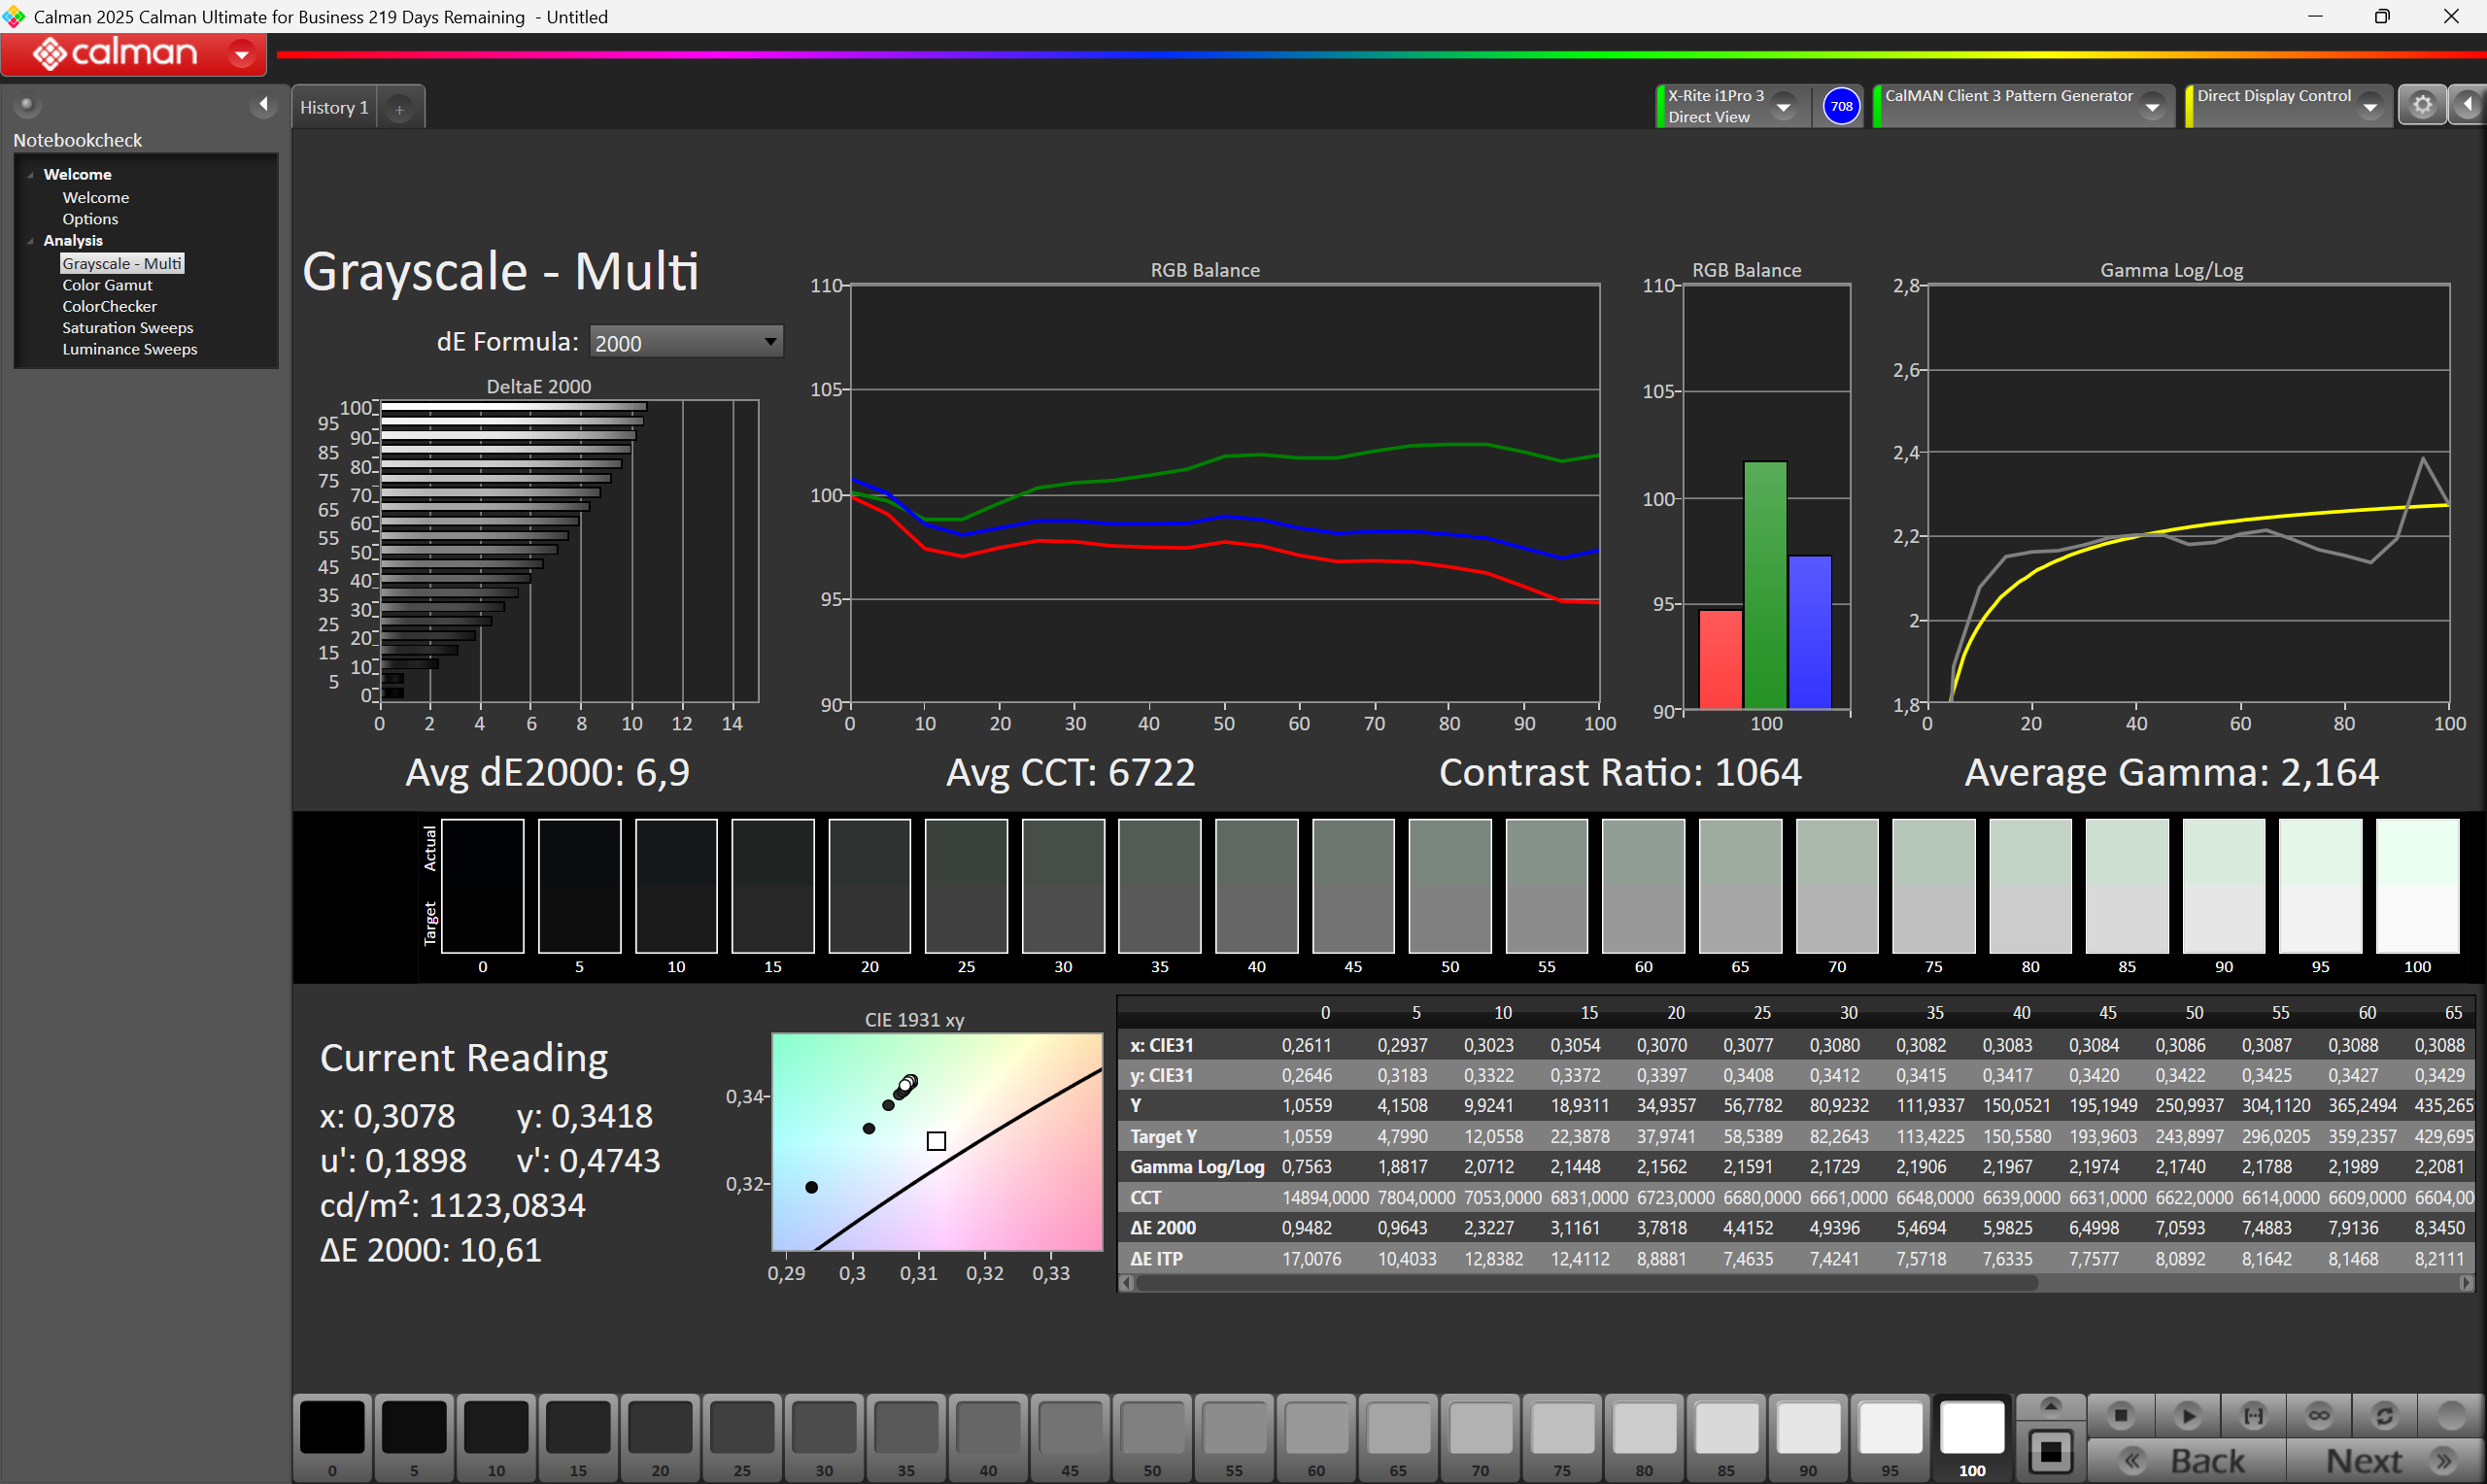
Contraste: 1024:1 (Preto: 1.05 cd/m²)
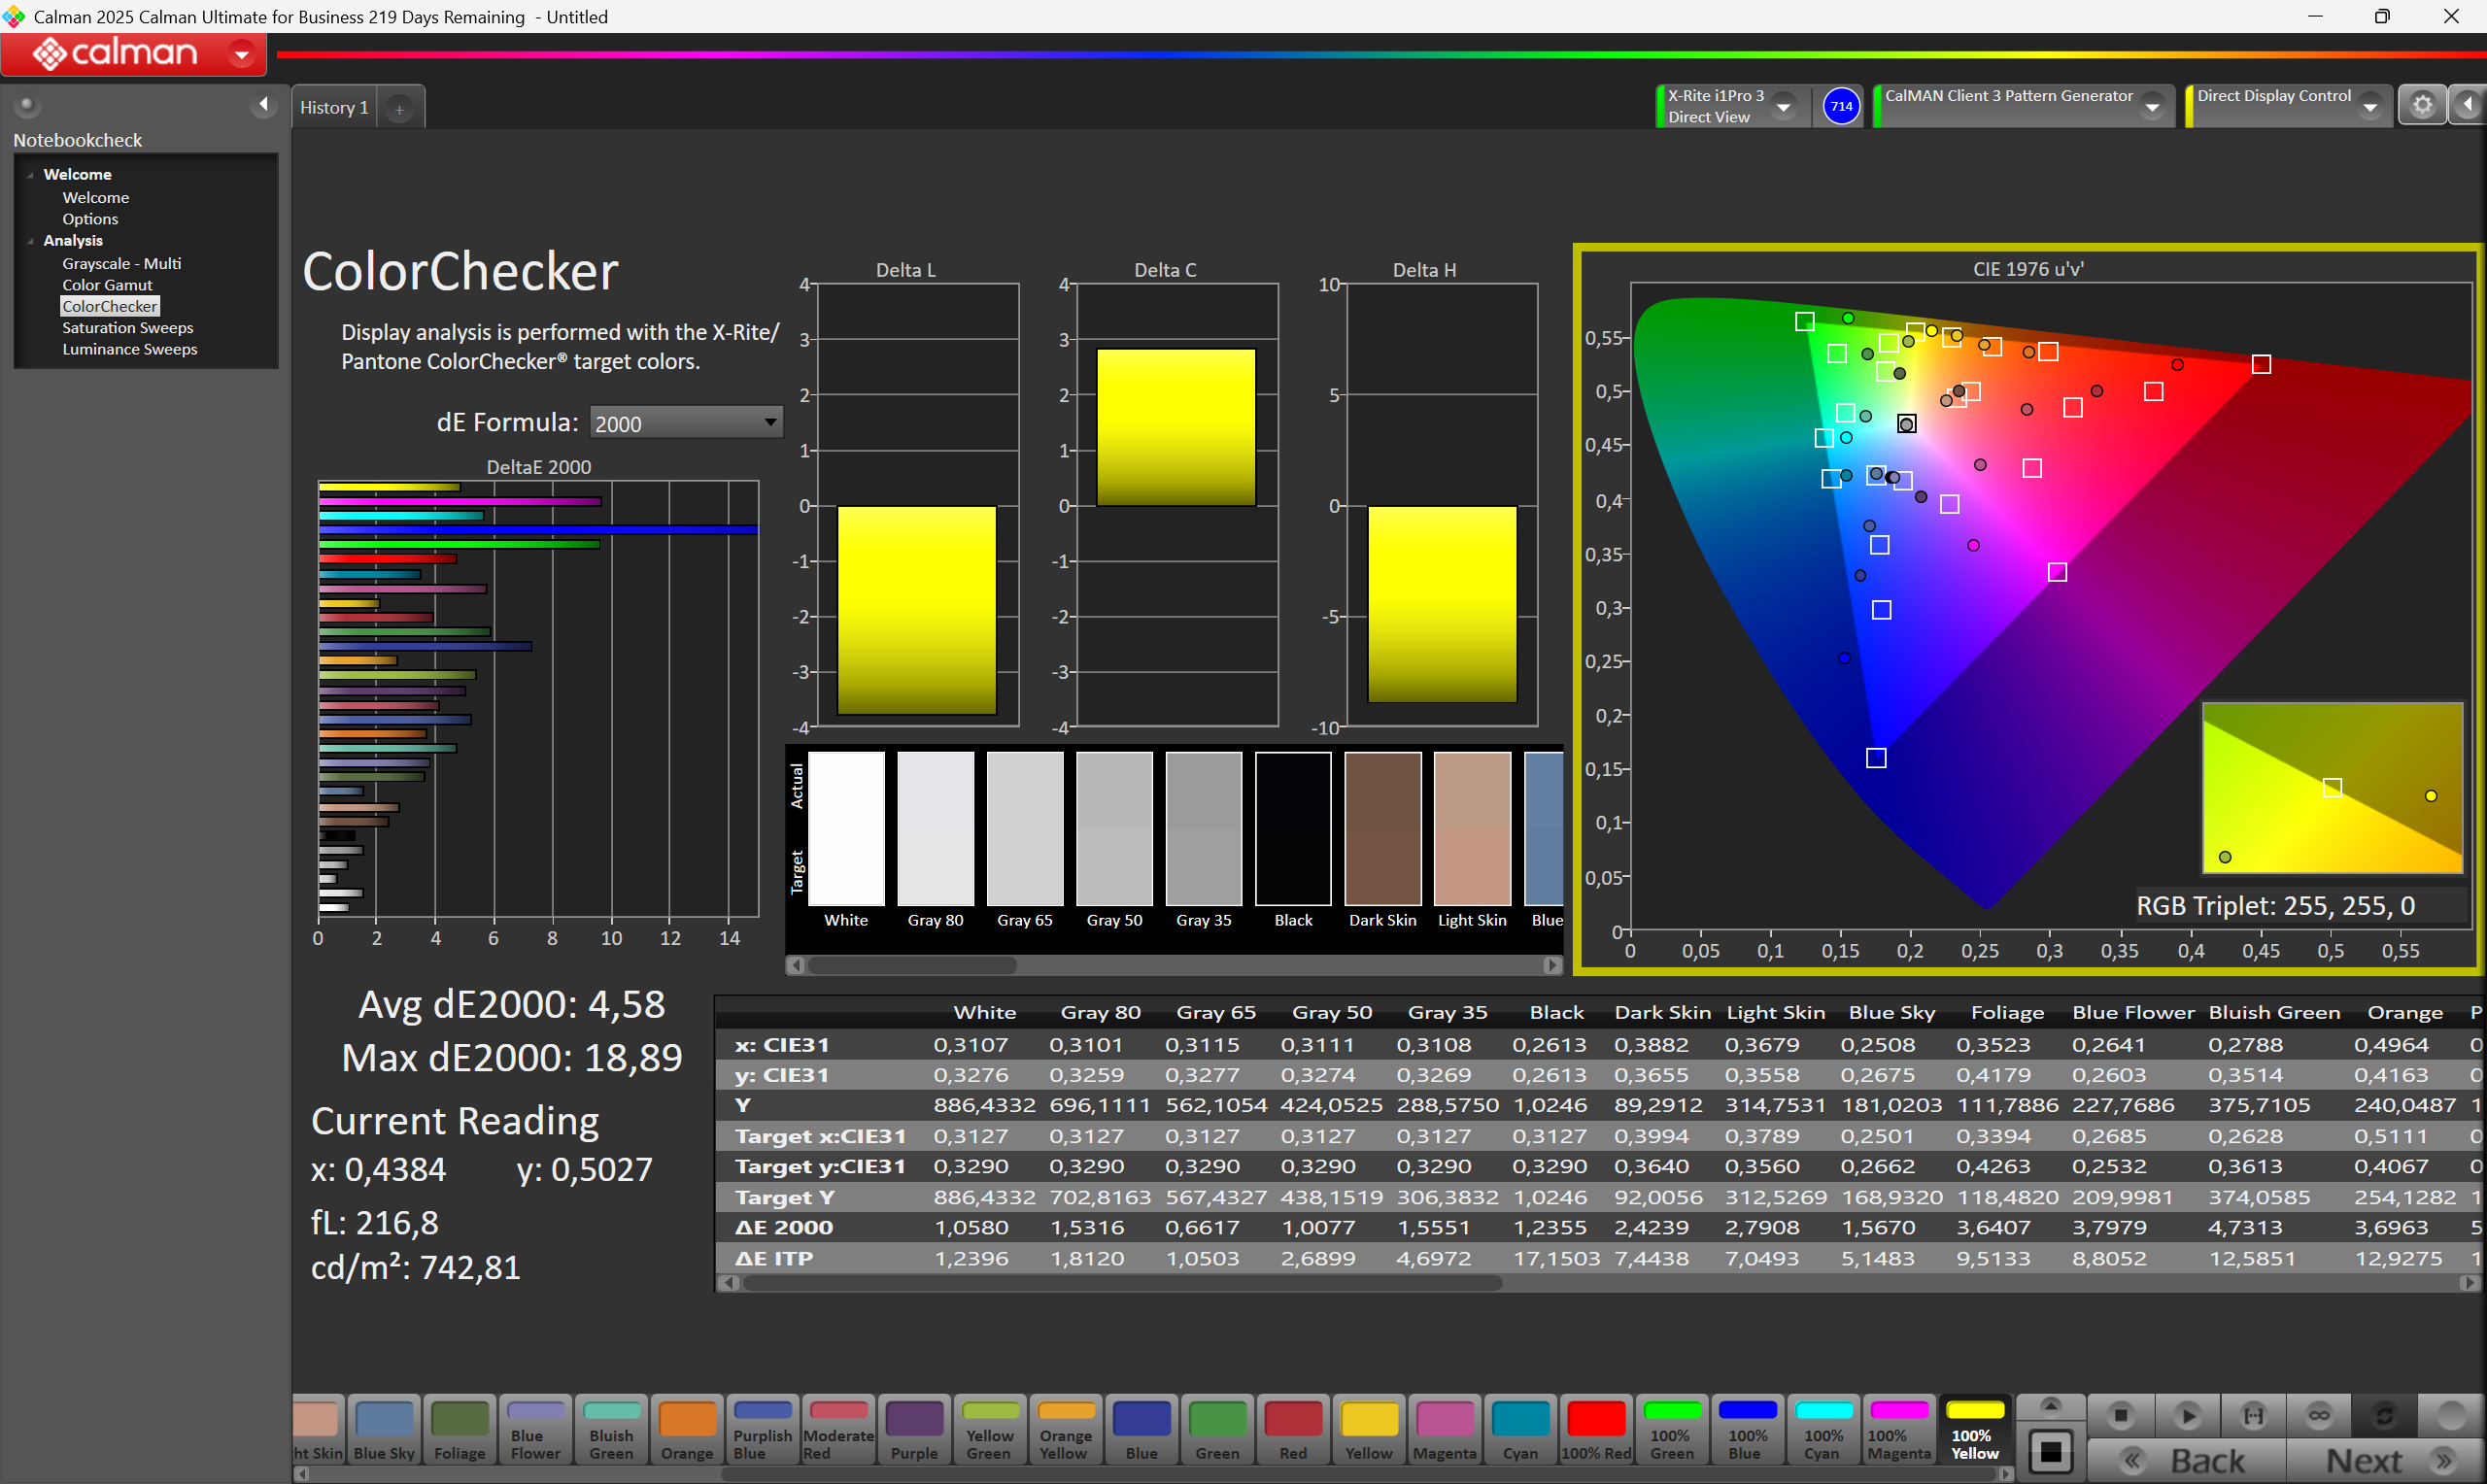
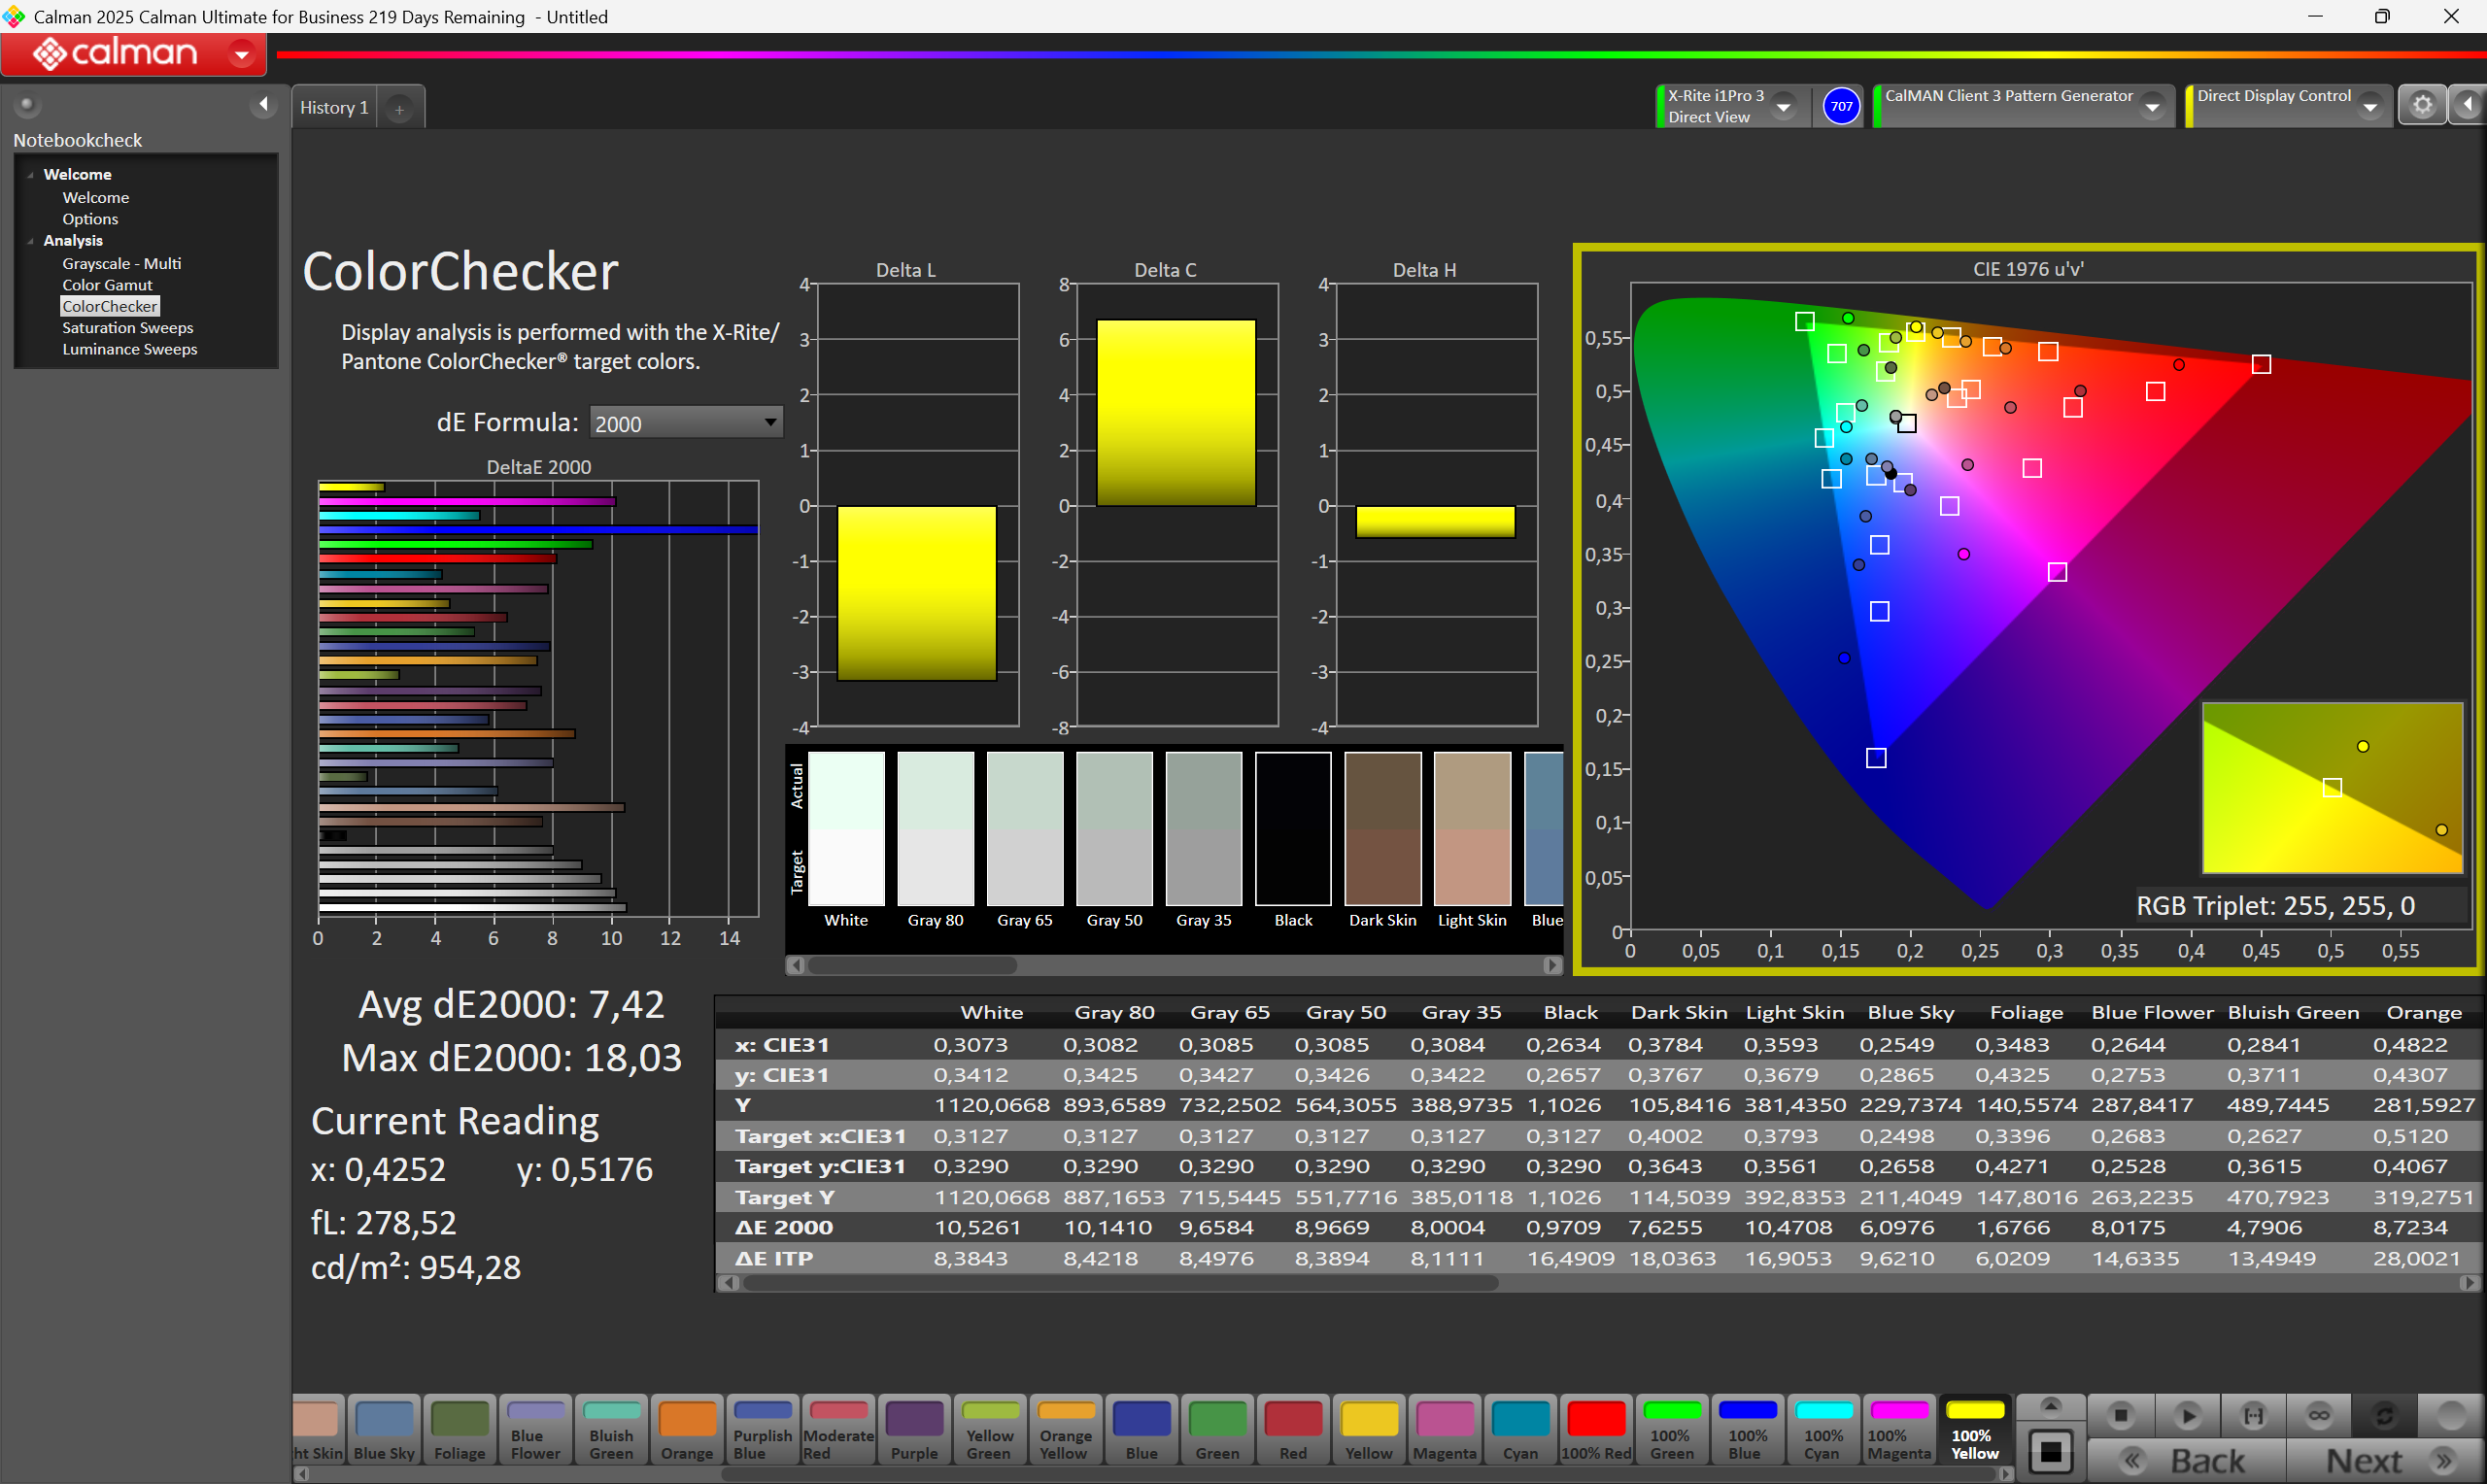
ΔE ColorChecker Calman: 7.42 | ∀{0.5-29.43 Ø4.72}
calibrated: 4.58
ΔE Greyscale Calman: 6.9 | ∀{0.09-98 Ø4.97}
44.17% AdobeRGB 1998 (Argyll 3D)
61.77% sRGB (Argyll 3D)
42.75% Display P3 (Argyll 3D)
Gamma: 2.164
CCT: 6722 K
| Durabook R10 HannStar 101GUW2, TFT, 1920x1200, 10.1", 60 Hz | Dell Latitude 7030 Rugged Extreme Sharp LQ101N1, IPS, 1920x1200, 10", 60 Hz | Lenovo ThinkPad T14 Gen 6 21QG001VGE MNE007JA1-3, IPS LED, 1920x1200, 14", 60 Hz | Dynabook Portege Z40L-N BOE NE140WUM-N6K, IPS, 1920x1200, 14", 60 Hz | Durabook R8 Tablet Digital Flat Panel, IPS, 1280x800, 8", 60 Hz | Lenovo ThinkPad T14 Gen 6 AMD NE140WUM-N6M, , 1920x1200, 14", 60 Hz | |
|---|---|---|---|---|---|---|
| Display | 65% | 58% | 62% | 22% | 57% | |
| Display P3 Coverage (%) | 42.75 | 72.2 69% | 67.7 58% | 70.1 64% | 51.5 20% | 66.9 56% |
| sRGB Coverage (%) | 61.77 | 99 60% | 98.3 59% | 99 60% | 77.4 25% | 98.5 59% |
| AdobeRGB 1998 Coverage (%) | 44.17 | 72.7 65% | 69.9 58% | 71.8 63% | 53.1 20% | 68.9 56% |
| Response Times | 26% | 10% | 8% | 30% | 28% | |
| Response Time Grey 50% / Grey 80% * (ms) | 53.2 ? | 35.9 ? 33% | 40.2 ? 24% | 42.1 ? 21% | 32.4 ? 39% | 31.1 ? 42% |
| Response Time Black / White * (ms) | 27.6 ? | 22.4 ? 19% | 29.1 ? -5% | 26.7 ? 3% | 21.9 ? 21% | 24.1 ? 13% |
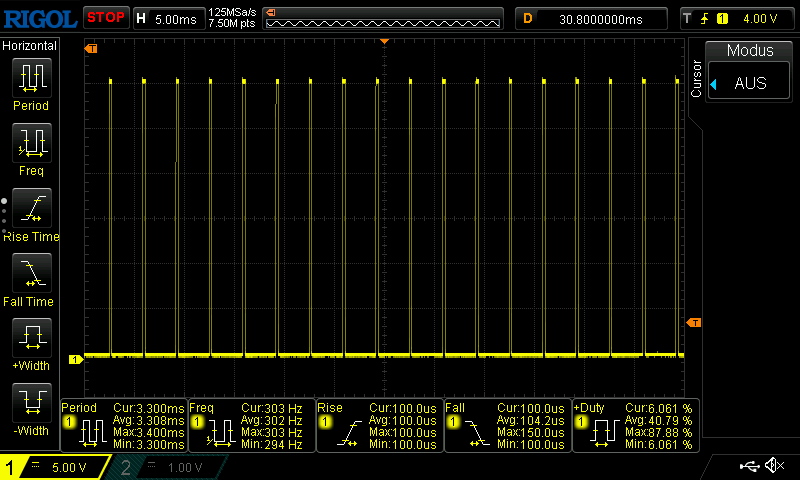
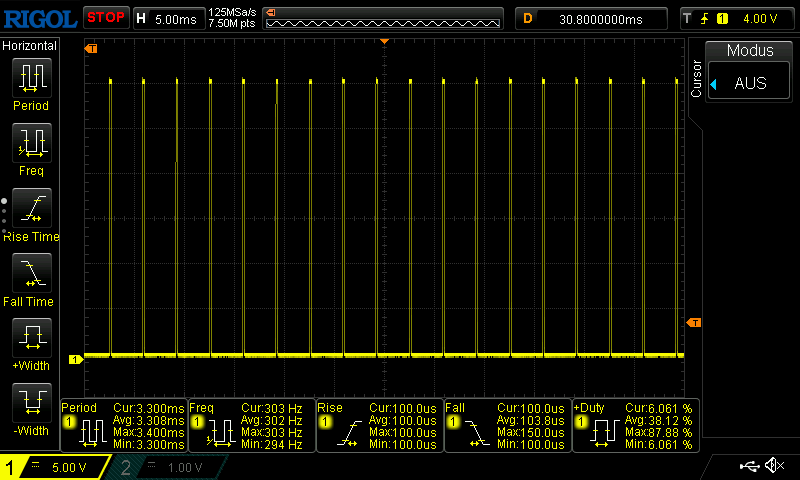
| PWM Frequency (Hz) | 300 | 300 ? | ||||
| PWM Amplitude * (%) | 100 | 100 -0% | ||||
| Screen | 45% | 45% | 34% | 5% | 28% | |
| Brightness middle (cd/m²) | 1075 | 1183.9 10% | 554 -48% | 445.4 -59% | 943.7 -12% | 557 -48% |
| Brightness (cd/m²) | 1042 | 1140 9% | 516 -50% | 424 -59% | 870 -17% | 526 -50% |
| Brightness Distribution (%) | 92 | 88 -4% | 91 -1% | 91 -1% | 85 -8% | 84 -9% |
| Black Level * (cd/m²) | 1.05 | 0.74 30% | 0.24 77% | 0.23 78% | 0.85 19% | 0.4 62% |
| Contrast (:1) | 1024 | 1600 56% | 2308 125% | 1937 89% | 1110 8% | 1393 36% |
| Colorchecker dE 2000 * | 7.42 | 2.03 73% | 1.5 80% | 2.85 62% | 6.35 14% | 2.4 68% |
| Colorchecker dE 2000 max. * | 18.03 | 3.44 81% | 3.4 81% | 4.57 75% | 8.86 51% | 5.9 67% |
| Colorchecker dE 2000 calibrated * | 4.58 | 0.53 88% | 0.9 80% | 1.54 66% | 5.1 -11% | 0.7 85% |
| Greyscale dE 2000 * | 6.9 | 2.6 62% | 2.7 61% | 3.3 52% | 6.9 -0% | 4 42% |
| Gamma | 2.164 102% | 2.27 97% | 2.25 98% | 2.03 108% | 2.65 83% | 2.15 102% |
| CCT | 6722 97% | 6102 107% | 6882 94% | 6497 100% | 6956 93% | 7017 93% |
| Média Total (Programa/Configurações) | 45% /
47% | 38% /
43% | 35% /
34% | 19% /
12% | 38% /
34% |
* ... menor é melhor
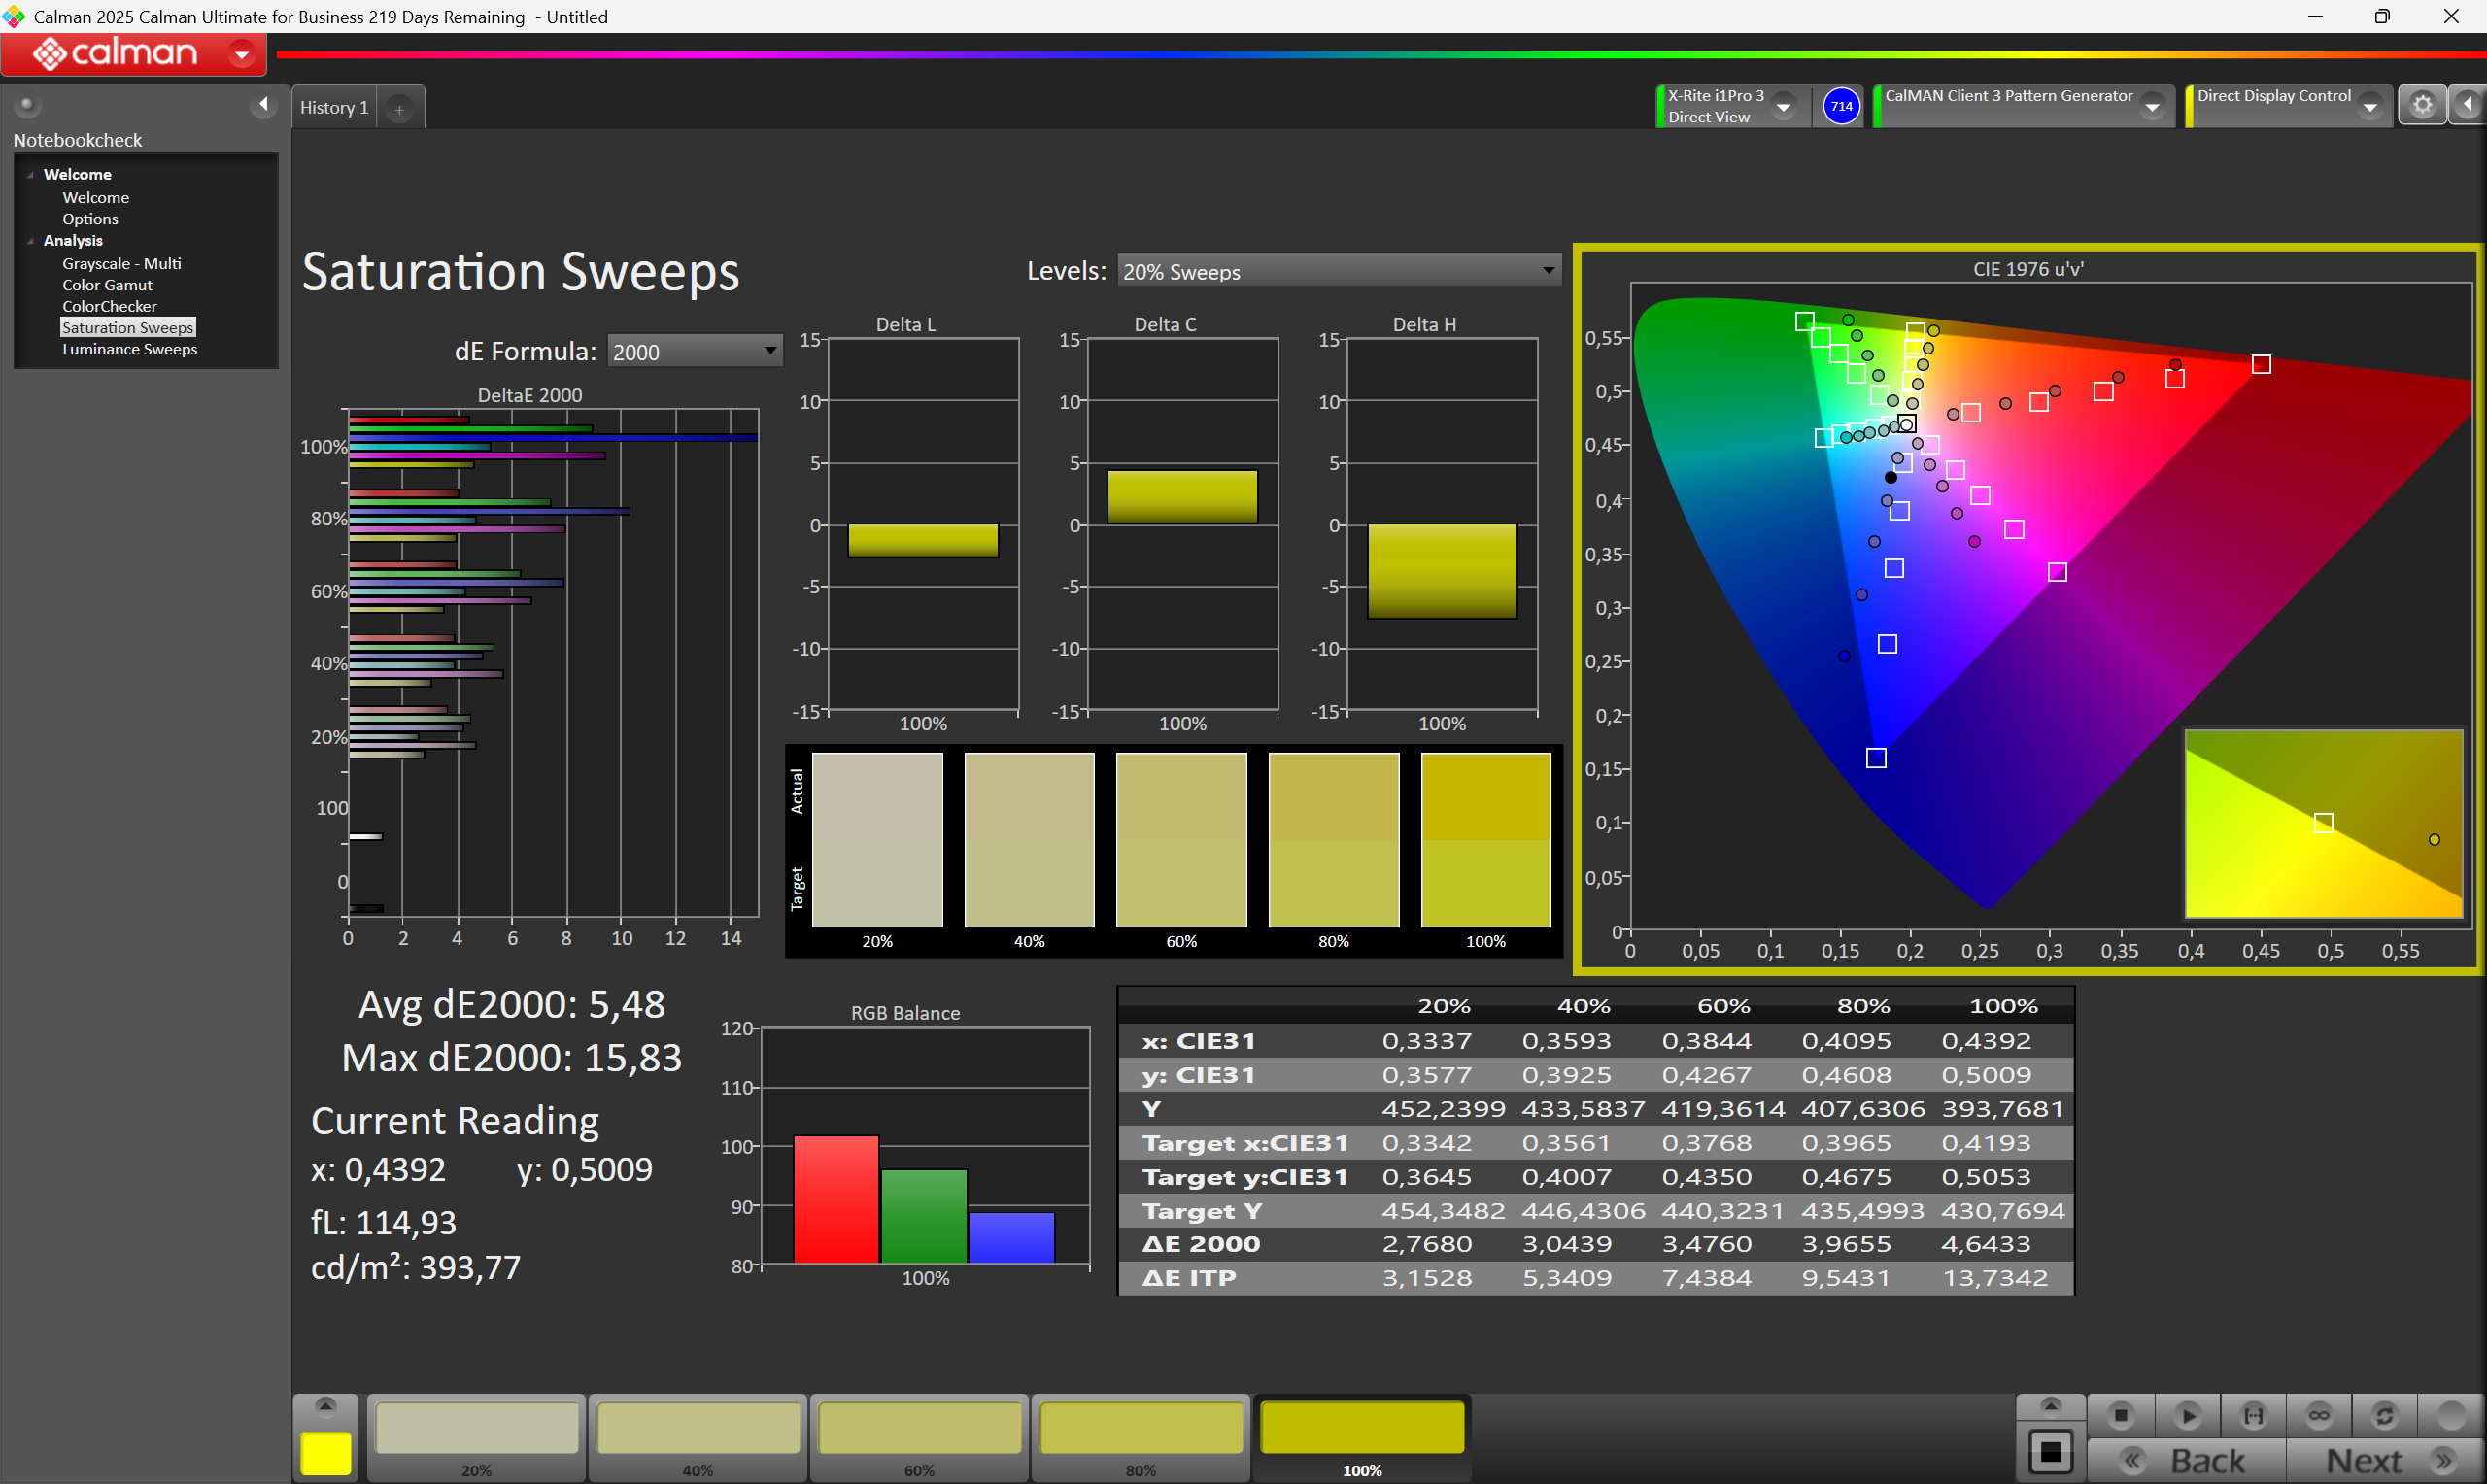
Este tablet não é adequado para trabalhos em que a precisão das cores é fundamental. Com uma cobertura da gama de cores sRGB de apenas 61%, as cores parecem desbotadas. Logo ao sair da embalagem, o painel apresenta um tom esverdeado perceptível.
Exibir tempos de resposta
| ↔ Tempo de resposta preto para branco | ||
|---|---|---|
| 27.6 ms ... ascensão ↗ e queda ↘ combinadas | ↗ 16 ms ascensão | 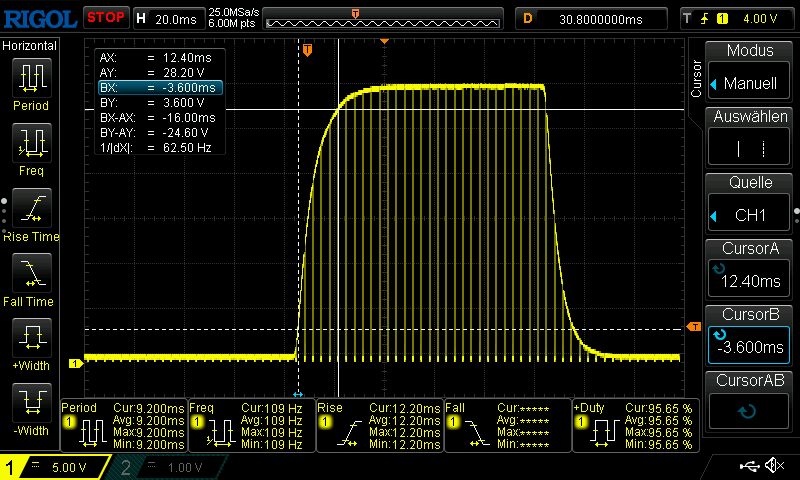 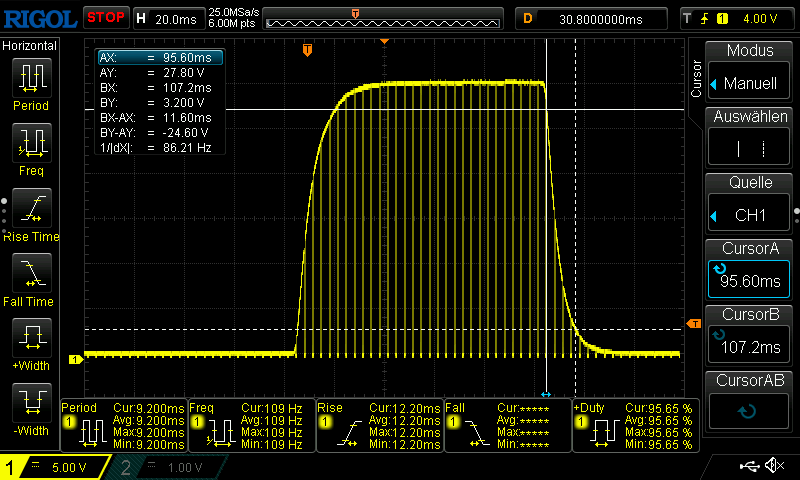 |
| ↘ 11.6 ms queda | ||
| A tela mostra taxas de resposta relativamente lentas em nossos testes e pode ser muito lenta para os jogadores. Em comparação, todos os dispositivos testados variam de 0.1 (mínimo) a 240 (máximo) ms. » 70 % de todos os dispositivos são melhores. Isso significa que o tempo de resposta medido é pior que a média de todos os dispositivos testados (19.8 ms). | ||
| ↔ Tempo de resposta 50% cinza a 80% cinza | ||
| 53.2 ms ... ascensão ↗ e queda ↘ combinadas | ↗ 20 ms ascensão | 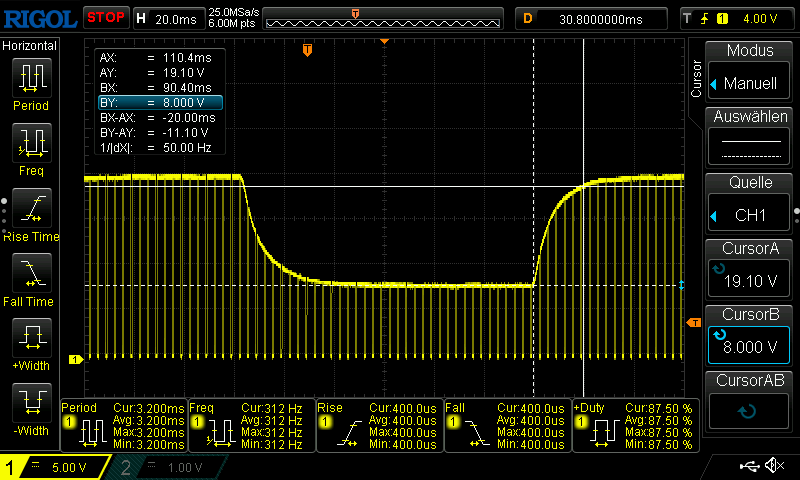 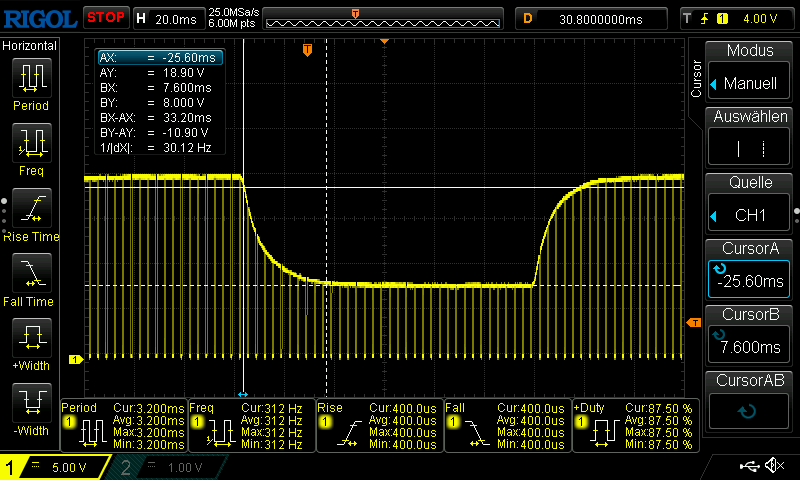 |
| ↘ 33.2 ms queda | ||
| A tela mostra taxas de resposta lentas em nossos testes e será insatisfatória para os jogadores. Em comparação, todos os dispositivos testados variam de 0.165 (mínimo) a 636 (máximo) ms. » 90 % de todos os dispositivos são melhores. Isso significa que o tempo de resposta medido é pior que a média de todos os dispositivos testados (31 ms). | ||
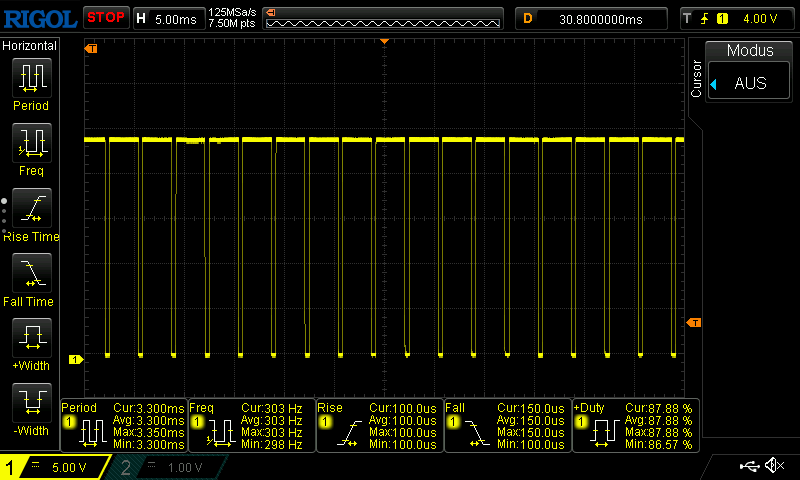
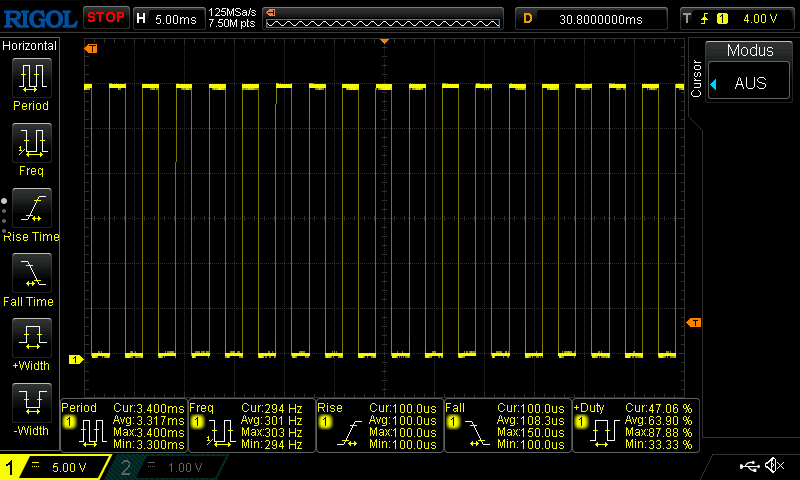
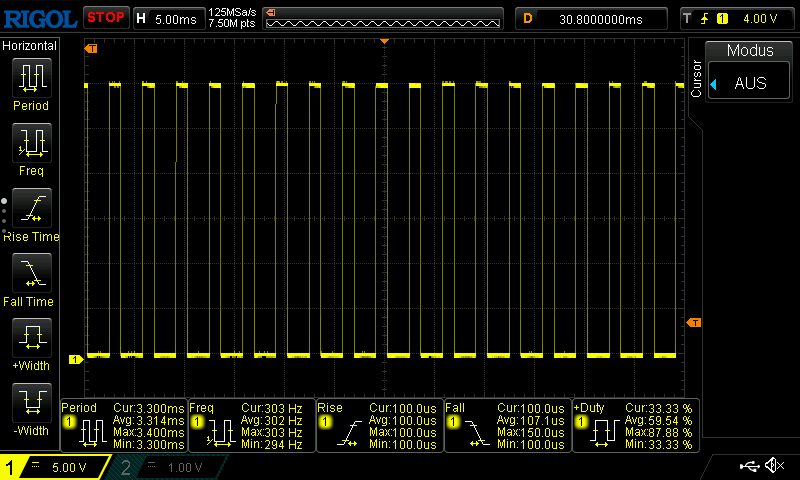
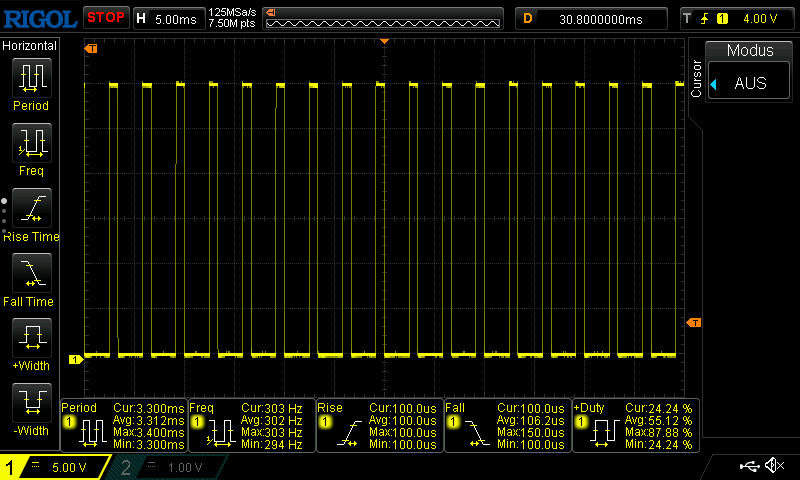
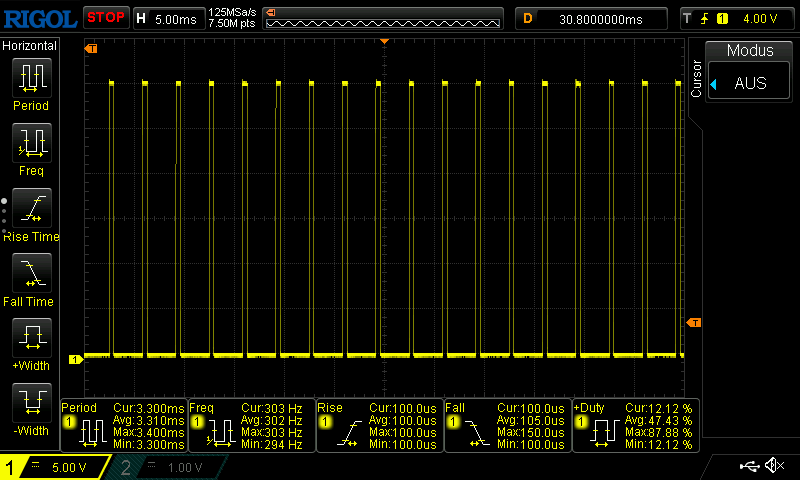
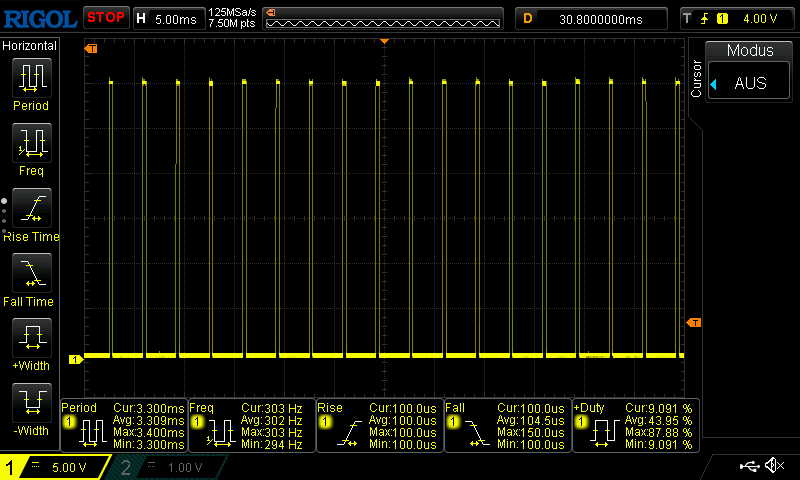
Cintilação da tela / PWM (modulação por largura de pulso)
| Tela tremeluzindo/PWM detectado | 300 Hz Amplitude: 100 % | 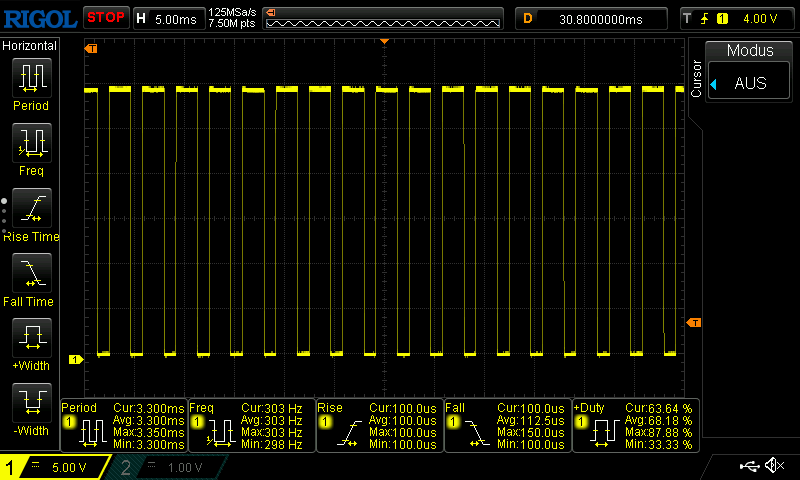 | |
A luz de fundo da tela pisca em 300 Hz (pior caso, por exemplo, utilizando PWM) . A frequência de 300 Hz é relativamente alta, portanto, a maioria dos usuários sensíveis ao PWM não deve notar nenhuma oscilação. No entanto, há relatos de que alguns usuários ainda são sensíveis ao PWM em 500 Hz e acima, portanto, esteja atento. [pwm_comparison] Em comparação: 52 % de todos os dispositivos testados não usam PWM para escurecer a tela. Se PWM foi detectado, uma média de 7781 (mínimo: 5 - máximo: 343500) Hz foi medida. | |||

Uso ao ar livre
Análise de Perspectiva
Desempenho
Sob o capô robusto, um processador Intel Core Ultra de última geração funciona incansavelmente. Para o R10, é possível configurar praticamente todos os processadores Core Ultra 5 e Core Ultra 7 da geração Lunar Lake. Dependendo da classe do processador, estão disponíveis versões vPro Enterprise.
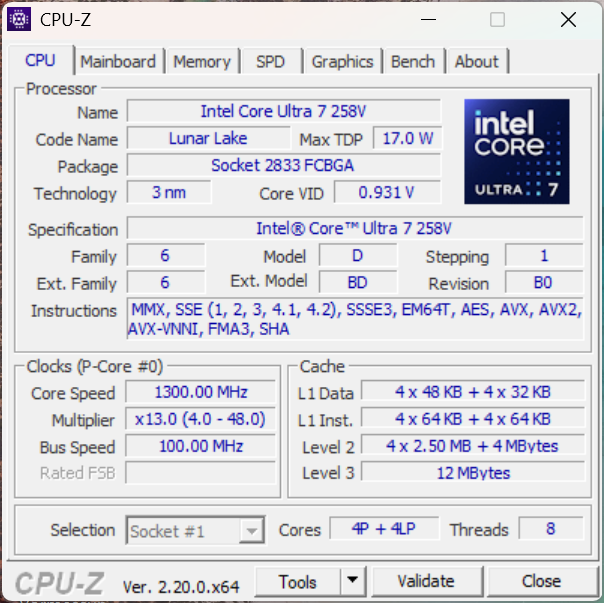
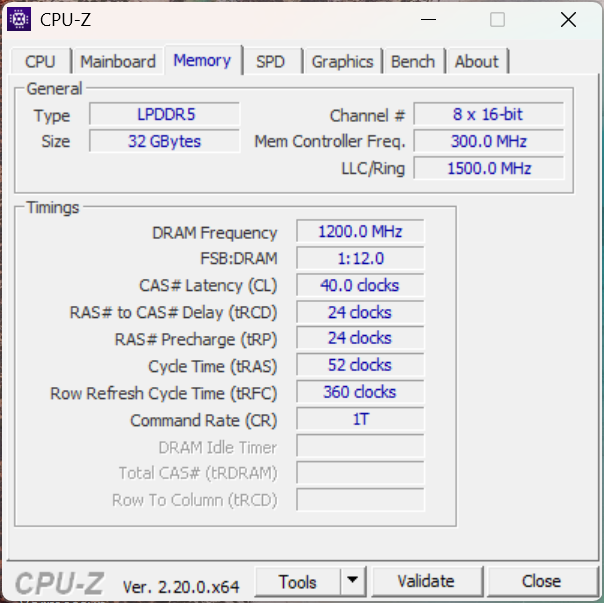
Desempenho do processador
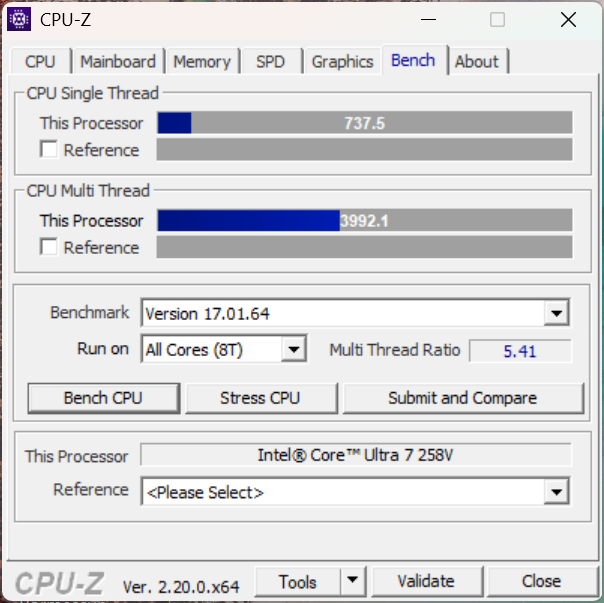
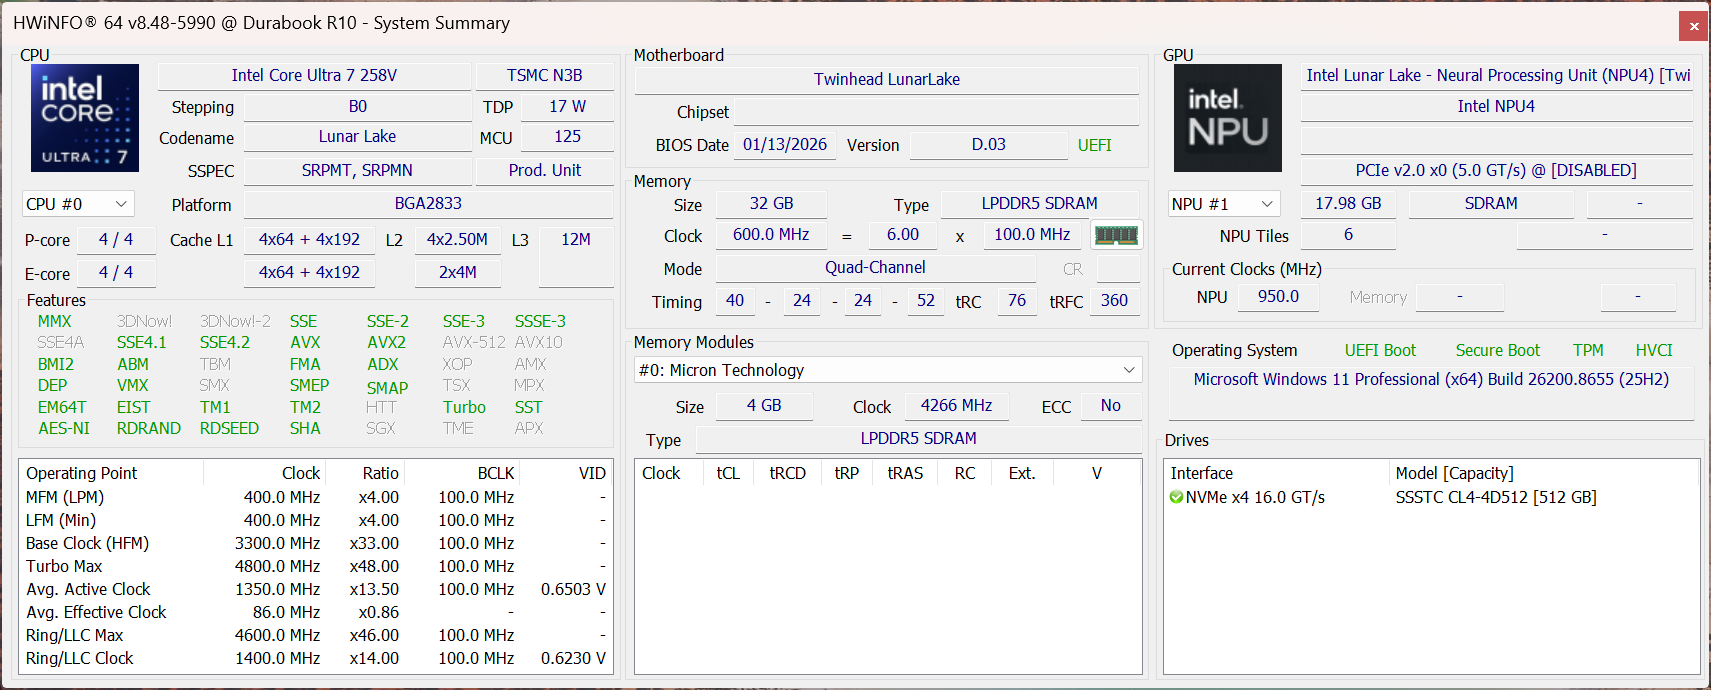
O 258V da unidade de teste possui oito núcleos sem multithreading. Durante breves picos de carga, o sistema permite até 32 watts antes que o consumo de energia seja permanentemente reduzido para cerca de 17 watts. Como resultado, o desempenho do Core Ultra 7 permanece abaixo da média em nossa comparação. Não há recurso de gerenciamento de energia com valores de TDP ajustáveis neste caso.
Teste de resistência multi-core do Cinebench R15
Cinebench R23: Multi Core | Single Core
Cinebench R20: CPU (Multi Core) | CPU (Single Core)
Cinebench R15: CPU Multi 64Bit | CPU Single 64Bit
Blender: v2.79 BMW27 CPU
7-Zip 18.03: 7z b 4 | 7z b 4 -mmt1
Geekbench 6.7: Multi-Core | Single-Core
Geekbench 5.5: Multi-Core | Single-Core
HWBOT x265 Benchmark v2.2: 4k Preset
LibreOffice : 20 Documents To PDF
R Benchmark 2.5: Overall mean
| CPU Performance rating | |
| Lenovo ThinkPad T14 Gen 6 AMD | |
| Lenovo ThinkPad T14 Gen 6 21QG001VGE | |
| Média Intel Core Ultra 7 258V | |
| Dynabook Portege Z40L-N | |
| Durabook R10 | |
| Dell Latitude 7030 Rugged Extreme | |
| Média da turma Tablet | |
| Durabook R8 Tablet -2! | |
| Cinebench R23 / Multi Core | |
| Lenovo ThinkPad T14 Gen 6 AMD | |
| Lenovo ThinkPad T14 Gen 6 21QG001VGE | |
| Média Intel Core Ultra 7 258V (7920 - 11097, n=25) | |
| Média da turma Tablet (8043 - 10868, n=3, últimos 2 anos) | |
| Dell Latitude 7030 Rugged Extreme | |
| Durabook R10 | |
| Durabook R10 | |
| Dynabook Portege Z40L-N | |
| Durabook R8 Tablet | |
| Cinebench R23 / Single Core | |
| Lenovo ThinkPad T14 Gen 6 AMD | |
| Lenovo ThinkPad T14 Gen 6 21QG001VGE | |
| Durabook R10 | |
| Durabook R10 | |
| Média da turma Tablet (1822 - 1921, n=3, últimos 2 anos) | |
| Média Intel Core Ultra 7 258V (1664 - 1957, n=25) | |
| Dynabook Portege Z40L-N | |
| Dell Latitude 7030 Rugged Extreme | |
| Durabook R8 Tablet | |
| Cinebench R20 / CPU (Multi Core) | |
| Lenovo ThinkPad T14 Gen 6 AMD | |
| Lenovo ThinkPad T14 Gen 6 21QG001VGE | |
| Média Intel Core Ultra 7 258V (3130 - 4314, n=24) | |
| Média da turma Tablet (3137 - 4255, n=2, últimos 2 anos) | |
| Dell Latitude 7030 Rugged Extreme | |
| Durabook R10 | |
| Dynabook Portege Z40L-N | |
| Durabook R8 Tablet | |
| Cinebench R20 / CPU (Single Core) | |
| Lenovo ThinkPad T14 Gen 6 AMD | |
| Lenovo ThinkPad T14 Gen 6 21QG001VGE | |
| Média da turma Tablet (705 - 739, n=2, últimos 2 anos) | |
| Dynabook Portege Z40L-N | |
| Média Intel Core Ultra 7 258V (643 - 749, n=24) | |
| Durabook R10 | |
| Dell Latitude 7030 Rugged Extreme | |
| Durabook R8 Tablet | |
| Cinebench R15 / CPU Multi 64Bit | |
| Lenovo ThinkPad T14 Gen 6 AMD | |
| Lenovo ThinkPad T14 Gen 6 21QG001VGE | |
| Média Intel Core Ultra 7 258V (1280 - 1656, n=24) | |
| Média da turma Tablet (1285 - 1651, n=2, últimos 2 anos) | |
| Dell Latitude 7030 Rugged Extreme | |
| Durabook R10 | |
| Dynabook Portege Z40L-N | |
| Durabook R8 Tablet | |
| Cinebench R15 / CPU Single 64Bit | |
| Média da turma Tablet (274 - 299, n=2, últimos 2 anos) | |
| Lenovo ThinkPad T14 Gen 6 21QG001VGE | |
| Média Intel Core Ultra 7 258V (258 - 298, n=24) | |
| Dynabook Portege Z40L-N | |
| Durabook R10 | |
| Dell Latitude 7030 Rugged Extreme | |
| Lenovo ThinkPad T14 Gen 6 AMD | |
| Durabook R8 Tablet | |
| Blender / v2.79 BMW27 CPU | |
| Durabook R8 Tablet | |
| Durabook R10 | |
| Dynabook Portege Z40L-N | |
| Média da turma Tablet (337 - 484, n=2, últimos 2 anos) | |
| Dell Latitude 7030 Rugged Extreme | |
| Média Intel Core Ultra 7 258V (315 - 484, n=24) | |
| Lenovo ThinkPad T14 Gen 6 21QG001VGE | |
| Lenovo ThinkPad T14 Gen 6 AMD | |
| 7-Zip 18.03 / 7z b 4 | |
| Lenovo ThinkPad T14 Gen 6 AMD | |
| Lenovo ThinkPad T14 Gen 6 21QG001VGE | |
| Dell Latitude 7030 Rugged Extreme | |
| Média Intel Core Ultra 7 258V (24486 - 36724, n=24) | |
| Média da turma Tablet (24486 - 36610, n=2, últimos 2 anos) | |
| Dynabook Portege Z40L-N | |
| Durabook R10 | |
| Durabook R8 Tablet | |
| 7-Zip 18.03 / 7z b 4 -mmt1 | |
| Lenovo ThinkPad T14 Gen 6 AMD | |
| Lenovo ThinkPad T14 Gen 6 21QG001VGE | |
| Dynabook Portege Z40L-N | |
| Média Intel Core Ultra 7 258V (4769 - 5869, n=24) | |
| Média da turma Tablet (4769 - 5991, n=2, últimos 2 anos) | |
| Dell Latitude 7030 Rugged Extreme | |
| Durabook R10 | |
| Durabook R8 Tablet | |
| Geekbench 6.7 / Multi-Core | |
| Lenovo ThinkPad T14 Gen 6 AMD | |
| Lenovo ThinkPad T14 Gen 6 21QG001VGE | |
| Média Intel Core Ultra 7 258V (8964 - 11334, n=24) | |
| Dynabook Portege Z40L-N | |
| Durabook R10 | |
| Dell Latitude 7030 Rugged Extreme | |
| Média da turma Tablet (1104 - 16544, n=86, últimos 2 anos) | |
| Geekbench 6.7 / Single-Core | |
| Lenovo ThinkPad T14 Gen 6 AMD | |
| Lenovo ThinkPad T14 Gen 6 21QG001VGE | |
| Dynabook Portege Z40L-N | |
| Média Intel Core Ultra 7 258V (2593 - 2795, n=24) | |
| Durabook R10 | |
| Dell Latitude 7030 Rugged Extreme | |
| Média da turma Tablet (323 - 4128, n=86, últimos 2 anos) | |
| Geekbench 5.5 / Multi-Core | |
| Lenovo ThinkPad T14 Gen 6 AMD | |
| Lenovo ThinkPad T14 Gen 6 21QG001VGE | |
| Média Intel Core Ultra 7 258V (7574 - 9918, n=24) | |
| Dynabook Portege Z40L-N | |
| Durabook R10 | |
| Dell Latitude 7030 Rugged Extreme | |
| Média da turma Tablet (303 - 10522, n=39, últimos 2 anos) | |
| Durabook R8 Tablet | |
| Geekbench 5.5 / Single-Core | |
| Lenovo ThinkPad T14 Gen 6 AMD | |
| Lenovo ThinkPad T14 Gen 6 21QG001VGE | |
| Dynabook Portege Z40L-N | |
| Média Intel Core Ultra 7 258V (1891 - 2046, n=24) | |
| Durabook R10 | |
| Dell Latitude 7030 Rugged Extreme | |
| Durabook R8 Tablet | |
| Média da turma Tablet (103 - 2286, n=39, últimos 2 anos) | |
| HWBOT x265 Benchmark v2.2 / 4k Preset | |
| Lenovo ThinkPad T14 Gen 6 AMD | |
| Lenovo ThinkPad T14 Gen 6 21QG001VGE | |
| Média Intel Core Ultra 7 258V (7.11 - 14.2, n=24) | |
| Média da turma Tablet (7.11 - 12.9, n=2, últimos 2 anos) | |
| Dynabook Portege Z40L-N | |
| Dell Latitude 7030 Rugged Extreme | |
| Durabook R10 | |
| Durabook R8 Tablet | |
| LibreOffice / 20 Documents To PDF | |
| Durabook R10 | |
| Durabook R8 Tablet | |
| Média da turma Tablet (48.3 - 62.8, n=2, últimos 2 anos) | |
| Lenovo ThinkPad T14 Gen 6 AMD | |
| Média Intel Core Ultra 7 258V (41.1 - 62.8, n=24) | |
| Lenovo ThinkPad T14 Gen 6 21QG001VGE | |
| Dell Latitude 7030 Rugged Extreme | |
| Dynabook Portege Z40L-N | |
| R Benchmark 2.5 / Overall mean | |
| Durabook R8 Tablet | |
| Durabook R10 | |
| Dell Latitude 7030 Rugged Extreme | |
| Média da turma Tablet (0.4361 - 0.542, n=2, últimos 2 anos) | |
| Dynabook Portege Z40L-N | |
| Média Intel Core Ultra 7 258V (0.443 - 0.542, n=24) | |
| Lenovo ThinkPad T14 Gen 6 21QG001VGE | |
| Lenovo ThinkPad T14 Gen 6 AMD | |
* ... menor é melhor
AIDA64: FP32 Ray-Trace | FPU Julia | CPU SHA3 | FPU SinJulia | FPU Mandel | CPU AES | CPU ZLib | FP64 Ray-Trace | CPU PhotoWorxx | CPU CheckMate
| Performance rating | |
| Lenovo ThinkPad T14 Gen 6 AMD | |
| Lenovo ThinkPad T14 Gen 6 21QG001VGE -1! | |
| Média Intel Core Ultra 7 258V | |
| Média da turma Tablet | |
| Durabook R10 | |
| Dynabook Portege Z40L-N -1! | |
| Dell Latitude 7030 Rugged Extreme -1! | |
| Durabook R8 Tablet -1! | |
| AIDA64 / FP32 Ray-Trace | |
| Lenovo ThinkPad T14 Gen 6 AMD (v8.20.8100) | |
| Lenovo ThinkPad T14 Gen 6 AMD (v6.92.6600) | |
| Lenovo ThinkPad T14 Gen 6 21QG001VGE (v6.92.6600) | |
| Média Intel Core Ultra 7 258V (8454 - 12781, n=26) | |
| Média da turma Tablet (8485 - 12759, n=2, últimos 2 anos) | |
| Dynabook Portege Z40L-N (v6.92.6600) | |
| Durabook R10 (v8.20.8100) | |
| Dell Latitude 7030 Rugged Extreme (v6.92.6600) | |
| Durabook R8 Tablet (v6.85.6300) | |
| AIDA64 / FPU Julia | |
| Lenovo ThinkPad T14 Gen 6 AMD (v8.20.8100) | |
| Lenovo ThinkPad T14 Gen 6 AMD (v6.92.6600) | |
| Lenovo ThinkPad T14 Gen 6 21QG001VGE (v6.92.6600) | |
| Média Intel Core Ultra 7 258V (40875 - 63401, n=26) | |
| Média da turma Tablet (42586 - 62102, n=2, últimos 2 anos) | |
| Dynabook Portege Z40L-N (v6.92.6600) | |
| Durabook R10 (v8.20.8100) | |
| Dell Latitude 7030 Rugged Extreme (v6.92.6600) | |
| Durabook R8 Tablet (v6.85.6300) | |
| AIDA64 / CPU SHA3 | |
| Lenovo ThinkPad T14 Gen 6 AMD (v6.92.6600) | |
| Lenovo ThinkPad T14 Gen 6 AMD (v8.20.8100) | |
| Lenovo ThinkPad T14 Gen 6 21QG001VGE (v6.92.6600) | |
| Média Intel Core Ultra 7 258V (1930 - 2817, n=26) | |
| Média da turma Tablet (2056 - 2784, n=2, últimos 2 anos) | |
| Durabook R10 (v8.20.8100) | |
| Dynabook Portege Z40L-N (v6.92.6600) | |
| Dell Latitude 7030 Rugged Extreme (v6.92.6600) | |
| Durabook R8 Tablet (v6.85.6300) | |
| AIDA64 / FPU SinJulia | |
| Lenovo ThinkPad T14 Gen 6 AMD (v8.20.8100) | |
| Lenovo ThinkPad T14 Gen 6 AMD (v6.92.6600) | |
| Lenovo ThinkPad T14 Gen 6 21QG001VGE (v6.92.6600) | |
| Média Intel Core Ultra 7 258V (3817 - 4440, n=26) | |
| Média da turma Tablet (4083 - 4429, n=2, últimos 2 anos) | |
| Dell Latitude 7030 Rugged Extreme (v6.92.6600) | |
| Durabook R10 (v8.20.8100) | |
| Dynabook Portege Z40L-N (v6.92.6600) | |
| Durabook R8 Tablet (v6.85.6300) | |
| AIDA64 / FPU Mandel | |
| Lenovo ThinkPad T14 Gen 6 AMD (v8.20.8100) | |
| Lenovo ThinkPad T14 Gen 6 AMD (v6.92.6600) | |
| Lenovo ThinkPad T14 Gen 6 21QG001VGE (v6.92.6600) | |
| Média Intel Core Ultra 7 258V (21670 - 33565, n=26) | |
| Média da turma Tablet (22775 - 31836, n=2, últimos 2 anos) | |
| Dynabook Portege Z40L-N (v6.92.6600) | |
| Durabook R10 (v8.20.8100) | |
| Dell Latitude 7030 Rugged Extreme (v6.92.6600) | |
| Durabook R8 Tablet (v6.85.6300) | |
| AIDA64 / CPU AES | |
| Lenovo ThinkPad T14 Gen 6 AMD (v6.92.6600) | |
| Lenovo ThinkPad T14 Gen 6 AMD (v8.20.8100) | |
| Lenovo ThinkPad T14 Gen 6 21QG001VGE (v6.92.6600) | |
| Média Intel Core Ultra 7 258V (30957 - 40753, n=26) | |
| Média da turma Tablet (34551 - 38941, n=2, últimos 2 anos) | |
| Dell Latitude 7030 Rugged Extreme (v6.92.6600) | |
| Durabook R10 (v8.20.8100) | |
| Dynabook Portege Z40L-N (v6.92.6600) | |
| Durabook R8 Tablet (v6.85.6300) | |
| AIDA64 / CPU ZLib | |
| Lenovo ThinkPad T14 Gen 6 AMD (v6.92.6600) | |
| Lenovo ThinkPad T14 Gen 6 AMD (v8.20.8100) | |
| Lenovo ThinkPad T14 Gen 6 21QG001VGE (v6.92.6600) | |
| Dell Latitude 7030 Rugged Extreme (v6.92.6600) | |
| Média Intel Core Ultra 7 258V (422 - 632, n=26) | |
| Média da turma Tablet (434 - 631, n=2, últimos 2 anos) | |
| Dynabook Portege Z40L-N (v6.92.6600) | |
| Durabook R10 (v8.20.8100) | |
| Durabook R8 Tablet (v6.85.6300) | |
| AIDA64 / FP64 Ray-Trace | |
| Lenovo ThinkPad T14 Gen 6 AMD (v6.92.6600) | |
| Lenovo ThinkPad T14 Gen 6 AMD (v8.20.8100) | |
| Lenovo ThinkPad T14 Gen 6 21QG001VGE (v6.92.6600) | |
| Média Intel Core Ultra 7 258V (4258 - 6930, n=26) | |
| Média da turma Tablet (4660 - 6803, n=2, últimos 2 anos) | |
| Dynabook Portege Z40L-N (v6.92.6600) | |
| Durabook R10 (v8.20.8100) | |
| Dell Latitude 7030 Rugged Extreme (v6.92.6600) | |
| Durabook R8 Tablet (v6.85.6300) | |
| AIDA64 / CPU PhotoWorxx | |
| Lenovo ThinkPad T14 Gen 6 21QG001VGE (v6.92.6600) | |
| Média da turma Tablet (52755 - 54886, n=2, últimos 2 anos) | |
| Média Intel Core Ultra 7 258V (44223 - 59245, n=26) | |
| Durabook R10 (v8.20.8100) | |
| Dynabook Portege Z40L-N (v6.92.6600) | |
| Dell Latitude 7030 Rugged Extreme (v6.92.6600) | |
| Lenovo ThinkPad T14 Gen 6 AMD (v8.20.8100) | |
| Lenovo ThinkPad T14 Gen 6 AMD (v6.92.6600) | |
| Durabook R8 Tablet (v6.85.6300) | |
| AIDA64 / CPU CheckMate | |
| Lenovo ThinkPad T14 Gen 6 AMD (v8.20.8100) | |
| Média Intel Core Ultra 7 258V (2014 - 2513, n=2) | |
| Durabook R10 (v8.20.8100) | |
| Média da turma Tablet (n=1últimos 2 anos) | |
Desempenho do sistema e do armazenamento
No uso cotidiano, a plataforma garante um desempenho fluido para tarefas do Office. No entanto, ao analisar os resultados dos testes de benchmark, o desempenho do tablet fica, em geral, abaixo da média para a plataforma Lunar Lake. Somente em termos de velocidade de armazenamento é que o tablet se destaca, apresentando o excelente desempenho típico da plataforma Lunar Lake.
PCMark 10: Score | Essentials | Productivity | Digital Content Creation
CrossMark: Overall | Productivity | Creativity | Responsiveness
WebXPRT 3: Overall
WebXPRT 4: Overall
Mozilla Kraken 1.1: Total
| Performance rating | |
| Lenovo ThinkPad T14 Gen 6 AMD | |
| Lenovo ThinkPad T14 Gen 6 21QG001VGE | |
| Média Intel Core Ultra 7 258V, Intel Arc Graphics 140V | |
| Dynabook Portege Z40L-N | |
| Durabook R10 | |
| Dell Latitude 7030 Rugged Extreme | |
| Média da turma Tablet | |
| Durabook R8 Tablet | |
| PCMark 10 / Score | |
| Durabook R10 | |
| Lenovo ThinkPad T14 Gen 6 21QG001VGE | |
| Média da turma Tablet (6924 - 7420, n=2, últimos 2 anos) | |
| Lenovo ThinkPad T14 Gen 6 AMD | |
| Média Intel Core Ultra 7 258V, Intel Arc Graphics 140V (6265 - 7420, n=23) | |
| Dynabook Portege Z40L-N | |
| Dell Latitude 7030 Rugged Extreme | |
| Durabook R8 Tablet | |
| PCMark 10 / Essentials | |
| Lenovo ThinkPad T14 Gen 6 AMD | |
| Lenovo ThinkPad T14 Gen 6 21QG001VGE | |
| Média Intel Core Ultra 7 258V, Intel Arc Graphics 140V (9295 - 11467, n=23) | |
| Dynabook Portege Z40L-N | |
| Média da turma Tablet (9991 - 10351, n=2, últimos 2 anos) | |
| Durabook R10 | |
| Dell Latitude 7030 Rugged Extreme | |
| Durabook R8 Tablet | |
| PCMark 10 / Productivity | |
| Durabook R10 | |
| Média da turma Tablet (8823 - 13600, n=2, últimos 2 anos) | |
| Lenovo ThinkPad T14 Gen 6 AMD | |
| Dynabook Portege Z40L-N | |
| Lenovo ThinkPad T14 Gen 6 21QG001VGE | |
| Média Intel Core Ultra 7 258V, Intel Arc Graphics 140V (7357 - 13600, n=23) | |
| Dell Latitude 7030 Rugged Extreme | |
| Durabook R8 Tablet | |
| PCMark 10 / Digital Content Creation | |
| Lenovo ThinkPad T14 Gen 6 21QG001VGE | |
| Média Intel Core Ultra 7 258V, Intel Arc Graphics 140V (8160 - 10308, n=23) | |
| Média da turma Tablet (8160 - 9863, n=2, últimos 2 anos) | |
| Dynabook Portege Z40L-N | |
| Lenovo ThinkPad T14 Gen 6 AMD | |
| Durabook R10 | |
| Dell Latitude 7030 Rugged Extreme | |
| Durabook R8 Tablet | |
| CrossMark / Overall | |
| Lenovo ThinkPad T14 Gen 6 AMD | |
| Lenovo ThinkPad T14 Gen 6 21QG001VGE | |
| Média Intel Core Ultra 7 258V, Intel Arc Graphics 140V (1275 - 1742, n=22) | |
| Dynabook Portege Z40L-N | |
| Dell Latitude 7030 Rugged Extreme | |
| Durabook R10 | |
| Durabook R8 Tablet | |
| Média da turma Tablet (319 - 2375, n=46, últimos 2 anos) | |
| CrossMark / Productivity | |
| Lenovo ThinkPad T14 Gen 6 AMD | |
| Lenovo ThinkPad T14 Gen 6 21QG001VGE | |
| Média Intel Core Ultra 7 258V, Intel Arc Graphics 140V (1267 - 1684, n=22) | |
| Dynabook Portege Z40L-N | |
| Dell Latitude 7030 Rugged Extreme | |
| Durabook R10 | |
| Durabook R8 Tablet | |
| Média da turma Tablet (346 - 2036, n=44, últimos 2 anos) | |
| CrossMark / Creativity | |
| Lenovo ThinkPad T14 Gen 6 AMD | |
| Lenovo ThinkPad T14 Gen 6 21QG001VGE | |
| Média Intel Core Ultra 7 258V, Intel Arc Graphics 140V (1393 - 1977, n=22) | |
| Dynabook Portege Z40L-N | |
| Dell Latitude 7030 Rugged Extreme | |
| Durabook R10 | |
| Durabook R8 Tablet | |
| Média da turma Tablet (288 - 2620, n=44, últimos 2 anos) | |
| CrossMark / Responsiveness | |
| Média da turma Tablet (333 - 12671, n=44, últimos 2 anos) | |
| Lenovo ThinkPad T14 Gen 6 AMD | |
| Lenovo ThinkPad T14 Gen 6 21QG001VGE | |
| Média Intel Core Ultra 7 258V, Intel Arc Graphics 140V (999 - 1411, n=22) | |
| Dynabook Portege Z40L-N | |
| Dell Latitude 7030 Rugged Extreme | |
| Durabook R10 | |
| Durabook R8 Tablet | |
| WebXPRT 3 / Overall | |
| Lenovo ThinkPad T14 Gen 6 AMD | |
| Dynabook Portege Z40L-N | |
| Lenovo ThinkPad T14 Gen 6 21QG001VGE | |
| Média Intel Core Ultra 7 258V, Intel Arc Graphics 140V (219 - 317, n=22) | |
| Durabook R10 | |
| Dell Latitude 7030 Rugged Extreme | |
| Média da turma Tablet (108 - 480, n=10, últimos 2 anos) | |
| Durabook R8 Tablet | |
| WebXPRT 4 / Overall | |
| Dynabook Portege Z40L-N | |
| Lenovo ThinkPad T14 Gen 6 21QG001VGE | |
| Lenovo ThinkPad T14 Gen 6 AMD | |
| Média Intel Core Ultra 7 258V, Intel Arc Graphics 140V (199.5 - 291, n=22) | |
| Durabook R10 | |
| Dell Latitude 7030 Rugged Extreme | |
| Durabook R8 Tablet | |
| Média da turma Tablet (39 - 376, n=56, últimos 2 anos) | |
| Mozilla Kraken 1.1 / Total | |
| Média da turma Tablet (243 - 27101, n=66, últimos 2 anos) | |
| Durabook R8 Tablet | |
| Dell Latitude 7030 Rugged Extreme | |
| Durabook R10 | |
| Média Intel Core Ultra 7 258V, Intel Arc Graphics 140V (468 - 559, n=24) | |
| Lenovo ThinkPad T14 Gen 6 21QG001VGE | |
| Dynabook Portege Z40L-N | |
| Lenovo ThinkPad T14 Gen 6 AMD | |
* ... menor é melhor
| PCMark 10 Score | 7420 pontos | |
Ajuda | ||
| AIDA64 / Memory Copy | |
| Durabook R10 | |
| Lenovo ThinkPad T14 Gen 6 21QG001VGE | |
| Média da turma Tablet (108317 - 110050, n=2, últimos 2 anos) | |
| Média Intel Core Ultra 7 258V (104408 - 114336, n=24) | |
| Dynabook Portege Z40L-N | |
| Dell Latitude 7030 Rugged Extreme | |
| Lenovo ThinkPad T14 Gen 6 AMD | |
| Lenovo ThinkPad T14 Gen 6 AMD | |
| Durabook R8 Tablet | |
| AIDA64 / Memory Read | |
| Lenovo ThinkPad T14 Gen 6 21QG001VGE | |
| Média Intel Core Ultra 7 258V (82846 - 89417, n=24) | |
| Dynabook Portege Z40L-N | |
| Média da turma Tablet (85395 - 87747, n=2, últimos 2 anos) | |
| Durabook R10 | |
| Dell Latitude 7030 Rugged Extreme | |
| Lenovo ThinkPad T14 Gen 6 AMD | |
| Lenovo ThinkPad T14 Gen 6 AMD | |
| Durabook R8 Tablet | |
| AIDA64 / Memory Write | |
| Lenovo ThinkPad T14 Gen 6 21QG001VGE | |
| Média Intel Core Ultra 7 258V (108824 - 117989, n=24) | |
| Média da turma Tablet (108824 - 117859, n=2, últimos 2 anos) | |
| Dynabook Portege Z40L-N | |
| Durabook R10 | |
| Dell Latitude 7030 Rugged Extreme | |
| Lenovo ThinkPad T14 Gen 6 AMD | |
| Lenovo ThinkPad T14 Gen 6 AMD | |
| Durabook R8 Tablet | |
| AIDA64 / Memory Latency | |
| Dell Latitude 7030 Rugged Extreme | |
| Lenovo ThinkPad T14 Gen 6 AMD | |
| Lenovo ThinkPad T14 Gen 6 AMD | |
| Durabook R8 Tablet | |
| Durabook R10 | |
| Dynabook Portege Z40L-N | |
| Lenovo ThinkPad T14 Gen 6 21QG001VGE | |
| Média da turma Tablet (94.4 - 101.7, n=2, últimos 2 anos) | |
| Média Intel Core Ultra 7 258V (95 - 101.7, n=24) | |
* ... menor é melhor
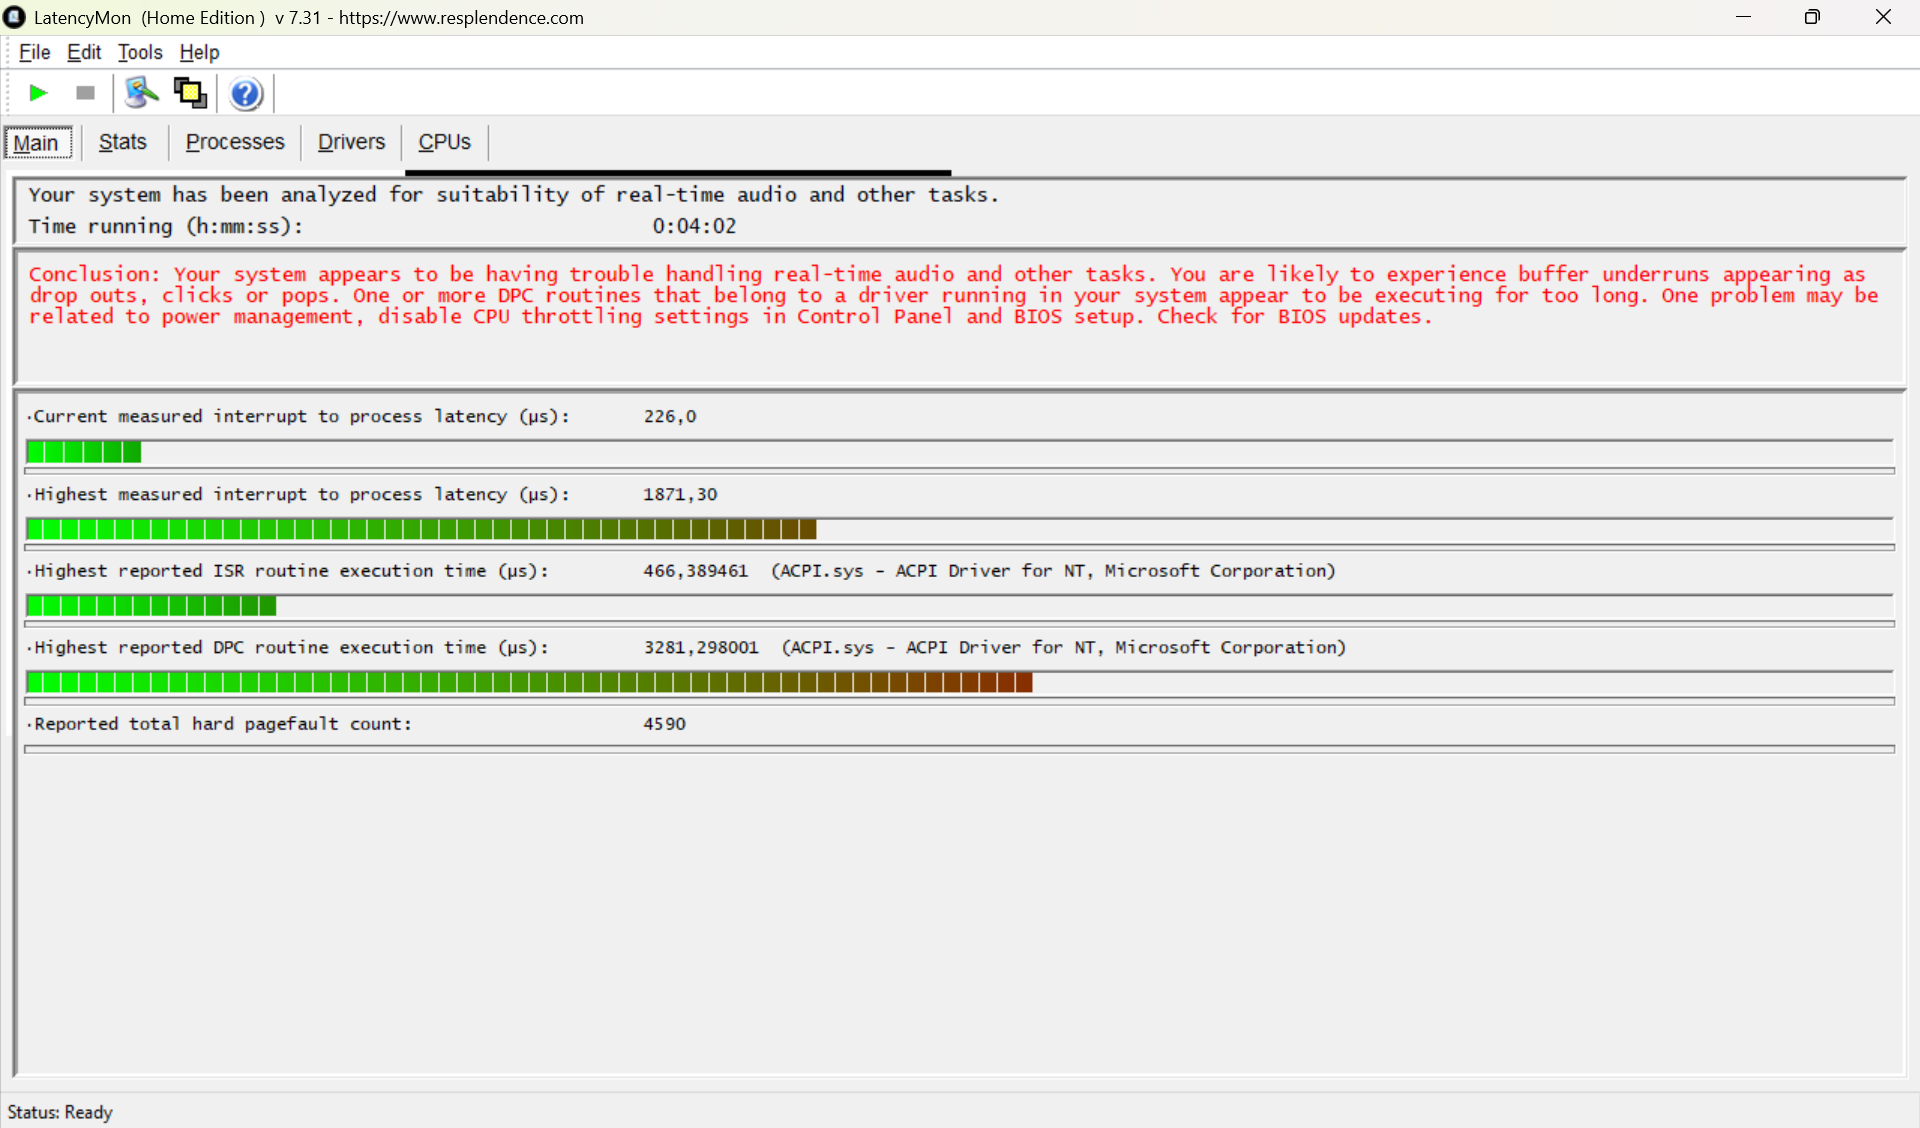
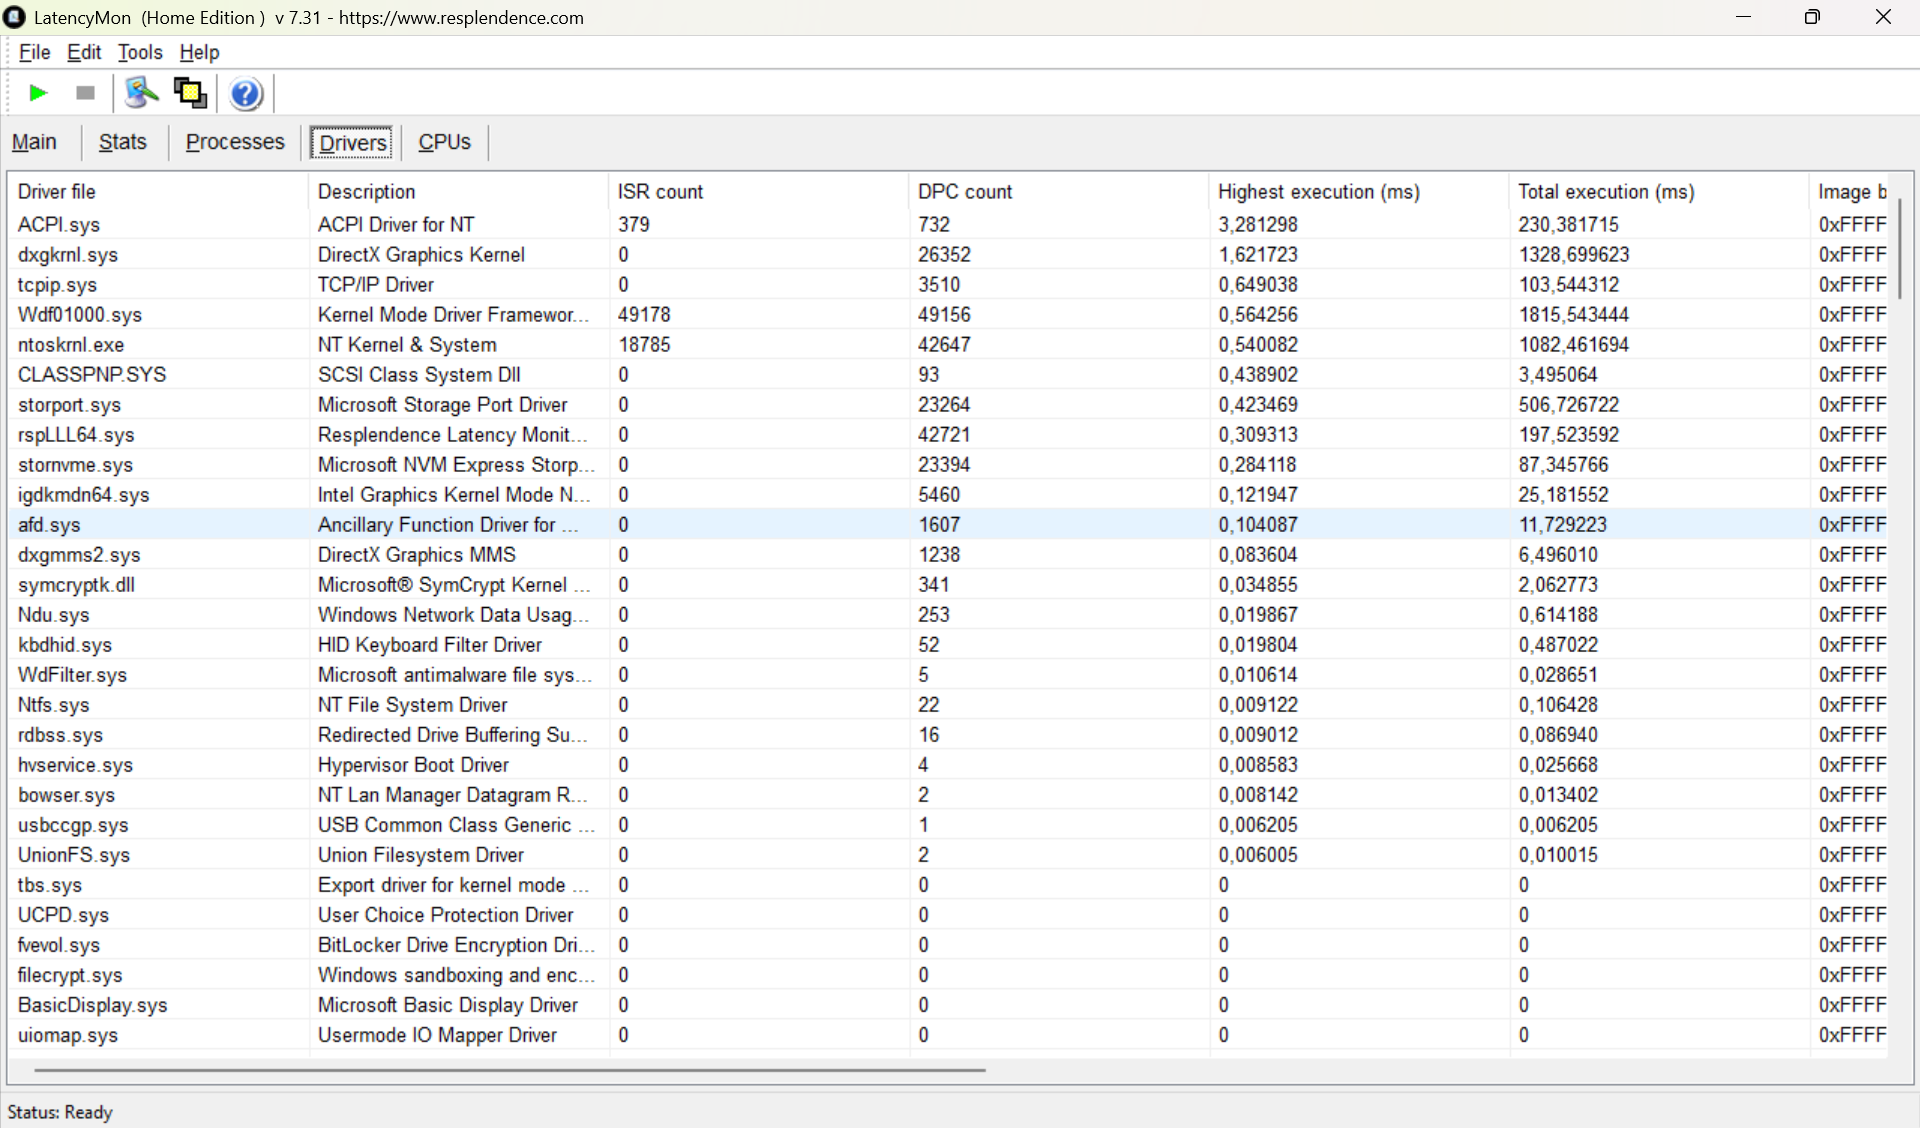
Latências de DPC
A ferramenta de análise LatencyMon mostra que o driver ACPI causa atrasos de até 3.281 microssegundos no tablet. Isso pode causar falhas durante tarefas em que o tempo é um fator crítico, como edição de áudio ou aquisição de dados em alta frequência.
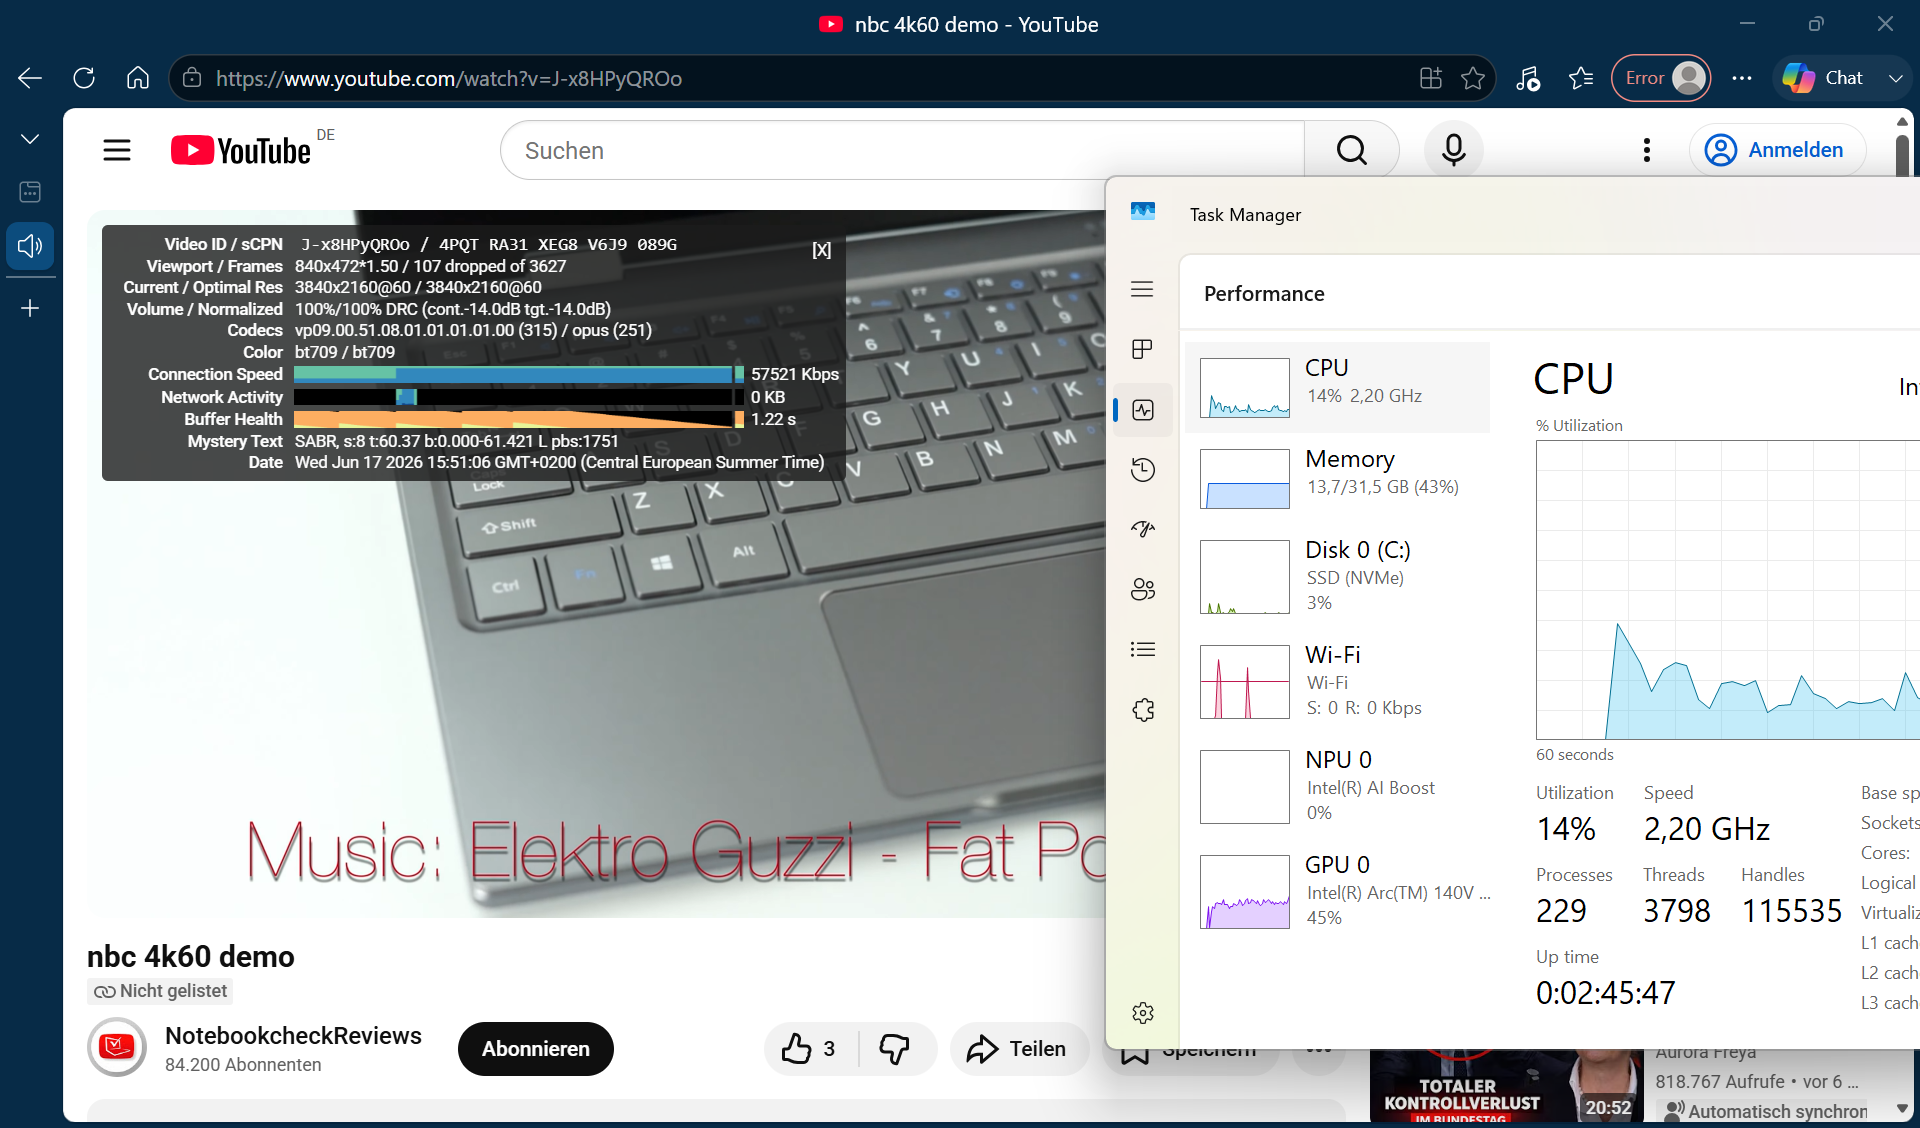
| DPC Latencies / LatencyMon - interrupt to process latency (max), Web, Youtube, Prime95 | |
| Durabook R10 | |
| Dell Latitude 7030 Rugged Extreme | |
| Durabook R8 Tablet | |
| Lenovo ThinkPad T14 Gen 6 21QG001VGE | |
| Dynabook Portege Z40L-N | |
| Média da turma Tablet (482 - 1871, n=2, últimos 2 anos) | |
* ... menor é melhor
Armazenamento em massa

* ... menor é melhor
Desempenho sustentado de leitura: DiskSpd Read Loop, profundidade da fila 8
Desempenho da GPU e em jogos
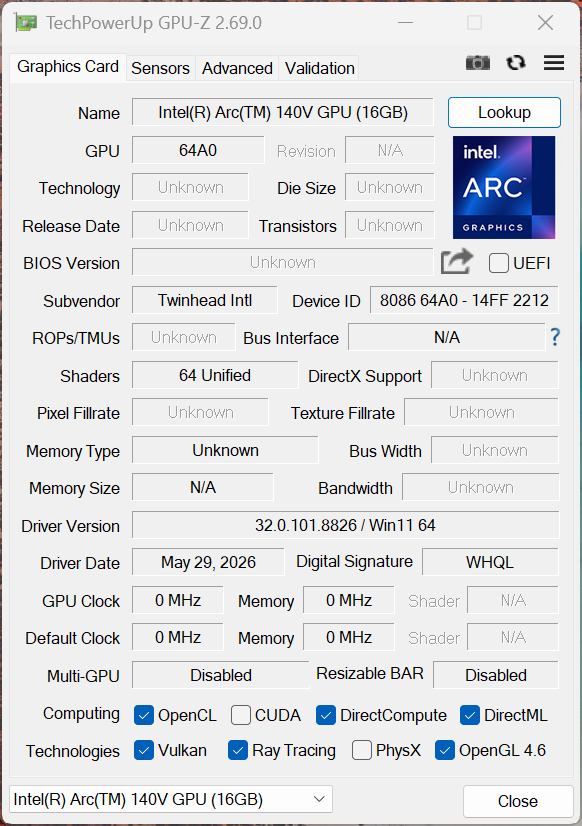
O processamento gráfico é realizado pela placa de vídeo Intel Arc Graphics 140V, que está integrada ao processador. Ela lida com facilidade com vídeos de alta resolução, tarefas 3D leves e configurações com vários monitores. No entanto, arquivos CAD de grande porte ou aplicativos com alta exigência gráfica podem representar um desafio para a placa de vídeo Intel.
| 3DMark 11 Performance | 9563 pontos | |
| 3DMark Ice Storm Standard Score | 178031 pontos | |
| 3DMark Cloud Gate Standard Score | 26729 pontos | |
| 3DMark Fire Strike Score | 7287 pontos | |
| 3DMark Time Spy Score | 3373 pontos | |
| 3DMark Steel Nomad Score | 743 pontos | |
| 3DMark Steel Nomad Light Score | 2843 pontos | |
Ajuda | ||
* ... menor é melhor
| Performance rating - Percent | |
| Lenovo ThinkPad T14 Gen 6 21QG001VGE -1! | |
| Média da turma Tablet | |
| Dynabook Portege Z40L-N | |
| Durabook R10 | |
| Lenovo ThinkPad T14 Gen 6 AMD -1! | |
| Dell Latitude 7030 Rugged Extreme -1! | |
| Durabook R8 Tablet -5! | |
| Cyberpunk 2077 - 1920x1080 Ultra Preset (FSR off) | |
| Lenovo ThinkPad T14 Gen 6 21QG001VGE | |
| Média da turma Tablet (21.2 - 28.7, n=2, últimos 2 anos) | |
| Durabook R10 | |
| Dynabook Portege Z40L-N | |
| Lenovo ThinkPad T14 Gen 6 AMD | |
| Dell Latitude 7030 Rugged Extreme | |
| Baldur's Gate 3 - 1920x1080 Ultra Preset AA:T | |
| Lenovo ThinkPad T14 Gen 6 21QG001VGE | |
| Média da turma Tablet (22.8 - 28.3, n=2, últimos 2 anos) | |
| Dynabook Portege Z40L-N | |
| Durabook R10 | |
| Lenovo ThinkPad T14 Gen 6 AMD | |
| GTA V - 1920x1080 Highest AA:4xMSAA + FX AF:16x | |
| Lenovo ThinkPad T14 Gen 6 21QG001VGE | |
| Média da turma Tablet (21.1 - 27.8, n=2, últimos 2 anos) | |
| Dynabook Portege Z40L-N | |
| Durabook R10 | |
| Lenovo ThinkPad T14 Gen 6 AMD | |
| Dell Latitude 7030 Rugged Extreme | |
| Final Fantasy XV Benchmark - 1920x1080 High Quality | |
| Lenovo ThinkPad T14 Gen 6 21QG001VGE | |
| Média da turma Tablet (25.4 - 34.4, n=3, últimos 2 anos) | |
| Durabook R10 | |
| Durabook R10 | |
| Dynabook Portege Z40L-N | |
| Lenovo ThinkPad T14 Gen 6 AMD | |
| Dell Latitude 7030 Rugged Extreme | |
| Strange Brigade - 1920x1080 ultra AA:ultra AF:16 | |
| Média da turma Tablet (44.4 - 58, n=2, últimos 2 anos) | |
| Dynabook Portege Z40L-N | |
| Durabook R10 | |
| Dell Latitude 7030 Rugged Extreme | |
| Dota 2 Reborn - 1920x1080 ultra (3/3) best looking | |
| Lenovo ThinkPad T14 Gen 6 21QG001VGE | |
| Média da turma Tablet (70.9 - 84.5, n=2, últimos 2 anos) | |
| Durabook R10 | |
| Dynabook Portege Z40L-N | |
| Dell Latitude 7030 Rugged Extreme | |
| Lenovo ThinkPad T14 Gen 6 AMD | |
| Durabook R8 Tablet | |
Gráfico de FPS em Ultra do Cyberpunk 2077
| baixo | média | alto | ultra | |
|---|---|---|---|---|
| GTA V (2015) | 128.8 | 125.6 | 50.7 | 21.1 |
| Dota 2 Reborn (2015) | 92.5 | 75 | 51.7 | 70.9 |
| Final Fantasy XV Benchmark (2018) | 63.8 | 35.9 | 25.4 | |
| X-Plane 11.11 (2018) | 34.5 | 31.4 | 30.1 | |
| Strange Brigade (2018) | 161.3 | 52.1 | 52.9 | 44.4 |
| Baldur's Gate 3 (2023) | 34.1 | 24.9 | 22.8 | |
| Cyberpunk 2077 (2023) | 37.9 | 21.2 | ||
| F1 24 (2024) | 40.4 | 14.6 | ||
| F1 25 (2025) | 55.8 | 48.6 | 34.9 |
Emissões e Energia
Emissões sonoras
A ventoinha interna funciona quase continuamente. Embora seja praticamente inaudível quando o sistema está ocioso, ela não fica muito barulhenta mesmo durante um teste de carga, registrando 31 dB(A). No entanto, esse zumbido suave é completamente abafado quando o dispositivo é utilizado ao ar livre.
Barulho
| Ocioso |
| 27.7 / 27.7 / 27.7 dB |
| Carga |
| / 31.6 dB |
 | ||
30 dB silencioso 40 dB(A) audível 50 dB(A) ruidosamente alto |
||
min: | ||
| Durabook R10 Core Ultra 7 258V, Arc 140V | Dell Latitude 7030 Rugged Extreme i7-1260U, Iris Xe G7 96EUs | Lenovo ThinkPad T14 Gen 6 21QG001VGE Core Ultra 7 258V, Arc 140V | Dynabook Portege Z40L-N Core Ultra 7 258V, Arc 140V | Durabook R8 Tablet i5-1230U, Iris Xe G7 80EUs | Lenovo ThinkPad T14 Gen 6 AMD Ryzen AI 7 PRO 350, Radeon 860M | |
|---|---|---|---|---|---|---|
| Noise | -1% | 0% | 6% | 7% | ||
| desligado / ambiente * (dB) | 25.9 | 23 11% | 25.1 3% | 23.5 9% | 24.5 5% | |
| Idle Minimum * (dB) | 27.7 | 23.5 15% | 25.1 9% | 23.6 15% | 24.5 12% | |
| Idle Average * (dB) | 27.7 | 23.5 15% | 25.1 9% | 23.6 15% | 24.5 12% | |
| Idle Maximum * (dB) | 27.7 | 23.5 15% | 27.1 2% | 23.6 15% | 24.5 12% | |
| Load Maximum * (dB) | 31.6 | 50.6 -60% | 38.5 -22% | 39 -23% | 33.7 -7% | |
| Load Average * (dB) | 24.1 | 34.8 | 37 | 26.8 | ||
| Cyberpunk 2077 ultra * (dB) | 50.5 | 38.3 | 37.8 | 35.3 |
* ... menor é melhor
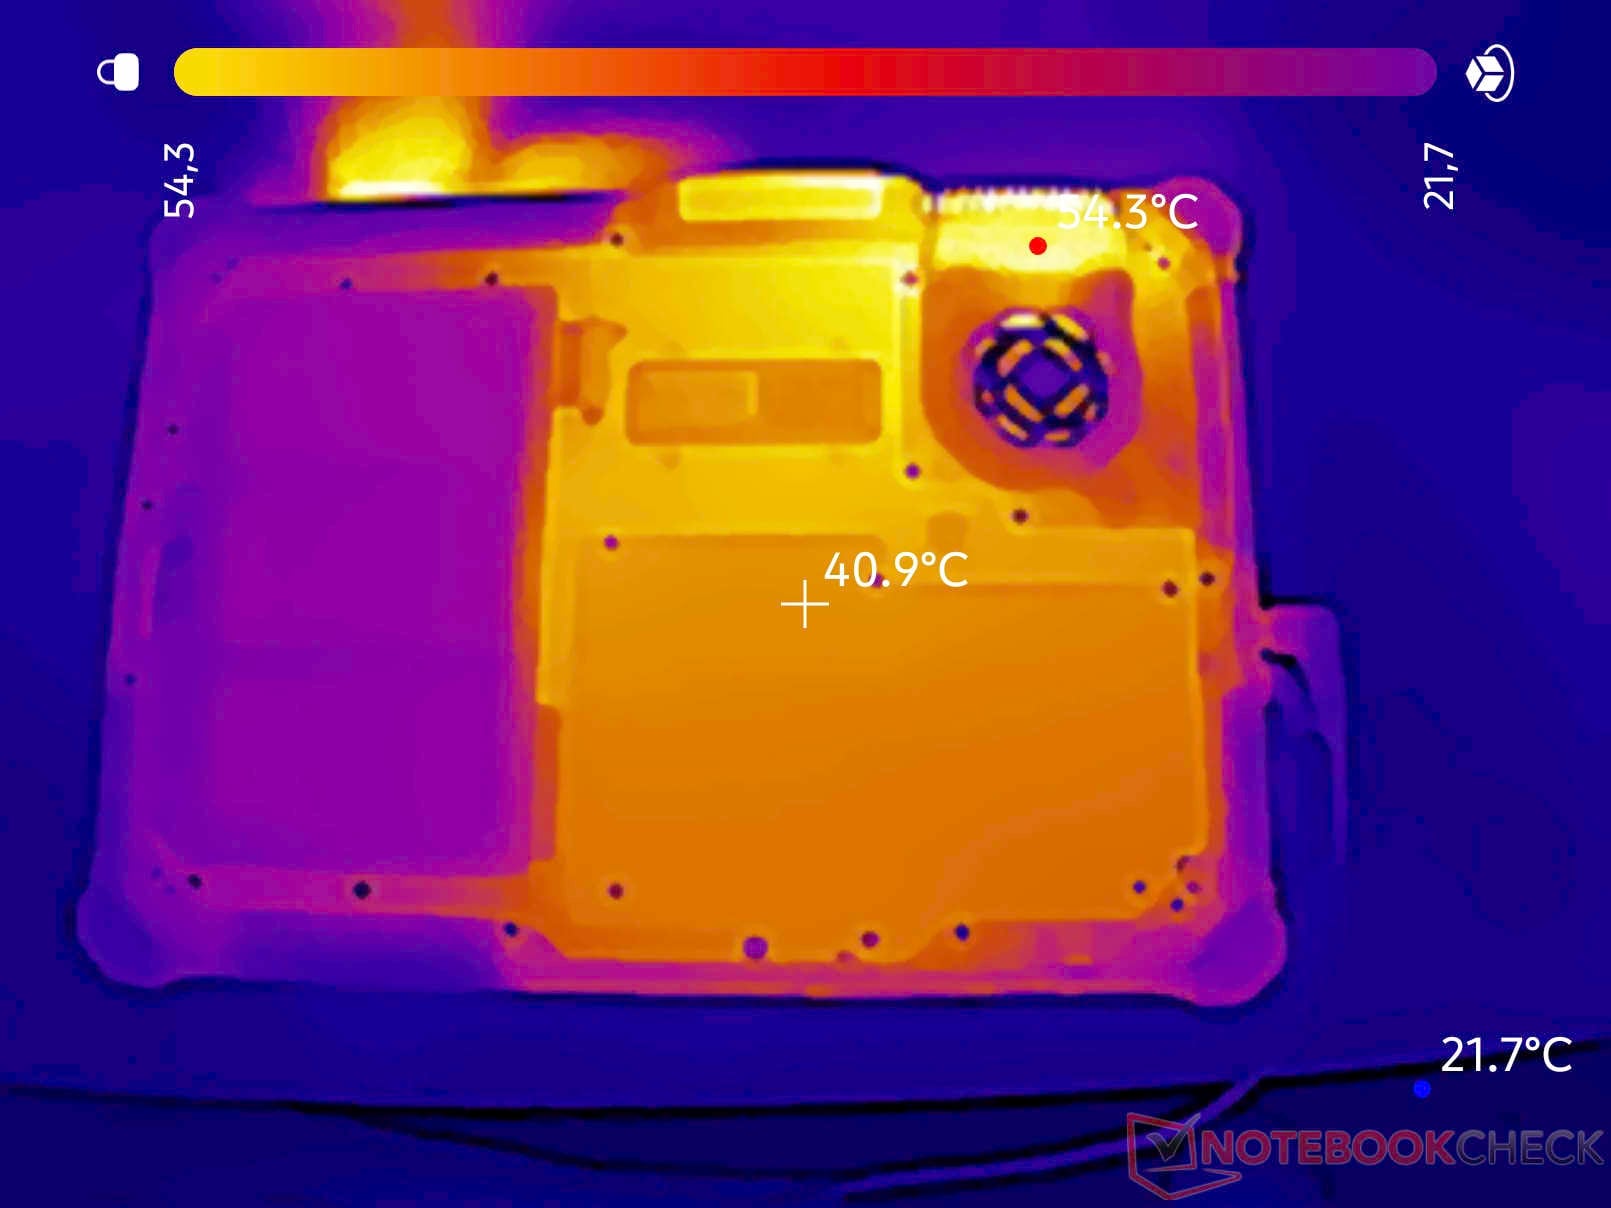
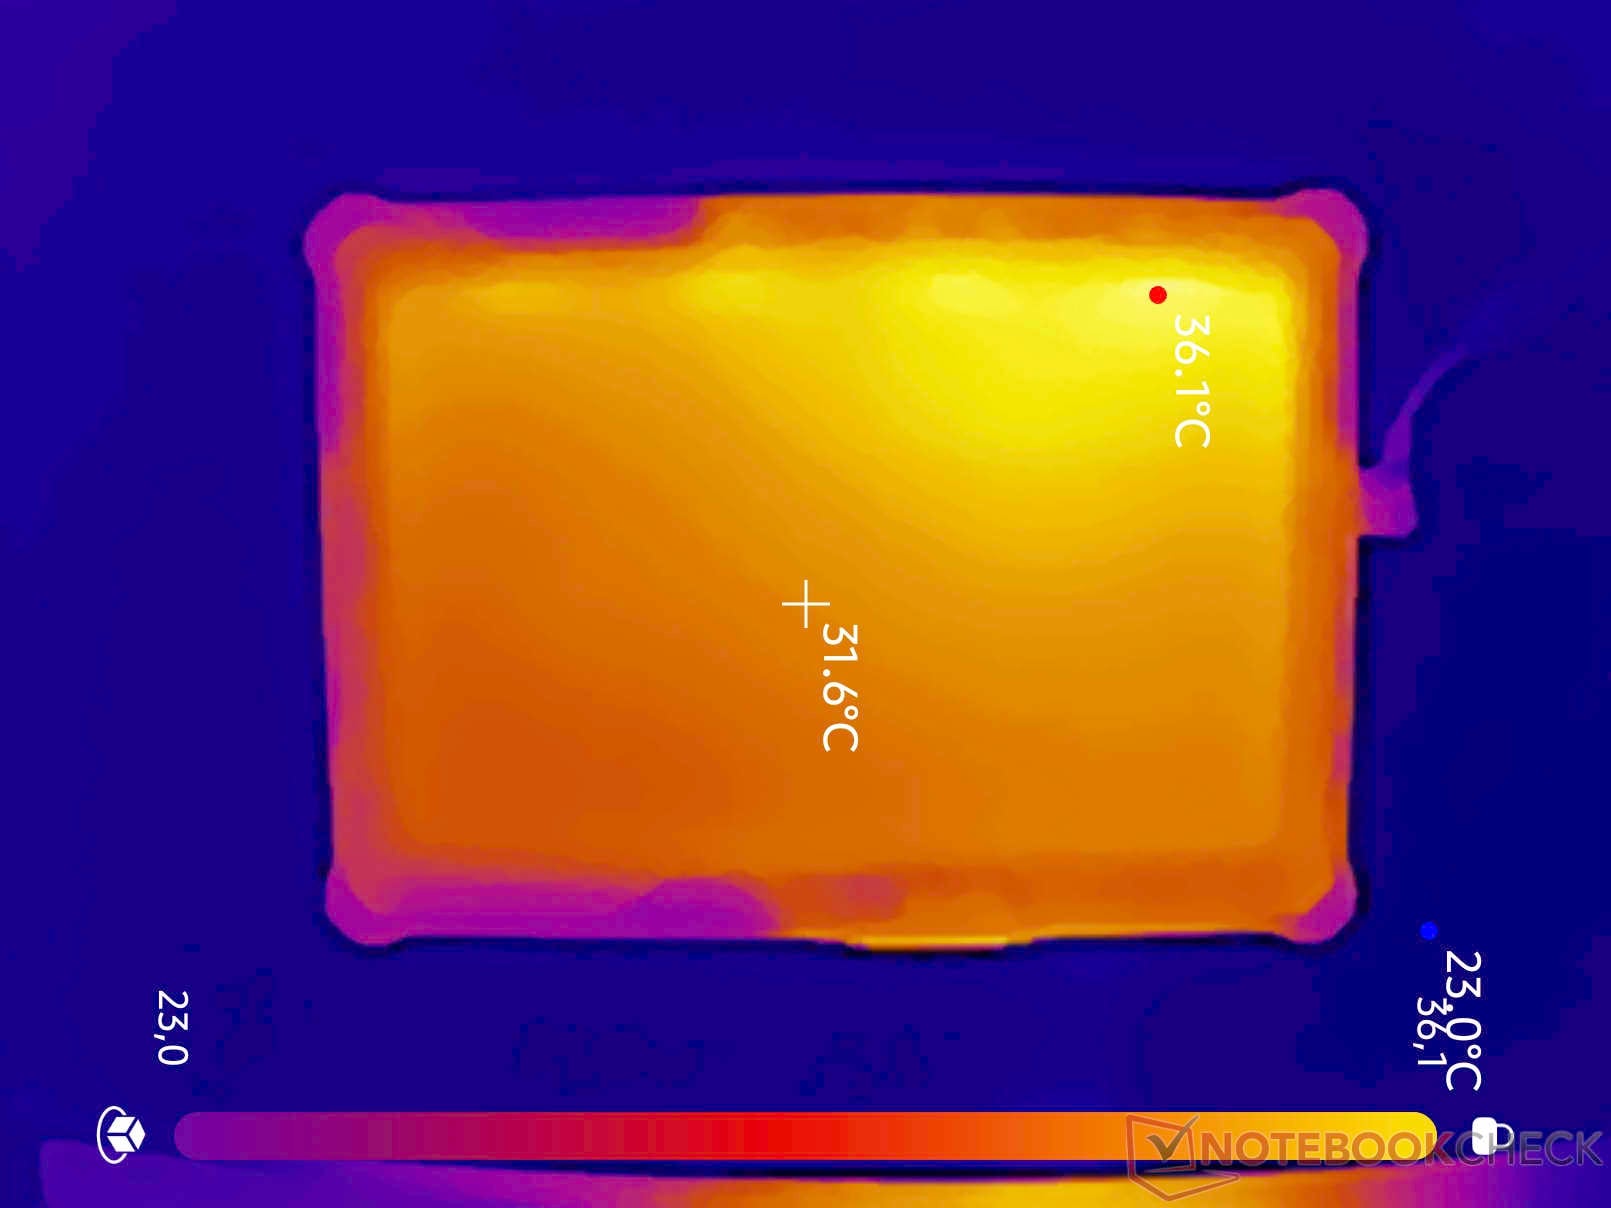
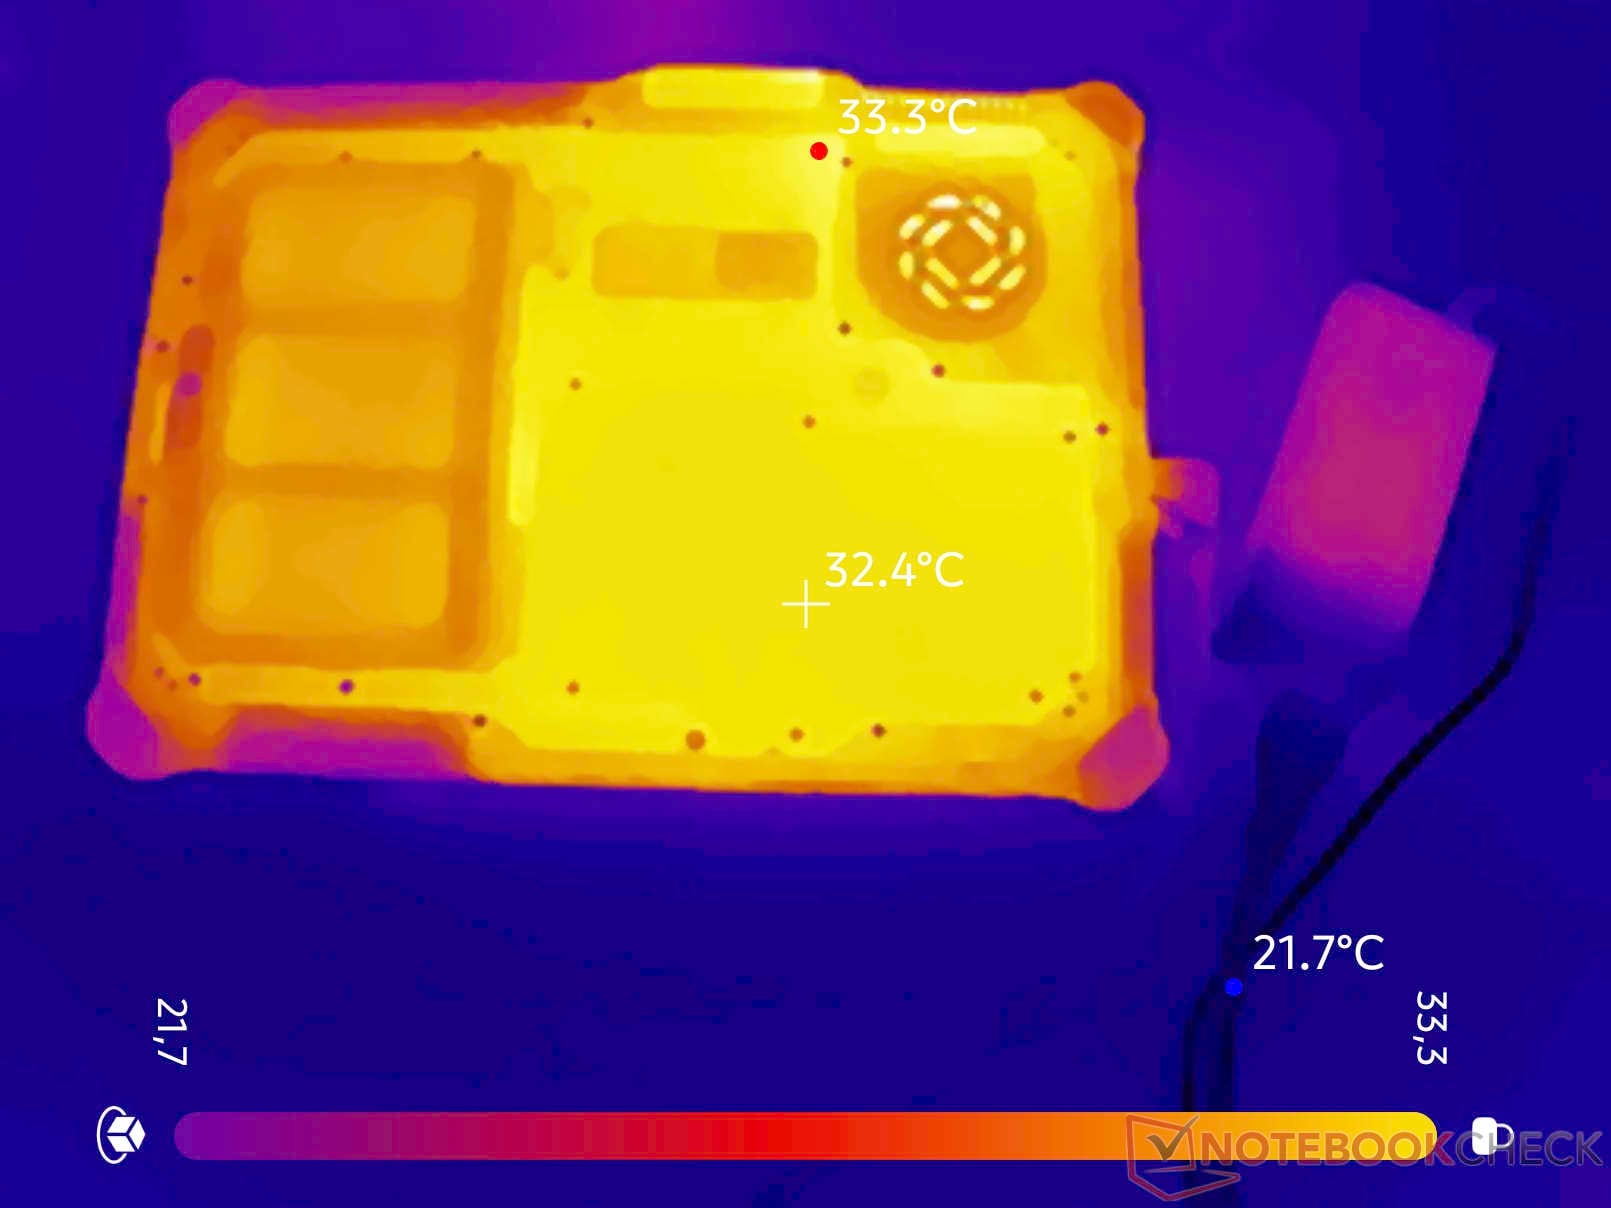
Temperatura
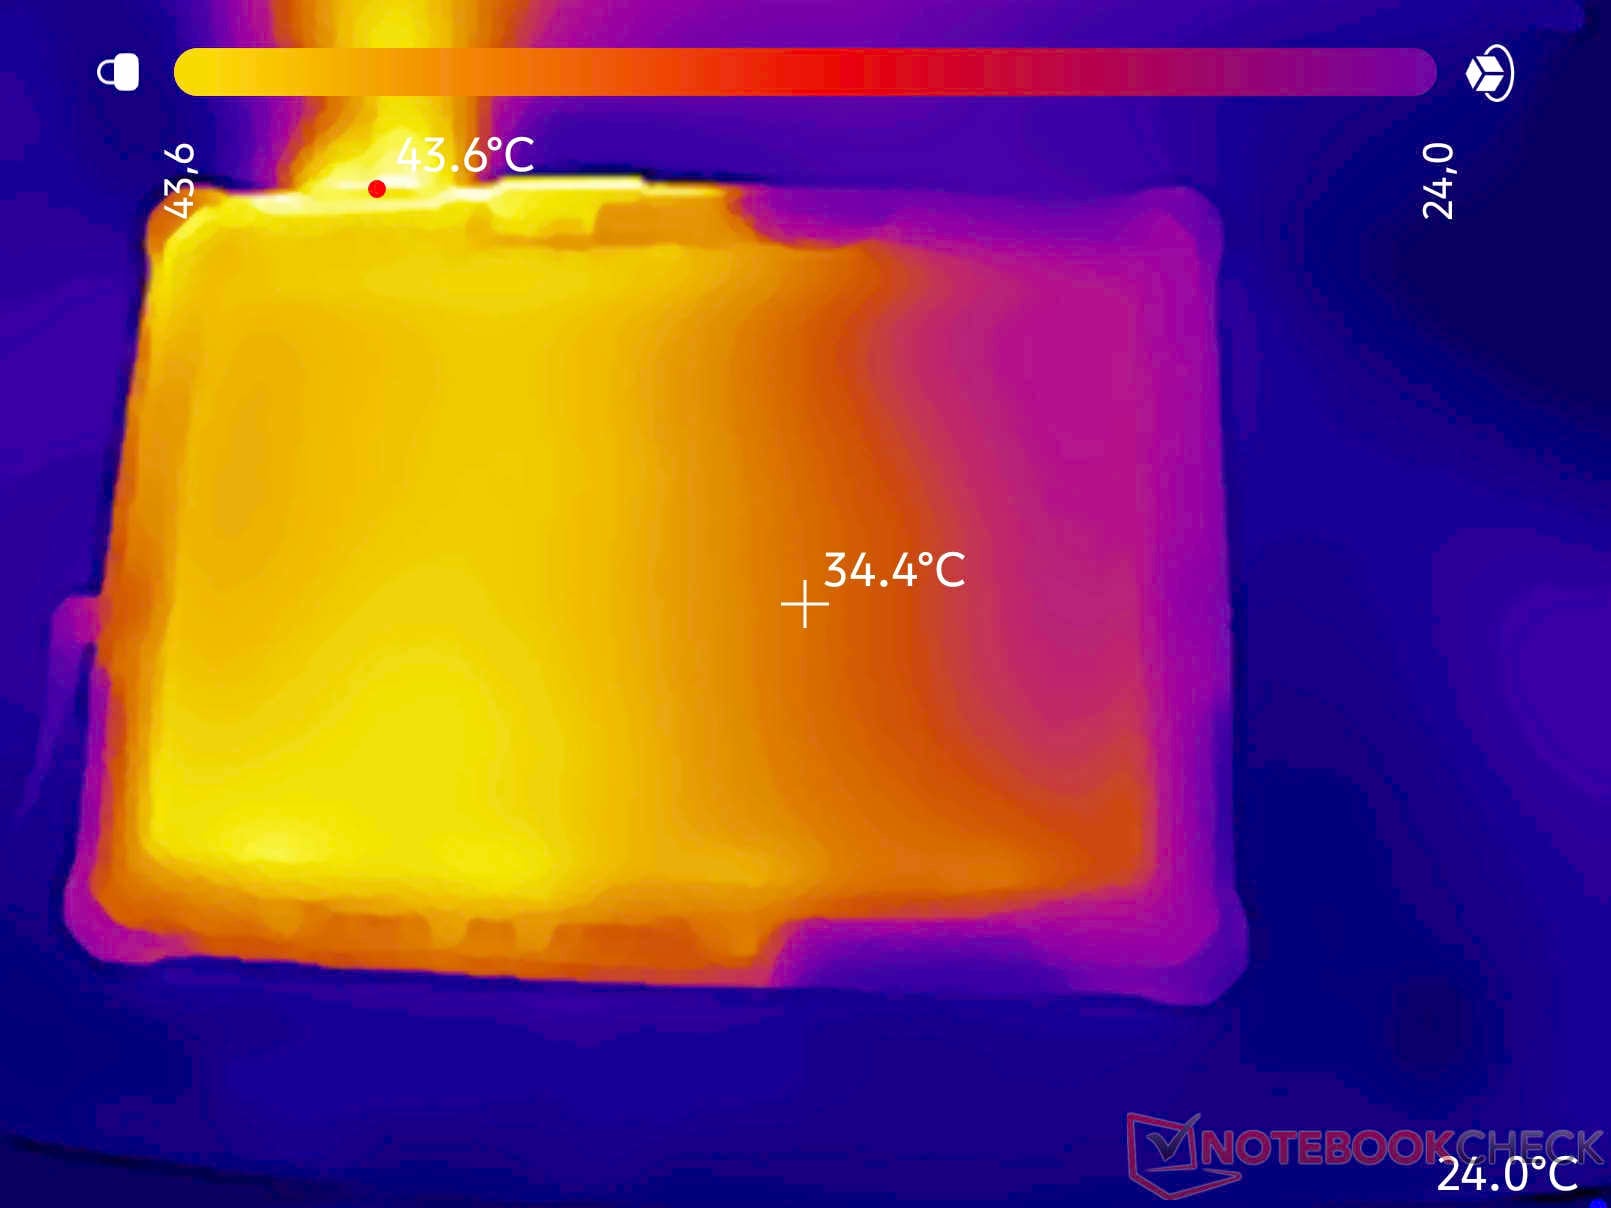
O sistema de resfriamento apresenta um desempenho excepcional. Durante o teste de carga, o tablet atinge temperaturas acima de 40 °C (104 °F) apenas em alguns pontos. O restante do chassi robusto permanece em uma temperatura agradável.
(±) A temperatura máxima no lado superior é 43.6 °C / 110 F, em comparação com a média de 33.6 °C / 92 F , variando de 20.7 a 53.2 °C para a classe Tablet.
(±) A parte inferior aquece até um máximo de 40 °C / 104 F, em comparação com a média de 33.2 °C / 92 F
(±) Em uso inativo, a temperatura média para o lado superior é 33.3 °C / 92 F, em comparação com a média do dispositivo de 30 °C / ### class_avg_f### F.
| Durabook R10 Core Ultra 7 258V, Arc 140V | Dell Latitude 7030 Rugged Extreme i7-1260U, Iris Xe G7 96EUs | Lenovo ThinkPad T14 Gen 6 21QG001VGE Core Ultra 7 258V, Arc 140V | Dynabook Portege Z40L-N Core Ultra 7 258V, Arc 140V | Durabook R8 Tablet i5-1230U, Iris Xe G7 80EUs | Lenovo ThinkPad T14 Gen 6 AMD Ryzen AI 7 PRO 350, Radeon 860M | |
|---|---|---|---|---|---|---|
| Heat | 11% | 16% | -2% | -0% | -3% | |
| Maximum Upper Side * (°C) | 43.6 | 37.2 15% | 39.7 9% | 41.2 6% | 38.2 12% | 47.7 -9% |
| Maximum Bottom * (°C) | 40 | 43.4 -9% | 38.1 5% | 38 5% | 49.6 -24% | 49.5 -24% |
| Idle Upper Side * (°C) | 36.1 | 26.4 27% | 24.3 33% | 35.4 2% | 32.2 11% | 30.7 15% |
| Idle Bottom * (°C) | 33.3 | 29.6 11% | 27.7 17% | 39.8 -20% | 33.4 -0% | 31.6 5% |
* ... menor é melhor
Palestrante
Os recursos de áudio do dispositivo são modestos. O alto-falante mono integrado na parte traseira do tablet atinge um volume máximo de 54 dB(A) e oferece uma qualidade de som bastante medíocre. Isso é suficiente para reproduzir os sons de alerta do sistema, pelo menos em ambientes silenciosos.
Durabook R10 análise de áudio
(-) | alto-falantes não muito altos (###valor### dB)
Graves 100 - 315Hz
(-) | quase nenhum baixo - em média 17.7% menor que a mediana
(±) | a linearidade dos graves é média (7.6% delta para a frequência anterior)
Médios 400 - 2.000 Hz
(+) | médios equilibrados - apenas 2.9% longe da mediana
(±) | a linearidade dos médios é média (13.7% delta para frequência anterior)
Altos 2 - 16 kHz
(+) | agudos equilibrados - apenas 4.7% longe da mediana
(±) | a linearidade dos máximos é média (10.2% delta para frequência anterior)
Geral 100 - 16.000 Hz
(-) | o som geral não é linear (31.3% diferença em relação à mediana)
Comparado com a mesma classe
» 90% de todos os dispositivos testados nesta classe foram melhores, 3% semelhantes, 7% piores
» O melhor teve um delta de 7%, a média foi 20%, o pior foi 129%
Comparado com todos os dispositivos testados
» 90% de todos os dispositivos testados foram melhores, 2% semelhantes, 8% piores
» O melhor teve um delta de 4%, a média foi 24%, o pior foi 134%
Apple MacBook Pro 16 2021 M1 Pro análise de áudio
(+) | os alto-falantes podem tocar relativamente alto (###valor### dB)
Graves 100 - 315Hz
(+) | bons graves - apenas 3.8% longe da mediana
(+) | o baixo é linear (5.2% delta para a frequência anterior)
Médios 400 - 2.000 Hz
(+) | médios equilibrados - apenas 1.3% longe da mediana
(+) | médios são lineares (2.1% delta para frequência anterior)
Altos 2 - 16 kHz
(+) | agudos equilibrados - apenas 1.9% longe da mediana
(+) | os máximos são lineares (2.7% delta da frequência anterior)
Geral 100 - 16.000 Hz
(+) | o som geral é linear (4.6% diferença em relação à mediana)
Comparado com a mesma classe
» 0% de todos os dispositivos testados nesta classe foram melhores, 0% semelhantes, 100% piores
» O melhor teve um delta de 5%, a média foi 17%, o pior foi 45%
Comparado com todos os dispositivos testados
» 0% de todos os dispositivos testados foram melhores, 0% semelhantes, 100% piores
» O melhor teve um delta de 4%, a média foi 24%, o pior foi 134%
Consumo de energia e duração da bateria
Em nosso teste de estresse, registramos um consumo máximo de energia de 55 watts. De longe, o maior consumo de energia é o da tela extremamente brilhante, que sobrecarrega significativamente a bateria ou o adaptador de energia. Sem estar conectado a uma tomada, a bateria proporcionou uma autonomia de oito horas durante a navegação contínua na internet via Wi-Fi em nosso teste. Graças ao recurso de troca a quente, a bateria pode ser substituída enquanto o dispositivo está em funcionamento. No interior do Durabook há uma pequena bateria, que fornece pouco mais de um minuto de energia e permite que a bateria seja substituída sem desligar o dispositivo. Para um uso ainda mais prolongado sem recarga ou substituição da bateria, o fabricante também oferece uma bateria de alta capacidade, embora ela se projete significativamente do dispositivo.
| desligado | |
| Ocioso | |
| Carga |
|
Key:
min: | |
Consumo de energia no Cyberpunk / Teste de estresse
Consumo de energia com um monitor externo
| Durabook R10 Core Ultra 7 258V, Arc 140V, 48 Wh | Dell Latitude 7030 Rugged Extreme i7-1260U, Iris Xe G7 96EUs, 36 Wh | Lenovo ThinkPad T14 Gen 6 21QG001VGE Core Ultra 7 258V, Arc 140V, 57 Wh | Dynabook Portege Z40L-N Core Ultra 7 258V, Arc 140V, 56 Wh | Durabook R8 Tablet i5-1230U, Iris Xe G7 80EUs, 27.4 Wh | Lenovo ThinkPad T14 Gen 6 AMD Ryzen AI 7 PRO 350, Radeon 860M, 57 Wh | Média da turma Tablet | |
|---|---|---|---|---|---|---|---|
| Battery Runtime | |||||||
| WiFi Websurfing (h) | 8.4 | 6.1 -27% | 19.4 131% | 19.1 127% | 5.3 -37% | 13.8 64% | 15.8 ? 88% |
| Duração da bateria | -27% | 131% | 127% | -37% | 64% | 88% | |
| WiFi v1.3 (h) | 8.4 | 6.1 -27% | 19.4 131% | 19.1 127% | 5.3 -37% | 13.8 64% | 15.8 ? 88% |
| Load (h) | 1.6 | 1.1 | 4.16 ? | ||||
| Média Total (Programa/Configurações) | -27% /
-27% | 131% /
131% | 127% /
127% | -37% /
-37% | 64% /
64% | 88% /
88% |
| Durabook R10 Core Ultra 7 258V, Arc 140V, 48 Wh | Dell Latitude 7030 Rugged Extreme i7-1260U, Iris Xe G7 96EUs, 36 Wh | Lenovo ThinkPad T14 Gen 6 21QG001VGE Core Ultra 7 258V, Arc 140V, 57 Wh | Dynabook Portege Z40L-N Core Ultra 7 258V, Arc 140V, 56 Wh | Durabook R8 Tablet i5-1230U, Iris Xe G7 80EUs, 27.4 Wh | Lenovo ThinkPad T14 Gen 6 AMD Ryzen AI 7 PRO 350, Radeon 860M, 57 Wh | Média da turma Tablet | |
|---|---|---|---|---|---|---|---|
| Duração da bateria | -27% | 131% | 127% | -37% | 64% | 88% | |
| WiFi v1.3 (h) | 8.4 | 6.1 -27% | 19.4 131% | 19.1 127% | 5.3 -37% | 13.8 64% | 15.8 ? 88% |
| Load (h) | 1.6 | 1.1 | 4.16 ? |
Avaliação geral do Notebookcheck
O Durabook R10 é um verdadeiro peso-pesado projetado para ambientes de trabalho extremos. Suas certificações de padrões militares, tela brilhante e fonte de alimentação ininterrupta são verdadeiramente impressionantes. No entanto, o desempenho da CPU abaixo da média, a alta latência e uma tela levemente esverdeada exigem algumas concessões.
Durabook R10
- 06/18/2026 v8
Marc Herter
 Total Sustainability Score:
 Uma comparação entre as alternativas possíveis
Imagem | Modelo / Análises | Preço | Peso | Altura | Tela |
|---|---|---|---|---|---|
1. 76.5% 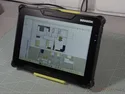 | Durabook R10 Intel Core Ultra 7 258V ⎘ Intel Arc Graphics 140V ⎘ 32 GB Memória | Amazon: 1. $14.99 ZBAGUG for Durabook R10 Tabl... 2. $17.99 ZBAGUG 2-Pack for Durabook R... | 1.3 kg | 29 mm | 10.10" 1920x1200 224 PPI TFT |
2. 82.3% 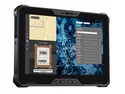 | Dell Latitude 7030 Rugged Extreme Intel Core i7-1260U ⎘ Intel Iris Xe Graphics G7 96EUs ⎘ 32 GB Memória, 1024 GB SSD | Amazon: 1. $2,049.00 Dell Latitude Rugged Extreme... 2. $2,199.00 Dell Latitude 7330 Rugged Ex... 3. $1,850.00 Dell Latitude Rugged Extreme... Preço de tabela: 3000 USD | 1.1 kg | 25.4 mm | 10.00" 1920x1200 226 PPI IPS |
3. 79.6% v7 (old)  | Durabook R8 Tablet Intel Core i5-1230U ⎘ Intel Iris Xe Graphics G7 80EUs ⎘ 8 GB Memória, 128 GB SSD | Amazon: 1. $38.99 PowerHOOD DC19V AC Power Ada... 2. $39.95 BoxWave Screen Protector Com... 3. $39.95 BoxWave Screen Protector Com... | 856 g | 20.6 mm | 8.00" 1280x800 189 PPI IPS |
Transparência
A seleção dos dispositivos a serem analisados é feita pela nossa equipe editorial. A amostra de teste foi fornecida ao autor como empréstimo pelo fabricante ou varejista para fins desta revisão. O credor não teve influência nesta revisão, nem o fabricante recebeu uma cópia desta revisão antes da publicação. Não houve obrigação de publicar esta revisão. Como empresa de mídia independente, a Notebookcheck não está sujeita à autoridade de fabricantes, varejistas ou editores.
É assim que o Notebookcheck está testando
Todos os anos, o Notebookcheck analisa de forma independente centenas de laptops e smartphones usando procedimentos padronizados para garantir que todos os resultados sejam comparáveis. Desenvolvemos continuamente nossos métodos de teste há cerca de 20 anos e definimos padrões da indústria no processo. Em nossos laboratórios de teste, equipamentos de medição de alta qualidade são utilizados por técnicos e editores experientes. Esses testes envolvem um processo de validação em vários estágios. Nosso complexo sistema de classificação é baseado em centenas de medições e benchmarks bem fundamentados, o que mantém a objetividade.