Avaliação do HP Envy x360 2 em 1 16: Ryzen 7 8840HS supera o Core Ultra 7 155U

A série Envy é a família de gama média da HP que fica entre a série Pavilion, mais barata, e a série Spectre, mais cara. Nesse caso, o novo Envy x360 16 pode ser visto como a versão econômica do Spectre x360 16 mas com opções mais robustas e recursos mais luxuosos do que o Pavilion x360 15.
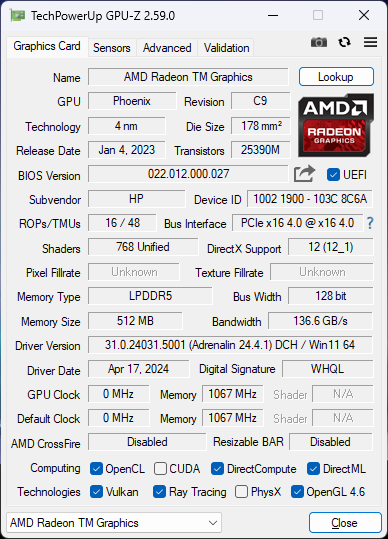
Nossa unidade de teste em análise vem com a CPU AMD Ryzen 7 8840HS, gráficos Radeon 780M integrados e tela sensível ao toque OLED 1800p de 120 Hz por aproximadamente US$ 1300 no varejo. As versões Intel também estão disponíveis com o Core Ultra 5 125U ou Ultra 7 155U de 14ª geração e tela sensível ao toque IPS de 1200p, mas todas as configurações vêm apenas com gráficos integrados. Esse design mais recente do Envy x360 16 substitui efetivamente o Envy x360 15 do ano passado.
Os concorrentes incluem outros notebooks multimídia de 16 polegadas, como o Lenovo Yoga 7 2 em 1 16IML9, Samsung Galaxy Book4 Pro 360ou LG Gram 2 em 1 16.
Mais análises da HP:
Possíveis concorrentes em comparação
Avaliação | Data | Modelo | Peso | Altura | Size | Resolução | Preço |
|---|---|---|---|---|---|---|---|
| 87.2 % v7 (old) | 05/2024 | HP Envy x360 2-in-1 16-ad0097nr R7 8840HS, Radeon 780M | 1.8 kg | 18.3 mm | 16.00" | 2880x1800 | |
| 86.9 % v7 (old) | 09/2022 | HP Envy 16 h0112nr i7-12700H, GeForce RTX 3060 Laptop GPU | 2.3 kg | 19.8 mm | 16.00" | 3840x2400 | |
| 91.1 % v7 (old) | 03/2024 | HP Spectre x360 16 RTX 4050 Ultra 7 155H, GeForce RTX 4050 Laptop GPU | 2 kg | 19.8 mm | 16.00" | 2880x1800 | |
| 86.7 % v7 (old) | 04/2024 | Lenovo Yoga 7 2-in-1 16IML9 Ultra 5 125U, Graphics 4-Core iGPU (Arrow Lake) | 2.1 kg | 16.99 mm | 16.00" | 1920x1200 | |
| 87.8 % v7 (old) | 03/2024 | Samsung Galaxy Book4 Pro 360 Ultra 5 125H, Arc 7-Core | 1.7 kg | 13 mm | 16.00" | 2880x1800 | |
| 85.8 % v7 (old) | 11/2023 | LG Gram 2in1 16 16T90R - G.AA78G i7-1360P, Iris Xe G7 96EUs | 1.5 kg | 17.2 mm | 16.00" | 2560x1600 |
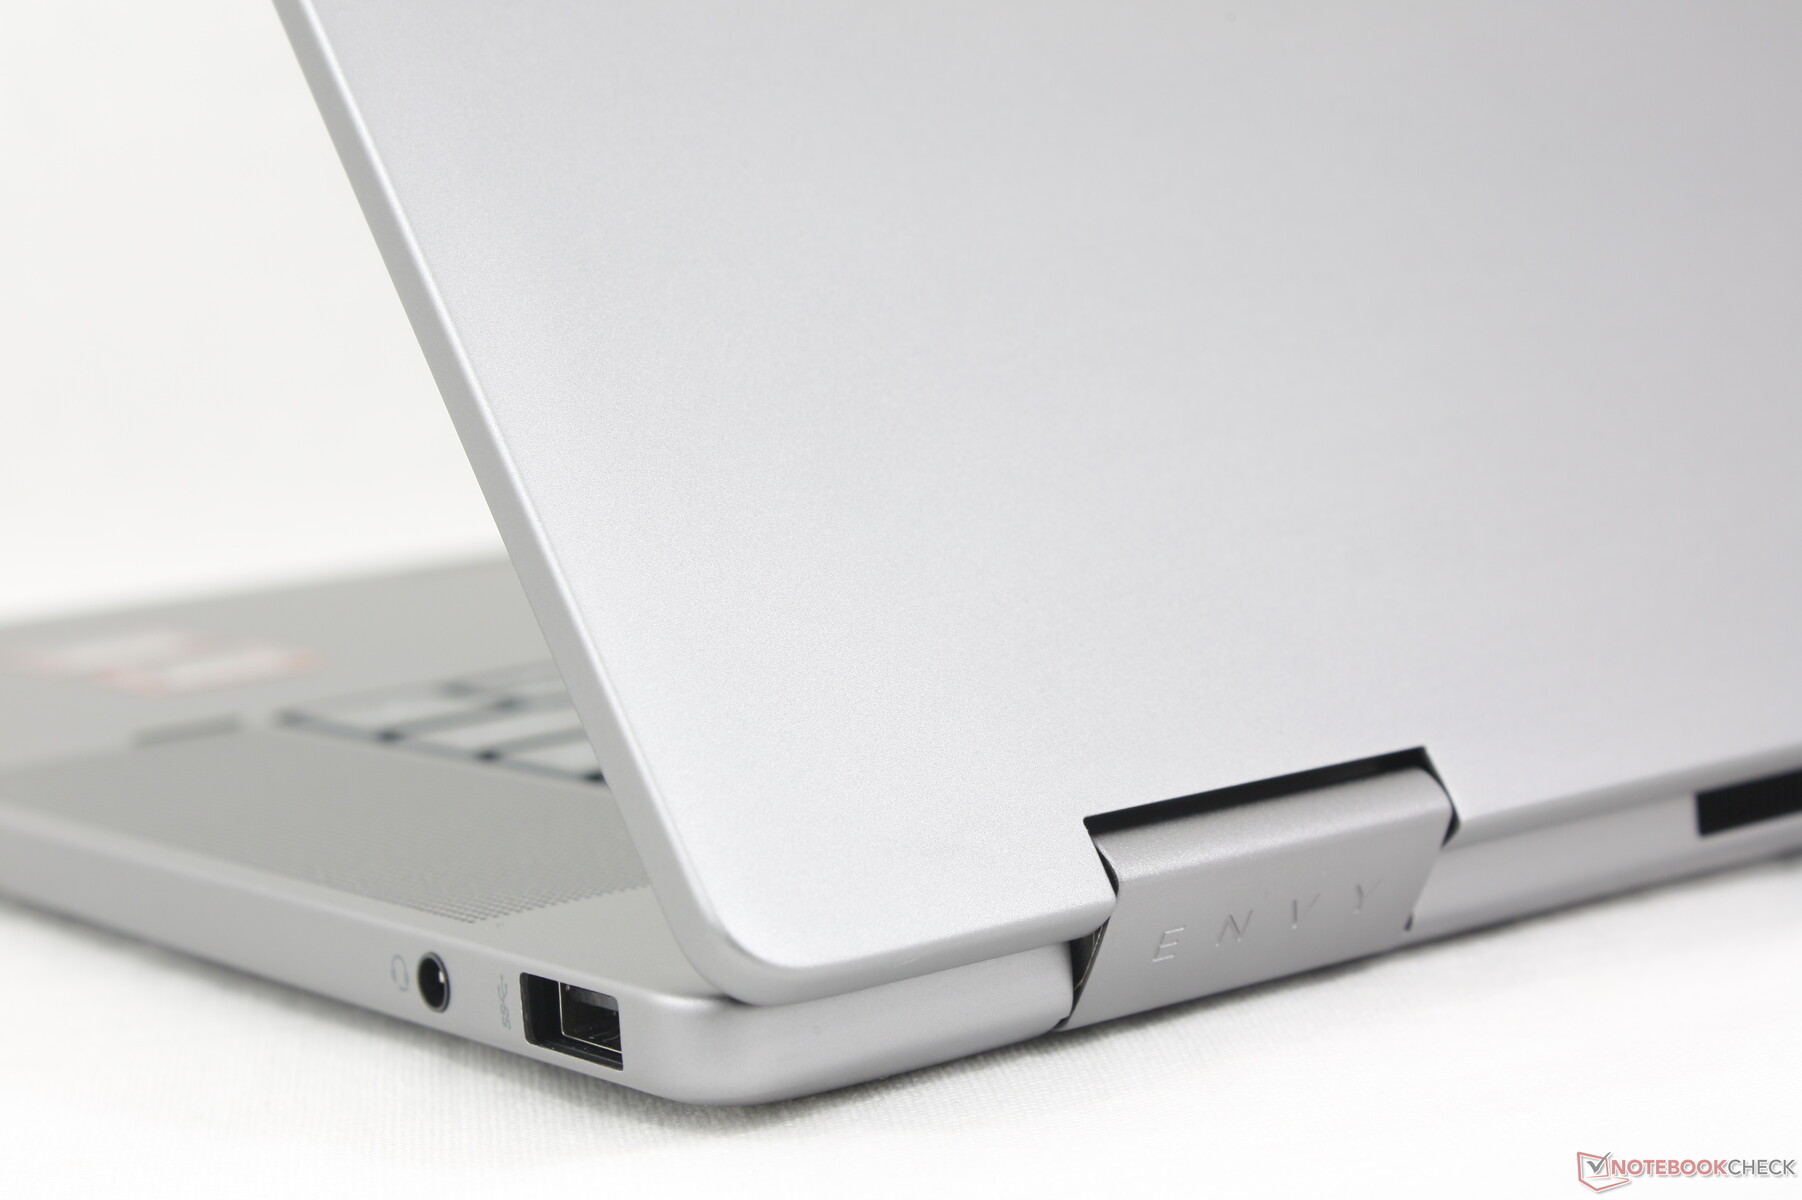
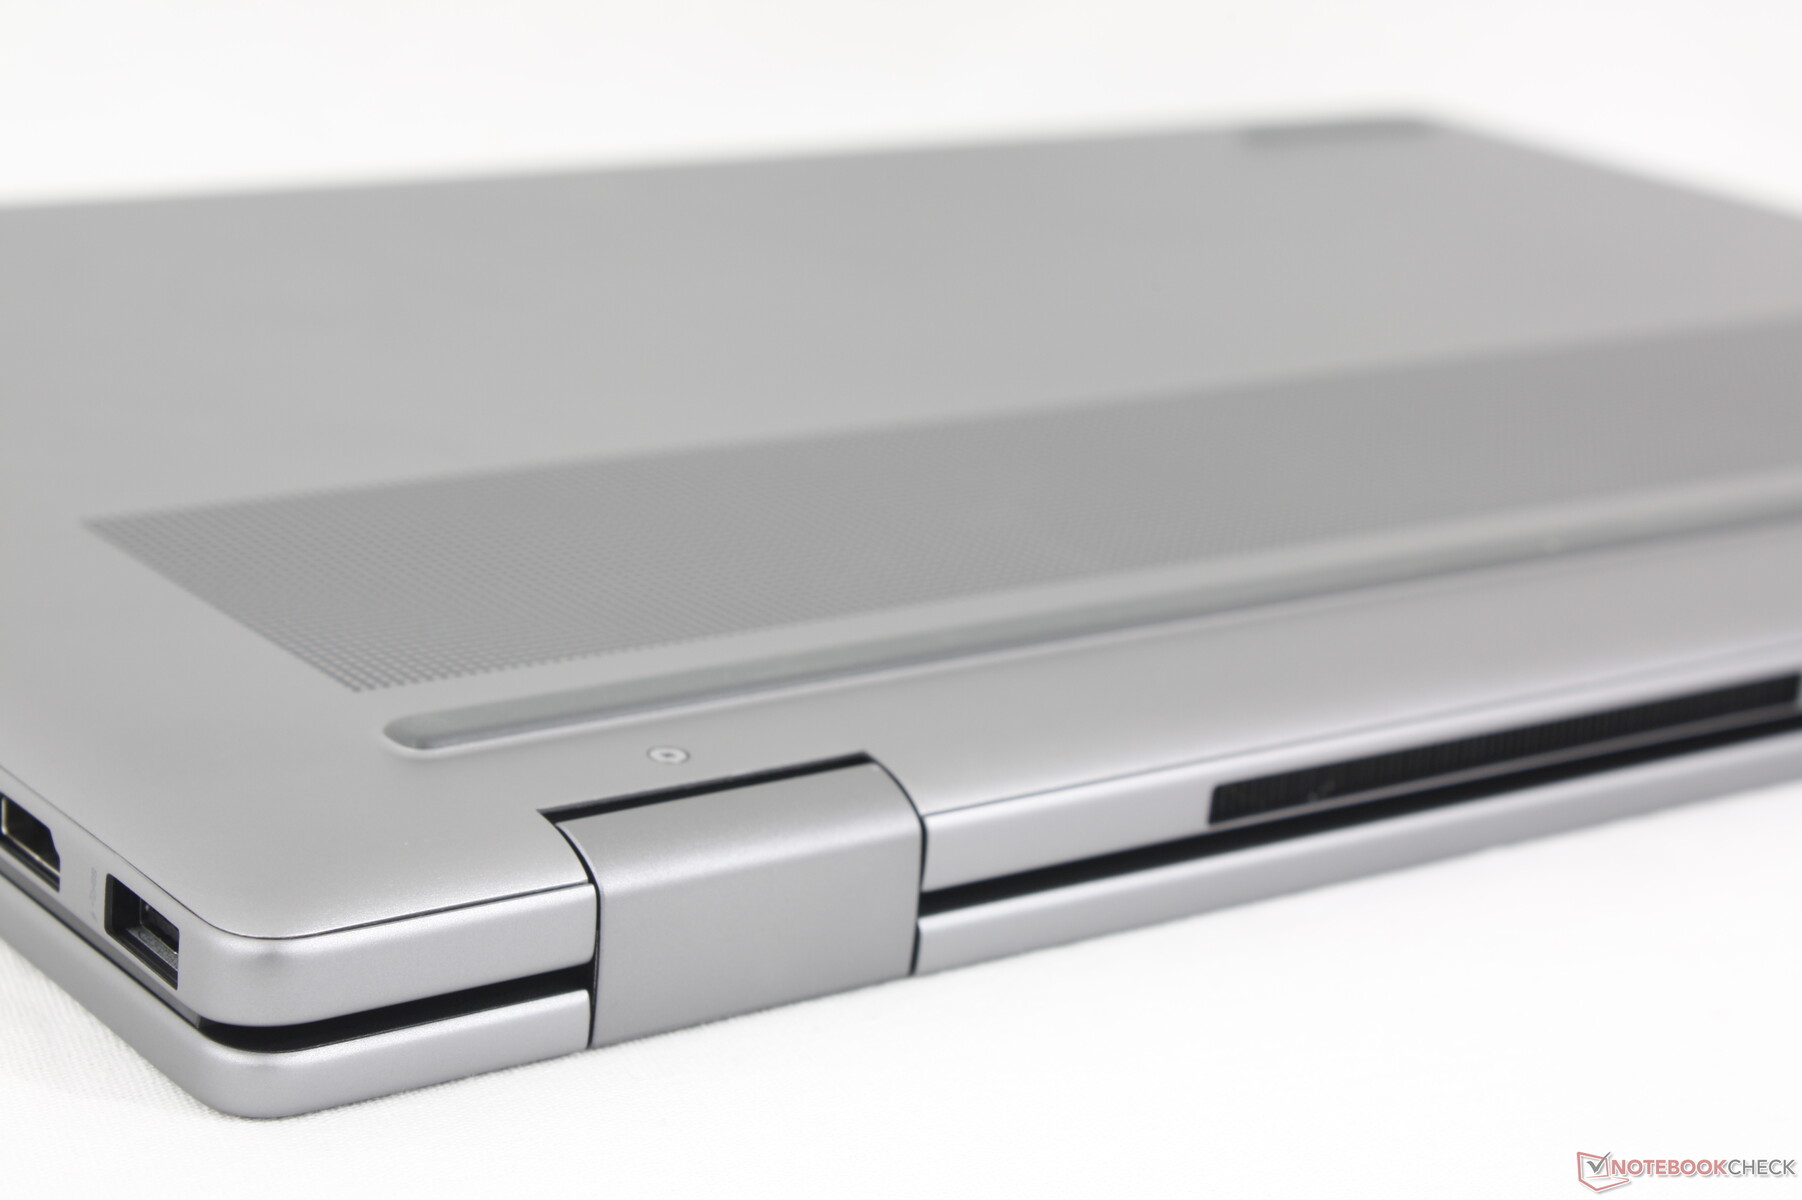
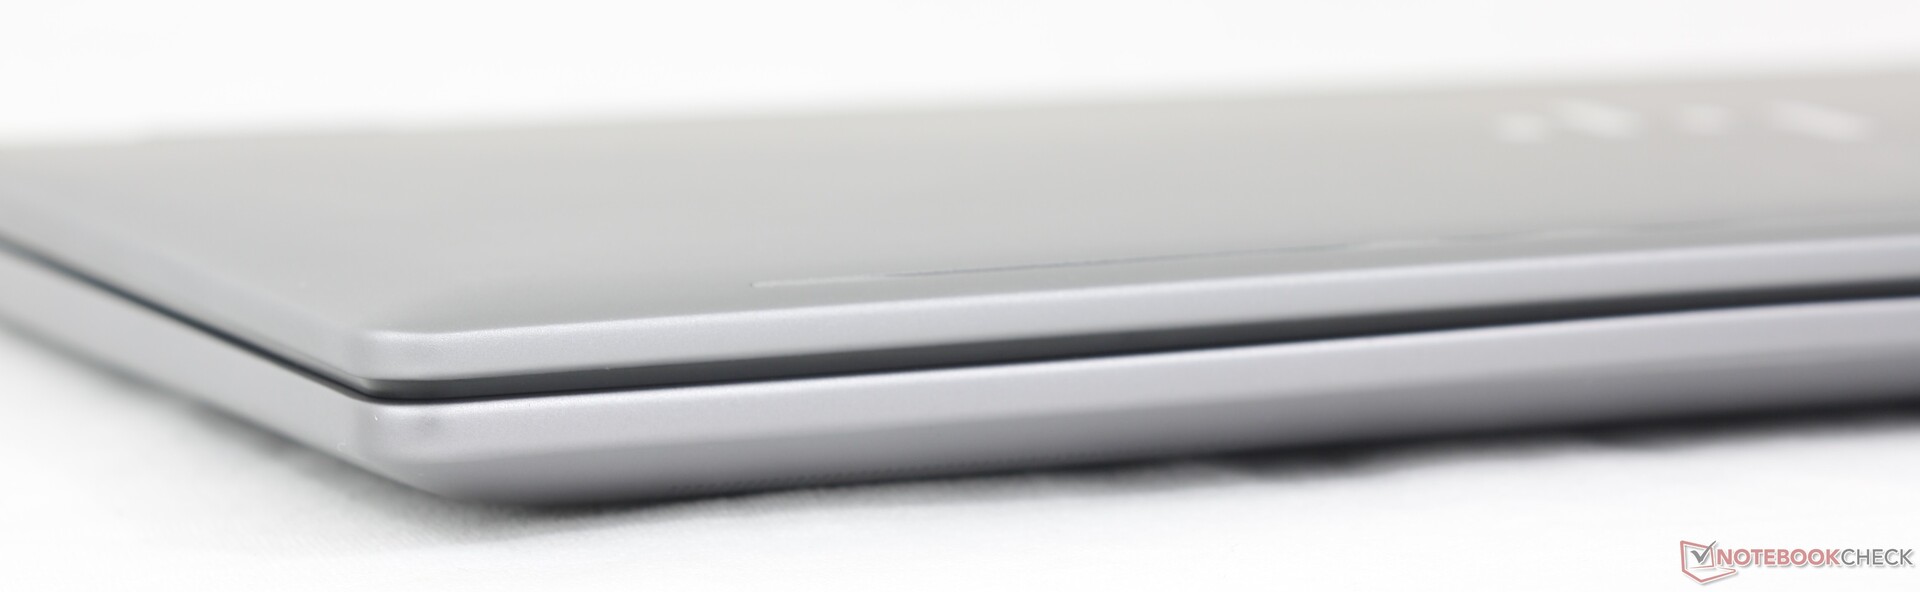
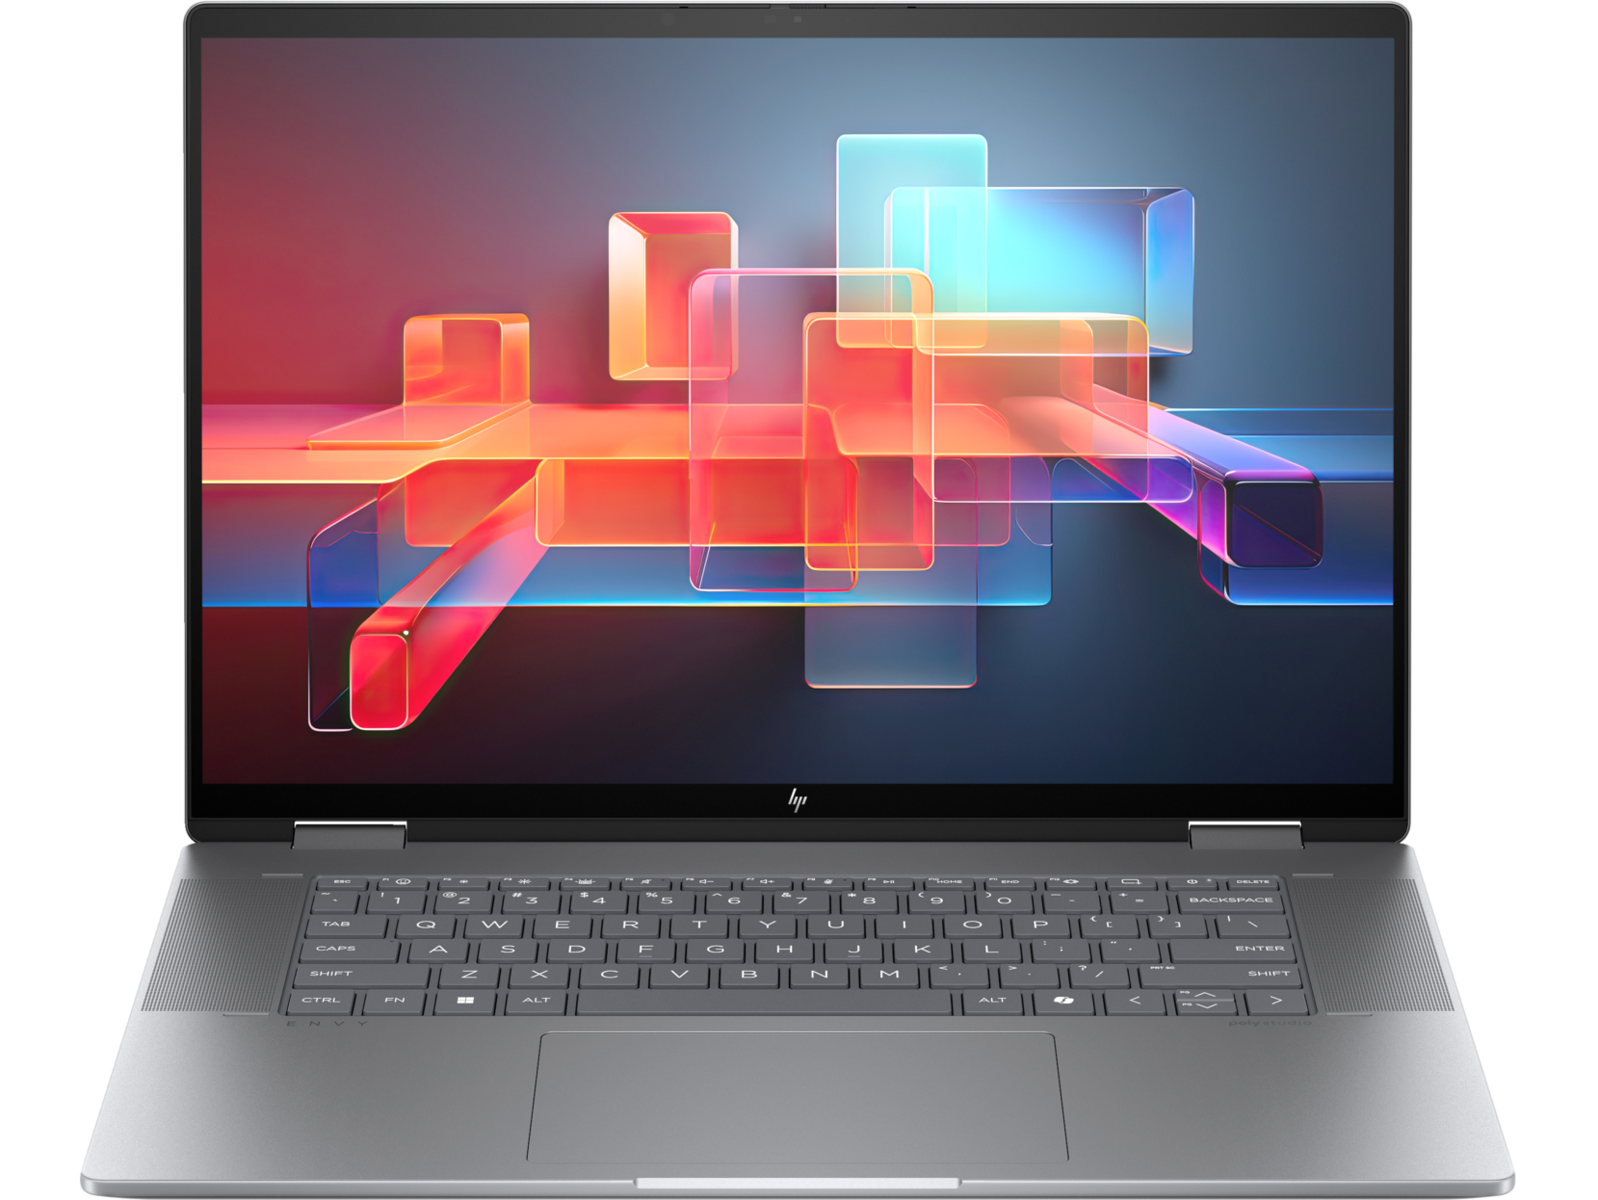
Estojo - Smooth Silver
A estrutura consiste em materiais de alumínio e teclas de plástico semelhantes aos do Envy x360 15 para uma aparência semelhante. As superfícies são rígidas e de alta qualidade, mesmo que não pareçam tão luxuosas quanto o design do Spectre. O chassi cede um pouco mais do que no Spectre ao aplicar pressão no centro do teclado ou ao tentar girar a base, mas não é visivelmente pior ou melhor do que o Yoga 7 2 em 1 16IML9.
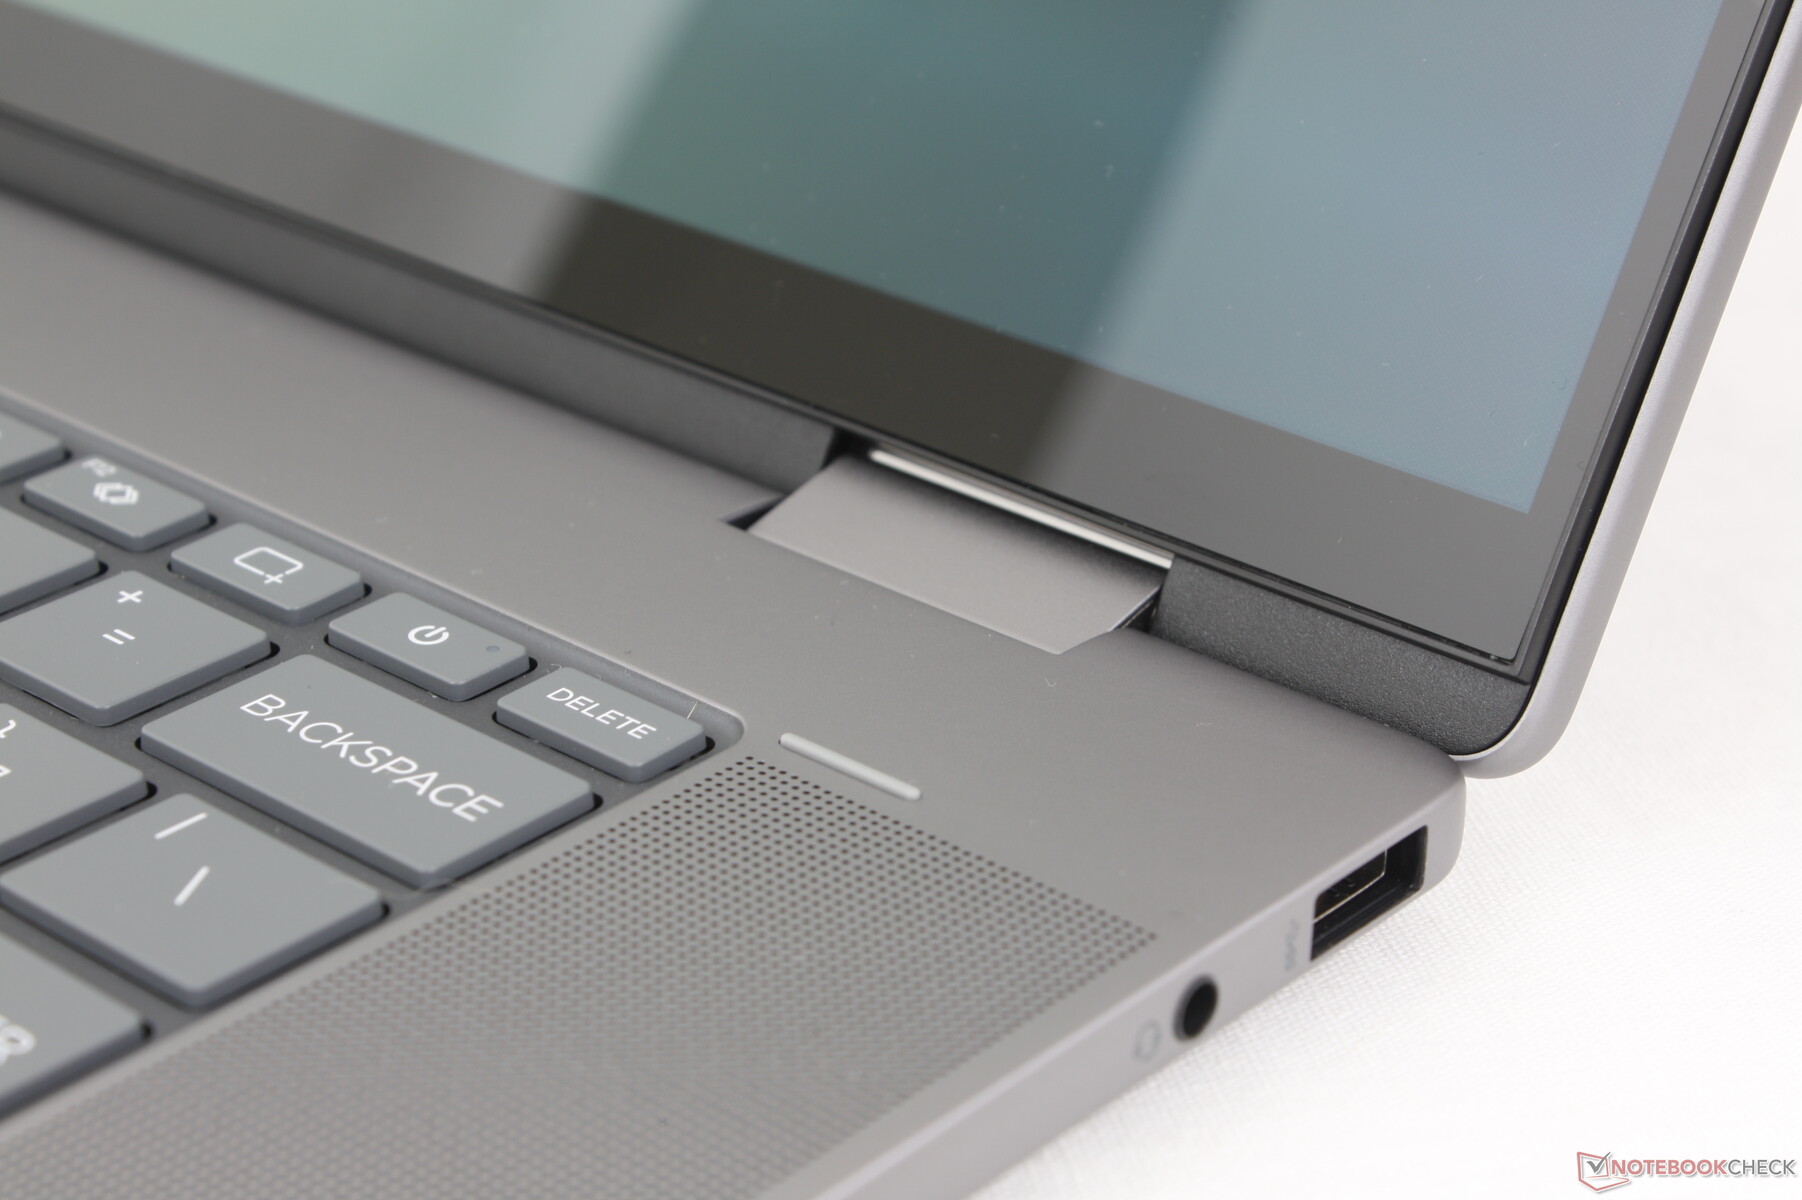
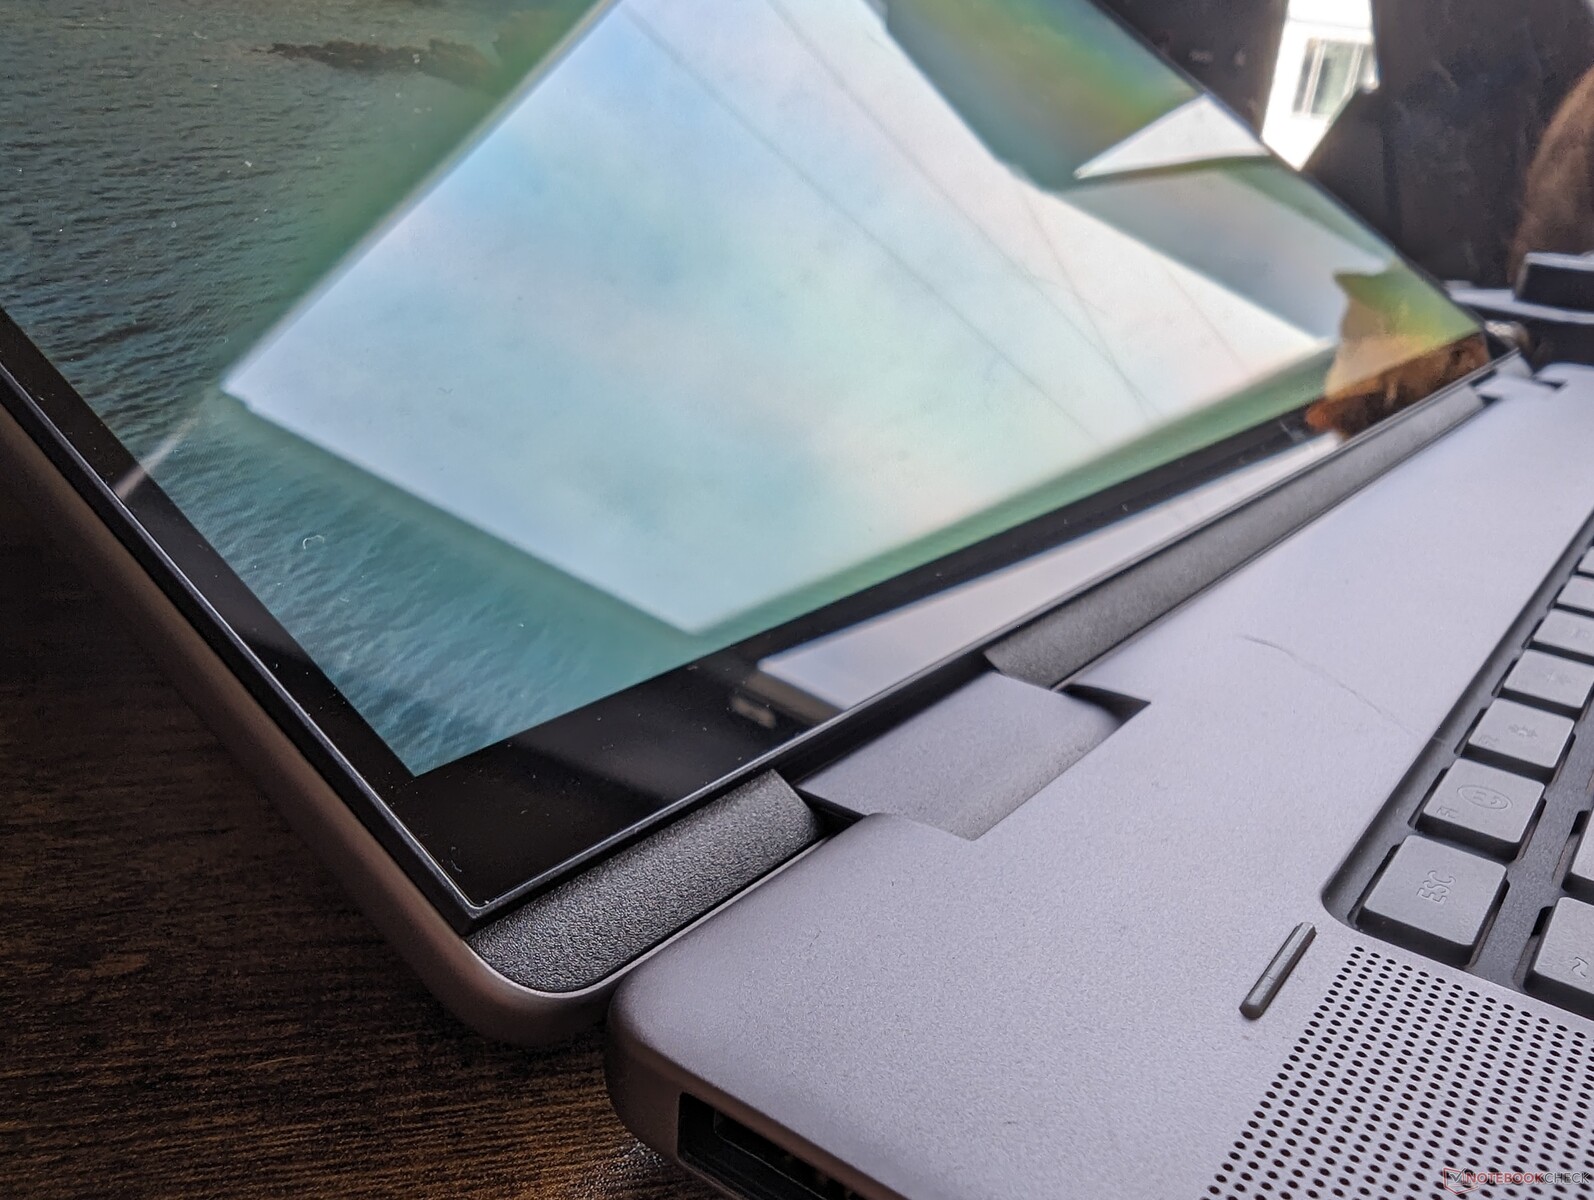
Uma diferença notável entre o Envy x360 16 e seus irmãos menores é a plataforma do teclado, que agora fica mais baixa do que as grades dos alto-falantes e os apoios para as mãos ao redor, enquanto as plataformas do teclado no Envy x360 15 ou no Spectre x360 16 ficam mais altas. A nova estética faz com que o design do Envy x360 16 pareça mais "parecido com o MacBook Pro" à primeira vista.
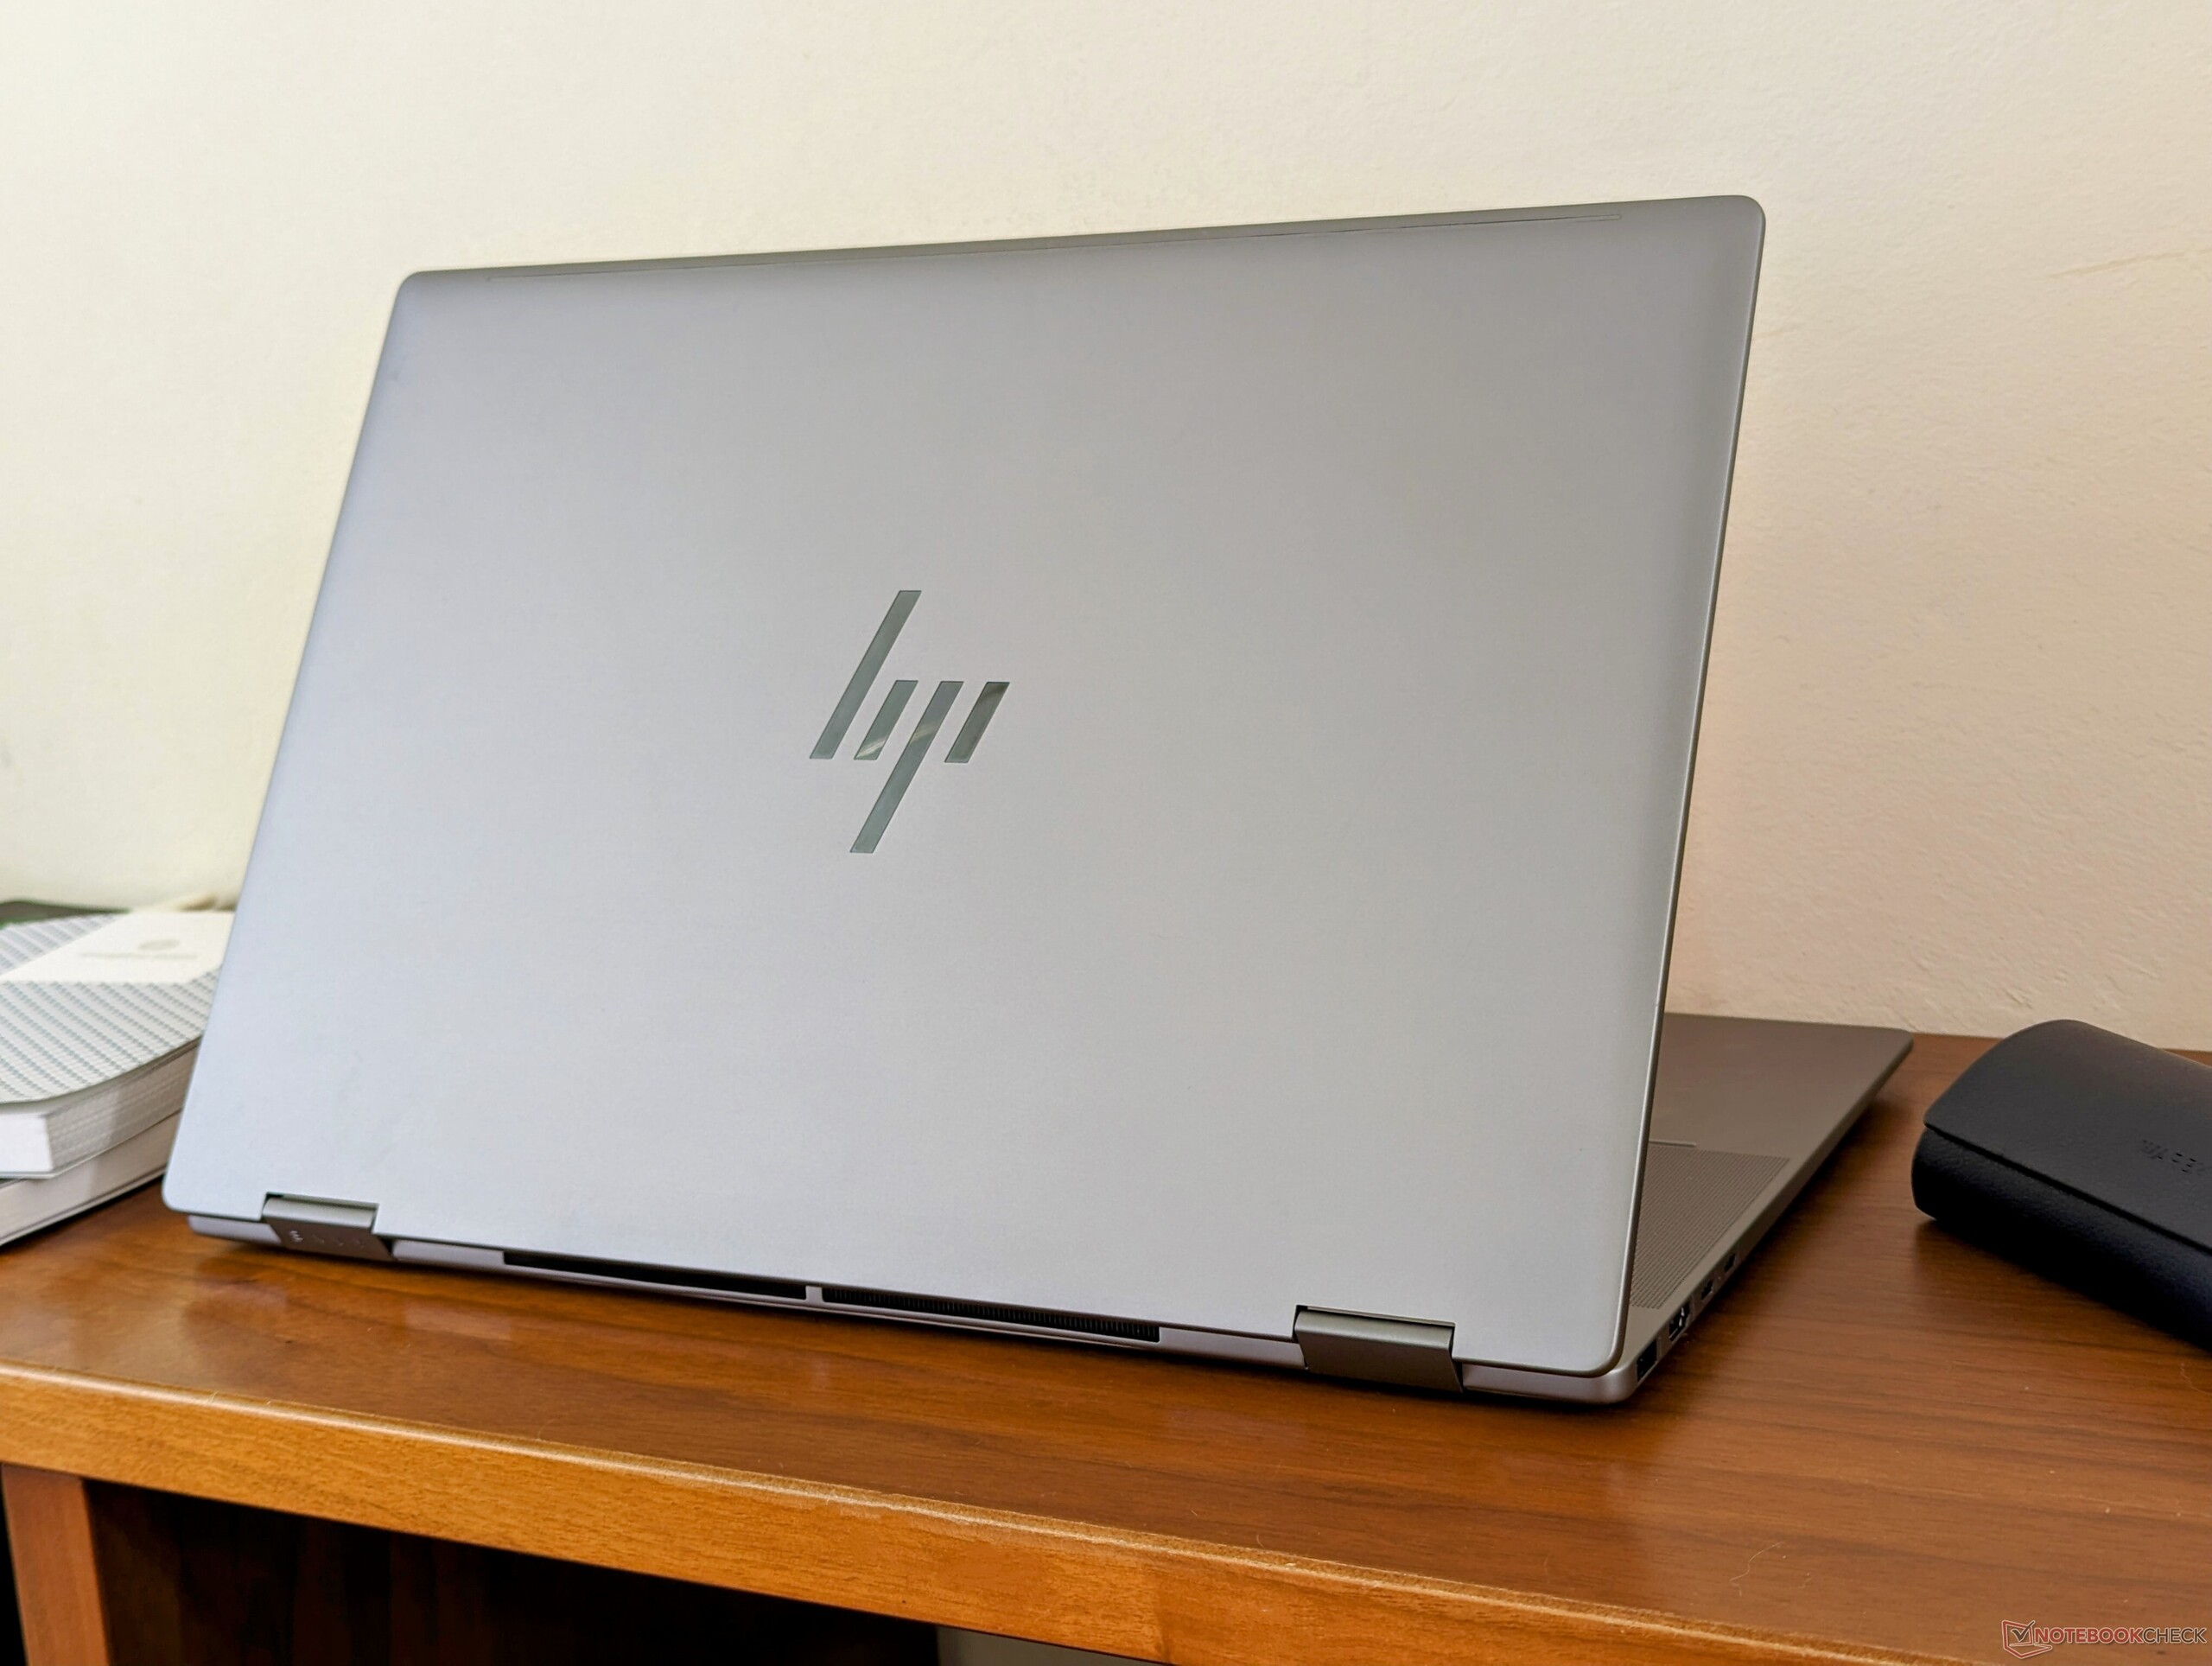
O novo modelo é mais espesso e maior do que o Envy x360 15, enquanto o peso permanece praticamente o mesmo. Talvez o mais notável seja o fato de que o Envy x360 16 é quase idêntico ao Specture x360 16, mais caro, em todas as três dimensões, o que significa que ele não é menos fácil de transportar, apesar das diferenças de preço.
Estranhamente, há apenas uma opção de cor para o novo conversível Envy, independentemente da configuração. Em comparação, os modelos menores do Envy x360 têm uma alternativa de cor Nightfall Black Aluminum para acompanhar a cor prata usual. Opções multicoloridas teriam ajudado a distinguir visualmente entre as SKUs Intel e AMD da série Envy x360 16.
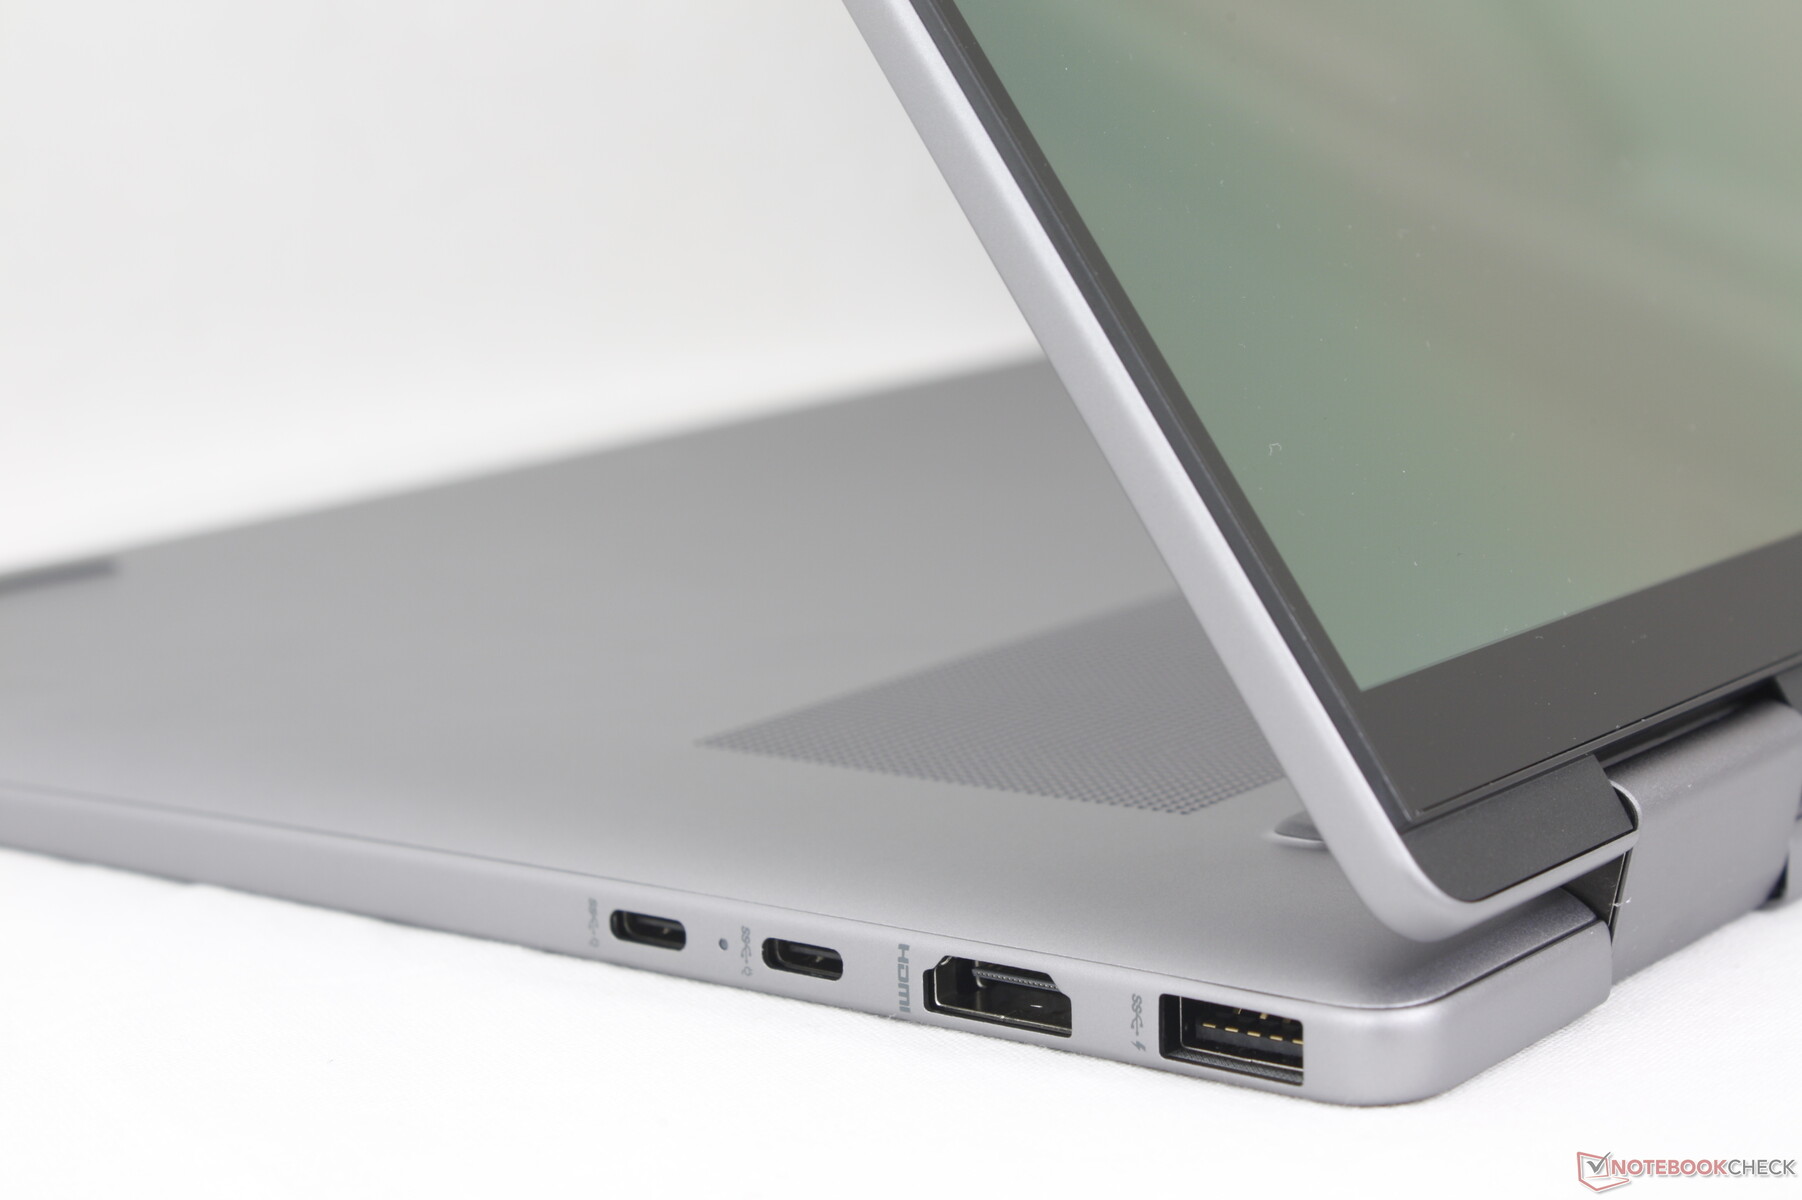
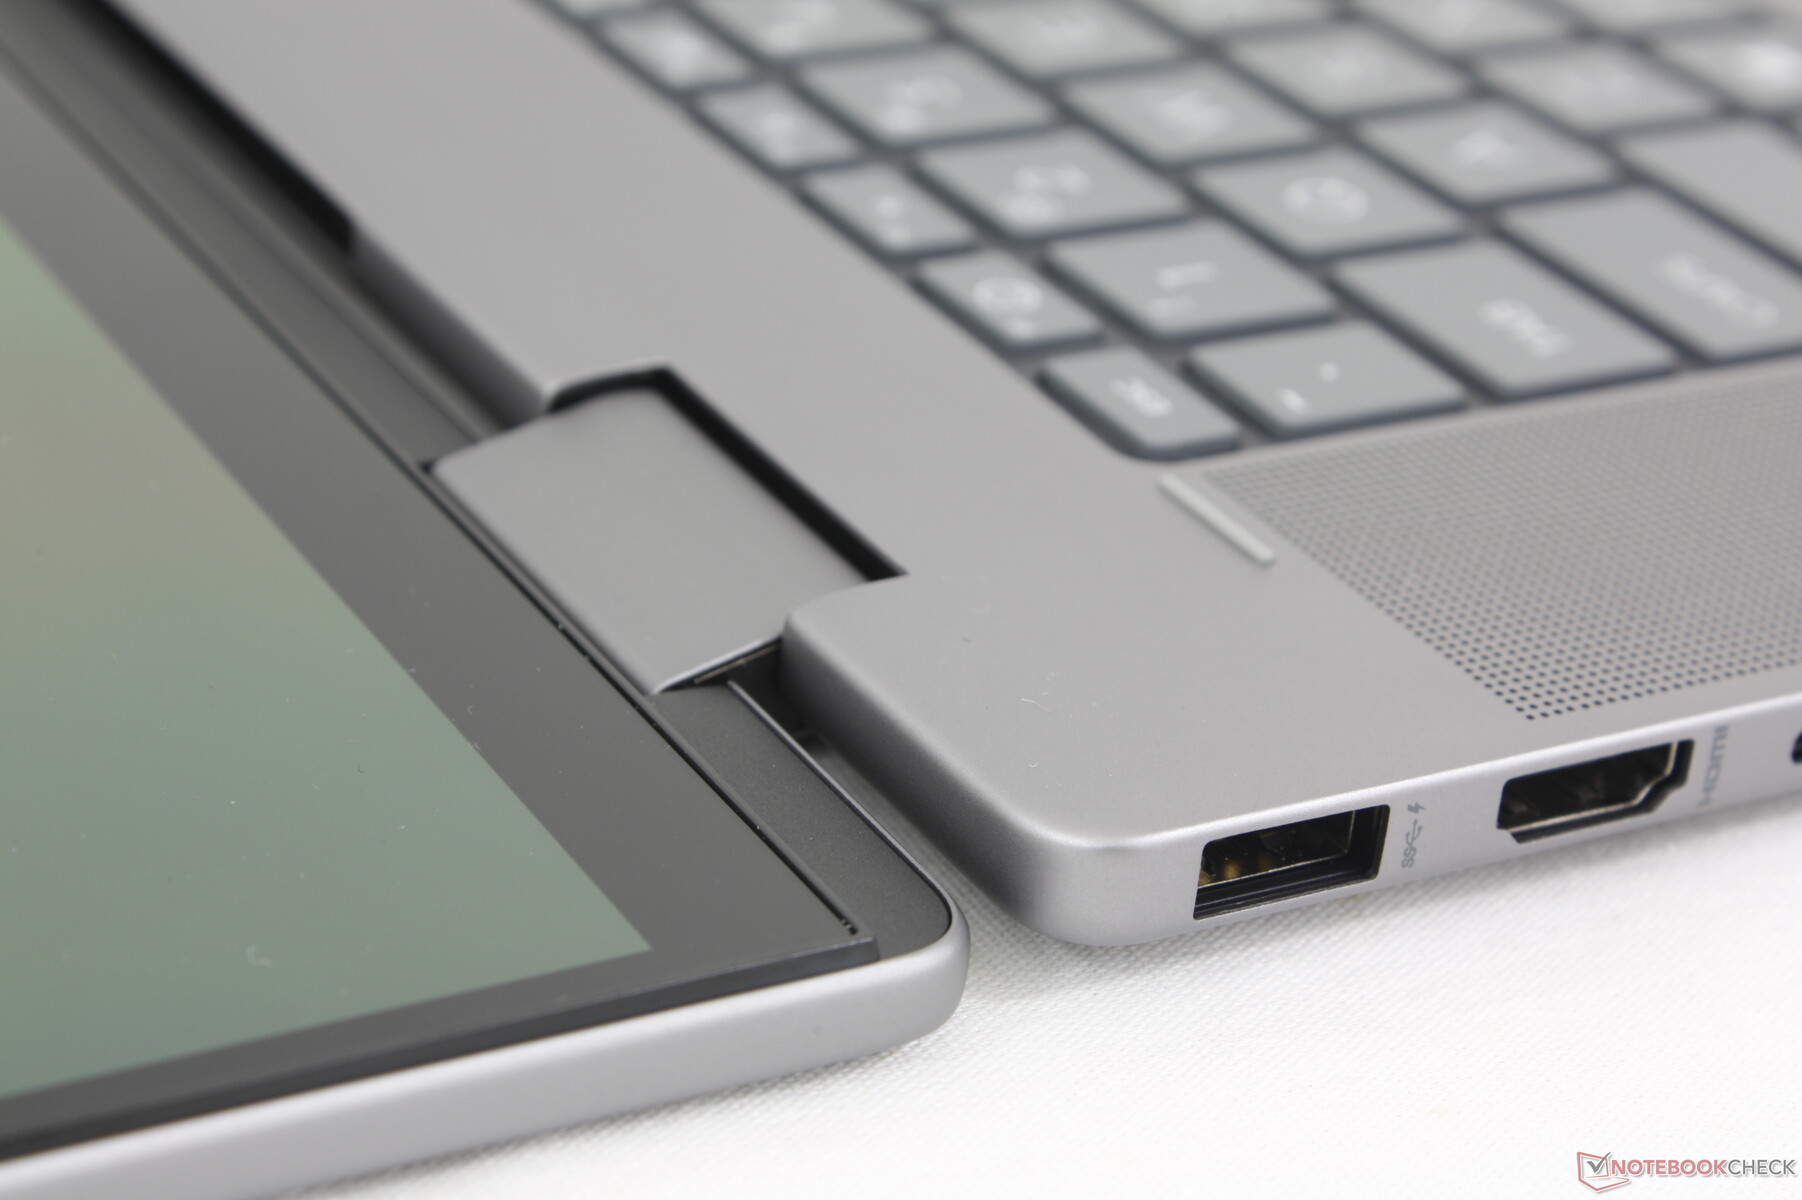
Conectividade - Sem Thunderbolt ou USB4 para a AMD
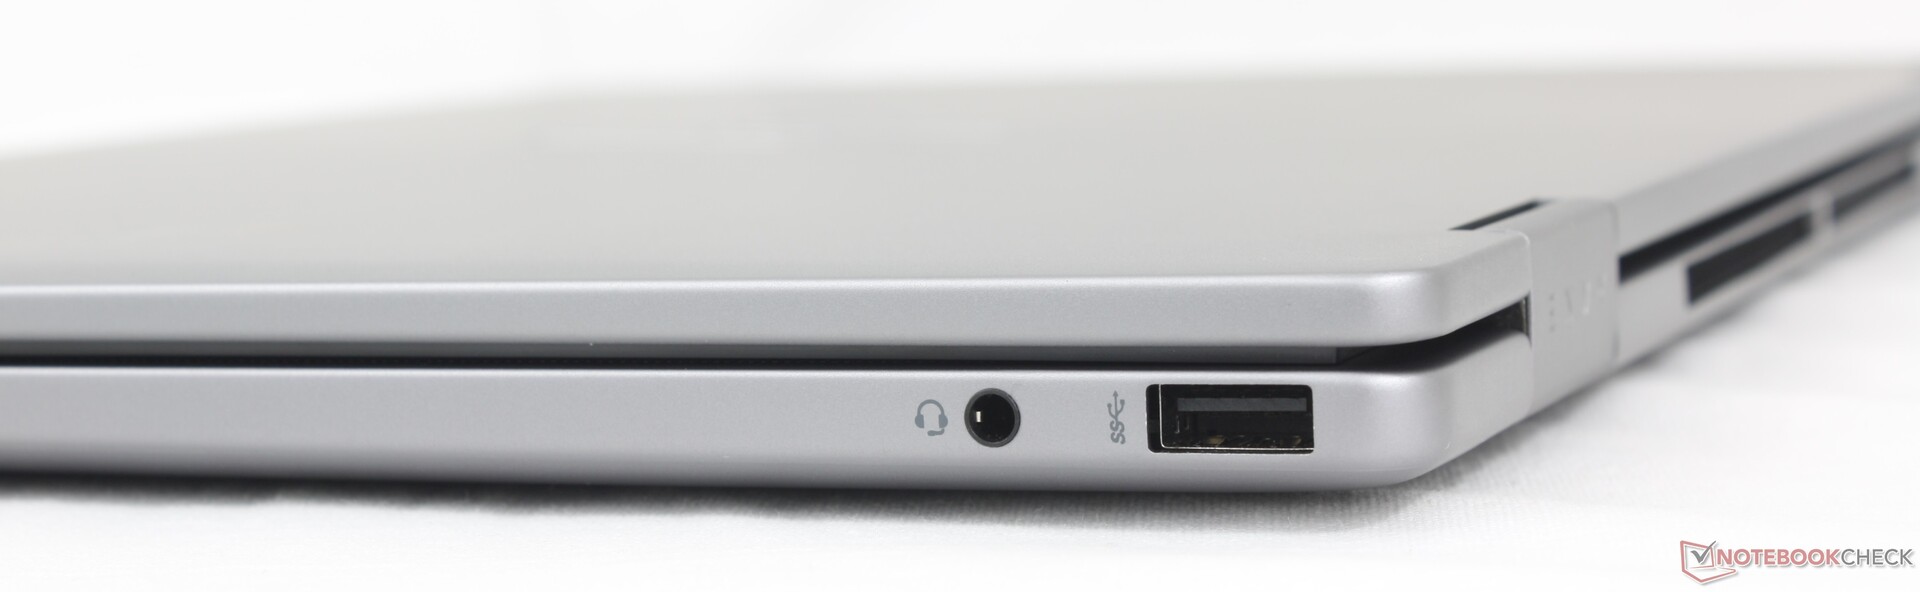
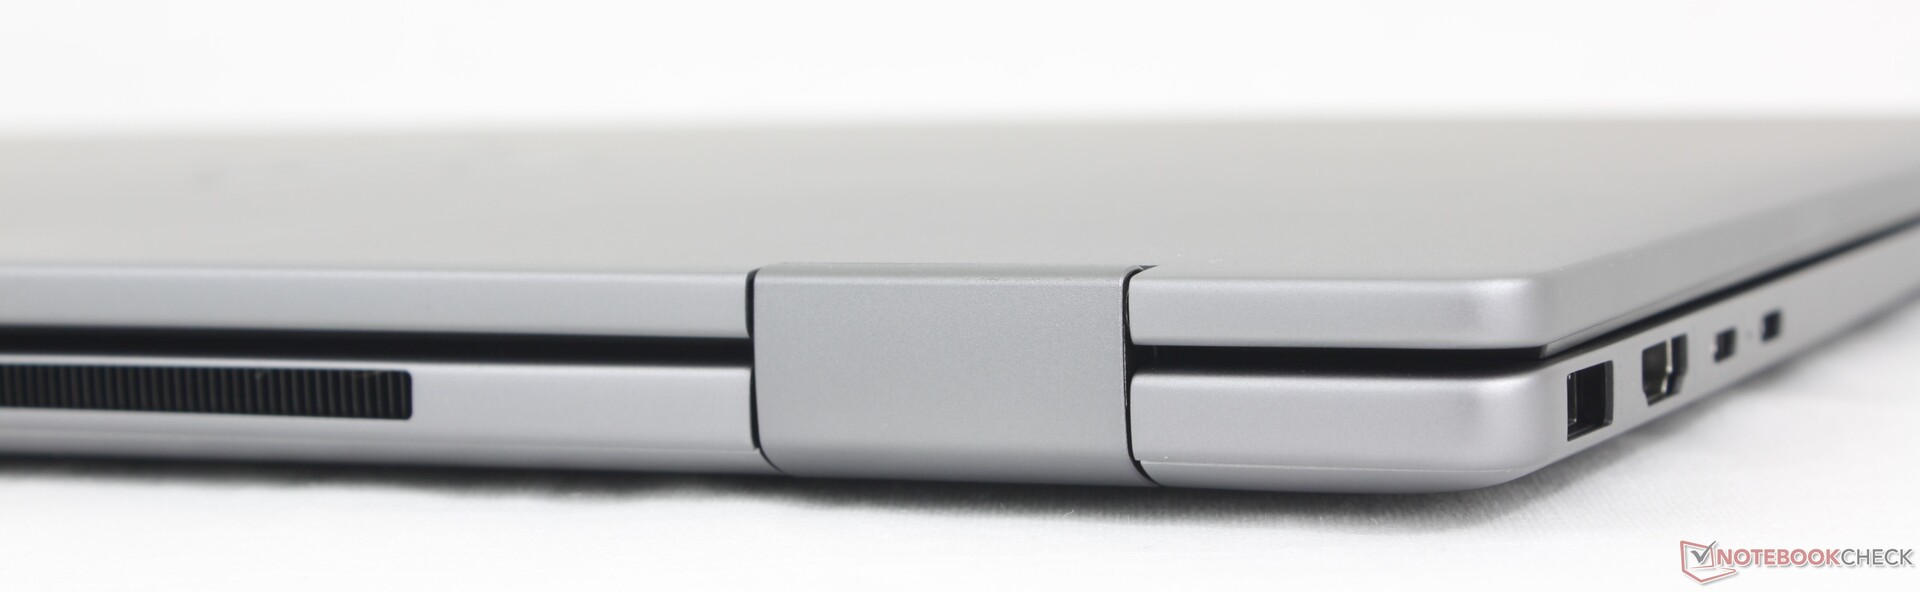
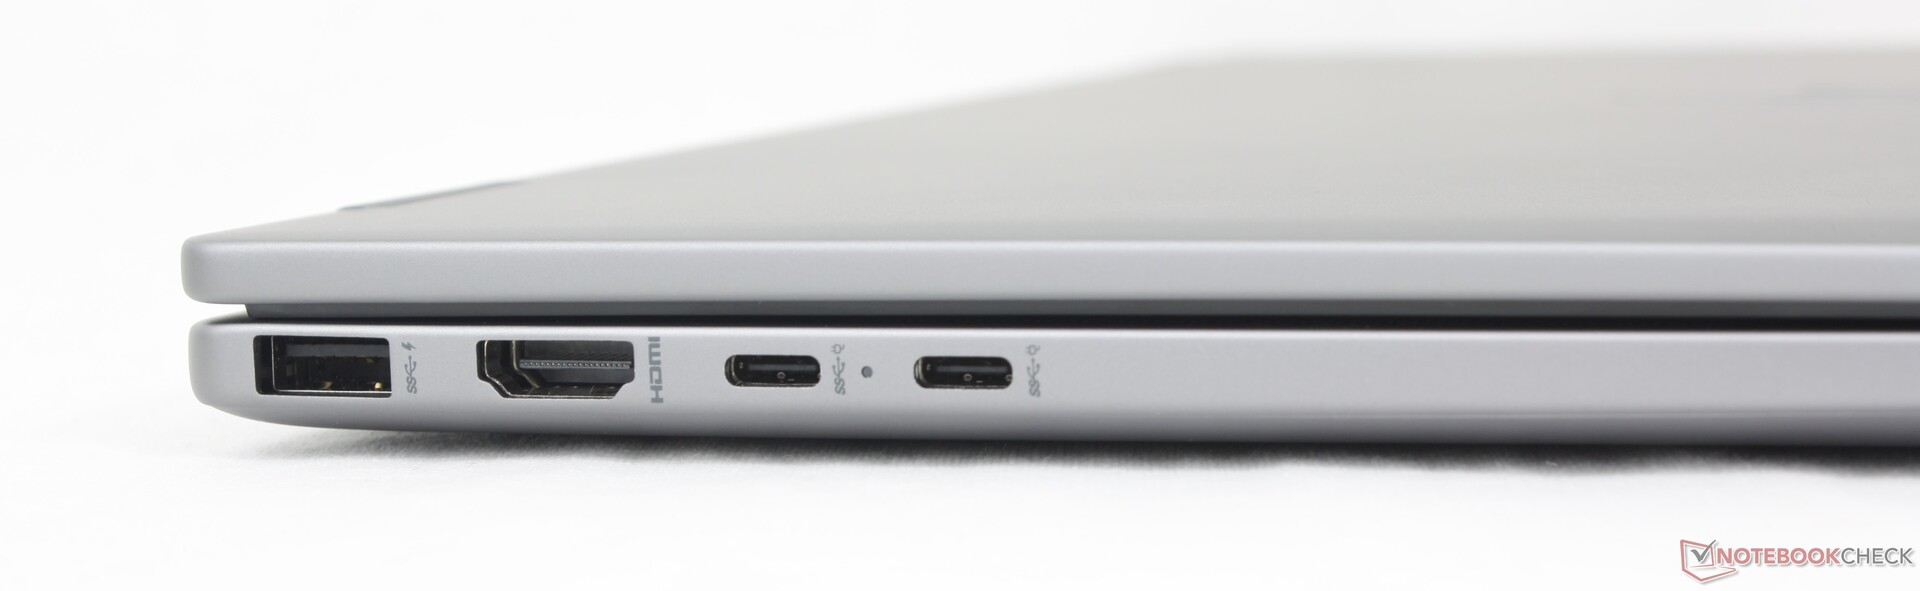
Todas as portas retornaram do Envy x360 15 de 2023, menos o leitor de cartão SD. Para um laptop multimídia tão grande, a falta de um leitor de cartão integrado é decepcionante para os fotógrafos que dependem dele para transferir mídia.
Infelizmente, o USB4 e o Thunderbolt não são compatíveis com o novo Envy, pois as duas portas USB-C são de apenas 10 Gbps cada. Em vez disso, os usuários terão que considerar a versão Intel do Envy x360 16 ou atualizar para a série Spectre x360 16 para obter compatibilidade com Thunderbolt.
Comunicação
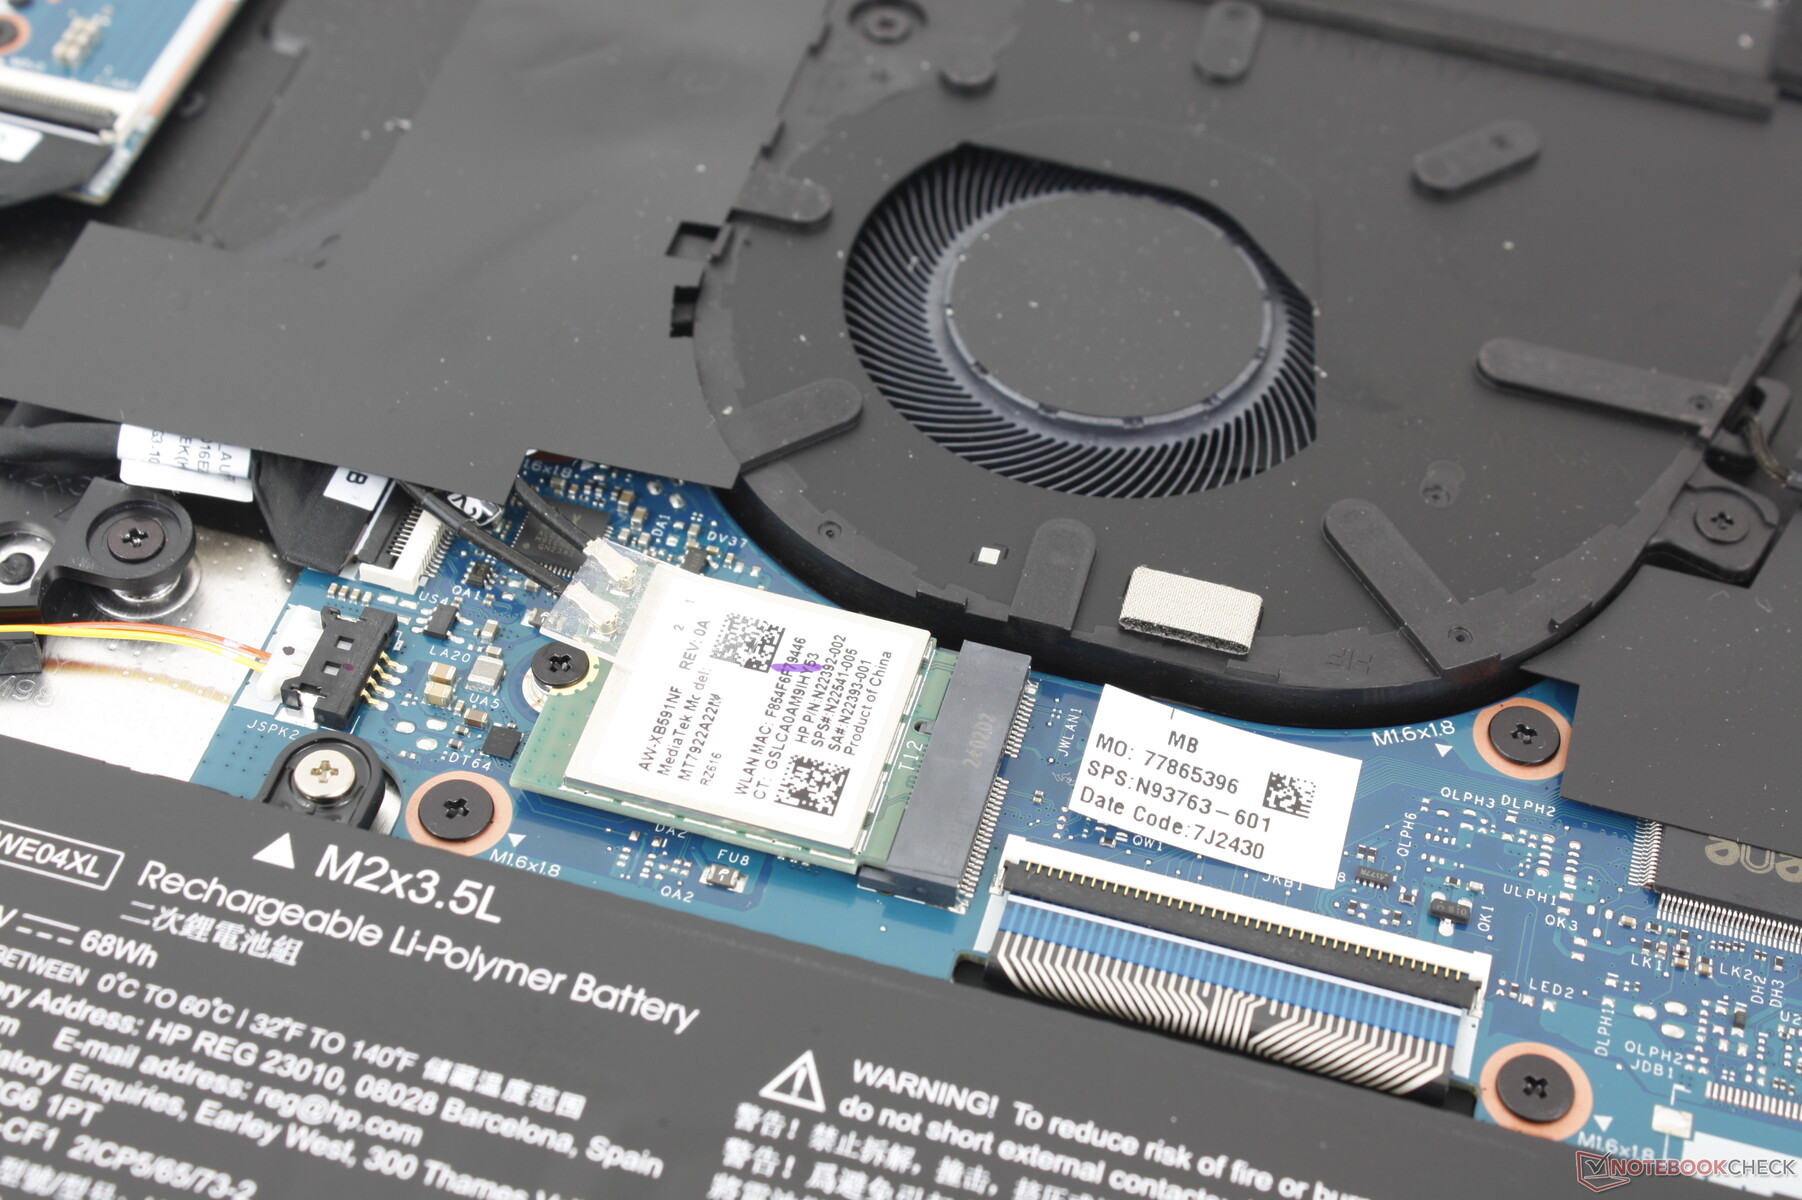
O MediaTek MT7922 vem com conectividade padrão Wi-Fi 6E e Bluetooth 5.3. Tivemos excelentes taxas de transferência e nenhum problema de conectividade durante nossos testes de Wi-Fi 6 e Wi-Fi 6E.
Webcam
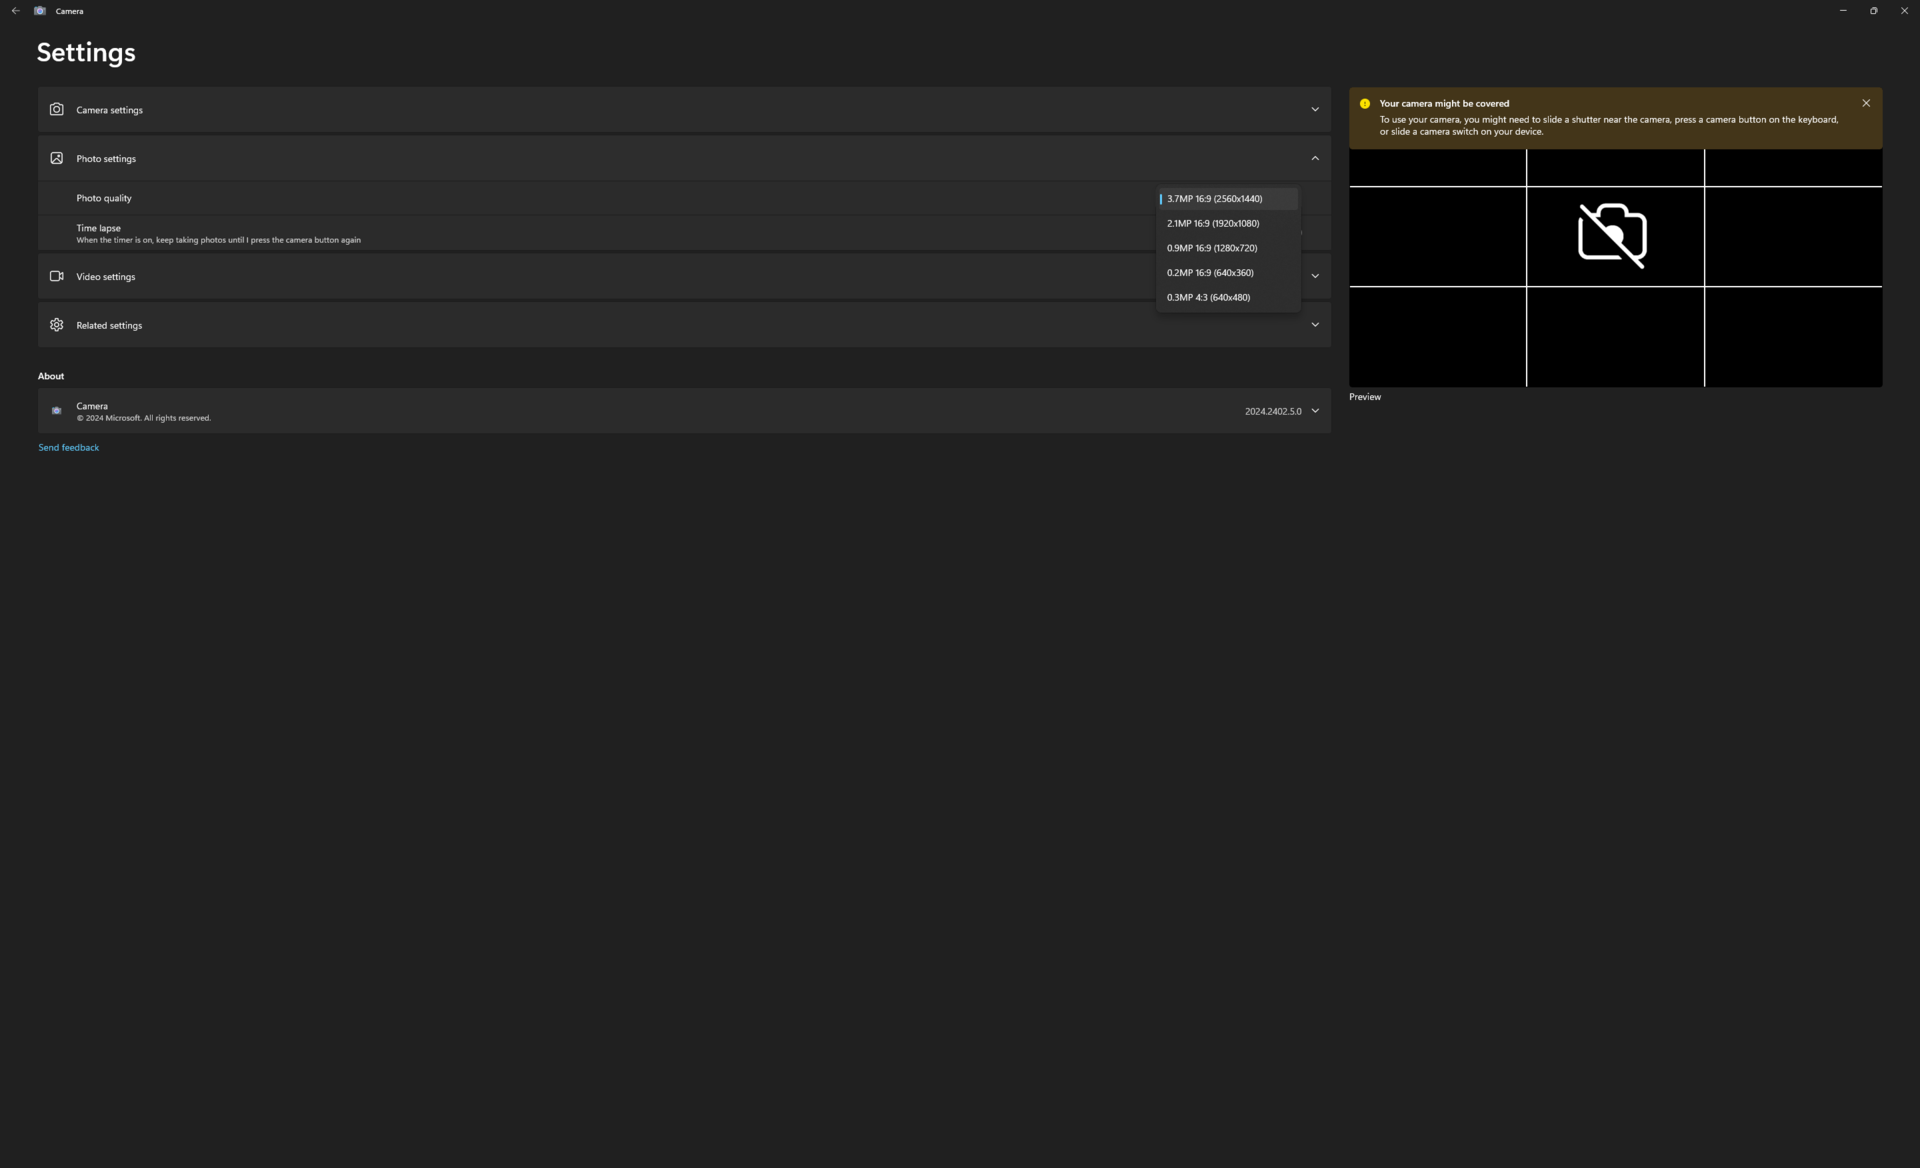
Embora a HP anuncie uma webcam de 5 MP, o aplicativo de câmera do Windows só permite até 3,7 MP, conforme mostrado na captura de tela à direita. Entramos em contato com a HP para saber se isso está funcionando como pretendido ou se há algum bug envolvido.
Tanto o IR quanto um obturador de privacidade físico são padrão.


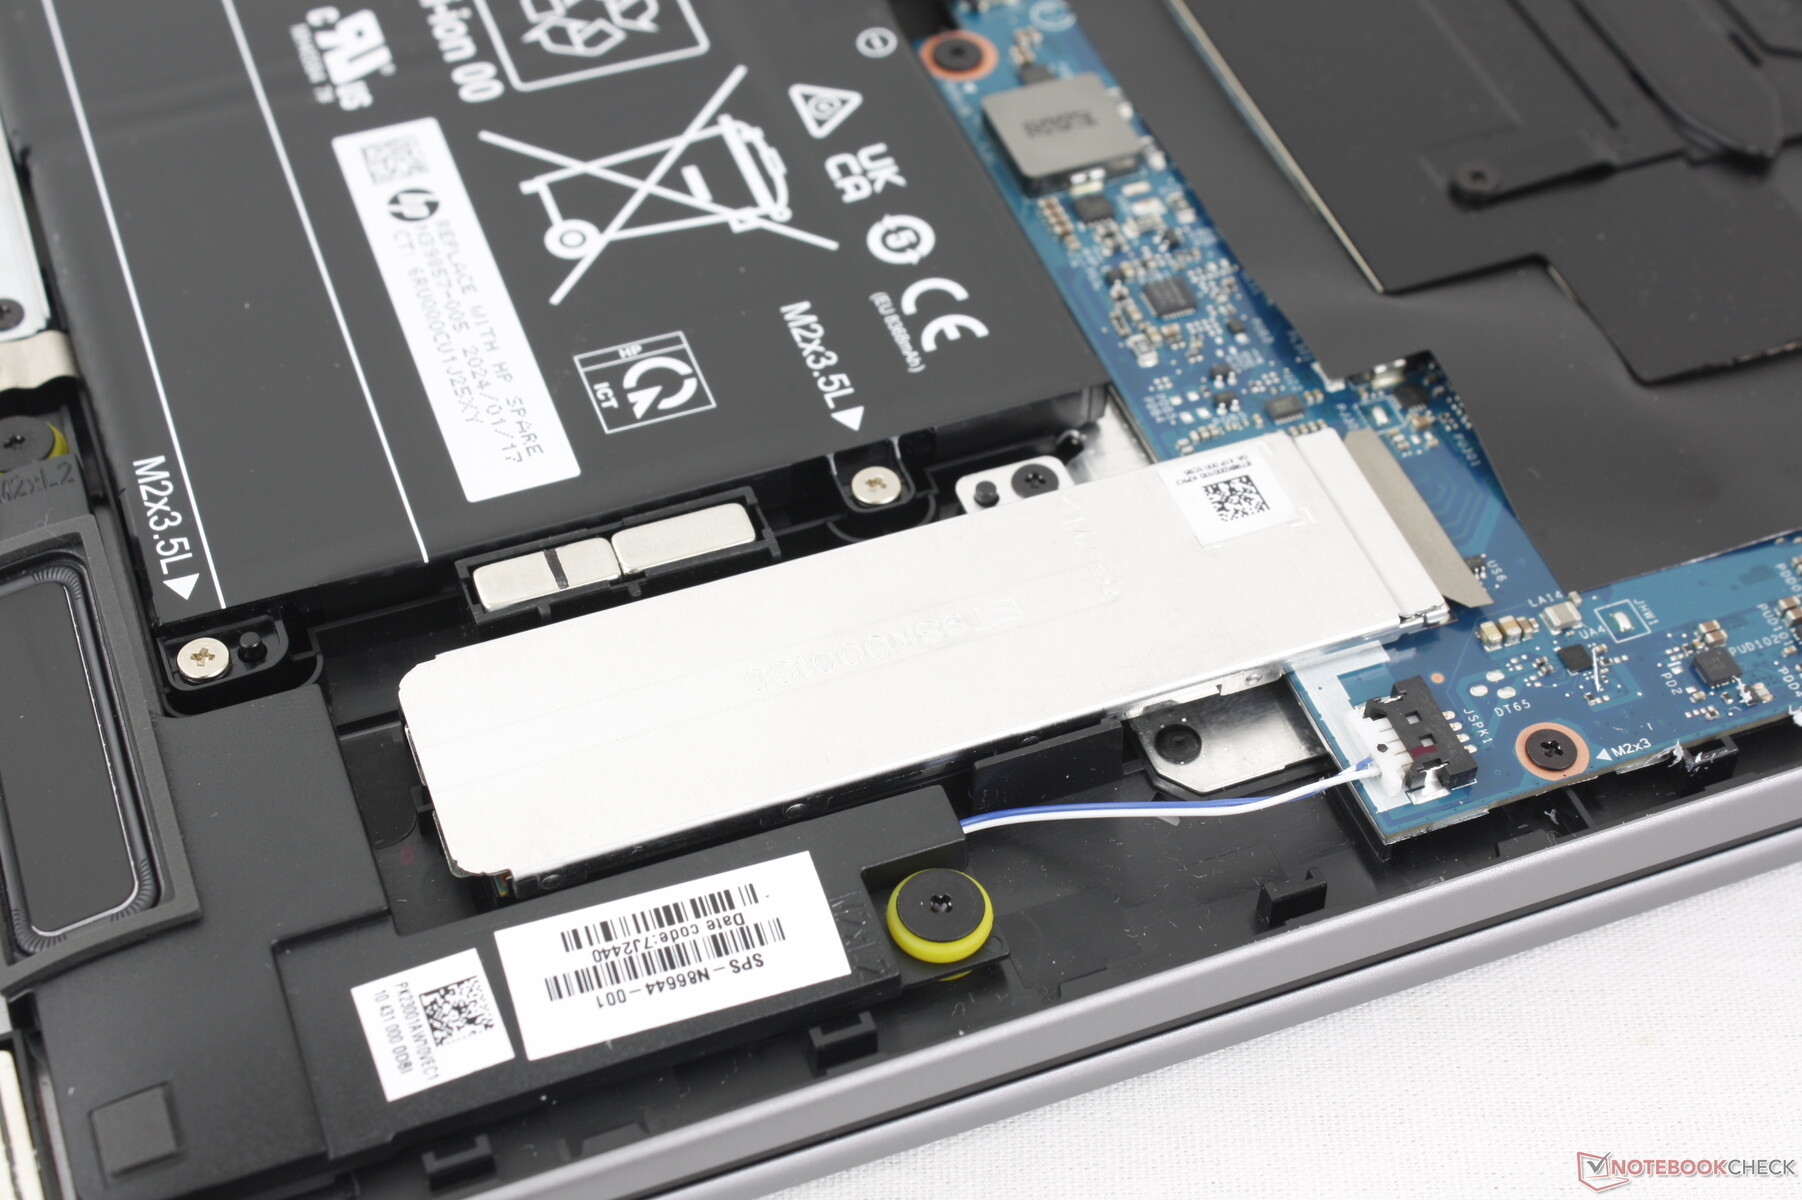
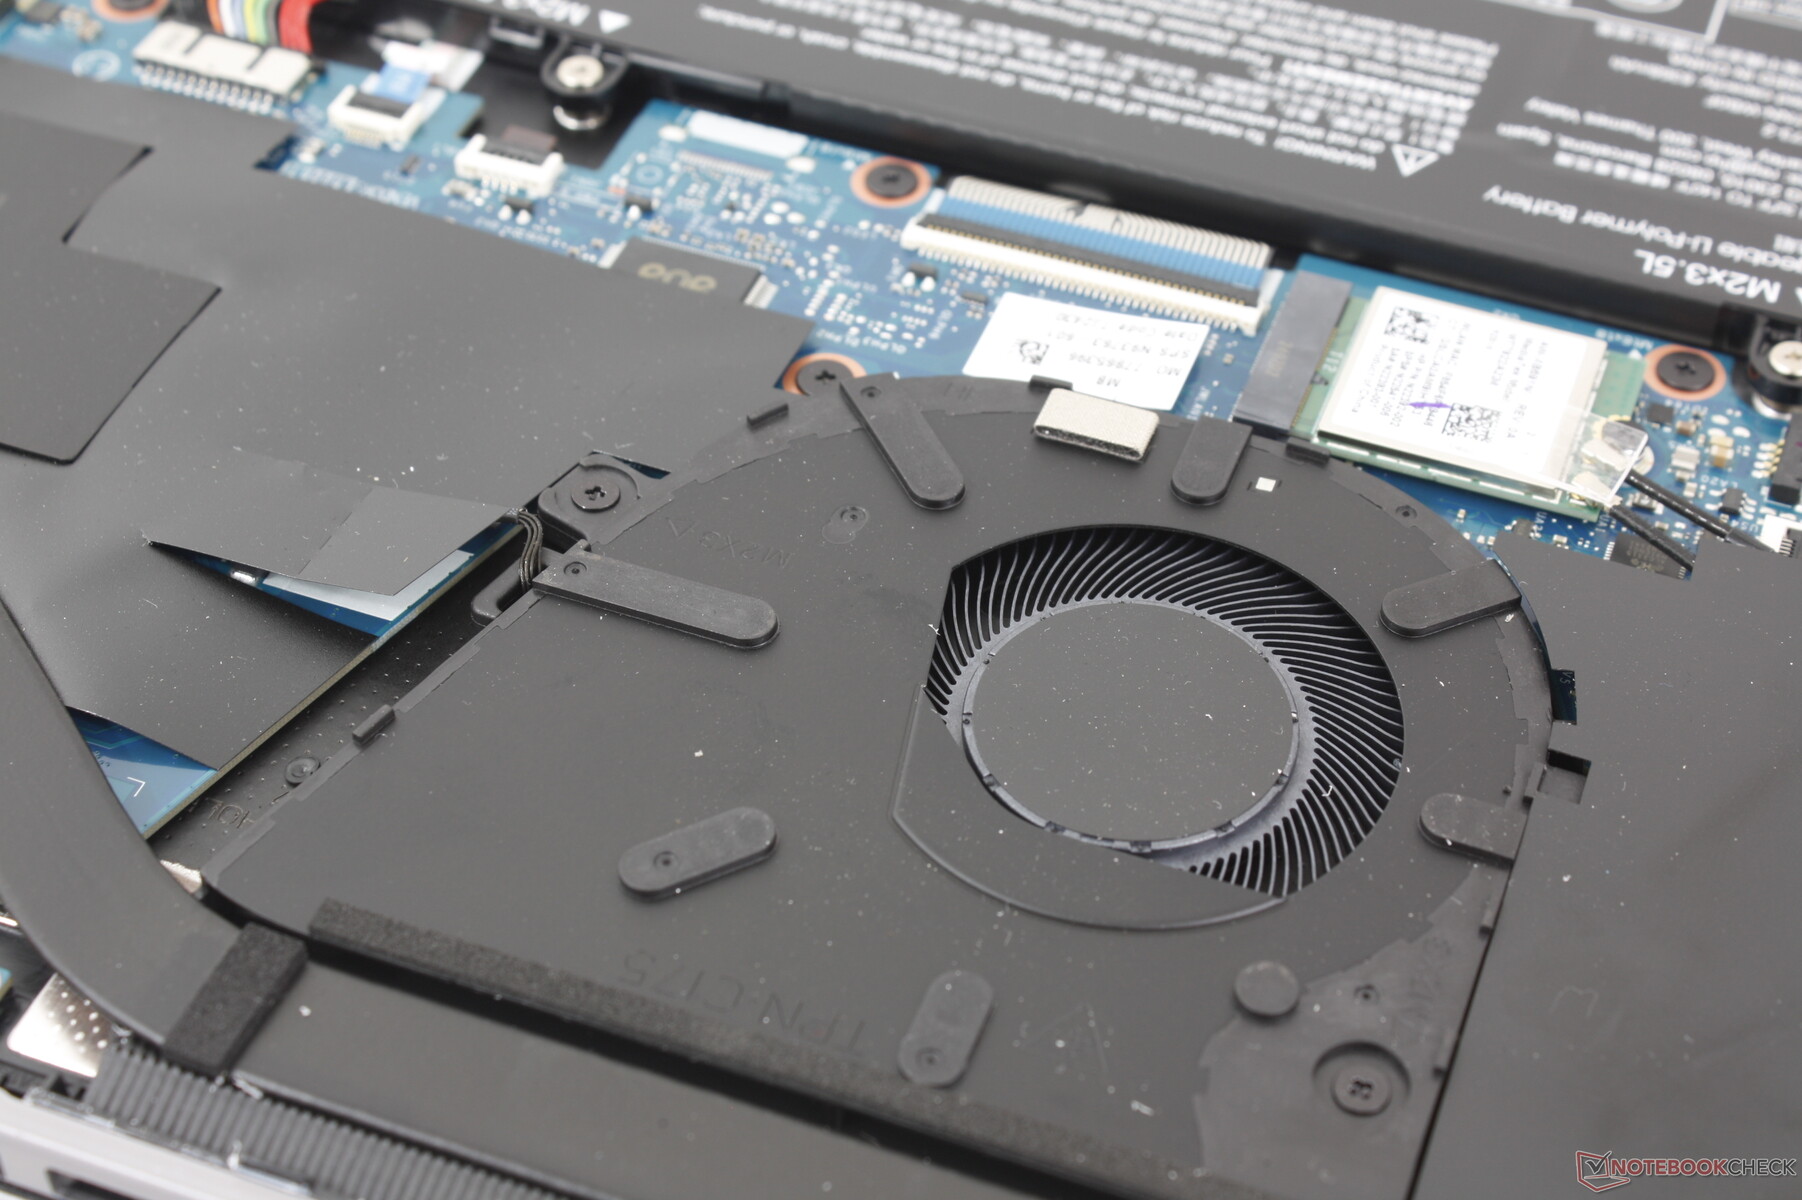
Manutenção
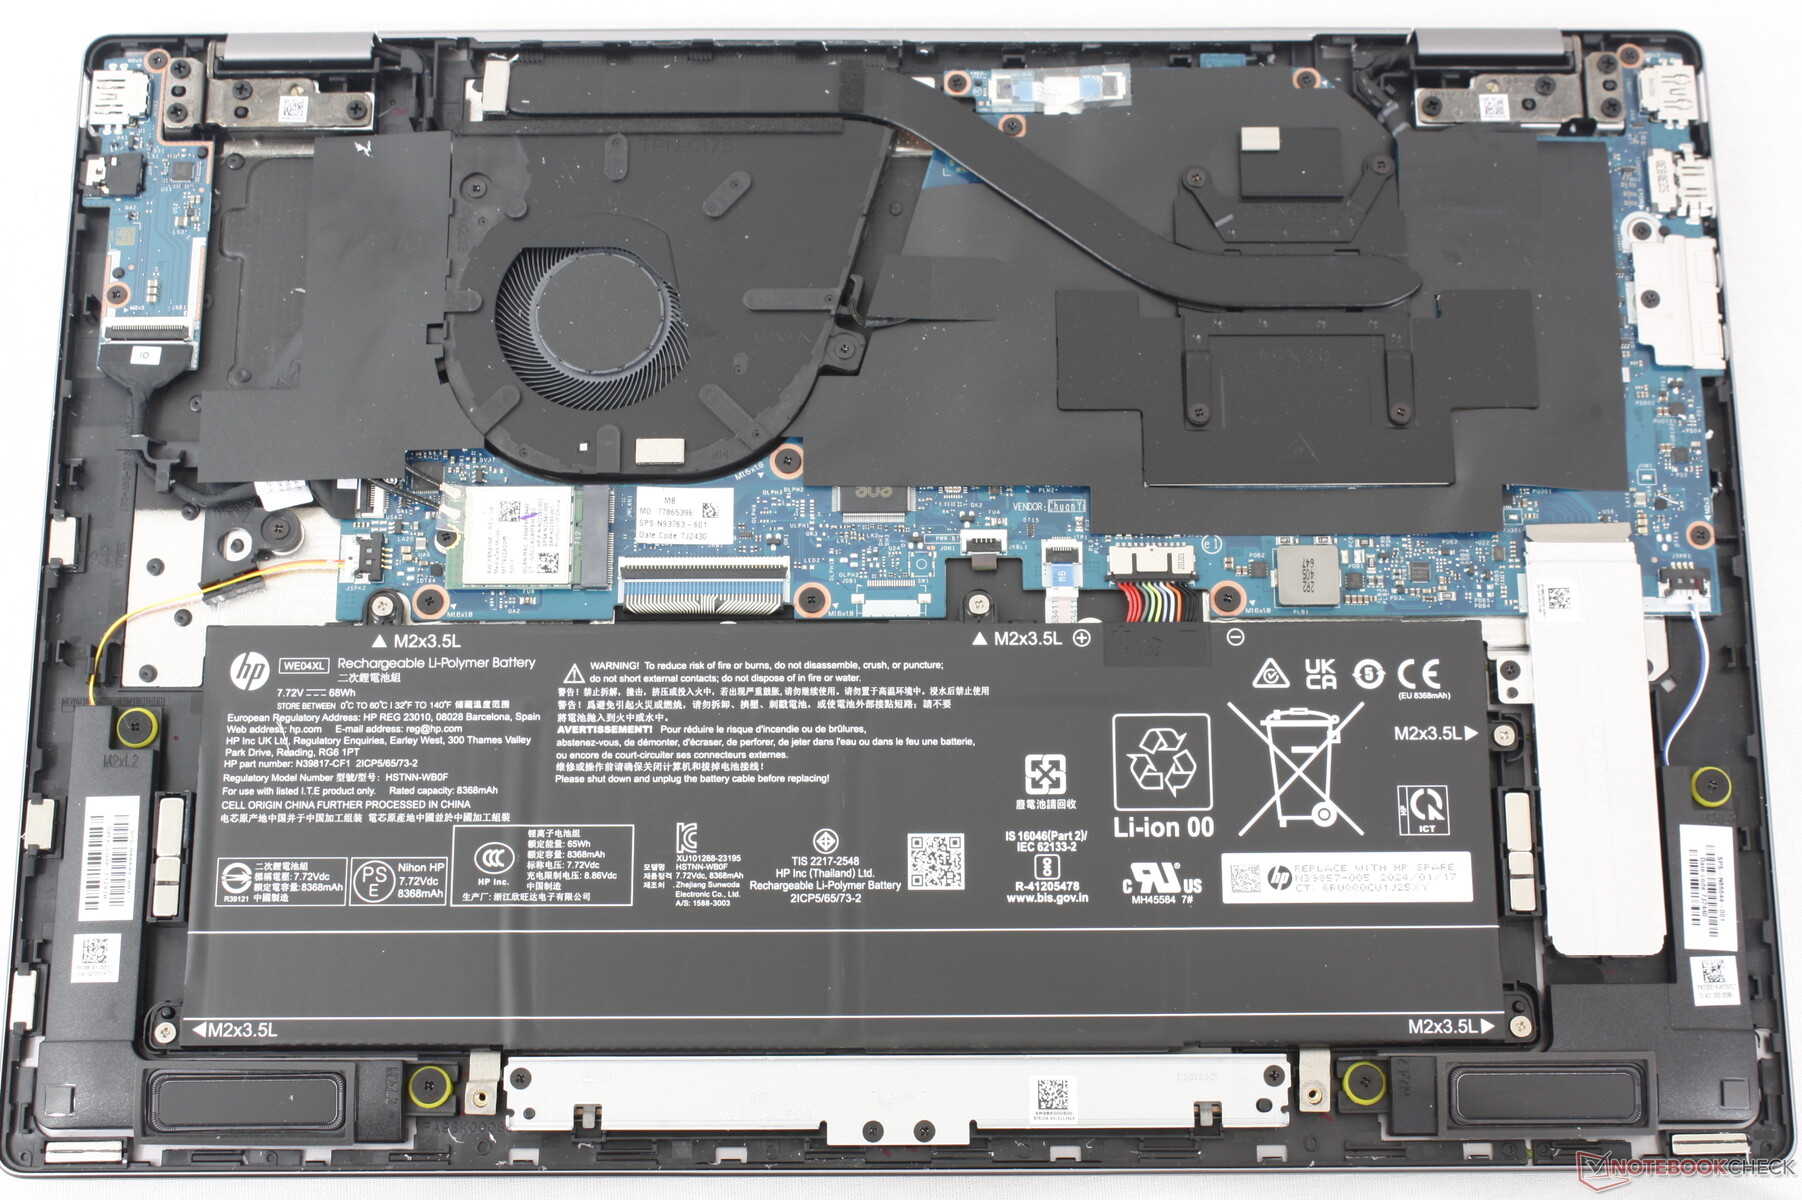
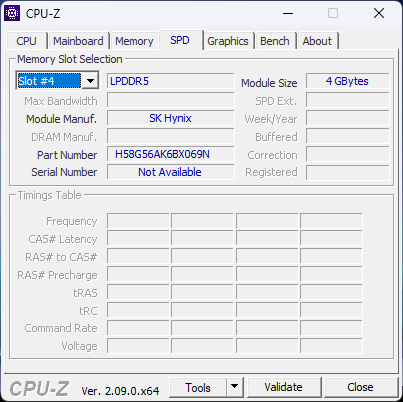
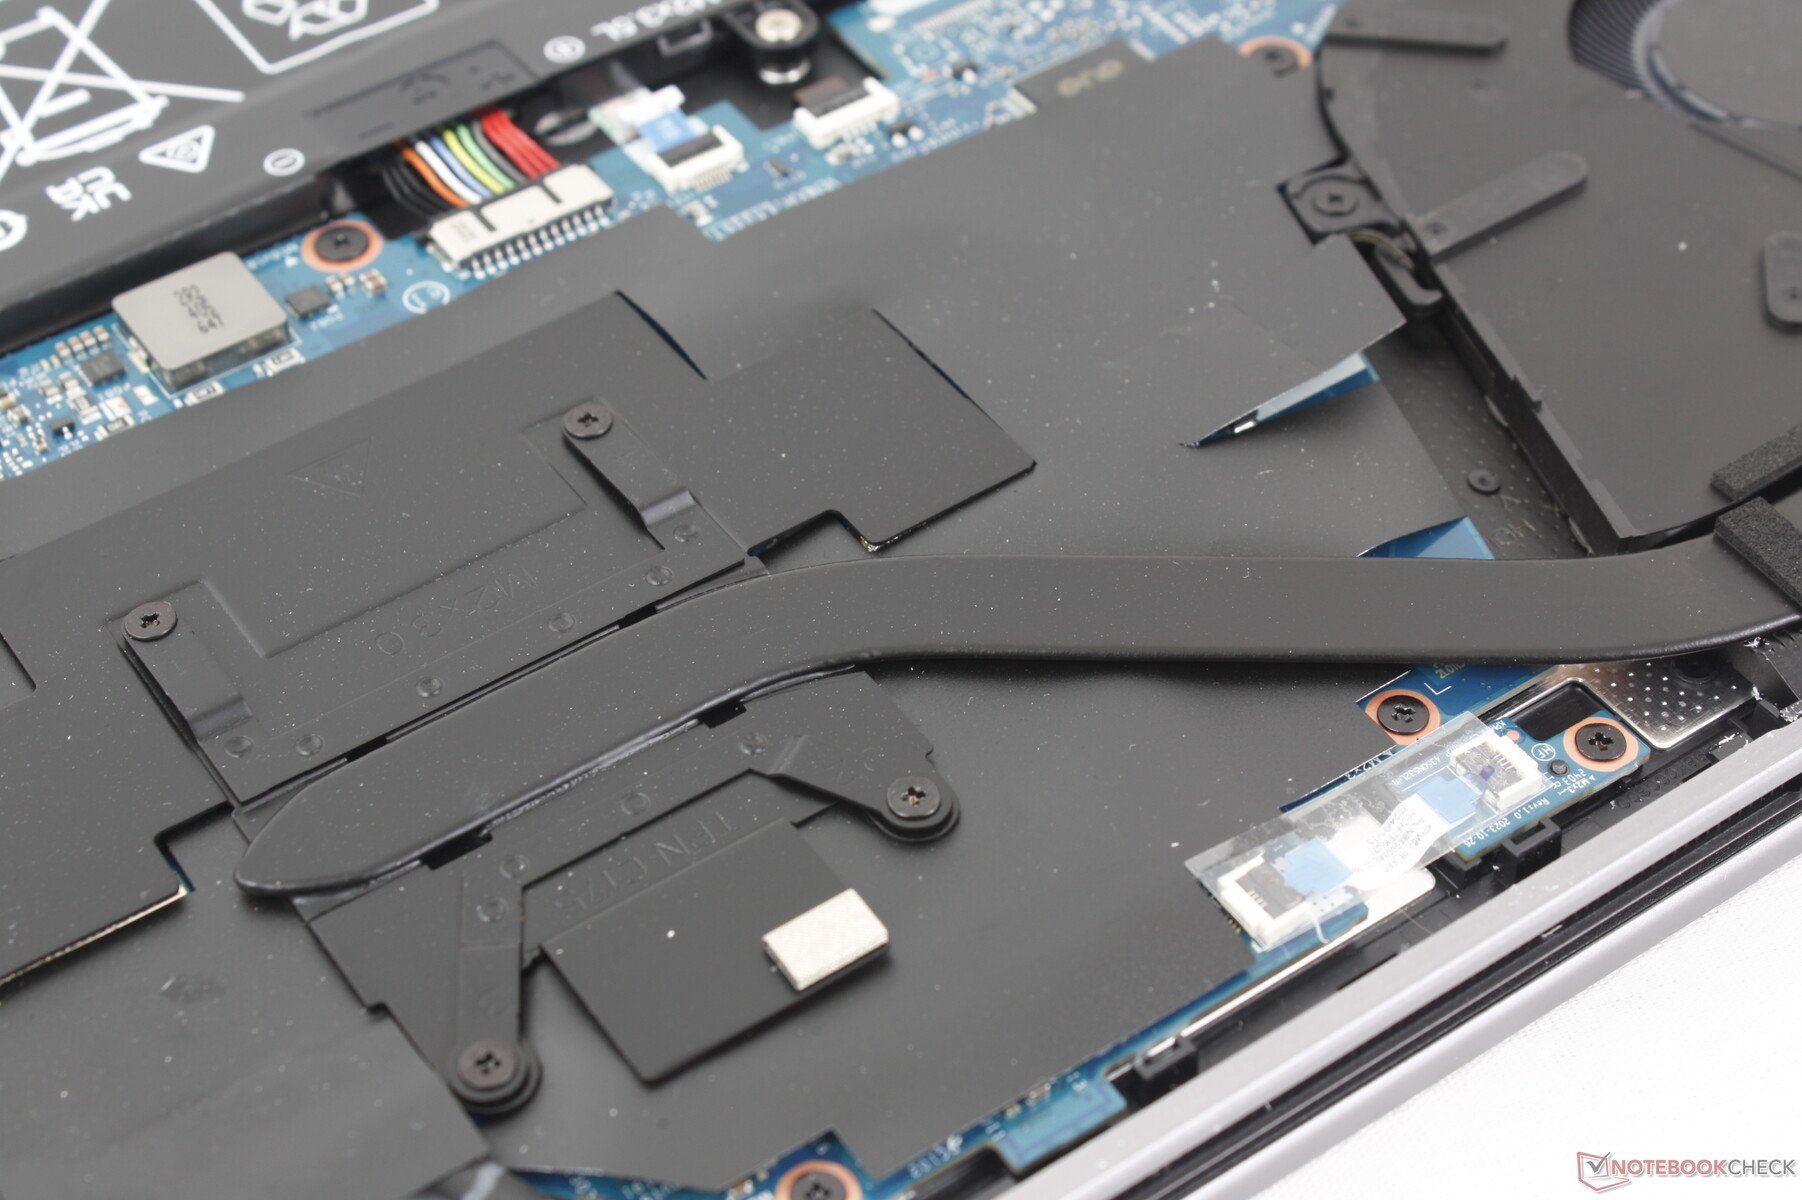
O painel inferior é fixado por apenas quatro parafusos Torx. Removê-lo, no entanto, é uma história totalmente diferente, já que as bordas são afiadas e extremamente apertadas para tornar a manutenção mais difícil do que o necessário. Tivemos exatamente o mesmo problema no Envy x360 15, o que sugere que a HP não se preocupou em melhorar esse aspecto no design do Envy x360 16. De qualquer forma, não há muito o que atualizar no interior, já que a RAM é soldada.
Acessórios e garantia
Uma caneta stylus ativa é opcional. A garantia padrão limitada de um ano do fabricante se aplica se o produto for comprado nos EUA.
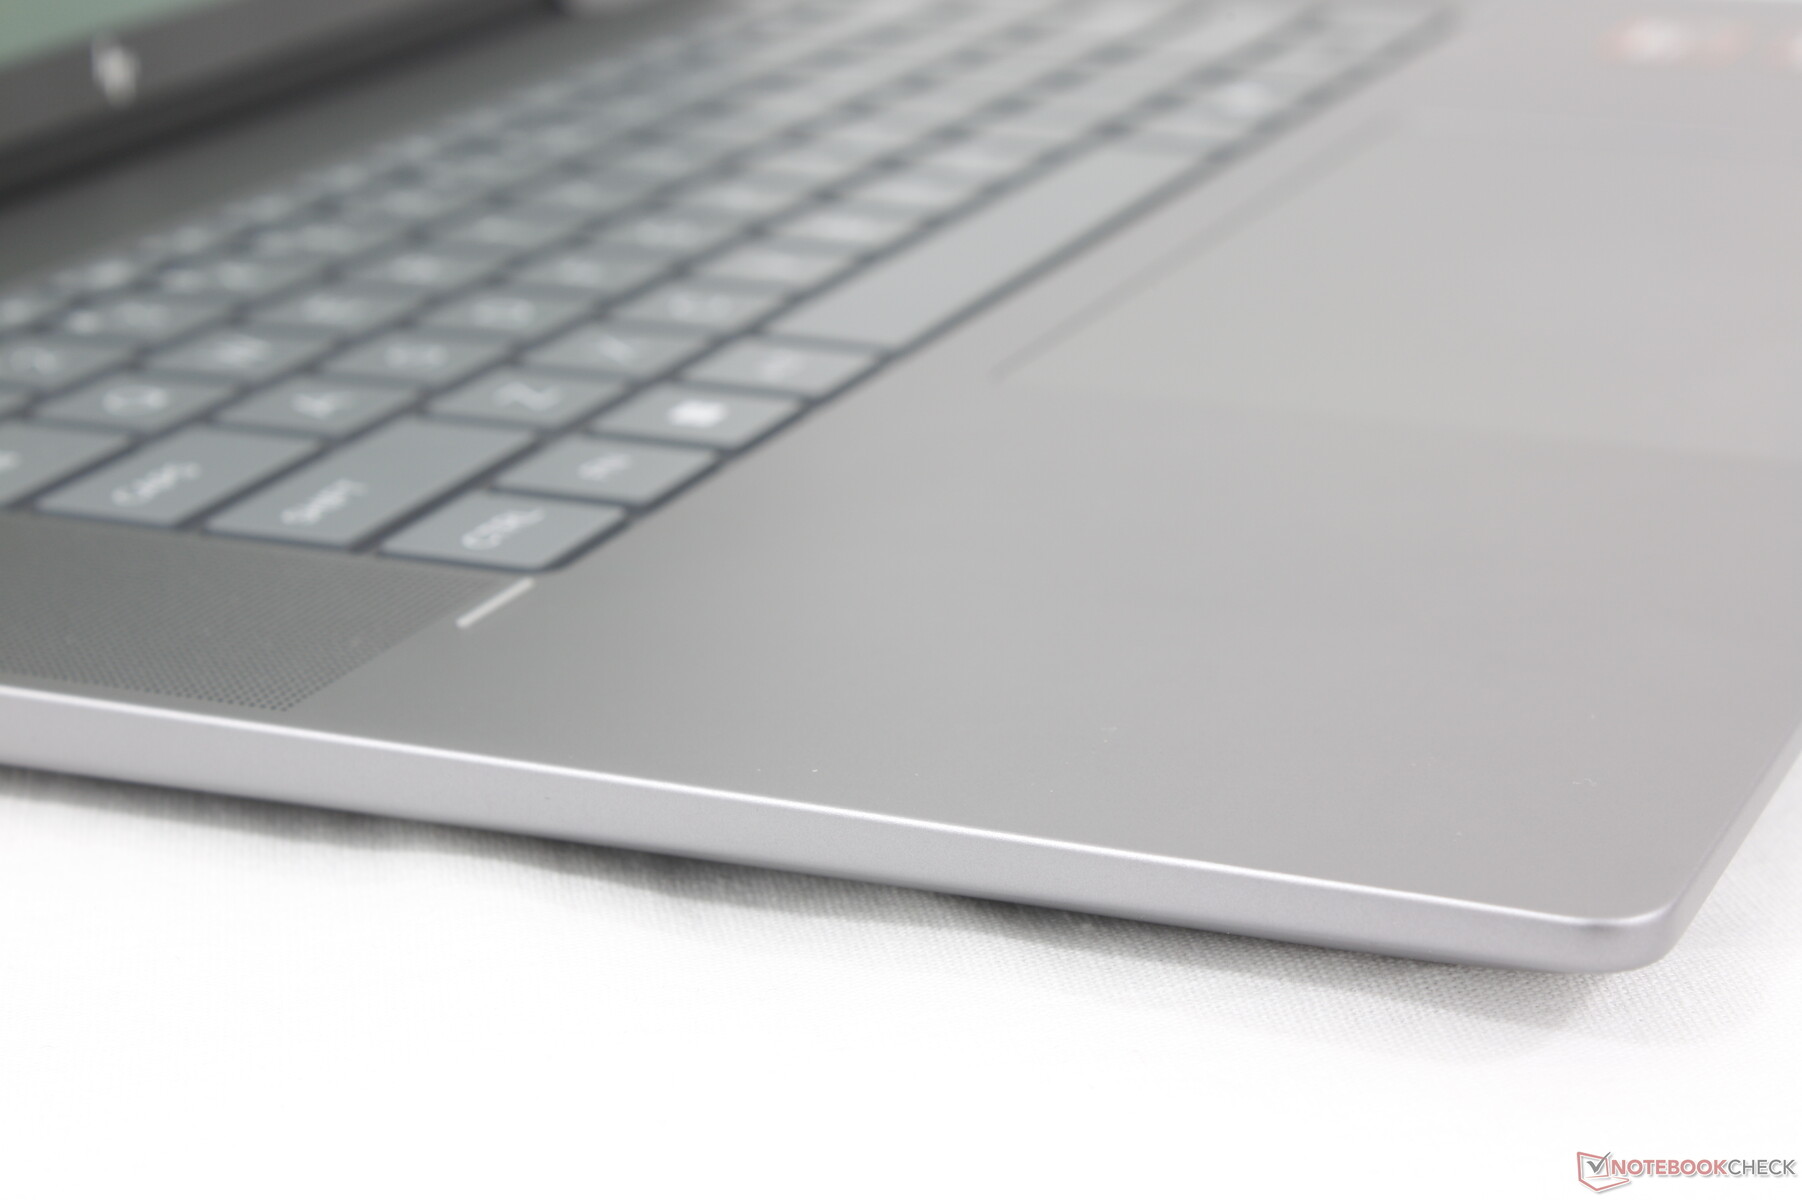
Dispositivos de entrada - Espaçoso e confortável
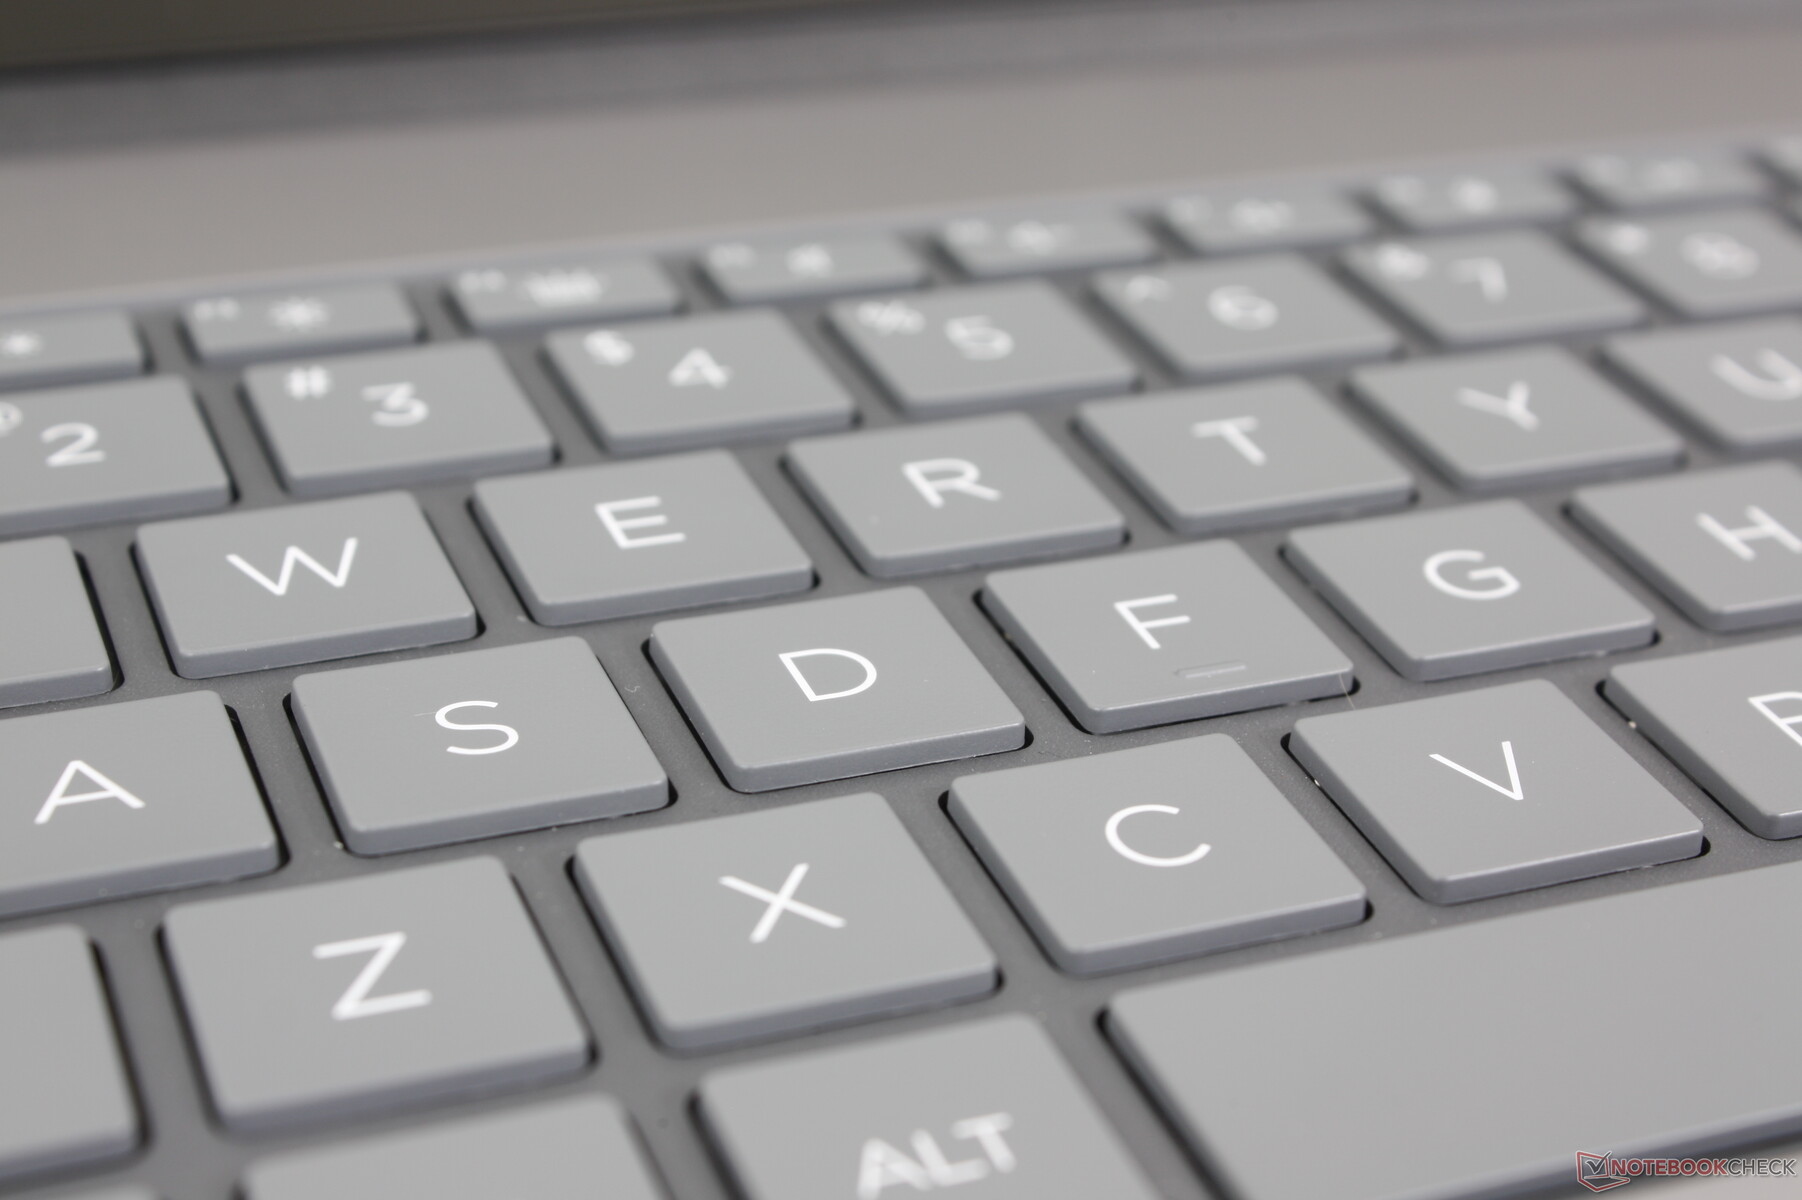
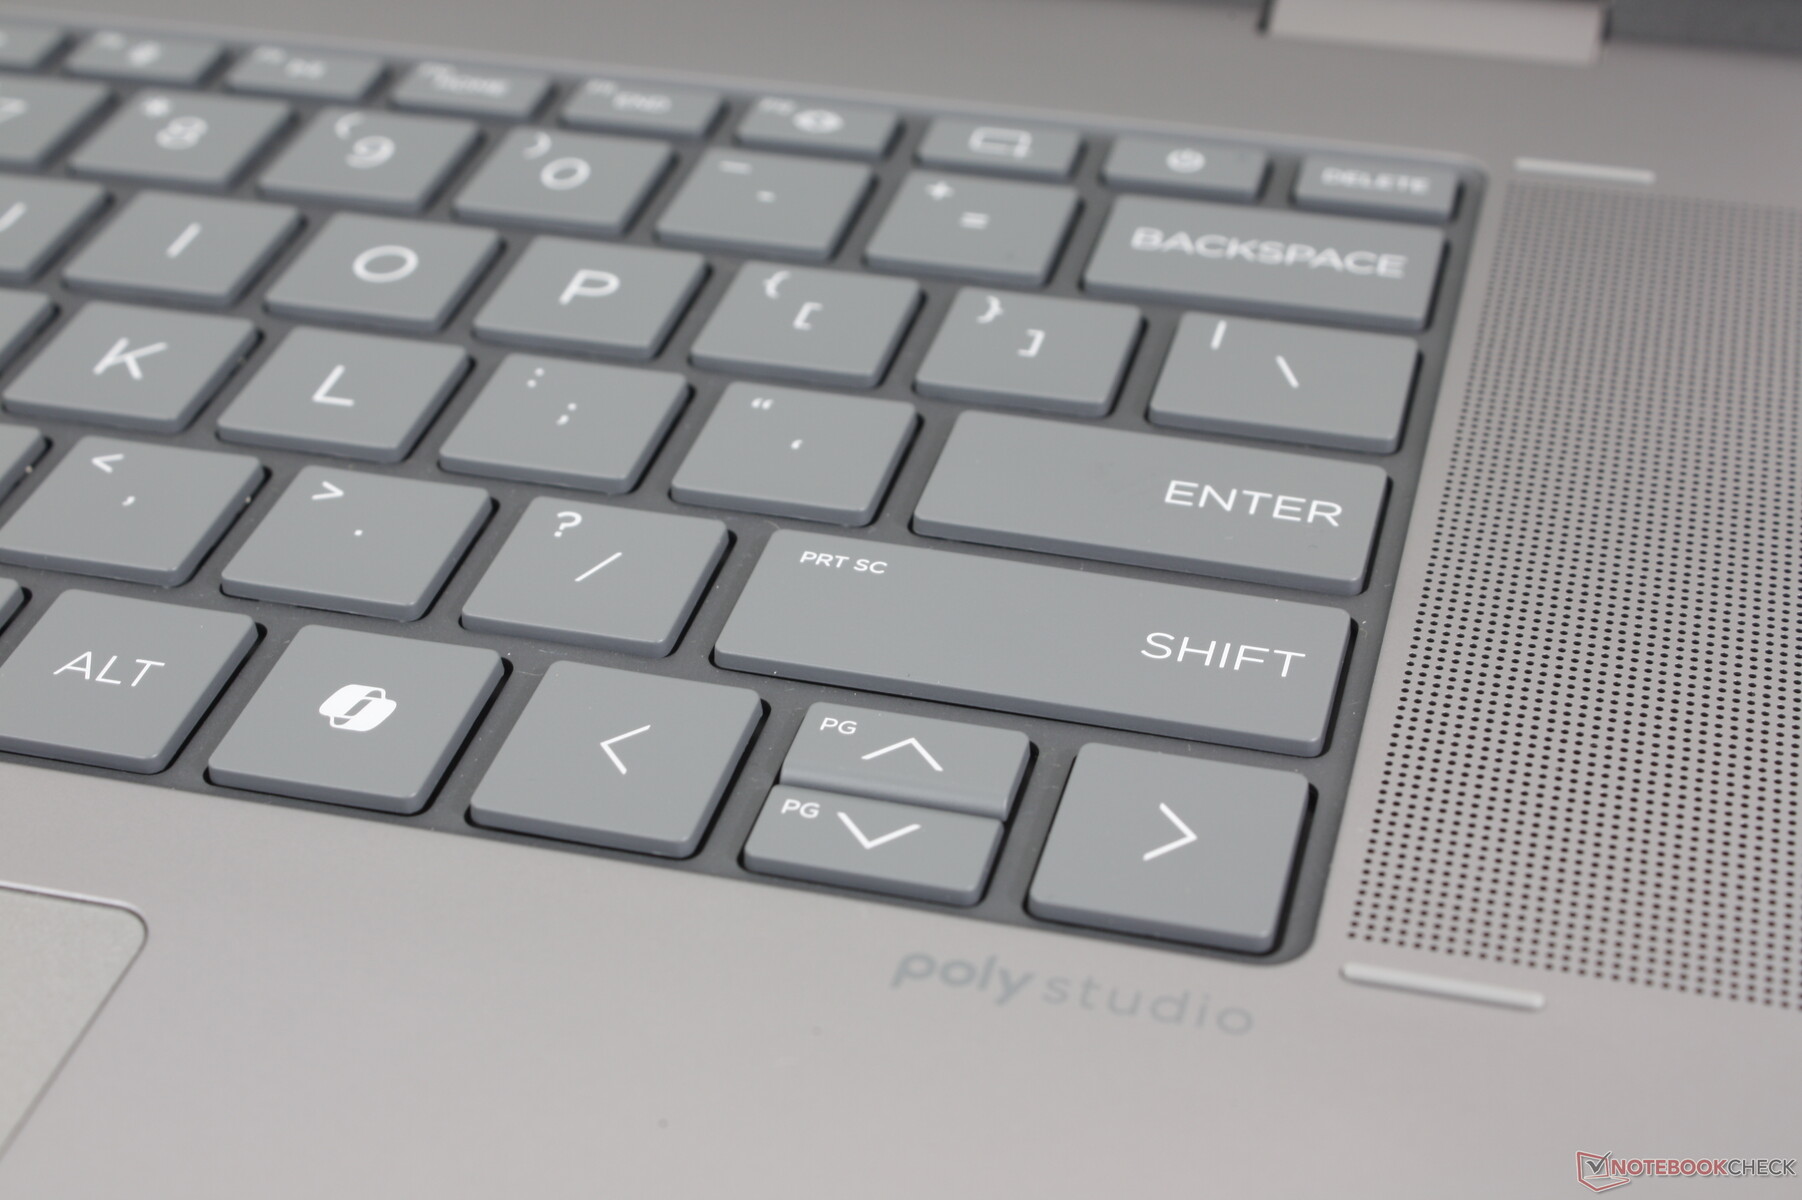
Teclado
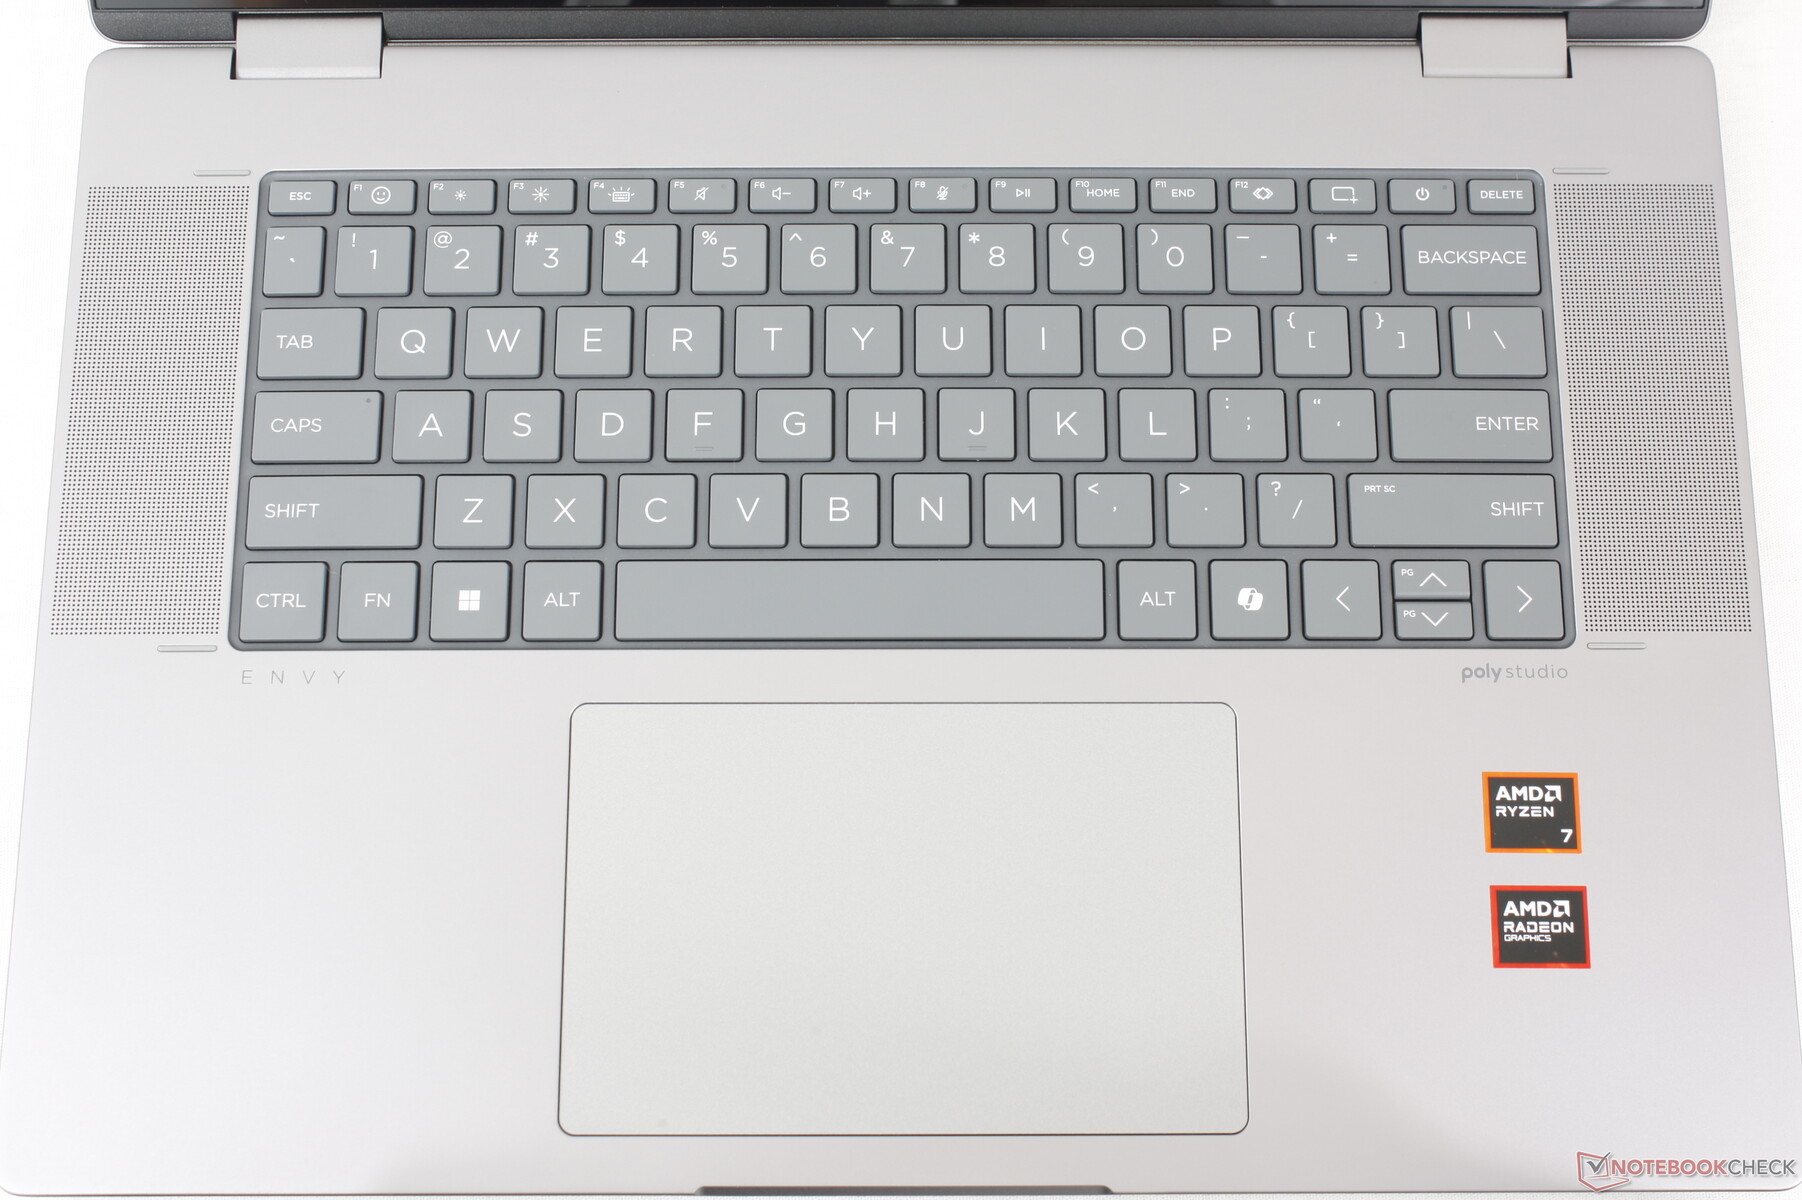
O layout das teclas foi alterado em relação ao Envy x360 15. A coluna dedicada de teclas ao longo da borda direita (PgDn, PgUp, End, etc.) foi removida e suas funções agora foram mescladas com o restante do teclado. Essa alteração torna o layout visualmente mais parecido com o do Spectre x360 16, embora sem o leitor de impressões digitais.
A experiência de digitação é excelente e comparável à do Spectre, com um feedback mais nítido do que no concorrente VivoBook ou IdeaPad concorrentes. O GIF e as teclas personalizáveis, em particular, merecem menção, pois a maioria dos outros laptops multimídia não inclui esses recursos.
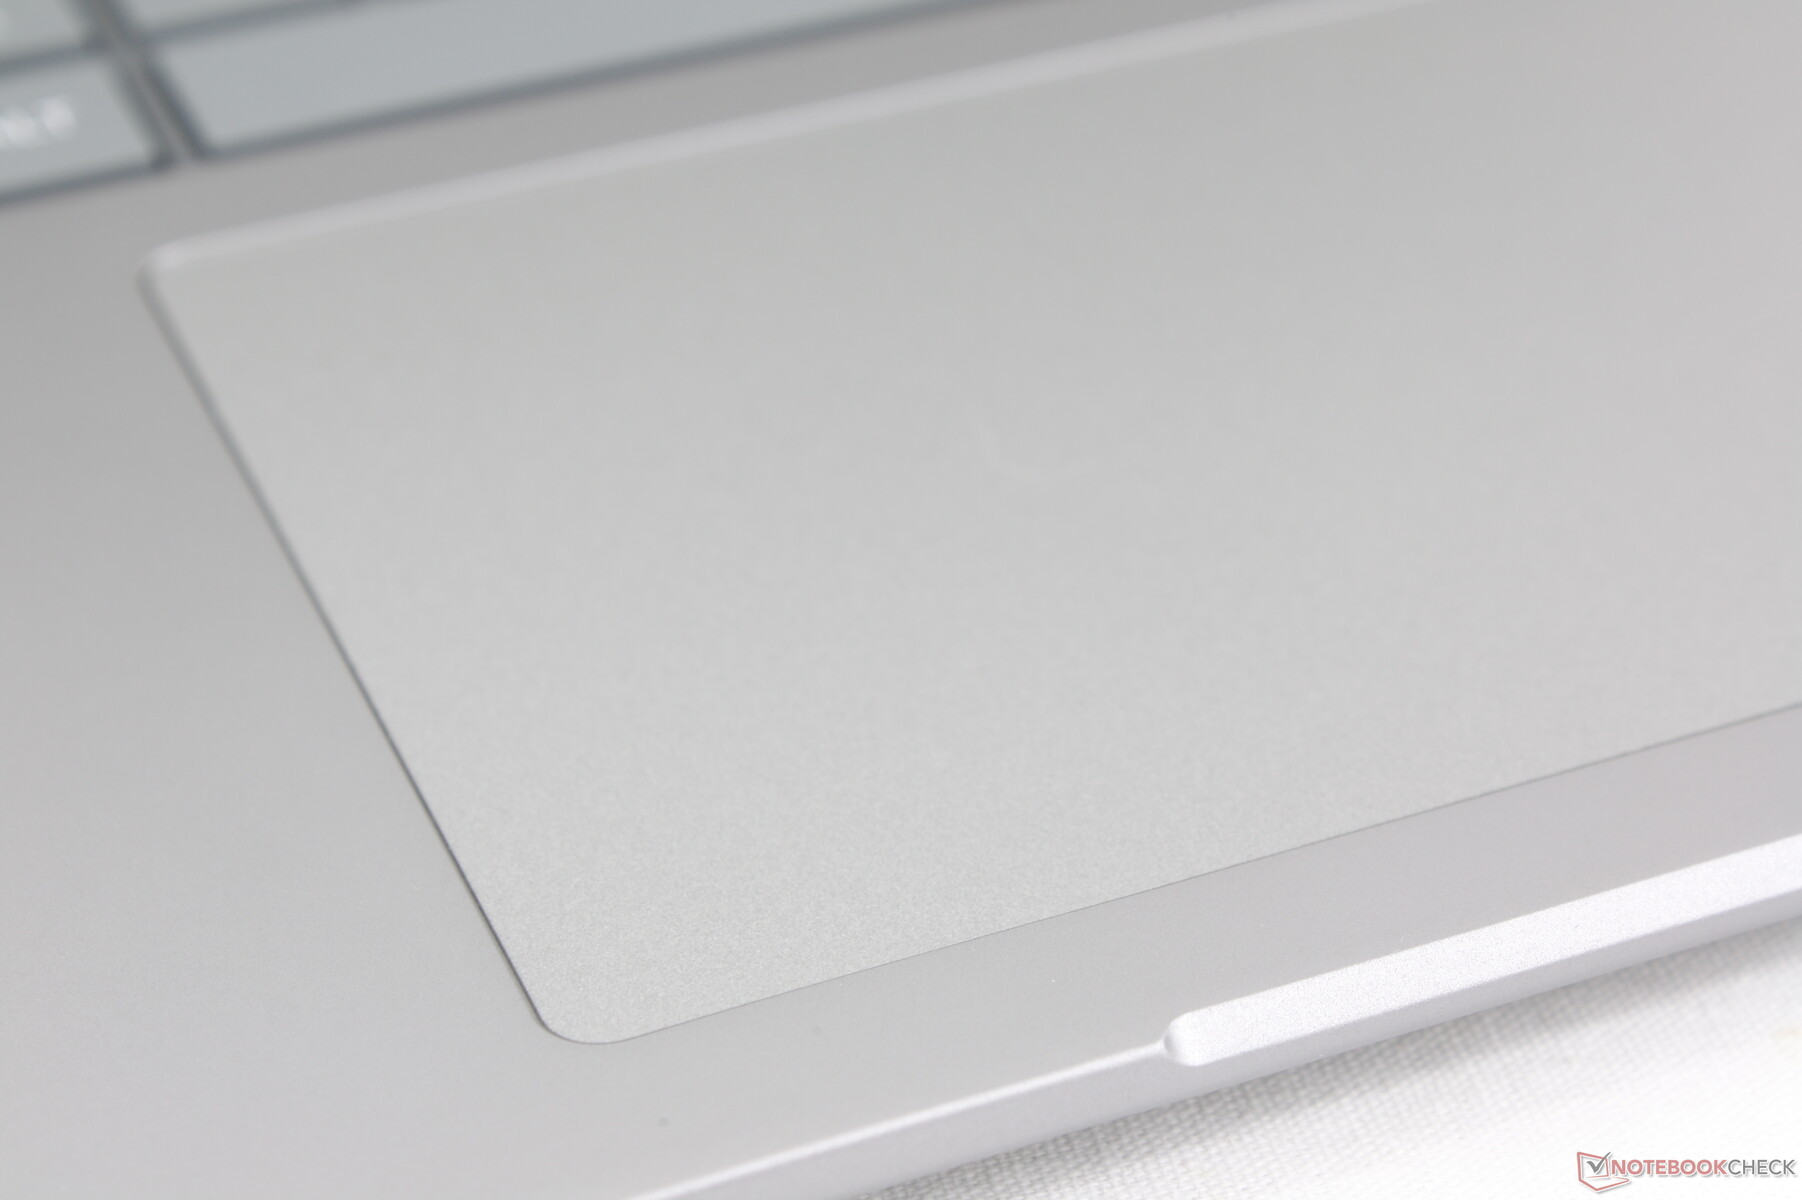
Touchpad
O clickpad é menor do que o do Spectre x360 16 (13,5 x 8,8 cm vs. 16 x 10 cm). Mesmo assim, ele ainda parece espaçoso e suficientemente grande, mesmo para um formato de 16 polegadas. A tração é suave, com apenas um pouco de aderência ao deslizar em velocidades mais lentas, enquanto o feedback ao clicar é um pouco suave e poderia ter sido mais firme.
Tela - OLED de alta qualidade por um preço médio
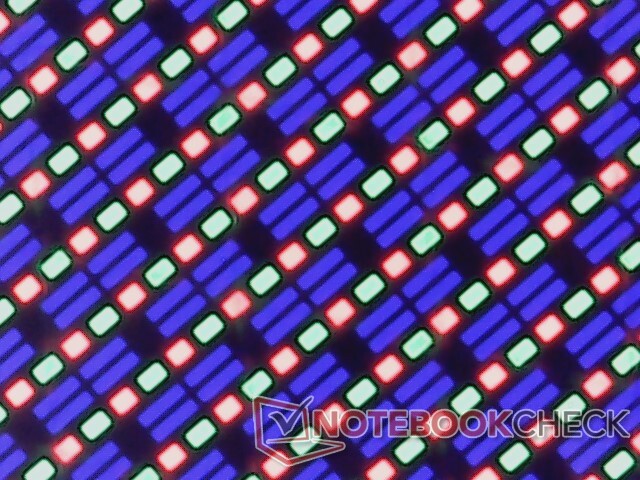
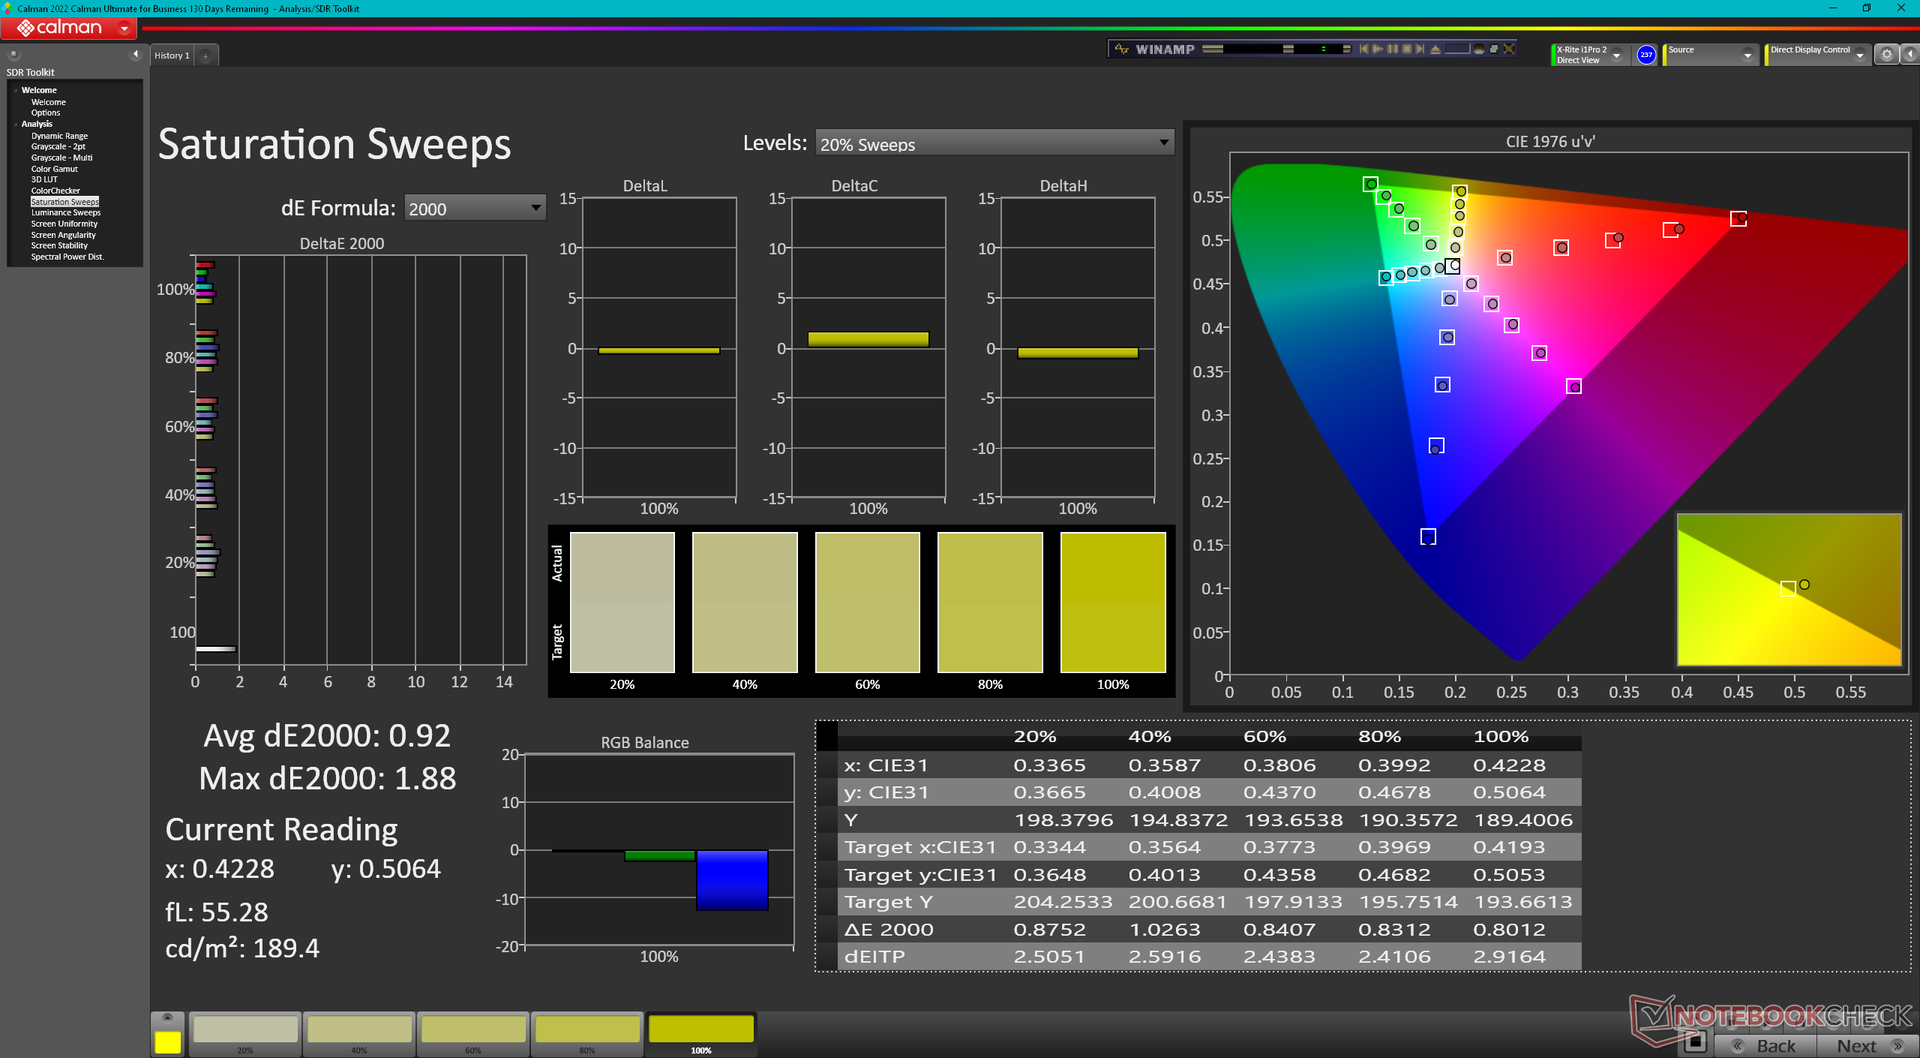
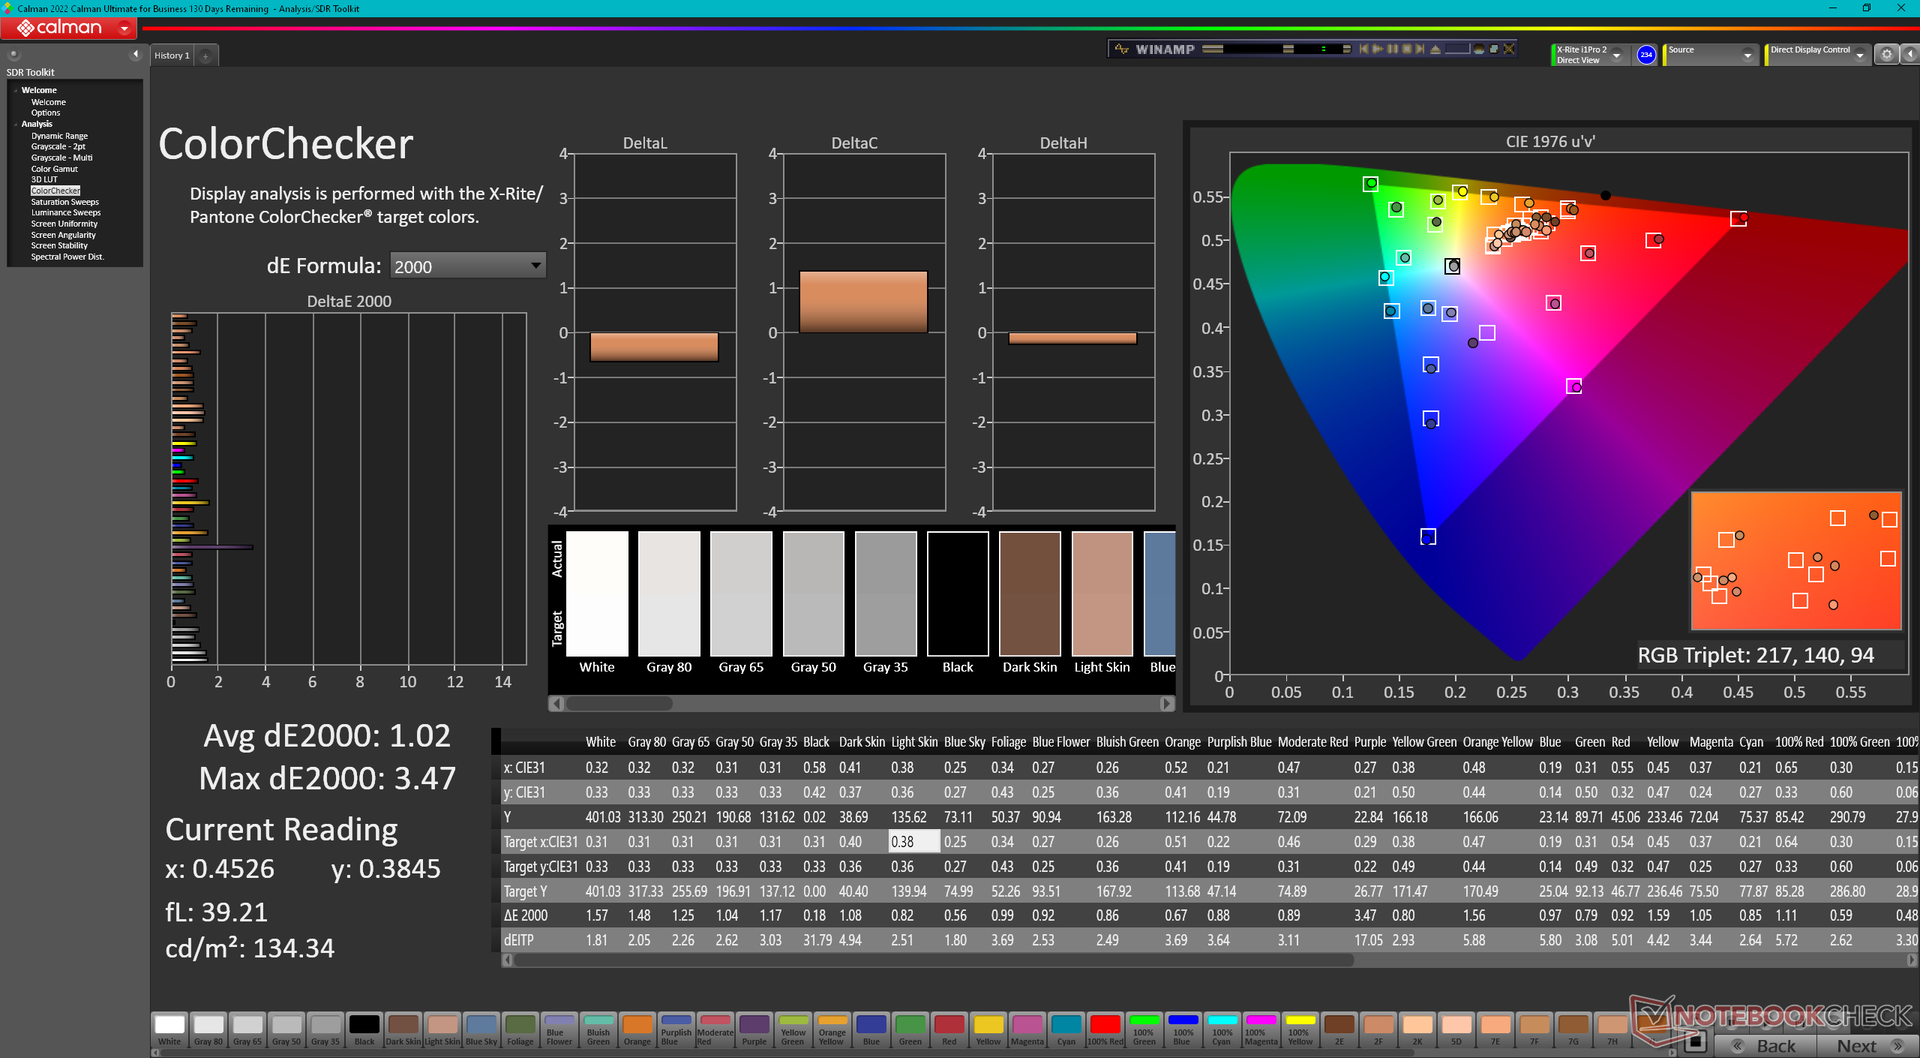
A HP utiliza o mesmo painel OLED Samsung SDC41A6 para o Envy x360 16 e o Spectre x360 16, embora o último seja muito mais caro. A experiência visual é, portanto, idêntica entre os dois modelos, com 100% de cores DCI-P3, tempos de resposta rápidos, taxa de atualização de 120 Hz, brilho máximo de 400 nits e até mesmo tecnologia de escurecimento OLED DC. Essa é uma tela de alta qualidade para um laptop de médio porte, o que coloca o Envy x360 16 um degrau acima de outras alternativas de preço semelhante.
A tela pode ter até 616 nits de brilho quando o HDR está ativado. Caso contrário, o conteúdo SDR é limitado a ~400 nits.
A tela de 120 Hz não suporta taxa de atualização variável e, portanto, oferece duas opções de taxa de atualização fixa: 48 Hz e 120 Hz. Não há seleção de 60 Hz, como na maioria dos outros painéis.
| |||||||||||||||||||||||||
iluminação: 98 %
iluminação com acumulador: 399.4 cd/m²
Contraste: ∞:1 (Preto: 0 cd/m²)
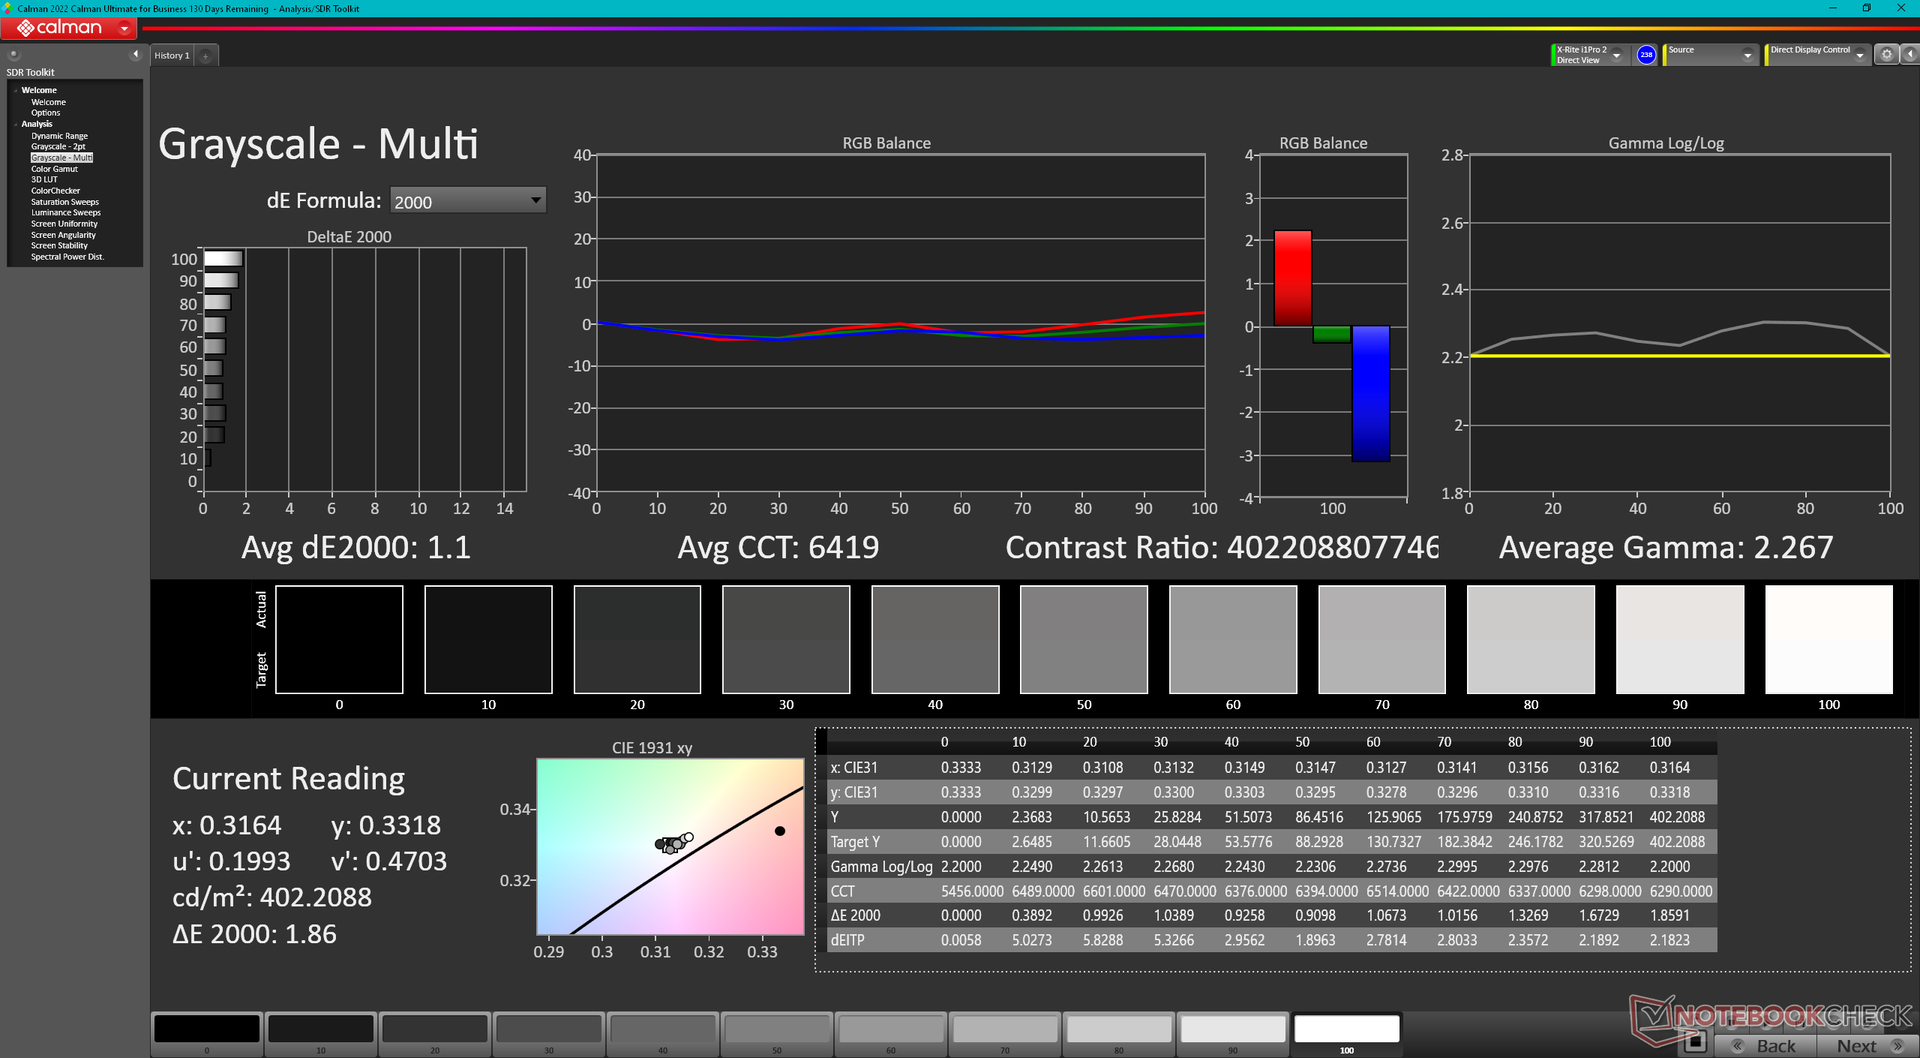
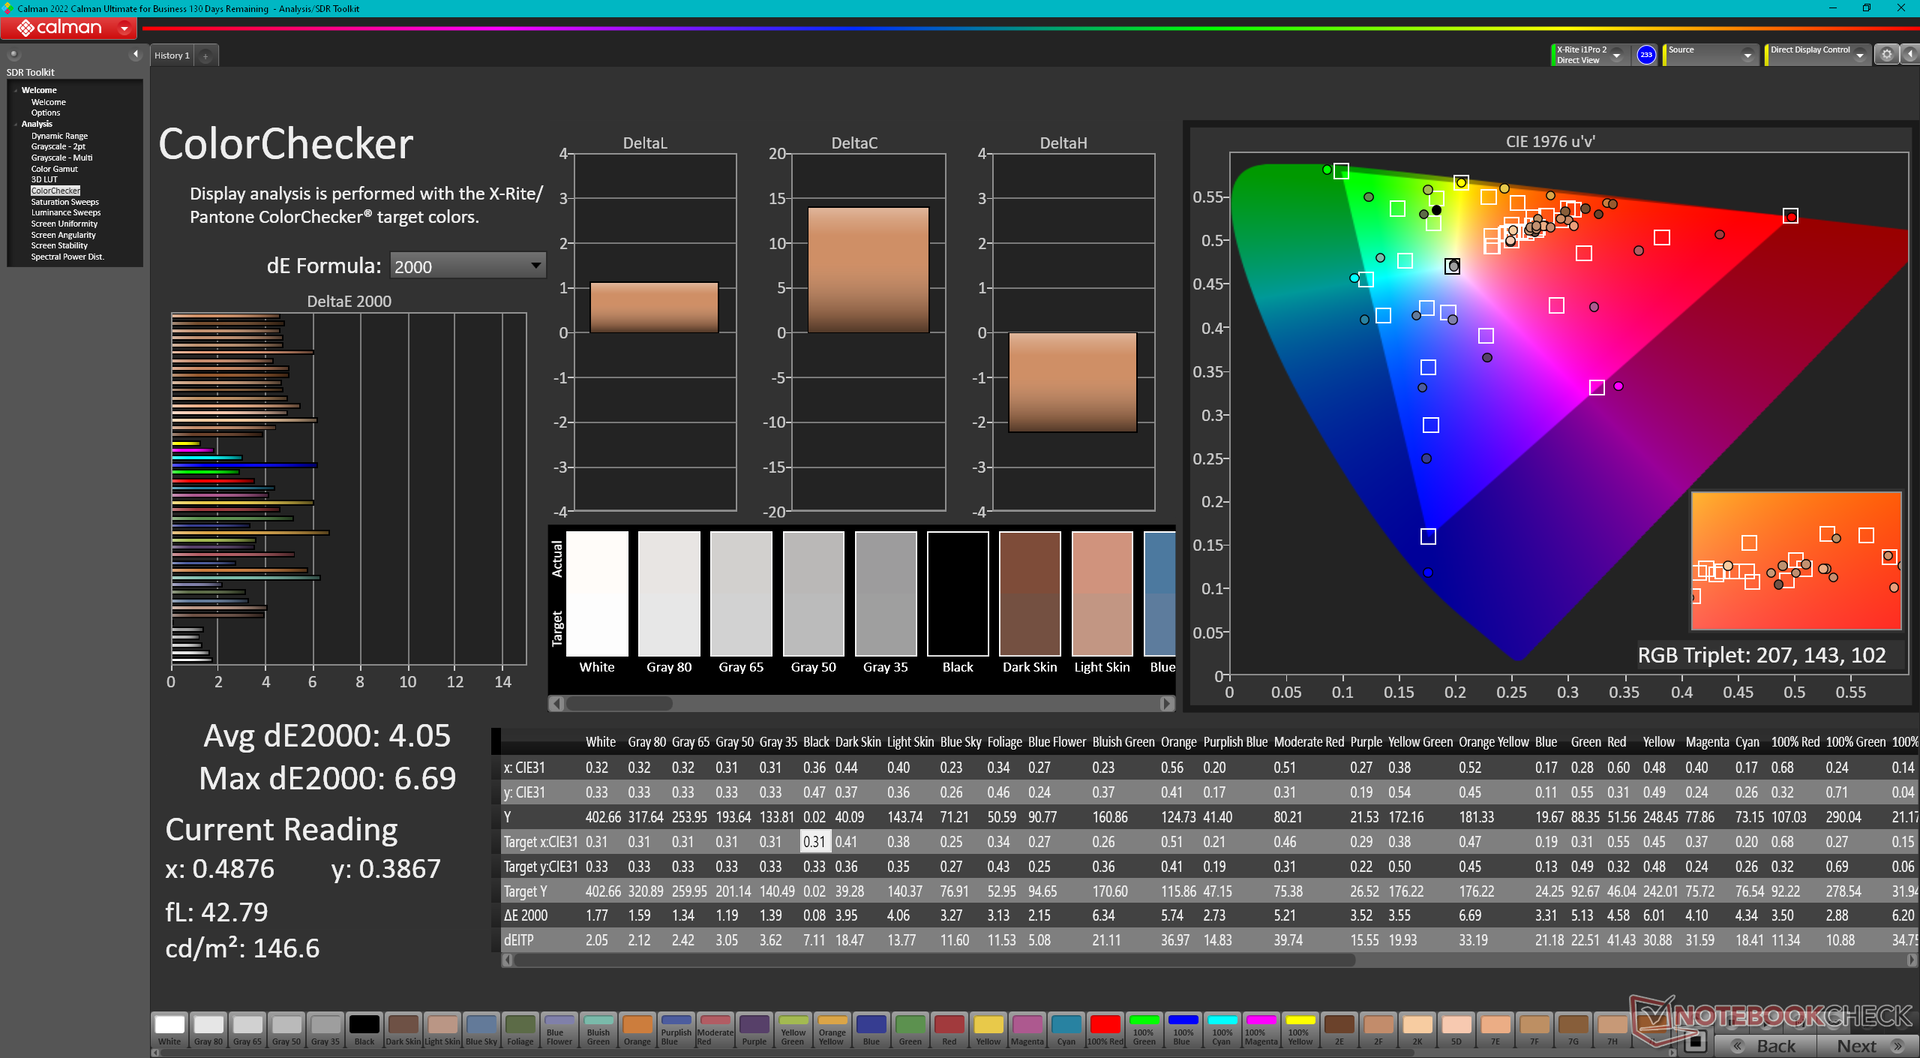
ΔE ColorChecker Calman: 4.05 | ∀{0.5-29.43 Ø4.71}
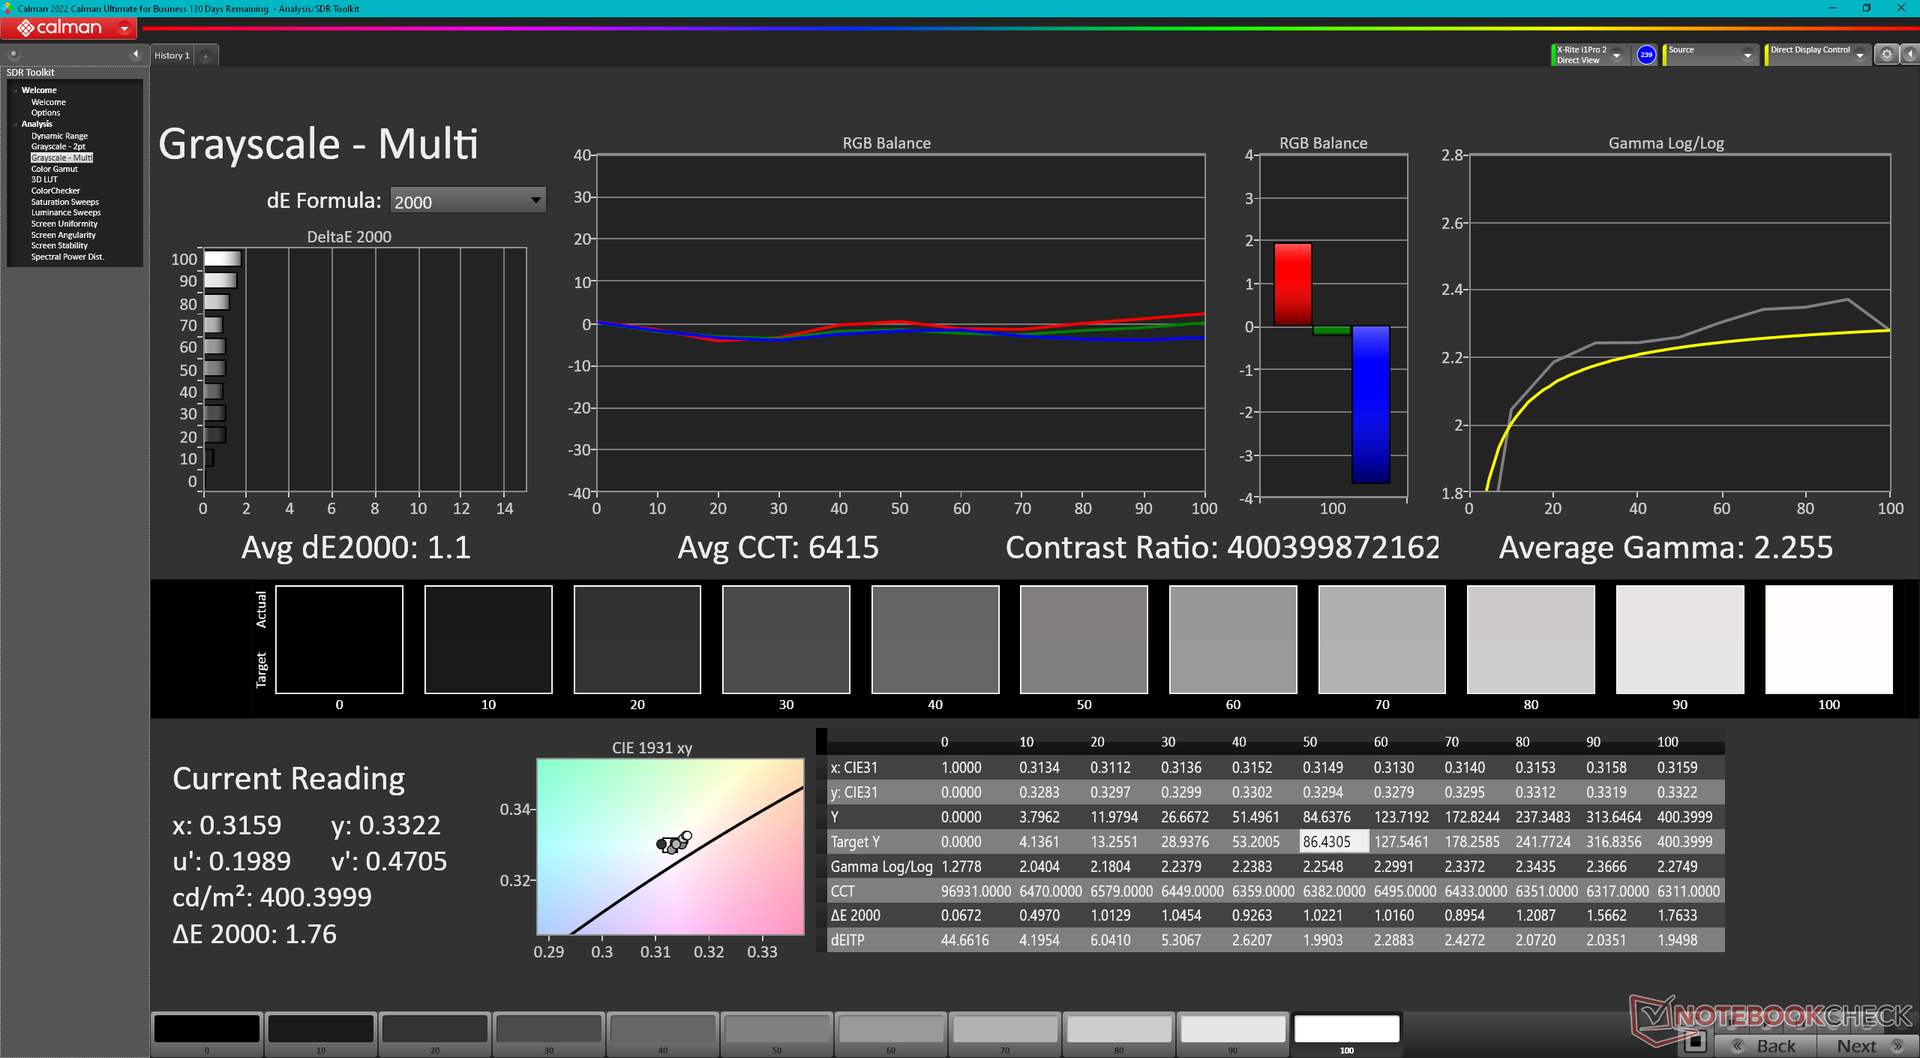
calibrated: 1.02
ΔE Greyscale Calman: 1.1 | ∀{0.09-98 Ø4.96}
96.5% AdobeRGB 1998 (Argyll 3D)
100% sRGB (Argyll 3D)
99.6% Display P3 (Argyll 3D)
Gamma: 2.27
CCT: 6419 K
| HP Envy x360 2-in-1 16-ad0097nr Samsung SDC41A6, OLED, 2880x1800, 16" | HP Envy 16 h0112nr Samsung SDC4174, OLED, 3840x2400, 16" | HP Spectre x360 16 RTX 4050 Samsung SDC41A6, OLED, 2880x1800, 16" | Lenovo Yoga 7 2-in-1 16IML9 LEN160FHD, IPS, 1920x1200, 16" | Samsung Galaxy Book4 Pro 360 ATNA60CL09-0, OLED, 2880x1800, 16" | LG Gram 2in1 16 16T90R - G.AA78G LP160WQ1-SPB2, IPS, 2560x1600, 16" | |
|---|---|---|---|---|---|---|
| Display | -3% | 0% | -51% | 0% | -5% | |
| Display P3 Coverage (%) | 99.6 | 99.3 0% | 99.6 0% | 40.9 -59% | 99.9 0% | 96.5 -3% |
| sRGB Coverage (%) | 100 | 100 0% | 100 0% | 61.4 -39% | 100 0% | 99.9 0% |
| AdobeRGB 1998 Coverage (%) | 96.5 | 88 -9% | 96.7 0% | 42.3 -56% | 96.6 0% | 84.6 -12% |
| Response Times | -132% | 3% | -3131% | 32% | -3502% | |
| Response Time Grey 50% / Grey 80% * (ms) | 0.8 ? | 2 ? -150% | 0.78 ? 2% | 32.1 ? -3913% | 0.49 ? 39% | 38.4 ? -4700% |
| Response Time Black / White * (ms) | 0.89 ? | 1.9 ? -113% | 0.86 ? 3% | 21.8 ? -2349% | 0.67 ? 25% | 21.4 ? -2304% |
| PWM Frequency (Hz) | 491.8 ? | 240.4 ? | 480 ? | 240 ? | ||
| Screen | 3% | -8% | -84% | 14% | -68% | |
| Brightness middle (cd/m²) | 399.4 | 328.8 -18% | 385.2 -4% | 313.3 -22% | 387 -3% | 329 -18% |
| Brightness (cd/m²) | 405 | 332 -18% | 387 -4% | 294 -27% | 392 -3% | 310 -23% |
| Brightness Distribution (%) | 98 | 97 -1% | 99 1% | 82 -16% | 98 0% | 88 -10% |
| Black Level * (cd/m²) | 0.35 | 0.39 | ||||
| Colorchecker dE 2000 * | 4.05 | 1.53 62% | 1.73 57% | 4.41 -9% | 1 75% | 3.52 13% |
| Colorchecker dE 2000 max. * | 6.69 | 6.04 10% | 3.95 41% | 15.75 -135% | 1.9 72% | 6.96 -4% |
| Colorchecker dE 2000 calibrated * | 1.02 | 1.84 -80% | 1.15 -13% | |||
| Greyscale dE 2000 * | 1.1 | 1.3 -18% | 2.6 -136% | 4.4 -300% | 1.7 -55% | 5.75 -423% |
| Gamma | 2.27 97% | 2.18 101% | 2.17 101% | 2.3 96% | 2.25 98% | 2.137 103% |
| CCT | 6419 101% | 6362 102% | 6133 106% | 7395 88% | 6325 103% | 7584 86% |
| Contrast (:1) | 895 | 844 | ||||
| Média Total (Programa/Configurações) | -44% /
-23% | -2% /
-4% | -1089% /
-584% | 15% /
14% | -1192% /
-625% |
* ... menor é melhor
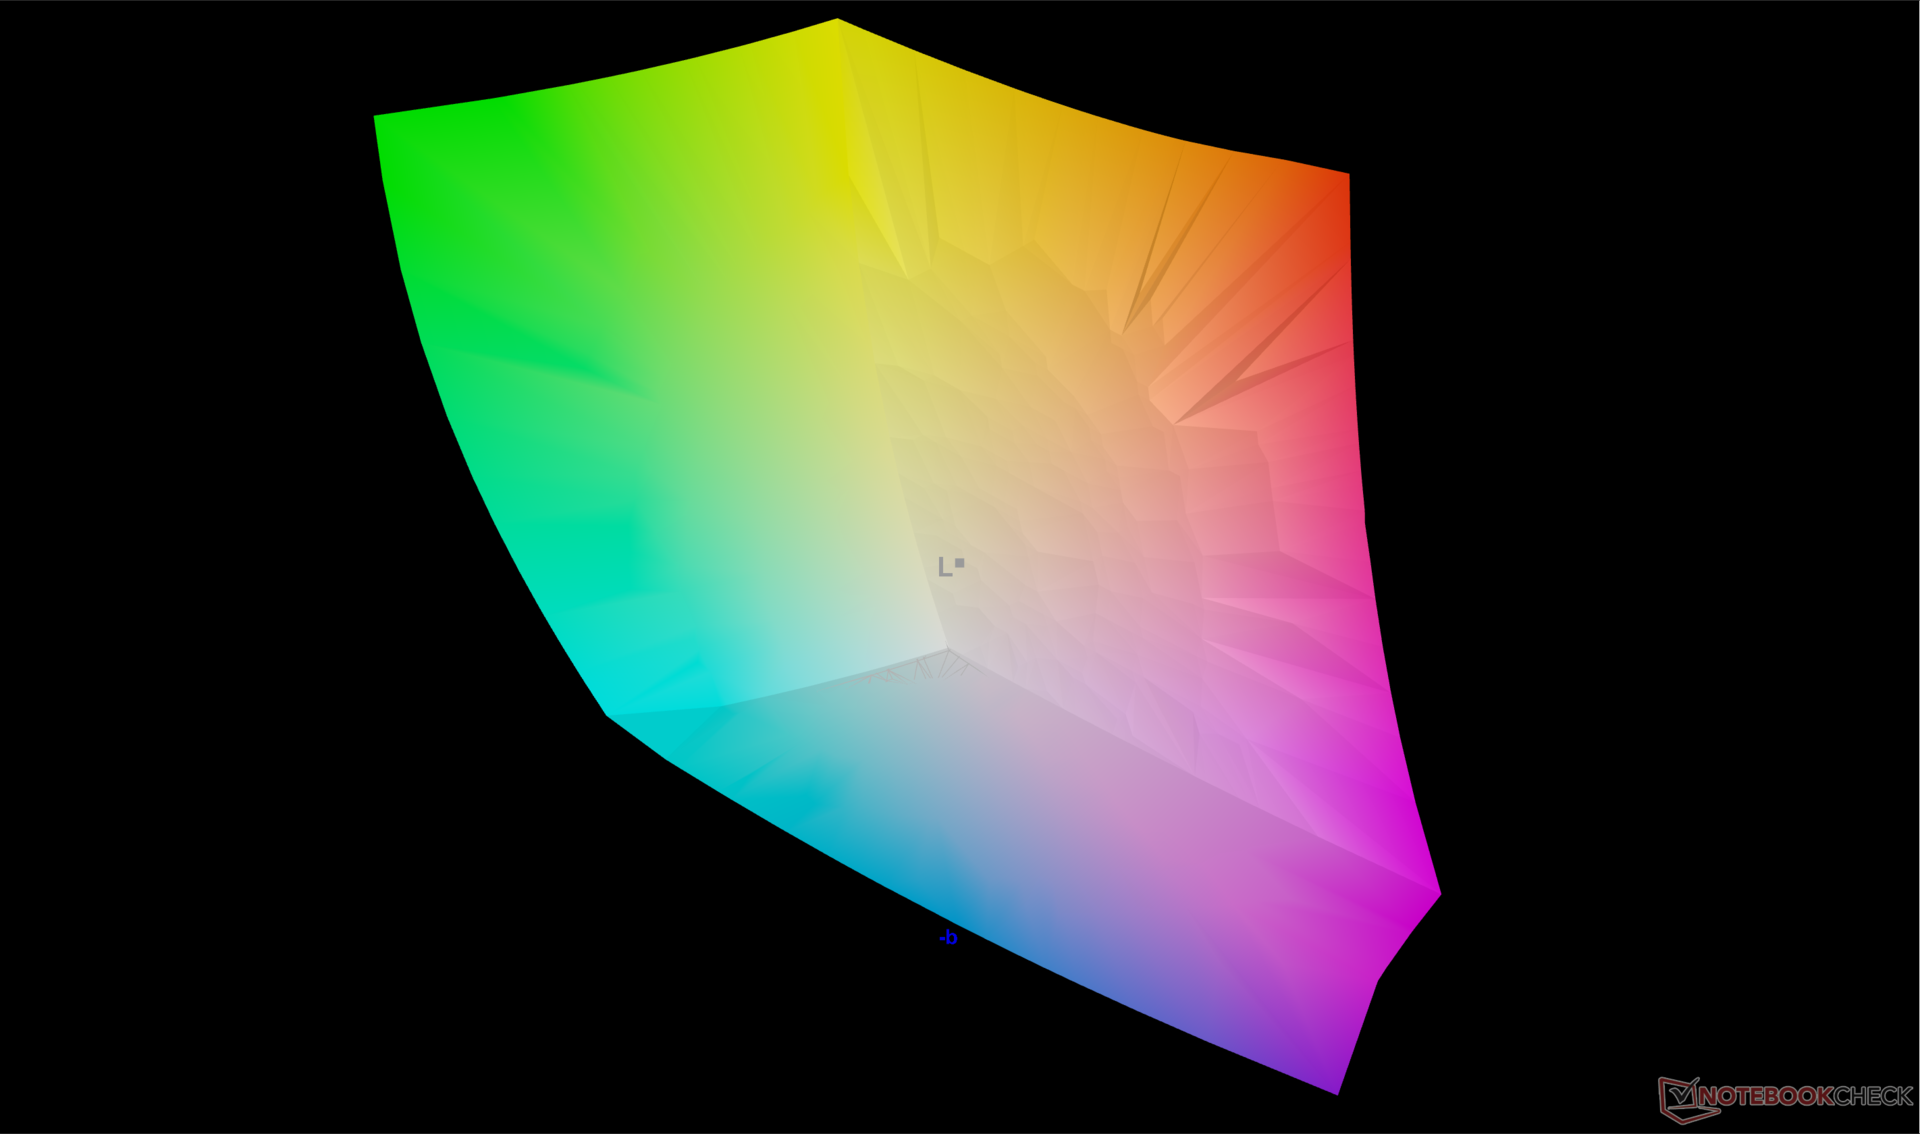
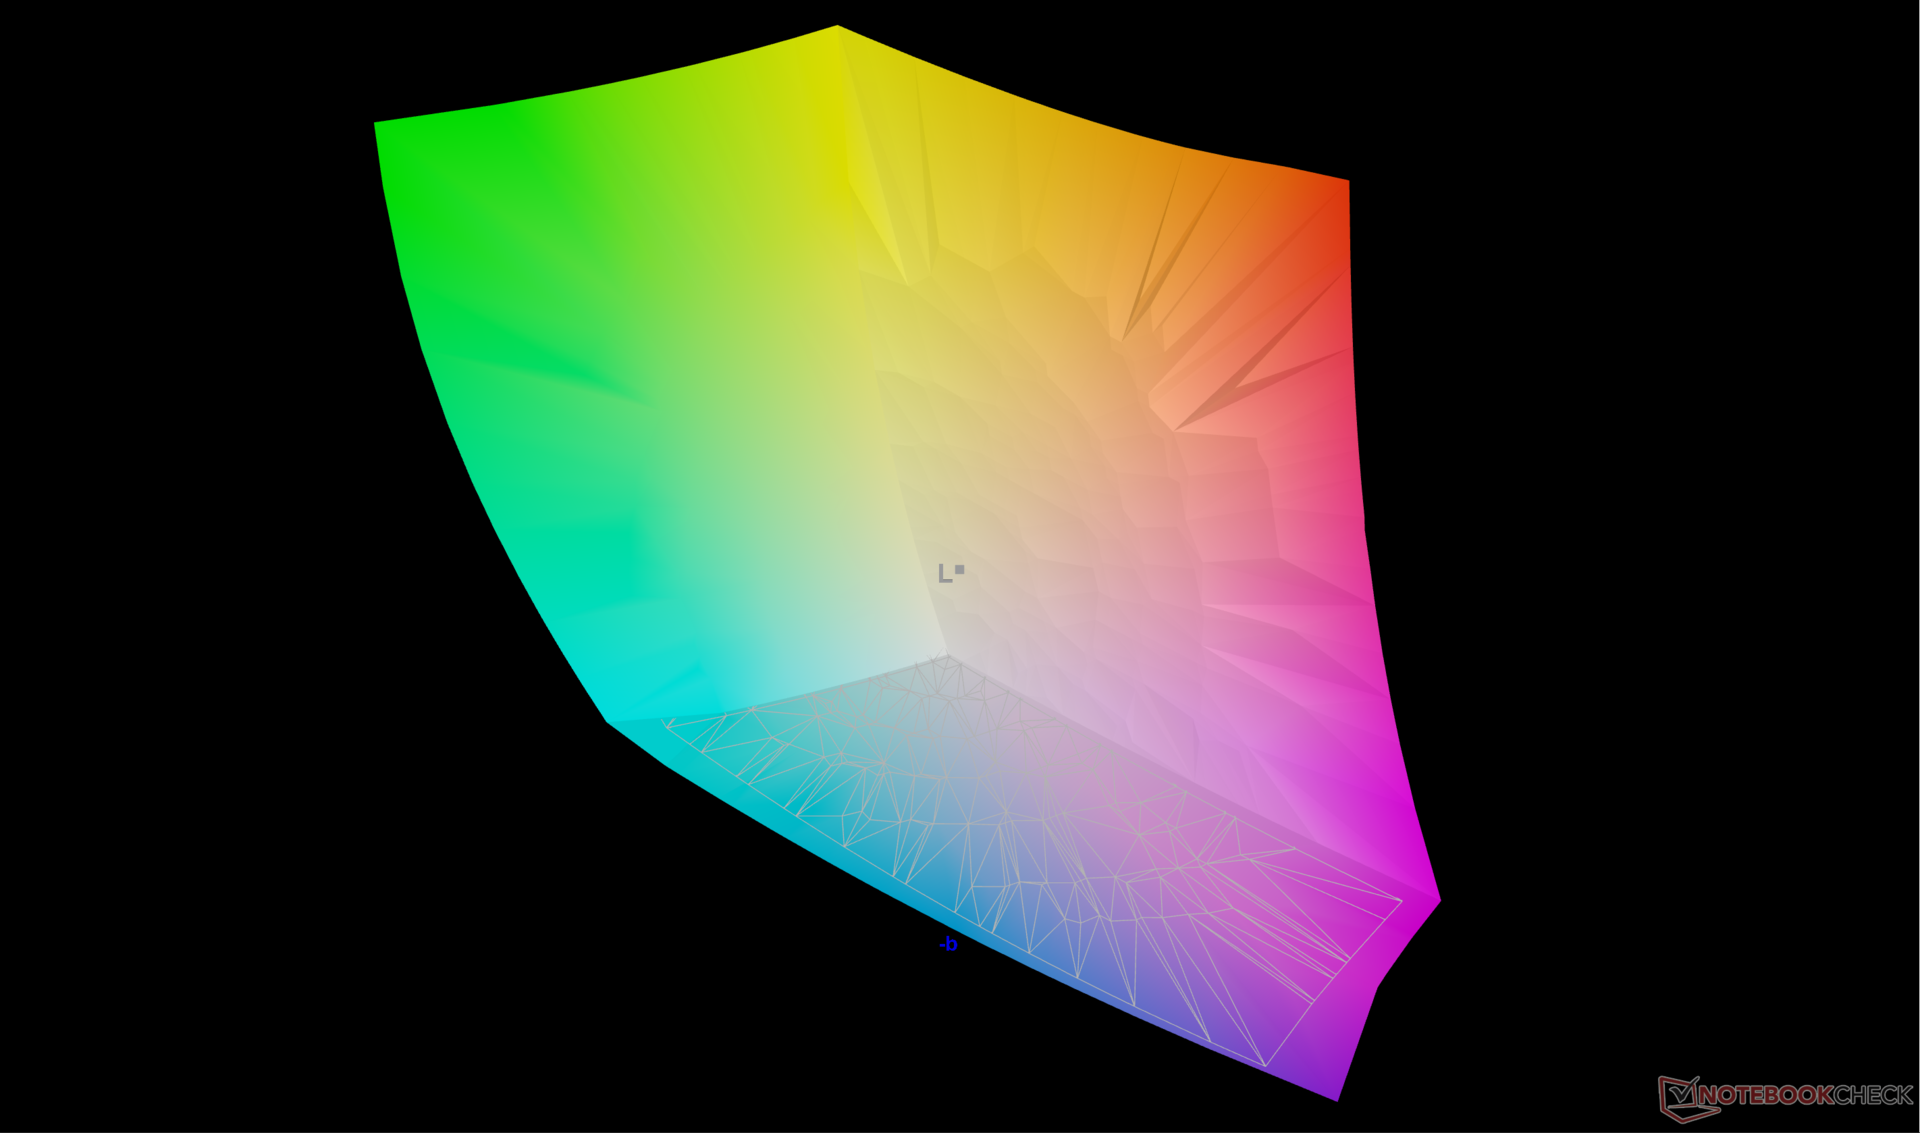
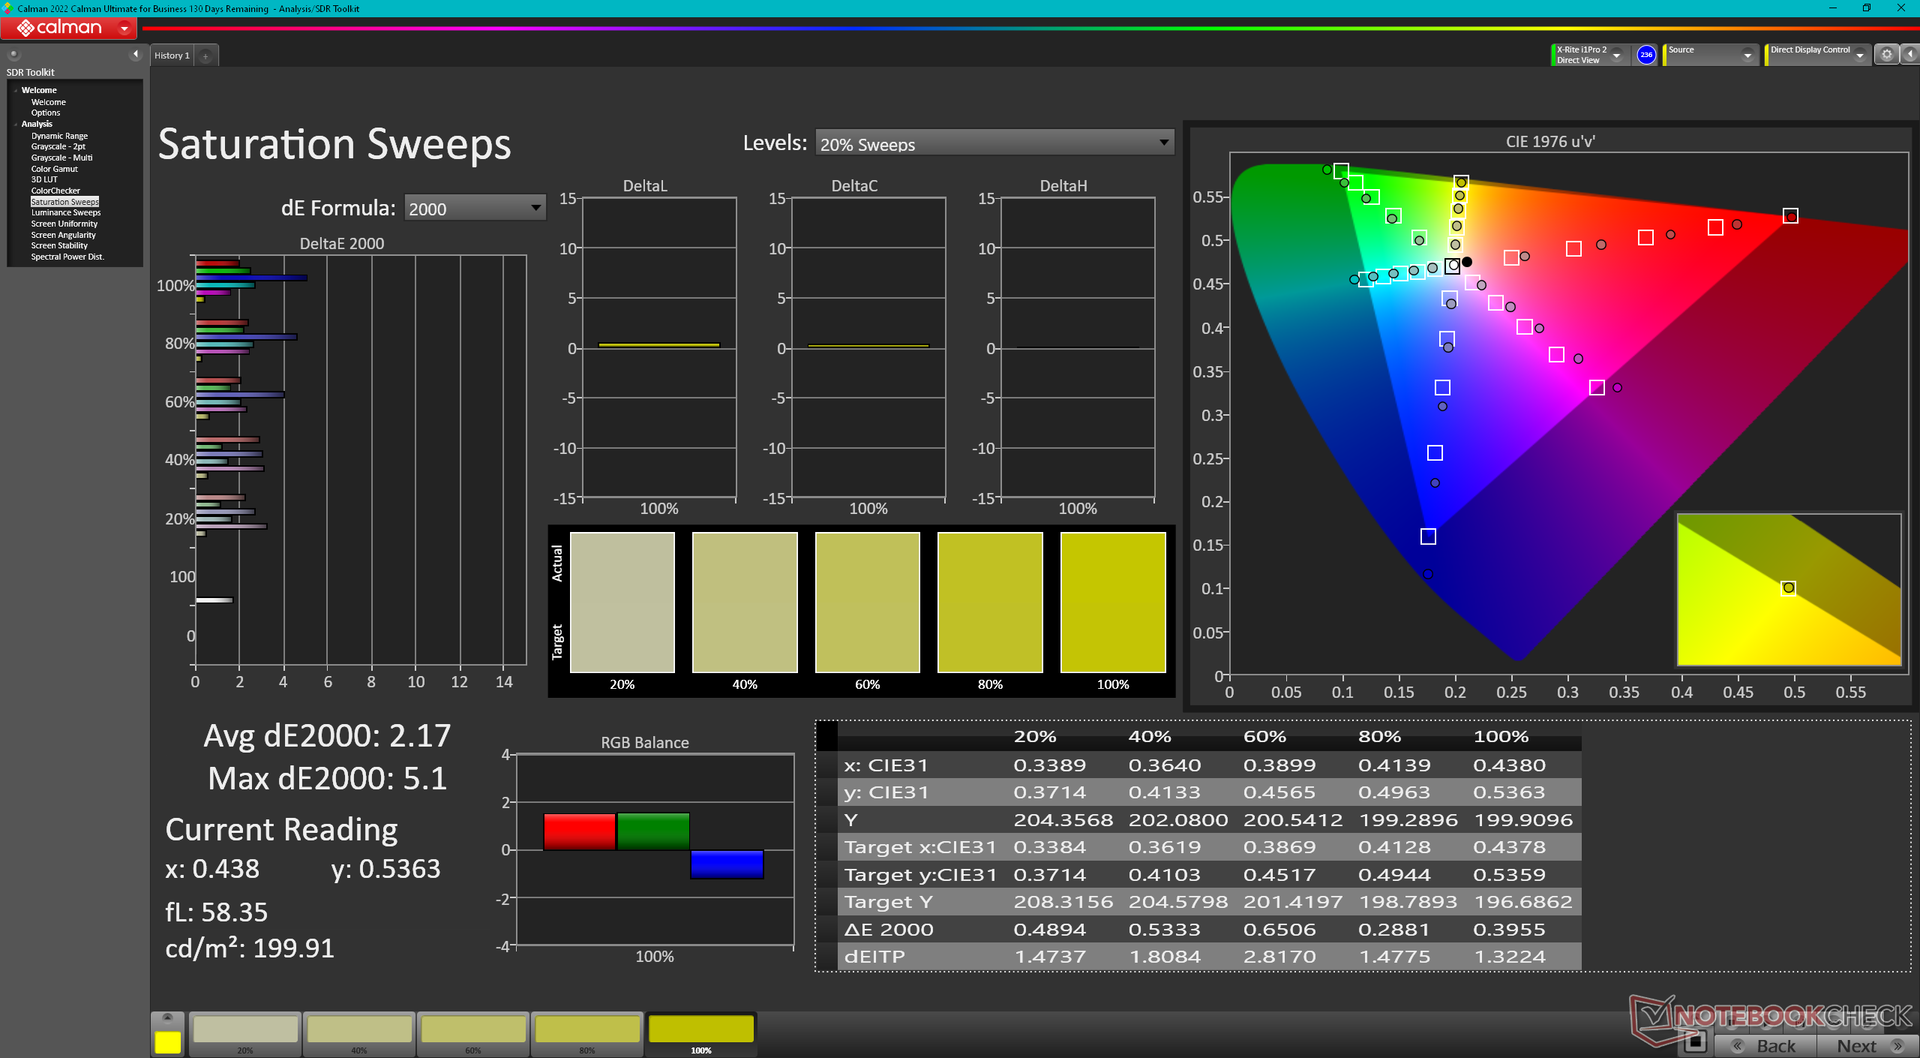
A tela é bem calibrada em relação ao padrão P3, com valores médios de deltaE de escala de cinza e cor prontos para uso de apenas 1,1 e 4,05, respectivamente.
Exibir tempos de resposta
| ↔ Tempo de resposta preto para branco | ||
|---|---|---|
| 0.89 ms ... ascensão ↗ e queda ↘ combinadas | ↗ 0.42 ms ascensão | 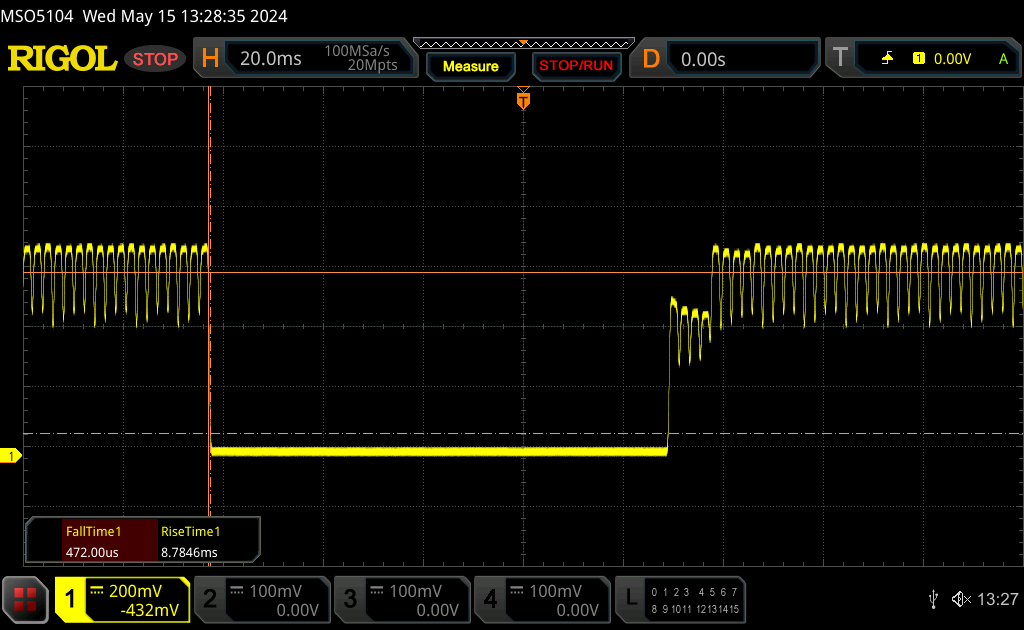 |
| ↘ 0.47 ms queda | ||
| A tela mostra taxas de resposta muito rápidas em nossos testes e deve ser muito adequada para jogos em ritmo acelerado. Em comparação, todos os dispositivos testados variam de 0.1 (mínimo) a 240 (máximo) ms. » 3 % de todos os dispositivos são melhores. Isso significa que o tempo de resposta medido é melhor que a média de todos os dispositivos testados (19.8 ms). | ||
| ↔ Tempo de resposta 50% cinza a 80% cinza | ||
| 0.8 ms ... ascensão ↗ e queda ↘ combinadas | ↗ 0.45 ms ascensão | 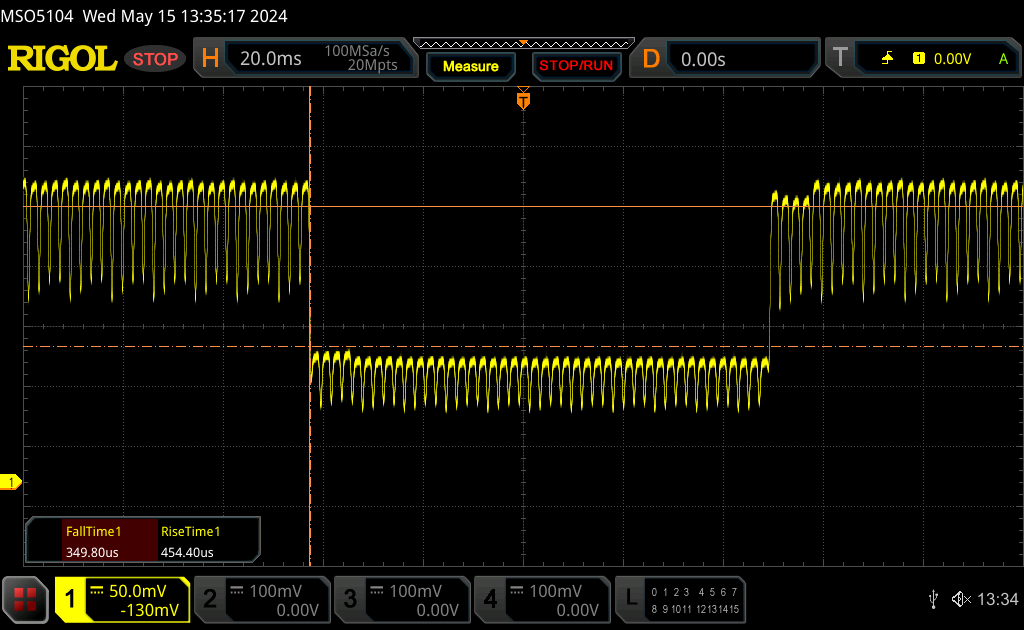 |
| ↘ 0.35 ms queda | ||
| A tela mostra taxas de resposta muito rápidas em nossos testes e deve ser muito adequada para jogos em ritmo acelerado. Em comparação, todos os dispositivos testados variam de 0.165 (mínimo) a 636 (máximo) ms. » 3 % de todos os dispositivos são melhores. Isso significa que o tempo de resposta medido é melhor que a média de todos os dispositivos testados (31 ms). | ||
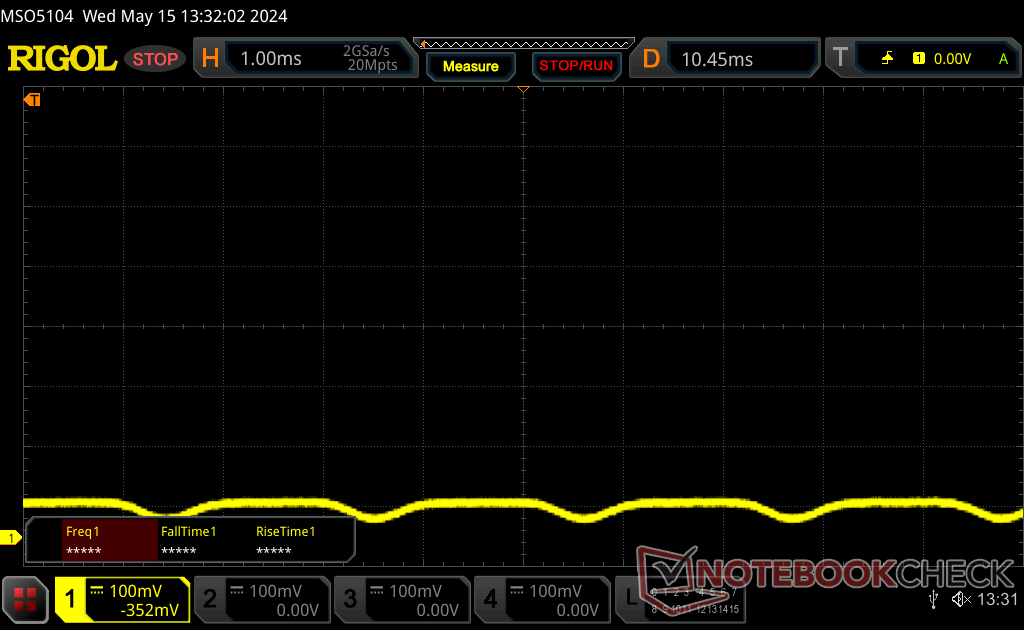
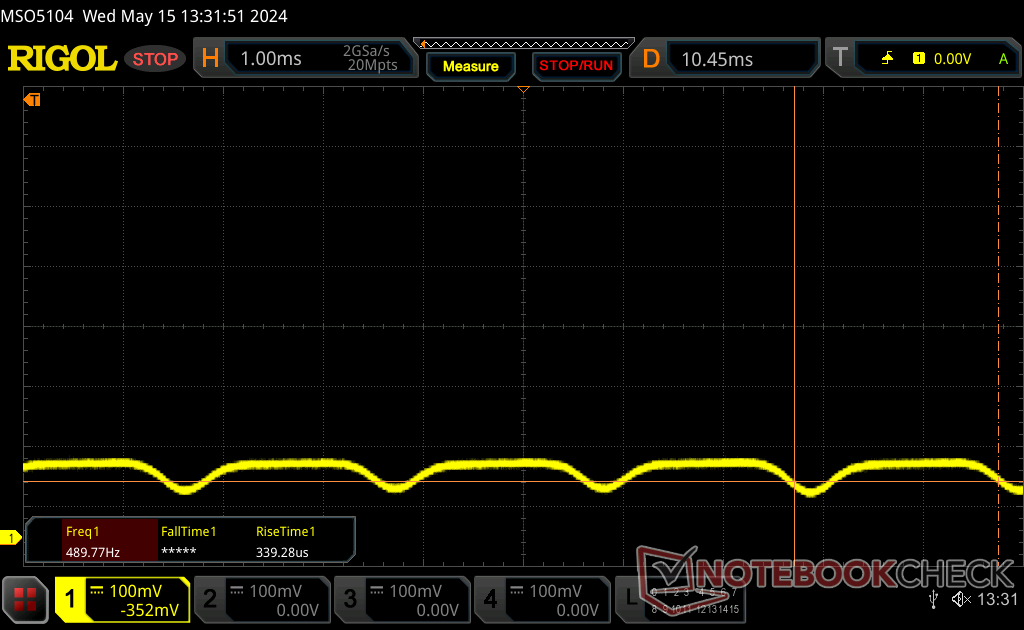
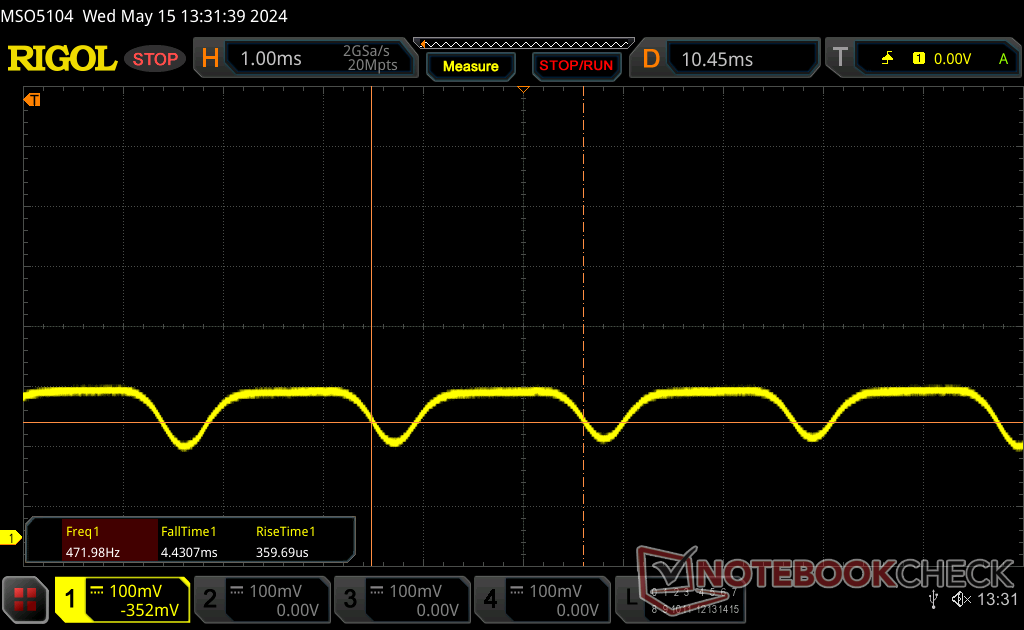
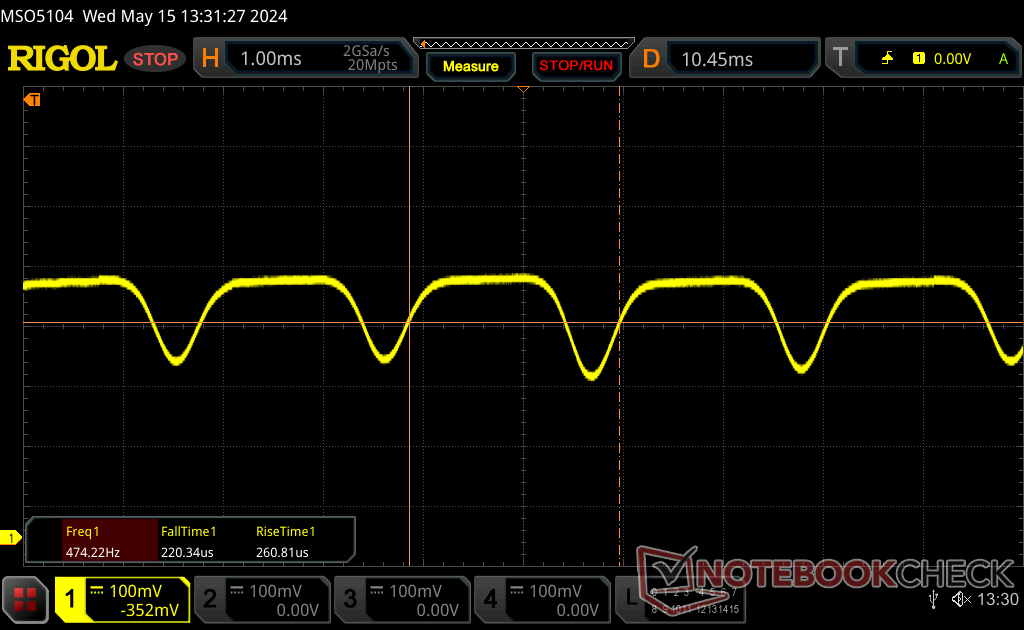
Cintilação da tela / PWM (modulação por largura de pulso)
| Tela tremeluzindo/PWM detectado | 491.8 Hz | ≤ 100 % configuração de brilho | 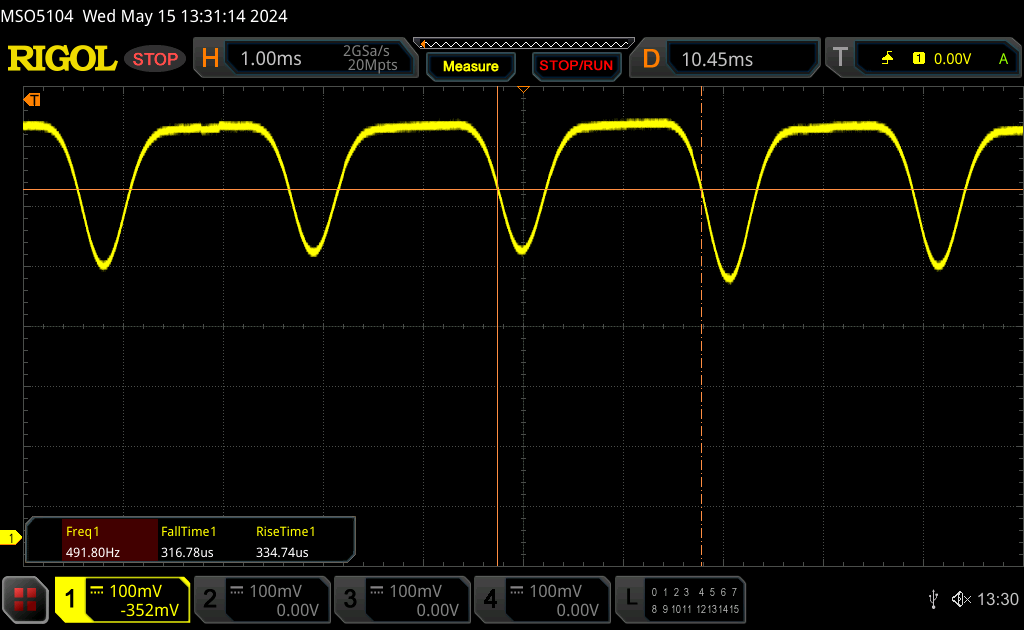 |
A luz de fundo da tela pisca em 491.8 Hz (pior caso, por exemplo, utilizando PWM) Cintilação detectada em uma configuração de brilho de 100 % e abaixo. Não deve haver cintilação ou PWM acima desta configuração de brilho. A frequência de 491.8 Hz é relativamente alta, portanto, a maioria dos usuários sensíveis ao PWM não deve notar nenhuma oscilação. No entanto, há relatos de que alguns usuários ainda são sensíveis ao PWM em 500 Hz e acima, portanto, esteja atento. [pwm_comparison] Em comparação: 52 % de todos os dispositivos testados não usam PWM para escurecer a tela. Se PWM foi detectado, uma média de 7757 (mínimo: 5 - máximo: 343500) Hz foi medida. | |||
A modulação de largura de pulso está presente em todos os níveis de brilho, inclusive na configuração máxima. Sua frequência permaneceria constante em 492 Hz em toda a faixa de brilho, enquanto a maioria dos outros painéis OLED pode mudar entre duas frequências diferentes, dependendo do nível de brilho. Isso ocorre porque a HP utiliza escurecimento DC, enquanto a maioria dos outros painéis OLED simplesmente alterna a luz de fundo para controlar o brilho.
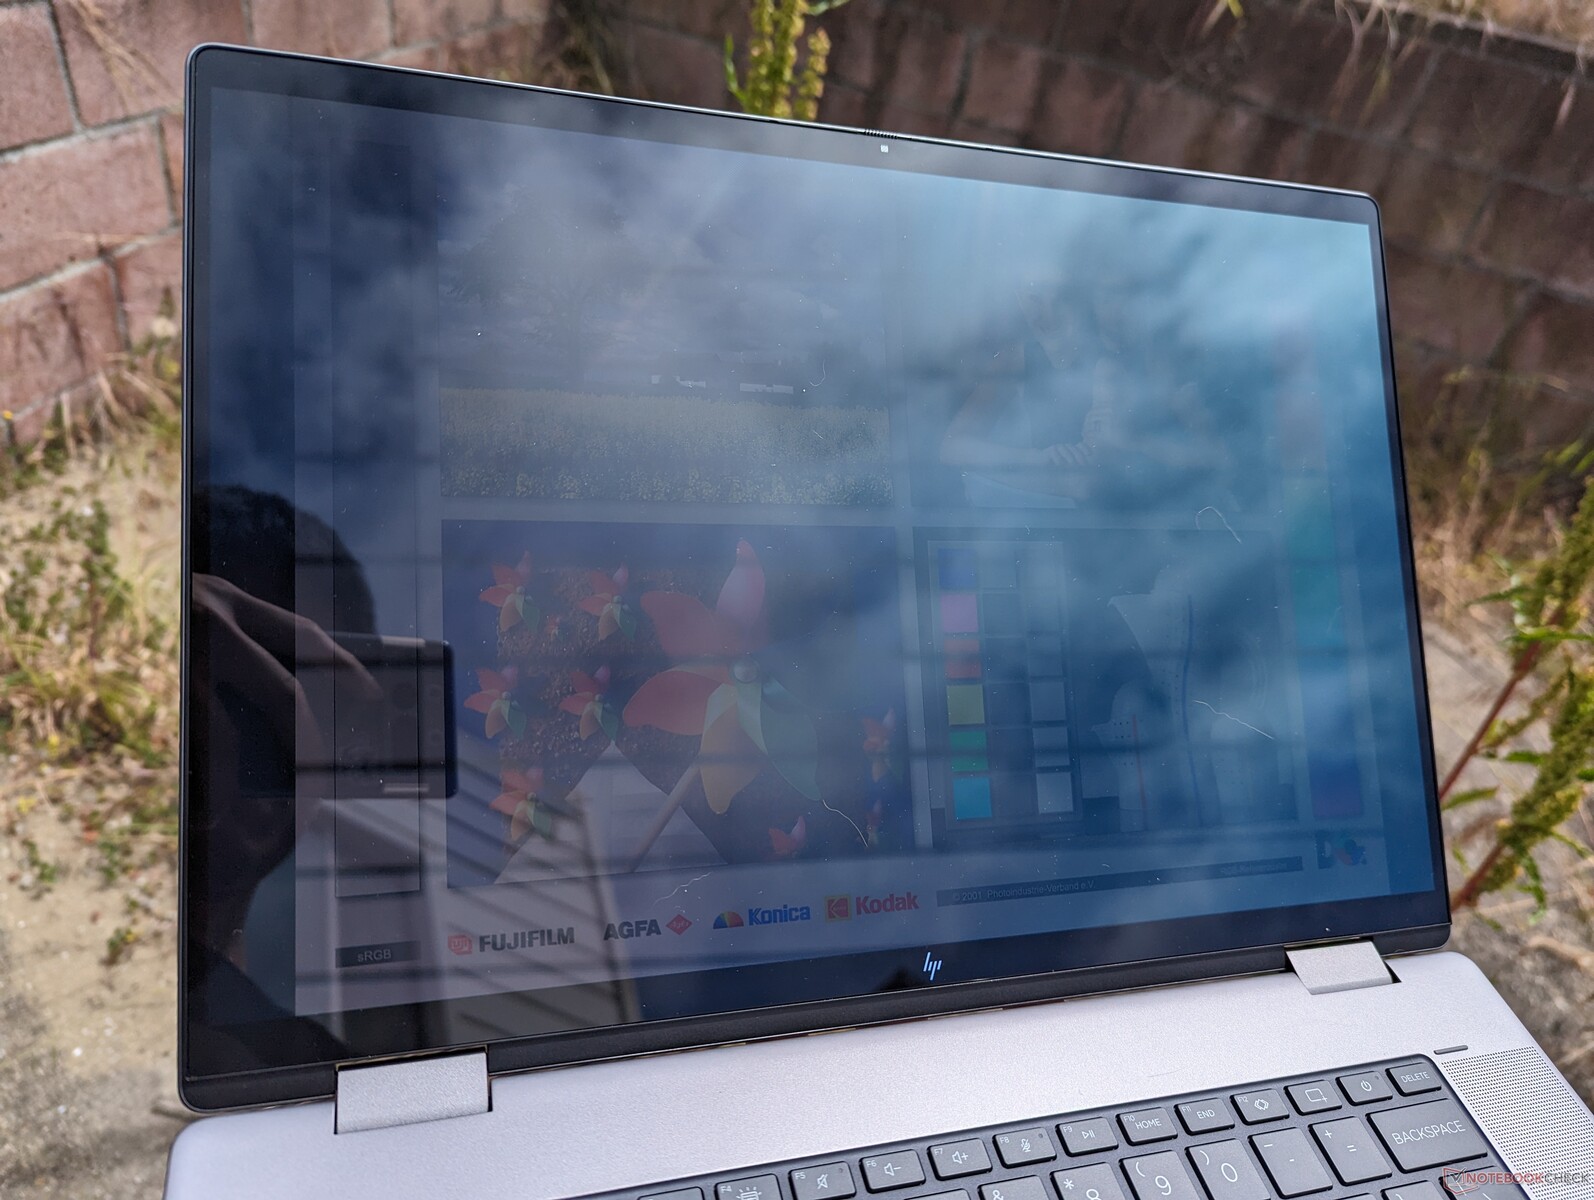
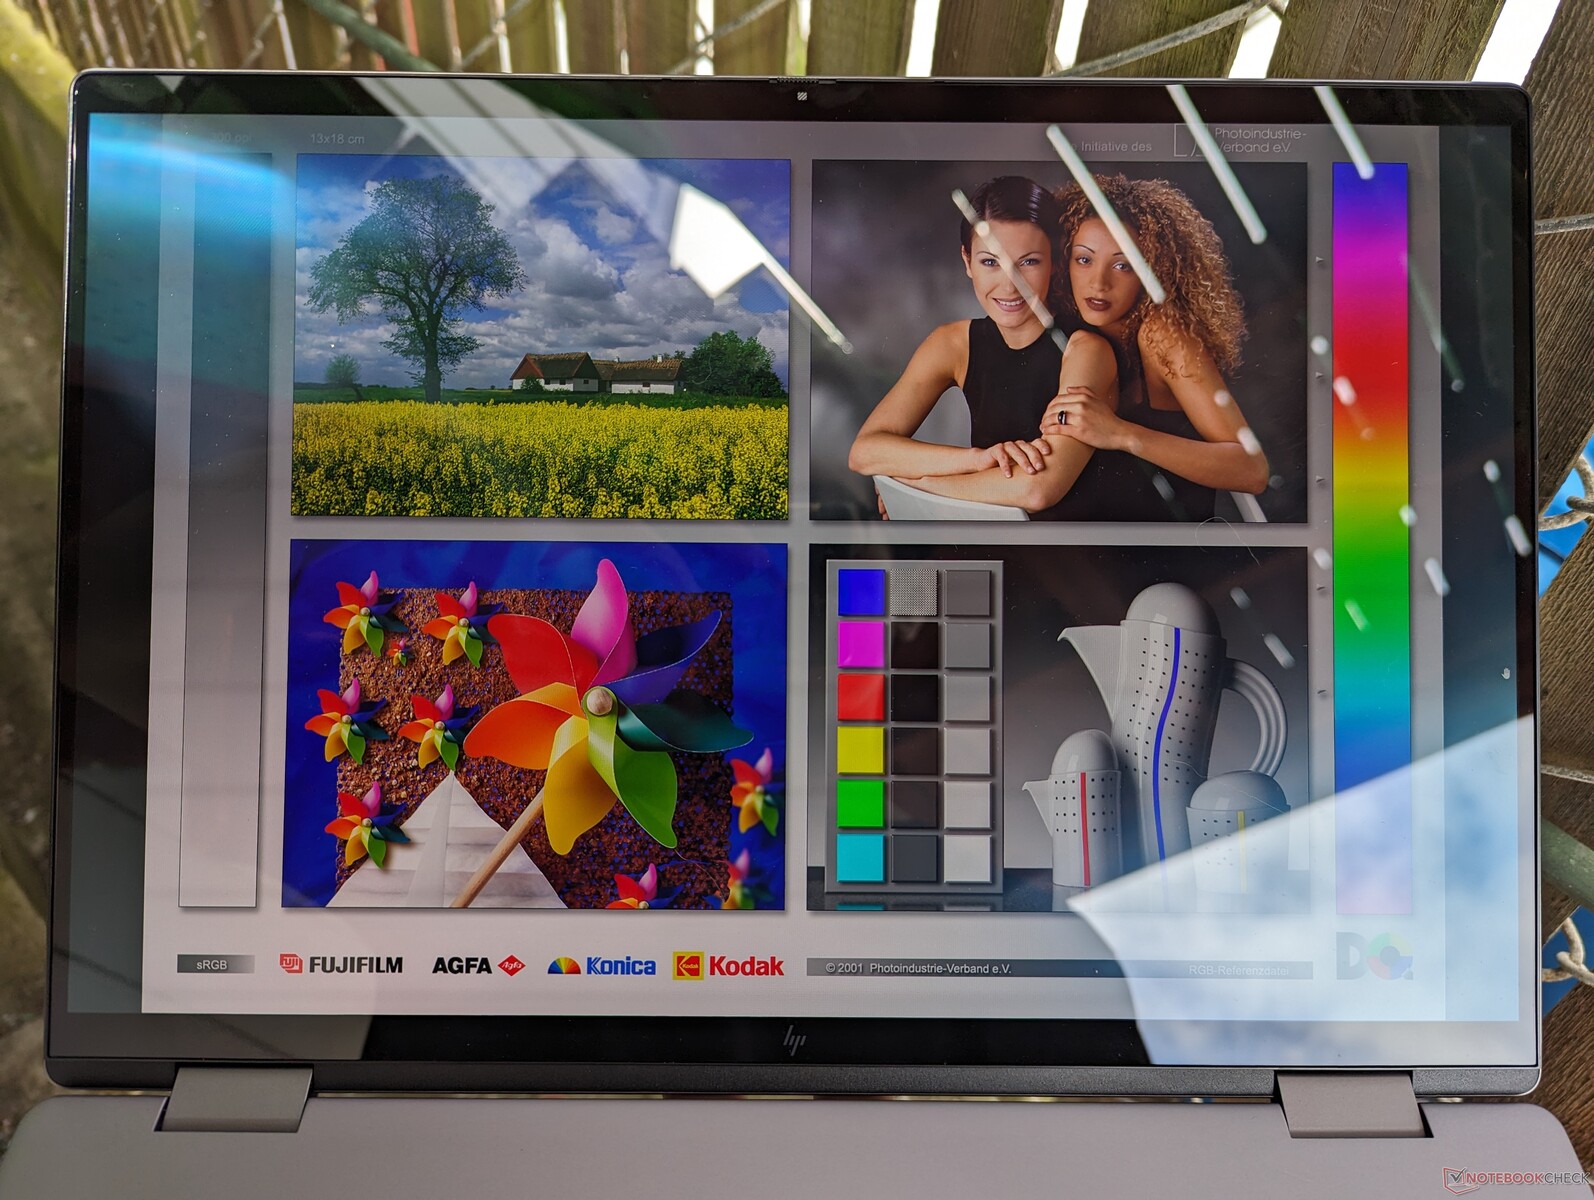
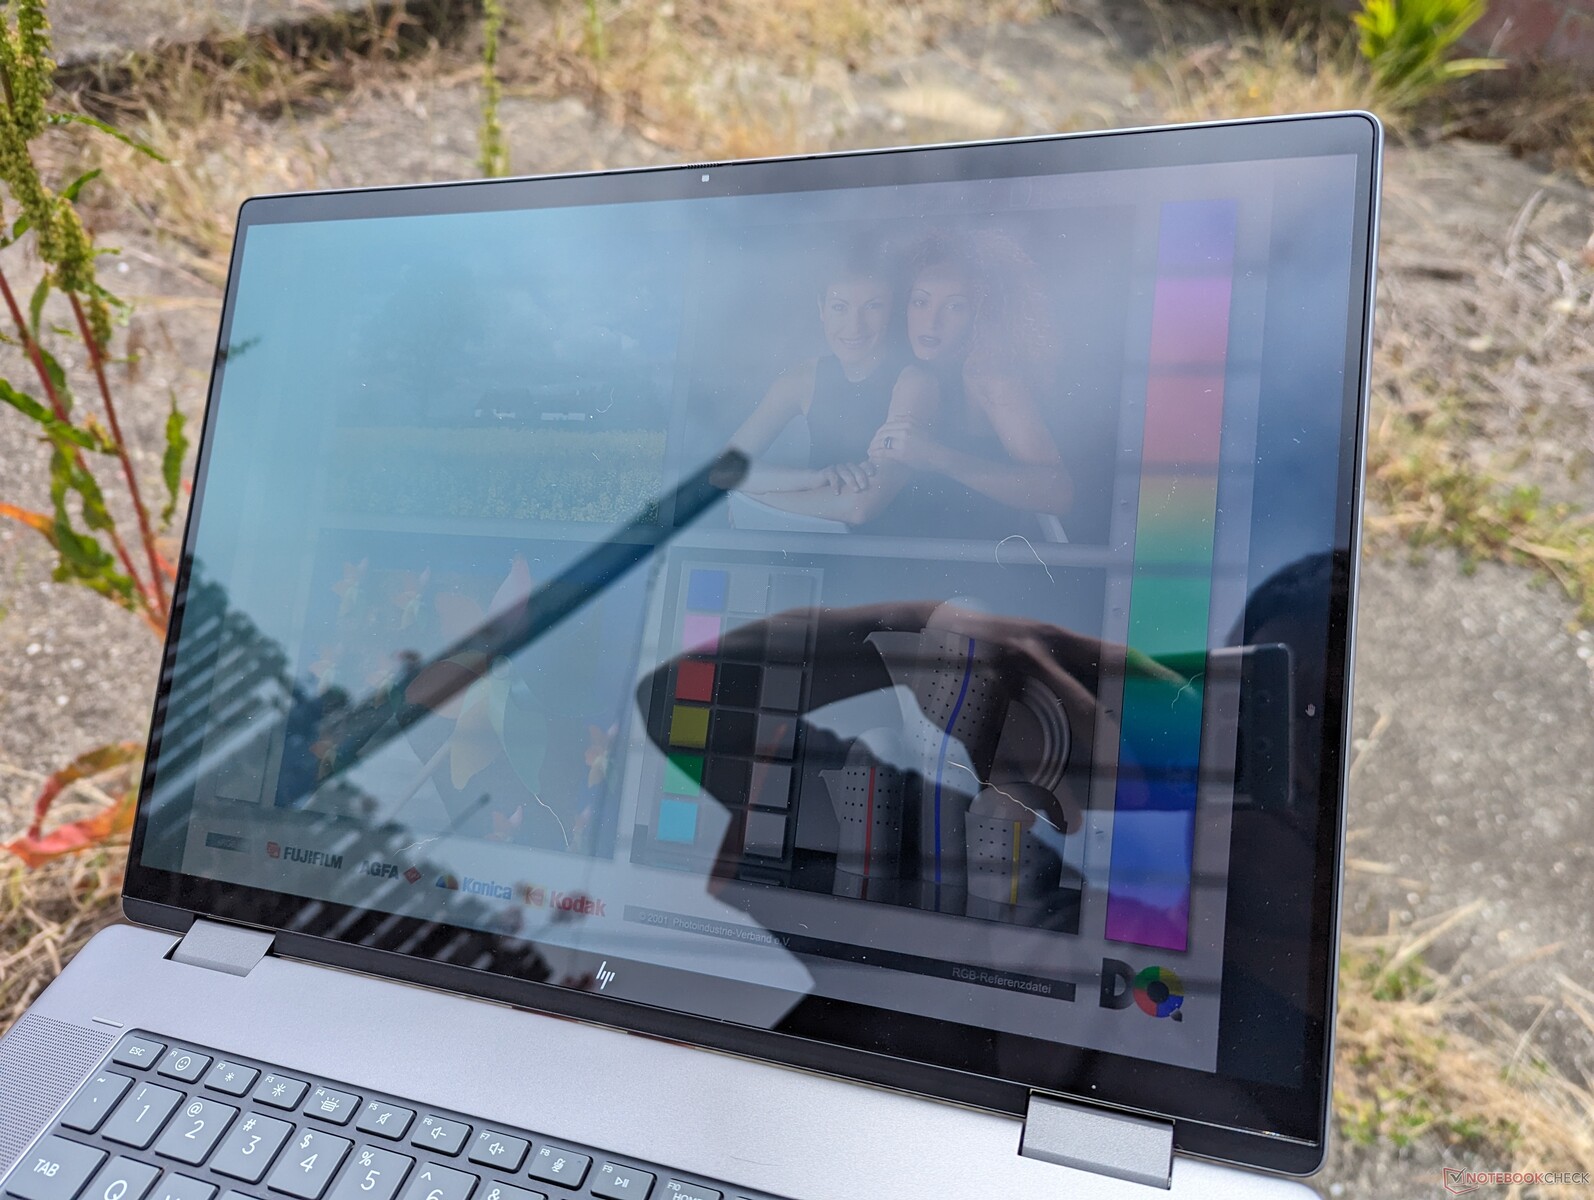
O brilho na tela brilhante é quase inevitável quando se trabalha ao ar livre. A luz de fundo não é potente o suficiente para superar a iluminação ambiente, mas o brilho ainda pode ser reduzido a níveis mais visíveis se o senhor estiver sob a sombra.

Desempenho - O Ryzen 7 8840HS não é necessariamente melhor do que o Ryzen 7 7840HS
Condições de teste
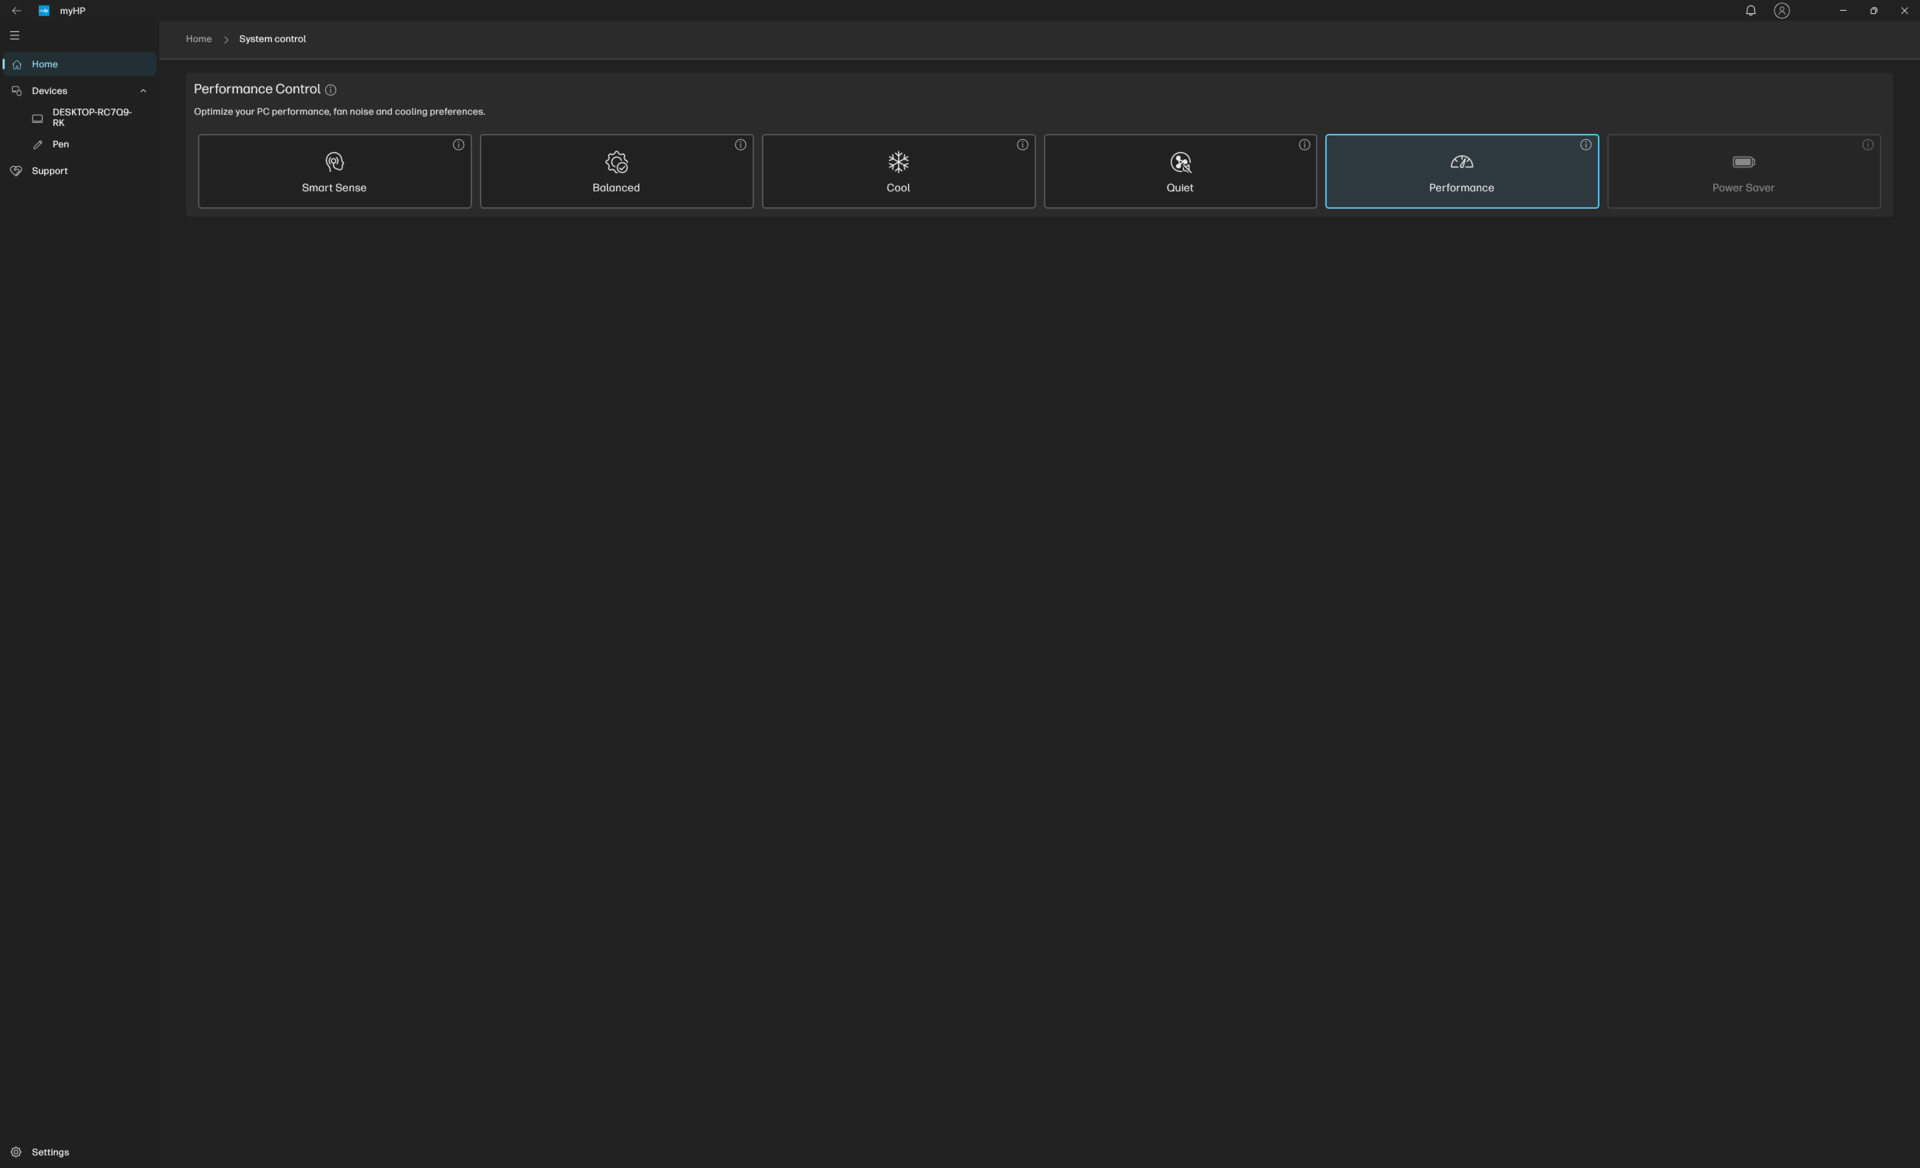
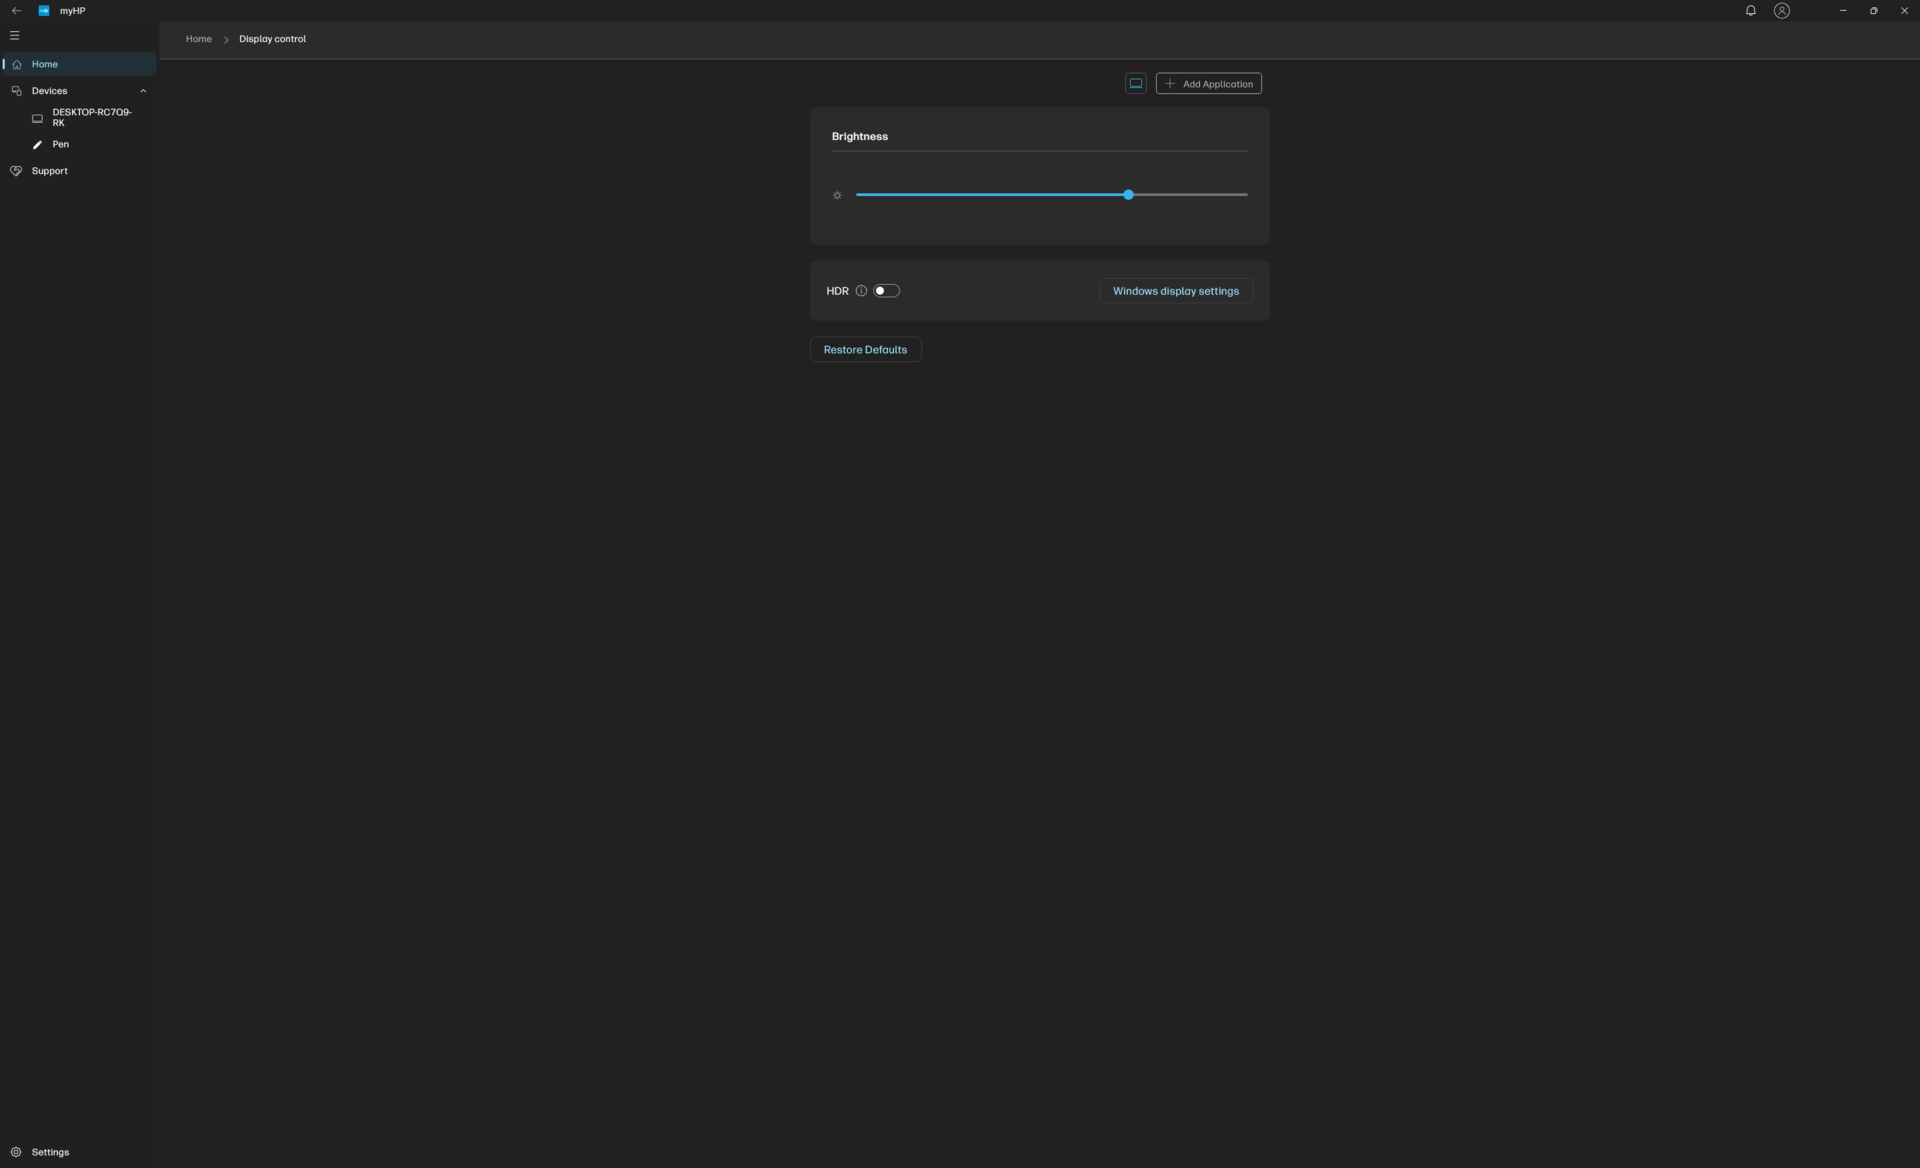
Definimos o MyHP e o Windows para o modo Desempenho antes de executar os benchmarks abaixo. O que é irritante é que o ajuste do perfil de energia pelo Windows não altera automaticamente o perfil de energia no MyHP e vice-versa. Os notebooks da Dell permitem que o senhor sincronize convenientemente diferentes conjuntos de perfis de energia em comparação.
O software MyHP certamente pode ser melhorado em termos de capacidade de resposta e recursos. O aplicativo em si é iniciado muito lentamente e as opções de exibição são pálidas em comparação com as opções disponíveis nos modelos Asus ZenBook/VivoBook OLED, onde os usuários podem ajustar a temperatura da cor, o nível de luz azul, o protetor de tela, a gama de cores e muito mais.

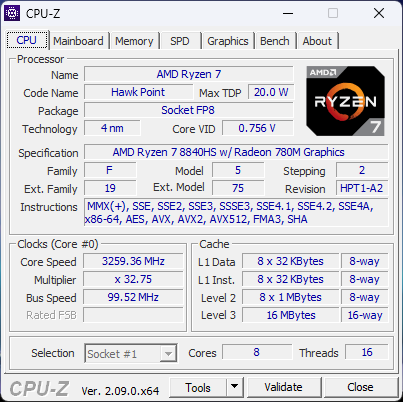
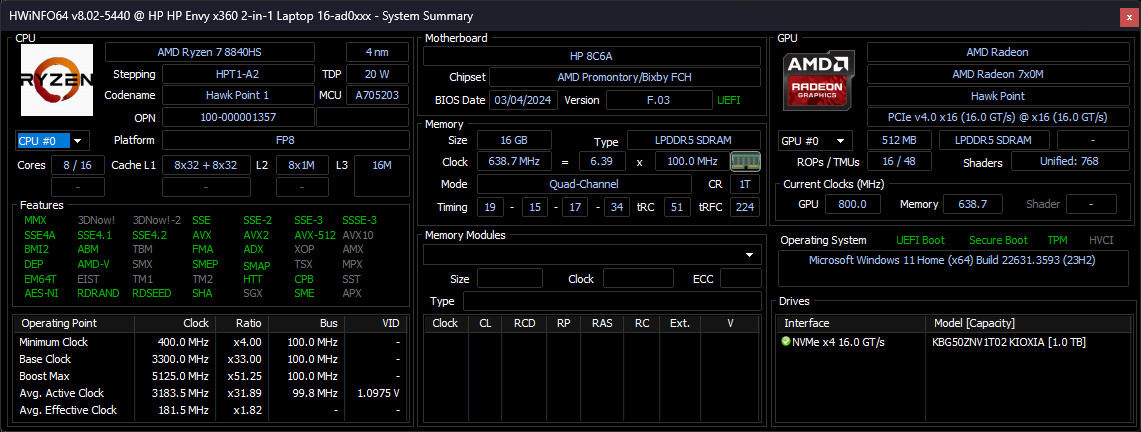
Processador
O Ryzen 7 8840HS substitui o Ryzen 7 7840HS do ano passado do ano passado, que era uma CPU móvel de classe gamer encontrada em laptops de alto desempenho como o Lenovo Legion Slim 7 16. Assim como na série Intel Meteor Lake, a nova CPU da AMD integra uma NPU para acelerar os aplicativos locais de IA, que devem se tornar comuns no próximo ano.
Infelizmente, o desempenho multi-thread bruto é mais lento do que o Ryzen 7 7840HS mais antigo em cerca de 15 a 20 por cento, o que não é insignificante. Um déficit semelhante foi observado no mais recente Asus Zenbook 14 que também vem com a mesma CPU do nosso HP. O déficit pode ser atribuído à faixa de TDP mais baixa da nova CPU (20 a 30 W vs. 35 a 54 W) e à NPU "calçada" que ocupa um espaço valioso na matriz que, de outra forma, seria reservado para funções não relacionadas à IA. Portanto, o desempenho geral está mais próximo da 12ª geração do Core i7-12700H encontrado no 2022 Envy 16 clamshell.
O Ryzen 7 8840HS não é lento de forma alguma, pois ainda supera o Intel Core Ultra 5 125U e Ultra 7 155U Envy x360 16 em 35 a 40 por cento cada. Para realmente aproveitar ao máximo a CPU AMD, no entanto, o senhor vai querer executar tarefas locais de IA quando elas se tornarem mais disponíveis.
Cinebench R15 Multi Loop
Cinebench R23: Multi Core | Single Core
Cinebench R20: CPU (Multi Core) | CPU (Single Core)
Cinebench R15: CPU Multi 64Bit | CPU Single 64Bit
Blender: v2.79 BMW27 CPU
7-Zip 18.03: 7z b 4 | 7z b 4 -mmt1
Geekbench 6.7: Multi-Core | Single-Core
Geekbench 5.5: Multi-Core | Single-Core
HWBOT x265 Benchmark v2.2: 4k Preset
LibreOffice : 20 Documents To PDF
R Benchmark 2.5: Overall mean
* ... menor é melhor
AIDA64: FP32 Ray-Trace | FPU Julia | CPU SHA3 | CPU Queen | FPU SinJulia | FPU Mandel | CPU AES | CPU ZLib | FP64 Ray-Trace | CPU PhotoWorxx
| Performance rating | |
| Média AMD Ryzen 7 8840HS | |
| HP Envy x360 2-in-1 16-ad0097nr | |
| HP Spectre x360 16 RTX 4050 | |
| HP Envy 16 h0112nr | |
| LG Gram 2in1 16 16T90R - G.AA78G | |
| Samsung Galaxy Book4 Pro 360 | |
| Lenovo Yoga 7 2-in-1 16IML9 | |
| AIDA64 / FPU Julia | |
| Média AMD Ryzen 7 8840HS (71472 - 93550, n=5) | |
| HP Envy x360 2-in-1 16-ad0097nr | |
| HP Spectre x360 16 RTX 4050 | |
| HP Envy 16 h0112nr | |
| LG Gram 2in1 16 16T90R - G.AA78G | |
| Lenovo Yoga 7 2-in-1 16IML9 | |
| Samsung Galaxy Book4 Pro 360 | |
| AIDA64 / CPU SHA3 | |
| Média AMD Ryzen 7 8840HS (3559 - 4132, n=5) | |
| HP Envy x360 2-in-1 16-ad0097nr | |
| HP Spectre x360 16 RTX 4050 | |
| HP Envy 16 h0112nr | |
| LG Gram 2in1 16 16T90R - G.AA78G | |
| Lenovo Yoga 7 2-in-1 16IML9 | |
| Samsung Galaxy Book4 Pro 360 | |
| AIDA64 / CPU Queen | |
| HP Envy x360 2-in-1 16-ad0097nr | |
| Média AMD Ryzen 7 8840HS (90515 - 111581, n=5) | |
| HP Envy 16 h0112nr | |
| LG Gram 2in1 16 16T90R - G.AA78G | |
| HP Spectre x360 16 RTX 4050 | |
| Samsung Galaxy Book4 Pro 360 | |
| Lenovo Yoga 7 2-in-1 16IML9 | |
| AIDA64 / FPU SinJulia | |
| Média AMD Ryzen 7 8840HS (12168 - 13731, n=5) | |
| HP Envy x360 2-in-1 16-ad0097nr | |
| HP Spectre x360 16 RTX 4050 | |
| HP Envy 16 h0112nr | |
| Samsung Galaxy Book4 Pro 360 | |
| LG Gram 2in1 16 16T90R - G.AA78G | |
| Lenovo Yoga 7 2-in-1 16IML9 | |
| AIDA64 / FPU Mandel | |
| Média AMD Ryzen 7 8840HS (38404 - 49687, n=5) | |
| HP Envy x360 2-in-1 16-ad0097nr | |
| HP Spectre x360 16 RTX 4050 | |
| HP Envy 16 h0112nr | |
| LG Gram 2in1 16 16T90R - G.AA78G | |
| Lenovo Yoga 7 2-in-1 16IML9 | |
| Samsung Galaxy Book4 Pro 360 | |
| AIDA64 / CPU ZLib | |
| HP Spectre x360 16 RTX 4050 | |
| HP Envy x360 2-in-1 16-ad0097nr | |
| HP Envy 16 h0112nr | |
| Média AMD Ryzen 7 8840HS (468 - 930, n=5) | |
| LG Gram 2in1 16 16T90R - G.AA78G | |
| Lenovo Yoga 7 2-in-1 16IML9 | |
| Samsung Galaxy Book4 Pro 360 | |
| AIDA64 / FP64 Ray-Trace | |
| Média AMD Ryzen 7 8840HS (9368 - 11880, n=5) | |
| HP Envy x360 2-in-1 16-ad0097nr | |
| HP Spectre x360 16 RTX 4050 | |
| HP Envy 16 h0112nr | |
| LG Gram 2in1 16 16T90R - G.AA78G | |
| Samsung Galaxy Book4 Pro 360 | |
| Lenovo Yoga 7 2-in-1 16IML9 | |
| AIDA64 / CPU PhotoWorxx | |
| HP Spectre x360 16 RTX 4050 | |
| Lenovo Yoga 7 2-in-1 16IML9 | |
| Samsung Galaxy Book4 Pro 360 | |
| LG Gram 2in1 16 16T90R - G.AA78G | |
| HP Envy 16 h0112nr | |
| Média AMD Ryzen 7 8840HS (31491 - 35861, n=5) | |
| HP Envy x360 2-in-1 16-ad0097nr | |
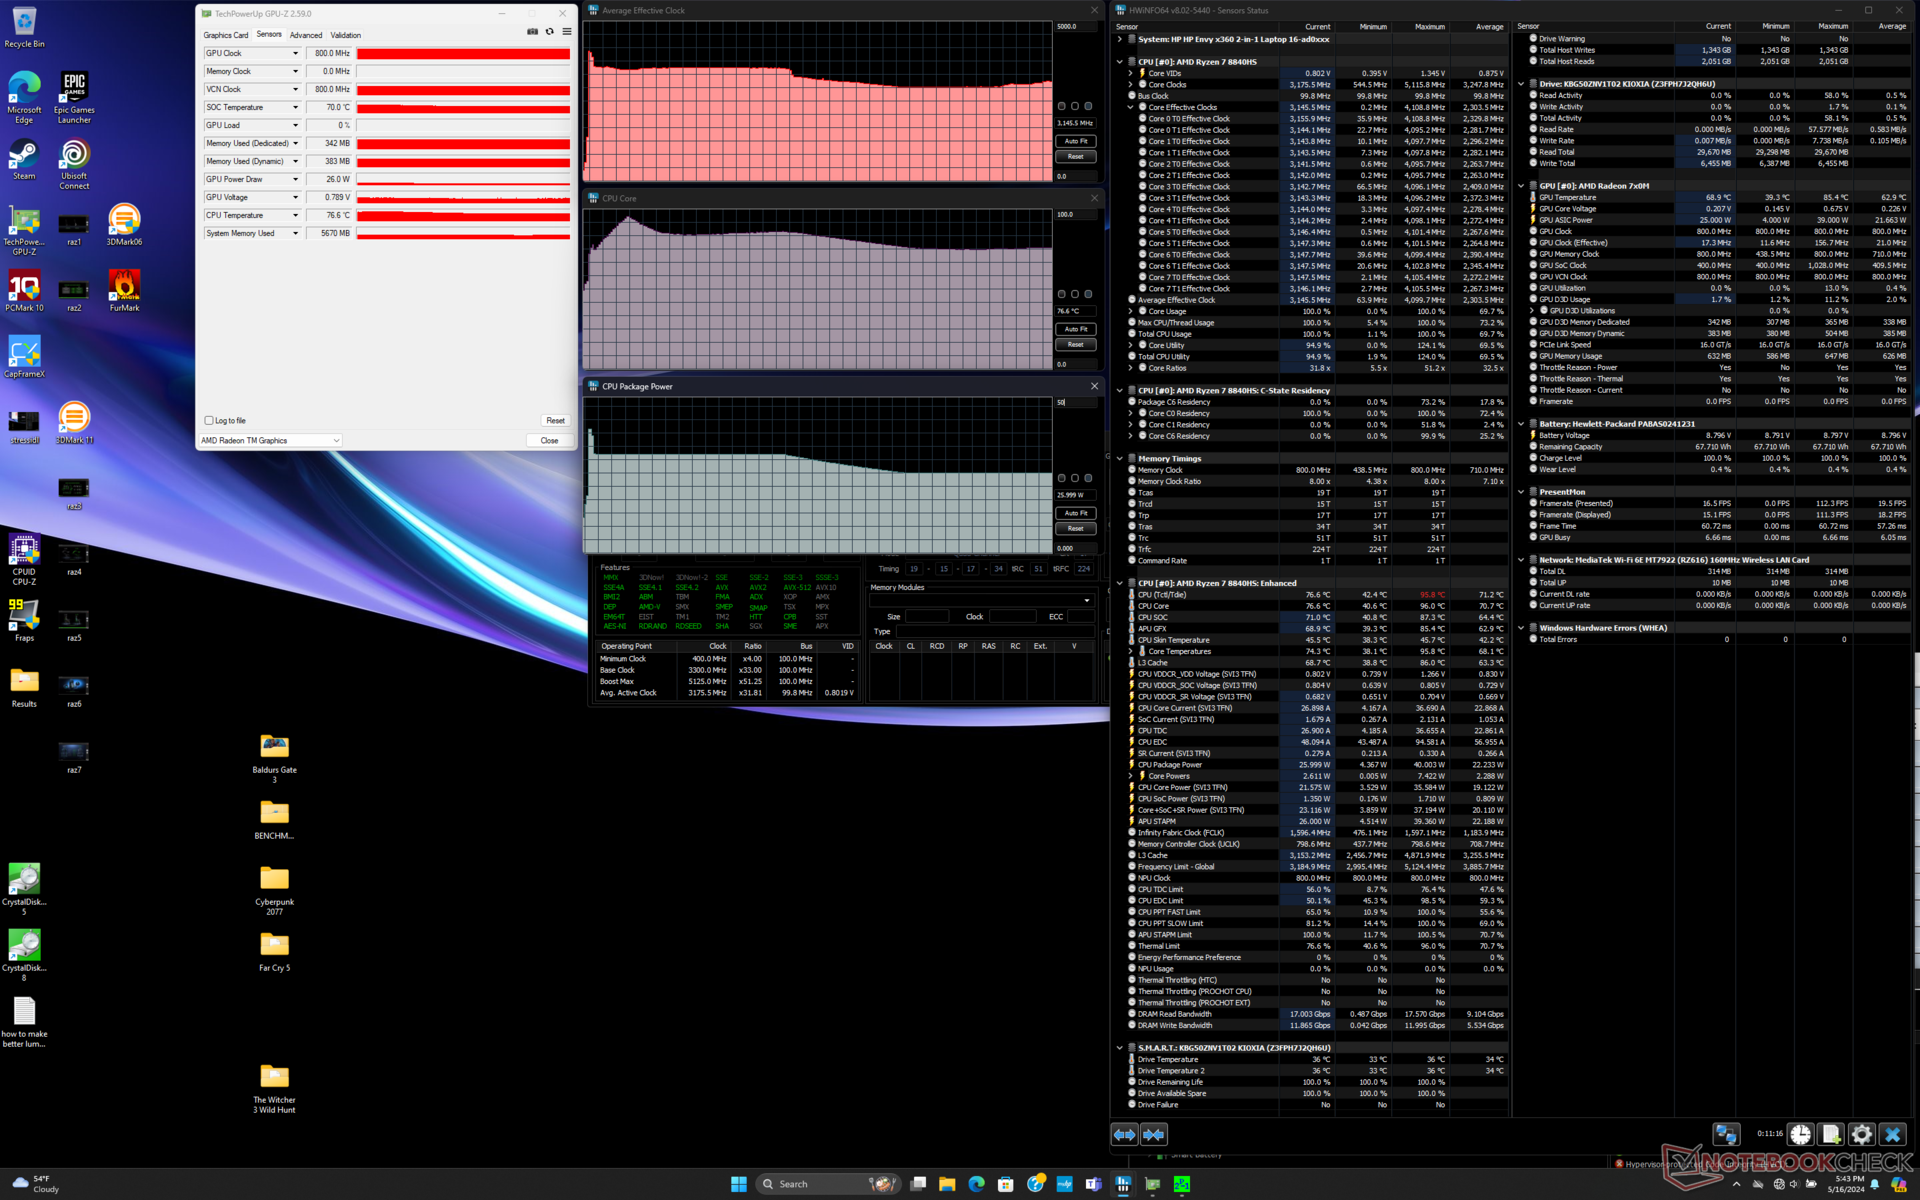
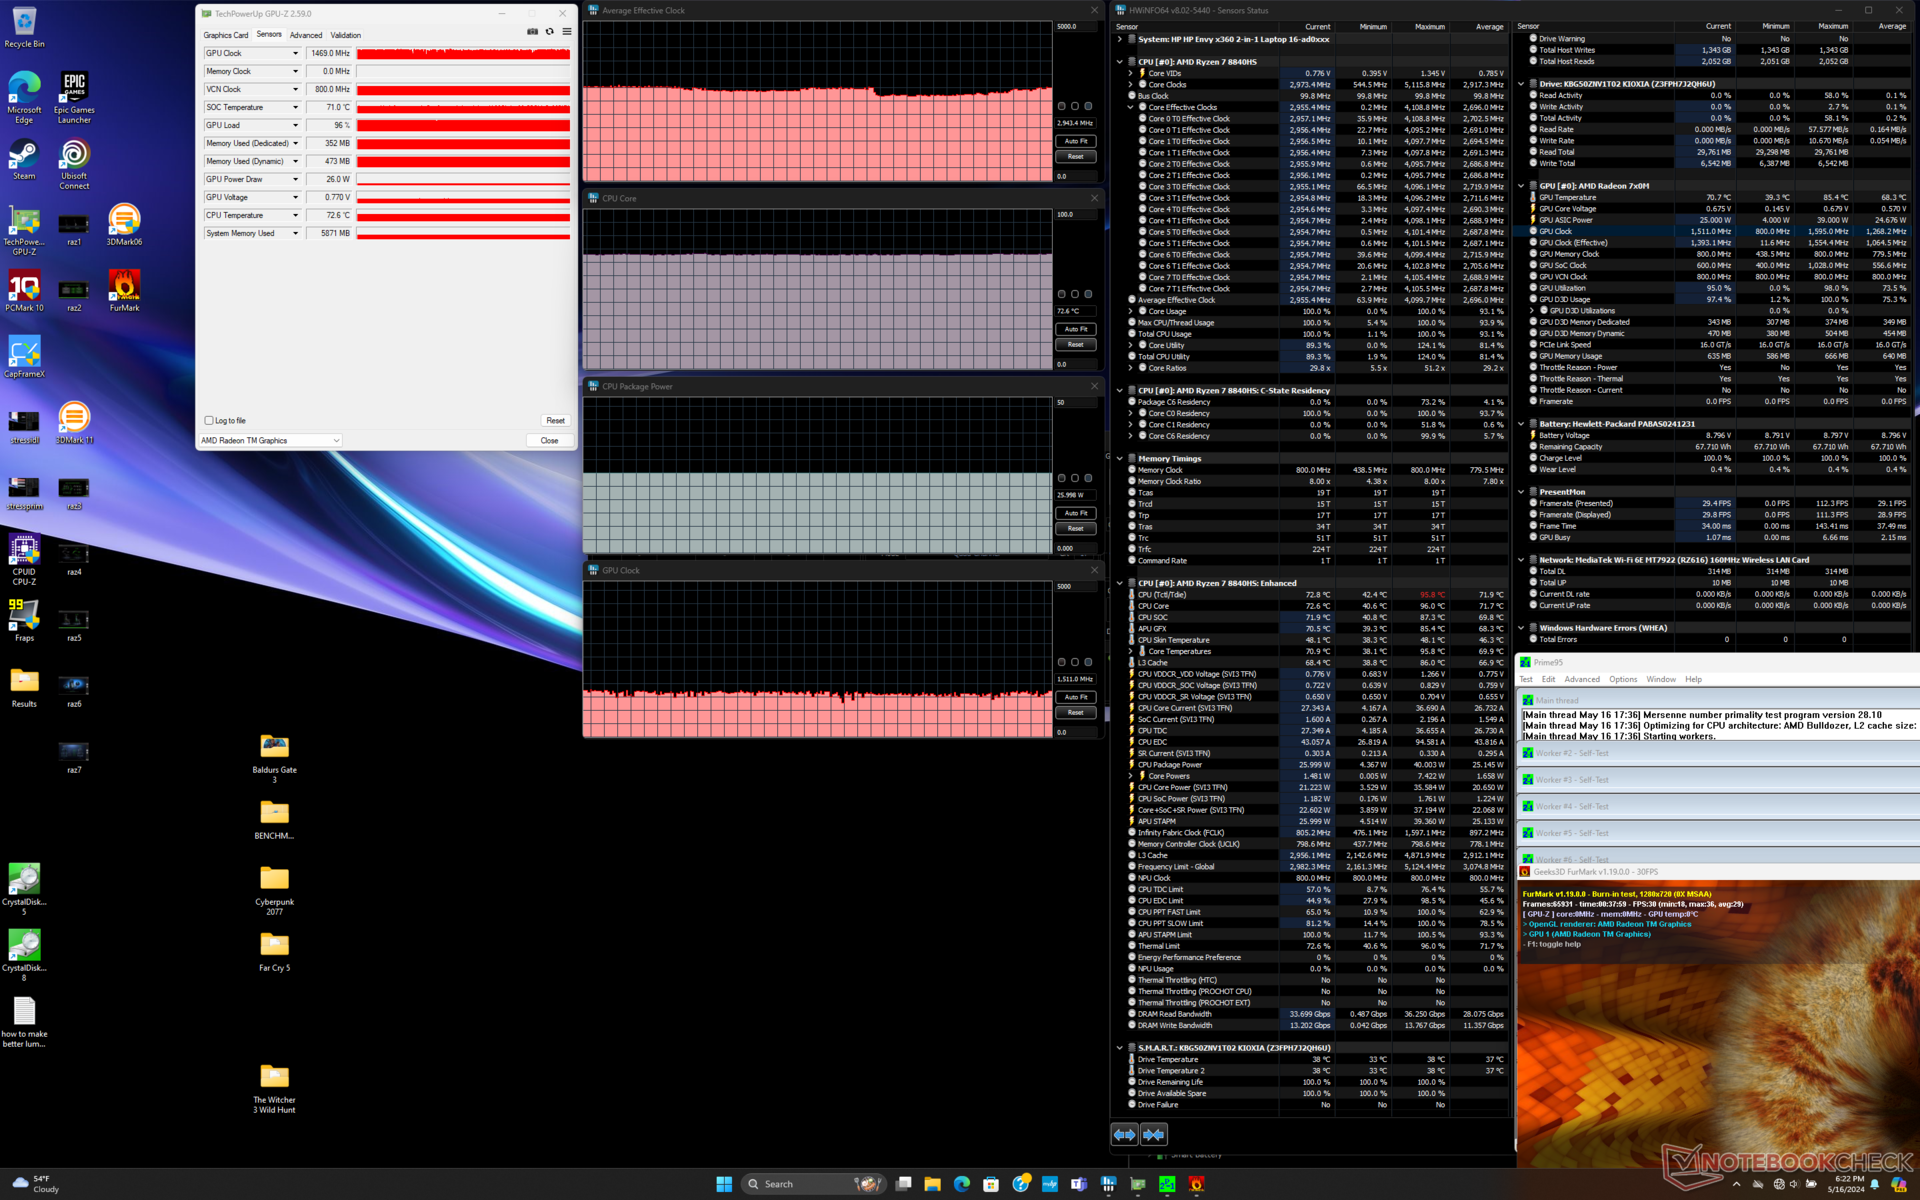
Teste de estresse
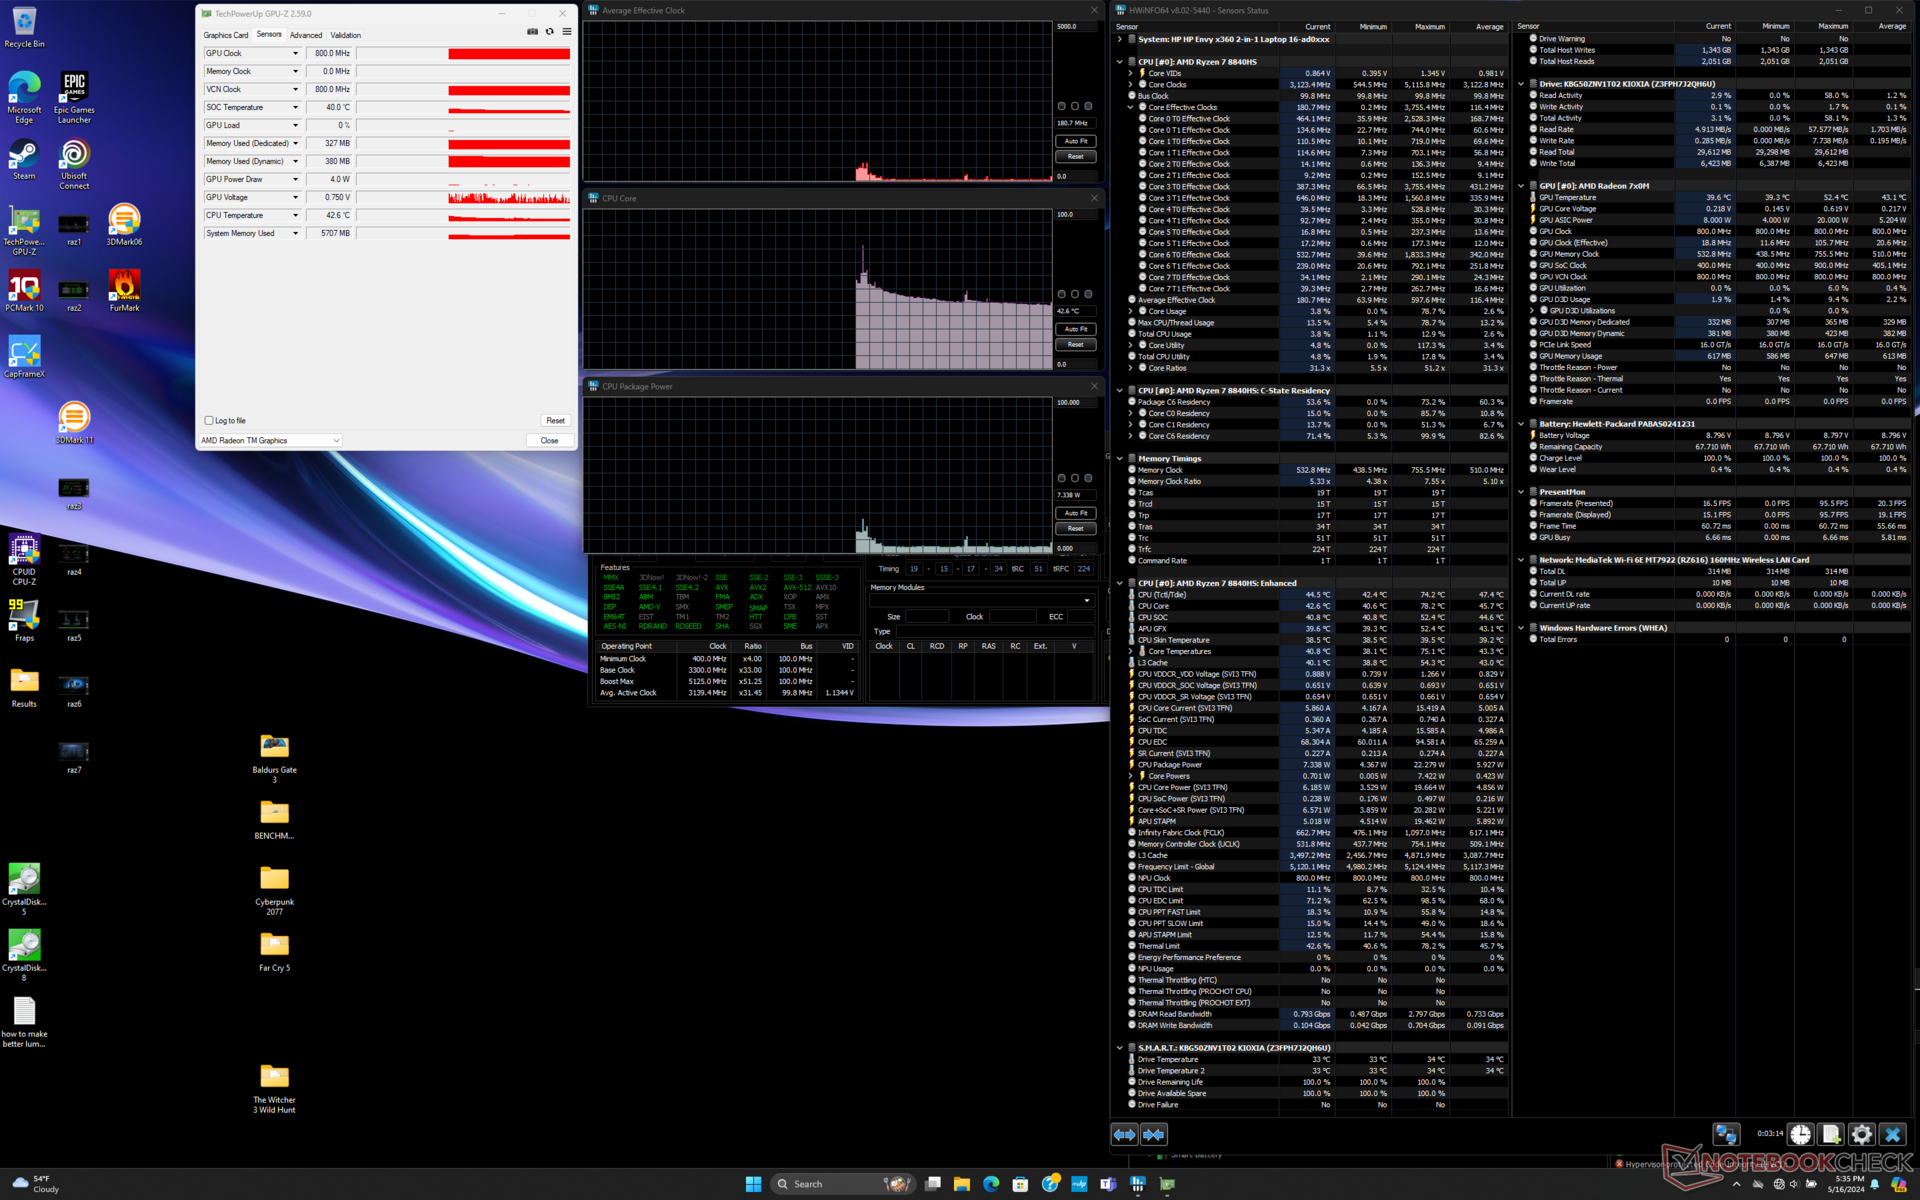
A execução do Prime95 faz com que a CPU atinja 4,1 GHz e 40 W apenas nos primeiros segundos, antes de cair para 3,4 GHz e 32 W. Depois de vários minutos, esse valor cairia ainda mais para 3,1 GHz e 26 W, sugerindo uma sustentabilidade limitada do Turbo Core. A CPU Intel Core Ultra 7 no Spectre x360 16 se estabilizaria na mesma temperatura que o nosso Envy x360 16 com tecnologia AMD, a 76 C, talvez por coincidência.
A execução Witcher 3 no modo Performance resultaria em uma temperatura estável da CPU e em uma taxa de clock da GPU de 68 C e 2180 MHz, respectivamente, em comparação com apenas 61 C e 1785 MHz no modo Balanced. As diferenças se alinham com nossos resultados do site Fire Strike e com as observações de ruído do ventilador entre os dois perfis de energia. A potência do pacote da CPU também é afetada, de 26 W no modo Performance para 20 W no modo Balanced.
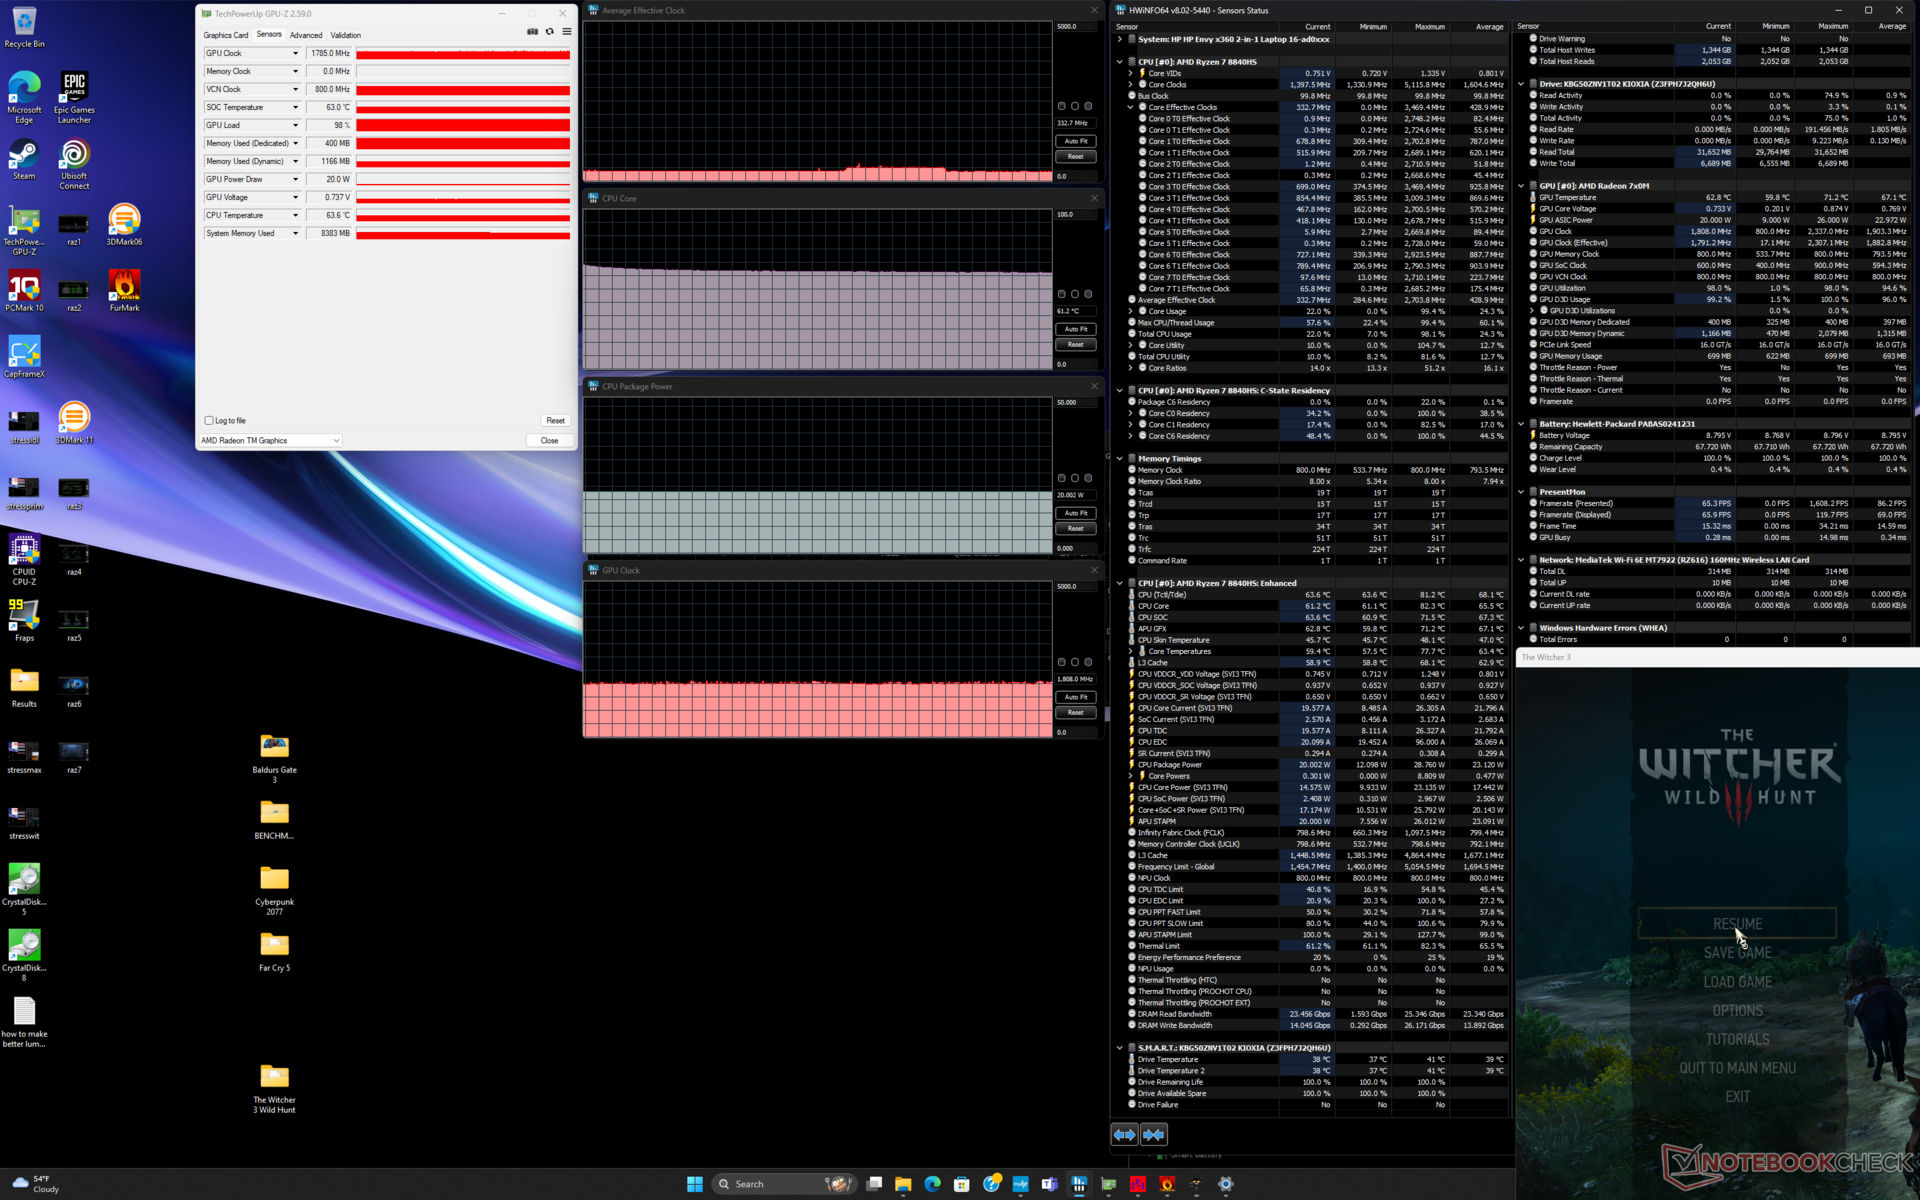
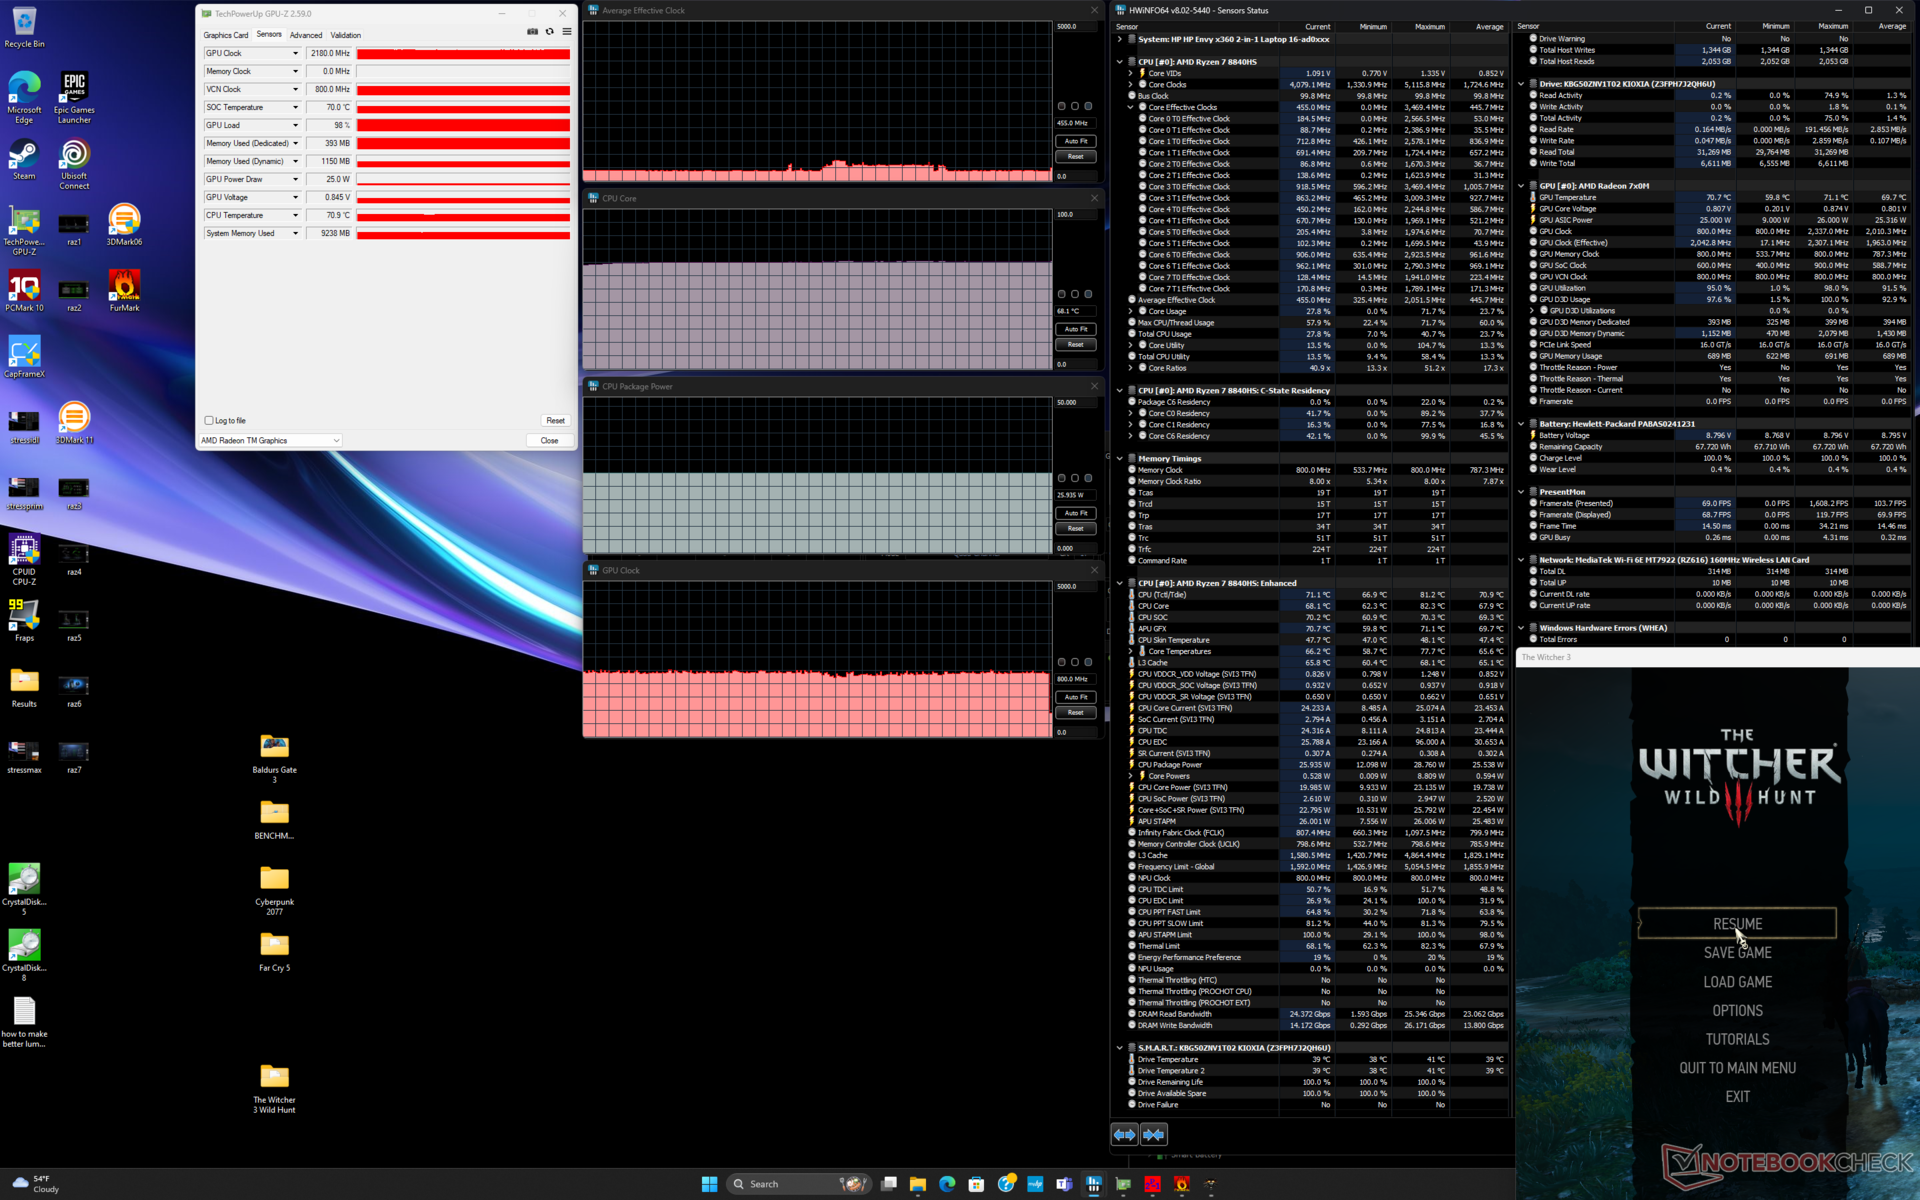
| Clock médio da CPU (GHz) | Clock da GPU (MHz) | Temperatura média da CPU (°C) | |
| Sistema ocioso | -- | -- | 42 |
| Estresse doPrime95 | 3.1 | -- | 77 |
| Prime95 + FurMark Stress | 2.9 | 1469 | 73 |
| Witcher 3 Estresse(modo balanceado) | ~0,3 | 1785 | 61 |
| Witcher 3 Estresse(modo de desempenho) | ~0,5 | 2180 | 68 |
Desempenho do sistema
As pontuações do PCMark estão bem acima das do ano passado Envy x360 15 do ano passado, especialmente nos subtestes de Produtividade e Criação de Conteúdo Digital, nos quais a potência bruta da CPU e da GPU é realmente importante. As pontuações do Envy x360 16 estão entre o Envy x360 15 e o Spectre x360 16, em média.

CrossMark: Overall | Productivity | Creativity | Responsiveness
WebXPRT 3: Overall
WebXPRT 4: Overall
Mozilla Kraken 1.1: Total
| PCMark 10 / Score | |
| HP Envy 16 h0112nr | |
| Média AMD Ryzen 7 8840HS, AMD Radeon 780M (6775 - 7213, n=5) | |
| HP Envy x360 2-in-1 16-ad0097nr | |
| HP Spectre x360 16 RTX 4050 | |
| Samsung Galaxy Book4 Pro 360 | |
| Lenovo Yoga 7 2-in-1 16IML9 | |
| LG Gram 2in1 16 16T90R - G.AA78G | |
| PCMark 10 / Essentials | |
| HP Envy 16 h0112nr | |
| LG Gram 2in1 16 16T90R - G.AA78G | |
| Lenovo Yoga 7 2-in-1 16IML9 | |
| Média AMD Ryzen 7 8840HS, AMD Radeon 780M (10178 - 11449, n=5) | |
| Samsung Galaxy Book4 Pro 360 | |
| HP Envy x360 2-in-1 16-ad0097nr | |
| HP Spectre x360 16 RTX 4050 | |
| PCMark 10 / Productivity | |
| Média AMD Ryzen 7 8840HS, AMD Radeon 780M (9706 - 10449, n=5) | |
| HP Envy x360 2-in-1 16-ad0097nr | |
| HP Spectre x360 16 RTX 4050 | |
| HP Envy 16 h0112nr | |
| Samsung Galaxy Book4 Pro 360 | |
| Lenovo Yoga 7 2-in-1 16IML9 | |
| LG Gram 2in1 16 16T90R - G.AA78G | |
| PCMark 10 / Digital Content Creation | |
| HP Envy 16 h0112nr | |
| Média AMD Ryzen 7 8840HS, AMD Radeon 780M (8519 - 9163, n=5) | |
| HP Envy x360 2-in-1 16-ad0097nr | |
| HP Spectre x360 16 RTX 4050 | |
| Samsung Galaxy Book4 Pro 360 | |
| LG Gram 2in1 16 16T90R - G.AA78G | |
| Lenovo Yoga 7 2-in-1 16IML9 | |
| CrossMark / Overall | |
| HP Envy 16 h0112nr | |
| Média AMD Ryzen 7 8840HS, AMD Radeon 780M (1643 - 1698, n=5) | |
| Lenovo Yoga 7 2-in-1 16IML9 | |
| HP Envy x360 2-in-1 16-ad0097nr | |
| Samsung Galaxy Book4 Pro 360 | |
| HP Spectre x360 16 RTX 4050 | |
| LG Gram 2in1 16 16T90R - G.AA78G | |
| CrossMark / Productivity | |
| HP Envy 16 h0112nr | |
| Média AMD Ryzen 7 8840HS, AMD Radeon 780M (1605 - 1666, n=5) | |
| HP Envy x360 2-in-1 16-ad0097nr | |
| Samsung Galaxy Book4 Pro 360 | |
| LG Gram 2in1 16 16T90R - G.AA78G | |
| HP Spectre x360 16 RTX 4050 | |
| Lenovo Yoga 7 2-in-1 16IML9 | |
| CrossMark / Creativity | |
| HP Envy 16 h0112nr | |
| HP Spectre x360 16 RTX 4050 | |
| Média AMD Ryzen 7 8840HS, AMD Radeon 780M (1739 - 1863, n=5) | |
| HP Envy x360 2-in-1 16-ad0097nr | |
| Samsung Galaxy Book4 Pro 360 | |
| LG Gram 2in1 16 16T90R - G.AA78G | |
| Lenovo Yoga 7 2-in-1 16IML9 | |
| CrossMark / Responsiveness | |
| HP Envy 16 h0112nr | |
| LG Gram 2in1 16 16T90R - G.AA78G | |
| Samsung Galaxy Book4 Pro 360 | |
| Média AMD Ryzen 7 8840HS, AMD Radeon 780M (1334 - 1498, n=5) | |
| HP Envy x360 2-in-1 16-ad0097nr | |
| HP Spectre x360 16 RTX 4050 | |
| Lenovo Yoga 7 2-in-1 16IML9 | |
| WebXPRT 3 / Overall | |
| Média AMD Ryzen 7 8840HS, AMD Radeon 780M (297 - 440, n=5) | |
| HP Envy 16 h0112nr | |
| HP Envy x360 2-in-1 16-ad0097nr | |
| HP Spectre x360 16 RTX 4050 | |
| Samsung Galaxy Book4 Pro 360 | |
| LG Gram 2in1 16 16T90R - G.AA78G | |
| Lenovo Yoga 7 2-in-1 16IML9 | |
| WebXPRT 4 / Overall | |
| HP Envy 16 h0112nr | |
| HP Spectre x360 16 RTX 4050 | |
| Média AMD Ryzen 7 8840HS, AMD Radeon 780M (246 - 257, n=5) | |
| HP Envy x360 2-in-1 16-ad0097nr | |
| Samsung Galaxy Book4 Pro 360 | |
| Lenovo Yoga 7 2-in-1 16IML9 | |
| Mozilla Kraken 1.1 / Total | |
| LG Gram 2in1 16 16T90R - G.AA78G | |
| Lenovo Yoga 7 2-in-1 16IML9 | |
| Samsung Galaxy Book4 Pro 360 | |
| HP Envy x360 2-in-1 16-ad0097nr | |
| HP Spectre x360 16 RTX 4050 | |
| Média AMD Ryzen 7 8840HS, AMD Radeon 780M (518 - 563, n=5) | |
| HP Envy 16 h0112nr | |
* ... menor é melhor
| PCMark 10 Score | 6958 pontos | |
Ajuda | ||
| AIDA64 / Memory Copy | |
| Samsung Galaxy Book4 Pro 360 | |
| HP Spectre x360 16 RTX 4050 | |
| Lenovo Yoga 7 2-in-1 16IML9 | |
| HP Envy x360 2-in-1 16-ad0097nr | |
| Média AMD Ryzen 7 8840HS (62098 - 76766, n=5) | |
| LG Gram 2in1 16 16T90R - G.AA78G | |
| HP Envy 16 h0112nr | |
| AIDA64 / Memory Read | |
| HP Spectre x360 16 RTX 4050 | |
| Samsung Galaxy Book4 Pro 360 | |
| HP Envy 16 h0112nr | |
| Lenovo Yoga 7 2-in-1 16IML9 | |
| Média AMD Ryzen 7 8840HS (50273 - 61739, n=5) | |
| LG Gram 2in1 16 16T90R - G.AA78G | |
| HP Envy x360 2-in-1 16-ad0097nr | |
| AIDA64 / Memory Write | |
| HP Spectre x360 16 RTX 4050 | |
| HP Envy x360 2-in-1 16-ad0097nr | |
| Média AMD Ryzen 7 8840HS (78025 - 107658, n=5) | |
| LG Gram 2in1 16 16T90R - G.AA78G | |
| Samsung Galaxy Book4 Pro 360 | |
| Lenovo Yoga 7 2-in-1 16IML9 | |
| HP Envy 16 h0112nr | |
| AIDA64 / Memory Latency | |
| Lenovo Yoga 7 2-in-1 16IML9 | |
| HP Spectre x360 16 RTX 4050 | |
| Samsung Galaxy Book4 Pro 360 | |
| HP Envy x360 2-in-1 16-ad0097nr | |
| LG Gram 2in1 16 16T90R - G.AA78G | |
| Média AMD Ryzen 7 8840HS (91 - 122.4, n=5) | |
| HP Envy 16 h0112nr | |
* ... menor é melhor
Latência DPC
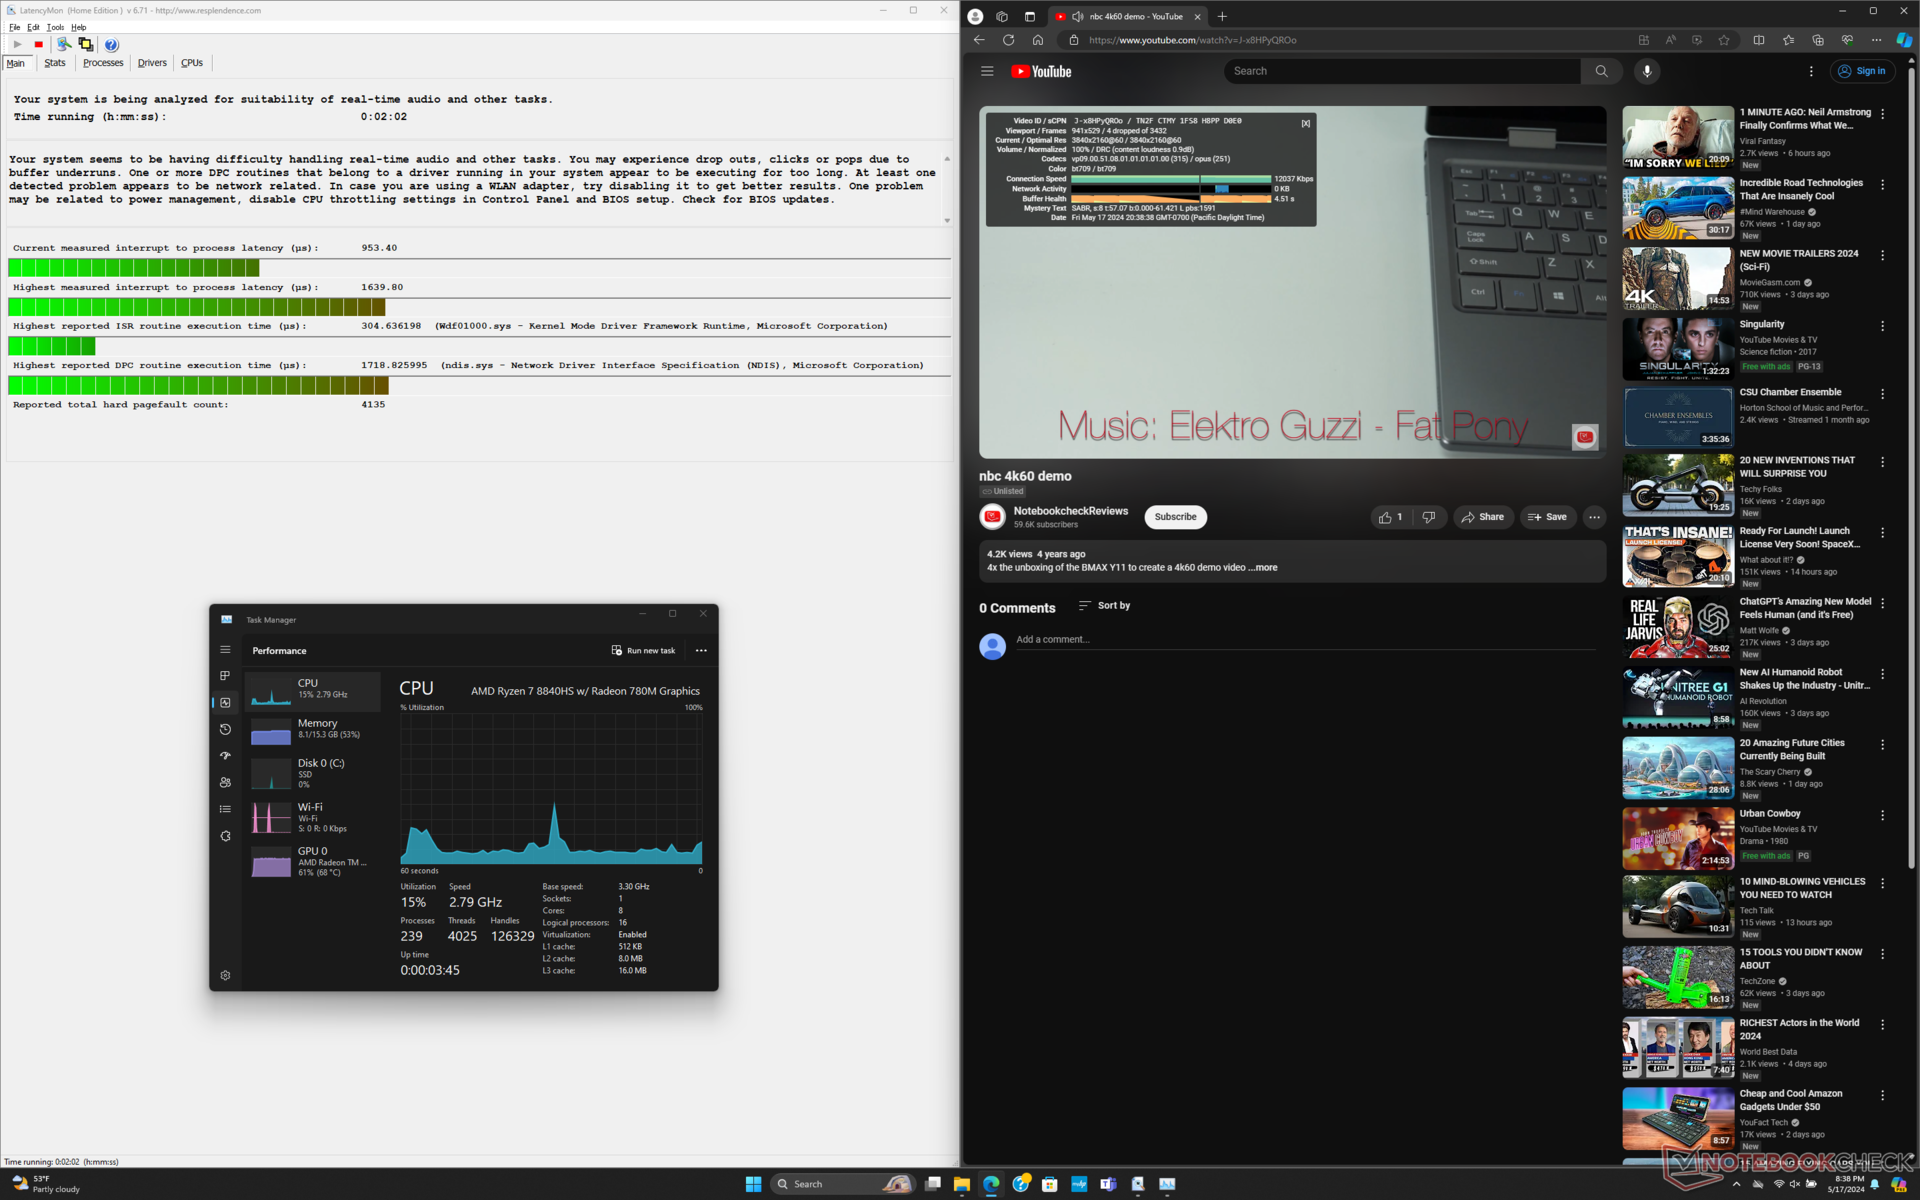
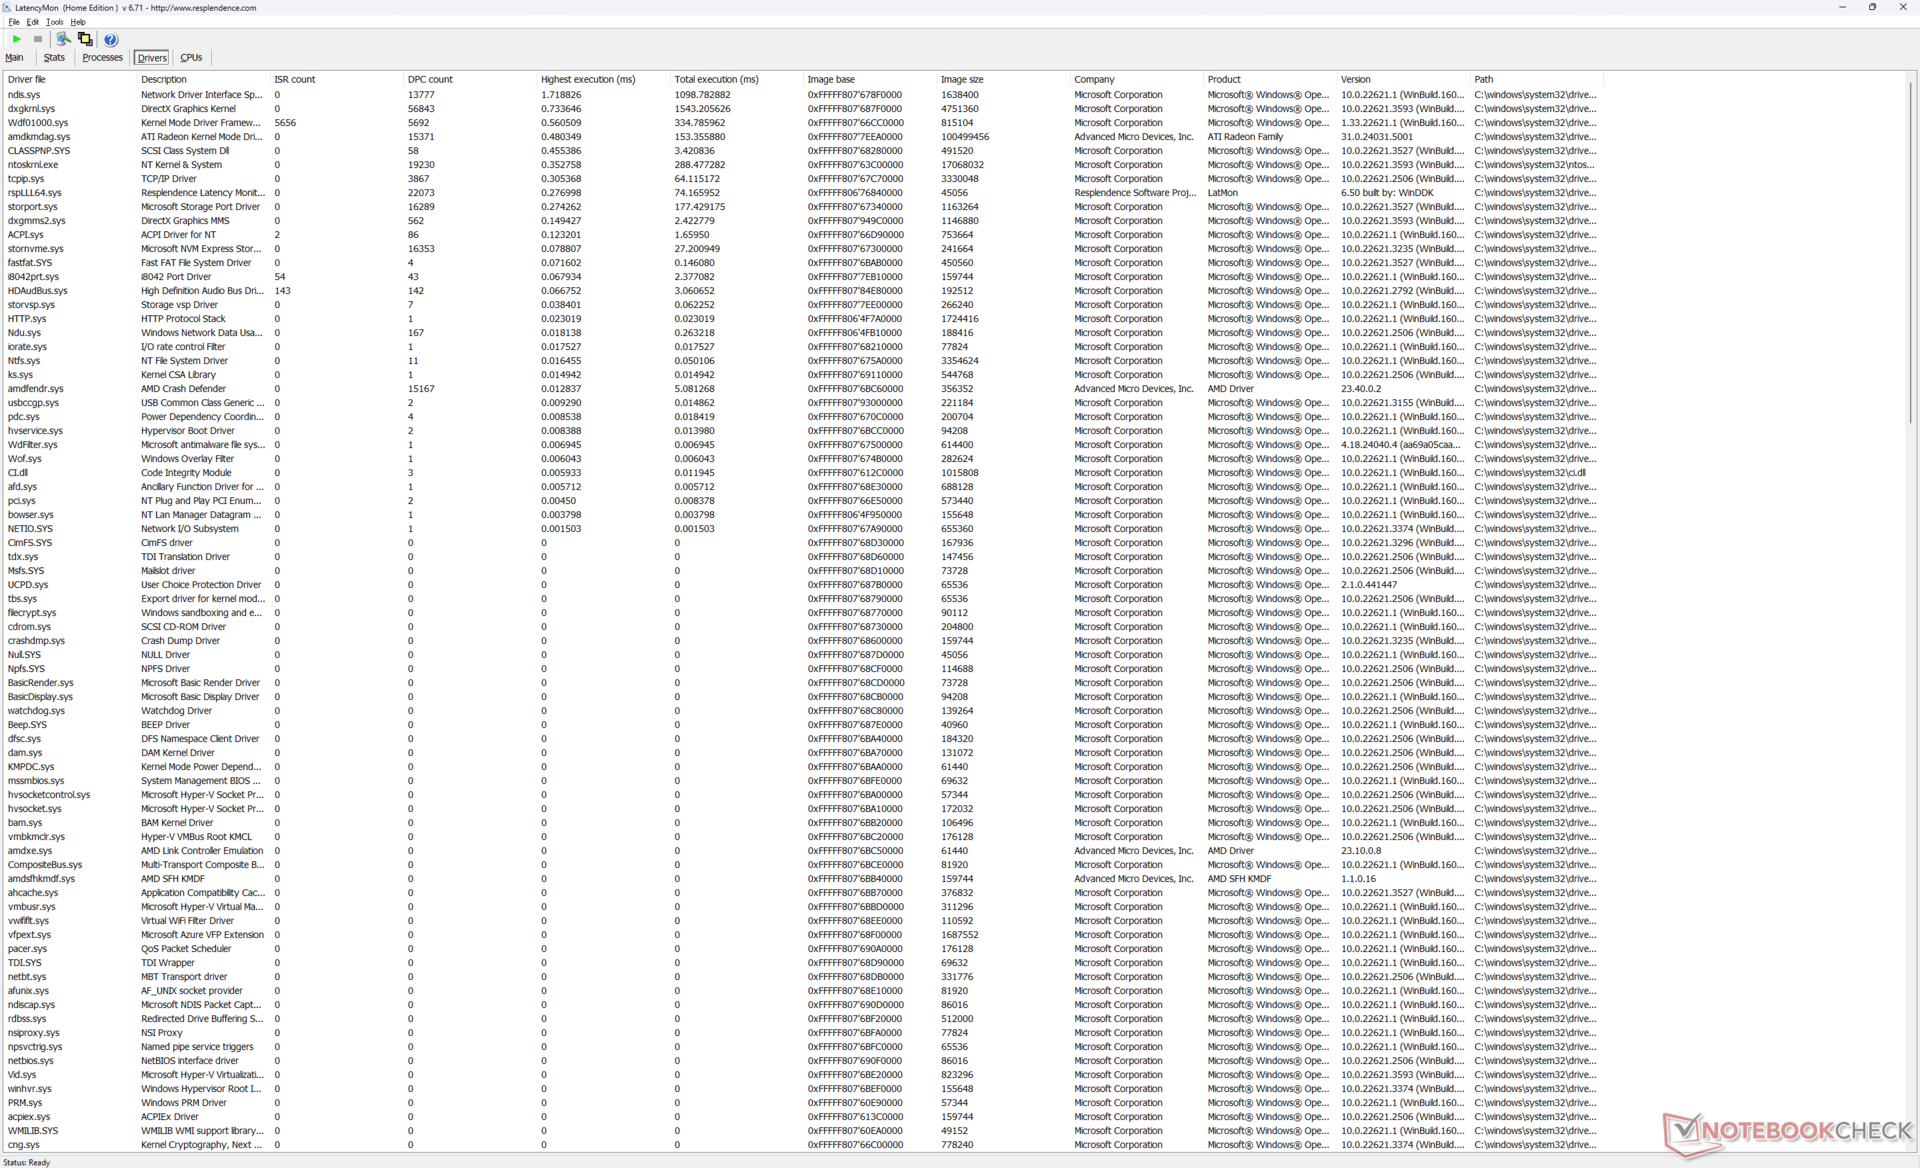
O LatencyMon revela pequenos problemas de DPC ao abrir várias guias de nossa página inicial. a reprodução de vídeo 4K60 também é imperfeita, com 4 quadros perdidos registrados em um período de 60 segundos. Embora as quedas de quadros não sejam frequentes o suficiente para serem perceptíveis, o ideal seria que não houvesse nenhuma queda.
| DPC Latencies / LatencyMon - interrupt to process latency (max), Web, Youtube, Prime95 | |
| LG Gram 2in1 16 16T90R - G.AA78G | |
| Samsung Galaxy Book4 Pro 360 | |
| HP Spectre x360 16 RTX 4050 | |
| HP Envy x360 2-in-1 16-ad0097nr | |
| HP Envy 16 h0112nr | |
| Lenovo Yoga 7 2-in-1 16IML9 | |
* ... menor é melhor
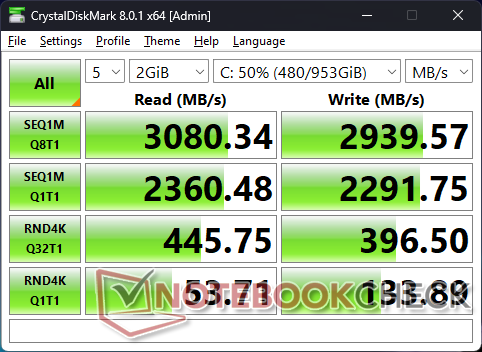
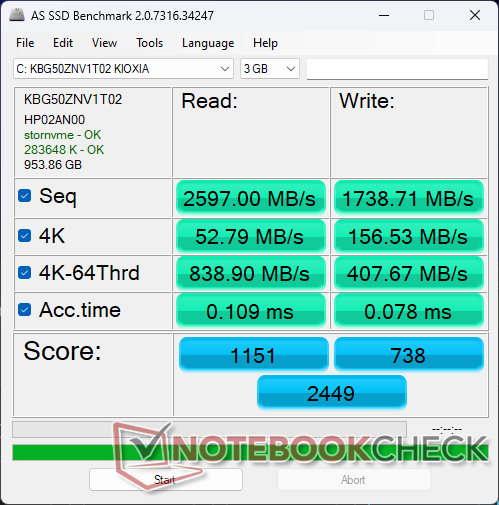
Dispositivos de armazenamento
Nossa unidade é fornecida com o Kioxia KBG50ZNV1T02 que é um SSD NVMe 2280 PCIe4 x4 econômico com taxas de leitura e gravação sequenciais de até 3.500 MB/s e 2.900 MB/s, respectivamente, em comparação com 7.000 MB/s em unidades de ponta como a série PM9A1 da Samsung. As taxas de transferência caem um pouco quando há estresse, mas o desempenho é bom para um sistema de médio porte.

| Drive Performance rating - Percent | |
| LG Gram 2in1 16 16T90R - G.AA78G | |
| HP Envy 16 h0112nr | |
| Samsung Galaxy Book4 Pro 360 | |
| HP Spectre x360 16 RTX 4050 | |
| HP Envy x360 2-in-1 16-ad0097nr | |
| Lenovo Yoga 7 2-in-1 16IML9 | |
* ... menor é melhor
Disk Throttling: DiskSpd Read Loop, Queue Depth 8
Desempenho da GPU
A Radeon 780M ainda é uma fera em GPU integrada, mesmo depois que a Intel respondeu com a concorrente Arc 8. os resultados do 3DMark mostram que ela é mais parecida com a Arc 7 mas bem à frente das antigas Iris Xe 96 EUs.
Optar pela versão Intel do Envy x360 16 implicará em uma queda significativa no desempenho gráfico. Isso ocorre porque as versões Intel são fornecidas com CPUs Core Ultra série U em vez de Core Ultra série H. Os gráficos Arc 7 e Arc 8 estão disponíveis apenas nas CPUs Core Ultra H, enquanto a GPU integrada na série Core Ultra U tem um desempenho mais parecido com o da Iris Xe 96 EUs.
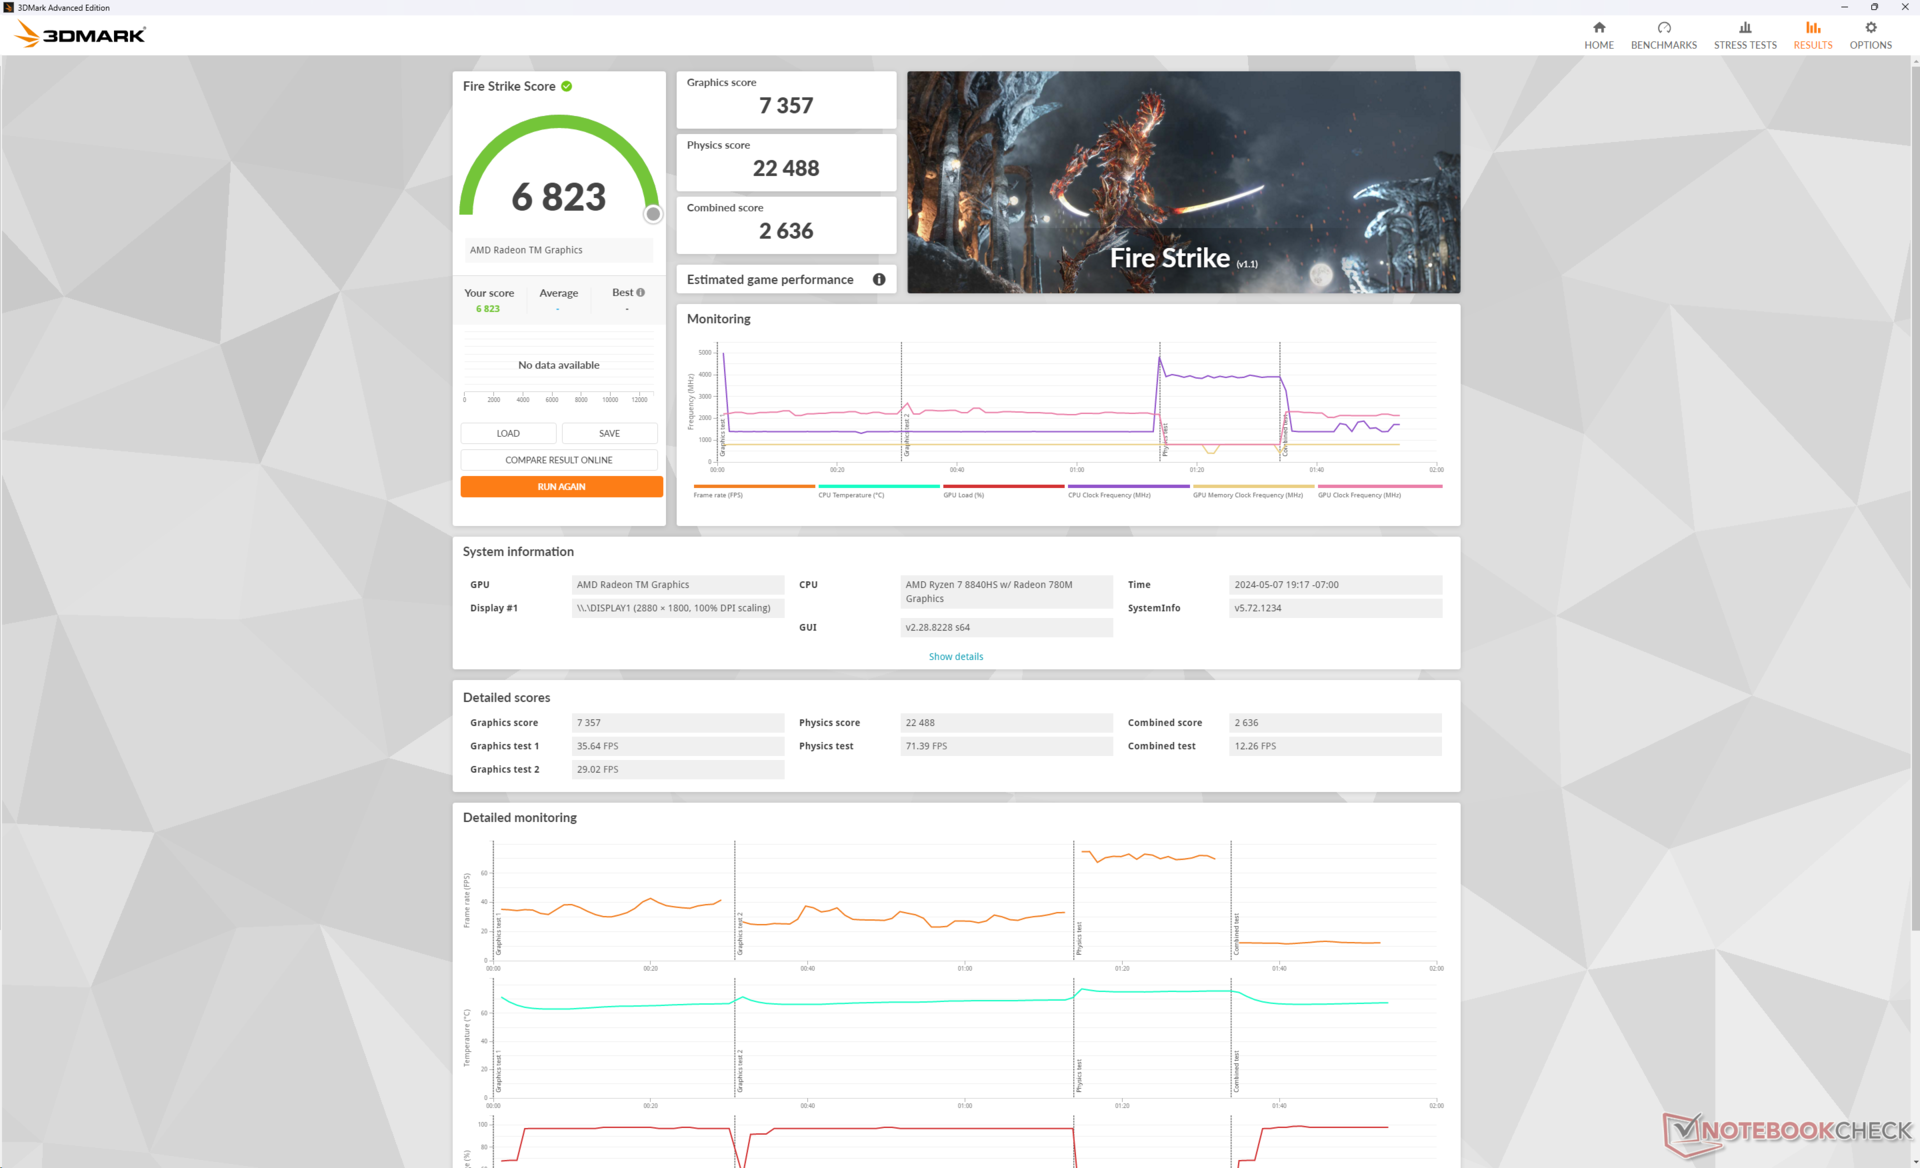
| Perfil de potência | Pontuação de gráficos | Pontuação de física | Pontuação combinada |
| Modo de desempenho | 7357 | 22488 | 2636 |
| Modo equilibrado | 6957 (-5%) | 20442 (-9%) | 2509 (-5%) |
| Energia da bateria | 4651 (-37%) | 18788 (-17%) | 1902 (-28%) |
A execução no modo Balanced afeta o desempenho em até 10%, de acordo com nossa tabela Fire Strike acima. O RPM do ventilador torna-se visivelmente mais letárgico quando definido para o modo Balanced, acompanhando o desempenho mais lento.
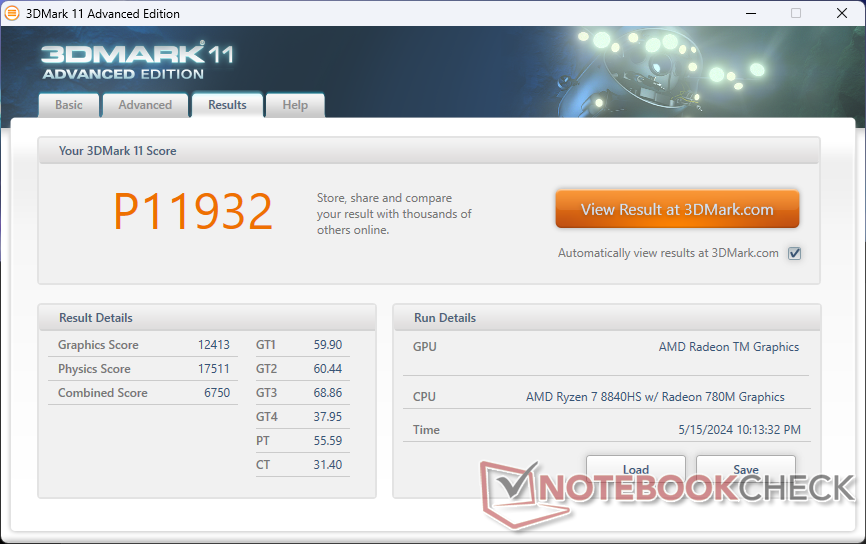
| 3DMark 11 Performance | 11932 pontos | |
| 3DMark Cloud Gate Standard Score | 32533 pontos | |
| 3DMark Fire Strike Score | 6823 pontos | |
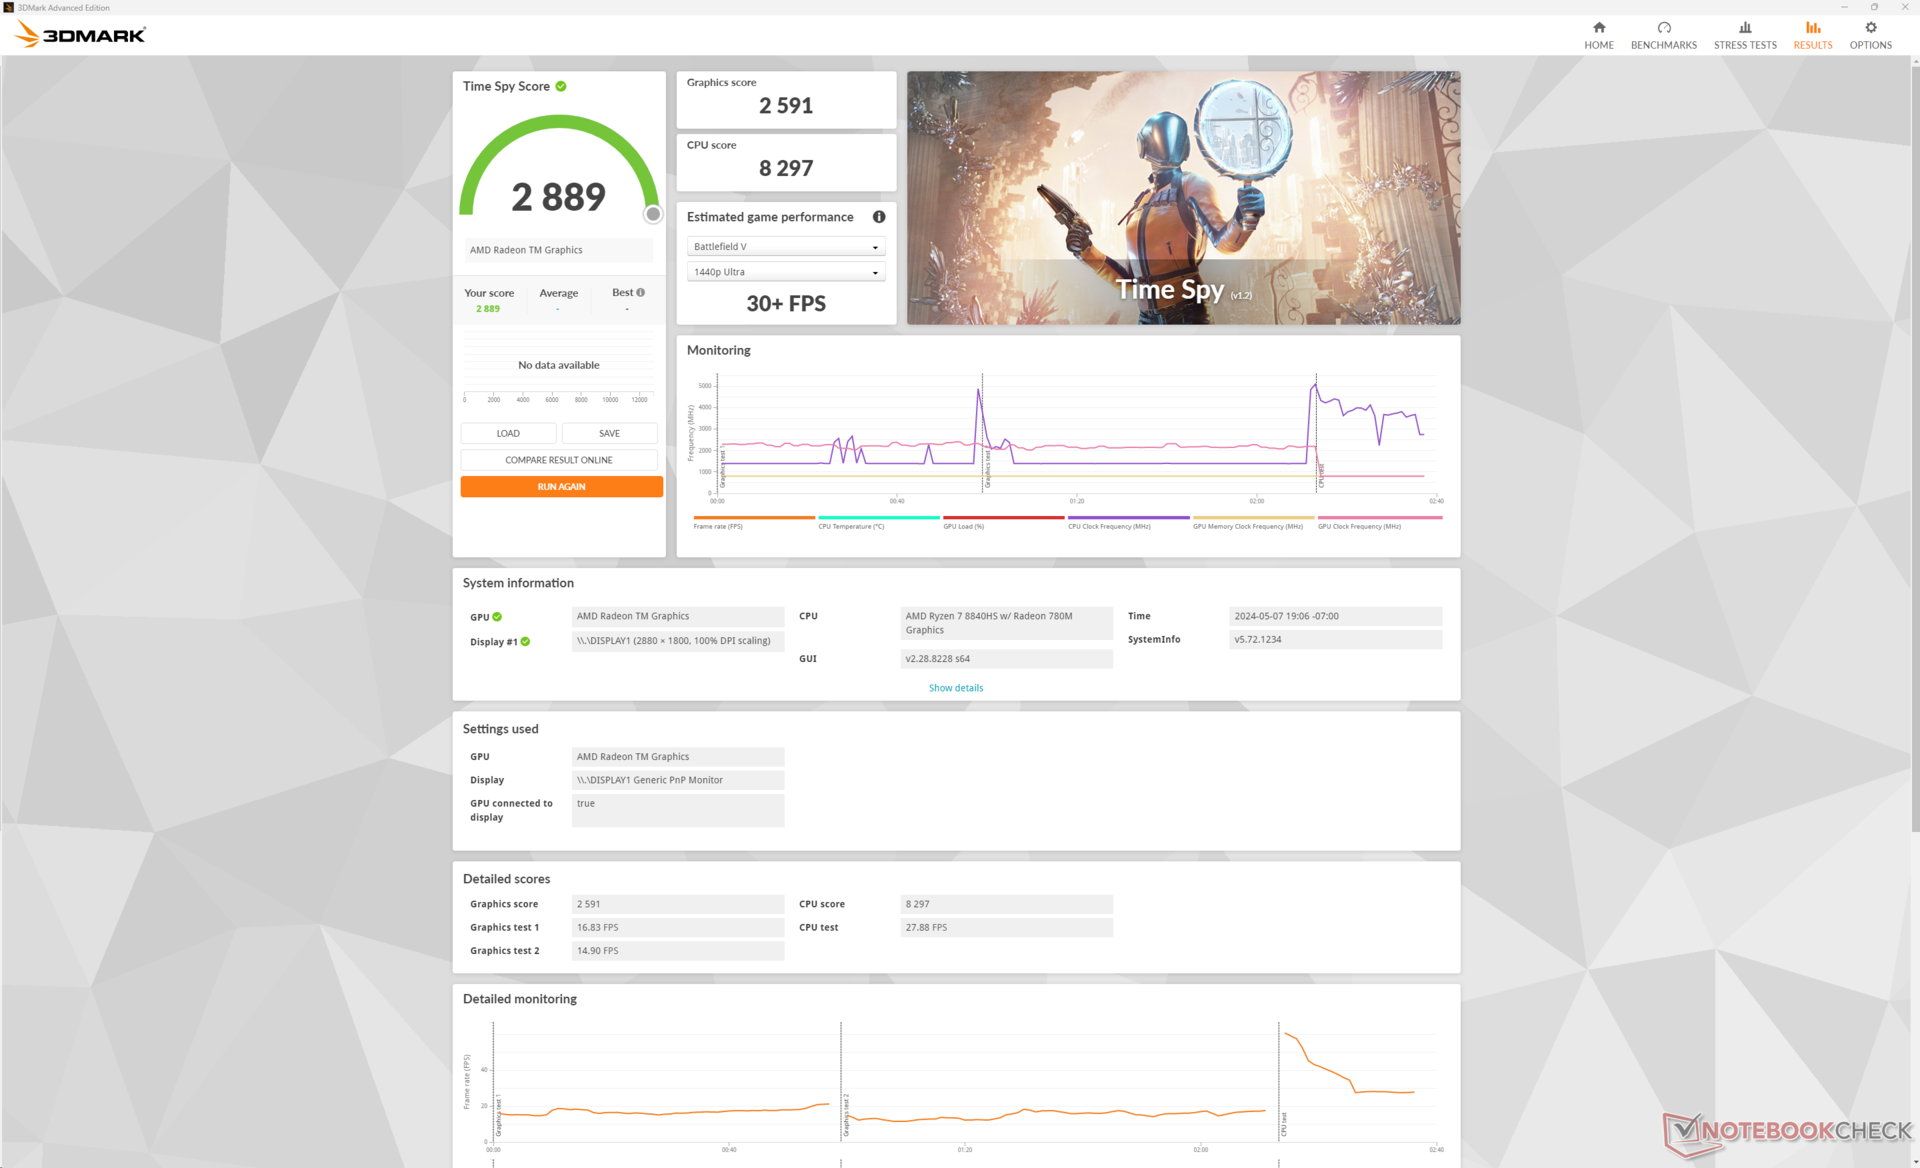
| 3DMark Time Spy Score | 2889 pontos | |
Ajuda | ||
* ... menor é melhor
Infelizmente, o desempenho em jogos é consistentemente mais lento do que a média dos notebooks em nosso banco de dados equipados com a mesma GPU Radeon 780M, mesmo quando configurados no modo Desempenho. Provavelmente, isso se deve ao desempenho geral mais lento do processador bruto do Ryzen 7 8840HS em comparação com o Ryzen 7 7840HS do ano passado, criando mais cenários com CPU.
| The Witcher 3 - 1920x1080 Ultra Graphics & Postprocessing (HBAO+) | |
| HP Spectre x360 16 RTX 4050 | |
| HP Envy x360 2-in-1 16-ad0097nr | |
| Samsung Galaxy Book4 Pro 360 | |
| HP Envy x360 15-fe0072ng | |
| Lenovo Yoga 7 2-in-1 16IML9 | |
| LG Gram 2in1 16 16T90R - G.AA78G | |
| Final Fantasy XV Benchmark - 1920x1080 High Quality | |
| HP Spectre x360 16 RTX 4050 | |
| HP Envy x360 2-in-1 16-ad0097nr | |
| Samsung Galaxy Book4 Pro 360 | |
| LG Gram 2in1 16 16T90R - G.AA78G | |
| HP Envy x360 15-fe0072ng | |
| Lenovo Yoga 7 2-in-1 16IML9 | |
| Strange Brigade - 1920x1080 ultra AA:ultra AF:16 | |
| HP Spectre x360 16 RTX 4050 | |
| HP Envy x360 2-in-1 16-ad0097nr | |
| Samsung Galaxy Book4 Pro 360 | |
| Lenovo Yoga 7 2-in-1 16IML9 | |
| LG Gram 2in1 16 16T90R - G.AA78G | |
| HP Envy x360 15-fe0072ng | |
| Dota 2 Reborn - 1920x1080 ultra (3/3) best looking | |
| HP Spectre x360 16 RTX 4050 | |
| HP Envy x360 2-in-1 16-ad0097nr | |
| LG Gram 2in1 16 16T90R - G.AA78G | |
| Samsung Galaxy Book4 Pro 360 | |
| Lenovo Yoga 7 2-in-1 16IML9 | |
| HP Envy x360 15-fe0072ng | |
| X-Plane 11.11 - 1920x1080 high (fps_test=3) | |
| HP Spectre x360 16 RTX 4050 | |
| LG Gram 2in1 16 16T90R - G.AA78G | |
| Samsung Galaxy Book4 Pro 360 | |
| HP Envy x360 15-fe0072ng | |
| HP Envy x360 2-in-1 16-ad0097nr | |
| Lenovo Yoga 7 2-in-1 16IML9 | |
| Far Cry 5 - 1920x1080 Ultra Preset AA:T | |
| HP Spectre x360 16 RTX 4050 | |
| HP Envy x360 2-in-1 16-ad0097nr | |
| LG Gram 2in1 16 16T90R - G.AA78G | |
| Lenovo Yoga 7 2-in-1 16IML9 | |
| Baldur's Gate 3 | |
| 1280x720 Low Preset AA:SM | |
| Média AMD Radeon 780M (30.7 - 67.6, n=34) | |
| HP Envy x360 2-in-1 16-ad0097nr | |
| Lenovo Yoga 7 2-in-1 16IML9 | |
| 1920x1080 Low Preset AA:SM | |
| Dell XPS 16 9640 | |
| HP Spectre x360 16 RTX 4050 | |
| Média AMD Radeon 780M (20.2 - 44.1, n=47) | |
| HP Envy x360 2-in-1 16-ad0097nr | |
| Lenovo Yoga 7 2-in-1 16IML9 | |
| 1920x1080 Medium Preset AA:T | |
| Dell XPS 16 9640 | |
| HP Spectre x360 16 RTX 4050 | |
| HP Envy x360 2-in-1 16-ad0097nr | |
| Média AMD Radeon 780M (15.7 - 36.8, n=50) | |
| 1920x1080 High Preset AA:T | |
| Dell XPS 16 9640 | |
| HP Spectre x360 16 RTX 4050 | |
| Média AMD Radeon 780M (13.3 - 30.6, n=50) | |
| HP Envy x360 2-in-1 16-ad0097nr | |
| 1920x1080 Ultra Preset AA:T | |
| Dell XPS 16 9640 | |
| HP Spectre x360 16 RTX 4050 | |
| Média AMD Radeon 780M (12.8 - 29.6, n=49) | |
| HP Envy x360 2-in-1 16-ad0097nr | |
Witcher 3 FPS Chart
| baixo | média | alto | ultra | |
|---|---|---|---|---|
| The Witcher 3 (2015) | 129.2 | 47.6 | 28.8 | |
| Dota 2 Reborn (2015) | 123.7 | 103.7 | 73 | 65.4 |
| Final Fantasy XV Benchmark (2018) | 64.5 | 34.1 | 25.2 | |
| X-Plane 11.11 (2018) | 47.8 | 33.9 | 27.9 | |
| Far Cry 5 (2018) | 63 | 36 | 33 | 31 |
| Strange Brigade (2018) | 138.2 | 60.3 | 50.2 | 42.2 |
| Tiny Tina's Wonderlands (2022) | 49.8 | 38 | 24 | 19.5 |
| F1 22 (2022) | 70.2 | 60 | 46 | 12 |
| Baldur's Gate 3 (2023) | 35 | 28.5 | 22.6 | 22.2 |
| Cyberpunk 2077 (2023) | 35.5 | 27.8 | 22.1 | 19.1 |
Emissões - baixas baixas com altas altas
Ruído do sistema
A RPM e o comportamento da ventoinha estão intimamente ligados ao perfil de energia selecionado. Se estiver no modo Balanced, a ventoinha tende a funcionar visivelmente mais silenciosa e por períodos mais longos antes de precisar aumentar a velocidade. O ruído da ventoinha durante a execução do 3DMark 06, por exemplo, permaneceria em 23,8 dB(A) durante toda a primeira cena do benchmark, enquanto saltaria para 28 dB(A) se fosse definido para o modo Performance. Recomenda-se colocar o MyHP no modo Balanced para limitar a pulsação da ventoinha ao executar tarefas pouco exigentes, como navegação na Web ou streaming de vídeo.
Conseguimos registrar um nível máximo de ruído de quase 44 dB(A) ao executar Witcher 3 no modo Performance. Isso faz com que o Envy x360 16 seja um dos conversíveis de 16 polegadas mais barulhentos por vários decibéis ao executar cargas exigentes.
Barulho
| Ocioso |
| 23 / 23 / 23 dB |
| Carga |
| 23.8 / 43.8 dB |
 | ||
30 dB silencioso 40 dB(A) audível 50 dB(A) ruidosamente alto |
||
min: | ||
| HP Envy x360 2-in-1 16-ad0097nr Radeon 780M, R7 8840HS, KIOXIA BG5 KBG50ZNV1T02 | HP Envy 16 h0112nr GeForce RTX 3060 Laptop GPU, i7-12700H, Micron 3400 1TB MTFDKBA1T0TFH | HP Spectre x360 16 RTX 4050 GeForce RTX 4050 Laptop GPU, Ultra 7 155H, SK hynix PC801 HFS001TEJ9X101N | Lenovo Yoga 7 2-in-1 16IML9 Graphics 4-Core iGPU (Arrow Lake), Ultra 5 125U, SK hynix HFS512GEJ4X112N | Samsung Galaxy Book4 Pro 360 Arc 7-Core, Ultra 5 125H, Samsung PM9B1 512GB MZVL4512HBLU | LG Gram 2in1 16 16T90R - G.AA78G Iris Xe G7 96EUs, i7-1360P, Samsung PM9A1 MZVL21T0HCLR | |
|---|---|---|---|---|---|---|
| Noise | -20% | 3% | 1% | -8% | -7% | |
| desligado / ambiente * (dB) | 22.9 | 22.8 -0% | 23.3 -2% | 22.8 -0% | 24.1 -5% | 25.1 -10% |
| Idle Minimum * (dB) | 23 | 22.9 -0% | 23.6 -3% | 22.8 1% | 24.1 -5% | 25.1 -9% |
| Idle Average * (dB) | 23 | 22.9 -0% | 23.6 -3% | 22.8 1% | 24.1 -5% | 25.1 -9% |
| Idle Maximum * (dB) | 23 | 30.5 -33% | 23.6 -3% | 22.8 1% | 26.4 -15% | 26.1 -13% |
| Load Average * (dB) | 23.8 | 41.4 -74% | 29.2 -23% | 30.8 -29% | 35.2 -48% | 31.4 -32% |
| Witcher 3 ultra * (dB) | 43.8 | 51.1 -17% | 32.1 27% | 31 29% | 38.5 12% | 41.1 6% |
| Load Maximum * (dB) | 43.8 | 51.4 -17% | 32.1 27% | 40.8 7% | 39.2 11% | 36.6 16% |
* ... menor é melhor
Temperatura
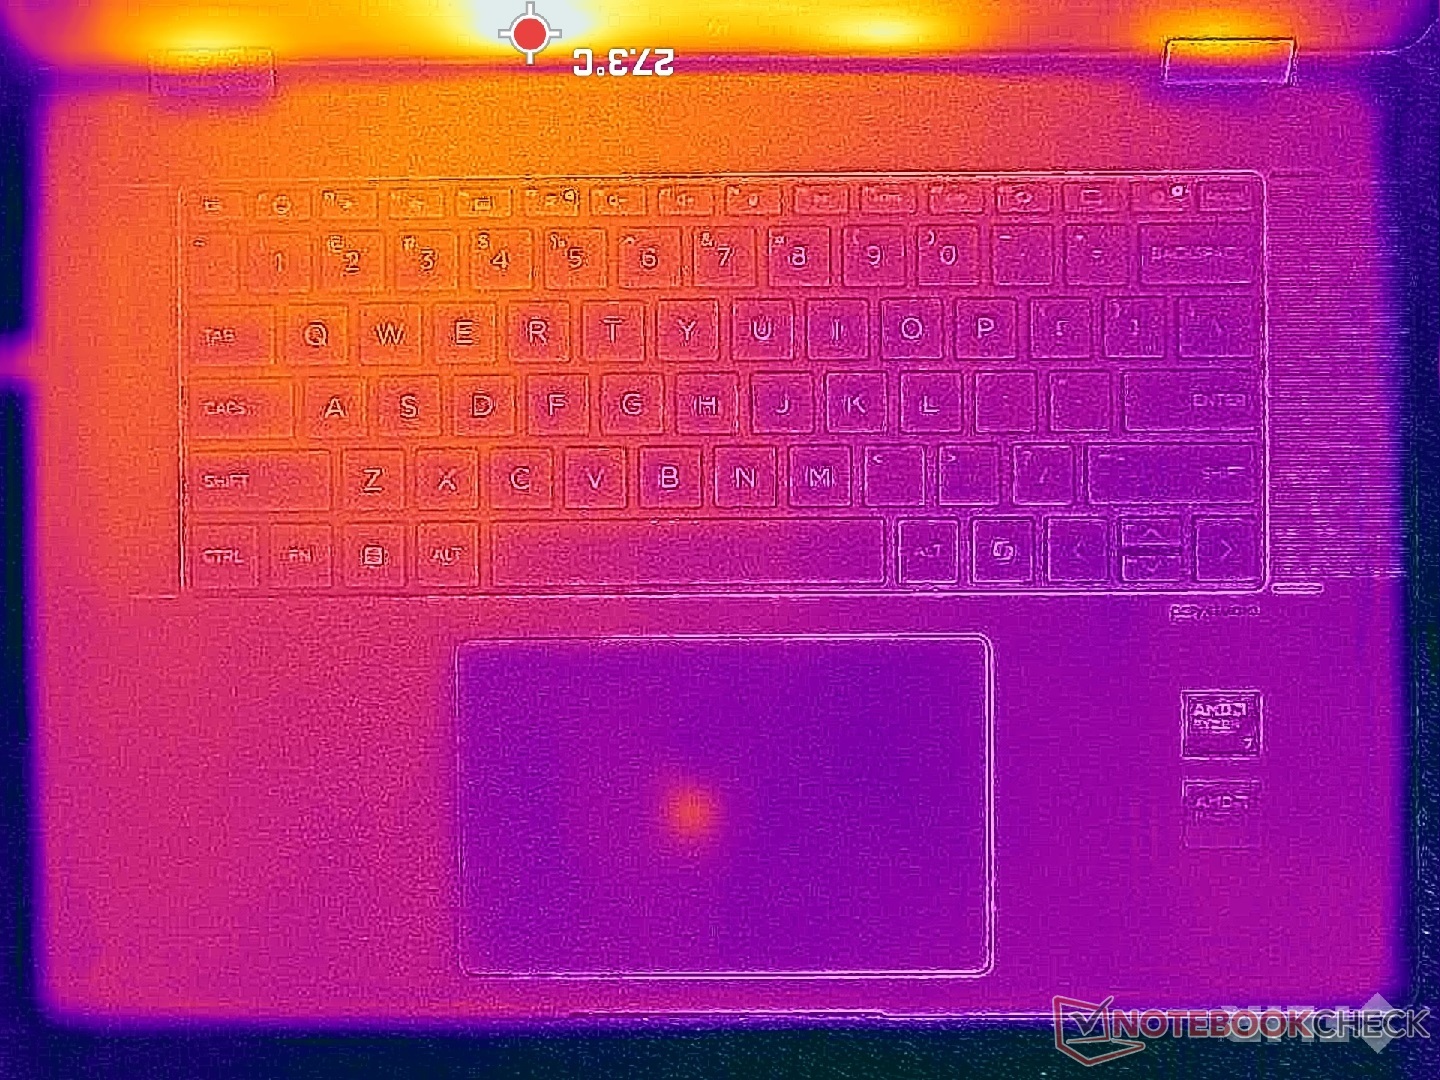
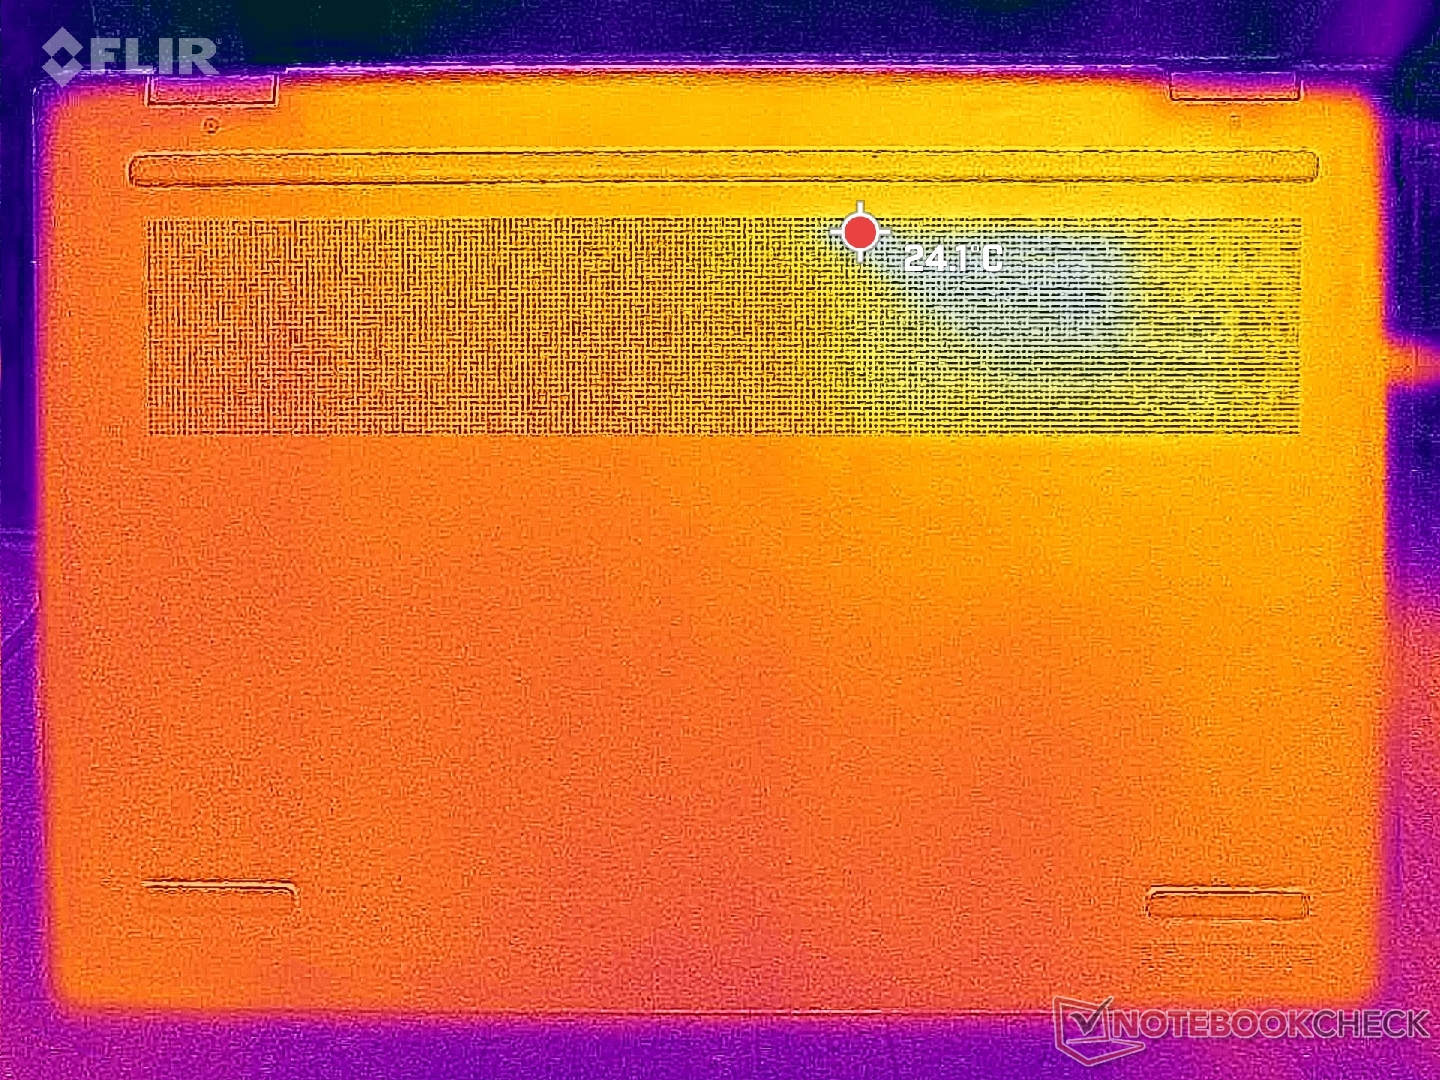
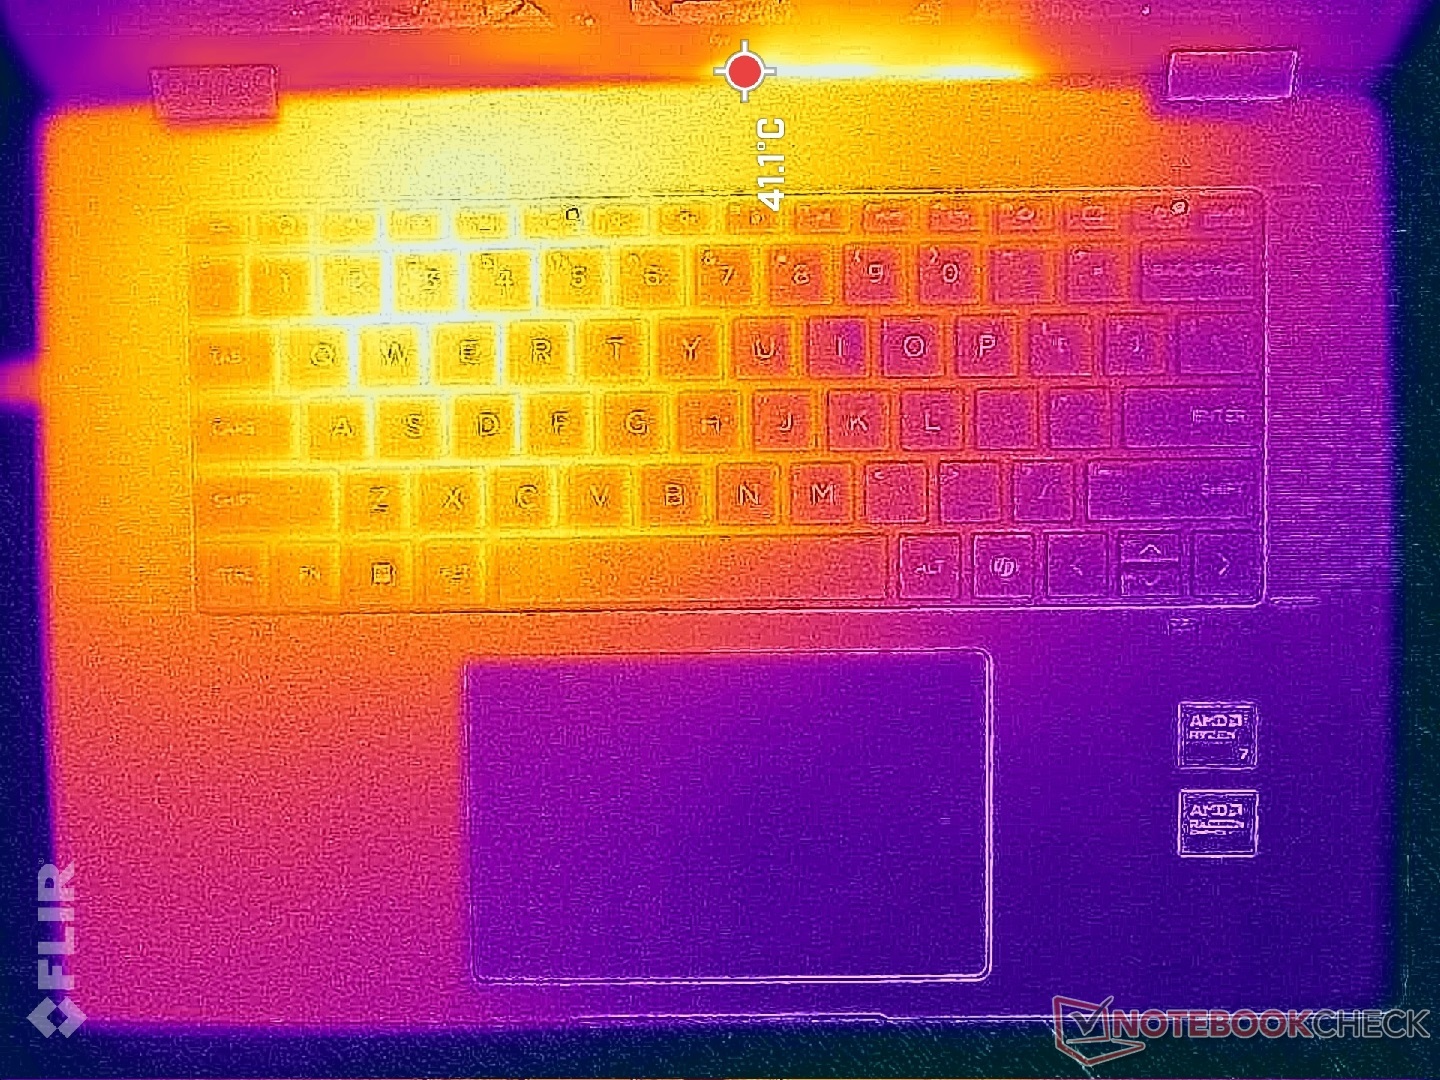
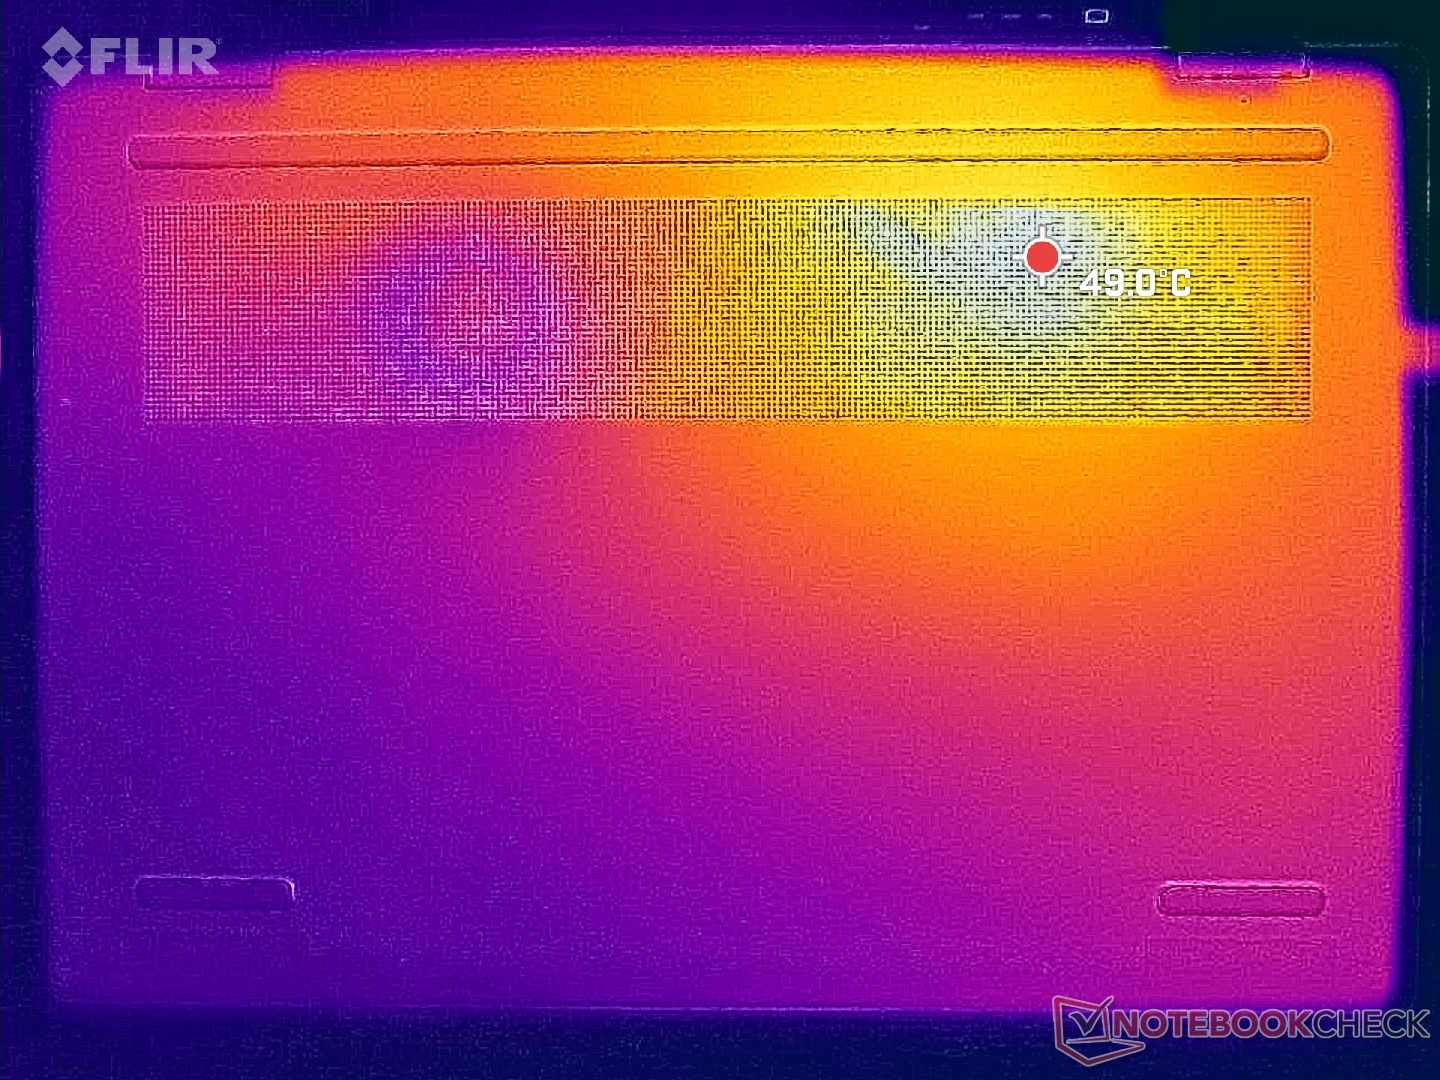
Os pontos quentes próximos às teclas WASD podem chegar a 41 °C, em comparação com 38 °C ou apenas 36 °C no mais lento Core U Yoga 7 2 em 1 16IML9 ou no Envy x360 15. O apoio para as mãos esquerdo, em particular, pode ficar visivelmente mais quente do que o direito quando sob carga, mas, felizmente, o calor nunca se torna muito desconfortável.
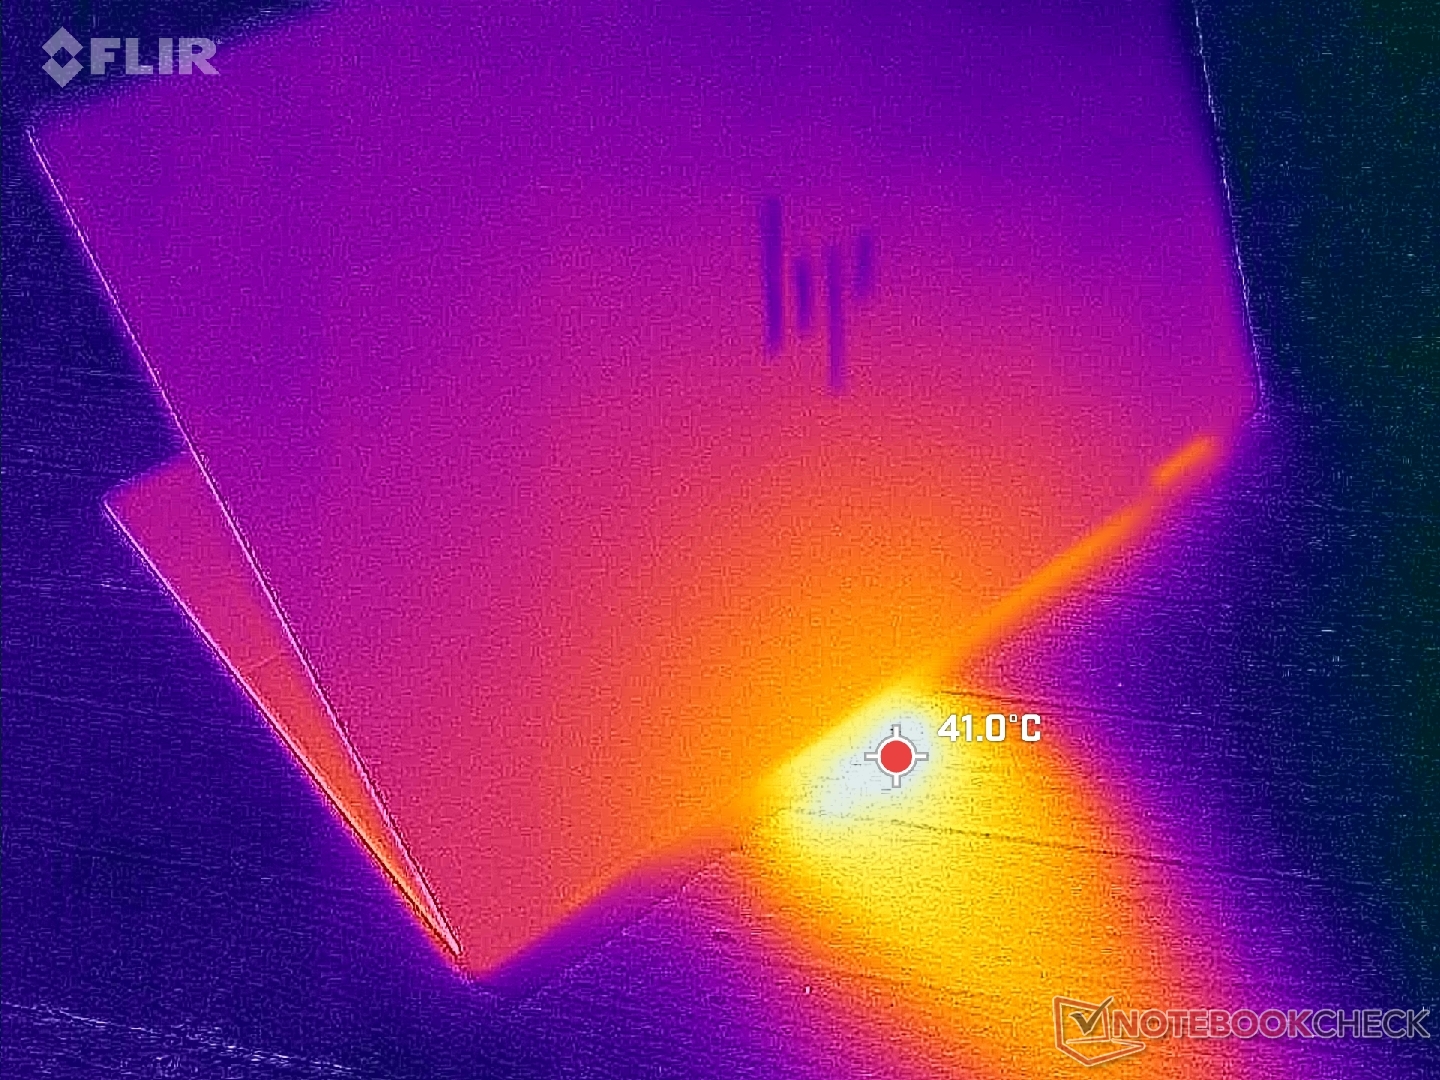
(±) A temperatura máxima no lado superior é 42.6 °C / 109 F, em comparação com a média de 35.4 °C / 96 F , variando de 19.6 a 60 °C para a classe Convertible.
(-) A parte inferior aquece até um máximo de 47.8 °C / 118 F, em comparação com a média de 36.9 °C / 98 F
(+) Em uso inativo, a temperatura média para o lado superior é 26.5 °C / 80 F, em comparação com a média do dispositivo de 30.3 °C / ### class_avg_f### F.
(+) Os apoios para as mãos e o touchpad estão atingindo a temperatura máxima da pele (32.4 °C / 90.3 F) e, portanto, não estão quentes.
(-) A temperatura média da área do apoio para as mãos de dispositivos semelhantes foi 28 °C / 82.4 F (-4.4 °C / -7.9 F).
| HP Envy x360 2-in-1 16-ad0097nr AMD Ryzen 7 8840HS, AMD Radeon 780M | HP Envy 16 h0112nr Intel Core i7-12700H, NVIDIA GeForce RTX 3060 Laptop GPU | HP Spectre x360 16 RTX 4050 Intel Core Ultra 7 155H, NVIDIA GeForce RTX 4050 Laptop GPU | Lenovo Yoga 7 2-in-1 16IML9 Intel Core Ultra 5 125U, Intel Graphics 4-Core iGPU (Meteor / Arrow Lake) | Samsung Galaxy Book4 Pro 360 Intel Core Ultra 5 125H, Intel Arc 7-Core iGPU | LG Gram 2in1 16 16T90R - G.AA78G Intel Core i7-1360P, Intel Iris Xe Graphics G7 96EUs | |
|---|---|---|---|---|---|---|
| Heat | -10% | 1% | 10% | 11% | -20% | |
| Maximum Upper Side * (°C) | 42.6 | 45.2 -6% | 39.6 7% | 37.8 11% | 38.6 9% | 55 -29% |
| Maximum Bottom * (°C) | 47.8 | 44 8% | 39.2 18% | 38.8 19% | 39.2 18% | 55.4 -16% |
| Idle Upper Side * (°C) | 27.4 | 33.6 -23% | 29 -6% | 25.4 7% | 25.2 8% | 34.9 -27% |
| Idle Bottom * (°C) | 27.8 | 32.6 -17% | 31.6 -14% | 26.8 4% | 25.7 8% | 30 -8% |
* ... menor é melhor
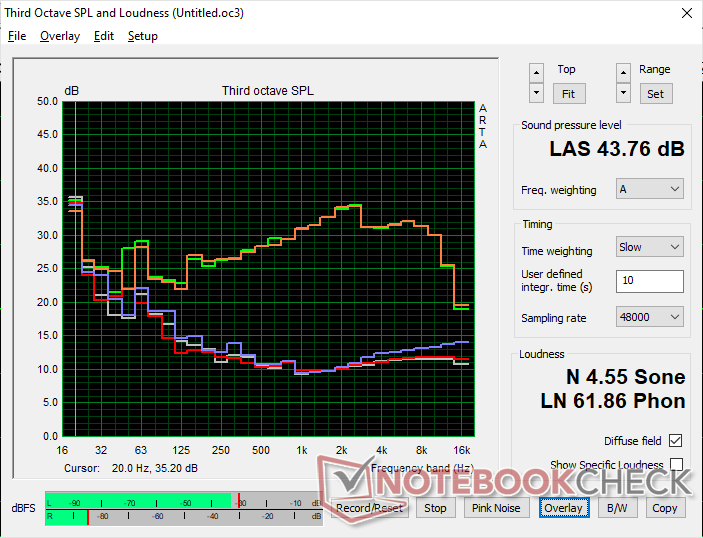
Alto-falantes

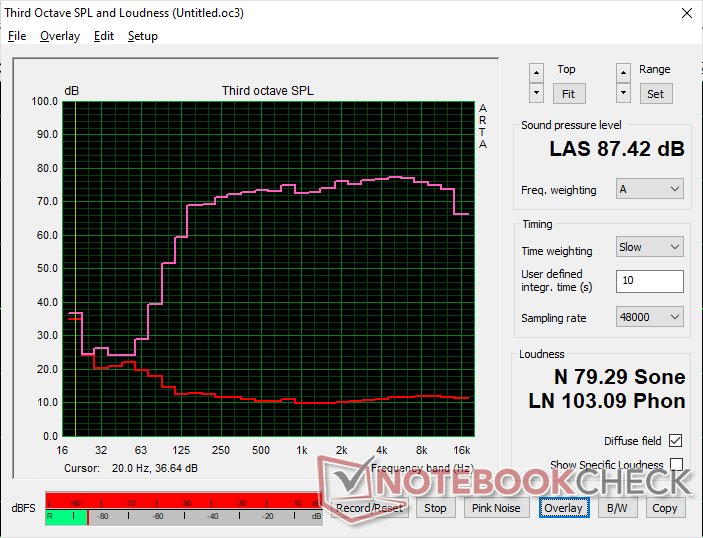
HP Envy x360 2-in-1 16-ad0097nr análise de áudio
(+) | os alto-falantes podem tocar relativamente alto (###valor### dB)
Graves 100 - 315Hz
(±) | graves reduzidos - em média 8.3% menor que a mediana
(±) | a linearidade dos graves é média (8.7% delta para a frequência anterior)
Médios 400 - 2.000 Hz
(+) | médios equilibrados - apenas 1% longe da mediana
(+) | médios são lineares (1.9% delta para frequência anterior)
Altos 2 - 16 kHz
(+) | agudos equilibrados - apenas 2.5% longe da mediana
(+) | os máximos são lineares (1.2% delta da frequência anterior)
Geral 100 - 16.000 Hz
(+) | o som geral é linear (6.5% diferença em relação à mediana)
Comparado com a mesma classe
» 0% de todos os dispositivos testados nesta classe foram melhores, 0% semelhantes, 99% piores
» O melhor teve um delta de 6%, a média foi 20%, o pior foi 57%
Comparado com todos os dispositivos testados
» 1% de todos os dispositivos testados foram melhores, 0% semelhantes, 99% piores
» O melhor teve um delta de 4%, a média foi 23%, o pior foi 134%
Apple MacBook Pro 16 2021 M1 Pro análise de áudio
(+) | os alto-falantes podem tocar relativamente alto (###valor### dB)
Graves 100 - 315Hz
(+) | bons graves - apenas 3.8% longe da mediana
(+) | o baixo é linear (5.2% delta para a frequência anterior)
Médios 400 - 2.000 Hz
(+) | médios equilibrados - apenas 1.3% longe da mediana
(+) | médios são lineares (2.1% delta para frequência anterior)
Altos 2 - 16 kHz
(+) | agudos equilibrados - apenas 1.9% longe da mediana
(+) | os máximos são lineares (2.7% delta da frequência anterior)
Geral 100 - 16.000 Hz
(+) | o som geral é linear (4.6% diferença em relação à mediana)
Comparado com a mesma classe
» 0% de todos os dispositivos testados nesta classe foram melhores, 0% semelhantes, 100% piores
» O melhor teve um delta de 5%, a média foi 17%, o pior foi 45%
Comparado com todos os dispositivos testados
» 0% de todos os dispositivos testados foram melhores, 0% semelhantes, 100% piores
» O melhor teve um delta de 4%, a média foi 23%, o pior foi 134%
Gerenciamento de energia
Consumo de energia
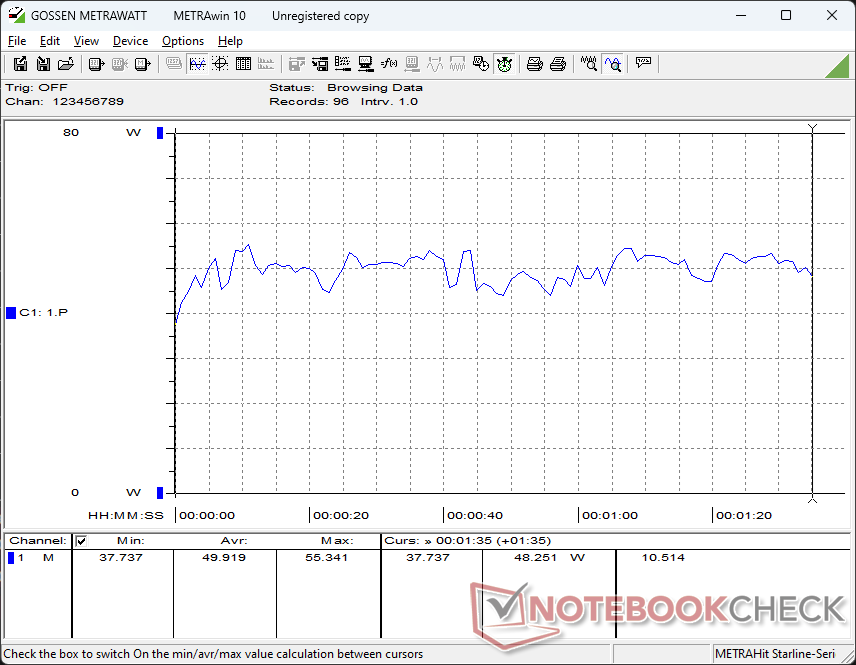
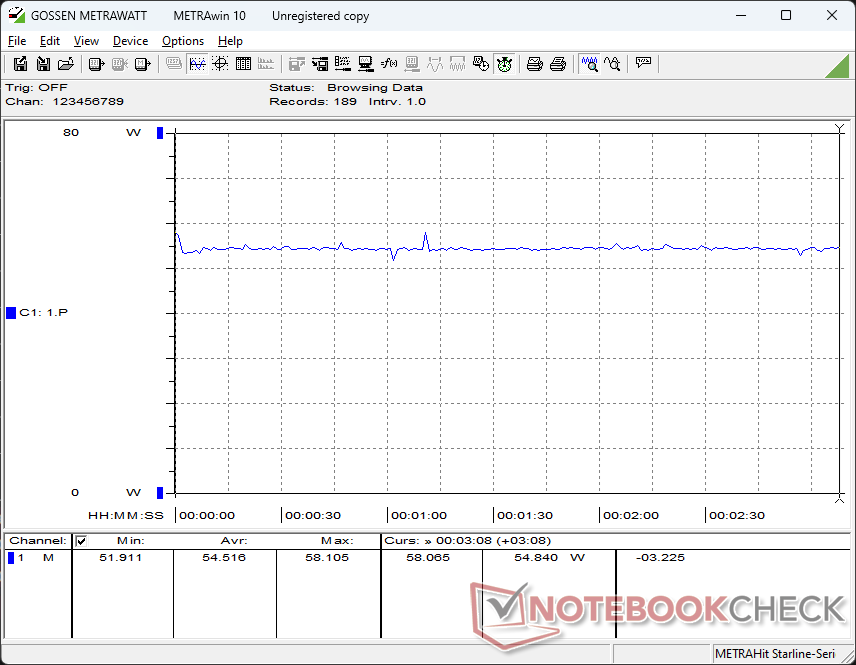
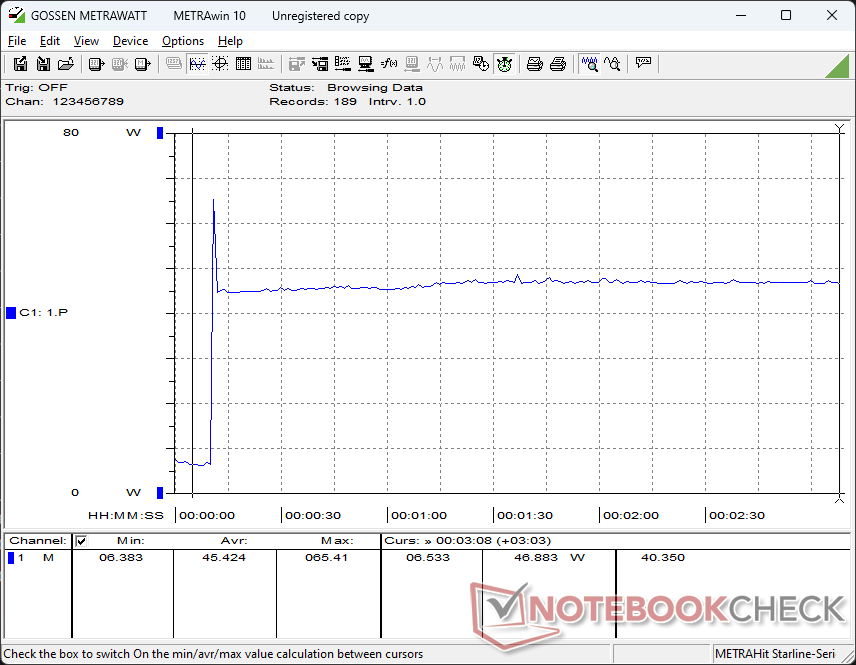
Ocioso no desktop exige entre 5 W e 15 W, o que é quase a metade do que o Spectre x360 16 devido à falta de uma GPU dedicada no modelo Envy. No entanto, é melhor limitar o tempo de tela com fundos brancos, pois o branco exige mais energia no OLED do que no IPS; conseguimos medir uma diferença de 9 W no nosso Envy ao exibir uma tela totalmente preta em comparação com uma tela totalmente branca quando ambas estão com o brilho máximo.
Execução Witcher 3 consome 55 W, em comparação com 47 W no Samsung Galaxy Book4 Pro 16 ou 54 W no IdeaPad Pro 6 16 cada um equipado com o concorrente Arc 8. O desempenho por watt ainda é muito bom e, em geral, está no mesmo nível das alternativas mais recentes da Intel, apesar de a solução da AMD ter quase dois anos de idade.
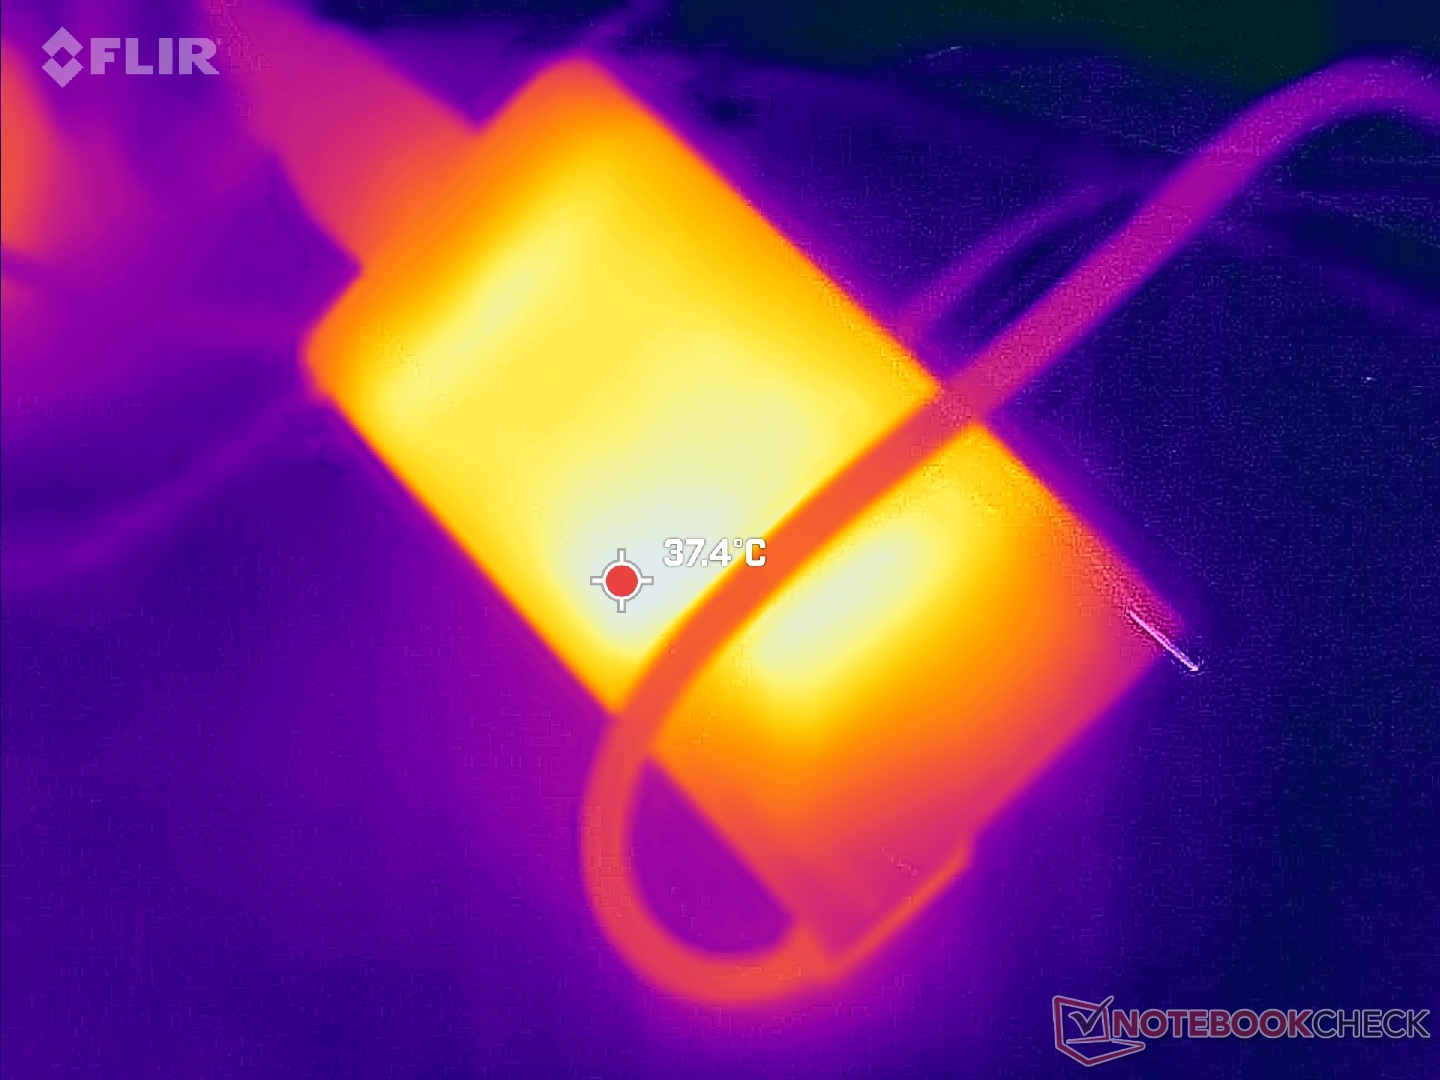
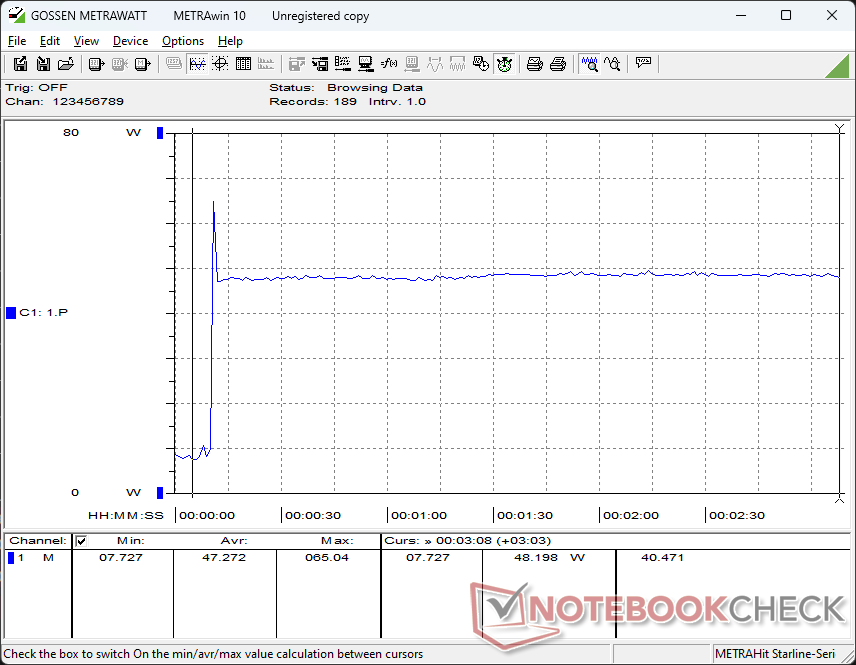
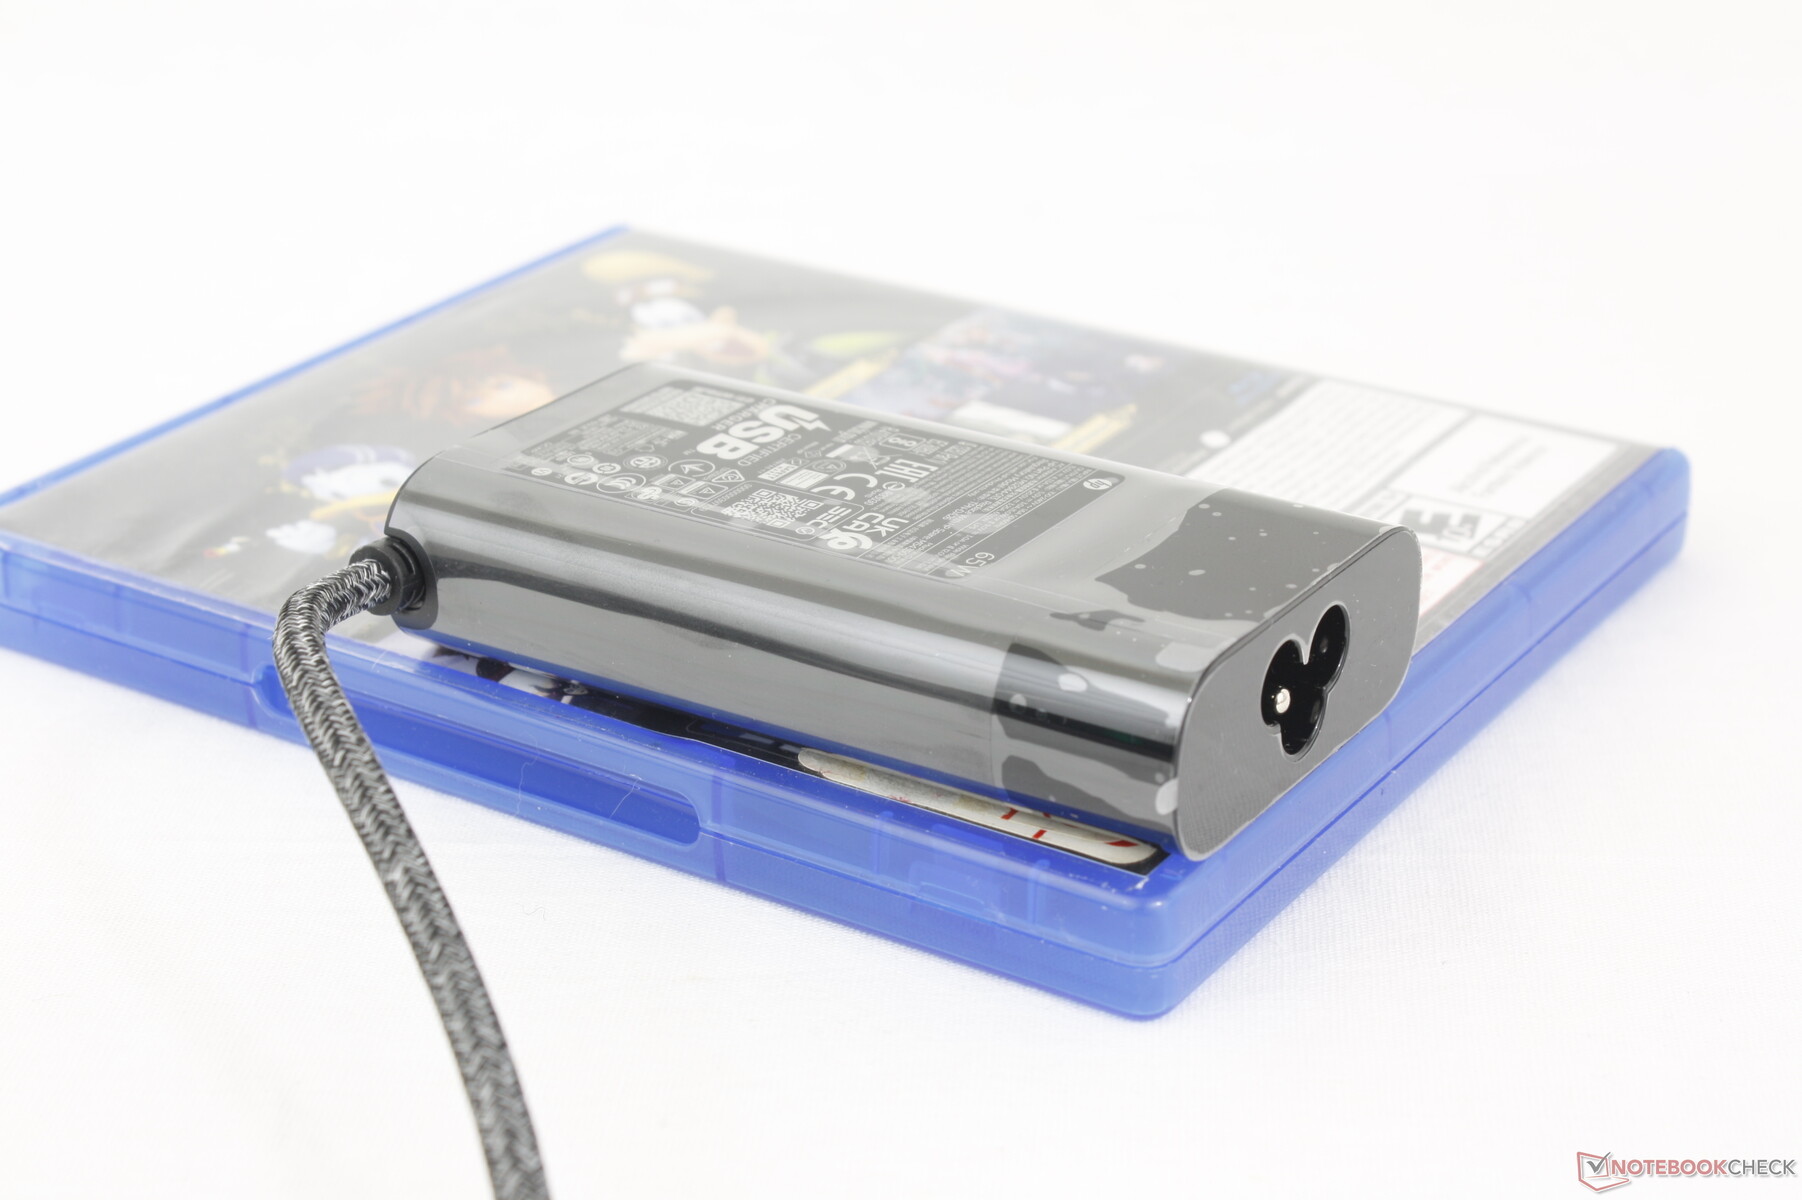
Conseguimos medir um consumo máximo temporário de 66 W do pequeno adaptador CA USB-C de 65 W (~9,6 x 5,5 x 2,2 cm) ao executar cargas extremas, conforme mostrado nas capturas de tela abaixo.
| desligado | |
| Ocioso | |
| Carga |
|
Key:
min: | |
| HP Envy x360 2-in-1 16-ad0097nr R7 8840HS, Radeon 780M, KIOXIA BG5 KBG50ZNV1T02, OLED, 2880x1800, 16" | HP Envy 16 h0112nr i7-12700H, GeForce RTX 3060 Laptop GPU, Micron 3400 1TB MTFDKBA1T0TFH, OLED, 3840x2400, 16" | HP Spectre x360 16 RTX 4050 Ultra 7 155H, GeForce RTX 4050 Laptop GPU, SK hynix PC801 HFS001TEJ9X101N, OLED, 2880x1800, 16" | Lenovo Yoga 7 2-in-1 16IML9 Ultra 5 125U, Graphics 4-Core iGPU (Arrow Lake), SK hynix HFS512GEJ4X112N, IPS, 1920x1200, 16" | Samsung Galaxy Book4 Pro 360 Ultra 5 125H, Arc 7-Core, Samsung PM9B1 512GB MZVL4512HBLU, OLED, 2880x1800, 16" | LG Gram 2in1 16 16T90R - G.AA78G i7-1360P, Iris Xe G7 96EUs, Samsung PM9A1 MZVL21T0HCLR, IPS, 2560x1600, 16" | |
|---|---|---|---|---|---|---|
| Power Consumption | -128% | -77% | 18% | 18% | -1% | |
| Idle Minimum * (Watt) | 5 | 10 -100% | 5.8 -16% | 3 40% | 3 40% | 5.5 -10% |
| Idle Average * (Watt) | 6.2 | 10.9 -76% | 12.3 -98% | 8.5 -37% | 6.3 -2% | 7.2 -16% |
| Idle Maximum * (Watt) | 14.7 | 27.8 -89% | 33.9 -131% | 8.9 39% | 6.5 56% | 12.9 12% |
| Load Average * (Watt) | 49.9 | 116.4 -133% | 83.3 -67% | 41.1 18% | 49.3 1% | 55 -10% |
| Witcher 3 ultra * (Watt) | 54.5 | 133.7 -145% | 89.1 -63% | 30.7 44% | 45.9 16% | 47 14% |
| Load Maximum * (Watt) | 65 | 209.8 -223% | 120.8 -86% | 64.6 1% | 65.5 -1% | 63.6 2% |
* ... menor é melhor
Power Consumption Witcher 3 / Stresstest
Power Consumption external Monitor
Duração da bateria
A capacidade da bateria é menor do que na maioria dos outros notebooks de 16 polegadas, o que, quando combinado com a exigente tela sensível ao toque OLED, leva a tempos de execução mais curtos em geral. Conseguimos extrair 7,5 horas de navegação no mundo real do Envy antes do desligamento automático, em comparação com mais de uma hora ou duas horas a mais no Samsung Galaxy Book4 Pro 360 ou no Spectre x360 16. Mesmo assim, a duração da bateria é muito boa, desde que os usuários não esperem um tempo de atividade no nível do MacBook.
O carregamento da bateria vazia até a capacidade total com o adaptador CA incluído leva cerca de 90 minutos.
| HP Envy x360 2-in-1 16-ad0097nr R7 8840HS, Radeon 780M, 68 Wh | HP Envy 16 h0112nr i7-12700H, GeForce RTX 3060 Laptop GPU, 83 Wh | HP Spectre x360 16 RTX 4050 Ultra 7 155H, GeForce RTX 4050 Laptop GPU, 83 Wh | Lenovo Yoga 7 2-in-1 16IML9 Ultra 5 125U, Graphics 4-Core iGPU (Arrow Lake), 71 Wh | Samsung Galaxy Book4 Pro 360 Ultra 5 125H, Arc 7-Core, 76 Wh | LG Gram 2in1 16 16T90R - G.AA78G i7-1360P, Iris Xe G7 96EUs, 80 Wh | |
|---|---|---|---|---|---|---|
| Duração da bateria | 0% | 43% | 60% | 8% | 30% | |
| Reader / Idle (h) | 15.6 | 17.8 14% | ||||
| WiFi v1.3 (h) | 7.7 | 7.9 3% | 11 43% | 12.3 60% | 8.9 16% | 11.9 55% |
| Load (h) | 1.9 | 1.6 -16% | 1.9 0% | 2 5% | ||
| H.264 (h) | 14.7 |
Pro
Contra
Veredicto - Experiência Spectre por menos
Atualmente, a HP oferece dois conversíveis de 16 polegadas para o consumidor: o Envy x360 16 de médio porte e o Spectre x360 16 de alto padrão Spectre x360 16. Surpreendentemente, o Envy é mais leve do que o Spectre, embora tenha exatamente a mesma tela touchscreen OLED e quase as mesmas dimensões. As experiências de usuário entre os dois modelos são, portanto, muito mais próximas do que o esperado, apesar das grandes diferenças de preço.
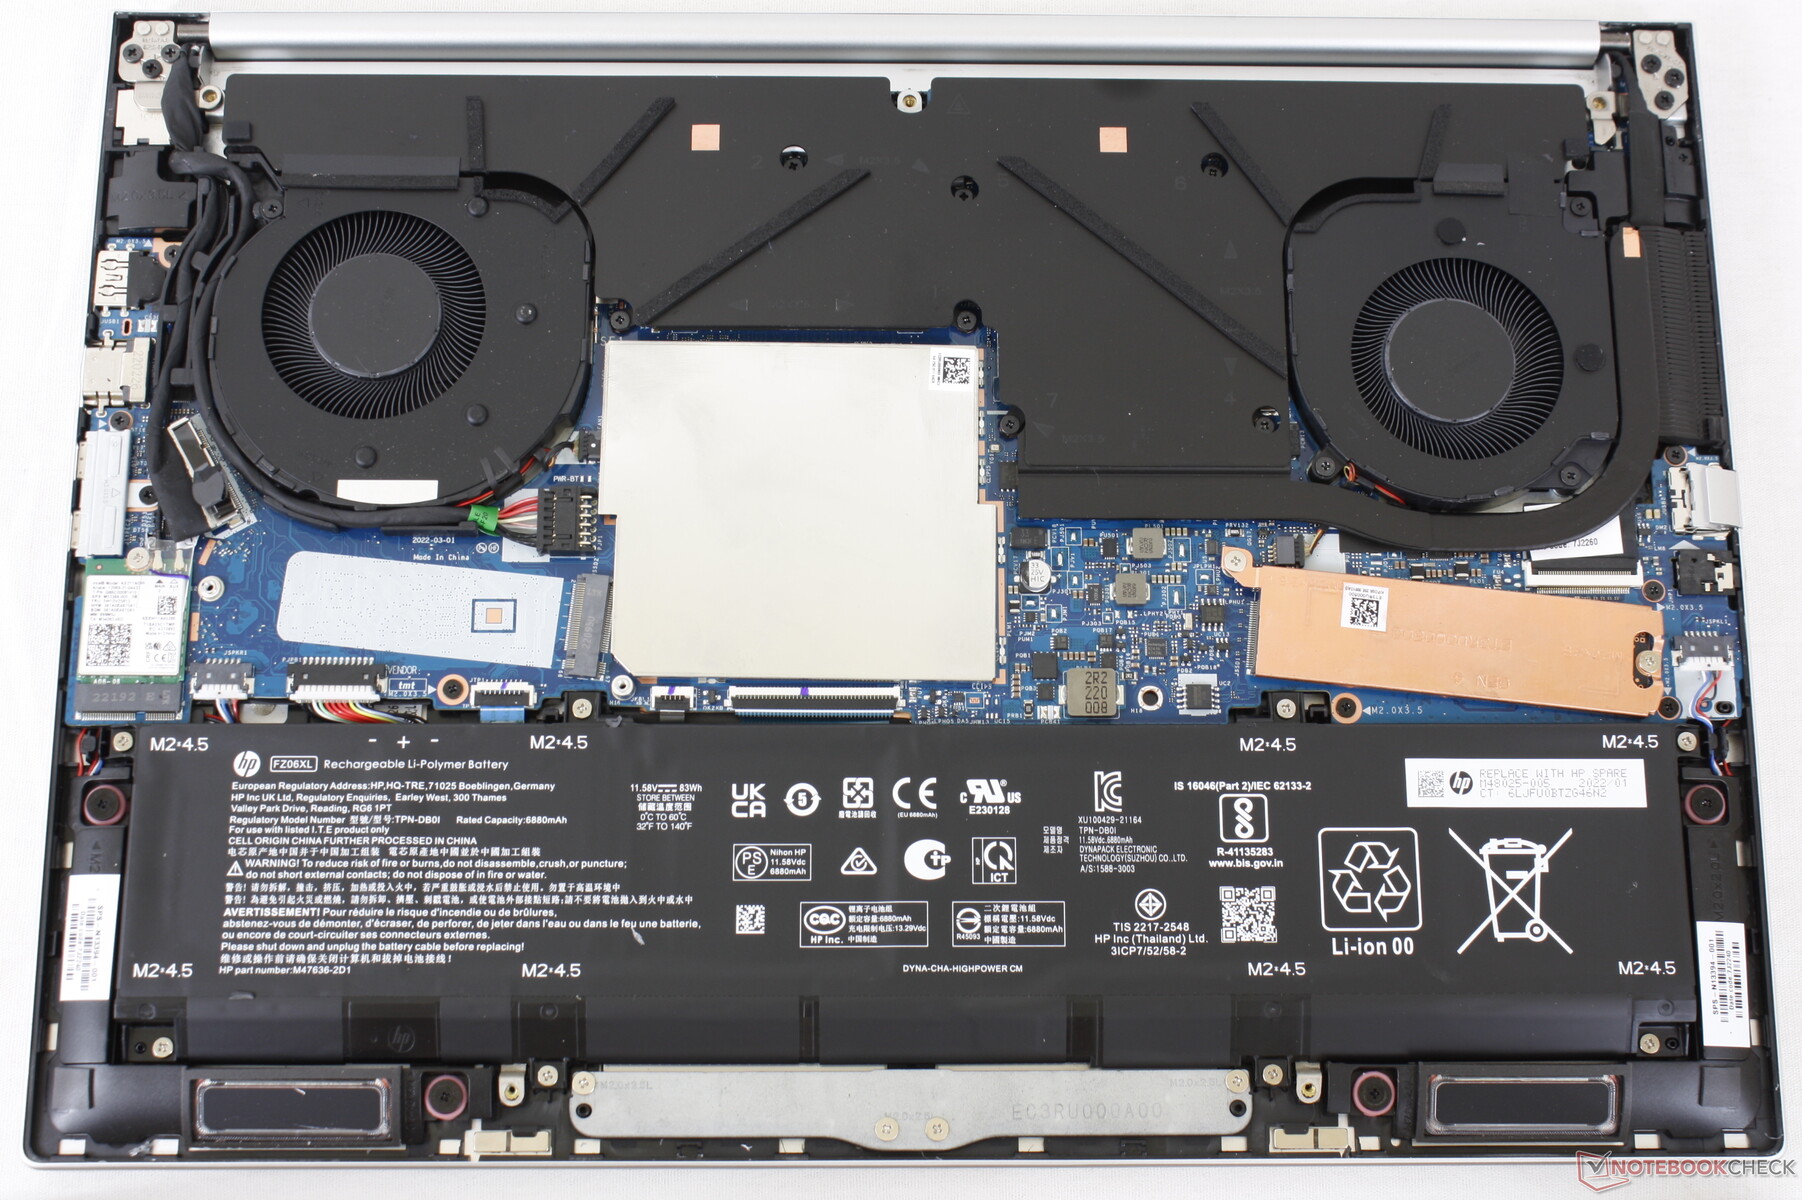
Ainda há algumas razões para preferir o Spectre x360 16, mais caro, além do design mais luxuoso. O Envy x360 16 tem uma bateria menor, não tem GPU dedicada e tem uma webcam de resolução mais baixa. Ele também tende a funcionar mais ruidosamente sob carga devido ao fato de ter apenas uma ventoinha interna em vez de duas. O Asus VivoBook Pro 16 é uma alternativa decente ao Envy x360 16, pois inclui OLED, uma dGPU para desempenho mais rápido e uma bateria maior por aproximadamente o mesmo preço, mas os proprietários perderiam o fator de forma 2 em 1.
O HP Envy x360 16 pronto para IA vem nas versões Intel e AMD e com recursos muito semelhantes aos do Spectre x360 16, mais caro. Embora as versões da AMD sejam notavelmente mais rápidas do que as da Intel, elas não têm suporte a USB4 e Thunderbolt para recursos de encaixe mais limitados.
Também temos que dar crédito ao modelo por oferecer as opções de CPU Intel Meteor Lake-U e AMD Hawk Point-HS, o que não é comum em outros notebooks. As versões da AMD são indiscutivelmente mais rápidas em termos de desempenho bruto do processador e até mesmo de desempenho gráfico integrado. No entanto, os usuários que valorizam o Thunderbolt não terão escolha a não ser ficar do lado da Intel e lidar com o processador mais lento. É lamentável que as versões AMD não suportem USB4, o que as tornaria mais facilmente recomendáveis em relação às opções Envy baseadas em Intel.
Preço e disponibilidade
A HP agora está enviando o Envy x360 16, conforme analisado, com o Ryzen 7 8840HS, 16 GB de RAM e SSD de 1 TB por US$ 1300.
HP Envy x360 2-in-1 16-ad0097nr
- 05/22/2024 v7 (old)
Allen Ngo
Transparência
A seleção dos dispositivos a serem analisados é feita pela nossa equipe editorial. A amostra de teste foi fornecida ao autor como empréstimo pelo fabricante ou varejista para fins desta revisão. O credor não teve influência nesta revisão, nem o fabricante recebeu uma cópia desta revisão antes da publicação. Não houve obrigação de publicar esta revisão. Como empresa de mídia independente, a Notebookcheck não está sujeita à autoridade de fabricantes, varejistas ou editores.
É assim que o Notebookcheck está testando
Todos os anos, o Notebookcheck analisa de forma independente centenas de laptops e smartphones usando procedimentos padronizados para garantir que todos os resultados sejam comparáveis. Desenvolvemos continuamente nossos métodos de teste há cerca de 20 anos e definimos padrões da indústria no processo. Em nossos laboratórios de teste, equipamentos de medição de alta qualidade são utilizados por técnicos e editores experientes. Esses testes envolvem um processo de validação em vários estágios. Nosso complexo sistema de classificação é baseado em centenas de medições e benchmarks bem fundamentados, o que mantém a objetividade.Price comparison

