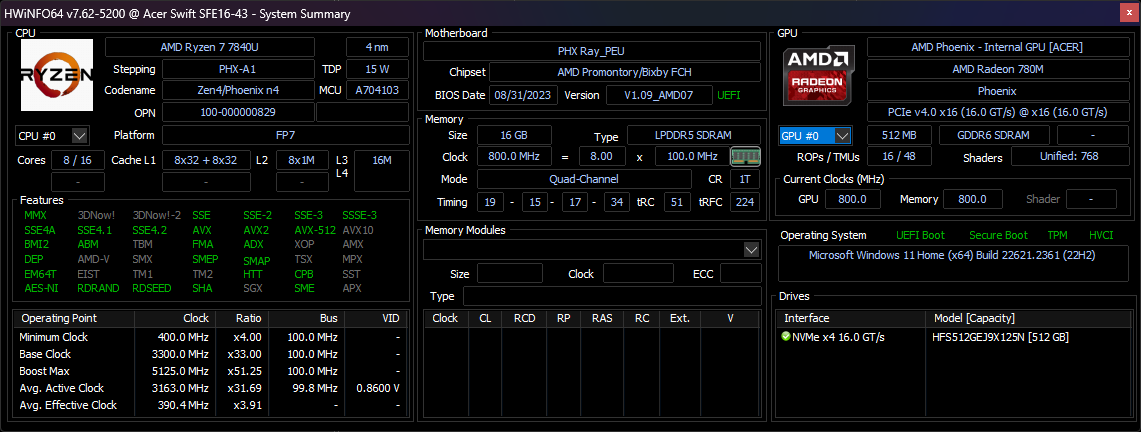
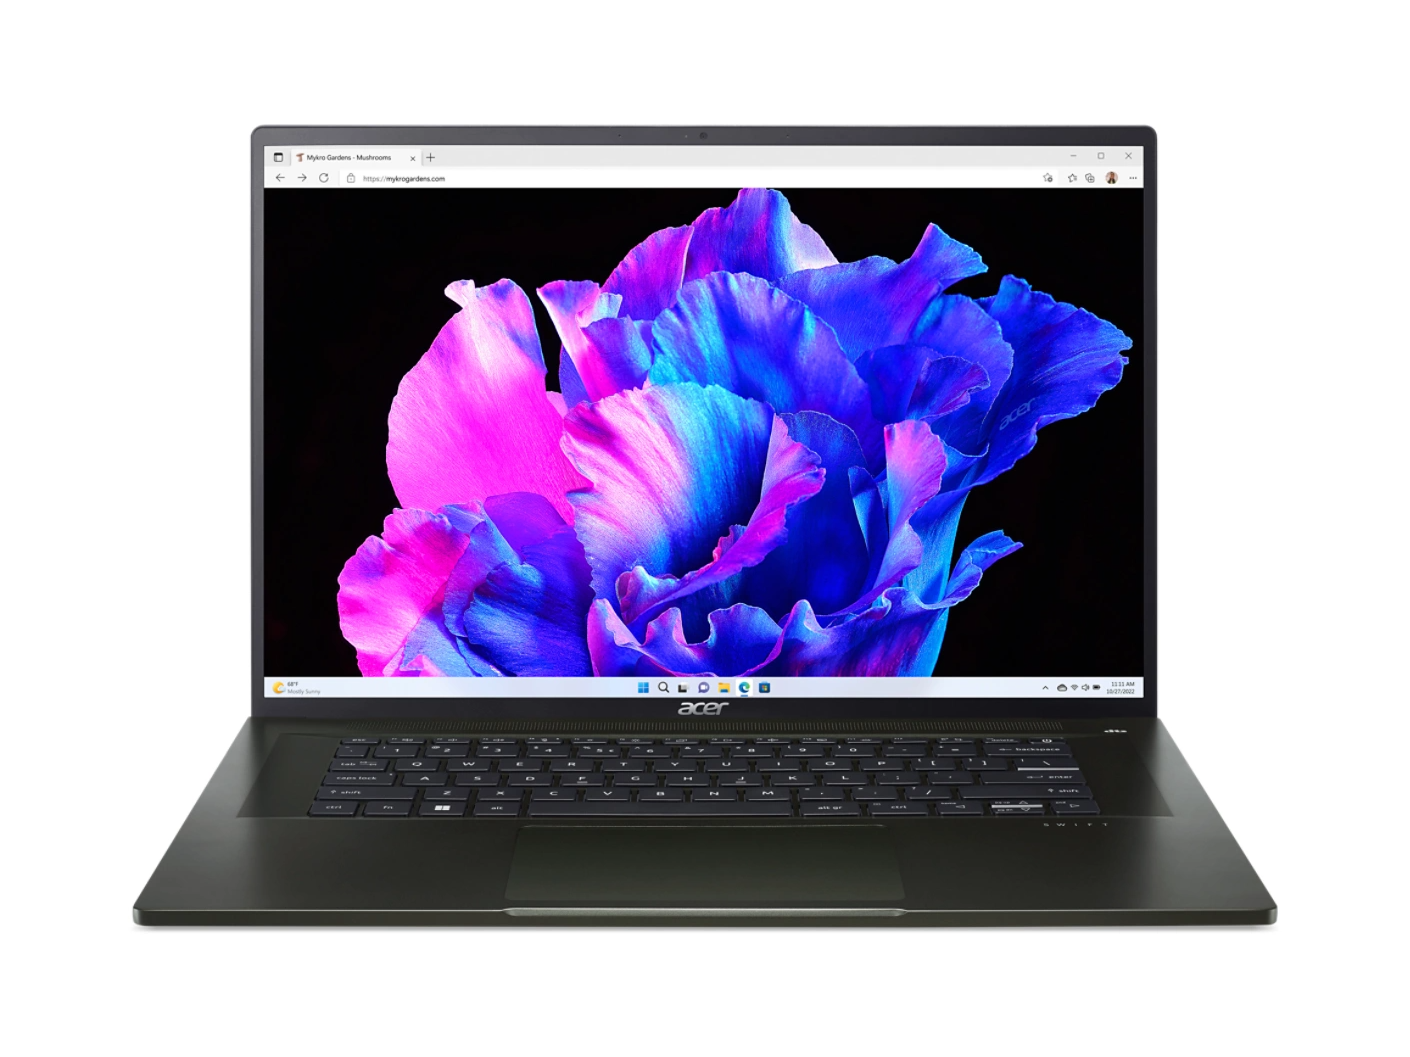
Análise do laptop Acer Swift Edge 16 Ryzen 7 7840U: CPU Zen 4 e aumento de 3,2K 120 Hz OLED

O Acer Swift Edge SFE16 foi atualizado nesta temporada para suportar a nova CPU Zen 4 Ryzen 7 7840U, acima do Zen 3+ Ryzen 7 7735U lançado apenas alguns meses antes. O modelo atualizado também recebe um novo painel OLED Samsung 3.2K de 120 Hz, em vez do painel 4K de 60 Hz da configuração do Zen 3+.
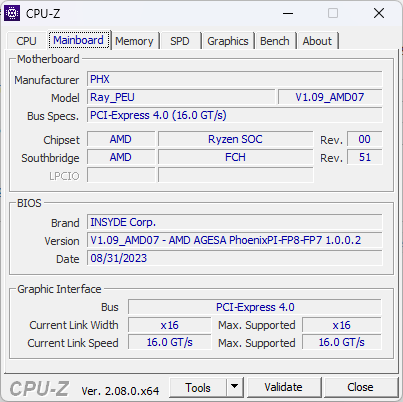
Além das diferenças de CPU e GPU mencionadas acima, o Swift Edge SFE16 Zen 4 e o Swift Edge SFE16 Zen 3+ usam designs de chassi semelhantes, com algumas diferenças que observaremos nesta análise. No entanto, internamente, muitos aspectos da placa-mãe foram alterados. Recomendamos dar uma olhada em nossa análise do Swift Edge SFE16 Zen 3+ para saber mais sobre os recursos físicos do modelo.
As alternativas ao Swift Edge incluem outros Ultrabooks leves de 16 polegadas, como o LG Gram 16, Samsung Galaxy Book3 Pro 16,Asus VivoBook 16ou oHuawei MateBook 16s.
O Swift Edge 16 não deve ser confundido com o Swift X 16, que é um laptop mais espesso com CPUs da série H mais rápidas e gráficos GeForce RTX dedicados.
Mais análises da Acer:
Possíveis concorrentes em comparação
Avaliação | Data | Modelo | Peso | Altura | Size | Resolução | Preço |
|---|---|---|---|---|---|---|---|
| 88.6 % v7 (old) | 10/2023 | Acer Swift Edge SFE16 Ryzen 7 7840U R7 7840U, Radeon 780M | 1.2 kg | 13 mm | 16.00" | 3200x2000 | |
| 87.5 % v7 (old) | 06/2023 | Acer Swift Edge SFE16-42-R1GM R7 7735U, Radeon 680M | 1.2 kg | 13.95 mm | 16.00" | 3840x2400 | |
| 88 % v7 (old) | 08/2023 | Lenovo Slim Pro 9i 16IRP8 i9-13905H, GeForce RTX 4050 Laptop GPU | 2.2 kg | 18.2 mm | 16.00" | 3200x2000 | |
| 86.3 % v7 (old) | 05/2023 | Asus VivoBook Pro 16 i7-12700H, GeForce RTX 3050 Ti Laptop GPU | 1.9 kg | 20 mm | 16.00" | 2560x1600 | |
| 89.4 % v7 (old) | 04/2023 | Samsung Galaxy Book3 Ultra 16 i7-13700H, GeForce RTX 4050 Laptop GPU | 1.8 kg | 16.5 mm | 16.00" | 2880x1800 | |
| 86.4 % v7 (old) | 07/2022 | Huawei MateBook 16s i7 i7-12700H, Iris Xe G7 96EUs | 2 kg | 17.8 mm | 16.00" | 2520x1680 |
Caso
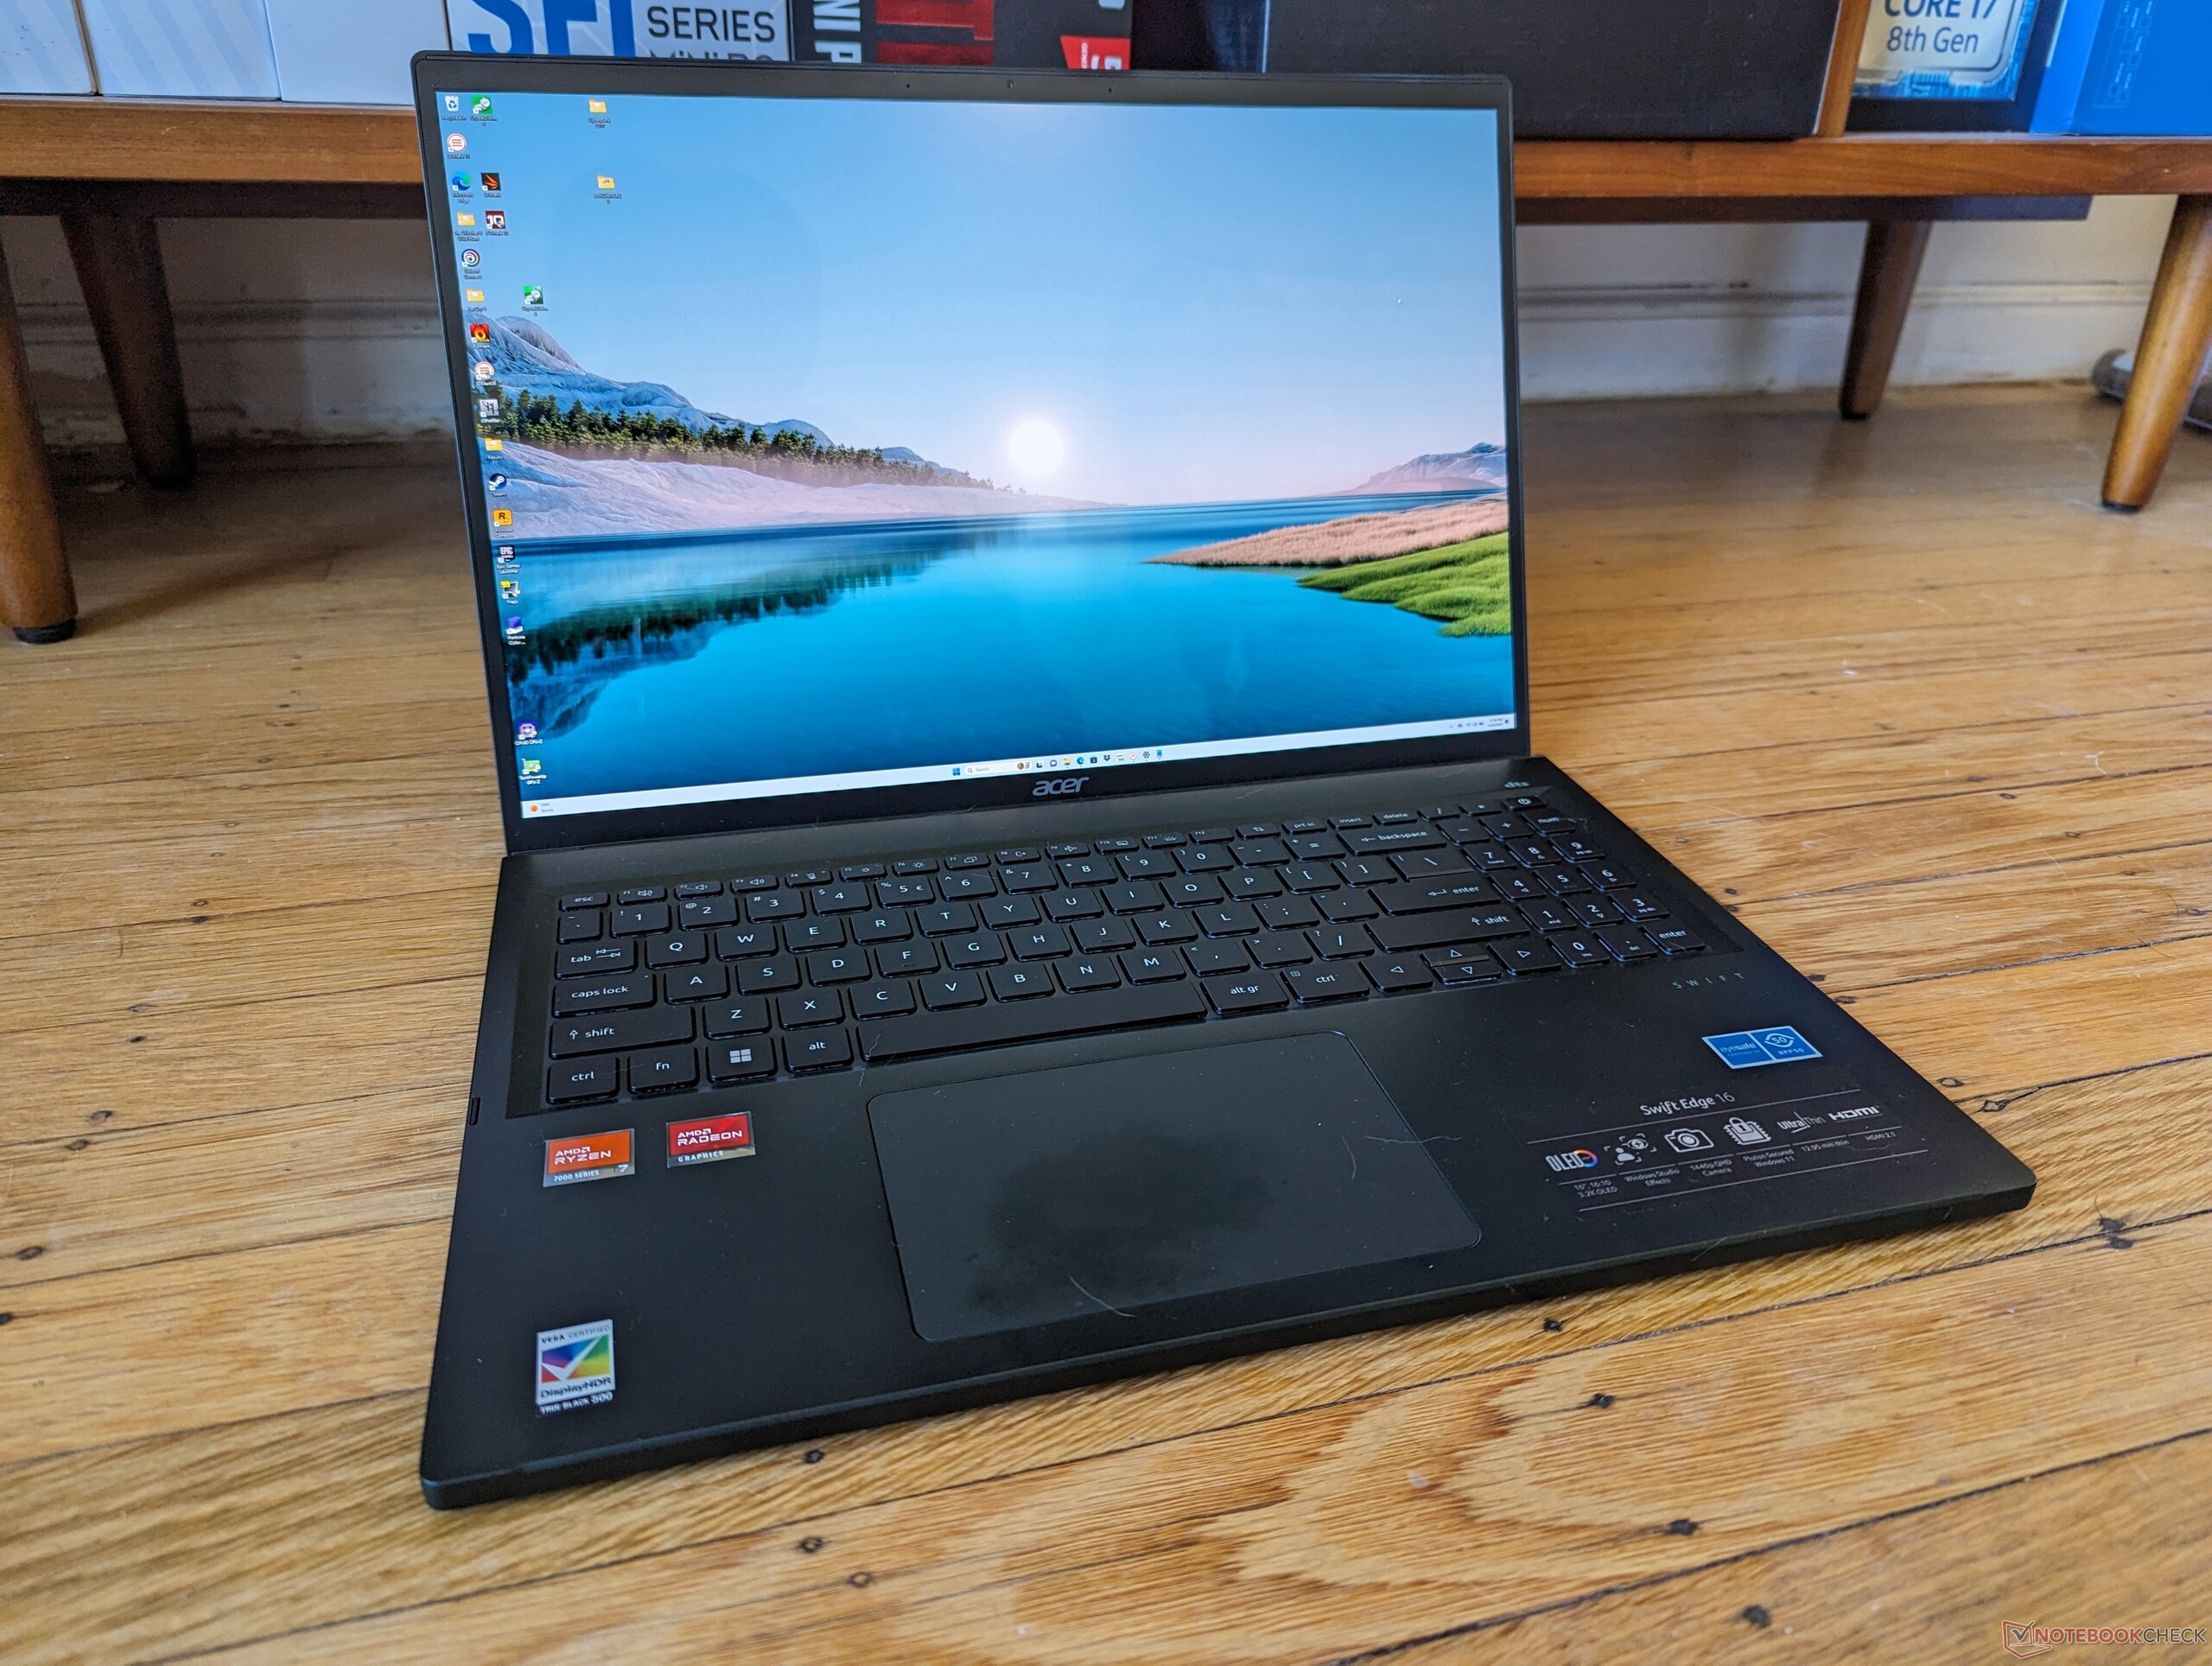
O Swift Edge 16 Zen 4 pode parecer idêntico ao Swift Edge 16 Zen 3+ à primeira vista, mas as mudanças externas são perceptíveis após uma inspeção mais detalhada. Em primeiro lugar, a versão mais recente integra um teclado numérico, que não existia na versão Zen 3+. Em segundo lugar, as grades de ventilação acima da primeira linha de teclas do teclado desapareceram e a borda frontal agora é contínua, sem cortes. Essa última é uma mudança estranha, pois torna a tampa mais difícil de abrir.
Fora isso, o modelo utiliza os mesmos materiais suaves de magnésio e alumínio do chassi, as mesmas portas e posicionamento e o mesmo tamanho de clickpad de antes. As dimensões são apenas um pouco mais largas e mais finas desta vez, mas as diferenças são difíceis de notar na prática.
Leitor de cartão SD
A Acer adicionou um leitor MicroSD, enquanto o recurso estava faltando na configuração do Ryzen 7 7735U. No entanto, as taxas de transferência são cerca de três vezes mais lentas do que as dos leitores de cartão SD dos modelos concorrentes, como oAsus VivoBook Pro 16 ou Samsung Galaxy Book3 Ultra 16.
| SD Card Reader | |
| average JPG Copy Test (av. of 3 runs) | |
| Lenovo Slim Pro 9i 16IRP8 (PNY EliteX-Pro60 V60 256 GB) | |
| Samsung Galaxy Book3 Ultra 16 (AV PRO microSD 128 GB V60) | |
| Asus VivoBook Pro 16 (AV Pro SD microSD 128 GB V60) | |
| Acer Swift Edge SFE16 Ryzen 7 7840U (AV Pro V60) | |
| maximum AS SSD Seq Read Test (1GB) | |
| Lenovo Slim Pro 9i 16IRP8 (PNY EliteX-Pro60 V60 256 GB) | |
| Samsung Galaxy Book3 Ultra 16 (AV PRO microSD 128 GB V60) | |
| Asus VivoBook Pro 16 (AV Pro SD microSD 128 GB V60) | |
| Acer Swift Edge SFE16 Ryzen 7 7840U (AV Pro V60) | |
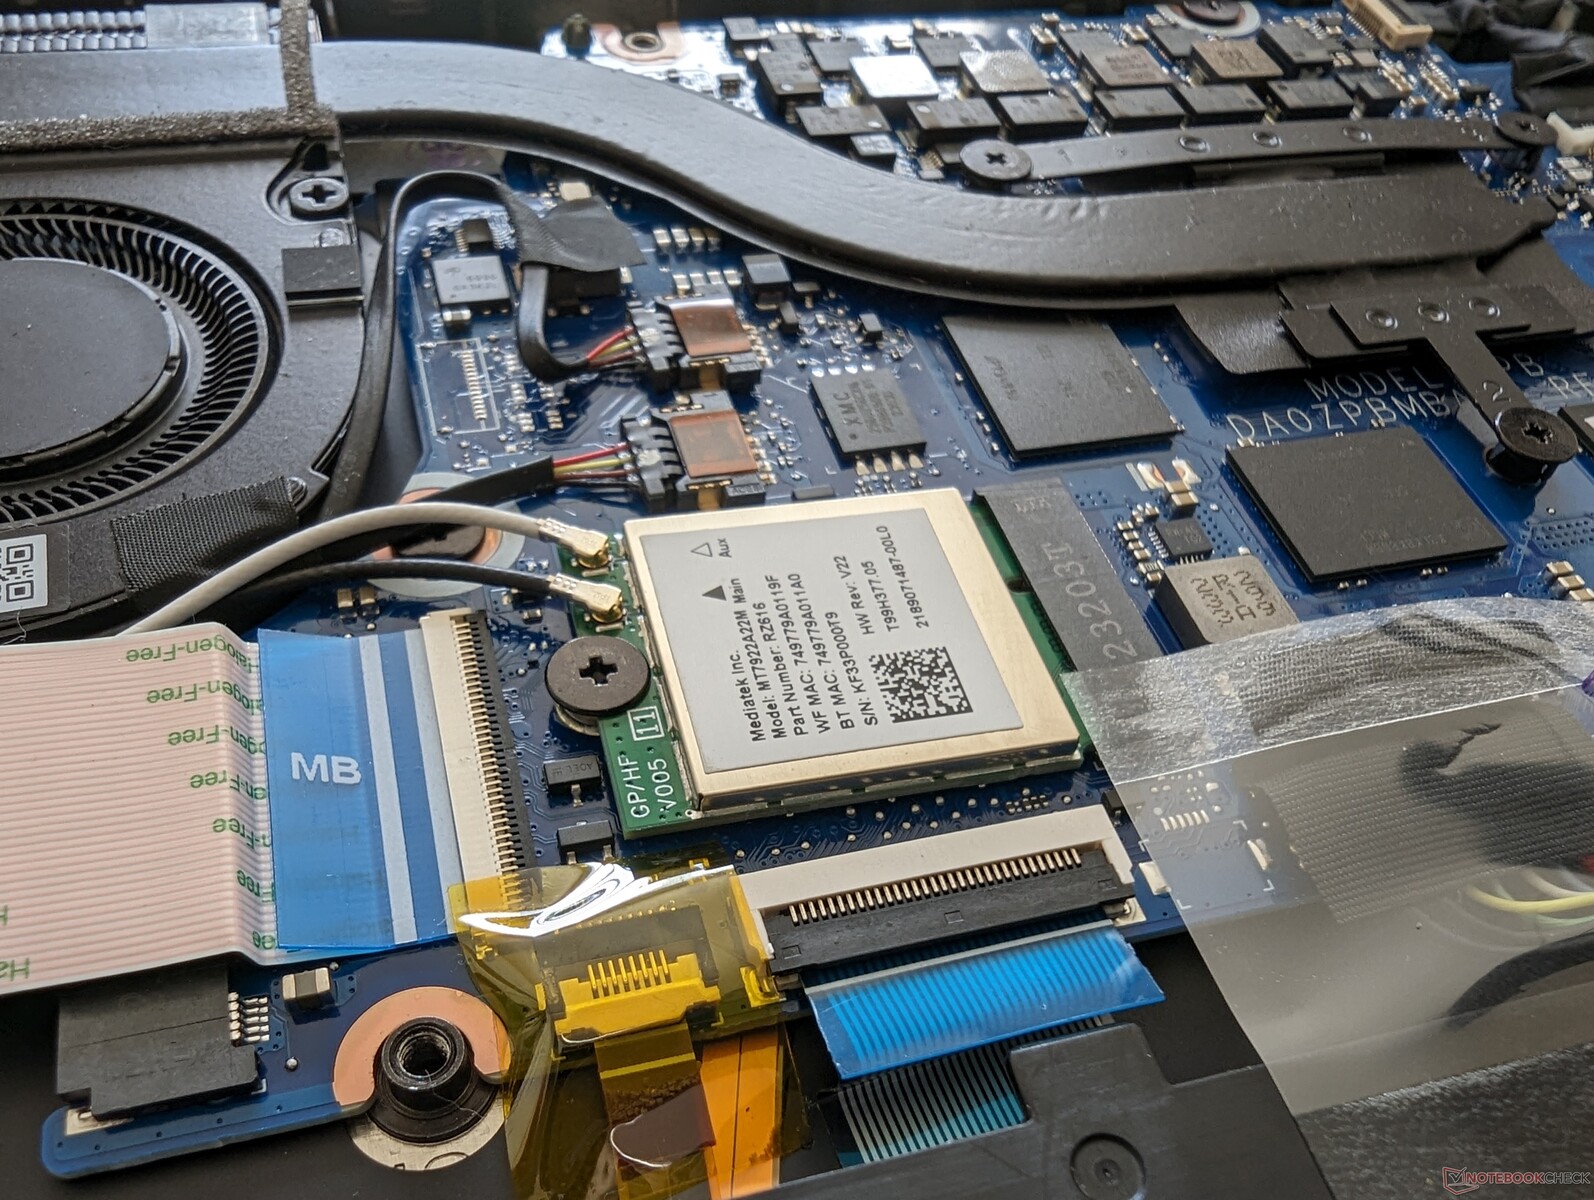
Comunicação
O módulo MediaTek tem velocidades de transmissão excepcionalmente lentas quando está no Wi-Fi 6, semelhante ao que observamos na configuração do Zen 3+. Por outro lado, as velocidades do Wi-Fi 6E são excelentes quando emparelhadas com nossa rede Asus AXE11000 de 6 GHz.
Webcam
A webcam é de 3,7 MP com gravação de até 1440p30, em comparação com a gravação de 2,1 MP e 1080p30 na configuração do Zen 3+, para uma imagem um pouco mais nítida.
Ainda não há obturador de privacidade embutido na webcam ou suporte a infravermelho.


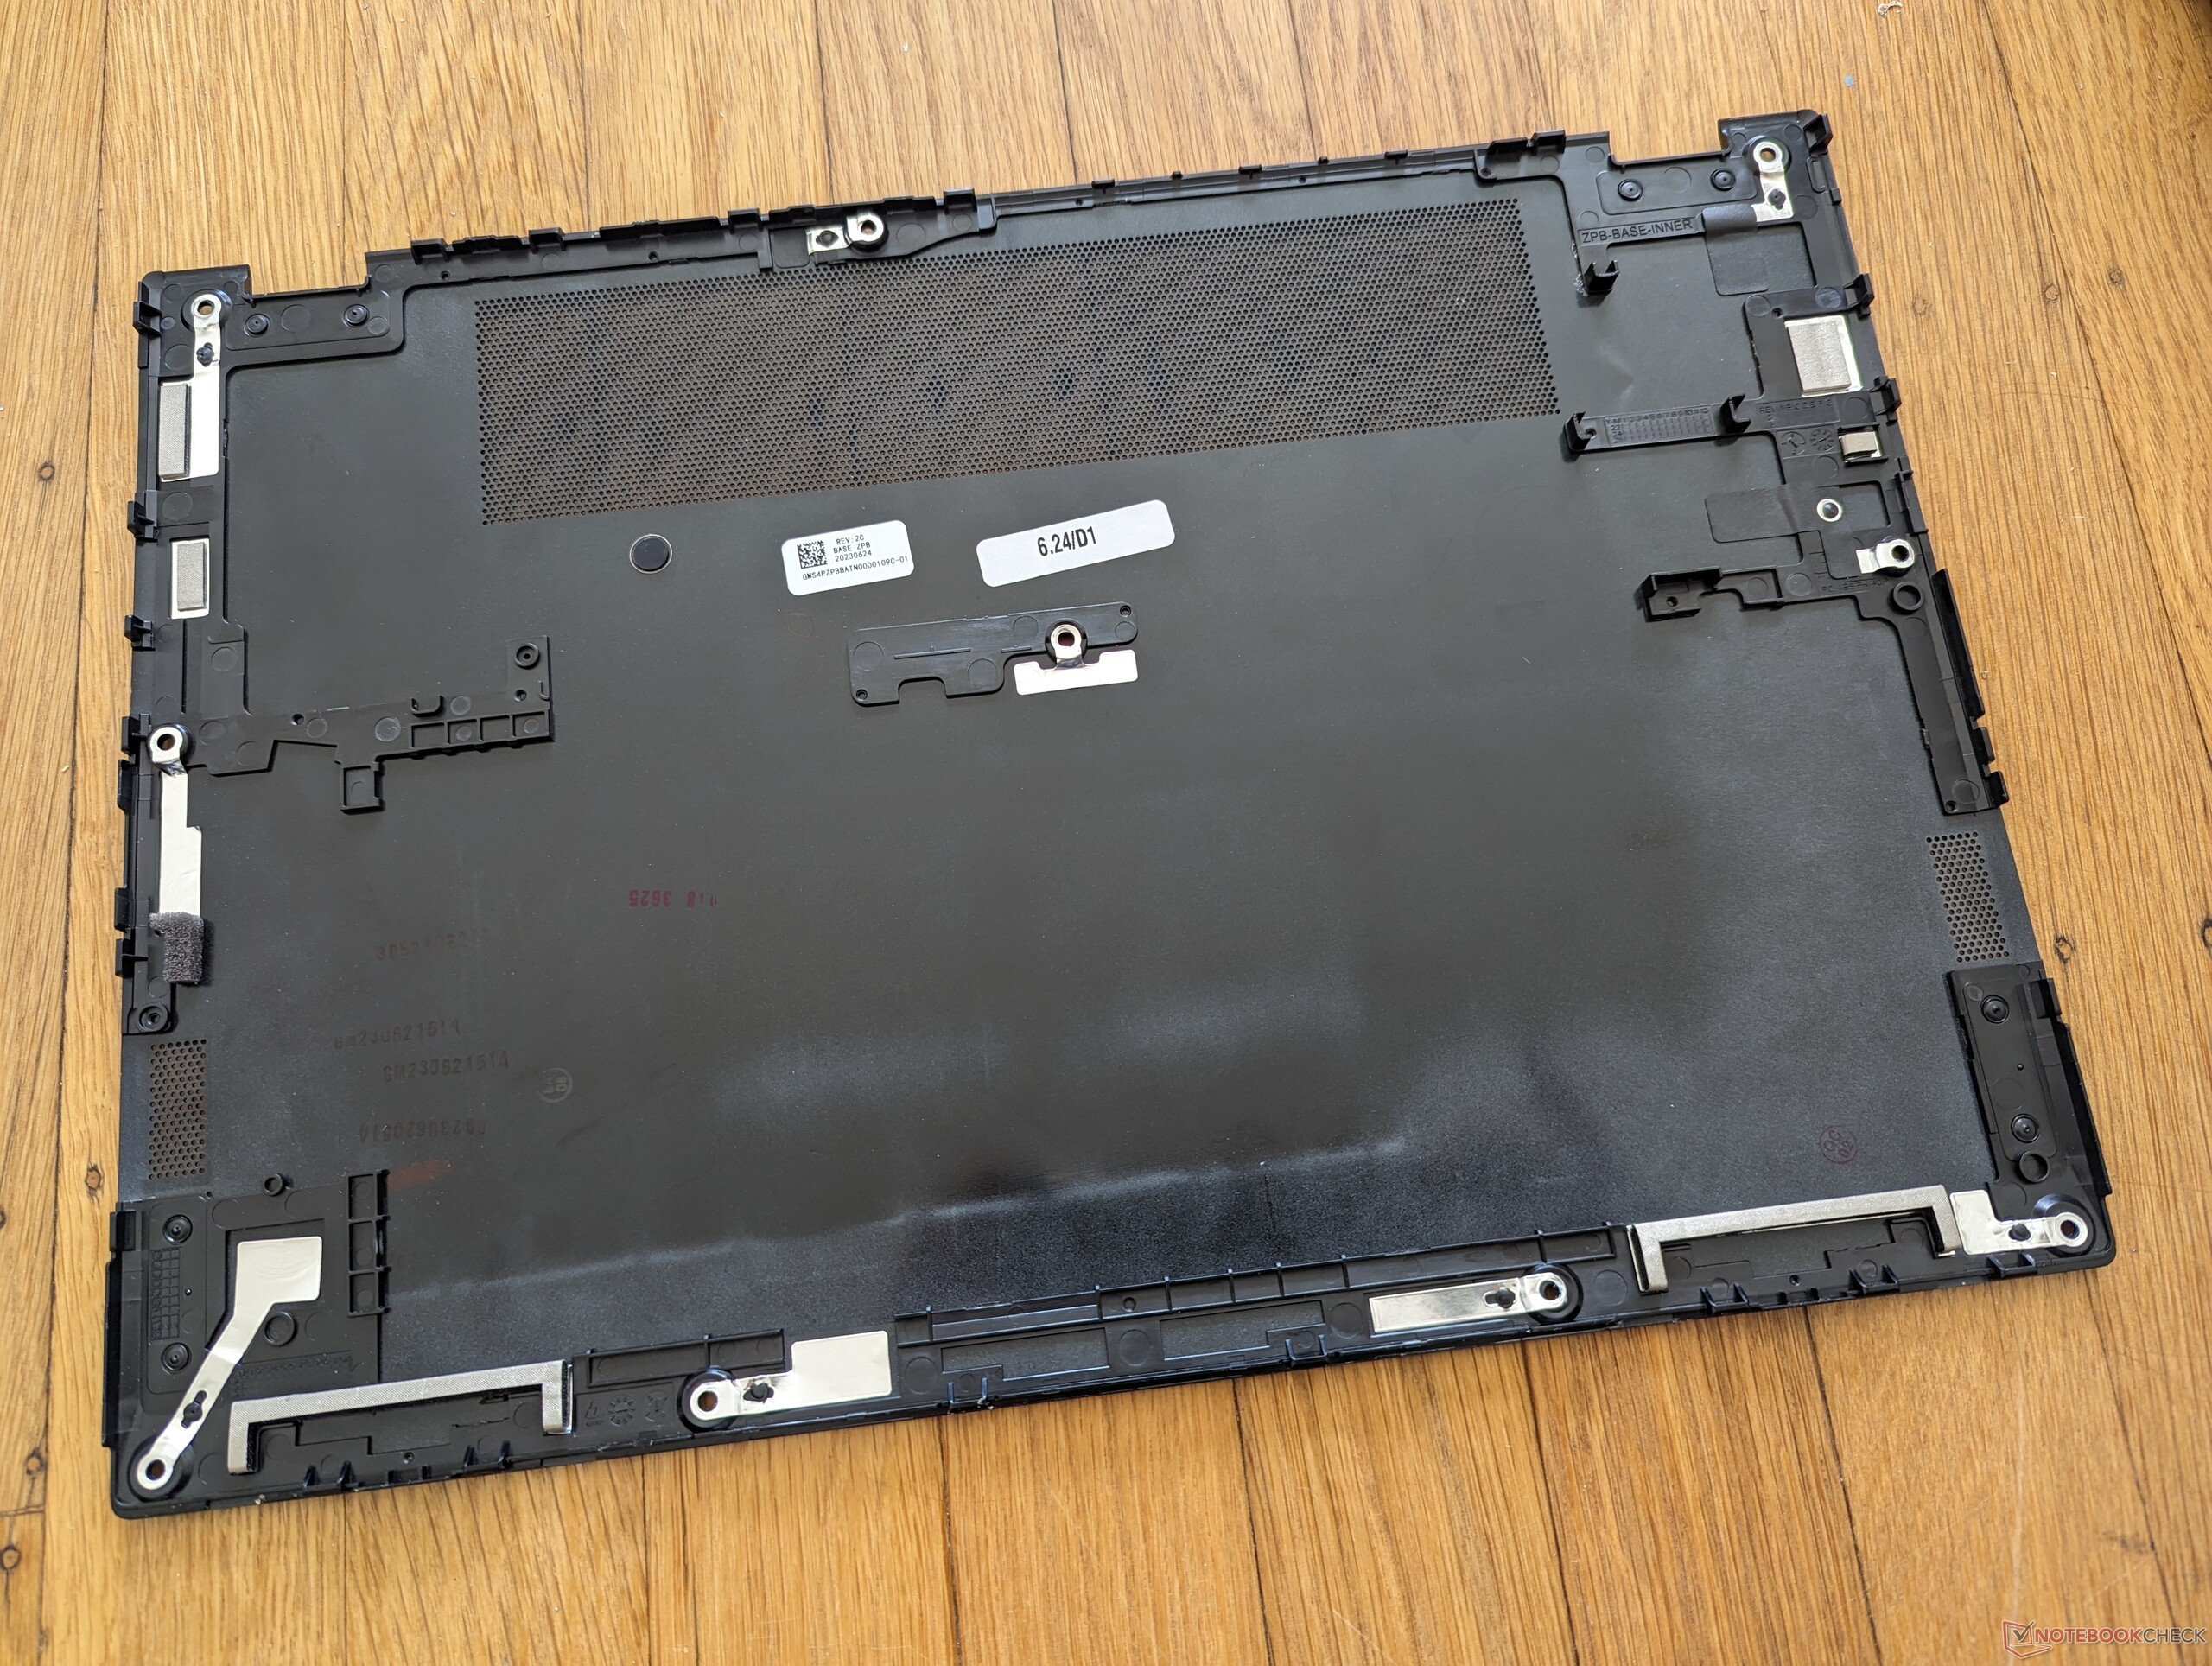
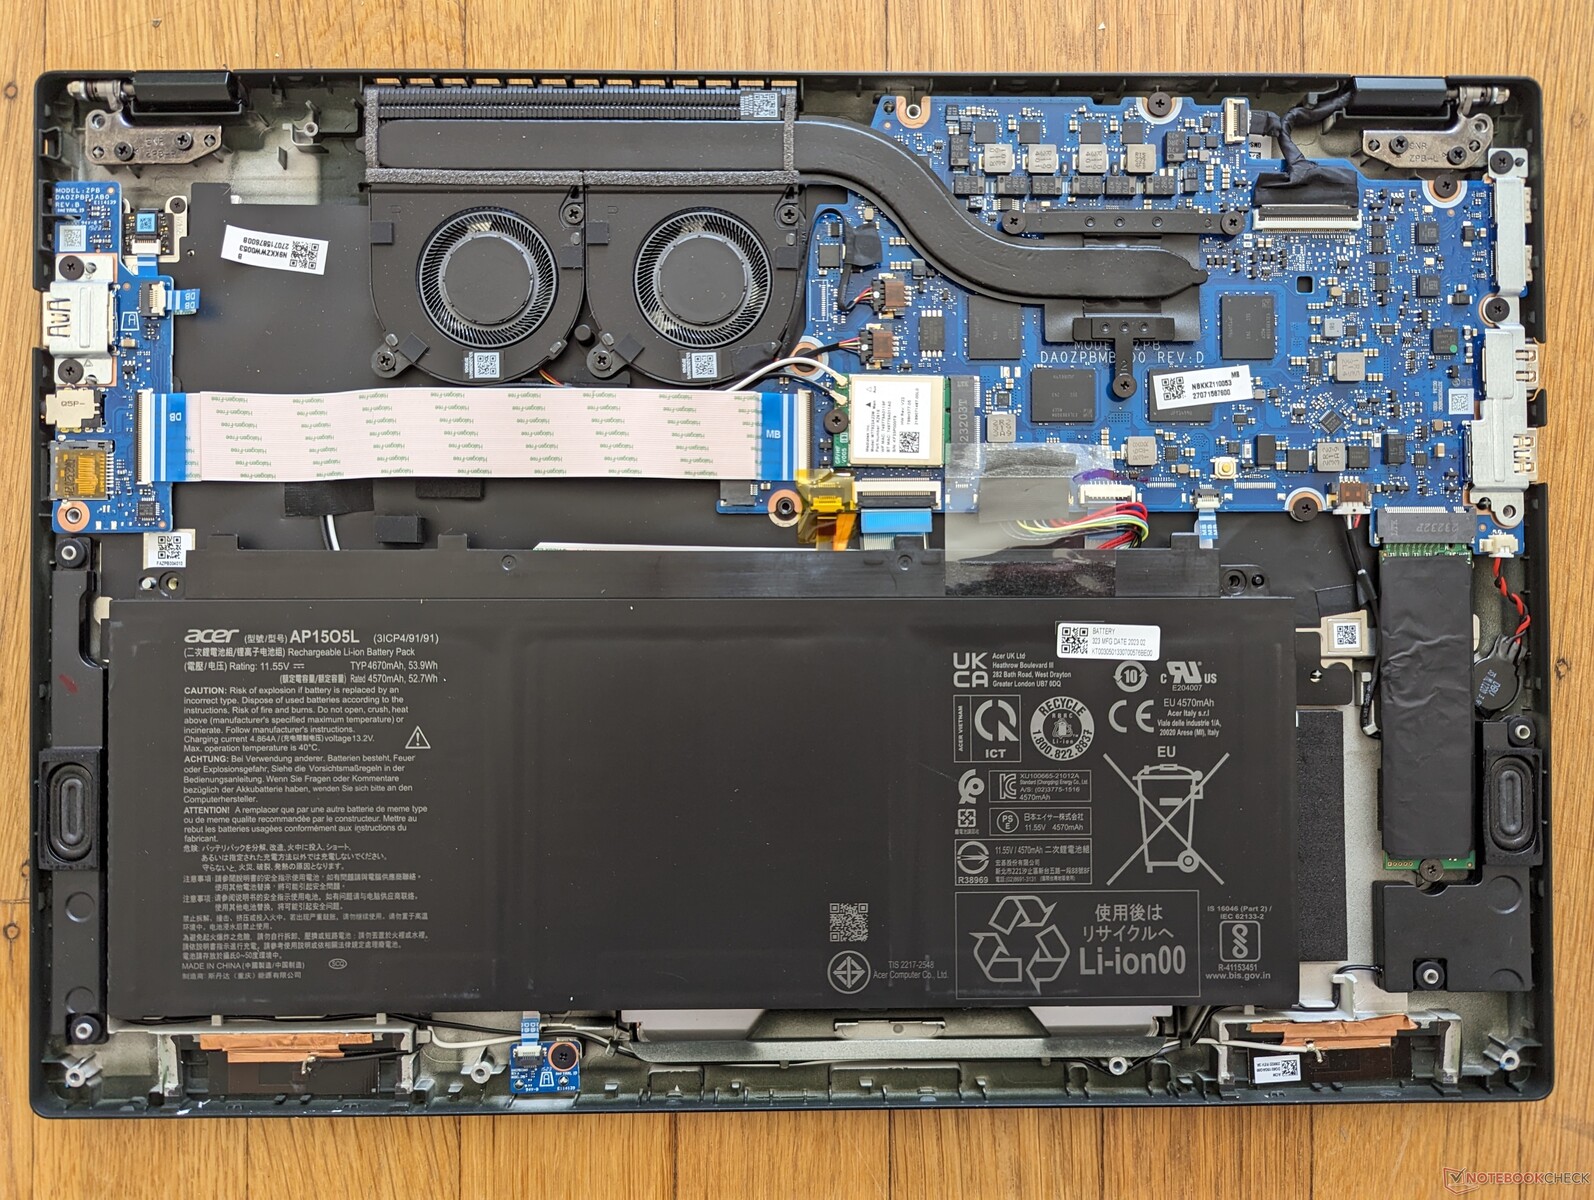
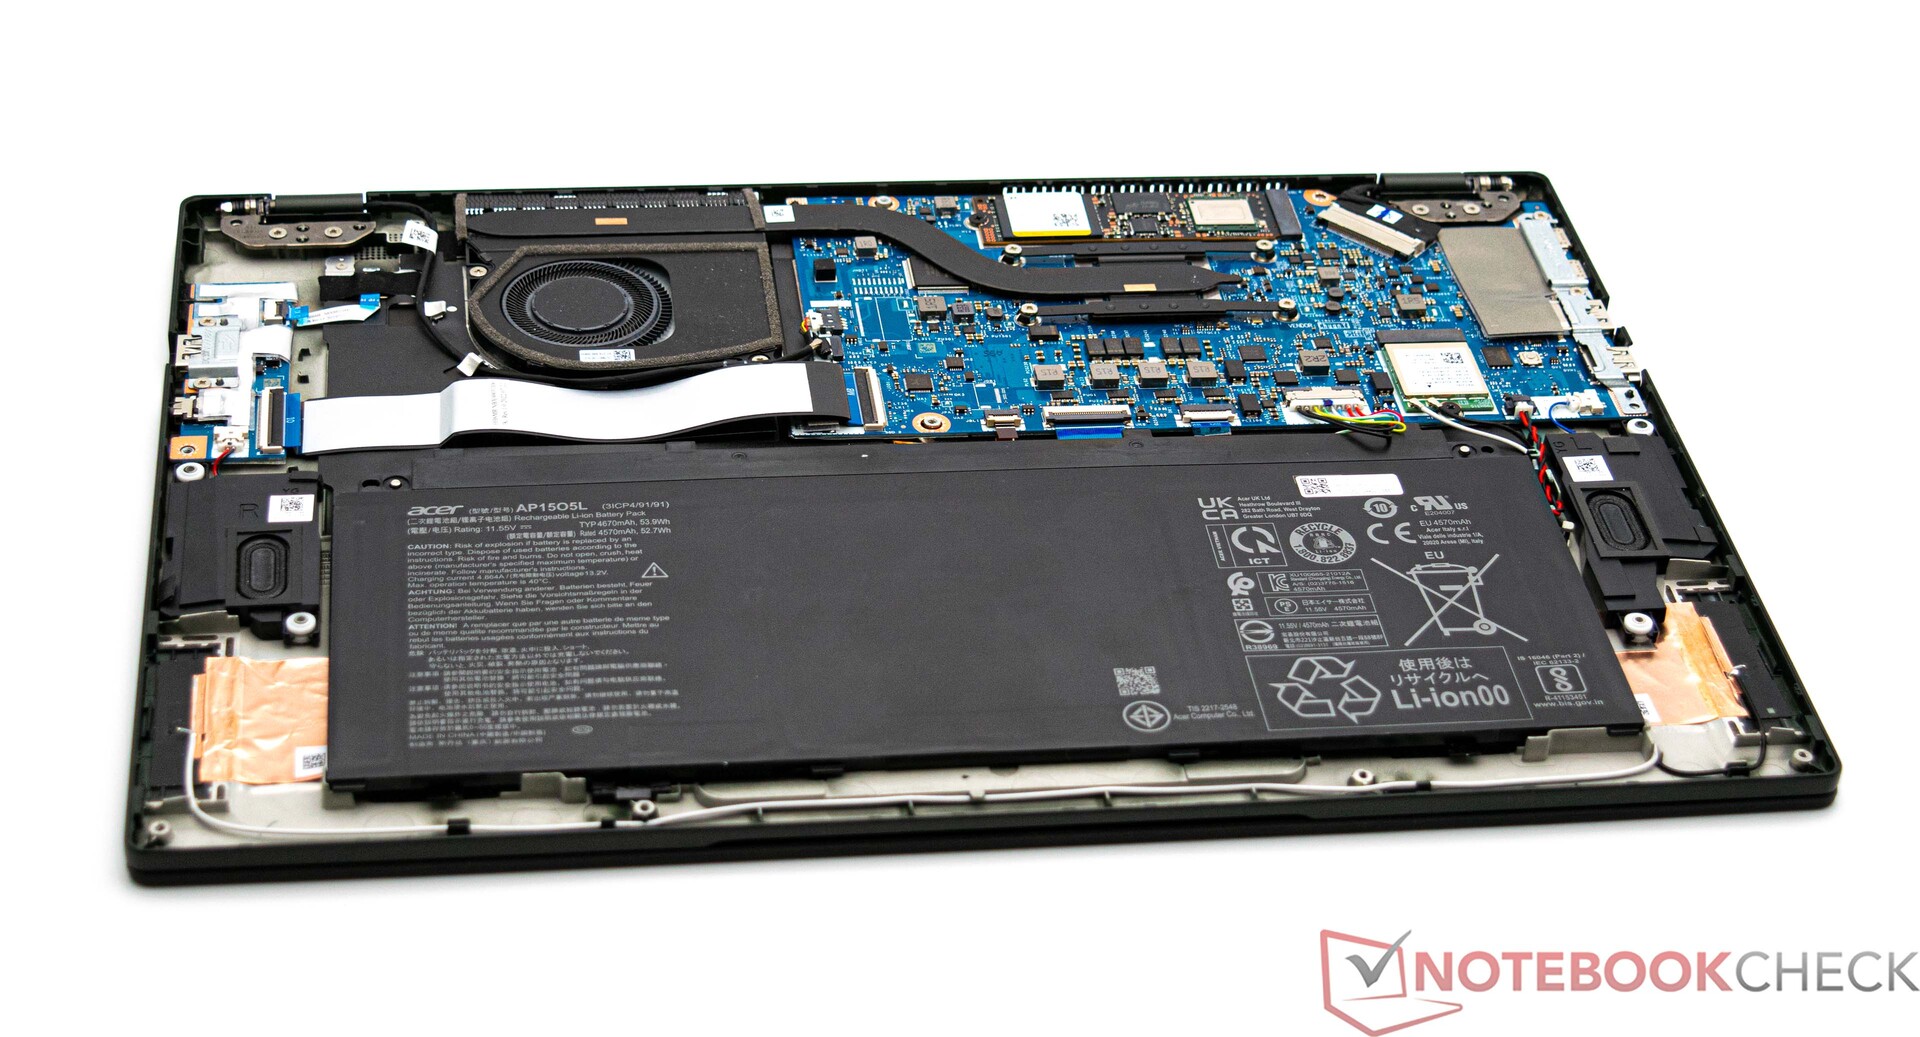
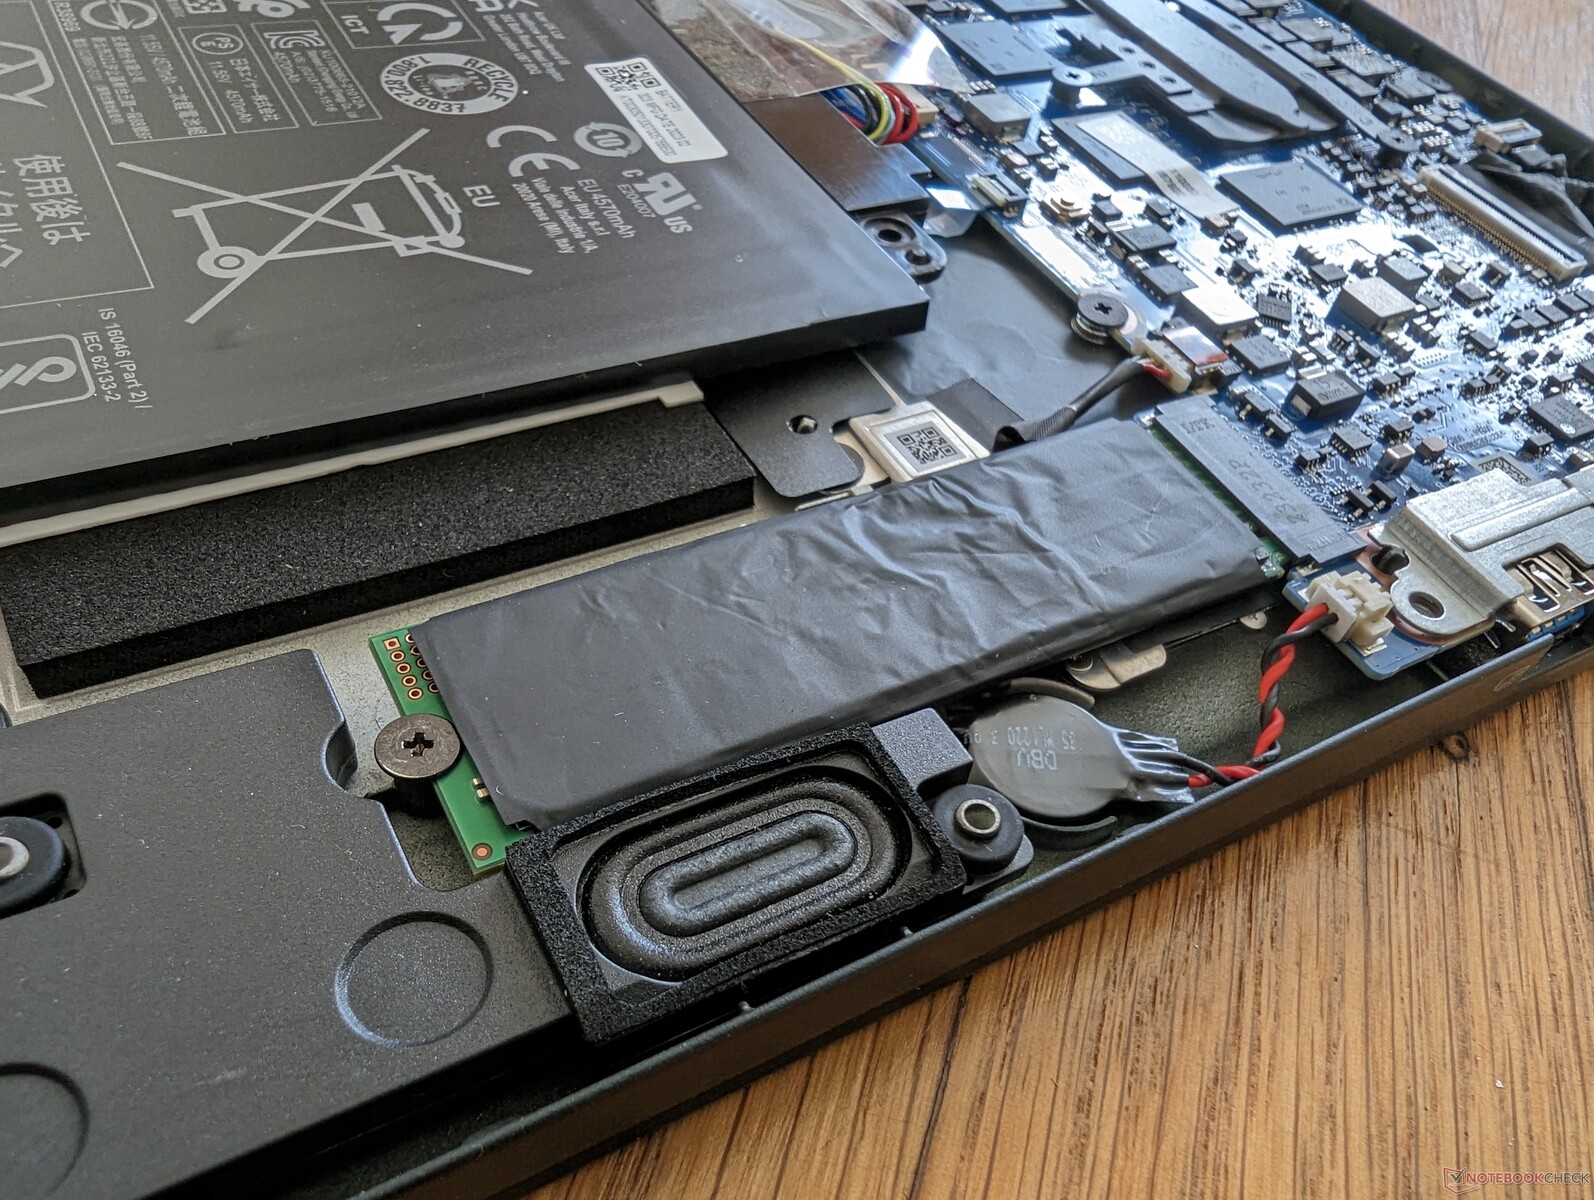
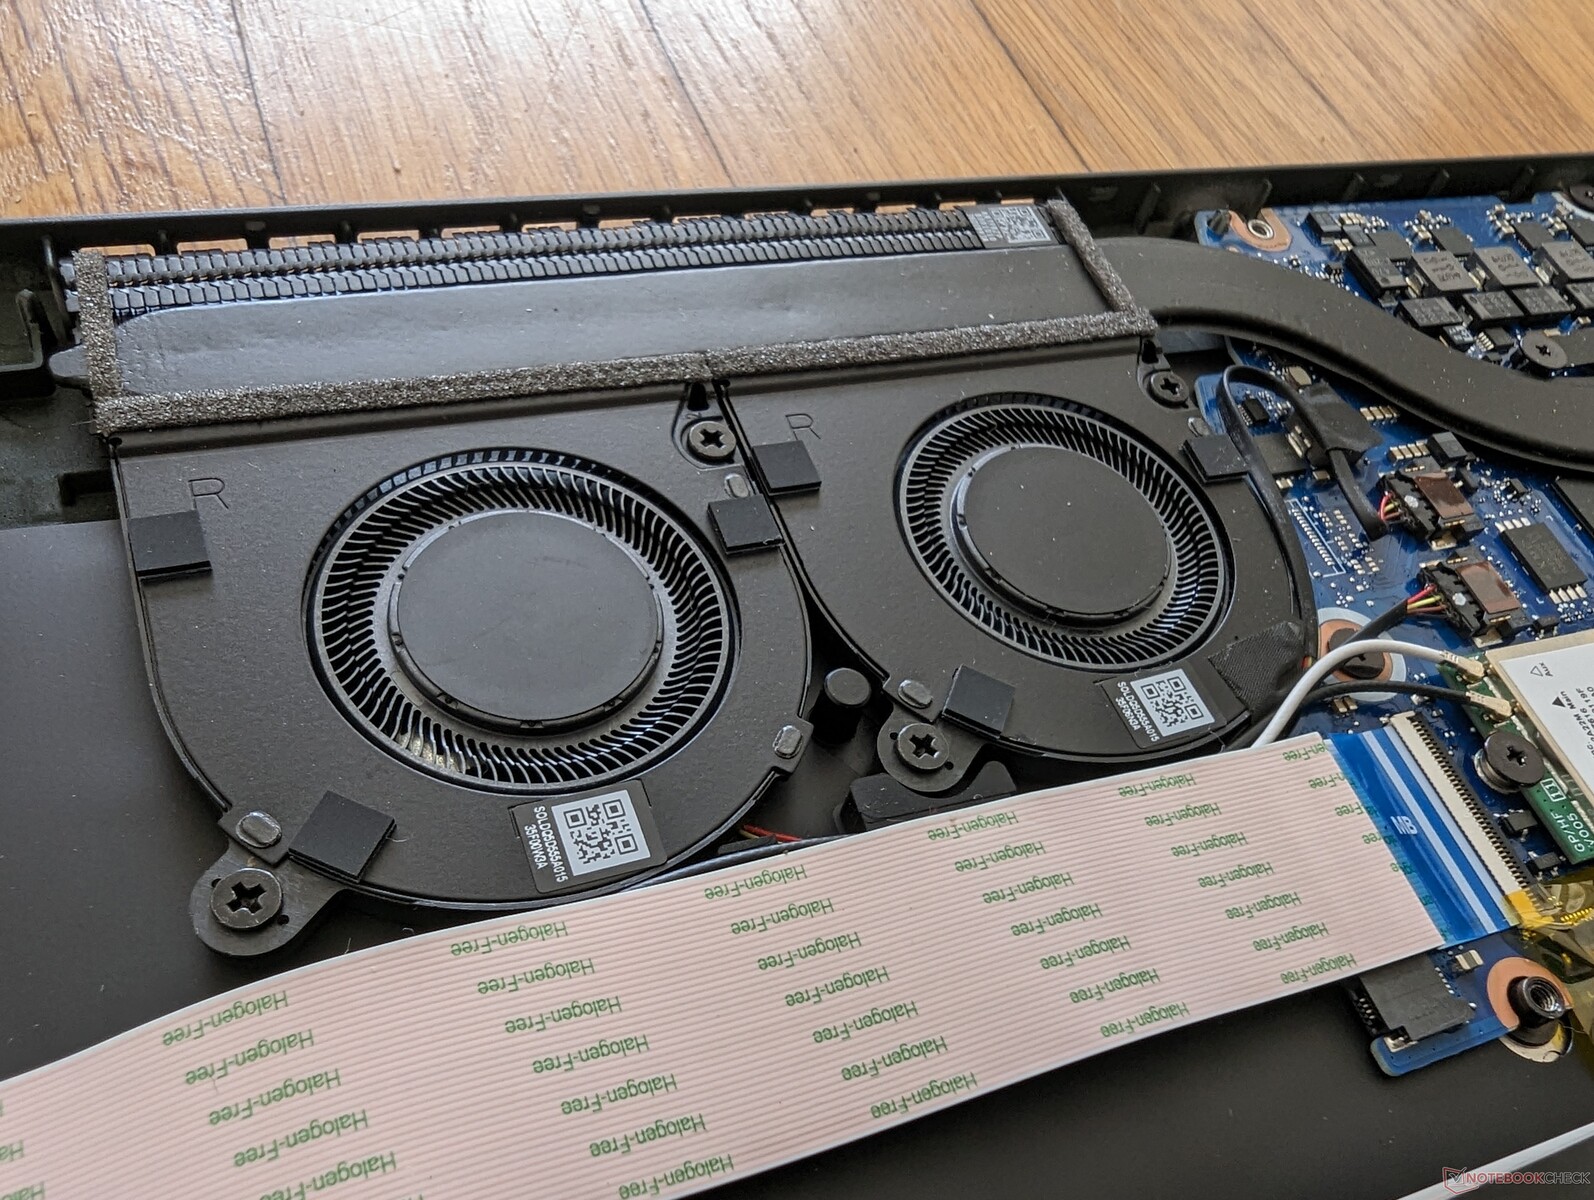
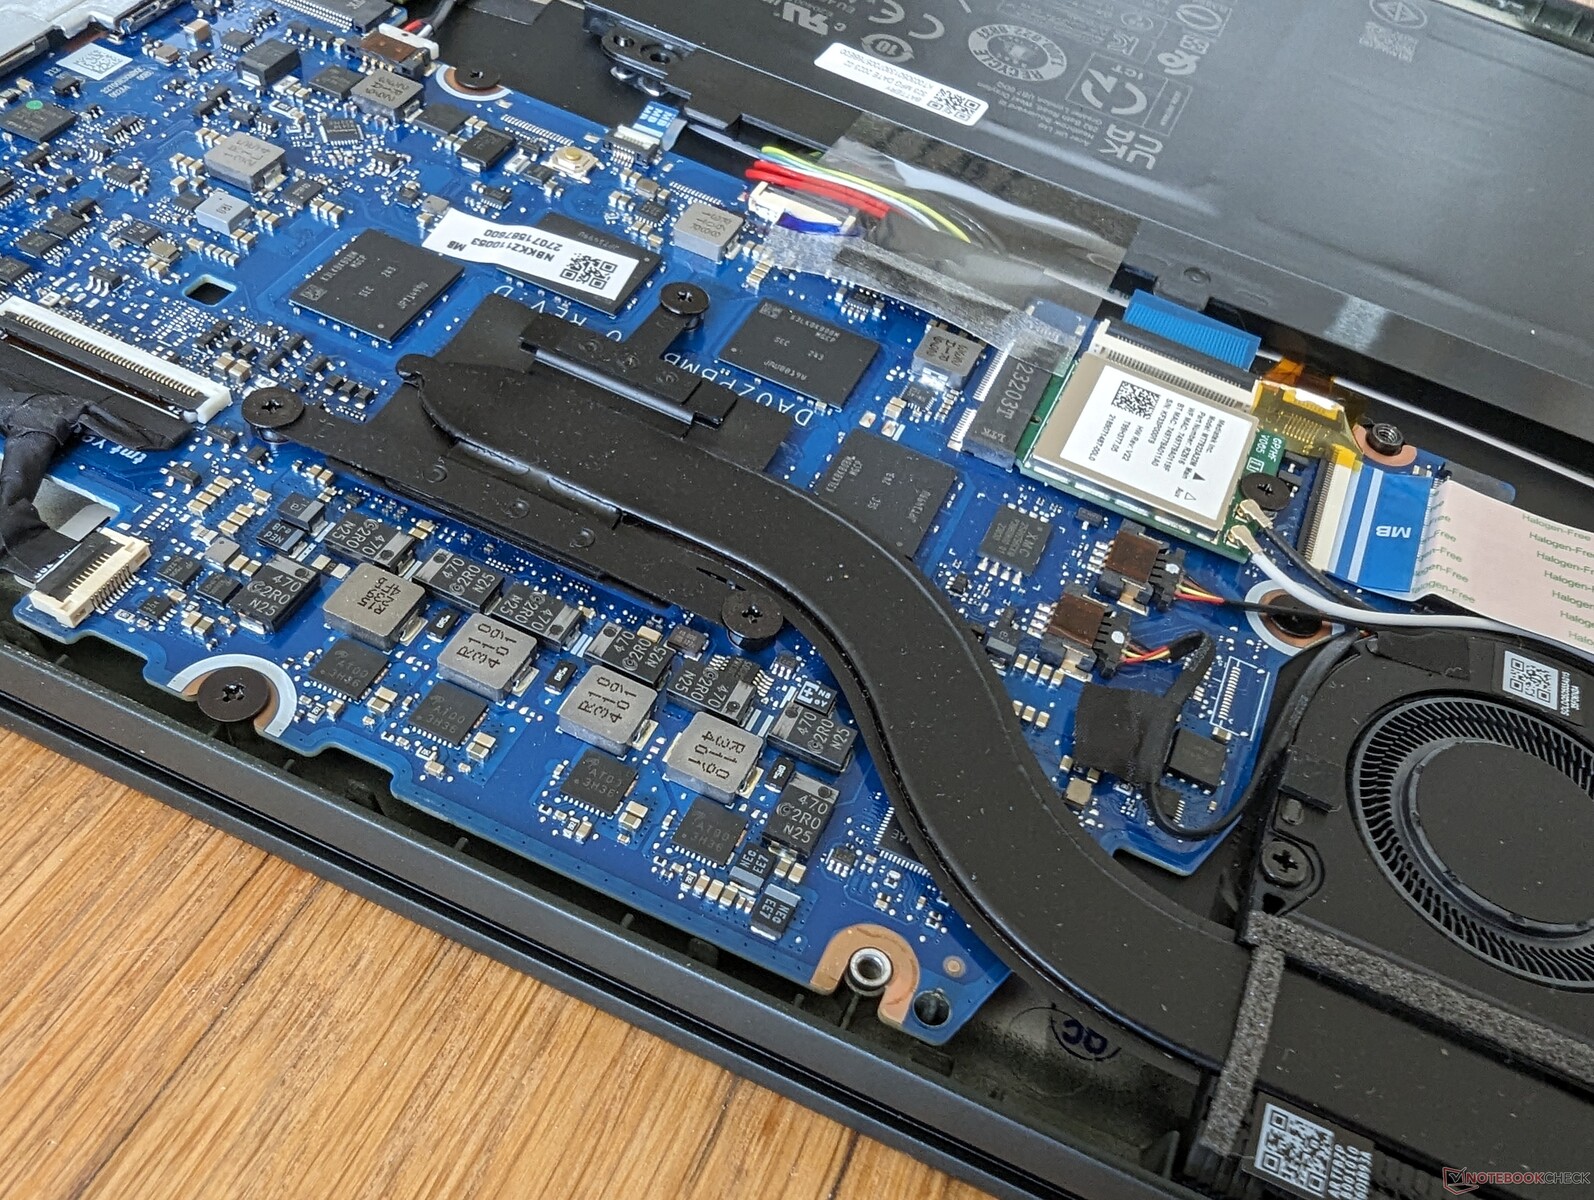
Manutenção
O painel inferior é fácil de abrir com uma chave Torx. As ventoinhas e a placa-mãe mudaram bastante entre os modelos Zen 3+ e Zen 4, como mostram as imagens abaixo. O SSD, por exemplo, agora fica ao lado da bateria.
Acessórios e garantia
Não há extras na caixa além da documentação e do adaptador CA. Uma garantia limitada de um ano do fabricante se aplica se for comprado nos EUA.
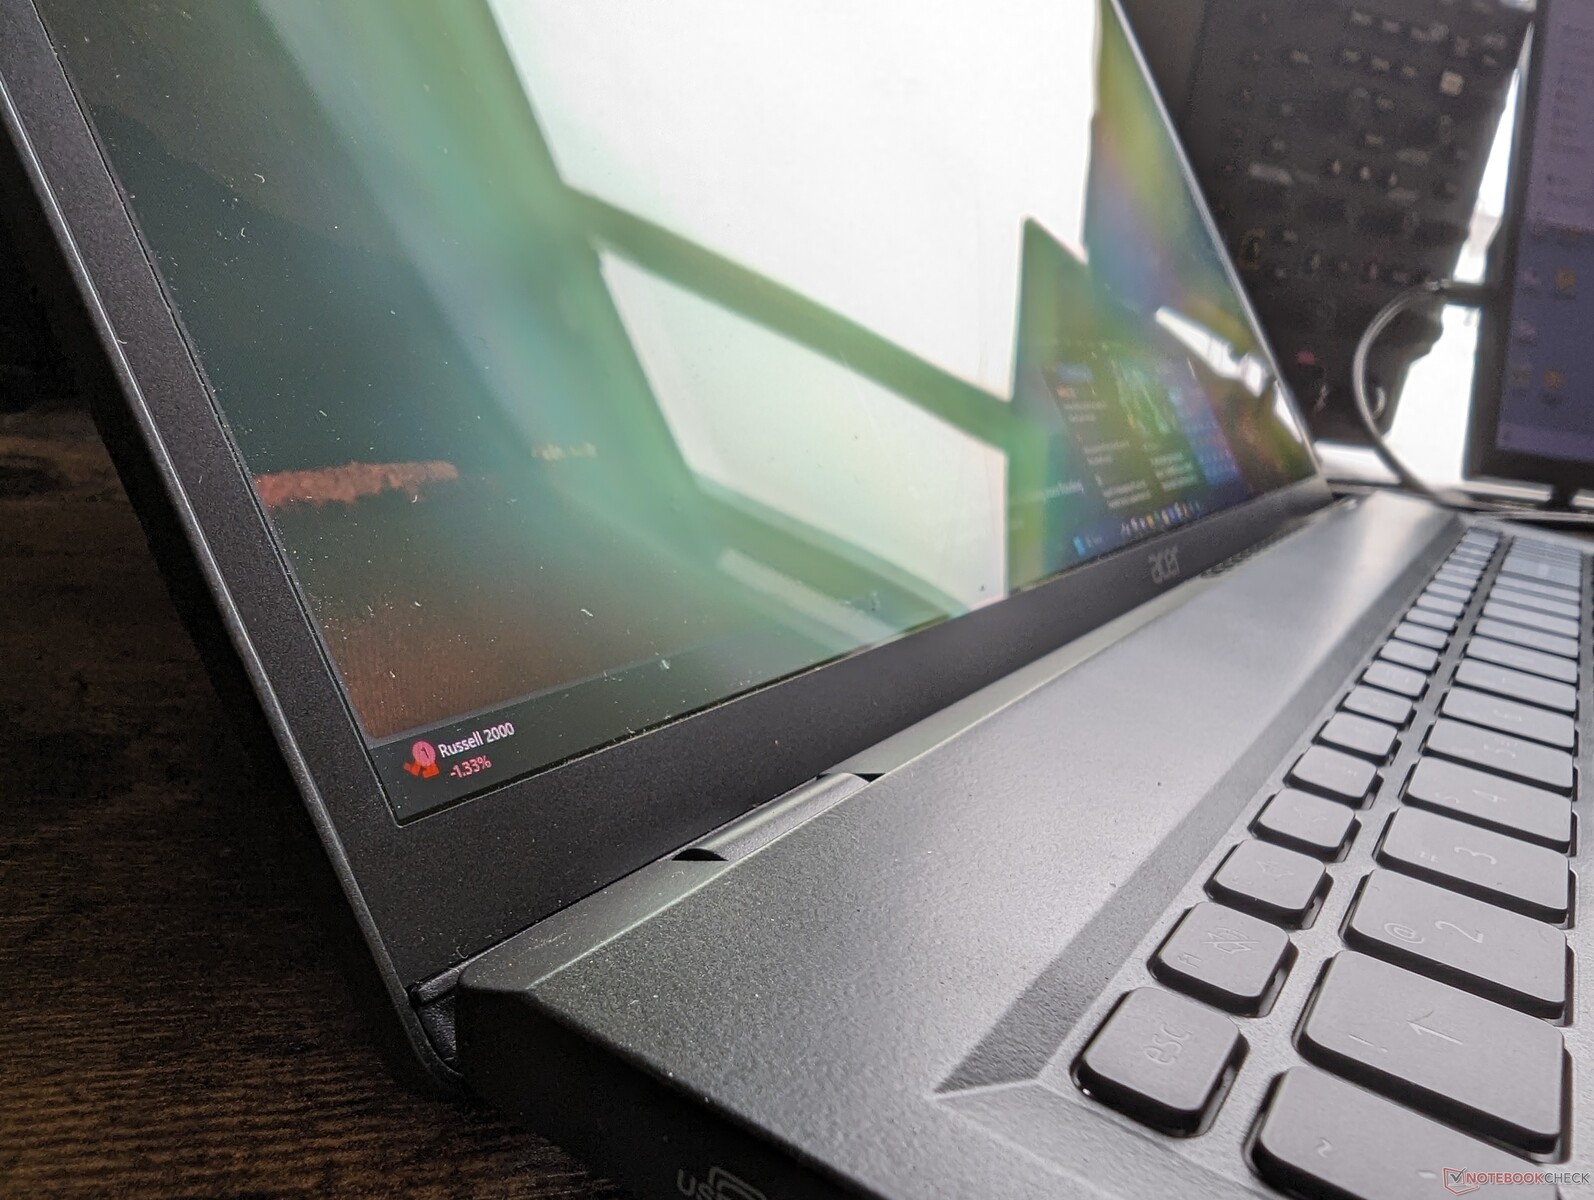
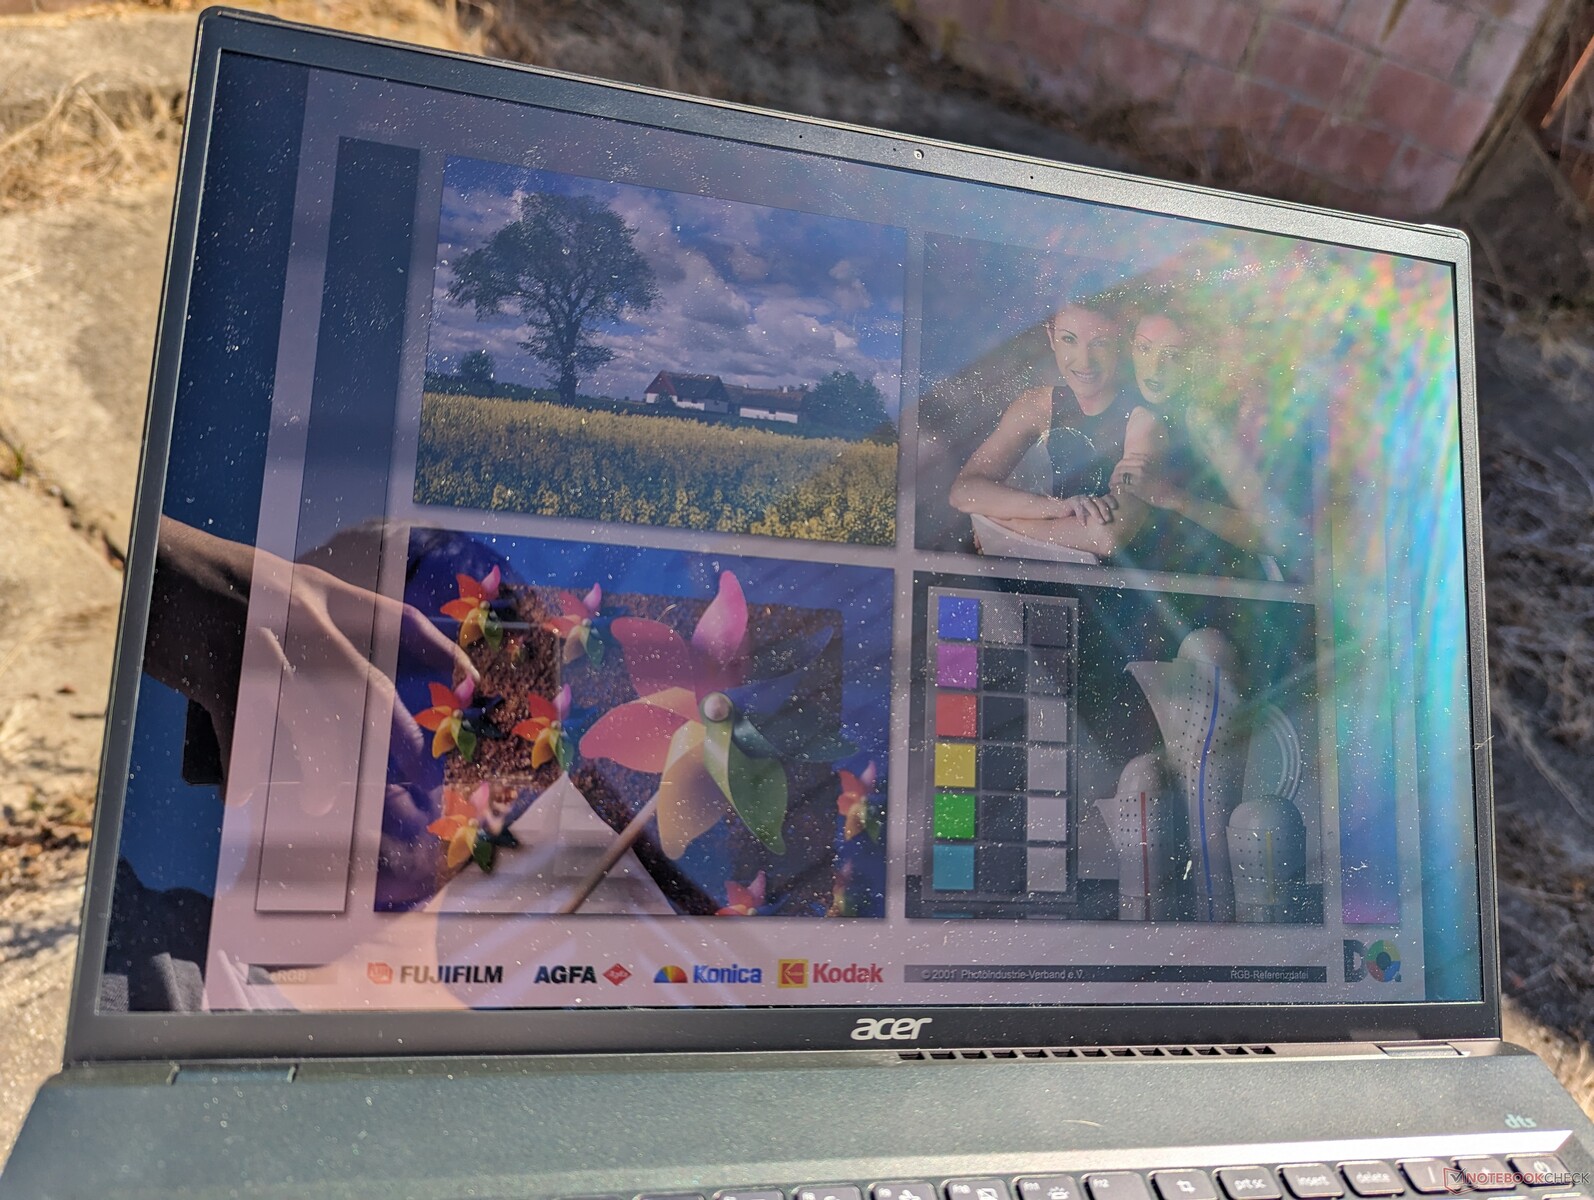
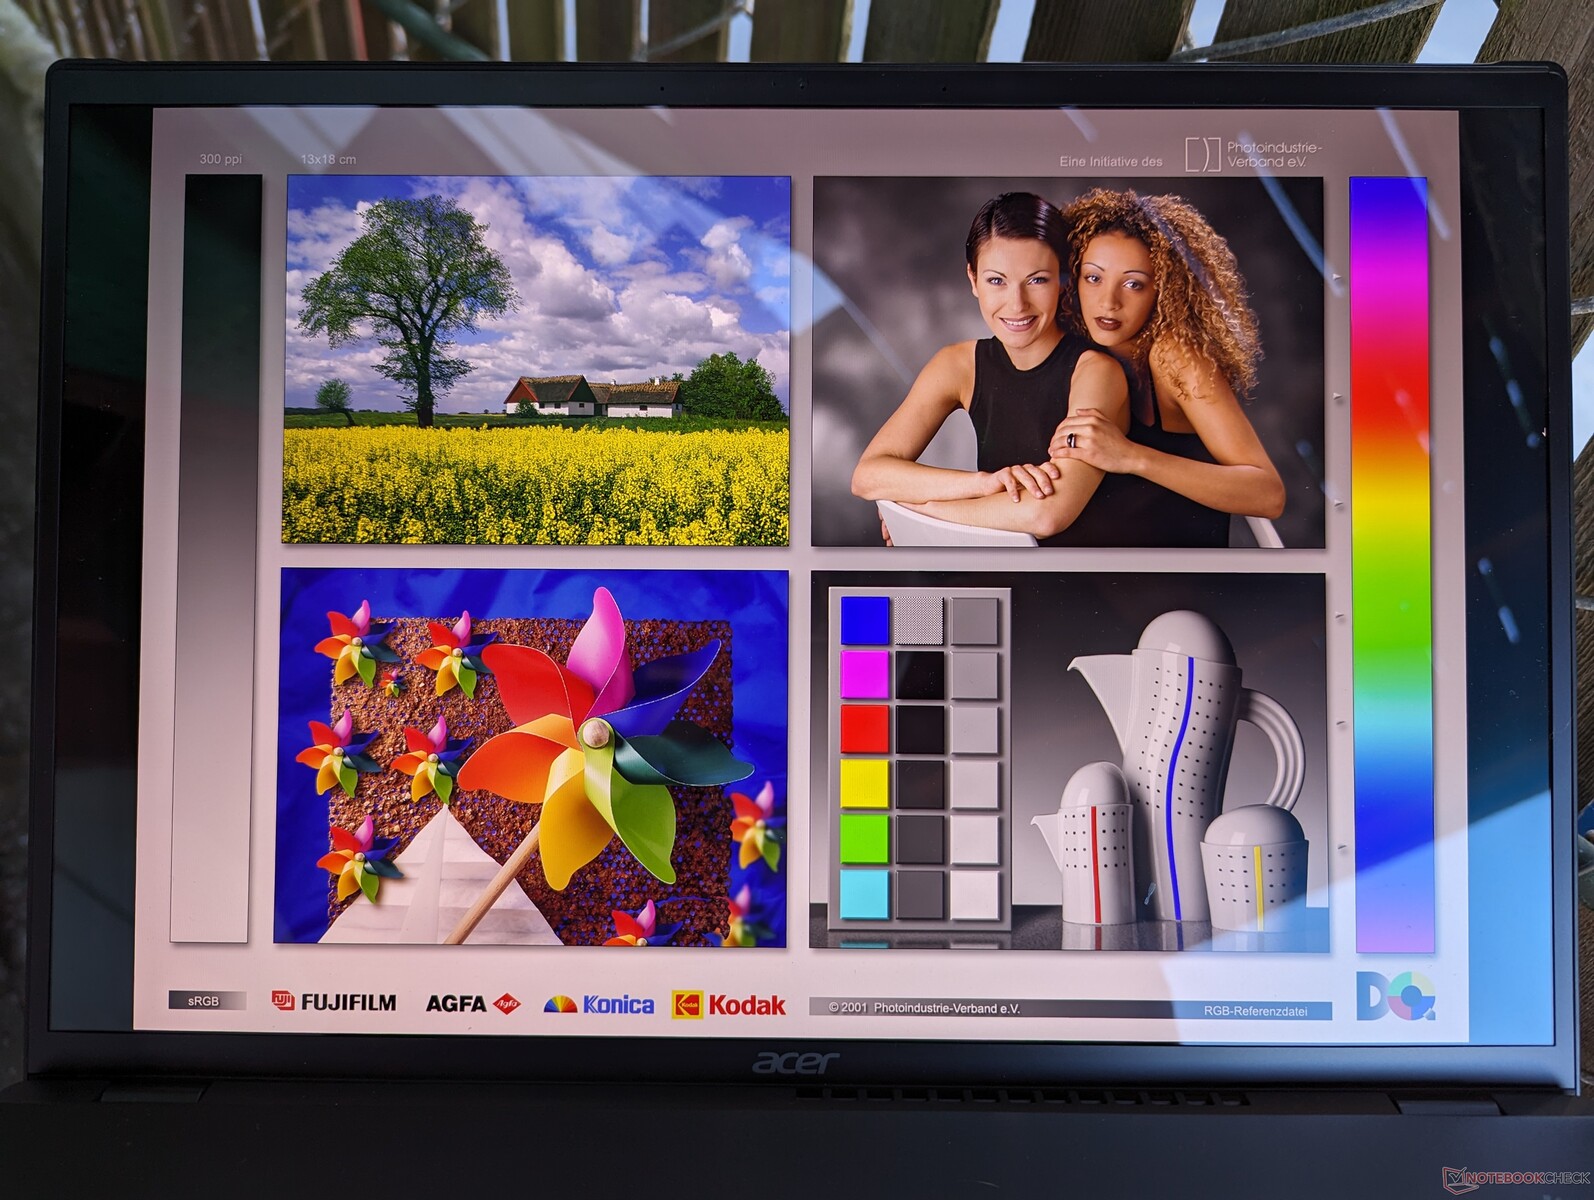
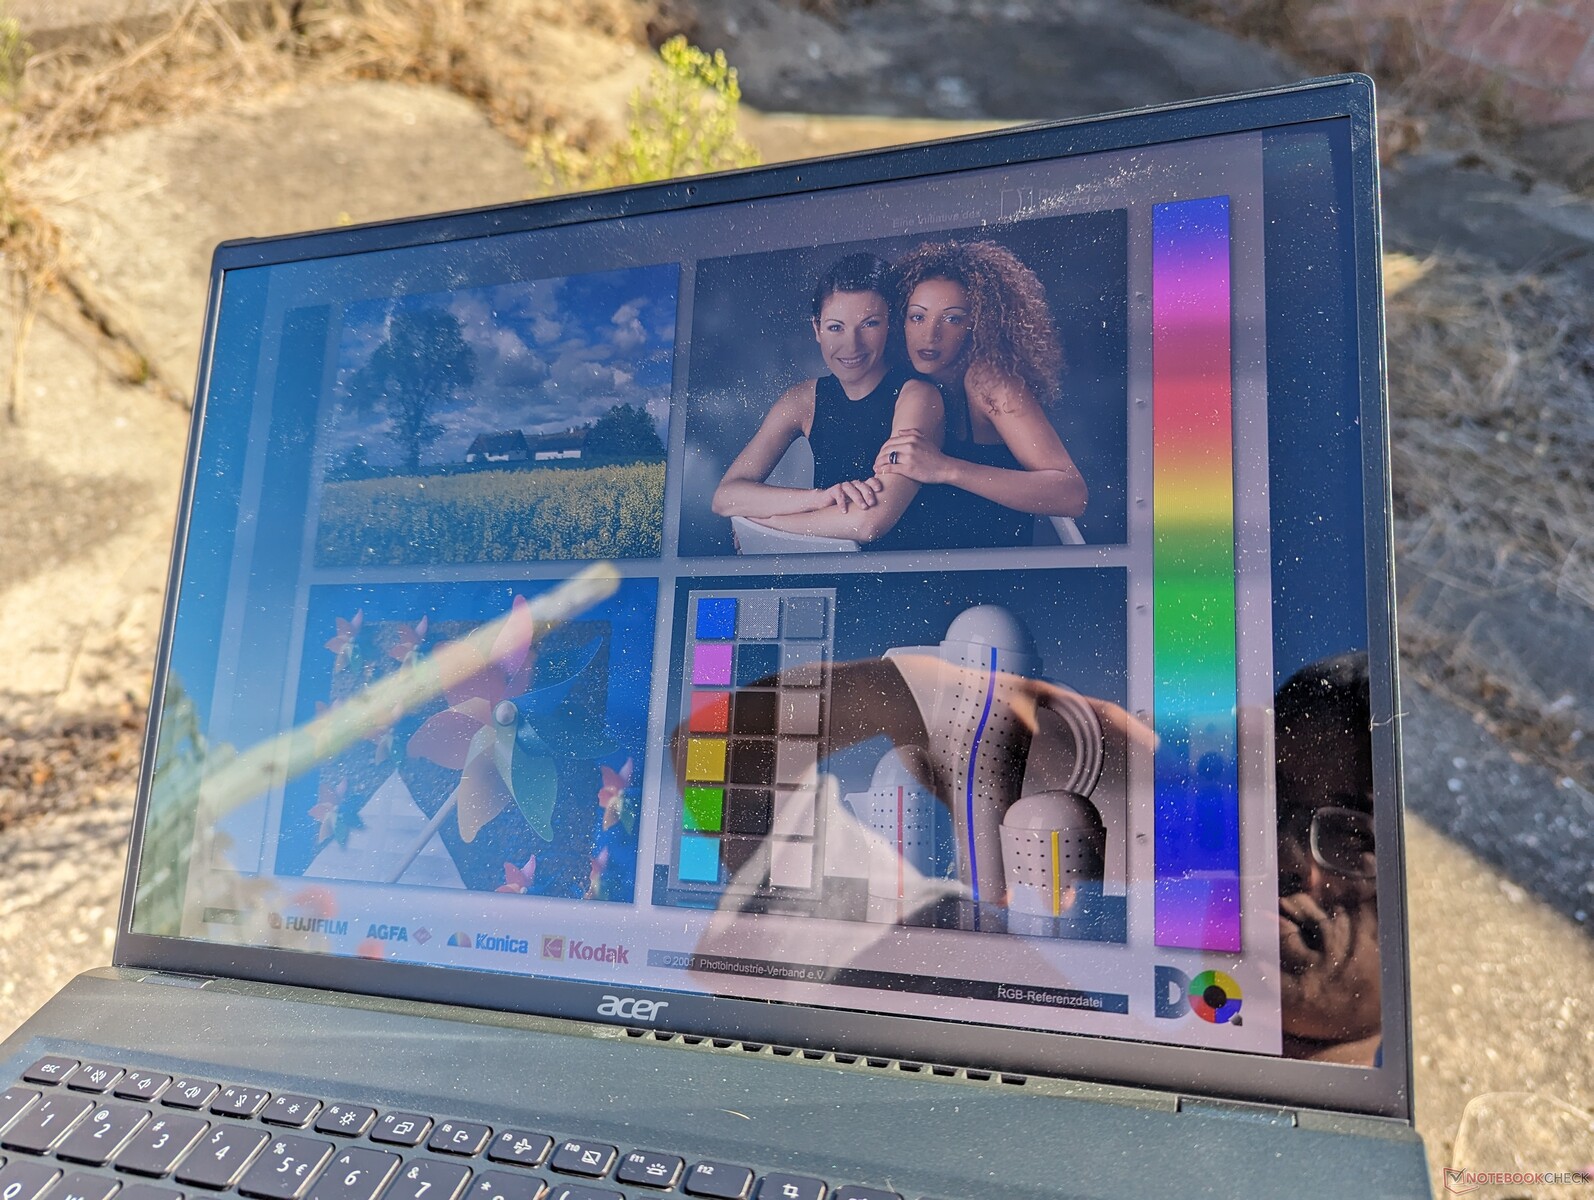
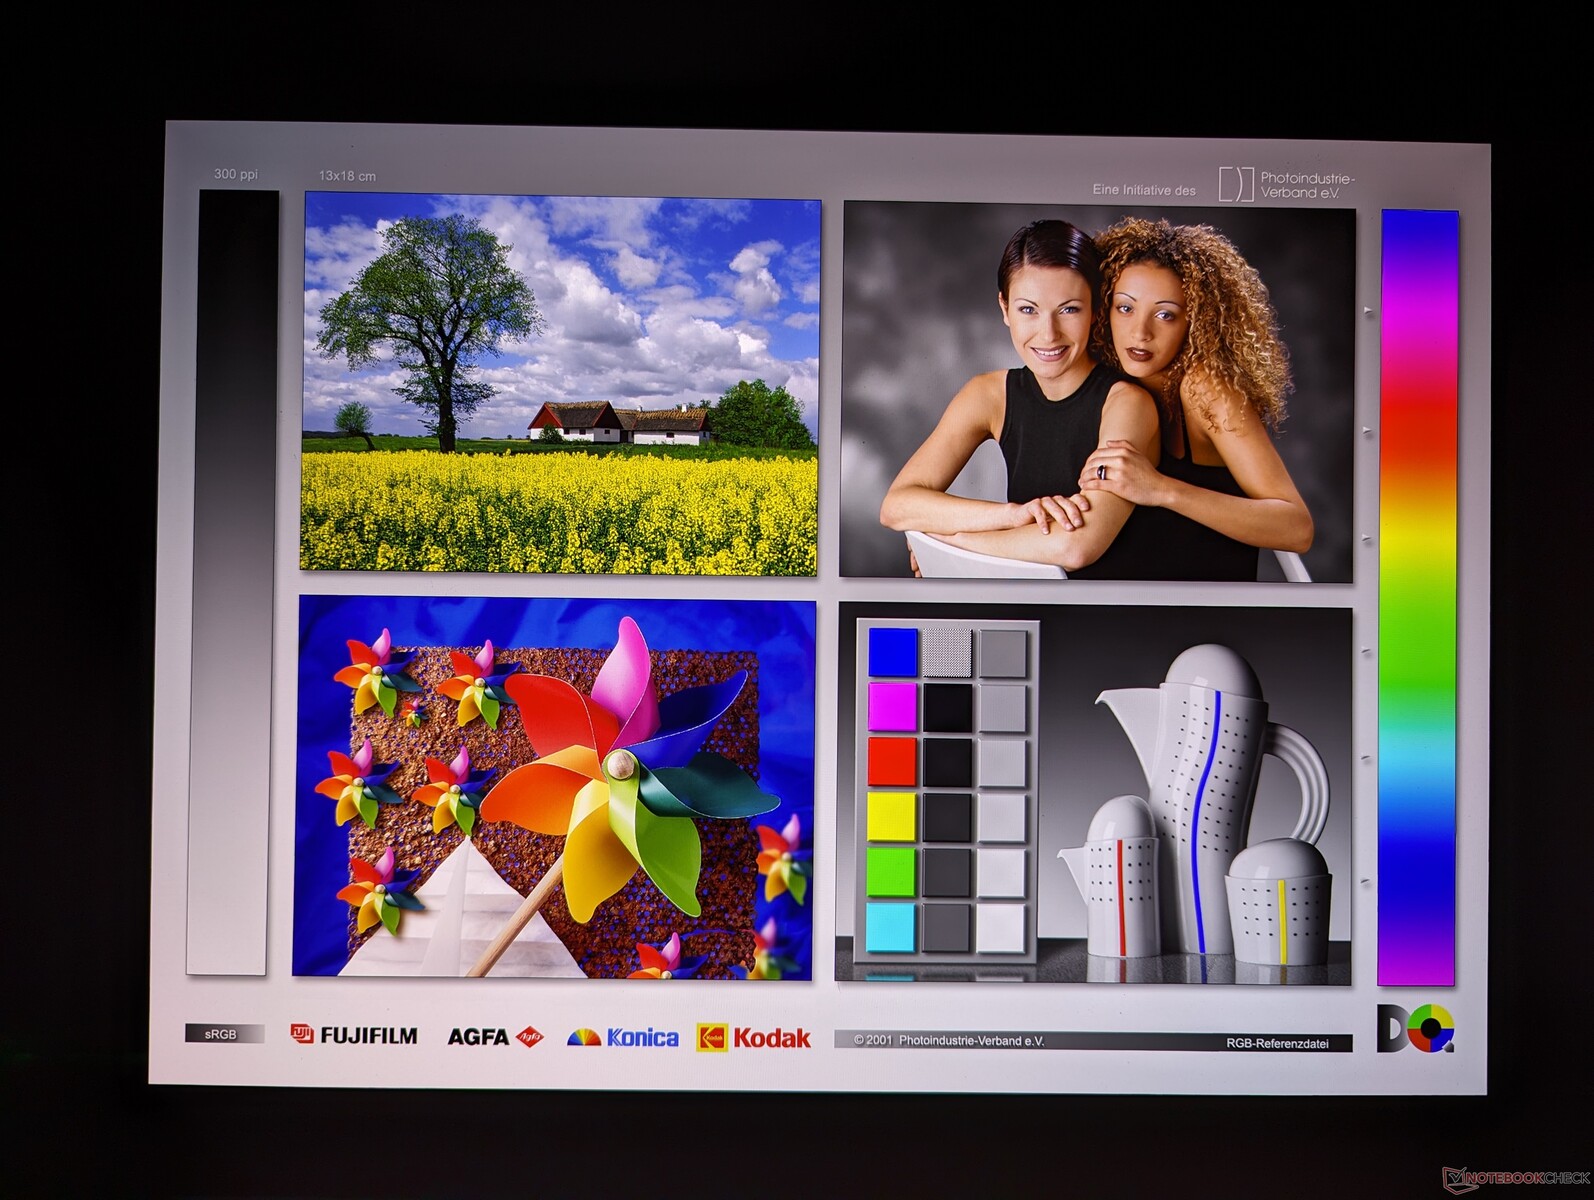
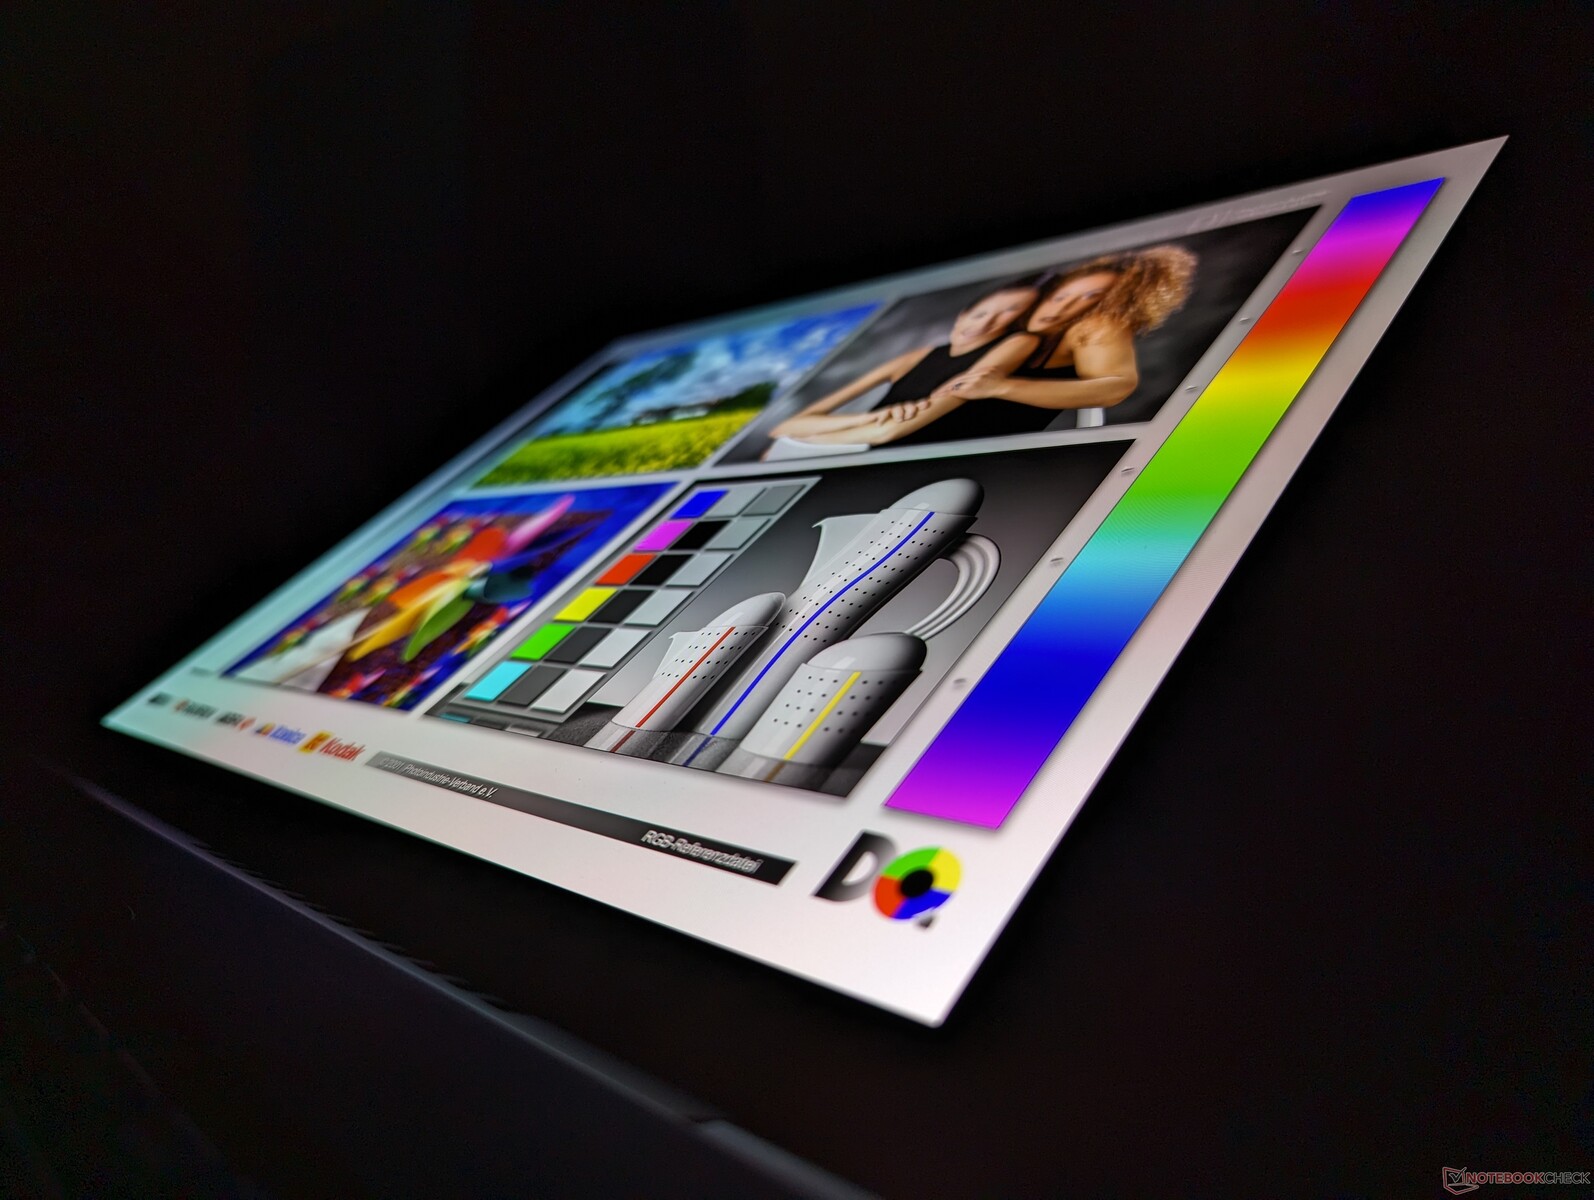
Tela
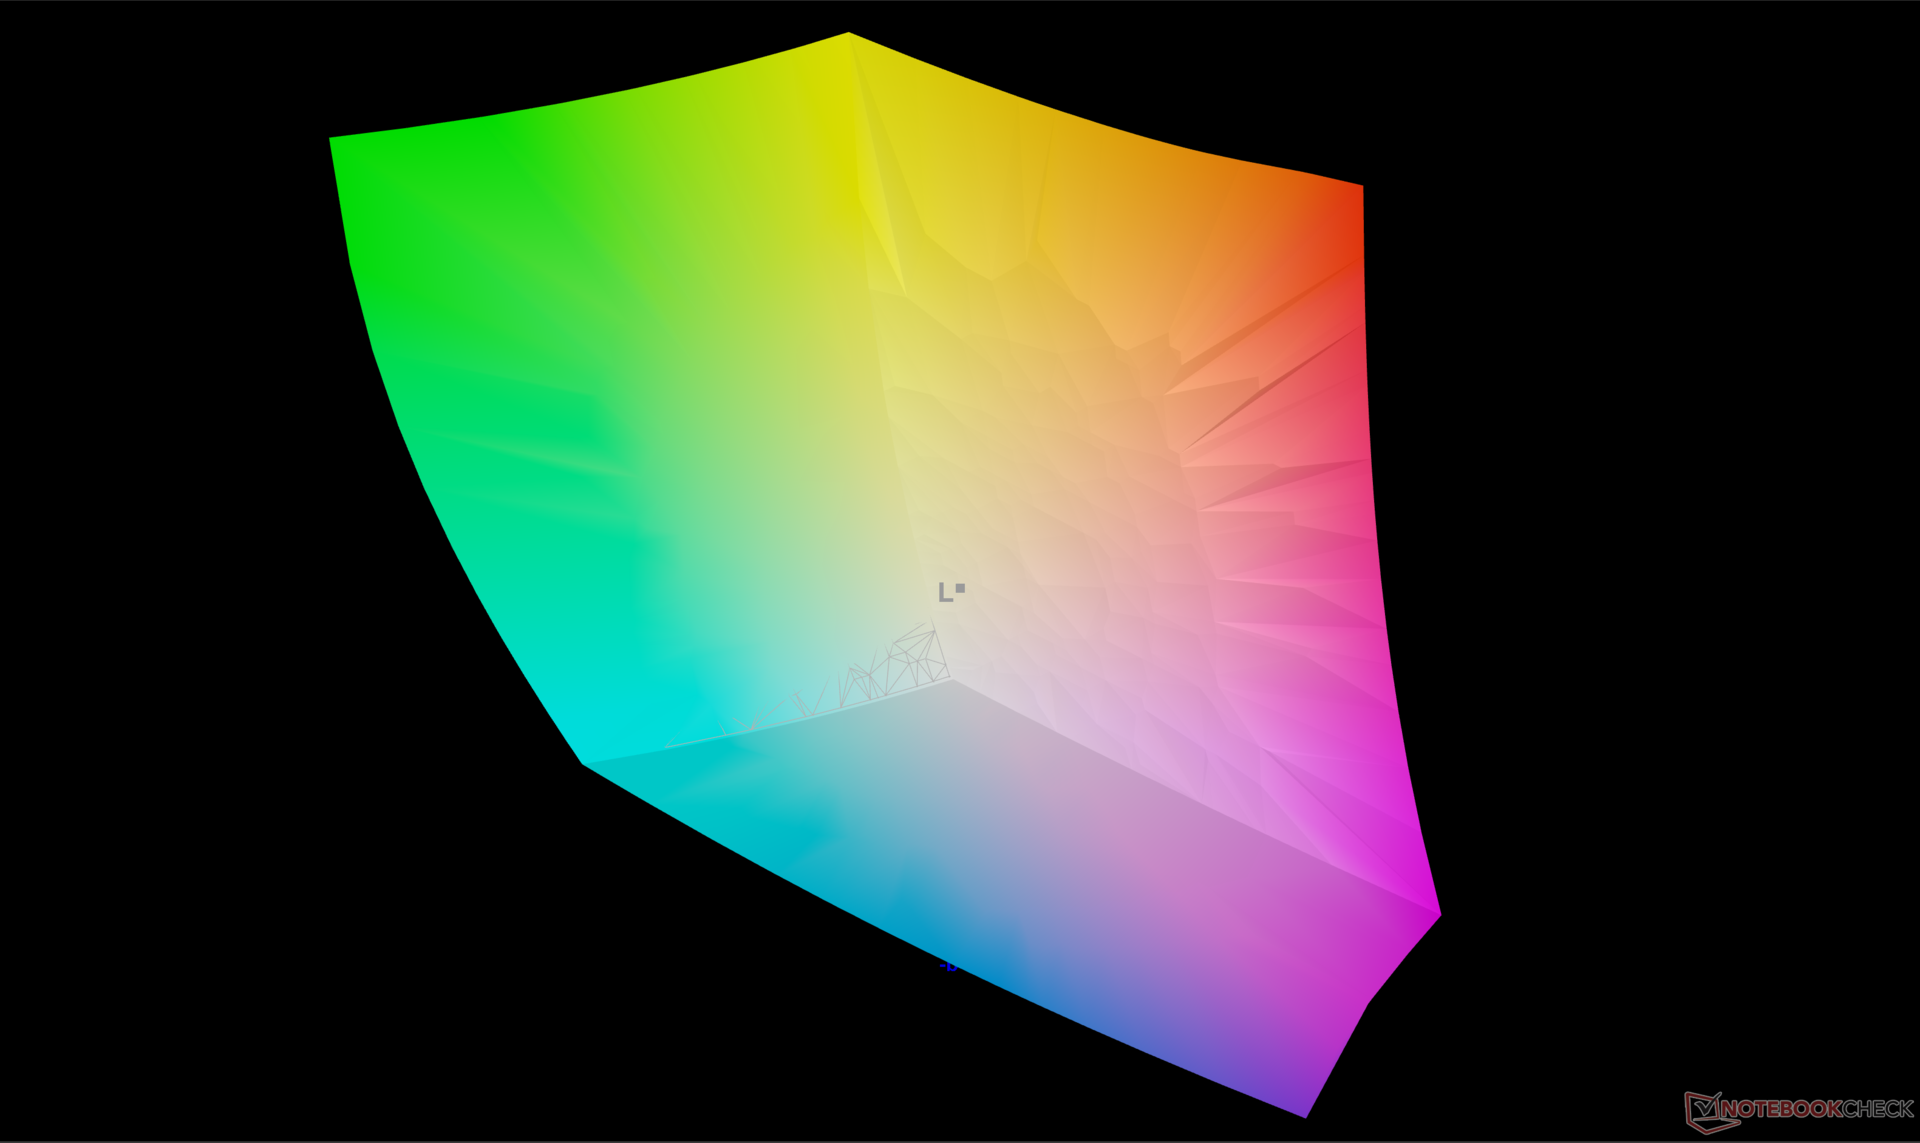
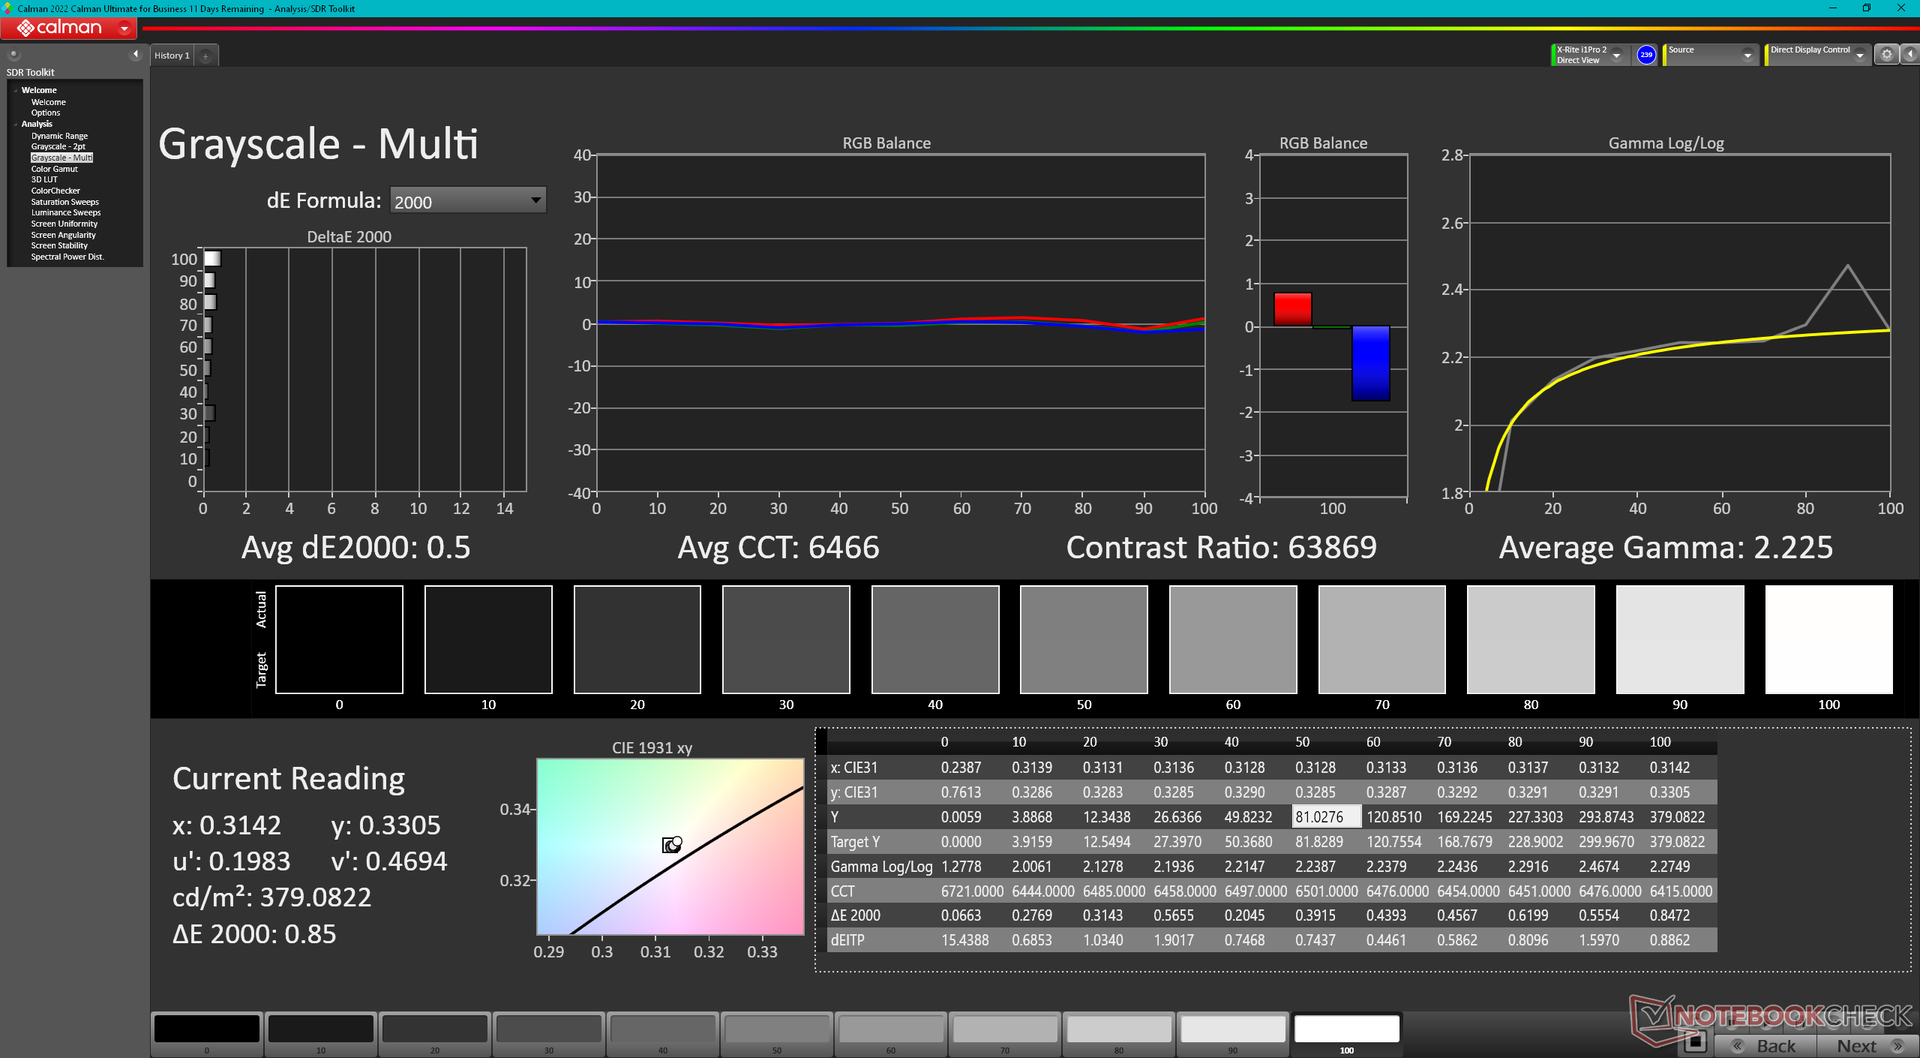
Nossa unidade vem com uma tela OLED de 3200 x 2000 120 Hz em vez da tela OLED de 3840 x 2400 60 Hz da nossa unidade de análise anterior do Zen 3+ Swift Edge 16. Os dois painéis da Samsung oferecem coberturas de cores, níveis de brilho, níveis de preto e tempos de resposta muito rápidos semelhantes. A opção de resolução mais alta pode ser mais útil para determinados aplicativos, como Excel ou janelas multitarefa lado a lado, mas é difícil voltar para 60 Hz depois de se acostumar com a taxa de atualização mais rápida de 120 Hz da nossa opção de resolução mais baixa de 3,2K. Para fins de jogos, a tela de 120 Hz significa que você pode atingir 40 FPS em vez de 30 FPS sem precisar se preocupar com o rompimento da tela.
| |||||||||||||||||||||||||
iluminação: 98 %
iluminação com acumulador: 379.8 cd/m²
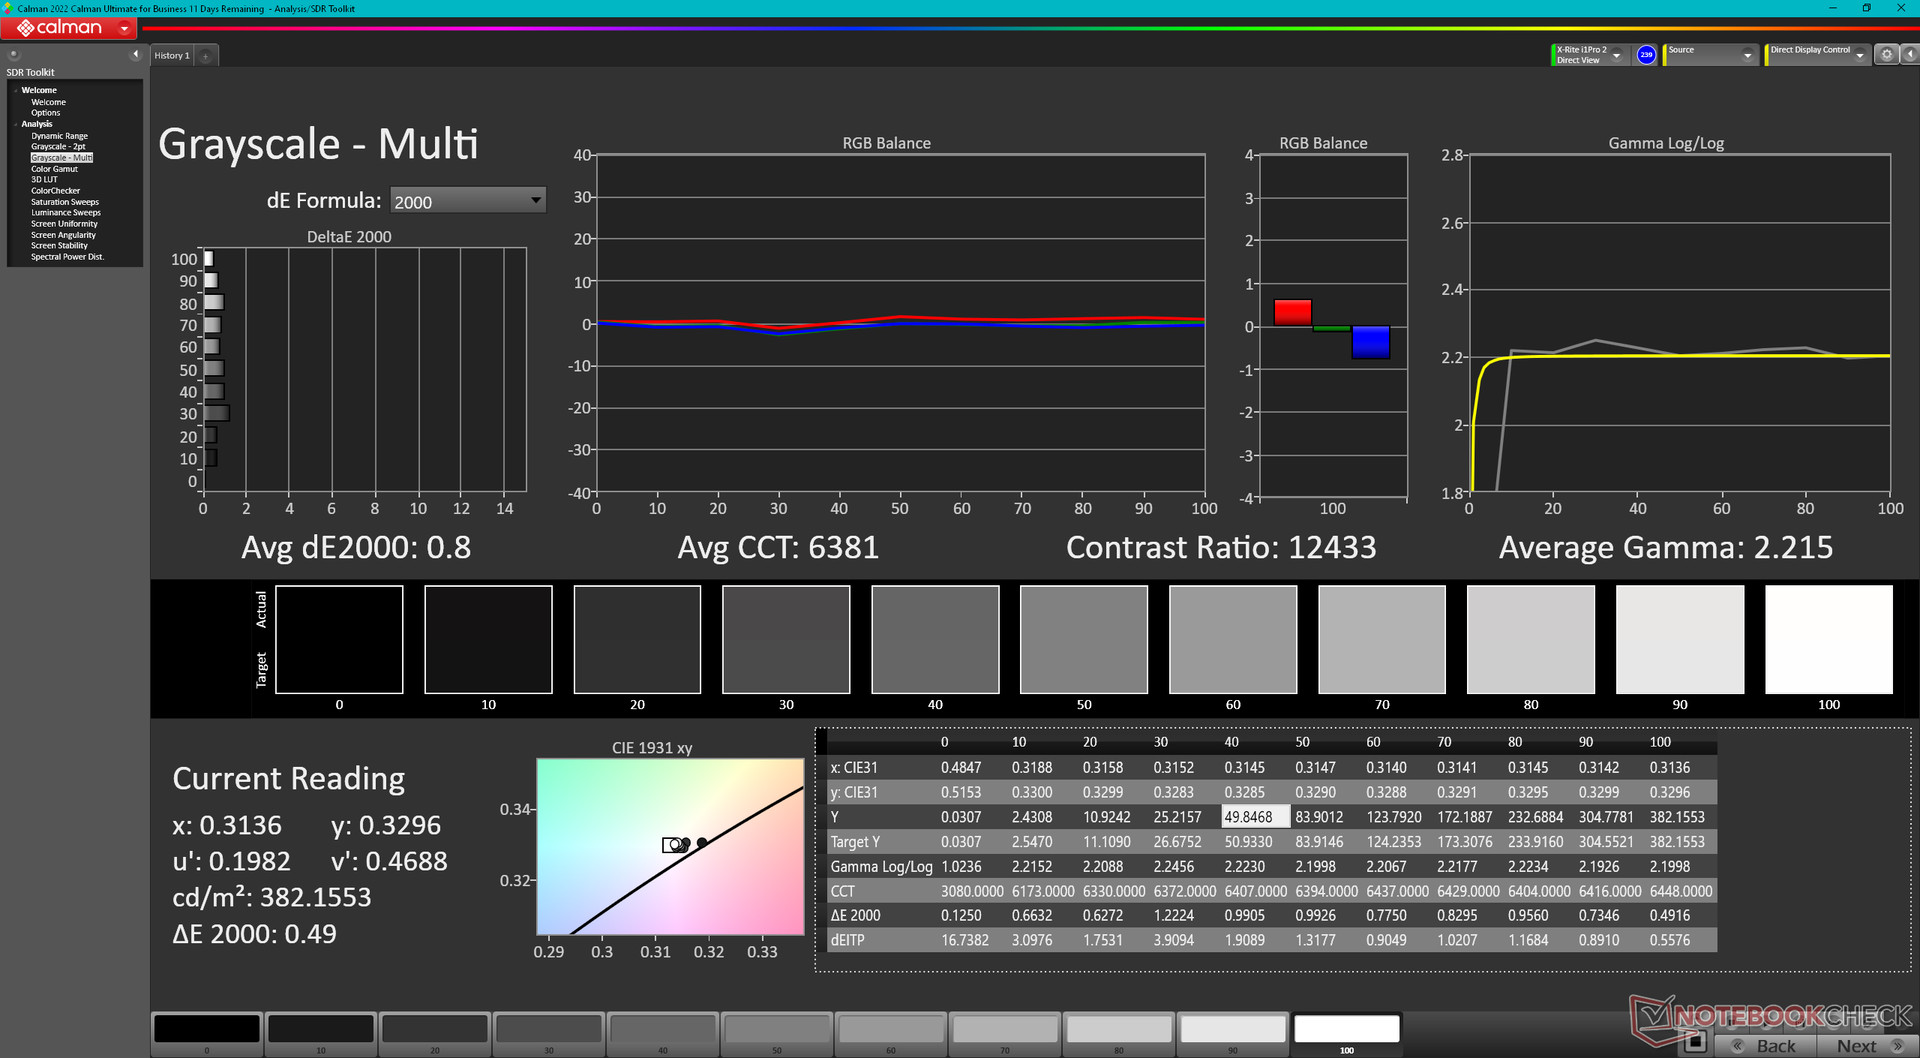
Contraste: ∞:1 (Preto: 0 cd/m²)
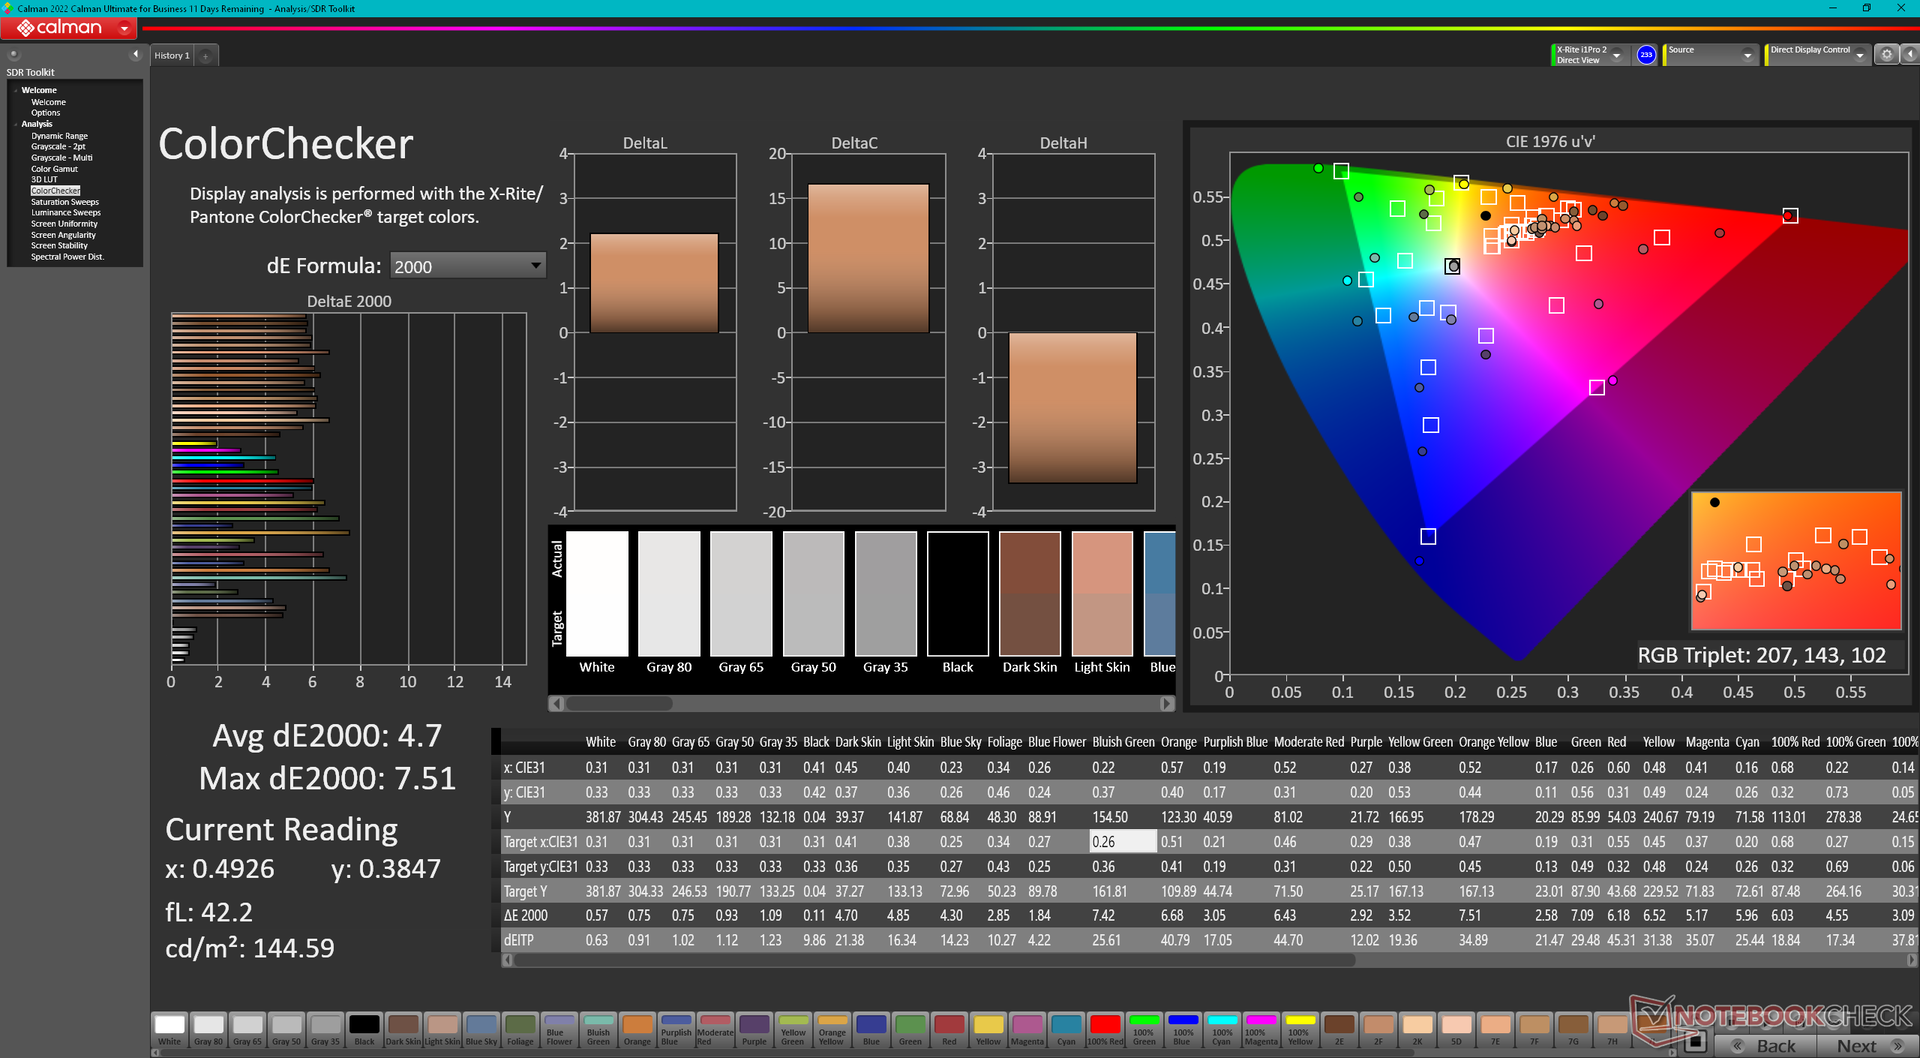
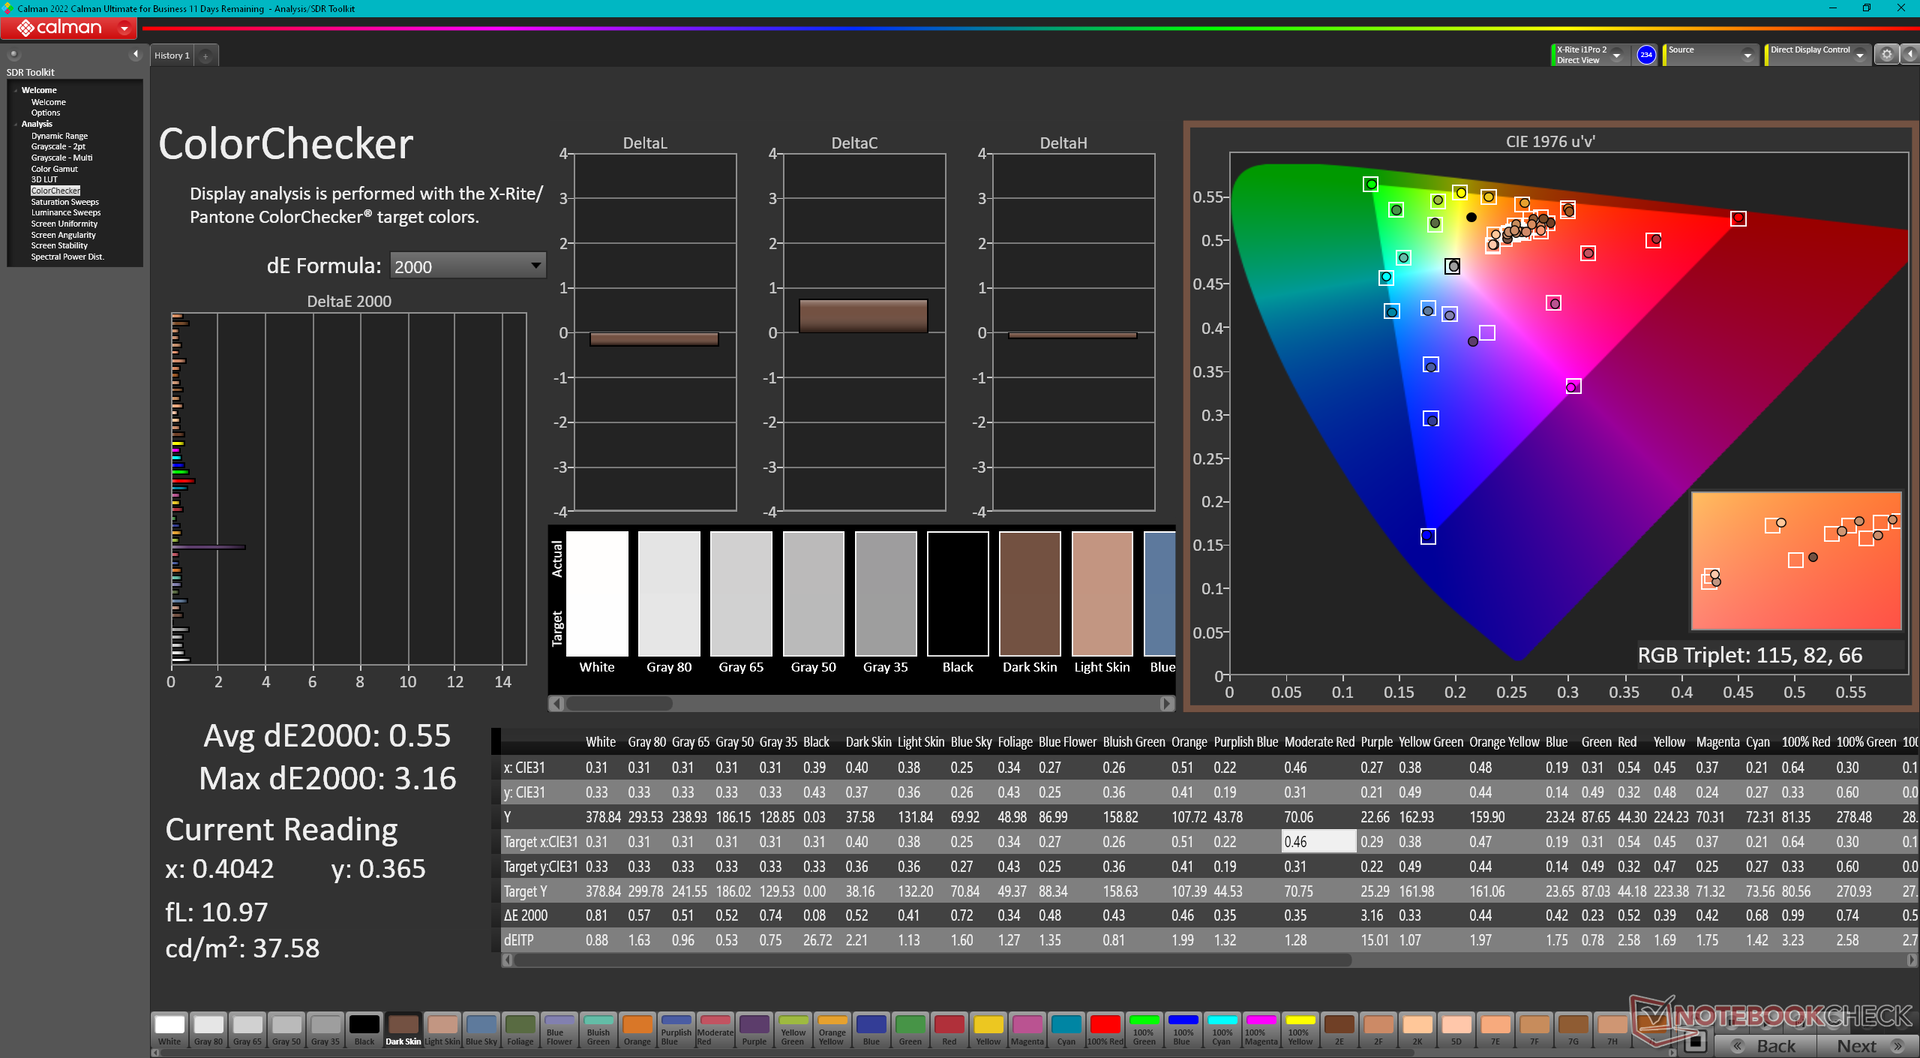
ΔE ColorChecker Calman: 4.7 | ∀{0.5-29.43 Ø4.71}
calibrated: 0.55
ΔE Greyscale Calman: 0.8 | ∀{0.09-98 Ø4.96}
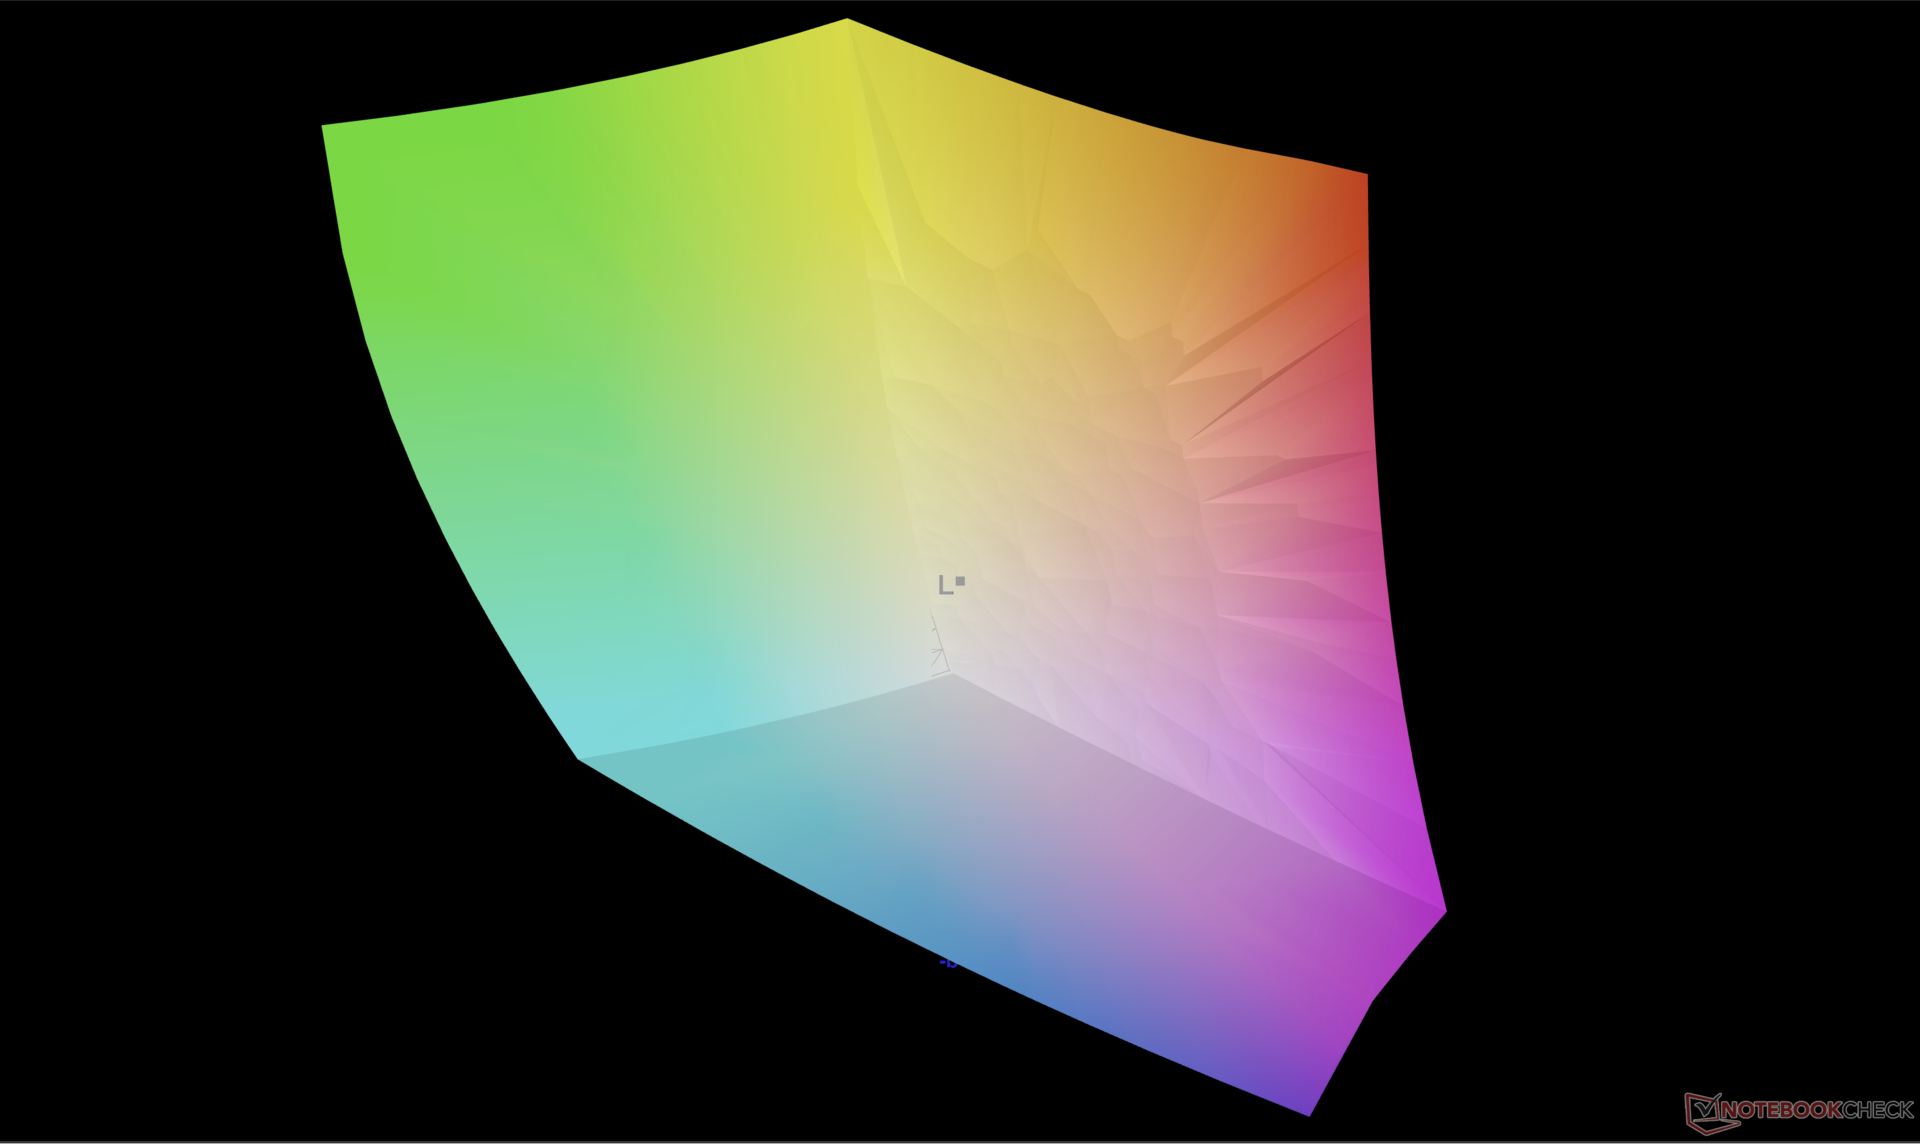
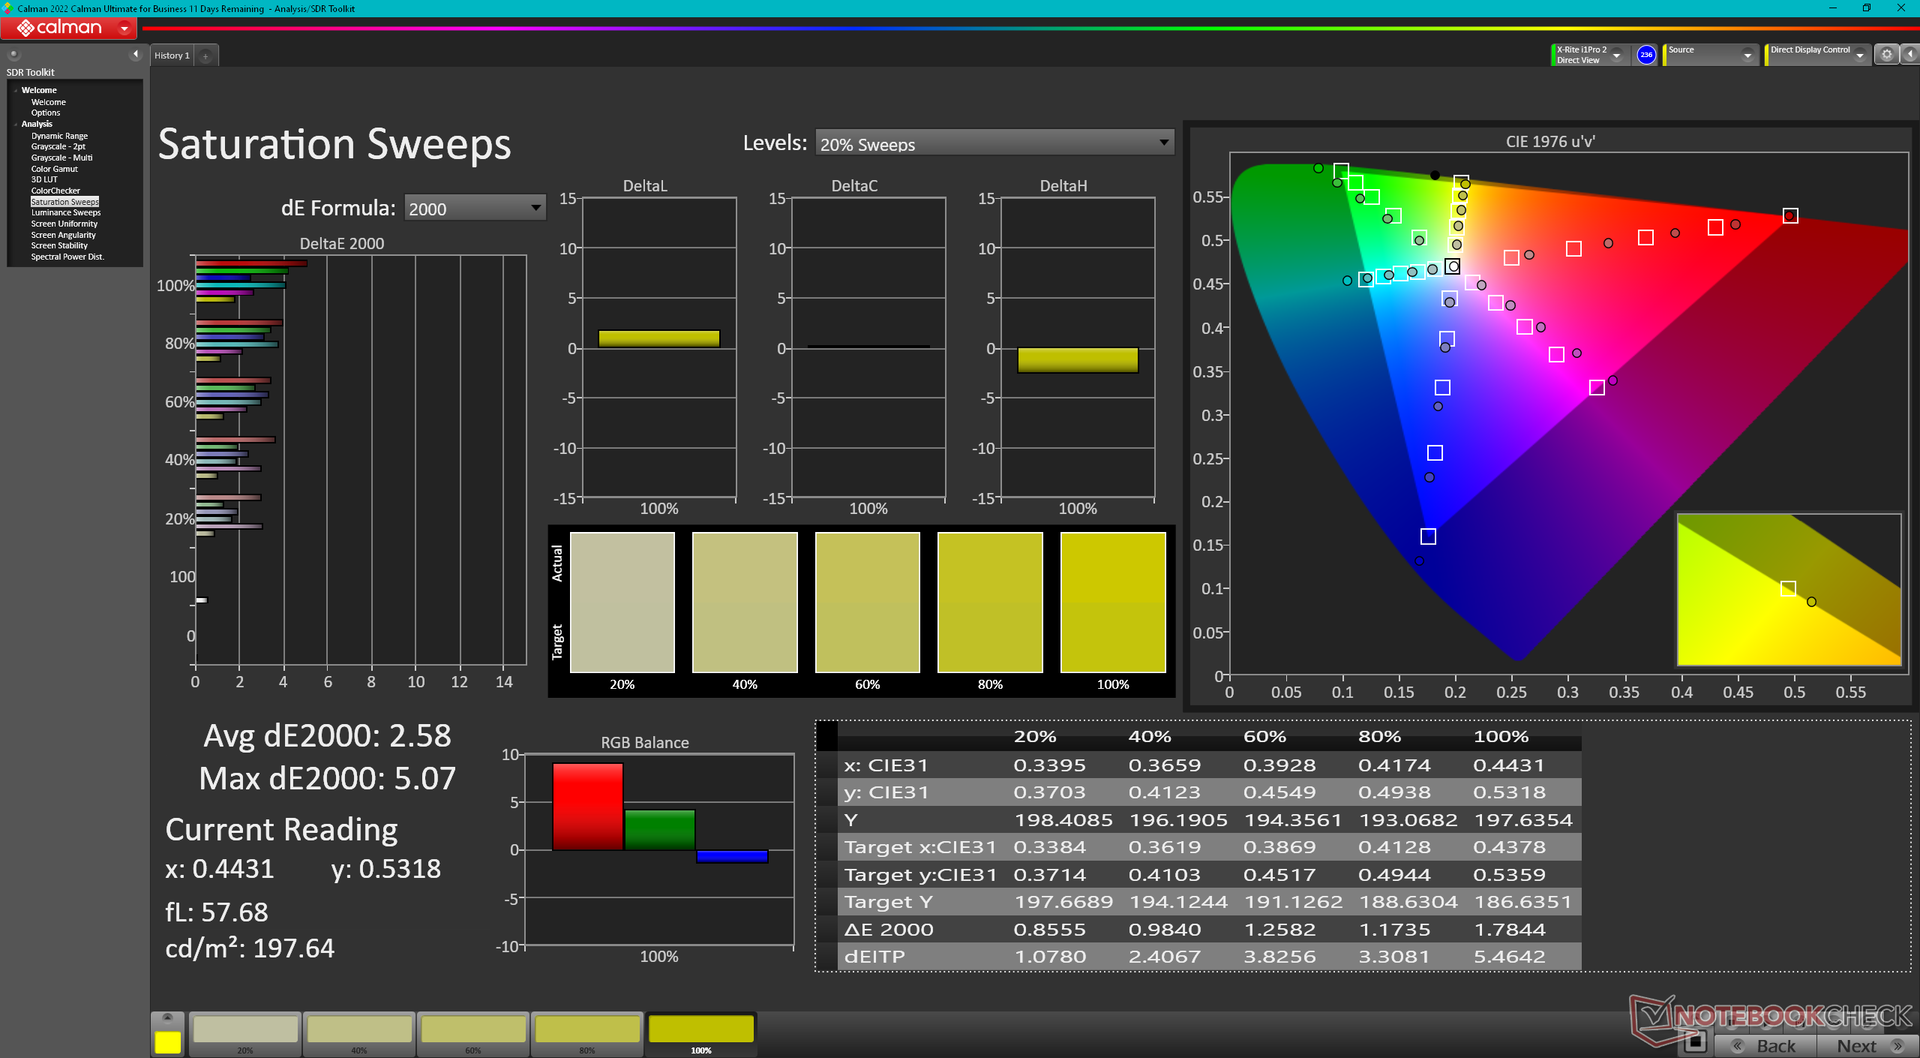
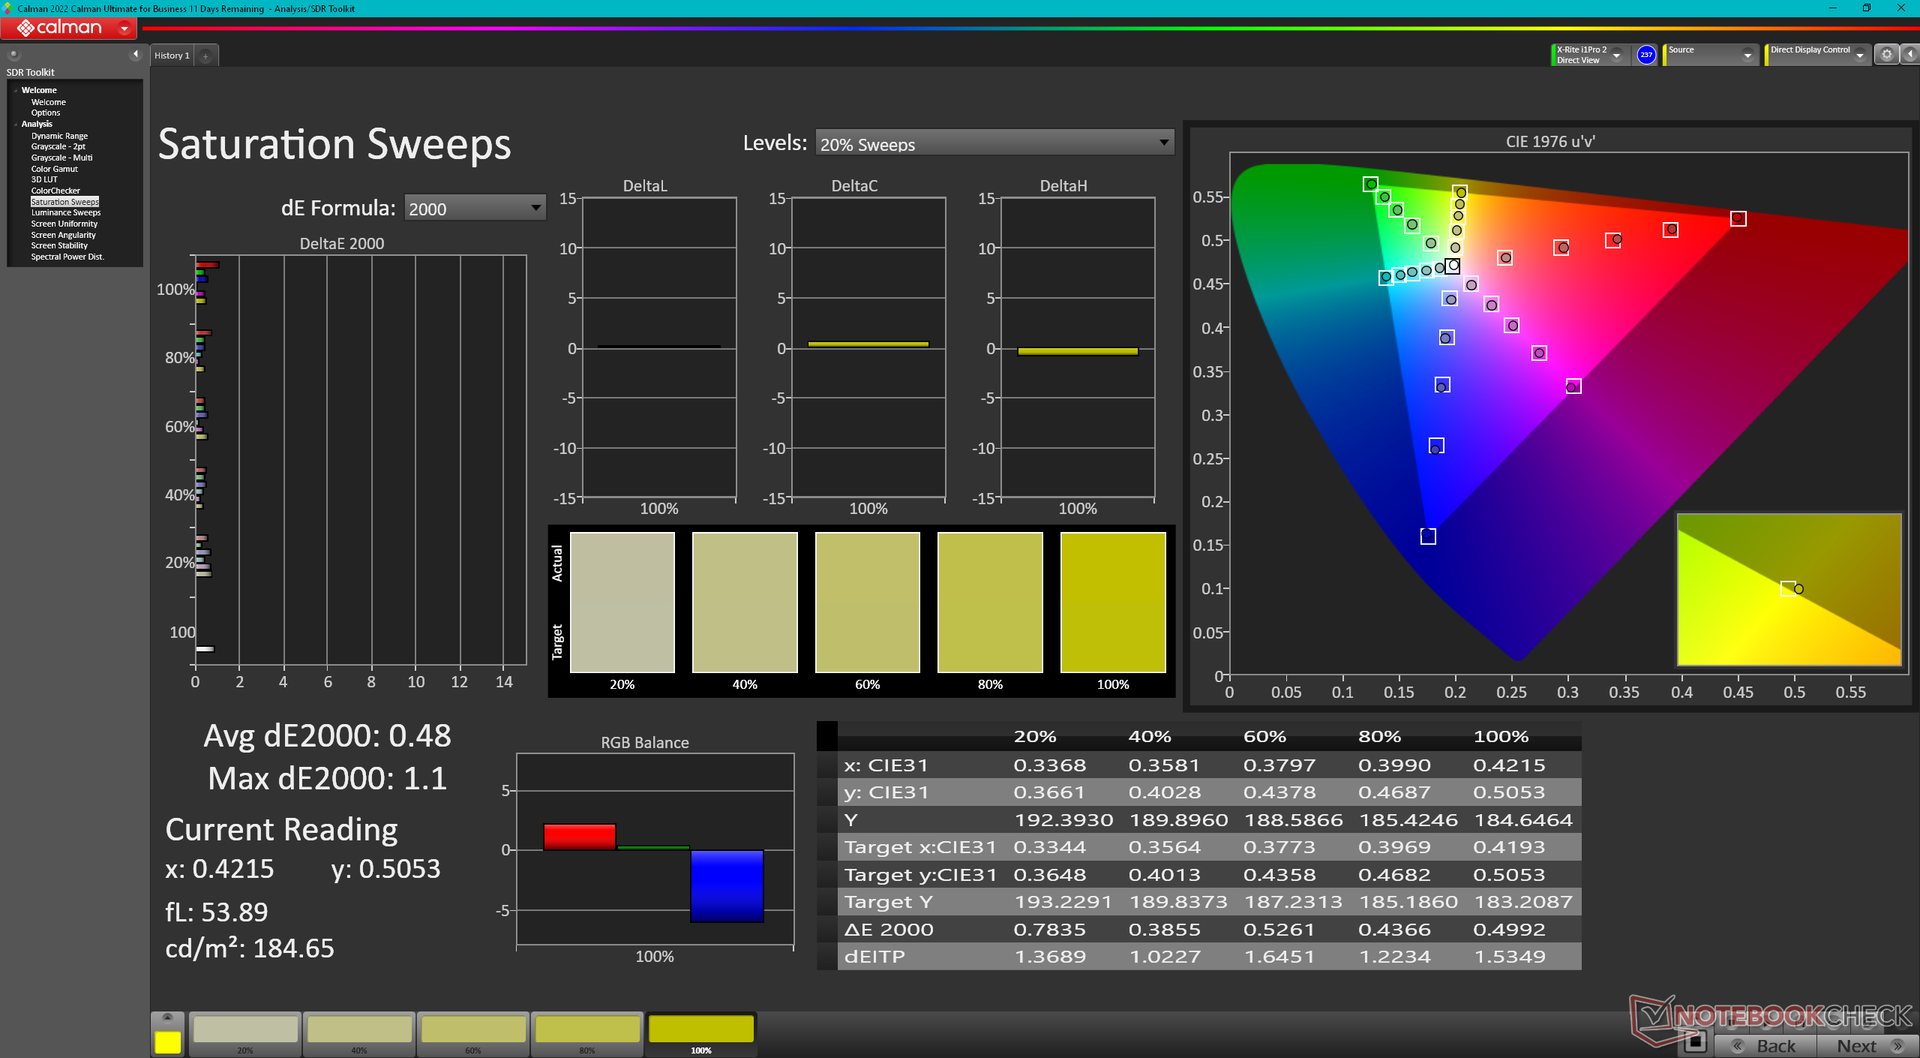
100% AdobeRGB 1998 (Argyll 3D)
100% sRGB (Argyll 3D)
99.9% Display P3 (Argyll 3D)
Gamma: 2.22
CCT: 6381 K
| Acer Swift Edge SFE16 Ryzen 7 7840U Samsung ATNA60BX03-0, OLED, 3200x2000, 16" | Acer Swift Edge SFE16-42-R1GM Samsung SDC4168, OLED, 3840x2400, 16" | Lenovo Slim Pro 9i 16IRP8 LEN160-3.2K, Mini-LED, 3200x2000, 16" | Asus VivoBook Pro 16 Au Optronics B160QAN02.L, IPS, 2560x1600, 16" | Samsung Galaxy Book3 Ultra 16 Samsung ATNA60CL03-0, AMOLED, 2880x1800, 16" | Huawei MateBook 16s i7 BOE XS TV160DKT-NH0, IPS, 2520x1680, 16" | |
|---|---|---|---|---|---|---|
| Display | -1% | -7% | -5% | -1% | -24% | |
| Display P3 Coverage (%) | 99.9 | 99.7 0% | 95.1 -5% | 98.5 -1% | 99.9 0% | 64.5 -35% |
| sRGB Coverage (%) | 100 | 100 0% | 99.9 0% | 99.9 0% | 100 0% | 96.7 -3% |
| AdobeRGB 1998 Coverage (%) | 100 | 97.2 -3% | 84.6 -15% | 86.1 -14% | 96.3 -4% | 66.6 -33% |
| Response Times | -226% | -1588% | -476% | 25% | -4192% | |
| Response Time Grey 50% / Grey 80% * (ms) | 0.57 ? | 2 ? -251% | 14 ? -2356% | 2 ? -251% | 0.49 ? 14% | 35.7 ? -6163% |
| Response Time Black / White * (ms) | 1 ? | 3 ? -200% | 9.2 ? -820% | 8 ? -700% | 0.65 ? 35% | 23.2 ? -2220% |
| PWM Frequency (Hz) | 238.8 | 239 ? | 5784 ? | 240 ? | ||
| Screen | -66% | -198% | -42% | -49% | -3% | |
| Brightness middle (cd/m²) | 379.8 | 369 -3% | 627.4 65% | 504 33% | 400 5% | 311 -18% |
| Brightness (cd/m²) | 383 | 371 -3% | 618 61% | 465 21% | 399 4% | 319 -17% |
| Brightness Distribution (%) | 98 | 97 -1% | 95 -3% | 87 -11% | 93 -5% | 91 -7% |
| Black Level * (cd/m²) | 0.19 | 0.35 | 0.03 | 0.17 | ||
| Colorchecker dE 2000 * | 4.7 | 2.3 51% | 5.84 -24% | 1.83 61% | 2.3 51% | 1 79% |
| Colorchecker dE 2000 max. * | 7.51 | 4.37 42% | 10.22 -36% | 5.51 27% | 4.15 45% | 1.7 77% |
| Colorchecker dE 2000 calibrated * | 0.55 | 2.87 -422% | 4.45 -709% | 1.34 -144% | 1.66 -202% | 0.8 -45% |
| Greyscale dE 2000 * | 0.8 | 1.83 -129% | 6.7 -738% | 3.02 -278% | 2.7 -238% | 1.5 -88% |
| Gamma | 2.22 99% | 2.39 92% | 2.77 79% | 2.39 92% | 2.266 97% | 2.15 102% |
| CCT | 6381 102% | 6392 102% | 5795 112% | 6688 97% | 7047 92% | 6432 101% |
| Contrast (:1) | 3302 | 1440 | 13333 | 1829 | ||
| Média Total (Programa/Configurações) | -98% /
-77% | -598% /
-382% | -174% /
-105% | -8% /
-25% | -1406% /
-706% |
* ... menor é melhor
Exibir tempos de resposta
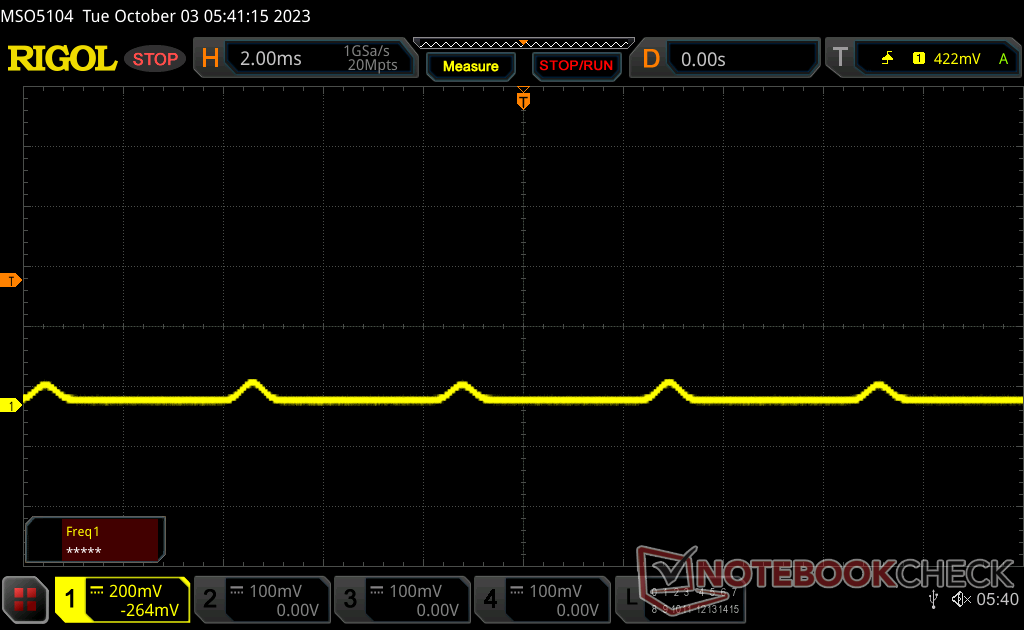
| ↔ Tempo de resposta preto para branco | ||
|---|---|---|
| 1 ms ... ascensão ↗ e queda ↘ combinadas | ↗ 0.55 ms ascensão | 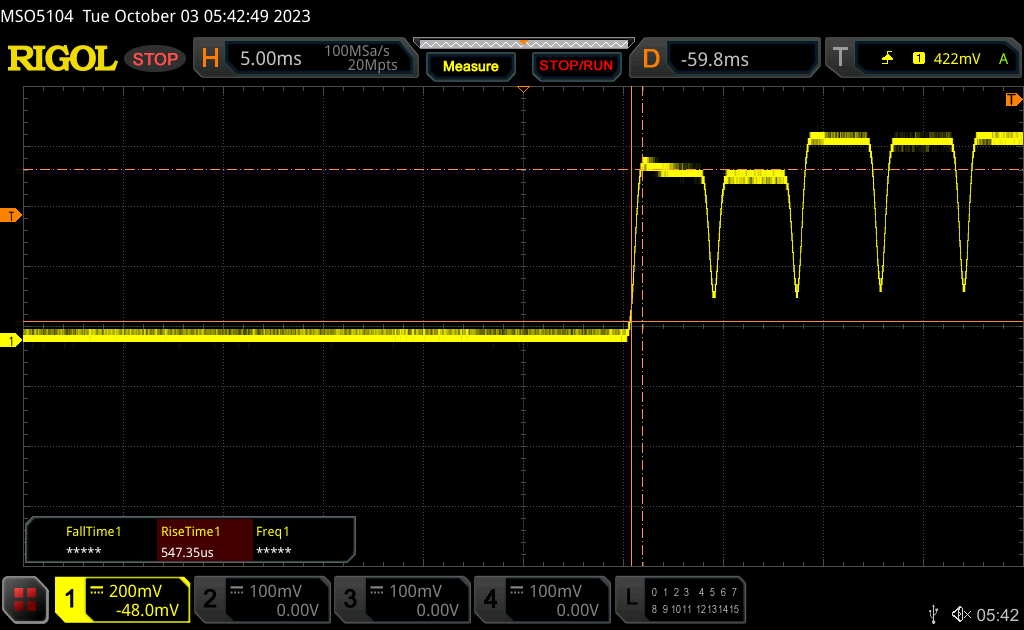 |
| ↘ 0.45 ms queda | ||
| A tela mostra taxas de resposta muito rápidas em nossos testes e deve ser muito adequada para jogos em ritmo acelerado. Em comparação, todos os dispositivos testados variam de 0.1 (mínimo) a 240 (máximo) ms. » 4 % de todos os dispositivos são melhores. Isso significa que o tempo de resposta medido é melhor que a média de todos os dispositivos testados (19.8 ms). | ||
| ↔ Tempo de resposta 50% cinza a 80% cinza | ||
| 0.57 ms ... ascensão ↗ e queda ↘ combinadas | ↗ 0.28 ms ascensão | 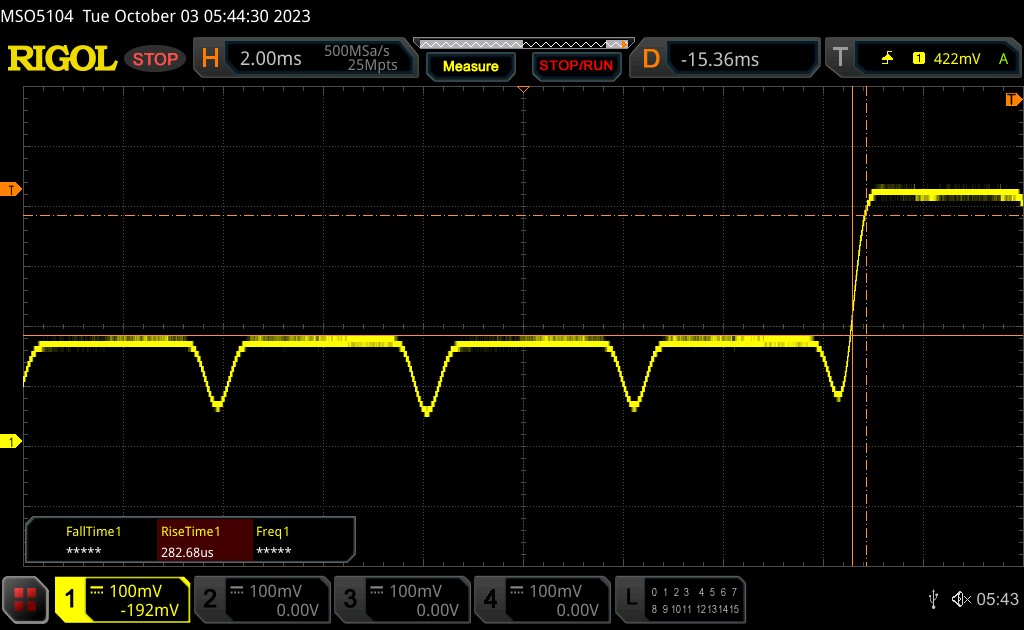 |
| ↘ 0.29 ms queda | ||
| A tela mostra taxas de resposta muito rápidas em nossos testes e deve ser muito adequada para jogos em ritmo acelerado. Em comparação, todos os dispositivos testados variam de 0.165 (mínimo) a 636 (máximo) ms. » 1 % de todos os dispositivos são melhores. Isso significa que o tempo de resposta medido é melhor que a média de todos os dispositivos testados (31 ms). | ||
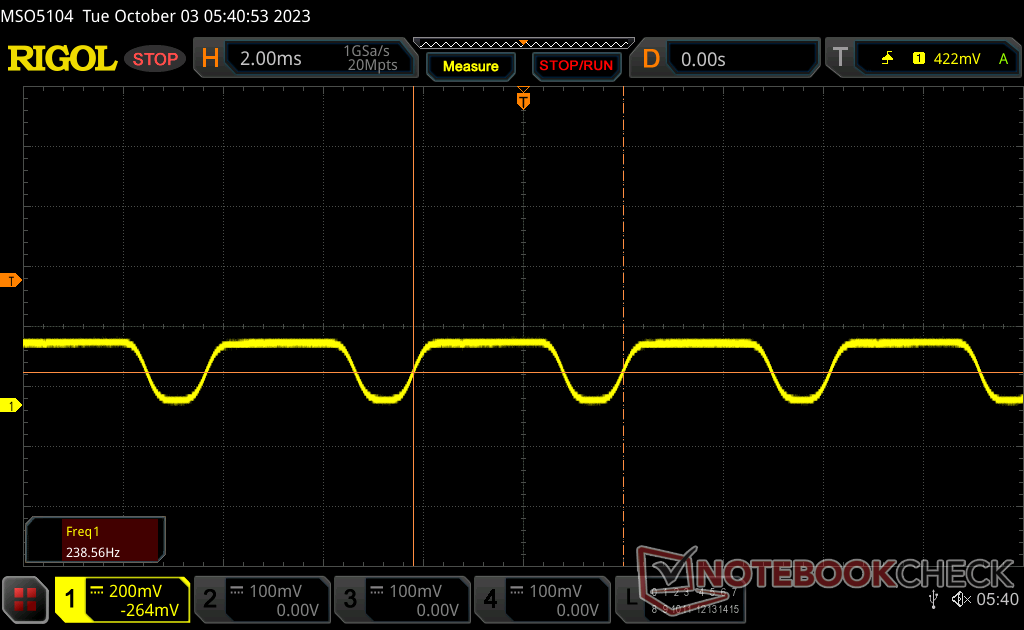
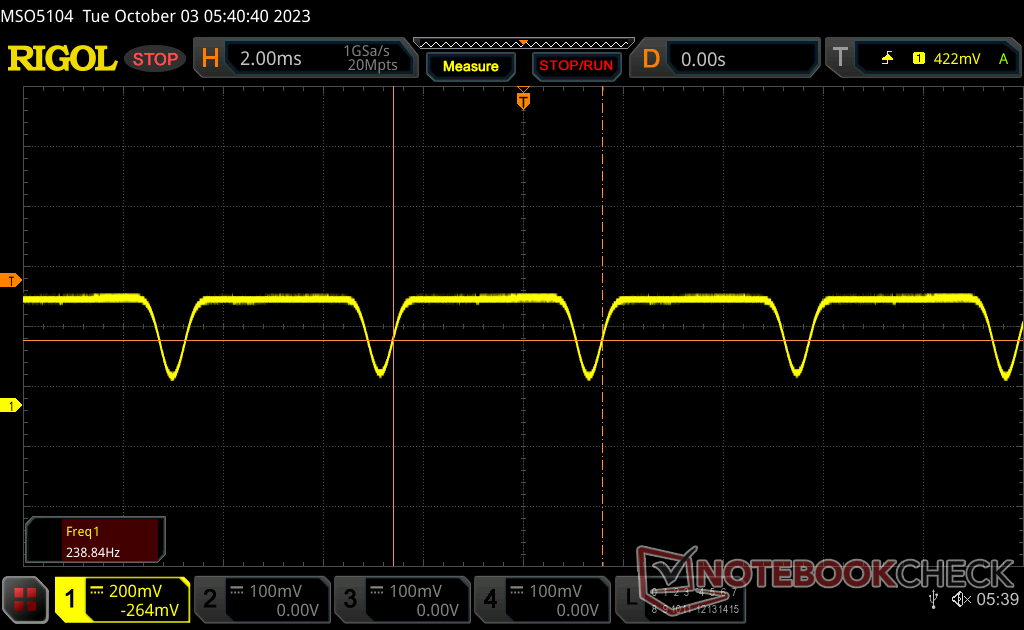
Cintilação da tela / PWM (modulação por largura de pulso)
| Tela tremeluzindo/PWM detectado | 238.8 Hz | 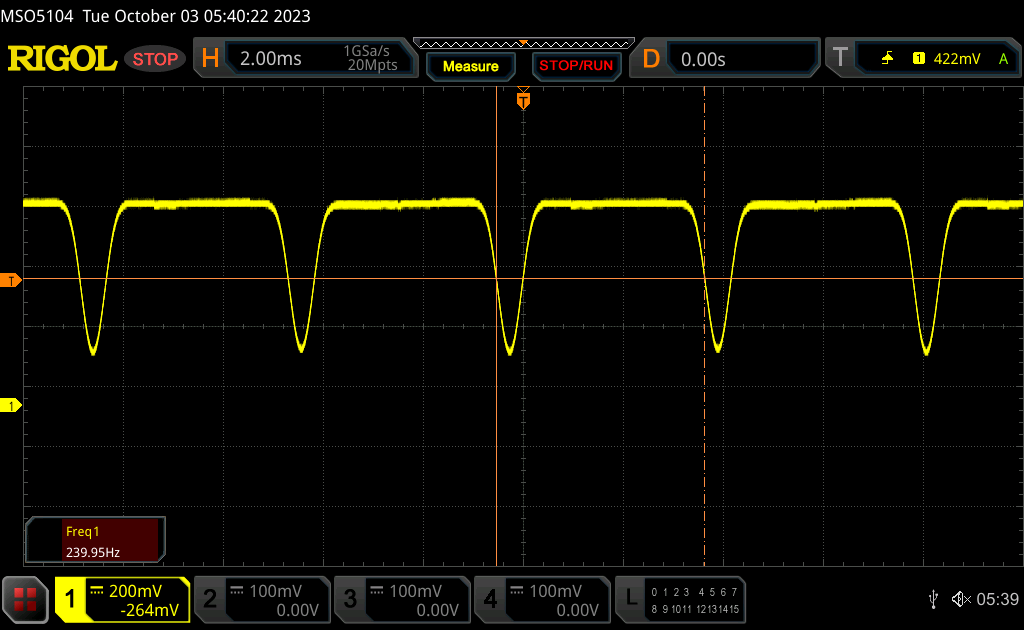 | |
A luz de fundo da tela pisca em 238.8 Hz (pior caso, por exemplo, utilizando PWM) . A frequência de 238.8 Hz é relativamente baixa, portanto, usuários sensíveis provavelmente notarão cintilação e sentirão fadiga ocular na configuração de brilho indicada e abaixo. [pwm_comparison] Em comparação: 52 % de todos os dispositivos testados não usam PWM para escurecer a tela. Se PWM foi detectado, uma média de 7757 (mínimo: 5 - máximo: 343500) Hz foi medida. | |||
Uma modulação de largura de pulso constante de 238 Hz está presente em todos os níveis de brilho, incluindo até mesmo a configuração máxima. Esse comportamento é comum em telas OLED que vão de smartphones a laptops.

Desempenho
Condições de teste
Colocamos o Windows no modo Desempenho antes de executar os benchmarks abaixo. A Acer não inclui nenhum software especializado para ajustes de desempenho ou de tela, ao contrário da série Asus VivoBook.
O FreeSync não é compatível com a tela interna.
Processador
O desempenho multi-thread está ligeiramente, mas consistentemente, atrás da maioria dos outros laptops com o mesmo desempenho Ryzen 7 7840U. O recente AMD Framework Laptop 13.5por exemplo, seria executado 15% mais rápido. A discrepância se deve ao potencial mais fraco do Turbo Core da CPU no Acer, decorrente de sua pequena solução de resfriamento em relação ao tamanho grande da tela de 16 polegadas. As pontuações do CineBench R15 xT cairiam em até 21% ao longo do tempo, conforme mostrado em nosso gráfico de comparação abaixo.
O desempenho geral ainda é mais rápido do que o do Zen 3+ Ryzen 7 7735U no antigo Acer Swift Edge SFE16-42-R1GM em cerca de 15% em cargas simples e multithread, apesar da limitação.
Cinebench R15 Multi Loop
Cinebench R23: Multi Core | Single Core
Cinebench R20: CPU (Multi Core) | CPU (Single Core)
Cinebench R15: CPU Multi 64Bit | CPU Single 64Bit
Blender: v2.79 BMW27 CPU
7-Zip 18.03: 7z b 4 | 7z b 4 -mmt1
Geekbench 5.5: Multi-Core | Single-Core
HWBOT x265 Benchmark v2.2: 4k Preset
LibreOffice : 20 Documents To PDF
R Benchmark 2.5: Overall mean
* ... menor é melhor
AIDA64: FP32 Ray-Trace | FPU Julia | CPU SHA3 | CPU Queen | FPU SinJulia | FPU Mandel | CPU AES | CPU ZLib | FP64 Ray-Trace | CPU PhotoWorxx
| Performance rating | |
| Lenovo Slim Pro 9i 16IRP8 | |
| Média AMD Ryzen 7 7840U | |
| Acer Swift Edge SFE16 Ryzen 7 7840U | |
| Samsung Galaxy Book3 Ultra 16 | |
| Asus VivoBook Pro 16 | |
| Acer Swift Edge SFE16-42-R1GM | |
| Huawei MateBook 16s i7 | |
| AIDA64 / FP32 Ray-Trace | |
| Média AMD Ryzen 7 7840U (17924 - 25901, n=11) | |
| Lenovo Slim Pro 9i 16IRP8 | |
| Acer Swift Edge SFE16 Ryzen 7 7840U | |
| Asus VivoBook Pro 16 | |
| Samsung Galaxy Book3 Ultra 16 | |
| Acer Swift Edge SFE16-42-R1GM | |
| Huawei MateBook 16s i7 | |
| AIDA64 / FPU Julia | |
| Lenovo Slim Pro 9i 16IRP8 | |
| Média AMD Ryzen 7 7840U (78360 - 109745, n=11) | |
| Acer Swift Edge SFE16 Ryzen 7 7840U | |
| Asus VivoBook Pro 16 | |
| Acer Swift Edge SFE16-42-R1GM | |
| Samsung Galaxy Book3 Ultra 16 | |
| Huawei MateBook 16s i7 | |
| AIDA64 / CPU Queen | |
| Lenovo Slim Pro 9i 16IRP8 | |
| Asus VivoBook Pro 16 | |
| Samsung Galaxy Book3 Ultra 16 | |
| Média AMD Ryzen 7 7840U (83206 - 114294, n=10) | |
| Acer Swift Edge SFE16 Ryzen 7 7840U | |
| Huawei MateBook 16s i7 | |
| Acer Swift Edge SFE16-42-R1GM | |
| AIDA64 / FPU SinJulia | |
| Média AMD Ryzen 7 7840U (11969 - 14822, n=11) | |
| Acer Swift Edge SFE16 Ryzen 7 7840U | |
| Lenovo Slim Pro 9i 16IRP8 | |
| Acer Swift Edge SFE16-42-R1GM | |
| Samsung Galaxy Book3 Ultra 16 | |
| Asus VivoBook Pro 16 | |
| Huawei MateBook 16s i7 | |
| AIDA64 / FPU Mandel | |
| Média AMD Ryzen 7 7840U (40720 - 58482, n=11) | |
| Lenovo Slim Pro 9i 16IRP8 | |
| Acer Swift Edge SFE16 Ryzen 7 7840U | |
| Acer Swift Edge SFE16-42-R1GM | |
| Asus VivoBook Pro 16 | |
| Samsung Galaxy Book3 Ultra 16 | |
| Huawei MateBook 16s i7 | |
| AIDA64 / CPU ZLib | |
| Lenovo Slim Pro 9i 16IRP8 | |
| Samsung Galaxy Book3 Ultra 16 | |
| Asus VivoBook Pro 16 | |
| Média AMD Ryzen 7 7840U (801 - 1047, n=11) | |
| Acer Swift Edge SFE16 Ryzen 7 7840U | |
| Huawei MateBook 16s i7 | |
| Acer Swift Edge SFE16-42-R1GM | |
| AIDA64 / FP64 Ray-Trace | |
| Média AMD Ryzen 7 7840U (9347 - 13846, n=11) | |
| Lenovo Slim Pro 9i 16IRP8 | |
| Acer Swift Edge SFE16 Ryzen 7 7840U | |
| Asus VivoBook Pro 16 | |
| Samsung Galaxy Book3 Ultra 16 | |
| Acer Swift Edge SFE16-42-R1GM | |
| Huawei MateBook 16s i7 | |
| AIDA64 / CPU PhotoWorxx | |
| Lenovo Slim Pro 9i 16IRP8 | |
| Samsung Galaxy Book3 Ultra 16 | |
| Huawei MateBook 16s i7 | |
| Média AMD Ryzen 7 7840U (26206 - 38173, n=11) | |
| Acer Swift Edge SFE16 Ryzen 7 7840U | |
| Acer Swift Edge SFE16-42-R1GM | |
| Asus VivoBook Pro 16 | |
Desempenho do sistema
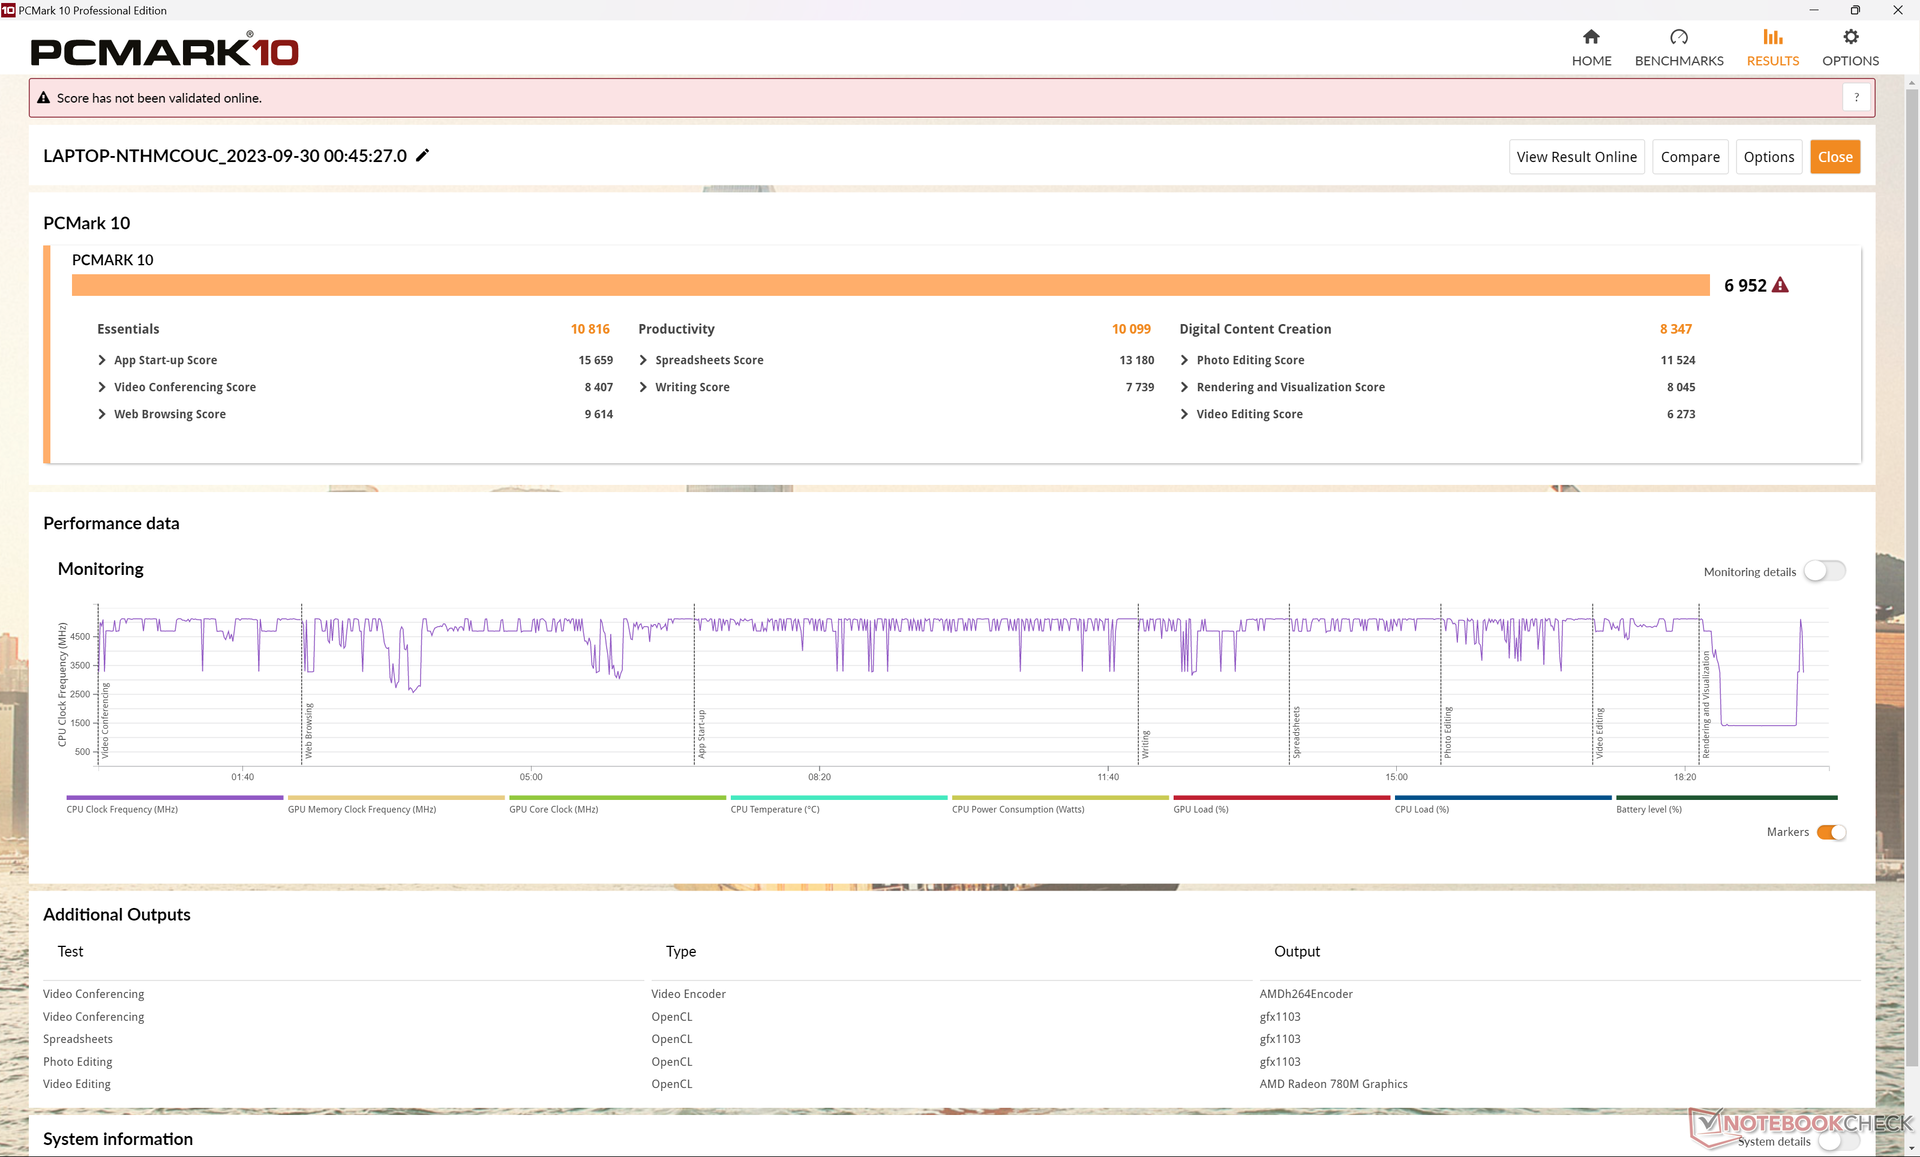
CrossMark: Overall | Productivity | Creativity | Responsiveness
| PCMark 10 / Score | |
| Lenovo Slim Pro 9i 16IRP8 | |
| Acer Swift Edge SFE16 Ryzen 7 7840U | |
| Samsung Galaxy Book3 Ultra 16 | |
| Asus VivoBook Pro 16 | |
| Média AMD Ryzen 7 7840U, AMD Radeon 780M (5866 - 7157, n=10) | |
| Huawei MateBook 16s i7 | |
| Acer Swift Edge SFE16-42-R1GM | |
| PCMark 10 / Essentials | |
| Huawei MateBook 16s i7 | |
| Lenovo Slim Pro 9i 16IRP8 | |
| Acer Swift Edge SFE16 Ryzen 7 7840U | |
| Samsung Galaxy Book3 Ultra 16 | |
| Média AMD Ryzen 7 7840U, AMD Radeon 780M (9068 - 11081, n=10) | |
| Asus VivoBook Pro 16 | |
| Acer Swift Edge SFE16-42-R1GM | |
| PCMark 10 / Productivity | |
| Acer Swift Edge SFE16 Ryzen 7 7840U | |
| Lenovo Slim Pro 9i 16IRP8 | |
| Acer Swift Edge SFE16-42-R1GM | |
| Asus VivoBook Pro 16 | |
| Média AMD Ryzen 7 7840U, AMD Radeon 780M (7323 - 10099, n=10) | |
| Samsung Galaxy Book3 Ultra 16 | |
| Huawei MateBook 16s i7 | |
| PCMark 10 / Digital Content Creation | |
| Lenovo Slim Pro 9i 16IRP8 | |
| Samsung Galaxy Book3 Ultra 16 | |
| Asus VivoBook Pro 16 | |
| Acer Swift Edge SFE16 Ryzen 7 7840U | |
| Média AMD Ryzen 7 7840U, AMD Radeon 780M (7204 - 8987, n=10) | |
| Acer Swift Edge SFE16-42-R1GM | |
| Huawei MateBook 16s i7 | |
| CrossMark / Overall | |
| Huawei MateBook 16s i7 | |
| Acer Swift Edge SFE16 Ryzen 7 7840U | |
| Lenovo Slim Pro 9i 16IRP8 | |
| Asus VivoBook Pro 16 | |
| Samsung Galaxy Book3 Ultra 16 | |
| Média AMD Ryzen 7 7840U, AMD Radeon 780M (1256 - 1804, n=10) | |
| Acer Swift Edge SFE16-42-R1GM | |
| CrossMark / Productivity | |
| Huawei MateBook 16s i7 | |
| Acer Swift Edge SFE16 Ryzen 7 7840U | |
| Asus VivoBook Pro 16 | |
| Lenovo Slim Pro 9i 16IRP8 | |
| Média AMD Ryzen 7 7840U, AMD Radeon 780M (1261 - 1798, n=10) | |
| Samsung Galaxy Book3 Ultra 16 | |
| Acer Swift Edge SFE16-42-R1GM | |
| CrossMark / Creativity | |
| Lenovo Slim Pro 9i 16IRP8 | |
| Huawei MateBook 16s i7 | |
| Acer Swift Edge SFE16 Ryzen 7 7840U | |
| Asus VivoBook Pro 16 | |
| Samsung Galaxy Book3 Ultra 16 | |
| Média AMD Ryzen 7 7840U, AMD Radeon 780M (1251 - 1835, n=10) | |
| Acer Swift Edge SFE16-42-R1GM | |
| CrossMark / Responsiveness | |
| Huawei MateBook 16s i7 | |
| Acer Swift Edge SFE16 Ryzen 7 7840U | |
| Asus VivoBook Pro 16 | |
| Samsung Galaxy Book3 Ultra 16 | |
| Lenovo Slim Pro 9i 16IRP8 | |
| Média AMD Ryzen 7 7840U, AMD Radeon 780M (1082 - 1775, n=10) | |
| Acer Swift Edge SFE16-42-R1GM | |
| PCMark 10 Score | 6952 pontos | |
Ajuda | ||
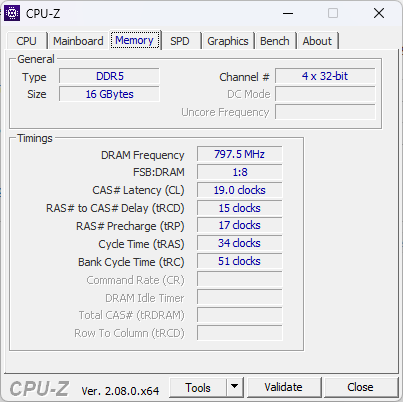
| AIDA64 / Memory Copy | |
| Lenovo Slim Pro 9i 16IRP8 | |
| Samsung Galaxy Book3 Ultra 16 | |
| Huawei MateBook 16s i7 | |
| Acer Swift Edge SFE16 Ryzen 7 7840U | |
| Média AMD Ryzen 7 7840U (43255 - 70532, n=12) | |
| Acer Swift Edge SFE16-42-R1GM | |
| Asus VivoBook Pro 16 | |
| AIDA64 / Memory Read | |
| Lenovo Slim Pro 9i 16IRP8 | |
| Samsung Galaxy Book3 Ultra 16 | |
| Huawei MateBook 16s i7 | |
| Acer Swift Edge SFE16 Ryzen 7 7840U | |
| Média AMD Ryzen 7 7840U (37399 - 61602, n=11) | |
| Acer Swift Edge SFE16-42-R1GM | |
| Asus VivoBook Pro 16 | |
| AIDA64 / Memory Write | |
| Acer Swift Edge SFE16 Ryzen 7 7840U | |
| Lenovo Slim Pro 9i 16IRP8 | |
| Samsung Galaxy Book3 Ultra 16 | |
| Média AMD Ryzen 7 7840U (46797 - 92289, n=13) | |
| Huawei MateBook 16s i7 | |
| Acer Swift Edge SFE16-42-R1GM | |
| Asus VivoBook Pro 16 | |
| AIDA64 / Memory Latency | |
| Média AMD Ryzen 7 7840U (90 - 137.2, n=12) | |
| Acer Swift Edge SFE16 Ryzen 7 7840U | |
| Huawei MateBook 16s i7 | |
| Lenovo Slim Pro 9i 16IRP8 | |
| Acer Swift Edge SFE16-42-R1GM | |
| Samsung Galaxy Book3 Ultra 16 | |
| Asus VivoBook Pro 16 | |
* ... menor é melhor
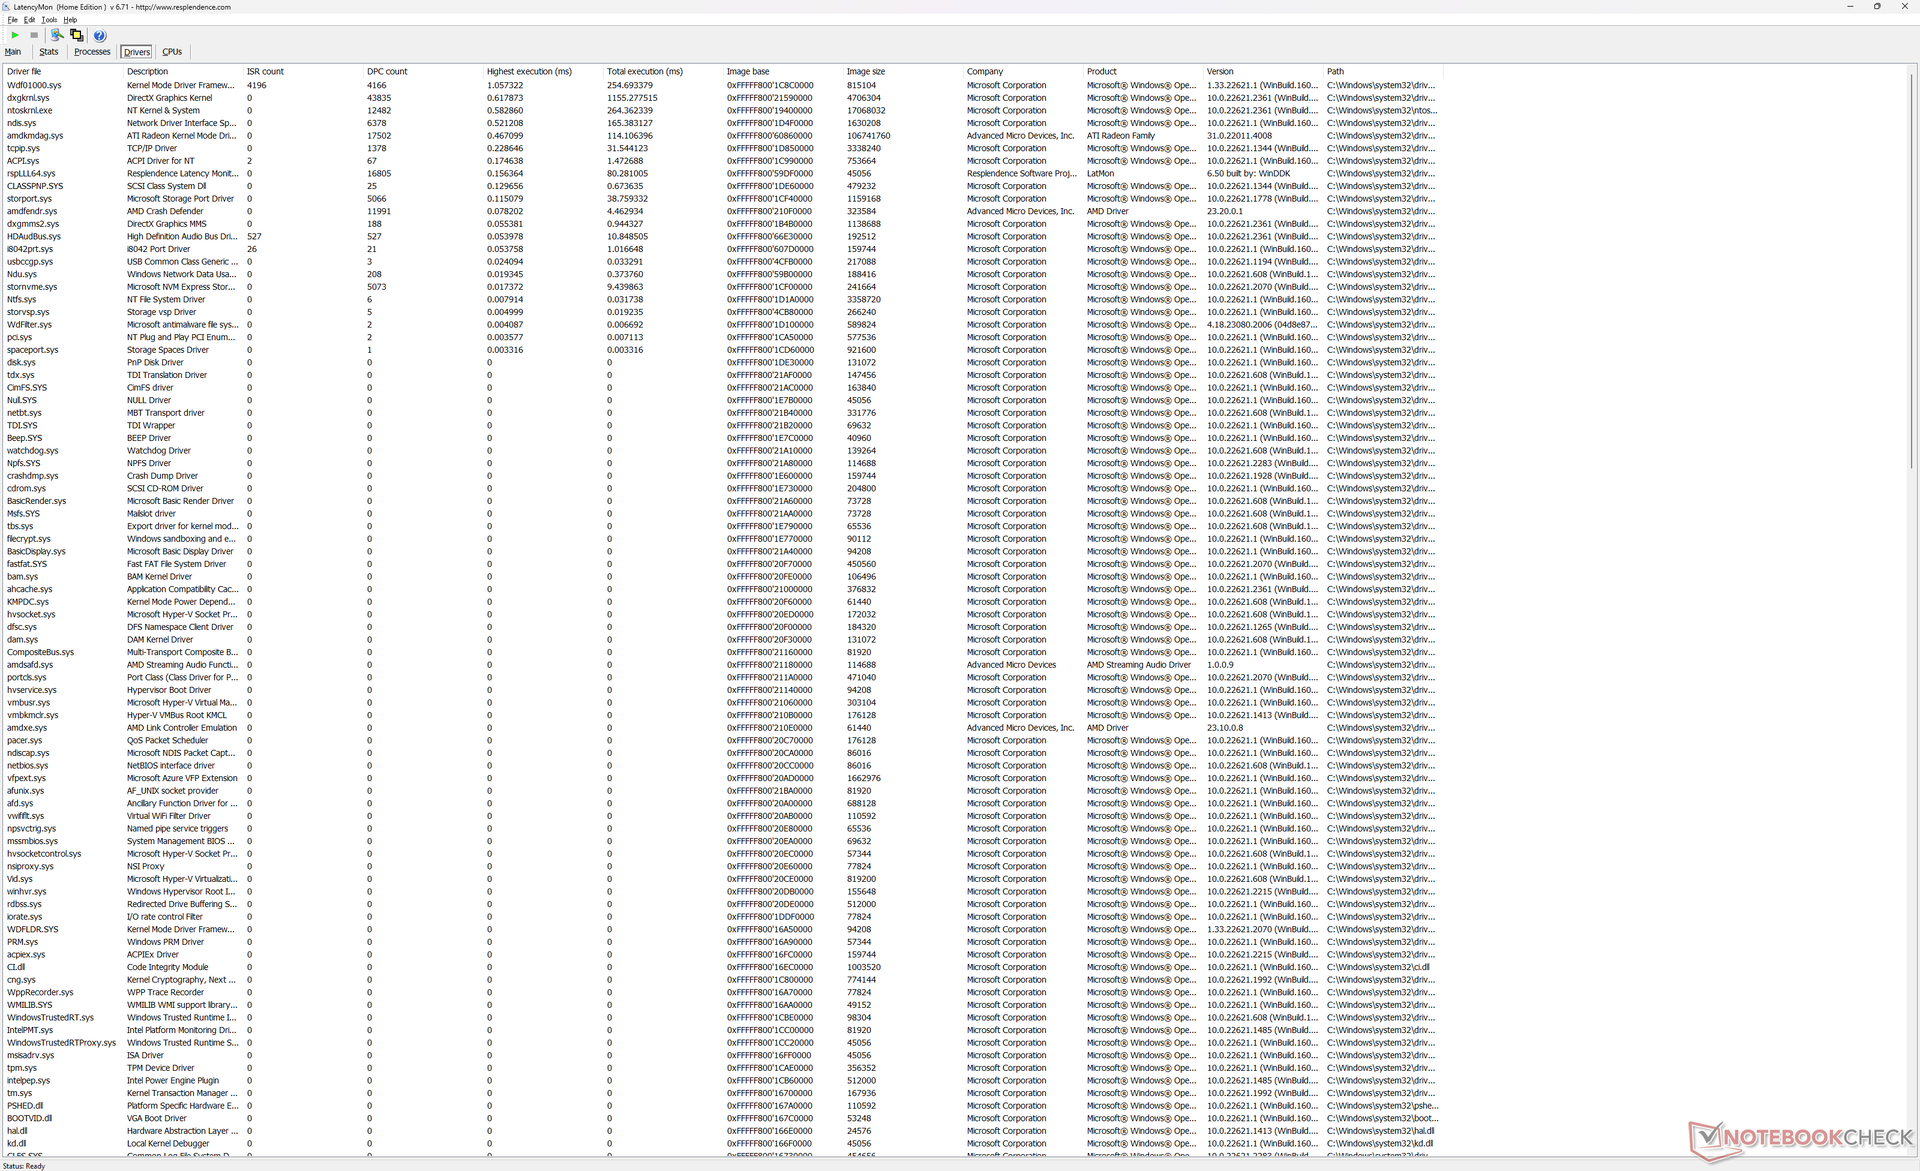
Latência DPC
O LatencyMon não revela nenhum problema grave de DPC ao abrir várias guias do navegador em nossa página inicial. a reprodução de vídeo 4K a 60 FPS também é perfeita, sem registro de queda de quadros.
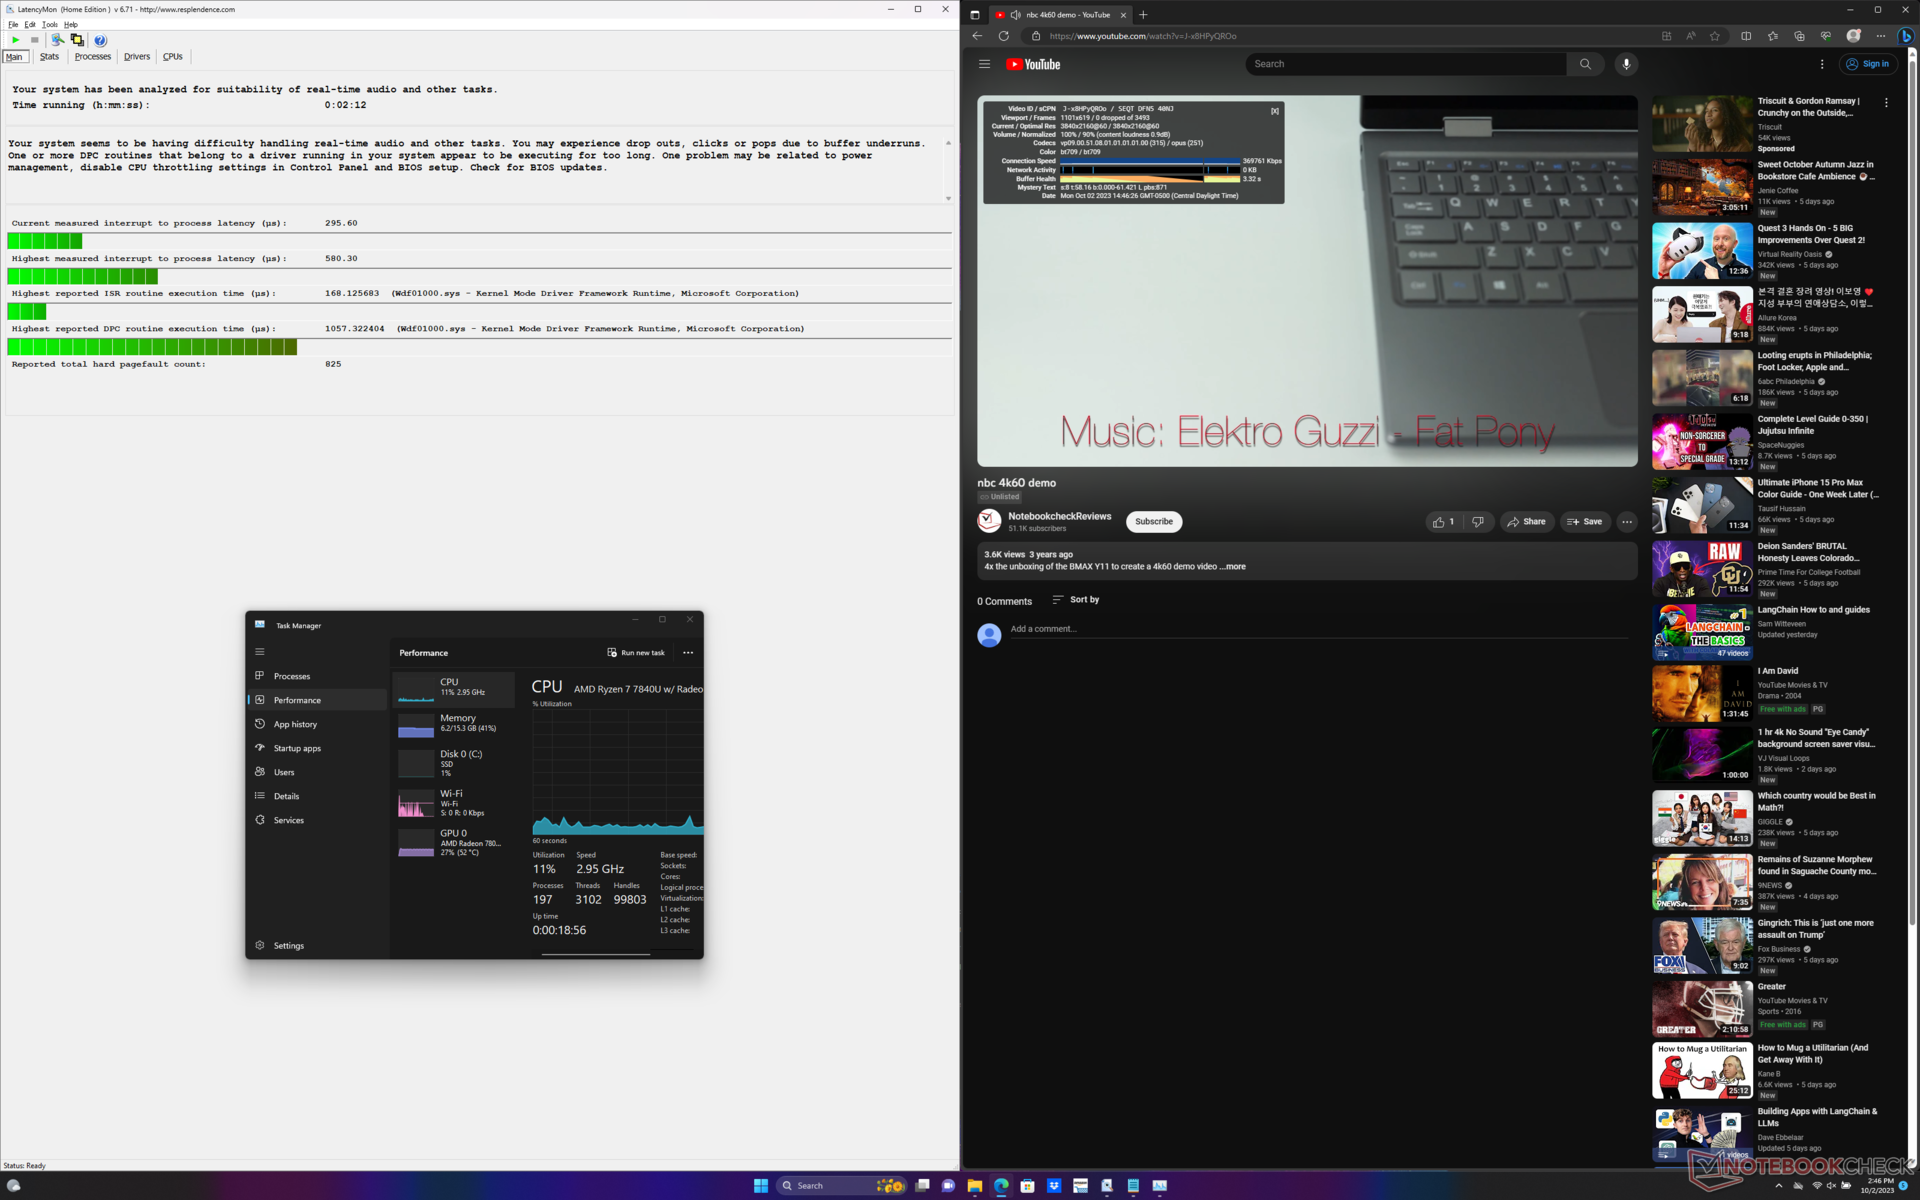
| DPC Latencies / LatencyMon - interrupt to process latency (max), Web, Youtube, Prime95 | |
| Samsung Galaxy Book3 Ultra 16 | |
| Acer Swift Edge SFE16-42-R1GM | |
| Asus VivoBook Pro 16 | |
| Lenovo Slim Pro 9i 16IRP8 | |
| Acer Swift Edge SFE16 Ryzen 7 7840U | |
* ... menor é melhor
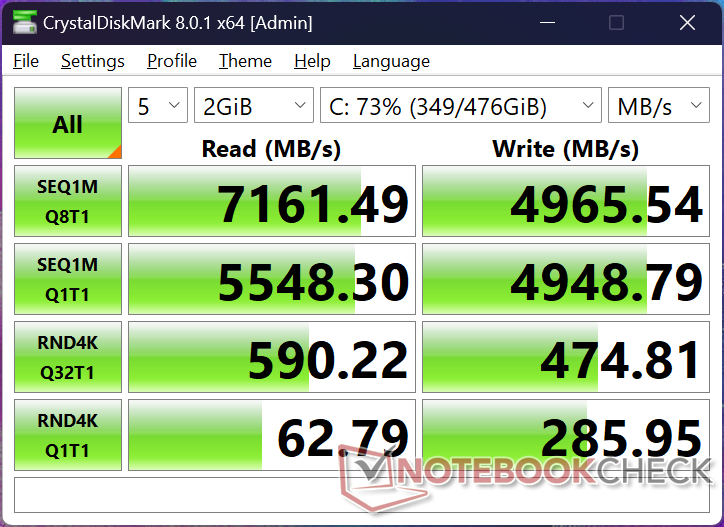
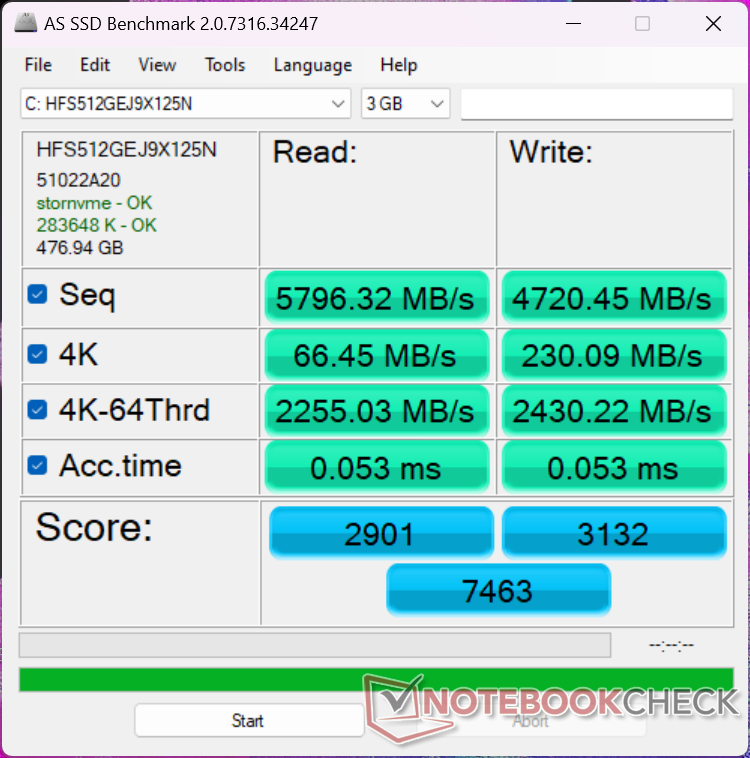
Dispositivos de armazenamento
Nossa unidade de teste vem com um SK hynix HFS512GEJ9X125N que rivaliza com o Samsung PM9A1 no papel. Na realidade, no entanto, a unidade em nossa unidade chegava a 3500 MB/s após apenas alguns minutos de estresse, conforme mostrado no gráfico abaixo. Esse comportamento também foi observado em nosso Swift Edge 16 mais antigo, o que sugere que as unidades sofrem de resfriamento ou dissipação de calor inadequados.

| Drive Performance rating - Percent | |
| Acer Swift Edge SFE16 Ryzen 7 7840U | |
| Samsung Galaxy Book3 Ultra 16 | |
| Acer Swift Edge SFE16-42-R1GM | |
| Lenovo Slim Pro 9i 16IRP8 | |
| Huawei MateBook 16s i7 | |
| Asus VivoBook Pro 16 | |
* ... menor é melhor
Disk Throttling: DiskSpd Read Loop, Queue Depth 8
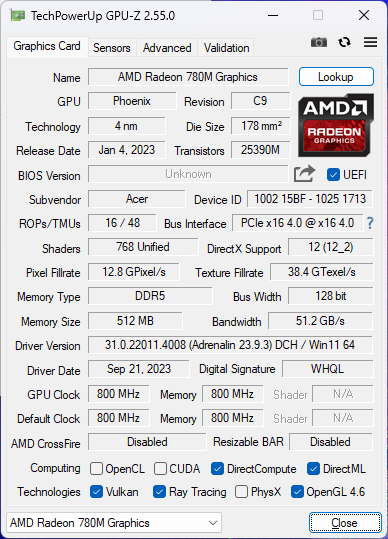
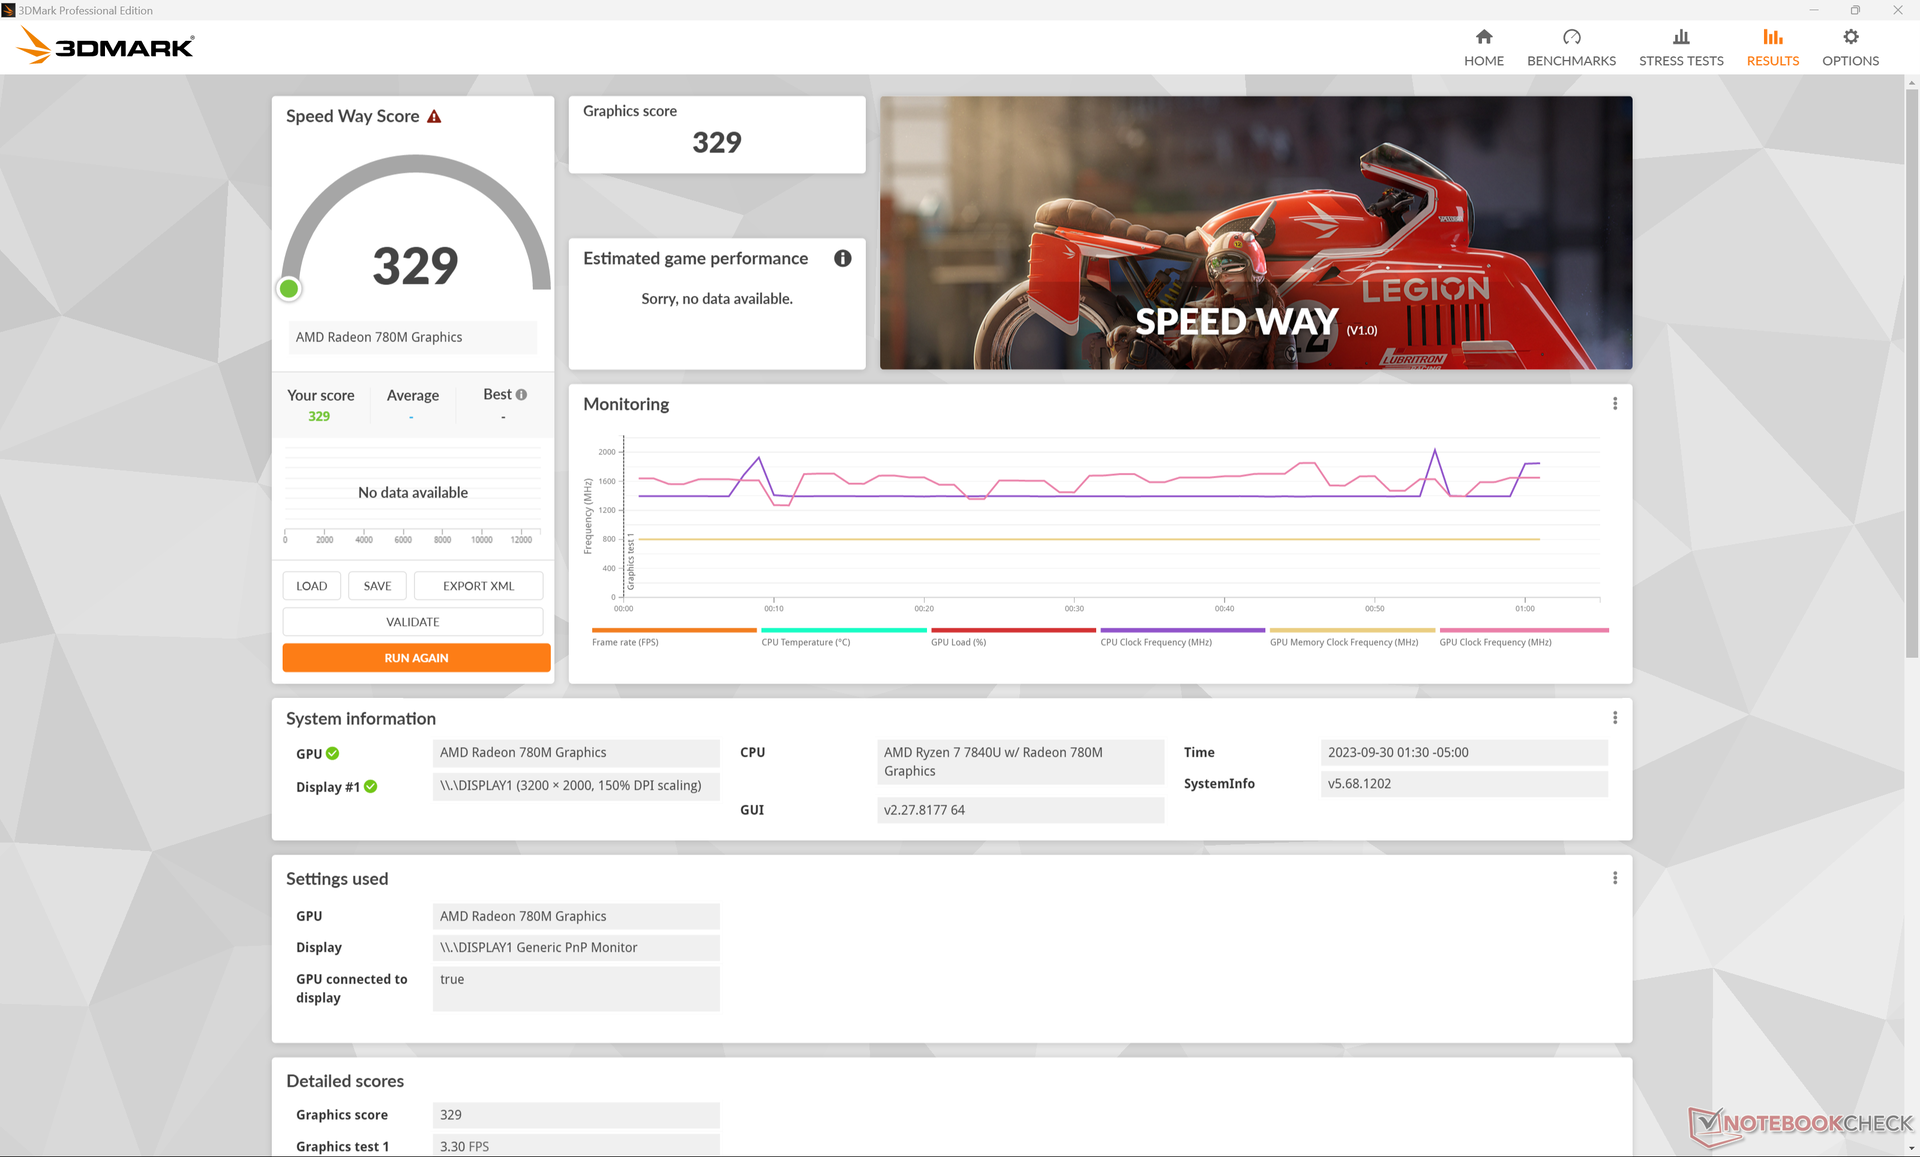
Desempenho da GPU
A 2022 Radeon 680M já era um grande avanço em relação à série RX Vega anterior e, portanto, a 2023 Radeon 780M é mais uma pequena atualização com apenas melhorias marginais. Nesse caso, a Radeon 780M em nosso Acer é apenas alguns pontos percentuais mais rápida do que a 680M na configuração Zen 3+.
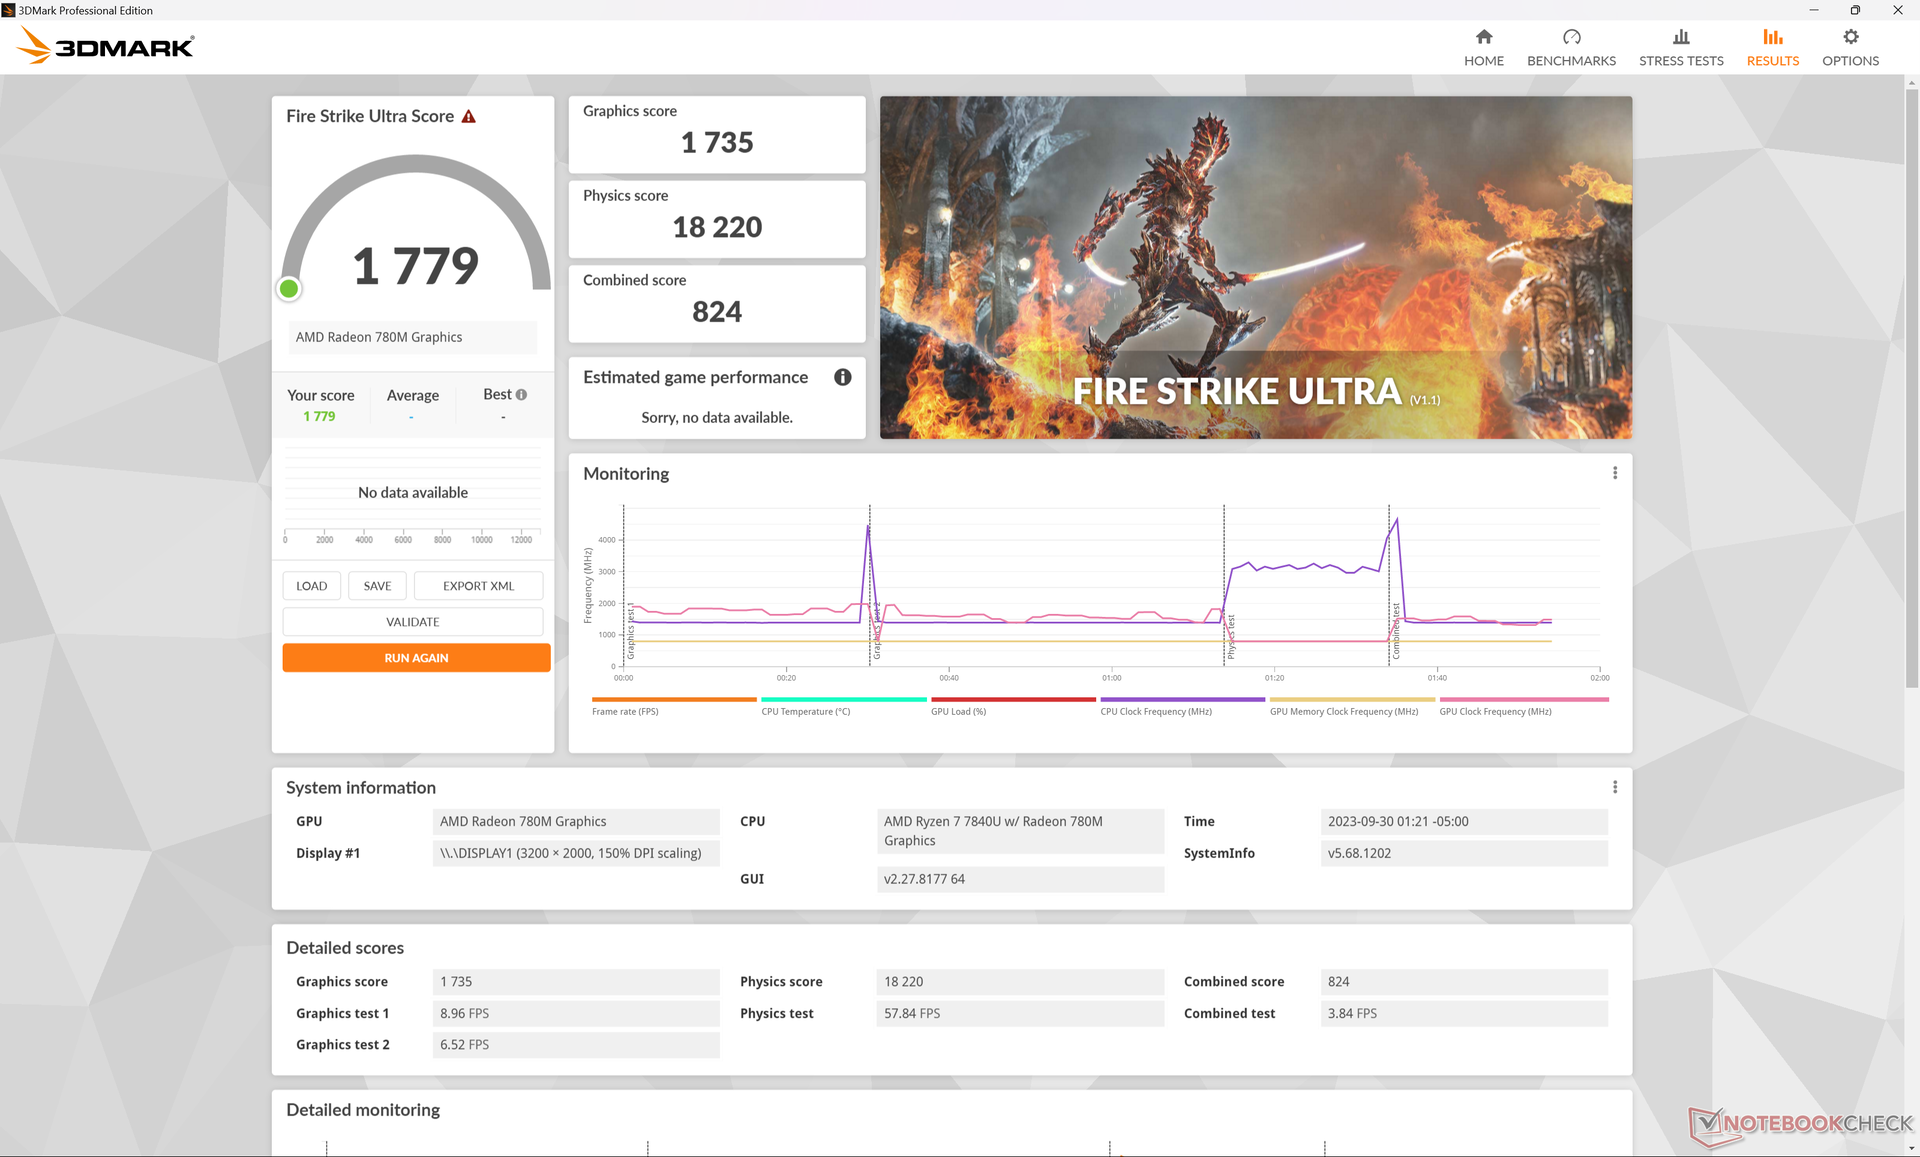
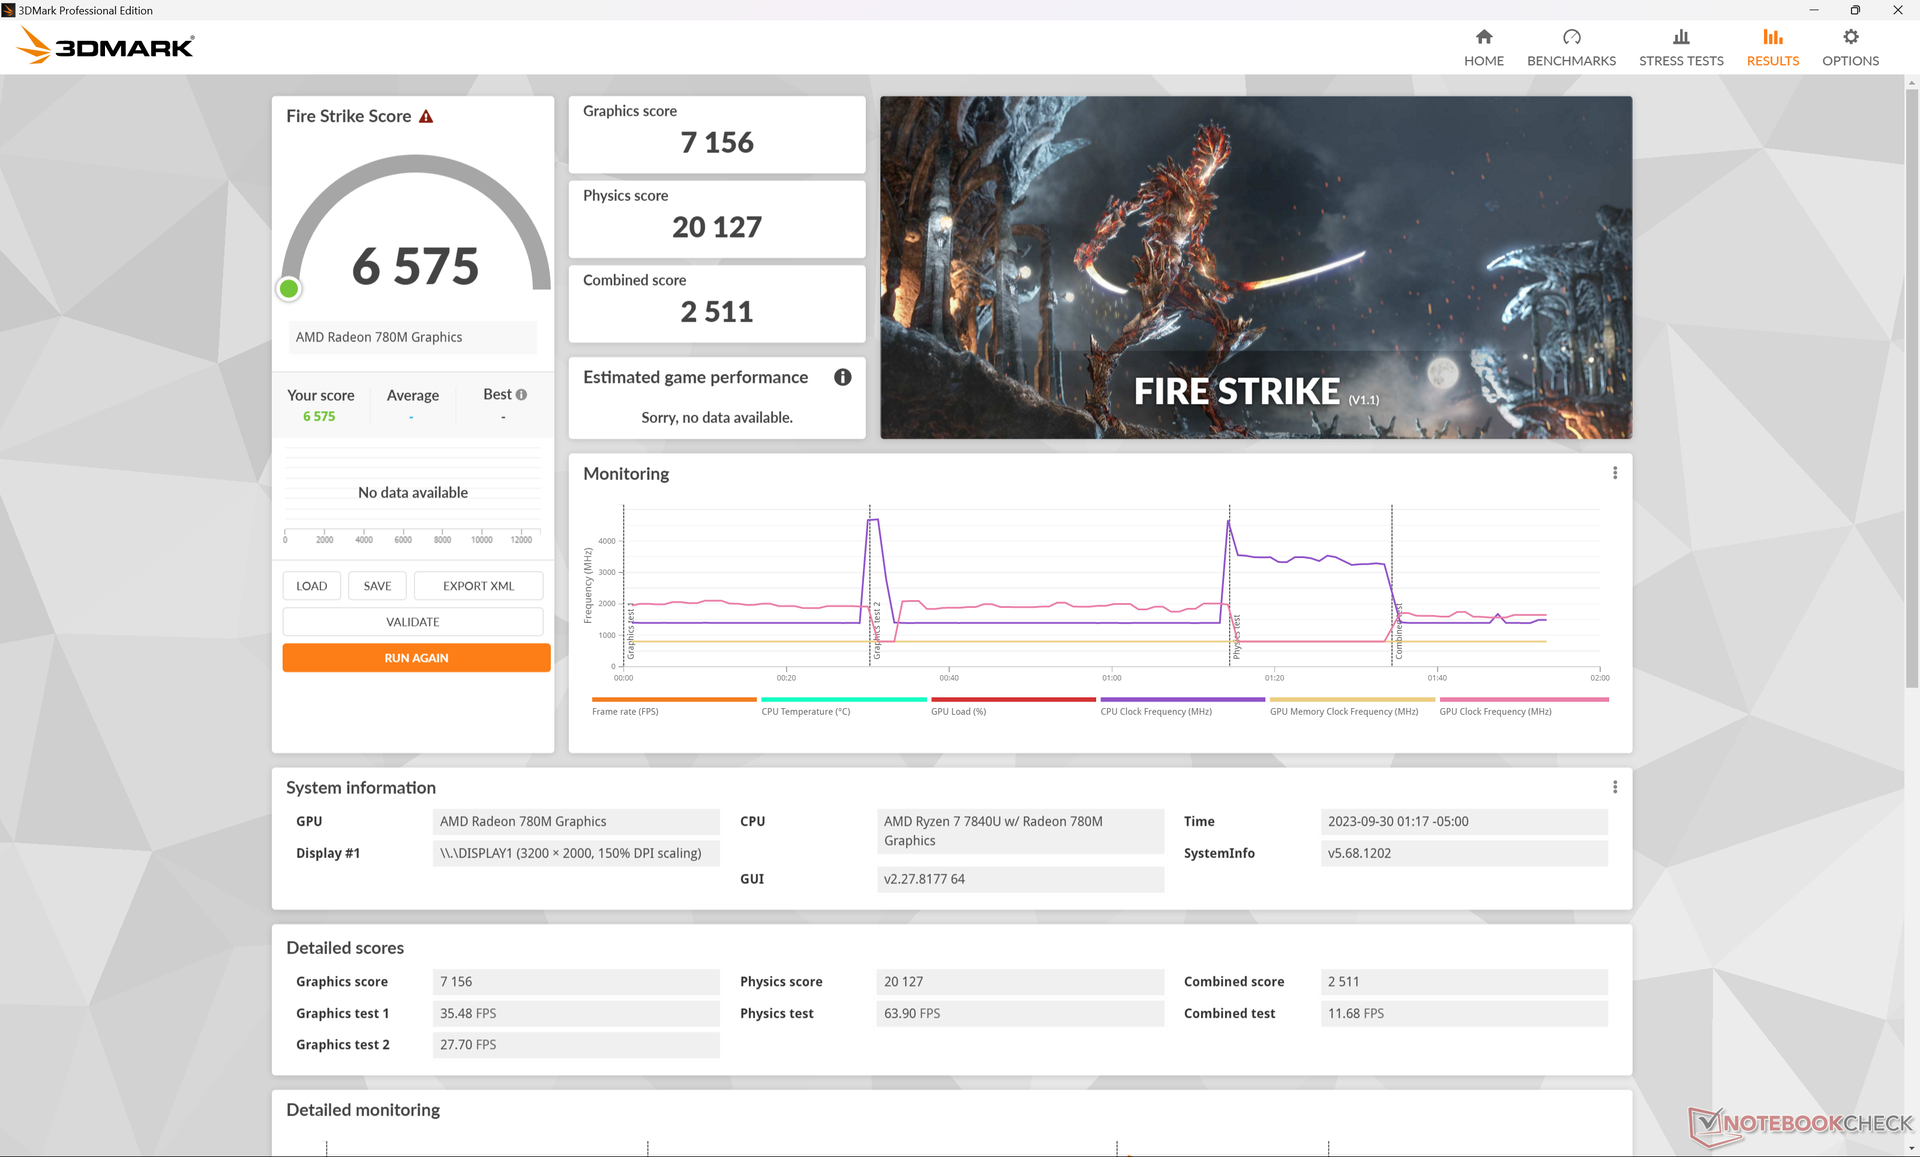
A configuração do sistema no modo Balanced em vez do modo Performance ou a execução com a energia da bateria afetará o desempenho geral, como mostra a tabela de resultados do site Fire Strike abaixo.
| Perfil de energia | Pontuação de gráficos | Pontuação de física | Pontuação combinada |
| Modo de desempenho | 7156 | 20127 | 2511 |
| Modo equilibrado | 4682 (-37%) | 15022 (-25%) | 1726 (-31%) |
| Energia da bateria | 4982 (-33%) | 14856 (-26%) | 1734 (-31%) |
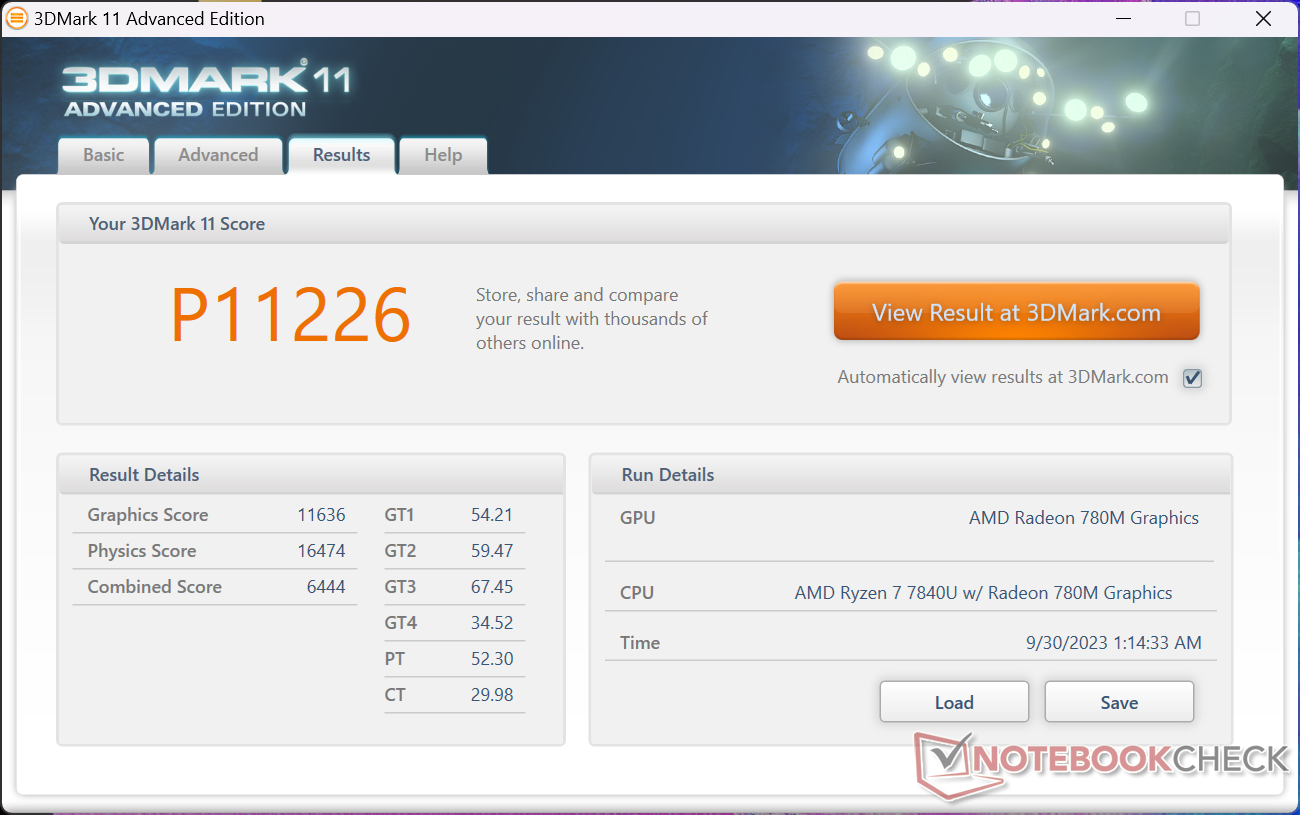
| 3DMark 11 Performance | 11226 pontos | |
| 3DMark Fire Strike Score | 6575 pontos | |
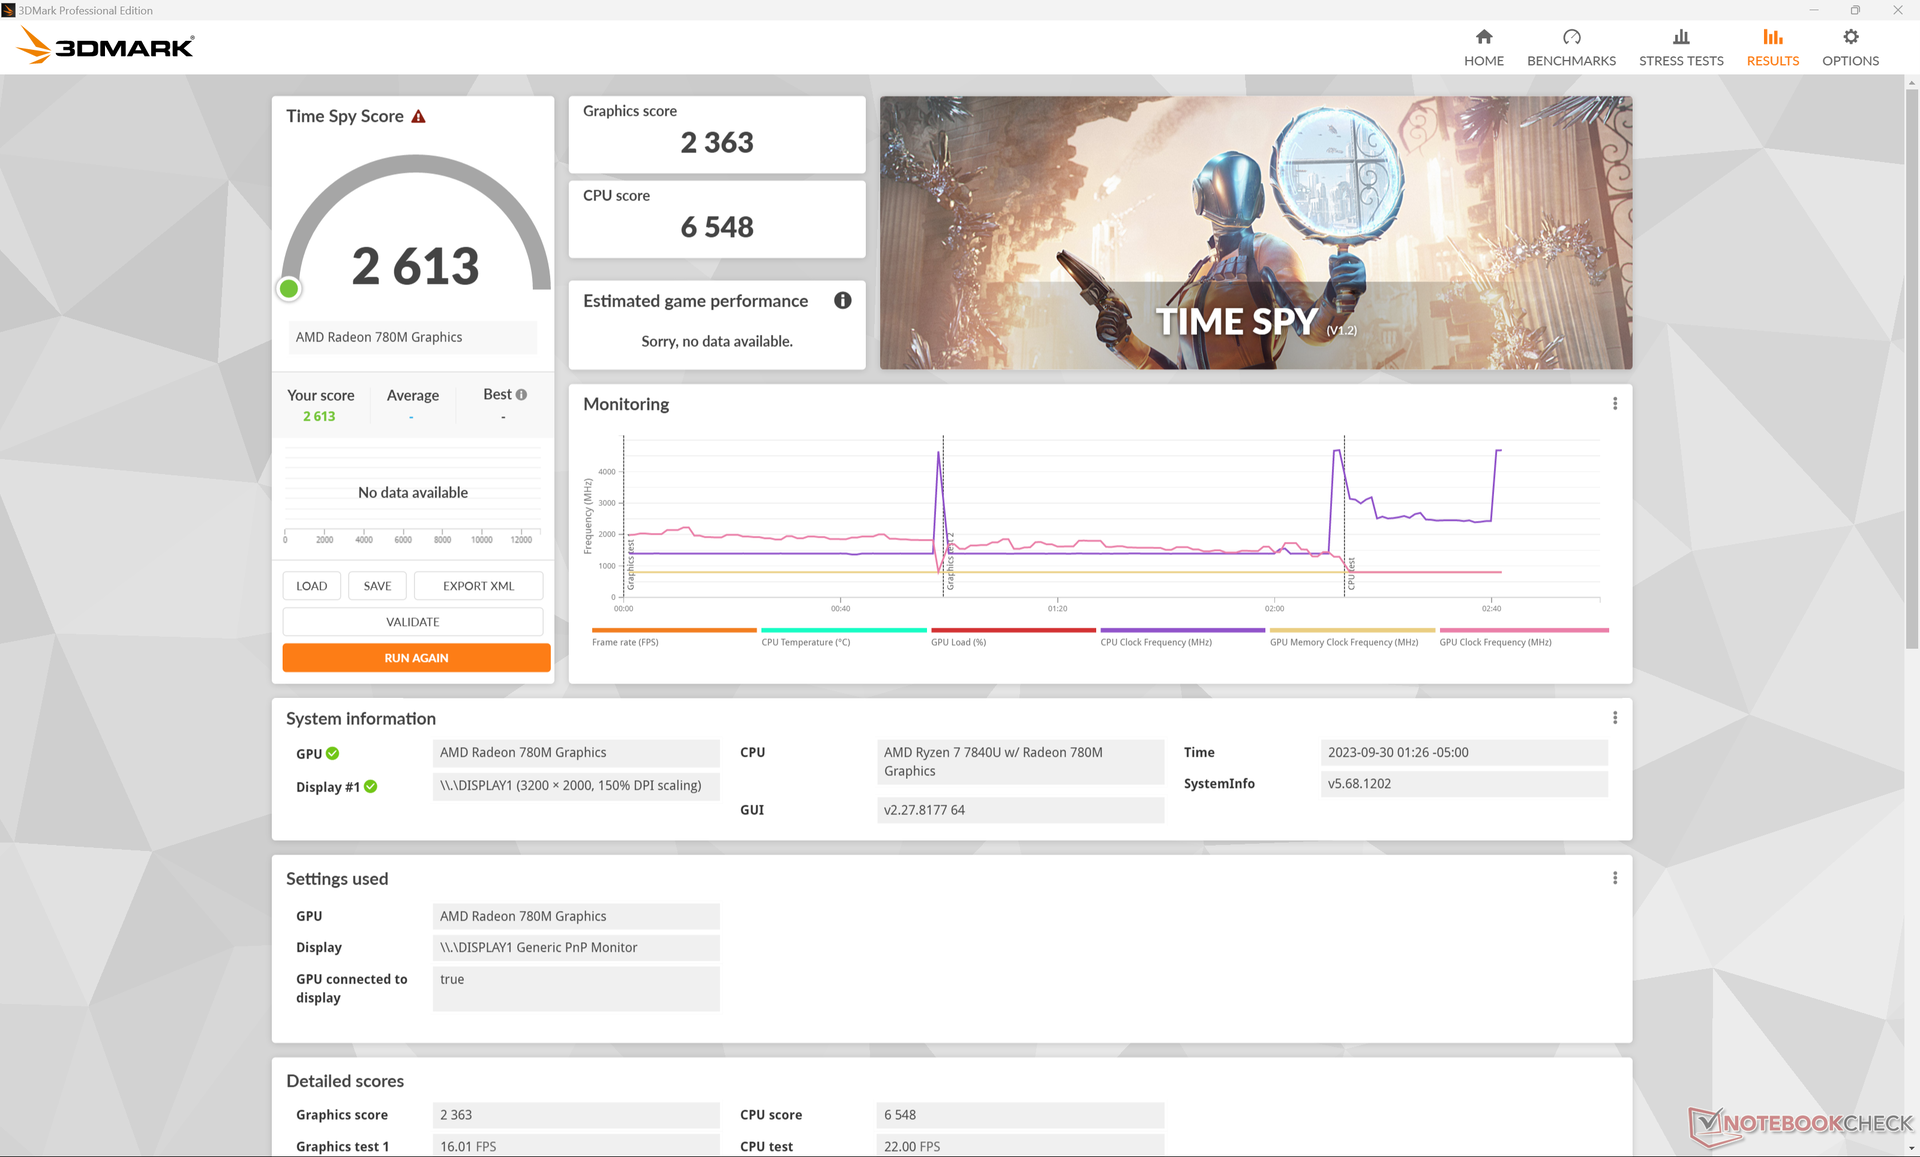
| 3DMark Time Spy Score | 2613 pontos | |
Ajuda | ||
* ... menor é melhor
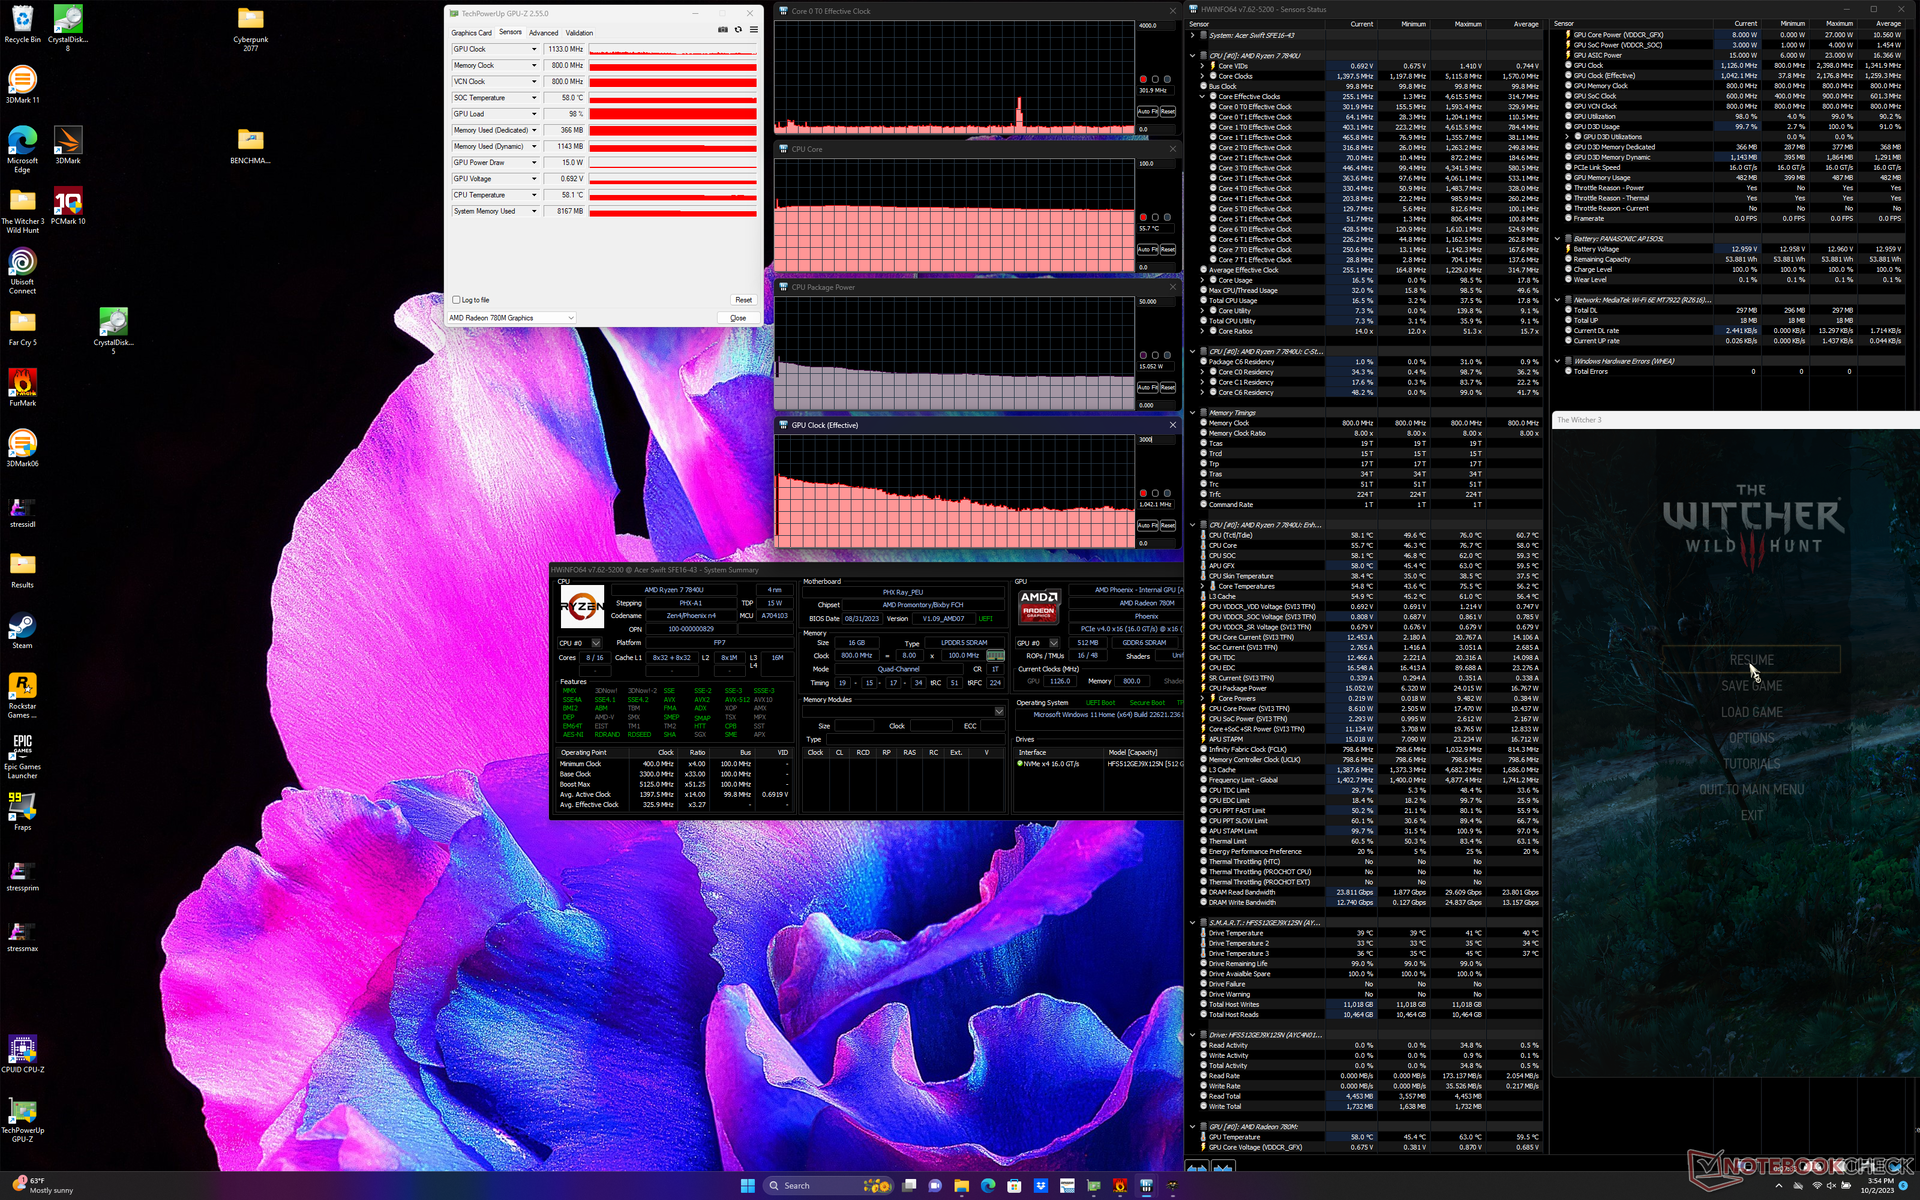
O desempenho da GPU também diminuía com o tempo, semelhante ao que observamos ao executar o teste de loop do CineBench R15 xT acima. Quando em marcha lenta no Witcher 3por exemplo, as taxas de quadros começavam altas, a 45 FPS, antes de desacelerar e se estabilizar na faixa de 30 FPS.
Witcher 3 FPS Chart
| baixo | média | alto | ultra | |
|---|---|---|---|---|
| GTA V (2015) | 139.3 | 53.9 | 21 | |
| The Witcher 3 (2015) | 109.8 | 36.1 | 20.4 | |
| Dota 2 Reborn (2015) | 128.1 | 101.5 | 66.8 | 61.4 |
| Final Fantasy XV Benchmark (2018) | 50.5 | 27.4 | 21.2 | |
| X-Plane 11.11 (2018) | 49.1 | 37 | 30.3 | |
| Far Cry 5 (2018) | 53 | 28 | 26 | 24 |
| Strange Brigade (2018) | 139.8 | 60.6 | 49.5 | 41.3 |
| Cyberpunk 2077 1.6 (2022) | 26.7 | 20.8 | 17.3 | 15.9 |
| Tiny Tina's Wonderlands (2022) | 34.3 | 28.4 | 18.6 | 16.5 |
| F1 22 (2022) | 65.4 | 62.1 | 42.6 | 9.92 |
Emissões
Ruído do sistema
O ruído da ventoinha não mudou muito em relação à configuração do Zen 3+, embora o número de ventoinhas tenha mudado. Isso é lamentável, pois a ventoinha em nossa unidade de teste do Zen 3+ pulsava com frequência e alto assim que cargas mais pesadas eram introduzidas e em nossa unidade do Zen 4 não seria diferente. O ruído da ventoinha oscila regularmente em torno de 28 dB(A) contra um fundo silencioso de 24 dB(A) ao navegar na Web ou fazer streaming, enquanto cargas mais pesadas se estabilizam em 41 dB(A), semelhante ao que acontecia antes.
Barulho
| Ocioso |
| 24.1 / 24.3 / 28 dB |
| Carga |
| 41 / 40.9 dB |
 | ||
30 dB silencioso 40 dB(A) audível 50 dB(A) ruidosamente alto |
||
min: | ||
| Acer Swift Edge SFE16 Ryzen 7 7840U Radeon 780M, R7 7840U, SK hynix HFS512GEJ9X125N | Acer Swift Edge SFE16-42-R1GM Radeon 680M, R7 7735U, Micron 3400 1TB MTFDKBA1T0TFH | Lenovo Slim Pro 9i 16IRP8 GeForce RTX 4050 Laptop GPU, i9-13905H, Samsung PM9A1 MZVL21T0HCLR | Asus VivoBook Pro 16 GeForce RTX 3050 Ti Laptop GPU, i7-12700H, Intel SSD 670p SSDPEKNU010TZ | Samsung Galaxy Book3 Ultra 16 GeForce RTX 4050 Laptop GPU, i7-13700H, Samsung PM9A1 MZVL2512HCJQ | Huawei MateBook 16s i7 Iris Xe G7 96EUs, i7-12700H, Silicon Motion PCIe-8 SSD | |
|---|---|---|---|---|---|---|
| Noise | -7% | -1% | -15% | -3% | 4% | |
| desligado / ambiente * (dB) | 23.4 | 25.7 -10% | 22.7 3% | 25.2 -8% | 25 -7% | 24 -3% |
| Idle Minimum * (dB) | 24.1 | 25.7 -7% | 22.7 6% | 25.2 -5% | 26 -8% | 24 -0% |
| Idle Average * (dB) | 24.3 | 27 -11% | 22.7 7% | 25.2 -4% | 27 -11% | 25.2 -4% |
| Idle Maximum * (dB) | 28 | 29.3 -5% | 27.5 2% | 25.2 10% | 28 -0% | 27.2 3% |
| Load Average * (dB) | 41 | 42.3 -3% | 28.9 30% | 55.1 -34% | 40 2% | 34.8 15% |
| Witcher 3 ultra * (dB) | 40.9 | 52.6 -29% | 39 5% | 34.8 15% | ||
| Load Maximum * (dB) | 40.9 | 42.7 -4% | 52.5 -28% | 61.5 -50% | 41 -0% | 39 5% |
* ... menor é melhor
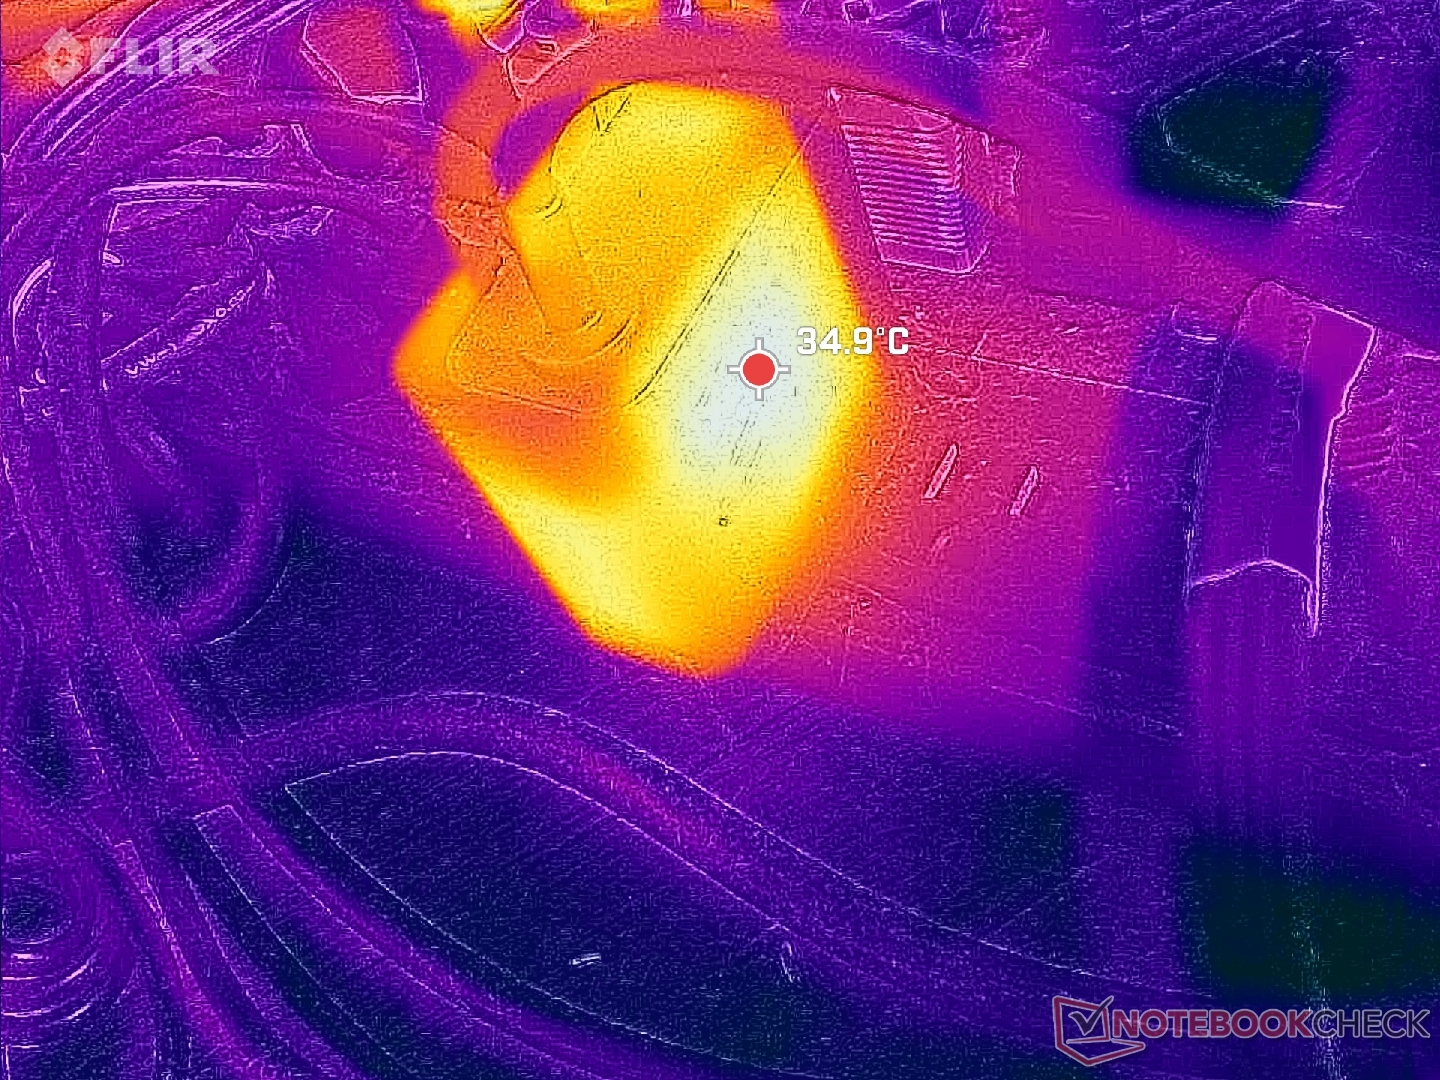
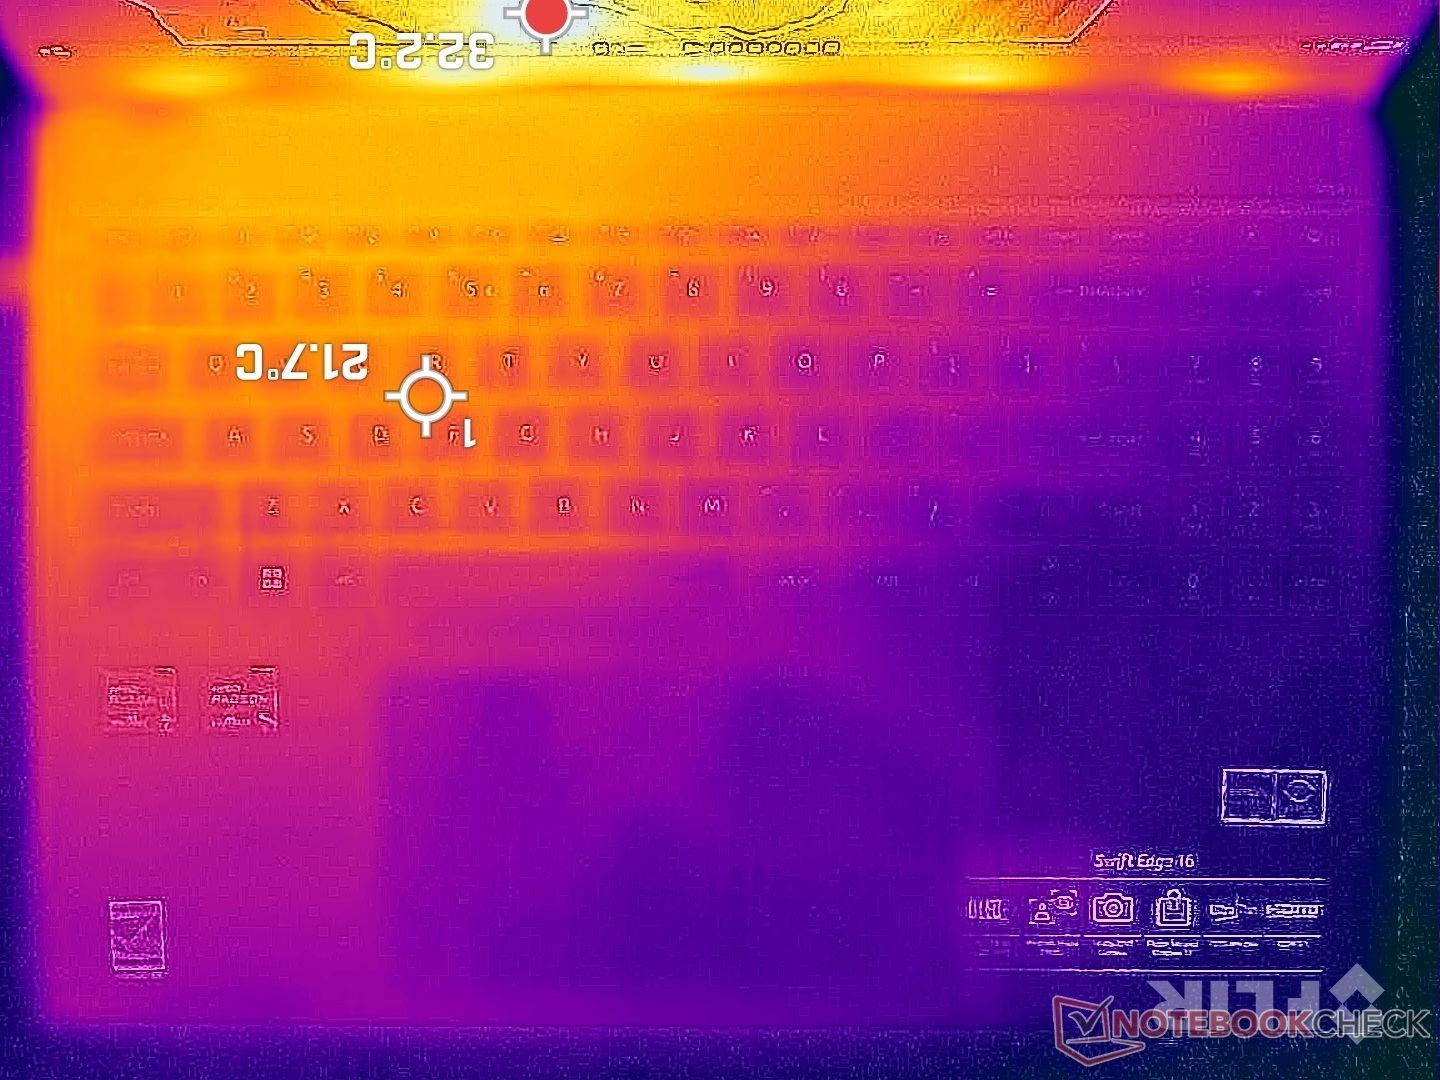
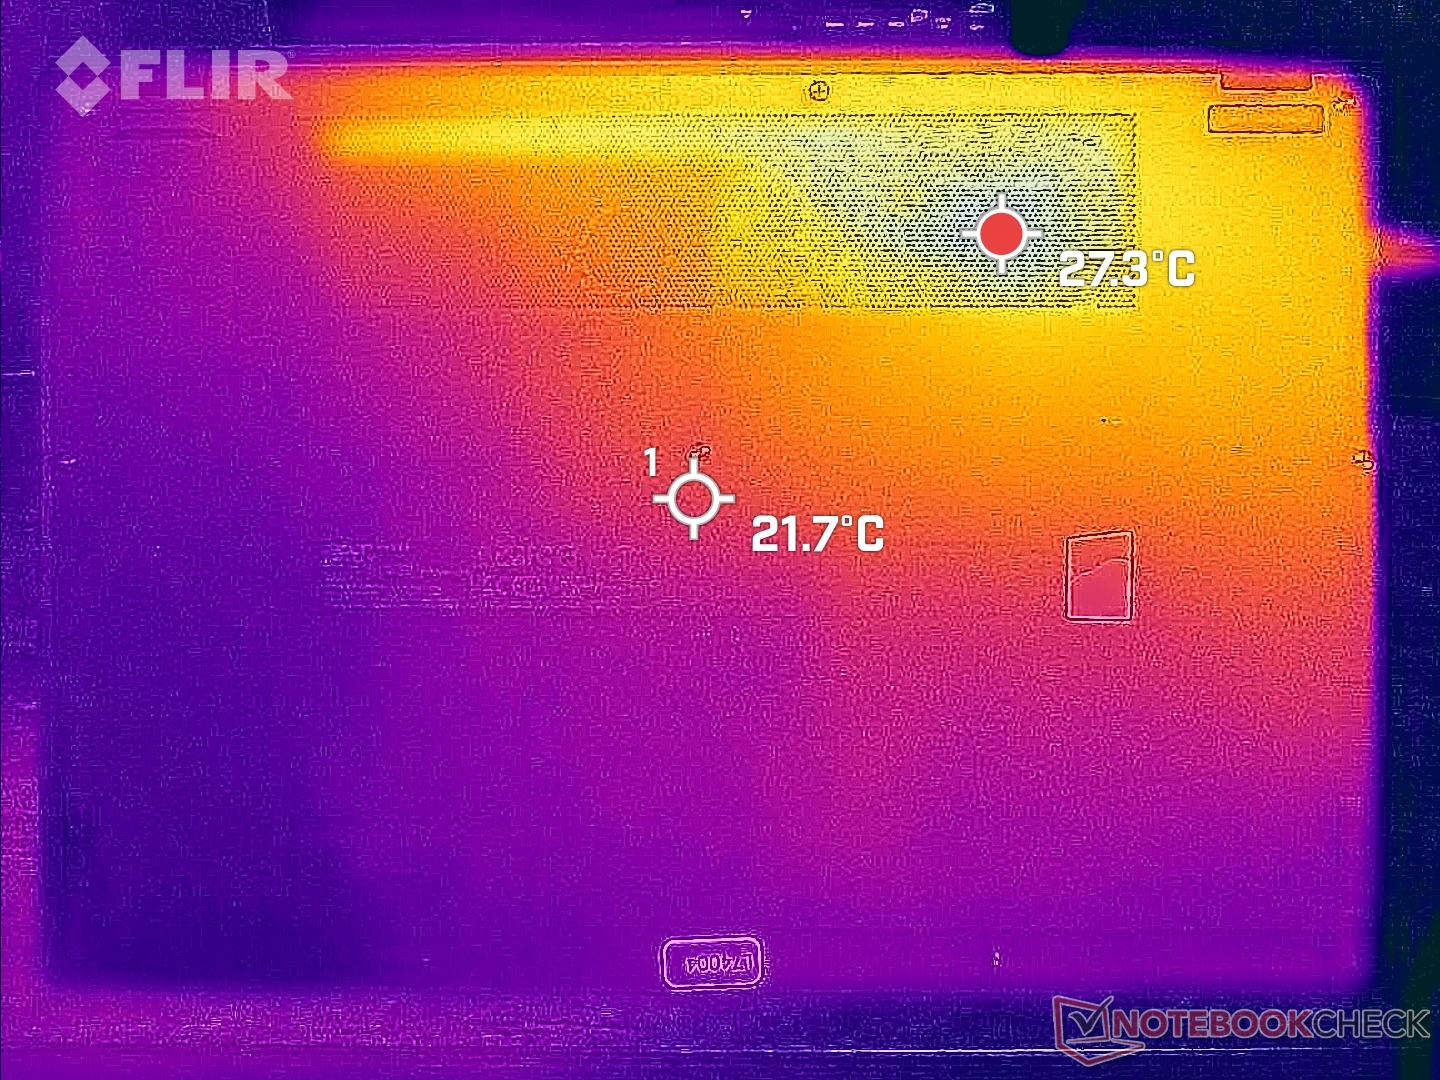
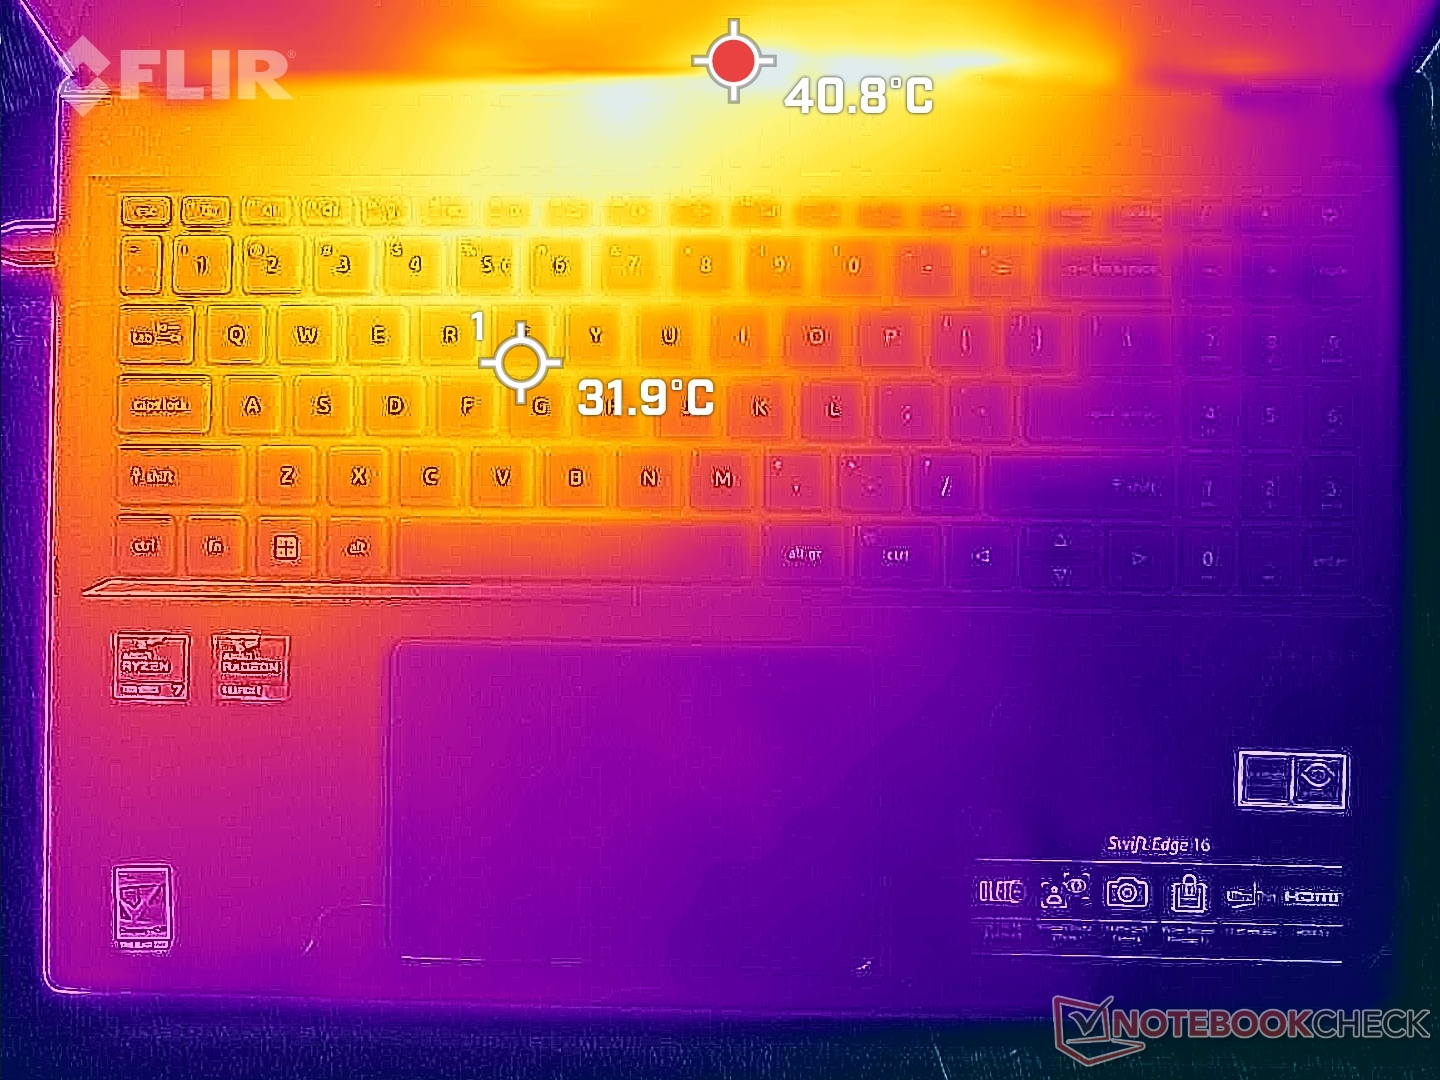
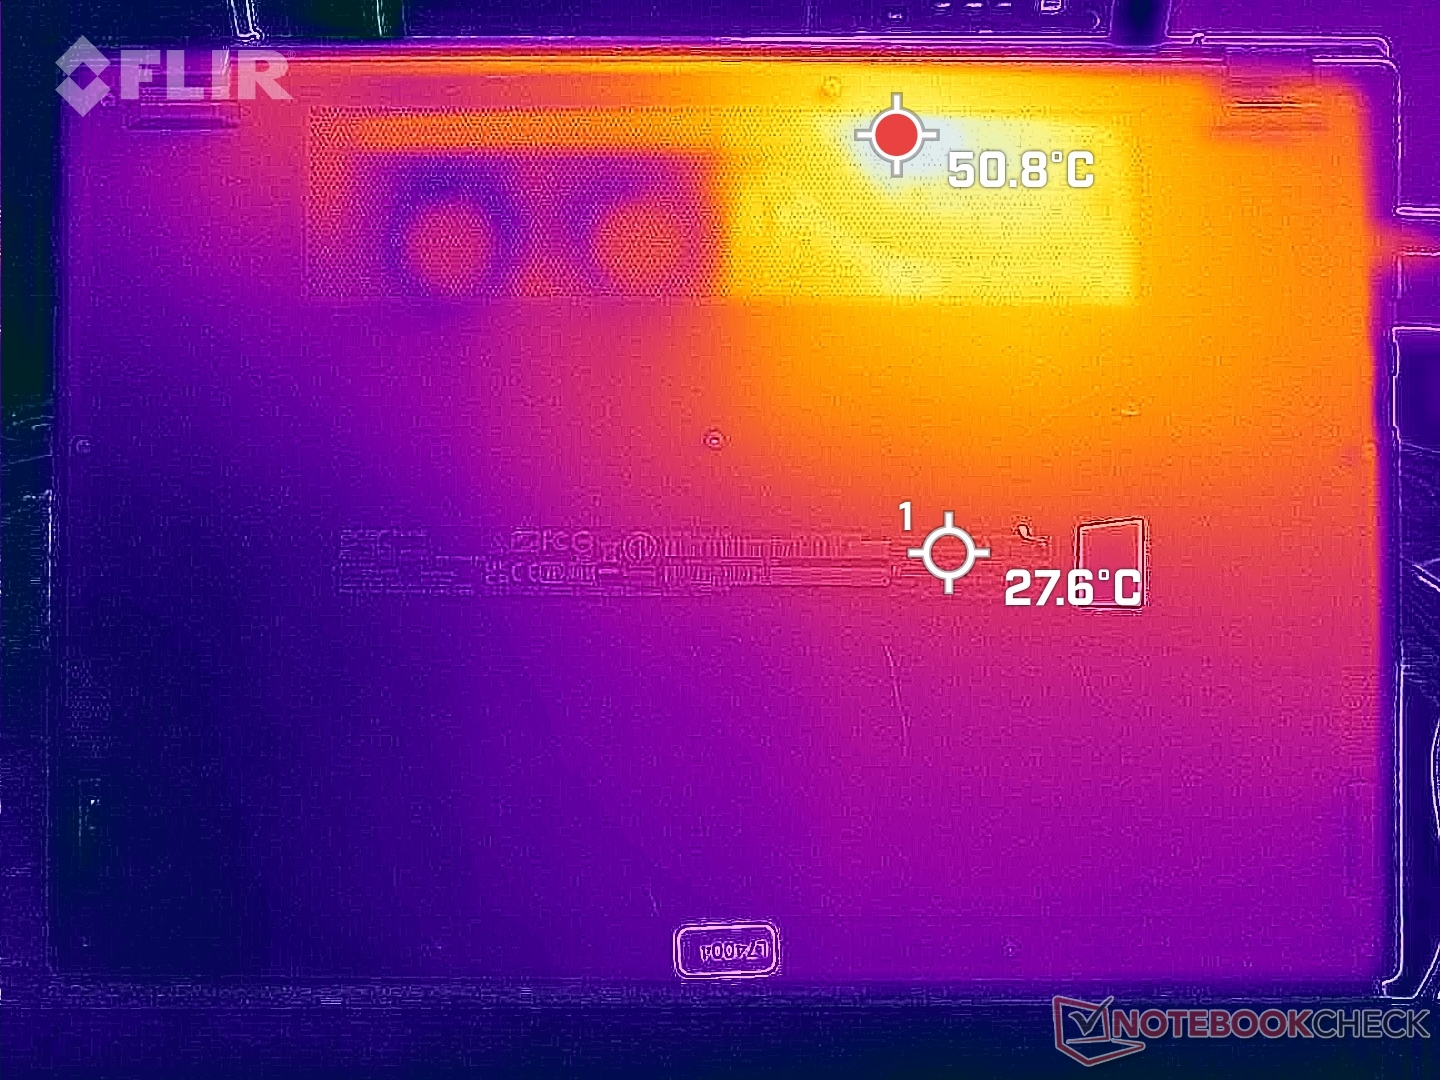
Temperatura
As temperaturas da superfície não são significativamente mais frias ou mais quentes do que as registradas na configuração do Configuração do Ryzen 7 7735U. Os pontos quentes na parte inferior ainda atingem mais de 50 °C perto das aberturas de ventilação, enquanto a superfície superior perto das dobradiças pode variar de 40 °C a 50 °C, dependendo do ângulo da tampa. É improvável que as mãos toquem essas áreas quentes por longos períodos ao jogar.
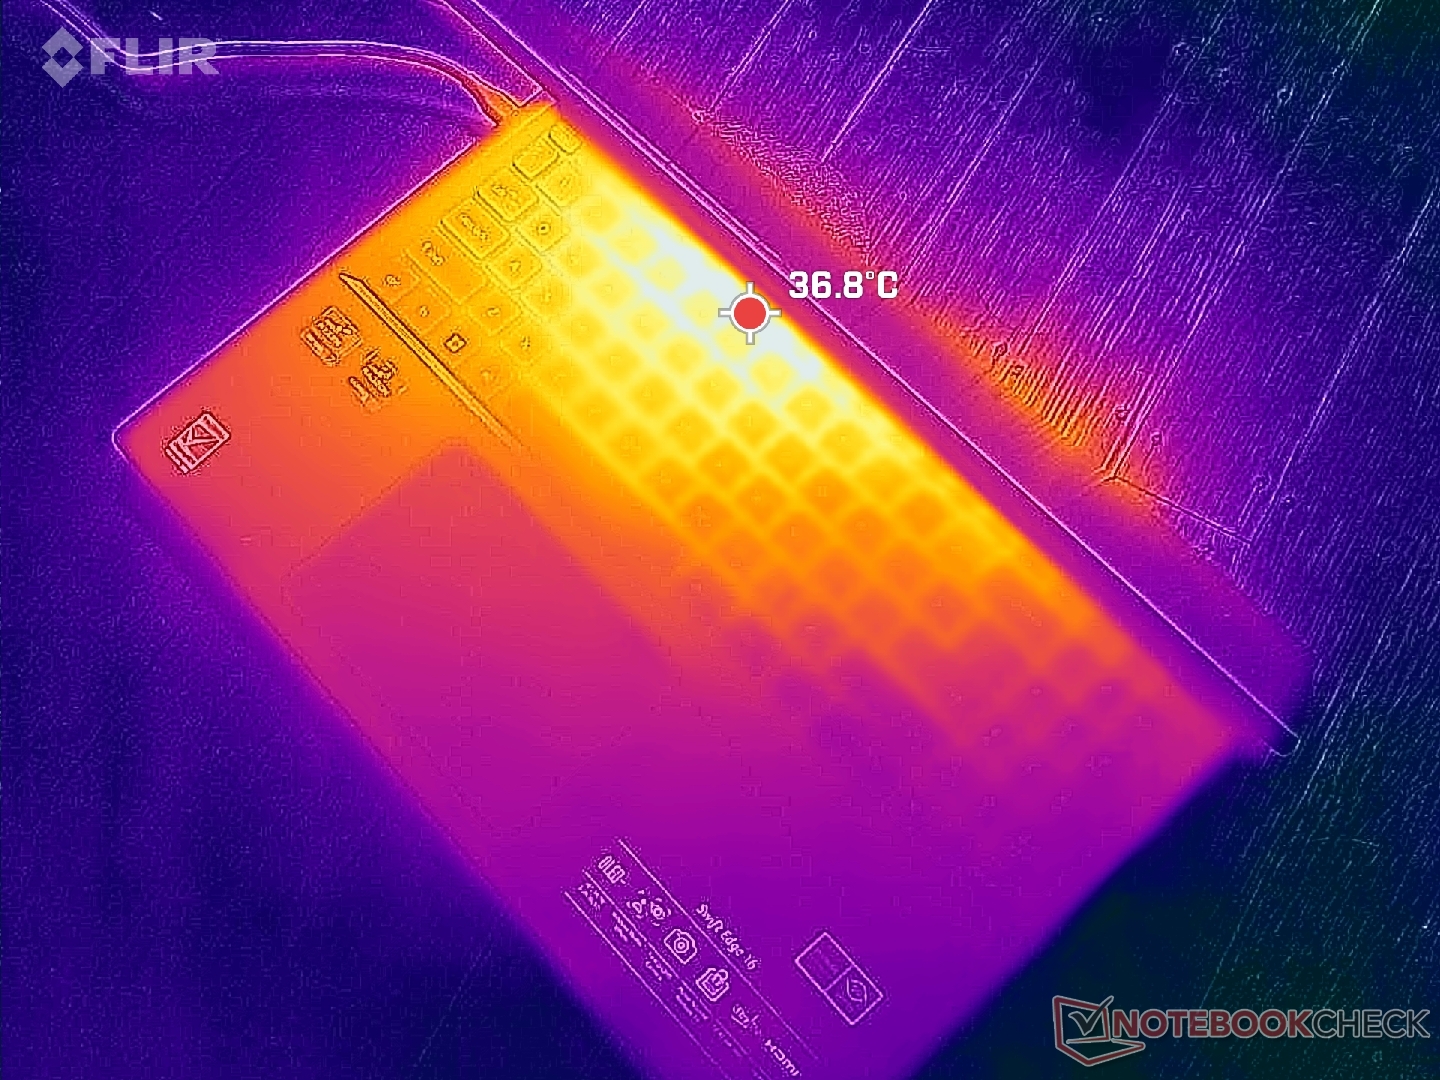
(±) A temperatura máxima no lado superior é 41.6 °C / 107 F, em comparação com a média de 34.3 °C / 94 F , variando de 21.2 a 62.5 °C para a classe Office.
(-) A parte inferior aquece até um máximo de 46.6 °C / 116 F, em comparação com a média de 36.8 °C / 98 F
(+) Em uso inativo, a temperatura média para o lado superior é 27 °C / 81 F, em comparação com a média do dispositivo de 29.5 °C / ### class_avg_f### F.
(+) Os apoios para as mãos e o touchpad são mais frios que a temperatura da pele, com um máximo de 26.6 °C / 79.9 F e, portanto, são frios ao toque.
(±) A temperatura média da área do apoio para as mãos de dispositivos semelhantes foi 27.5 °C / 81.5 F (+0.9 °C / 1.6 F).
| Acer Swift Edge SFE16 Ryzen 7 7840U AMD Ryzen 7 7840U, AMD Radeon 780M | Acer Swift Edge SFE16-42-R1GM AMD Ryzen 7 7735U, AMD Radeon 680M | Lenovo Slim Pro 9i 16IRP8 Intel Core i9-13905H, NVIDIA GeForce RTX 4050 Laptop GPU | Asus VivoBook Pro 16 Intel Core i7-12700H, NVIDIA GeForce RTX 3050 Ti Laptop GPU | Samsung Galaxy Book3 Ultra 16 Intel Core i7-13700H, NVIDIA GeForce RTX 4050 Laptop GPU | Huawei MateBook 16s i7 Intel Core i7-12700H, Intel Iris Xe Graphics G7 96EUs | |
|---|---|---|---|---|---|---|
| Heat | -7% | 3% | -13% | 12% | 1% | |
| Maximum Upper Side * (°C) | 41.6 | 49.4 -19% | 37.8 9% | 44.2 -6% | 41 1% | 40.9 2% |
| Maximum Bottom * (°C) | 46.6 | 44.7 4% | 44.8 4% | 53 -14% | 44 6% | 48.3 -4% |
| Idle Upper Side * (°C) | 30.4 | 34 -12% | 30.6 -1% | 32.1 -6% | 23 24% | 29.2 4% |
| Idle Bottom * (°C) | 31 | 31.6 -2% | 31 -0% | 38.4 -24% | 26 16% | 30.4 2% |
* ... menor é melhor
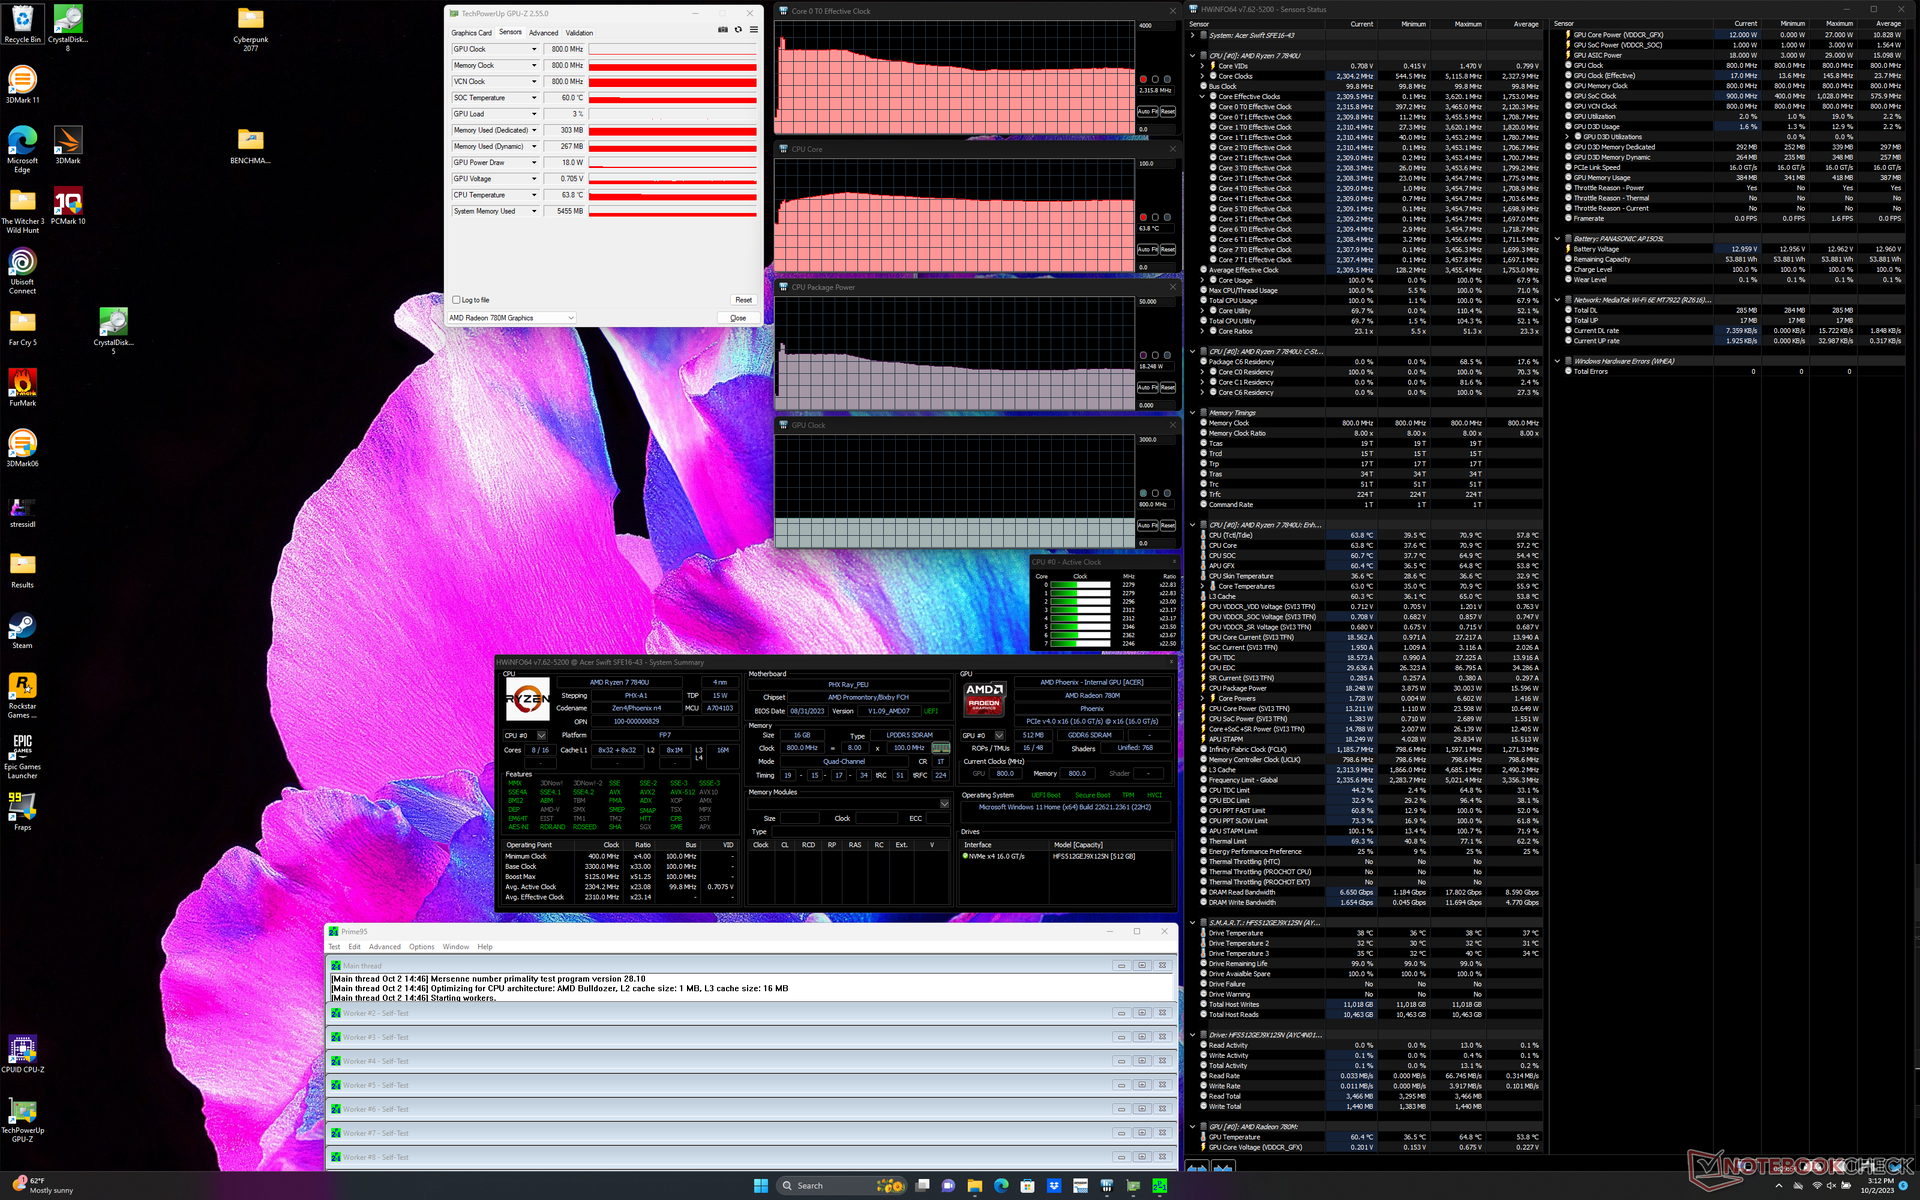
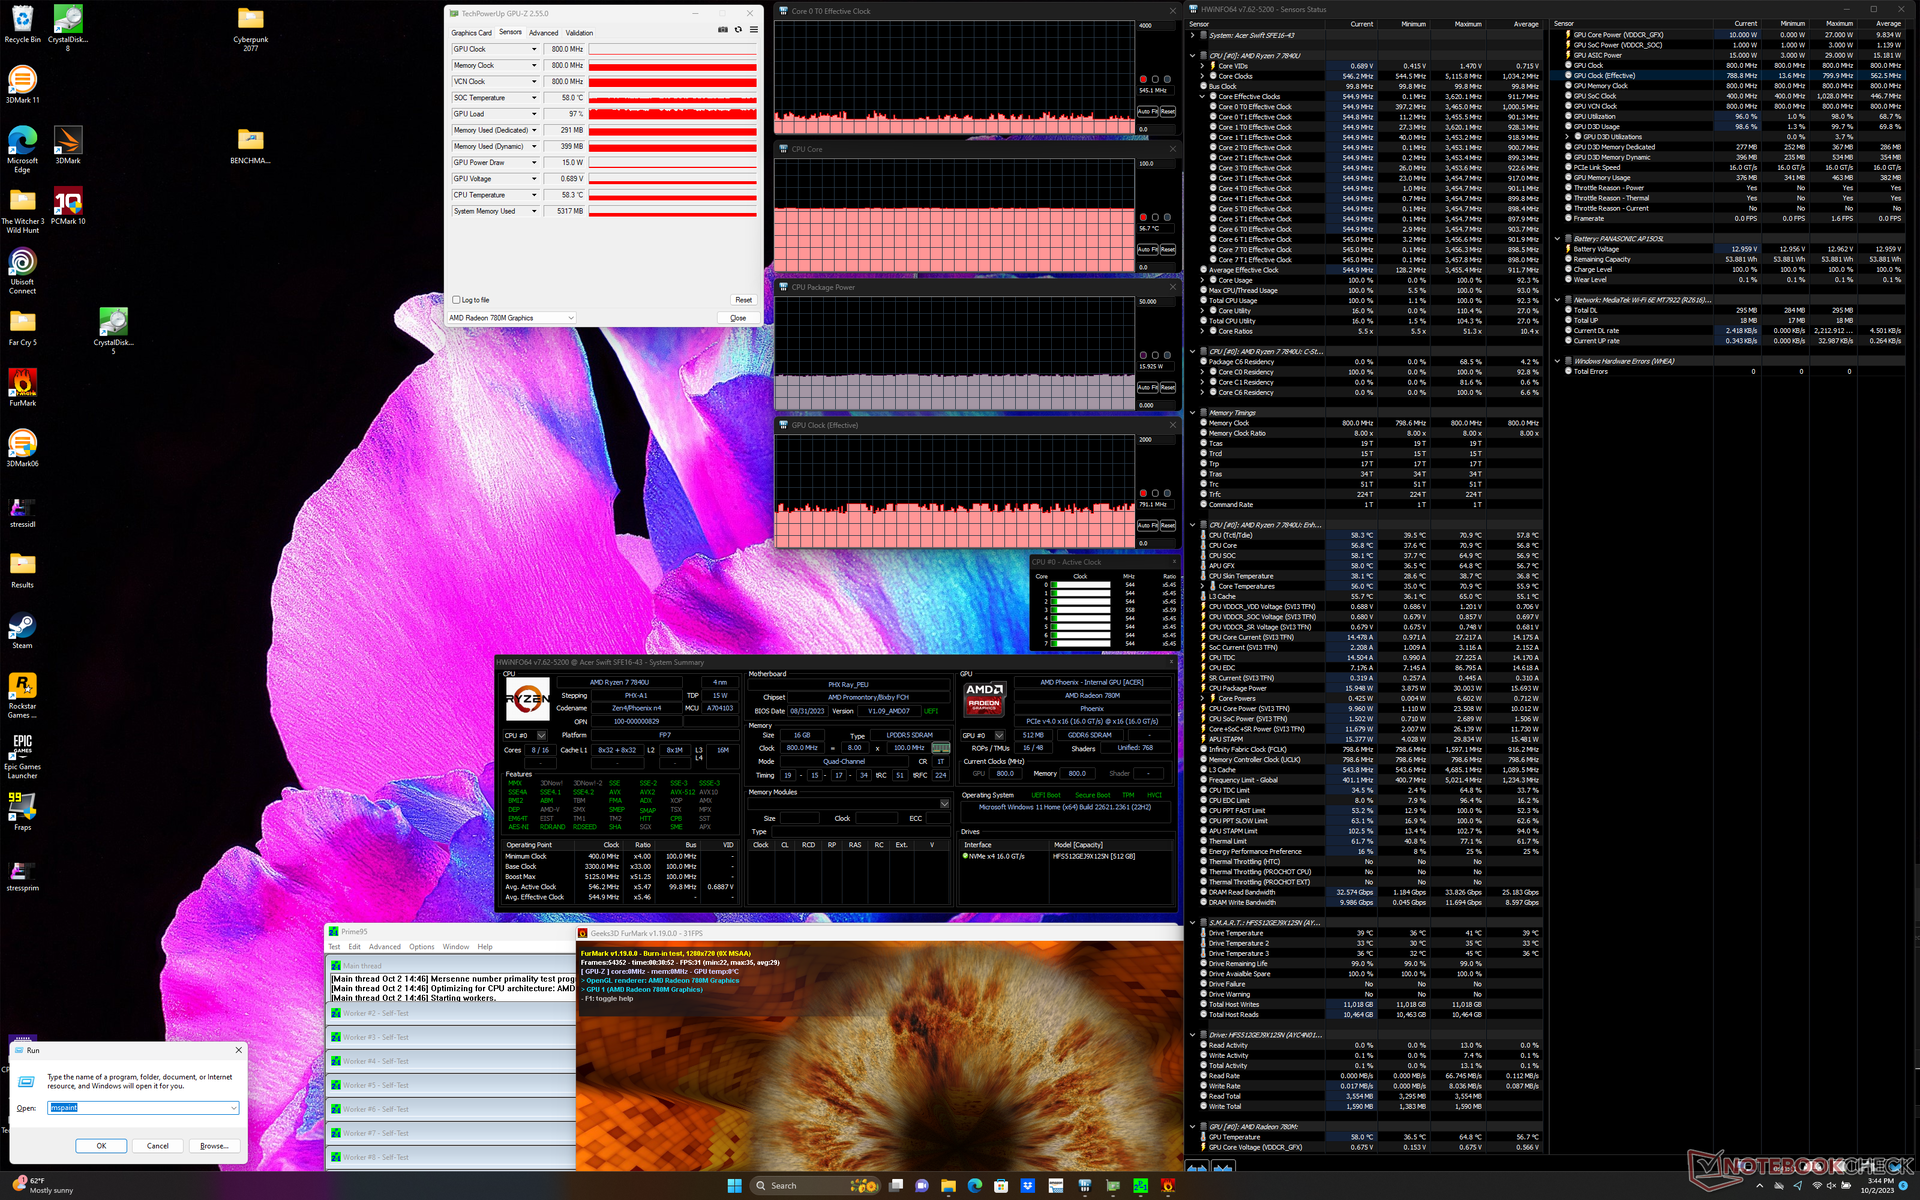
Teste de estresse
O potencial limitado do Turbo Core da Acer pode ser observado nos testes de estresse com benchmarks. As taxas de clock e o consumo de energia da placa ao iniciar o estresse do Prime95 aumentaram para 3,5 GHz e 30 W, respectivamente, antes de cair constantemente para apenas 2,3 GHz e 18 W no minuto seguinte. A temperatura do núcleo também se estabilizava em um valor relativamente baixo de 64 C. Repetindo esse teste no AMD Framework Laptop 13.5 com a mesma CPU resultaria em valores mais altos, com 3,2 GHz, 35 W e 85 C em comparação.
A temperatura do núcleo durante a execução Witcher 3 se estabilizaria em apenas 56 °C ou cerca de 15 °C mais fria do que na estrutura mencionada acima. Está claro que o sistema prioriza temperaturas de superfície mais baixas em relação ao desempenho mais alto.
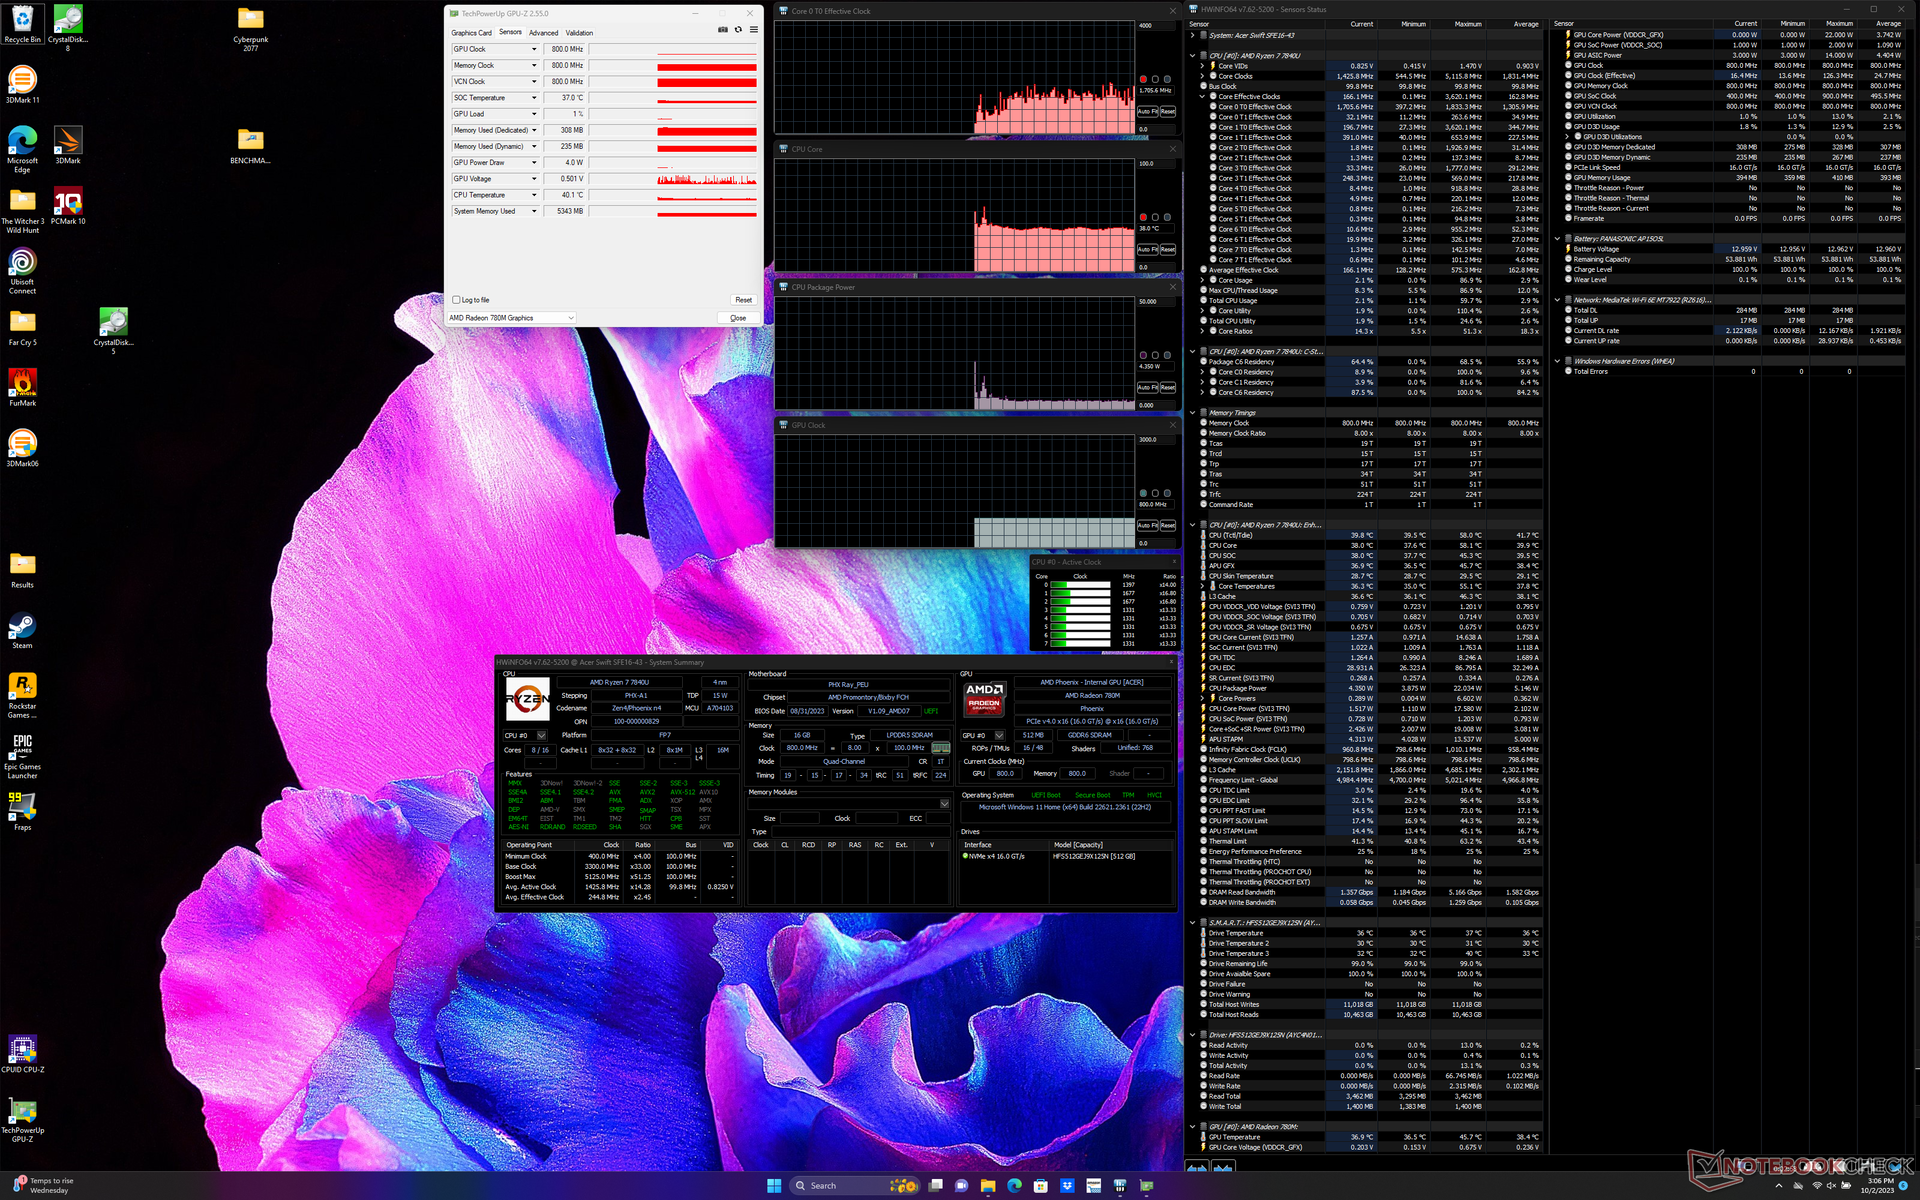
| Clock da CPU (GHz) | Clock da GPU (MHz) | Temperatura média da CPU (°C) | |
| Sistema ocioso | -- | -- | 38 |
| Estresse doPrime95 | 2.3 | -- | 64 |
| Estresse doPrime95 + FurMark | 0,5 | 791 | 57 |
| Witcher 3 Estresse | 0,3 | 1042 | 56 |
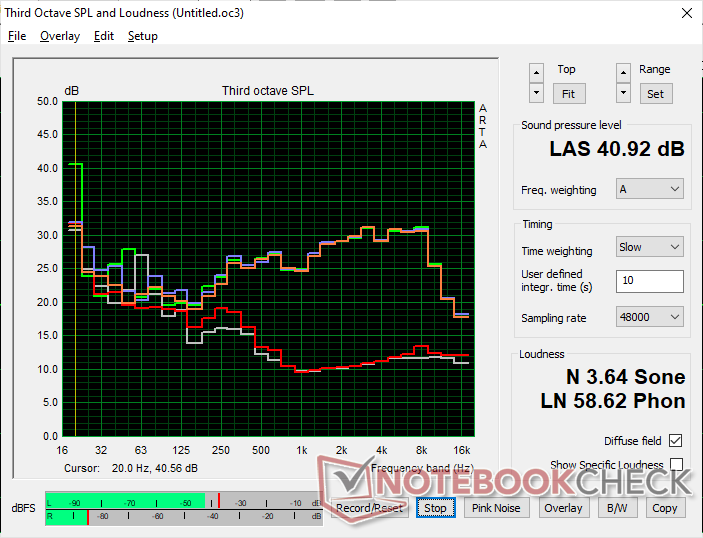
Alto-falantes
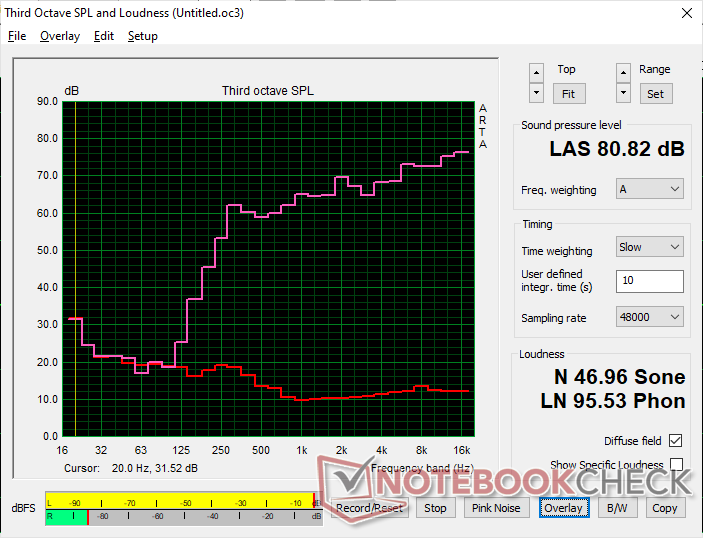
Acer Swift Edge SFE16 Ryzen 7 7840U análise de áudio
(±) | o volume do alto-falante é médio, mas bom (###valor### dB)
Graves 100 - 315Hz
(-) | quase nenhum baixo - em média 24.5% menor que a mediana
(±) | a linearidade dos graves é média (14.2% delta para a frequência anterior)
Médios 400 - 2.000 Hz
(+) | médios equilibrados - apenas 2.9% longe da mediana
(+) | médios são lineares (3.5% delta para frequência anterior)
Altos 2 - 16 kHz
(+) | agudos equilibrados - apenas 4.8% longe da mediana
(+) | os máximos são lineares (3.7% delta da frequência anterior)
Geral 100 - 16.000 Hz
(±) | a linearidade do som geral é média (19.8% diferença em relação à mediana)
Comparado com a mesma classe
» 41% de todos os dispositivos testados nesta classe foram melhores, 9% semelhantes, 50% piores
» O melhor teve um delta de 7%, a média foi 21%, o pior foi 53%
Comparado com todos os dispositivos testados
» 51% de todos os dispositivos testados foram melhores, 7% semelhantes, 42% piores
» O melhor teve um delta de 4%, a média foi 23%, o pior foi 134%
Apple MacBook Pro 16 2021 M1 Pro análise de áudio
(+) | os alto-falantes podem tocar relativamente alto (###valor### dB)
Graves 100 - 315Hz
(+) | bons graves - apenas 3.8% longe da mediana
(+) | o baixo é linear (5.2% delta para a frequência anterior)
Médios 400 - 2.000 Hz
(+) | médios equilibrados - apenas 1.3% longe da mediana
(+) | médios são lineares (2.1% delta para frequência anterior)
Altos 2 - 16 kHz
(+) | agudos equilibrados - apenas 1.9% longe da mediana
(+) | os máximos são lineares (2.7% delta da frequência anterior)
Geral 100 - 16.000 Hz
(+) | o som geral é linear (4.6% diferença em relação à mediana)
Comparado com a mesma classe
» 0% de todos os dispositivos testados nesta classe foram melhores, 0% semelhantes, 100% piores
» O melhor teve um delta de 5%, a média foi 17%, o pior foi 45%
Comparado com todos os dispositivos testados
» 0% de todos os dispositivos testados foram melhores, 0% semelhantes, 100% piores
» O melhor teve um delta de 4%, a média foi 23%, o pior foi 134%
Gerenciamento de energia
Consumo de energia
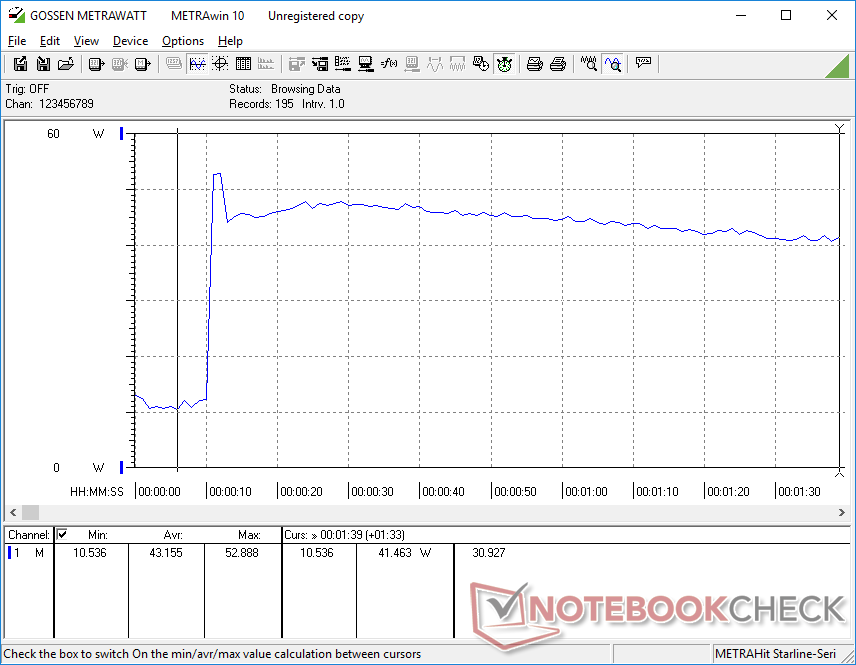
O consumo de energia em marcha lenta é mais alto do que na maioria dos outros notebooks com GPUs integradas devido à alta taxa de atualização de 120 Hz e ao painel OLED da nossa configuração Acer, que são conhecidos por consumir mais energia do que o IPS de 60 Hz comum. A exibição de uma imagem totalmente branca a 120 Hz consumiria até 19 W, em comparação com menos da metade no Framework Laptop 13.5.
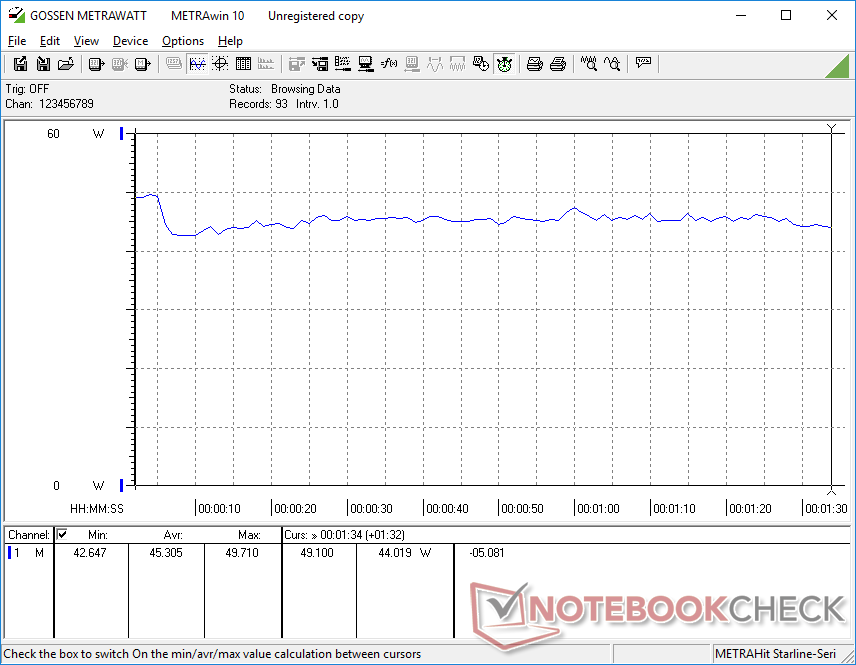
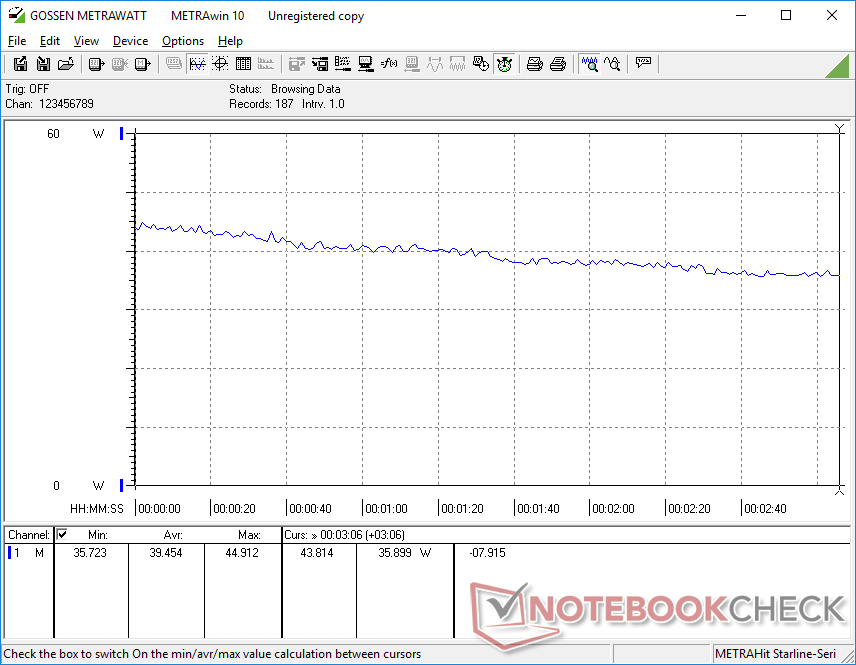
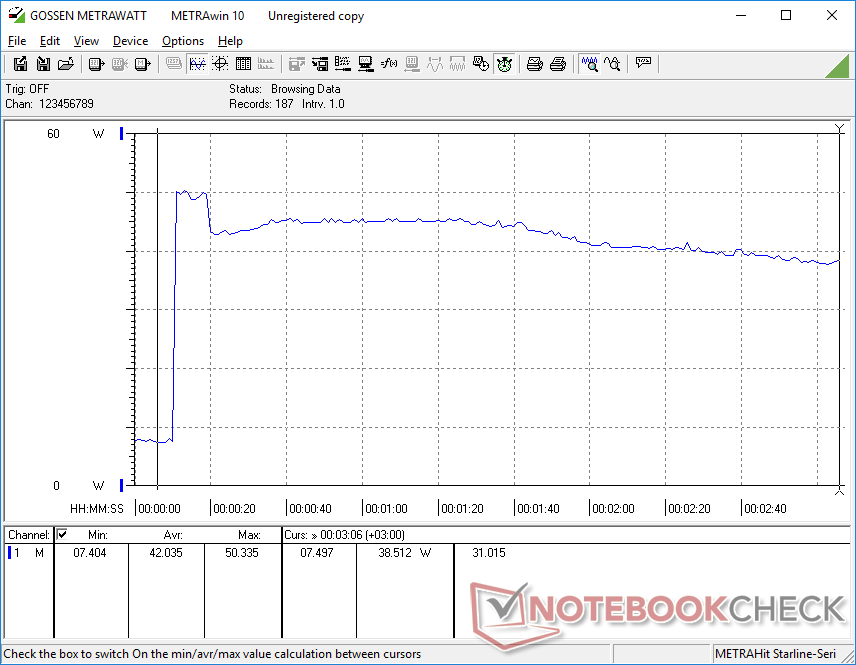
Por outro lado, o consumo de energia durante os jogos seria menor do que o esperado devido às tendências de estrangulamento do processador. O consumo começava alto durante o início do teste antes de cair constantemente ao longo do tempo, conforme mostrado em nossos gráficos abaixo, sugerindo a limitação do desempenho.
| desligado | |
| Ocioso | |
| Carga |
|
Key:
min: | |
| Acer Swift Edge SFE16 Ryzen 7 7840U R7 7840U, Radeon 780M, SK hynix HFS512GEJ9X125N, OLED, 3200x2000, 16" | Acer Swift Edge SFE16-42-R1GM R7 7735U, Radeon 680M, Micron 3400 1TB MTFDKBA1T0TFH, OLED, 3840x2400, 16" | Lenovo Slim Pro 9i 16IRP8 i9-13905H, GeForce RTX 4050 Laptop GPU, Samsung PM9A1 MZVL21T0HCLR, Mini-LED, 3200x2000, 16" | Asus VivoBook Pro 16 i7-12700H, GeForce RTX 3050 Ti Laptop GPU, Intel SSD 670p SSDPEKNU010TZ, IPS, 2560x1600, 16" | Samsung Galaxy Book3 Ultra 16 i7-13700H, GeForce RTX 4050 Laptop GPU, Samsung PM9A1 MZVL2512HCJQ, AMOLED, 2880x1800, 16" | Huawei MateBook 16s i7 i7-12700H, Iris Xe G7 96EUs, Silicon Motion PCIe-8 SSD, IPS, 2520x1680, 16" | |
|---|---|---|---|---|---|---|
| Power Consumption | 4% | -166% | -102% | -15% | -30% | |
| Idle Minimum * (Watt) | 7.1 | 8.6 -21% | 16 -125% | 8.7 -23% | 3 58% | 6.8 4% |
| Idle Average * (Watt) | 10.1 | 7.7 24% | 30 -197% | 13.1 -30% | 5 50% | 13.2 -31% |
| Idle Maximum * (Watt) | 18.6 | 9.3 50% | 30.4 -63% | 18.3 2% | 11 41% | 13.8 26% |
| Load Average * (Watt) | 45.3 | 47.9 -6% | 78.9 -74% | 116 -156% | 72 -59% | 75.2 -66% |
| Witcher 3 ultra * (Watt) | 39.5 | 46.3 -17% | 155.3 -293% | 117.6 -198% | 69.7 -76% | 56.1 -42% |
| Load Maximum * (Watt) | 52.9 | 56 -6% | 180.4 -241% | 162 -206% | 108 -104% | 90.6 -71% |
* ... menor é melhor
Power Consumption Witcher 3 / Stresstest
Power Consumption external Monitor
Duração da bateria
O tempo de execução da WLAN é menor do que o registrado em nossa unidade anterior em quase duas horas inteiras, mesmo quando ambos estão definidos com as mesmas configurações de perfil de energia e condições de navegador. A taxa de atualização de 120 Hz é provavelmente um fator que contribui para as diferenças na duração da bateria.
| Acer Swift Edge SFE16 Ryzen 7 7840U R7 7840U, Radeon 780M, 54 Wh | Acer Swift Edge SFE16-42-R1GM R7 7735U, Radeon 680M, 54 Wh | Lenovo Slim Pro 9i 16IRP8 i9-13905H, GeForce RTX 4050 Laptop GPU, 75 Wh | Asus VivoBook Pro 16 i7-12700H, GeForce RTX 3050 Ti Laptop GPU, 70 Wh | Samsung Galaxy Book3 Ultra 16 i7-13700H, GeForce RTX 4050 Laptop GPU, 76 Wh | Huawei MateBook 16s i7 i7-12700H, Iris Xe G7 96EUs, 84 Wh | |
|---|---|---|---|---|---|---|
| Duração da bateria | 30% | 18% | 30% | 71% | 45% | |
| WiFi v1.3 (h) | 5.6 | 7.3 30% | 6.6 18% | 7.3 30% | 9.6 71% | 8.1 45% |
| Reader / Idle (h) | 10.9 | 18.2 | ||||
| H.264 (h) | 8.6 | 13.4 | 9.3 | |||
| Load (h) | 1.5 | 1.8 | 1.9 |
Pro
Contra
Veredicto - Melhorias pequenas, mas notáveis
O Zen 3+ Swift Edge 16 já era um dos nossos notebooks de 16 polegadas favoritos e a configuração atualizada do Zen 4 apenas solidifica nossa posição. O nível de potência da CPU e, principalmente, da GPU disponível é alto, considerando o baixo peso e o perfil fino. Enquanto isso, a tela OLED 3.2K 120 Hz é uma das melhores que já vimos em qualquer laptop multimídia para processamento de texto, edição, navegação, vídeo e até mesmo jogos. Se você deseja maximizar o desempenho e a qualidade da tela e, ao mesmo tempo, minimizar o peso o máximo possível, o Swift Edge 16 realmente acerta o alvo.
O Ryzen 7 7840U oferece um aumento decente no desempenho em relação à já excelente configuração do Ryzen 7 7735U Swift Edge 16. Os usuários vão adorar o OLED de 120 Hz e o baixo peso, mas a duração média da bateria e a limitação do desempenho podem irritar os usuários avançados.
Os cortes surgem quando se olha além da CPU e da tela. Como o laptop é extremamente leve para o seu tamanho, alguns recursos tiveram que ser removidos ou reduzidos, como a solução de resfriamento menor, a capacidade menor da bateria e a falta do Gorilla Glass ou da tela sensível ao toque para manter o peso baixo. Como resultado, a CPU funciona um pouco mais lentamente do que o esperado, a duração da bateria é apenas mediana, o SSD fica acelerado sob estresse e a tela é mais suscetível a torções e oscilações do que gostaríamos. A expansão também é limitada, pois a RAM é soldada e só há suporte para um SSD interno.
Se você precisa absolutamente da potência das CPUs da série H e das GPUs GeForce RTX, talvez queira considerar o mais pesado Swift X 16, Asus VivoBook Pro 16ou oGalaxy Book3 Ultra 16 em vez disso. Os viajantes constantes terão mais motivos para gostar do Swift Edge 16, pois podem explorar mais regularmente o baixo peso do sistema sem sacrificar a qualidade da tela ou o desempenho excessivo.
Preço e disponibilidade
O Acer Swift Edge SFE16 analisado com o Ryzen 7 7840U está agora amplamente disponível na Best Buy por $1300 USD.
Acer Swift Edge SFE16 Ryzen 7 7840U
- 10/06/2023 v7 (old)
Allen Ngo
Transparência
A seleção dos dispositivos a serem analisados é feita pela nossa equipe editorial. A amostra de teste foi fornecida ao autor como empréstimo pelo fabricante ou varejista para fins desta revisão. O credor não teve influência nesta revisão, nem o fabricante recebeu uma cópia desta revisão antes da publicação. Não houve obrigação de publicar esta revisão. Como empresa de mídia independente, a Notebookcheck não está sujeita à autoridade de fabricantes, varejistas ou editores.
É assim que o Notebookcheck está testando
Todos os anos, o Notebookcheck analisa de forma independente centenas de laptops e smartphones usando procedimentos padronizados para garantir que todos os resultados sejam comparáveis. Desenvolvemos continuamente nossos métodos de teste há cerca de 20 anos e definimos padrões da indústria no processo. Em nossos laboratórios de teste, equipamentos de medição de alta qualidade são utilizados por técnicos e editores experientes. Esses testes envolvem um processo de validação em vários estágios. Nosso complexo sistema de classificação é baseado em centenas de medições e benchmarks bem fundamentados, o que mantém a objetividade.Price comparison

