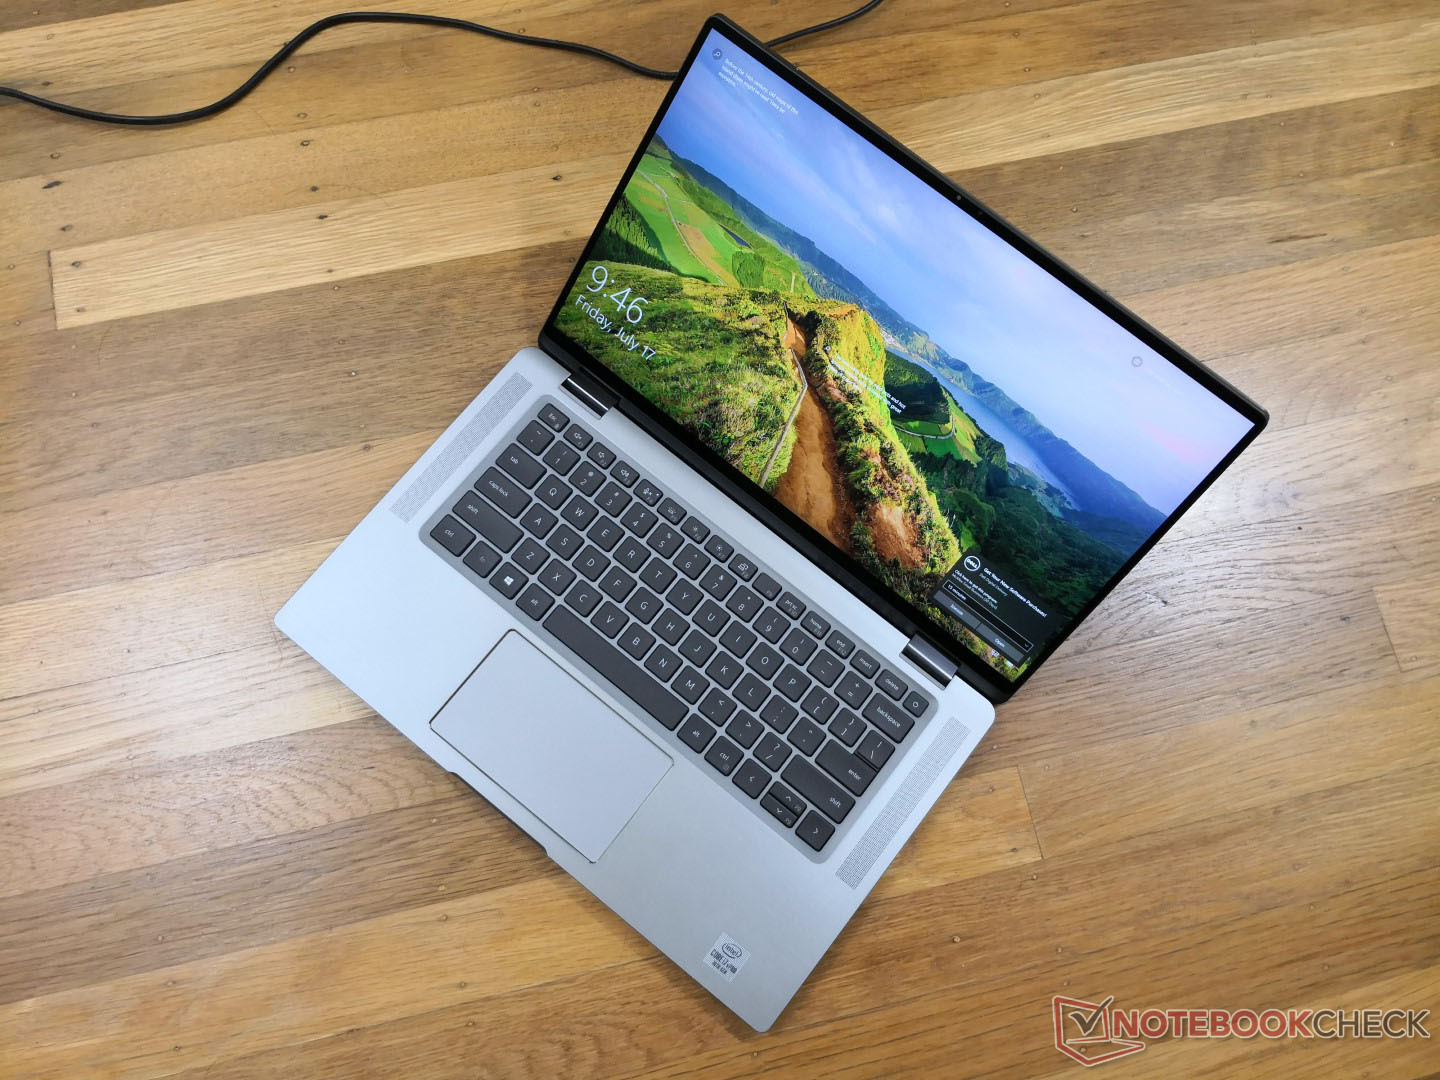
Breve Análise do 2-em-1 Dell Latitude 9510: Um conversível 5G de 15 polegadas que não é enorme nem pesado
Avaliação | Data | Modelo | Peso | Altura | Size | Resolução | Preço |
|---|---|---|---|---|---|---|---|
| 88.6 % v7 (old) | 07/2020 | Dell Latitude 9510 2-in-1 i7-10810U, UHD Graphics 620 | 1.7 kg | 13.99 mm | 15.00" | 1920x1080 | |
| 87.2 % v7 (old) | 07/2020 | Lenovo ThinkPad T15 Gen1-20S7S02U00 i7-10510U, GeForce MX330 | 1.8 kg | 19.95 mm | 15.60" | 3840x2160 | |
| 81.8 % v7 (old) | 02/2020 | Lenovo ThinkBook 15 i5-10210U, UHD Graphics 620 | 1.9 kg | 18.9 mm | 15.60" | 1920x1080 | |
| 82.9 % v7 (old) | Dynabook Tecra X50-F i7-8665U, UHD Graphics 620 | 1.4 kg | 17.6 mm | 15.60" | 1920x1080 | ||
| 80.4 % v7 (old) | 06/2020 | HP Envy x360 15-dr1679cl i7-10510U, UHD Graphics 620 | 2.1 kg | 17.2 mm | 15.60" | 1920x1080 | |
| 84.2 % v6 (old) | 08/2018 | Dell Latitude 5591 i7-8850H, GeForce MX130 | 2.3 kg | 24.3 mm | 15.60" | 1920x1080 |
| SD Card Reader | |
| average JPG Copy Test (av. of 3 runs) | |
| Dell Latitude 5591 (Toshiba Exceria Pro SDXC 64 GB UHS-II) | |
| Dell Latitude 9510 2-in-1 (Toshiba Exceria Pro M501 64 GB UHS-II) | |
| Lenovo ThinkPad T15 Gen1-20S7S02U00 (Toshiba Exceria Pro M501 64 GB UHS-II) | |
| HP Envy x360 15-dr1679cl (Toshiba Exceria Pro SDXC 64 GB UHS-II) | |
| Lenovo ThinkBook 15 (Toshiba Exceria Pro SDXC 64 GB UHS-II) | |
| Dynabook Tecra X50-F | |
| maximum AS SSD Seq Read Test (1GB) | |
| Dell Latitude 5591 (Toshiba Exceria Pro SDXC 64 GB UHS-II) | |
| Dell Latitude 9510 2-in-1 (Toshiba Exceria Pro M501 64 GB UHS-II) | |
| Lenovo ThinkPad T15 Gen1-20S7S02U00 (Toshiba Exceria Pro M501 64 GB UHS-II) | |
| Lenovo ThinkBook 15 (Toshiba Exceria Pro SDXC 64 GB UHS-II) | |
| HP Envy x360 15-dr1679cl (Toshiba Exceria Pro SDXC 64 GB UHS-II) | |
| Dynabook Tecra X50-F | |
| Networking | |
| iperf3 transmit AX12 | |
| HP Envy x360 15-dr1679cl | |
| Dell Latitude 9510 2-in-1 | |
| Lenovo ThinkPad T15 Gen1-20S7S02U00 | |
| Honor MagicBook 15 | |
| iperf3 receive AX12 | |
| Lenovo ThinkPad T15 Gen1-20S7S02U00 | |
| Dell Latitude 9510 2-in-1 | |
| HP Envy x360 15-dr1679cl | |
| Honor MagicBook 15 | |


| |||||||||||||||||||||||||
iluminação: 87 %
iluminação com acumulador: 426.7 cd/m²
Contraste: 1422:1 (Preto: 0.3 cd/m²)
ΔE ColorChecker Calman: 4.28 | ∀{0.5-29.43 Ø4.71}
calibrated: 1.46
ΔE Greyscale Calman: 8.1 | ∀{0.09-98 Ø4.96}
99.2% sRGB (Argyll 1.6.3 3D)
65.2% AdobeRGB 1998 (Argyll 1.6.3 3D)
71.3% AdobeRGB 1998 (Argyll 3D)
99.3% sRGB (Argyll 3D)
71.2% Display P3 (Argyll 3D)
Gamma: 2.26
CCT: 7993 K
| Dell Latitude 9510 2-in-1 AU Optronics B150HAN, IPS, 15", 1920x1080 | Lenovo ThinkPad T15 Gen1-20S7S02U00 NE156QUM-N66, IPS LED, 15.6", 3840x2160 | Lenovo ThinkBook 15 LP156WFC-SPD1, IPS, 15.6", 1920x1080 | Dynabook Tecra X50-F Toshiba TOS508F, IPS, 15.6", 1920x1080 | HP Envy x360 15-dr1679cl AU Optronics B156HW02, IPS, 15.6", 1920x1080 | Dell Latitude 5591 AU Optronics B156HW03, IPS, 15.6", 1920x1080 | |
|---|---|---|---|---|---|---|
| Display | 15% | -44% | -47% | -43% | -44% | |
| Display P3 Coverage (%) | 71.2 | 80.7 13% | 38.38 -46% | 36.68 -48% | 39.28 -45% | 38.74 -46% |
| sRGB Coverage (%) | 99.3 | 98.1 -1% | 57.7 -42% | 55 -45% | 58.8 -41% | 58.1 -41% |
| AdobeRGB 1998 Coverage (%) | 71.3 | 95.5 34% | 39.67 -44% | 37.92 -47% | 40.58 -43% | 40.03 -44% |
| Response Times | 26% | 21% | 24% | 26% | 17% | |
| Response Time Grey 50% / Grey 80% * (ms) | 52.8 ? | 42 ? 20% | 37.6 ? 29% | 38 ? 28% | 39.6 ? 25% | 45.2 ? 14% |
| Response Time Black / White * (ms) | 32 ? | 21.6 ? 32% | 28 ? 12% | 25.6 ? 20% | 23.6 ? 26% | 26 ? 19% |
| PWM Frequency (Hz) | ||||||
| Screen | 21% | -40% | -54% | -39% | -38% | |
| Brightness middle (cd/m²) | 426.7 | 489 15% | 245 -43% | 295.9 -31% | 261.2 -39% | 245.4 -42% |
| Brightness (cd/m²) | 394 | 501 27% | 239 -39% | 270 -31% | 248 -37% | 234 -41% |
| Brightness Distribution (%) | 87 | 91 5% | 82 -6% | 86 -1% | 92 6% | 88 1% |
| Black Level * (cd/m²) | 0.3 | 0.35 -17% | 0.25 17% | 0.3 -0% | 0.38 -27% | 0.26 13% |
| Contrast (:1) | 1422 | 1397 -2% | 980 -31% | 986 -31% | 687 -52% | 944 -34% |
| Colorchecker dE 2000 * | 4.28 | 3 30% | 5.6 -31% | 6.55 -53% | 5.4 -26% | 5.36 -25% |
| Colorchecker dE 2000 max. * | 10.43 | 5.1 51% | 15.6 -50% | 21.52 -106% | 16.31 -56% | 19.31 -85% |
| Colorchecker dE 2000 calibrated * | 1.46 | 0.8 45% | 4.8 -229% | 5.73 -292% | 3.81 -161% | 4.06 -178% |
| Greyscale dE 2000 * | 8.1 | 4 51% | 3.4 58% | 4.3 47% | 4.1 49% | 3.5 57% |
| Gamma | 2.26 97% | 2.24 98% | 2.3 96% | 2.475 89% | 2.53 87% | 2.53 87% |
| CCT | 7993 81% | 7400 88% | 7156 91% | 7002 93% | 6611 98% | 6430 101% |
| Color Space (Percent of AdobeRGB 1998) (%) | 65.2 | 84.7 30% | 36.5 -44% | 35 -46% | 37.4 -43% | 40 -39% |
| Color Space (Percent of sRGB) (%) | 99.2 | 98.1 -1% | 57.5 -42% | 54 -46% | 58.7 -41% | 58.1 -41% |
| Média Total (Programa/Configurações) | 21% /
21% | -21% /
-33% | -26% /
-43% | -19% /
-32% | -22% /
-32% |
* ... menor é melhor
Exibir tempos de resposta
| ↔ Tempo de resposta preto para branco | ||
|---|---|---|
| 32 ms ... ascensão ↗ e queda ↘ combinadas | ↗ 16.4 ms ascensão | 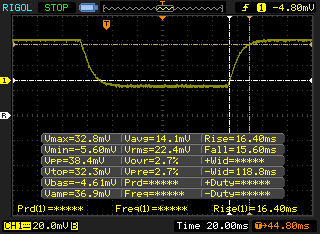 |
| ↘ 15.6 ms queda | ||
| A tela mostra taxas de resposta lentas em nossos testes e será insatisfatória para os jogadores. Em comparação, todos os dispositivos testados variam de 0.1 (mínimo) a 240 (máximo) ms. » 86 % de todos os dispositivos são melhores. Isso significa que o tempo de resposta medido é pior que a média de todos os dispositivos testados (19.8 ms). | ||
| ↔ Tempo de resposta 50% cinza a 80% cinza | ||
| 52.8 ms ... ascensão ↗ e queda ↘ combinadas | ↗ 25.2 ms ascensão | 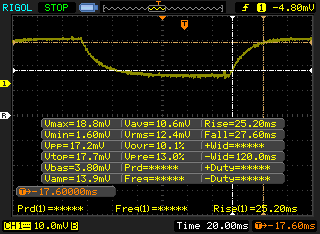 |
| ↘ 27.6 ms queda | ||
| A tela mostra taxas de resposta lentas em nossos testes e será insatisfatória para os jogadores. Em comparação, todos os dispositivos testados variam de 0.165 (mínimo) a 636 (máximo) ms. » 89 % de todos os dispositivos são melhores. Isso significa que o tempo de resposta medido é pior que a média de todos os dispositivos testados (31 ms). | ||
Cintilação da tela / PWM (modulação por largura de pulso)
| Tela tremeluzindo / PWM não detectado | 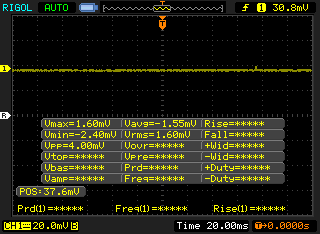 | ||
[pwm_comparison] Em comparação: 52 % de todos os dispositivos testados não usam PWM para escurecer a tela. Se PWM foi detectado, uma média de 7754 (mínimo: 5 - máximo: 343500) Hz foi medida. | |||
Cinebench R15: CPU Multi 64Bit | CPU Single 64Bit
Blender: v2.79 BMW27 CPU
7-Zip 18.03: 7z b 4 -mmt1 | 7z b 4
Geekbench 5.5: Single-Core | Multi-Core
HWBOT x265 Benchmark v2.2: 4k Preset
LibreOffice : 20 Documents To PDF
R Benchmark 2.5: Overall mean
| Cinebench R20 / CPU (Multi Core) | |
| HP ProBook 455 G7-175W8EA | |
| Razer Blade 15 RZ09-0328 | |
| Dell XPS 13 7390 Core i7-10710U | |
| Dell Latitude 9510 2-in-1 | |
| Dell XPS 15 9500 Core i5 | |
| Lenovo ThinkPad T15 Gen1-20S7S02U00 | |
| Microsoft Surface Book 3 15 | |
| Honor MagicBook 15 | |
| HP EliteBook 735 G6 7KN29EA | |
| Acer Aspire 5 A515-54G | |
| Dynabook Portege A30-E-174 | |
| Lenovo ThinkPad E590-20NB0012GE | |
| Cinebench R20 / CPU (Single Core) | |
| Lenovo ThinkPad T15 Gen1-20S7S02U00 | |
| Razer Blade 15 RZ09-0328 | |
| HP ProBook 455 G7-175W8EA | |
| Dell XPS 13 7390 Core i7-10710U | |
| Microsoft Surface Book 3 15 | |
| Dell XPS 15 9500 Core i5 | |
| Lenovo ThinkPad E590-20NB0012GE | |
| Acer Aspire 5 A515-54G | |
| Dell Latitude 9510 2-in-1 | |
| Dynabook Portege A30-E-174 | |
| Honor MagicBook 15 | |
| HP EliteBook 735 G6 7KN29EA | |
| Cinebench R15 / CPU Multi 64Bit | |
| Razer Blade 15 RZ09-0328 | |
| Dell Latitude 9510 2-in-1 | |
| Dell XPS 13 7390 Core i7-10710U | |
| HP ProBook 455 G7-175W8EA | |
| Dell XPS 15 9500 Core i5 | |
| Lenovo ThinkPad T15 Gen1-20S7S02U00 | |
| Honor MagicBook 15 | |
| HP EliteBook 735 G6 7KN29EA | |
| Microsoft Surface Book 3 15 | |
| Acer Aspire 5 A515-54G | |
| Lenovo ThinkPad E590-20NB0012GE | |
| Dynabook Portege A30-E-174 | |
| Cinebench R15 / CPU Single 64Bit | |
| Razer Blade 15 RZ09-0328 | |
| Lenovo ThinkPad T15 Gen1-20S7S02U00 | |
| Dell XPS 15 9500 Core i5 | |
| Lenovo ThinkPad E590-20NB0012GE | |
| HP ProBook 455 G7-175W8EA | |
| Microsoft Surface Book 3 15 | |
| Dell XPS 13 7390 Core i7-10710U | |
| Acer Aspire 5 A515-54G | |
| Dell Latitude 9510 2-in-1 | |
| Dynabook Portege A30-E-174 | |
| Honor MagicBook 15 | |
| HP EliteBook 735 G6 7KN29EA | |
| LibreOffice / 20 Documents To PDF | |
| HP EliteBook 735 G6 7KN29EA | |
| HP ProBook 455 G7-175W8EA | |
| Honor MagicBook 15 | |
| Dell Latitude 9510 2-in-1 | |
| Microsoft Surface Book 3 15 | |
| Dell XPS 15 9500 Core i5 | |
| Acer Aspire 5 A515-54G | |
| Lenovo ThinkPad T15 Gen1-20S7S02U00 | |
| Razer Blade 15 RZ09-0328 | |
| R Benchmark 2.5 / Overall mean | |
| HP EliteBook 735 G6 7KN29EA | |
| Honor MagicBook 15 | |
| Dell Latitude 9510 2-in-1 | |
| Acer Aspire 5 A515-54G | |
| Microsoft Surface Book 3 15 | |
| HP ProBook 455 G7-175W8EA | |
| Lenovo ThinkPad T15 Gen1-20S7S02U00 | |
| Dell XPS 15 9500 Core i5 | |
Cinebench R15: CPU Multi 64Bit | CPU Single 64Bit
Blender: v2.79 BMW27 CPU
7-Zip 18.03: 7z b 4 -mmt1 | 7z b 4
Geekbench 5.5: Single-Core | Multi-Core
HWBOT x265 Benchmark v2.2: 4k Preset
LibreOffice : 20 Documents To PDF
R Benchmark 2.5: Overall mean
* ... menor é melhor
| PCMark 10 | |
| Score | |
| HP Envy x360 15-dr1679cl | |
| Dell Latitude 9510 2-in-1 | |
| Lenovo ThinkBook 15 | |
| Dell Latitude 5591 | |
| Lenovo ThinkPad T15 Gen1-20S7S02U00 | |
| Dynabook Tecra X50-F | |
| Essentials | |
| Dell Latitude 9510 2-in-1 | |
| HP Envy x360 15-dr1679cl | |
| Lenovo ThinkBook 15 | |
| Dell Latitude 5591 | |
| Dynabook Tecra X50-F | |
| Lenovo ThinkPad T15 Gen1-20S7S02U00 | |
| Productivity | |
| Dell Latitude 9510 2-in-1 | |
| HP Envy x360 15-dr1679cl | |
| Lenovo ThinkBook 15 | |
| Dynabook Tecra X50-F | |
| Dell Latitude 5591 | |
| Lenovo ThinkPad T15 Gen1-20S7S02U00 | |
| Digital Content Creation | |
| Dell Latitude 5591 | |
| Lenovo ThinkBook 15 | |
| HP Envy x360 15-dr1679cl | |
| Dell Latitude 9510 2-in-1 | |
| Lenovo ThinkPad T15 Gen1-20S7S02U00 | |
| Dynabook Tecra X50-F | |
| PCMark 8 | |
| Home Score Accelerated v2 | |
| Lenovo ThinkBook 15 | |
| Dell Latitude 5591 | |
| Dell Latitude 9510 2-in-1 | |
| HP Envy x360 15-dr1679cl | |
| Lenovo ThinkPad T15 Gen1-20S7S02U00 | |
| Work Score Accelerated v2 | |
| Dell Latitude 5591 | |
| HP Envy x360 15-dr1679cl | |
| Dell Latitude 9510 2-in-1 | |
| Lenovo ThinkBook 15 | |
| Lenovo ThinkPad T15 Gen1-20S7S02U00 | |
| PCMark 8 Home Score Accelerated v2 | 3969 pontos | |
| PCMark 8 Work Score Accelerated v2 | 5149 pontos | |
| PCMark 10 Score | 4335 pontos | |
Ajuda | ||
| DPC Latencies / LatencyMon - interrupt to process latency (max), Web, Youtube, Prime95 | |
| Dell Latitude 9510 2-in-1 | |
| HP Envy x360 15-dr1679cl | |
| Lenovo ThinkPad T15 Gen1-20S7S02U00 | |
| Honor Magicbook 14 | |
| HP EliteBook 735 G6 7KN29EA | |
| Honor MagicBook 15 | |
| HP Envy x360 13-ay0010nr | |
| Microsoft Surface Book 3 15 | |
| HP ProBook 455 G7-175W8EA | |
* ... menor é melhor
| Dell Latitude 9510 2-in-1 Toshiba KBG40ZNS512G NVMe | Lenovo ThinkPad T15 Gen1-20S7S02U00 Toshiba XG6 KXG6AZNV1T02 | Lenovo ThinkBook 15 Samsung SSD PM981 MZVLB512HAJQ | Dynabook Tecra X50-F Samsung SSD PM981 MZVLB512HAJQ | HP Envy x360 15-dr1679cl Intel Optane Memory H10 with Solid State Storage 32GB + 512GB HBRPEKNX0202A(L/H) | Dell Latitude 5591 Toshiba XG5 KXG50ZNV512G | |
|---|---|---|---|---|---|---|
| AS SSD | 88% | 105% | 49% | -5% | -11% | |
| Seq Read (MB/s) | 1427 | 2372 66% | 2564 80% | 1461 2% | 931 -35% | 2573 80% |
| Seq Write (MB/s) | 741 | 2230 201% | 2268 206% | 1039 40% | 331.5 -55% | 426.5 -42% |
| 4K Read (MB/s) | 48.7 | 50.2 3% | 57 17% | 45.98 -6% | 72.8 49% | 21.95 -55% |
| 4K Write (MB/s) | 108.2 | 139.8 29% | 141.4 31% | 125.5 16% | 119 10% | 97.2 -10% |
| 4K-64 Read (MB/s) | 1023 | 1430 40% | 1175 15% | 560 -45% | 389.7 -62% | 719 -30% |
| 4K-64 Write (MB/s) | 315.3 | 1368 334% | 1665 428% | 1162 269% | 573 82% | 430.3 36% |
| Access Time Read * (ms) | 0.058 | 0.059 -2% | 0.032 45% | 0.045 22% | 0.07 -21% | 0.122 -110% |
| Access Time Write * (ms) | 0.523 | 0.03 94% | 0.025 95% | 0.032 94% | 0.138 74% | 0.065 88% |
| Score Read (Points) | 1215 | 1718 41% | 1488 22% | 752 -38% | 556 -54% | 998 -18% |
| Score Write (Points) | 498 | 1731 248% | 2033 308% | 1391 179% | 725 46% | 570 14% |
| Score Total (Points) | 2310 | 4325 87% | 4279 85% | 2521 9% | 1565 -32% | 1971 -15% |
| Copy ISO MB/s (MB/s) | 1090 | 1540 41% | 2118 94% | 593 -46% | 782 -28% | |
| Copy Program MB/s (MB/s) | 406.8 | 583 43% | 495.6 22% | 495.5 22% | 365.7 -10% | |
| Copy Game MB/s (MB/s) | 1008 | 1046 4% | 1174 16% | 566 -44% | 457.9 -55% | |
| CrystalDiskMark 5.2 / 6 | 36% | 43% | 1% | 18% | ||
| Write 4K (MB/s) | 114.1 | 159.1 39% | 176.3 55% | 100.1 -12% | 125.6 10% | |
| Read 4K (MB/s) | 50.6 | 55.6 10% | 48.98 -3% | 42.4 -16% | 145.8 188% | |
| Write Seq (MB/s) | 1368 | 1435 5% | 1789 31% | 509 -63% | ||
| Read Seq (MB/s) | 1696 | 1435 -15% | 1671 -1% | 1536 -9% | ||
| Write 4K Q32T1 (MB/s) | 282.8 | 512 81% | 433.5 53% | 245.9 -13% | 362.4 28% | |
| Read 4K Q32T1 (MB/s) | 354.8 | 541 52% | 526 48% | 230.3 -35% | 307.3 -13% | |
| Write Seq Q32T1 (MB/s) | 1418 | 2682 89% | 2983 110% | 1910 35% | 1320 -7% | |
| Read Seq Q32T1 (MB/s) | 2359 | 2902 23% | 3555 51% | 3454 46% | 2489 6% | |
| Write 4K Q8T8 (MB/s) | 1688 | |||||
| Read 4K Q8T8 (MB/s) | 1036 | |||||
| Média Total (Programa/Configurações) | 62% /
69% | 74% /
82% | 25% /
32% | 7% /
3% | -11% /
-11% |
* ... menor é melhor

Disk Throttling: DiskSpd Read Loop, Queue Depth 8
| 3DMark 06 Standard Score | 12453 pontos | |
| 3DMark 11 Performance | 2187 pontos | |
| 3DMark Cloud Gate Standard Score | 10960 pontos | |
| 3DMark Fire Strike Score | 1130 pontos | |
| 3DMark Time Spy Score | 488 pontos | |
Ajuda | ||
| baixo | média | alto | ultra | |
|---|---|---|---|---|
| The Witcher 3 (2015) | 19.9 | 12.1 | ||
| Dota 2 Reborn (2015) | 71.7 | 44.1 | 19 | 17 |
| X-Plane 11.11 (2018) | 12.9 | 13.1 | 11.7 |
| Dell Latitude 9510 2-in-1 UHD Graphics 620, i7-10810U, Toshiba KBG40ZNS512G NVMe | Lenovo ThinkPad T15 Gen1-20S7S02U00 GeForce MX330, i7-10510U, Toshiba XG6 KXG6AZNV1T02 | Lenovo ThinkBook 15 UHD Graphics 620, i5-10210U, Samsung SSD PM981 MZVLB512HAJQ | Dynabook Tecra X50-F UHD Graphics 620, i7-8665U, Samsung SSD PM981 MZVLB512HAJQ | HP Envy x360 15-dr1679cl UHD Graphics 620, i7-10510U, Intel Optane Memory H10 with Solid State Storage 32GB + 512GB HBRPEKNX0202A(L/H) | Dell Latitude 5591 GeForce MX130, i7-8850H, Toshiba XG5 KXG50ZNV512G | |
|---|---|---|---|---|---|---|
| Noise | -4% | -2% | -7% | -8% | -16% | |
| desligado / ambiente * (dB) | 27.2 | 29.4 -8% | 29.2 -7% | 30.2 -11% | 28 -3% | 29 -7% |
| Idle Minimum * (dB) | 27.2 | 29.4 -8% | 29.2 -7% | 30.2 -11% | 28 -3% | 29 -7% |
| Idle Average * (dB) | 27.2 | 29.4 -8% | 29.2 -7% | 30.2 -11% | 30.2 -11% | 29 -7% |
| Idle Maximum * (dB) | 27.2 | 29.4 -8% | 29.9 -10% | 30.2 -11% | 31.5 -16% | 30.3 -11% |
| Load Average * (dB) | 33.4 | 34.2 -2% | 30.6 8% | 33.4 -0% | 35.7 -7% | 46.5 -39% |
| Load Maximum * (dB) | 39.5 | 34.2 13% | 33.8 14% | 39 1% | 43.1 -9% | 48.6 -23% |
| Witcher 3 ultra * (dB) | 34.2 |
* ... menor é melhor
Barulho
| Ocioso |
| 27.2 / 27.2 / 27.2 dB |
| Carga |
| 33.4 / 39.5 dB |
 | ||
30 dB silencioso 40 dB(A) audível 50 dB(A) ruidosamente alto |
||
min: | ||
(±) A temperatura máxima no lado superior é 42.8 °C / 109 F, em comparação com a média de 34.3 °C / 94 F , variando de 21.2 a 62.5 °C para a classe Office.
(±) A parte inferior aquece até um máximo de 41.8 °C / 107 F, em comparação com a média de 36.8 °C / 98 F
(+) Em uso inativo, a temperatura média para o lado superior é 27.2 °C / 81 F, em comparação com a média do dispositivo de 29.5 °C / ### class_avg_f### F.
(+) Os apoios para as mãos e o touchpad são mais frios que a temperatura da pele, com um máximo de 30.6 °C / 87.1 F e, portanto, são frios ao toque.
(-) A temperatura média da área do apoio para as mãos de dispositivos semelhantes foi 27.5 °C / 81.5 F (-3.1 °C / -5.6 F).
Dell Latitude 9510 2-in-1 análise de áudio
(±) | o volume do alto-falante é médio, mas bom (###valor### dB)
Graves 100 - 315Hz
(+) | bons graves - apenas 3% longe da mediana
(±) | a linearidade dos graves é média (9.6% delta para a frequência anterior)
Médios 400 - 2.000 Hz
(+) | médios equilibrados - apenas 3.5% longe da mediana
(±) | a linearidade dos médios é média (7.1% delta para frequência anterior)
Altos 2 - 16 kHz
(+) | agudos equilibrados - apenas 4.9% longe da mediana
(±) | a linearidade dos máximos é média (12.2% delta para frequência anterior)
Geral 100 - 16.000 Hz
(+) | o som geral é linear (10% diferença em relação à mediana)
Comparado com a mesma classe
» 1% de todos os dispositivos testados nesta classe foram melhores, 1% semelhantes, 98% piores
» O melhor teve um delta de 7%, a média foi 21%, o pior foi 53%
Comparado com todos os dispositivos testados
» 4% de todos os dispositivos testados foram melhores, 1% semelhantes, 94% piores
» O melhor teve um delta de 4%, a média foi 23%, o pior foi 134%
Apple MacBook 12 (Early 2016) 1.1 GHz análise de áudio
(+) | os alto-falantes podem tocar relativamente alto (###valor### dB)
Graves 100 - 315Hz
(±) | graves reduzidos - em média 11.3% menor que a mediana
(±) | a linearidade dos graves é média (14.2% delta para a frequência anterior)
Médios 400 - 2.000 Hz
(+) | médios equilibrados - apenas 2.4% longe da mediana
(+) | médios são lineares (5.5% delta para frequência anterior)
Altos 2 - 16 kHz
(+) | agudos equilibrados - apenas 2% longe da mediana
(+) | os máximos são lineares (4.5% delta da frequência anterior)
Geral 100 - 16.000 Hz
(+) | o som geral é linear (10.2% diferença em relação à mediana)
Comparado com a mesma classe
» 7% de todos os dispositivos testados nesta classe foram melhores, 2% semelhantes, 90% piores
» O melhor teve um delta de 5%, a média foi 18%, o pior foi 53%
Comparado com todos os dispositivos testados
» 5% de todos os dispositivos testados foram melhores, 1% semelhantes, 94% piores
» O melhor teve um delta de 4%, a média foi 23%, o pior foi 134%
| desligado | |
| Ocioso | |
| Carga |
|
Key:
min: | |
| Dell Latitude 9510 2-in-1 i7-10810U, UHD Graphics 620, Toshiba KBG40ZNS512G NVMe, IPS, 1920x1080, 15" | Lenovo ThinkPad T15 Gen1-20S7S02U00 i7-10510U, GeForce MX330, Toshiba XG6 KXG6AZNV1T02, IPS LED, 3840x2160, 15.6" | Lenovo ThinkBook 15 i5-10210U, UHD Graphics 620, Samsung SSD PM981 MZVLB512HAJQ, IPS, 1920x1080, 15.6" | Dynabook Tecra X50-F i7-8665U, UHD Graphics 620, Samsung SSD PM981 MZVLB512HAJQ, IPS, 1920x1080, 15.6" | HP Envy x360 15-dr1679cl i7-10510U, UHD Graphics 620, Intel Optane Memory H10 with Solid State Storage 32GB + 512GB HBRPEKNX0202A(L/H), IPS, 1920x1080, 15.6" | Dell Latitude 5591 i7-8850H, GeForce MX130, Toshiba XG5 KXG50ZNV512G, IPS, 1920x1080, 15.6" | |
|---|---|---|---|---|---|---|
| Power Consumption | -105% | -24% | -21% | -32% | -69% | |
| Idle Minimum * (Watt) | 2.1 | 4.3 -105% | 3.5 -67% | 3.9 -86% | 4.3 -105% | 4.4 -110% |
| Idle Average * (Watt) | 4.6 | 13.8 -200% | 7.1 -54% | 7 -52% | 7.2 -57% | 8.4 -83% |
| Idle Maximum * (Watt) | 5.3 | 16.2 -206% | 7.8 -47% | 7.3 -38% | 7.5 -42% | 10.2 -92% |
| Load Average * (Watt) | 45.8 | 66 -44% | 38.9 15% | 32.7 29% | 40.4 12% | 71 -55% |
| Load Maximum * (Watt) | 96.3 | 67.4 30% | 65.4 32% | 57.8 40% | 65.7 32% | 100.1 -4% |
| Witcher 3 ultra * (Watt) | 53 |
* ... menor é melhor
| Dell Latitude 9510 2-in-1 i7-10810U, UHD Graphics 620, 88 Wh | Lenovo ThinkPad T15 Gen1-20S7S02U00 i7-10510U, GeForce MX330, 57 Wh | Lenovo ThinkBook 15 i5-10210U, UHD Graphics 620, 45 Wh | Dynabook Tecra X50-F i7-8665U, UHD Graphics 620, 48 Wh | HP Envy x360 15-dr1679cl i7-10510U, UHD Graphics 620, 55.67 Wh | Dell Latitude 5591 i7-8850H, GeForce MX130, 92 Wh | |
|---|---|---|---|---|---|---|
| Duração da bateria | -66% | -65% | -74% | -50% | -52% | |
| Reader / Idle (h) | 59 | 17.9 -70% | 5.8 -90% | 25.4 -57% | 22.4 -62% | |
| WiFi v1.3 (h) | 18.7 | 7.1 -62% | 6.8 -64% | 4.6 -75% | 9.2 -51% | 12.5 -33% |
| Load (h) | 4 | 1.2 -70% | 1.5 -62% | 1.7 -57% | 2.3 -43% | 1.5 -62% |
Pro
Contra
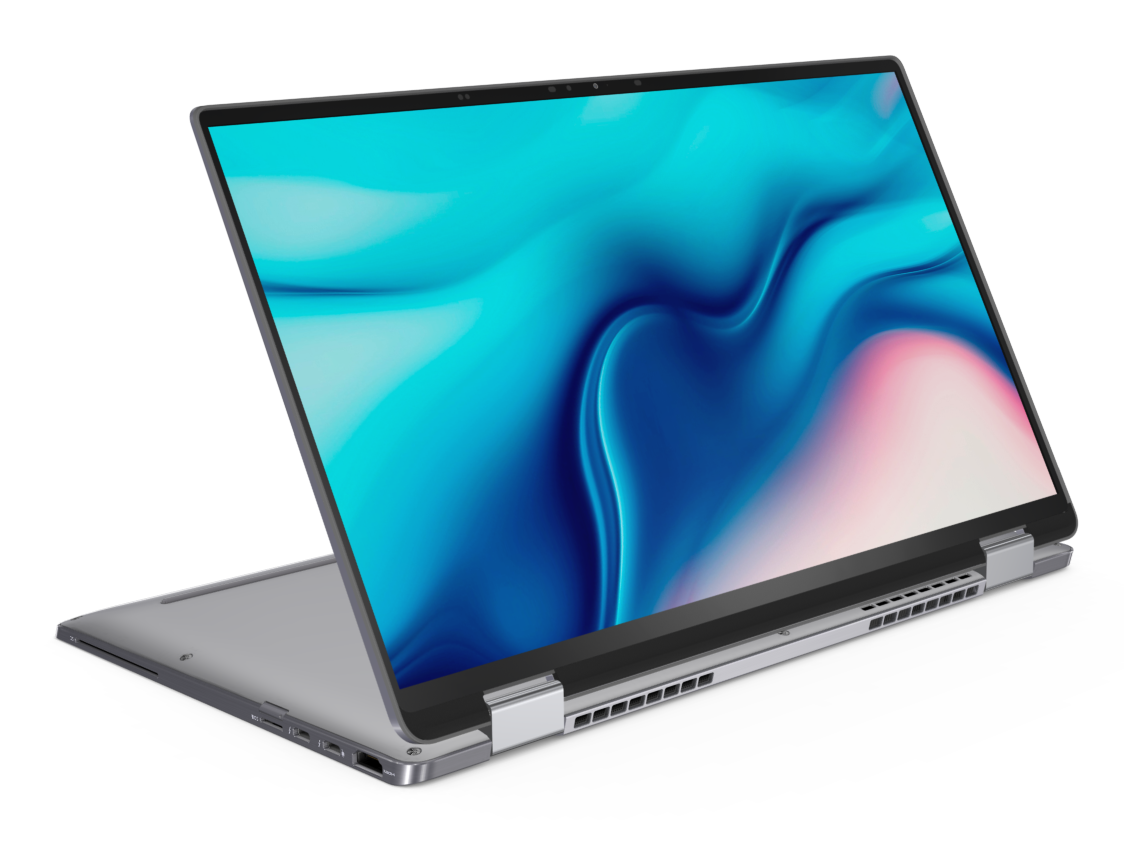
Os recursos mais distintos do Latitude 9510 2-em-1 são seus tempos de duração extraordinariamente longos, habilitado para 5G, chassi de metal e facilidade de manuseio, especialmente para um conversível de 15 polegadas. Esses atributos o tornam adequado para viajantes que desejam algo maior do que o subportátil empresarial típico de 13 ou 14 polegadas como o HP EliteBook x360 1040 ou Lenovo X1 Carbon sem sacrificar muito em termos de portabilidade e peso no processo. Ainda é mais pesado e maior que o mencionado HP ou Lenovo, mas é definitivamente menor do que qualquer conversível de 15,6 polegadas para uma solução confortável no meio do caminho.
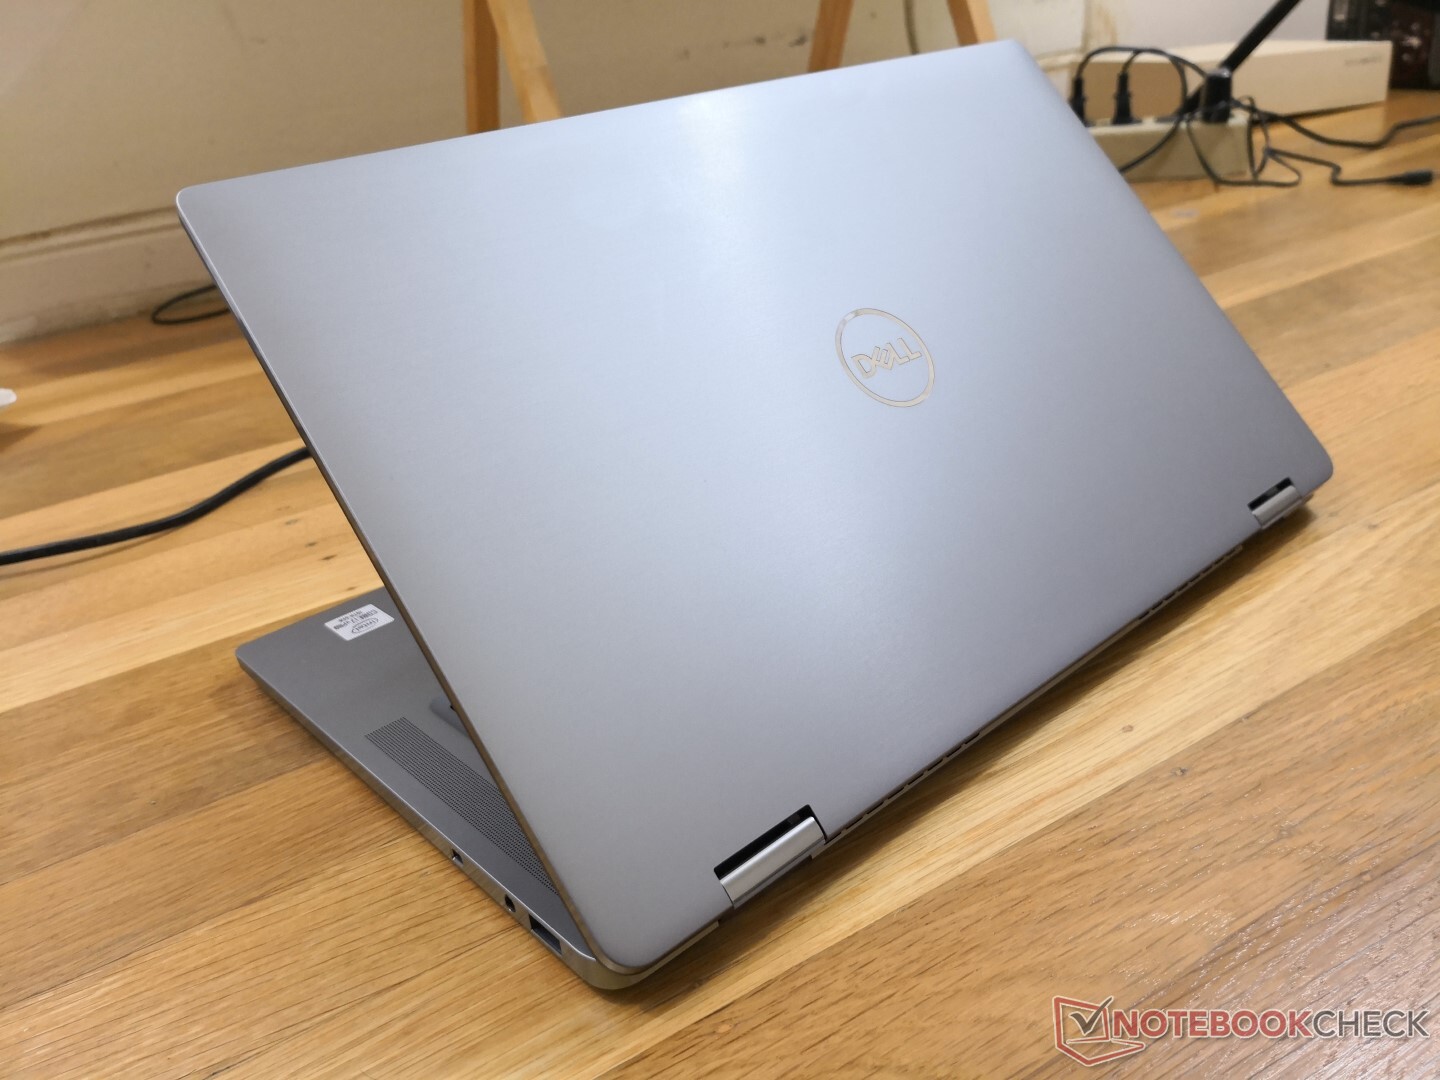
Por mais cheio de recursos que seja, ainda faltam algumas opções. A falta de um obturador de webcam para o modelo conversível é estranha, especialmente para uma série que se concentra tanto na segurança. Além disso, uma opção de painel de 1000 nit ajuda a equiparar o sistema ao HP EliteBook série x360 em termos de visibilidade em ambientes externos.
Os usuários que pretendem executar cargas longas e exigentes devem procurar outras alternativas. O desempenho da CPU diminui acentuadamente após apenas alguns minutos de cargas extremas de processamento e a falta de opções de GPU Ryzen ou adicionais se tornará óbvia após a execução de tarefas intensivas em gráficos. O sistema funciona muito silenciosamente e com bateria de longa duração como resultado, mas o desempenho do processador intermediário é o preço a pagar.
Versátil para quase todas as suas necessidades para dentro ou fora do escritório, desde que suas necessidades não envolvam cargas de processamento intensivas. O tamanho incomum da tela de 15,0 polegadas funciona bem para que um formato conversível seja maior que os subportáteis de 14 polegadas e ainda menor e mais portátil do que as alternativas comuns de 15,6 polegadas.
Dell Latitude 9510 2-in-1
- 07/20/2020 v7 (old)
Allen Ngo
Price comparison
