Breve Análise do Conversível Lenovo ThinkPad X380 Yoga (i5-8250U, FHD)
| SD Card Reader | |
| average JPG Copy Test (av. of 3 runs) | |
| Lenovo ThinkPad X1 Yoga 2018-20LD0015US | |
| Dell Latitude 7390 2-in-1 (Toshiba Exceria Pro M501 UHS-II) | |
| Microsoft Surface Book 2 (Toshiba Exceria Pro SDXC 64 GB UHS-II) | |
| HP Spectre x360 13-ae048ng (Toshiba Exceria Pro M501 microSDXC 64GB) | |
| Lenovo ThinkPad X380 Yoga-20LH000LUS (Toshiba Exceria Pro M501 UHS-II) | |
| Lenovo ThinkPad X380 Yoga 20LJS02W00 (Toshiba Exceria Pro SDXC 64 GB UHS-II) | |
| Média da turma Convertible (28.1 - 141, n=22, últimos 2 anos) | |
| maximum AS SSD Seq Read Test (1GB) | |
| Microsoft Surface Book 2 (Toshiba Exceria Pro SDXC 64 GB UHS-II) | |
| Dell Latitude 7390 2-in-1 (Toshiba Exceria Pro M501 UHS-II) | |
| Lenovo ThinkPad X1 Yoga 2018-20LD0015US | |
| HP Spectre x360 13-ae048ng (Toshiba Exceria Pro M501 microSDXC 64GB) | |
| Média da turma Convertible (28.9 - 254, n=21, últimos 2 anos) | |
| Lenovo ThinkPad X380 Yoga 20LJS02W00 (Toshiba Exceria Pro SDXC 64 GB UHS-II) | |
| Lenovo ThinkPad X380 Yoga-20LH000LUS (Toshiba Exceria Pro M501 UHS-II) | |
| |||||||||||||||||||||||||
iluminação: 91 %
iluminação com acumulador: 336.3 cd/m²
Contraste: 989:1 (Preto: 0.34 cd/m²)
ΔE ColorChecker Calman: 5.77 | ∀{0.5-29.43 Ø4.72}
calibrated: 1.46
ΔE Greyscale Calman: 7.8 | ∀{0.09-98 Ø4.97}
96% sRGB (Argyll 1.6.3 3D)
61% AdobeRGB 1998 (Argyll 1.6.3 3D)
67.2% AdobeRGB 1998 (Argyll 3D)
95.8% sRGB (Argyll 3D)
65.4% Display P3 (Argyll 3D)
Gamma: 1.99
CCT: 6408 K
| Lenovo ThinkPad X380 Yoga-20LH000LUS Lenovo LEN4094, IPS, 13.3", 1920x1080 | Lenovo ThinkPad X380 Yoga 20LJS02W00 Lenovo M133NWF4 R3, IPS, 13.3", 1920x1080 | Lenovo ThinkPad X1 Yoga 2018-20LD0015US Lenovo LEN40A9, IPS, 14", 1920x1080 | HP Spectre x360 13-ae048ng Chi Mei (CMN1376), IPS, 13.3", 1920x1080 | Dell Latitude 7390 2-in-1 AUO462D, IPS, 13.3", 1920x1080 | Microsoft Surface Book 2 Panasonic MEI96A2 , IPS, 13.5", 3000x2000 | |
|---|---|---|---|---|---|---|
| Display | 1% | -8% | 4% | -7% | 2% | |
| Display P3 Coverage (%) | 65.4 | 65.9 1% | 60.9 -7% | 68.1 4% | 62.5 -4% | 67.9 4% |
| sRGB Coverage (%) | 95.8 | 95.8 0% | 86.4 -10% | 99.5 4% | 86.1 -10% | 95.7 0% |
| AdobeRGB 1998 Coverage (%) | 67.2 | 67.8 1% | 61.9 -8% | 70.2 4% | 62.9 -6% | 69.4 3% |
| Response Times | -6% | 6% | 14% | -7% | -11% | |
| Response Time Grey 50% / Grey 80% * (ms) | 44 ? | 50 ? -14% | 40.4 ? 8% | 36 ? 18% | 48.8 ? -11% | 52.8 ? -20% |
| Response Time Black / White * (ms) | 29.6 ? | 29 ? 2% | 28.8 ? 3% | 27 ? 9% | 30.4 ? -3% | 30 ? -1% |
| PWM Frequency (Hz) | 962 ? | 1000 ? | 25000 ? | |||
| Screen | 14% | -6% | 15% | -10% | 37% | |
| Brightness middle (cd/m²) | 336.3 | 314 -7% | 267.2 -21% | 311 -8% | 318.2 -5% | 385 14% |
| Brightness (cd/m²) | 322 | 302 -6% | 239 -26% | 278 -14% | 312 -3% | 372 16% |
| Brightness Distribution (%) | 91 | 84 -8% | 75 -18% | 82 -10% | 83 -9% | 89 -2% |
| Black Level * (cd/m²) | 0.34 | 0.16 53% | 0.27 21% | 0.2 41% | 0.3 12% | 0.21 38% |
| Contrast (:1) | 989 | 1963 98% | 990 0% | 1555 57% | 1061 7% | 1833 85% |
| Colorchecker dE 2000 * | 5.77 | 5.73 1% | 3.5 39% | 3.98 31% | 4.25 26% | 1.6 72% |
| Colorchecker dE 2000 max. * | 10.59 | 10.43 2% | 6.4 40% | 8.48 20% | 9.49 10% | 4.5 58% |
| Colorchecker dE 2000 calibrated * | 1.46 | 3.81 -161% | 4.38 -200% | |||
| Greyscale dE 2000 * | 7.8 | 7.39 5% | 1.3 83% | 5.57 29% | 2.1 73% | 1.5 81% |
| Gamma | 1.99 111% | 2.14 103% | 2.146 103% | 2.51 88% | 2.311 95% | 2.22 99% |
| CCT | 6408 101% | 6351 102% | 6523 100% | 7810 83% | 6588 99% | 6502 100% |
| Color Space (Percent of AdobeRGB 1998) (%) | 61 | 61 0% | 56 -8% | 64 5% | 56 -8% | 64 5% |
| Color Space (Percent of sRGB) (%) | 96 | 96 0% | 86 -10% | 99 3% | 85 -11% | 95.9 0% |
| Média Total (Programa/Configurações) | 3% /
9% | -3% /
-5% | 11% /
13% | -8% /
-9% | 9% /
24% |
* ... menor é melhor
Exibir tempos de resposta
| ↔ Tempo de resposta preto para branco | ||
|---|---|---|
| 29.6 ms ... ascensão ↗ e queda ↘ combinadas | ↗ 15.6 ms ascensão | 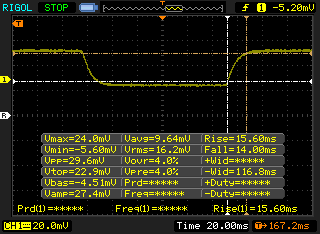 |
| ↘ 14 ms queda | ||
| A tela mostra taxas de resposta relativamente lentas em nossos testes e pode ser muito lenta para os jogadores. Em comparação, todos os dispositivos testados variam de 0.1 (mínimo) a 240 (máximo) ms. » 79 % de todos os dispositivos são melhores. Isso significa que o tempo de resposta medido é pior que a média de todos os dispositivos testados (19.8 ms). | ||
| ↔ Tempo de resposta 50% cinza a 80% cinza | ||
| 44 ms ... ascensão ↗ e queda ↘ combinadas | ↗ 21.2 ms ascensão | 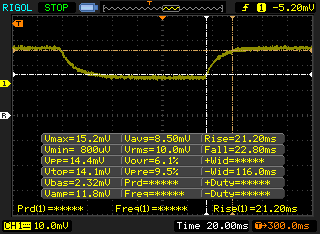 |
| ↘ 22.8 ms queda | ||
| A tela mostra taxas de resposta lentas em nossos testes e será insatisfatória para os jogadores. Em comparação, todos os dispositivos testados variam de 0.165 (mínimo) a 636 (máximo) ms. » 73 % de todos os dispositivos são melhores. Isso significa que o tempo de resposta medido é pior que a média de todos os dispositivos testados (31 ms). | ||
Cintilação da tela / PWM (modulação por largura de pulso)
| Tela tremeluzindo/PWM detectado | 962 Hz | ≤ 99 % configuração de brilho | 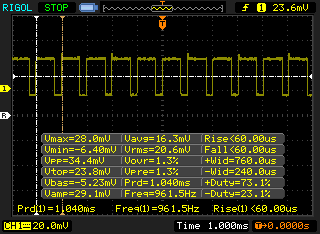 |
A luz de fundo da tela pisca em 962 Hz (pior caso, por exemplo, utilizando PWM) Cintilação detectada em uma configuração de brilho de 99 % e abaixo. Não deve haver cintilação ou PWM acima desta configuração de brilho. A frequência de 962 Hz é bastante alta, então a maioria dos usuários sensíveis ao PWM não deve notar nenhuma oscilação. [pwm_comparison] Em comparação: 52 % de todos os dispositivos testados não usam PWM para escurecer a tela. Se PWM foi detectado, uma média de 7753 (mínimo: 5 - máximo: 343500) Hz foi medida. | |||


| Cinebench R15 | |
| CPU Single 64Bit | |
| Média da turma Convertible (149.8 - 317, n=49, últimos 2 anos) | |
| Dell Latitude 5490 | |
| HP EliteBook x360 1020 G2 | |
| Lenovo ThinkPad X380 Yoga 20LJS02W00 | |
| Dell Latitude 5290 2-in-1 | |
| Lenovo ThinkPad 13 20J1005TPB | |
| Média Intel Core i5-8250U (81 - 147, n=97) | |
| Microsoft Surface Pro (2017) i5 | |
| Acer Aspire 3 A315-51-30YA | |
| Lenovo Ideapad 720S-13ARR | |
| Lenovo ThinkPad X380 Yoga-20LH000LUS | |
| Dell Inspiron 15 5575-98MH4 | |
| CPU Multi 64Bit | |
| Média da turma Convertible (478 - 4940, n=49, últimos 2 anos) | |
| Dell Latitude 5490 | |
| Média Intel Core i5-8250U (320 - 730, n=101) | |
| Dell Latitude 5290 2-in-1 | |
| Lenovo Ideapad 720S-13ARR | |
| Lenovo ThinkPad X380 Yoga-20LH000LUS | |
| Lenovo ThinkPad X380 Yoga 20LJS02W00 | |
| HP EliteBook x360 1020 G2 | |
| Lenovo ThinkPad 13 20J1005TPB | |
| Acer Aspire 3 A315-51-30YA | |
| Microsoft Surface Pro (2017) i5 | |
| Dell Inspiron 15 5575-98MH4 | |
| Cinebench R10 | |
| Rendering Multiple CPUs 32Bit | |
| Média da turma Convertible (24911 - 67475, n=8, últimos 2 anos) | |
| Média Intel Core i5-8250U (14148 - 22097, n=42) | |
| Lenovo ThinkPad X380 Yoga-20LH000LUS | |
| Lenovo ThinkPad X380 Yoga 20LJS02W00 | |
| Acer Aspire 3 A315-51-30YA | |
| HP EliteBook x360 1020 G2 | |
| Lenovo Ideapad 720S-13ARR | |
| Dell Inspiron 15 5575-98MH4 | |
| Rendering Single 32Bit | |
| Média da turma Convertible (7163 - 10030, n=8, últimos 2 anos) | |
| Lenovo ThinkPad X380 Yoga 20LJS02W00 | |
| Média Intel Core i5-8250U (5349 - 8356, n=42) | |
| Lenovo ThinkPad X380 Yoga-20LH000LUS | |
| Acer Aspire 3 A315-51-30YA | |
| HP EliteBook x360 1020 G2 | |
| Lenovo Ideapad 720S-13ARR | |
| Dell Inspiron 15 5575-98MH4 | |
* ... menor é melhor
| PCMark 8 Home Score Accelerated v2 | 3760 pontos | |
| PCMark 8 Work Score Accelerated v2 | 4781 pontos | |
| PCMark 10 Score | 3538 pontos | |
Ajuda | ||
| Lenovo ThinkPad X380 Yoga-20LH000LUS Samsung SSD PM981 MZVLB512HAJQ | Lenovo ThinkPad X380 Yoga 20LJS02W00 Samsung SSD PM981 MZVLB512HAJQ | Lenovo ThinkPad X1 Yoga 2018-20LD0015US Samsung SSD PM981 MZVLB512HAJQ | HP Spectre x360 13-ae048ng Toshiba NVMe THNSN51T02DUK | Dell Latitude 7390 2-in-1 SK hynix PC401 NVMe 500 GB | Média Samsung SSD PM981 MZVLB512HAJQ | |
|---|---|---|---|---|---|---|
| AS SSD | -7% | 11% | -596% | -25% | 6% | |
| Copy Game MB/s (MB/s) | 962 | 607 | 856 | 473.6 | 1057 ? | |
| Copy Program MB/s (MB/s) | 343 | 233.5 | 281.8 | 223.5 | 454 ? | |
| Copy ISO MB/s (MB/s) | 1770 | 917 | 1205 | 1377 | 1755 ? | |
| Score Total (Points) | 3487 | 2543 -27% | 3594 3% | 455 -87% | 2057 -41% | 3966 ? 14% |
| Score Write (Points) | 1099 | 1165 6% | 1359 24% | 42 -96% | 781 -29% | 1780 ? 62% |
| Score Read (Points) | 1619 | 896 -45% | 1487 -8% | 305 -81% | 877 -46% | 1451 ? -10% |
| Access Time Write * (ms) | 0.04 | 0.032 20% | 0.037 7% | 2.391 -5878% | 0.052 -30% | 0.08337 ? -108% |
| Access Time Read * (ms) | 0.04 | 0.039 2% | 0.043 -8% | 0.044 -10% | 0.045 -13% | 0.05092 ? -27% |
| 4K-64 Write (MB/s) | 907 | 926 2% | 1072 18% | 2.09 -100% | 606 -33% | 1504 ? 66% |
| 4K-64 Read (MB/s) | 1350 | 735 -46% | 1216 -10% | 115.6 -91% | 643 -52% | 1203 ? -11% |
| 4K Write (MB/s) | 91.3 | 111.6 22% | 102.3 12% | 1.73 -98% | 103.4 13% | 112 ? 23% |
| 4K Read (MB/s) | 43.1 | 51.5 19% | 49.11 14% | 31.73 -26% | 42.12 -2% | 50.5 ? 17% |
| Seq Write (MB/s) | 1044 | 1272 22% | 1840 76% | 377.1 -64% | 711 -32% | 1637 ? 57% |
| Seq Read (MB/s) | 2260 | 1099 -51% | 2218 -2% | 1574 -30% | 1911 -15% | 1976 ? -13% |
* ... menor é melhor

| 3DMark 11 | |
| 1280x720 Performance GPU | |
| Média da turma Convertible (1505 - 40732, n=49, últimos 2 anos) | |
| Dell XPS 15 2018 i5 FHD 97Wh | |
| HP Spectre x360 15-ch011nr | |
| Asus VivoBook 15 F510UF-ES71 | |
| Asus VivoBook S410UQ-NH74 | |
| Média Intel UHD Graphics 620 (1144 - 3432, n=244) | |
| HP Elitebook 1040 G4-2XU40UT | |
| Lenovo ThinkPad X380 Yoga-20LH000LUS | |
| Huawei Matebook E | |
| Fujitsu Lifebook E756 | |
| 1280x720 Performance Combined | |
| Média da turma Convertible (1952 - 17837, n=48, últimos 2 anos) | |
| Dell XPS 15 2018 i5 FHD 97Wh | |
| HP Spectre x360 15-ch011nr | |
| Asus VivoBook 15 F510UF-ES71 | |
| Asus VivoBook S410UQ-NH74 | |
| HP Elitebook 1040 G4-2XU40UT | |
| Média Intel UHD Graphics 620 (927 - 2505, n=244) | |
| Lenovo ThinkPad X380 Yoga-20LH000LUS | |
| Fujitsu Lifebook E756 | |
| Huawei Matebook E | |
| 3DMark 06 Standard Score | 10245 pontos | |
| 3DMark 11 Performance | 1790 pontos | |
| 3DMark Cloud Gate Standard Score | 7672 pontos | |
| 3DMark Fire Strike Score | 1030 pontos | |
Ajuda | ||
Barulho
| Ocioso |
| 28 / 28 / 29.1 dB |
| Carga |
| 34.5 / 36.4 dB |
 | ||
30 dB silencioso 40 dB(A) audível 50 dB(A) ruidosamente alto |
||
min: | ||
| Lenovo ThinkPad X380 Yoga-20LH000LUS UHD Graphics 620, i5-8250U, Samsung SSD PM981 MZVLB512HAJQ | Lenovo ThinkPad X380 Yoga 20LJS02W00 UHD Graphics 620, i5-8550U, Samsung SSD PM981 MZVLB512HAJQ | Lenovo ThinkPad X1 Yoga 2018-20LD0015US UHD Graphics 620, i5-8250U, Samsung SSD PM981 MZVLB512HAJQ | HP Spectre x360 13-ae048ng UHD Graphics 620, i5-8550U, Toshiba NVMe THNSN51T02DUK | Dell Latitude 7390 2-in-1 UHD Graphics 620, i7-8650U, SK hynix PC401 NVMe 500 GB | Microsoft Surface Book 2 GeForce GTX 1050 Mobile, i7-8650U, Samsung PM961 MZVLW256HEHP | |
|---|---|---|---|---|---|---|
| Noise | -5% | -0% | -3% | -1% | -7% | |
| desligado / ambiente * (dB) | 28 | 30.4 -9% | 27.8 1% | 30.13 -8% | 28.2 -1% | 29.4 -5% |
| Idle Minimum * (dB) | 28 | 30.4 -9% | 27.8 1% | 30.13 -8% | 28.2 -1% | 29.4 -5% |
| Idle Average * (dB) | 28 | 30.4 -9% | 27.8 1% | 30 -7% | 28.2 -1% | 29.4 -5% |
| Idle Maximum * (dB) | 29.1 | 30.4 -4% | 27.8 4% | 30.13 -4% | 28.2 3% | 29.4 -1% |
| Load Average * (dB) | 34.5 | 34.2 1% | 33.9 2% | 33.4 3% | 32 7% | 31.4 9% |
| Load Maximum * (dB) | 36.4 | 35.2 3% | 39.9 -10% | 33 9% | 41.6 -14% | 49 -35% |
| Witcher 3 ultra * (dB) | 49 |
* ... menor é melhor
(±) A temperatura máxima no lado superior é 40.4 °C / 105 F, em comparação com a média de 35.4 °C / 96 F , variando de 19.6 a 60 °C para a classe Convertible.
(-) A parte inferior aquece até um máximo de 51 °C / 124 F, em comparação com a média de 36.9 °C / 98 F
(+) Em uso inativo, a temperatura média para o lado superior é 27.2 °C / 81 F, em comparação com a média do dispositivo de 30.3 °C / ### class_avg_f### F.
(+) Os apoios para as mãos e o touchpad são mais frios que a temperatura da pele, com um máximo de 31.4 °C / 88.5 F e, portanto, são frios ao toque.
(-) A temperatura média da área do apoio para as mãos de dispositivos semelhantes foi 28 °C / 82.4 F (-3.4 °C / -6.1 F).
Lenovo ThinkPad X380 Yoga-20LH000LUS análise de áudio
(-) | alto-falantes não muito altos (###valor### dB)
Graves 100 - 315Hz
(-) | quase nenhum baixo - em média 19.2% menor que a mediana
(±) | a linearidade dos graves é média (12.2% delta para a frequência anterior)
Médios 400 - 2.000 Hz
(±) | médios mais altos - em média 6.7% maior que a mediana
(±) | a linearidade dos médios é média (11.5% delta para frequência anterior)
Altos 2 - 16 kHz
(±) | máximos mais altos - em média 5.4% maior que a mediana
(±) | a linearidade dos máximos é média (9.8% delta para frequência anterior)
Geral 100 - 16.000 Hz
(-) | o som geral não é linear (35.9% diferença em relação à mediana)
Comparado com a mesma classe
» 95% de todos os dispositivos testados nesta classe foram melhores, 1% semelhantes, 4% piores
» O melhor teve um delta de 6%, a média foi 20%, o pior foi 57%
Comparado com todos os dispositivos testados
» 94% de todos os dispositivos testados foram melhores, 1% semelhantes, 5% piores
» O melhor teve um delta de 4%, a média foi 23%, o pior foi 134%
Apple MacBook 12 (Early 2016) 1.1 GHz análise de áudio
(+) | os alto-falantes podem tocar relativamente alto (###valor### dB)
Graves 100 - 315Hz
(±) | graves reduzidos - em média 11.3% menor que a mediana
(±) | a linearidade dos graves é média (14.2% delta para a frequência anterior)
Médios 400 - 2.000 Hz
(+) | médios equilibrados - apenas 2.4% longe da mediana
(+) | médios são lineares (5.5% delta para frequência anterior)
Altos 2 - 16 kHz
(+) | agudos equilibrados - apenas 2% longe da mediana
(+) | os máximos são lineares (4.5% delta da frequência anterior)
Geral 100 - 16.000 Hz
(+) | o som geral é linear (10.2% diferença em relação à mediana)
Comparado com a mesma classe
» 7% de todos os dispositivos testados nesta classe foram melhores, 2% semelhantes, 91% piores
» O melhor teve um delta de 5%, a média foi 18%, o pior foi 53%
Comparado com todos os dispositivos testados
» 5% de todos os dispositivos testados foram melhores, 1% semelhantes, 94% piores
» O melhor teve um delta de 4%, a média foi 23%, o pior foi 134%
| desligado | |
| Ocioso | |
| Carga |
|
Key:
min: | |
| Lenovo ThinkPad X380 Yoga-20LH000LUS i5-8250U, UHD Graphics 620, Samsung SSD PM981 MZVLB512HAJQ, IPS, 1920x1080, 13.3" | Lenovo ThinkPad X1 Yoga 2018-20LD0015US i5-8250U, UHD Graphics 620, Samsung SSD PM981 MZVLB512HAJQ, IPS, 1920x1080, 14" | HP Spectre x360 13-ae048ng i5-8550U, UHD Graphics 620, Toshiba NVMe THNSN51T02DUK, IPS, 1920x1080, 13.3" | Dell Latitude 7390 2-in-1 i7-8650U, UHD Graphics 620, SK hynix PC401 NVMe 500 GB, IPS, 1920x1080, 13.3" | Microsoft Surface Book 2 i7-8650U, GeForce GTX 1050 Mobile, Samsung PM961 MZVLW256HEHP, IPS, 3000x2000, 13.5" | Lenovo ThinkPad X380 Yoga 20LJS02W00 i5-8550U, UHD Graphics 620, Samsung SSD PM981 MZVLB512HAJQ, IPS, 1920x1080, 13.3" | |
|---|---|---|---|---|---|---|
| Power Consumption | -0% | 12% | 20% | -82% | 12% | |
| Idle Minimum * (Watt) | 3.7 | 3 19% | 3.2 14% | 2.6 30% | 4.7 -27% | 4 -8% |
| Idle Average * (Watt) | 6.9 | 5.4 22% | 6 13% | 5.7 17% | 10.6 -54% | 4.9 29% |
| Idle Maximum * (Watt) | 11.3 | 7.5 34% | 9.2 19% | 6 47% | 12.3 -9% | 6.9 39% |
| Load Average * (Watt) | 34.2 | 40.1 -17% | 29.5 14% | 29.2 15% | 81 -137% | 36 -5% |
| Load Maximum * (Watt) | 35.6 | 57.1 -60% | 35.6 -0% | 38.8 -9% | 100.3 -182% | 34.4 3% |
| Witcher 3 ultra * (Watt) | 97 |
* ... menor é melhor
| Lenovo ThinkPad X380 Yoga-20LH000LUS i5-8250U, UHD Graphics 620, 51 Wh | Lenovo ThinkPad X380 Yoga 20LJS02W00 i5-8550U, UHD Graphics 620, 51 Wh | Lenovo ThinkPad X1 Yoga 2018-20LD0015US i5-8250U, UHD Graphics 620, 54 Wh | HP Spectre x360 13-ae048ng i5-8550U, UHD Graphics 620, 60 Wh | Dell Latitude 7390 2-in-1 i7-8650U, UHD Graphics 620, 60 Wh | Microsoft Surface Book 2 i7-8650U, GeForce GTX 1050 Mobile, 75 Wh | |
|---|---|---|---|---|---|---|
| Duração da bateria | -7% | 1% | 6% | -3% | 20% | |
| Reader / Idle (h) | 22.2 | 20.8 -6% | 20.3 -9% | 24.5 10% | ||
| WiFi v1.3 (h) | 9.4 | 8.5 -10% | 10.9 16% | 8.8 -6% | 9.2 -2% | 11.1 18% |
| Load (h) | 2.4 | 2.3 -4% | 2.3 -4% | 2.8 17% | 2.3 -4% | 3.2 33% |
| Witcher 3 ultra (h) | 3.8 |
Pro
Contra
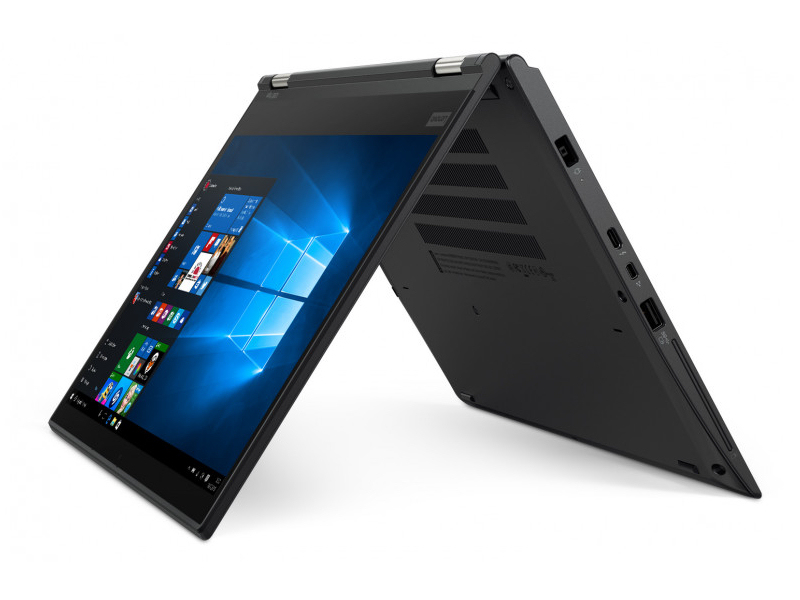
O Lenovo X380 Yoga se saiu bem em nossa análise inicial, mas teve algumas deficiências. Enquanto o Core i7 2670QM tem uma velocidade 18% mais rápida no papel que o Core i5 2430M, mostrou ser um pouco demais para o X380 Yoga. O 8250U parece ser o melhor companheiro para o dispositivo flexível na maioria das cargas de trabalho. O dispositivo é excelente em quase todas as áreas, exceto pelo desempenho de longo prazo da CPU. A carcaça é robusta, a seleção de portas é excelente, e as dobradiças duráveis e o teclado retrátil facilitam o uso do tablet.
Como uma máquina de escritório, o X380 é excelente. A linha ThinkPad Yoga da Lenovo há muito tempo está no topo da lista para os profissionais empresariais em busca de um conversível bem construído. No entanto, os concorrentes alcançaram e até superaram a Lenovo de algumas maneiras. O Spectre x360 13 da HP é uma máquina muito bem trabalhada que não sofre com o afogamento pesado do X380 Yoga. O Latitude 7390 da Dell tem espaço suficiente para duas unidades de armazenamento e um formato compacto. O Surface Book 2 da Microsoft coloca uma tonelada de poder em um conversível e derrota concorrentes em tarefas graficamente intensivas.
Dito isto, cada um deles tem suas próprias deficiências. O Spectre x360 tem uma seleção limitada de portas, o Latitude 7390 tem uma tela ruim com um acabamento altamente reflexivo, e o Surface Book 2 é proibitivamente caro. O X380 Yoga é uma máquina bem completa com um preço razoável e é, no geral, agradável de usar.
O X380 Yoga, particularmente a variante Core i5-8250U, talvez seja o melhor conversível compacto para usuários corporativos. Embora existam algumas falhas, o pacote é compatível com uma carcaça bem construída com uma excelente variedade de portas e oferece excelente duração de bateria e uma tela bonita e com cores precisas. Outros conversíveis de escritório podem cobrir uma área da experiência do portátil com excelência, mas o X380 Yoga os faz bem, sem deixar muito para trás.
Lenovo ThinkPad X380 Yoga-20LH000LUS
- 07/18/2018 v6 (old)
Sam Medley
Price comparison
