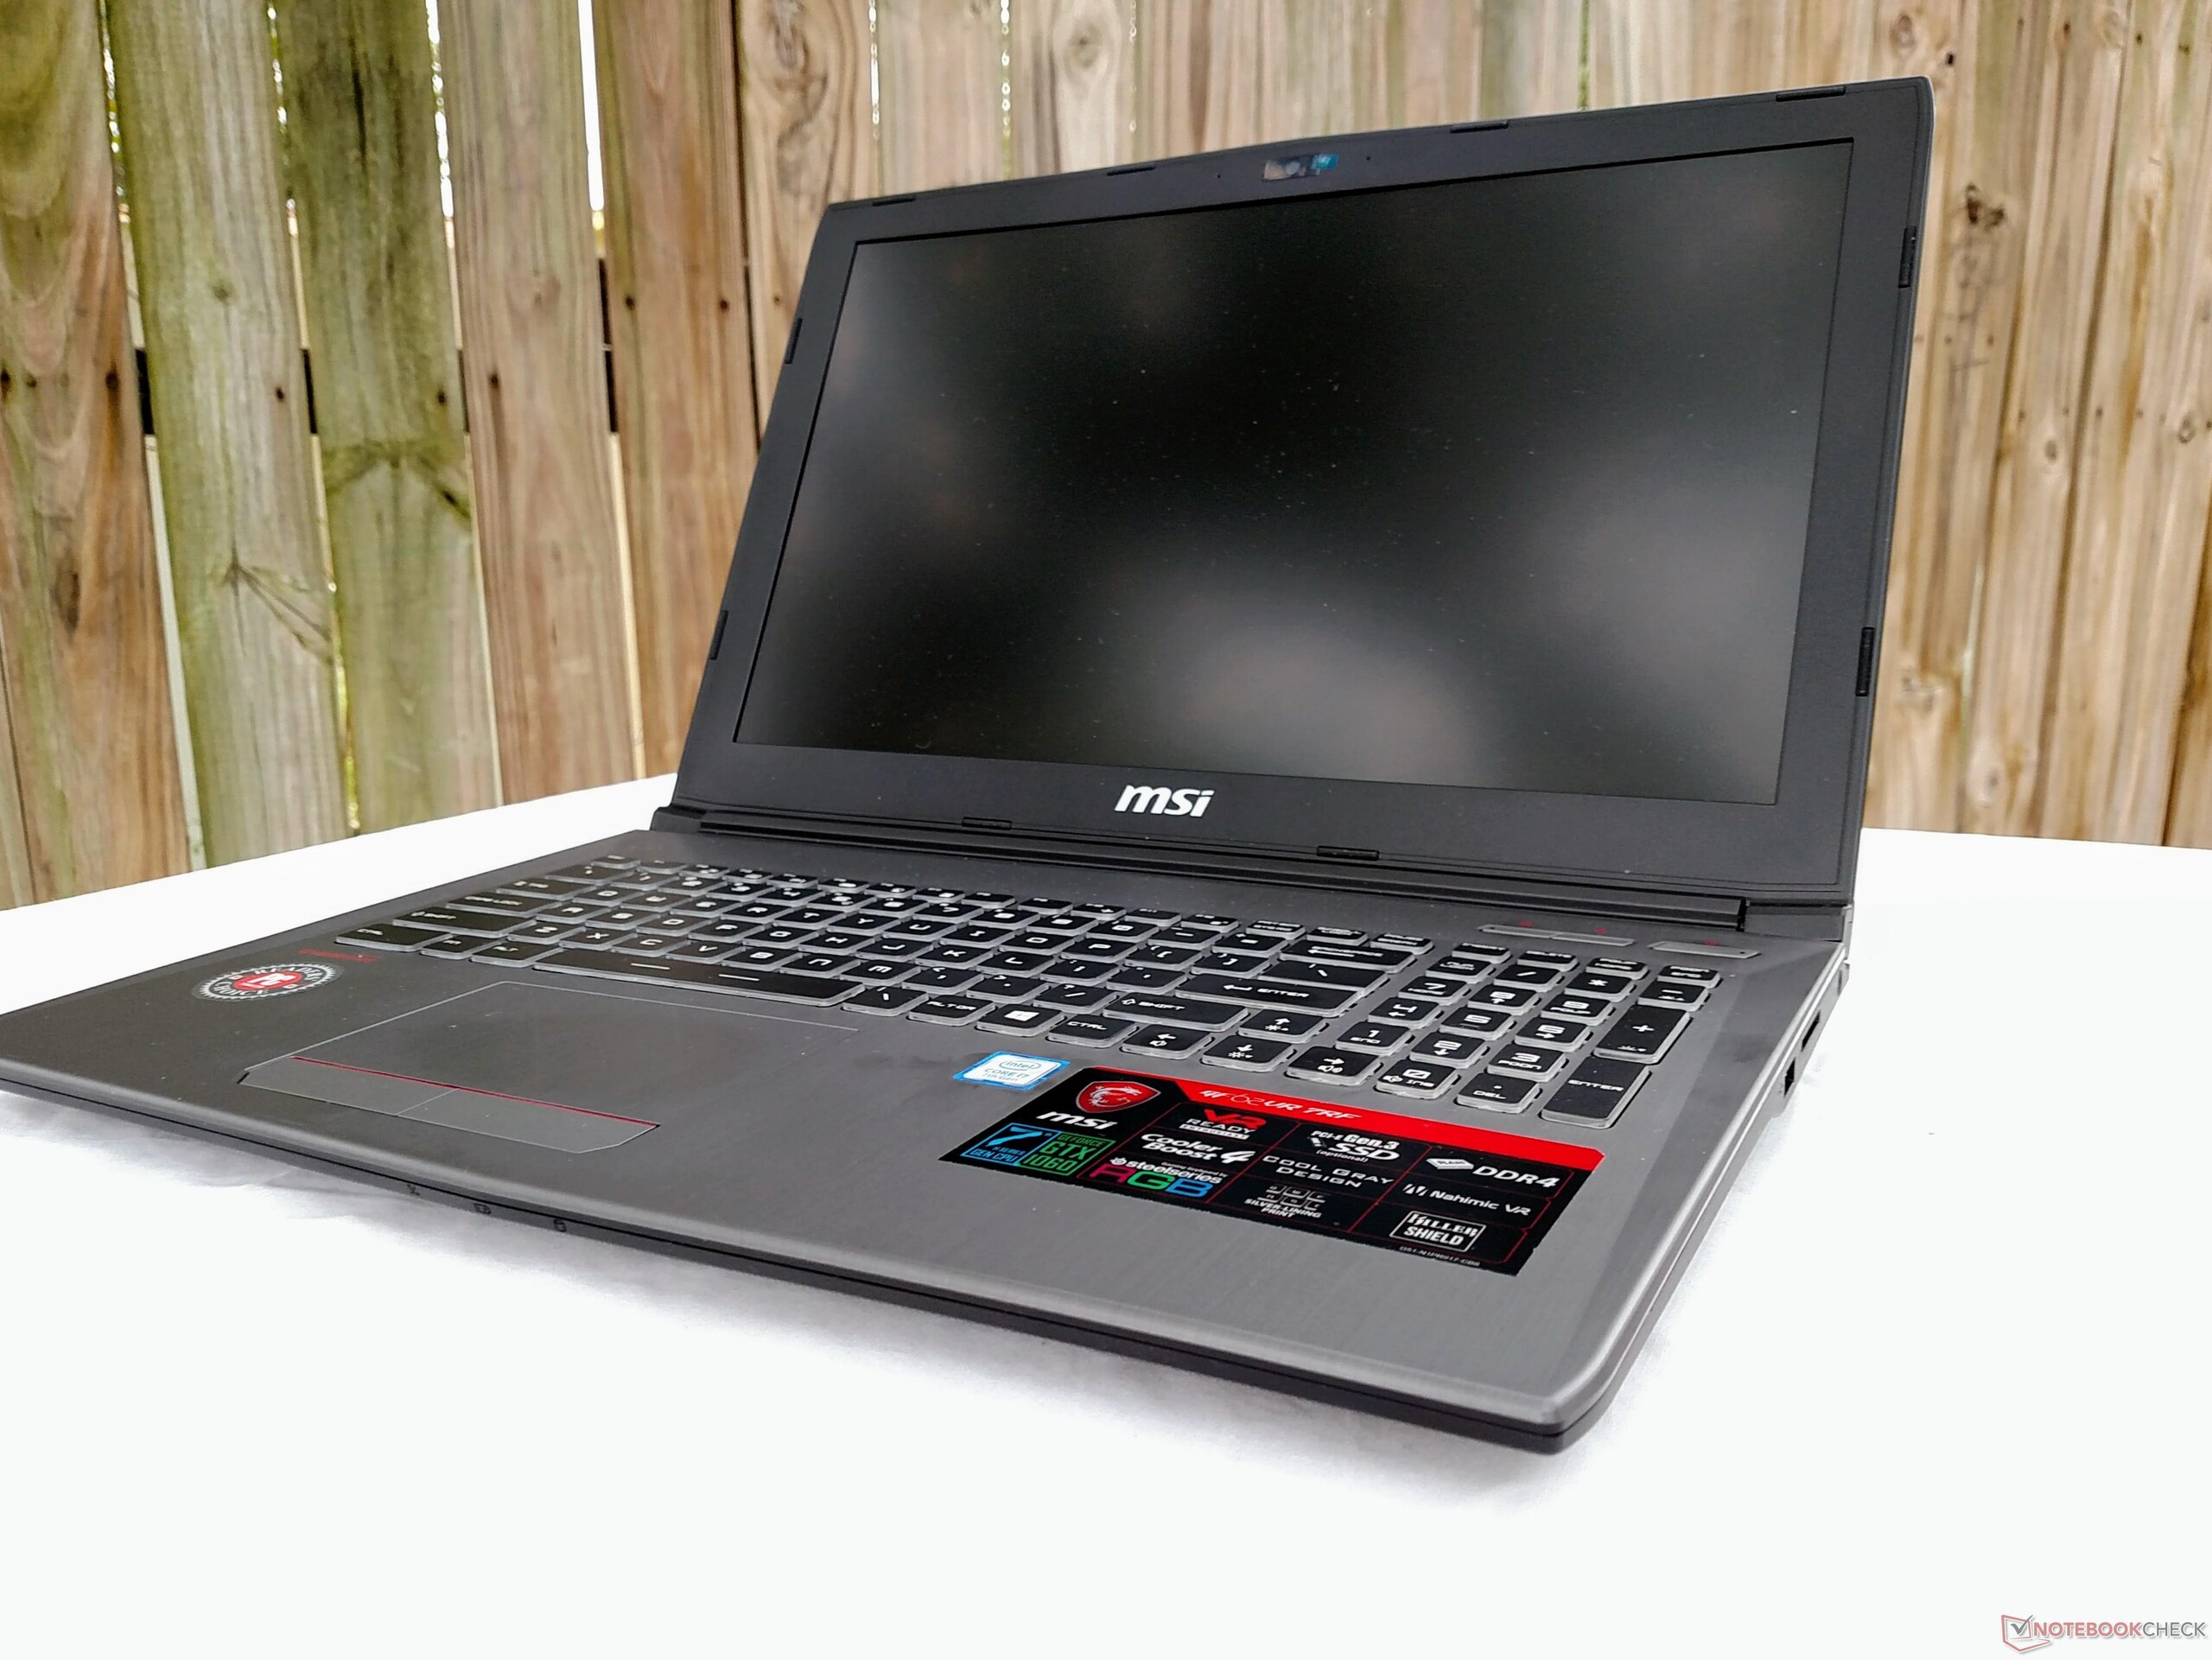
Breve Análise do Portátil MSI GF62VR 7RF (7700HQ, GTX 1060, FHD 60 Hz)
| SD Card Reader | |
| average JPG Copy Test (av. of 3 runs) | |
| Asus Strix GL502VM-DS74 | |
| Gigabyte Aero 15 | |
| Schenker XMG A517 | |
| HP Omen 15-ce002ng | |
| Gigabyte P55W v7 | |
| MSI GF62VR 7RF-877 | |
| MSI GE62VR 6RF-001US | |
| maximum AS SSD Seq Read Test (1GB) | |
| Asus Strix GL502VM-DS74 | |
| Gigabyte Aero 15 | |
| Gigabyte P55W v7 | |
| Schenker XMG A517 | |
| HP Omen 15-ce002ng | |
| MSI GF62VR 7RF-877 | |
| MSI GE62VR 6RF-001US | |
| |||||||||||||||||||||||||
iluminação: 88 %
iluminação com acumulador: 223.9 cd/m²
Contraste: 400:1 (Preto: 0.56 cd/m²)
ΔE ColorChecker Calman: 9.7 | ∀{0.5-29.43 Ø4.71}
ΔE Greyscale Calman: 12.9 | ∀{0.09-98 Ø4.96}
100% sRGB (Argyll 1.6.3 3D)
75% AdobeRGB 1998 (Argyll 1.6.3 3D)
83.9% AdobeRGB 1998 (Argyll 3D)
99.9% sRGB (Argyll 3D)
85.6% Display P3 (Argyll 3D)
Gamma: 2.18
CCT: 15225 K
| MSI GF62VR 7RF-877 Chi Mei N156HGA-EAL, TN LED, 15.6", 1920x1080 | MSI GE62VR 6RF-001US IPS, 15.6", 1920x1080 | Schenker XMG A517 LG Philips LP156WF6 (LGD046F), IPS, 15.6", 1920x1080 | Gigabyte Aero 15 N156HCA-EA1 (CMN15D7), IPS, 15.6", 1920x1080 | Gigabyte P55W v7 LG Philips LP156WF6 (LGD046F), IPS, 15.6", 1920x1080 | Asus Strix GL502VM-DS74 IPS, 15.6", 1920x1080 | HP Omen 15-ce002ng AUO42ED, IPS, 15.6", 1920x1080 | Samsung Odyssey NP800G5M-X01US IPS, 15.6", 1920x1080 | |
|---|---|---|---|---|---|---|---|---|
| Display | -22% | -22% | -17% | -24% | -22% | -18% | -39% | |
| Display P3 Coverage (%) | 85.6 | 65.6 -23% | 65 -24% | 65.2 -24% | 63.5 -26% | 64.8 -24% | 65.8 -23% | 47.11 -45% |
| sRGB Coverage (%) | 99.9 | 84.3 -16% | 85.1 -15% | 92.5 -7% | 82 -18% | 84.9 -15% | 90.9 -9% | 70.4 -30% |
| AdobeRGB 1998 Coverage (%) | 83.9 | 61.7 -26% | 62.2 -26% | 66.5 -21% | 59.9 -29% | 62 -26% | 66.5 -21% | 48.71 -42% |
| Response Times | 9% | 15% | -9% | 12% | -10% | -8% | -8% | |
| Response Time Grey 50% / Grey 80% * (ms) | 49.6 ? | 36.8 ? 26% | 36 ? 27% | 42.8 ? 14% | 37 ? 25% | 42 ? 15% | 43.2 ? 13% | 38.8 ? 22% |
| Response Time Black / White * (ms) | 24.4 ? | 26.4 ? -8% | 24 ? 2% | 32 ? -31% | 25 ? -2% | 32.8 ? -34% | 31.2 ? -28% | 33.6 ? -38% |
| PWM Frequency (Hz) | 25510 ? | 21000 ? | 26000 ? | 19230 ? | ||||
| Screen | 63% | 38% | 38% | 38% | 40% | 50% | 11% | |
| Brightness middle (cd/m²) | 223.9 | 302 35% | 320 43% | 320 43% | 287 28% | 307.8 37% | 304 36% | 255.9 14% |
| Brightness (cd/m²) | 208 | 303 46% | 311 50% | 316 52% | 289 39% | 301 45% | 289 39% | 249 20% |
| Brightness Distribution (%) | 88 | 87 -1% | 90 2% | 90 2% | 87 -1% | 88 0% | 86 -2% | 90 2% |
| Black Level * (cd/m²) | 0.56 | 0.169 70% | 0.36 36% | 0.36 36% | 0.29 48% | 0.33 41% | 0.26 54% | 0.48 14% |
| Contrast (:1) | 400 | 1787 347% | 889 122% | 889 122% | 990 148% | 933 133% | 1169 192% | 533 33% |
| Colorchecker dE 2000 * | 9.7 | 4.61 52% | 5.08 48% | 4.62 52% | 4.92 49% | 4.5 54% | 3.46 64% | 5.9 39% |
| Colorchecker dE 2000 max. * | 19.7 | 9.98 49% | 10.73 46% | 9.75 51% | 11 44% | 10 49% | 7.72 61% | 18.9 4% |
| Greyscale dE 2000 * | 12.9 | 3.32 74% | 4.04 69% | 6 53% | 3.66 72% | 2.9 78% | 2.46 81% | 5.6 57% |
| Gamma | 2.18 101% | 2.24 98% | 2.34 94% | 2.46 89% | 2.32 95% | 2.22 99% | 2.38 92% | 2.21 100% |
| CCT | 15225 43% | 6358 102% | 7029 92% | 6761 96% | 6482 100% | 1136 572% | 6915 94% | 7250 90% |
| Color Space (Percent of AdobeRGB 1998) (%) | 75 | 55.4 -26% | 56 -25% | 60 -20% | 54 -28% | 55.4 -26% | 59 -21% | 44.8 -40% |
| Color Space (Percent of sRGB) (%) | 100 | 84.4 -16% | 85 -15% | 92 -8% | 82 -18% | 84.8 -15% | 91 -9% | 70.1 -30% |
| Média Total (Programa/Configurações) | 17% /
39% | 10% /
23% | 4% /
21% | 9% /
22% | 3% /
21% | 8% /
28% | -12% /
-1% |
* ... menor é melhor
Exibir tempos de resposta
| ↔ Tempo de resposta preto para branco | ||
|---|---|---|
| 24.4 ms ... ascensão ↗ e queda ↘ combinadas | ↗ 20 ms ascensão | 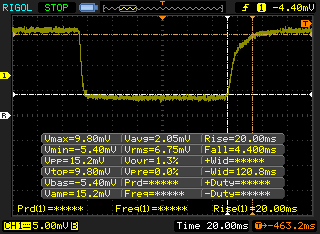 |
| ↘ 4.4 ms queda | ||
| A tela mostra boas taxas de resposta em nossos testes, mas pode ser muito lenta para jogadores competitivos. Em comparação, todos os dispositivos testados variam de 0.1 (mínimo) a 240 (máximo) ms. » 58 % de todos os dispositivos são melhores. Isso significa que o tempo de resposta medido é pior que a média de todos os dispositivos testados (19.8 ms). | ||
| ↔ Tempo de resposta 50% cinza a 80% cinza | ||
| 49.6 ms ... ascensão ↗ e queda ↘ combinadas | ↗ 24.8 ms ascensão | 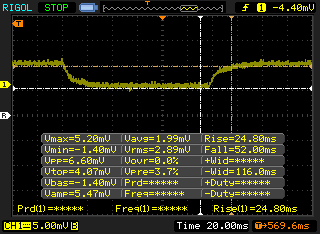 |
| ↘ 24.8 ms queda | ||
| A tela mostra taxas de resposta lentas em nossos testes e será insatisfatória para os jogadores. Em comparação, todos os dispositivos testados variam de 0.165 (mínimo) a 636 (máximo) ms. » 86 % de todos os dispositivos são melhores. Isso significa que o tempo de resposta medido é pior que a média de todos os dispositivos testados (31 ms). | ||
Cintilação da tela / PWM (modulação por largura de pulso)
| Tela tremeluzindo/PWM detectado | 25510 Hz | ≤ 20 % configuração de brilho | 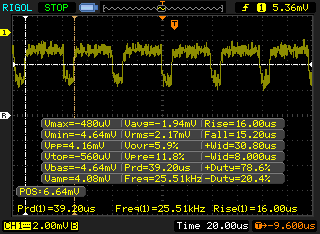 |
A luz de fundo da tela pisca em 25510 Hz (pior caso, por exemplo, utilizando PWM) Cintilação detectada em uma configuração de brilho de 20 % e abaixo. Não deve haver cintilação ou PWM acima desta configuração de brilho. A frequência de 25510 Hz é bastante alta, então a maioria dos usuários sensíveis ao PWM não deve notar nenhuma oscilação. [pwm_comparison] Em comparação: 52 % de todos os dispositivos testados não usam PWM para escurecer a tela. Se PWM foi detectado, uma média de 7757 (mínimo: 5 - máximo: 343500) Hz foi medida. | |||
| Cinebench R15 | |
| CPU Single 64Bit | |
| Aorus X9 | |
| Alienware 15 R3 Max-Q | |
| Lenovo Legion Y920-17IKB | |
| HP Omen 15-ce002ng | |
| Asus Strix GL502VM-DS74 | |
| Gigabyte P55W v7 | |
| Samsung Odyssey NP800G5M-X01US | |
| Lenovo Legion Y520-15IKBM 80YY001APB | |
| Acer Aspire VX15 VX5-591G-589S | |
| MSI GF62VR 7RF-877 | |
| Dell Inspiron 15 7566 PL | |
| MSI GE62VR 6RF-001US | |
| CPU Multi 64Bit | |
| Aorus X9 | |
| Lenovo Legion Y920-17IKB | |
| Lenovo Legion Y920-17IKB | |
| Alienware 15 R3 Max-Q | |
| Asus Strix GL502VM-DS74 | |
| HP Omen 15-ce002ng | |
| Samsung Odyssey NP800G5M-X01US | |
| MSI GF62VR 7RF-877 | |
| Gigabyte P55W v7 | |
| Dell Inspiron 15 7566 PL | |
| MSI GE62VR 6RF-001US | |
| Lenovo Legion Y520-15IKBM 80YY001APB | |
| Acer Aspire VX15 VX5-591G-589S | |
| wPrime 2.10 - 1024m | |
| Lenovo Legion Y520-15IKBM 80YY001APB | |
| Lenovo Legion Y920-17IKB | |
| Dell Inspiron 15 7566 PL | |
| MSI GE62VR 6RF-001US | |
| MSI GF62VR 7RF-877 | |
| Asus Strix GL502VM-DS74 | |
| Samsung Odyssey NP800G5M-X01US | |
* ... menor é melhor
| PCMark 8 Home Score Accelerated v2 | 4069 pontos | |
| PCMark 8 Creative Score Accelerated v2 | 5136 pontos | |
| PCMark 8 Work Score Accelerated v2 | 5090 pontos | |
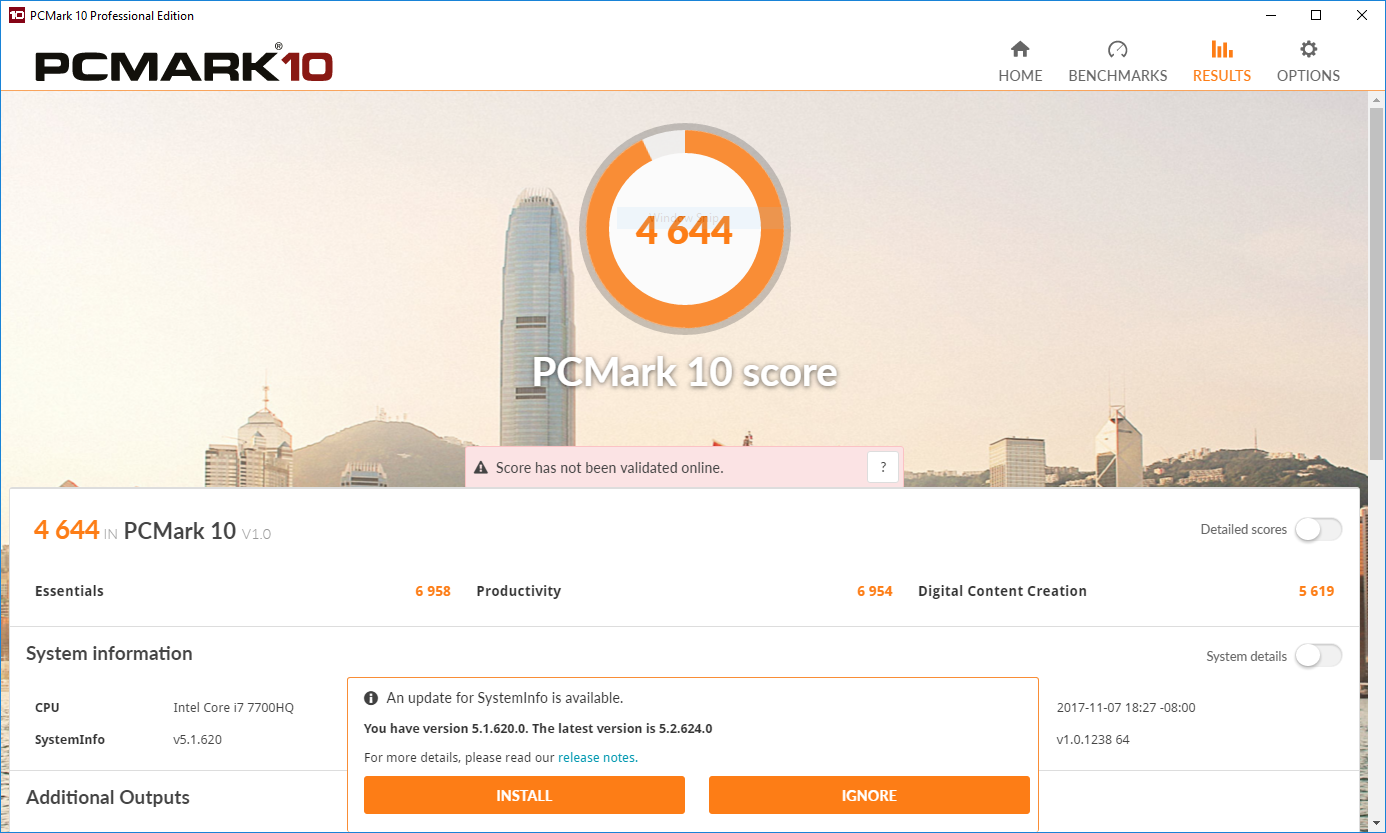
| PCMark 10 Score | 4644 pontos | |
Ajuda | ||
| MSI GF62VR 7RF-877 Intel SSD 600p SSDPEKKW256G7 | MSI GE62VR 6RF-001US Samsung SM951 MZVPV512HDGL m.2 PCI-e | Lenovo Legion Y520-15IKBM 80YY001APB ADATA SX7000NP 256 GB | Schenker XMG A517 Samsung SSD 960 Evo 500GB m.2 NVMe | Gigabyte P55W v7 Liteonit CV3-8D256 | Asus Strix GL502VM-DS74 Samsung SSD 960 Evo 250GB m.2 NVMe | Samsung Odyssey NP800G5M-X01US Samsung PM961 NVMe MZVLW128HEGR | Dell Inspiron 15 7566 PL Toshiba SG5 THNSNK128GVN8 | Acer Aspire VX15 VX5-591G-589S Hynix HFS128G39TND | |
|---|---|---|---|---|---|---|---|---|---|
| AS SSD | 93% | 4% | 180% | -41% | 39% | 33% | -50% | -89% | |
| Copy Game MB/s (MB/s) | 471.7 | 898 90% | 1100 133% | 240.5 -49% | 157.6 -67% | ||||
| Copy Program MB/s (MB/s) | 286.5 | 403.5 41% | 483.6 69% | 299.5 5% | 111.1 -61% | ||||
| Copy ISO MB/s (MB/s) | 1069 | 1225 15% | 1599 50% | 1560 46% | 195 -82% | ||||
| Score Total (Points) | 1324 | 2572 94% | 898 -32% | 4063 207% | 840 -37% | 3501 164% | 1592 20% | 710 -46% | 882 -33% |
| Score Write (Points) | 693 | 581 -16% | 291 -58% | 1575 127% | 248 -64% | 1028 48% | 376 -46% | 218 -69% | 218 -69% |
| Score Read (Points) | 448 | 1327 196% | 409 -9% | 1677 274% | 393 -12% | 1670 273% | 852 90% | 332 -26% | 444 -1% |
| Access Time Write * (ms) | 0.03 | 0.038 -27% | 0.033 -10% | 0.026 13% | 0.083 -177% | 0.3 -900% | 0.031 -3% | 0.08 -167% | 0.261 -770% |
| Access Time Read * (ms) | 0.09 | 0.039 57% | 0.069 23% | 0.036 60% | 0.088 2% | 0.41 -356% | 0.066 27% | 0.099 -10% | 0.077 14% |
| 4K-64 Write (MB/s) | 551 | 329.8 -40% | 100.7 -82% | 1263 129% | 166.6 -70% | 768 39% | 176.4 -68% | 111.8 -80% | 113.9 -79% |
| 4K-64 Read (MB/s) | 280.1 | 1092 290% | 255.9 -9% | 1359 385% | 318.3 14% | 1375 391% | 564 101% | 256.9 -8% | 361.4 29% |
| 4K Write (MB/s) | 118.3 | 103 -13% | 110.6 -7% | 147 24% | 48.47 -59% | 118 0% | 124.1 5% | 92.6 -22% | 90.8 -23% |
| 4K Read (MB/s) | 31.27 | 44.04 41% | 30.9 -1% | 48 54% | 23.34 -25% | 44.55 42% | 44.75 43% | 25.39 -19% | 32.29 3% |
| Seq Write (MB/s) | 234.9 | 1480 530% | 795 238% | 1662 608% | 328.1 40% | 1424 506% | 752 220% | 134.1 -43% | 130.2 -45% |
| Seq Read (MB/s) | 1371 | 1912 39% | 1221 -11% | 2694 96% | 514 -63% | 2505 83% | 2433 77% | 493.2 -64% | 507 -63% |
* ... menor é melhor

| 3DMark | |
| 1280x720 Cloud Gate Standard Graphics | |
| Aorus X9 | |
| MSI GT75VR 7RF-012 Titan Pro | |
| Alienware 15 R3 Max-Q | |
| MSI GF62VR 7RF-877 | |
| Asus Strix GL502VM-DS74 | |
| Lenovo Legion Y920-17IKB | |
| MSI GE62VR 6RF-001US | |
| Lenovo Legion Y520-15IKBM 80YY001APB | |
| Gigabyte P55W v7 | |
| Acer Predator 15 G9-592-7925 | |
| Acer Aspire Nitro BE VN7-793G-5811 | |
| Asus Strix GL502VT-DS74 | |
| Samsung Odyssey NP800G5M-X01US | |
| 1920x1080 Fire Strike Graphics | |
| Aorus X9 | |
| MSI GT75VR 7RF-012 Titan Pro | |
| Alienware 15 R3 Max-Q | |
| Lenovo Legion Y920-17IKB | |
| MSI GF62VR 7RF-877 | |
| MSI GE62VR 6RF-001US | |
| Gigabyte P55W v7 | |
| Asus Strix GL502VM-DS74 | |
| Lenovo Legion Y520-15IKBM 80YY001APB | |
| Acer Aspire Nitro BE VN7-793G-5811 | |
| Acer Predator 15 G9-592-7925 | |
| Asus Strix GL502VT-DS74 | |
| Samsung Odyssey NP800G5M-X01US | |
| 1920x1080 Ice Storm Extreme Graphics | |
| Alienware 15 R3 Max-Q | |
| Asus Strix GL502VM-DS74 | |
| Acer Aspire Nitro BE VN7-793G-5811 | |
| MSI GF62VR 7RF-877 | |
| Asus Strix GL502VT-DS74 | |
| Samsung Odyssey NP800G5M-X01US | |
| MSI GE62VR 6RF-001US | |
| Lenovo Legion Y520-15IKBM 80YY001APB | |
| 3DMark Ice Storm Standard Score | 116682 pontos | |
| 3DMark Cloud Gate Standard Score | 25422 pontos | |
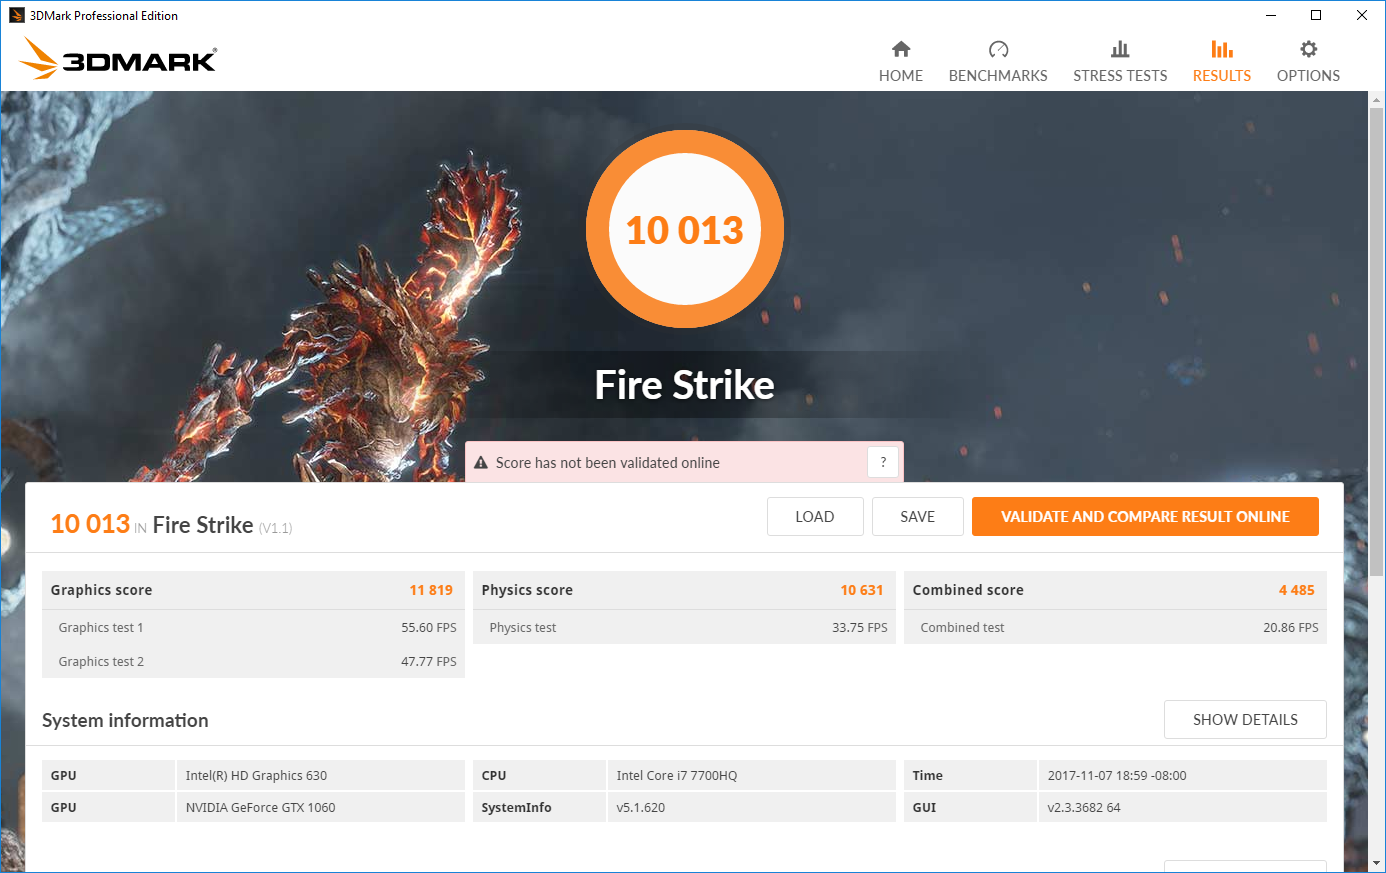
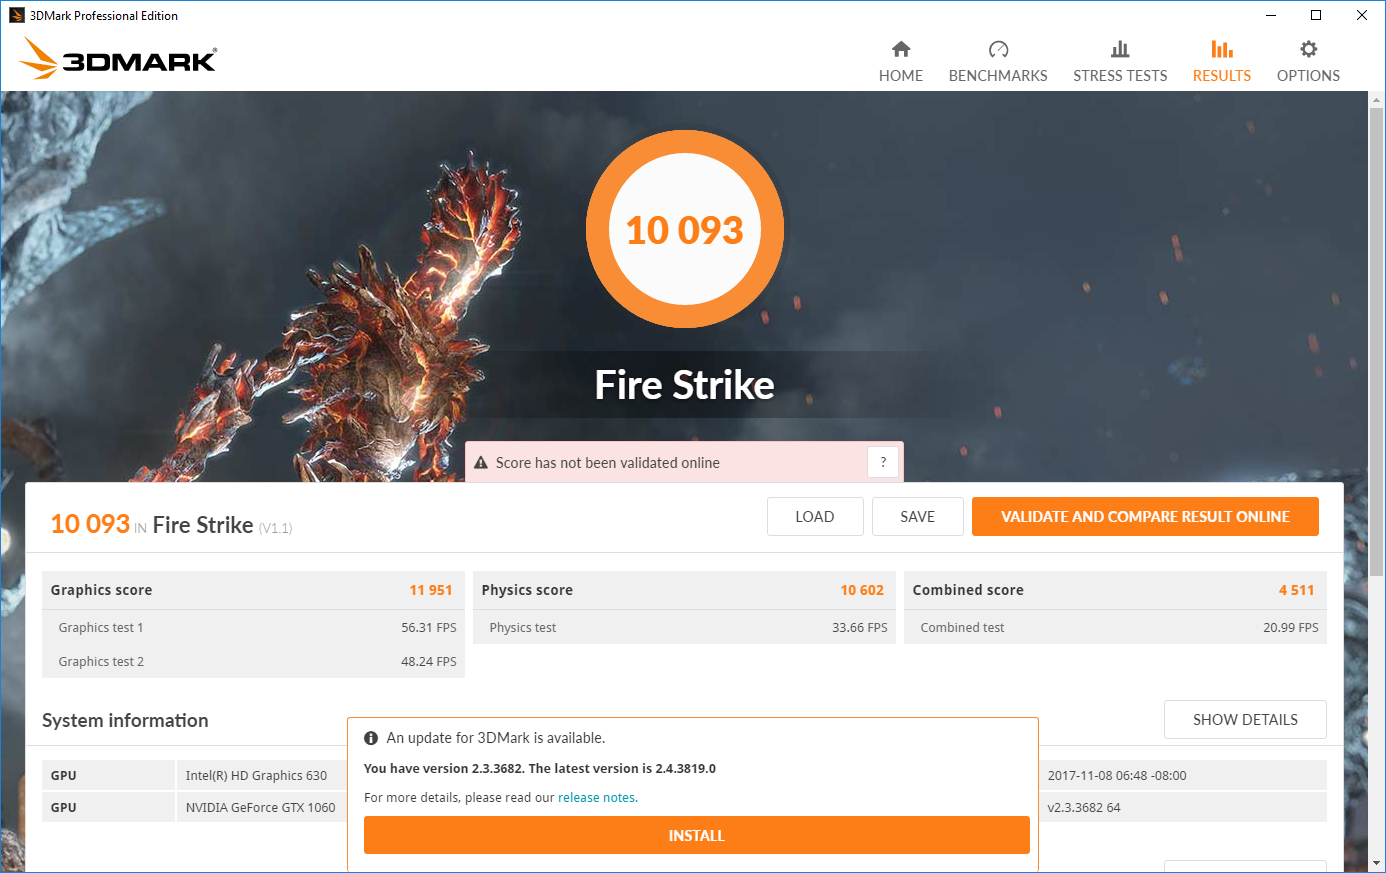
| 3DMark Fire Strike Score | 10093 pontos | |
| 3DMark Fire Strike Extreme Score | 5256 pontos | |
Ajuda | ||
| BioShock Infinite - 1920x1080 Ultra Preset, DX11 (DDOF) | |
| Alienware 15 R3 Max-Q | |
| Lenovo Legion Y920-17IKB | |
| MSI GF62VR 7RF-877 | |
| Asus FX502VM-AS73 | |
| MSI GS63VR 7RF-228US | |
| Hyperbook N85-7300-8-12-1060 | |
| MSI GE72VR-6RF16H21 | |
| MSI GE62VR 6RF-001US | |
| Lenovo Legion Y520-15IKBM 80YY001APB | |
| Acer Aspire Nitro BE VN7-793G-5811 | |
| Acer Aspire VX15 VX5-591G-589S | |
| Dell Inspiron 15 7566 PL | |
| Metro: Last Light - 1920x1080 Very High (DX11) AF:16x | |
| Lenovo Legion Y920-17IKB | |
| Asus FX502VM-AS73 | |
| MSI GS63VR 7RF-228US | |
| MSI GF62VR 7RF-877 | |
| MSI GE62VR 6RF-001US | |
| Thief - 1920x1080 Very High Preset AA:FXAA & High SS AF:8x | |
| Lenovo Legion Y920-17IKB | |
| Asus FX502VM-AS73 | |
| MSI GS63VR 7RF-228US | |
| MSI GF62VR 7RF-877 | |
| MSI GE62VR 6RF-001US | |
| Hyperbook N85-7300-8-12-1060 | |
| Lenovo Legion Y520-15IKBM 80YY001APB | |
| Dell Inspiron 15 7566 PL | |
| The Witcher 3 | |
| 1920x1080 Ultra Graphics & Postprocessing (HBAO+) | |
| Aorus X9 | |
| Alienware 15 R3 Max-Q | |
| Lenovo Legion Y920-17IKB | |
| Lenovo Legion Y920-17IKB | |
| MSI GS63VR 7RF-228US | |
| Hyperbook N85-7300-8-12-1060 | |
| MSI GF62VR 7RF-877 | |
| Gigabyte P55W v7 | |
| Gigabyte Aero 15 | |
| MSI GE72VR-6RF16H21 | |
| Lenovo Legion Y520-15IKBM 80YY001APB | |
| HP Omen 15-ce002ng | |
| Acer Aspire Nitro BE VN7-793G-5811 | |
| Dell Inspiron 15 7566 PL | |
| 1920x1080 High Graphics & Postprocessing (Nvidia HairWorks Off) | |
| Aorus X9 | |
| Alienware 15 R3 Max-Q | |
| MSI GS63VR 7RF-228US | |
| Gigabyte P55W v7 | |
| Gigabyte Aero 15 | |
| MSI GF62VR 7RF-877 | |
| MSI GE72VR-6RF16H21 | |
| HP Omen 15-ce002ng | |
| Hyperbook N85-7300-8-12-1060 | |
| Lenovo Legion Y520-15IKBM 80YY001APB | |
| Acer Aspire Nitro BE VN7-793G-5811 | |
| Dell Inspiron 15 7566 PL | |
| Fallout 4 | |
| 1920x1080 Ultra Preset AA:T AF:16x | |
| Asus FX502VM-AS73 | |
| MSI GF62VR 7RF-877 | |
| MSI GS63VR 7RF-228US | |
| MSI GE62VR 6RF-001US | |
| 1920x1080 High Preset AA:T AF:16x | |
| MSI GF62VR 7RF-877 | |
| Rise of the Tomb Raider | |
| 1920x1080 Very High Preset AA:FX AF:16x | |
| Lenovo Legion Y920-17IKB | |
| MSI GS63VR 7RF-228US | |
| Gigabyte P55W v7 | |
| Asus FX502VM-AS73 | |
| MSI GF62VR 7RF-877 | |
| MSI GE72VR-6RF16H21 | |
| MSI GE62VR 6RF-001US | |
| HP Omen 15-ce002ng | |
| 1920x1080 High Preset AA:FX AF:4x | |
| MSI GF62VR 7RF-877 | |
| Gigabyte P55W v7 | |
| MSI GE72VR-6RF16H21 | |
| HP Omen 15-ce002ng | |
| Hitman 2016 | |
| 1920x1080 Ultra / On AA:SM AF:16x | |
| MSI GF62VR 7RF-877 | |
| 1920x1080 High / On AA:FX AF:8x | |
| MSI GF62VR 7RF-877 | |
| Doom | |
| 1920x1080 Ultra Preset AA:SM | |
| Asus FX502VM-AS73 | |
| MSI GF62VR 7RF-877 | |
| MSI GS63VR 7RF-228US | |
| HP Omen 15-ce002ng | |
| MSI GE62VR 6RF-001US | |
| 1920x1080 High Preset AA:FX | |
| MSI GF62VR 7RF-877 | |
| HP Omen 15-ce002ng | |
| Rocket League | |
| 1920x1080 High Quality AA:High FX | |
| Aorus X9 | |
| MSI GF62VR 7RF-877 | |
| HP Omen 15-ce002ng | |
| 3840x2160 High Quality AA:High FX | |
| Aorus X9 | |
| MSI GF62VR 7RF-877 | |
| HP Omen 15-ce002ng | |
| 1920x1080 Quality AA:Medium FX | |
| MSI GF62VR 7RF-877 | |
| HP Omen 15-ce002ng | |
| Dirt 4 | |
| 3840x2160 Ultra Preset AF:16x | |
| MSI GF62VR 7RF-877 | |
| 1920x1080 Ultra Preset AA:4xMS AF:16x | |
| Aorus X9 | |
| MSI GF62VR 7RF-877 | |
| HP Omen 15-ce002ng | |
| 1920x1080 High Preset AA:2xMS AF:8x | |
| Aorus X9 | |
| MSI GF62VR 7RF-877 | |
| HP Omen 15-ce002ng | |
| Playerunknown's Battlegrounds (PUBG) | |
| 1920x1080 Ultra Preset | |
| Aorus X9 | |
| MSI GF62VR 7RF-877 | |
| 1920x1080 High Preset | |
| Aorus X9 | |
| MSI GF62VR 7RF-877 | |
| baixo | média | alto | ultra | 4K | |
|---|---|---|---|---|---|
| BioShock Infinite (2013) | 108 | ||||
| Metro: Last Light (2013) | 75 | ||||
| Thief (2014) | 71 | ||||
| The Witcher 3 (2015) | 68 | 39 | |||
| Batman: Arkham Knight (2015) | 86 | 61 | |||
| Metal Gear Solid V (2015) | 60 | 60 | |||
| Fallout 4 (2015) | 83 | 69 | |||
| Just Cause 3 (2015) | 79 | 70 | |||
| Rise of the Tomb Raider (2016) | 73 | 60 | |||
| Hitman 2016 (2016) | 58 | 51 | |||
| Ashes of the Singularity (2016) | 45 | ||||
| Doom (2016) | 99 | 93 | |||
| Mafia 3 (2016) | 48 | 40 | |||
| Farming Simulator 17 (2016) | 162 | 150 | |||
| Resident Evil 7 (2017) | 104 | 83 | |||
| Rocket League (2017) | 238 | 171 | 64 | ||
| Dirt 4 (2017) | 98 | 58 | 31 | ||
| Playerunknown's Battlegrounds (PUBG) (2017) | 69 | 53 |
Barulho
| Ocioso |
| 33.5 / 33.5 / 33.5 dB |
| Carga |
| 41.3 / 53.5 dB |
 | ||
30 dB silencioso 40 dB(A) audível 50 dB(A) ruidosamente alto |
||
min: | ||
| MSI GF62VR 7RF-877 GeForce GTX 1060 Mobile, i7-7700HQ, Intel SSD 600p SSDPEKKW256G7 | MSI GE62VR 6RF-001US GeForce GTX 1060 Mobile, 6700HQ, Samsung SM951 MZVPV512HDGL m.2 PCI-e | Gigabyte P55W v7 GeForce GTX 1060 Mobile, i7-7700HQ, Liteonit CV3-8D256 | Lenovo Legion Y520-15IKBM 80YY001APB GeForce GTX 1060 Max-Q, i5-7300HQ, ADATA SX7000NP 256 GB | Schenker XMG A517 GeForce GTX 1060 Mobile, i7-7700HQ, Samsung SSD 960 Evo 500GB m.2 NVMe | Gigabyte Aero 15 GeForce GTX 1060 Mobile, i7-7700HQ, Lite-On CX2-8B512-Q11 | Asus Strix GL502VM-DS74 GeForce GTX 1060 Mobile, i7-7700HQ, Samsung SSD 960 Evo 250GB m.2 NVMe | HP Omen 15-ce002ng GeForce GTX 1060 Max-Q, i7-7700HQ, Samsung PM961 MZVLW256HEHP | Samsung Odyssey NP800G5M-X01US GeForce GTX 1050 Mobile, i7-7700HQ, Samsung PM961 NVMe MZVLW128HEGR | |
|---|---|---|---|---|---|---|---|---|---|
| Noise | 0% | 0% | 6% | -1% | 3% | -2% | 2% | 5% | |
| desligado / ambiente * (dB) | 28.1 | 28.2 -0% | 30 -7% | 30 -7% | 31 -10% | 30.8 -10% | 30 -7% | 28.1 -0% | |
| Idle Minimum * (dB) | 33.5 | 32.8 2% | 33 1% | 30.5 9% | 30 10% | 32 4% | 32 4% | 30 10% | 28.1 16% |
| Idle Average * (dB) | 33.5 | 32.9 2% | 34 -1% | 33 1% | 35 -4% | 33 1% | 32 4% | 33 1% | 29.1 13% |
| Idle Maximum * (dB) | 33.5 | 32.9 2% | 35 -4% | 36.1 -8% | 40 -19% | 34 -1% | 32 4% | 37 -10% | 29.1 13% |
| Load Average * (dB) | 41.3 | 41.6 -1% | 39 6% | 39.4 5% | 43 -4% | 39 6% | 48.3 -17% | 41 1% | 49.2 -19% |
| Witcher 3 ultra * (dB) | 48.5 | 43 11% | 43 11% | 42 13% | |||||
| Load Maximum * (dB) | 53.5 | 55 -3% | 50 7% | 41.5 22% | 49 8% | 50 7% | 51.2 4% | 50 7% | 49.2 8% |
* ... menor é melhor
(-) A temperatura máxima no lado superior é 48.2 °C / 119 F, em comparação com a média de 40.4 °C / 105 F , variando de 21.2 a 68.8 °C para a classe Gaming.
(-) A parte inferior aquece até um máximo de 46 °C / 115 F, em comparação com a média de 43.2 °C / 110 F
(+) Em uso inativo, a temperatura média para o lado superior é 29.8 °C / 86 F, em comparação com a média do dispositivo de 33.9 °C / ### class_avg_f### F.
(±) Jogando The Witcher 3, a temperatura média para o lado superior é 37.9 °C / 100 F, em comparação com a média do dispositivo de 33.9 °C / ## #class_avg_f### F.
(-) Os apoios para as mãos e o touchpad podem ficar muito quentes ao toque, com um máximo de 44.2 °C / 111.6 F.
(-) A temperatura média da área do apoio para as mãos de dispositivos semelhantes foi 28.8 °C / 83.8 F (-15.4 °C / -27.8 F).
MSI GF62VR 7RF-877 análise de áudio
(+) | os alto-falantes podem tocar relativamente alto (###valor### dB)
Graves 100 - 315Hz
(-) | quase nenhum baixo - em média 27.4% menor que a mediana
(±) | a linearidade dos graves é média (10.4% delta para a frequência anterior)
Médios 400 - 2.000 Hz
(±) | médios mais altos - em média 8.5% maior que a mediana
(±) | a linearidade dos médios é média (9.5% delta para frequência anterior)
Altos 2 - 16 kHz
(±) | máximos mais altos - em média 8% maior que a mediana
(±) | a linearidade dos máximos é média (8% delta para frequência anterior)
Geral 100 - 16.000 Hz
(-) | o som geral não é linear (31.8% diferença em relação à mediana)
Comparado com a mesma classe
» 97% de todos os dispositivos testados nesta classe foram melhores, 1% semelhantes, 2% piores
» O melhor teve um delta de 6%, a média foi 18%, o pior foi 132%
Comparado com todos os dispositivos testados
» 91% de todos os dispositivos testados foram melhores, 2% semelhantes, 7% piores
» O melhor teve um delta de 4%, a média foi 23%, o pior foi 134%
MSI GE62VR 6RF-001US análise de áudio
(±) | o volume do alto-falante é médio, mas bom (###valor### dB)
Graves 100 - 315Hz
(±) | graves reduzidos - em média 13.1% menor que a mediana
(±) | a linearidade dos graves é média (12% delta para a frequência anterior)
Médios 400 - 2.000 Hz
(+) | médios equilibrados - apenas 3% longe da mediana
(±) | a linearidade dos médios é média (12% delta para frequência anterior)
Altos 2 - 16 kHz
(+) | agudos equilibrados - apenas 4.4% longe da mediana
(±) | a linearidade dos máximos é média (10.1% delta para frequência anterior)
Geral 100 - 16.000 Hz
(±) | a linearidade do som geral é média (18.6% diferença em relação à mediana)
Comparado com a mesma classe
» 61% de todos os dispositivos testados nesta classe foram melhores, 9% semelhantes, 31% piores
» O melhor teve um delta de 6%, a média foi 18%, o pior foi 132%
Comparado com todos os dispositivos testados
» 42% de todos os dispositivos testados foram melhores, 8% semelhantes, 50% piores
» O melhor teve um delta de 4%, a média foi 23%, o pior foi 134%
| desligado | |
| Ocioso | |
| Carga |
|
Key:
min: | |
| MSI GF62VR 7RF-877 i7-7700HQ, GeForce GTX 1060 Mobile, Intel SSD 600p SSDPEKKW256G7, TN LED, 1920x1080, 15.6" | MSI GE62VR 6RF-001US 6700HQ, GeForce GTX 1060 Mobile, Samsung SM951 MZVPV512HDGL m.2 PCI-e, IPS, 1920x1080, 15.6" | Gigabyte P55W v7 i7-7700HQ, GeForce GTX 1060 Mobile, Liteonit CV3-8D256, IPS, 1920x1080, 15.6" | Lenovo Legion Y520-15IKBM 80YY001APB i5-7300HQ, GeForce GTX 1060 Max-Q, ADATA SX7000NP 256 GB, IPS, 1920x1080, 15.6" | Schenker XMG A517 i7-7700HQ, GeForce GTX 1060 Mobile, Samsung SSD 960 Evo 500GB m.2 NVMe, IPS, 1920x1080, 15.6" | Gigabyte Aero 15 i7-7700HQ, GeForce GTX 1060 Mobile, Lite-On CX2-8B512-Q11, IPS, 1920x1080, 15.6" | Asus Strix GL502VM-DS74 i7-7700HQ, GeForce GTX 1060 Mobile, Samsung SSD 960 Evo 250GB m.2 NVMe, IPS, 1920x1080, 15.6" | HP Omen 15-ce002ng i7-7700HQ, GeForce GTX 1060 Max-Q, Samsung PM961 MZVLW256HEHP, IPS, 1920x1080, 15.6" | Samsung Odyssey NP800G5M-X01US i7-7700HQ, GeForce GTX 1050 Mobile, Samsung PM961 NVMe MZVLW128HEGR, IPS, 1920x1080, 15.6" | |
|---|---|---|---|---|---|---|---|---|---|
| Power Consumption | -45% | 21% | 30% | 9% | 9% | -82% | -12% | 34% | |
| Idle Minimum * (Watt) | 16.2 | 25.4 -57% | 8 51% | 3.9 76% | 8 51% | 12 26% | 38.3 -136% | 18 -11% | 6.7 59% |
| Idle Average * (Watt) | 18.2 | 30.3 -66% | 13 29% | 10.7 41% | 12 34% | 15 18% | 40.5 -123% | 23 -26% | 8.9 51% |
| Idle Maximum * (Watt) | 18.9 | 31.5 -67% | 18 5% | 11.2 41% | 25 -32% | 20 -6% | 42.2 -123% | 30 -59% | 10.8 43% |
| Load Average * (Watt) | 82.7 | 111.8 -35% | 76 8% | 111.5 -35% | 85 -3% | 82 1% | 110.4 -33% | 85 -3% | 81.8 1% |
| Witcher 3 ultra * (Watt) | 125.7 | 110 12% | 111 12% | 96 24% | 92.2 27% | ||||
| Load Maximum * (Watt) | 162.3 | 163.2 -1% | 143 12% | 115.5 29% | 180 -11% | 161 1% | 155.7 4% | 158 3% | 122.7 24% |
* ... menor é melhor
| MSI GF62VR 7RF-877 i7-7700HQ, GeForce GTX 1060 Mobile, 41 Wh | MSI GE62VR 6RF-001US 6700HQ, GeForce GTX 1060 Mobile, 51 Wh | Gigabyte P55W v7 i7-7700HQ, GeForce GTX 1060 Mobile, 63 Wh | Lenovo Legion Y520-15IKBM 80YY001APB i5-7300HQ, GeForce GTX 1060 Max-Q, 45 Wh | Schenker XMG A517 i7-7700HQ, GeForce GTX 1060 Mobile, 62 Wh | Gigabyte Aero 15 i7-7700HQ, GeForce GTX 1060 Mobile, 94.24 Wh | Asus Strix GL502VM-DS74 i7-7700HQ, GeForce GTX 1060 Mobile, 64 Wh | HP Omen 15-ce002ng i7-7700HQ, GeForce GTX 1060 Max-Q, 70 Wh | Samsung Odyssey NP800G5M-X01US i7-7700HQ, GeForce GTX 1050 Mobile, 43 Wh | |
|---|---|---|---|---|---|---|---|---|---|
| Duração da bateria | -14% | 235% | 300% | 158% | 239% | -6% | 71% | 161% | |
| Reader / Idle (h) | 2.8 | 2.3 -18% | 13.2 371% | 11.2 300% | 7.5 168% | 10.6 279% | 1.7 -39% | 4.3 54% | 10.2 264% |
| WiFi v1.3 (h) | 1.9 | 1.7 -11% | 5.8 205% | 5 163% | 7 268% | 1.5 -21% | 3.3 74% | 4.4 132% | |
| Load (h) | 0.7 | 0.6 -14% | 1.6 129% | 1.7 143% | 1.9 171% | 1 43% | 1.3 86% | 1.3 86% | |
| WiFi (h) | 4 |
Pro
Contra

No papel, não há nada muito especial sobre o MSI GF62VR. Embora ofereça um desempenho bom e consistente e uma tela rica em cores, estes são opacados por uma tela TN de má qualidade com terrível precisão de cores e ventoinhas irritantes. A história do GF62VR é de compromisso; por cada ponto positivo, há um negativo. O resultado final é um excelente portátil de jogos que fica curto em algumas áreas críticas (principalmente qualidade da tela, ruído da ventoinha e qualidade de construção).
No entanto, quando se considera o preço atual, o portátil se torna muito mais atraente. A partir de USD $1300, o GF62VR cai na faixa de preços para portáteis que ostentam a GTX 1050 Ti. A maioria dos portáteis com componentes similares estão a partir de $200-300 a mais. Adicione o fato de que o desempenho dos jogos tende a derrubar concorrentes e o GF62VR de repente se torna um dos melhores portáteis de jogos no mercado atualmente.
Há um grande intercâmbio a considerar aqui. Por essa ótima relação preço/desempenho, os usuários terão que aguentar uma tela (francamente) terrível que exige calibração, ventoinhas barulhentas, e uma carcaça de plástico que tenta e não consegue imitar um chassi mais premium. Mas esse intercâmbio pode valer a pena para alguns consumidores.
Para os jogadores que não se importam muito com a estética e querem jogar enquanto estão em movimento, é difícil vencer o GF62VR atualmente. O principal concorrente do GF62VR é realmente o mais antigo GE62VR que está substituindo. Se você puder encontrar um GE62VR no mercado de usados, com uma tela IPS, provavelmente seria a melhor compra. No entanto, se você tiver que ter um novo portátil de jogos com uma GTX 1060, que ofereça o melhor valor, o GF62VR deve ser em ou estar perto do topo da sua lista.
MSI GF62VR 7RF-877
- 11/10/2017 v6 (old)
Sam Medley
Price comparison
