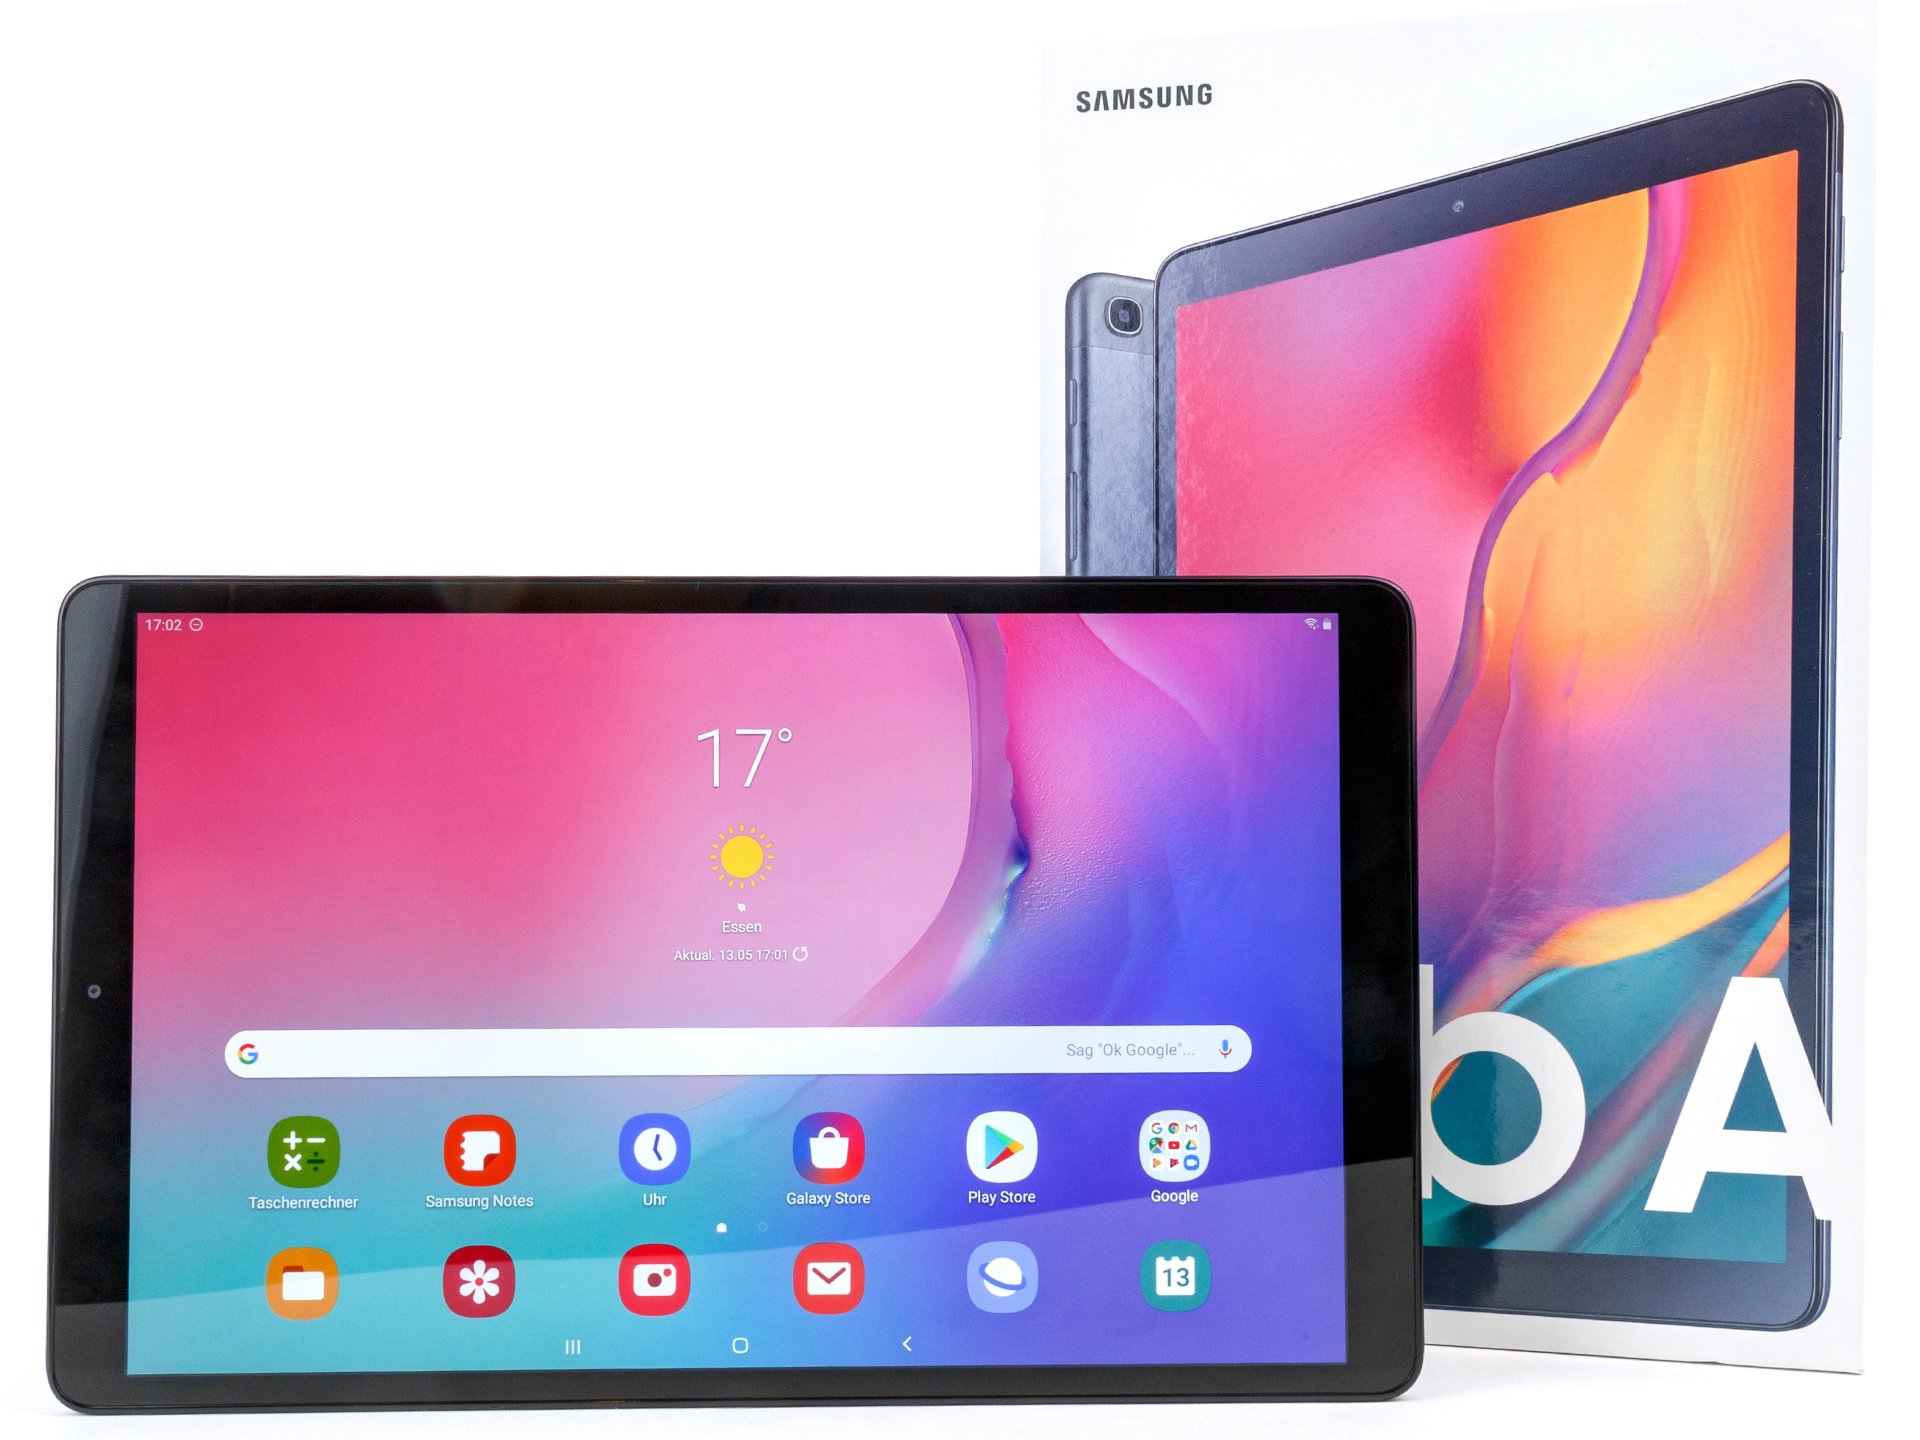
Breve Análise do Tablet Samsung Galaxy Tab A 10.1 (2019)


| |||||||||||||||||||||||||
iluminação: 86 %
iluminação com acumulador: 401 cd/m²
Contraste: 802:1 (Preto: 0.5 cd/m²)
ΔE ColorChecker Calman: 2.9 | ∀{0.5-29.43 Ø4.73}
ΔE Greyscale Calman: 4.1 | ∀{0.09-98 Ø4.97}
96.2% sRGB (Calman 2D)
Gamma: 2.36
CCT: 7263 K
| Samsung Galaxy Tab A 10.1 2019 TFT-LCD, 1920x1200, 10.1" | Samsung Galaxy Tab A 10.1 2016 SM-T585 TFT, 1920x1200, 10.1" | Amazon Fire HD 10 2017 IPS, 1920x1200, 10.1" | Huawei MediaPad M5 lite IPS, 1920x1200, 10.1" | Lenovo Tab M10 IPS, 1920x1200, 10.1" | Samsung Galaxy Tab A 10.5 SM-T590N IPS, 1920x1200, 10.5" | Samsung Galaxy Tab S5e SM-T720 Super AMOLED, 2560x1600, 10.5" | Apple iPad 6 2018 IPS, 2048x1536, 9.7" | |
|---|---|---|---|---|---|---|---|---|
| Screen | -5% | -5% | -37% | -41% | 35% | 25% | 29% | |
| Brightness middle (cd/m²) | 401 | 542 35% | 426 6% | 514 28% | 339 -15% | 556 39% | 452 13% | 530 32% |
| Brightness (cd/m²) | 396 | 520 31% | 399 1% | 492 24% | 327 -17% | 514 30% | 453 14% | 513 30% |
| Brightness Distribution (%) | 86 | 91 6% | 91 6% | 80 -7% | 86 0% | 87 1% | 90 5% | 92 7% |
| Black Level * (cd/m²) | 0.5 | 0.68 -36% | 0.38 24% | 0.96 -92% | 0.42 16% | 0.42 16% | 0.61 -22% | |
| Contrast (:1) | 802 | 797 -1% | 1121 40% | 535 -33% | 807 1% | 1324 65% | 869 8% | |
| Colorchecker dE 2000 * | 2.9 | 4.2 -45% | 4.5 -55% | 5.42 -87% | 5.8 -100% | 1.8 38% | 1.7 41% | 1.2 59% |
| Colorchecker dE 2000 max. * | 5.8 | 6.7 -16% | 7.9 -36% | 9.84 -70% | 11.6 -100% | 3.2 45% | 3.7 36% | 3.2 45% |
| Greyscale dE 2000 * | 4.1 | 4.8 -17% | 5.2 -27% | 6.5 -59% | 8.6 -110% | 2.2 46% | 2.4 41% | 1 76% |
| Gamma | 2.36 93% | 2.42 91% | 2.23 99% | 2.216 99% | 2.16 102% | 2.26 97% | 2.07 106% | 2.28 96% |
| CCT | 7263 89% | 7434 87% | 6875 95% | 6780 96% | 8718 75% | 6819 95% | 6337 103% | 6588 99% |
* ... menor é melhor
Cintilação da tela / PWM (modulação por largura de pulso)
| Tela tremeluzindo / PWM não detectado | 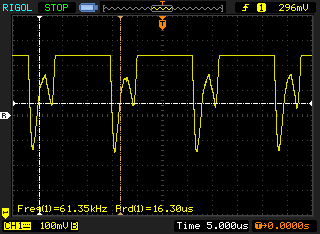 | ||
[pwm_comparison] Em comparação: 52 % de todos os dispositivos testados não usam PWM para escurecer a tela. Se PWM foi detectado, uma média de 7784 (mínimo: 5 - máximo: 343500) Hz foi medida. | |||
Exibir tempos de resposta
| ↔ Tempo de resposta preto para branco | ||
|---|---|---|
| 31.6 ms ... ascensão ↗ e queda ↘ combinadas | ↗ 13.6 ms ascensão | 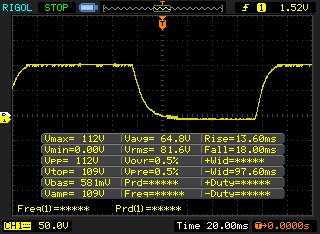 |
| ↘ 18 ms queda | ||
| A tela mostra taxas de resposta lentas em nossos testes e será insatisfatória para os jogadores. Em comparação, todos os dispositivos testados variam de 0.1 (mínimo) a 240 (máximo) ms. » 85 % de todos os dispositivos são melhores. Isso significa que o tempo de resposta medido é pior que a média de todos os dispositivos testados (19.9 ms). | ||
| ↔ Tempo de resposta 50% cinza a 80% cinza | ||
| 52.8 ms ... ascensão ↗ e queda ↘ combinadas | ↗ 26.8 ms ascensão | 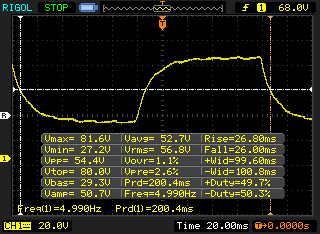 |
| ↘ 26 ms queda | ||
| A tela mostra taxas de resposta lentas em nossos testes e será insatisfatória para os jogadores. Em comparação, todos os dispositivos testados variam de 0.165 (mínimo) a 636 (máximo) ms. » 89 % de todos os dispositivos são melhores. Isso significa que o tempo de resposta medido é pior que a média de todos os dispositivos testados (31.1 ms). | ||
| Geekbench 3 | |
| 64 Bit Single-Core Score | |
| Samsung Galaxy Tab S5e SM-T720 | |
| Samsung Galaxy Tab A 10.1 2019 | |
| Média Samsung Exynos 7904 (n=1) | |
| Samsung Galaxy Tab A 10.1 2016 SM-T585 | |
| 64 Bit Multi-Core Score | |
| Samsung Galaxy Tab S5e SM-T720 | |
| Samsung Galaxy Tab A 10.1 2016 SM-T585 | |
| Samsung Galaxy Tab A 10.1 2019 | |
| Média Samsung Exynos 7904 (n=1) | |
| Basemark GPU 1.1 | |
| 1920x1080 Vulkan Medium Offscreen | |
| Samsung Galaxy Tab S5e SM-T720 | |
| Média Samsung Exynos 7904 (n=1) | |
| Samsung Galaxy Tab A 10.1 2019 | |
| Vulkan Medium Native | |
| Samsung Galaxy Tab S5e SM-T720 | |
| Média Samsung Exynos 7904 (n=1) | |
| Samsung Galaxy Tab A 10.1 2019 | |
| 1920x1080 OpenGL Medium Offscreen | |
| Samsung Galaxy Tab S5e SM-T720 | |
| Samsung Galaxy Tab A 10.1 2019 | |
| Média Samsung Exynos 7904 (6.21 - 8.72, n=2) | |
| VRMark - Amber Room | |
| Samsung Galaxy Tab S5e SM-T720 | |
| Média Samsung Exynos 7904 (n=1) | |
| Basemark ES 3.1 / Metal - offscreen Overall Score | |
| Média da turma Tablet (255 - 5784, n=7, últimos 2 anos) | |
| Apple iPad 6 2018 | |
| Samsung Galaxy Tab S5e SM-T720 | |
| Samsung Galaxy Tab A 10.1 2019 | |
| Média Samsung Exynos 7904 (241 - 301, n=2) | |
| Jetstream 2 - 2.0 Total | |
| Média da turma Tablet (35.8 - 395, n=58, últimos 2 anos) | |
| Samsung Galaxy Tab S5e SM-T720 (Chrome 74.0.3729.136) | |
| Média Samsung Exynos 7904 (22.1 - 25.7, n=4) | |
| Samsung Galaxy Tab A 10.1 2019 (Samung Browser 9.2) | |
| JetStream 1.1 - 1.1 Total | |
| Apple iPad 6 2018 (Safari Mobile 11.3) | |
| Samsung Galaxy Tab S5e SM-T720 (Chrome 74.0.3729.136) | |
| Amazon Fire HD 10 2017 (Amazon Silk 61.2) | |
| Média Samsung Exynos 7904 (42.2 - 45.1, n=4) | |
| Samsung Galaxy Tab A 10.1 2019 (Samsung Browser 9.2) | |
| Huawei MediaPad M5 lite (Chrome 67) | |
| Samsung Galaxy Tab A 10.1 2016 SM-T585 (Chrome 52.0.2743.98) | |
| Lenovo Tab M10 (Chrome 71.0.3578.99) | |
| Samsung Galaxy Tab A 10.5 SM-T590N (Chrome 69.0.3497.100) | |
| WebXPRT 3 - Overall | |
| Média da turma Tablet (108 - 480, n=10, últimos 2 anos) | |
| Apple iPad 6 2018 (Safari Mobile 10) | |
| Samsung Galaxy Tab S5e SM-T720 (Chrome 74.0.3729.136) | |
| Samsung Galaxy Tab A 10.1 2019 (Samsung Browser 9.2) | |
| Média Samsung Exynos 7904 (43 - 56, n=4) | |
| Huawei MediaPad M5 lite (Chrome 67) | |
| Lenovo Tab M10 (Chrome 71.0.3578.99) | |
| Samsung Galaxy Tab A 10.5 SM-T590N (Chrome 69.0.3497.100) | |
| Speedometer 2.0 - Result 2.0 | |
| Média da turma Tablet (2.59 - 790, n=37, últimos 2 anos) | |
| Apple iPad 6 2018 (IOS 12.1.1) | |
| Samsung Galaxy Tab S5e SM-T720 (Chrome 74.0.3729.136) | |
| Média Samsung Exynos 7904 (19.3 - 24.1, n=4) | |
| Samsung Galaxy Tab A 10.1 2019 (Samsung Browser 9.2) | |
| Octane V2 - Total Score | |
| Média da turma Tablet (763 - 138481, n=73, últimos 2 anos) | |
| Apple iPad 6 2018 (Safari Mobile 11.3) | |
| Samsung Galaxy Tab S5e SM-T720 (Chrome 74.0.3729.136) | |
| Samsung Galaxy Tab A 10.1 2019 (Samsung Browser 9.2) | |
| Amazon Fire HD 10 2017 (Amazon Silk 61.2) | |
| Média Samsung Exynos 7904 (7798 - 9087, n=4) | |
| Huawei MediaPad M5 lite (Chrome 67) | |
| Samsung Galaxy Tab A 10.5 SM-T590N (Chrome 69.0.3497.100) | |
| Lenovo Tab M10 (Chrome 71.0.3578.99) | |
| Samsung Galaxy Tab A 10.1 2016 SM-T585 (Chrome 52.0.2743.98) | |
| Mozilla Kraken 1.1 - Total | |
| Samsung Galaxy Tab A 10.5 SM-T590N (Chrome 69.0.3497.100) | |
| Lenovo Tab M10 (Chrome 71.0.3578.99) | |
| Samsung Galaxy Tab A 10.1 2016 SM-T585 (Chrome 52.0.2743.98) | |
| Huawei MediaPad M5 lite (Chrome 67) | |
| Média Samsung Exynos 7904 (3703 - 5707, n=4) | |
| Samsung Galaxy Tab A 10.1 2019 (Samsung Browser 9.2) | |
| Amazon Fire HD 10 2017 (Amazon Silk 61.2) | |
| Samsung Galaxy Tab S5e SM-T720 (Chrome 74.0.3729.136) | |
| Média da turma Tablet (243 - 27101, n=67, últimos 2 anos) | |
| Apple iPad 6 2018 (Safari Mobile 11.3) | |
* ... menor é melhor
| Samsung Galaxy Tab A 10.1 2019 | Samsung Galaxy Tab A 10.5 SM-T590N | Samsung Galaxy Tab A 10.1 2016 SM-T585 | Huawei MediaPad M5 lite | Amazon Fire HD 10 2017 | Lenovo Tab M10 | Samsung Galaxy Tab S5e SM-T720 | Média 32 GB eMMC Flash | Média da turma Tablet | |
|---|---|---|---|---|---|---|---|---|---|
| AndroBench 3-5 | 5% | -31% | 101% | -18% | -12% | 32% | 4% | 1305% | |
| Sequential Read 256KB (MB/s) | 300 | 285.6 -5% | 215.8 -28% | 308.1 3% | 262.2 -13% | 279.9 -7% | 294.4 -2% | 242 ? -19% | 1986 ? 562% |
| Sequential Write 256KB (MB/s) | 90.7 | 103.3 14% | 45.88 -49% | 82.6 -9% | 147.7 63% | 52.6 -42% | 197.1 117% | 100.5 ? 11% | 1582 ? 1644% |
| Random Read 4KB (MB/s) | 62.6 | 71.1 14% | 23.46 -63% | 73.5 17% | 27.72 -56% | 52.5 -16% | 79.2 27% | 43.1 ? -31% | 271 ? 333% |
| Random Write 4KB (MB/s) | 11.37 | 13.39 18% | 10.01 -12% | 77.3 580% | 9.37 -18% | 11.32 0% | 18.79 65% | 22.3 ? 96% | 316 ? 2679% |
| Sequential Read 256KB SDCard (MB/s) | 81.2 ? | 80.6 ? -1% | 75.5 ? -7% | 83.7 ? 3% | 55.5 ? -32% | 83.5 ? 3% | 76.1 ? -6% | 71.8 ? -12% | |
| Sequential Write 256KB SDCard (MB/s) | 65.6 ? | 60.4 ? -8% | 50.1 ? -24% | 72.8 ? 11% | 30.14 ? -54% | 61.2 ? -7% | 60.8 ? -7% | 52.9 ? -19% |
PUBG Mobile
Asphalt 9
Battle Bay
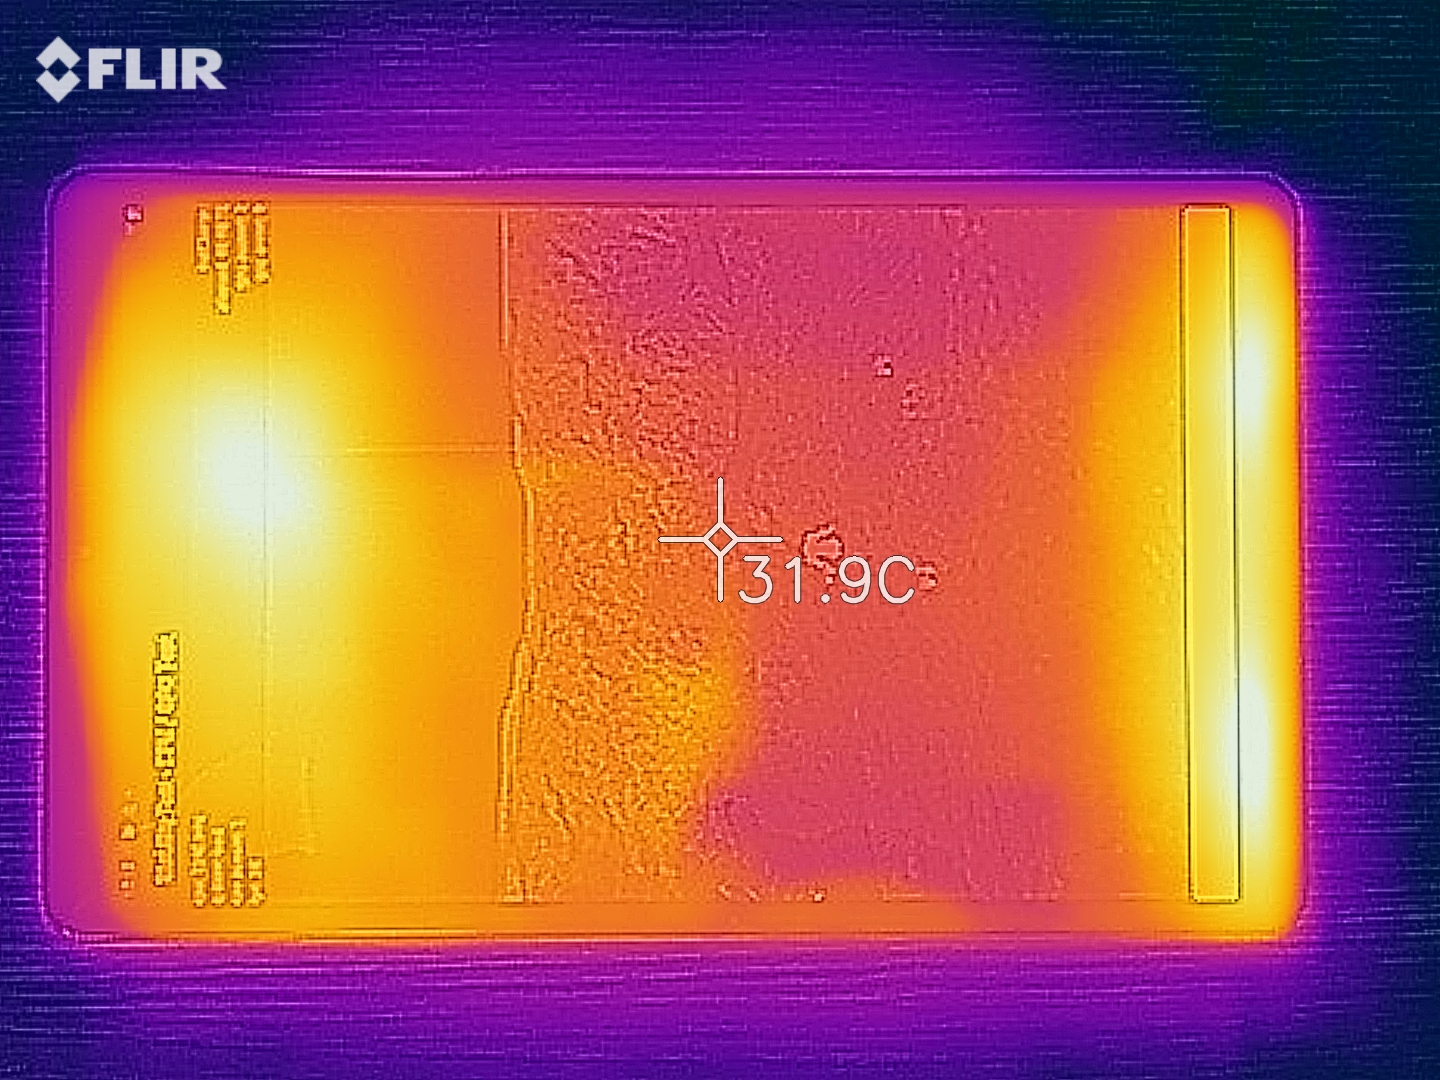
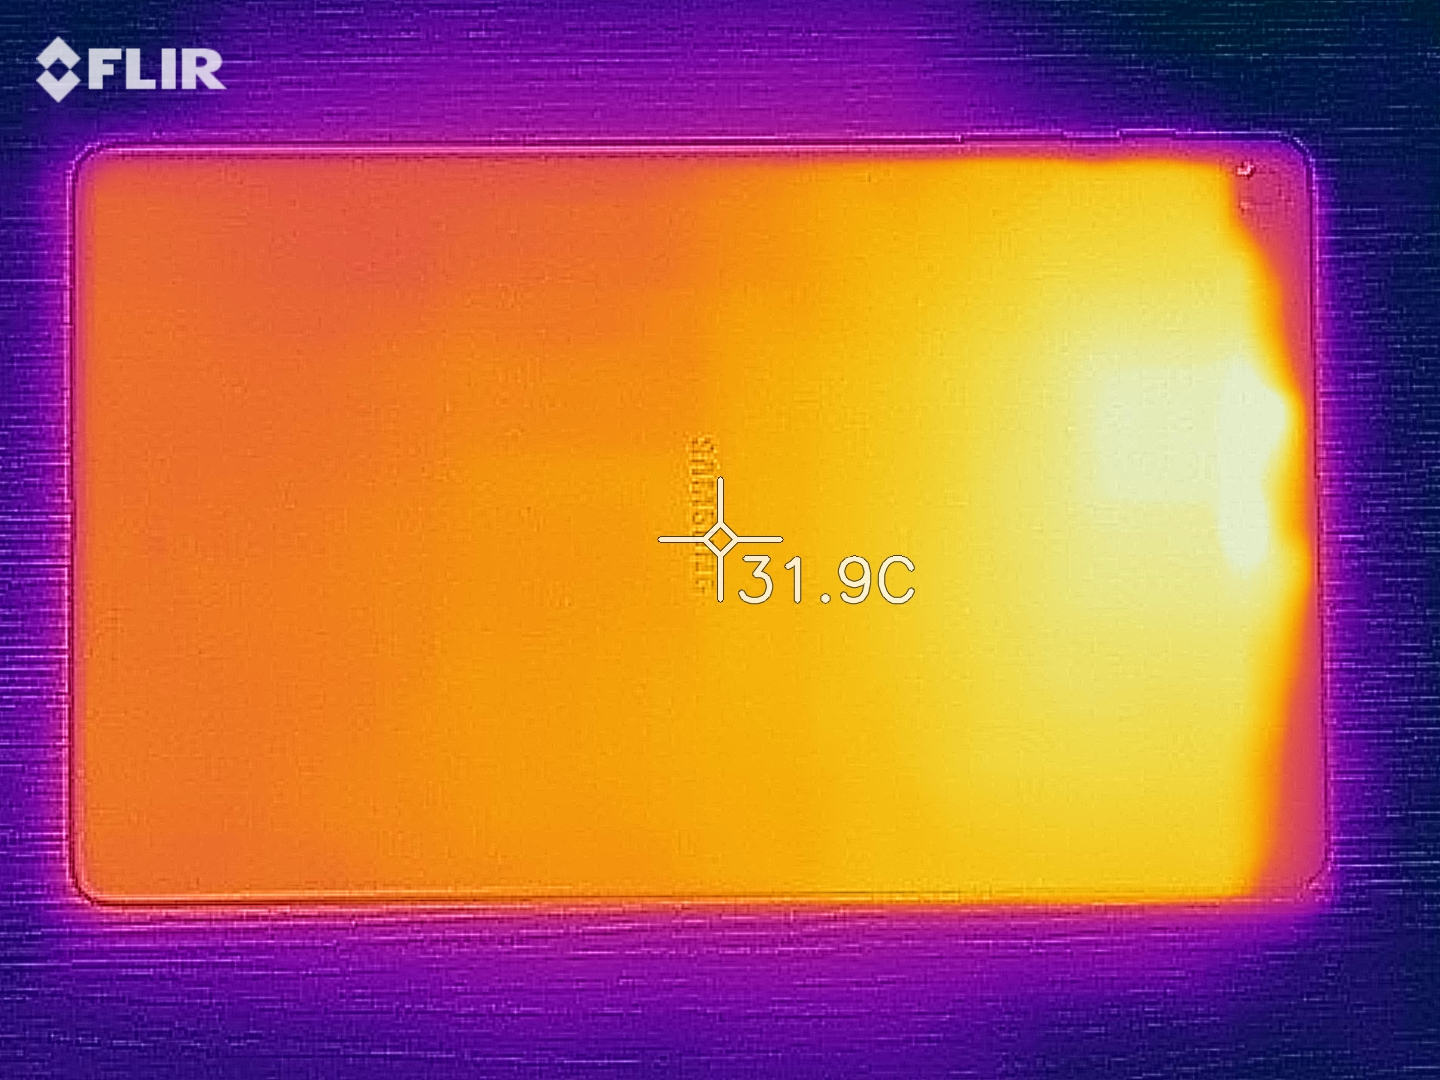
(+) A temperatura máxima no lado superior é 36.3 °C / 97 F, em comparação com a média de 33.6 °C / 92 F , variando de 20.7 a 53.2 °C para a classe Tablet.
(+) A parte inferior aquece até um máximo de 33.2 °C / 92 F, em comparação com a média de 33.2 °C / 92 F
(+) Em uso inativo, a temperatura média para o lado superior é 29.4 °C / 85 F, em comparação com a média do dispositivo de 30 °C / ### class_avg_f### F.
Samsung Galaxy Tab A 10.1 2019 análise de áudio
(+) | os alto-falantes podem tocar relativamente alto (###valor### dB)
Graves 100 - 315Hz
(-) | quase nenhum baixo - em média 18.9% menor que a mediana
(±) | a linearidade dos graves é média (13.3% delta para a frequência anterior)
Médios 400 - 2.000 Hz
(+) | médios equilibrados - apenas 2.1% longe da mediana
(+) | médios são lineares (3.9% delta para frequência anterior)
Altos 2 - 16 kHz
(±) | máximos mais altos - em média 5.6% maior que a mediana
(+) | os máximos são lineares (5.2% delta da frequência anterior)
Geral 100 - 16.000 Hz
(±) | a linearidade do som geral é média (15% diferença em relação à mediana)
Comparado com a mesma classe
» 33% de todos os dispositivos testados nesta classe foram melhores, 3% semelhantes, 65% piores
» O melhor teve um delta de 7%, a média foi 20%, o pior foi 129%
Comparado com todos os dispositivos testados
» 21% de todos os dispositivos testados foram melhores, 4% semelhantes, 75% piores
» O melhor teve um delta de 4%, a média foi 24%, o pior foi 134%
Huawei MediaPad M5 lite análise de áudio
(±) | o volume do alto-falante é médio, mas bom (###valor### dB)
Graves 100 - 315Hz
(-) | quase nenhum baixo - em média 63.6% menor que a mediana
(+) | o baixo é linear (0% delta para a frequência anterior)
Médios 400 - 2.000 Hz
(-) | quase nenhum médio - em média 63.6% menor que a mediana
(+) | médios são lineares (0% delta para frequência anterior)
Altos 2 - 16 kHz
(-) | quase nenhum máximo - em média 63.6% menor que a mediana
(+) | os máximos são lineares (0% delta da frequência anterior)
Geral 100 - 16.000 Hz
(-) | o som geral não é linear (116% diferença em relação à mediana)
Comparado com a mesma classe
» 99% de todos os dispositivos testados nesta classe foram melhores, 0% semelhantes, 1% piores
» O melhor teve um delta de 7%, a média foi 20%, o pior foi 129%
Comparado com todos os dispositivos testados
» 96% de todos os dispositivos testados foram melhores, 1% semelhantes, 2% piores
» O melhor teve um delta de 4%, a média foi 24%, o pior foi 134%
| desligado | |
| Ocioso | |
| Carga |
|
Key:
min: | |
| Samsung Galaxy Tab A 10.1 2019 6150 mAh | Samsung Galaxy Tab A 10.5 SM-T590N 7300 mAh | Samsung Galaxy Tab A 10.1 2016 SM-T585 7300 mAh | Huawei MediaPad M5 lite 7500 mAh | Amazon Fire HD 10 2017 6300 mAh | Apple iPad 6 2018 mAh | Samsung Galaxy Tab S5e SM-T720 7040 mAh | |
|---|---|---|---|---|---|---|---|
| Power Consumption | 17% | 12% | 4% | 3% | -60% | 15% | |
| Idle Minimum * (Watt) | 1.66 | 1.26 24% | 1.18 29% | 2.8 -69% | 1.55 7% | 2.2 -33% | 2.07 -25% |
| Idle Average * (Watt) | 4.28 | 4.22 1% | 4.65 -9% | 3.3 23% | 4.17 3% | 7.8 -82% | 3.94 8% |
| Idle Maximum * (Watt) | 4.44 | 4.29 3% | 4.74 -7% | 3.9 12% | 4.25 4% | 7.9 -78% | 3.96 11% |
| Load Average * (Watt) | 7.53 | 5.48 27% | 5.75 24% | 5.2 31% | 7.13 5% | 12.6 -67% | 4.07 46% |
| Load Maximum * (Watt) | 9.09 | 6.57 28% | 6.97 23% | 7.2 21% | 9.63 -6% | 12.8 -41% | 5.73 37% |
* ... menor é melhor
| Samsung Galaxy Tab A 10.1 2019 6150 mAh | Samsung Galaxy Tab A 10.1 2016 SM-T585 7300 mAh | Samsung Galaxy Tab A 10.5 SM-T590N 7300 mAh | Amazon Fire HD 10 2017 6300 mAh | Huawei MediaPad M5 lite 7500 mAh | Samsung Galaxy Tab S5e SM-T720 7040 mAh | Apple iPad 6 2018 mAh | |
|---|---|---|---|---|---|---|---|
| Duração da bateria | 30% | 21% | -28% | 15% | -10% | -25% | |
| Reader / Idle (h) | 25 | 43.9 76% | 32.7 31% | 16 -36% | 36 44% | 21.1 -16% | |
| H.264 (h) | 14 | 14.9 6% | 16.1 15% | 9.8 -30% | 15.6 11% | 14.4 3% | |
| WiFi v1.3 (h) | 12.1 | 13.8 14% | 15.6 29% | 9 -26% | 14.2 17% | 10.4 -14% | 11.9 -2% |
| Load (h) | 5.8 | 7.1 22% | 6.4 10% | 4.6 -21% | 5 -14% | 5 -14% | 3.1 -47% |
Pro
Contra

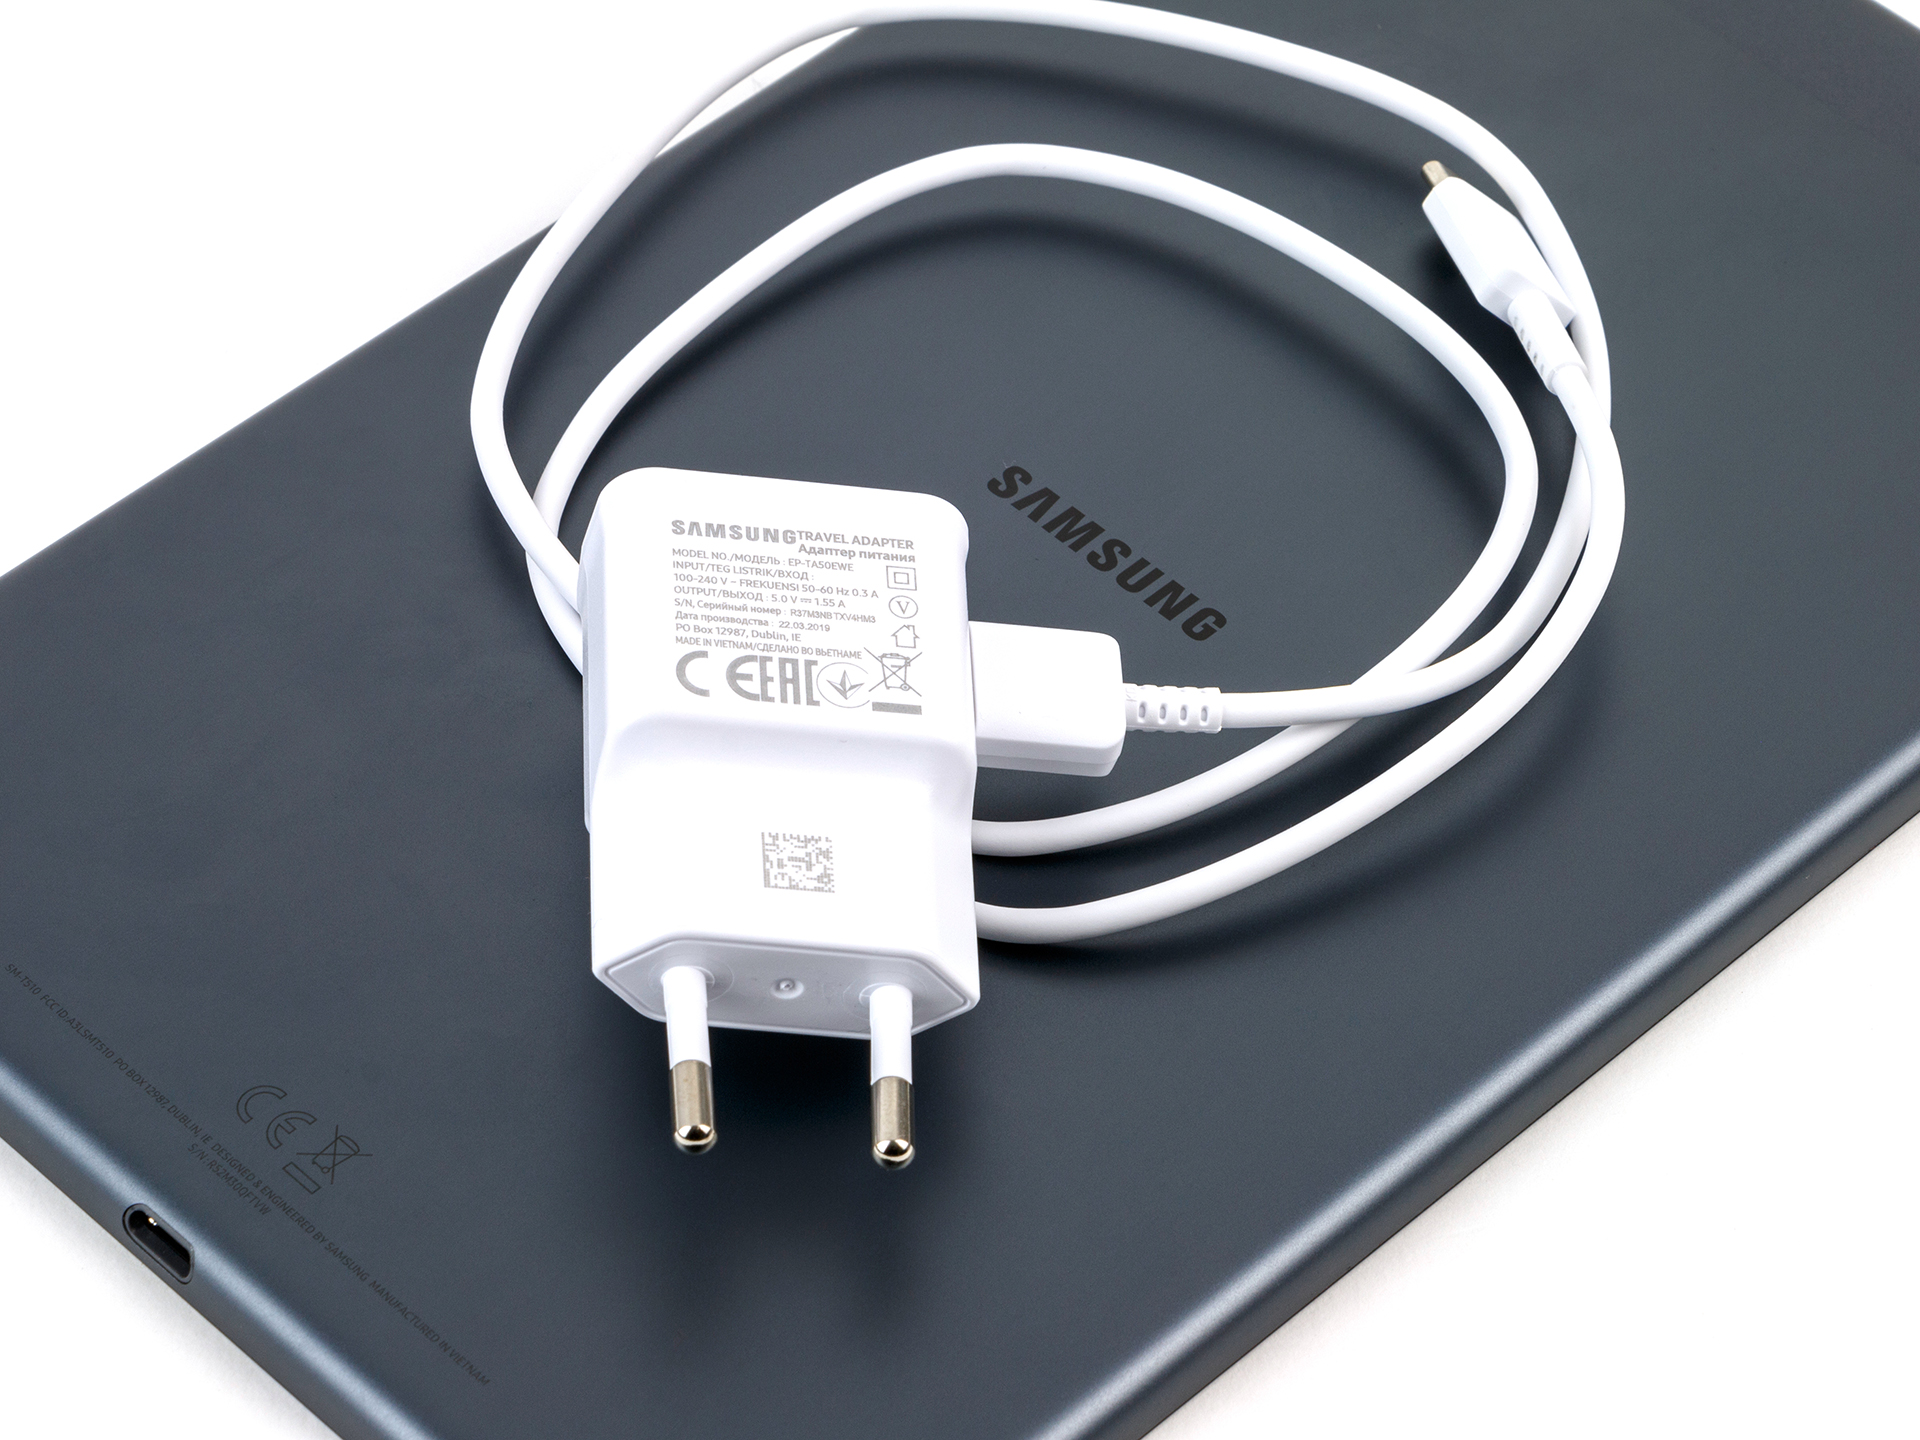
O Samsung Galaxy Tab A 10.1 (2019) é um tablet de nível básico acessível que já pode ser encontrado por menos de € 200 (~$ 223 USD). O mesmo se aplica ao seu antecessor, que tem uma melhor tela, alto-falantes e mais memória RAM. Além disso, o Tab A 10.5 tem uma duração de bateria mais longa e suporta um teclado opcional. O Tab A 10.1 brilha com seu SoC aprimorado e sua versão mais recente do Android. Vale a pena mencionar o último, pois os tablets muitas vezes não recebem atualizações de software com a mesma frequência que os smartphones.
No geral, escolher entre o Tab A 10.1 e seu antecessor depende do que você acha importante em um tablet. A diferença de preço entre os dois dispositivos provavelmente diminuirá no futuro, o que tornaria o Tab A 10.1 mais uma opção atraente.
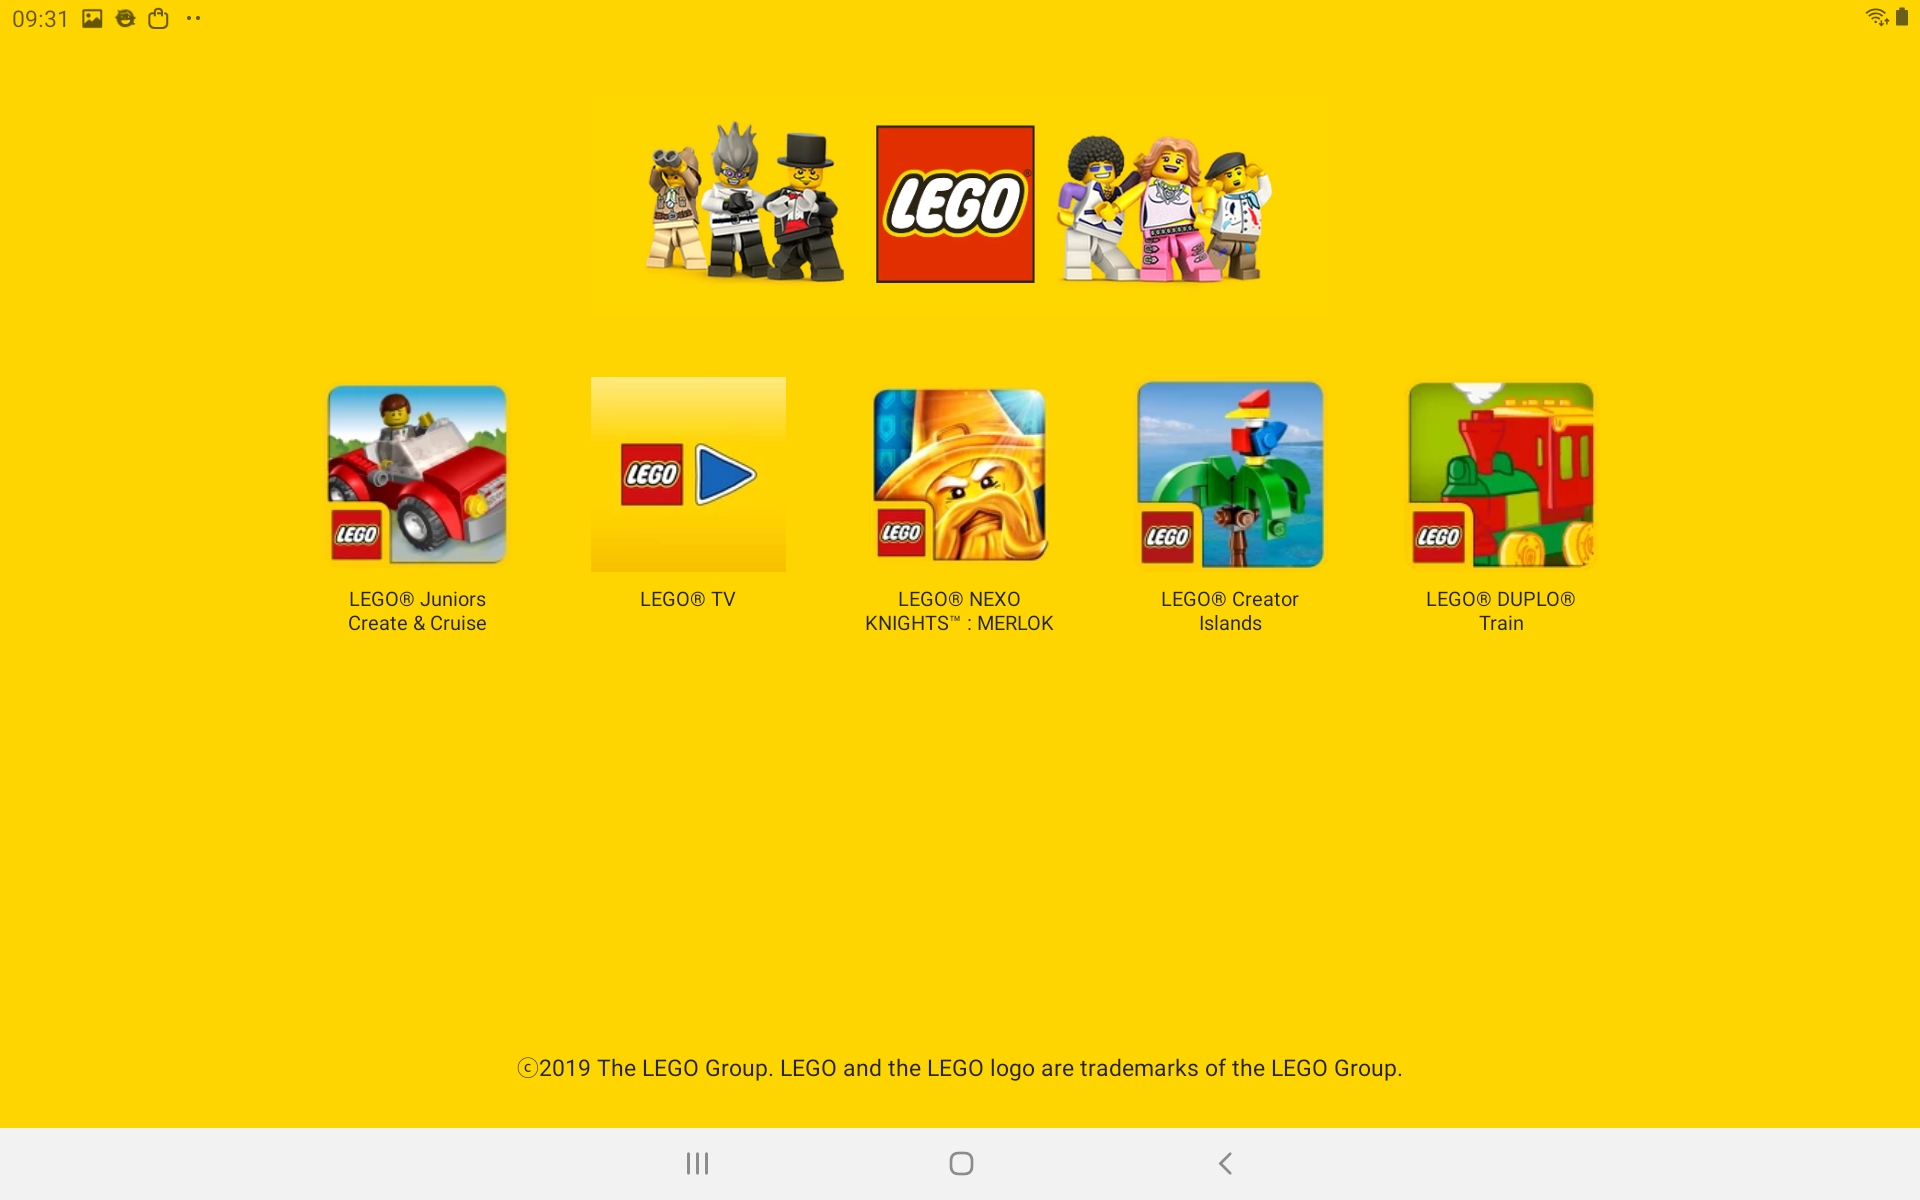
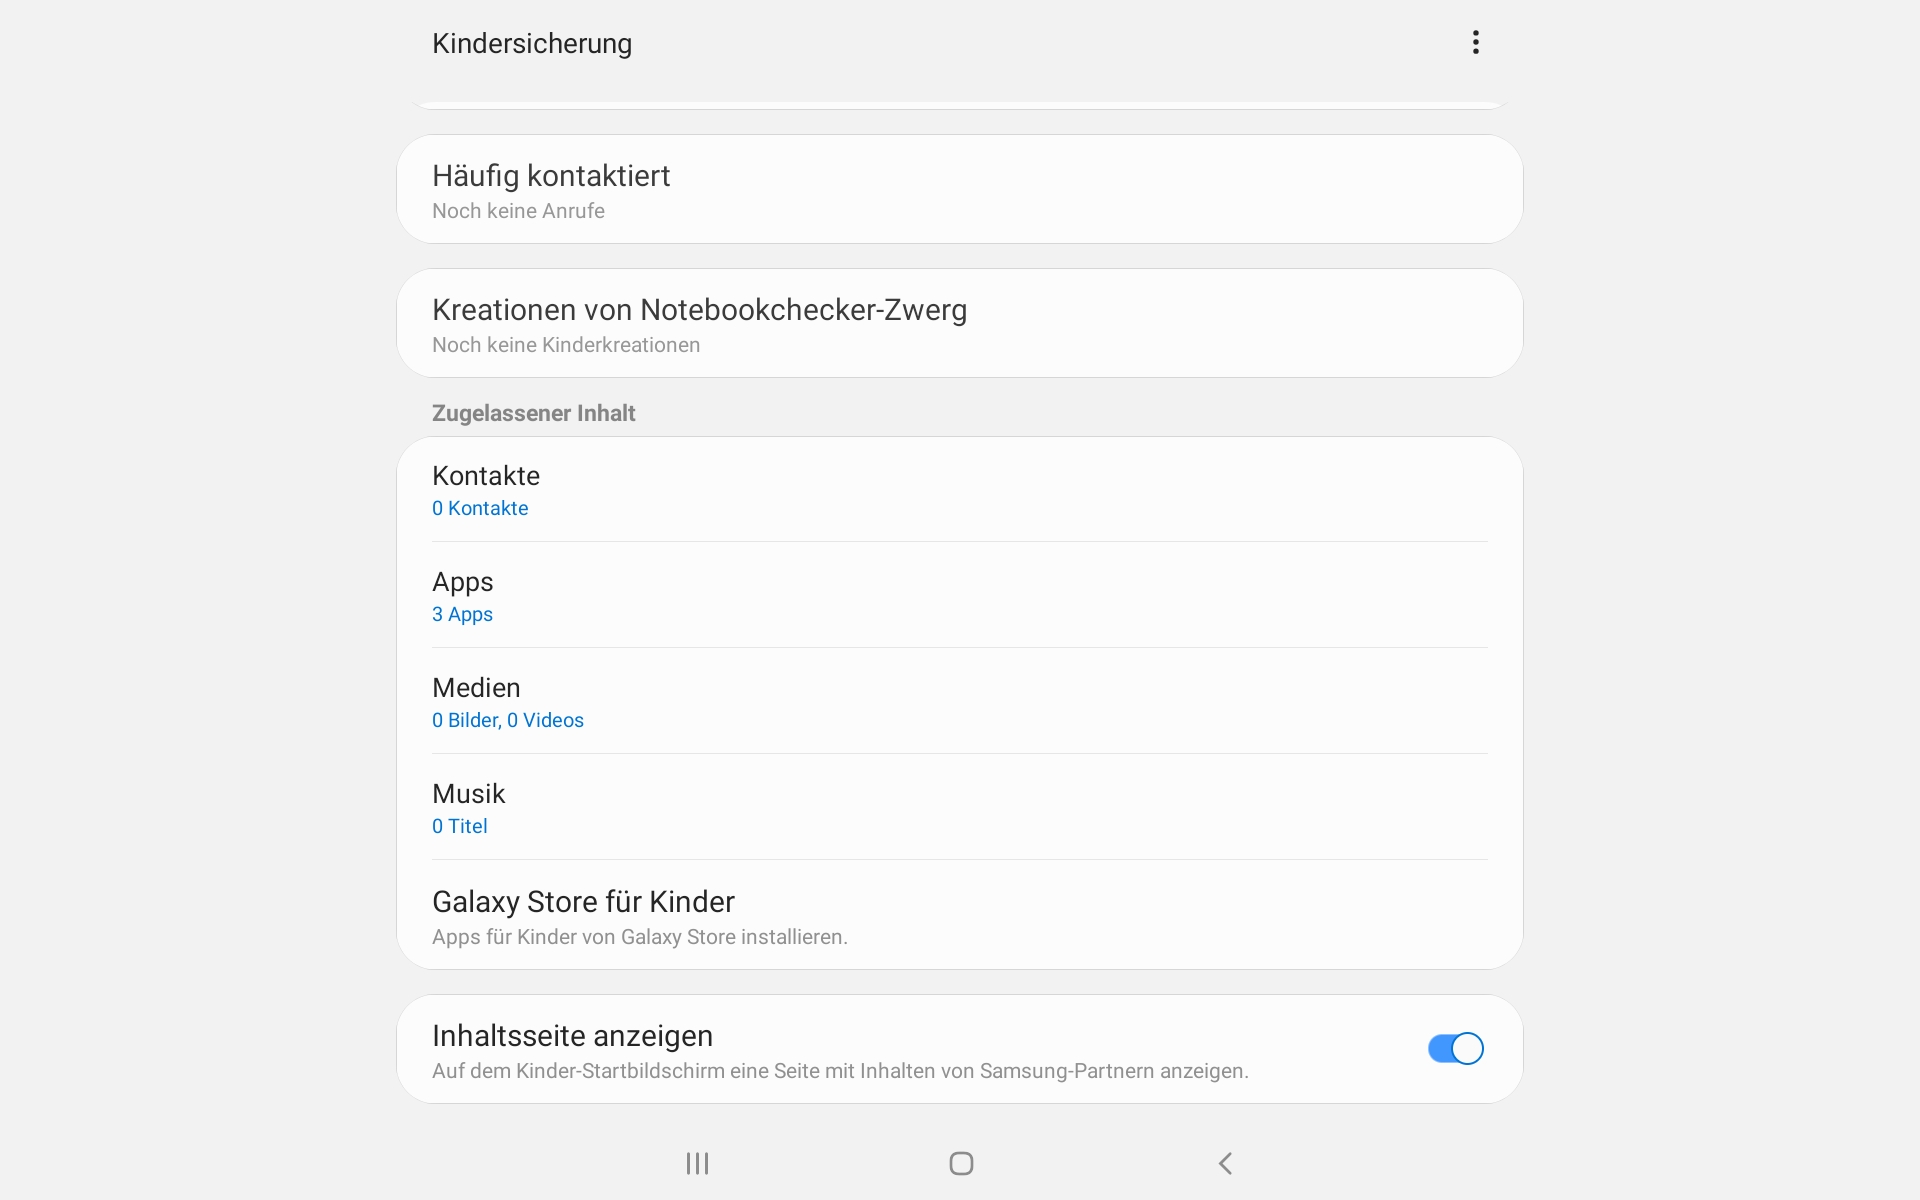
O Samsung Galaxy Tab A 10.1 é um tablet de baixo custo, que é um bom valor pelo dinheiro e é bem adequado para uso por famílias com crianças pequenas.
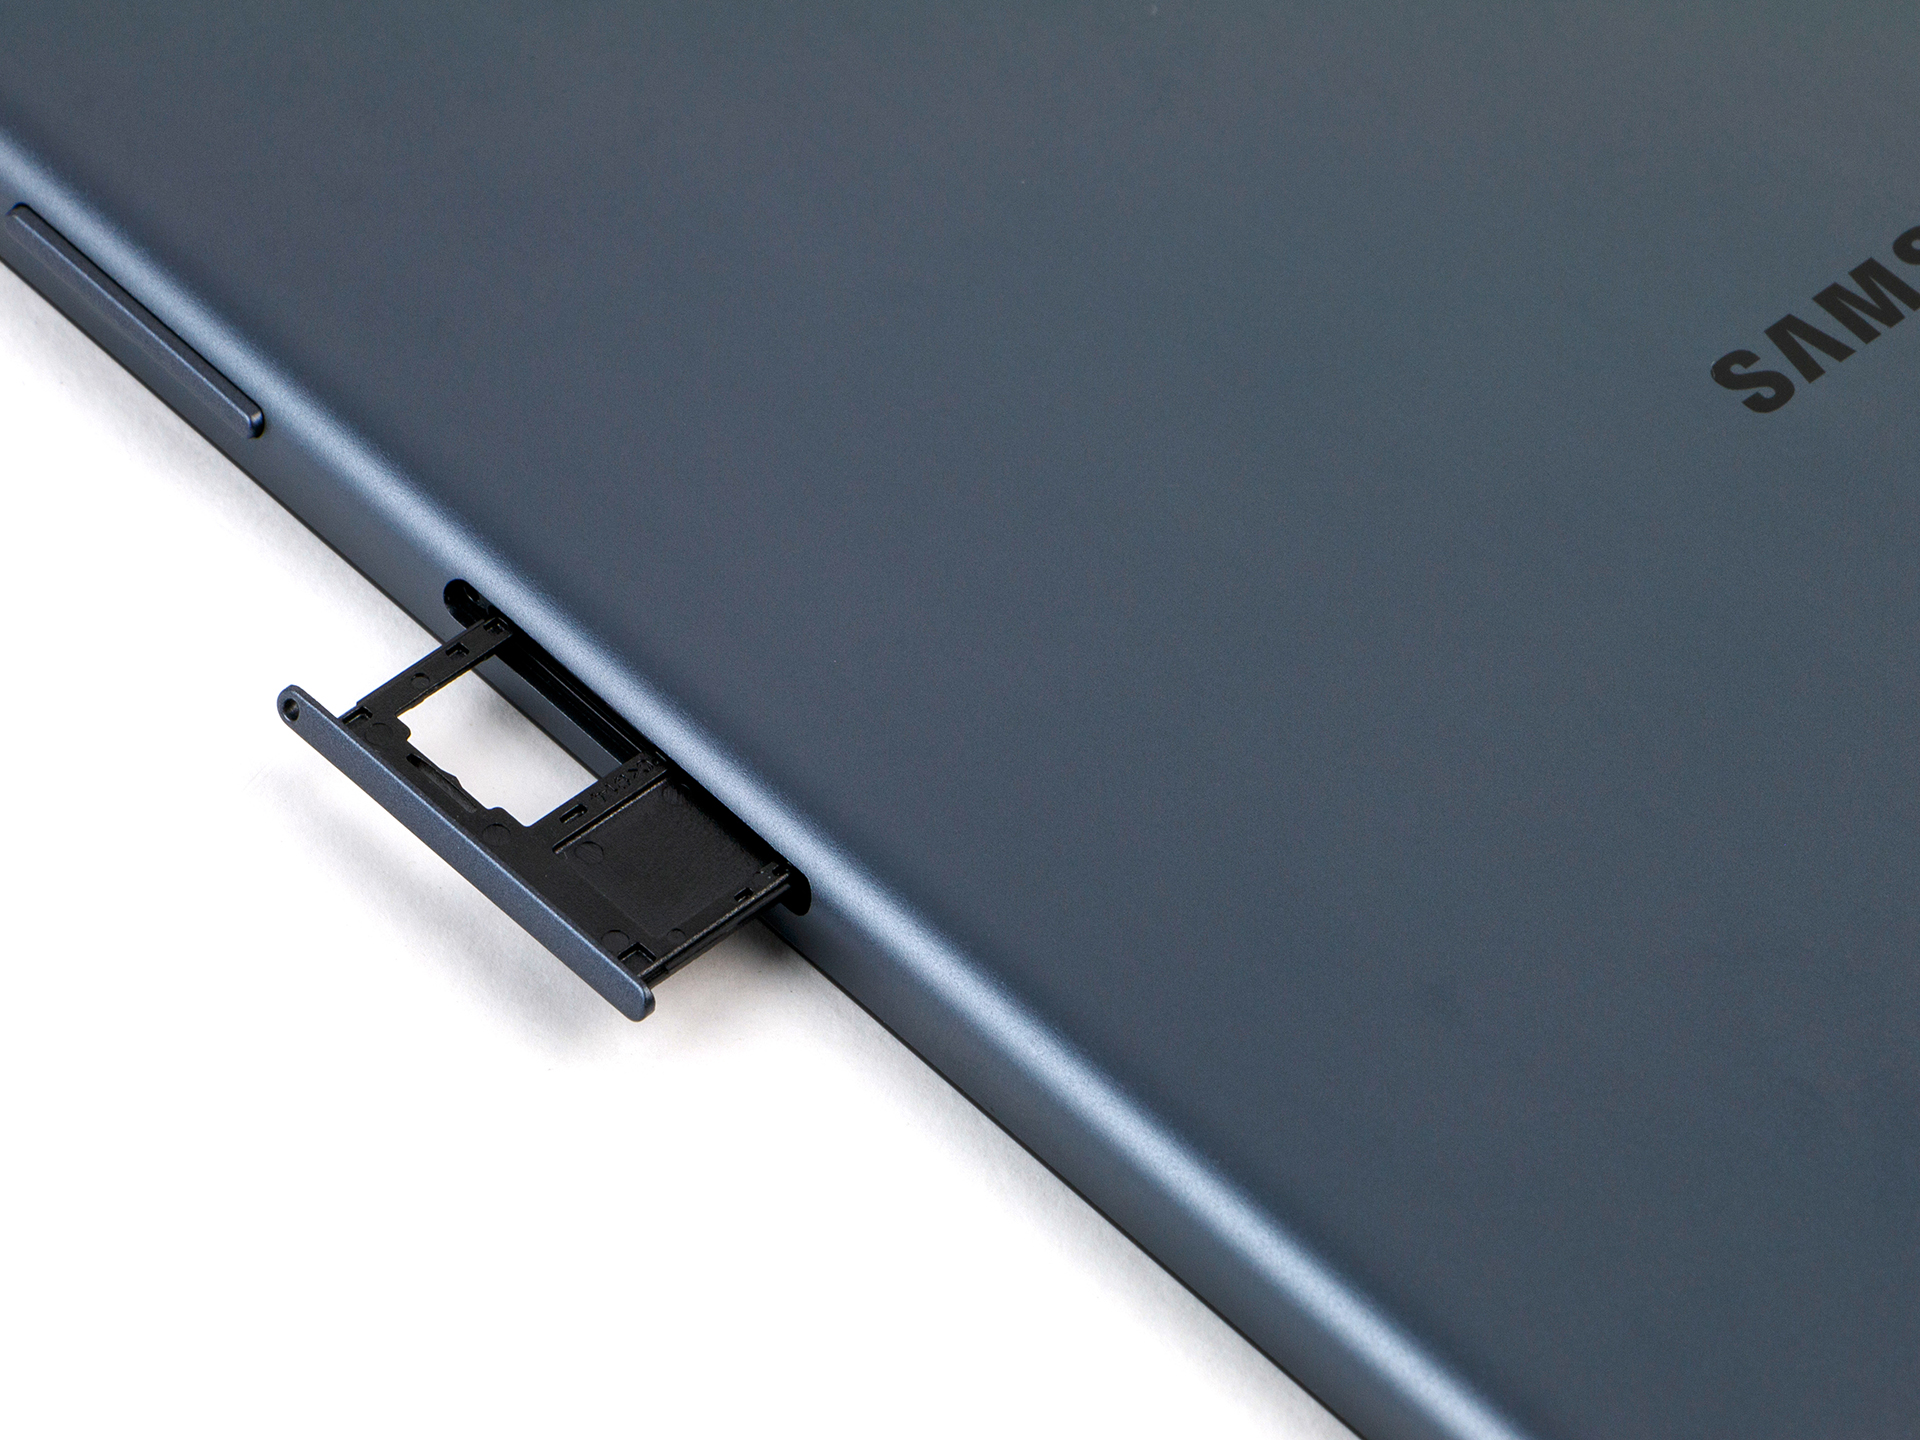
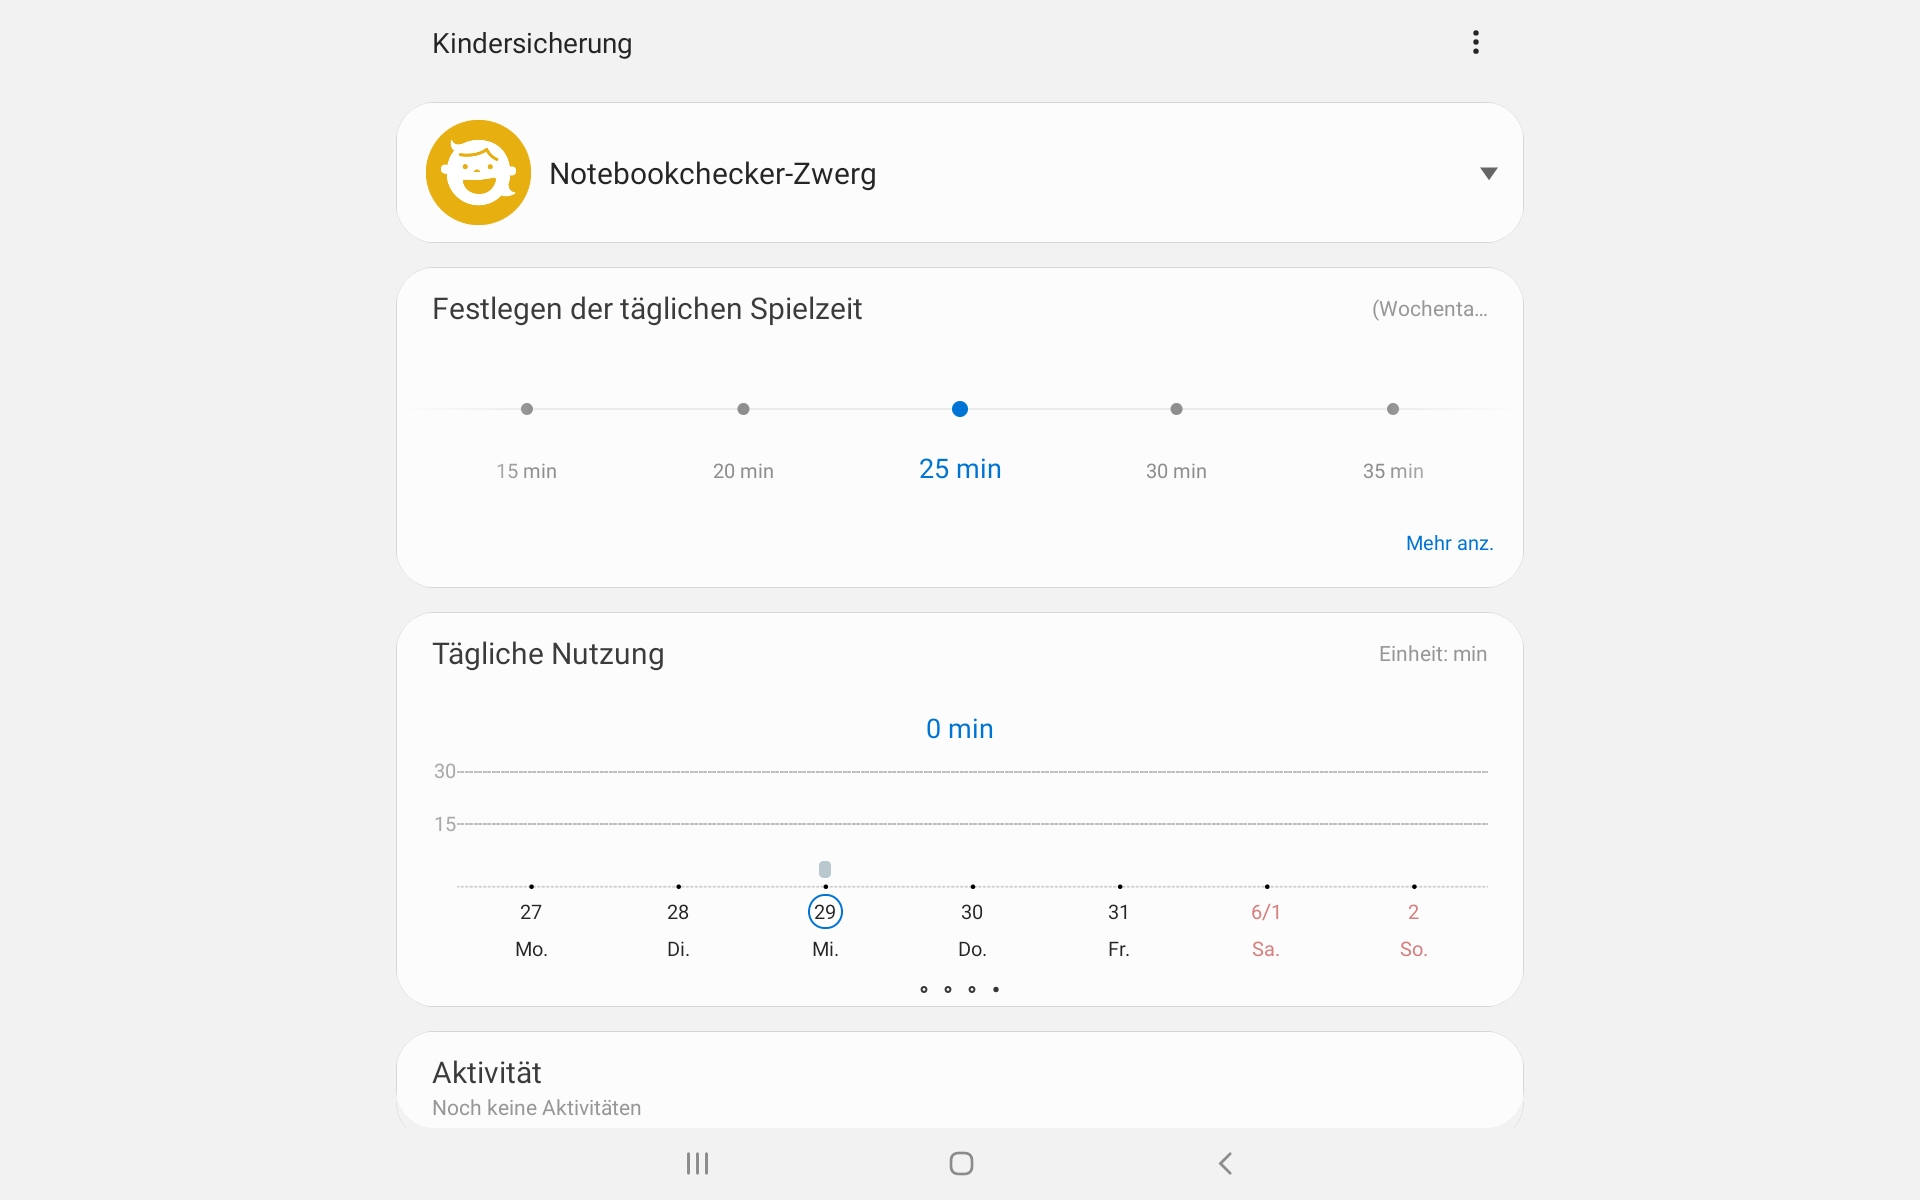
2 GB de RAM e 32 GB de armazenamento são bastante frugais para um sistema com Android 9.0 Pie, especialmente porque a Samsung posicionou o Tab A 10.1 como um dispositivo familiar que suporta múltiplas contas de usuário. A falta de um sensor de luz ambiente e nenhum modo de leitura integrado parece também uma medida para reduzir custos. Resumindo, o Tab A 10.1 é um tablet de baixo custo, mas a Samsung cortou alguns cantos demais para o nosso gosto.
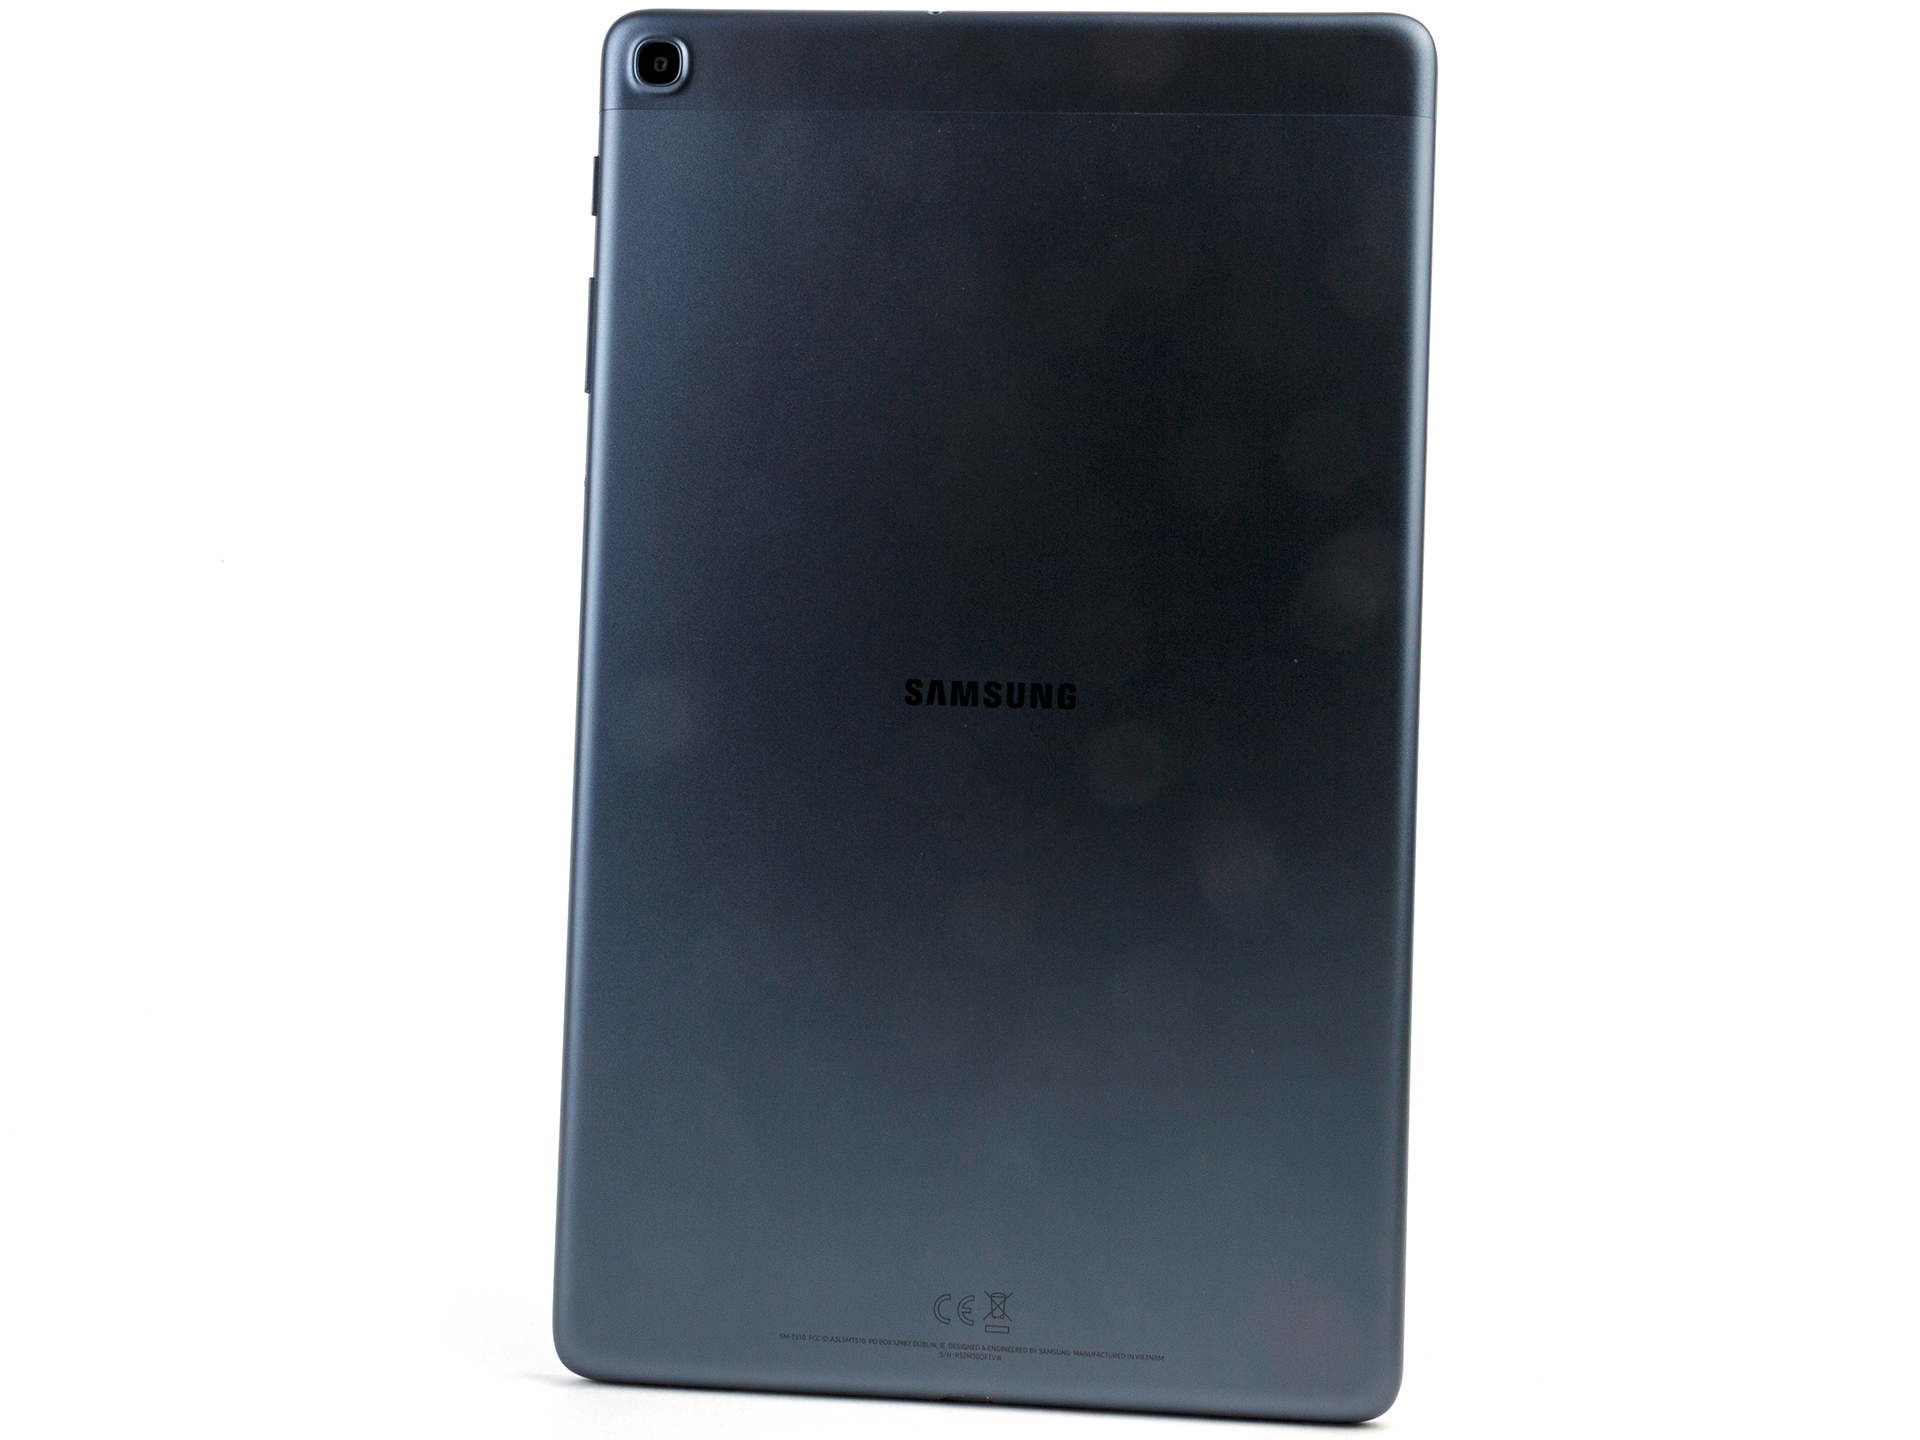
Samsung Galaxy Tab A 10.1 2019
- 11/05/2019 v7 (old)
Daniel Schmidt
Price comparison
