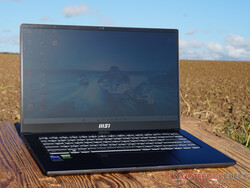
Revisão do MSI Prestige 15 laptop: Qualidade de imagem 4K deslumbrante, desempenho sólido

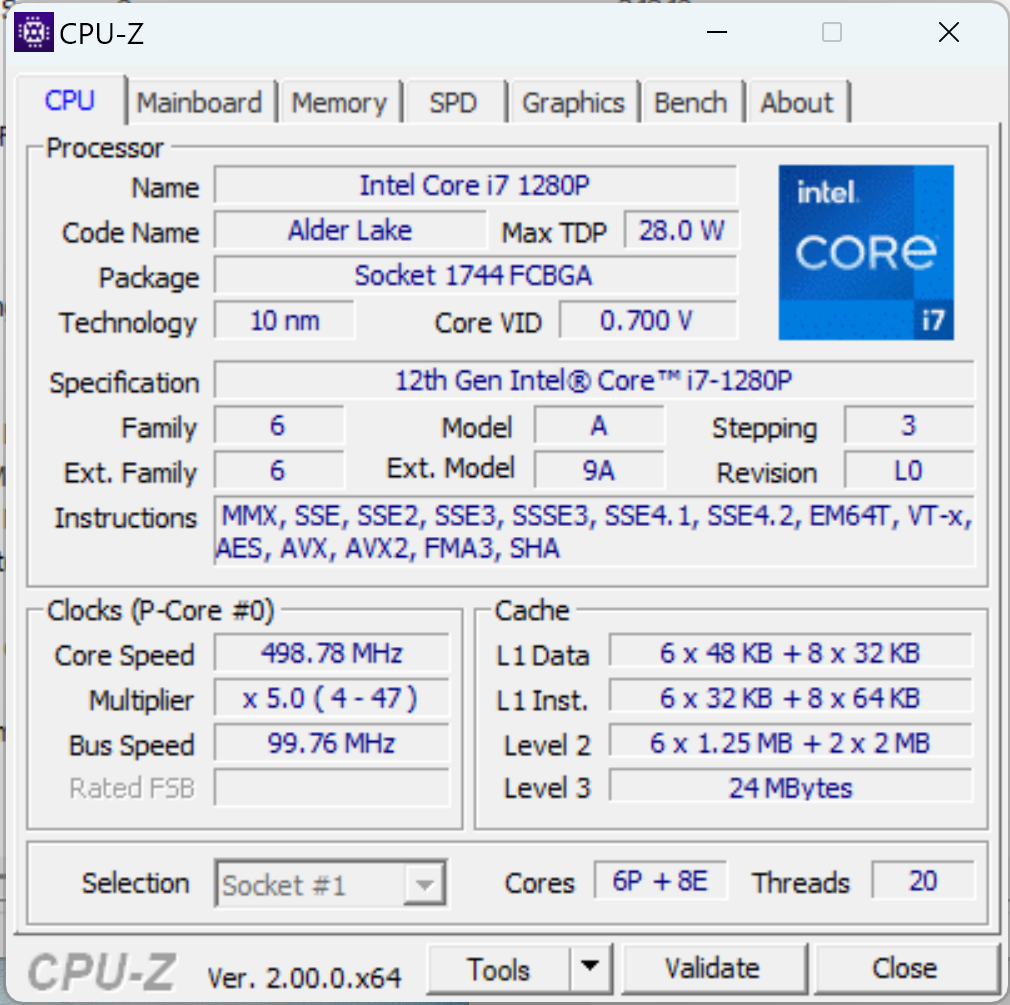
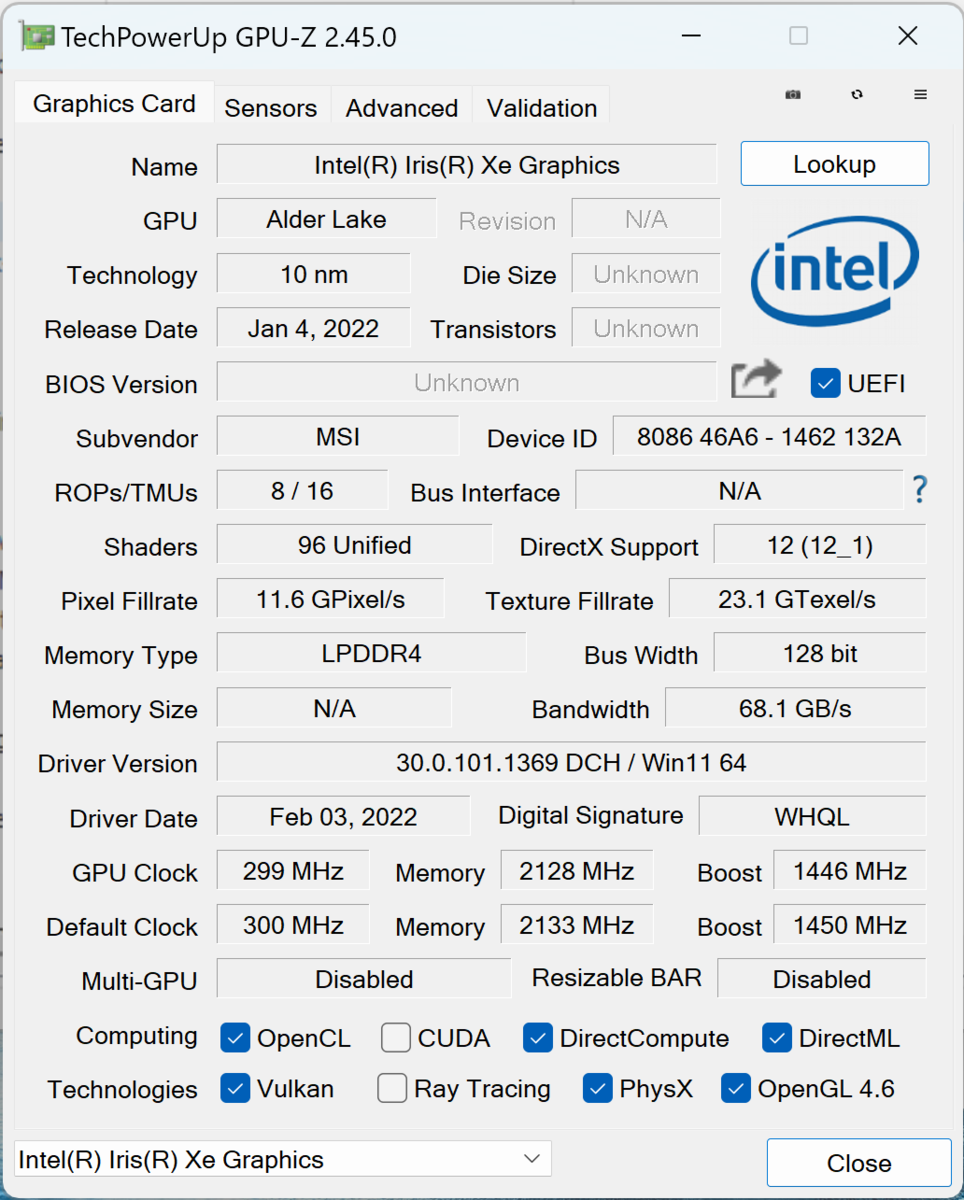
O MSI Prestige 15 A12UD-093 parece ter sido feito para tarefas graficamente exigentes. Sua tela 4K com AdobeRGB fornece imagens detalhadas com as cores mais realistas possíveis, para que fotografias digitais de alta qualidade possam ser visualizadas, modificadas e otimizadas sem a necessidade de um monitor externo. Um processador Intel Alder Lake da série "P", umi7-1280P neste caso, fornece poder computacional suficiente para todas as tarefas. Tarefas graficamente intensivas são tratadas pela Nvidia GeForce RTX 3050 Ti.
Ao mesmo tempo, a MSI garantiu que os problemas típicos associados a uma configuração excessivamente poderosa com um chip gráfico separado não ocorram. O consumo de energia tem sido limitado, o que resulta em longos tempos de funcionamento da bateria, ruído mínimo do ventilador e aquecimento limitado. O trabalho silencioso e concentrado tem precedência sobre os valores puros de desempenho.
Além do modelo em análise, há também outras variantes que só oferecem uma tela Full HD com um espaço de cores menor. Neste caso, um monitor externo seria de fato necessário para a edição profissional de imagens. Além disso, o mais fraco e ainda mais econômico Intel Core i5-1240Ppode ser escolhido no lugar do i7-1280P.
Em relação à criação de conteúdo, edição de mídia e muito mais, a concorrência é feroz. OAcer Swift X SFX16 com o Intel Arc A370M, o Asus Vivobook Pro 16X OLED ou o Schenker Visão 14 todos oferecem valores de desempenho menores ou maiores, mas também têm como objetivo oferecer edição rápida de vídeo e imagem.
Possíveis concorrentes em comparação
Avaliação | Data | Modelo | Peso | Altura | Size | Resolução | Preço |
|---|---|---|---|---|---|---|---|
| 85.4 % v7 (old) | 12/2022 | MSI Prestige 15 A12UD-093 i7-1280P, GeForce RTX 3050 Ti Laptop GPU | 1.8 kg | 20.1 mm | 15.60" | 3840x2160 | |
| 89.5 % v7 (old) | 05/2022 | Dell XPS 15 9520 RTX 3050 Ti i7-12700H, GeForce RTX 3050 Ti Laptop GPU | 1.9 kg | 18 mm | 15.60" | 3456x2160 | |
| 88.8 % v7 (old) | 10/2022 | Schenker Vision 14 2022 RTX 3050 Ti i7-12700H, GeForce RTX 3050 Ti Laptop GPU | 1.3 kg | 16.6 mm | 14.00" | 2880x1800 | |
| 86.4 % v7 (old) | 11/2022 | Acer Swift X SFX16-52G-77RX i7-1260P, A370M | 1.8 kg | 21.2 mm | 16.00" | 2560x1600 | |
| 83.7 % v7 (old) | 11/2022 | Asus VivoBook Pro 16X OLED N7600PC-L2026X i7-11370H, GeForce RTX 3050 4GB Laptop GPU | 2 kg | 18.9 mm | 16.00" | 3840x2400 | |
| 79.8 % v7 (old) | 08/2022 | Samsung Galaxy Book2 15 i7-1260P, A350M | 1.6 kg | 15 mm | 15.60" | 1920x1080 |
Caso - O Prestige 15 causa uma séria impressão
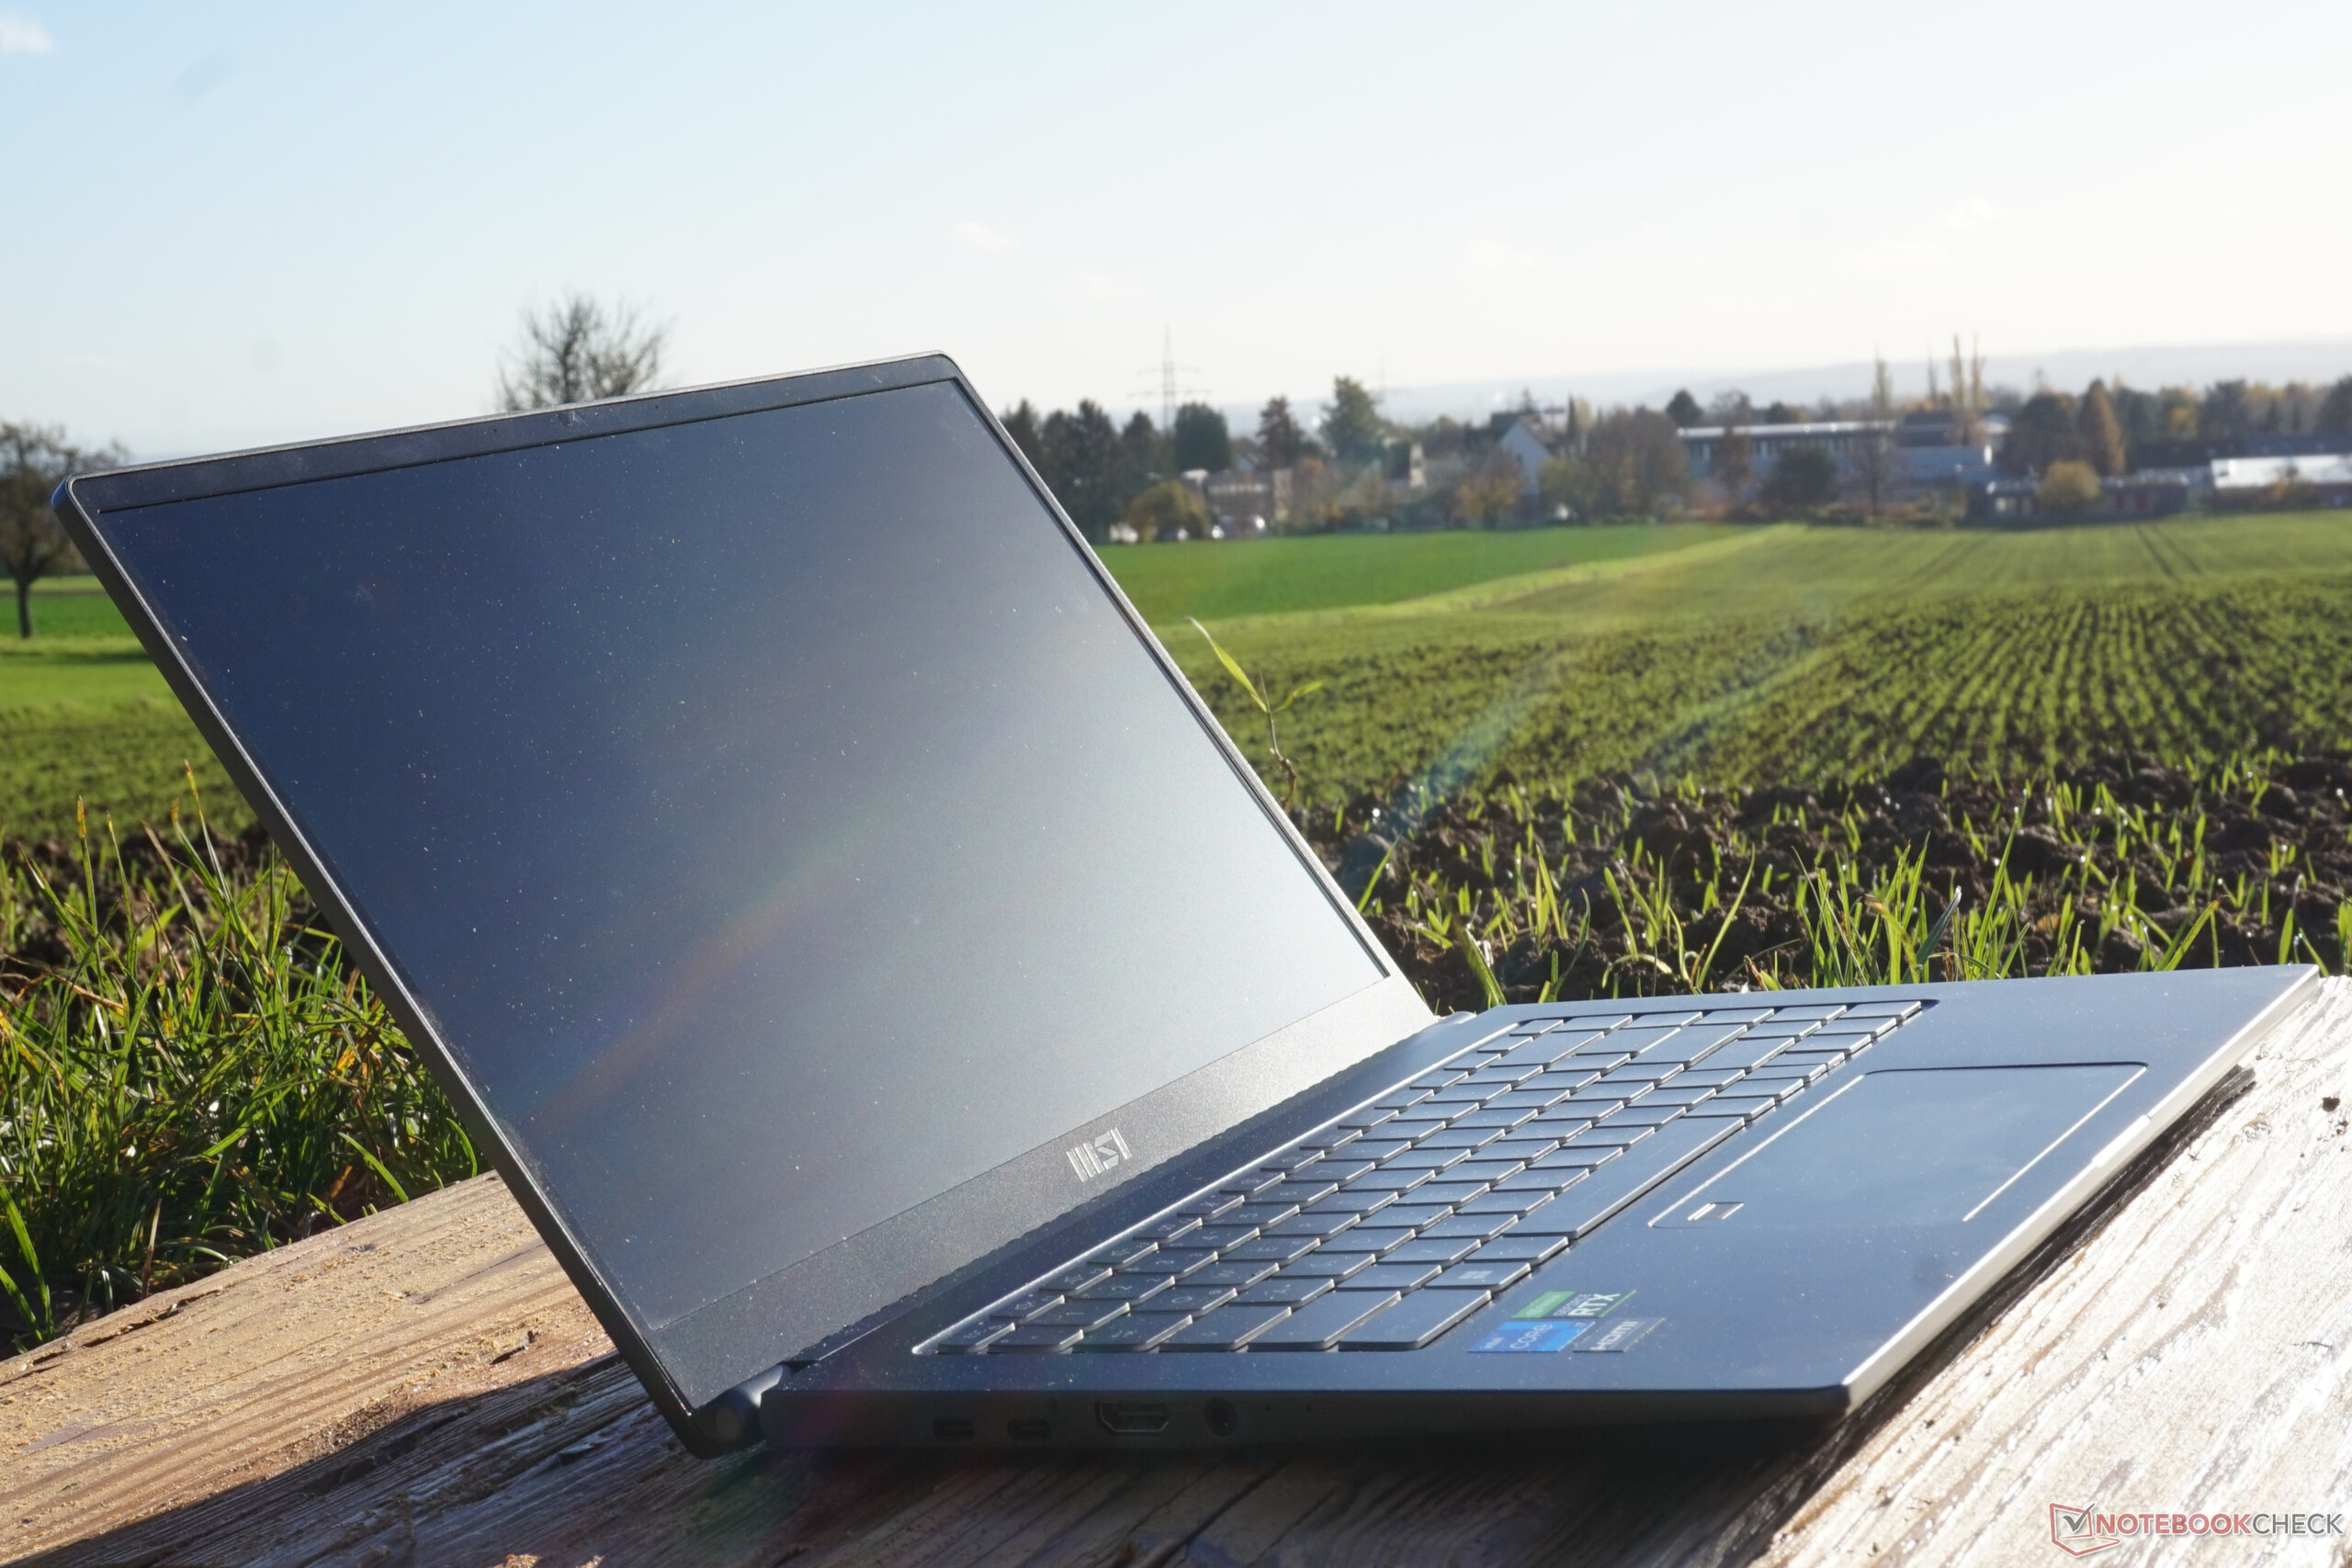
Com um cinza escuro profundo, quase preto, e o logo "MSI" mal reconhecido na parte de trás, o chassi pode ser descrito como sóbrio e discreto. A tampa do display metálico e a estrutura do teclado parecem de alta qualidade, mas são muito sensíveis às impressões digitais. Que a estrutura do display e a placa de base são feitas de plástico é claramente perceptível.
Pelo menos isto não afeta a estabilidade. A abertura da tela é mínima e a abertura com uma só mão não representa nenhum problema, pelo menos até 180 graus. Nada pode ser torcido aqui também. O fundo permanece sempre plano, e a tela só pode ser dobrada minimamente
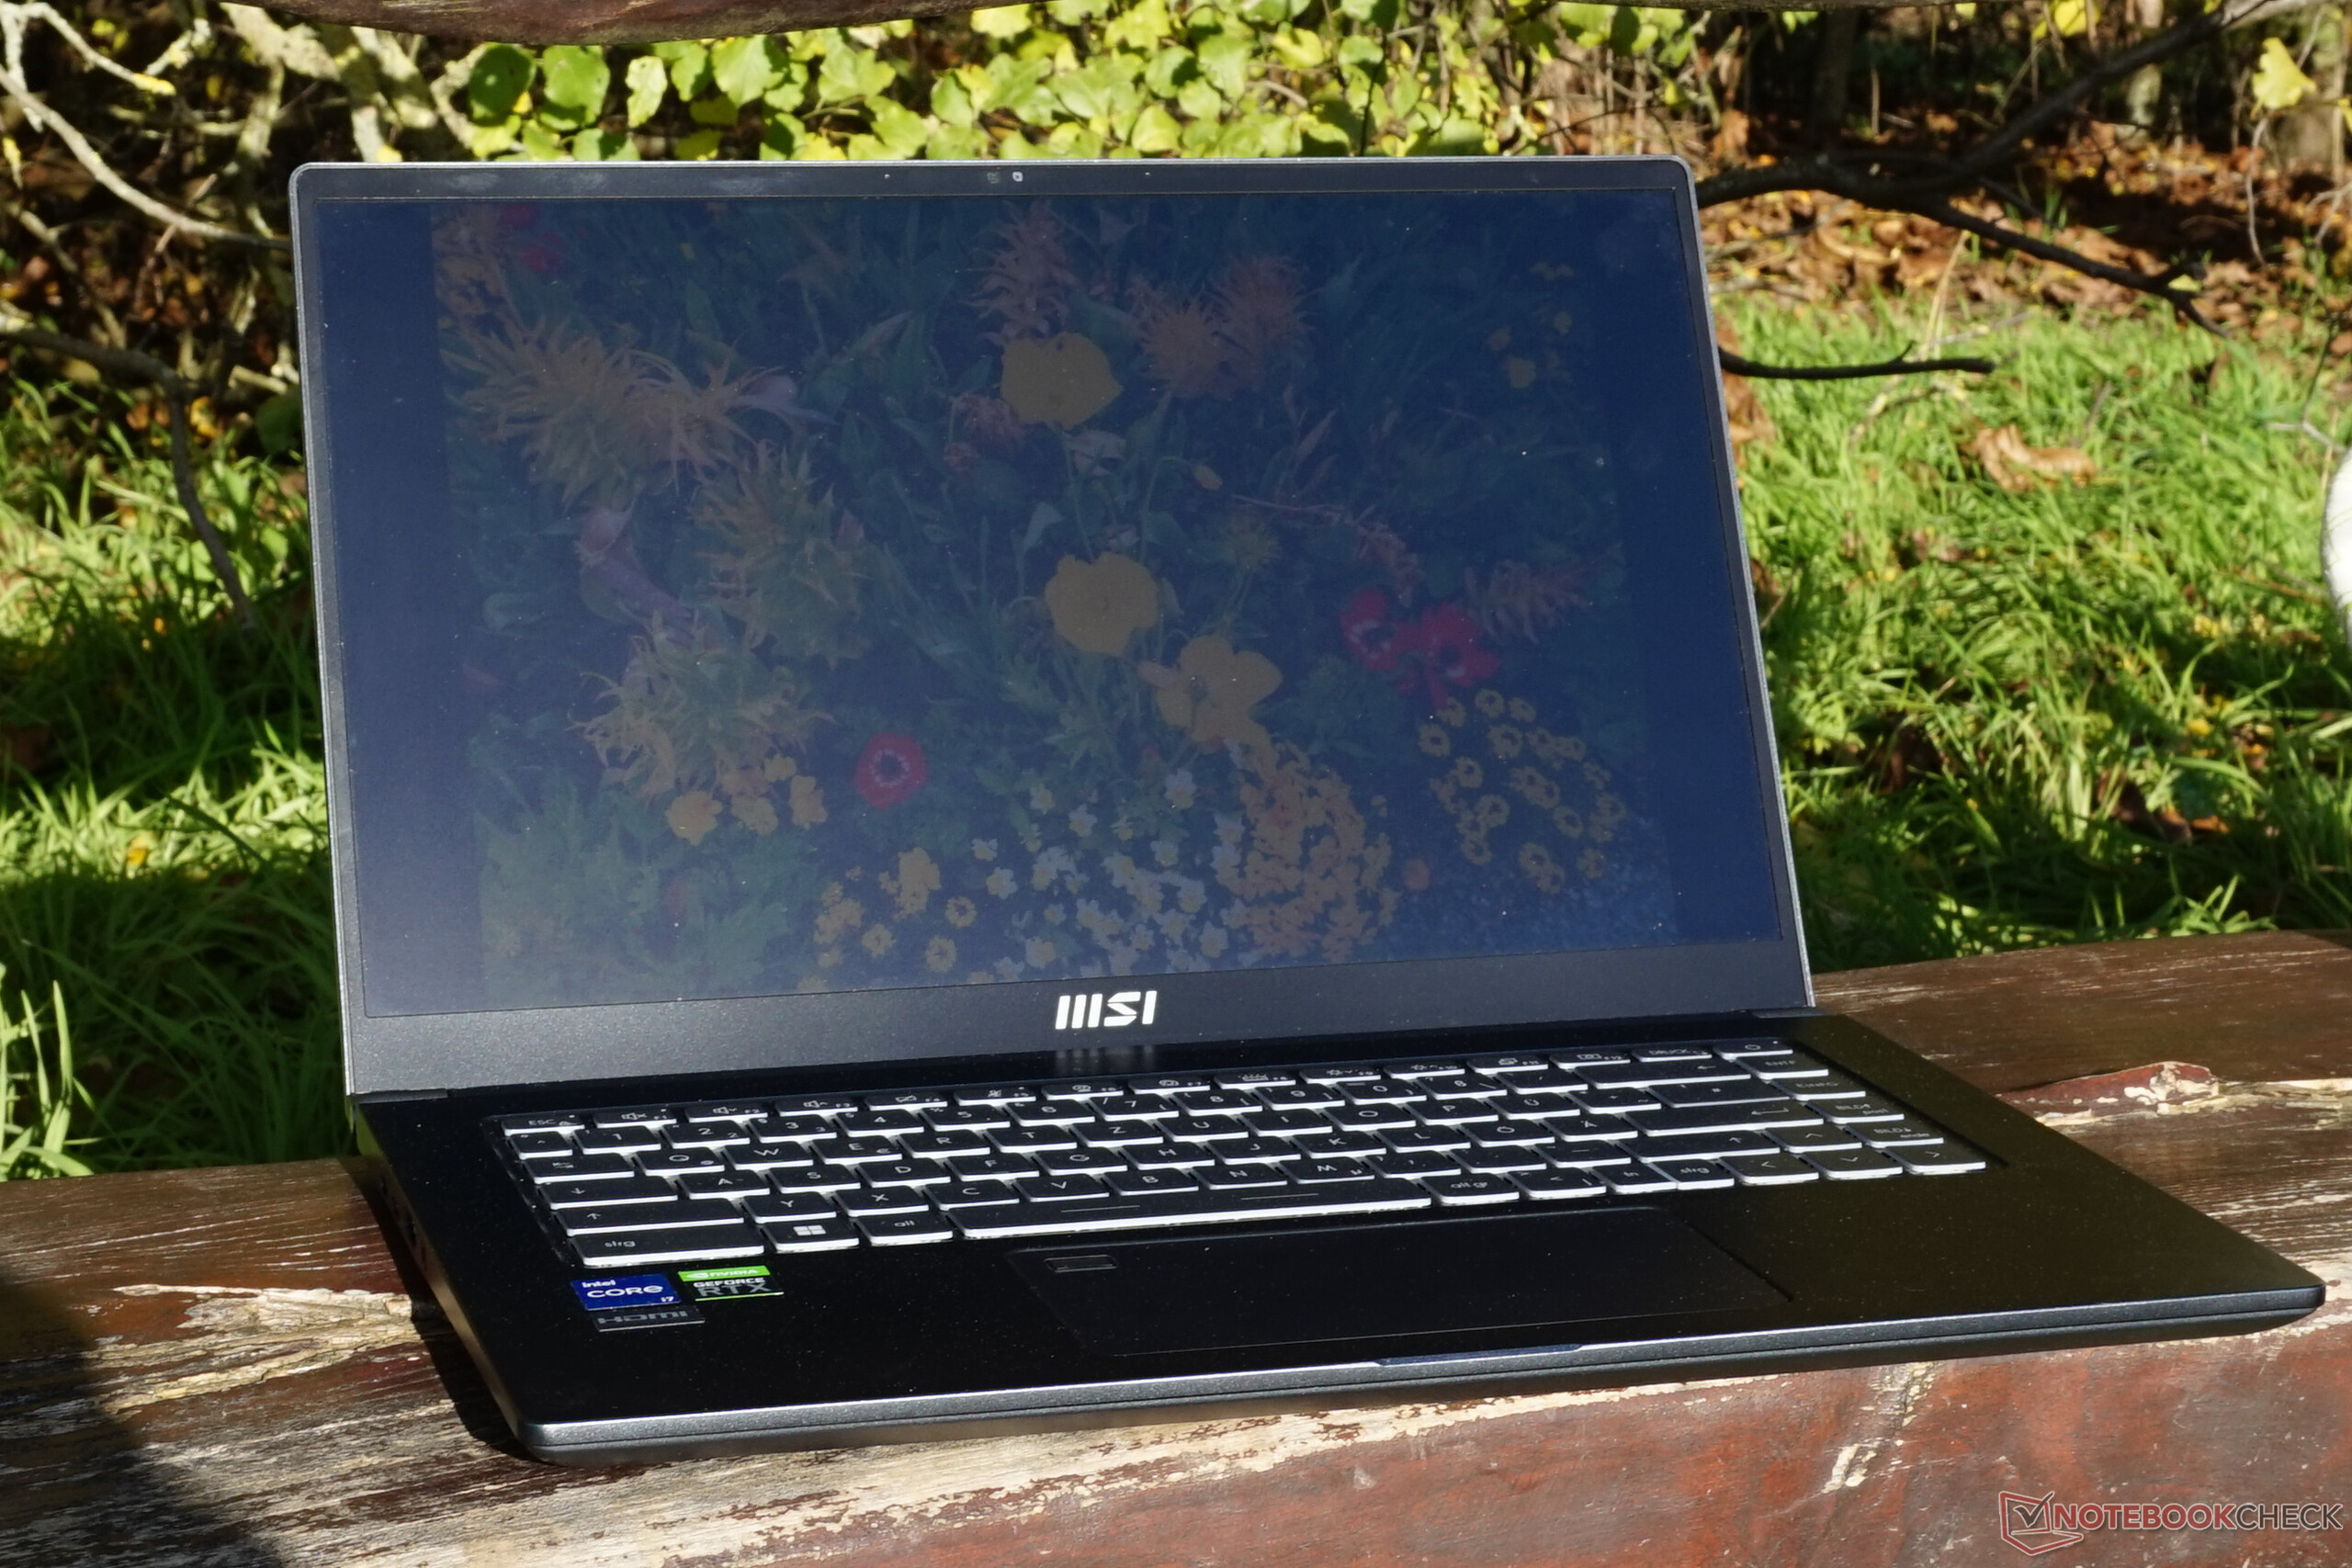
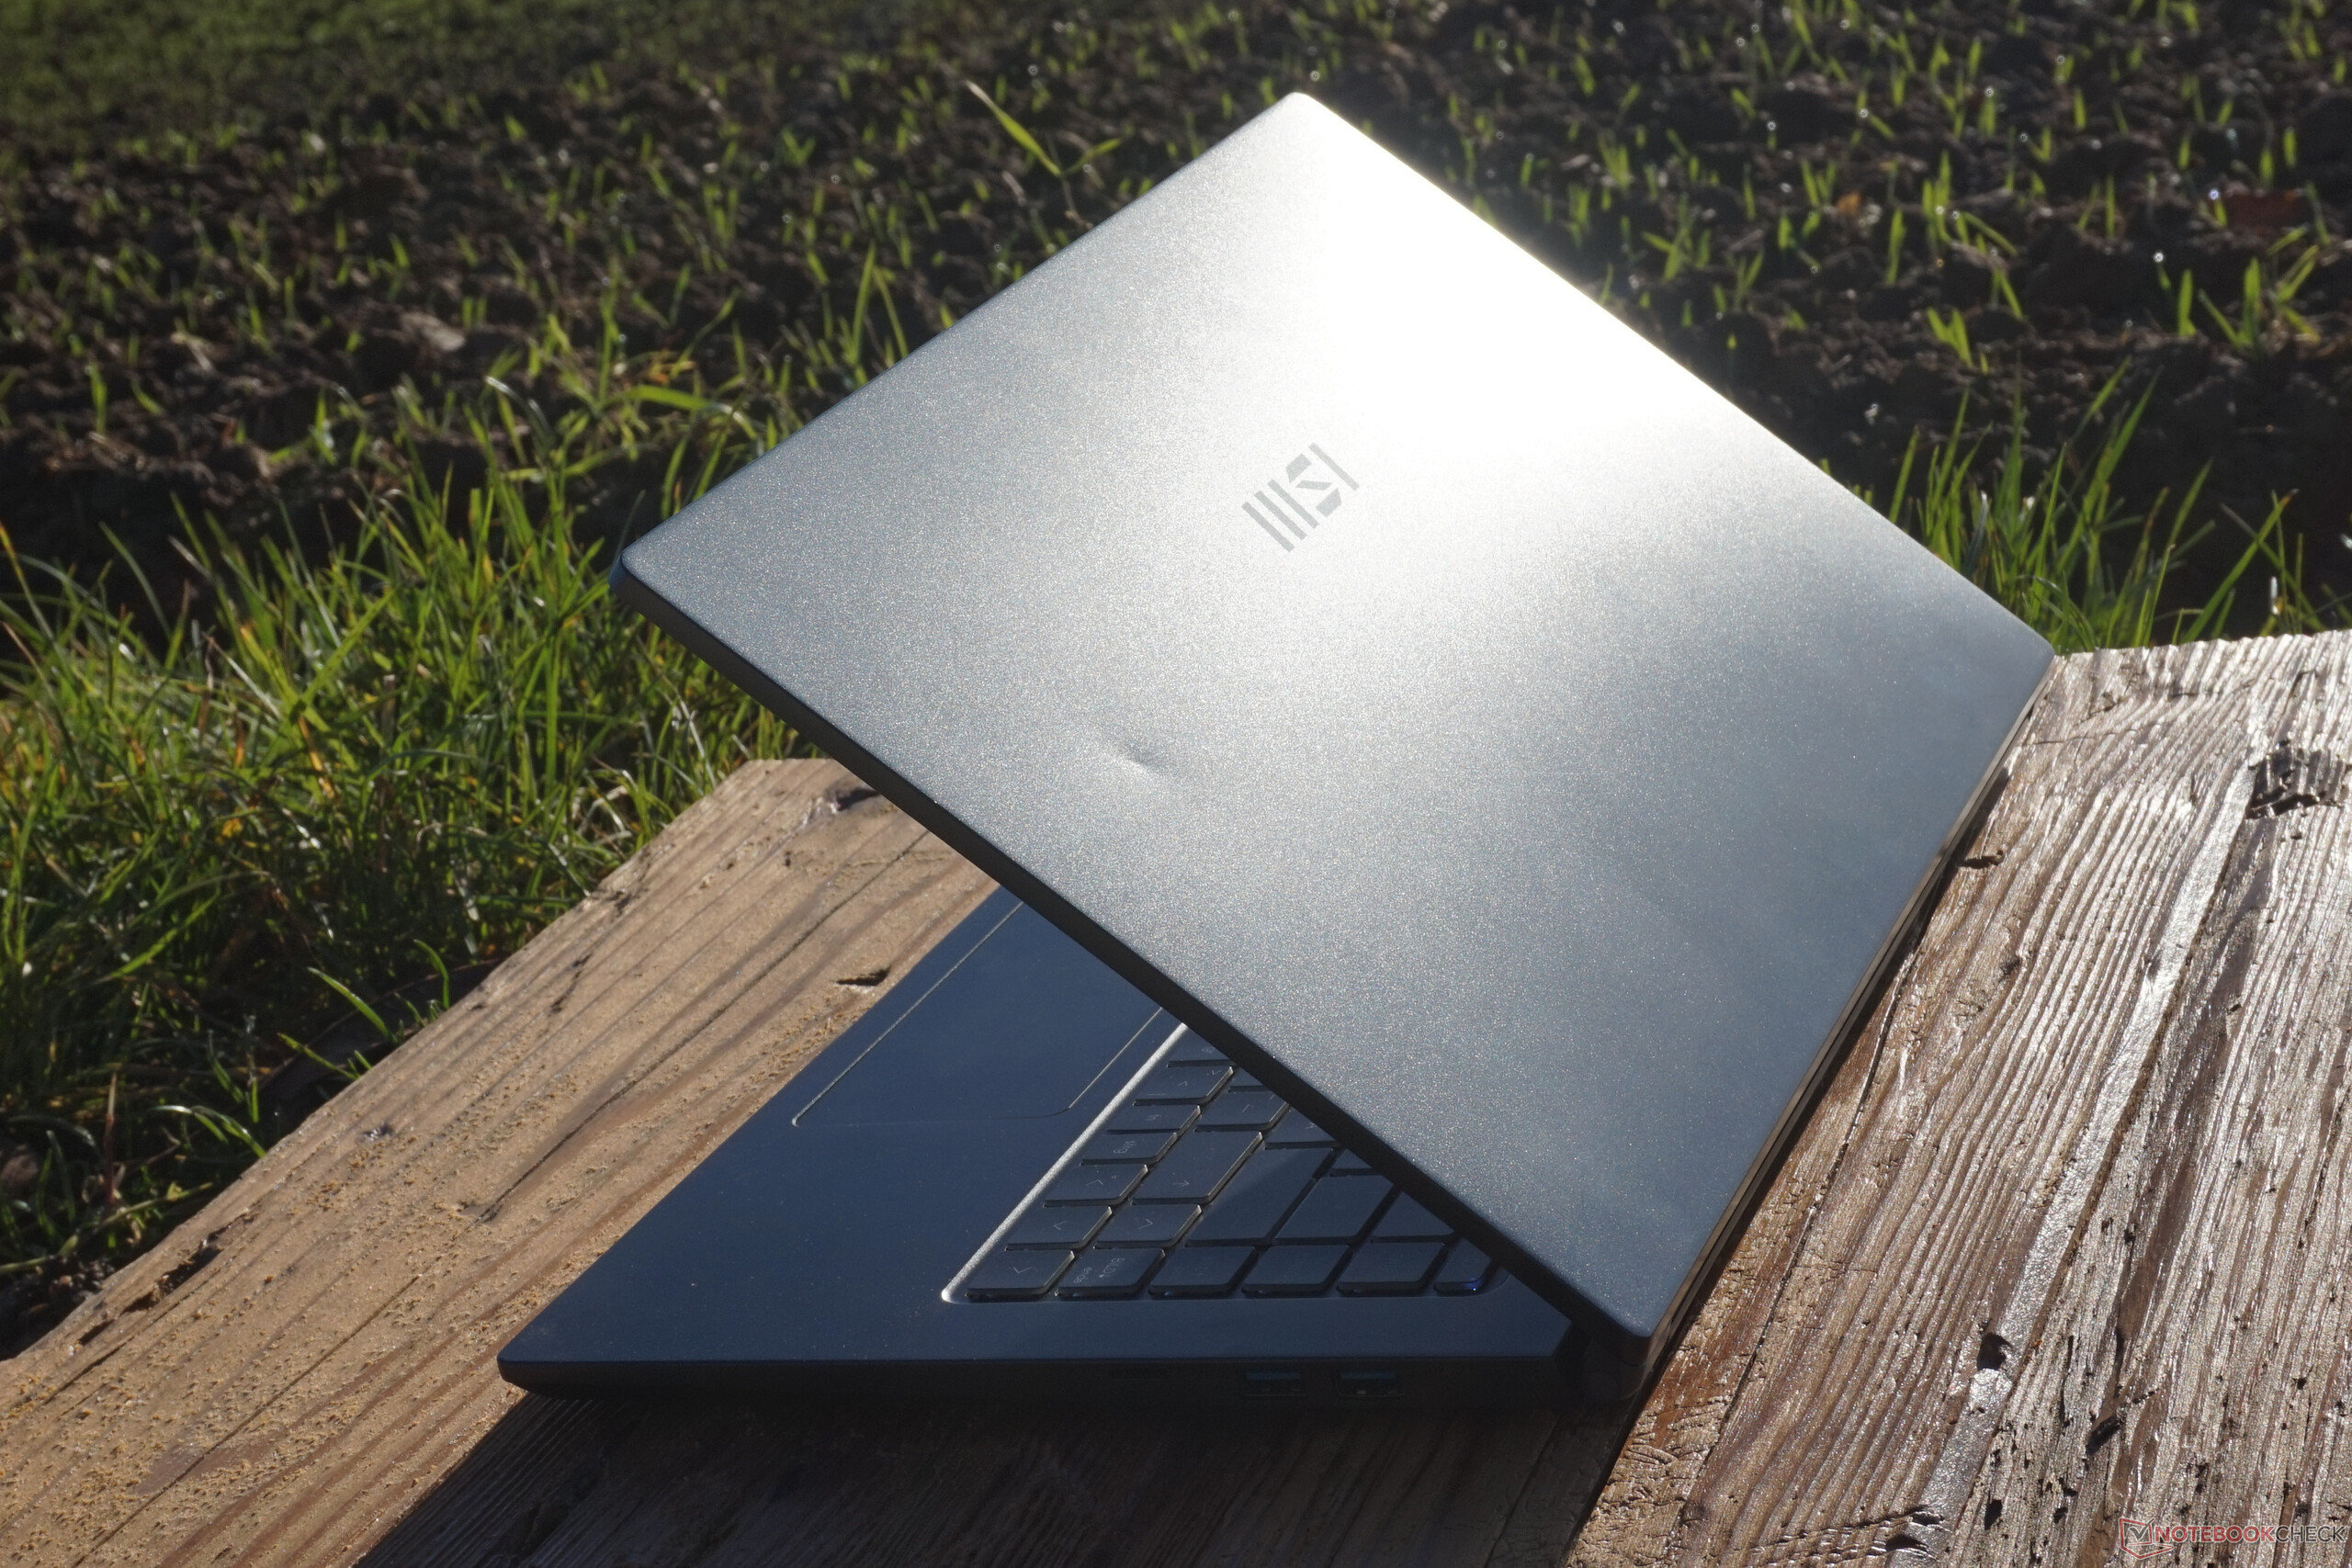
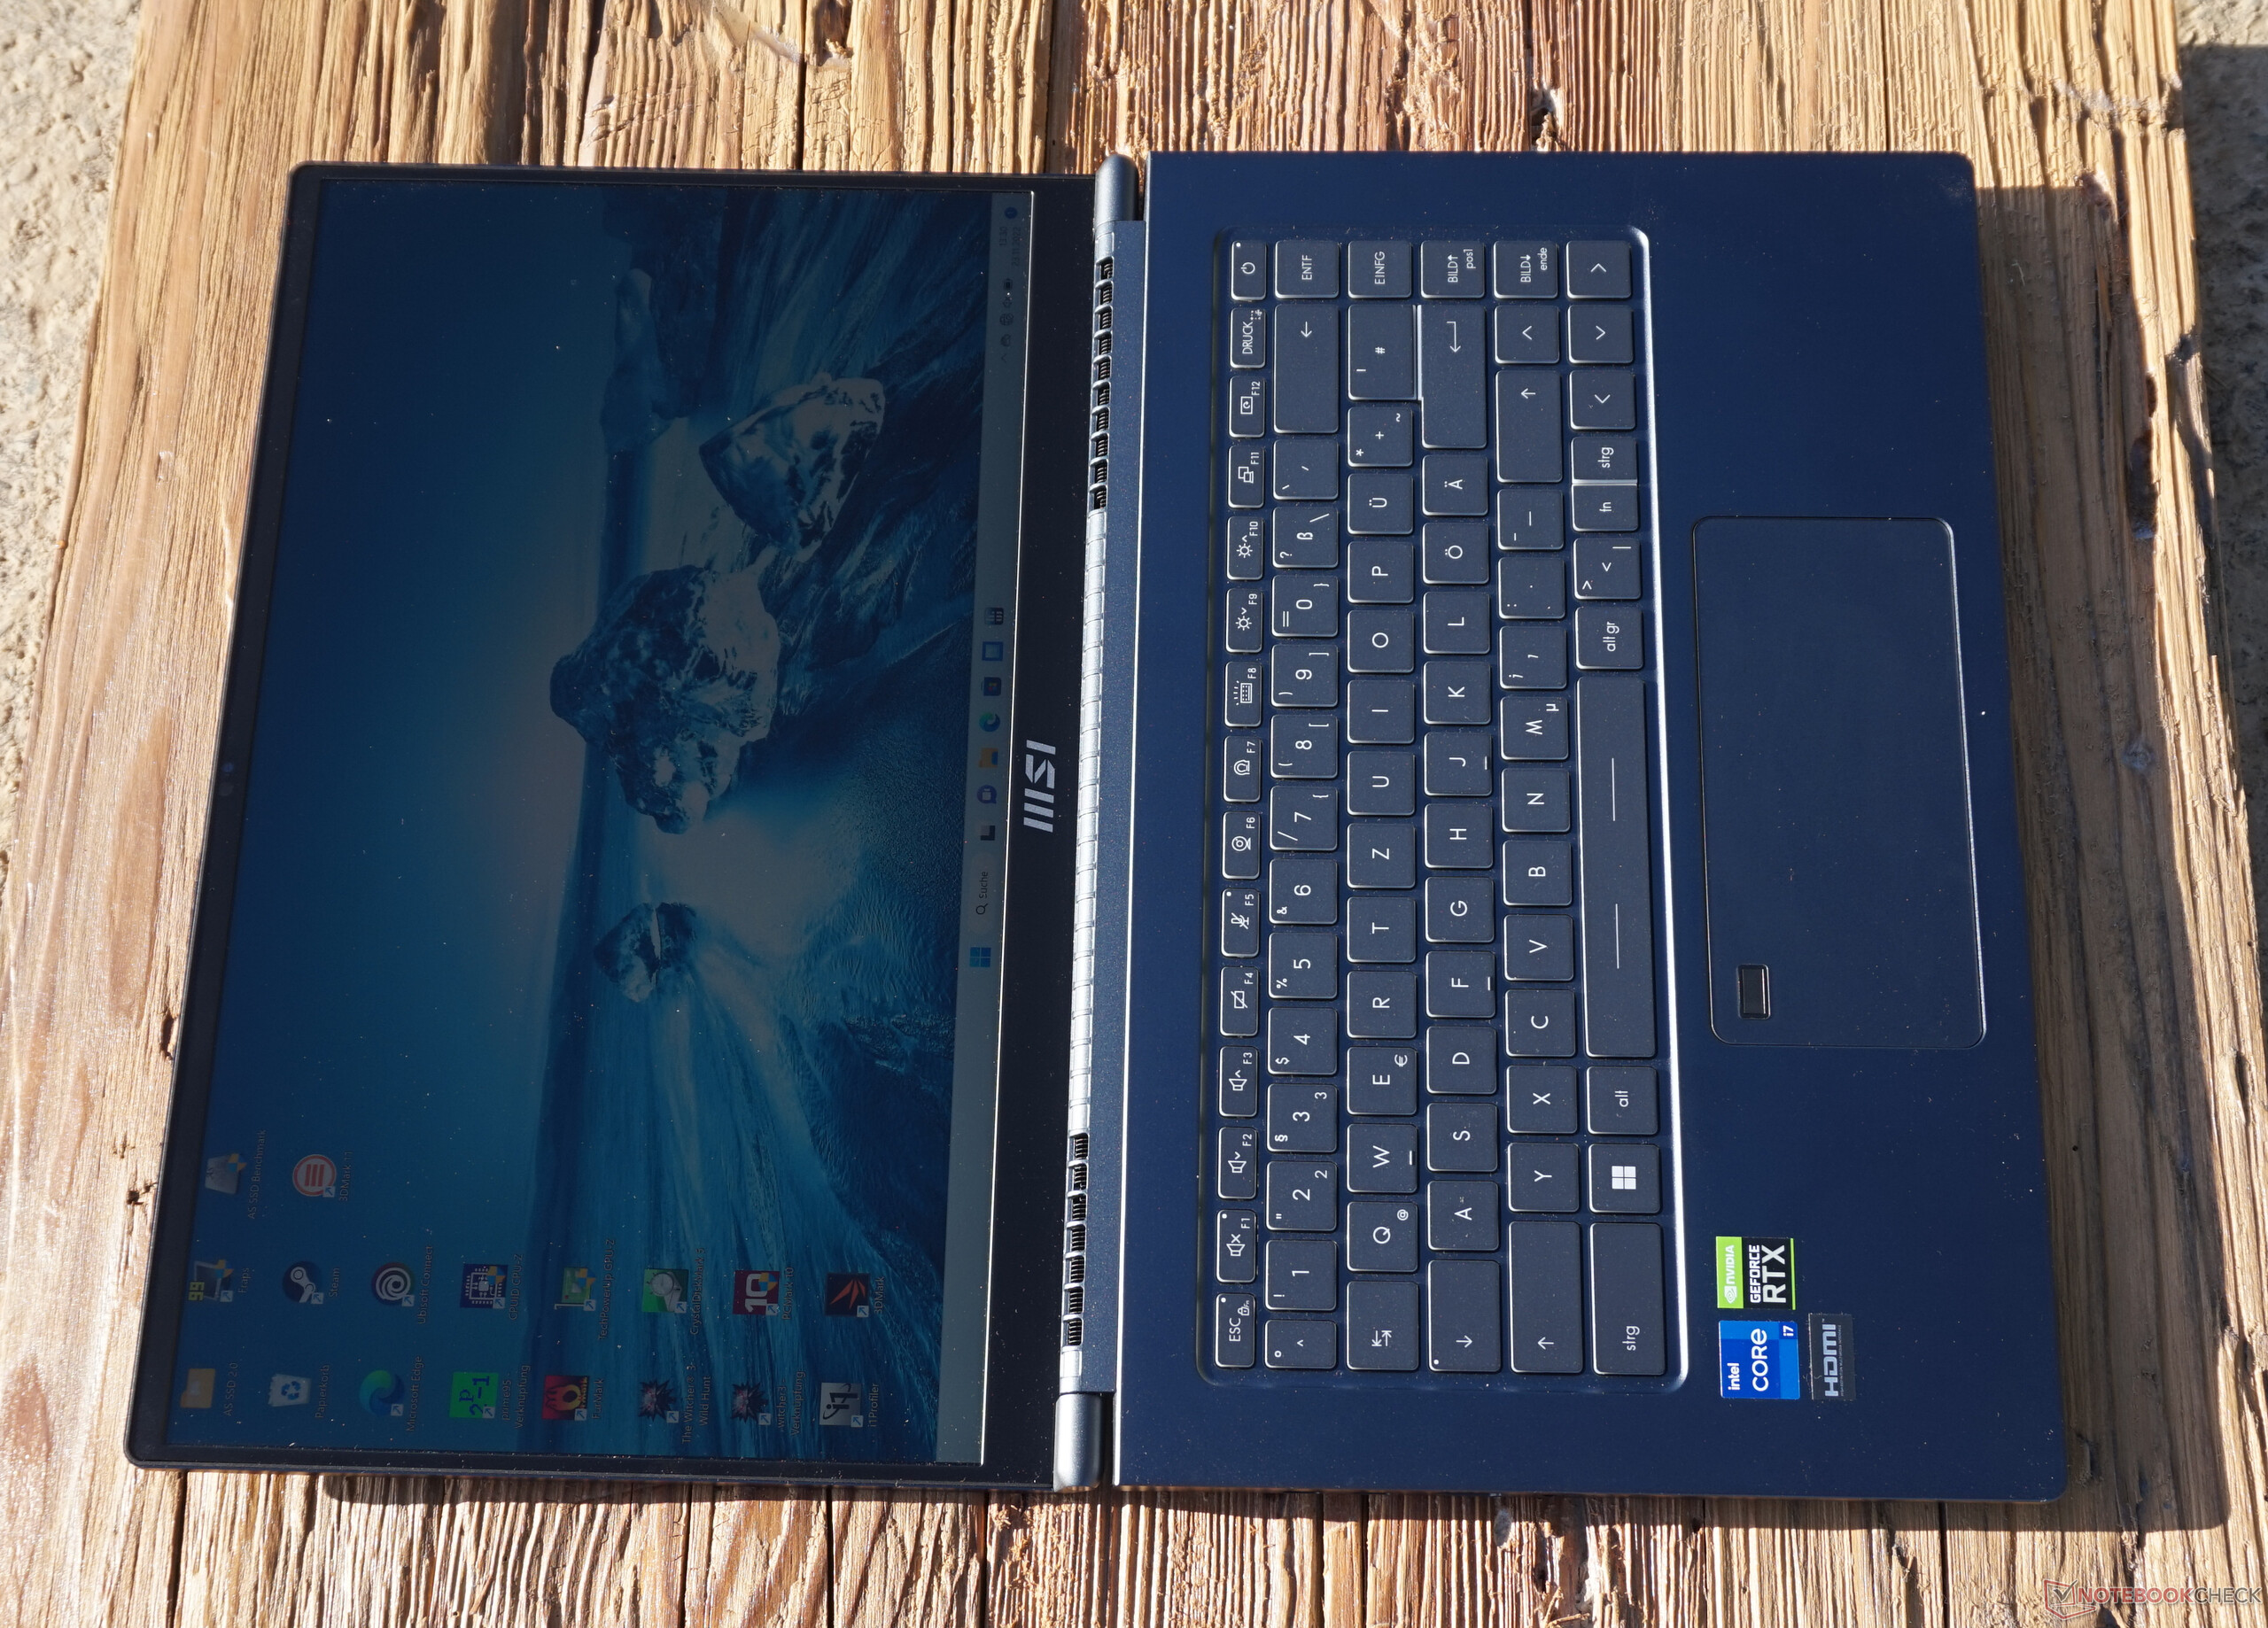
Olhando para os componentes integrados, não há surpresas em termos de peso e tamanho. 1.8 kg é apropriado para a tela e o hardware e corresponde aos valores dos laptops rivais. O mesmo se aplica às dimensões, que, considerando a tela e suas bordas de tela de 5 mm de largura, são bastante compactas no geral. O estojo poderia ter sido um pouco mais estreito.
Equipamento - Caderno criador com uma conexão rápida
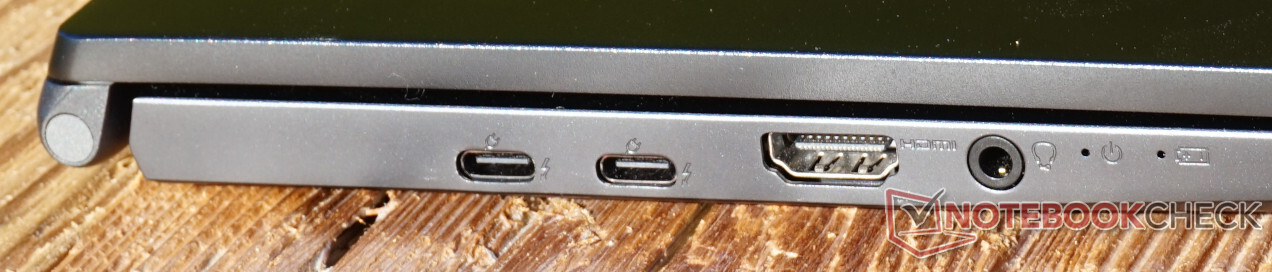
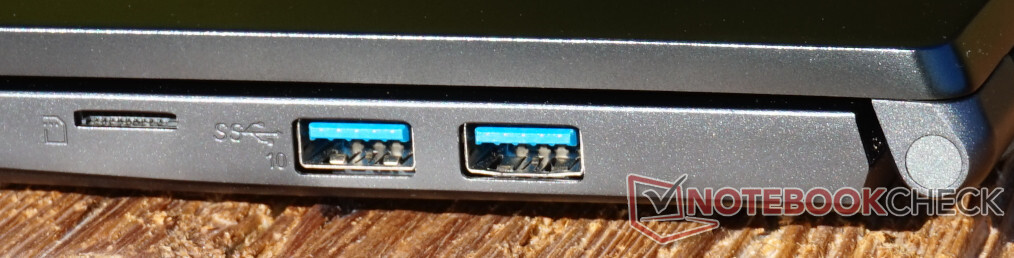
O número e a velocidade dos portos são impressionantes. Em particular, duas portas Thunderbolt 4 à esquerda oferecem uso variável e altas taxas de transferência. A bateria também é recarregada através desta porta, mas como há duas portas uma ao lado da outra, uma é sempre livre. Felizmente, as duas portas USB-A normais atingem 10 Gbit/s, o que deve ser suficiente para um SSD externo em muitos casos
Algumas outras conexões essenciais incluem o slot do cartão, HDMI e fone de ouvido. No entanto, a seleção é um pouco escassa no geral. Falta uma porta LAN ou a típica fechadura Kensington. Também não há nenhum argumento real contra um slot de cartão SD completo, para o qual haveria muito espaço
SD CardReader
Os valores medidos com a placa de referência AV PRO microSD 128 GB V60 são valores médios. Isto significa que a velocidade de transferência de fotos e vídeos é aceitável em geral, o que significa que grandes quantidades de dados podem ser transferidas para o Prestige 15 em apenas alguns minutos.
| SD Card Reader | |
| average JPG Copy Test (av. of 3 runs) | |
| Dell XPS 15 9520 RTX 3050 Ti (Toshiba Exceria Pro SDXC 64 GB UHS-II) | |
| Média da turma Multimedia (23 - 531, n=37, últimos 2 anos) | |
| MSI Prestige 15 A12UD-093 (AV Pro SD microSD 128 GB V60) | |
| Schenker Vision 14 2022 RTX 3050 Ti | |
| Asus VivoBook Pro 16X OLED N7600PC-L2026X | |
| maximum AS SSD Seq Read Test (1GB) | |
| Média da turma Multimedia (37.3 - 1455, n=36, últimos 2 anos) | |
| Dell XPS 15 9520 RTX 3050 Ti (Toshiba Exceria Pro SDXC 64 GB UHS-II) | |
| MSI Prestige 15 A12UD-093 (AV Pro SD microSD 128 GB V60) | |
| Schenker Vision 14 2022 RTX 3050 Ti | |
| Asus VivoBook Pro 16X OLED N7600PC-L2026X | |
Comunicação
Pelo menos ao receber dados, o módulo Intel AX211 WLAN atinge valores acima da média. Ao enviar, os valores são um pouco baixos demais, embora pouco menos de 1.000 Mbit/s ainda seja impressionante. A medição da velocidade máxima de transmissão foi propensa a erros em nossos testes, mas podemos assumir com confiança que isto funciona suficientemente bem na prática, tendo em vista as boas taxas de recepção
Webcam
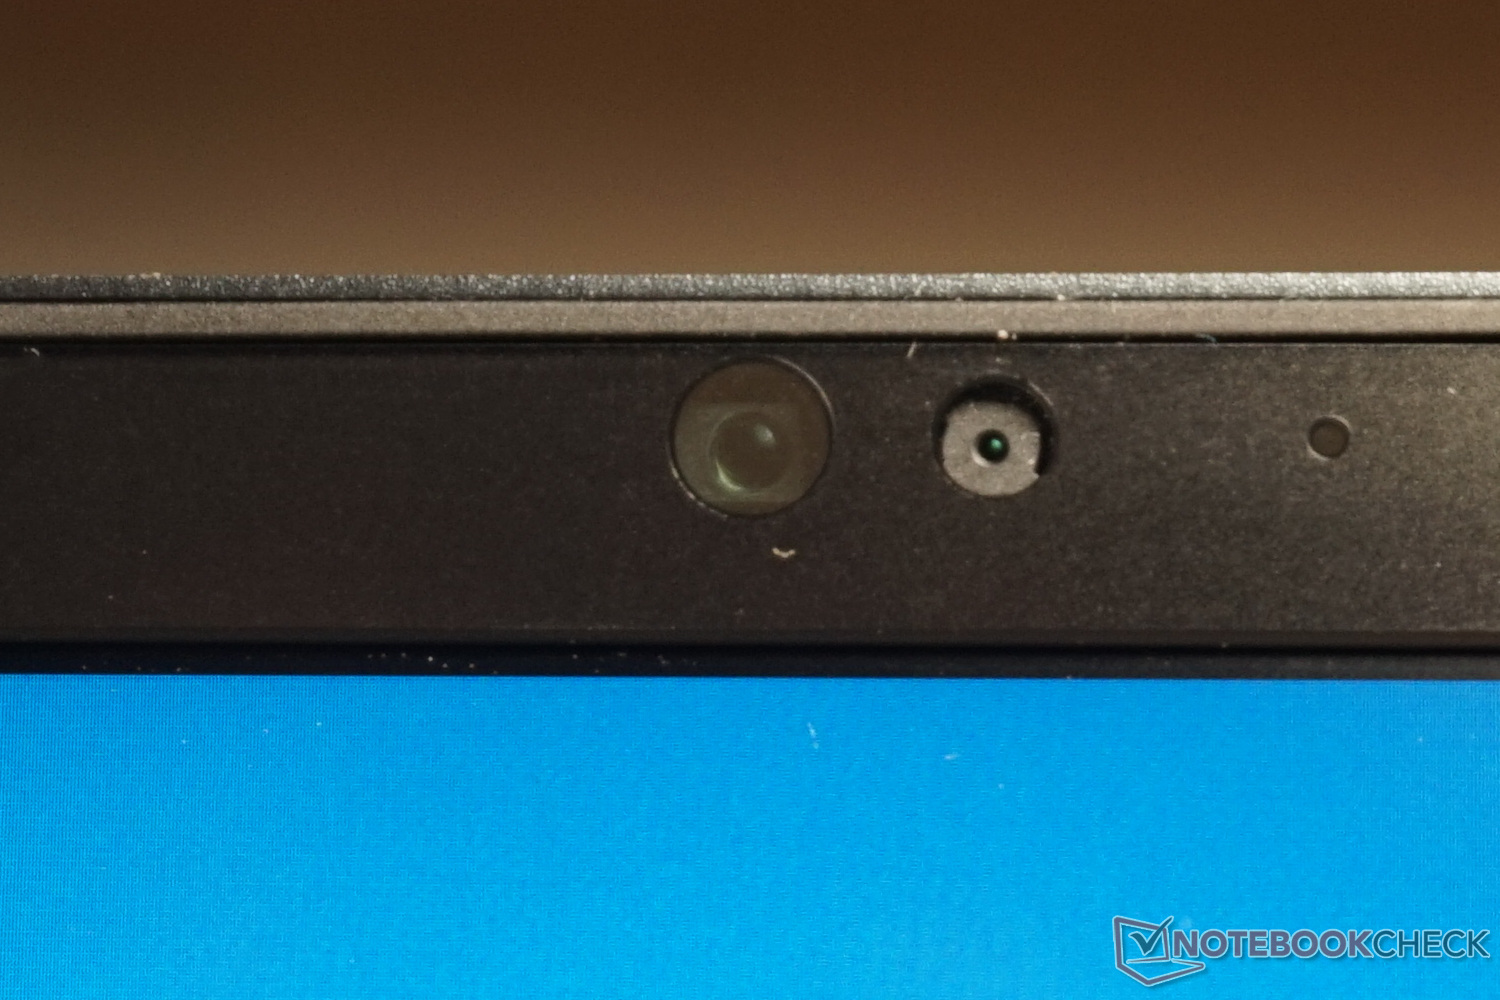
A webcam do MSI Prestige 15 não é muito impressionante: apenas a qualidade HD, que não funciona bem durante as chamadas de vídeo, na verdade é muito pequena para um notebook multimídia. Por outro lado, o reconhecimento em baixa luminosidade é convincente. Mesmo o brilho da tela é suficiente para que o laptop possa ser usado para videotelefonia a qualquer momento.
Os dois microfones não compensam a fraca qualidade do vídeo. As vozes soam como uma lata, e o que é dito só pode ser compreendido quando se fala diretamente em frente ao laptop.
Pelo menos o reconhecimento facial com infravermelho funciona de forma confiável. Em geral, a webcam é utilizável, mas a resolução e os microfones atendem apenas aos requisitos mínimos


Segurança

Embora não haja nenhum cadeado Kensington para fixar o dispositivo na mesa ou no local de trabalho, pelo menos o login pode ser feito de forma segura através do reconhecimento facial e do sensor de impressões digitais.
Um pouco incomum é a posição do sensor no touchpad, mas seu design generoso garante que isto não deixe uma impressão negativa durante o uso. No entanto, os usuários esquerdinos podem ver isto de forma diferente. A construção e a operação tiveram uma pontuação muito boa em nossos testes funcionais. A tecnologia parece ser significativamente mais robusta do que muitos sensores de impressão digital construídos com teclados.
O reconhecimento facial no Prestige 15 também funcionou livre de erros. Independentemente das condições de iluminação, a câmera infravermelha reconheceu o usuário corretamente
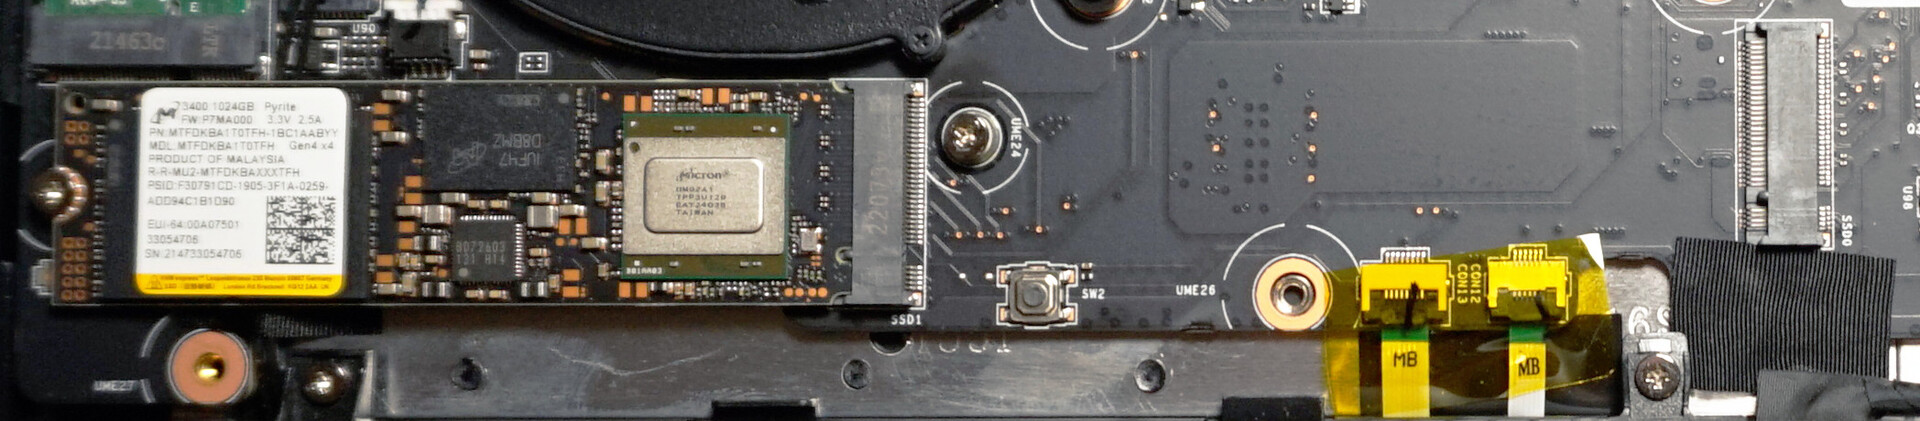
Manutenção

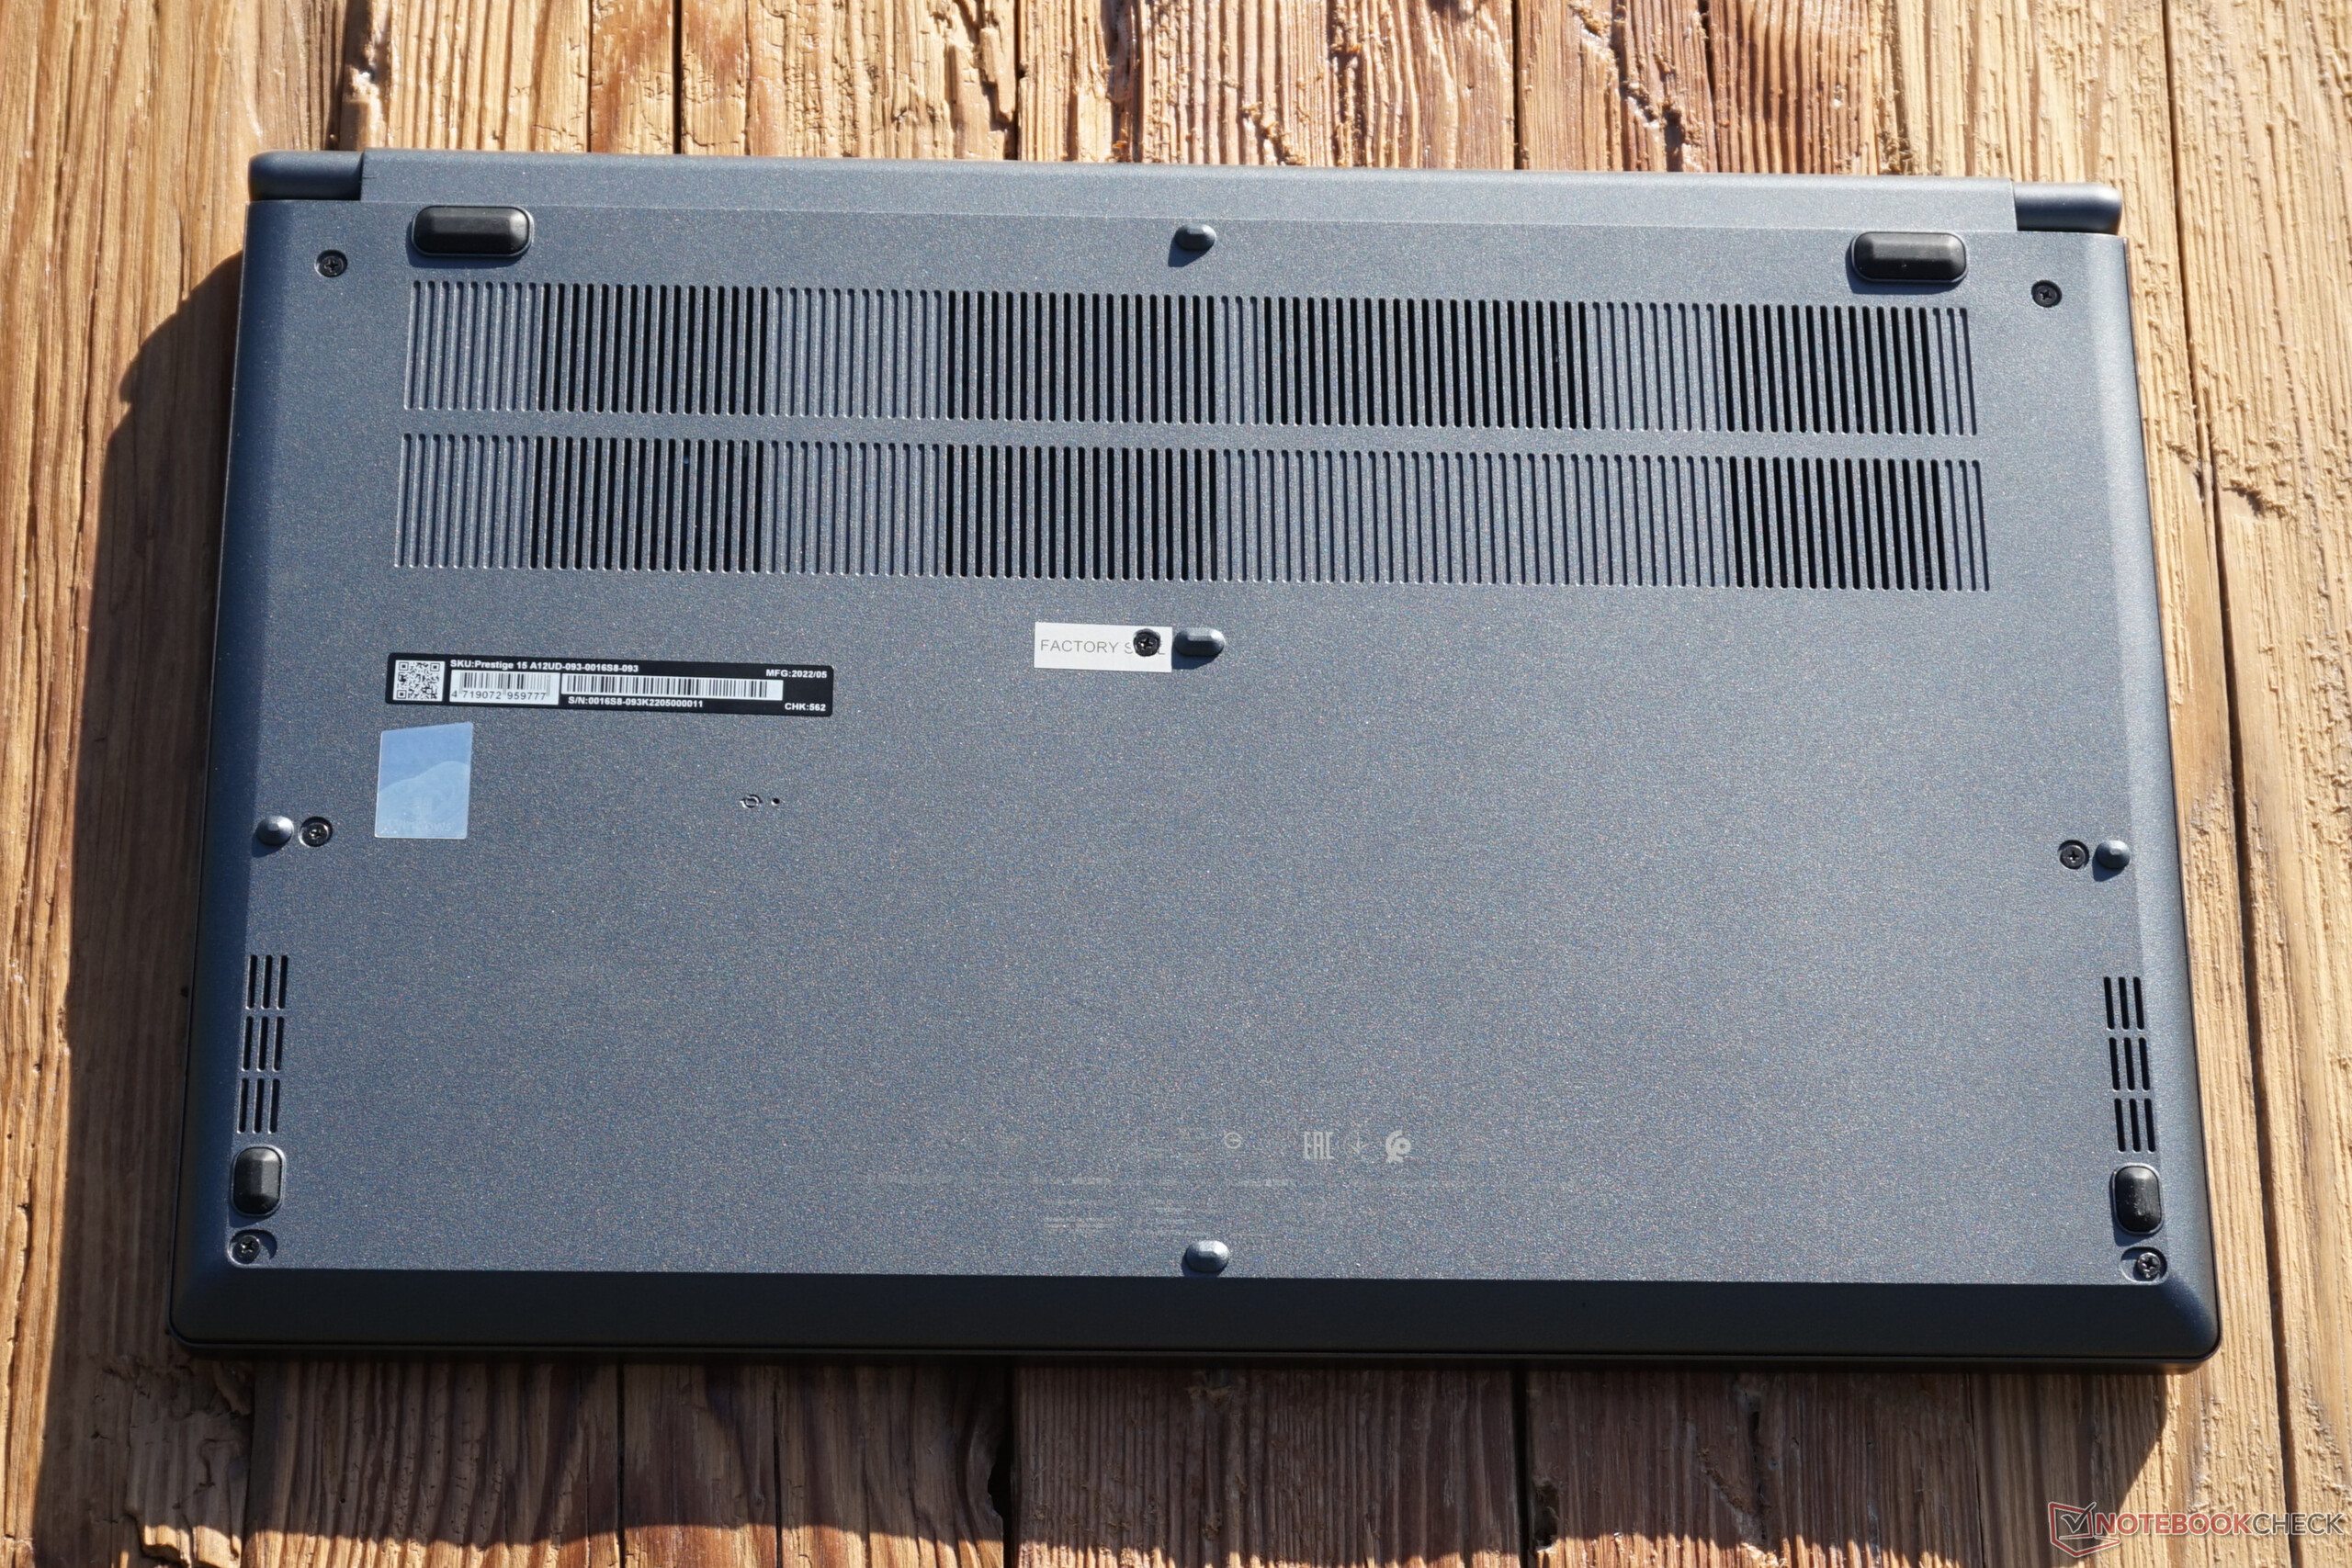
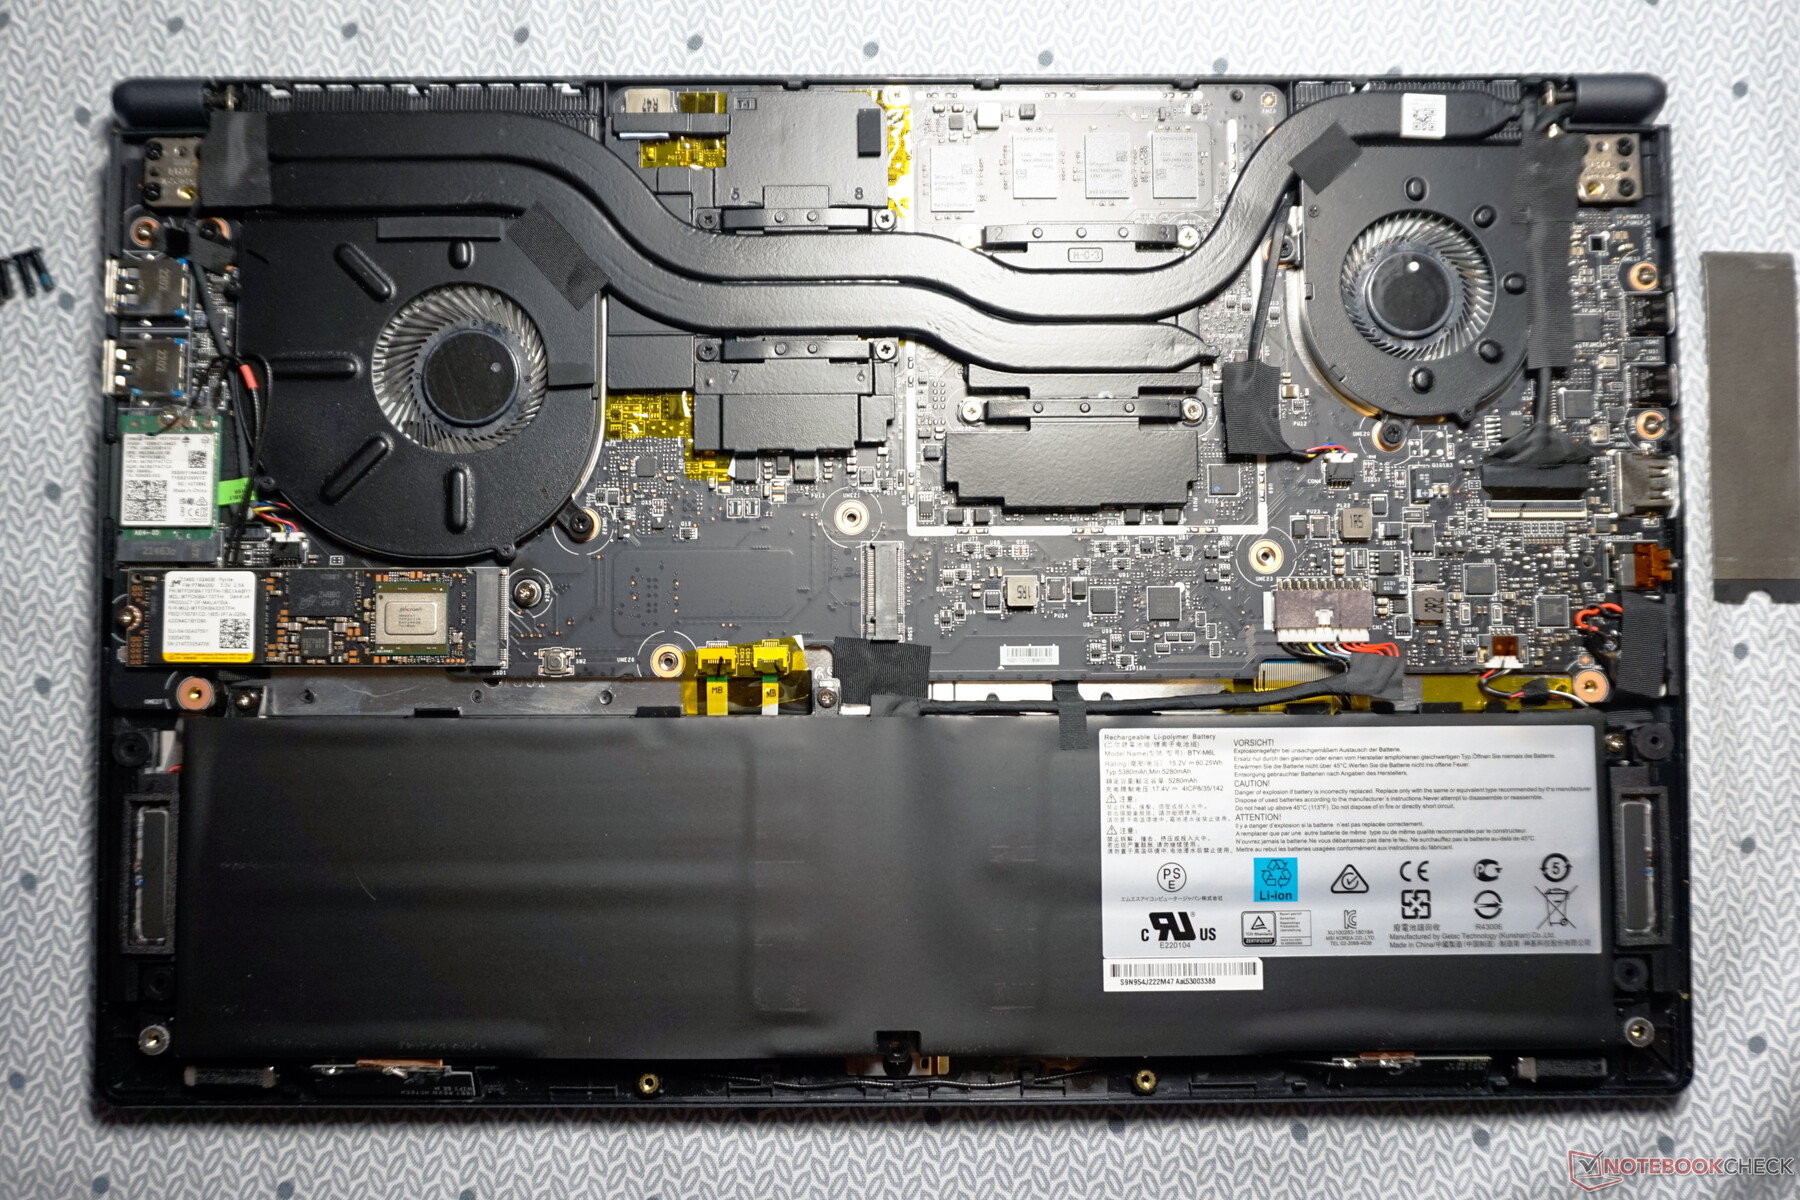
O laptop MSI era fácil de abrir. Apenas sete parafusos Phillips têm que ser afrouxados a fim de destacar a placa de base com pouco esforço. Infelizmente, o parafuso do meio é coberto por um selo. Após o contato com a MSI, tivemos a certeza de que a quebra do selo não invalida a garantia. No entanto, isto pode ter um efeito dissuasor para alguns usuários
Caso contrário, uma olhada no interior revela um projeto interno bem pensado. Somente a bateria é aparafusada. O módulo WLAN também pode ser trocado, se necessário.
Além disso, a expansão do espaço de armazenamento foi projetada para ser completamente simples, o que torna o selo ainda menos compreensível. Além do SSD já instalado, um SSD adicional pode ser inserido em um segundo slot M.2 no formato padrão 2280. Isto faz todo o sentido para a edição de vídeo.
Somente a RAM é permanentemente soldada. No máximo, isto pode ser problemático na variante para notebook com 16 GB em algum momento no futuro. A configuração de 32 GB, por outro lado, deve ser completamente suficiente a longo prazo.
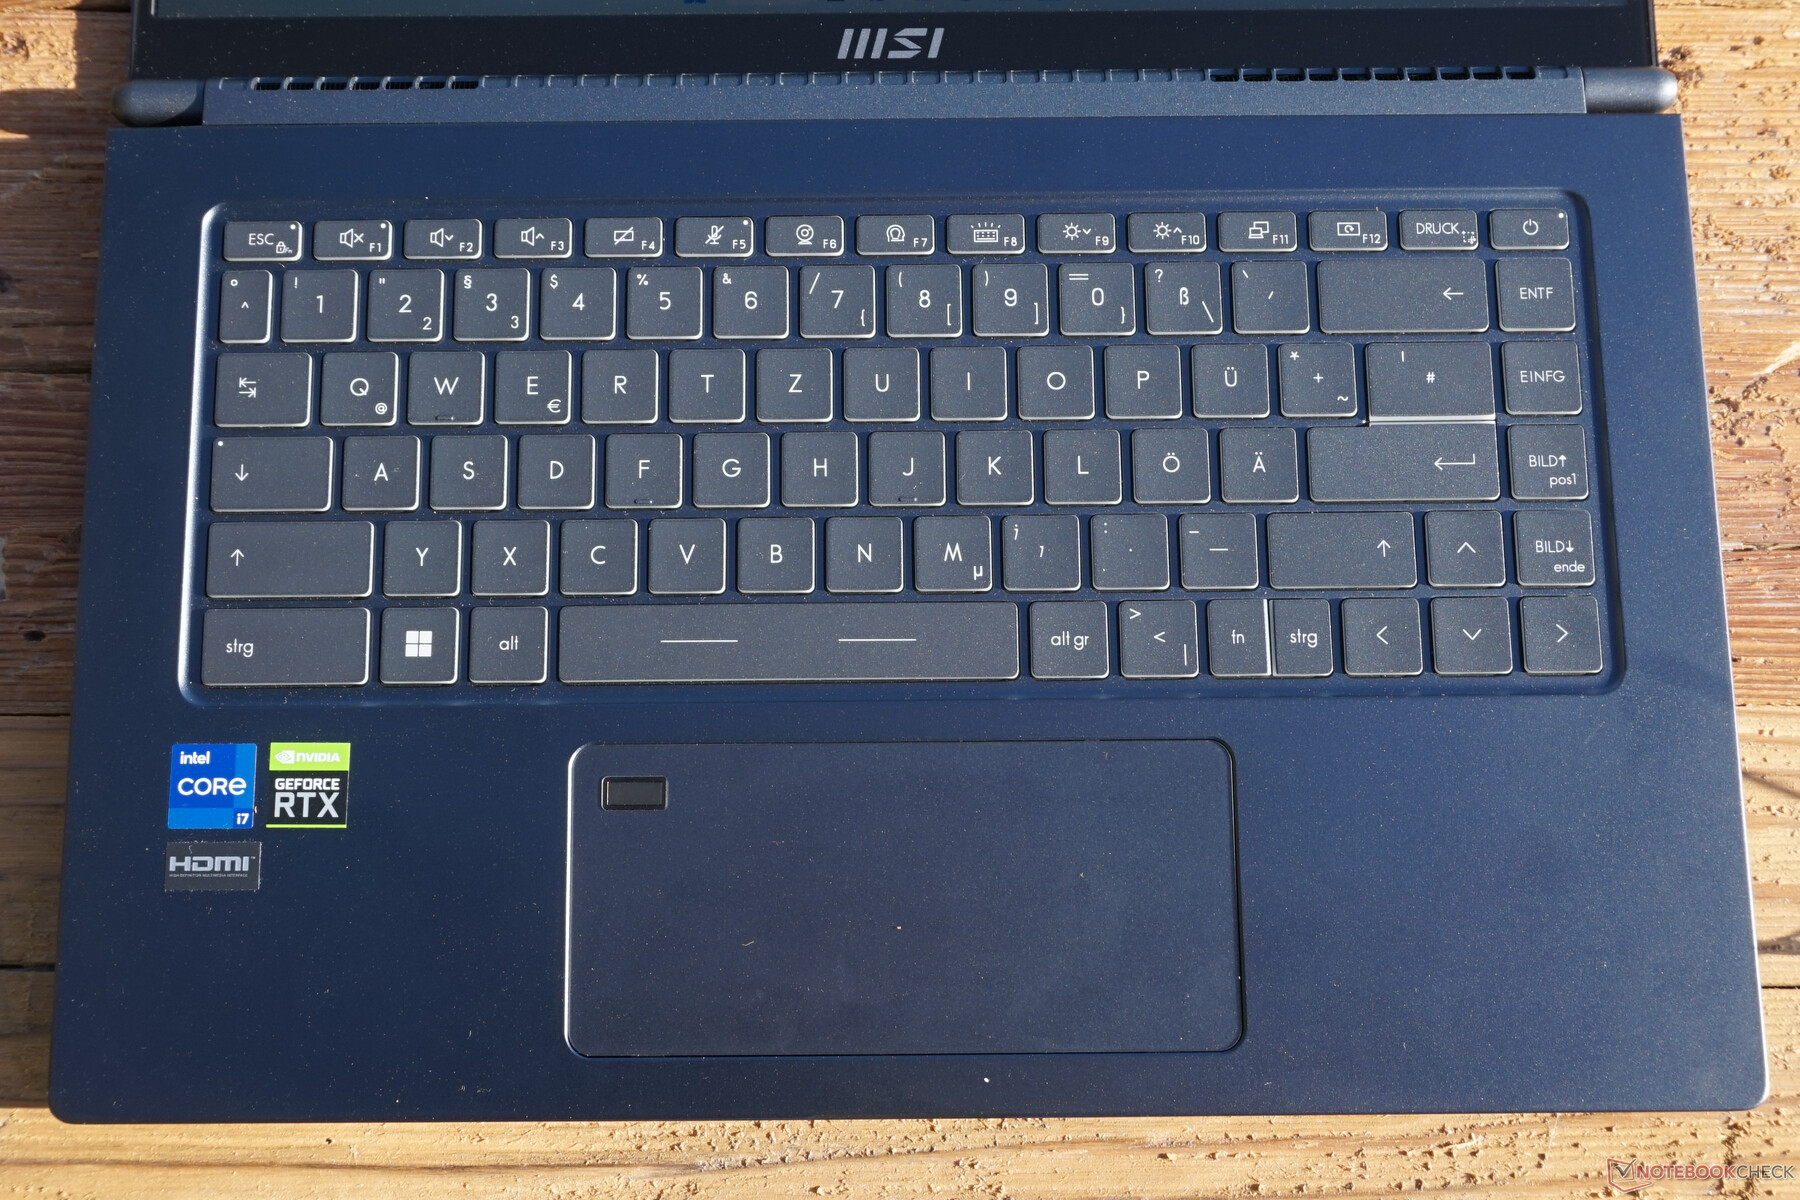
Dispositivos de entrada - Criador de laptop com padrão simples
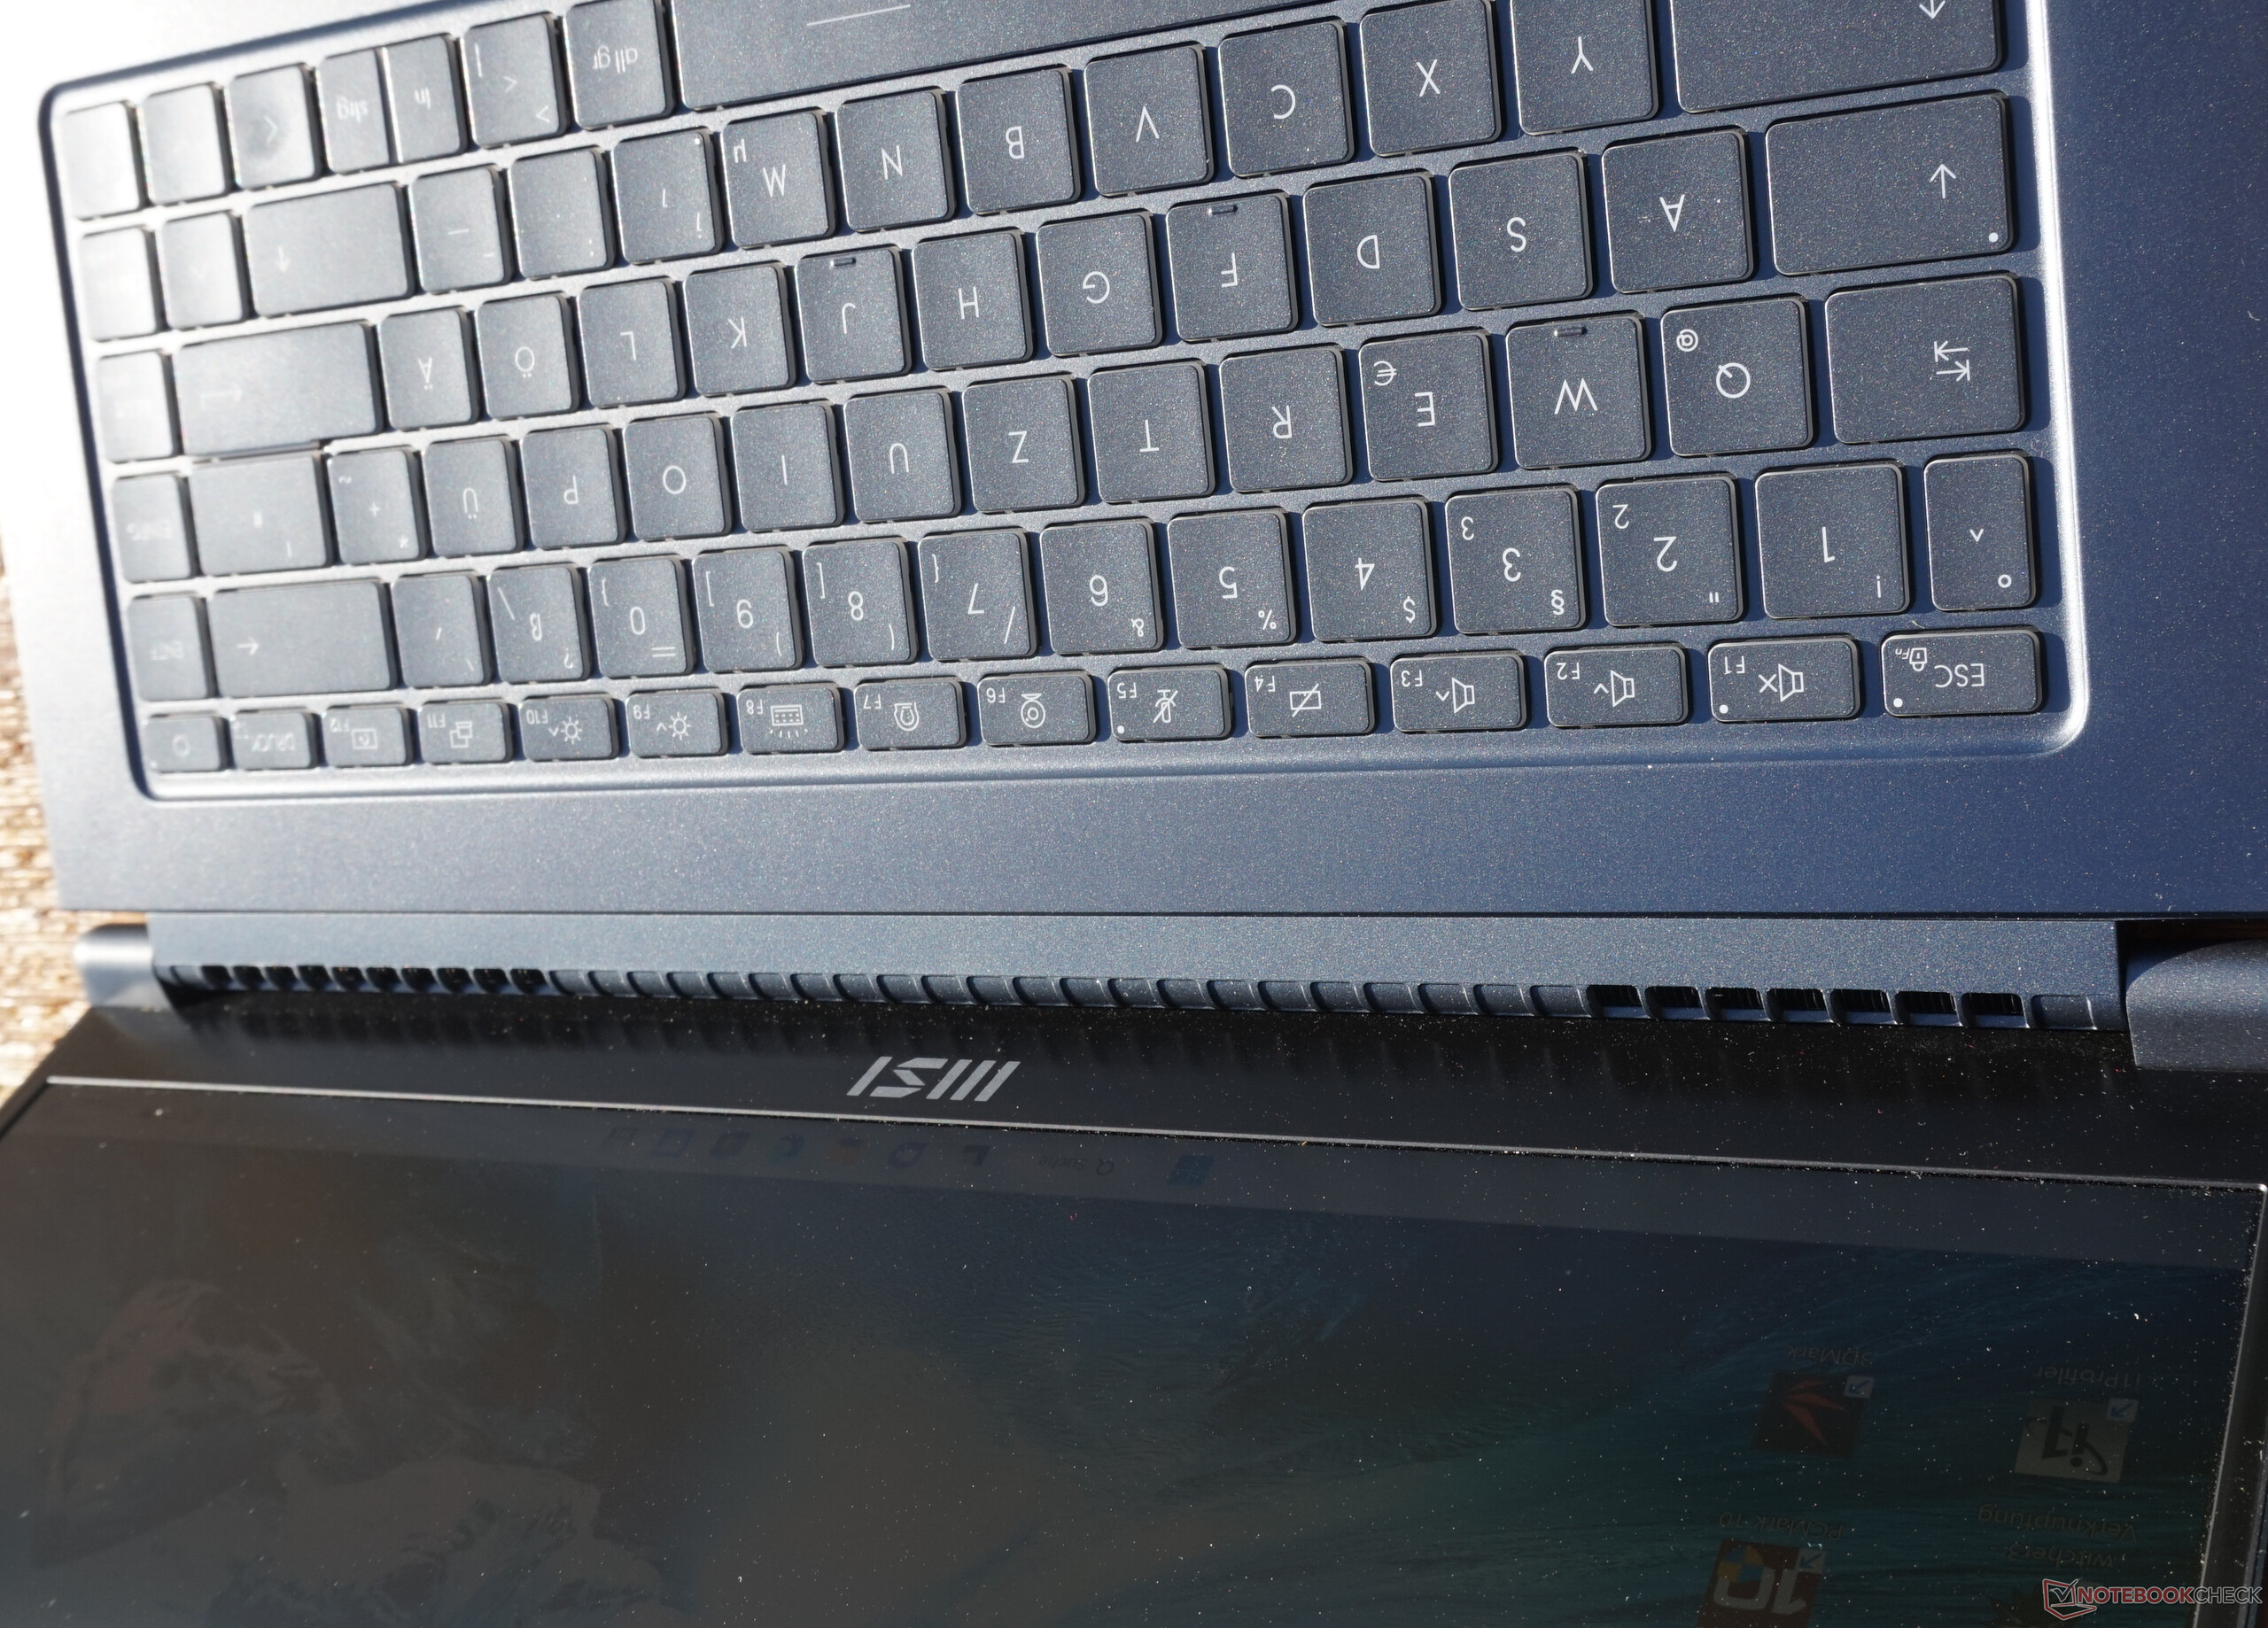
As letras claramente reconhecíveis e, acima de tudo, o tamanho familiar e o espaçamento padronizado, poupam qualquer habituação. A digitação no teclado do MSI Prestige 15 é rápida e precisa. Não é particularmente barulhento nem muito silencioso.
A resistência das teclas é bem dosada e também deve ser bem adequada para longos períodos de trabalho. Entretanto, um pouco mais do que apenas 1 mm de percurso teria sido desejável, especialmente com uso intensivo.
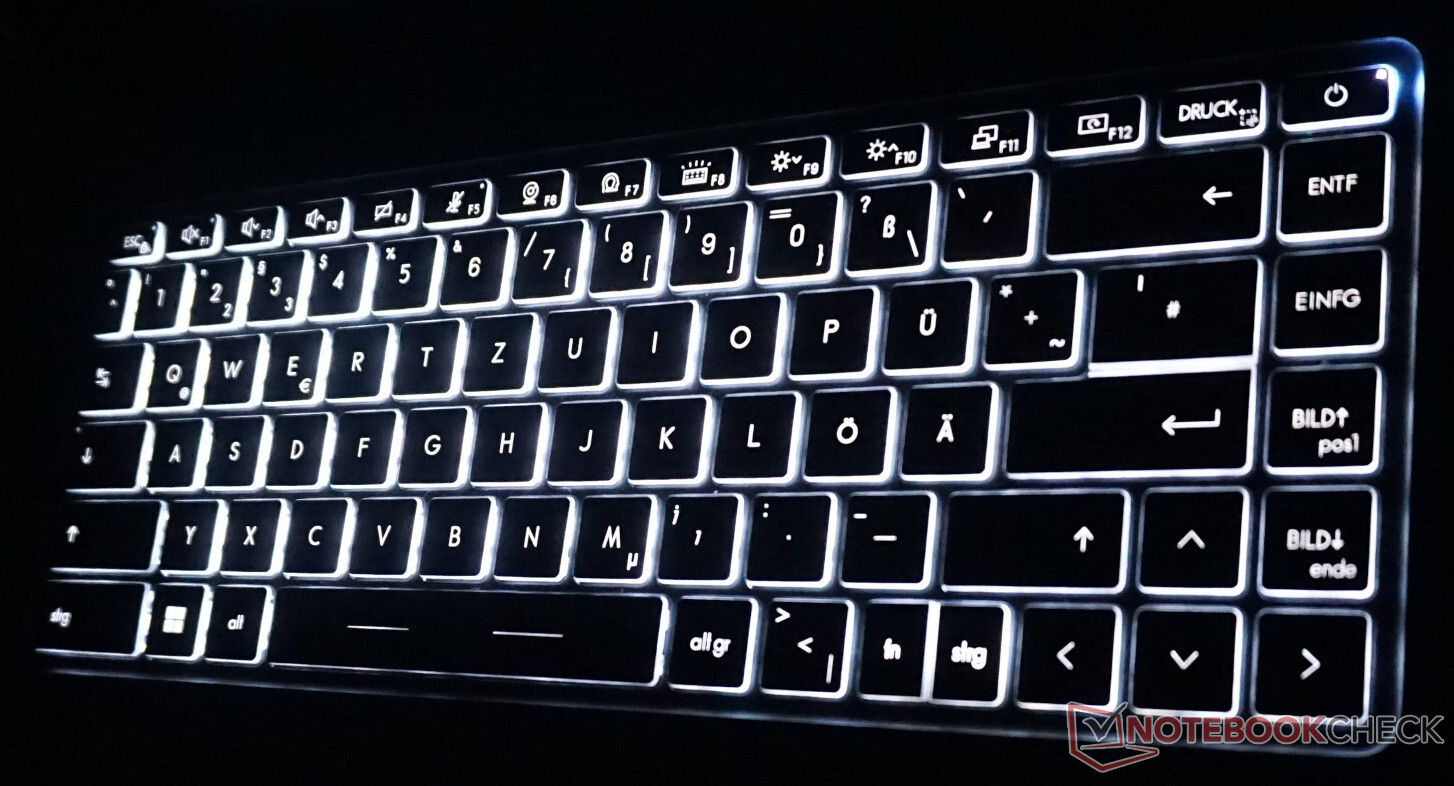
A retroiluminação também não deixa espaço para críticas. Três níveis diferentes de brilho estão disponíveis, e nenhuma irregularidade foi observada. Além disso, a estrutura iluminada de cada chave garante uma excelente orientação em ambientes escuros.
O touchpad também deixa uma impressão positiva em geral. As entradas com um ou mais dedos são implementadas com precisão. A superfície de vidro é muito boa, e as teclas cobertas na área inferior também funcionam suavemente.
Não pudemos ver nenhuma vantagem real no design particularmente amplo à primeira vista, especialmente porque o sensor de impressão digital também está instalado aqui. O comprimento de apenas 65 mm, por outro lado, parece um pouco apertado. Aqui, um desliza rapidamente para além do touchpad.
Mostrador - O Prestige 15 oferece 4K e mais

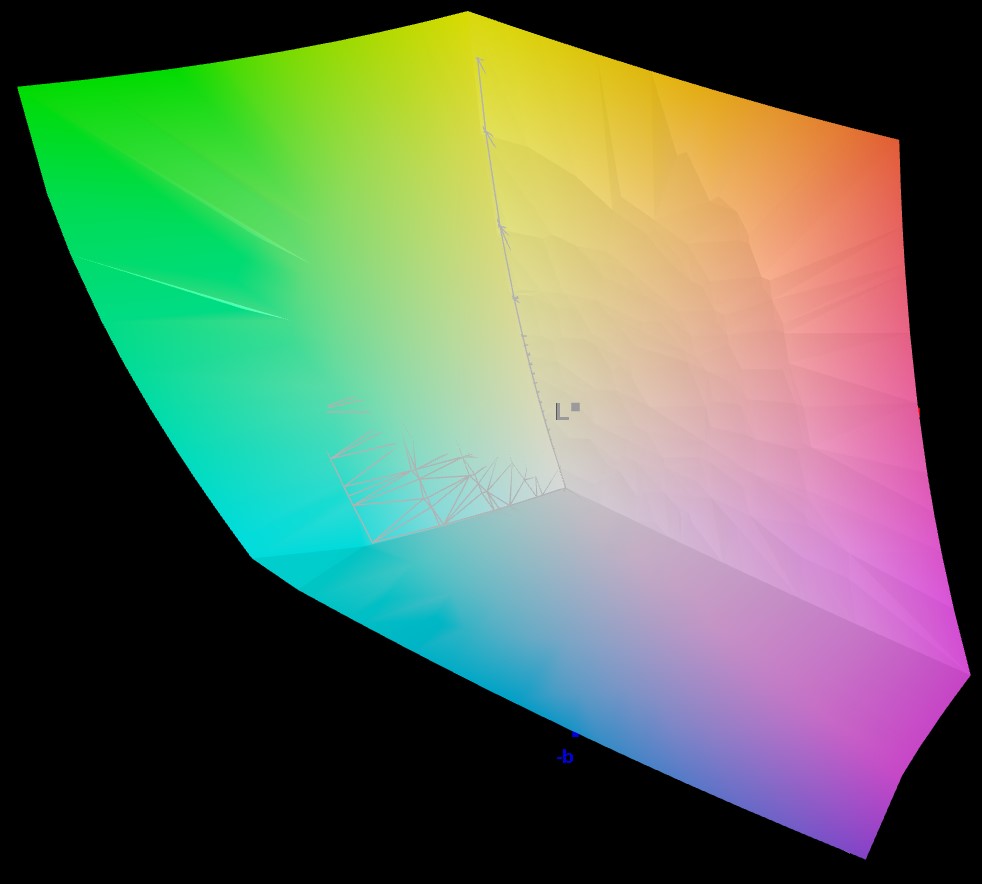
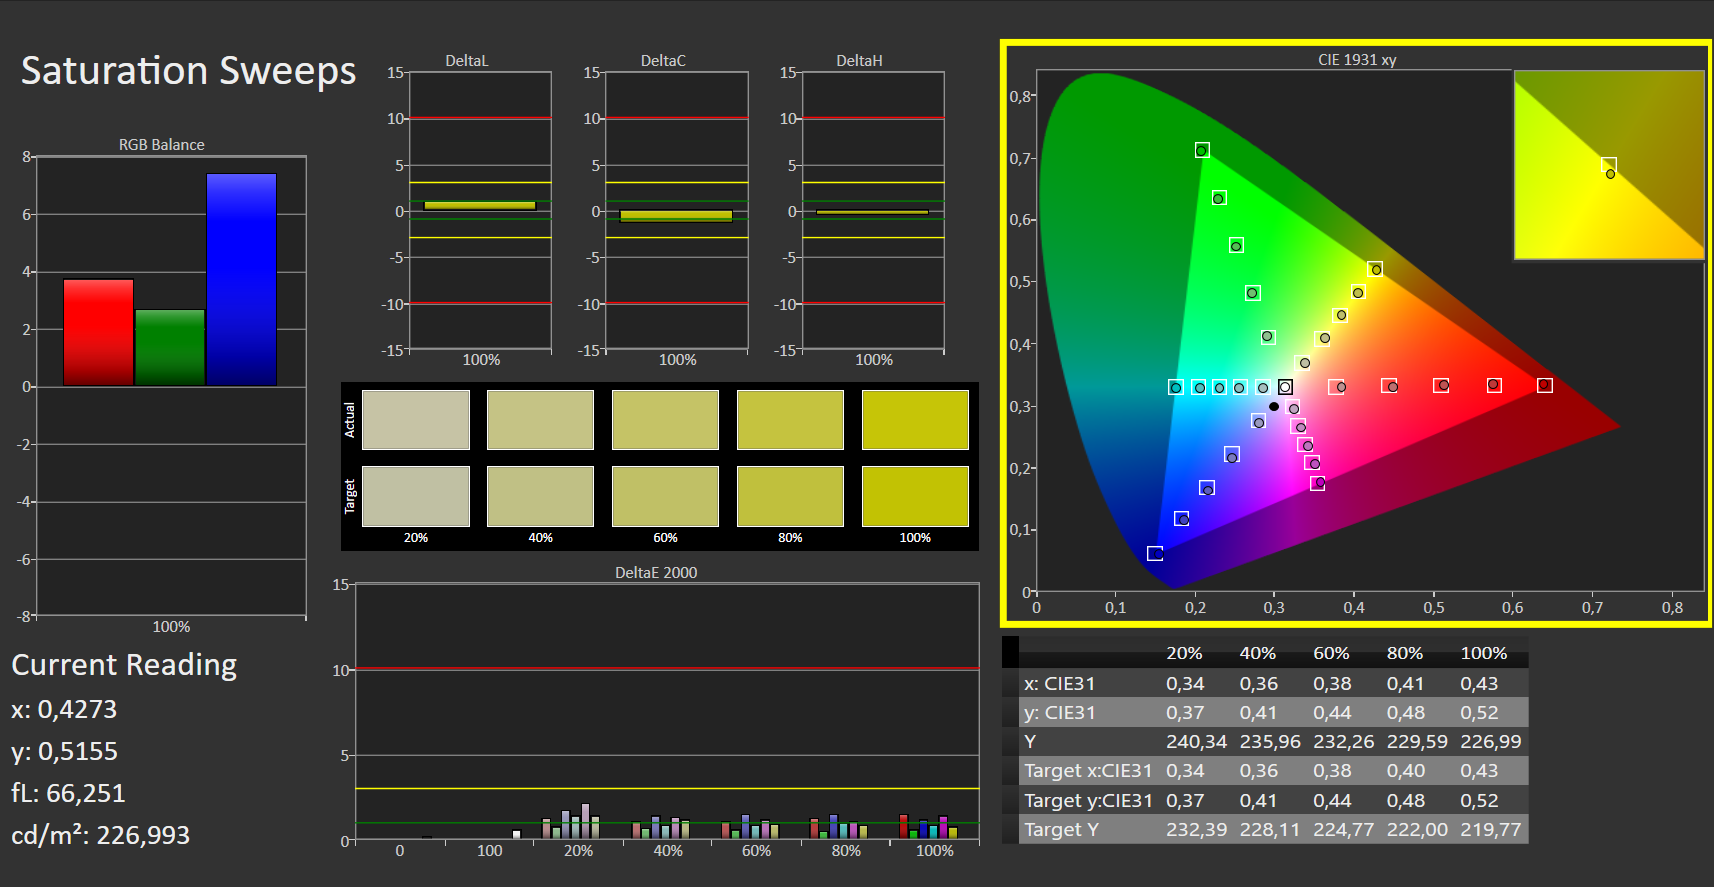
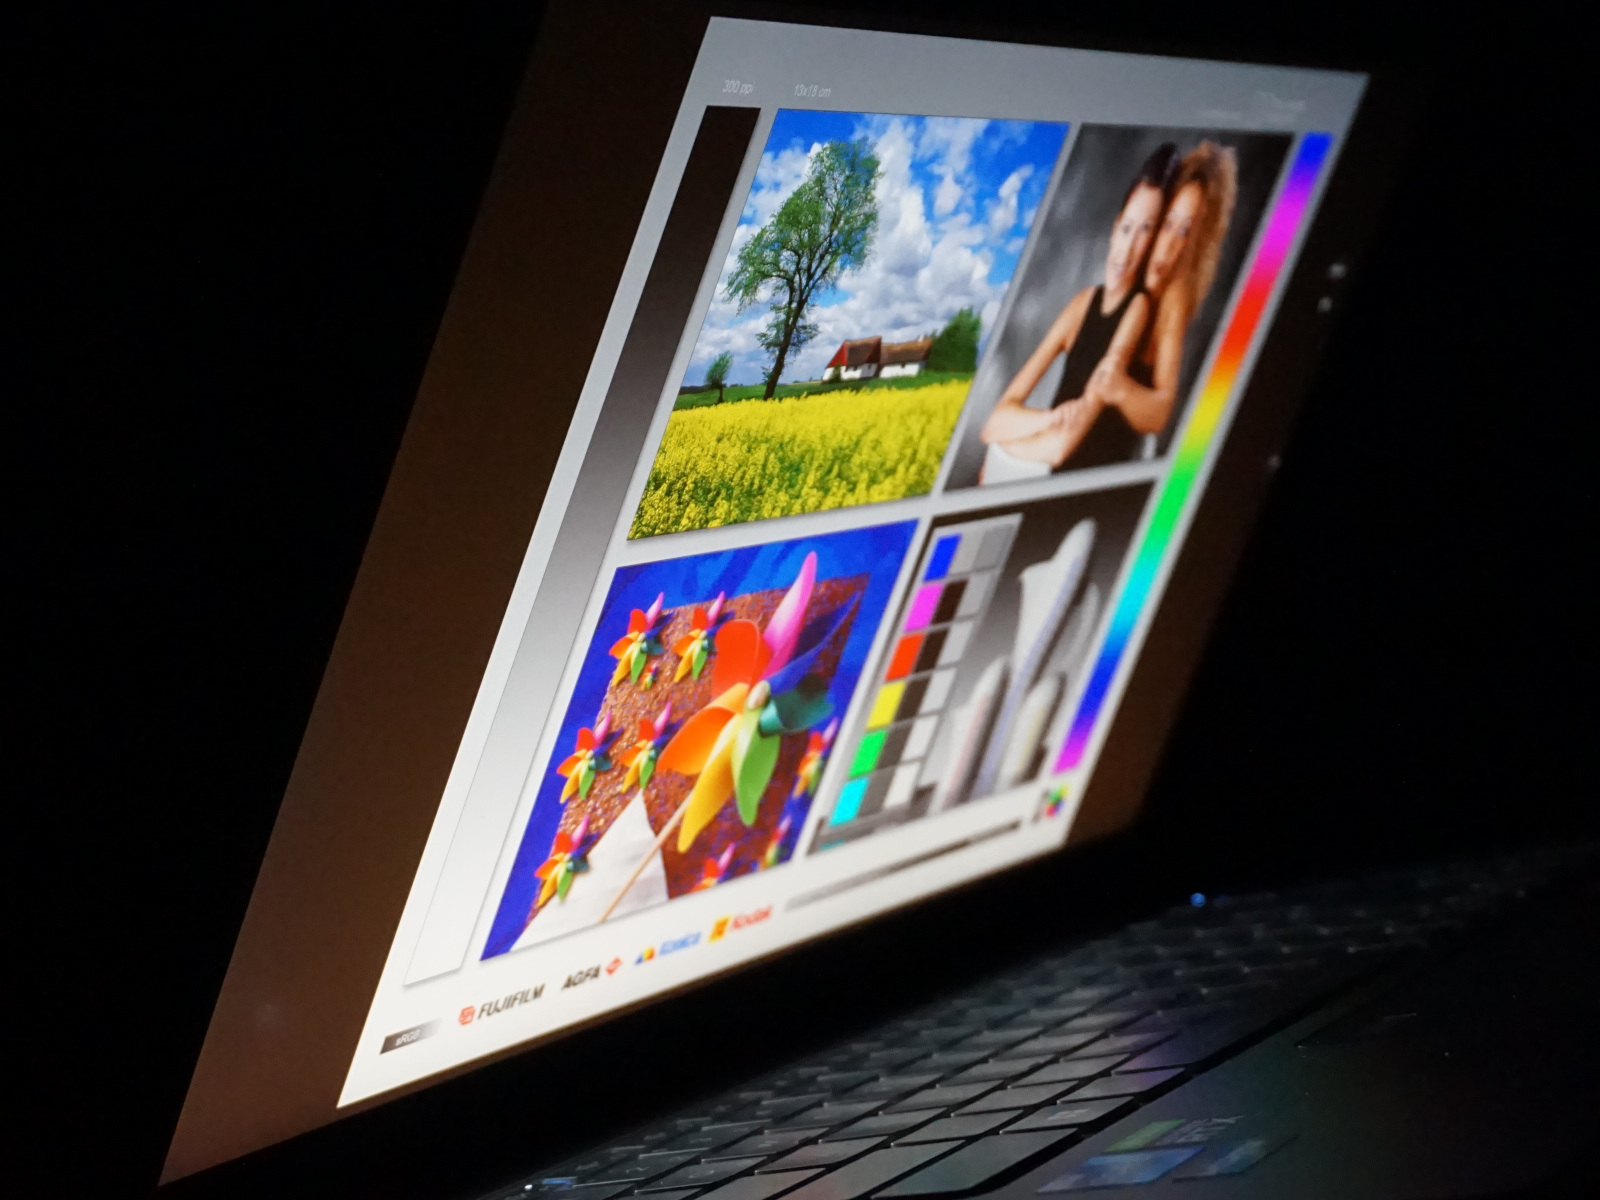
Os valores da tela indicam claramente que a MSI é muito séria em se posicionar como um laptop criador. Com uma diagonal de 15,6 polegadas, a resolução de 4K garante uma densidade de pixels extremamente alta. Os pixels individuais não são discerníveis, mesmo a curta distância. Alternativamente, pode ser usado um monitor Full HD, que infelizmente tem um desempenho um pouco pior em termos de reprodução de cores
O contraste é impressionante e é suportado por um valor muito baixo de preto, entre outras coisas. O brilho é ligeiramente acima da média a uma média de 420 cd/m², o que não diminui no modo de bateria.
Observamos um sangramento mínimo da tela na borda inferior. Entretanto, isto só ocorre durante o brilho total da tela, uma imagem completamente preta e longos tempos de exposição. Isto também não deve ser visível a olho nu. Os tempos de resposta são aceitáveis para um laptop multimídia. A cintilação não foi detectada em vários níveis de luminosidade.
Entretanto, a resolução de 4K em uma área que dificilmente é maior do que uma folha DIN A4 não parece ser realmente prática. O Windows recomenda uma ampliação de 250%, o que parece realista. Mesmo 200% torna a leitura na tela difícil. Uma tela em tamanho real torna o trabalho no Prestige 15 quase impossível. Além disso, muito poucos são capazes de dizer a diferença se a imagem exibida está em FullHD ou 4K porque os detalhes são simplesmente muito pequenos.
Em qualquer caso, a tela é feita para edição de fotos. Mas seus próprios olhos podem ter dificuldade em reconhecer este nível de detalhe. A conexão de um monitor adequado em combinação com uma tela Full HD integrada parece mais prática
| |||||||||||||||||||||||||
iluminação: 85 %
iluminação com acumulador: 441 cd/m²
Contraste: 2845:1 (Preto: 0.155 cd/m²)
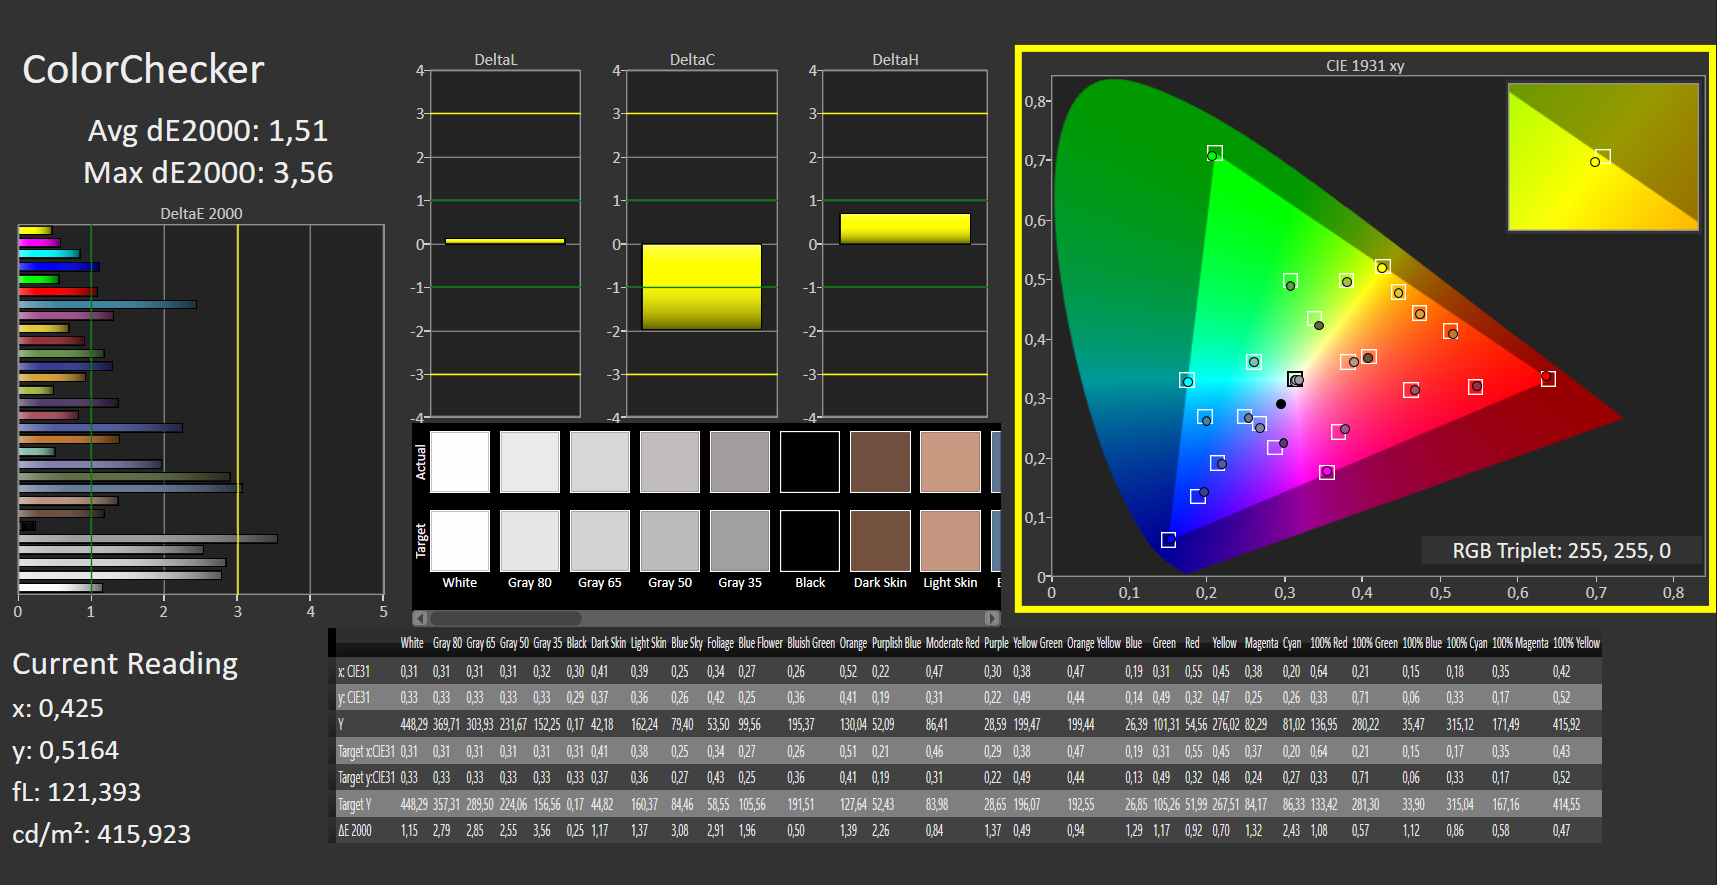
ΔE ColorChecker Calman: 1.51 | ∀{0.5-29.43 Ø4.71}
ΔE Greyscale Calman: 2.49 | ∀{0.09-98 Ø4.96}
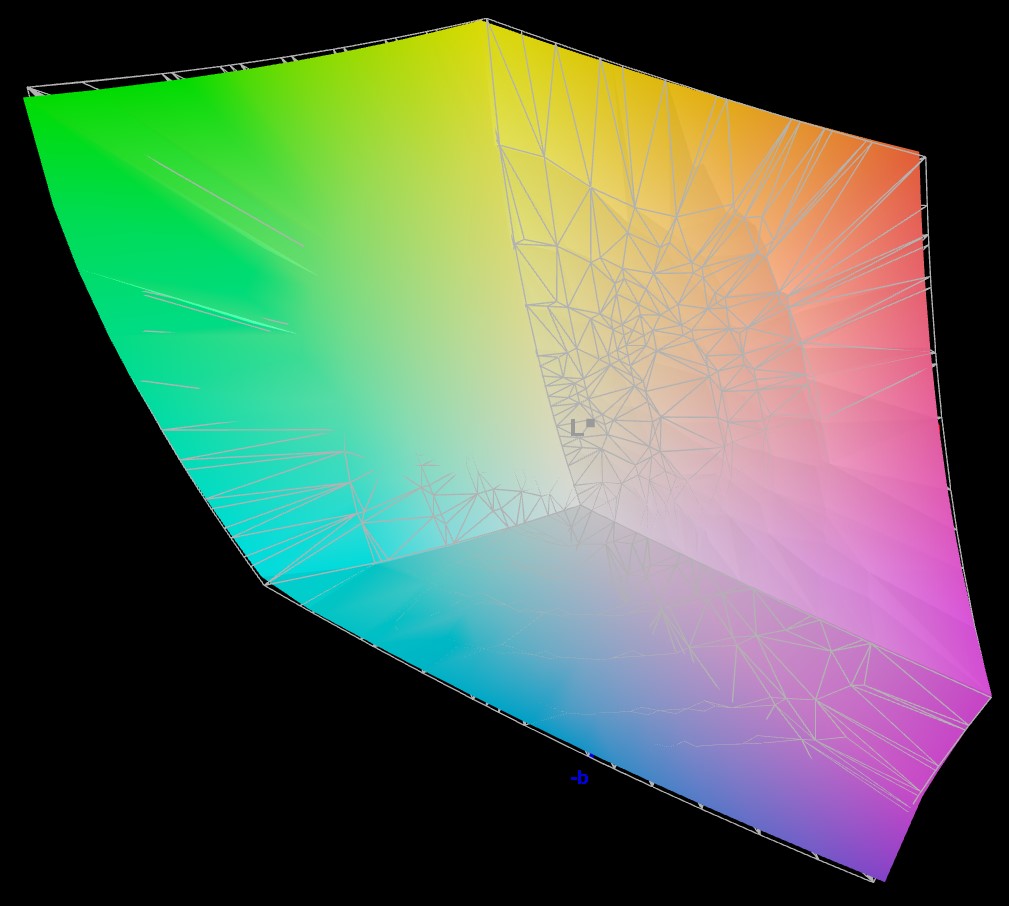
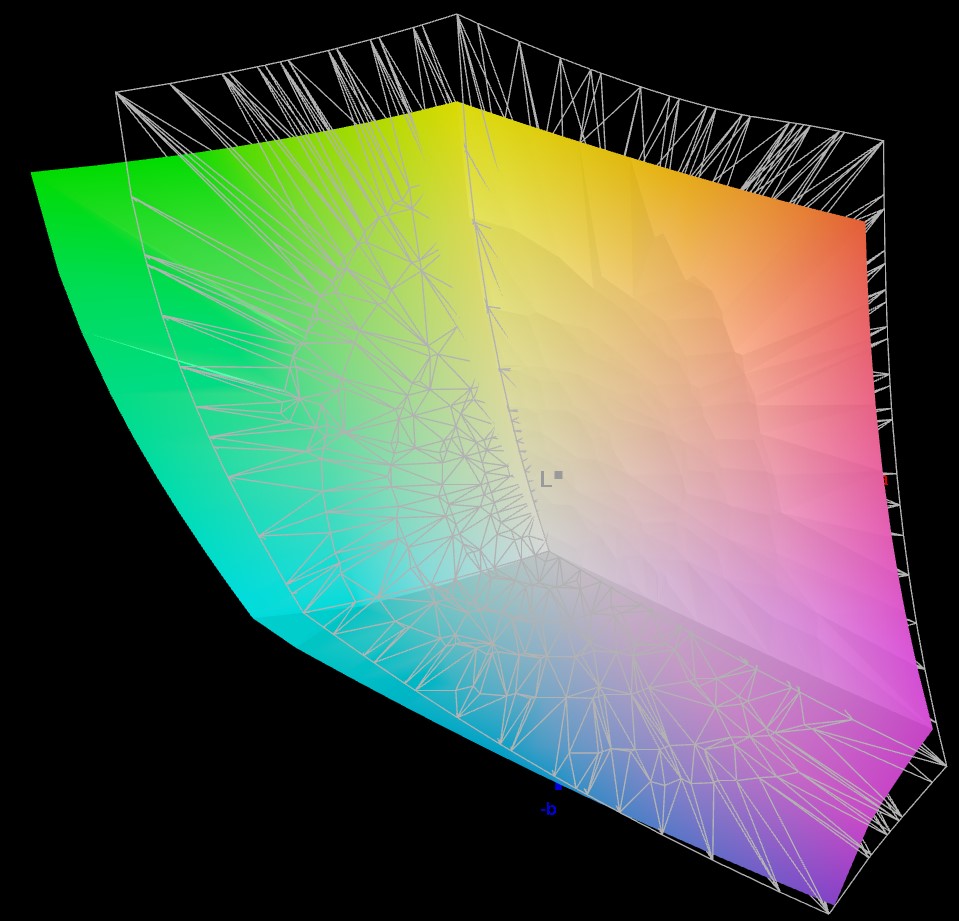
94.02% AdobeRGB 1998 (Argyll 3D)
96.95% sRGB (Argyll 3D)
80.48% Display P3 (Argyll 3D)
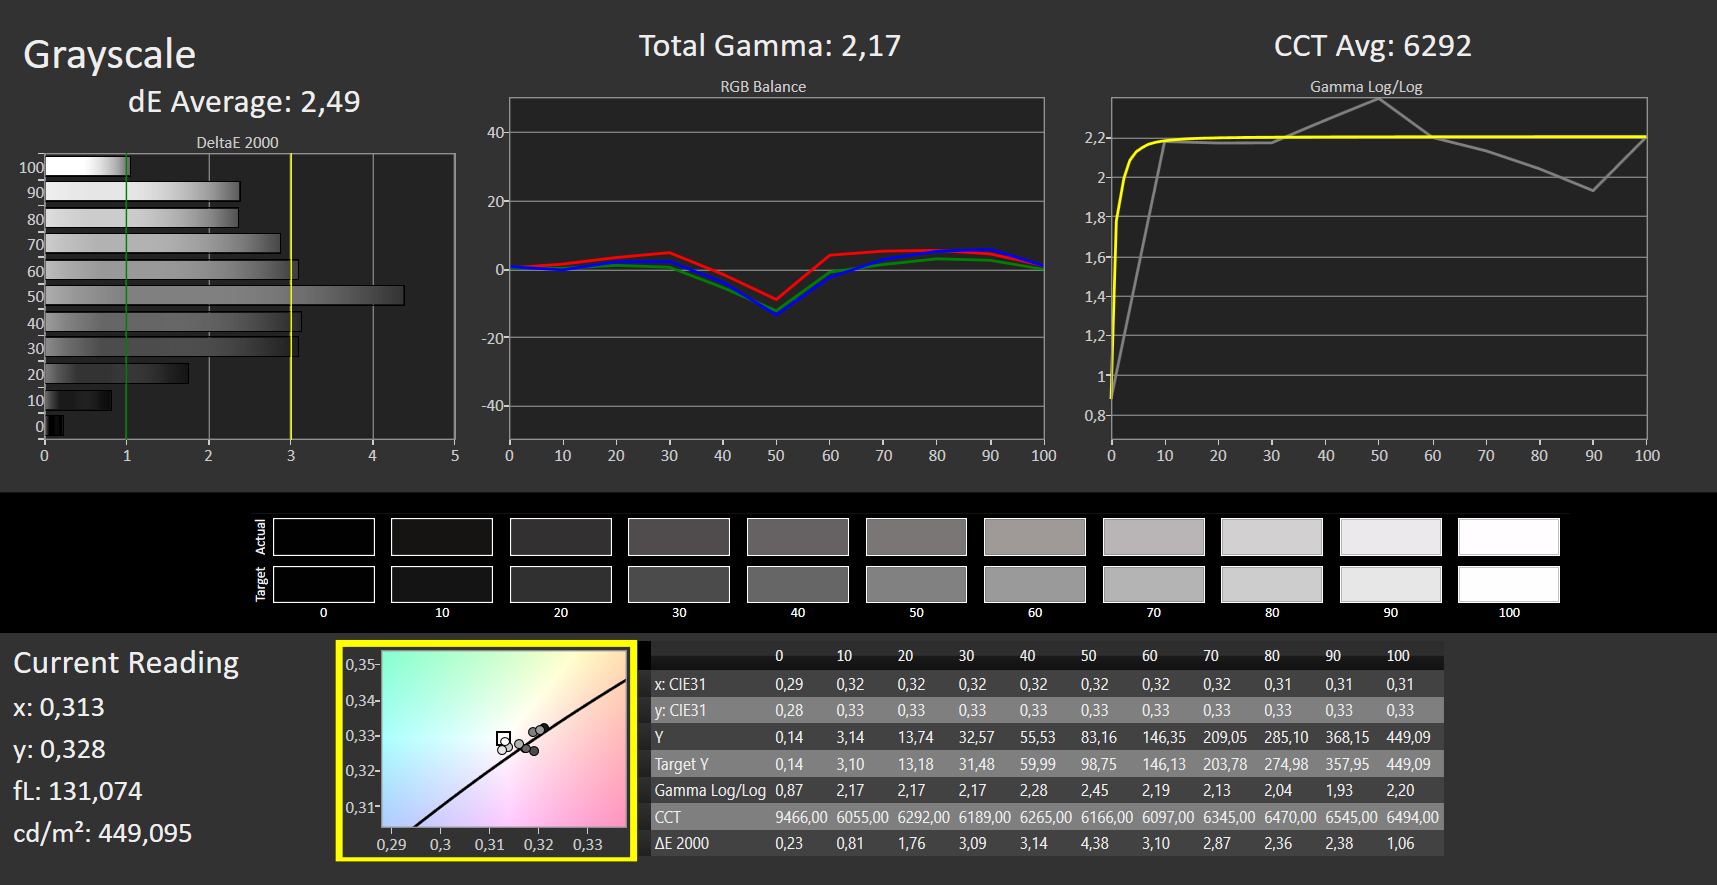
Gamma: 2.17
CCT: 6292 K
| MSI Prestige 15 A12UD-093 Sharp LQ156D1JW42, IPS, 3840x2160, 15.6" | Acer Swift X SFX16-52G-77RX B160QAN02.M, IPS-LED, 2560x1600, 16" | Schenker Vision 14 2022 RTX 3050 Ti MNE007ZA1-1, IPS, 2880x1800, 14" | Asus VivoBook Pro 16X OLED N7600PC-L2026X Samsung ATNA60YV02-0, OLED, 3840x2400, 16" | Lenovo IdeaPad Gaming 3 15ARH7 LEN156FHD, IPS, 1920x1080, 15.6" | Dell XPS 15 9520 RTX 3050 Ti Samsung 156XG01, OLED, 3456x2160, 15.6" | |
|---|---|---|---|---|---|---|
| Display | -7% | -9% | 10% | -49% | 5% | |
| Display P3 Coverage (%) | 80.48 | 76.4 -5% | 74.1 -8% | 99.9 24% | 39.4 -51% | 97.8 22% |
| sRGB Coverage (%) | 96.95 | 100 3% | 97.4 0% | 100 3% | 58 -40% | 99.9 3% |
| AdobeRGB 1998 Coverage (%) | 94.02 | 76.6 -19% | 75.3 -20% | 98.05 4% | 40.7 -57% | 86 -9% |
| Response Times | 39% | 41% | 95% | 44% | 95% | |
| Response Time Grey 50% / Grey 80% * (ms) | 51 ? | 33 ? 35% | 31.5 ? 38% | 1 98% | 20.8 ? 59% | 1.9 ? 96% |
| Response Time Black / White * (ms) | 26 ? | 15 ? 42% | 14.5 ? 44% | 2 ? 92% | 18.4 ? 29% | 1.9 ? 93% |
| PWM Frequency (Hz) | 247 ? | 59.52 ? | ||||
| Screen | -30% | -46% | 57% | -138% | -56% | |
| Brightness middle (cd/m²) | 441 | 411 -7% | 421 -5% | 383 -13% | 287.8 -35% | 381.4 -14% |
| Brightness (cd/m²) | 416 | 378 -9% | 416 0% | 390 -6% | 268 -36% | 384 -8% |
| Brightness Distribution (%) | 85 | 83 -2% | 89 5% | 96 13% | 86 1% | 95 12% |
| Black Level * (cd/m²) | 0.155 | 0.29 -87% | 0.28 -81% | 0.027 83% | 0.3 -94% | |
| Contrast (:1) | 2845 | 1417 -50% | 1504 -47% | 14185 399% | 959 -66% | |
| Colorchecker dE 2000 * | 1.51 | 2.18 -44% | 3.2 -112% | 2.29 -52% | 6.3 -317% | 4.34 -187% |
| Colorchecker dE 2000 max. * | 3.56 | 4.84 -36% | 5.5 -54% | 3.47 3% | 21.32 -499% | 9.24 -160% |
| Greyscale dE 2000 * | 2.49 | 2.68 -8% | 4.4 -77% | 1.84 26% | 4 -61% | 2 20% |
| Gamma | 2.17 101% | 2.43 91% | 2.22 99% | 2.32 95% | 2.21 100% | 2.13 103% |
| CCT | 6292 103% | 6717 97% | 6384 102% | 6308 103% | 6762 96% | 6210 105% |
| Colorchecker dE 2000 calibrated * | 1.48 | 2 | 2.53 | |||
| Média Total (Programa/Configurações) | 1% /
-14% | -5% /
-24% | 54% /
52% | -48% /
-90% | 15% /
-12% |
* ... menor é melhor
A MSI promete 100% de cobertura do espaço de cores AdobeRGB no Prestige 15. Em vez disso, declara sem rodeios que este deveria ser o caso tipicamente. O 94% medido está um pouco fora do alvo, mas ainda é adequado para exibir e editar fotos em um nível alto.
A tela é muito pior na cobertura do espaço de cores DCI-P3, que é freqüentemente usado para conteúdo de vídeo e tem faixas verdes e amarelas maiores. Isto não é surpreendente, uma vez que o foco está na edição de imagens
A calibração de fábrica especificada está ligeiramente fora da marca em nossa amostra de revisão com um DeltaE máximo de 2. Para ser justo, os desvios de cor só são perceptíveis a partir de um valor de 3, portanto o valor médio permanece bem abaixo disso.
Assim, a tela do Prestige 15 exibirá cores quase realistas sem nenhum outro ajuste
Exibir tempos de resposta
| ↔ Tempo de resposta preto para branco | ||
|---|---|---|
| 26 ms ... ascensão ↗ e queda ↘ combinadas | ↗ 11 ms ascensão |  |
| ↘ 15 ms queda | ||
| A tela mostra taxas de resposta relativamente lentas em nossos testes e pode ser muito lenta para os jogadores. Em comparação, todos os dispositivos testados variam de 0.1 (mínimo) a 240 (máximo) ms. » 63 % de todos os dispositivos são melhores. Isso significa que o tempo de resposta medido é pior que a média de todos os dispositivos testados (19.8 ms). | ||
| ↔ Tempo de resposta 50% cinza a 80% cinza | ||
| 51 ms ... ascensão ↗ e queda ↘ combinadas | ↗ 23 ms ascensão |  |
| ↘ 28 ms queda | ||
| A tela mostra taxas de resposta lentas em nossos testes e será insatisfatória para os jogadores. Em comparação, todos os dispositivos testados variam de 0.165 (mínimo) a 636 (máximo) ms. » 87 % de todos os dispositivos são melhores. Isso significa que o tempo de resposta medido é pior que a média de todos os dispositivos testados (31 ms). | ||
Cintilação da tela / PWM (modulação por largura de pulso)
| Tela tremeluzindo / PWM não detectado |  | ||
[pwm_comparison] Em comparação: 52 % de todos os dispositivos testados não usam PWM para escurecer a tela. Se PWM foi detectado, uma média de 7754 (mínimo: 5 - máximo: 343500) Hz foi medida. | |||


Os textos são legíveis ao ar livre e mesmo sob a luz direta do sol. Por outro lado, você deve procurar um ponto sombrio para o conteúdo colorido da tela, caso contrário, a reprodução de cores sofrerá.
No geral, o brilho permite que o Prestige 15 seja usado ao ar livre, mesmo que seja apenas
Como de costume, os painéis IPS devem garantir uma estabilidade quase perfeita do ângulo de visão, mas este não é o caso com o Prestige 15. As cores e o brilho permanecem inalterados apenas até cerca de 30 graus. Além disso, uma descoloração acastanhada pode ser vista, especialmente em superfícies pretas.
Suspeitamos de um efeito de interferência devido à alta densidade de pixels, como pode ser visto em experimentos com fendas duplas. Outro ponto que fala a favor dos modelos com telas Full HD.
Desempenho - Caderno de criação rápida e silenciosa
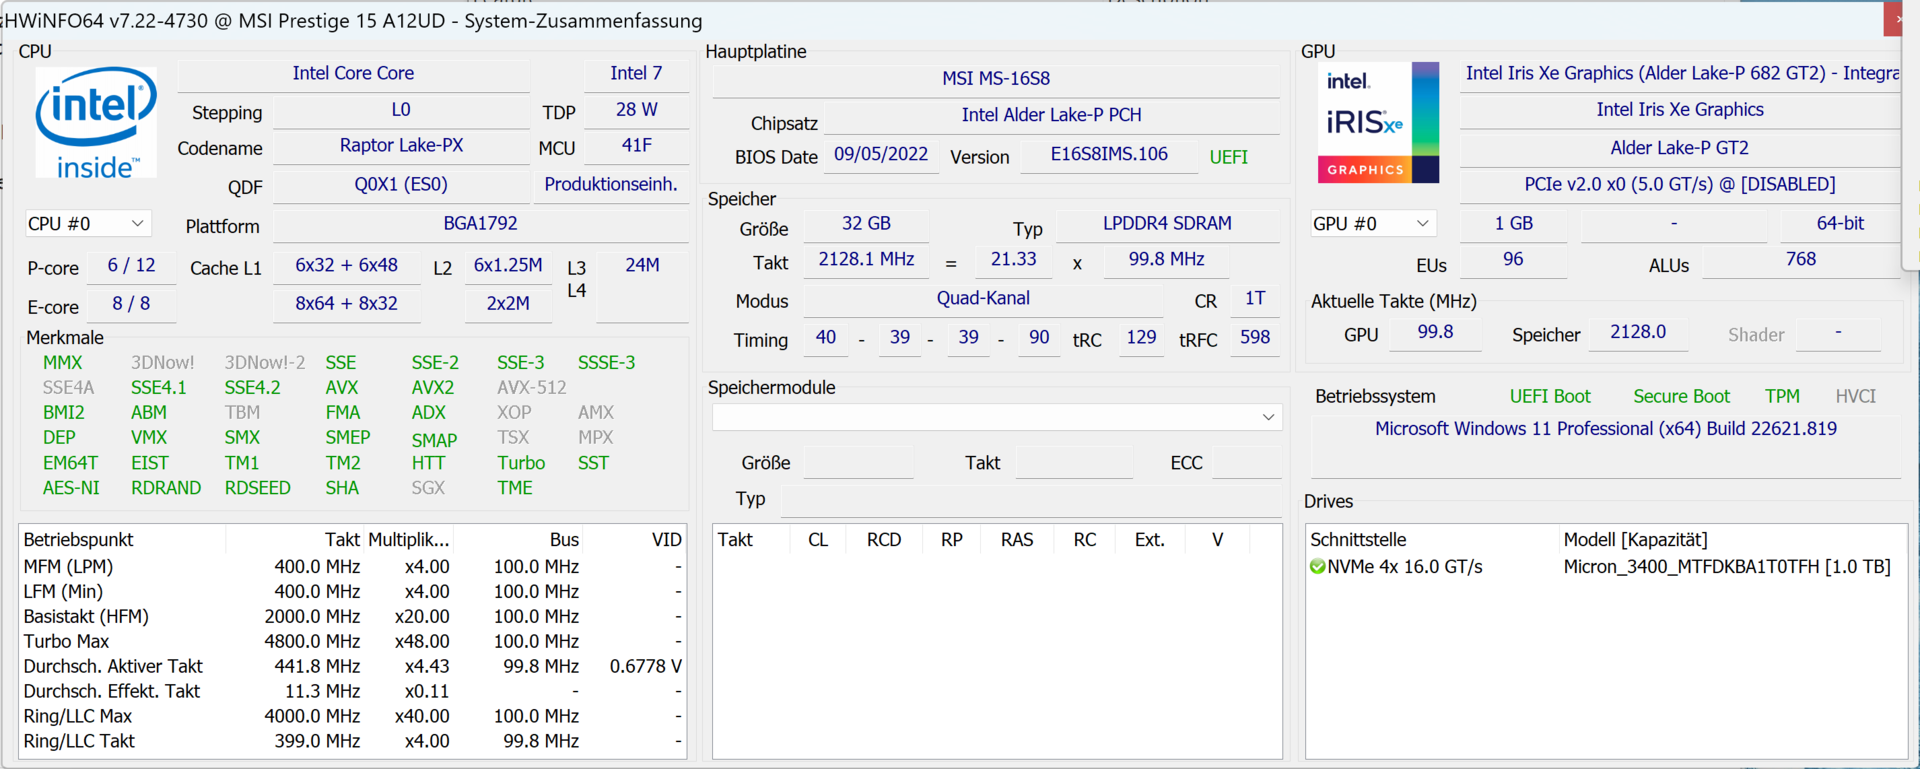
A combinação de umaIntel Core i7-1280P e um Nvidia GeForce RTX 3050 Tiprocessador gráfico garante tempos mínimos de espera durante o início do sistema e do programa. Com 14 núcleos e 20 fios, o MSI Prestige 15 não se deixa intimidar por múltiplos programas em execução simultânea. É claro, 32 GB de RAM também ajudam
Como a variante de mesa grande, o móvel RTX 3050 Ti é principalmente adequado para edição de imagem e vídeo. Tarefas complexas como a renderização de vídeo e otimização de fotos são correspondentemente rápidas. Entretanto, os jogos revelam os limites da GPU. Uma experiência de jogo suave só é realista com uma resolução limitada e detalhes restritos.
Se os tempos de processamento mais curtos não forem tão importantes para a edição de mídia, nada fala contra o Prestige 15 A12UC-099 com o Intel Core i5-1240P e 16 GB de RAM. No máximo, as limitações só vêm realmente à tona no trabalho multitarefa
Condições de teste
o "Smart Auto" foi configurado no MSI Center Pro para todos os testes. Este modo destina-se a garantir que as configurações mais desejáveis para o processador sejam selecionadas de acordo com os programas em execução e com o ambiente.
O modo estendido com ruído dinâmico do ventilador, que supostamente é menor em ambientes silenciosos do que em ruídos altos, ainda parece estar na fase experimental. Além das mensagens de erro, não houve mudanças perceptíveis
Por outro lado, aqueles que querem selecionar eles mesmos o modo de desempenho têm as seguintes opções:
| Alto desempenho | Balanceado | Silencioso | Super Bateria | |
|---|---|---|---|---|
| PL1 | 50 watts | 35 watts | 20 watts | 12 watts |
| PL2 | 64 watts | 40 watts | 35 watts | 15 watts |
Processador
O Intel Core i7-1280Ptem 6 núcleos de desempenho e 8 núcleos de eficiência, totalizando 20 fios (somente os núcleos P suportam 2 fios). A configuração é, portanto, fortemente reminiscente do Intel Core i7-12700Hque, no entanto, é projetado para uma carga contínua de 45 watts e não apenas 28 watts como o i7-1280P.
No início de nossos testes de resistência com o Cinebench R15, eles estão pelo menos no mesmo nível, devido à configuração comparável. Entretanto, o Prestige 15 tem que restringir a potência muito rapidamente, o que leva a uma redução significativa do desempenho. No entanto, a CPU permanece acima de umIntel Core i7-11370He no nível do AMD Ryzen 5 6600Hmesmo com o freio de mão ligado.
A i7-1280P pode assim utilizar seus pontos fortes exatamente da maneira que a MSI pretendia. Uma quantidade extremamente alta de desempenho está disponível nos primeiros segundos, o que é necessário ao executar programas ou instalações. O processamento de imagens também raramente leva mais de 30 segundos, mesmo em arquivos grandes.
A i7-1280P pode, portanto, acompanhar a muito maior i7-12700H em todos os cenários típicos. Somente programas mais exigentes como software de edição de vídeo e jogos experimentam quedas no desempenho. Mas estes são menos dramáticos do que o consumo de energia sugere: Enquanto a i7-12700H fornece cerca de 40% melhor taxa, ela consome quase o dobro de energia.
O processador instalado aqui ainda está no nível de CPUs não muito atualizadas que são encontradas em notebooks de jogos. Devido a seu consumo significativamente menor, a ventilação permanece silenciosa e a caixa aquece menos.
Mais referências para diferentes processadores podem ser encontradas em nossoLista de referência de CPU.
Cinebench R15 Multi Sustained Load
Cinebench R23: Multi Core | Single Core
Cinebench R20: CPU (Multi Core) | CPU (Single Core)
Cinebench R15: CPU Multi 64Bit | CPU Single 64Bit
Blender: v2.79 BMW27 CPU
7-Zip 18.03: 7z b 4 | 7z b 4 -mmt1
Geekbench 5.5: Multi-Core | Single-Core
HWBOT x265 Benchmark v2.2: 4k Preset
LibreOffice : 20 Documents To PDF
R Benchmark 2.5: Overall mean
| CPU Performance rating | |
| Média da turma Multimedia | |
| Dell XPS 15 9520 RTX 3050 Ti | |
| Schenker Vision 14 2022 RTX 3050 Ti | |
| MSI Prestige 15 A12UD-093 -1! | |
| Média Intel Core i7-1280P | |
| Acer Swift X SFX16-52G-77RX | |
| Lenovo IdeaPad Gaming 3 15ARH7 | |
| Asus VivoBook Pro 16X OLED N7600PC-L2026X | |
| Cinebench R23 / Multi Core | |
| Média da turma Multimedia (4861 - 33362, n=74, últimos 2 anos) | |
| Schenker Vision 14 2022 RTX 3050 Ti | |
| Dell XPS 15 9520 RTX 3050 Ti | |
| MSI Prestige 15 A12UD-093 | |
| Média Intel Core i7-1280P (8632 - 14803, n=8) | |
| Acer Swift X SFX16-52G-77RX | |
| Lenovo IdeaPad Gaming 3 15ARH7 | |
| Asus VivoBook Pro 16X OLED N7600PC-L2026X | |
| Cinebench R23 / Single Core | |
| Média da turma Multimedia (1128 - 2459, n=66, últimos 2 anos) | |
| Dell XPS 15 9520 RTX 3050 Ti | |
| Acer Swift X SFX16-52G-77RX | |
| Schenker Vision 14 2022 RTX 3050 Ti | |
| Média Intel Core i7-1280P (1609 - 1787, n=7) | |
| MSI Prestige 15 A12UD-093 | |
| Asus VivoBook Pro 16X OLED N7600PC-L2026X | |
| Lenovo IdeaPad Gaming 3 15ARH7 | |
| Cinebench R20 / CPU (Multi Core) | |
| Média da turma Multimedia (1887 - 12912, n=57, últimos 2 anos) | |
| Schenker Vision 14 2022 RTX 3050 Ti | |
| Dell XPS 15 9520 RTX 3050 Ti | |
| Média Intel Core i7-1280P (3283 - 5415, n=8) | |
| MSI Prestige 15 A12UD-093 | |
| Acer Swift X SFX16-52G-77RX | |
| Lenovo IdeaPad Gaming 3 15ARH7 | |
| Asus VivoBook Pro 16X OLED N7600PC-L2026X | |
| Cinebench R20 / CPU (Single Core) | |
| Média da turma Multimedia (425 - 853, n=57, últimos 2 anos) | |
| Schenker Vision 14 2022 RTX 3050 Ti | |
| Dell XPS 15 9520 RTX 3050 Ti | |
| MSI Prestige 15 A12UD-093 | |
| Acer Swift X SFX16-52G-77RX | |
| Média Intel Core i7-1280P (615 - 701, n=8) | |
| Asus VivoBook Pro 16X OLED N7600PC-L2026X | |
| Lenovo IdeaPad Gaming 3 15ARH7 | |
| Cinebench R15 / CPU Multi 64Bit | |
| Média da turma Multimedia (856 - 5224, n=61, últimos 2 anos) | |
| MSI Prestige 15 A12UD-093 | |
| Dell XPS 15 9520 RTX 3050 Ti | |
| Schenker Vision 14 2022 RTX 3050 Ti | |
| Média Intel Core i7-1280P (1905 - 2332, n=7) | |
| Acer Swift X SFX16-52G-77RX | |
| Lenovo IdeaPad Gaming 3 15ARH7 | |
| Asus VivoBook Pro 16X OLED N7600PC-L2026X | |
| Cinebench R15 / CPU Single 64Bit | |
| Média da turma Multimedia (184.8 - 326, n=59, últimos 2 anos) | |
| Schenker Vision 14 2022 RTX 3050 Ti | |
| Dell XPS 15 9520 RTX 3050 Ti | |
| Acer Swift X SFX16-52G-77RX | |
| Média Intel Core i7-1280P (203 - 258, n=7) | |
| Lenovo IdeaPad Gaming 3 15ARH7 | |
| Asus VivoBook Pro 16X OLED N7600PC-L2026X | |
| Asus VivoBook Pro 16X OLED N7600PC-L2026X | |
| MSI Prestige 15 A12UD-093 | |
| Blender / v2.79 BMW27 CPU | |
| Asus VivoBook Pro 16X OLED N7600PC-L2026X | |
| Lenovo IdeaPad Gaming 3 15ARH7 | |
| Acer Swift X SFX16-52G-77RX | |
| MSI Prestige 15 A12UD-093 | |
| Média Intel Core i7-1280P (259 - 309, n=7) | |
| Schenker Vision 14 2022 RTX 3050 Ti | |
| Média da turma Multimedia (100 - 557, n=58, últimos 2 anos) | |
| Dell XPS 15 9520 RTX 3050 Ti | |
| 7-Zip 18.03 / 7z b 4 | |
| Dell XPS 15 9520 RTX 3050 Ti | |
| Média da turma Multimedia (26062 - 130368, n=55, últimos 2 anos) | |
| MSI Prestige 15 A12UD-093 | |
| Schenker Vision 14 2022 RTX 3050 Ti | |
| Média Intel Core i7-1280P (45292 - 53710, n=7) | |
| Acer Swift X SFX16-52G-77RX | |
| Lenovo IdeaPad Gaming 3 15ARH7 | |
| Asus VivoBook Pro 16X OLED N7600PC-L2026X | |
| 7-Zip 18.03 / 7z b 4 -mmt1 | |
| Média da turma Multimedia (3666 - 7545, n=56, últimos 2 anos) | |
| Schenker Vision 14 2022 RTX 3050 Ti | |
| Dell XPS 15 9520 RTX 3050 Ti | |
| MSI Prestige 15 A12UD-093 | |
| Média Intel Core i7-1280P (4995 - 5874, n=7) | |
| Lenovo IdeaPad Gaming 3 15ARH7 | |
| Asus VivoBook Pro 16X OLED N7600PC-L2026X | |
| Acer Swift X SFX16-52G-77RX | |
| Geekbench 5.5 / Multi-Core | |
| Média da turma Multimedia (4652 - 20422, n=56, últimos 2 anos) | |
| Dell XPS 15 9520 RTX 3050 Ti | |
| MSI Prestige 15 A12UD-093 | |
| Schenker Vision 14 2022 RTX 3050 Ti | |
| Média Intel Core i7-1280P (9623 - 11811, n=7) | |
| Acer Swift X SFX16-52G-77RX | |
| Lenovo IdeaPad Gaming 3 15ARH7 | |
| Asus VivoBook Pro 16X OLED N7600PC-L2026X | |
| Geekbench 5.5 / Single-Core | |
| Média da turma Multimedia (805 - 2974, n=56, últimos 2 anos) | |
| Acer Swift X SFX16-52G-77RX | |
| Schenker Vision 14 2022 RTX 3050 Ti | |
| Dell XPS 15 9520 RTX 3050 Ti | |
| Média Intel Core i7-1280P (1571 - 1802, n=7) | |
| MSI Prestige 15 A12UD-093 | |
| Asus VivoBook Pro 16X OLED N7600PC-L2026X | |
| Lenovo IdeaPad Gaming 3 15ARH7 | |
| HWBOT x265 Benchmark v2.2 / 4k Preset | |
| Média da turma Multimedia (5.26 - 36.1, n=56, últimos 2 anos) | |
| Dell XPS 15 9520 RTX 3050 Ti | |
| Schenker Vision 14 2022 RTX 3050 Ti | |
| Acer Swift X SFX16-52G-77RX | |
| Média Intel Core i7-1280P (9.62 - 14.5, n=5) | |
| Lenovo IdeaPad Gaming 3 15ARH7 | |
| Asus VivoBook Pro 16X OLED N7600PC-L2026X | |
| LibreOffice / 20 Documents To PDF | |
| MSI Prestige 15 A12UD-093 | |
| MSI Prestige 15 A12UD-093 | |
| Lenovo IdeaPad Gaming 3 15ARH7 | |
| Acer Swift X SFX16-52G-77RX | |
| Asus VivoBook Pro 16X OLED N7600PC-L2026X | |
| Média Intel Core i7-1280P (41 - 61.6, n=8) | |
| Média da turma Multimedia (23.9 - 146.7, n=57, últimos 2 anos) | |
| Schenker Vision 14 2022 RTX 3050 Ti | |
| Dell XPS 15 9520 RTX 3050 Ti | |
| R Benchmark 2.5 / Overall mean | |
| Asus VivoBook Pro 16X OLED N7600PC-L2026X | |
| Lenovo IdeaPad Gaming 3 15ARH7 | |
| Média Intel Core i7-1280P (0.4505 - 0.512, n=7) | |
| Acer Swift X SFX16-52G-77RX | |
| Média da turma Multimedia (0.3604 - 0.947, n=56, últimos 2 anos) | |
| Schenker Vision 14 2022 RTX 3050 Ti | |
| Dell XPS 15 9520 RTX 3050 Ti | |
| MSI Prestige 15 A12UD-093 | |
* ... menor é melhor
AIDA64: FP32 Ray-Trace | FPU Julia | CPU SHA3 | CPU Queen | FPU SinJulia | FPU Mandel | CPU AES | CPU ZLib | FP64 Ray-Trace | CPU PhotoWorxx
| Performance rating | |
| Média da turma Multimedia | |
| Lenovo IdeaPad Gaming 3 15ARH7 | |
| Schenker Vision 14 2022 RTX 3050 Ti | |
| MSI Prestige 15 A12UD-093 | |
| Média Intel Core i7-1280P | |
| Dell XPS 15 9520 RTX 3050 Ti | |
| Acer Swift X SFX16-52G-77RX | |
| Asus VivoBook Pro 16X OLED N7600PC-L2026X | |
| AIDA64 / FP32 Ray-Trace | |
| Média da turma Multimedia (2214 - 50388, n=53, últimos 2 anos) | |
| Schenker Vision 14 2022 RTX 3050 Ti | |
| Lenovo IdeaPad Gaming 3 15ARH7 | |
| MSI Prestige 15 A12UD-093 | |
| Média Intel Core i7-1280P (7466 - 13068, n=6) | |
| Acer Swift X SFX16-52G-77RX | |
| Dell XPS 15 9520 RTX 3050 Ti | |
| Asus VivoBook Pro 16X OLED N7600PC-L2026X | |
| AIDA64 / FPU Julia | |
| Média da turma Multimedia (12867 - 201874, n=54, últimos 2 anos) | |
| Lenovo IdeaPad Gaming 3 15ARH7 | |
| Schenker Vision 14 2022 RTX 3050 Ti | |
| MSI Prestige 15 A12UD-093 | |
| Média Intel Core i7-1280P (38904 - 66081, n=6) | |
| Acer Swift X SFX16-52G-77RX | |
| Dell XPS 15 9520 RTX 3050 Ti | |
| Asus VivoBook Pro 16X OLED N7600PC-L2026X | |
| AIDA64 / CPU SHA3 | |
| Média da turma Multimedia (626 - 8623, n=54, últimos 2 anos) | |
| Schenker Vision 14 2022 RTX 3050 Ti | |
| Dell XPS 15 9520 RTX 3050 Ti | |
| MSI Prestige 15 A12UD-093 | |
| Lenovo IdeaPad Gaming 3 15ARH7 | |
| Média Intel Core i7-1280P (1826 - 2992, n=6) | |
| Acer Swift X SFX16-52G-77RX | |
| Asus VivoBook Pro 16X OLED N7600PC-L2026X | |
| AIDA64 / CPU Queen | |
| Dell XPS 15 9520 RTX 3050 Ti | |
| Média Intel Core i7-1280P (80180 - 100358, n=6) | |
| Schenker Vision 14 2022 RTX 3050 Ti | |
| Acer Swift X SFX16-52G-77RX | |
| MSI Prestige 15 A12UD-093 | |
| Lenovo IdeaPad Gaming 3 15ARH7 | |
| Média da turma Multimedia (13483 - 181505, n=41, últimos 2 anos) | |
| Asus VivoBook Pro 16X OLED N7600PC-L2026X | |
| AIDA64 / FPU SinJulia | |
| Lenovo IdeaPad Gaming 3 15ARH7 | |
| Média da turma Multimedia (886 - 28794, n=54, últimos 2 anos) | |
| Dell XPS 15 9520 RTX 3050 Ti | |
| Schenker Vision 14 2022 RTX 3050 Ti | |
| MSI Prestige 15 A12UD-093 | |
| Média Intel Core i7-1280P (5880 - 8571, n=6) | |
| Acer Swift X SFX16-52G-77RX | |
| Asus VivoBook Pro 16X OLED N7600PC-L2026X | |
| AIDA64 / FPU Mandel | |
| Média da turma Multimedia (6395 - 105740, n=53, últimos 2 anos) | |
| Lenovo IdeaPad Gaming 3 15ARH7 | |
| Schenker Vision 14 2022 RTX 3050 Ti | |
| MSI Prestige 15 A12UD-093 | |
| Média Intel Core i7-1280P (18907 - 32766, n=6) | |
| Acer Swift X SFX16-52G-77RX | |
| Dell XPS 15 9520 RTX 3050 Ti | |
| Asus VivoBook Pro 16X OLED N7600PC-L2026X | |
| AIDA64 / CPU AES | |
| Lenovo IdeaPad Gaming 3 15ARH7 | |
| MSI Prestige 15 A12UD-093 | |
| Dell XPS 15 9520 RTX 3050 Ti | |
| Schenker Vision 14 2022 RTX 3050 Ti | |
| Média da turma Multimedia (8171 - 126790, n=54, últimos 2 anos) | |
| Asus VivoBook Pro 16X OLED N7600PC-L2026X | |
| Média Intel Core i7-1280P (40691 - 99367, n=6) | |
| Acer Swift X SFX16-52G-77RX | |
| AIDA64 / CPU ZLib | |
| Média da turma Multimedia (143.8 - 2022, n=54, últimos 2 anos) | |
| Schenker Vision 14 2022 RTX 3050 Ti | |
| Dell XPS 15 9520 RTX 3050 Ti | |
| Média Intel Core i7-1280P (540 - 880, n=6) | |
| MSI Prestige 15 A12UD-093 | |
| Acer Swift X SFX16-52G-77RX | |
| Lenovo IdeaPad Gaming 3 15ARH7 | |
| Asus VivoBook Pro 16X OLED N7600PC-L2026X | |
| AIDA64 / FP64 Ray-Trace | |
| Média da turma Multimedia (1014 - 26875, n=54, últimos 2 anos) | |
| Schenker Vision 14 2022 RTX 3050 Ti | |
| Lenovo IdeaPad Gaming 3 15ARH7 | |
| Média Intel Core i7-1280P (4006 - 7184, n=6) | |
| MSI Prestige 15 A12UD-093 | |
| Acer Swift X SFX16-52G-77RX | |
| Dell XPS 15 9520 RTX 3050 Ti | |
| Asus VivoBook Pro 16X OLED N7600PC-L2026X | |
| AIDA64 / CPU PhotoWorxx | |
| Média da turma Multimedia (8187 - 88154, n=54, últimos 2 anos) | |
| MSI Prestige 15 A12UD-093 | |
| Acer Swift X SFX16-52G-77RX | |
| Média Intel Core i7-1280P (36663 - 48416, n=6) | |
| Dell XPS 15 9520 RTX 3050 Ti | |
| Schenker Vision 14 2022 RTX 3050 Ti | |
| Lenovo IdeaPad Gaming 3 15ARH7 | |
| Asus VivoBook Pro 16X OLED N7600PC-L2026X | |
Desempenho do sistema
Nossa boa impressão, embora subjetiva, reflete-se nas pontuações da PCMark. O teste padronizado e relativamente realista coloca o MSI Prestige 15 no topo das classificações. O processador e a placa gráfica, que são muito potentes por curtos períodos de tempo, nunca têm nenhuma dificuldade.
Uma razão para isso é também a frugalidade sob carga sustentada. O sistema não aquece tanto aqui. Portanto, o desempenho máximo está sempre disponível quando necessário, como por exemplo quando um programa tem que ser iniciado, o que é então apenas por breves momentos.
O alto poder de computação pode sempre ser sentido ao navegar, instalar e iniciar jogos.
CrossMark: Overall | Productivity | Creativity | Responsiveness
| PCMark 10 / Score | |
| Média da turma Multimedia (4325 - 10386, n=52, últimos 2 anos) | |
| Dell XPS 15 9520 RTX 3050 Ti | |
| Schenker Vision 14 2022 RTX 3050 Ti | |
| MSI Prestige 15 A12UD-093 | |
| Média Intel Core i7-1280P, NVIDIA GeForce RTX 3050 Ti Laptop GPU (5984 - 6379, n=2) | |
| Lenovo IdeaPad Gaming 3 15ARH7 | |
| Acer Swift X SFX16-52G-77RX | |
| Asus VivoBook Pro 16X OLED N7600PC-L2026X | |
| PCMark 10 / Essentials | |
| Dell XPS 15 9520 RTX 3050 Ti | |
| Acer Swift X SFX16-52G-77RX | |
| Média da turma Multimedia (8025 - 11664, n=51, últimos 2 anos) | |
| Schenker Vision 14 2022 RTX 3050 Ti | |
| MSI Prestige 15 A12UD-093 | |
| Média Intel Core i7-1280P, NVIDIA GeForce RTX 3050 Ti Laptop GPU (9687 - 10227, n=2) | |
| Lenovo IdeaPad Gaming 3 15ARH7 | |
| Asus VivoBook Pro 16X OLED N7600PC-L2026X | |
| PCMark 10 / Productivity | |
| Média da turma Multimedia (7323 - 18233, n=51, últimos 2 anos) | |
| Dell XPS 15 9520 RTX 3050 Ti | |
| MSI Prestige 15 A12UD-093 | |
| Lenovo IdeaPad Gaming 3 15ARH7 | |
| Schenker Vision 14 2022 RTX 3050 Ti | |
| Asus VivoBook Pro 16X OLED N7600PC-L2026X | |
| Média Intel Core i7-1280P, NVIDIA GeForce RTX 3050 Ti Laptop GPU (7521 - 9165, n=2) | |
| Acer Swift X SFX16-52G-77RX | |
| PCMark 10 / Digital Content Creation | |
| Média da turma Multimedia (3651 - 16240, n=51, últimos 2 anos) | |
| Dell XPS 15 9520 RTX 3050 Ti | |
| Schenker Vision 14 2022 RTX 3050 Ti | |
| Média Intel Core i7-1280P, NVIDIA GeForce RTX 3050 Ti Laptop GPU (7518 - 7980, n=2) | |
| Acer Swift X SFX16-52G-77RX | |
| MSI Prestige 15 A12UD-093 | |
| Lenovo IdeaPad Gaming 3 15ARH7 | |
| Asus VivoBook Pro 16X OLED N7600PC-L2026X | |
| CrossMark / Overall | |
| Média da turma Multimedia (866 - 2728, n=60, últimos 2 anos) | |
| Dell XPS 15 9520 RTX 3050 Ti | |
| Acer Swift X SFX16-52G-77RX | |
| MSI Prestige 15 A12UD-093 | |
| Média Intel Core i7-1280P, NVIDIA GeForce RTX 3050 Ti Laptop GPU (1652 - 1671, n=2) | |
| Schenker Vision 14 2022 RTX 3050 Ti | |
| Lenovo IdeaPad Gaming 3 15ARH7 | |
| Asus VivoBook Pro 16X OLED N7600PC-L2026X | |
| CrossMark / Productivity | |
| Dell XPS 15 9520 RTX 3050 Ti | |
| Média da turma Multimedia (931 - 2489, n=60, últimos 2 anos) | |
| Acer Swift X SFX16-52G-77RX | |
| Schenker Vision 14 2022 RTX 3050 Ti | |
| MSI Prestige 15 A12UD-093 | |
| Média Intel Core i7-1280P, NVIDIA GeForce RTX 3050 Ti Laptop GPU (1583 - 1618, n=2) | |
| Lenovo IdeaPad Gaming 3 15ARH7 | |
| Asus VivoBook Pro 16X OLED N7600PC-L2026X | |
| CrossMark / Creativity | |
| Média da turma Multimedia (907 - 3465, n=60, últimos 2 anos) | |
| Dell XPS 15 9520 RTX 3050 Ti | |
| Acer Swift X SFX16-52G-77RX | |
| Média Intel Core i7-1280P, NVIDIA GeForce RTX 3050 Ti Laptop GPU (1752 - 1761, n=2) | |
| MSI Prestige 15 A12UD-093 | |
| Schenker Vision 14 2022 RTX 3050 Ti | |
| Lenovo IdeaPad Gaming 3 15ARH7 | |
| Asus VivoBook Pro 16X OLED N7600PC-L2026X | |
| CrossMark / Responsiveness | |
| Dell XPS 15 9520 RTX 3050 Ti | |
| Acer Swift X SFX16-52G-77RX | |
| MSI Prestige 15 A12UD-093 | |
| Média Intel Core i7-1280P, NVIDIA GeForce RTX 3050 Ti Laptop GPU (1550 - 1594, n=2) | |
| Schenker Vision 14 2022 RTX 3050 Ti | |
| Média da turma Multimedia (605 - 2024, n=60, últimos 2 anos) | |
| Lenovo IdeaPad Gaming 3 15ARH7 | |
| Asus VivoBook Pro 16X OLED N7600PC-L2026X | |
| PCMark 10 Score | 6379 pontos | |
Ajuda | ||
| AIDA64 / Memory Copy | |
| Média da turma Multimedia (11299 - 132135, n=54, últimos 2 anos) | |
| Média Intel Core i7-1280P (56337 - 73486, n=6) | |
| Acer Swift X SFX16-52G-77RX | |
| MSI Prestige 15 A12UD-093 | |
| Dell XPS 15 9520 RTX 3050 Ti | |
| Schenker Vision 14 2022 RTX 3050 Ti | |
| Asus VivoBook Pro 16X OLED N7600PC-L2026X | |
| Lenovo IdeaPad Gaming 3 15ARH7 | |
| AIDA64 / Memory Read | |
| Média da turma Multimedia (11624 - 174586, n=54, últimos 2 anos) | |
| Média Intel Core i7-1280P (63221 - 73719, n=6) | |
| Acer Swift X SFX16-52G-77RX | |
| MSI Prestige 15 A12UD-093 | |
| Dell XPS 15 9520 RTX 3050 Ti | |
| Schenker Vision 14 2022 RTX 3050 Ti | |
| Asus VivoBook Pro 16X OLED N7600PC-L2026X | |
| Lenovo IdeaPad Gaming 3 15ARH7 | |
| AIDA64 / Memory Write | |
| Média da turma Multimedia (11755 - 134998, n=54, últimos 2 anos) | |
| MSI Prestige 15 A12UD-093 | |
| Média Intel Core i7-1280P (58729 - 68247, n=6) | |
| Acer Swift X SFX16-52G-77RX | |
| Dell XPS 15 9520 RTX 3050 Ti | |
| Schenker Vision 14 2022 RTX 3050 Ti | |
| Asus VivoBook Pro 16X OLED N7600PC-L2026X | |
| Lenovo IdeaPad Gaming 3 15ARH7 | |
| AIDA64 / Memory Latency | |
| Média da turma Multimedia (7 - 535, n=53, últimos 2 anos) | |
| Acer Swift X SFX16-52G-77RX | |
| Média Intel Core i7-1280P (93.1 - 153.3, n=6) | |
| Dell XPS 15 9520 RTX 3050 Ti | |
| MSI Prestige 15 A12UD-093 | |
| Schenker Vision 14 2022 RTX 3050 Ti | |
| Asus VivoBook Pro 16X OLED N7600PC-L2026X | |
| Lenovo IdeaPad Gaming 3 15ARH7 | |
* ... menor é melhor
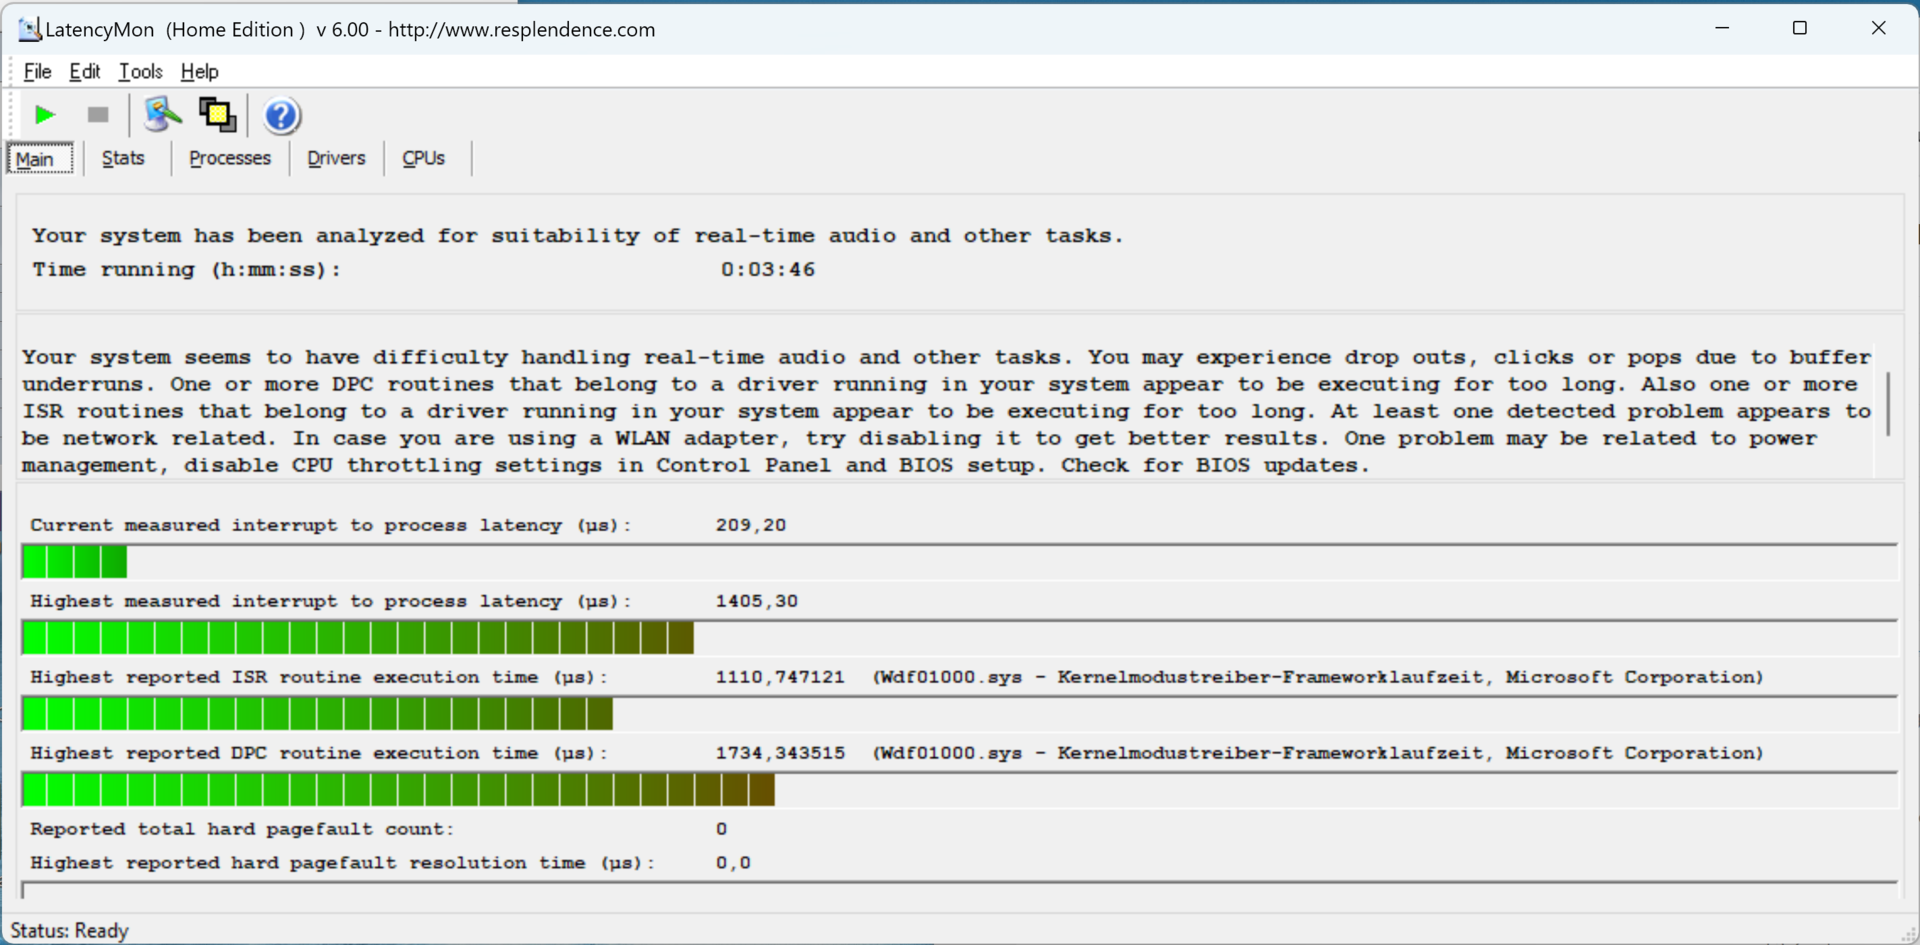
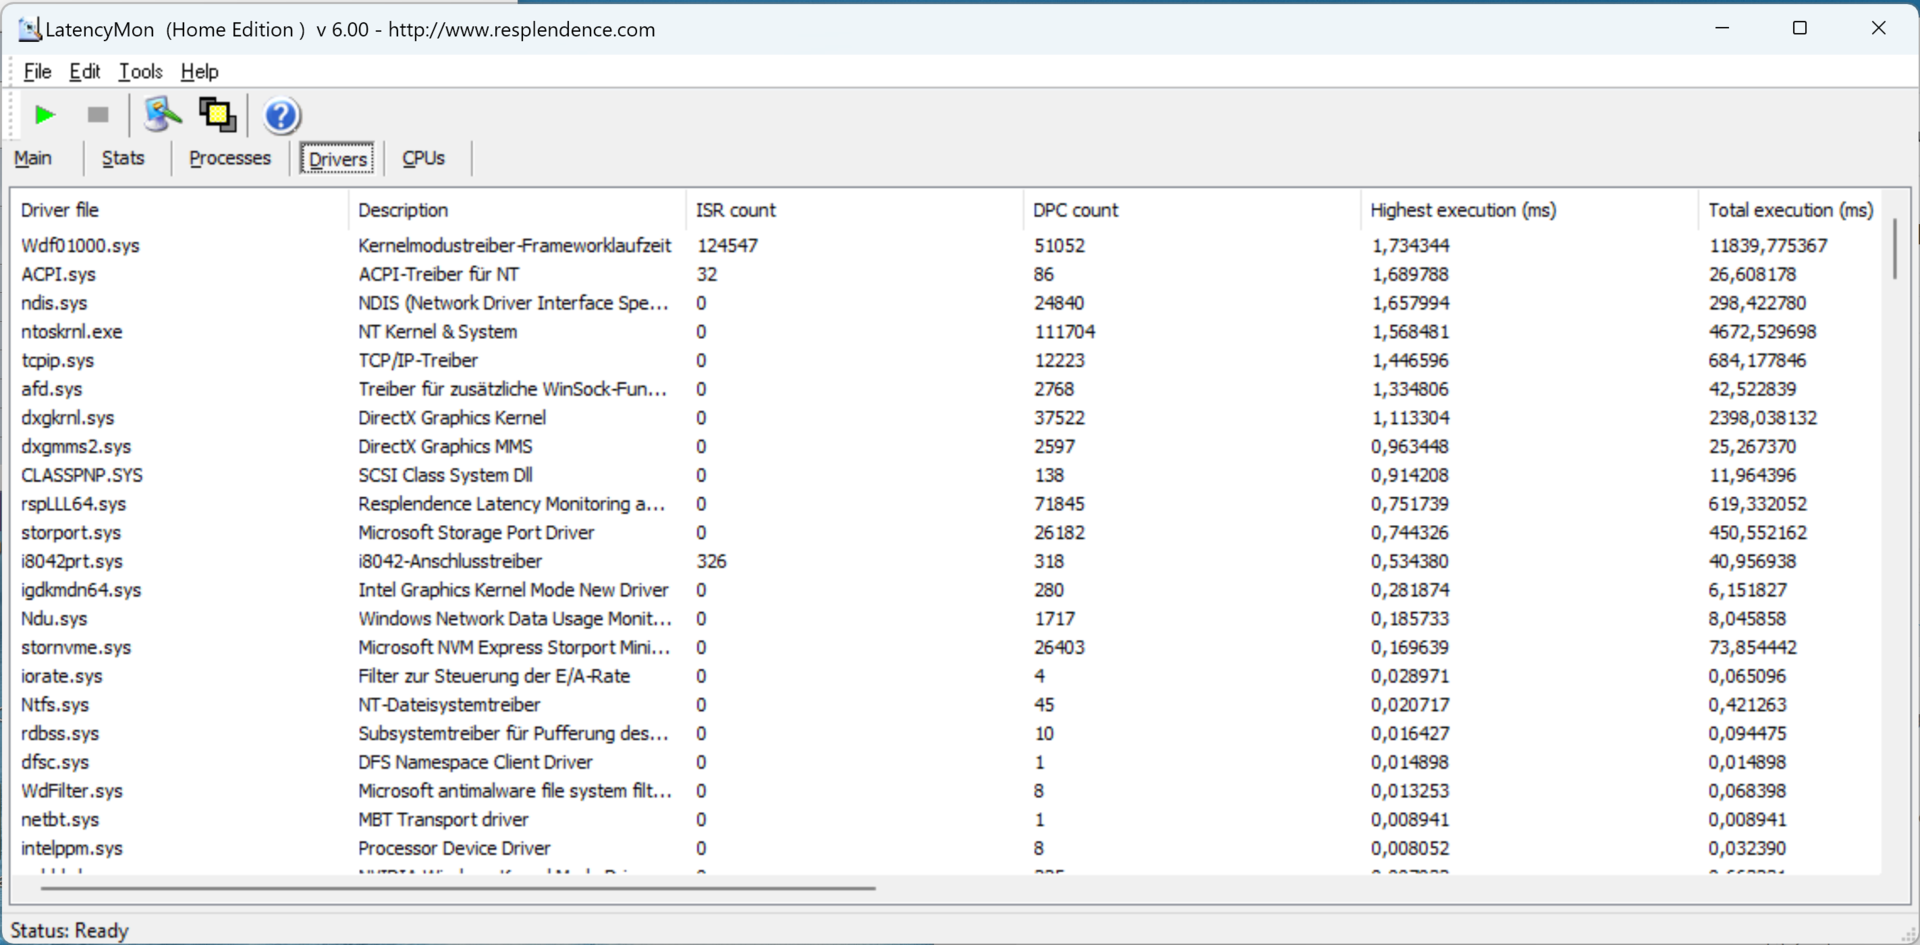
Latência do DPC
O Prestige 15 não é adequado para edição de áudio e vídeo em tempo real. Ele tem a maior latência no campo dos concorrentes.
A estrutura do driver em modo kernel é a principal responsável por isso. Um ajuste da configuração do driver, atualizações e muito mais pode resolver o problema
| DPC Latencies / LatencyMon - interrupt to process latency (max), Web, Youtube, Prime95 | |
| MSI Prestige 15 A12UD-093 | |
| Dell XPS 15 9520 RTX 3050 Ti | |
| Schenker Vision 14 2022 RTX 3050 Ti | |
| Acer Swift X SFX16-52G-77RX | |
| Lenovo IdeaPad Gaming 3 15ARH7 | |
| Asus VivoBook Pro 16X OLED N7600PC-L2026X | |
* ... menor é melhor
Dispositivos de armazenamento
O SSD Micron atinge mais de 6.000 MB/s em leitura seqüencial. Esta taxa também permanece estável por períodos de tempo mais longos, o que fala para o resfriamento adequado do hardware.
Isto significa que a interface PCIe 4.0 pode ser usada bem com o SSD M.2. No entanto, as outras taxas não estão exatamente no mesmo nível dos melhores discos rígidos. Mas isto não tem nenhum efeito negativo para um notebook de criação rápida, embora não excepcional.
Por outro lado, o tamanho de 1 TB é adequado. Dados brutos, sejam vídeos ou imagens, ocupam muito espaço. Portanto, o segundo slot SSD faz sentido, que é facilmente acessível independentemente do selo

* ... menor é melhor
Sustained Read Performance: DiskSpd Read Loop, Queue Depth 8
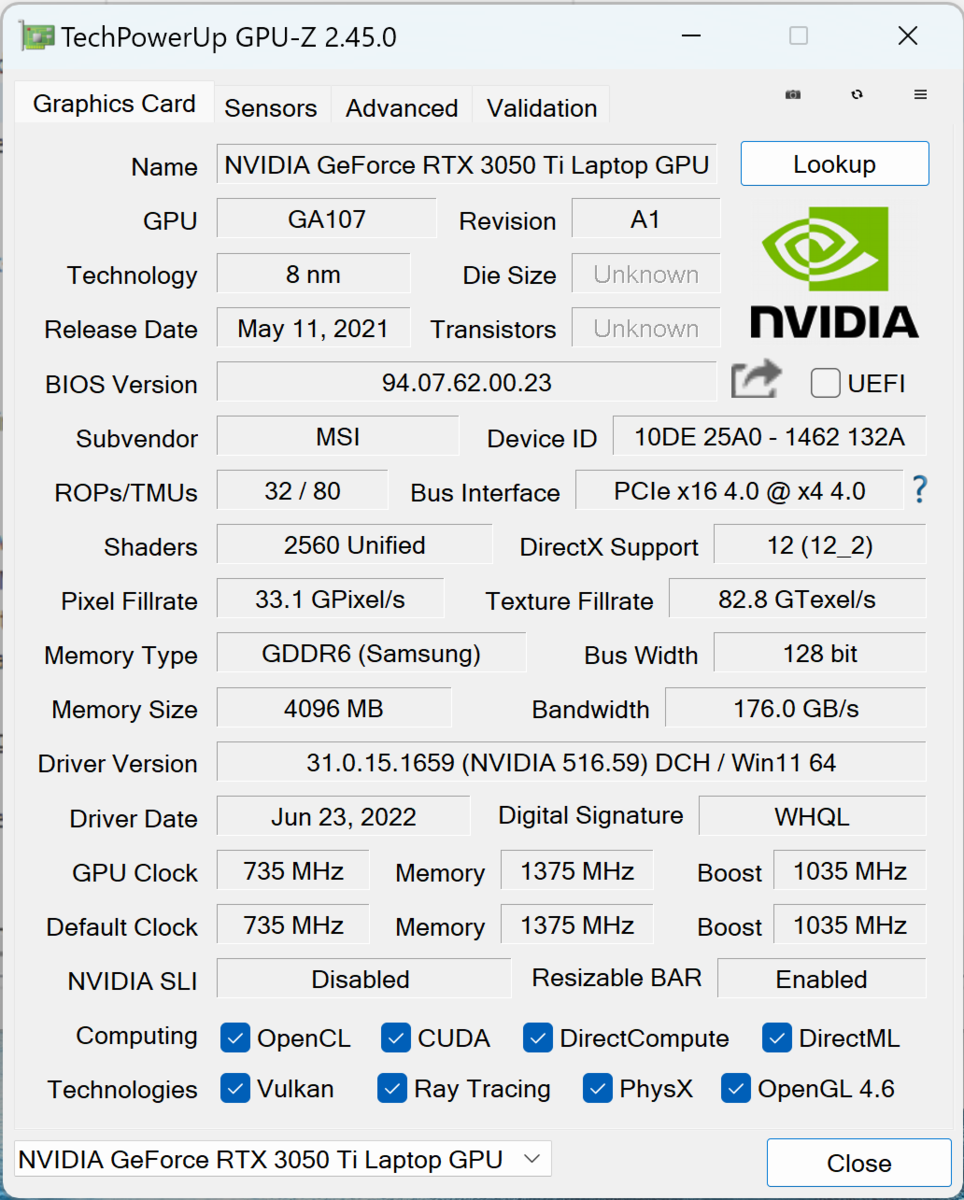
Placa Gráfica
O Nvidia GeForce RTX 3050 Tinão é a recomendação mais sólida para jogos, mesmo quando livre de limitações. Aqui é limitado a um máximo de 40 watts no MSI Prestige 15, o que reduz ainda mais o desempenho em operação contínua. Em teoria, pelo menos, é possível uma operação de até 80 watts.
Isto, naturalmente, não é necessário aqui. Assim como o processador, o chip gráfico destina-se apenas a fornecer potentes explosões de desempenho para acelerar os processos do programa. Isto tem um sucesso muito convincente em comparação com um GeForce MX450. Por outro lado, o Intel Arc A370M, que na verdade é um pouco mais fraco em média em nossas medições, é capaz de superar o RTX 3050 Ti.
Este consumo limitado de energia garante que não haja queda no desempenho mesmo sob carga sustentada. Mesmo no modo de bateria, o desempenho gráfico permanece aproximadamente no mesmo nível. Esta decisão parece apenas lógica, pois os notebooks multimídia não devem levar mais tempo para a edição de imagens só porque não há uma tomada elétrica próxima.
Entretanto, o fato de que as melhores taxas de desempenho são alcançadas em modo de bateria poderia ser devido ao software MSI Center Pro não estar configurado corretamente. O sistema então recebe mais energia do que com o adaptador de energia conectado
Mais pontos de referência de GPU podem ser encontradosaqui.
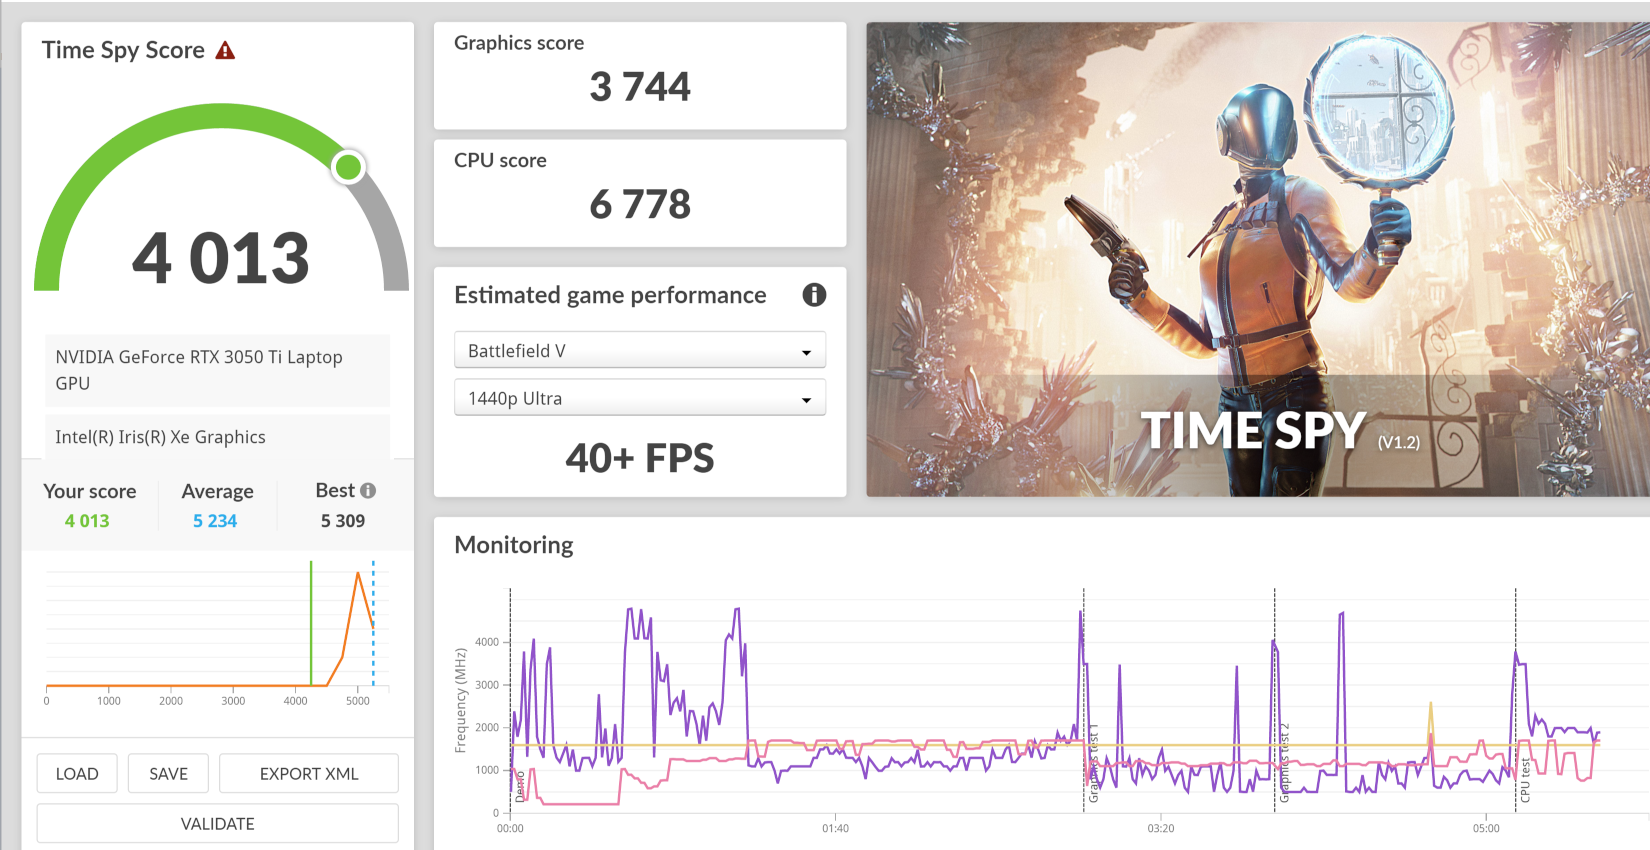
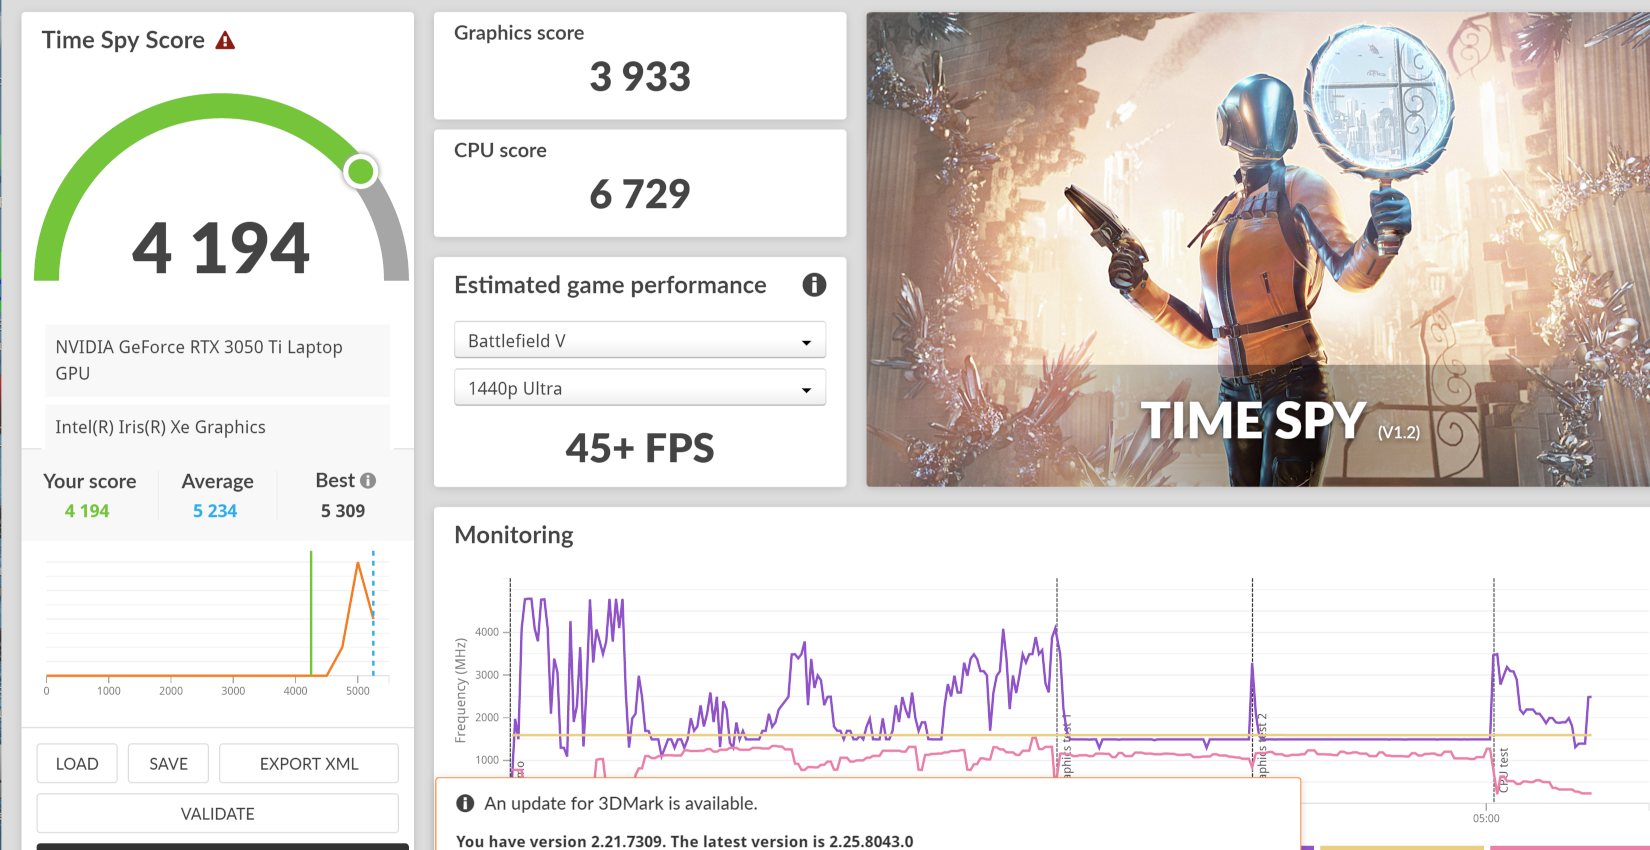
| 3DMark 11 Performance | 8322 pontos | |
| 3DMark Cloud Gate Standard Score | 21679 pontos | |
| 3DMark Fire Strike Score | 6670 pontos | |
| 3DMark Time Spy Score | 4013 pontos | |
Ajuda | ||
* ... menor é melhor
Desempenho nos jogos
A limitação da placa gráfica a 35 ou 40 watts no modo turbo e a configuração geral do sistema para operações silenciosas deprime consistentemente os valores medidos nos jogos. Mesmo a Acer Swift X SFX16com o Intel Arc A370M nominalmente mais fraco oferece melhores taxas de quadros em alguns jogos.
Mais uma vez, o Prestige 15 pode ser creditado com o fato de que simplesmente não foi projetado para carga sustentada de CPU e GPU e que seus pontos fortes estão em outro lugar. Ainda assim, sentimos que o sistema também poderia fazer com um "modo de alto desempenho". O hardware para ele está lá, mas sempre funciona em modo econômico
| The Witcher 3 - 1920x1080 Ultra Graphics & Postprocessing (HBAO+) | |
| Lenovo IdeaPad Gaming 3 15ARH7 | |
| Média da turma Multimedia (11 - 121, n=7, últimos 2 anos) | |
| Asus VivoBook Pro 16X OLED N7600PC-L2026X | |
| Schenker Vision 14 2022 RTX 3050 Ti | |
| Dell XPS 15 9520 RTX 3050 Ti | |
| Acer Swift X SFX16-52G-77RX | |
| MSI Prestige 15 A12UD-093 | |
| F1 22 | |
| 1920x1080 Ultra High Preset AA:T AF:16x | |
| Schenker Vision 14 2022 RTX 3050 Ti | |
| Média NVIDIA GeForce RTX 3050 Ti Laptop GPU (16 - 35, n=7) | |
| Média da turma Multimedia (11 - 54.1, n=8, últimos 2 anos) | |
| Asus VivoBook Pro 16X OLED N7600PC-L2026X | |
| MSI Prestige 15 A12UD-093 | |
| 3840x2160 Ultra High Preset AA:T AF:16x | |
| MSI Prestige 15 A12UD-093 | |
| Média NVIDIA GeForce RTX 3050 Ti Laptop GPU (n=1) | |
A diferença torna-se clara quando comparamos um pequeno caderno de jogos com um GPU idêntico. O Lenovo IdeaPad Gaming 3 15IAH7fornece o dobro da taxa de quadros e isto parece ser ainda mais consistente do que no MSI Prestige 15.
Os laptops com um iGPU são, no entanto, muito mais fracos, como pode ser visto no exemplo doAsus ExpertBook Flip 2 com seu Iris Xe G7. O Arco Intel A350M no Samsung Galaxy Livro 2 15 está no mesmo nível.
Witcher 3 FPS Chart
| baixo | média | alto | ultra | QHD | 4K | |
|---|---|---|---|---|---|---|
| GTA V (2015) | 144 | 136 | 53.8 | 27.8 | 22.8 | |
| The Witcher 3 (2015) | 75 | 48 | 30 | 19 | 10 | |
| Dota 2 Reborn (2015) | 153.8 | 111.9 | 74.8 | 67.3 | 31.9 | |
| Final Fantasy XV Benchmark (2018) | 55.9 | 33.4 | 23.5 | 18.4 | 12.8 | |
| X-Plane 11.11 (2018) | 100.8 | 72.7 | 62 | 32.8 | ||
| Far Cry 5 (2018) | 56 | 44 | 36 | 30 | 19 | 13 |
| Strange Brigade (2018) | 103.3 | 53 | 34.8 | 28.1 | 18.9 | |
| F1 22 (2022) | 70 | 63 | 48 | 16 | 10 | 4 |
Emissões - O notebook da MSI permanece calmo e frio
Ruído
Os ventiladores quase nunca estão completamente parados. Eles são sempre audíveis em segundo plano durante o uso normal, mas de forma alguma desconfortáveis quando mudam de velocidade ou quando fazem uma breve inversão de marcha.
Sob carga, o resfriamento é particularmente eficiente em comparação com muitos rivais. Ele fica um pouco mais alto, mas permanece discreto e visivelmente mais silencioso do que em muitos cadernos similares.
Barulho
| Ocioso |
| 26 / 30.7 / 30.7 dB |
| Carga |
| 41.9 / 40.7 dB |
 | ||
30 dB silencioso 40 dB(A) audível 50 dB(A) ruidosamente alto |
||
min: | ||
| MSI Prestige 15 A12UD-093 GeForce RTX 3050 Ti Laptop GPU, i7-1280P, Micron 3400 1TB MTFDKBA1T0TFH | Acer Swift X SFX16-52G-77RX A370M, i7-1260P, WDC PC SN810 1TB | Schenker Vision 14 2022 RTX 3050 Ti GeForce RTX 3050 Ti Laptop GPU, i7-12700H, Samsung SSD 980 Pro 1TB MZ-V8P1T0BW | Asus VivoBook Pro 16X OLED N7600PC-L2026X GeForce RTX 3050 4GB Laptop GPU, i7-11370H, Intel Optane Memory H10 with Solid State Storage 32GB + 512GB HBRPEKNX0202A(L/H) | Lenovo IdeaPad Gaming 3 15ARH7 GeForce RTX 3050 4GB Laptop GPU, R5 6600H, Lenovo UMIS AM630 RPJTJ256MGE1QDY | Dell XPS 15 9520 RTX 3050 Ti GeForce RTX 3050 Ti Laptop GPU, i7-12700H, WDC PC SN810 512GB | |
|---|---|---|---|---|---|---|
| Noise | 5% | 3% | -17% | 8% | 15% | |
| desligado / ambiente * (dB) | 26 | 25 4% | 24.4 6% | 25.15 3% | 23.3 10% | 22.8 12% |
| Idle Minimum * (dB) | 26 | 25 4% | 24.4 6% | 30 -15% | 23.8 8% | 22.9 12% |
| Idle Average * (dB) | 30.7 | 25 19% | 24.4 21% | 30 2% | 23.8 22% | 22.9 25% |
| Idle Maximum * (dB) | 30.7 | 25 19% | 27.8 9% | 30 2% | 27.2 11% | 22.9 25% |
| Load Average * (dB) | 41.9 | 44.7 -7% | 43.3 -3% | 57.6 -37% | 34.8 17% | 30.9 26% |
| Load Maximum * (dB) | 40.7 | 45.6 -12% | 48.8 -20% | 62.9 -55% | 49.4 -21% | 44.7 -10% |
| Witcher 3 ultra * (dB) | 48.2 | 49.3 | 37.8 |
* ... menor é melhor
Temperatura
O caderno do Criador não só é calmo, mas também legal. As temperaturas só sobem até mais de 50 °C em casos extremos na borda superior, o que também acomoda as fendas de ventilação. Por outro lado, se você usar o notebook normalmente e não para testes de estresse, é improvável que você sinta algo mais do que um leve aquecimento.
A distribuição de calor é particularmente bem sucedida. As altas temperaturas estão completamente ausentes na área de descanso da palma da mão, e o aumento da temperatura da caixa só é perceptível na área superior do teclado
(-) A temperatura máxima no lado superior é 49 °C / 120 F, em comparação com a média de 36.8 °C / 98 F , variando de 21 a 71 °C para a classe Multimedia.
(-) A parte inferior aquece até um máximo de 52.6 °C / 127 F, em comparação com a média de 39.1 °C / 102 F
(+) Em uso inativo, a temperatura média para o lado superior é 27.7 °C / 82 F, em comparação com a média do dispositivo de 31.3 °C / ### class_avg_f### F.
(±) Jogando The Witcher 3, a temperatura média para o lado superior é 34.9 °C / 95 F, em comparação com a média do dispositivo de 31.3 °C / ## #class_avg_f### F.
(+) Os apoios para as mãos e o touchpad são mais frios que a temperatura da pele, com um máximo de 29.5 °C / 85.1 F e, portanto, são frios ao toque.
(±) A temperatura média da área do apoio para as mãos de dispositivos semelhantes foi 28.7 °C / 83.7 F (-0.8 °C / -1.4 F).
| MSI Prestige 15 A12UD-093 Intel Core i7-1280P, NVIDIA GeForce RTX 3050 Ti Laptop GPU | Acer Swift X SFX16-52G-77RX Intel Core i7-1260P, Intel Arc A370M | Schenker Vision 14 2022 RTX 3050 Ti Intel Core i7-12700H, NVIDIA GeForce RTX 3050 Ti Laptop GPU | Asus VivoBook Pro 16X OLED N7600PC-L2026X Intel Core i7-11370H, NVIDIA GeForce RTX 3050 4GB Laptop GPU | Lenovo IdeaPad Gaming 3 15ARH7 AMD Ryzen 5 6600H, NVIDIA GeForce RTX 3050 4GB Laptop GPU | Dell XPS 15 9520 RTX 3050 Ti Intel Core i7-12700H, NVIDIA GeForce RTX 3050 Ti Laptop GPU | |
|---|---|---|---|---|---|---|
| Heat | -2% | 1% | 7% | 8% | -3% | |
| Maximum Upper Side * (°C) | 49 | 49.4 -1% | 48.4 1% | 40.6 17% | 47.6 3% | 51.4 -5% |
| Maximum Bottom * (°C) | 52.6 | 55.5 -6% | 57.1 -9% | 53 -1% | 46.6 11% | 51 3% |
| Idle Upper Side * (°C) | 29.7 | 28.4 4% | 28.1 5% | 29 2% | 27.2 8% | 30 -1% |
| Idle Bottom * (°C) | 30.7 | 32.6 -6% | 29 6% | 28.3 8% | 27.2 11% | 33 -7% |
* ... menor é melhor
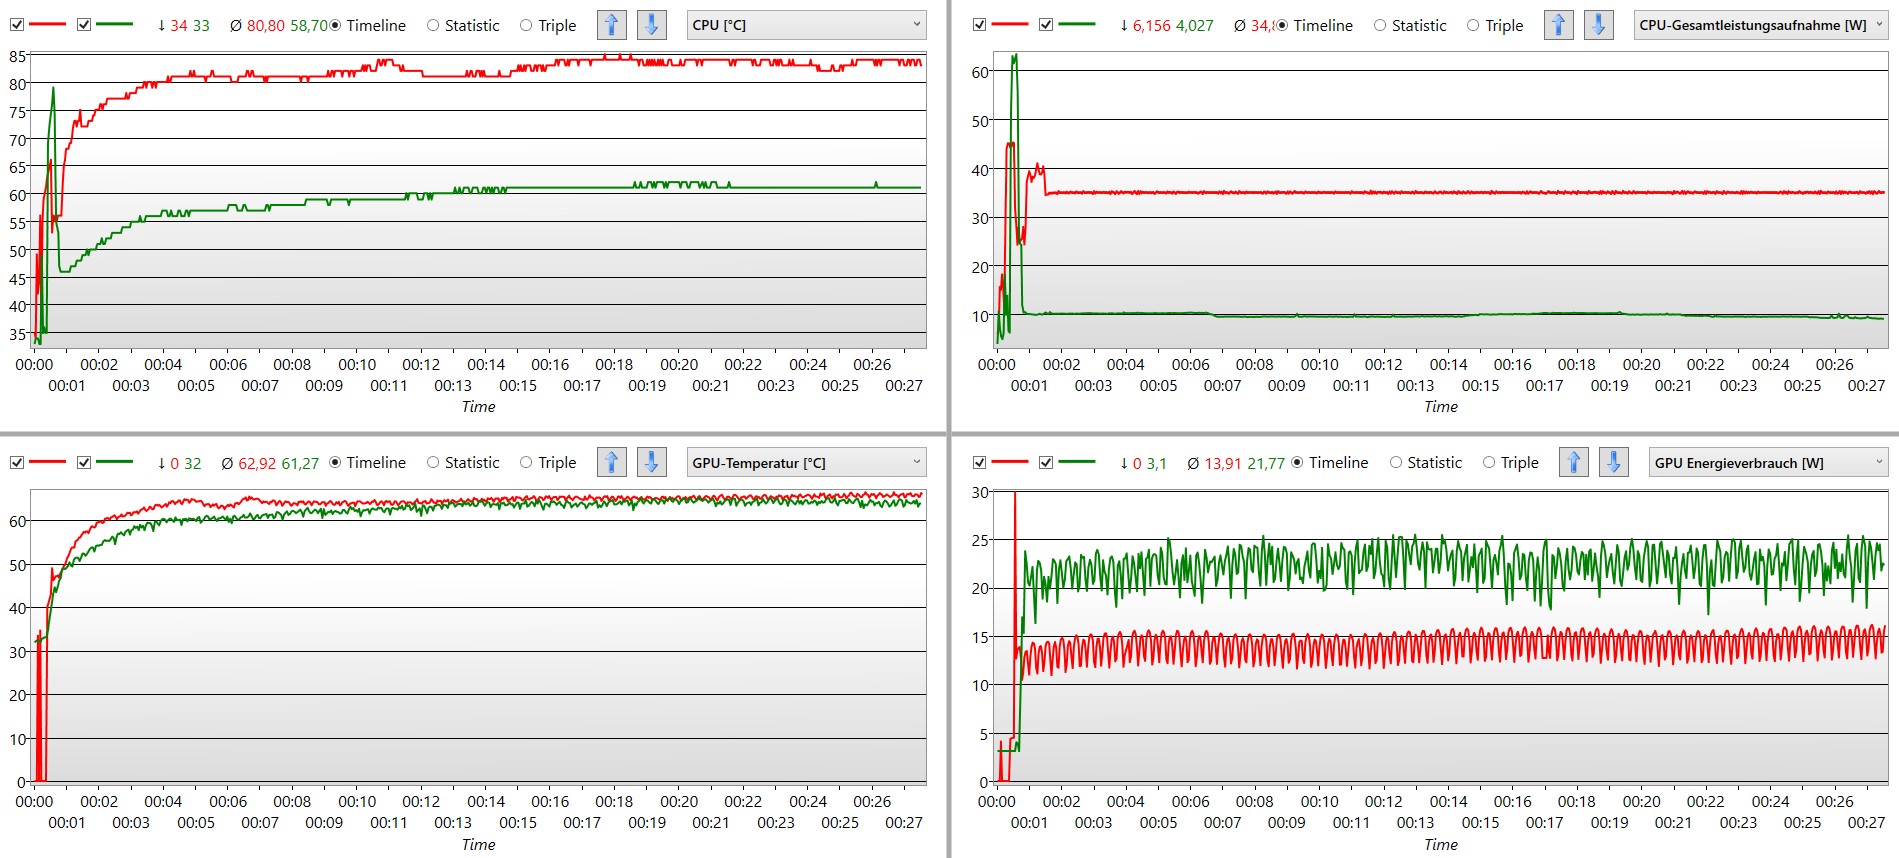
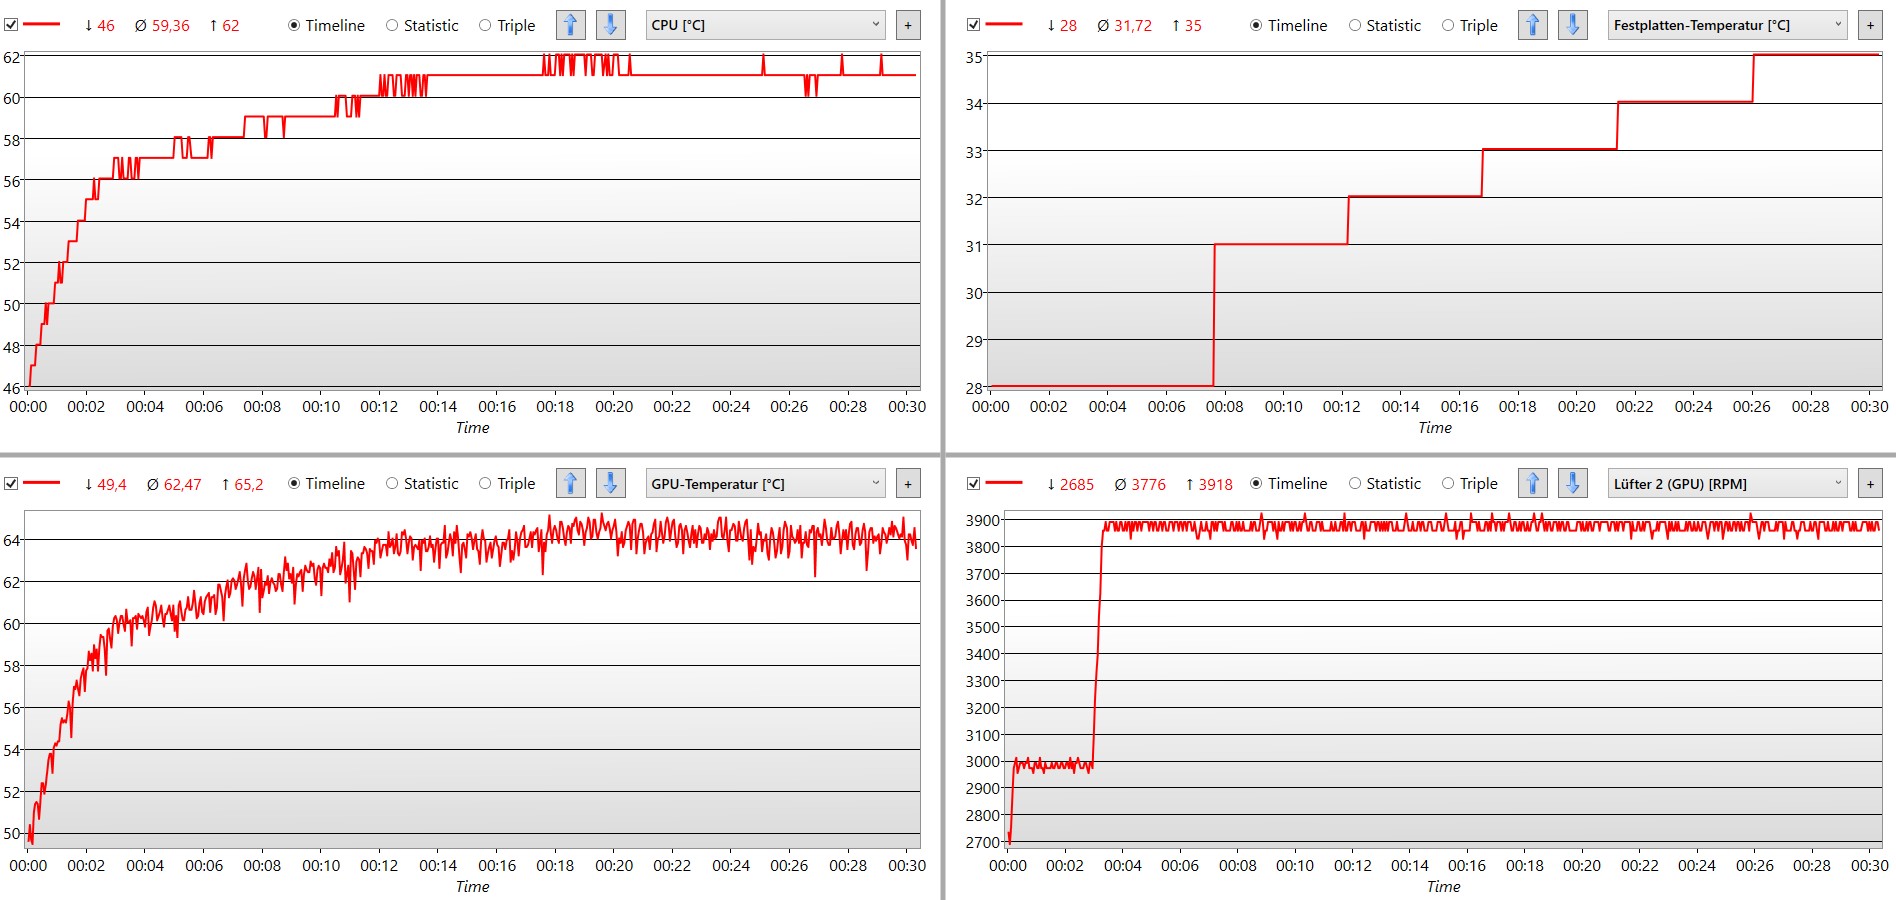
Teste de estresse
Mesmo a carga completa em Prime95 e Furmark não leva a temperaturas insalubres. A CPU sobe um pouco mais de 60 °C, enquanto os sensores para a GPU indicam pouco menos de 65 °C. O ventilador gira a uma velocidade consistentemente alta. Os valores máximos são alcançados após 10 minutos no máximo, e o laptop permanece no mesmo nível.
Aqui, o ajuste "Automático Inteligente" com seu limite de consumo de energia sempre garante temperaturas toleráveis. Assim, o desempenho máximo está disponível imediatamente após tais cargas, pois o sistema não precisa esfriar a partir de 80 ou 90 °C
Oradores
Uma comparação com oApple MacBook Pro 16 2021revela uma infeliz falha: Os alto-falantes do Prestige 15 começam a se sobremodular em grandes volumes. Por exemplo, os baixos e os médios inferiores, nos quais as guitarras elétricas podem ser ouvidas, são muito fracos.
As vozes soam decentes e detalhadas. No geral, isto é suficiente para verificar o som dos vídeos, para transmitir filmes, ou para fazer chamadas de vídeo. No entanto, assim que a música começa a tocar, os pontos fracos dos alto-falantes se tornam claramente audíveis
MSI Prestige 15 A12UD-093 análise de áudio
(+) | os alto-falantes podem tocar relativamente alto (###valor### dB)
Graves 100 - 315Hz
(-) | quase nenhum baixo - em média 34.4% menor que a mediana
(±) | a linearidade dos graves é média (10.7% delta para a frequência anterior)
Médios 400 - 2.000 Hz
(±) | médios reduzidos - em média 10.8% menor que a mediana
(±) | a linearidade dos médios é média (11.1% delta para frequência anterior)
Altos 2 - 16 kHz
(±) | máximos mais altos - em média 9% maior que a mediana
(+) | os máximos são lineares (3.7% delta da frequência anterior)
Geral 100 - 16.000 Hz
(±) | a linearidade do som geral é média (28.1% diferença em relação à mediana)
Comparado com a mesma classe
» 94% de todos os dispositivos testados nesta classe foram melhores, 1% semelhantes, 5% piores
» O melhor teve um delta de 5%, a média foi 17%, o pior foi 45%
Comparado com todos os dispositivos testados
» 85% de todos os dispositivos testados foram melhores, 3% semelhantes, 12% piores
» O melhor teve um delta de 4%, a média foi 23%, o pior foi 134%
Apple MacBook Pro 16 2021 M1 Pro análise de áudio
(+) | os alto-falantes podem tocar relativamente alto (###valor### dB)
Graves 100 - 315Hz
(+) | bons graves - apenas 3.8% longe da mediana
(+) | o baixo é linear (5.2% delta para a frequência anterior)
Médios 400 - 2.000 Hz
(+) | médios equilibrados - apenas 1.3% longe da mediana
(+) | médios são lineares (2.1% delta para frequência anterior)
Altos 2 - 16 kHz
(+) | agudos equilibrados - apenas 1.9% longe da mediana
(+) | os máximos são lineares (2.7% delta da frequência anterior)
Geral 100 - 16.000 Hz
(+) | o som geral é linear (4.6% diferença em relação à mediana)
Comparado com a mesma classe
» 0% de todos os dispositivos testados nesta classe foram melhores, 0% semelhantes, 100% piores
» O melhor teve um delta de 5%, a média foi 17%, o pior foi 45%
Comparado com todos os dispositivos testados
» 0% de todos os dispositivos testados foram melhores, 0% semelhantes, 100% piores
» O melhor teve um delta de 4%, a média foi 23%, o pior foi 134%
Gerenciamento de energia - Prestige 15 pontua com eficiência
Consumo de energia
O i7-1280Pmostra que ele pode funcionar com eficiência energética. Um mínimo de 5 watts atesta o seu funcionamento econômico. Entretanto, ele não precisa alimentar um visor OLED como o Asus VivoBook Pro 16Xmas sim um monitor de 4K.
A diferença no consumo máximo de energia é particularmente marcante. O fato de que a MSI acelera consideravelmente a CPU e a GPU para alcançar o comportamento mais silencioso possível resulta em cerca da metade das taxas máximas usuais
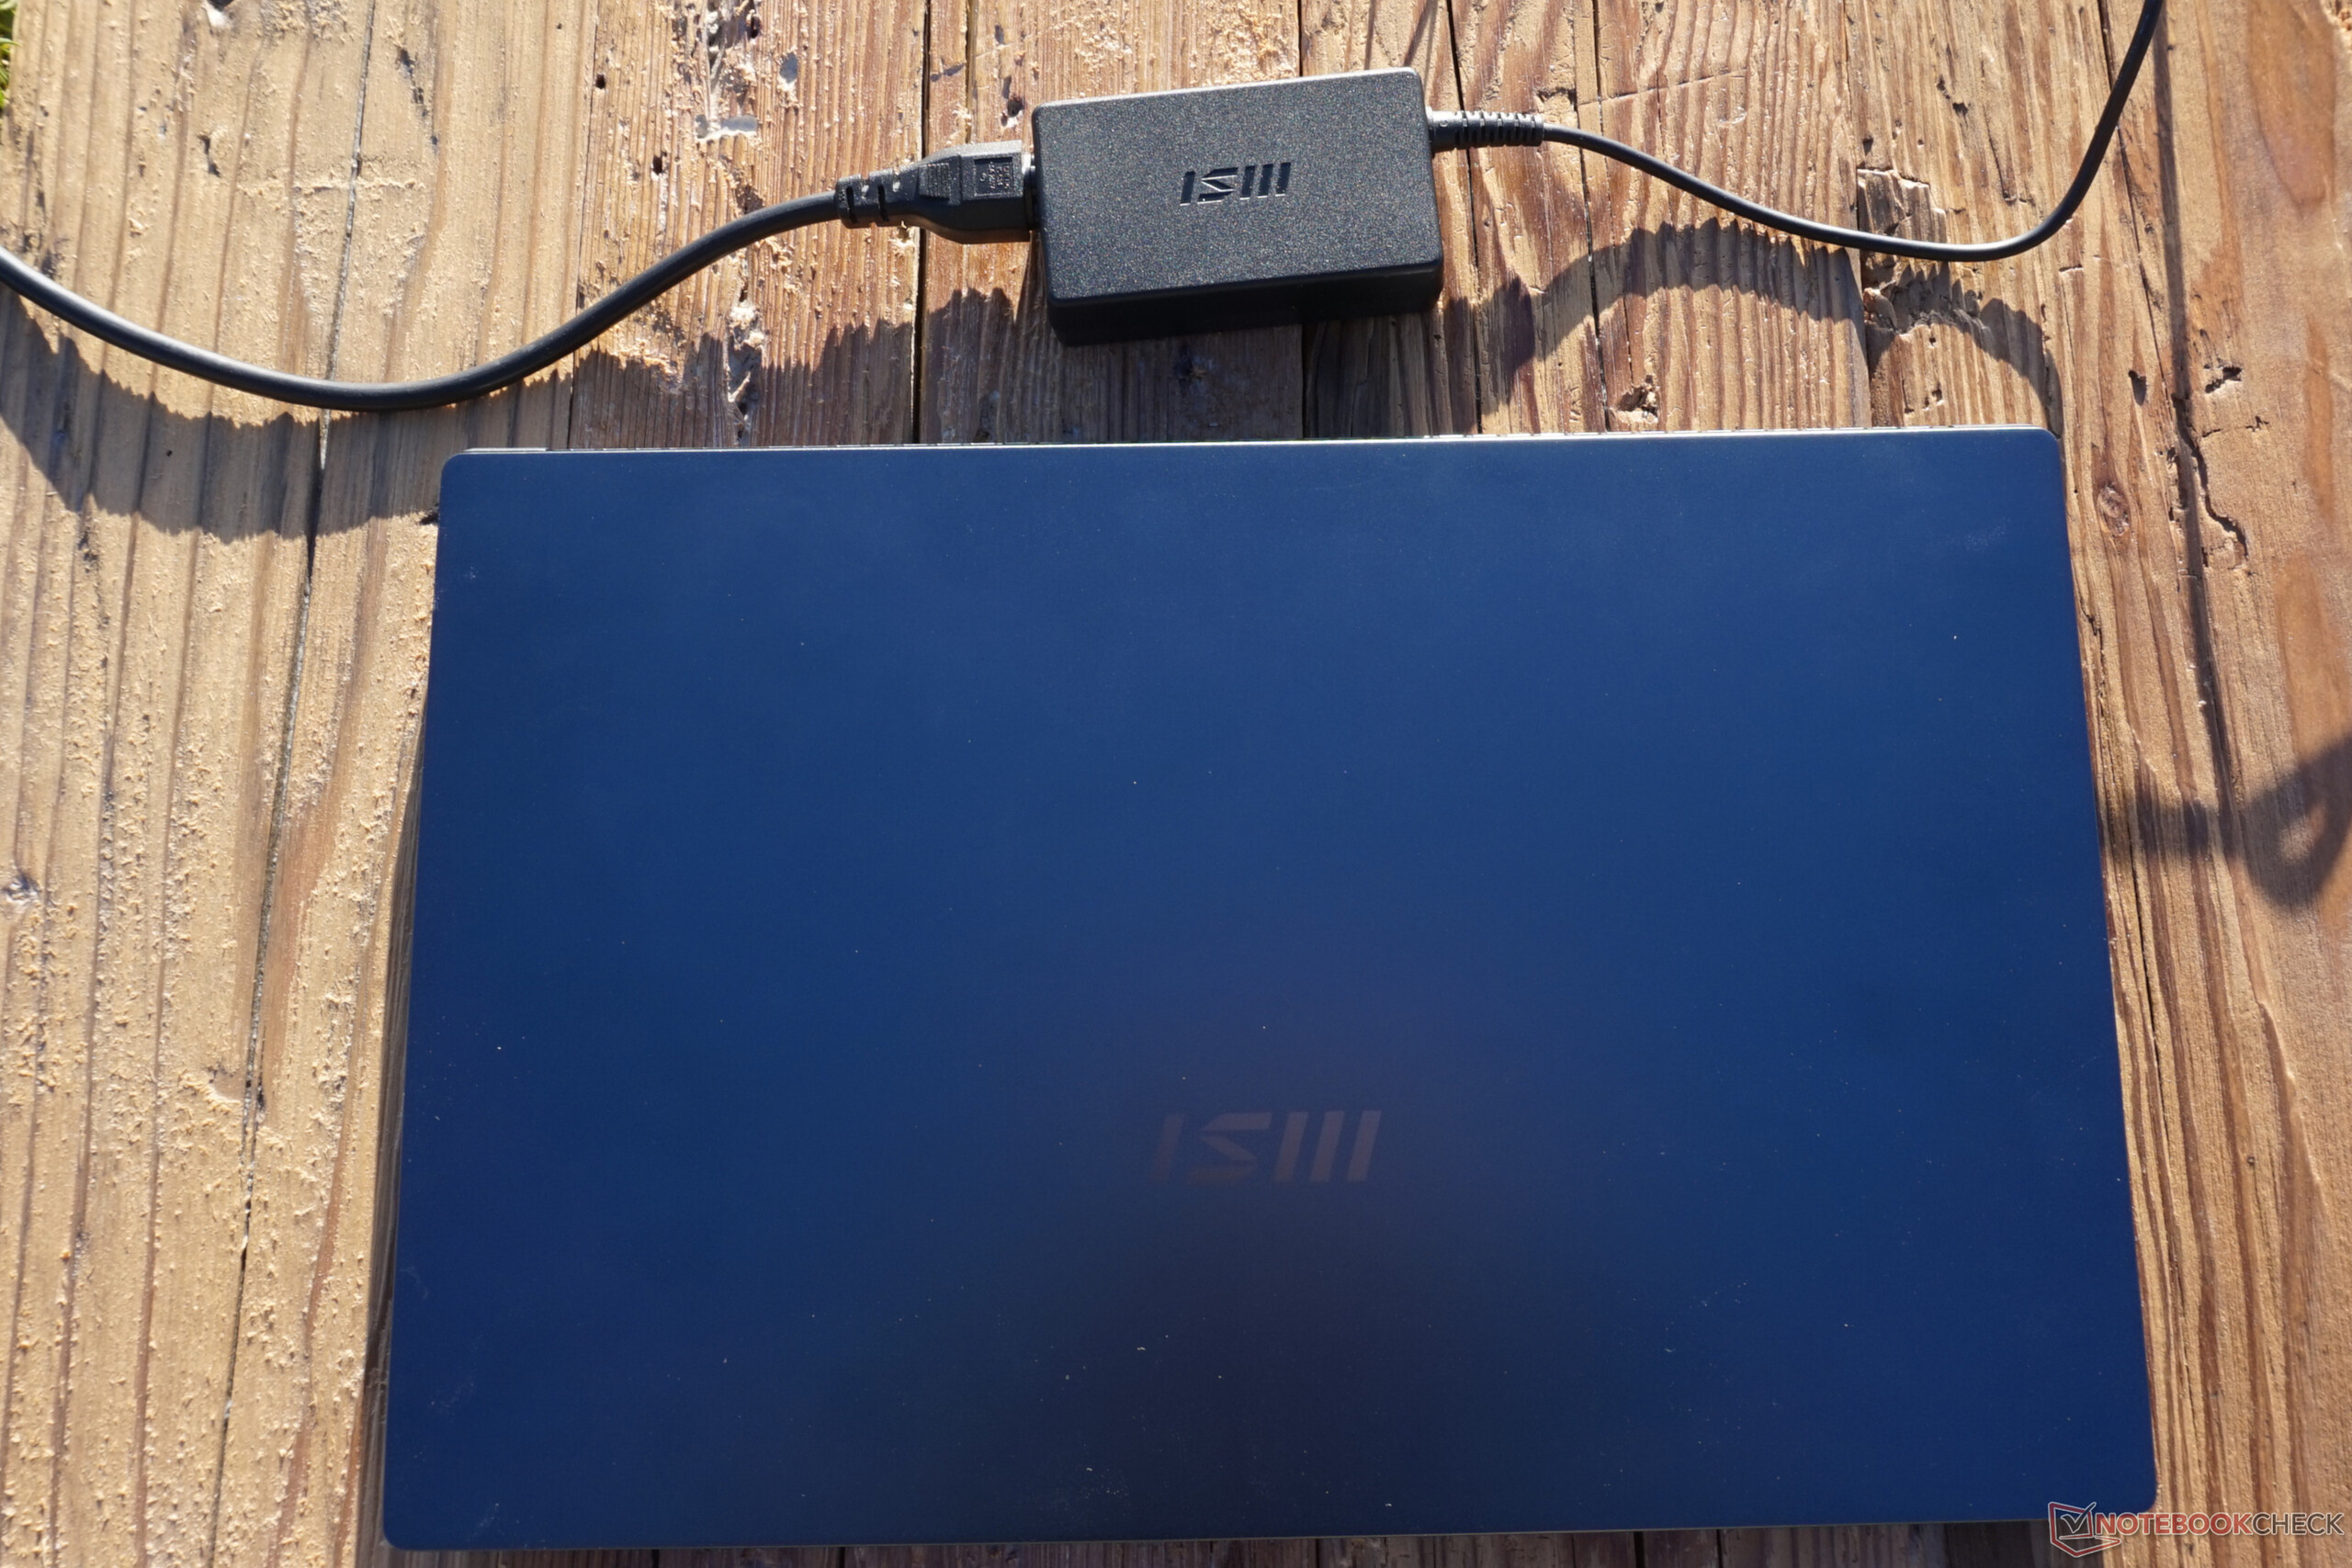
O fornecimento de energia é um pouco apertado. A recarga é feita com um padrão de 60 watts através de uma das portas Thunderbolt. Sob carga, isto é apenas o suficiente para abastecer o laptop com energia. Durante operações de computação intensiva e prolongada, observamos que a bateria só foi carregada na velocidade mínima ou não foi carregada de todo. Por outro lado, não notamos uma descarga, apesar de um adaptador de energia conectado
| desligado | |
| Ocioso | |
| Carga |
|
Key:
min: | |
| MSI Prestige 15 A12UD-093 i7-1280P, GeForce RTX 3050 Ti Laptop GPU, Micron 3400 1TB MTFDKBA1T0TFH, IPS, 3840x2160, 15.6" | Acer Swift X SFX16-52G-77RX i7-1260P, A370M, WDC PC SN810 1TB, IPS-LED, 2560x1600, 16" | Schenker Vision 14 2022 RTX 3050 Ti i7-12700H, GeForce RTX 3050 Ti Laptop GPU, Samsung SSD 980 Pro 1TB MZ-V8P1T0BW, IPS, 2880x1800, 14" | Asus VivoBook Pro 16X OLED N7600PC-L2026X i7-11370H, GeForce RTX 3050 4GB Laptop GPU, Intel Optane Memory H10 with Solid State Storage 32GB + 512GB HBRPEKNX0202A(L/H), OLED, 3840x2400, 16" | Lenovo IdeaPad Gaming 3 15ARH7 R5 6600H, GeForce RTX 3050 4GB Laptop GPU, Lenovo UMIS AM630 RPJTJ256MGE1QDY, IPS, 1920x1080, 15.6" | Dell XPS 15 9520 RTX 3050 Ti i7-12700H, GeForce RTX 3050 Ti Laptop GPU, WDC PC SN810 512GB, OLED, 3456x2160, 15.6" | Média NVIDIA GeForce RTX 3050 Ti Laptop GPU | Média da turma Multimedia | |
|---|---|---|---|---|---|---|---|---|
| Power Consumption | -16% | -46% | -55% | -76% | -44% | -63% | -22% | |
| Idle Minimum * (Watt) | 5.4 | 3.7 31% | 7.5 -39% | 8.9 -65% | 7.7 -43% | 5.5 -2% | 8.2 ? -52% | 5.66 ? -5% |
| Idle Average * (Watt) | 11.8 | 7.6 36% | 10.4 12% | 10.2 14% | 9.1 23% | 7.2 39% | 12.6 ? -7% | 10.2 ? 14% |
| Idle Maximum * (Watt) | 12.7 | 11.1 13% | 11.4 10% | 12 6% | 15.6 -23% | 16 -26% | 17.2 ? -35% | 12.5 ? 2% |
| Load Average * (Watt) | 45.9 | 70 -53% | 83.3 -81% | 94 -105% | 90.7 -98% | 91.8 -100% | 92 ? -100% | 65.2 ? -42% |
| Witcher 3 ultra * (Watt) | 45.7 | 68.8 -51% | 92.7 -103% | 93.1 -104% | 122.9 -169% | 74.6 -63% | ||
| Load Maximum * (Watt) | 63 | 108 -71% | 110.3 -75% | 112 -78% | 155.2 -146% | 134.7 -114% | 139.1 ? -121% | 113.5 ? -80% |
* ... menor é melhor
Power Consumption Witcher 3 / Stresstest
Power Consumption with an External Monitor
Vida útil da bateria
Com um impressionante 80 Wh, os bons tempos de corrida são quase garantidos. Se o brilho for reduzido, o MSI Prestige 15 atinge quase 9 horas em nosso teste de navegação na web. A variante com visor Full HD deve assim ser capaz de quebrar a marca das 10 horas com relativa facilidade.
Os números não são tão impressionantes no brilho total ou durante a reprodução de um vídeo Full HD em um loop contínuo. No entanto, às 7 horas, o laptop deve ser suficiente para a maioria das operações.
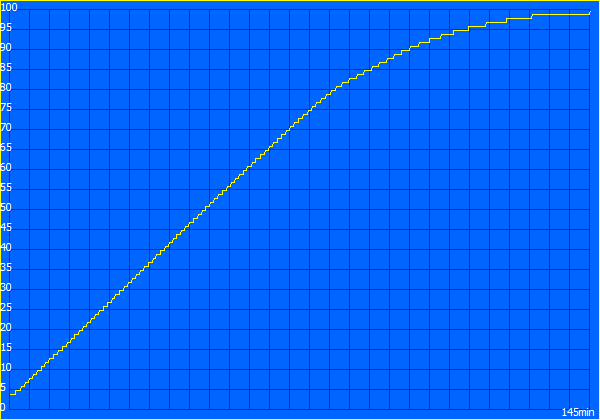
Sob carga total, a falta de estrangulamento empurra a vida útil da bateria para o baixo valor esperado. Um consumo de 60 watts e uma bateria de 80 Wh resultam em 80 minutos. Afinal de contas, o desempenho total está disponível mesmo sem uma fonte de alimentação externa
| MSI Prestige 15 A12UD-093 i7-1280P, GeForce RTX 3050 Ti Laptop GPU, 80 Wh | Acer Swift X SFX16-52G-77RX i7-1260P, A370M, 56 Wh | Schenker Vision 14 2022 RTX 3050 Ti i7-12700H, GeForce RTX 3050 Ti Laptop GPU, 99.8 Wh | Asus VivoBook Pro 16X OLED N7600PC-L2026X i7-11370H, GeForce RTX 3050 4GB Laptop GPU, 96 Wh | Lenovo IdeaPad Gaming 3 15ARH7 R5 6600H, GeForce RTX 3050 4GB Laptop GPU, 45 Wh | Dell XPS 15 9520 RTX 3050 Ti i7-12700H, GeForce RTX 3050 Ti Laptop GPU, 86 Wh | Média da turma Multimedia | |
|---|---|---|---|---|---|---|---|
| Duração da bateria | 9% | 40% | 39% | -32% | 64% | 66% | |
| H.264 (h) | 7.1 | 10.4 46% | 11.1 56% | 17.1 ? 141% | |||
| WiFi v1.3 (h) | 8.9 | 9.1 2% | 10.1 13% | 8.7 -2% | 6.5 -27% | 8.8 -1% | 12.2 ? 37% |
| Load (h) | 1.4 | 1.1 -21% | 2.1 50% | 2.5 79% | 0.9 -36% | 3.2 129% | 1.664 ? 19% |
Pro
Contra
Veredicto: Uma combinação bem balanceada de componentes no Prestige 15
O MSI Prestige 15 parece implementar consistentemente o princípio orientador de estrangular o hardware sólido e eficiente a tal ponto que a criação de conteúdo é perfeitamente bem sucedida. As tarefas ávidas de desempenho, por outro lado, são um pouco retardadas pela redução do consumo de energia.
Por outro lado, isto significa que o caso permanece relativamente frio e a dupla ventoinha é controlada. A vida útil da bateria também é um pouco beneficiada. Portanto, as perdas não são realmente dramáticas, porque o desempenho total ainda está disponível para pequenas explosões.
Isto também diferencia o Prestige de um laptop com um iGPU, apesar do desempenho gráfico relativamente baixo. Embora o desempenho seja fraco em jogos, ele ainda é suficiente e bem ajustado para software de edição de imagem e vídeo e está claramente acima do que os chips gráficos integrados podem fazer.
Quieto, móvel e poderoso - a escolha perfeita para pessoas criativas.
Além disso, há a tela otimamente sintonizada. o 4K e o espaço de cores AdobeRGB provam ser dignos de um display tão profissional. Em 15,6 polegadas, no entanto, os muitos pixels não podem maximizar totalmente seu potencial. Em vez disso, eles consomem mais energia e ocupam mais capacidade de computação do que uma tela FullHD, que seria ainda mais brilhante com a mesma saída de luz.
O Prestige 15 convence em outros aspectos, talvez não com o melhor desempenho, mas com uma boa gama de características de hardware. Estas incluem duas portas Thunderbolt e duas portas USB-A razoavelmente rápidas. O teclado e o touchpad causam uma impressão sólida e nós gostamos deles mesmo sem os destaques extravagantes.
Se o foco é a edição de imagem e vídeo, o Prestige oferece uma mistura quase perfeita que é projetada para funcionar agradavelmente. Somente a tela talvez seja um pouco boa demais.
Em termos de alternativas, o Dell XPS 15 9520 tem menos pontos fracos em certas áreas, desde a webcam, o teclado e até os alto-falantes. O Schenker Vision 14 2022 impressiona com o alto desempenho de componentes similares. Entretanto, ambos os modelos custam mais e não alcançam a eficiência do Prestige 15.
Preço e Disponibilidade
As variações regionais do Prestige 15 A12UD ainda estão sendo implementadas internacionalmente. Nos EUA, por exemplo, somente o Prestige 15 A12UD-010 https://us.msi.com/Business-Productivity/Prestige-15-A12UX/shopnow (com um Intel Core i7-1260P em vez de um i7-1280P) parece estar à venda por US$1.899,00 (atualmente fora de estoque em todos os varejistas aplicáveis)
Os usuários são aconselhados a verificar diretamente via MSI (onde aplicável) e digitar Prestige 15 A12UD na barra de busca
MSI Prestige 15 A12UD-093
- 11/30/2022 v7 (old)
Mario Petzold
Price comparison

