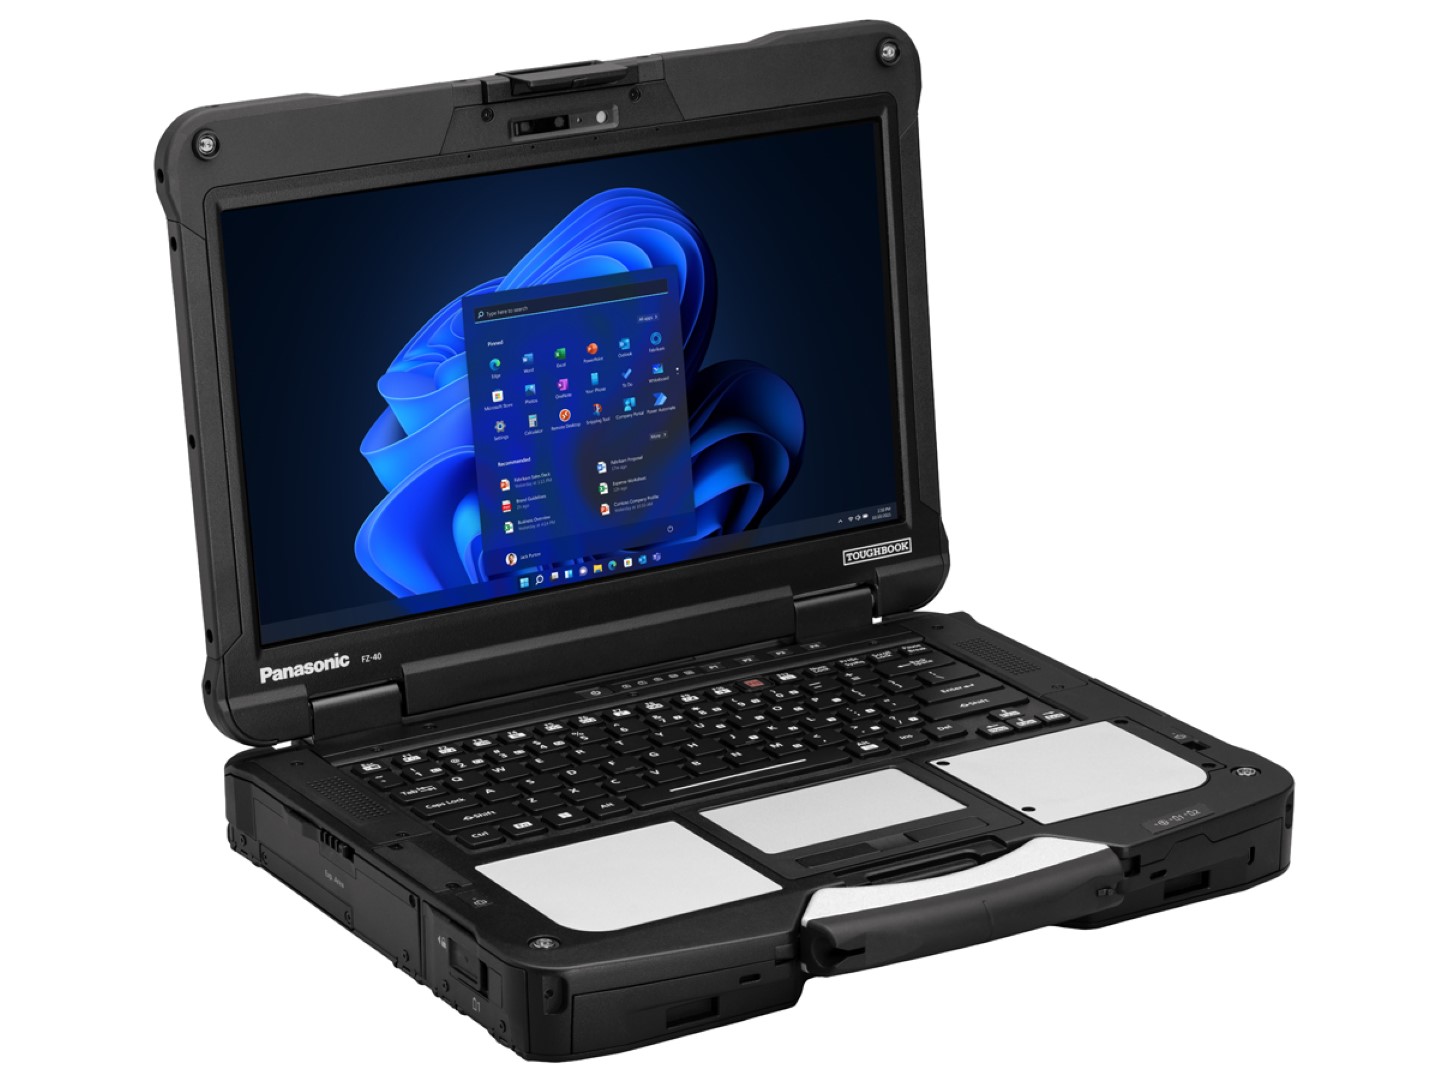
Revisão do laptop Panasonic Toughbook 40: Altamente adaptável e modular
Não confundir com o menor Toughbook 55 de 14 polegadas, o Toughbook 40 de 14 polegadas é um laptop totalmente robusto projetado com a capacidade de suportar até quatro cartões de expansão xPAK modulares para se adaptar às necessidades do usuário. Estes cartões opcionais ajudam a separar o Toughbook 40 dos modelos concorrentes, tais como o Getac S410, Dell Latitude 7400 Resistente série, ou a Durabook S14I
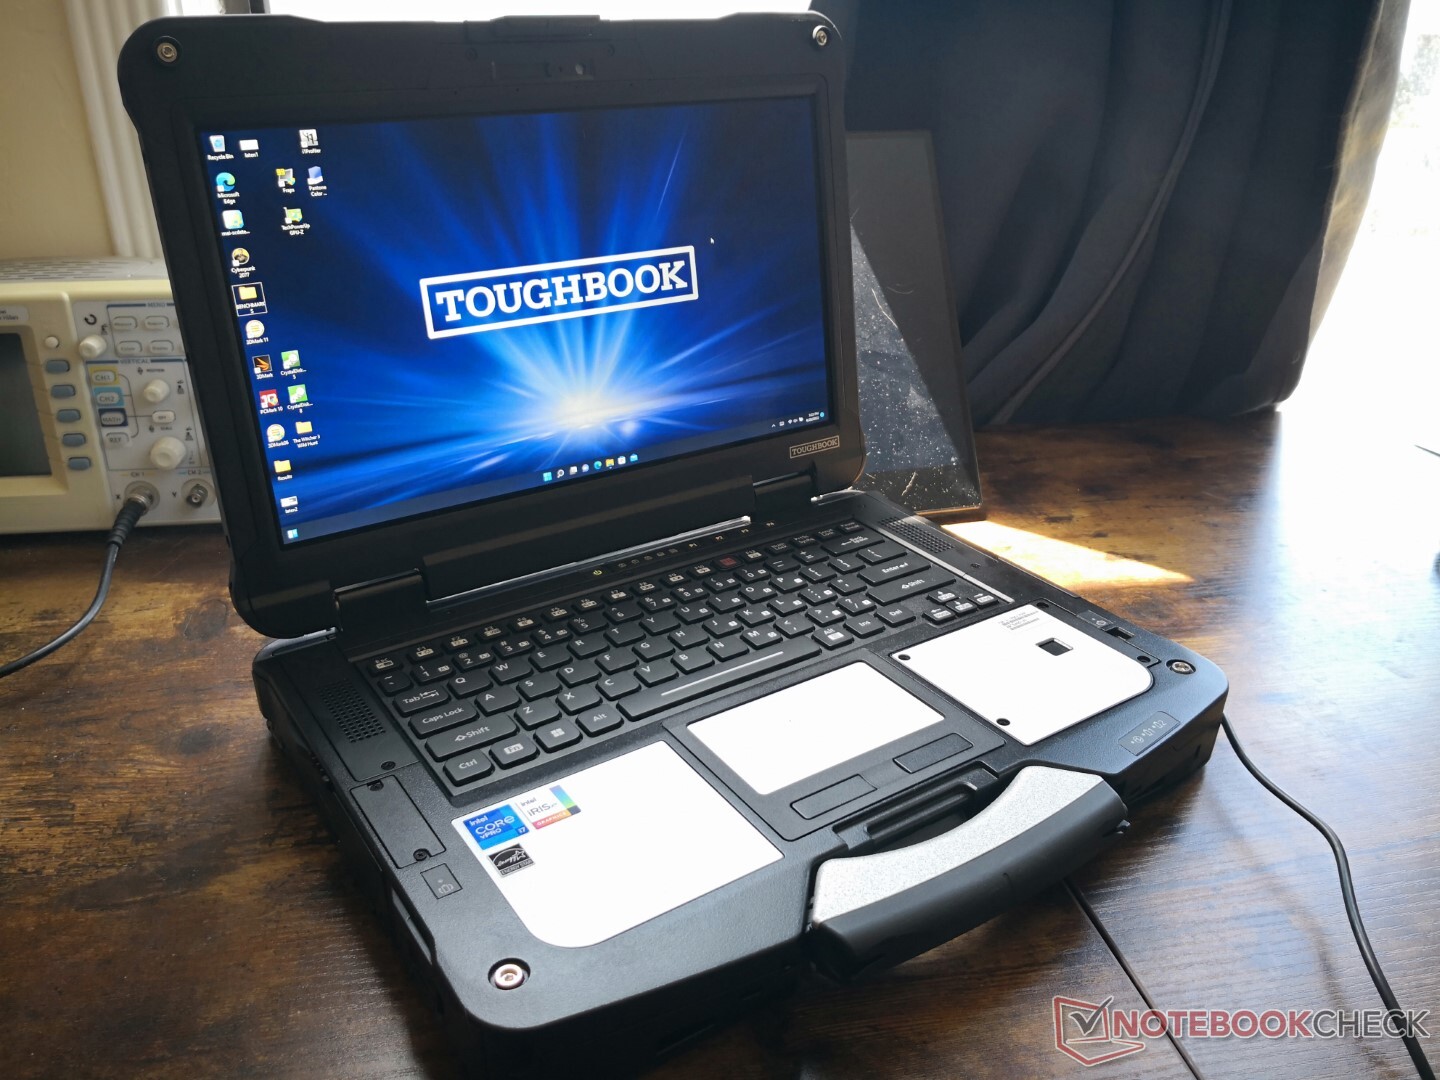
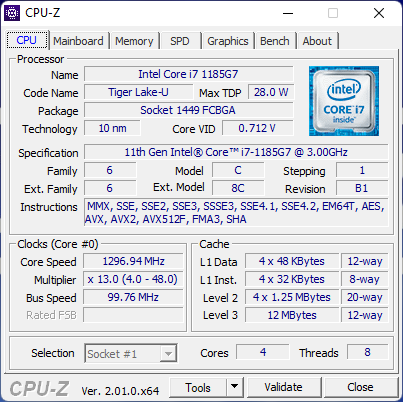
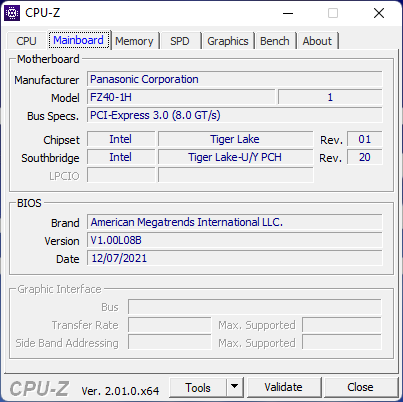
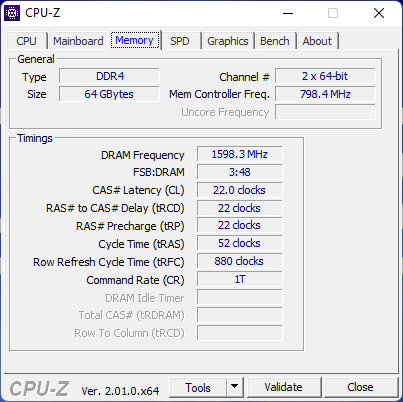
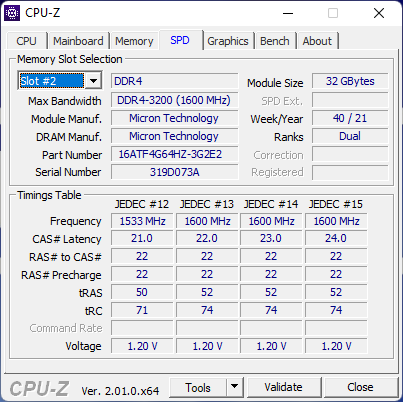
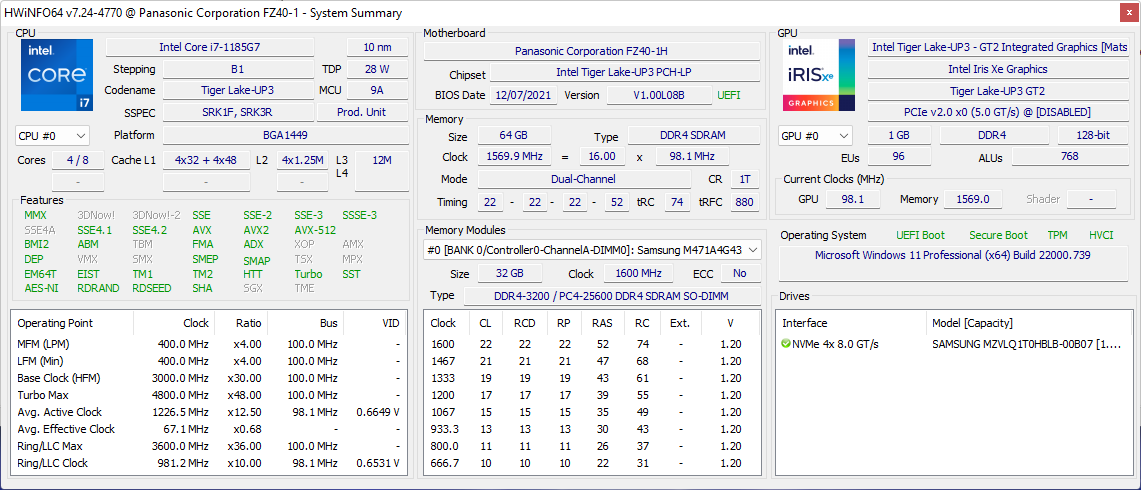
Internamente, nossa unidade de teste vem equipada com a 11ª geração Tiger Lake-U Core i7-1185G7 CPU, 64 GB de RAM, e uma tela IPS ultrabright 1080p. Configurações adicionais podem ser encontradas na página oficial do produto aqui
Mais análises da Panasonic:
- Panasonic FZ-55 MK2
- Panasonic FZ-G2
- Panasonic FZ-S1
- Panasonic FZ-A3
Posibles contendientes en la comparación
Avaliação | Data | Modelo | Peso | Altura | Size | Resolução | Preço |
|---|---|---|---|---|---|---|---|
v (old) | 07/2022 | Panasonic Toughbook 40 i7-1185G7, Iris Xe G7 96EUs | 3.9 kg | 53.4 mm | 14.00" | 1920x1080 | |
| 83.9 % v7 (old) | 09/2021 | Panasonic Toughbook FZ-55 MK2 i7-1185G7, Iris Xe G7 96EUs | 2.3 kg | 33 mm | 14.00" | 1920x1080 | |
| 81.7 % v7 (old) | 05/2022 | Getac S410 Gen 4 i7-1185G7, Iris Xe G7 96EUs | 3.2 kg | 34.9 mm | 14.00" | 1920x1080 | |
| 89.2 % v6 (old) | Dell Latitude 5420 Rugged-P85G i7-8650U, Radeon RX 540 | 2.8 kg | 32.9 mm | 14.00" | 1920x1080 | ||
| 82.4 % v7 (old) | 12/2021 | Acer Enduro Urban N3 EUN314 i7-1165G7, Iris Xe G7 96EUs | 1.8 kg | 21.95 mm | 14.00" | 1920x1080 | |
v (old) | 04/2021 | Durabook S14I i7-1165G7, Iris Xe G7 96EUs | 3 kg | 38.1 mm | 14.00" | 1920x1080 |
Caso
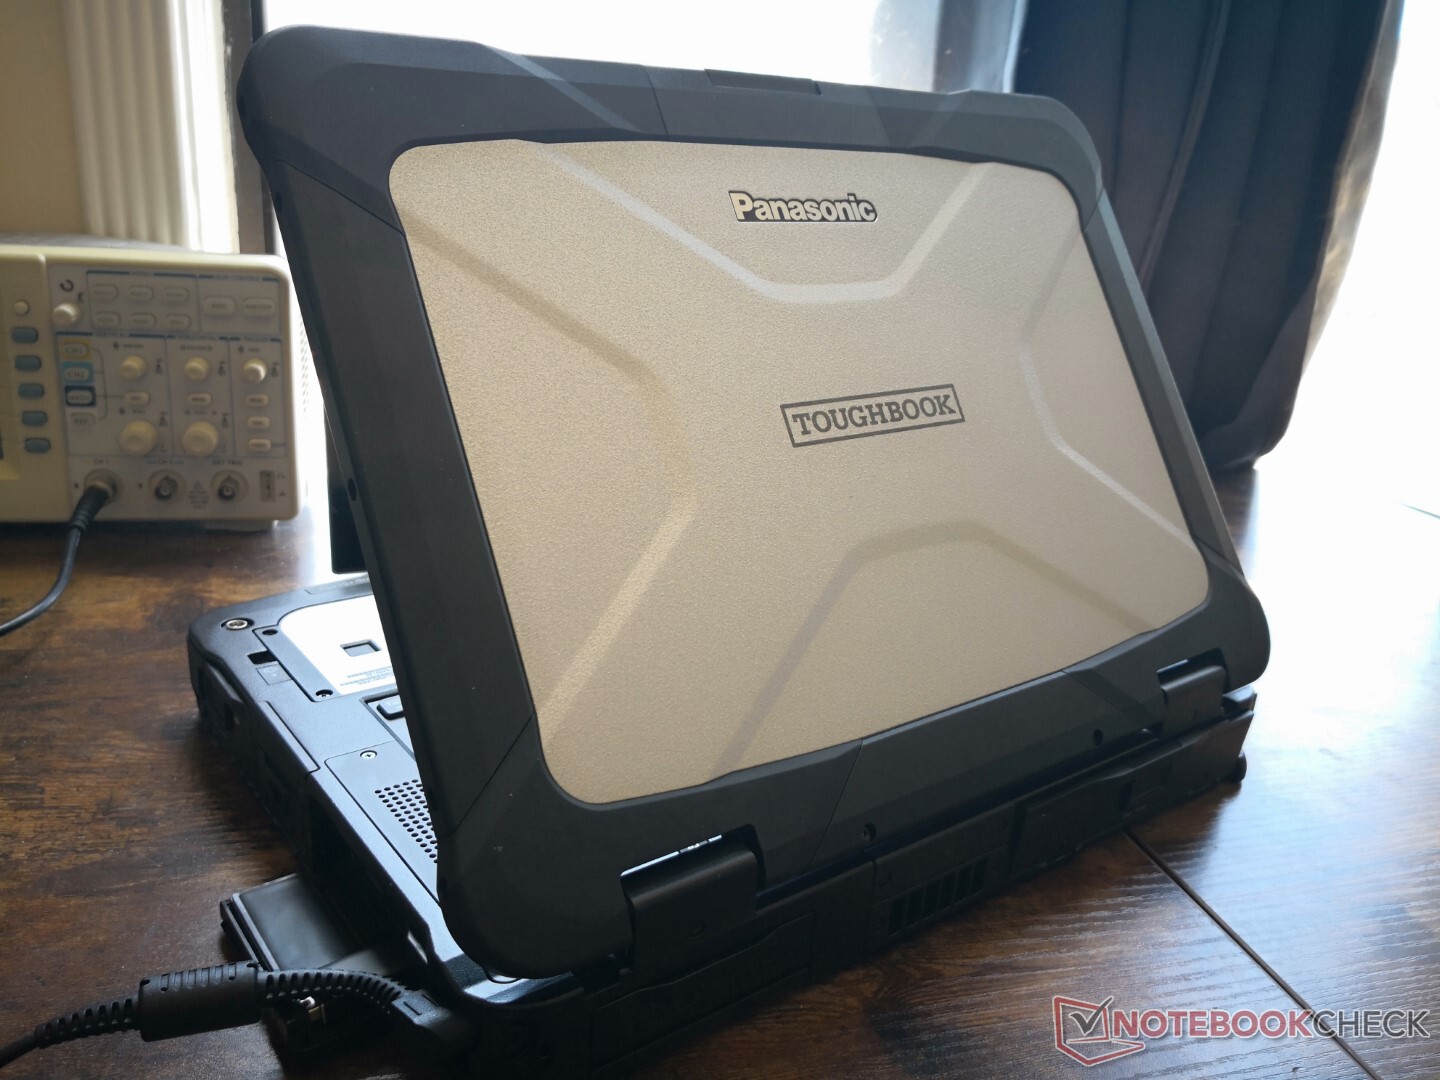
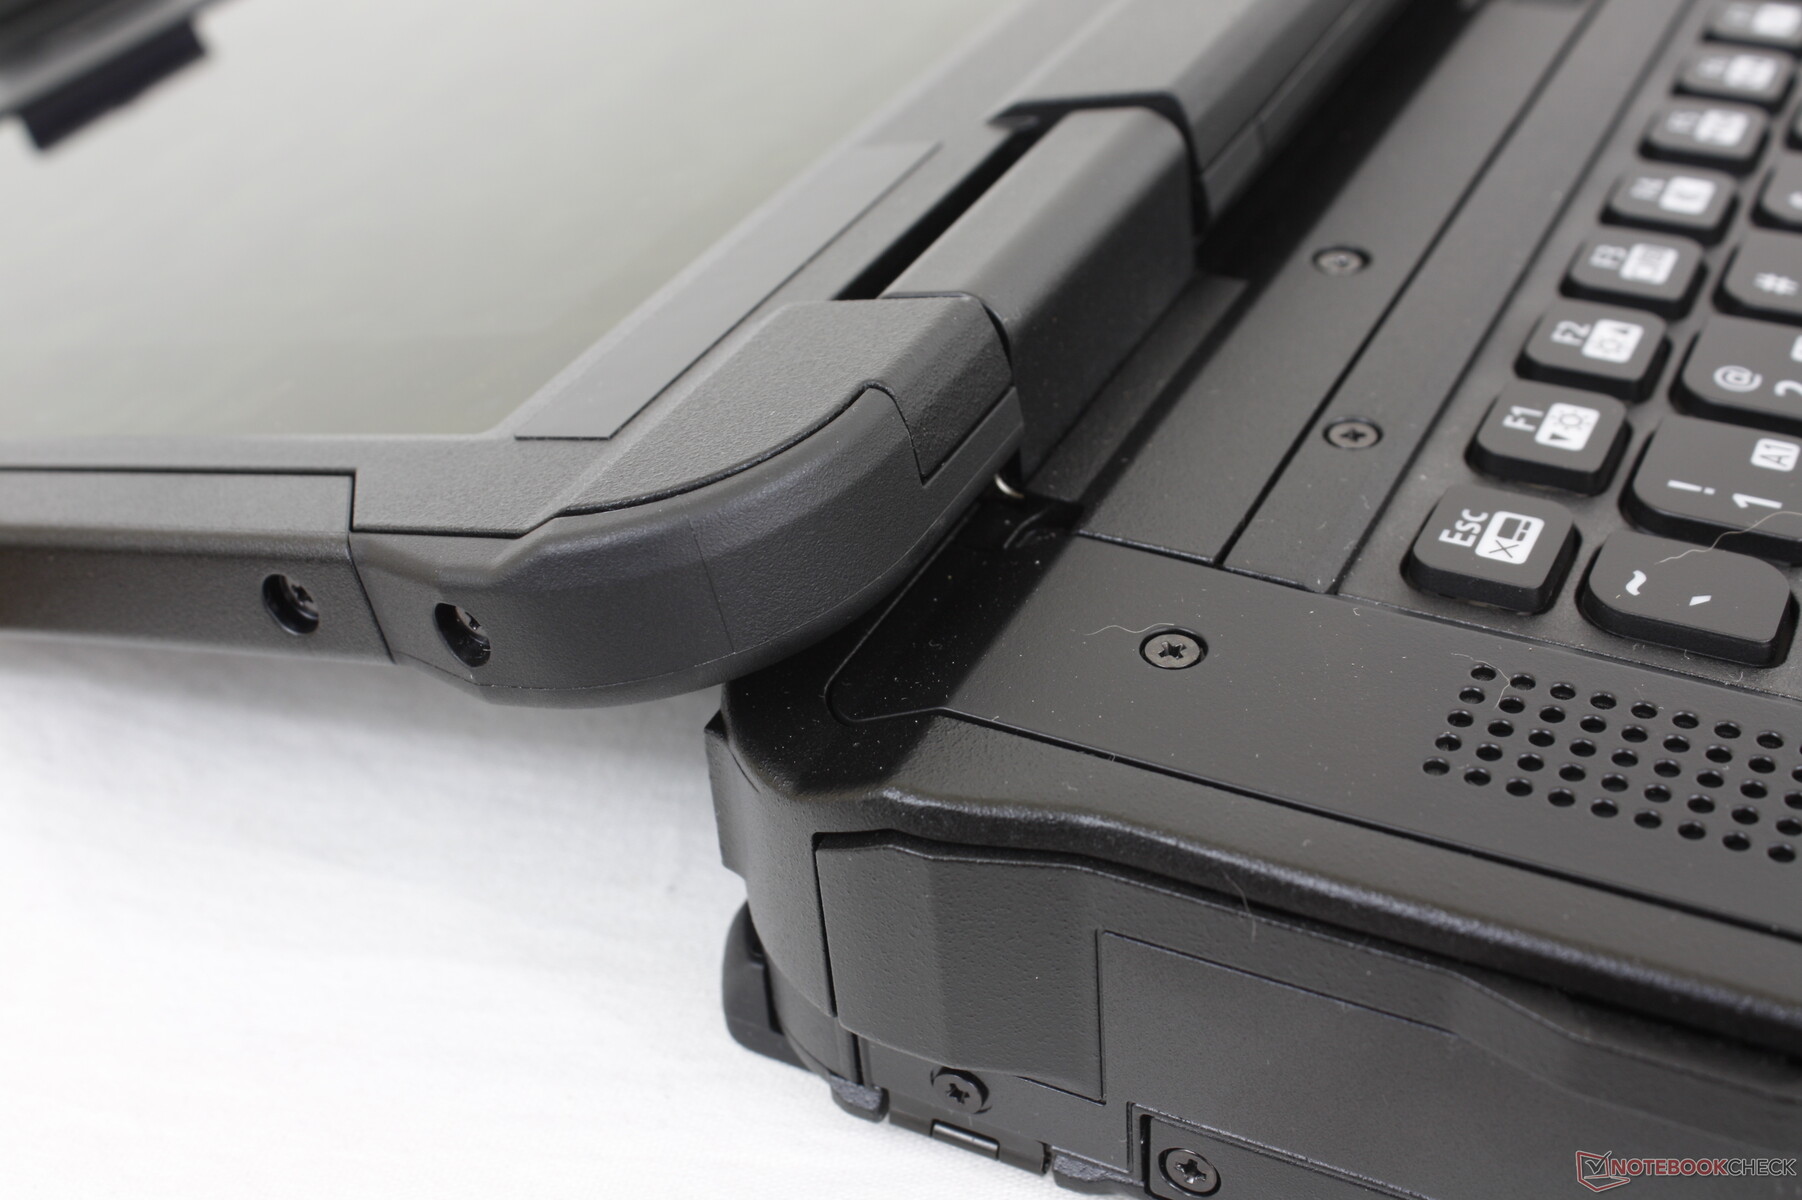
O modelo é grande e pesado, pois é um projeto totalmente robusto. O Durabook S14I semi-robusto, por exemplo, oferece o mesmo tamanho de tela e, no entanto, é quase 1 kg mais leve, sendo menor em todas as três dimensões.
Conectividade e Expansão xPAK
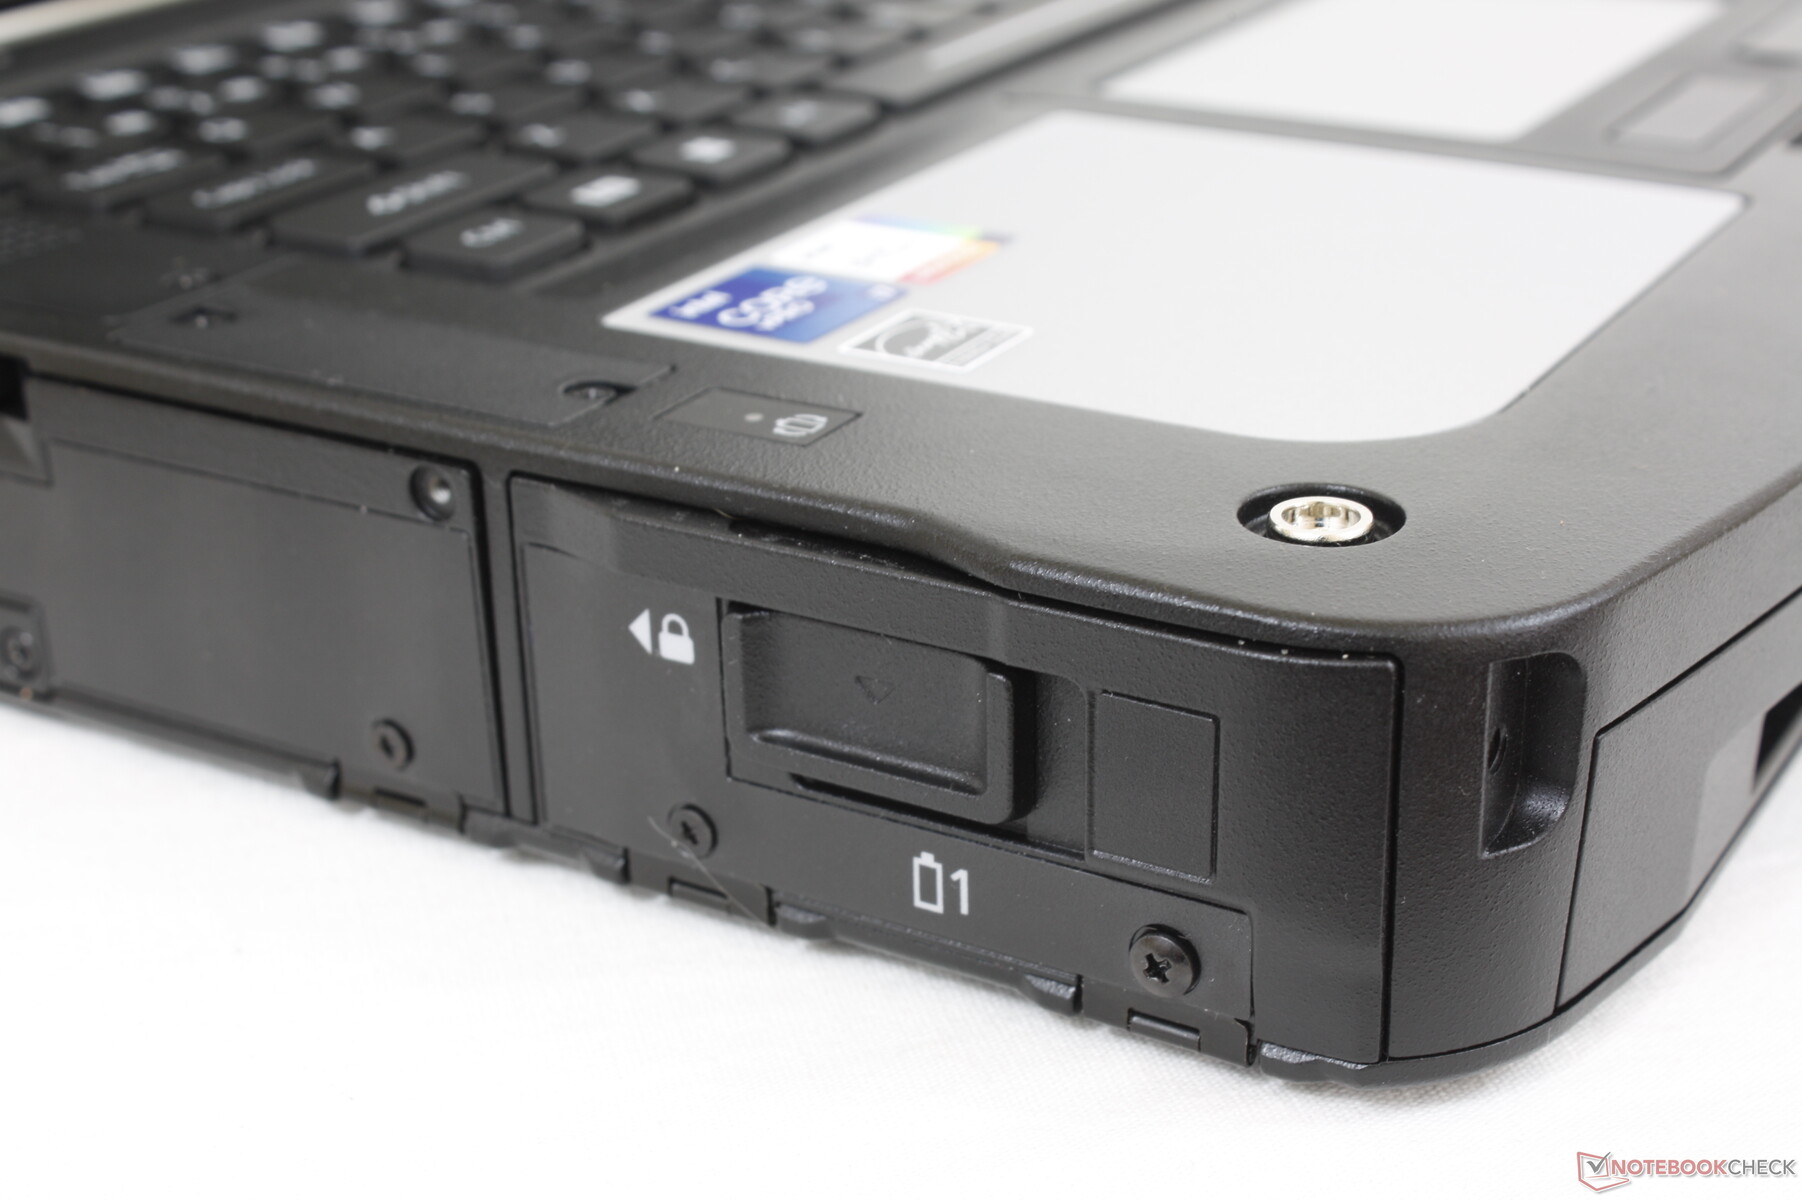
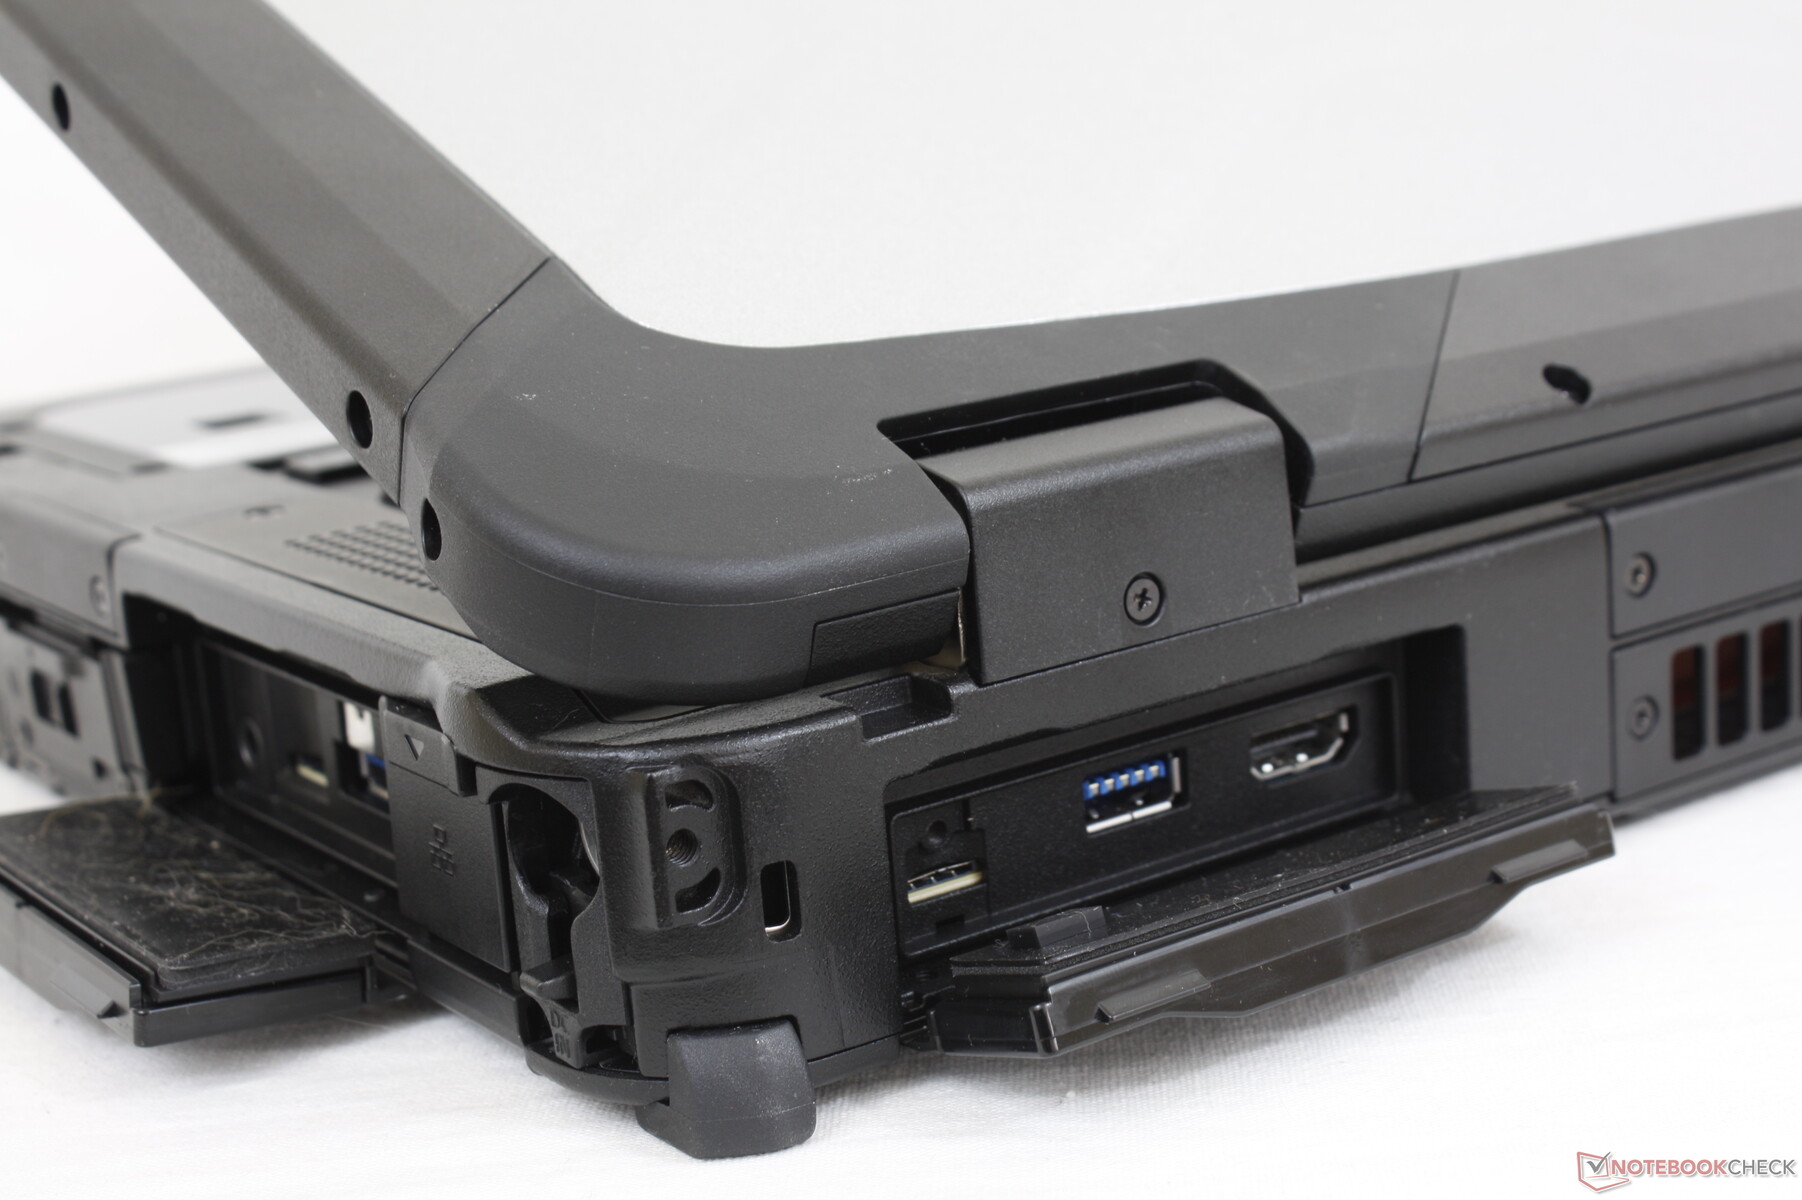
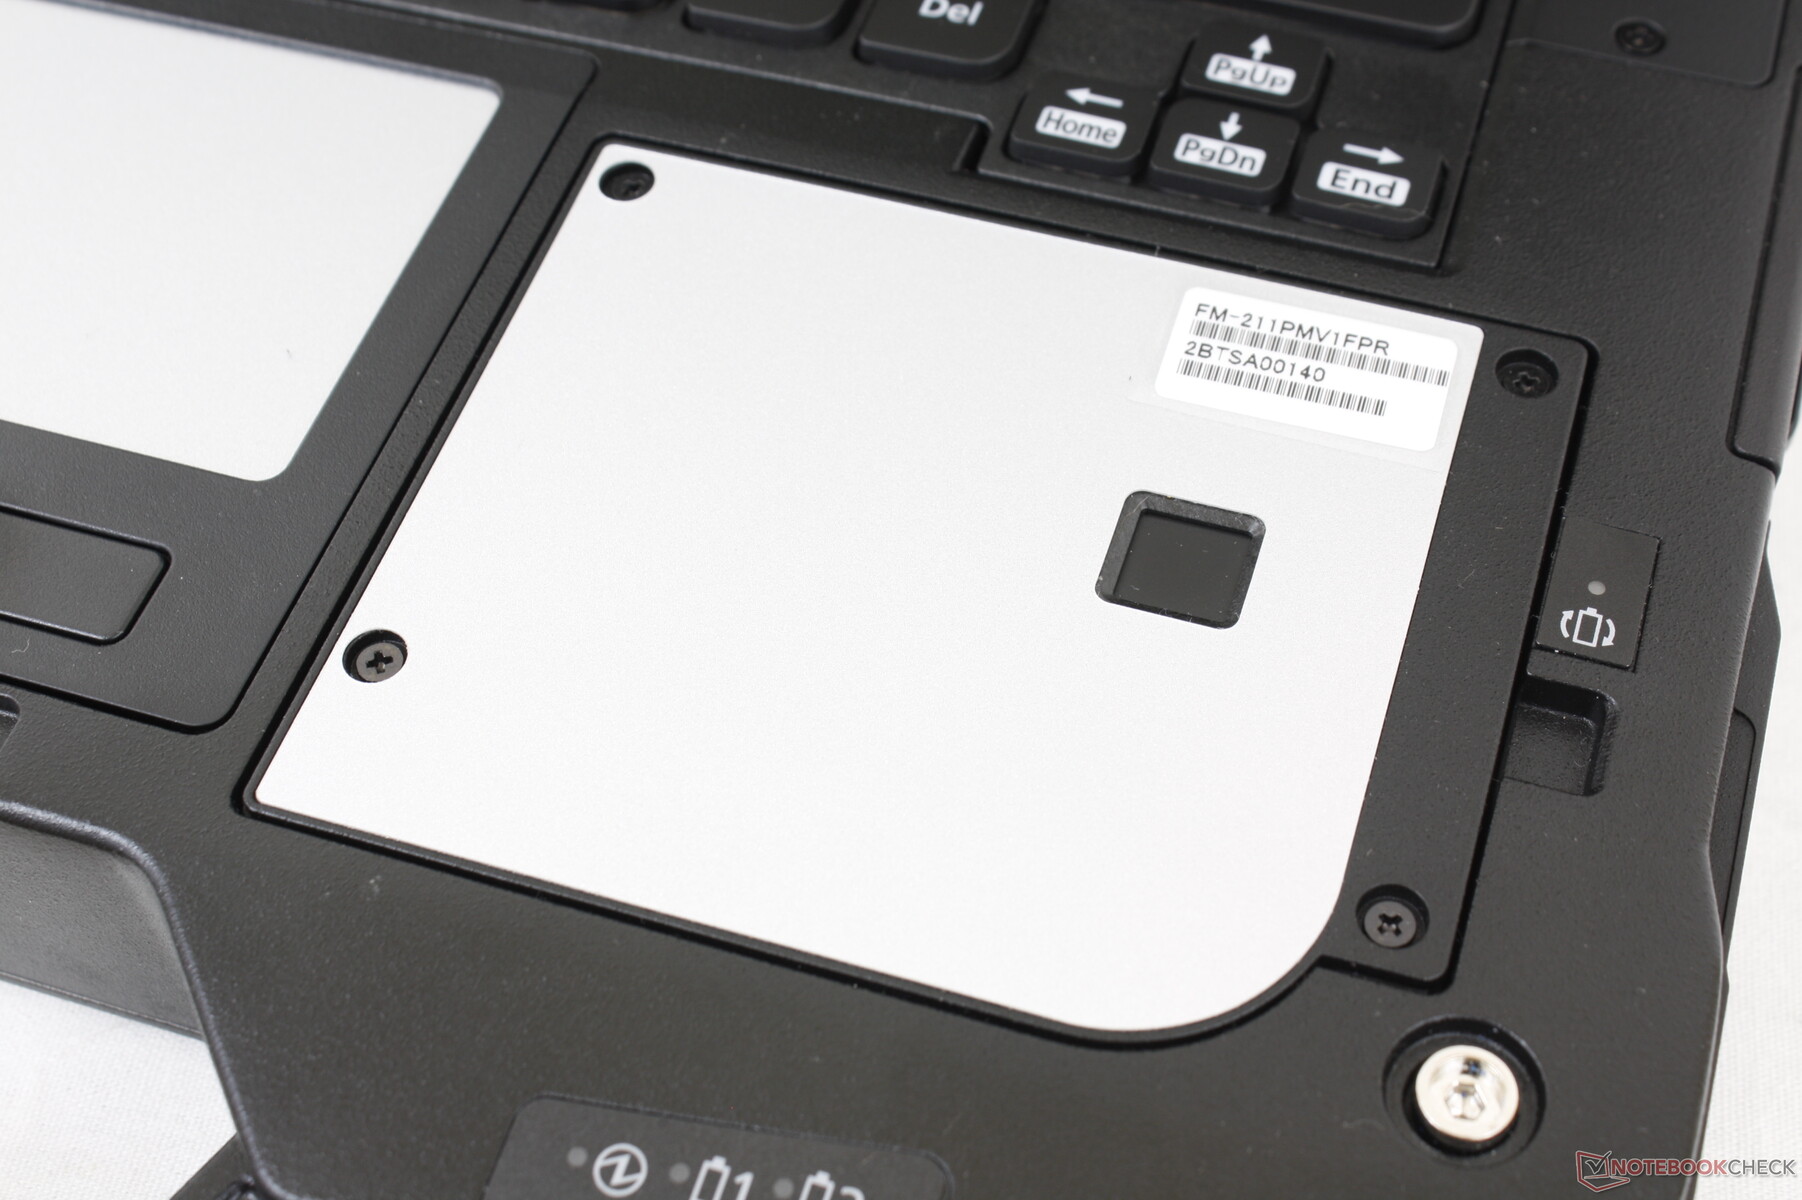
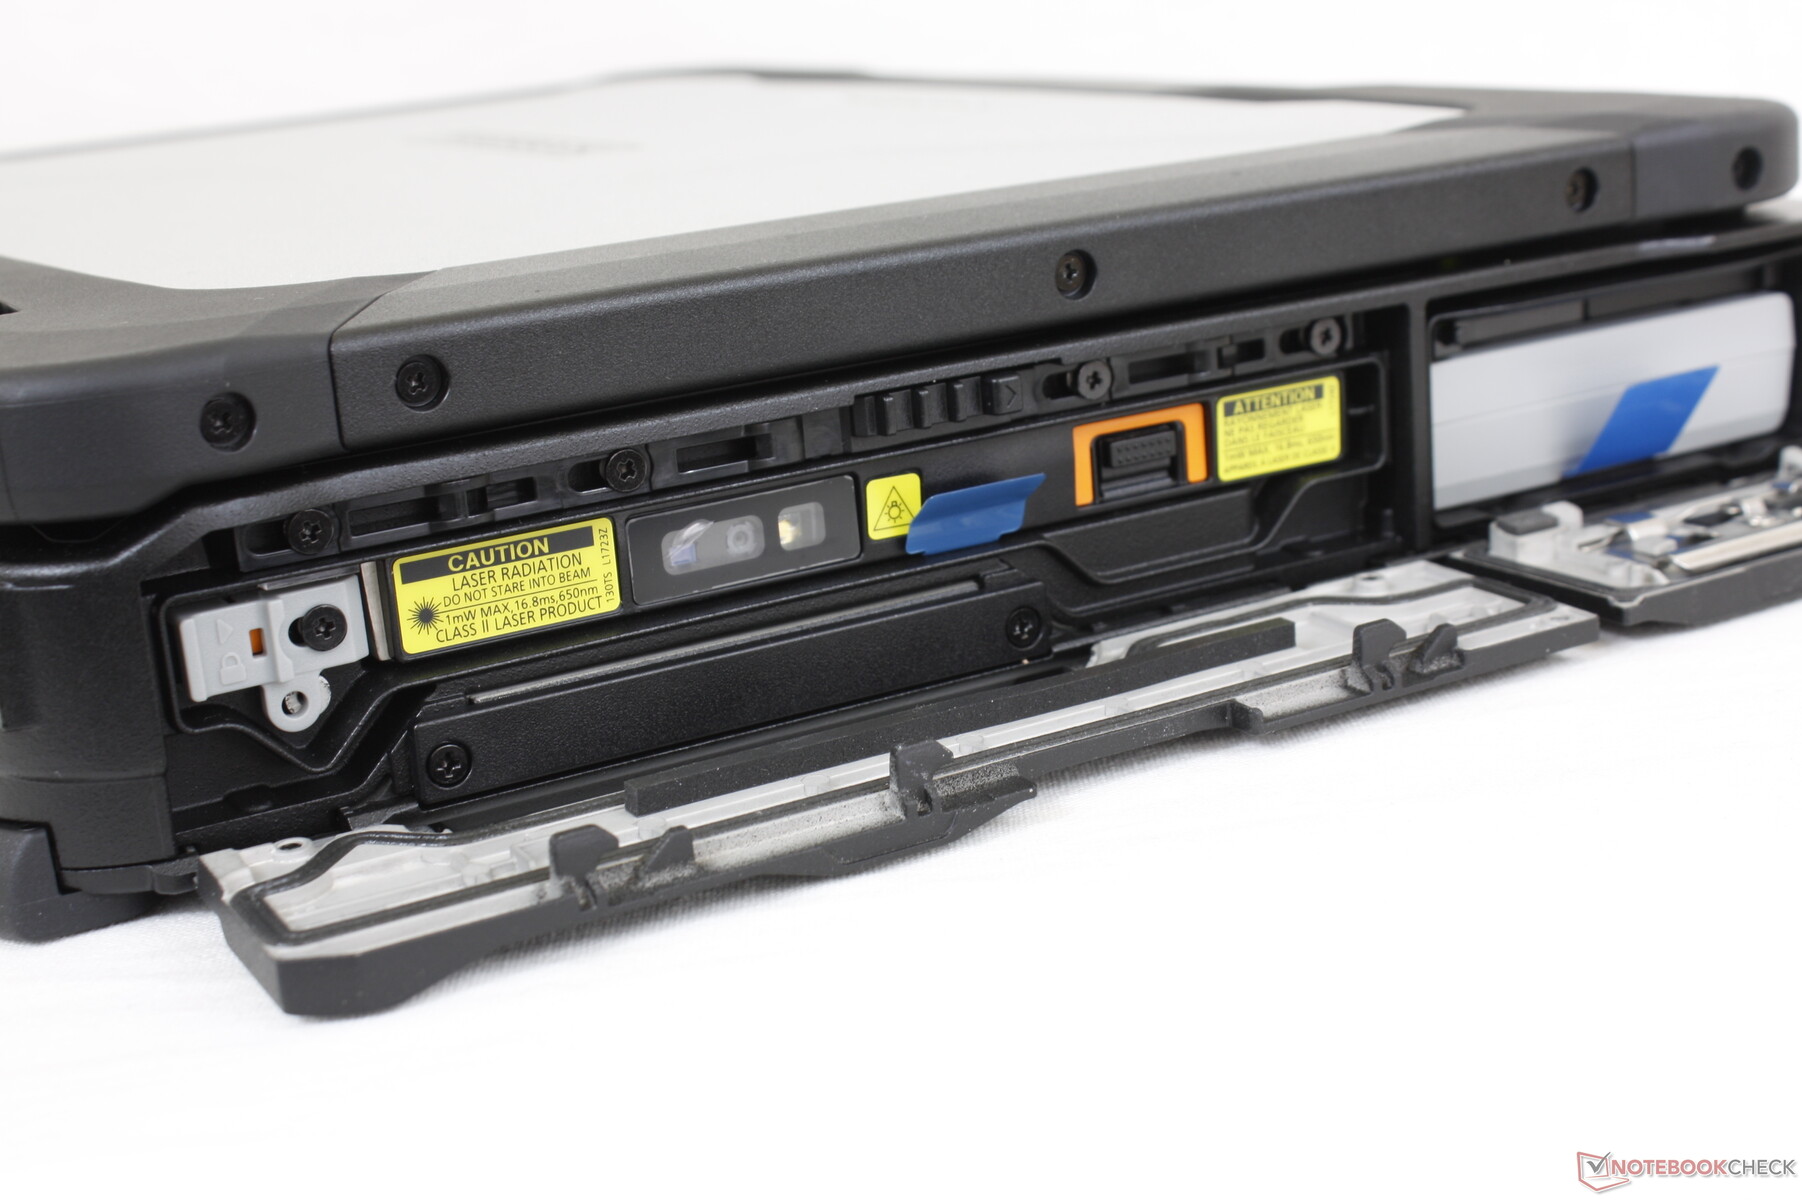
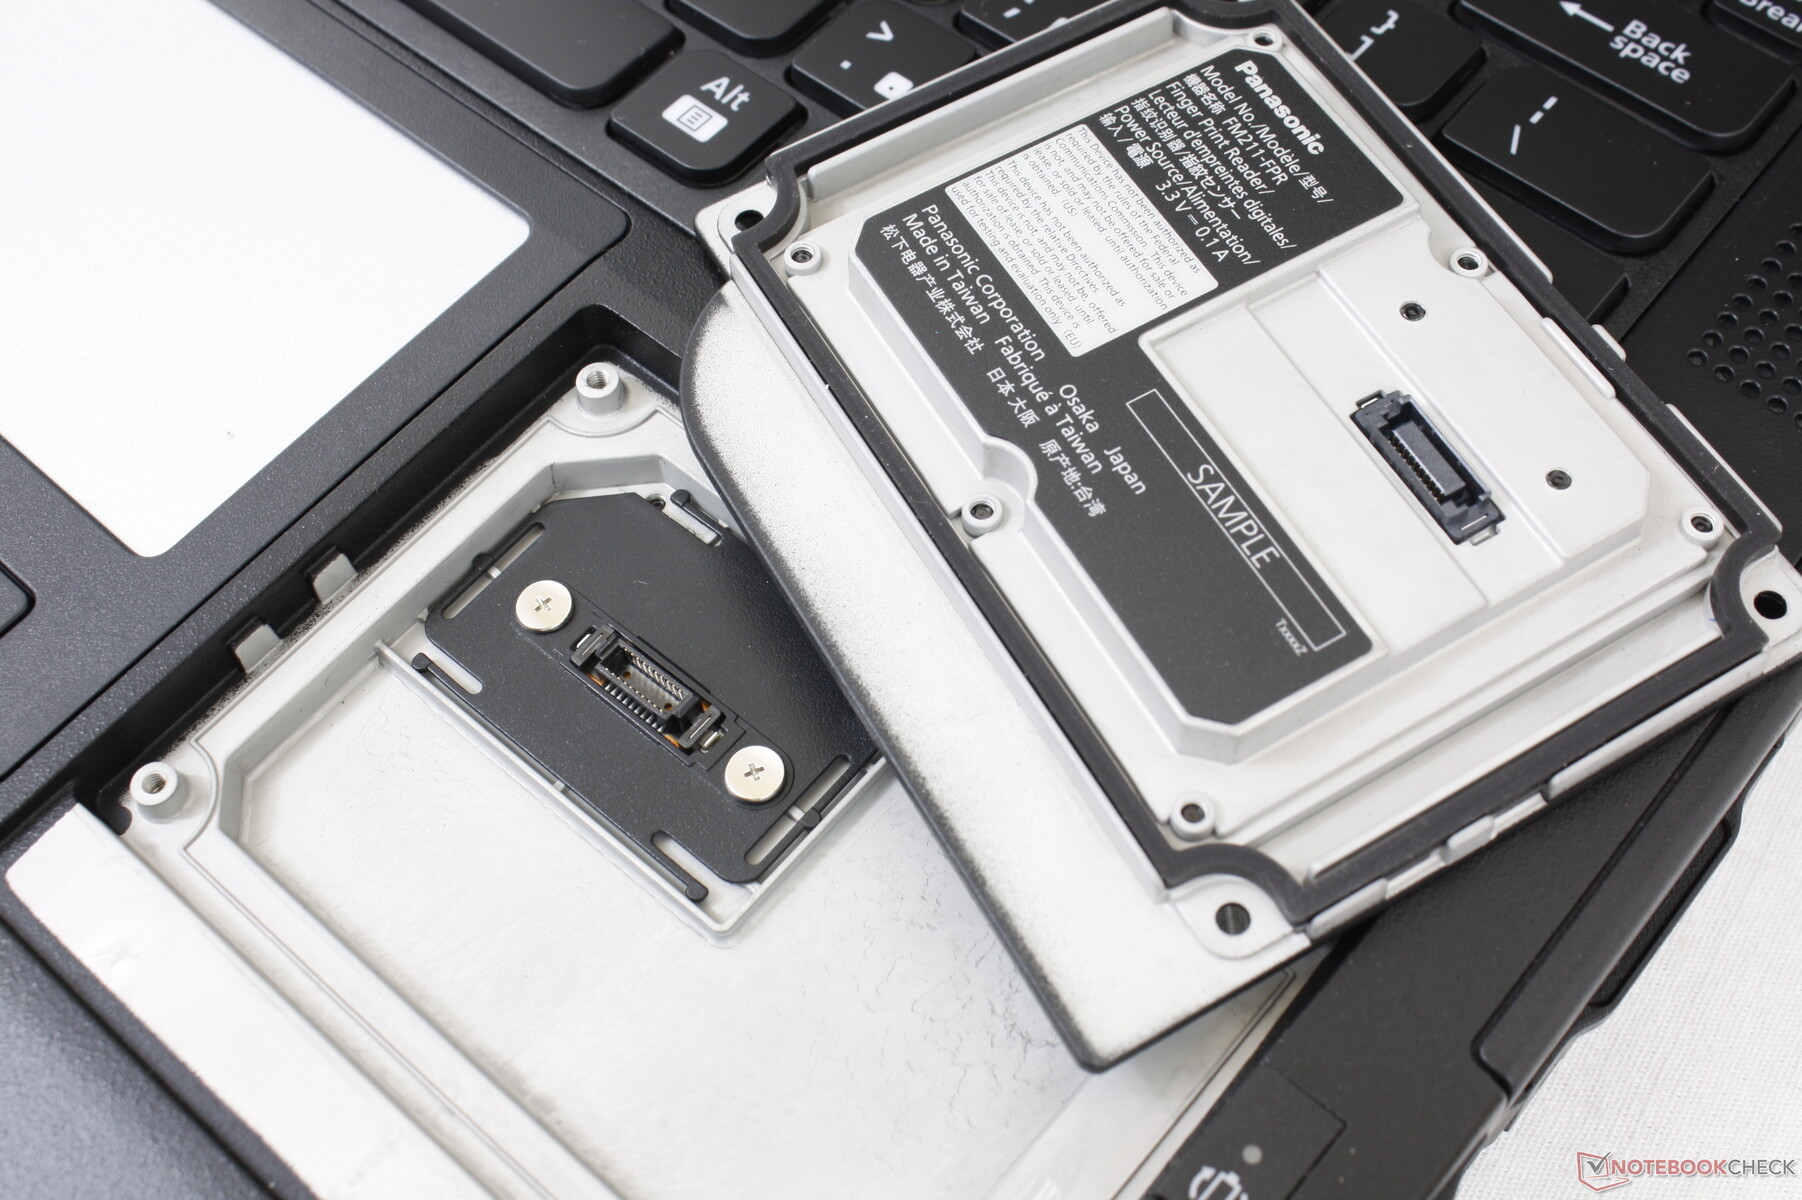
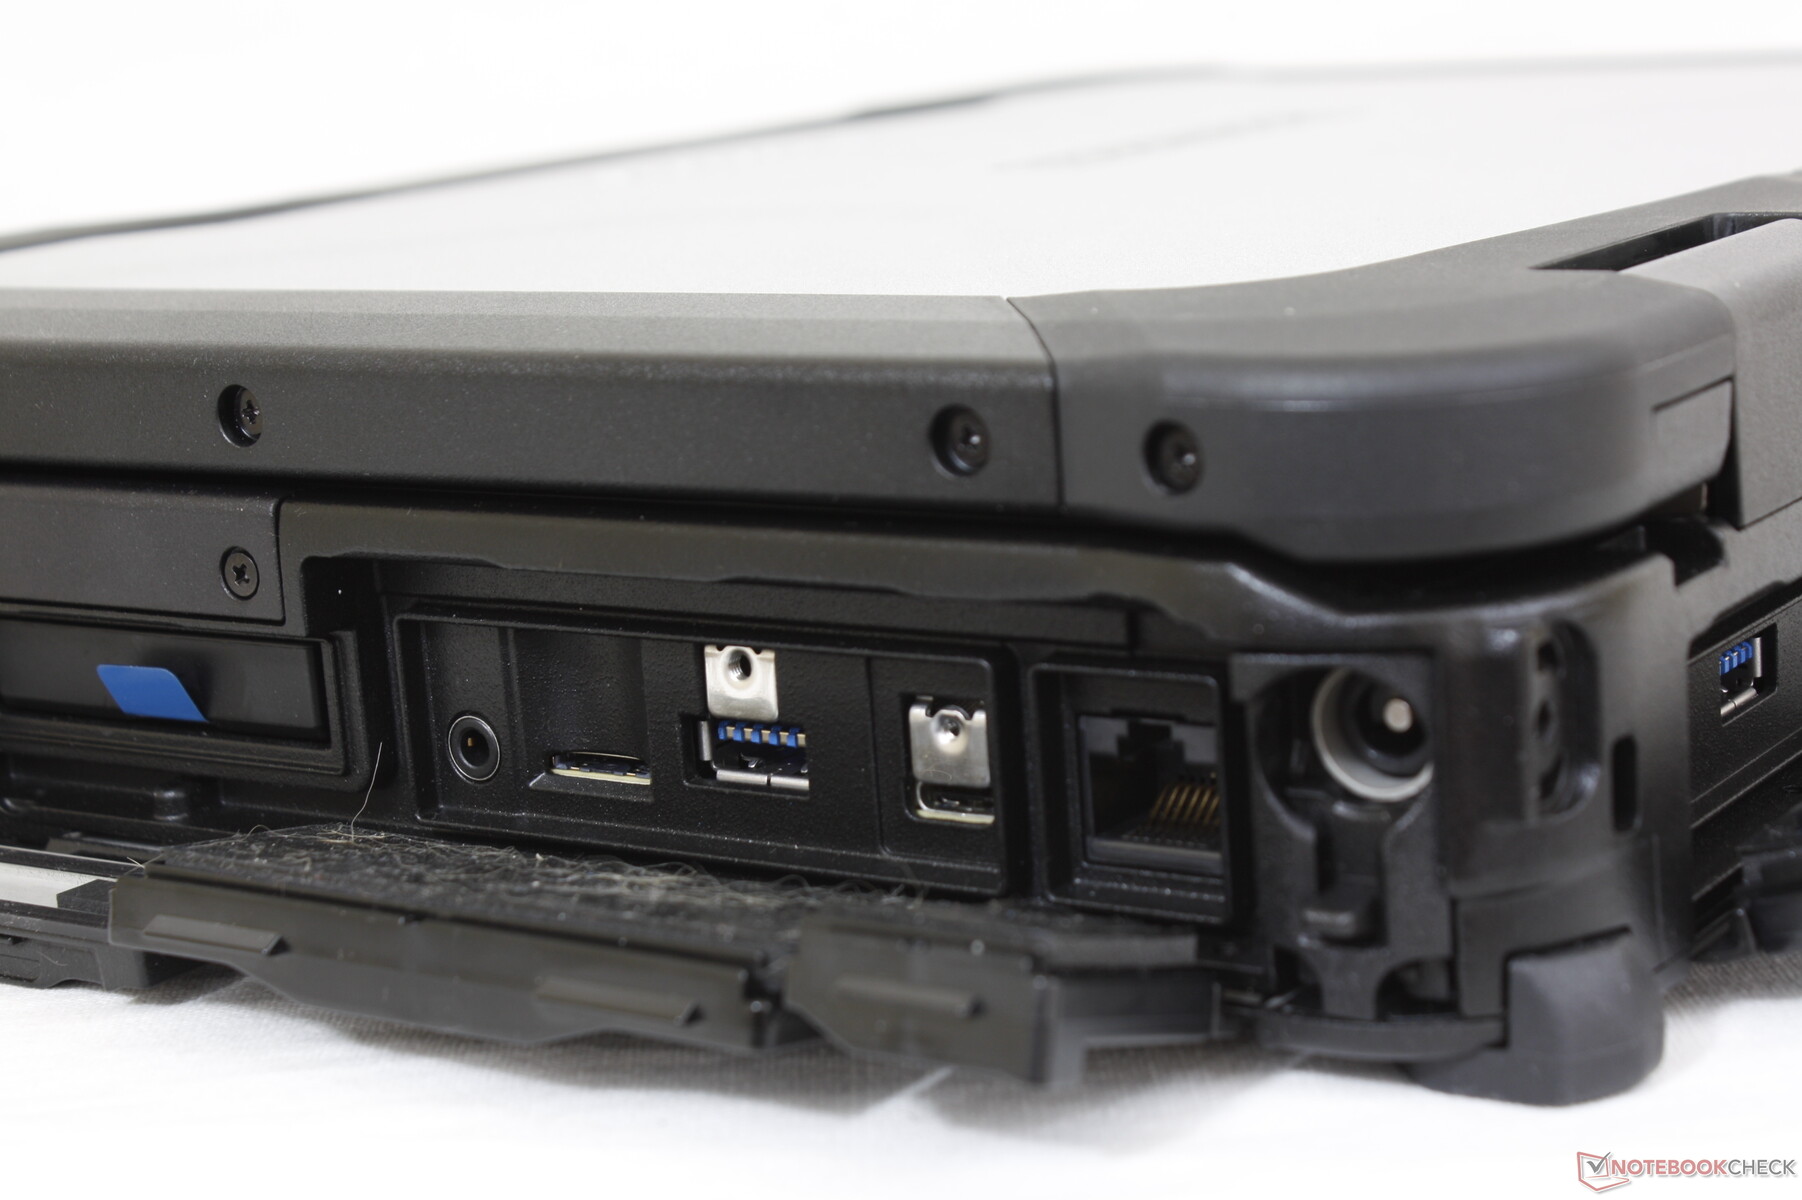
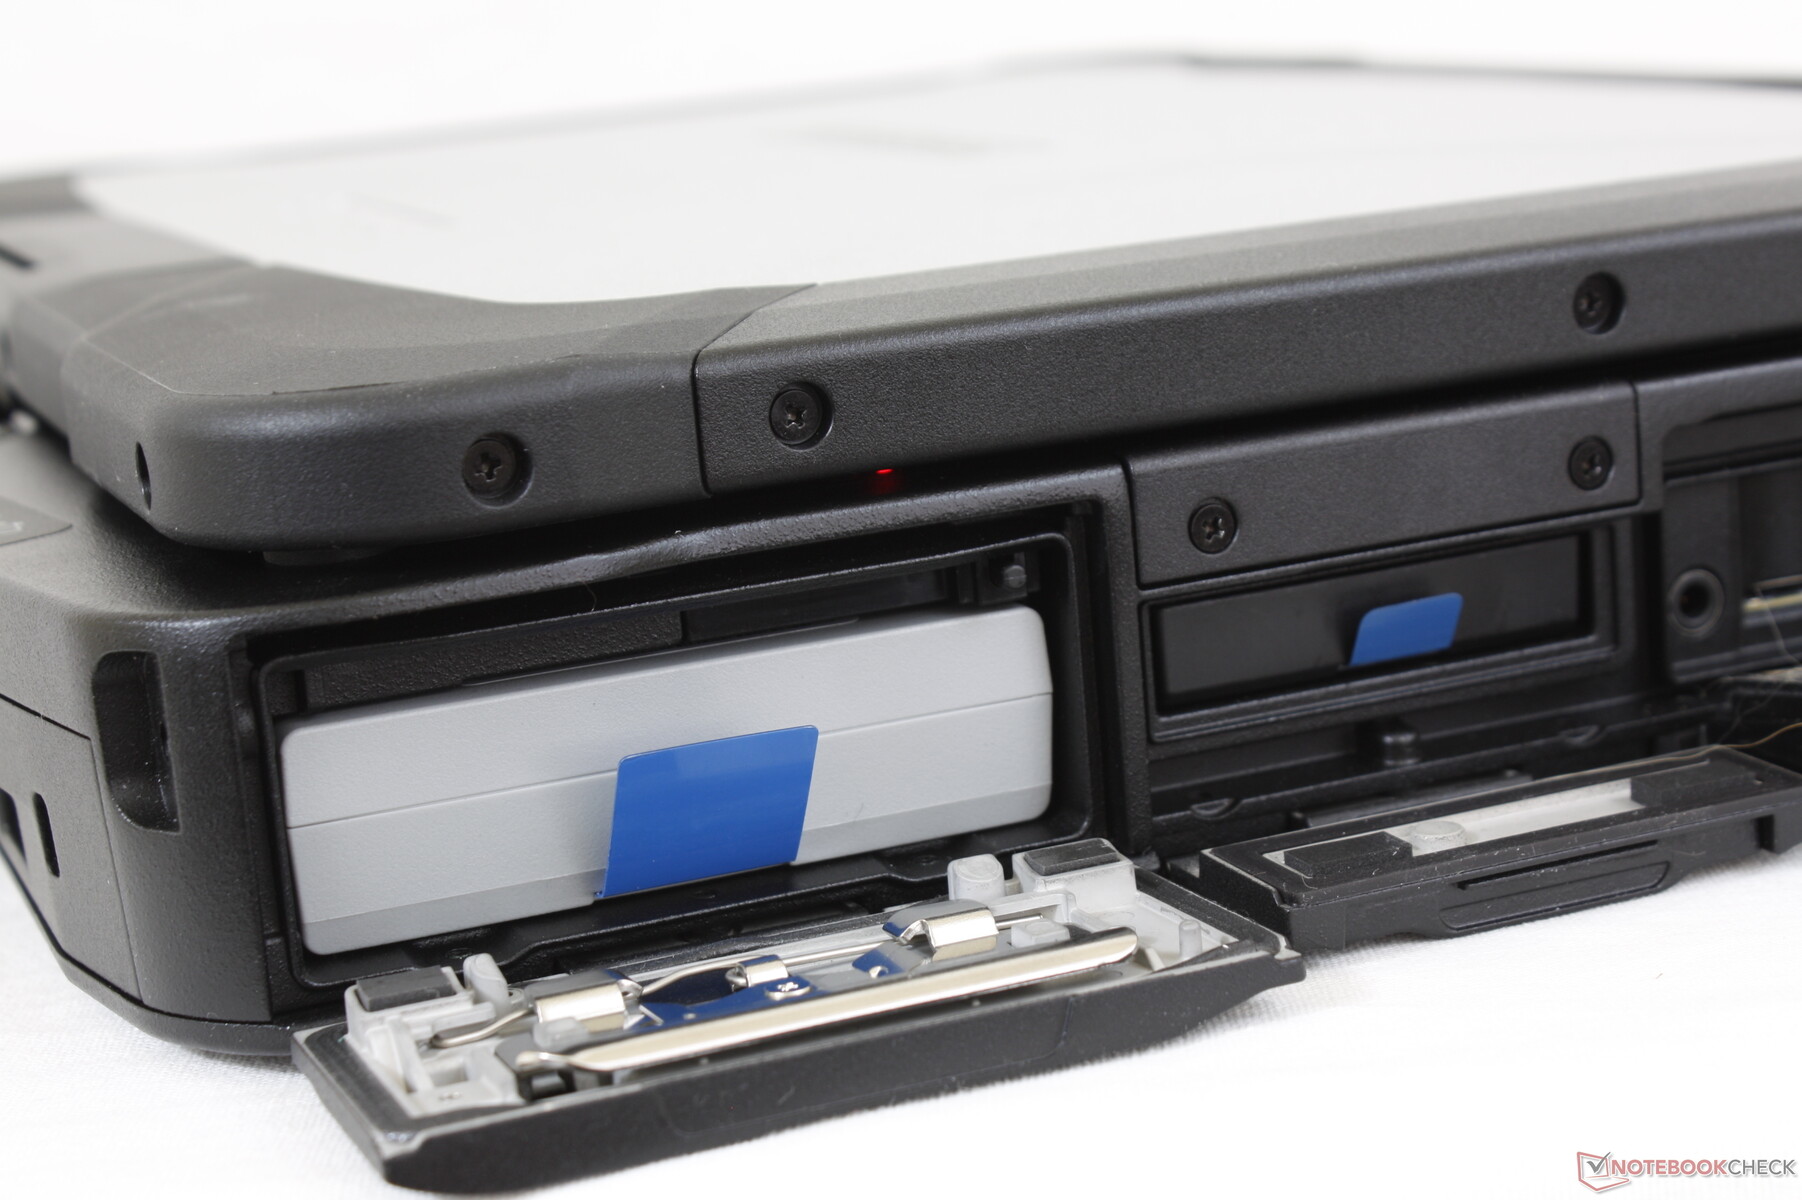
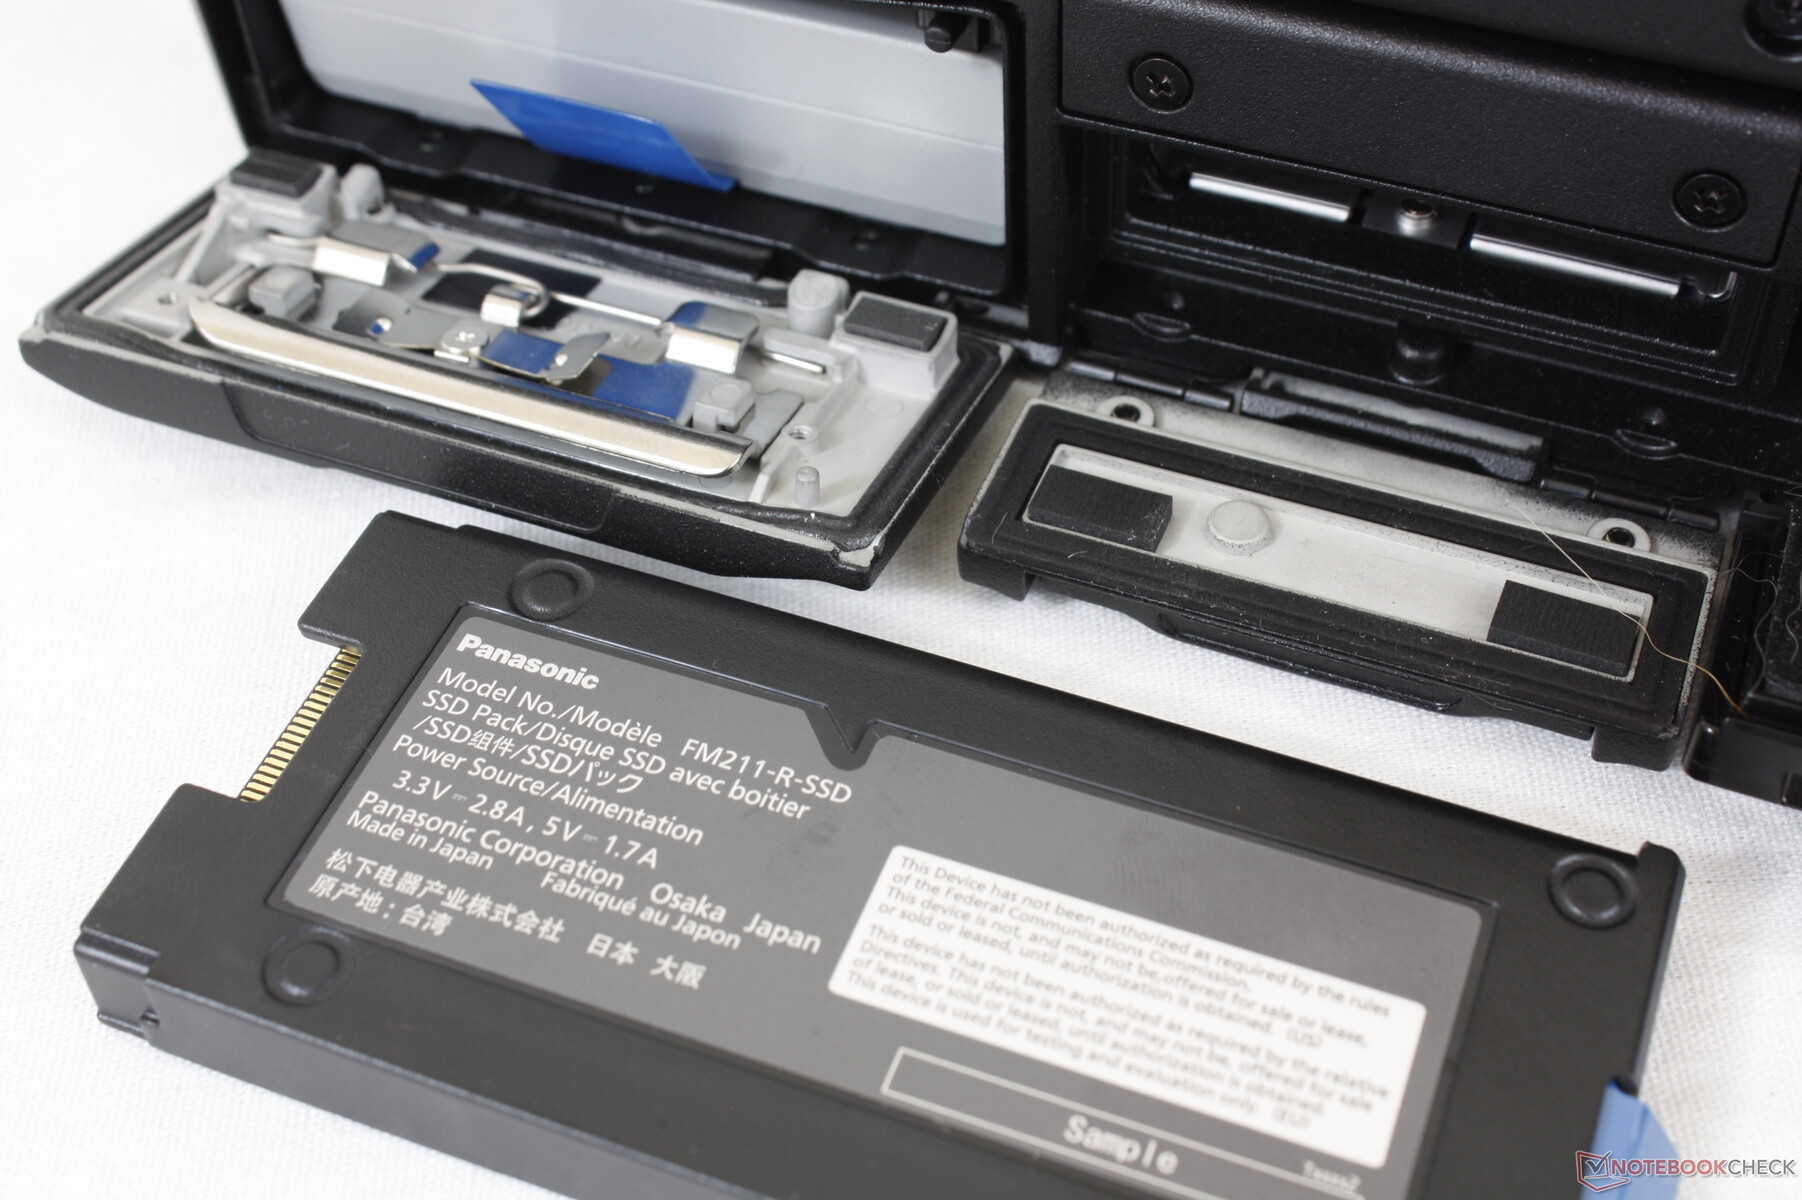
As portas intercambiáveis e as características de conectividade do Toughbook 40 são algumas das mais versáteis que já vimos em qualquer laptop. O modelo suporta até quatro cartões xPAK removíveis simultaneamente: Um na parte de trás, um na borda esquerda, um na borda direita e um debaixo do apoio de mão direito, como mostram as imagens abaixo. Se seu cenário de uso não requer HDMI, por exemplo, então o deck de porta pode ser trocado por outro que inclua um conjunto diferente de portas. A bateria primária e o SSD têm seus próprios slots ao longo da borda esquerda e da borda direita, respectivamente, mas não estão incluídos como parte dos quatro slots xPAK. Tenha em mente que cada um dos quatro slots xPAK são de tamanhos e formatos diferentes; um cartão projetado para caber em um slot não caberá em nenhum dos outros slots.
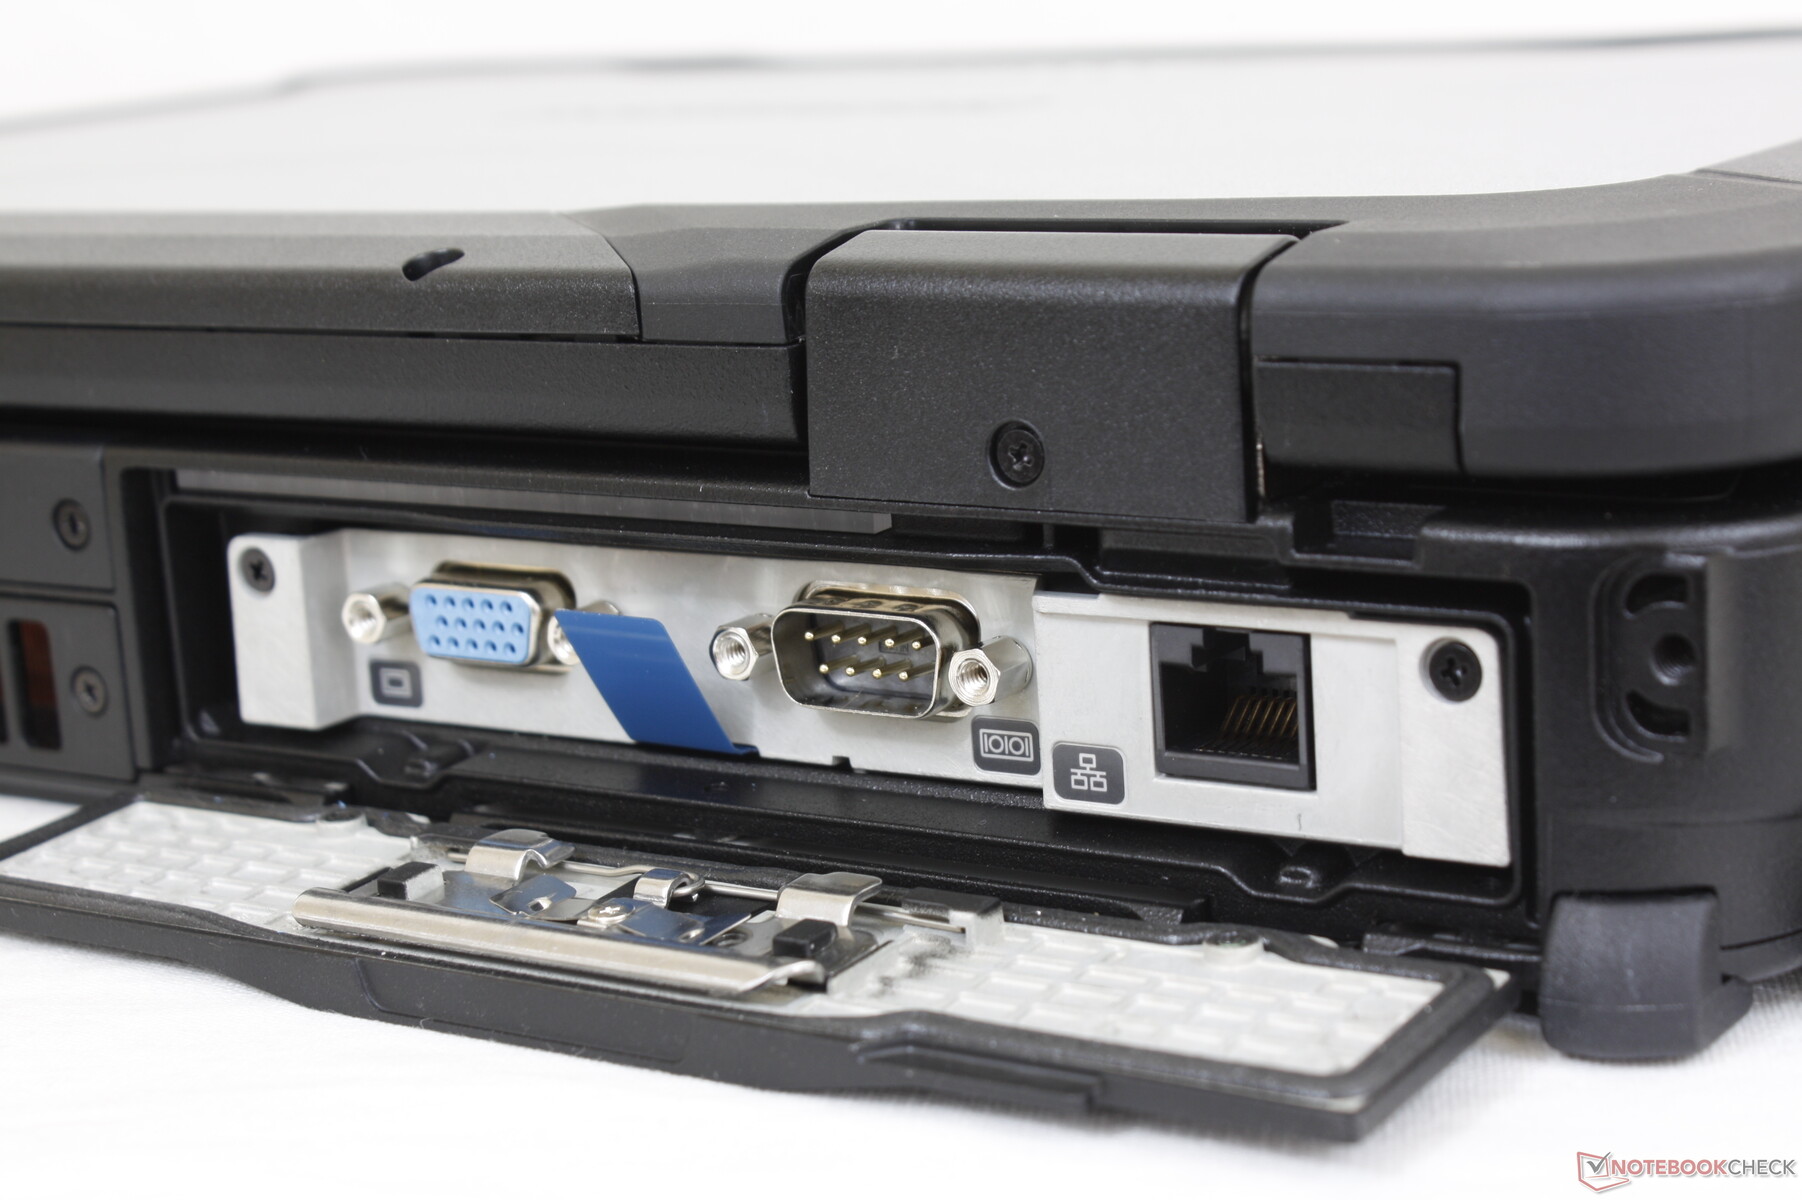
O primeiro slot é o slot de expansão traseira projetado para portas como VGA, serial, LAN, USB-A, e HDMI. O segundo slot ao longo da borda esquerda suporta drives ópticos, leitores de código de barras, leitores de Smart Card e SSDs secundários. A terceira ranhura ao longo da borda direita suporta baterias secundárias ou leitores de Smart Card. E finalmente, a ranhura para descanso da palma da mão suporta leitores de impressões digitais e outras características de segurança. O fabricante planeja produzir cartões de expansão adicionais para várias finalidades num futuro próximo.
Um problema complicado com todos estes slots é que as abas que os cobrem são muito finas e difíceis de abrir e trancar, especialmente se você tiver mãos menores ou dedos oleosos. Simplesmente não há aderência suficiente sobre estas abas para torná-las confortáveis de usar. As tampas ao longo das bordas do Dell Latitude 7330 Resistente são muito mais fáceis de segurar e manusear em comparação.

Leitor de cartões SD
| SD Card Reader | |
| average JPG Copy Test (av. of 3 runs) | |
| Dell Latitude 5420 Rugged-P85G (Toshiba Exceria Pro SDXC 64 GB UHS-II) | |
| Panasonic Toughbook FZ-55 MK2 (AV Pro V60) | |
| Panasonic Toughbook 40 (AV Pro V60) | |
| Acer Enduro Urban N3 EUN314 (AV Pro V60) | |
| Durabook S14I (Angelbird 128GB AV Pro UHS-II) | |
| maximum AS SSD Seq Read Test (1GB) | |
| Dell Latitude 5420 Rugged-P85G (Toshiba Exceria Pro SDXC 64 GB UHS-II) | |
| Panasonic Toughbook FZ-55 MK2 (AV Pro V60) | |
| Panasonic Toughbook 40 (AV Pro V60) | |
| Durabook S14I (Angelbird 128GB AV Pro UHS-II) | |
| Acer Enduro Urban N3 EUN314 (AV Pro V60) | |
Comunicação
Um Intel AX201 vem como padrão para conectividade Wi-Fi 6. Não há opções de Wi-Fi 6E a partir desta escrita
Opcionais 4G LTE e até 5G são opções disponíveis.
| Networking | |
| iperf3 transmit AX12 | |
| Acer Enduro Urban N3 EUN314 | |
| Panasonic Toughbook FZ-55 MK2 | |
| Durabook S14I | |
| Getac S410 Gen 4 | |
| Dell Latitude 5420 Rugged-P85G | |
| iperf3 receive AX12 | |
| Durabook S14I | |
| Acer Enduro Urban N3 EUN314 | |
| Panasonic Toughbook FZ-55 MK2 | |
| Getac S410 Gen 4 | |
| Dell Latitude 5420 Rugged-P85G | |
| iperf3 receive AXE11000 | |
| Panasonic Toughbook 40 | |
| iperf3 transmit AXE11000 | |
| Panasonic Toughbook 40 | |
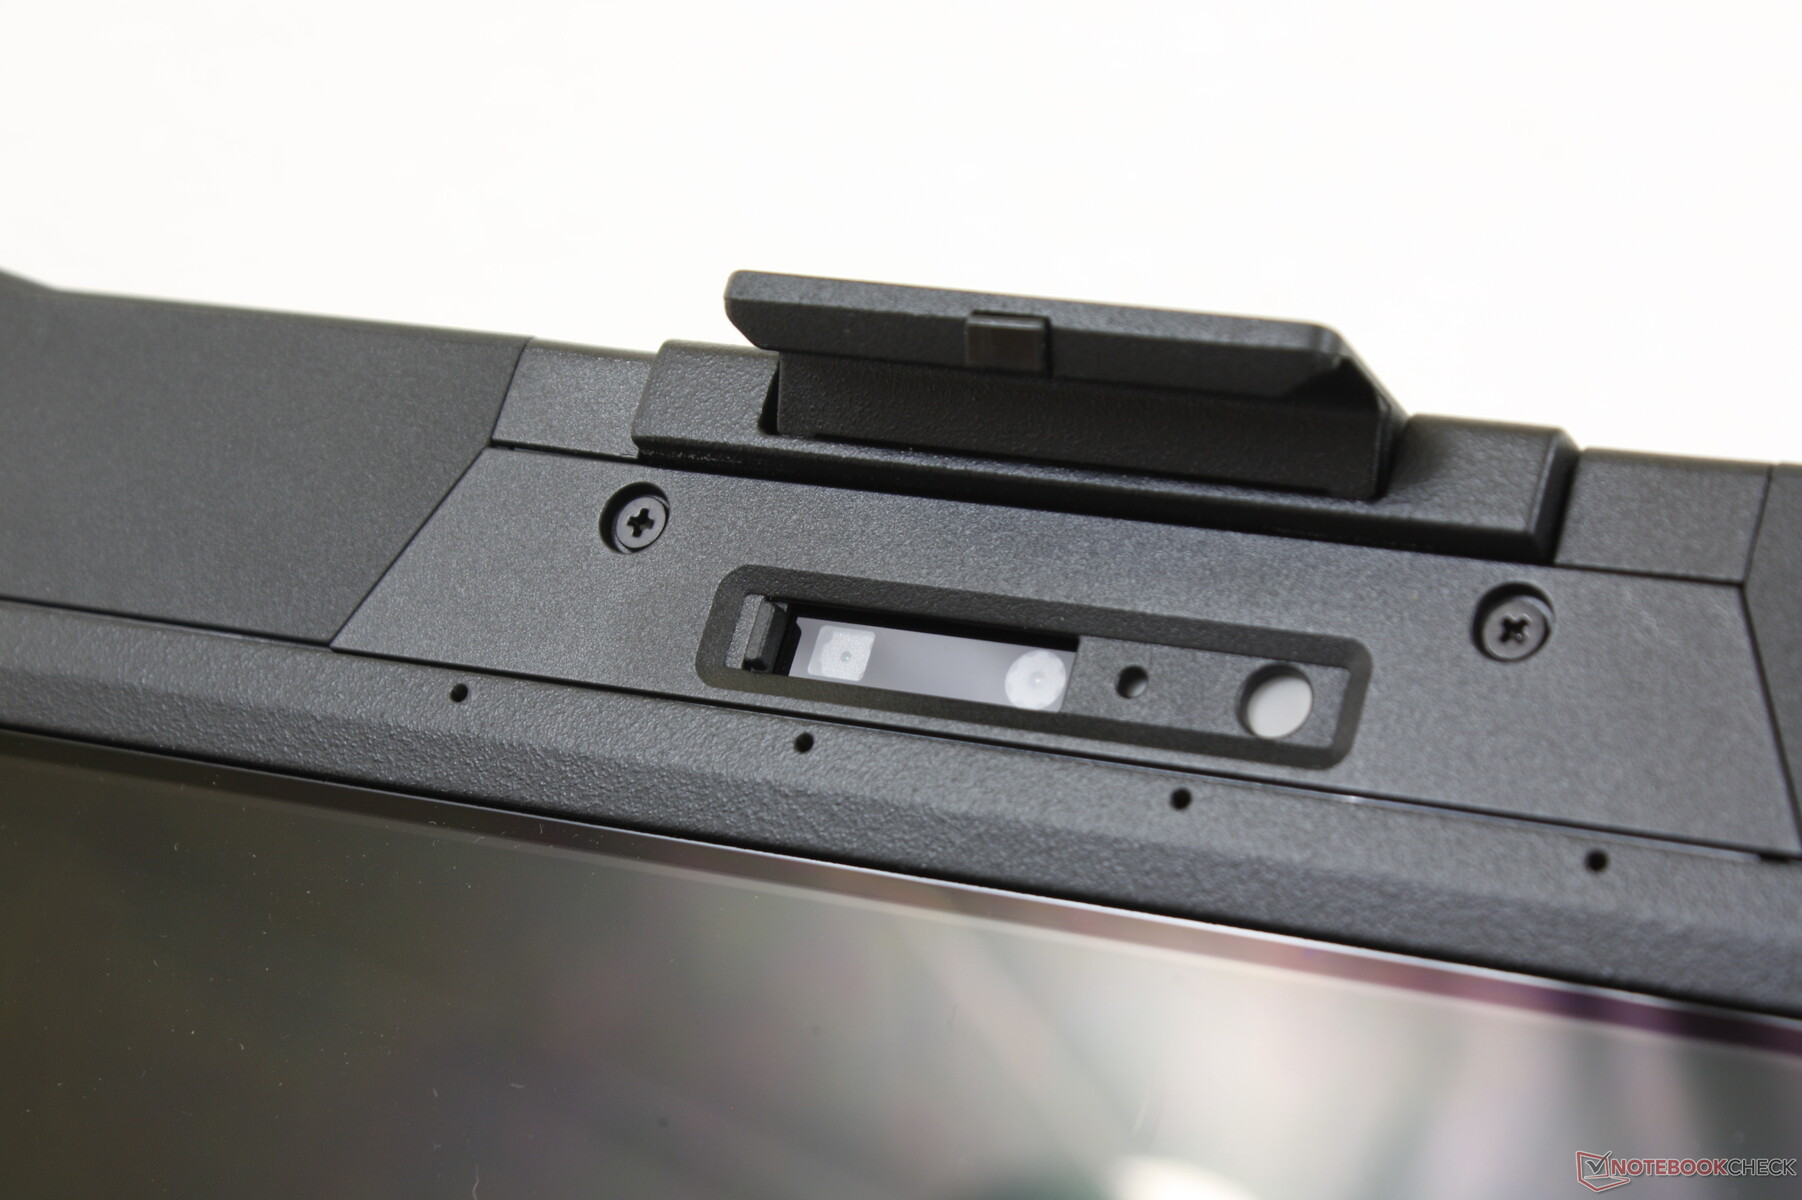
Webcam
A câmera de 5 MP é mais nítida do que na maioria dos outros laptops onde 2 MP ou menos são comuns. IR está presente para suporte ao Windows Olá.


Manutenção
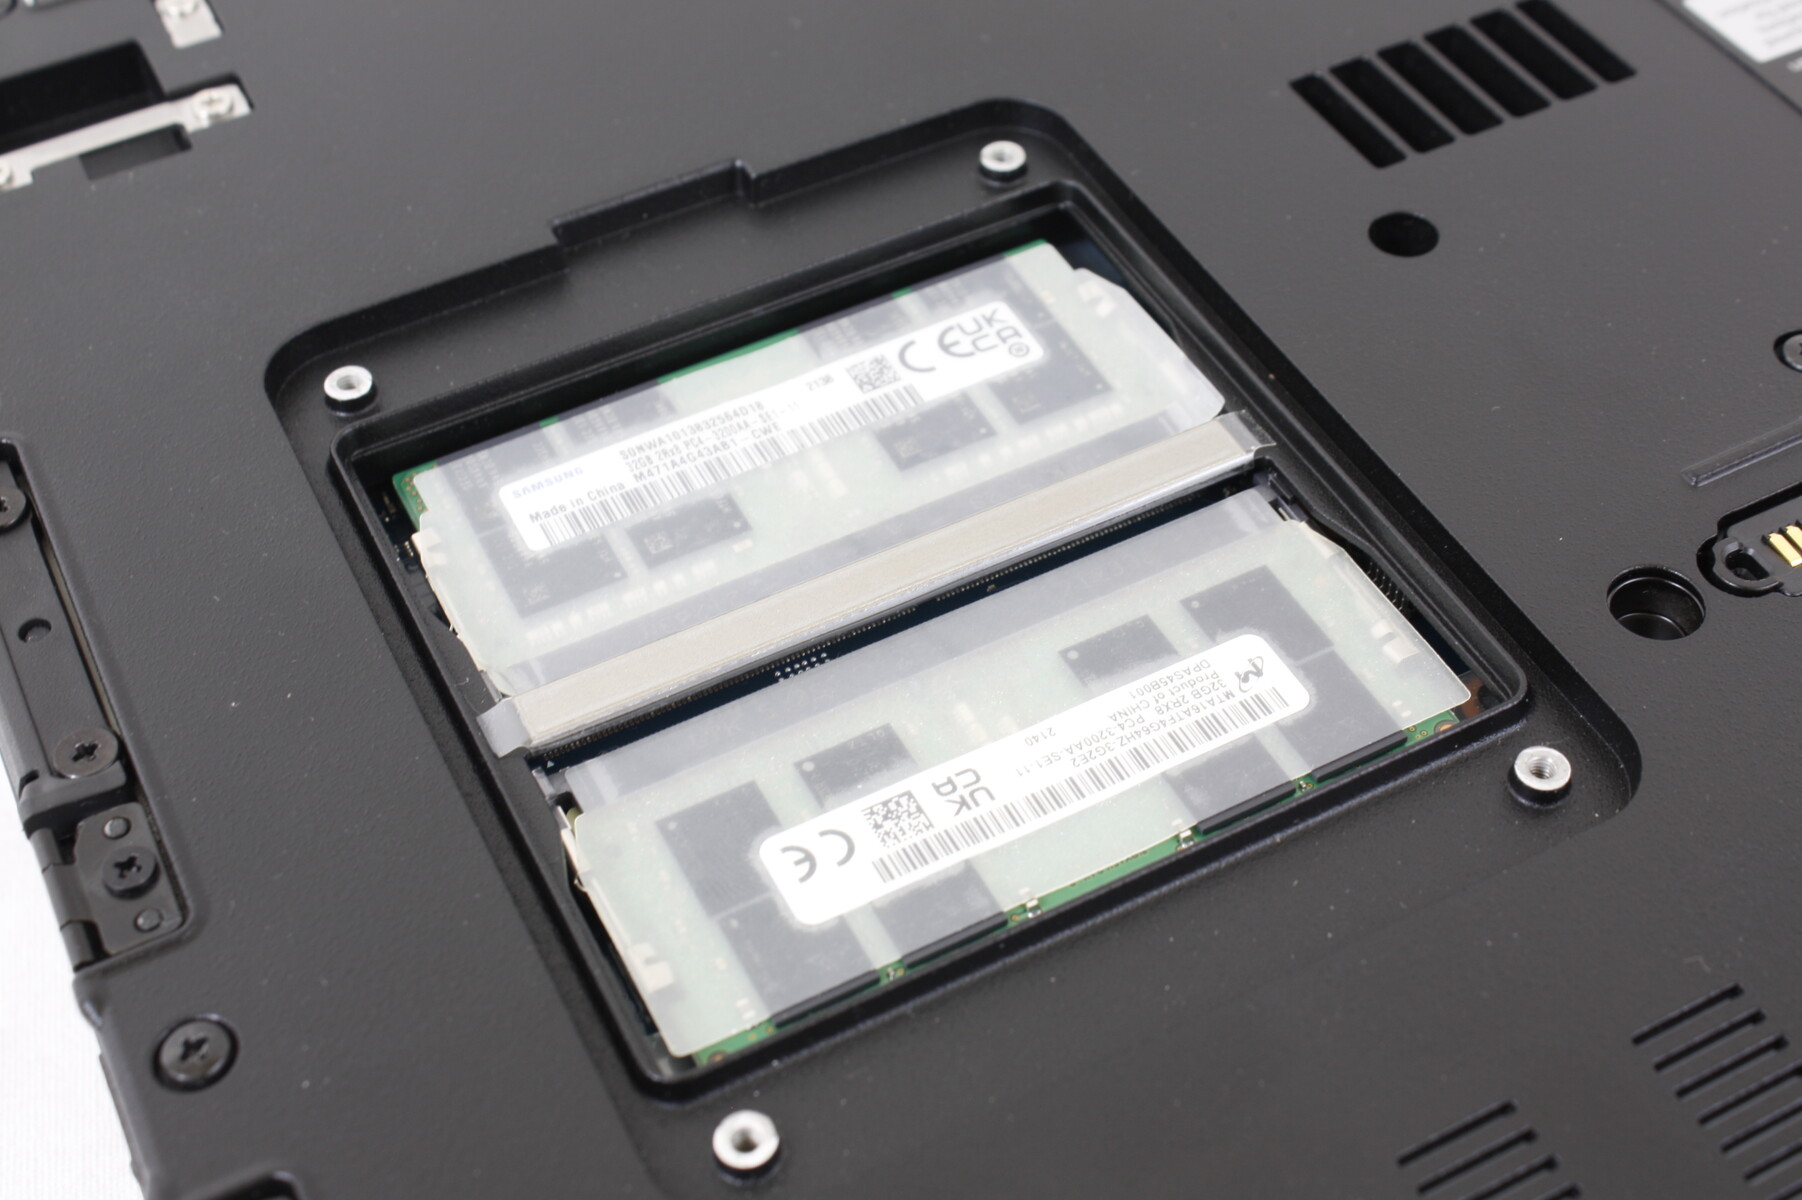
O painel inferior não foi projetado para ser facilmente removido pelo usuário. Em vez disso, uma pequena escotilha é embutida para acessar os 2x slots DDR4 SODIMM.
Acessórios e Garantia
Um estilete passivo fica dentro da alça ao longo da parte frontal da unidade. A Panasonic oferece uma ampla gama de acessórios para seus modelos de laptop, conforme detalhado aqui.
Aplica-se uma garantia padrão limitada de três anos do fabricante.
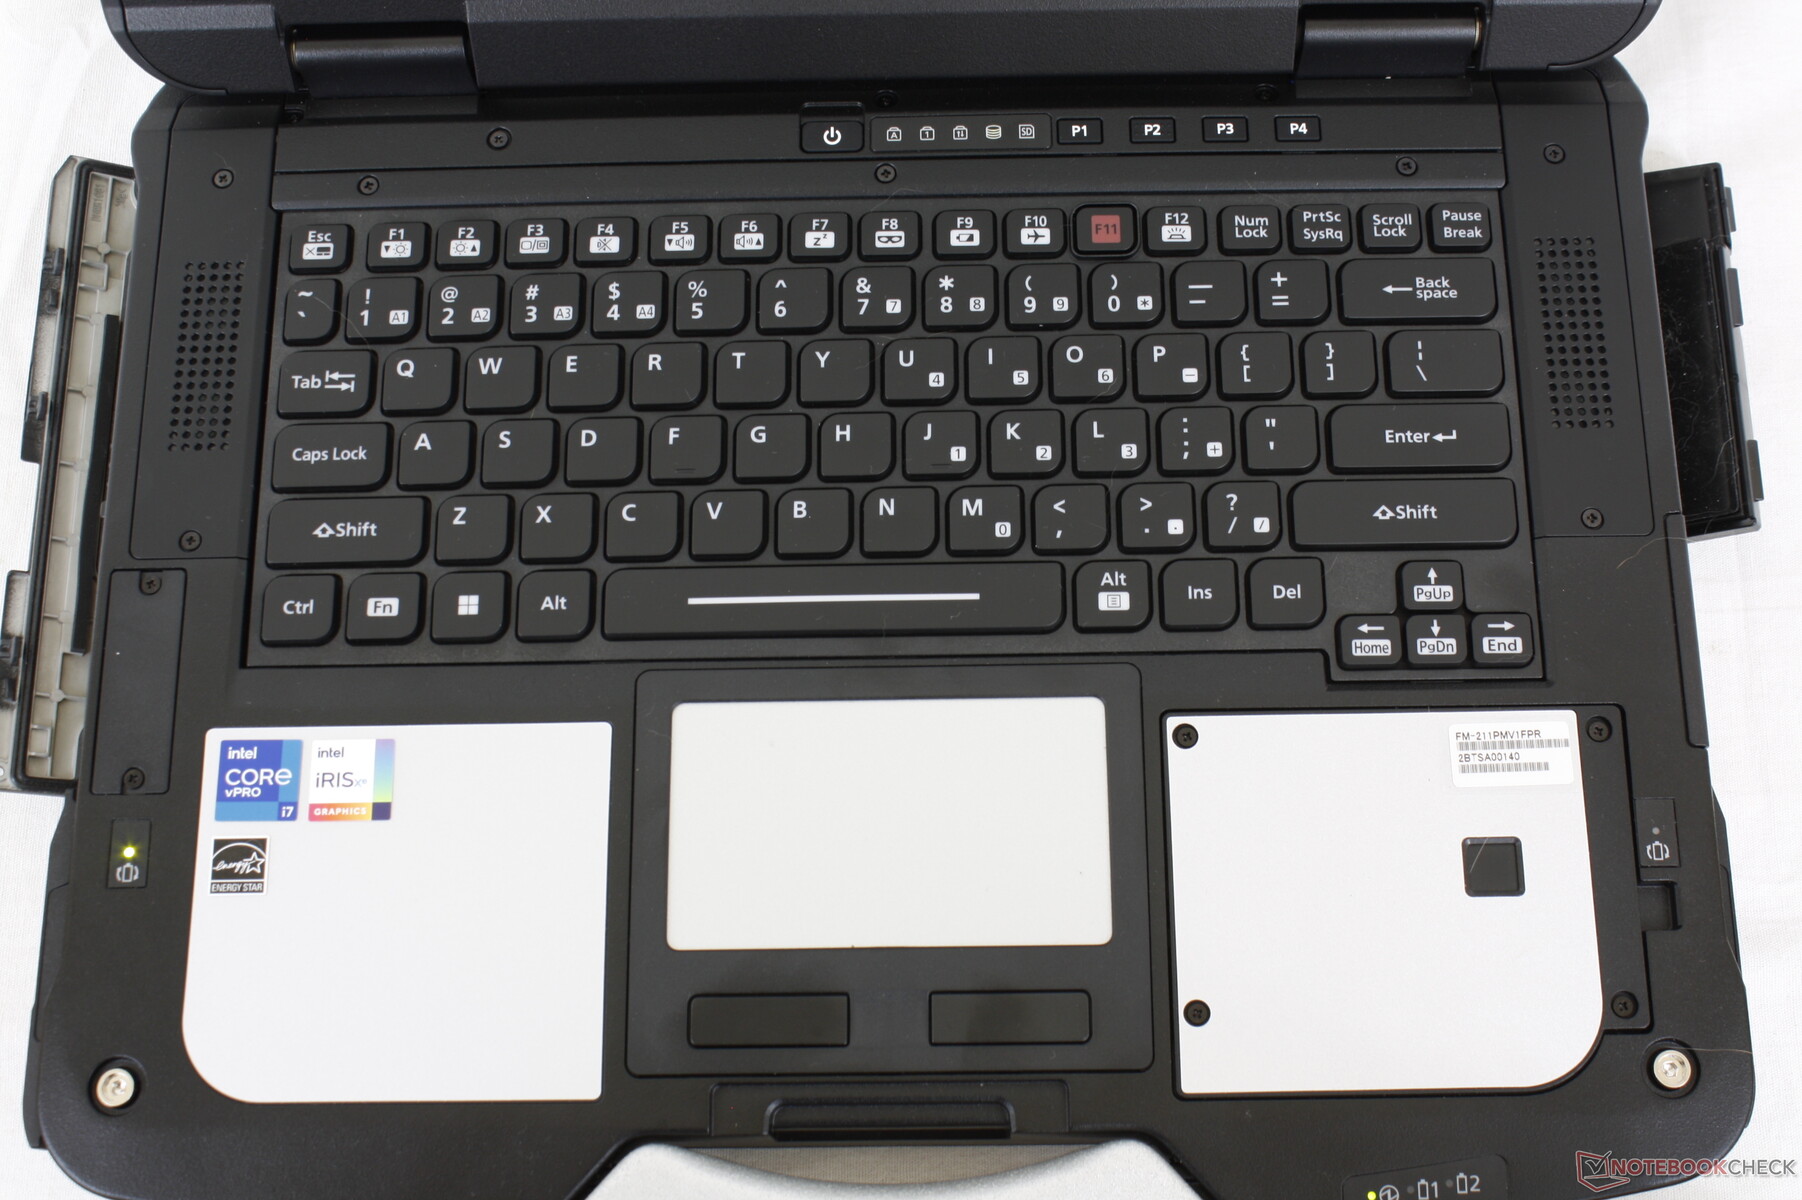
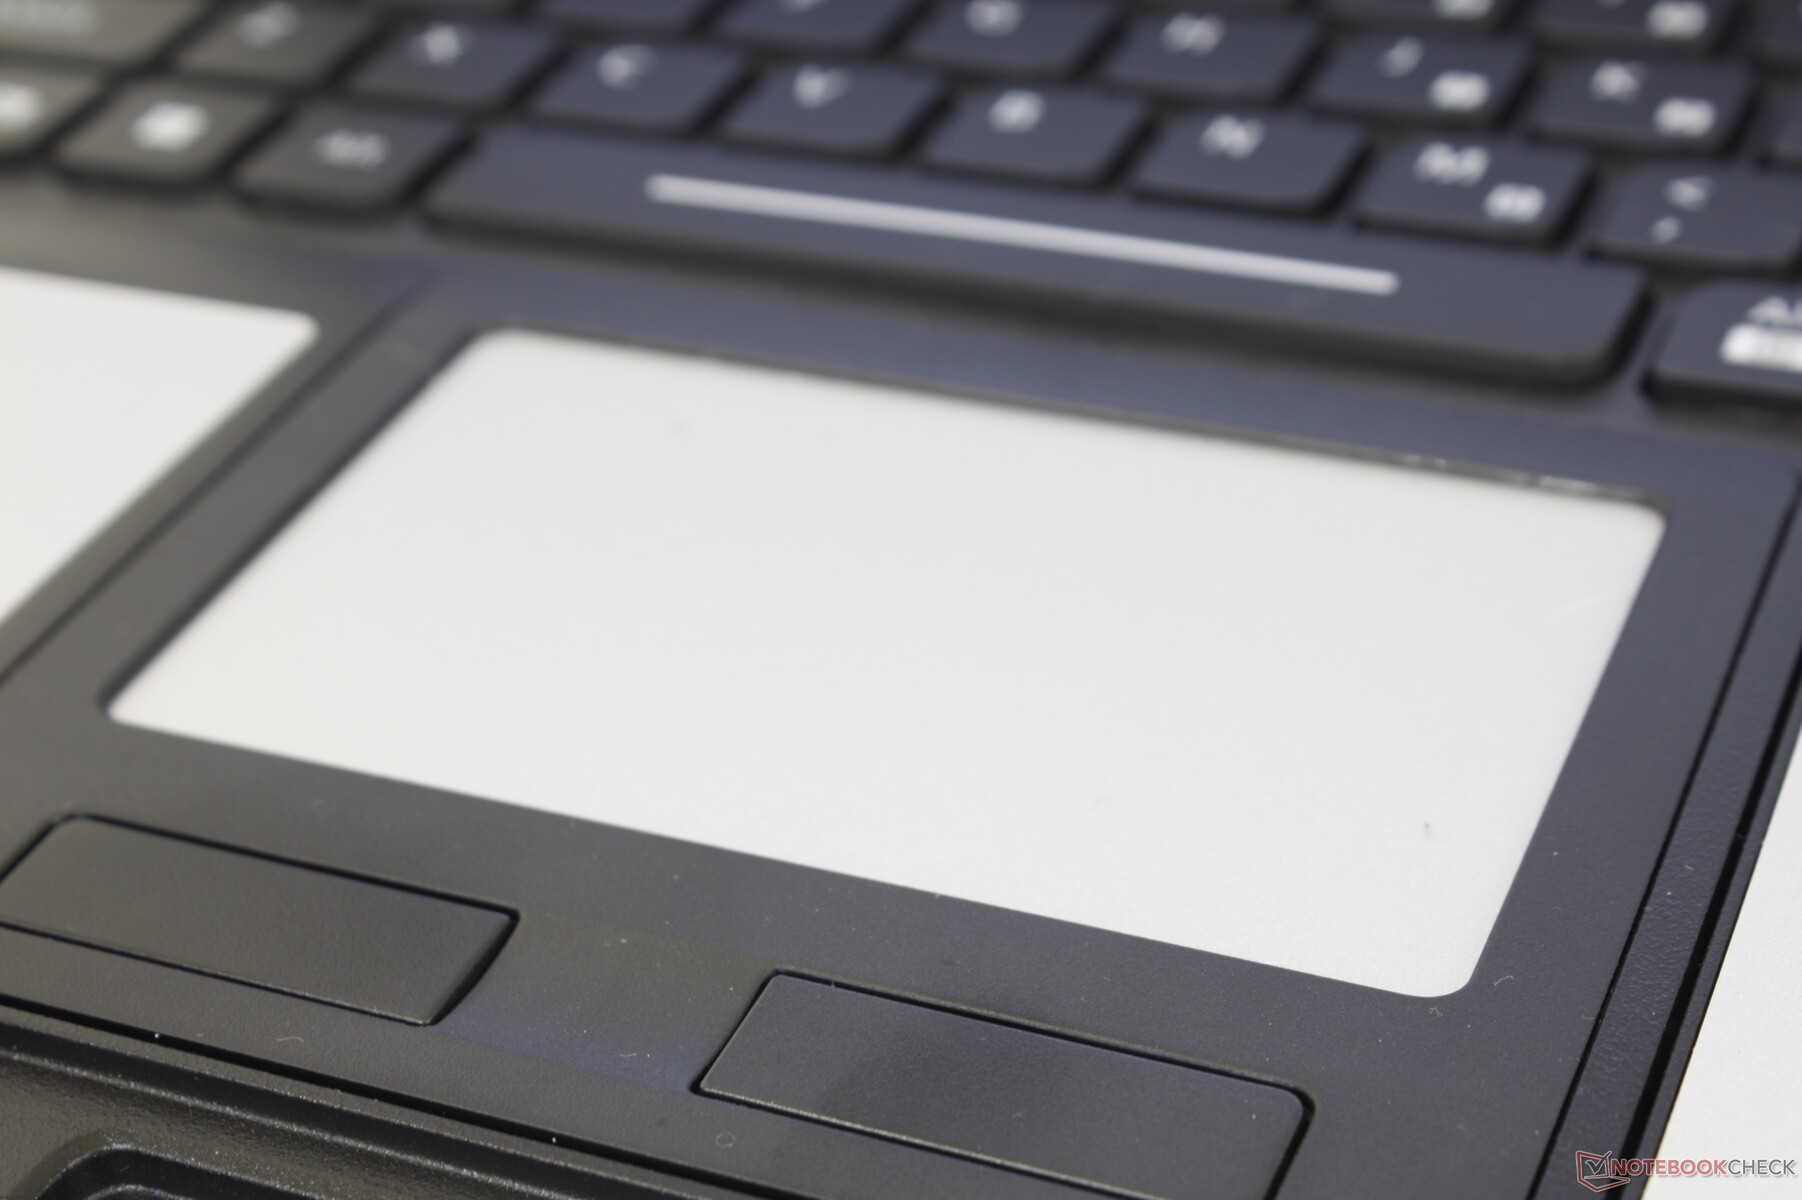
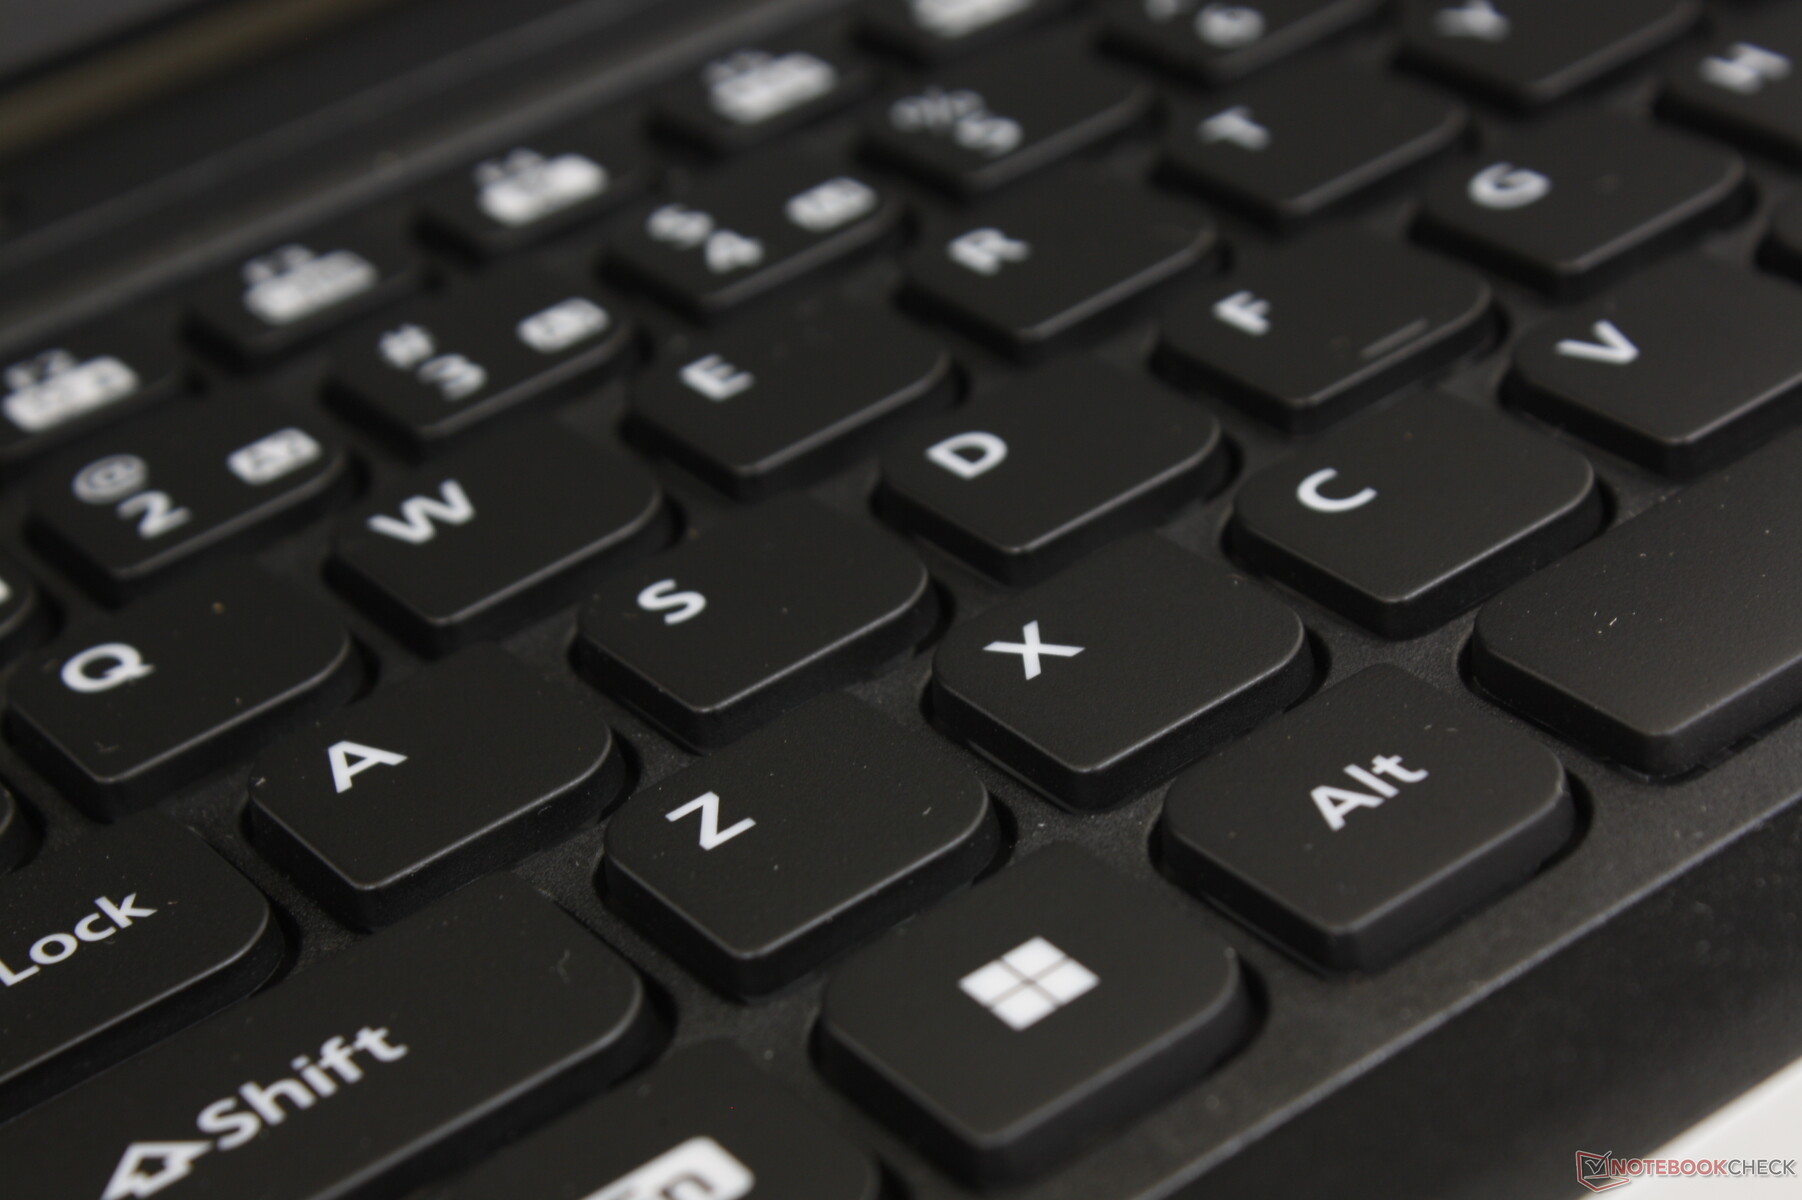
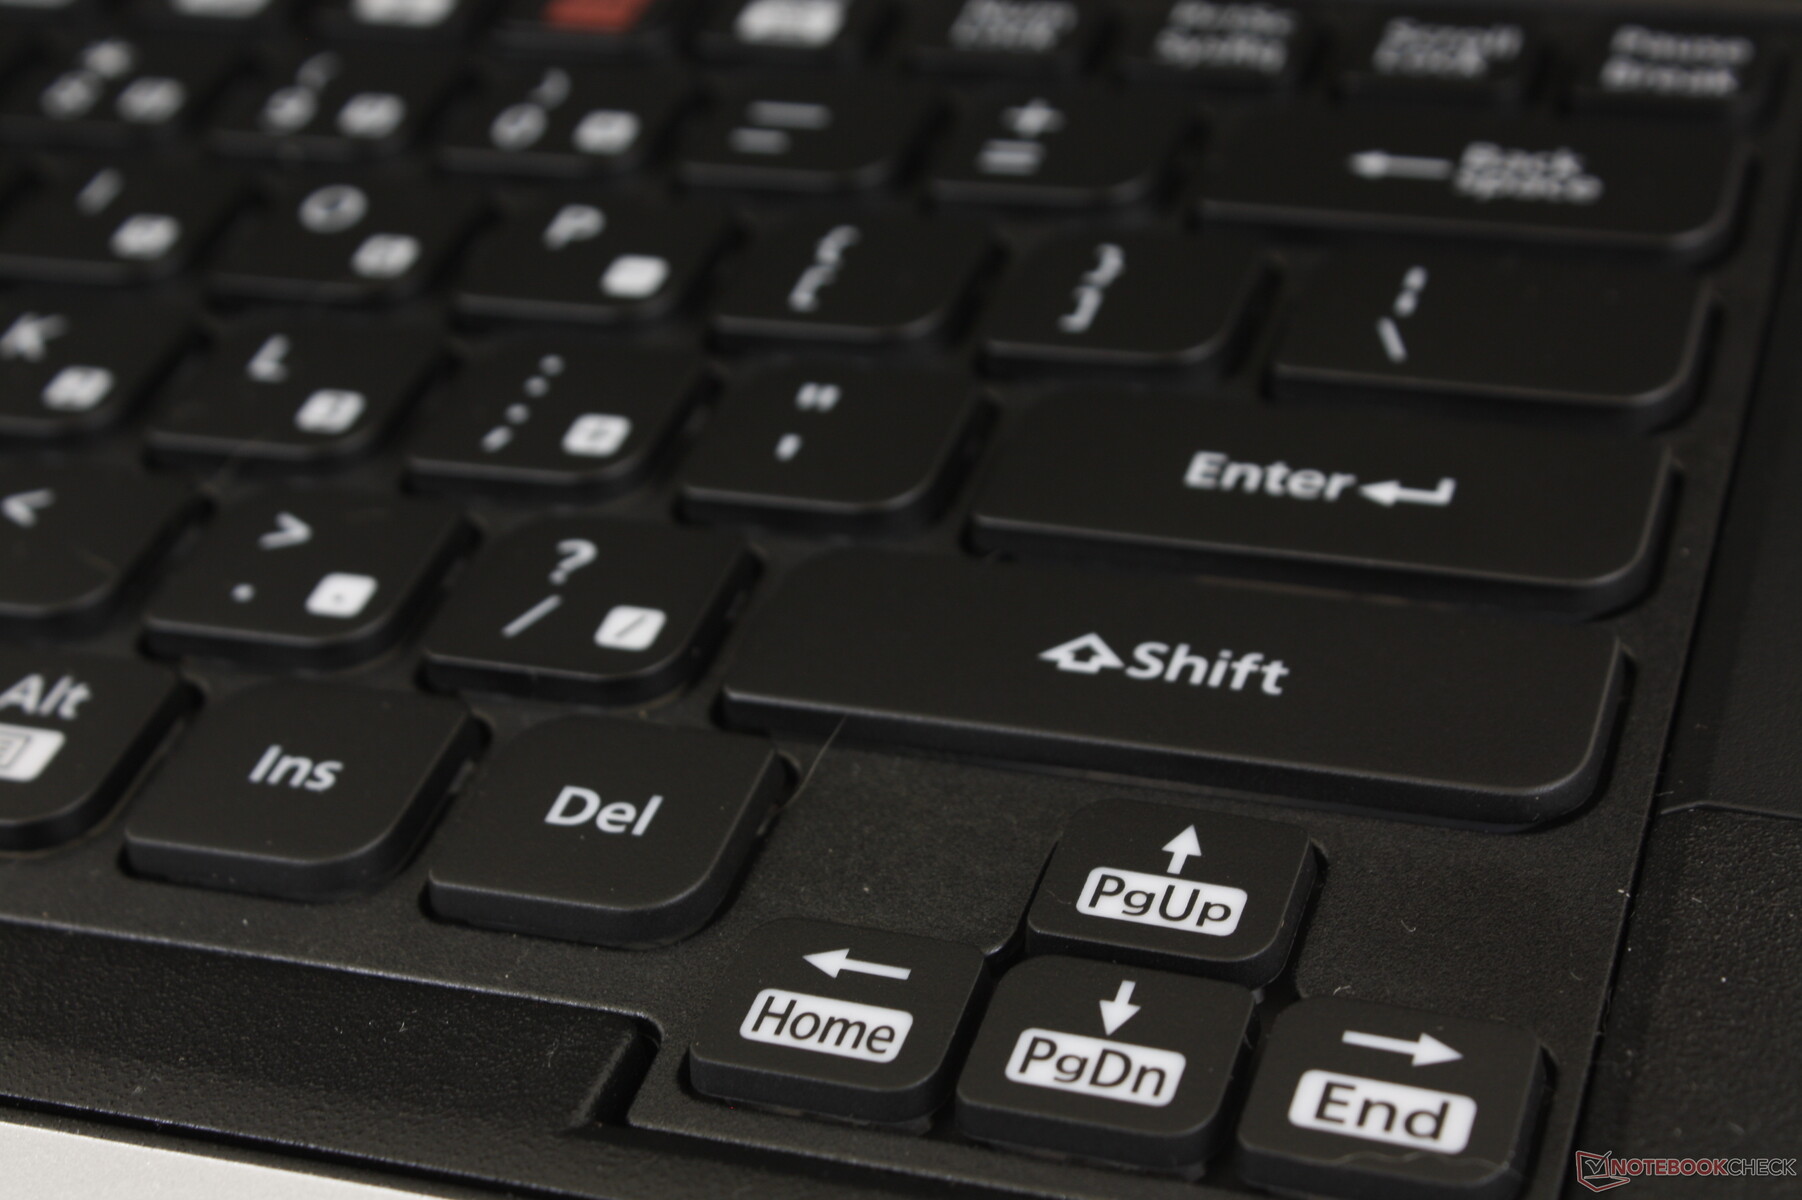
Dispositivos de entrada
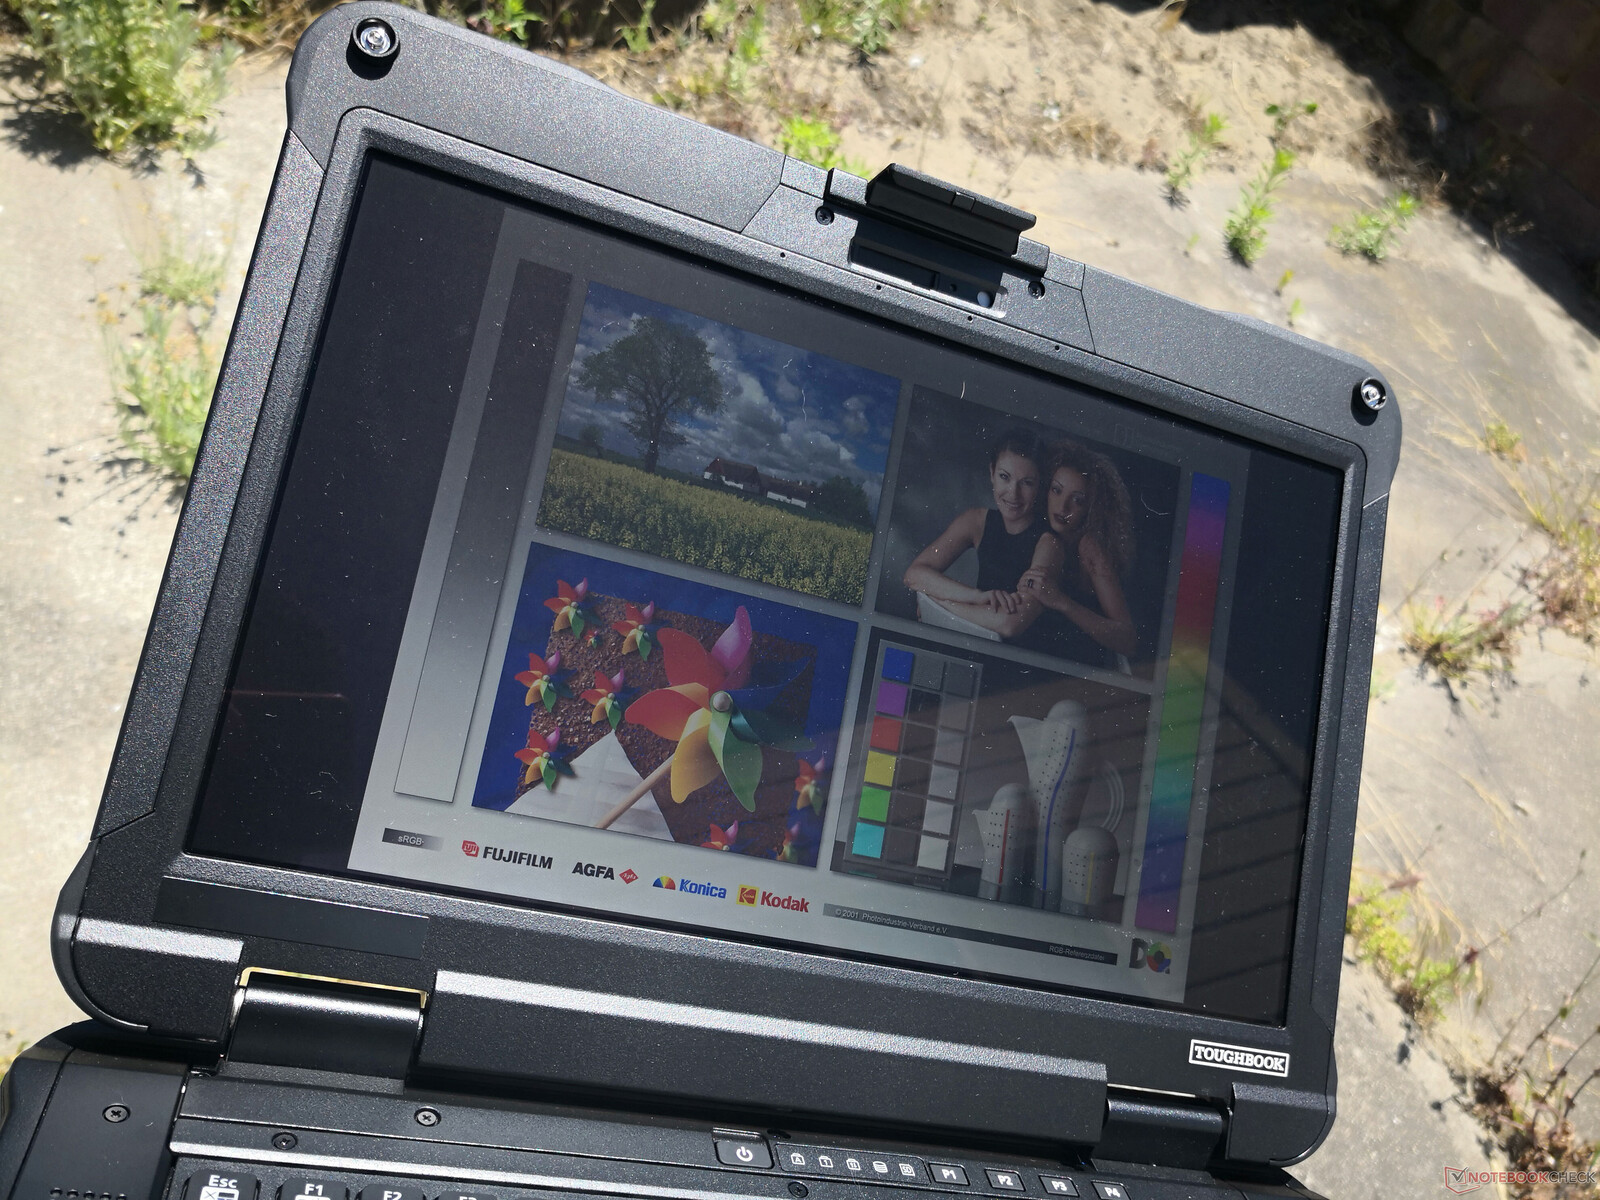
Mostrar
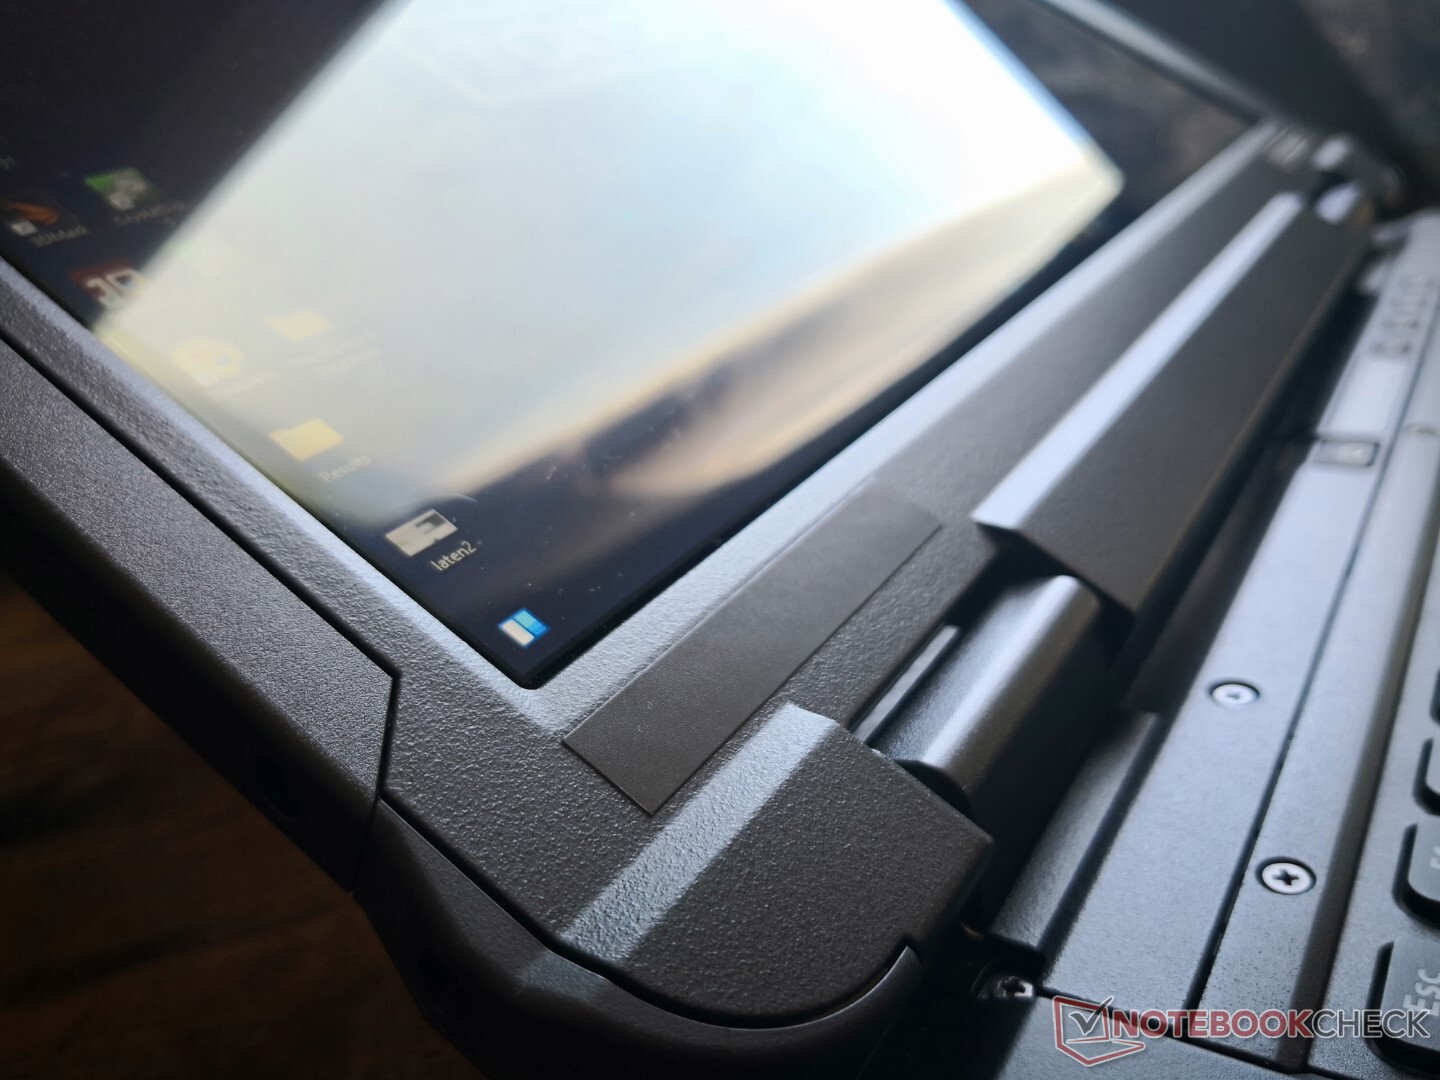
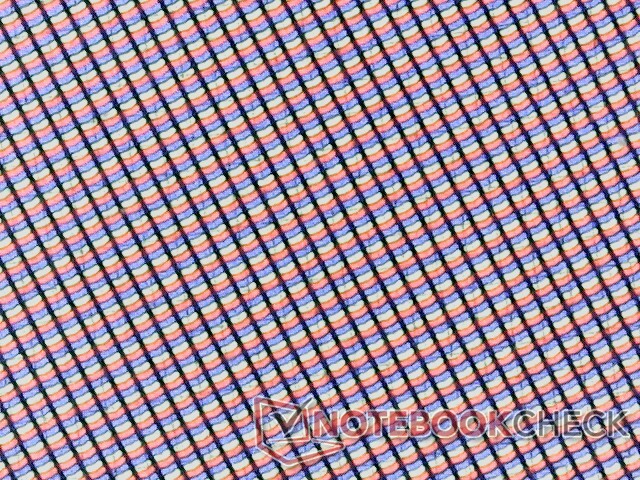
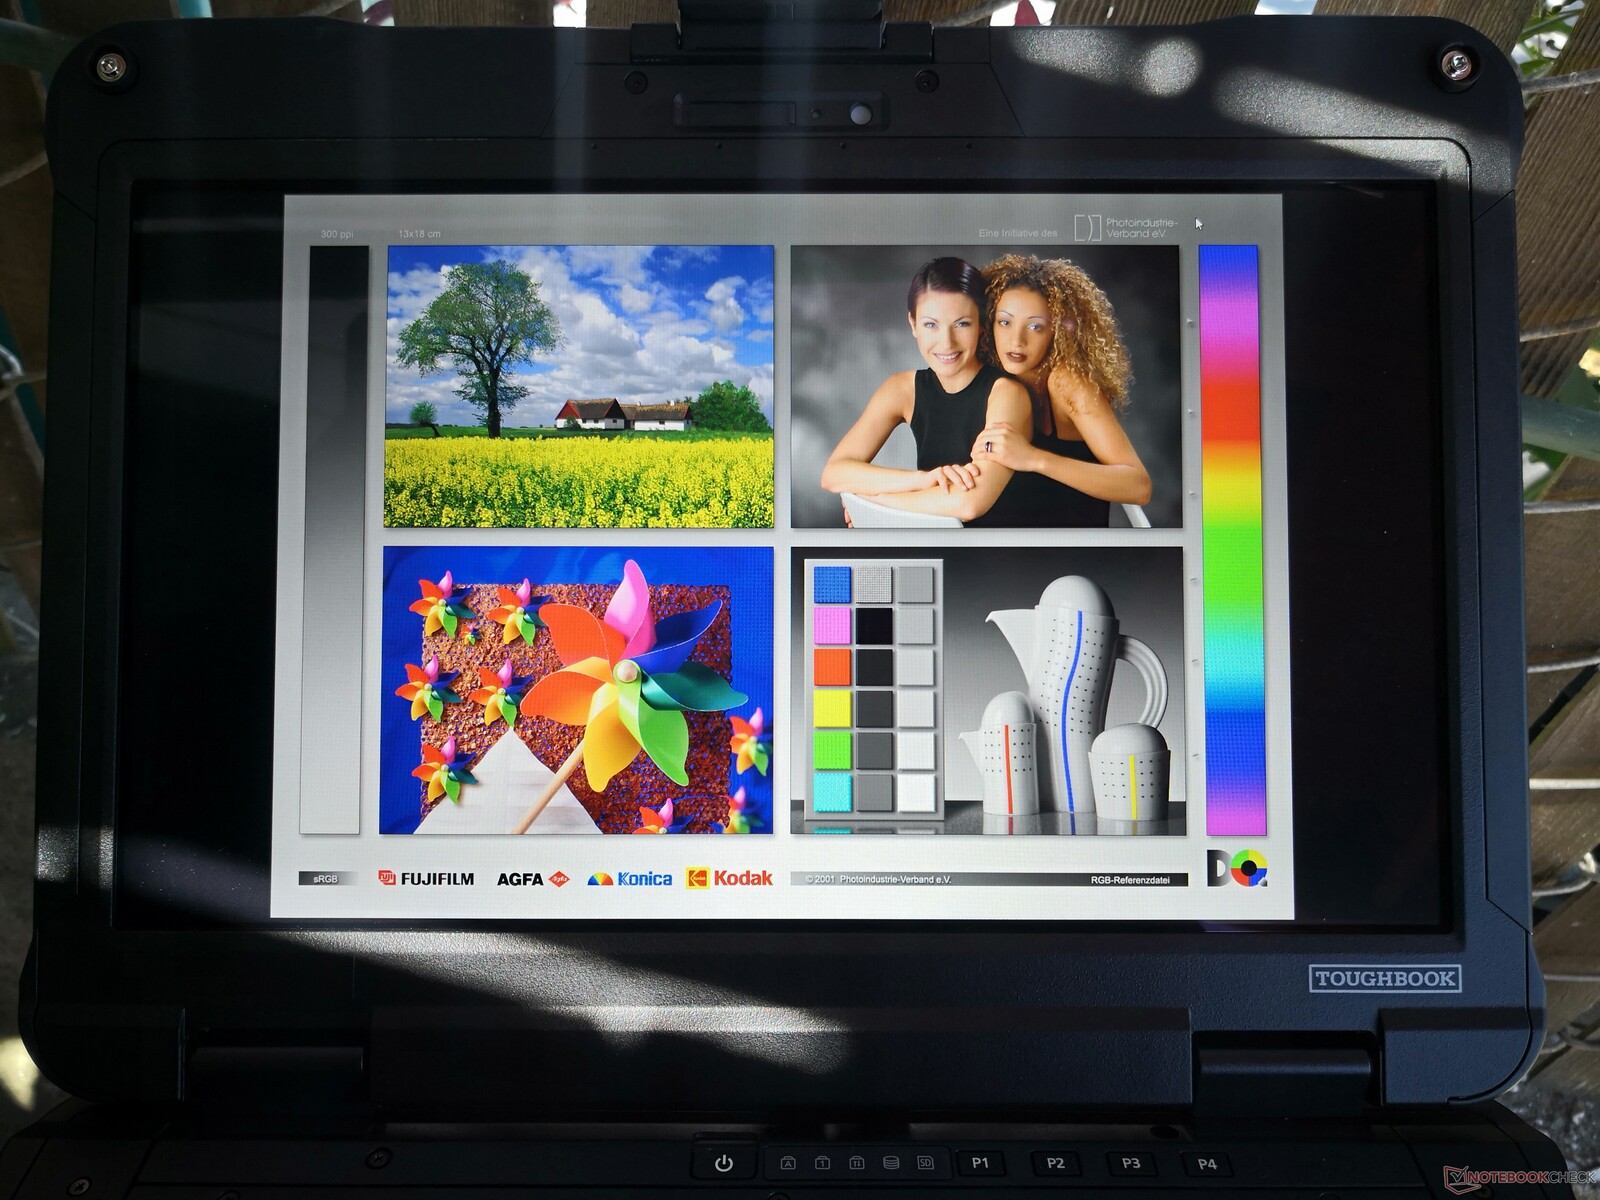
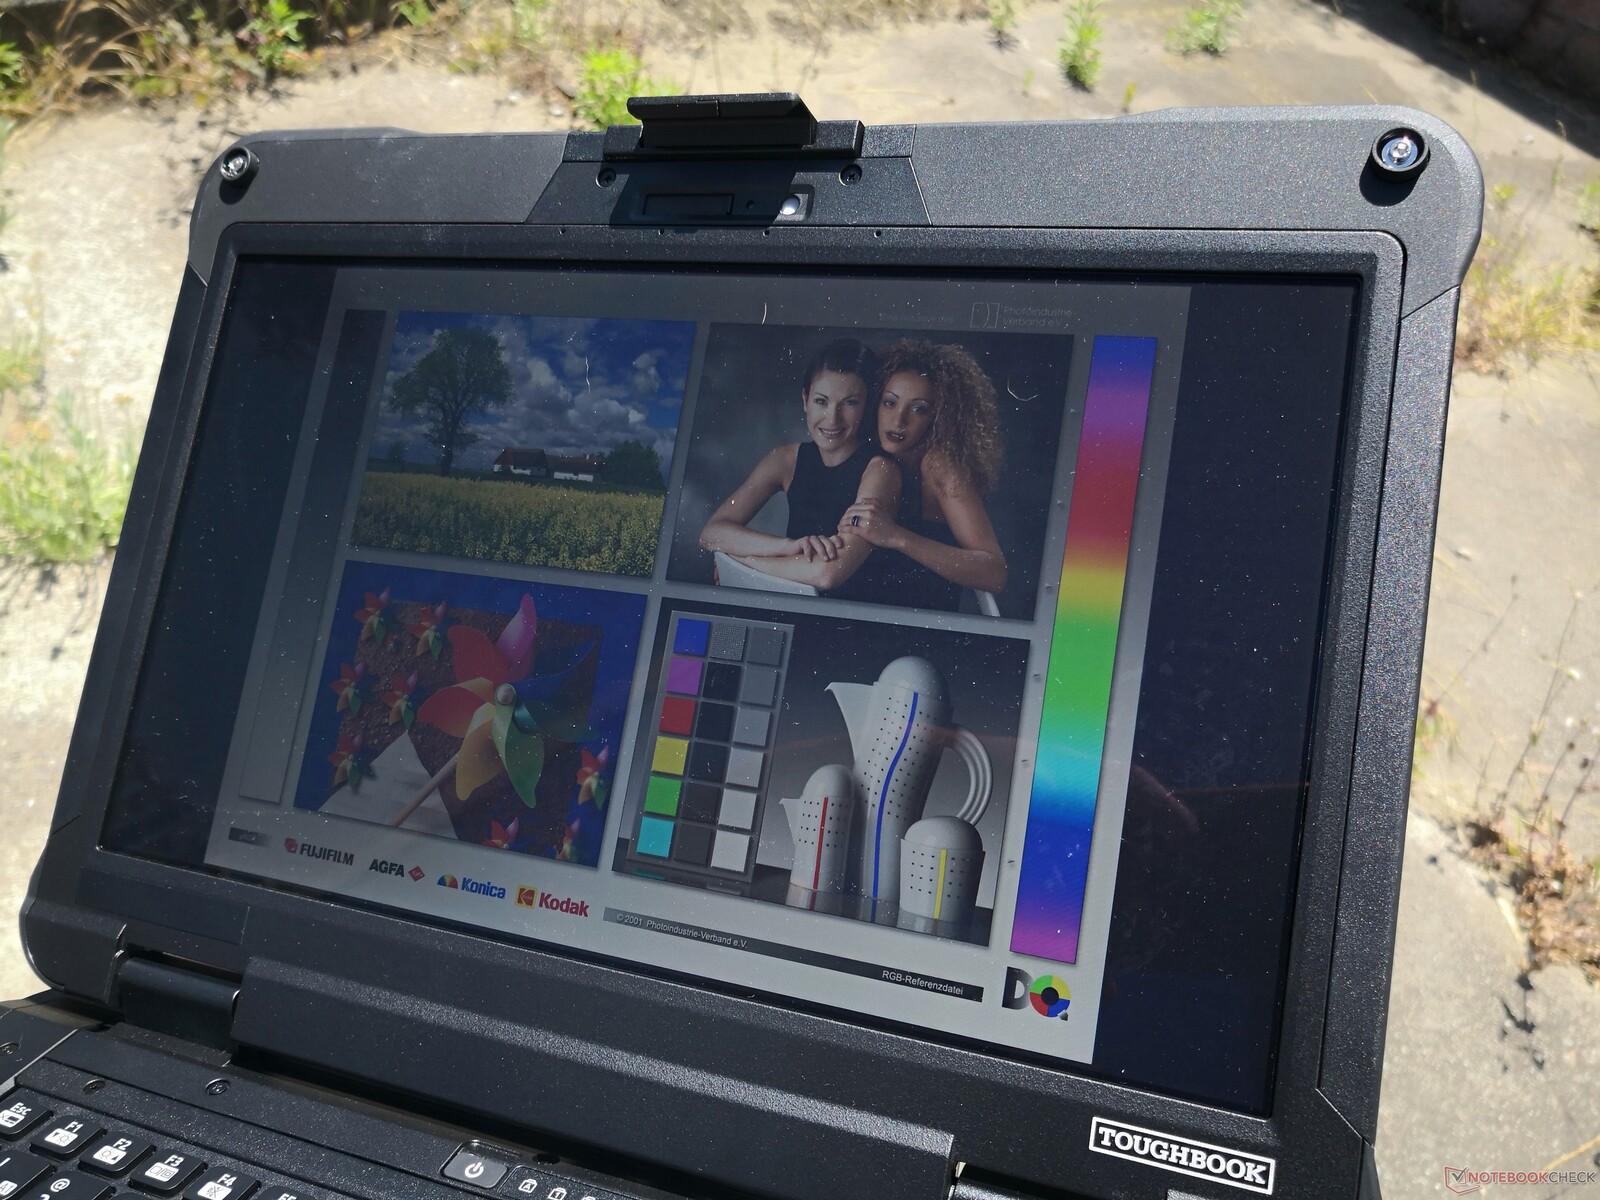
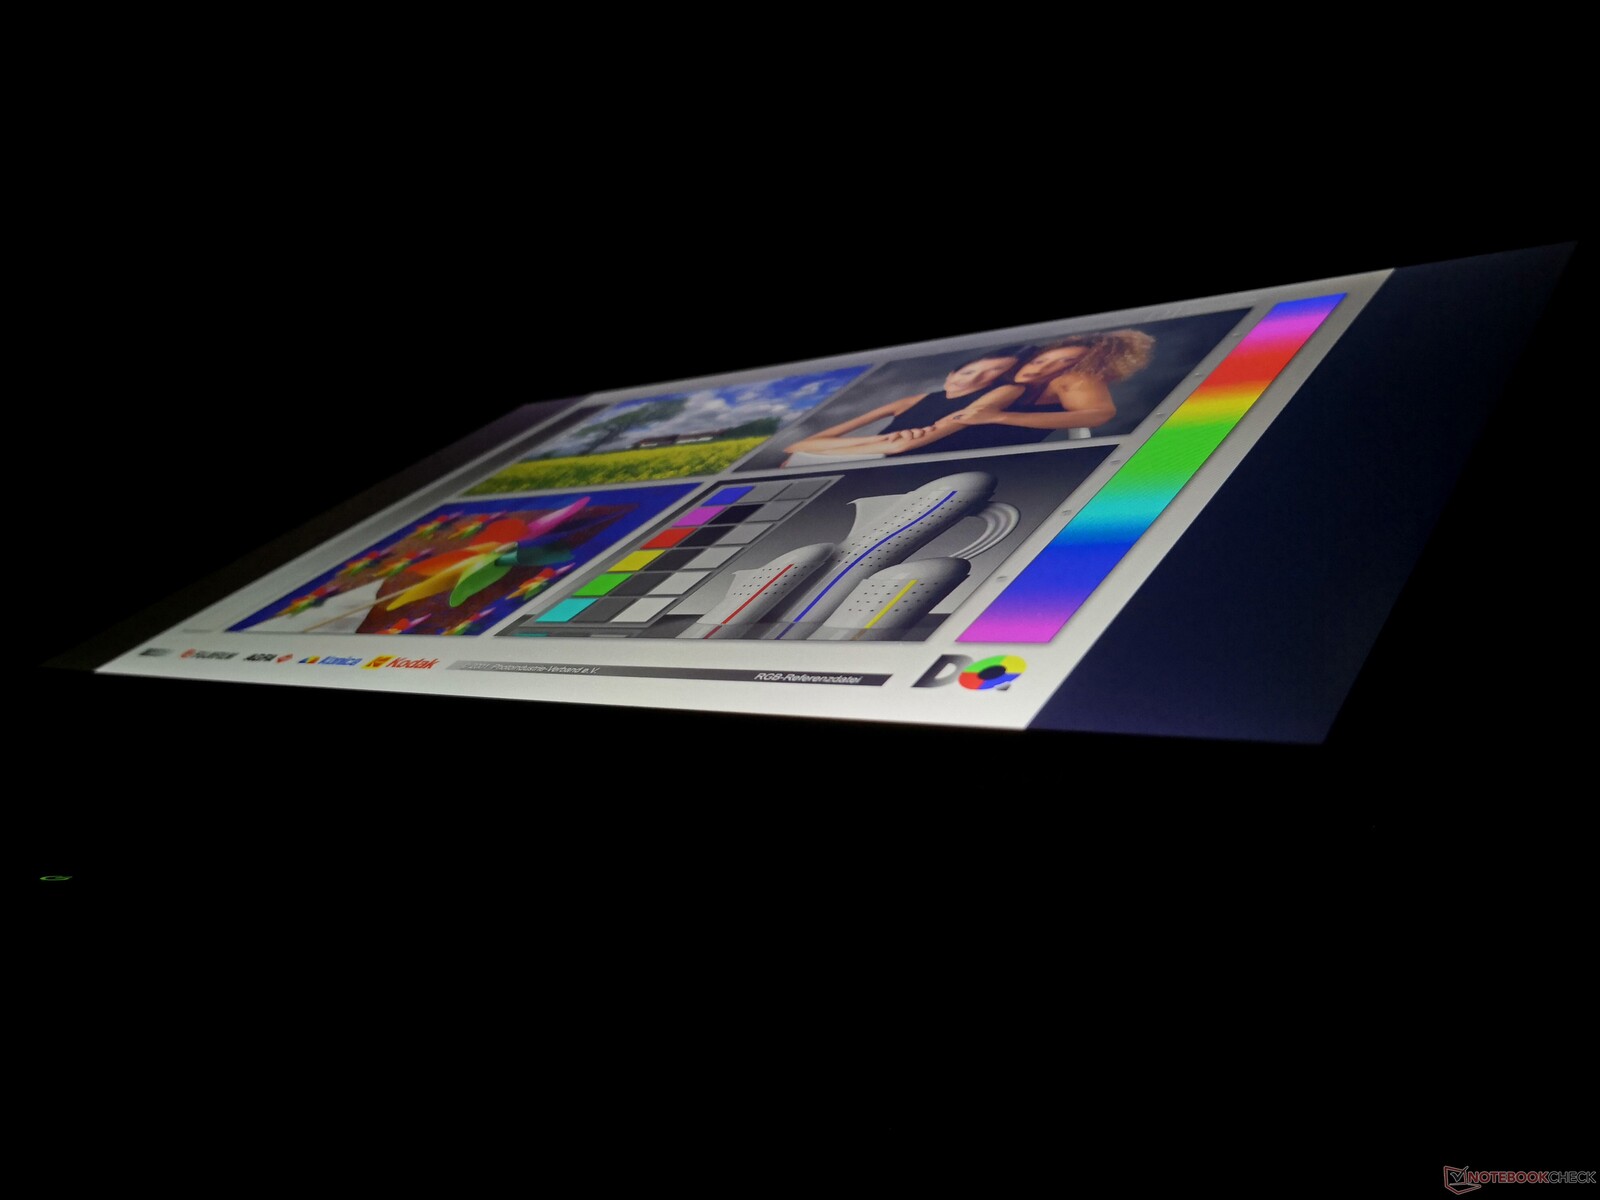
No entanto, a tela IPS é muito boa até os computadores portáteis robustos. Ele não sofre de grandes problemas de granulosidade que muitos outros modelos robustos exibem para textos e imagens mais nítidos. Também é muito brilhante com quase 1400 lêndeas, mantendo uma boa relação de contraste de mais de 1000:1 para ser melhor do que a tela de 1400-nit TN no Durabook S14I
A modulação por largura de pulso está infelizmente presente em todos os níveis de brilho, exceto o máximo. Se seus olhos são sensíveis à cintilação, então você pode querer evitar usar o Panasonic em configurações de alta luminosidade por longos períodos.
| |||||||||||||||||||||||||
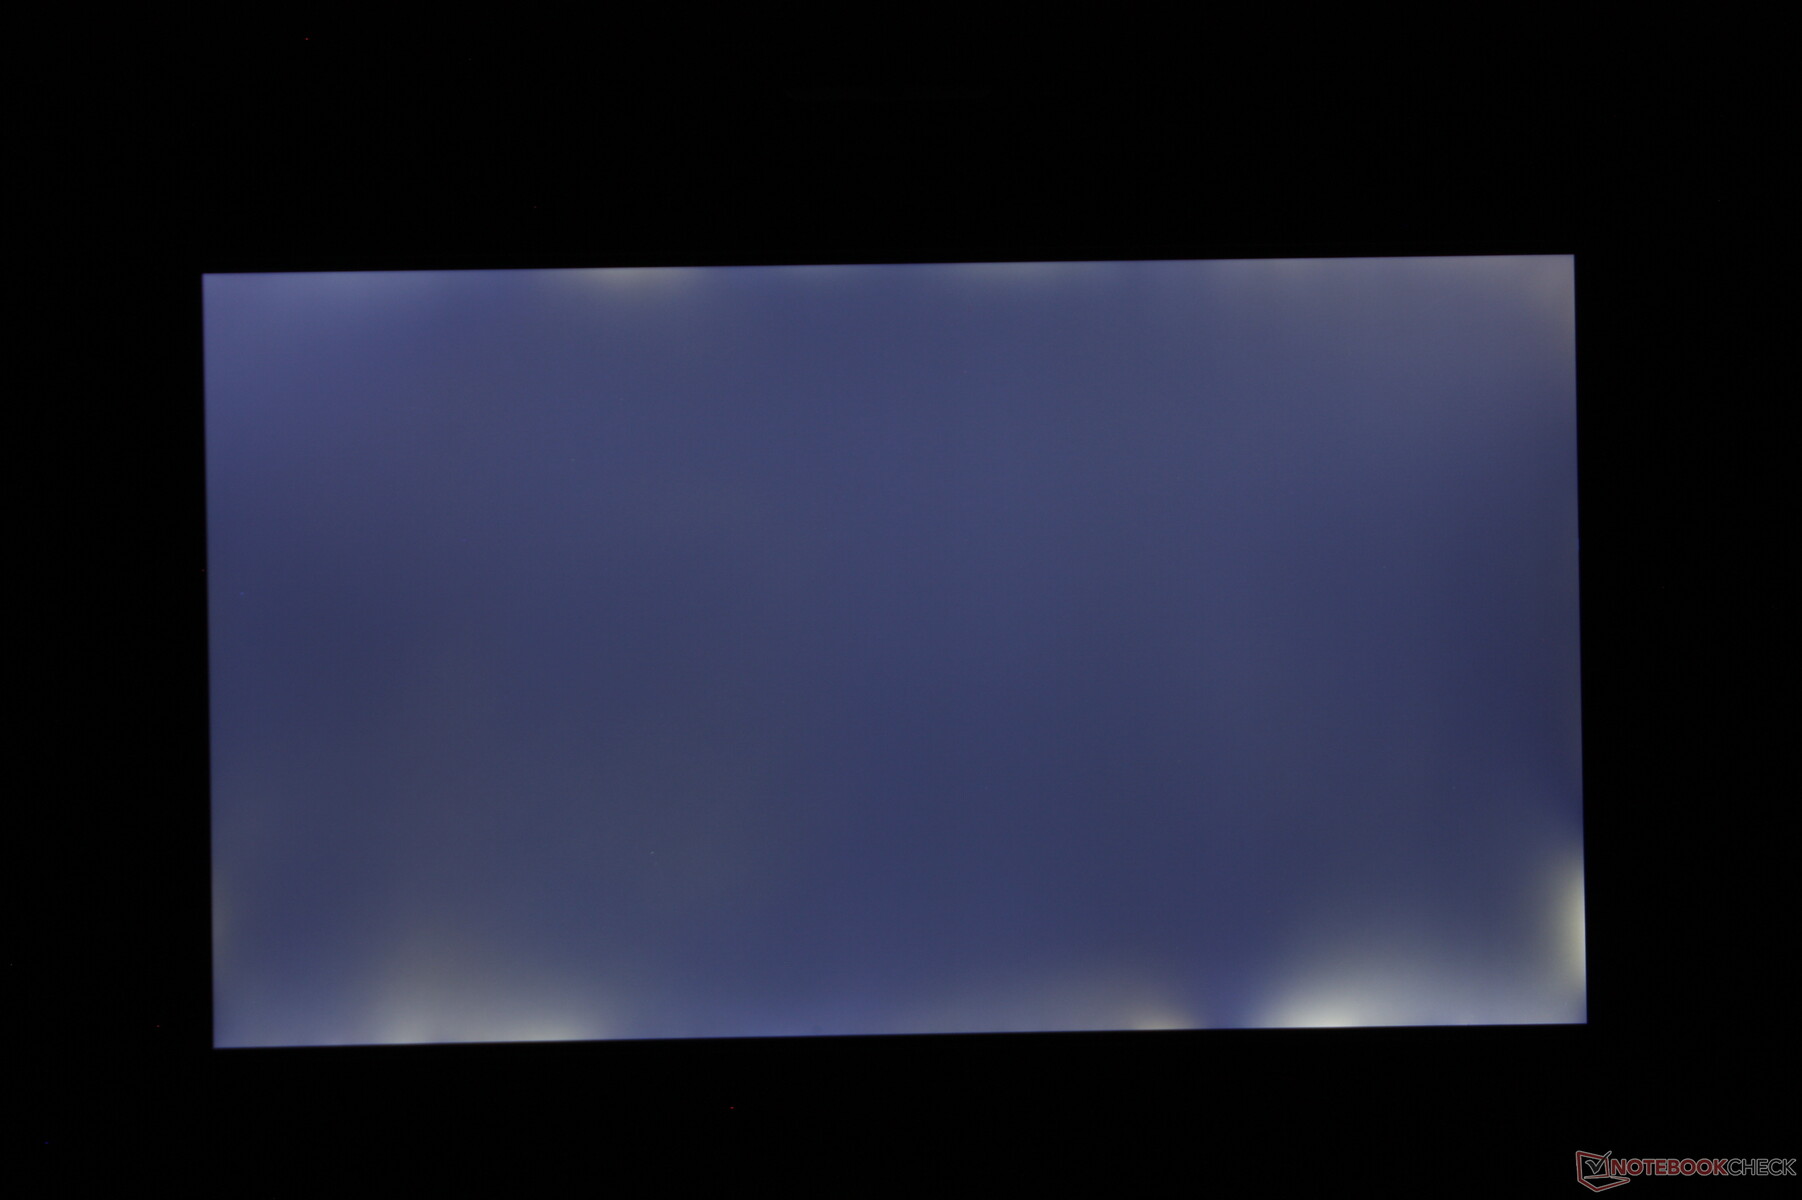
iluminação: 82 %
iluminação com acumulador: 1284.3 cd/m²
Contraste: 1443:1 (Preto: 0.89 cd/m²)
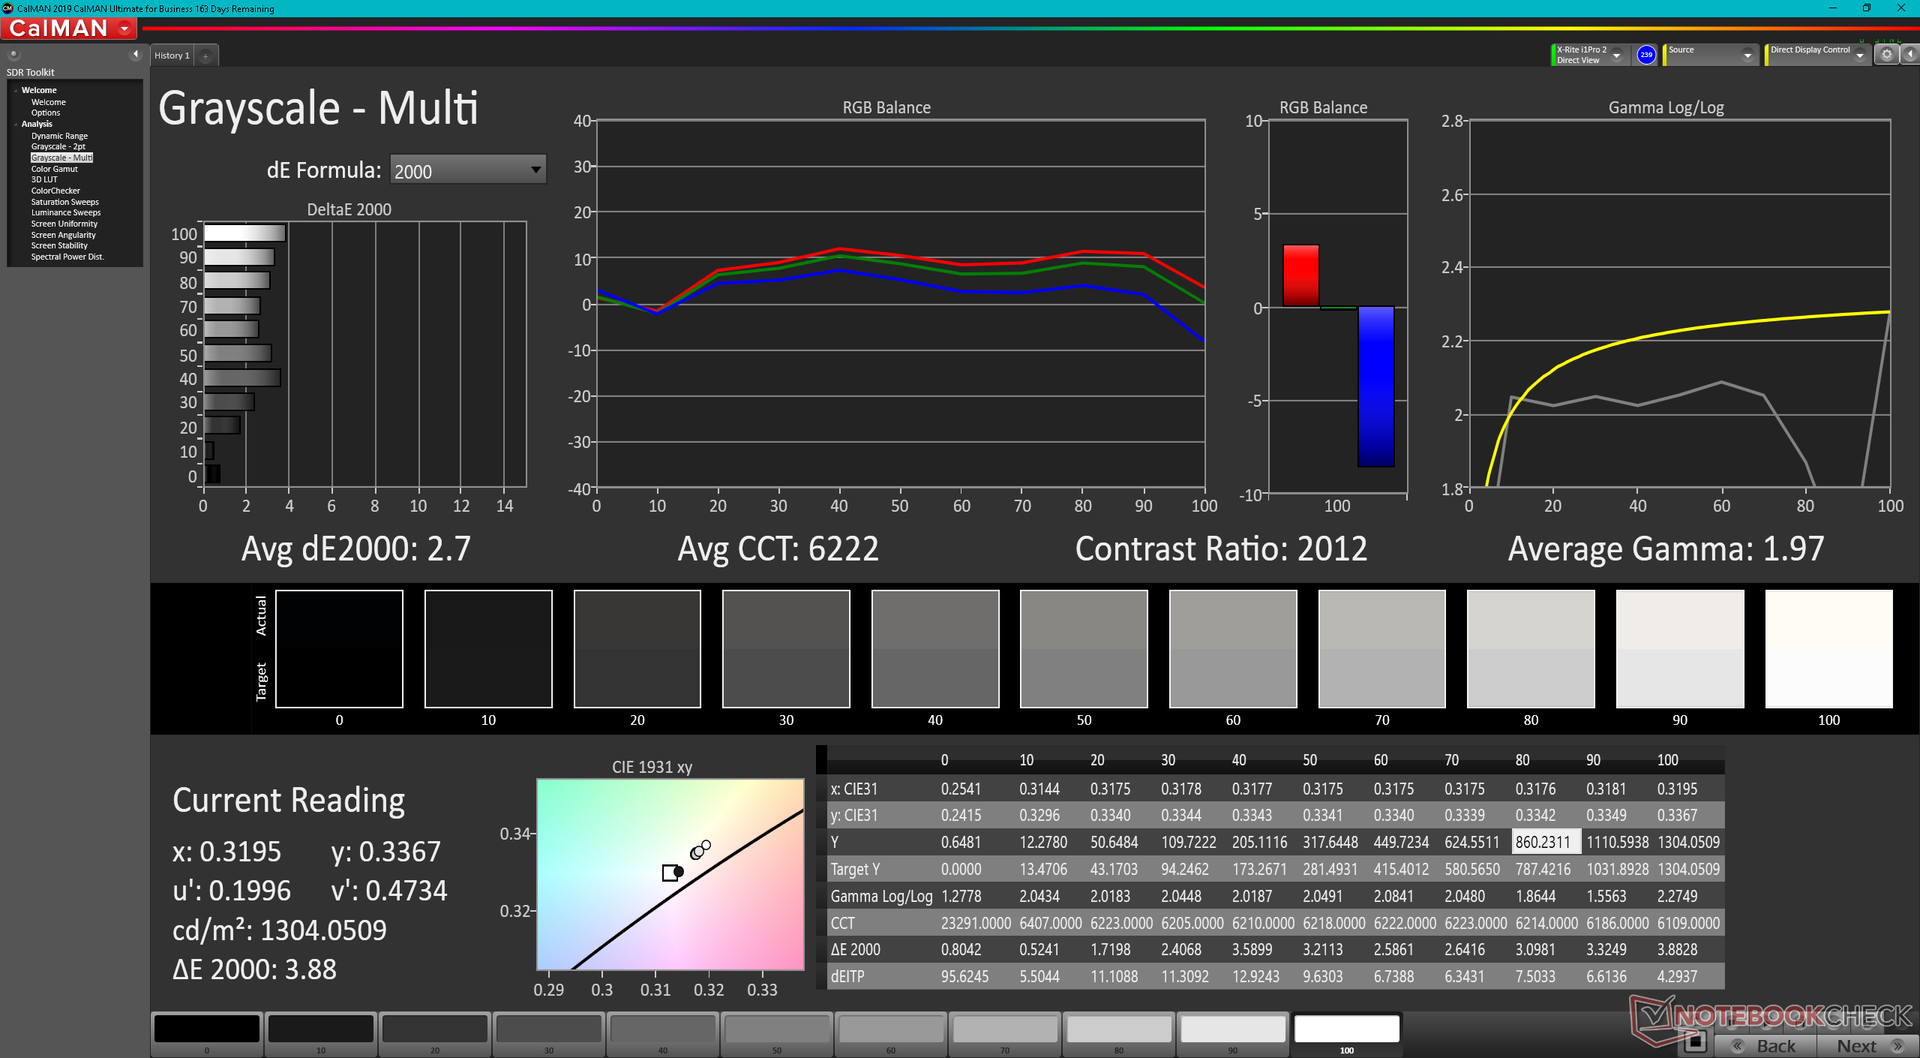
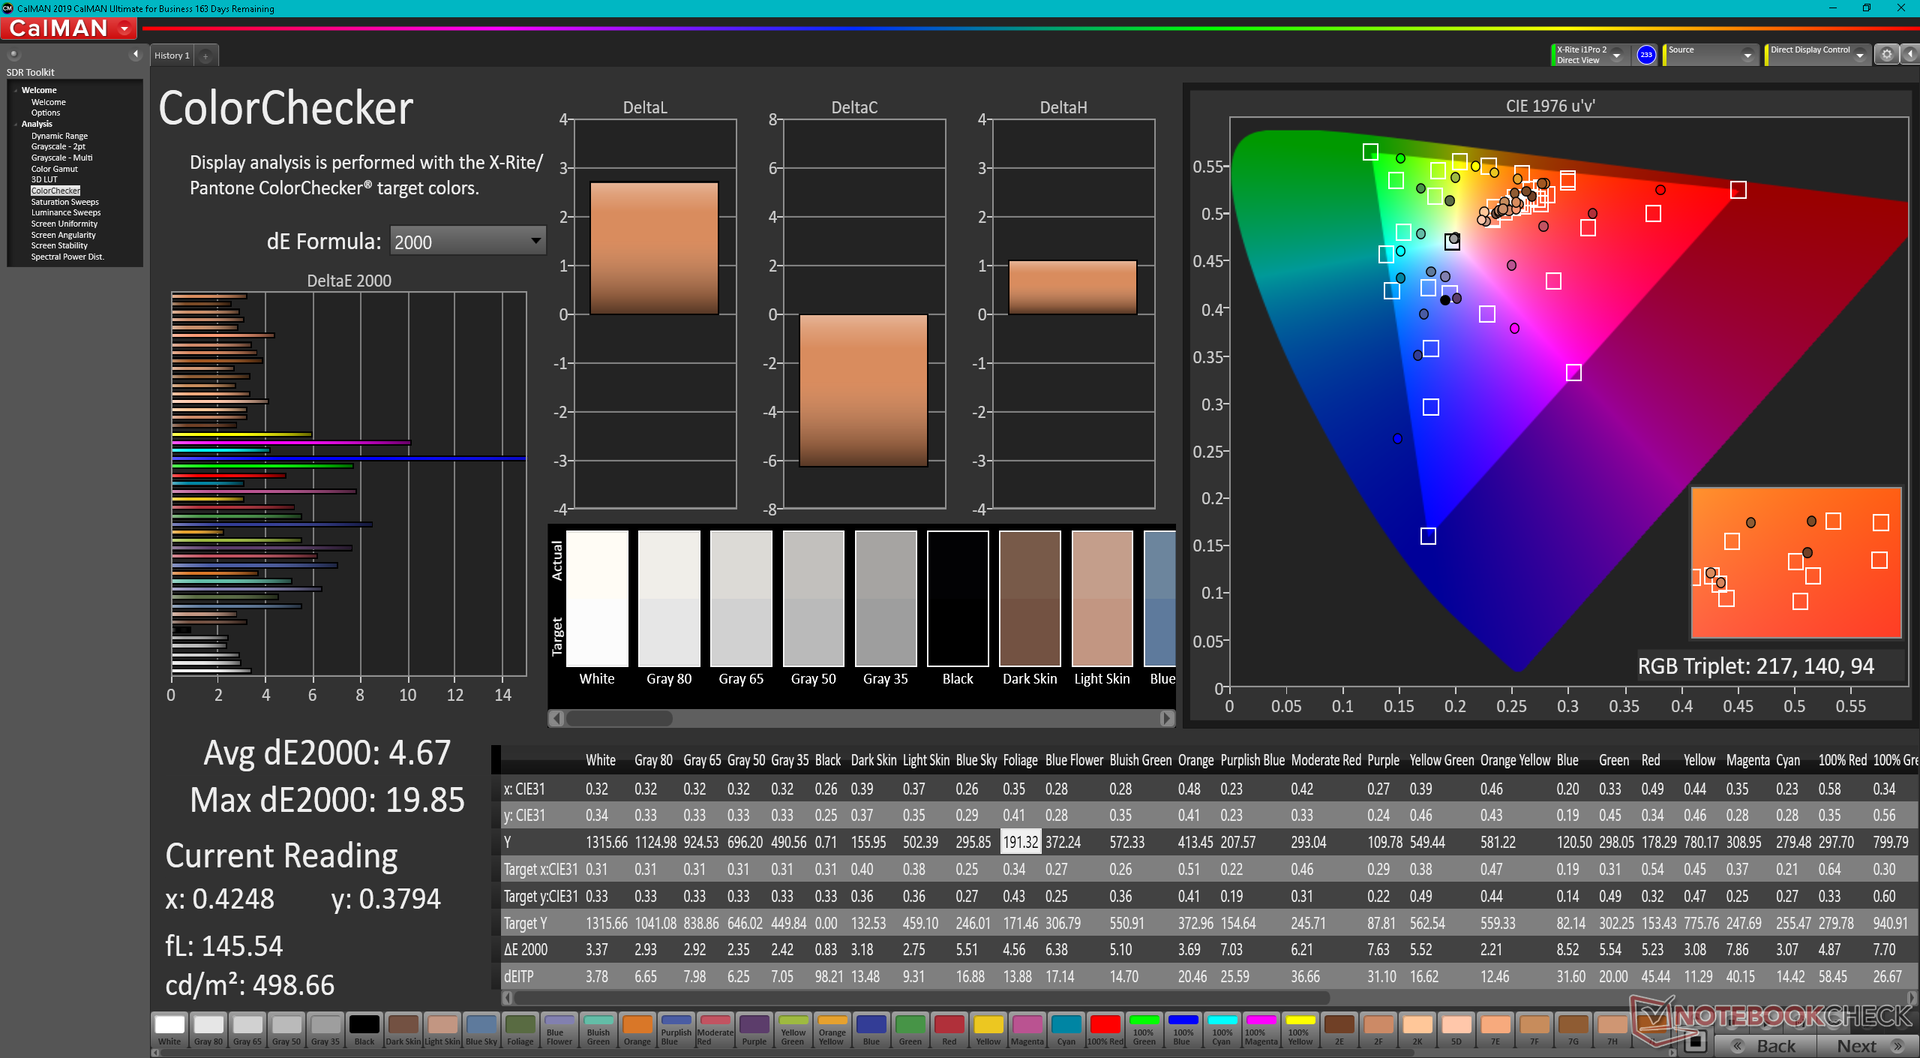
ΔE ColorChecker Calman: 4.67 | ∀{0.5-29.43 Ø4.71}
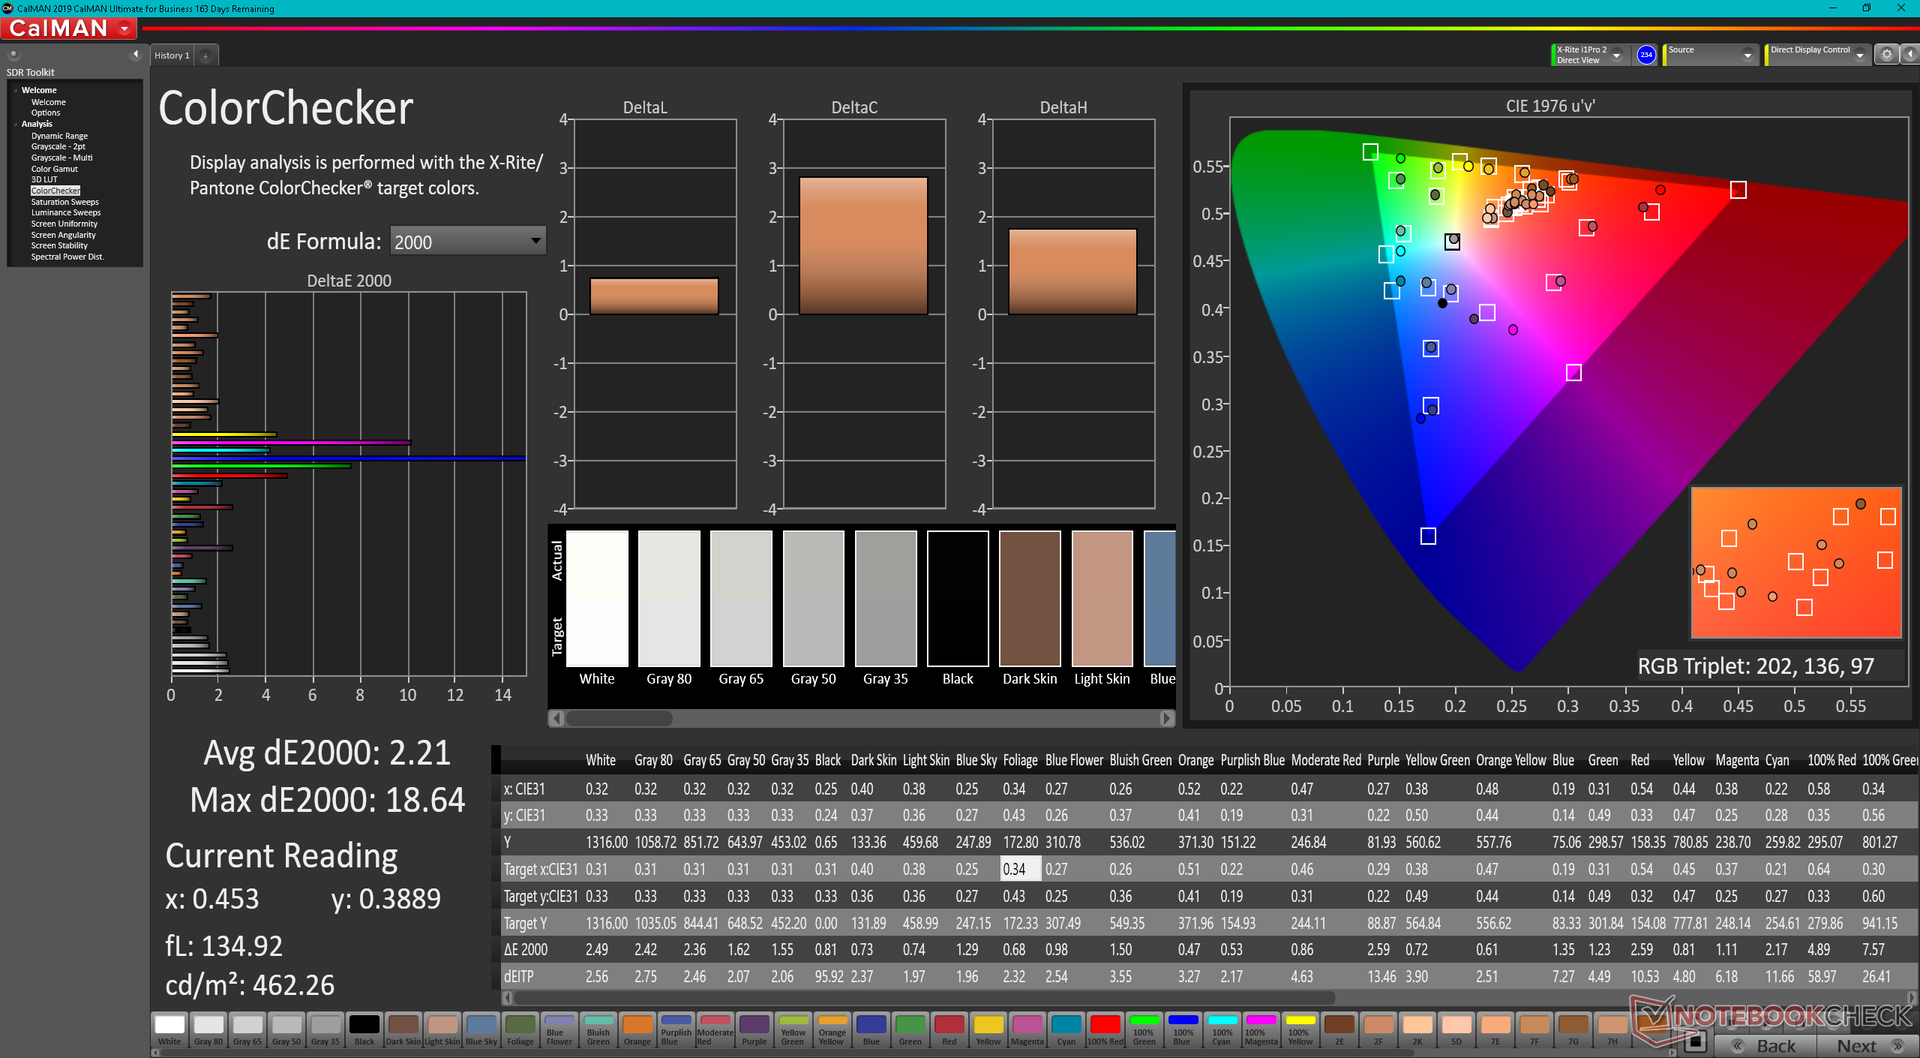
calibrated: 2.21
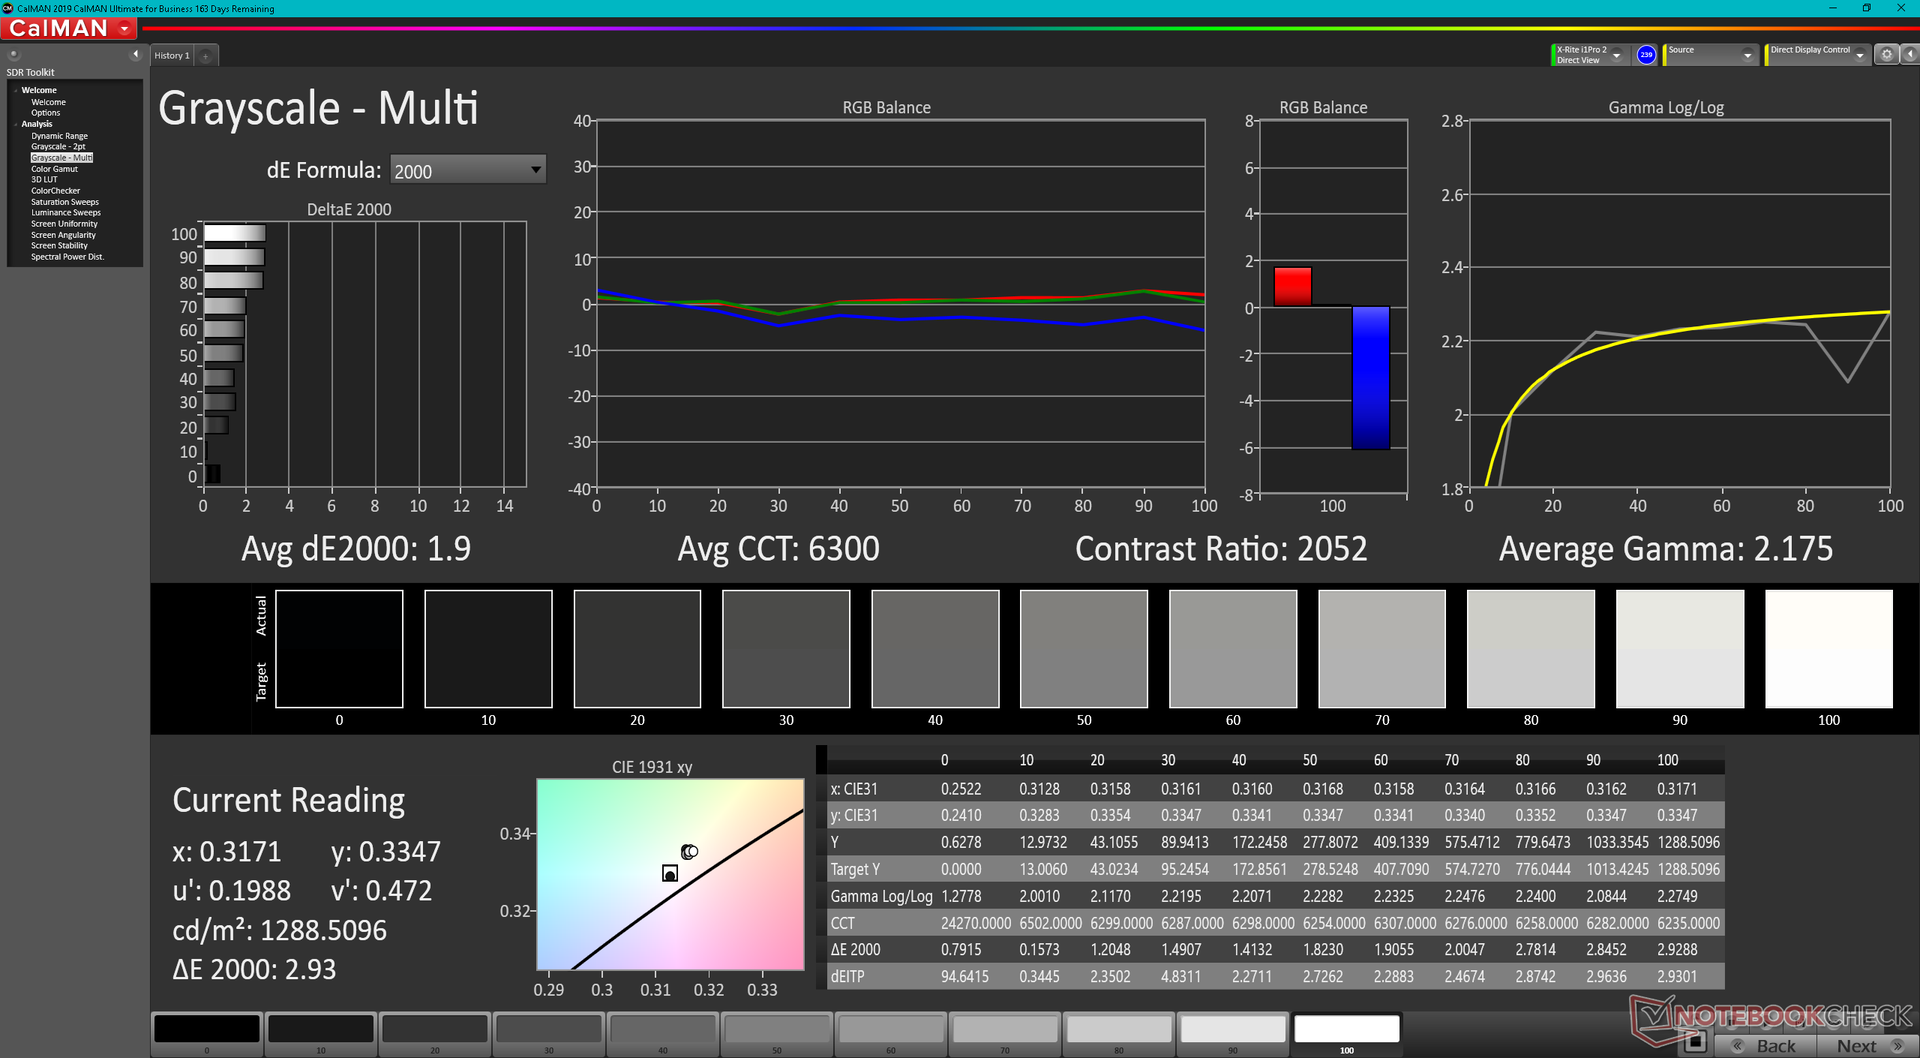
ΔE Greyscale Calman: 2.7 | ∀{0.09-98 Ø4.96}
37% AdobeRGB 1998 (Argyll 3D)
53.8% sRGB (Argyll 3D)
35.8% Display P3 (Argyll 3D)
Gamma: 1.97
CCT: 6222 K
| Panasonic Toughbook 40 InfoVision M140NWF5 R3, IPS, 1920x1080, 14" | Panasonic Toughbook FZ-55 MK2 InfoVision M140NWF5 R3, IPS, 1920x1080, 14" | Getac S410 Gen 4 AU Optronics AUO413D, IPS, 1920x1080, 14" | Dell Latitude 5420 Rugged-P85G AU Optronics AUO523D, IPS, 1920x1080, 14" | Acer Enduro Urban N3 EUN314 XR140EA6T, IPS, 1920x1080, 14" | Durabook S14I KD140N0730A01, TN, 1920x1080, 14" | |
|---|---|---|---|---|---|---|
| Display | -3% | 7% | 74% | 75% | 22% | |
| Display P3 Coverage (%) | 35.8 | 34.8 -3% | 38.3 7% | 62.5 75% | 63.5 77% | 43.55 22% |
| sRGB Coverage (%) | 53.8 | 52.2 -3% | 57.2 6% | 92.4 72% | 91.9 71% | 65.4 22% |
| AdobeRGB 1998 Coverage (%) | 37 | 36 -3% | 39.5 7% | 64.2 74% | 65.5 77% | 45 22% |
| Response Times | 18% | 9% | -29% | -20% | 49% | |
| Response Time Grey 50% / Grey 80% * (ms) | 50.4 ? | 28.4 ? 44% | 35.2 ? 30% | 68 ? -35% | 56 ? -11% | 30.4 ? 40% |
| Response Time Black / White * (ms) | 27.6 ? | 30 ? -9% | 31.2 ? -13% | 33.6 ? -22% | 35.2 ? -28% | 11.8 ? 57% |
| PWM Frequency (Hz) | 694.4 ? | 685 ? | 870 ? | 735 ? | 1000 ? | 304.9 ? |
| Screen | -5% | -35% | -11% | -30% | -100% | |
| Brightness middle (cd/m²) | 1284.3 | 1061.1 -17% | 956.9 -25% | 1111.7 -13% | 487.8 -62% | 1180.7 -8% |
| Brightness (cd/m²) | 1289 | 997 -23% | 984 -24% | 1026 -20% | 464 -64% | 1102 -15% |
| Brightness Distribution (%) | 82 | 76 -7% | 84 2% | 80 -2% | 89 9% | 89 9% |
| Black Level * (cd/m²) | 0.89 | 0.7 21% | 0.81 9% | 0.81 9% | 0.48 46% | 1.91 -115% |
| Contrast (:1) | 1443 | 1516 5% | 1181 -18% | 1372 -5% | 1016 -30% | 618 -57% |
| Colorchecker dE 2000 * | 4.67 | 4.64 1% | 6.6 -41% | 3.83 18% | 6.51 -39% | 13.45 -188% |
| Colorchecker dE 2000 max. * | 19.85 | 20.92 -5% | 22.94 -16% | 7.85 60% | 11.36 43% | 22.52 -13% |
| Colorchecker dE 2000 calibrated * | 2.21 | 2.52 -14% | 4.05 -83% | 2.98 -35% | 1.77 20% | 3.19 -44% |
| Greyscale dE 2000 * | 2.7 | 2.8 -4% | 6 -122% | 5.6 -107% | 7.8 -189% | 15.4 -470% |
| Gamma | 1.97 112% | 2.08 106% | 2.19 100% | 2.306 95% | 2.28 96% | 1.97 112% |
| CCT | 6222 104% | 6364 102% | 7276 89% | 7676 85% | 8102 80% | 21134 31% |
| Color Space (Percent of AdobeRGB 1998) (%) | 59 | 41.6 | ||||
| Color Space (Percent of sRGB) (%) | 93 | 65.5 | ||||
| Média Total (Programa/Configurações) | 3% /
-1% | -6% /
-20% | 11% /
5% | 8% /
-6% | -10% /
-53% |
* ... menor é melhor
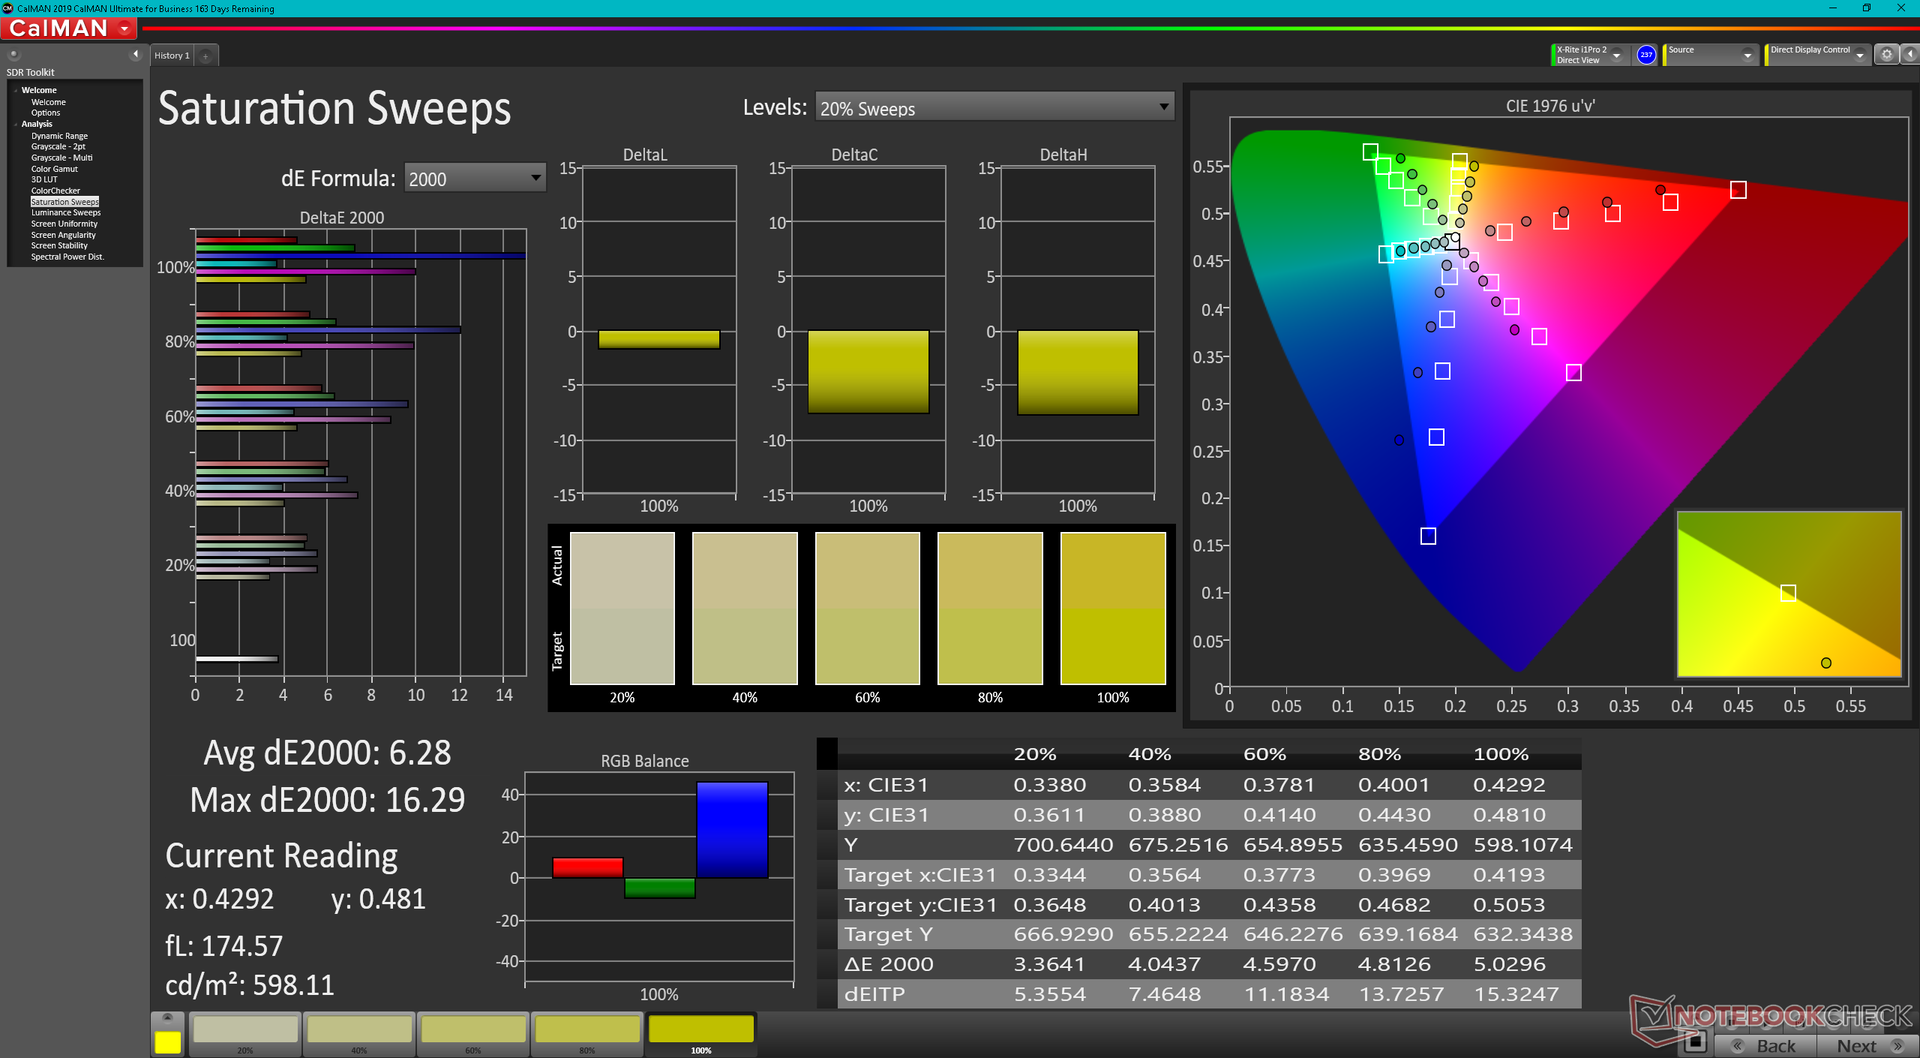
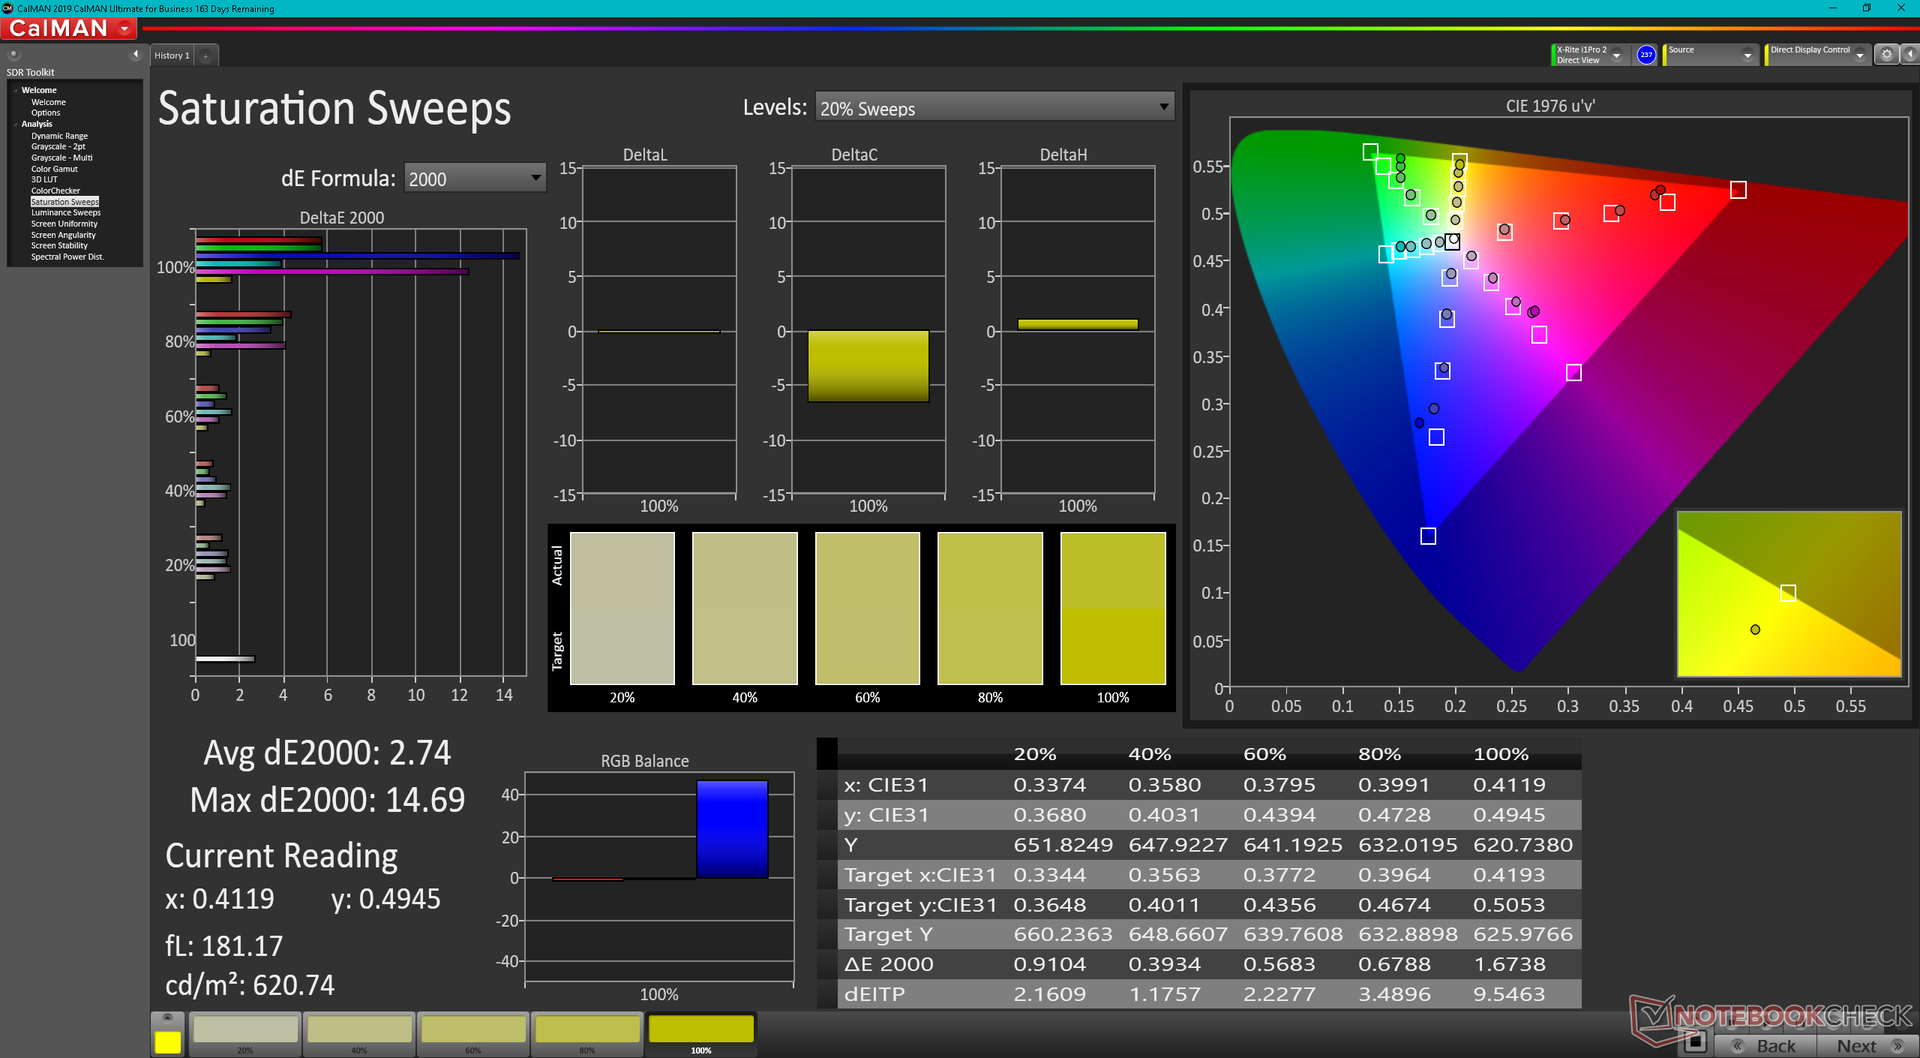
A gama é estreita em apenas 54% do sRGB em comparação com >90% no Acer Enduro Urbano N3dell Latitude 5420 Rugged, e a maioria dos computadores portáteis de médio e alto consumo. Isto geralmente não deve ser uma preocupação, a menos que a precisão da cor seja essencial para suas aplicações.
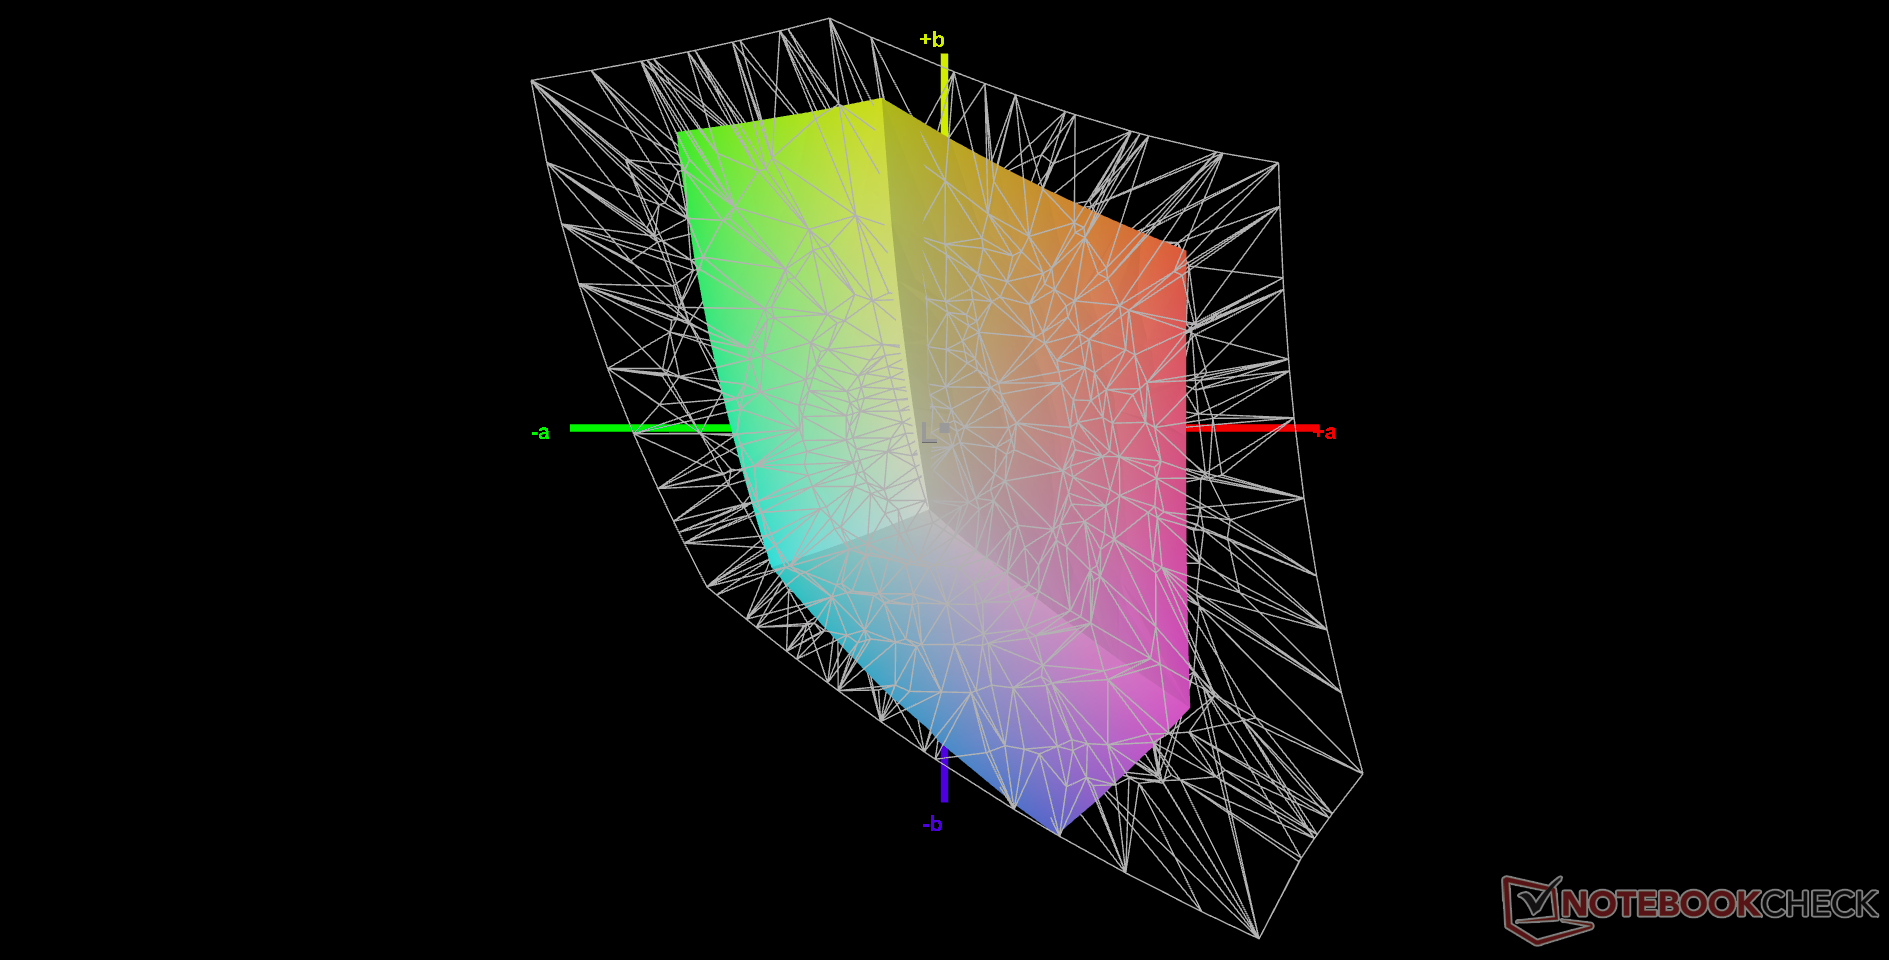
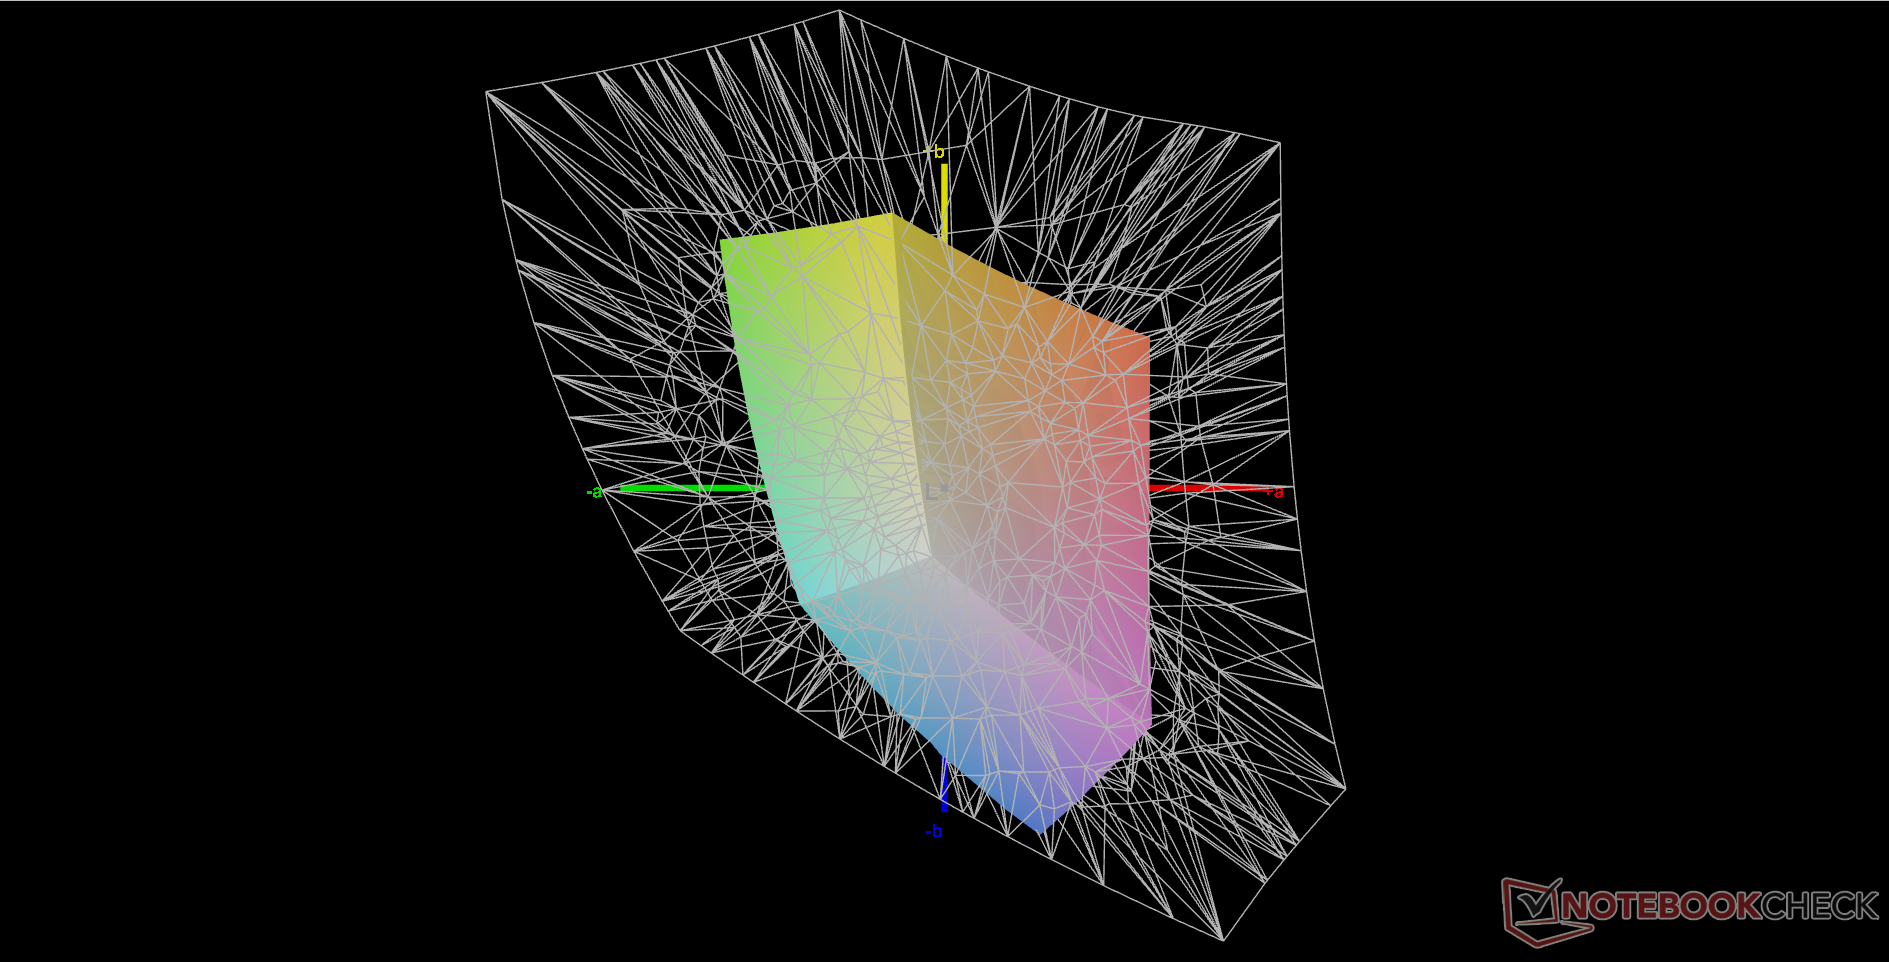
O display não é calibrado na fábrica. Calibrá-lo nós mesmos melhoraria os valores médios do deltaE em toda a linha, mas as cores saturadas serão sempre imprecisas devido à limitada cobertura sRGB mencionada acima. Mesmo assim, os usuários ainda podem aplicar nosso perfil de ICM calibrado acima para obter o máximo do display.
Exibir tempos de resposta
| ↔ Tempo de resposta preto para branco | ||
|---|---|---|
| 27.6 ms ... ascensão ↗ e queda ↘ combinadas | ↗ 14.4 ms ascensão | 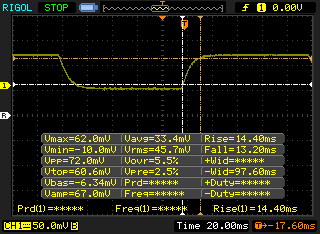 |
| ↘ 13.2 ms queda | ||
| A tela mostra taxas de resposta relativamente lentas em nossos testes e pode ser muito lenta para os jogadores. Em comparação, todos os dispositivos testados variam de 0.1 (mínimo) a 240 (máximo) ms. » 70 % de todos os dispositivos são melhores. Isso significa que o tempo de resposta medido é pior que a média de todos os dispositivos testados (19.8 ms). | ||
| ↔ Tempo de resposta 50% cinza a 80% cinza | ||
| 50.4 ms ... ascensão ↗ e queda ↘ combinadas | ↗ 24.4 ms ascensão | 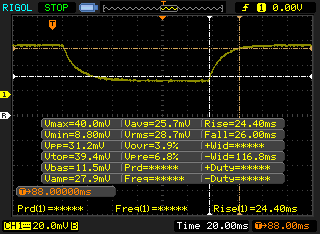 |
| ↘ 26 ms queda | ||
| A tela mostra taxas de resposta lentas em nossos testes e será insatisfatória para os jogadores. Em comparação, todos os dispositivos testados variam de 0.165 (mínimo) a 636 (máximo) ms. » 87 % de todos os dispositivos são melhores. Isso significa que o tempo de resposta medido é pior que a média de todos os dispositivos testados (31 ms). | ||
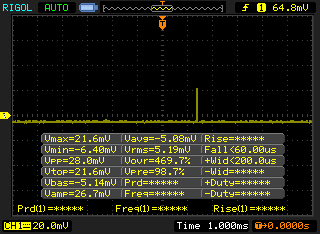
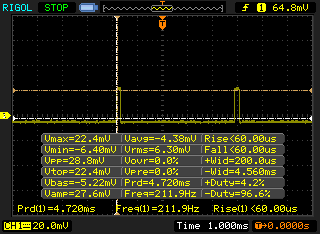
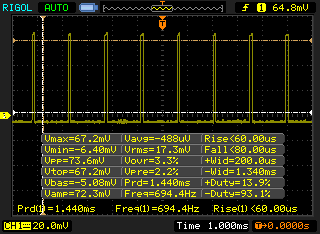
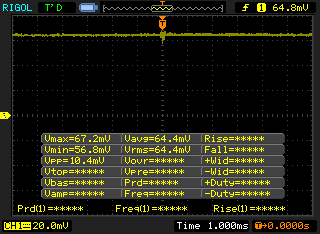
Cintilação da tela / PWM (modulação por largura de pulso)
| Tela tremeluzindo/PWM detectado | 694.4 Hz | ≤ 99 % configuração de brilho | 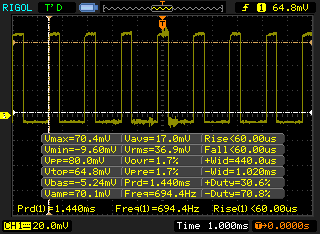 |
A luz de fundo da tela pisca em 694.4 Hz (pior caso, por exemplo, utilizando PWM) Cintilação detectada em uma configuração de brilho de 99 % e abaixo. Não deve haver cintilação ou PWM acima desta configuração de brilho. A frequência de 694.4 Hz é bastante alta, então a maioria dos usuários sensíveis ao PWM não deve notar nenhuma oscilação. [pwm_comparison] Em comparação: 52 % de todos os dispositivos testados não usam PWM para escurecer a tela. Se PWM foi detectado, uma média de 7757 (mínimo: 5 - máximo: 343500) Hz foi medida. | |||

Desempenho
Condições de teste
Configuramos nossa unidade para o modo Performance via Windows antes de executar quaisquer benchmarks abaixo.
Processador
O desempenho da CPU é cerca de 5% a 10% mais lento, tanto em cargas de trabalho simples como em múltiplas roscas, do que a média do laptop em nosso banco de dados equipado com o mesmo Núcleo i7-1185G7 CPU. Isto não é incomum, pois muitos laptops robustos tendem a apontar para taxas de relógio mais baixas para maior estabilidade e confiabilidade. O desempenho geral ainda é muito mais rápido do que qualquer solução de 10ª geração ou mais antiga da série Core U.
Cinebench R15 Multi Loop
Cinebench R23: Multi Core | Single Core
Cinebench R15: CPU Multi 64Bit | CPU Single 64Bit
Blender: v2.79 BMW27 CPU
7-Zip 18.03: 7z b 4 | 7z b 4 -mmt1
Geekbench 5.5: Multi-Core | Single-Core
HWBOT x265 Benchmark v2.2: 4k Preset
LibreOffice : 20 Documents To PDF
R Benchmark 2.5: Overall mean
| Cinebench R20 / CPU (Multi Core) | |
| Lenovo IdeaPad 5 Pro 14ACN6 | |
| Lenovo Yoga 9 14IAP7 82LU0001US | |
| Dell Inspiron 14 7400 7415 2-in-1 | |
| Dell Inspiron 14 7420 2-in-1 | |
| Dell Latitude 14 5420-D2G5W | |
| Média Intel Core i7-1185G7 (1425 - 2493, n=28) | |
| Acer Enduro Urban N3 EUN314 | |
| Panasonic Toughbook 40 | |
| Acer Spin 3 SP314-54N-56S5 | |
| Asus ZenBook 14 UX434FL-DB77 | |
| Infinix INBook X2 | |
| Durabook S15ABG2 | |
| Cinebench R20 / CPU (Single Core) | |
| Dell Inspiron 14 7420 2-in-1 | |
| Lenovo Yoga 9 14IAP7 82LU0001US | |
| Média Intel Core i7-1185G7 (489 - 593, n=28) | |
| Acer Enduro Urban N3 EUN314 | |
| Lenovo IdeaPad 5 Pro 14ACN6 | |
| Panasonic Toughbook 40 | |
| Dell Latitude 14 5420-D2G5W | |
| Dell Inspiron 14 7400 7415 2-in-1 | |
| Asus ZenBook 14 UX434FL-DB77 | |
| Acer Spin 3 SP314-54N-56S5 | |
| Infinix INBook X2 | |
| Durabook S15ABG2 | |
| Cinebench R15 / CPU Multi 64Bit | |
| Lenovo IdeaPad 5 Pro 14ACN6 | |
| Lenovo Yoga 9 14IAP7 82LU0001US | |
| Dell Inspiron 14 7400 7415 2-in-1 | |
| Dell Inspiron 14 7420 2-in-1 | |
| Média Intel Core i7-1185G7 (617 - 1066, n=32) | |
| Dell Latitude 14 5420-D2G5W | |
| Acer Enduro Urban N3 EUN314 | |
| Panasonic Toughbook 40 | |
| Asus ZenBook 14 UX434FL-DB77 | |
| Acer Spin 3 SP314-54N-56S5 | |
| Infinix INBook X2 | |
| Durabook S15ABG2 | |
| Cinebench R15 / CPU Single 64Bit | |
| Dell Inspiron 14 7420 2-in-1 | |
| Lenovo Yoga 9 14IAP7 82LU0001US | |
| Lenovo IdeaPad 5 Pro 14ACN6 | |
| Média Intel Core i7-1185G7 (168 - 230, n=27) | |
| Acer Enduro Urban N3 EUN314 | |
| Panasonic Toughbook 40 | |
| Dell Latitude 14 5420-D2G5W | |
| Dell Inspiron 14 7400 7415 2-in-1 | |
| Asus ZenBook 14 UX434FL-DB77 | |
| Acer Spin 3 SP314-54N-56S5 | |
| Durabook S15ABG2 | |
| Infinix INBook X2 | |
| Blender / v2.79 BMW27 CPU | |
| Durabook S15ABG2 | |
| Infinix INBook X2 | |
| Acer Spin 3 SP314-54N-56S5 | |
| Asus ZenBook 14 UX434FL-DB77 | |
| Panasonic Toughbook 40 | |
| Média Intel Core i7-1185G7 (478 - 745, n=28) | |
| Acer Enduro Urban N3 EUN314 | |
| Dell Latitude 14 5420-D2G5W | |
| Dell Inspiron 14 7420 2-in-1 | |
| Dell Inspiron 14 7400 7415 2-in-1 | |
| Lenovo Yoga 9 14IAP7 82LU0001US | |
| Lenovo IdeaPad 5 Pro 14ACN6 | |
| 7-Zip 18.03 / 7z b 4 -mmt1 | |
| Dell Inspiron 14 7420 2-in-1 | |
| Acer Enduro Urban N3 EUN314 | |
| Lenovo IdeaPad 5 Pro 14ACN6 | |
| Média Intel Core i7-1185G7 (3678 - 5507, n=27) | |
| Panasonic Toughbook 40 | |
| Dell Latitude 14 5420-D2G5W | |
| Lenovo Yoga 9 14IAP7 82LU0001US | |
| Dell Inspiron 14 7400 7415 2-in-1 | |
| Acer Spin 3 SP314-54N-56S5 | |
| Durabook S15ABG2 | |
| Asus ZenBook 14 UX434FL-DB77 | |
| Infinix INBook X2 | |
| Geekbench 5.5 / Multi-Core | |
| Lenovo Yoga 9 14IAP7 82LU0001US | |
| Dell Inspiron 14 7420 2-in-1 | |
| Média Intel Core i7-1185G7 (4620 - 5944, n=21) | |
| Acer Enduro Urban N3 EUN314 | |
| Panasonic Toughbook 40 | |
| Acer Spin 3 SP314-54N-56S5 | |
| Dell Latitude 14 5420-D2G5W | |
| Infinix INBook X2 | |
| Durabook S15ABG2 | |
| Asus ZenBook 14 UX434FL-DB77 | |
| Geekbench 5.5 / Single-Core | |
| Lenovo Yoga 9 14IAP7 82LU0001US | |
| Dell Inspiron 14 7420 2-in-1 | |
| Acer Enduro Urban N3 EUN314 | |
| Média Intel Core i7-1185G7 (1398 - 1626, n=21) | |
| Panasonic Toughbook 40 | |
| Acer Spin 3 SP314-54N-56S5 | |
| Dell Latitude 14 5420-D2G5W | |
| Infinix INBook X2 | |
| Asus ZenBook 14 UX434FL-DB77 | |
| Durabook S15ABG2 | |
| HWBOT x265 Benchmark v2.2 / 4k Preset | |
| Lenovo IdeaPad 5 Pro 14ACN6 | |
| Lenovo Yoga 9 14IAP7 82LU0001US | |
| Dell Inspiron 14 7400 7415 2-in-1 | |
| Dell Inspiron 14 7420 2-in-1 | |
| Acer Enduro Urban N3 EUN314 | |
| Média Intel Core i7-1185G7 (5.02 - 8.13, n=27) | |
| Dell Latitude 14 5420-D2G5W | |
| Panasonic Toughbook 40 | |
| Asus ZenBook 14 UX434FL-DB77 | |
| Acer Spin 3 SP314-54N-56S5 | |
| Infinix INBook X2 | |
| Durabook S15ABG2 | |
| LibreOffice / 20 Documents To PDF | |
| Asus ZenBook 14 UX434FL-DB77 | |
| Durabook S15ABG2 | |
| Infinix INBook X2 | |
| Acer Enduro Urban N3 EUN314 | |
| Dell Inspiron 14 7400 7415 2-in-1 | |
| Acer Spin 3 SP314-54N-56S5 | |
| Dell Latitude 14 5420-D2G5W | |
| Lenovo IdeaPad 5 Pro 14ACN6 | |
| Panasonic Toughbook 40 | |
| Média Intel Core i7-1185G7 (41.3 - 61.7, n=26) | |
| Dell Inspiron 14 7420 2-in-1 | |
| Lenovo Yoga 9 14IAP7 82LU0001US | |
| R Benchmark 2.5 / Overall mean | |
| Asus ZenBook 14 UX434FL-DB77 | |
| Infinix INBook X2 | |
| Durabook S15ABG2 | |
| Acer Spin 3 SP314-54N-56S5 | |
| Dell Latitude 14 5420-D2G5W | |
| Panasonic Toughbook 40 | |
| Dell Inspiron 14 7400 7415 2-in-1 | |
| Média Intel Core i7-1185G7 (0.55 - 0.615, n=27) | |
| Acer Enduro Urban N3 EUN314 | |
| Lenovo IdeaPad 5 Pro 14ACN6 | |
| Lenovo Yoga 9 14IAP7 82LU0001US | |
| Dell Inspiron 14 7420 2-in-1 | |
* ... menor é melhor
AIDA64: FP32 Ray-Trace | FPU Julia | CPU SHA3 | CPU Queen | FPU SinJulia | FPU Mandel | CPU AES | CPU ZLib | FP64 Ray-Trace | CPU PhotoWorxx
| Performance rating | |
| Acer Enduro Urban N3 EUN314 | |
| Média Intel Core i7-1185G7 | |
| Panasonic Toughbook FZ-55 MK2 | |
| Getac S410 Gen 4 | |
| Panasonic Toughbook 40 | |
| Durabook S14I | |
| AIDA64 / FP32 Ray-Trace | |
| Acer Enduro Urban N3 EUN314 | |
| Média Intel Core i7-1185G7 (5621 - 7453, n=20) | |
| Panasonic Toughbook FZ-55 MK2 | |
| Getac S410 Gen 4 | |
| Panasonic Toughbook 40 | |
| Durabook S14I | |
| AIDA64 / FPU Julia | |
| Acer Enduro Urban N3 EUN314 | |
| Panasonic Toughbook FZ-55 MK2 | |
| Média Intel Core i7-1185G7 (23248 - 32614, n=20) | |
| Getac S410 Gen 4 | |
| Panasonic Toughbook 40 | |
| Durabook S14I | |
| AIDA64 / CPU SHA3 | |
| Acer Enduro Urban N3 EUN314 | |
| Média Intel Core i7-1185G7 (1530 - 2209, n=20) | |
| Panasonic Toughbook FZ-55 MK2 | |
| Getac S410 Gen 4 | |
| Panasonic Toughbook 40 | |
| Durabook S14I | |
| AIDA64 / CPU Queen | |
| Acer Enduro Urban N3 EUN314 | |
| Durabook S14I | |
| Panasonic Toughbook FZ-55 MK2 | |
| Média Intel Core i7-1185G7 (44677 - 52815, n=20) | |
| Getac S410 Gen 4 | |
| Panasonic Toughbook 40 | |
| AIDA64 / FPU SinJulia | |
| Acer Enduro Urban N3 EUN314 | |
| Panasonic Toughbook FZ-55 MK2 | |
| Média Intel Core i7-1185G7 (3870 - 5027, n=20) | |
| Getac S410 Gen 4 | |
| Panasonic Toughbook 40 | |
| Durabook S14I | |
| AIDA64 / FPU Mandel | |
| Acer Enduro Urban N3 EUN314 | |
| Panasonic Toughbook FZ-55 MK2 | |
| Média Intel Core i7-1185G7 (14584 - 19594, n=20) | |
| Getac S410 Gen 4 | |
| Panasonic Toughbook 40 | |
| Durabook S14I | |
| AIDA64 / CPU AES | |
| Acer Enduro Urban N3 EUN314 | |
| Durabook S14I | |
| Média Intel Core i7-1185G7 (33002 - 76826, n=20) | |
| Getac S410 Gen 4 | |
| Panasonic Toughbook FZ-55 MK2 | |
| Panasonic Toughbook 40 | |
| AIDA64 / CPU ZLib | |
| Acer Enduro Urban N3 EUN314 | |
| Panasonic Toughbook 40 | |
| Getac S410 Gen 4 | |
| Média Intel Core i7-1185G7 (258 - 412, n=22) | |
| Panasonic Toughbook FZ-55 MK2 | |
| Durabook S14I | |
| AIDA64 / FP64 Ray-Trace | |
| Acer Enduro Urban N3 EUN314 | |
| Panasonic Toughbook FZ-55 MK2 | |
| Média Intel Core i7-1185G7 (2821 - 4094, n=20) | |
| Getac S410 Gen 4 | |
| Panasonic Toughbook 40 | |
| Durabook S14I | |
| AIDA64 / CPU PhotoWorxx | |
| Média Intel Core i7-1185G7 (22349 - 43701, n=20) | |
| Getac S410 Gen 4 | |
| Acer Enduro Urban N3 EUN314 | |
| Panasonic Toughbook FZ-55 MK2 | |
| Panasonic Toughbook 40 | |
| Durabook S14I | |
Desempenho do sistema
CrossMark: Overall | Productivity | Creativity | Responsiveness
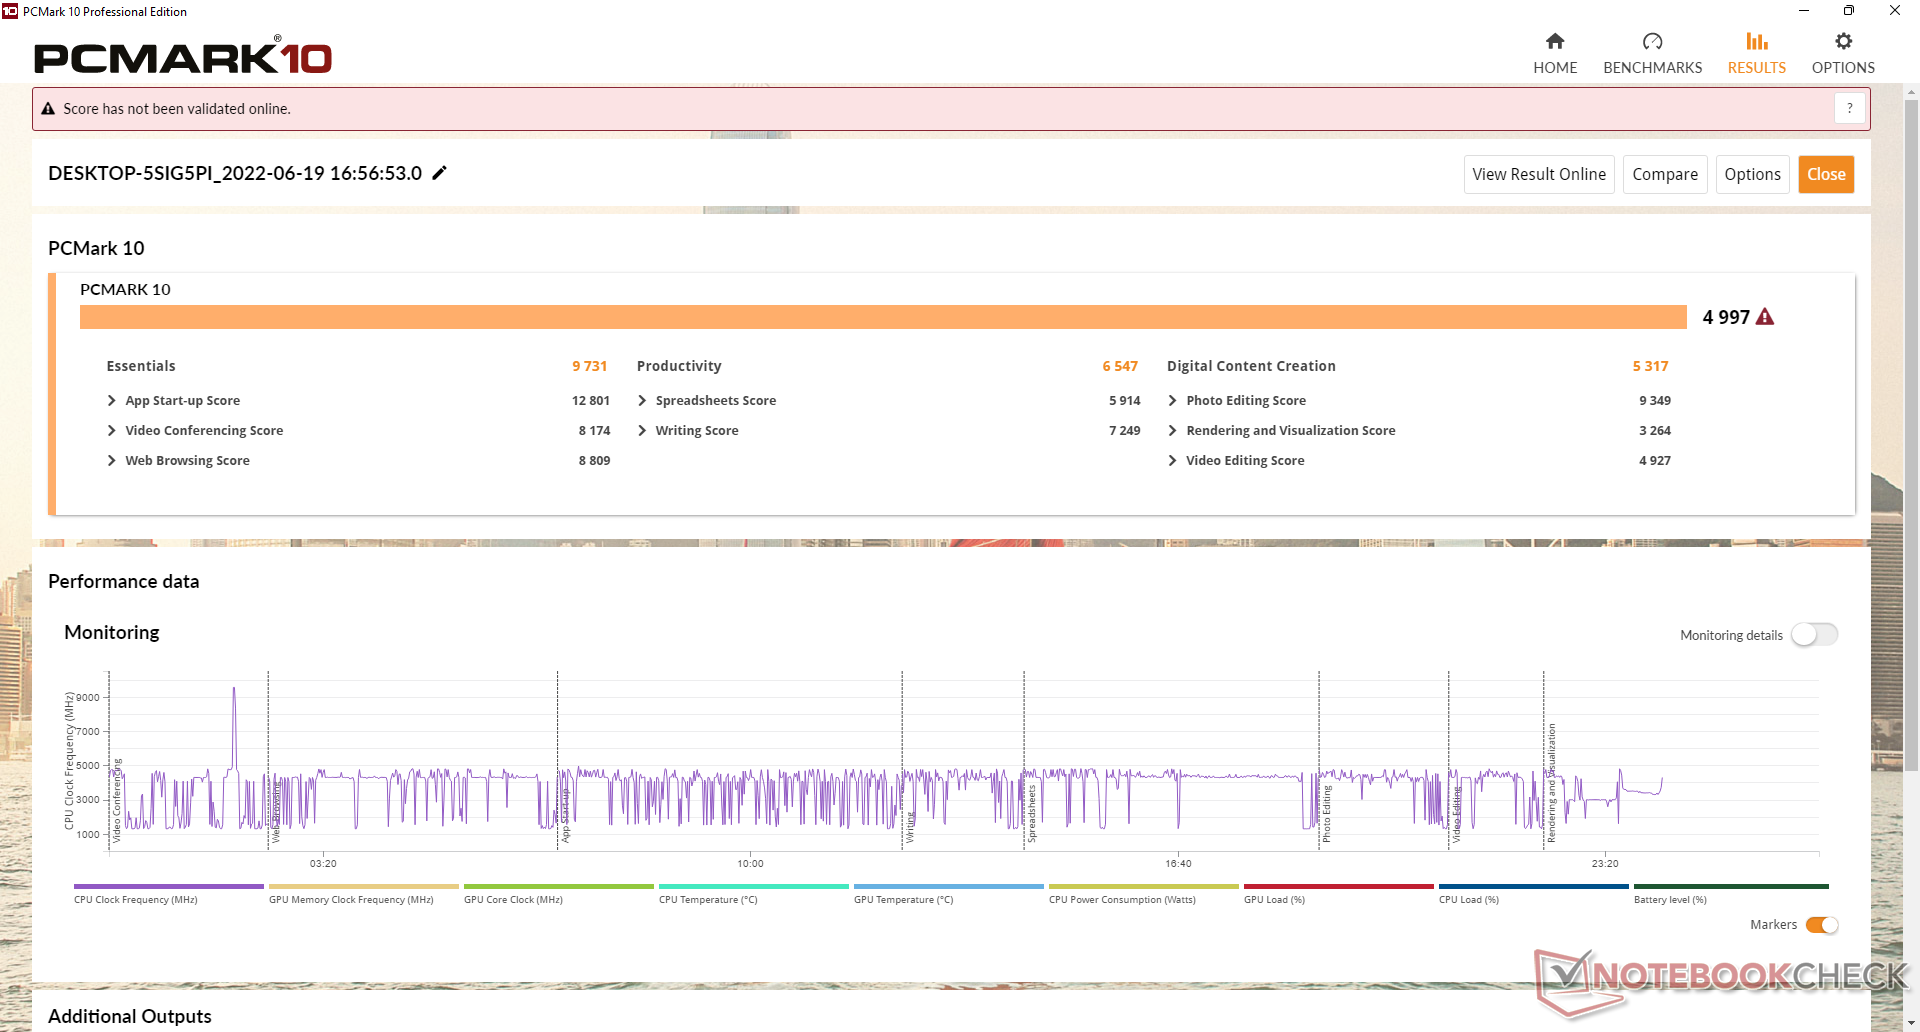
| PCMark 10 / Score | |
| Panasonic Toughbook FZ-55 MK2 | |
| Média Intel Core i7-1185G7, Intel Iris Xe Graphics G7 96EUs (4746 - 5561, n=20) | |
| Panasonic Toughbook 40 | |
| Durabook S14I | |
| Getac S410 Gen 4 | |
| Acer Enduro Urban N3 EUN314 | |
| Dell Latitude 5420 Rugged-P85G | |
| PCMark 10 / Essentials | |
| Panasonic Toughbook FZ-55 MK2 | |
| Durabook S14I | |
| Getac S410 Gen 4 | |
| Média Intel Core i7-1185G7, Intel Iris Xe Graphics G7 96EUs (8279 - 10664, n=20) | |
| Panasonic Toughbook 40 | |
| Acer Enduro Urban N3 EUN314 | |
| Dell Latitude 5420 Rugged-P85G | |
| PCMark 10 / Productivity | |
| Dell Latitude 5420 Rugged-P85G | |
| Durabook S14I | |
| Média Intel Core i7-1185G7, Intel Iris Xe Graphics G7 96EUs (5799 - 8770, n=20) | |
| Panasonic Toughbook FZ-55 MK2 | |
| Panasonic Toughbook 40 | |
| Acer Enduro Urban N3 EUN314 | |
| Getac S410 Gen 4 | |
| PCMark 10 / Digital Content Creation | |
| Panasonic Toughbook 40 | |
| Panasonic Toughbook FZ-55 MK2 | |
| Média Intel Core i7-1185G7, Intel Iris Xe Graphics G7 96EUs (4424 - 5684, n=20) | |
| Getac S410 Gen 4 | |
| Acer Enduro Urban N3 EUN314 | |
| Durabook S14I | |
| Dell Latitude 5420 Rugged-P85G | |
| CrossMark / Overall | |
| Média Intel Core i7-1185G7, Intel Iris Xe Graphics G7 96EUs (1233 - 1474, n=5) | |
| Panasonic Toughbook 40 | |
| Getac S410 Gen 4 | |
| CrossMark / Productivity | |
| Média Intel Core i7-1185G7, Intel Iris Xe Graphics G7 96EUs (1277 - 1506, n=5) | |
| Panasonic Toughbook 40 | |
| Getac S410 Gen 4 | |
| CrossMark / Creativity | |
| Média Intel Core i7-1185G7, Intel Iris Xe Graphics G7 96EUs (1291 - 1513, n=5) | |
| Panasonic Toughbook 40 | |
| Getac S410 Gen 4 | |
| CrossMark / Responsiveness | |
| Média Intel Core i7-1185G7, Intel Iris Xe Graphics G7 96EUs (969 - 1411, n=5) | |
| Panasonic Toughbook 40 | |
| Getac S410 Gen 4 | |
| PCMark 10 Score | 4997 pontos | |
Ajuda | ||
| AIDA64 / Memory Copy | |
| Média Intel Core i7-1185G7 (36515 - 68450, n=20) | |
| Acer Enduro Urban N3 EUN314 | |
| Panasonic Toughbook FZ-55 MK2 | |
| Getac S410 Gen 4 | |
| Panasonic Toughbook 40 | |
| Durabook S14I | |
| AIDA64 / Memory Read | |
| Média Intel Core i7-1185G7 (38394 - 64291, n=20) | |
| Acer Enduro Urban N3 EUN314 | |
| Panasonic Toughbook FZ-55 MK2 | |
| Getac S410 Gen 4 | |
| Panasonic Toughbook 40 | |
| Durabook S14I | |
| AIDA64 / Memory Write | |
| Média Intel Core i7-1185G7 (37684 - 66873, n=20) | |
| Acer Enduro Urban N3 EUN314 | |
| Panasonic Toughbook FZ-55 MK2 | |
| Getac S410 Gen 4 | |
| Panasonic Toughbook 40 | |
| Durabook S14I | |
| AIDA64 / Memory Latency | |
| Panasonic Toughbook 40 | |
| Média Intel Core i7-1185G7 (78.3 - 117, n=22) | |
| Acer Enduro Urban N3 EUN314 | |
| Getac S410 Gen 4 | |
| Panasonic Toughbook FZ-55 MK2 | |
| Durabook S14I | |
* ... menor é melhor
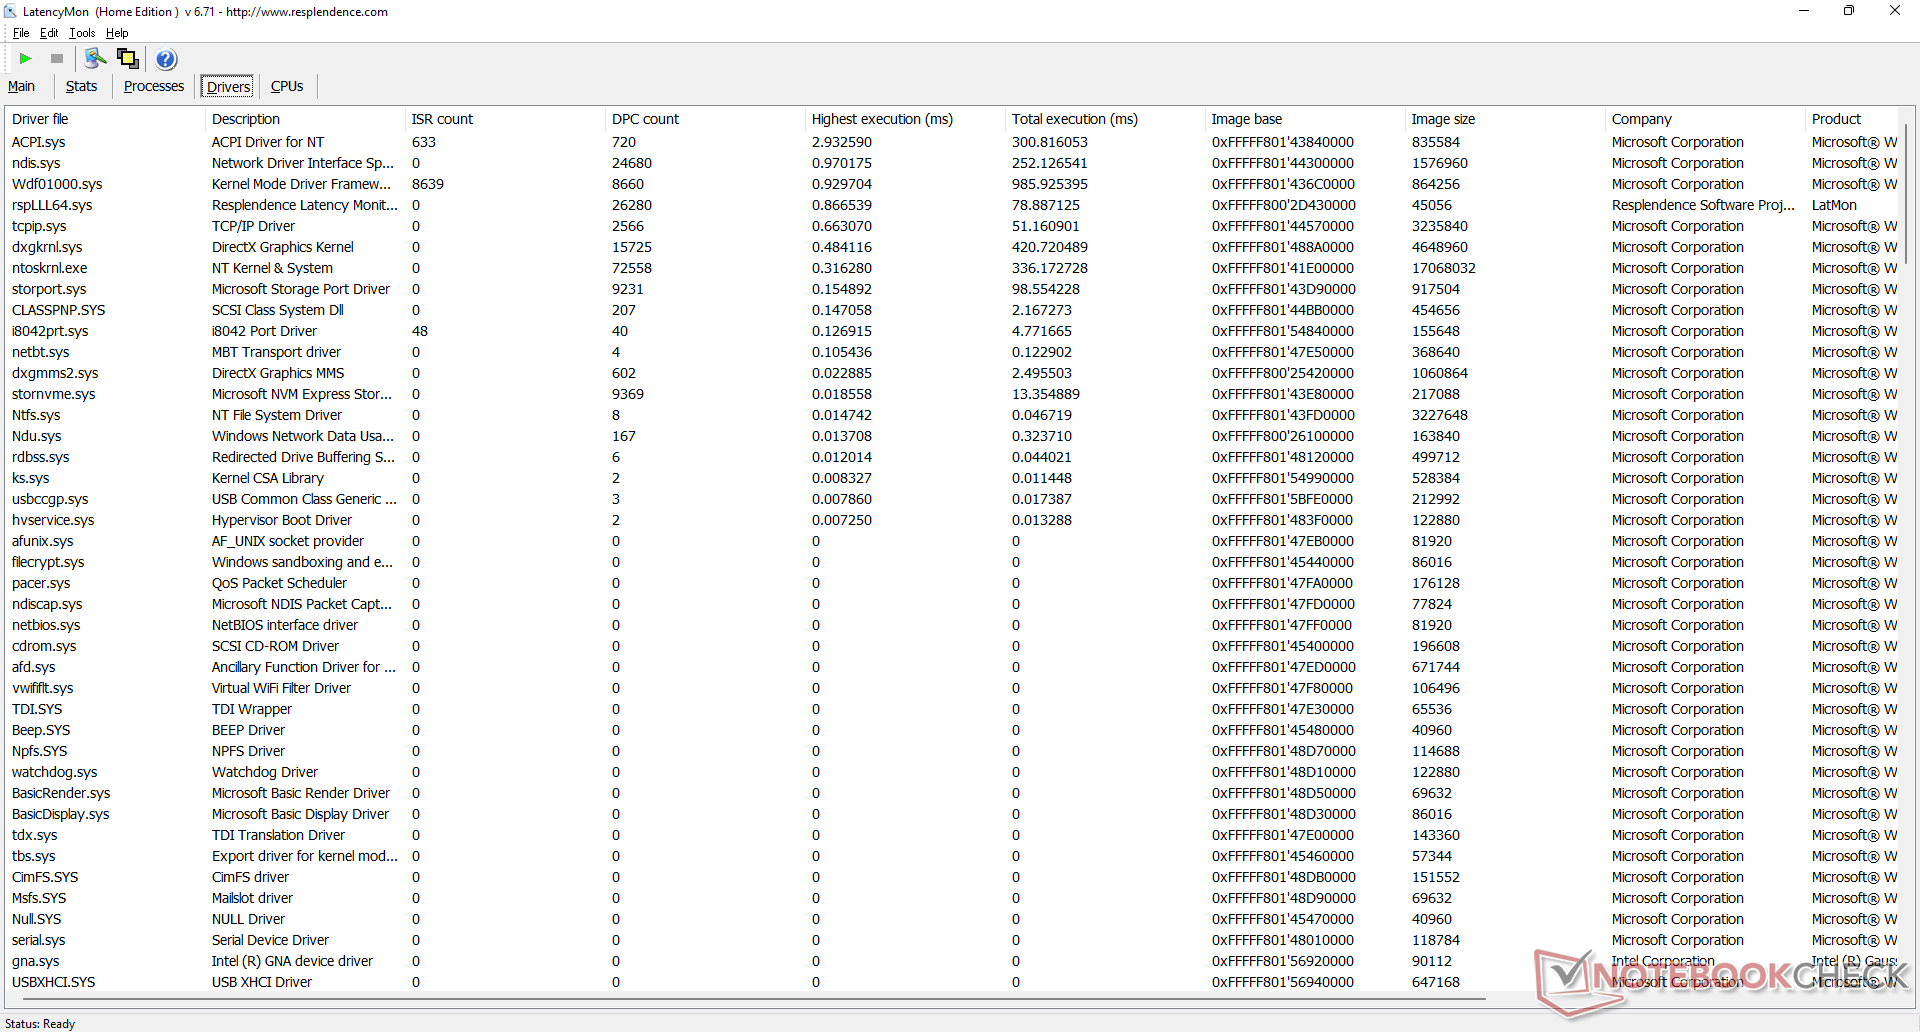
Latência do DPC
LatencyMon revela problemas de DPC ao abrir várias abas do navegador em nossa página inicial. a reprodução de vídeo de 4K a 60 FPS é, de outra forma, suave e sem qualquer queda de quadros.
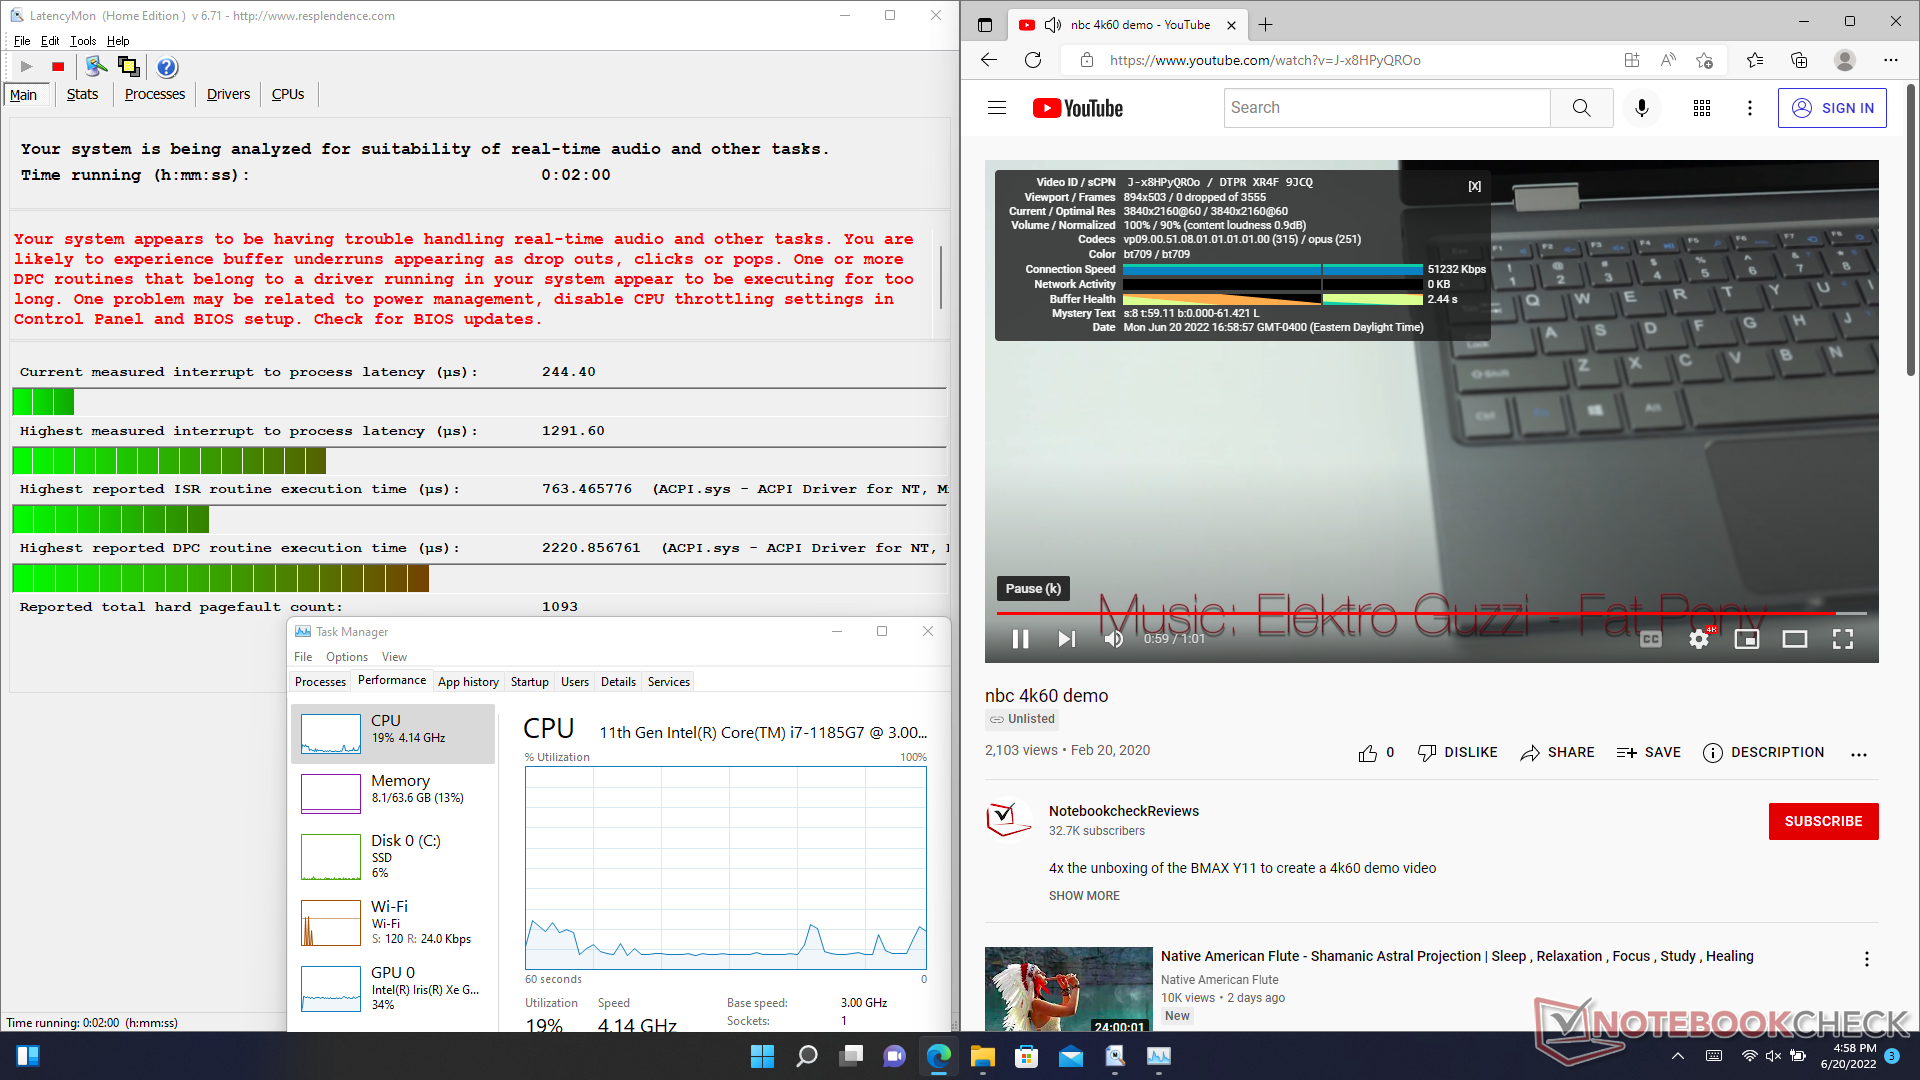
| DPC Latencies / LatencyMon - interrupt to process latency (max), Web, Youtube, Prime95 | |
| Acer Enduro Urban N3 EUN314 | |
| Panasonic Toughbook FZ-55 MK2 | |
| Durabook S14I | |
| Getac S410 Gen 4 | |
| Panasonic Toughbook 40 | |
* ... menor é melhor
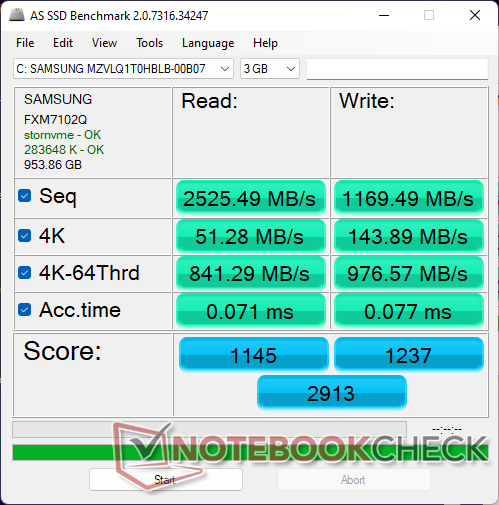
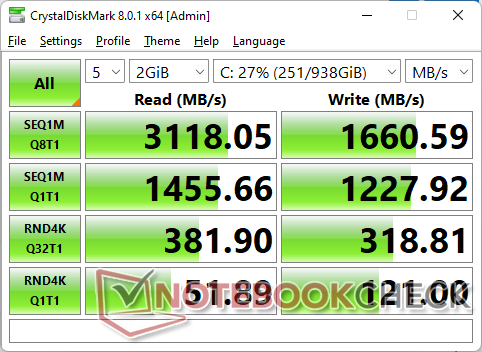
Dispositivos de armazenamento
Nossa unidade de teste vem com um Samsung PM991 PCIe3 x4 NVMe SSD. Um drive SATA secundário opcional também pode ser instalado, utilizando um dos slots xPAK. Ambos os drives são conectados ao laptop através de slots de liberação rápida
O SSD em nossa unidade é incapaz de manter suas taxas máximas de transferência por períodos prolongados, provavelmente devido à fraca dissipação de calor. Ao executar o DiskSpd em um loop, as taxas de transferência começariam altas a 3000 MB/s antes de caírem de forma constante e eventualmente se estabilizariam em apenas ~1700 MB/s.

| Drive Performance rating - Percent | |
| Acer Enduro Urban N3 EUN314 | |
| Durabook S14I | |
| Panasonic Toughbook 40 | |
| Dell Latitude 5420 Rugged-P85G -8! | |
| Panasonic Toughbook FZ-55 MK2 | |
| Getac S410 Gen 4 | |
* ... menor é melhor
Disk Throttling: DiskSpd Read Loop, Queue Depth 8
Desempenho da GPU
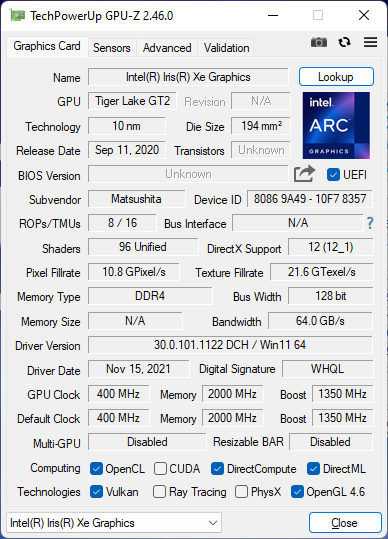
A integração Iris Xe 96 EUs está atuando onde esperamos que seja relativo a outros laptops com a mesma GPU. Tanto a performance quanto a performance por watt são significativamente maiores do que qualquer laptop robusto ainda rodando em notebooks mais antigos UHD 620 Gráficos.
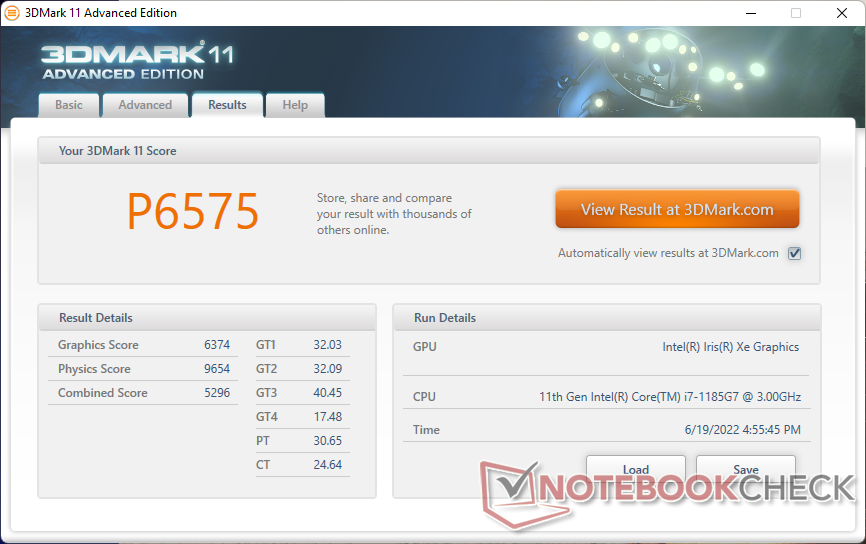
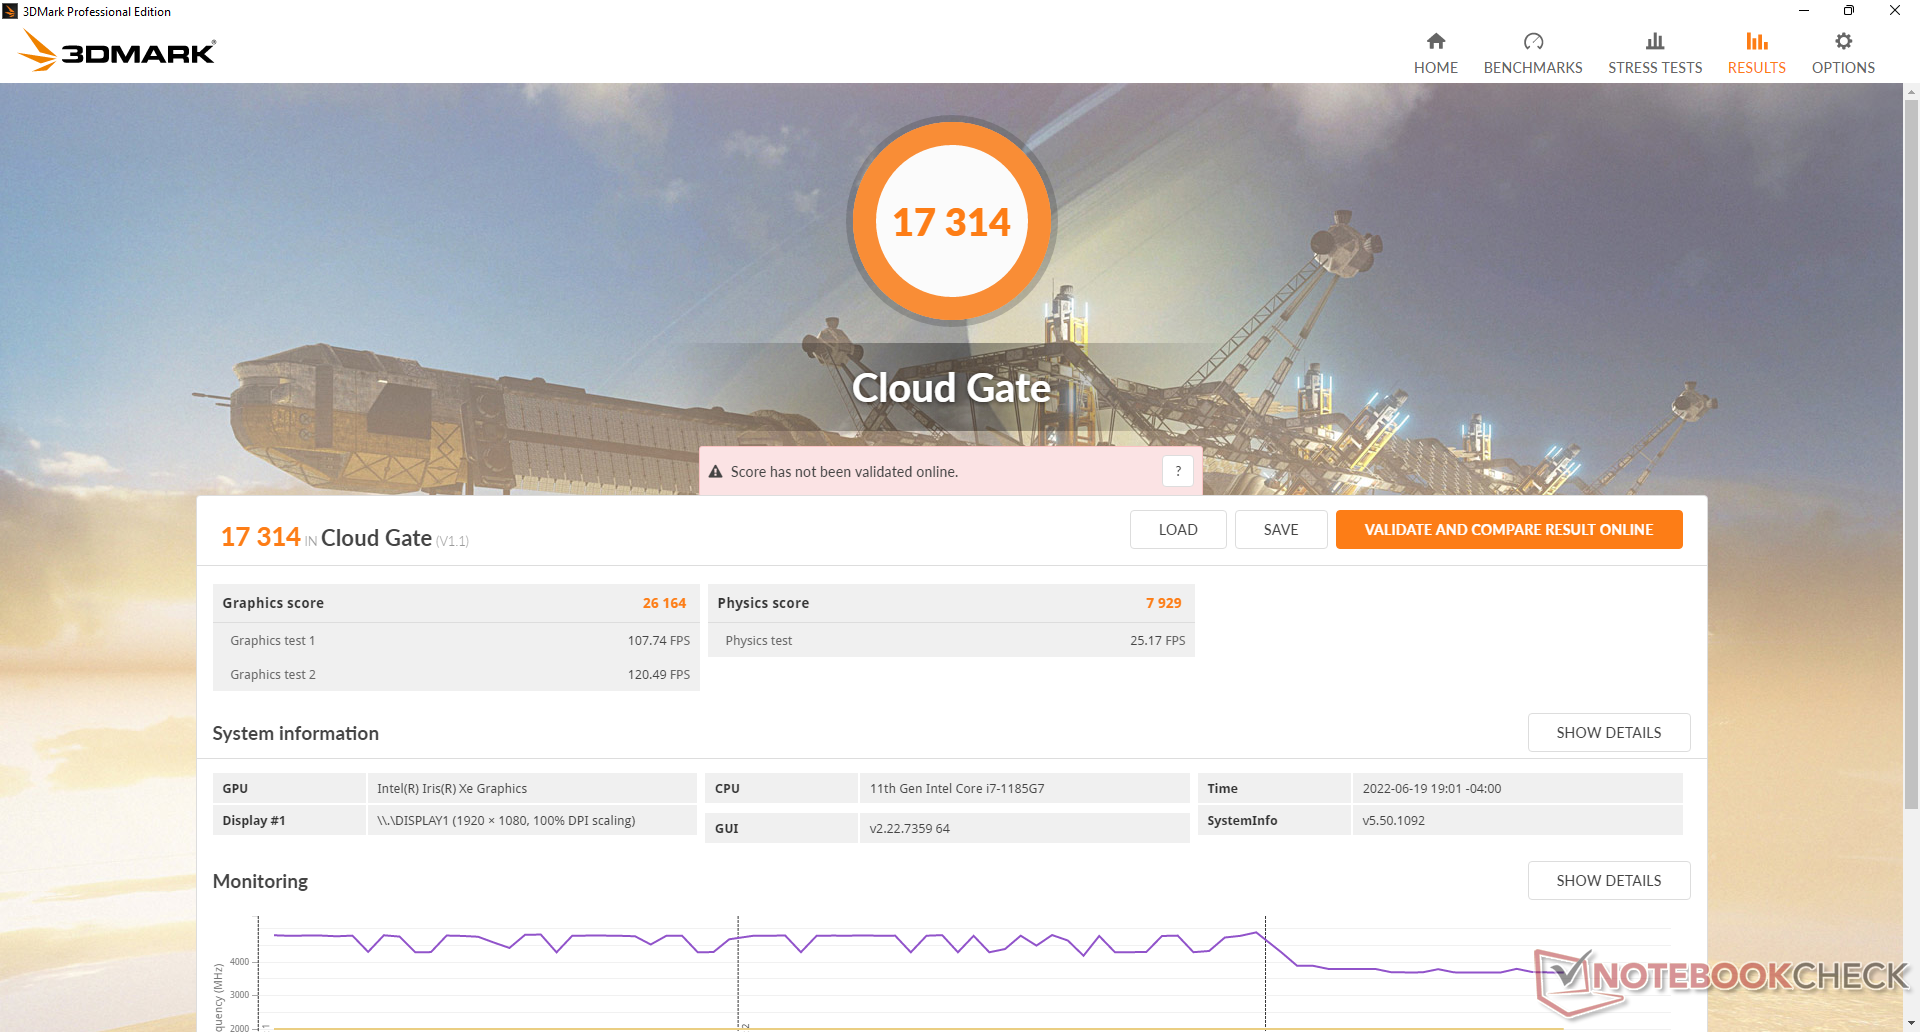
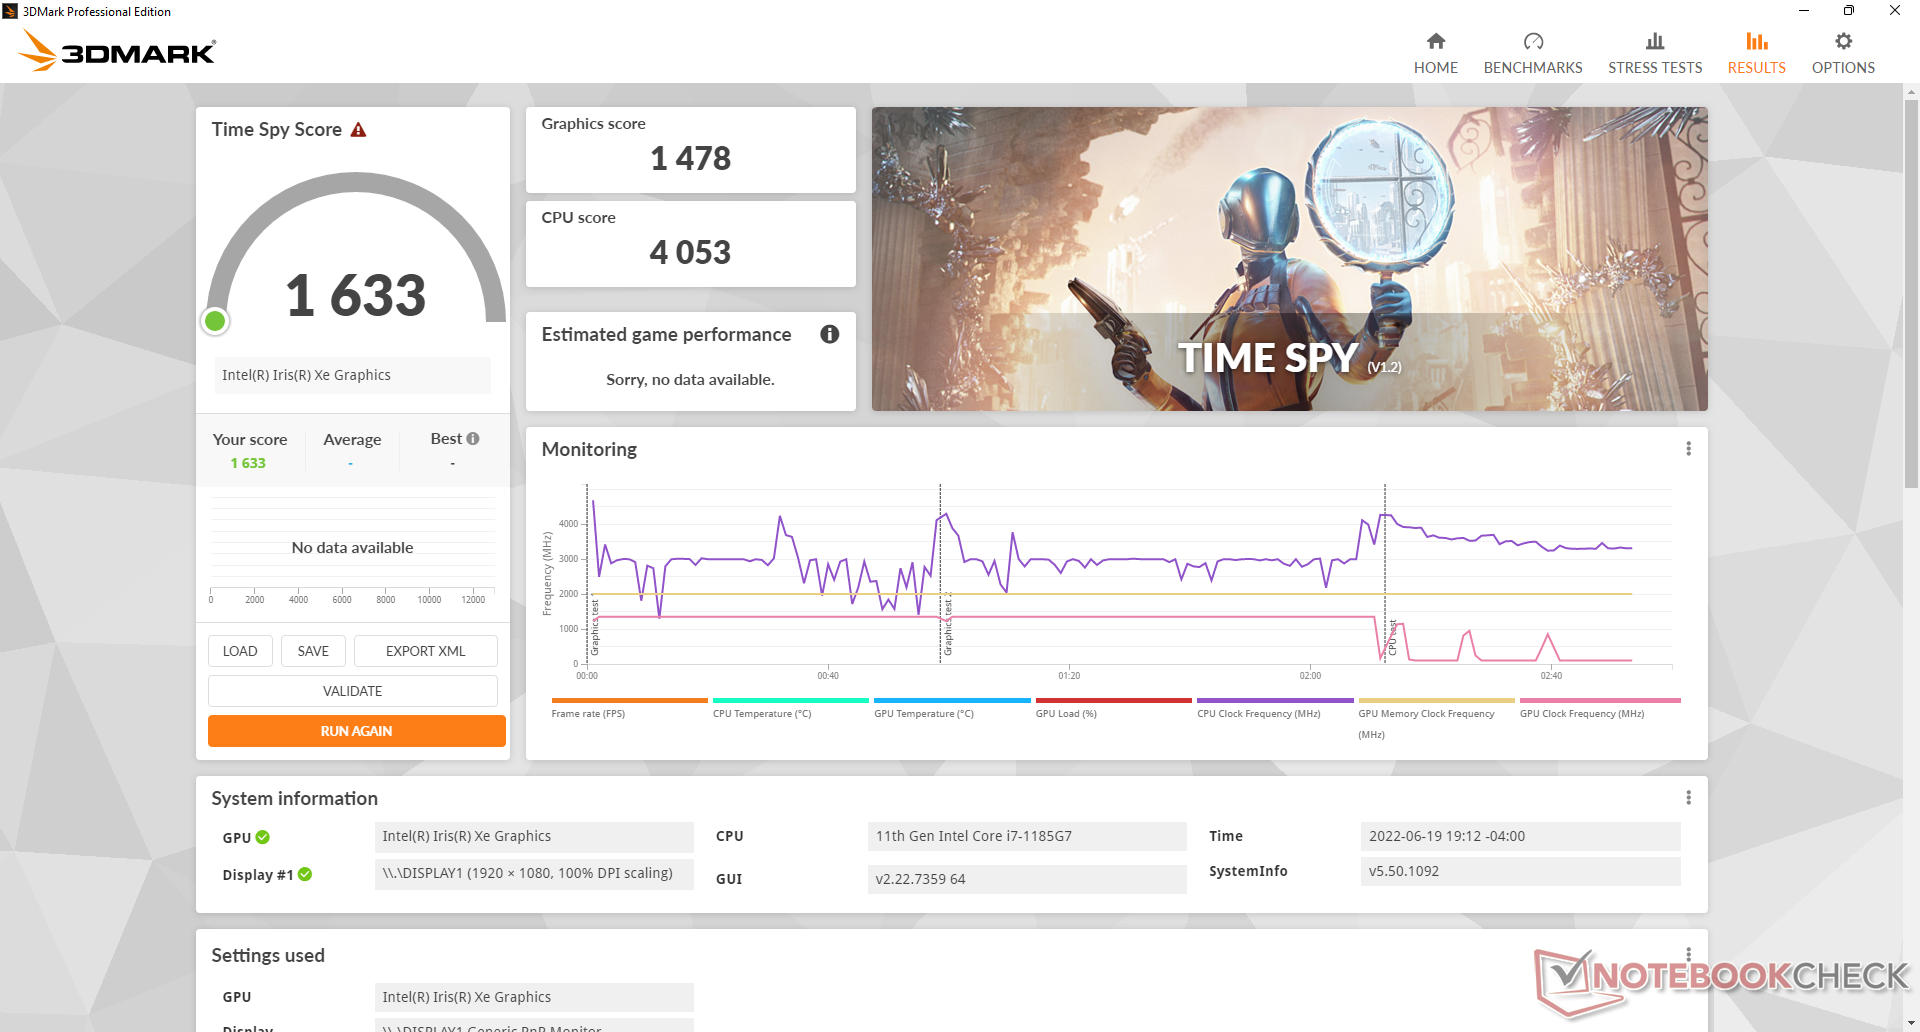
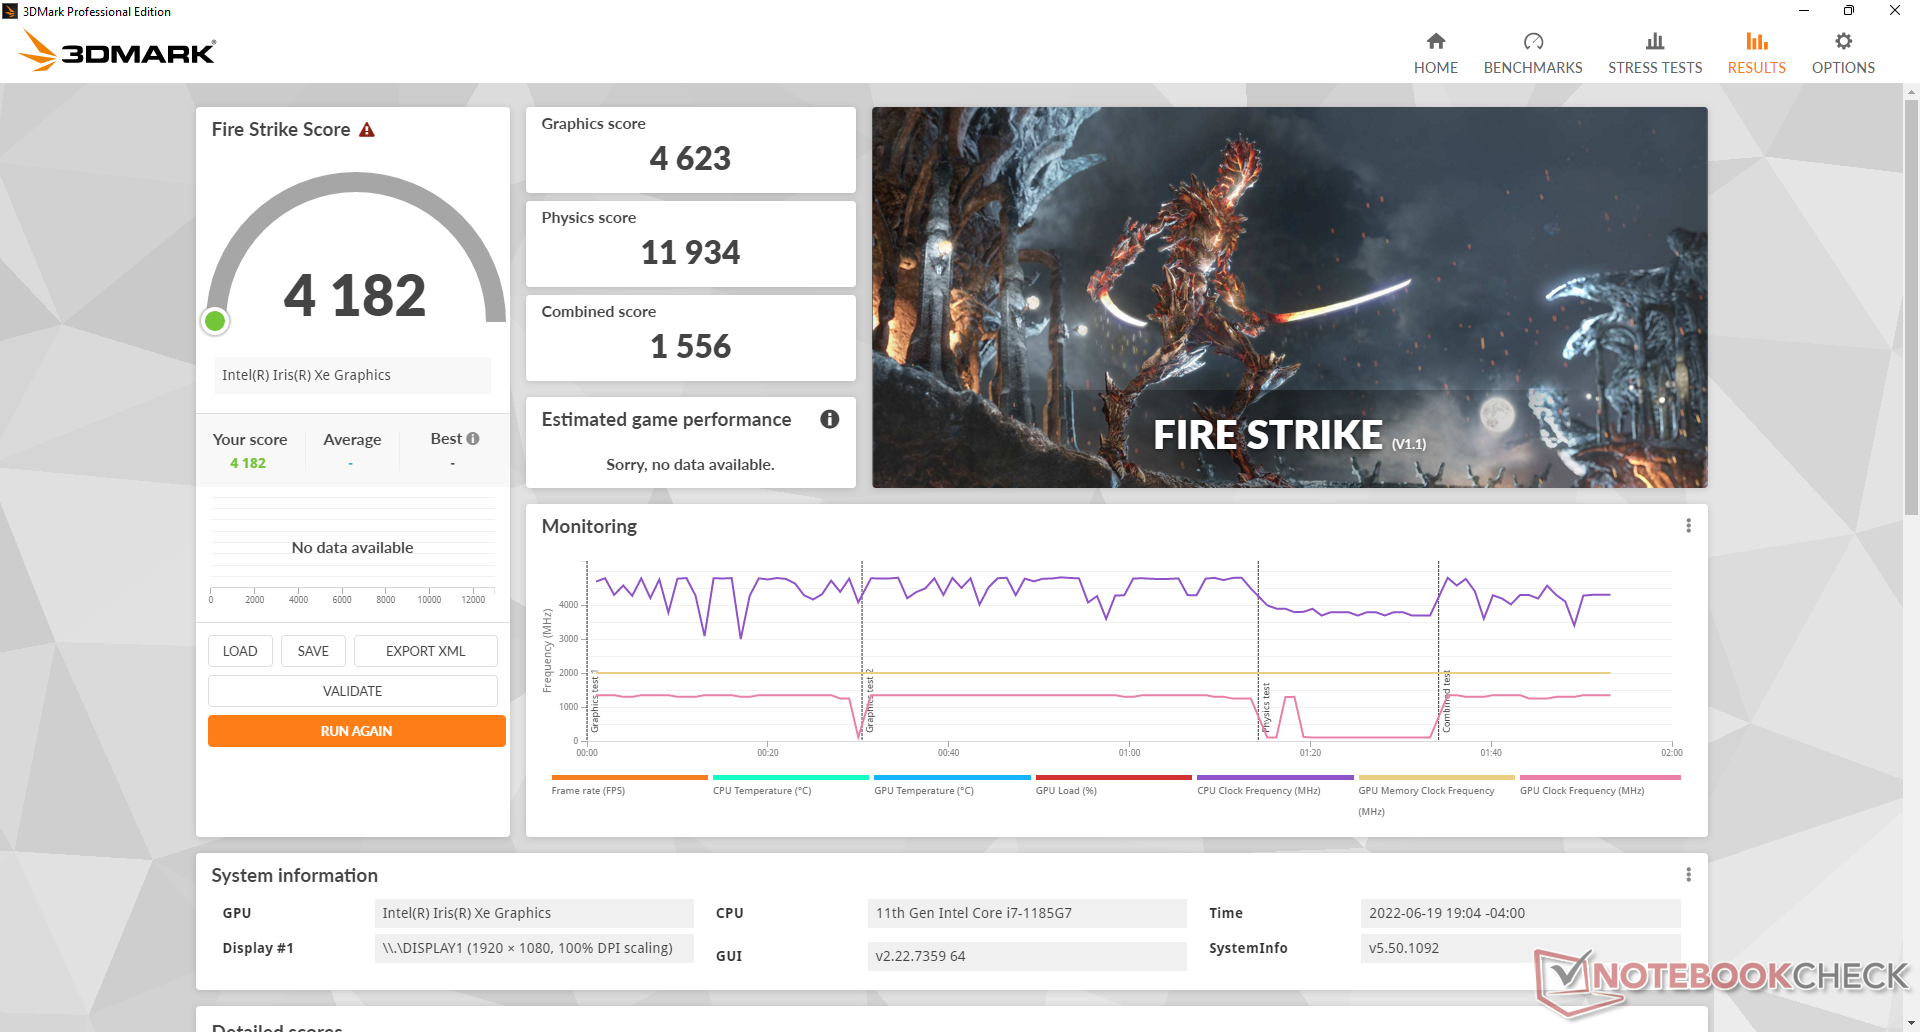
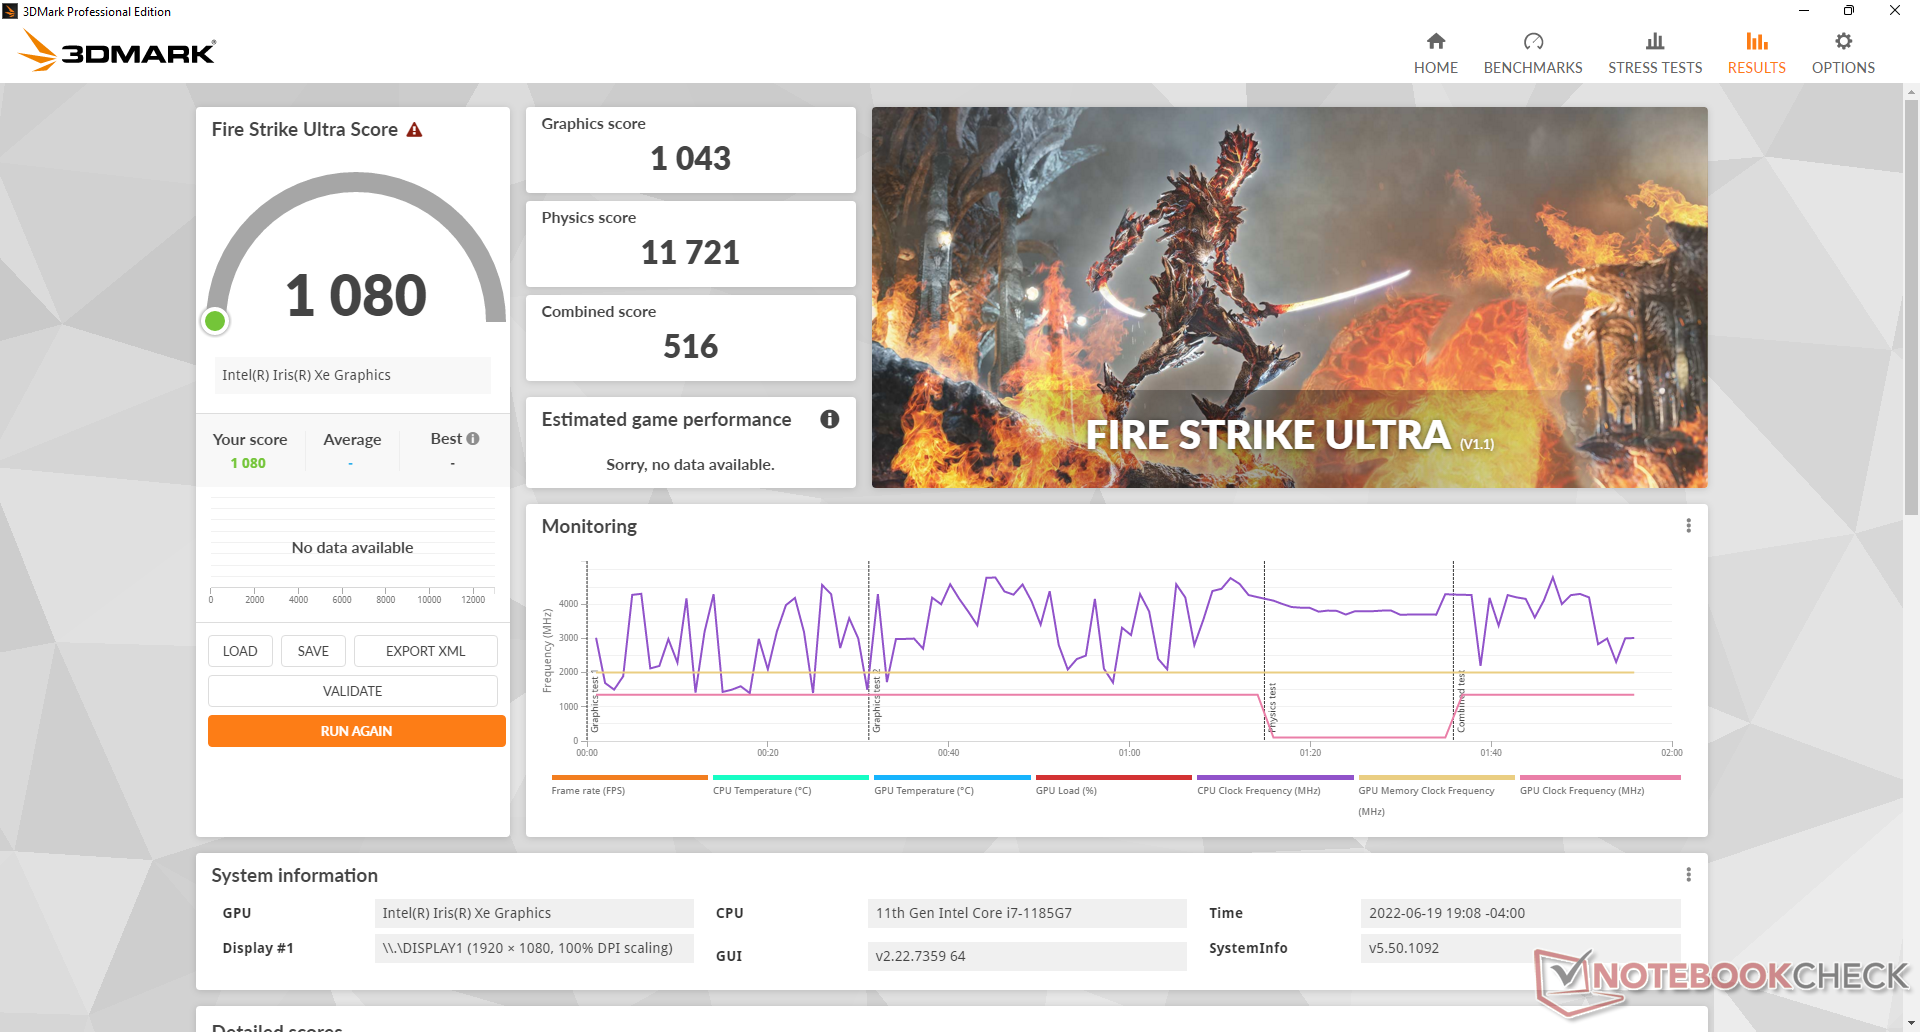
| 3DMark 11 Performance | 6575 pontos | |
| 3DMark Cloud Gate Standard Score | 17314 pontos | |
| 3DMark Fire Strike Score | 4182 pontos | |
| 3DMark Time Spy Score | 1633 pontos | |
Ajuda | ||
Witcher 3 FPS Chart
| baixo | média | alto | ultra | |
|---|---|---|---|---|
| The Witcher 3 (2015) | 85.9 | 54.2 | 29.5 | 14.8 |
| Dota 2 Reborn (2015) | 112.9 | 104.6 | 62.4 | 55.5 |
| Final Fantasy XV Benchmark (2018) | 40.1 | 21.3 | 15.5 | |
| X-Plane 11.11 (2018) | 24.8 | 23.3 | 25.9 | |
| Cyberpunk 2077 1.6 (2022) | 21.1 | 17.2 | 13 | 10.5 |
Emissões
Ruído do sistema
O ventilador está sempre ativo em nossa experiência a 26 dB(A) contra um fundo silencioso de 22,8 dB(A), mesmo quando ocioso na área de trabalho. Podemos notar algum ruído eletrônico ou lamúria da bobina quando colocamos um ouvido perto das teclas do teclado também. Estes ruídos passivos não são, felizmente, suficientemente altos para serem motivo de qualquer preocupação durante a maioria dos cenários do mundo real
A execução da primeira cena de referência do 3DMark 06 induziria um ruído do ventilador de 37,6 dB(A) a ser mais alto e mais suave do que o que observamos no Toughbook FZ-55 MK2 e Getac S410 Gen 4, respectivamente. Espere este nível de ruído ao executar cargas exigentes.
Barulho
| Ocioso |
| 26 / 26 / 26 dB |
| Carga |
| 37.6 / 40.3 dB |
 | ||
30 dB silencioso 40 dB(A) audível 50 dB(A) ruidosamente alto |
||
min: | ||
| Panasonic Toughbook 40 Iris Xe G7 96EUs, i7-1185G7, Samsung PM991 MZVLQ1T0HALB | Panasonic Toughbook FZ-55 MK2 Iris Xe G7 96EUs, i7-1185G7, Toshiba KIOXIA KBG4AZNV512G M.2 2280 OPAL | Getac S410 Gen 4 Iris Xe G7 96EUs, i7-1185G7, SSSTC CA5-8D256 | Dell Latitude 5420 Rugged-P85G Radeon RX 540, i7-8650U, SK hynix PC401 NVMe 500 GB | Acer Enduro Urban N3 EUN314 Iris Xe G7 96EUs, i7-1165G7, Samsung PM991 MZVLQ1T0HALB | Durabook S14I Iris Xe G7 96EUs, i7-1165G7, UDinfo M2P M2P80DE512GBAEP | |
|---|---|---|---|---|---|---|
| Noise | 8% | -3% | -4% | 8% | -3% | |
| desligado / ambiente * (dB) | 22.8 | 23.8 -4% | 23.3 -2% | 28.3 -24% | 23.8 -4% | 25.2 -11% |
| Idle Minimum * (dB) | 26 | 24 8% | 23.5 10% | 28.3 -9% | 24.1 7% | 25.2 3% |
| Idle Average * (dB) | 26 | 24 8% | 23.5 10% | 28.3 -9% | 24.1 7% | 25.2 3% |
| Idle Maximum * (dB) | 26 | 24 8% | 28 -8% | 28.3 -9% | 24.1 7% | 34.5 -33% |
| Load Average * (dB) | 37.6 | 26.7 29% | 42.8 -14% | 29.9 20% | 27.9 26% | 34.5 8% |
| Witcher 3 ultra * (dB) | 37.8 | 42.3 -12% | 35.7 6% | |||
| Load Maximum * (dB) | 40.3 | 41.7 -3% | 42.6 -6% | 38 6% | 38.6 4% | 36.2 10% |
* ... menor é melhor
Temperatura
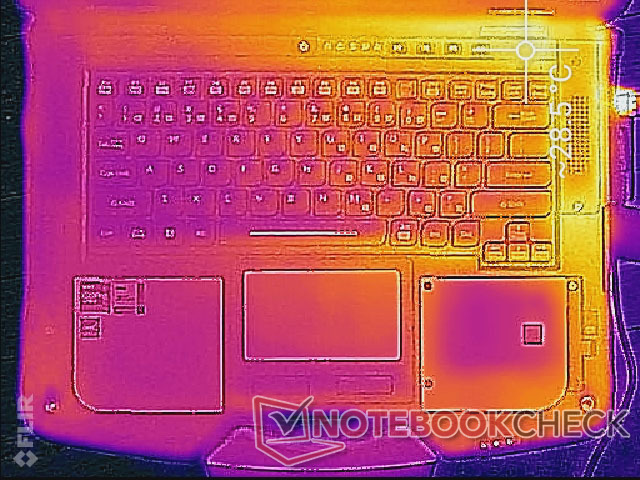
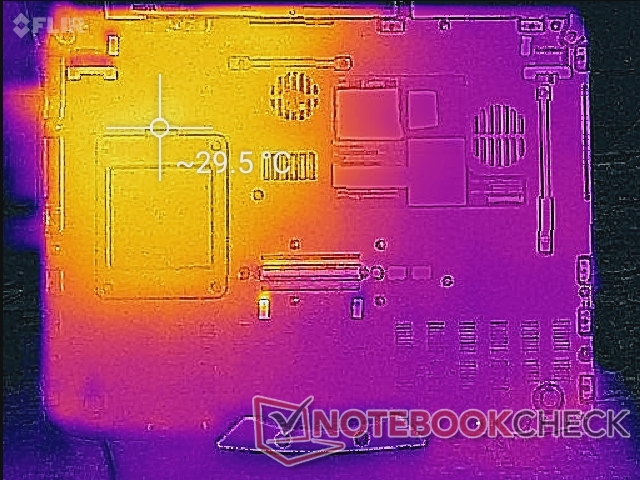
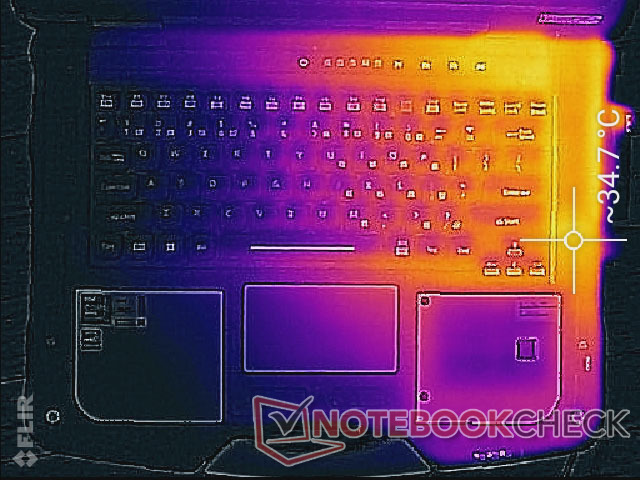
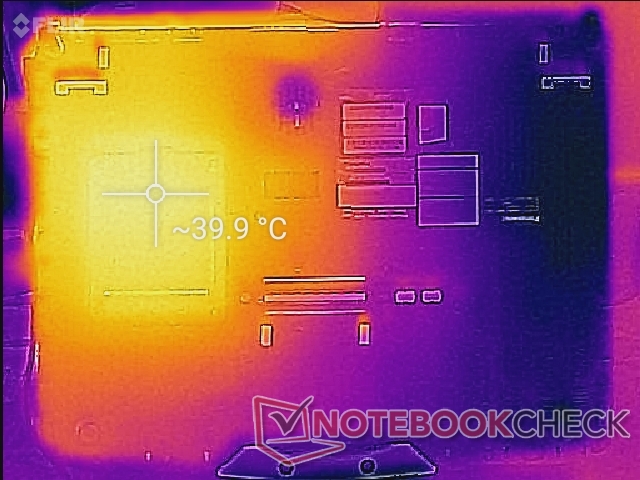
As temperaturas de superfície são geralmente frias devido à CPU da série Core U e ao projeto de chassis espessos. Afinal de contas, esta é a mesma CPU encontrada em muitos laptops de consumo mais finos. Os pontos quentes podem atingir 29 C e 40 C nos lados superior e inferior, respectivamente, depois de suportar cargas pesadas por longos períodos.
A metade direita do modelo Toughbook será sempre mais quente que a metade esquerda devido à forma como a CPU e a solução de resfriamento estão posicionadas no interior.
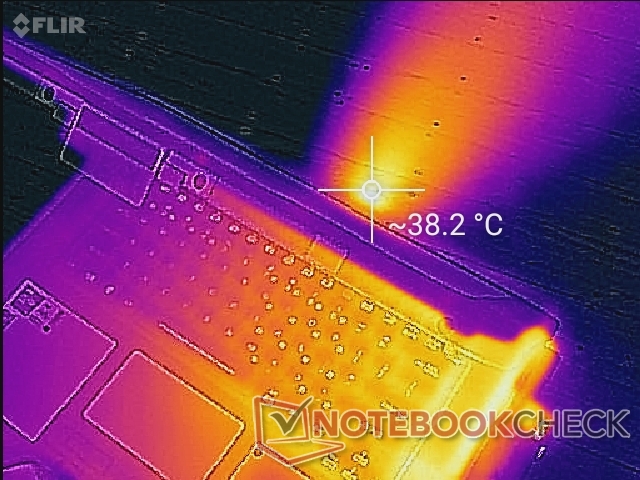
(+) A temperatura máxima no lado superior é 35.6 °C / 96 F, em comparação com a média de 34.3 °C / 94 F , variando de 21.2 a 62.5 °C para a classe Office.
(±) A parte inferior aquece até um máximo de 40 °C / 104 F, em comparação com a média de 36.8 °C / 98 F
(+) Em uso inativo, a temperatura média para o lado superior é 27.1 °C / 81 F, em comparação com a média do dispositivo de 29.5 °C / ### class_avg_f### F.
(+) Os apoios para as mãos e o touchpad são mais frios que a temperatura da pele, com um máximo de 29 °C / 84.2 F e, portanto, são frios ao toque.
(±) A temperatura média da área do apoio para as mãos de dispositivos semelhantes foi 27.5 °C / 81.5 F (-1.5 °C / -2.7 F).
| Panasonic Toughbook 40 Intel Core i7-1185G7, Intel Iris Xe Graphics G7 96EUs | Panasonic Toughbook FZ-55 MK2 Intel Core i7-1185G7, Intel Iris Xe Graphics G7 96EUs | Getac S410 Gen 4 Intel Core i7-1185G7, Intel Iris Xe Graphics G7 96EUs | Dell Latitude 5420 Rugged-P85G Intel Core i7-8650U, AMD Radeon RX 540 | Acer Enduro Urban N3 EUN314 Intel Core i7-1165G7, Intel Iris Xe Graphics G7 96EUs | Durabook S14I Intel Core i7-1165G7, Intel Iris Xe Graphics G7 96EUs | |
|---|---|---|---|---|---|---|
| Heat | -8% | -13% | -11% | -4% | -7% | |
| Maximum Upper Side * (°C) | 35.6 | 36.2 -2% | 36 -1% | 42.2 -19% | 37.8 -6% | 36.4 -2% |
| Maximum Bottom * (°C) | 40 | 42.2 -6% | 46.8 -17% | 42 -5% | 45.8 -15% | 38.6 3% |
| Idle Upper Side * (°C) | 28.6 | 31 -8% | 30 -5% | 31.6 -10% | 26.4 8% | 32.6 -14% |
| Idle Bottom * (°C) | 29.4 | 34 -16% | 38.2 -30% | 31.8 -8% | 30.2 -3% | 33.8 -15% |
* ... menor é melhor
Teste de estresse
Ao rodar Prime95 para enfatizar a CPU, as taxas do relógio e a temperatura central aumentariam para 3,1 GHz e 100 C por apenas uma fração de segundo, respectivamente, antes de cair constantemente para 2,6 e ~95 C. A energia do pacote da CPU chegaria a 40 W durante o início do teste antes de se estabilizar em 28 W. Ao rodar este mesmo teste na Durabook S14I com uma CPU Core i7-1165G7 resultaria em uma temperatura de núcleo muito mais fria e estável de 63 C, embora a uma taxa de relógio mais lenta de 1,8 GHz. É claro que nosso modelo Panasonic está favorecendo o desempenho da CPU mesmo que isso signifique um processador muito mais quente no processo.
Quando em funcionamento Witcher 3 para representar cargas exigentes, a temperatura do processador se estabilizaria em 83 C, que é mais quente que no Durabook (68 C) acima mencionado, mas mais fria que no Getac S410 Gen 4 (95 C).
O funcionamento com energia de bateria não limitará o desempenho. Um teste 3DMark 11 com baterias devolveria pontuações semelhantes ao funcionamento em rede.
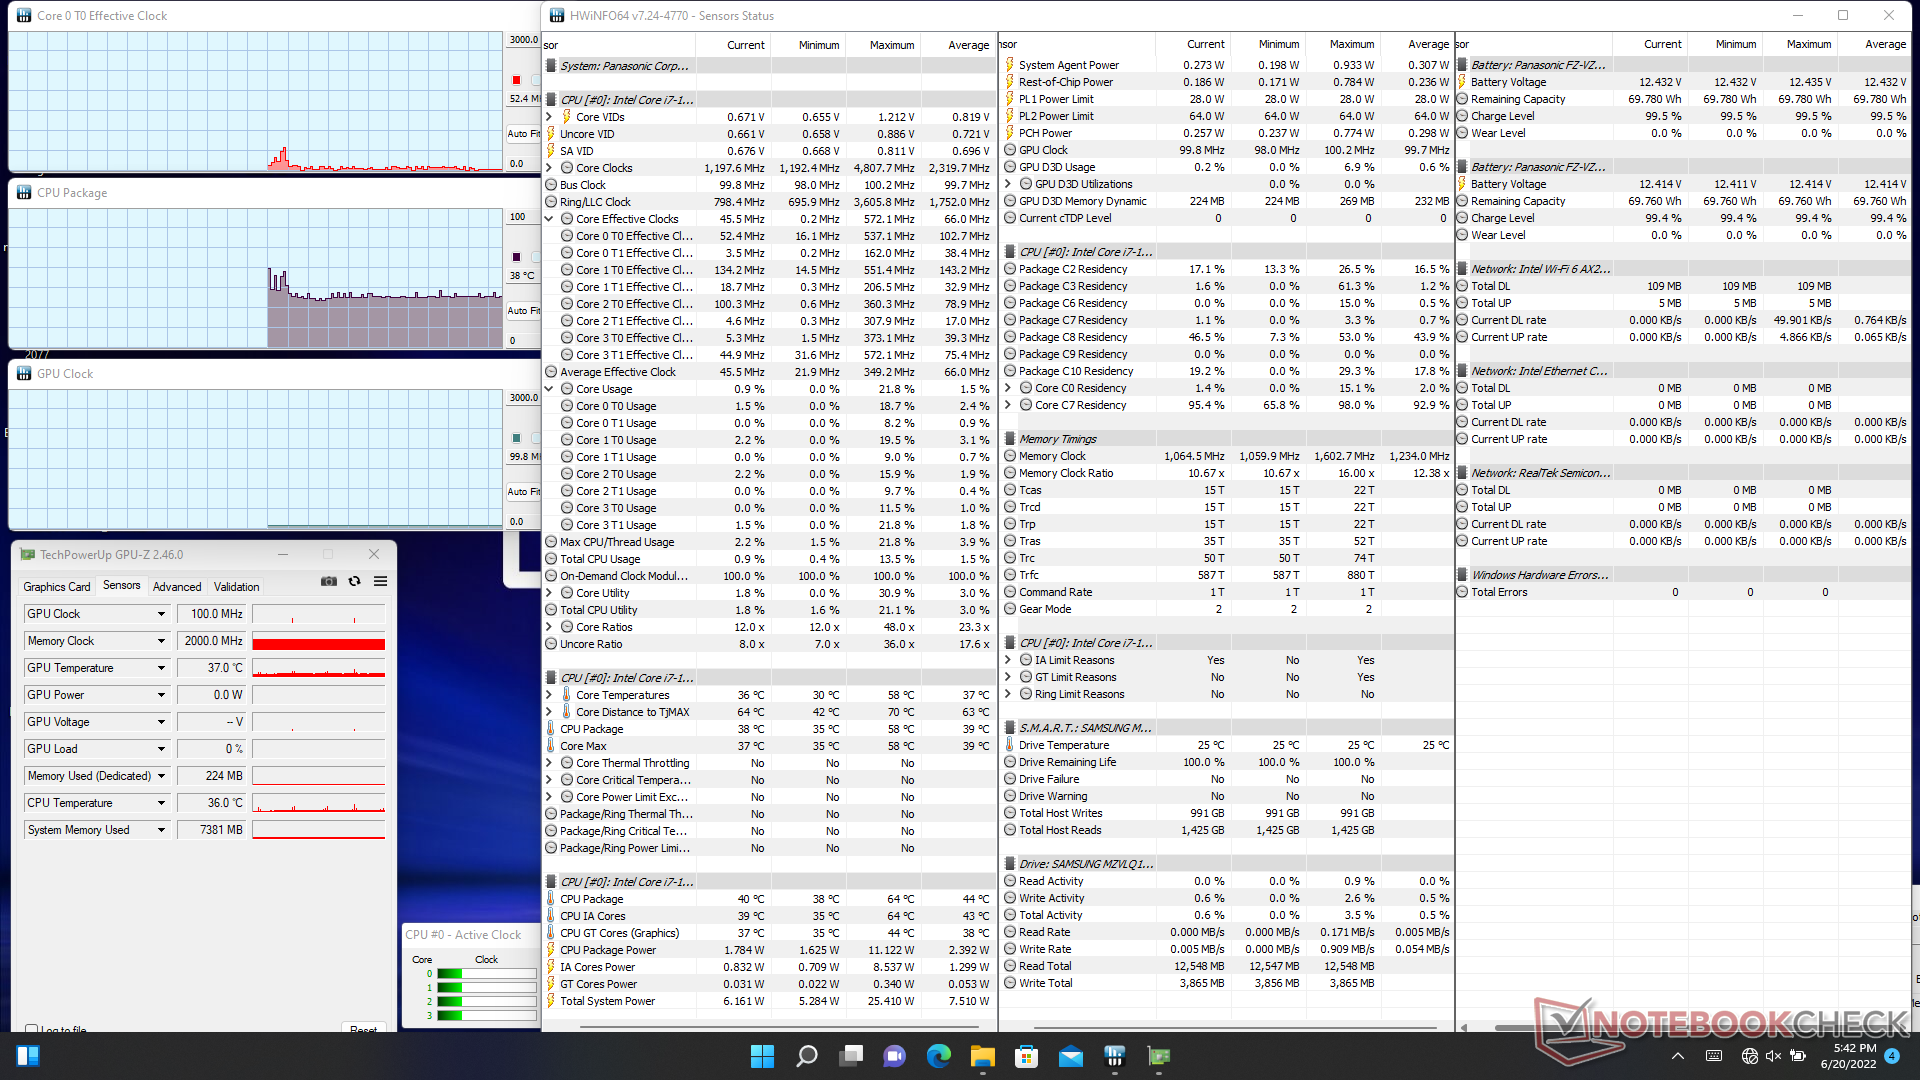
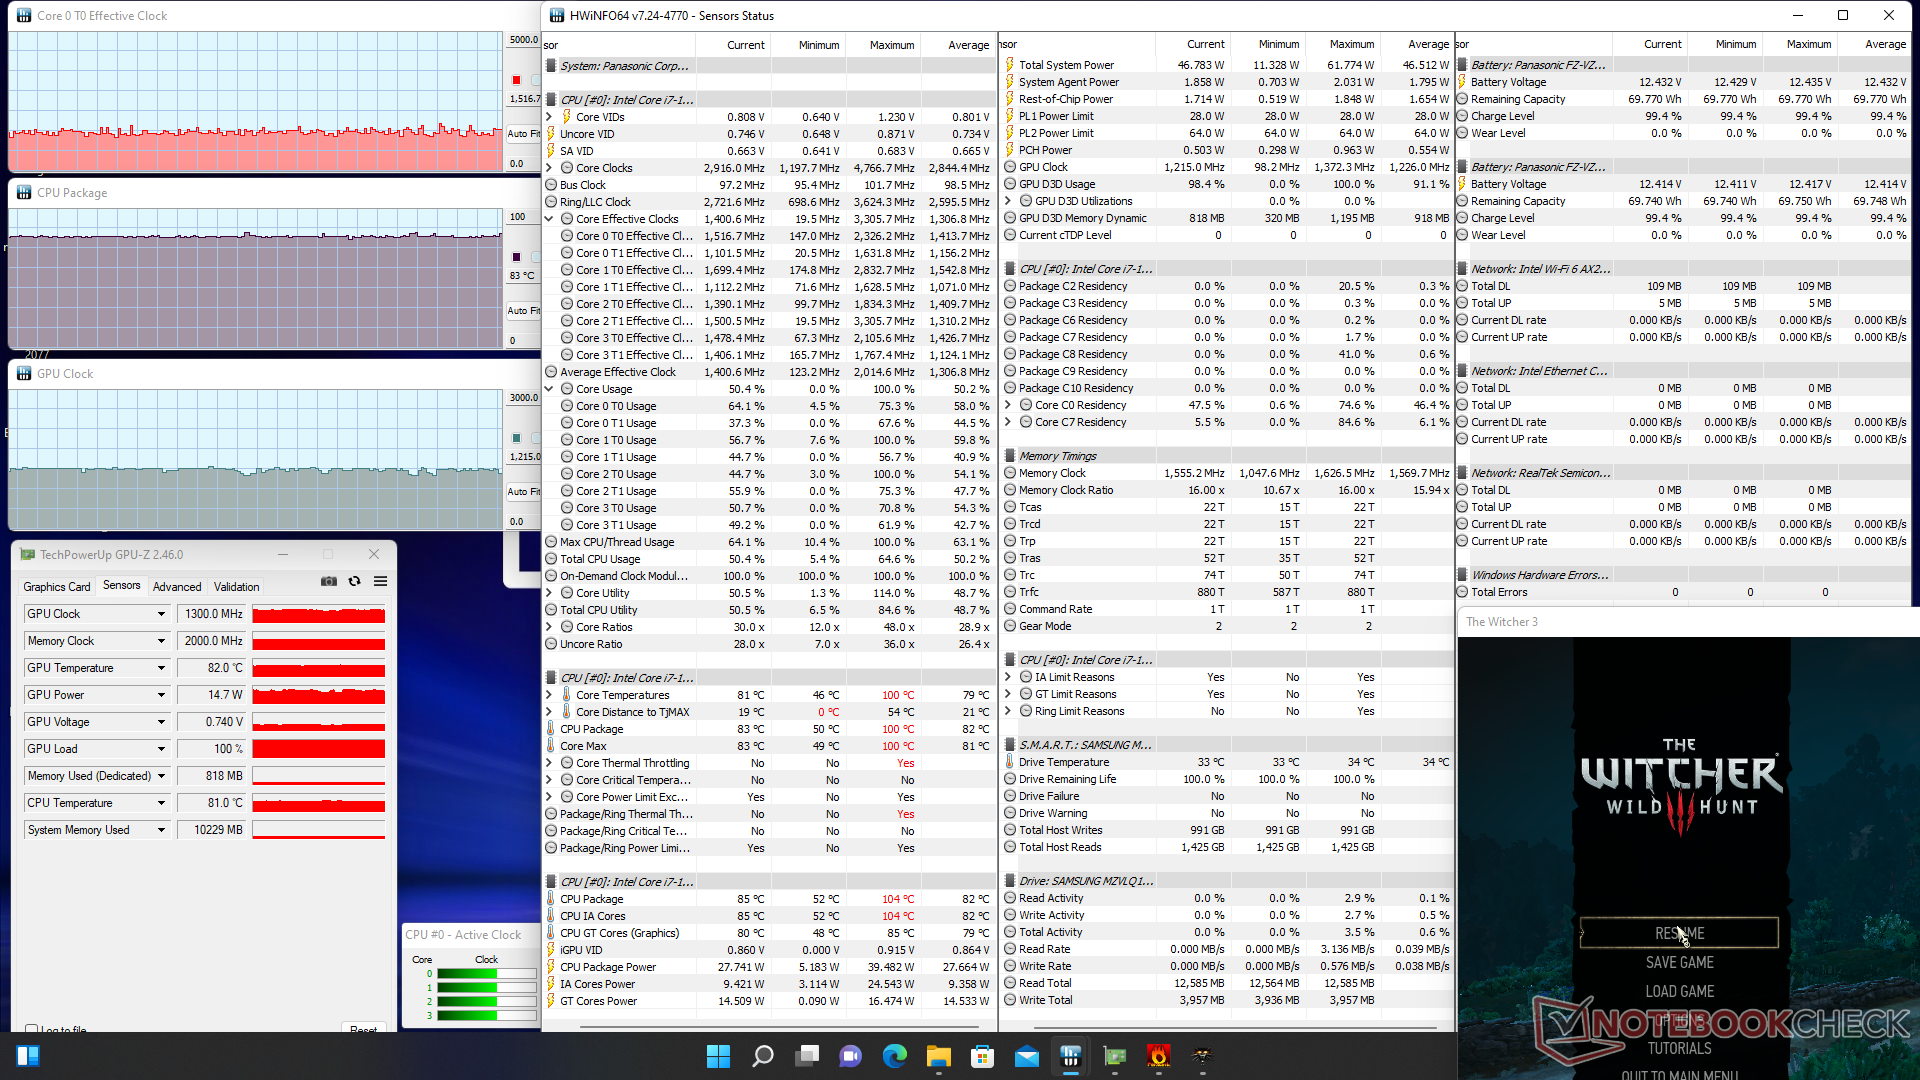
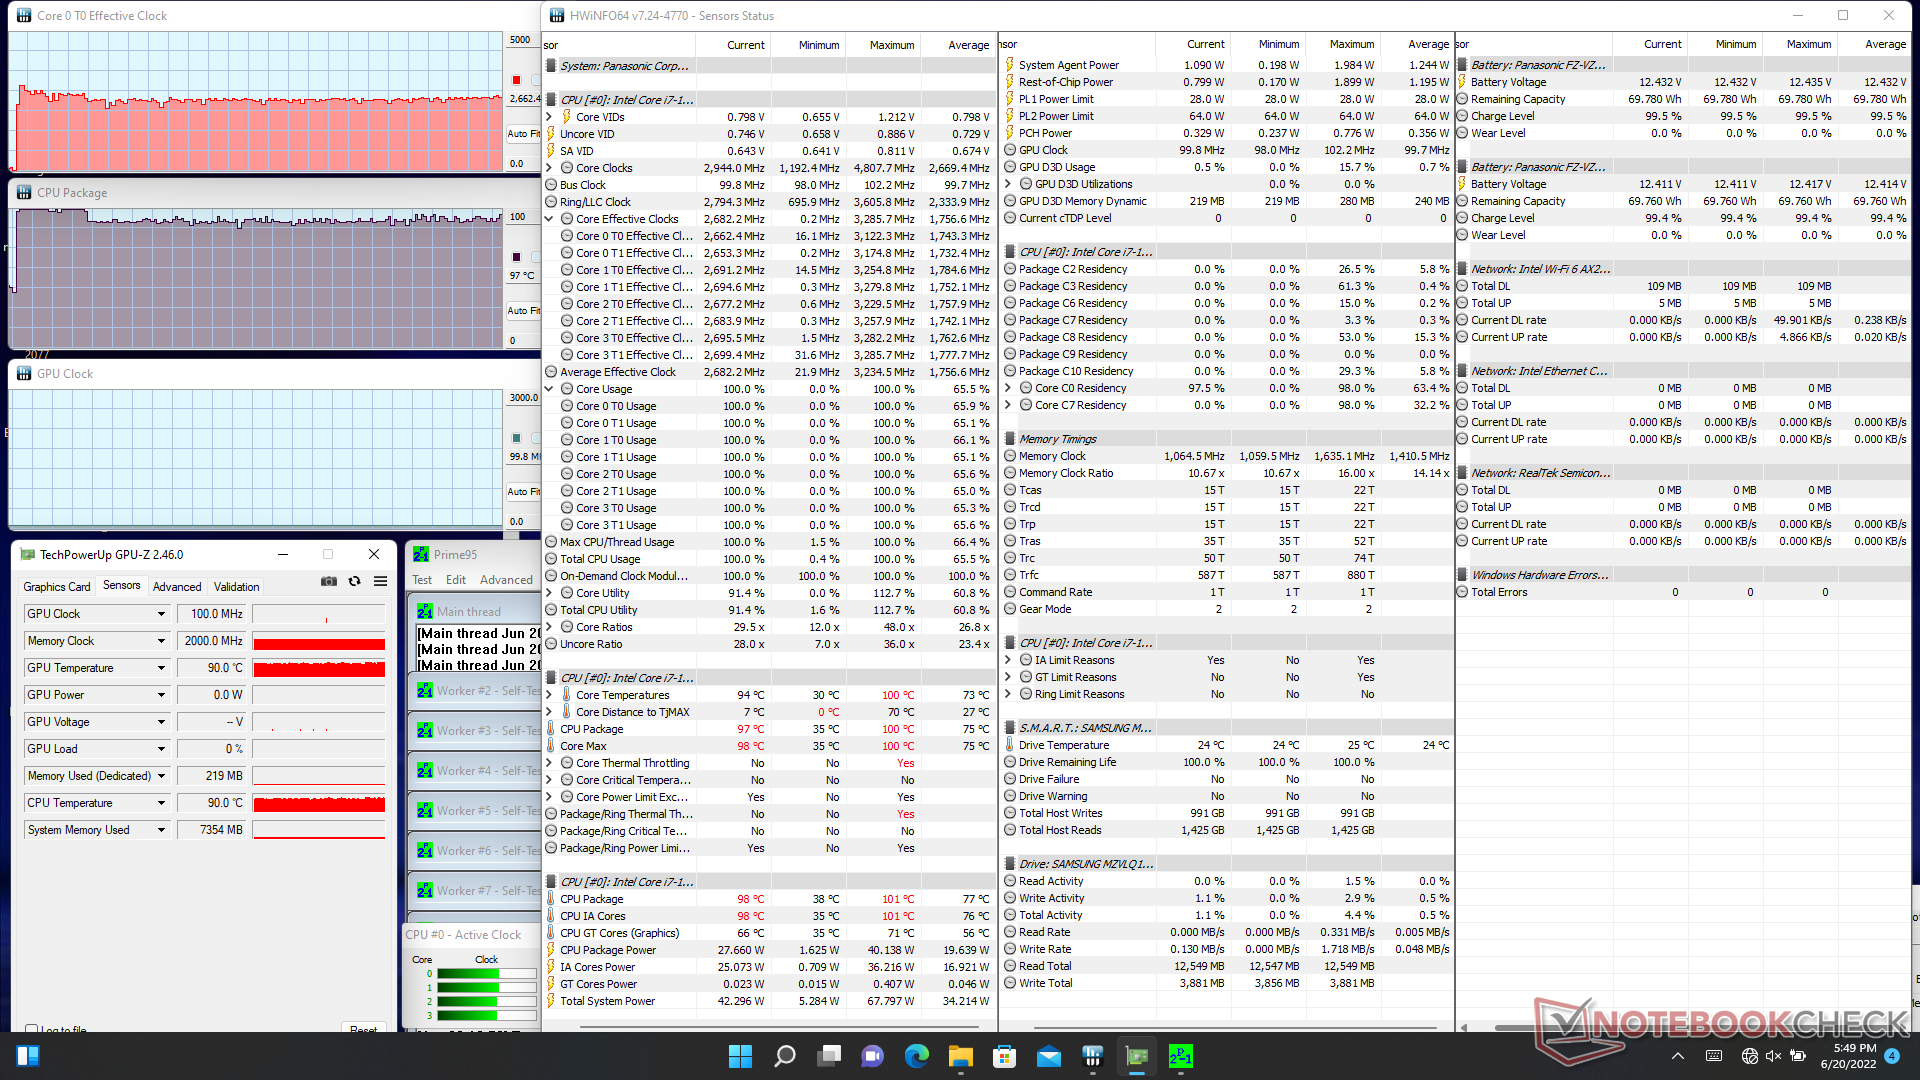
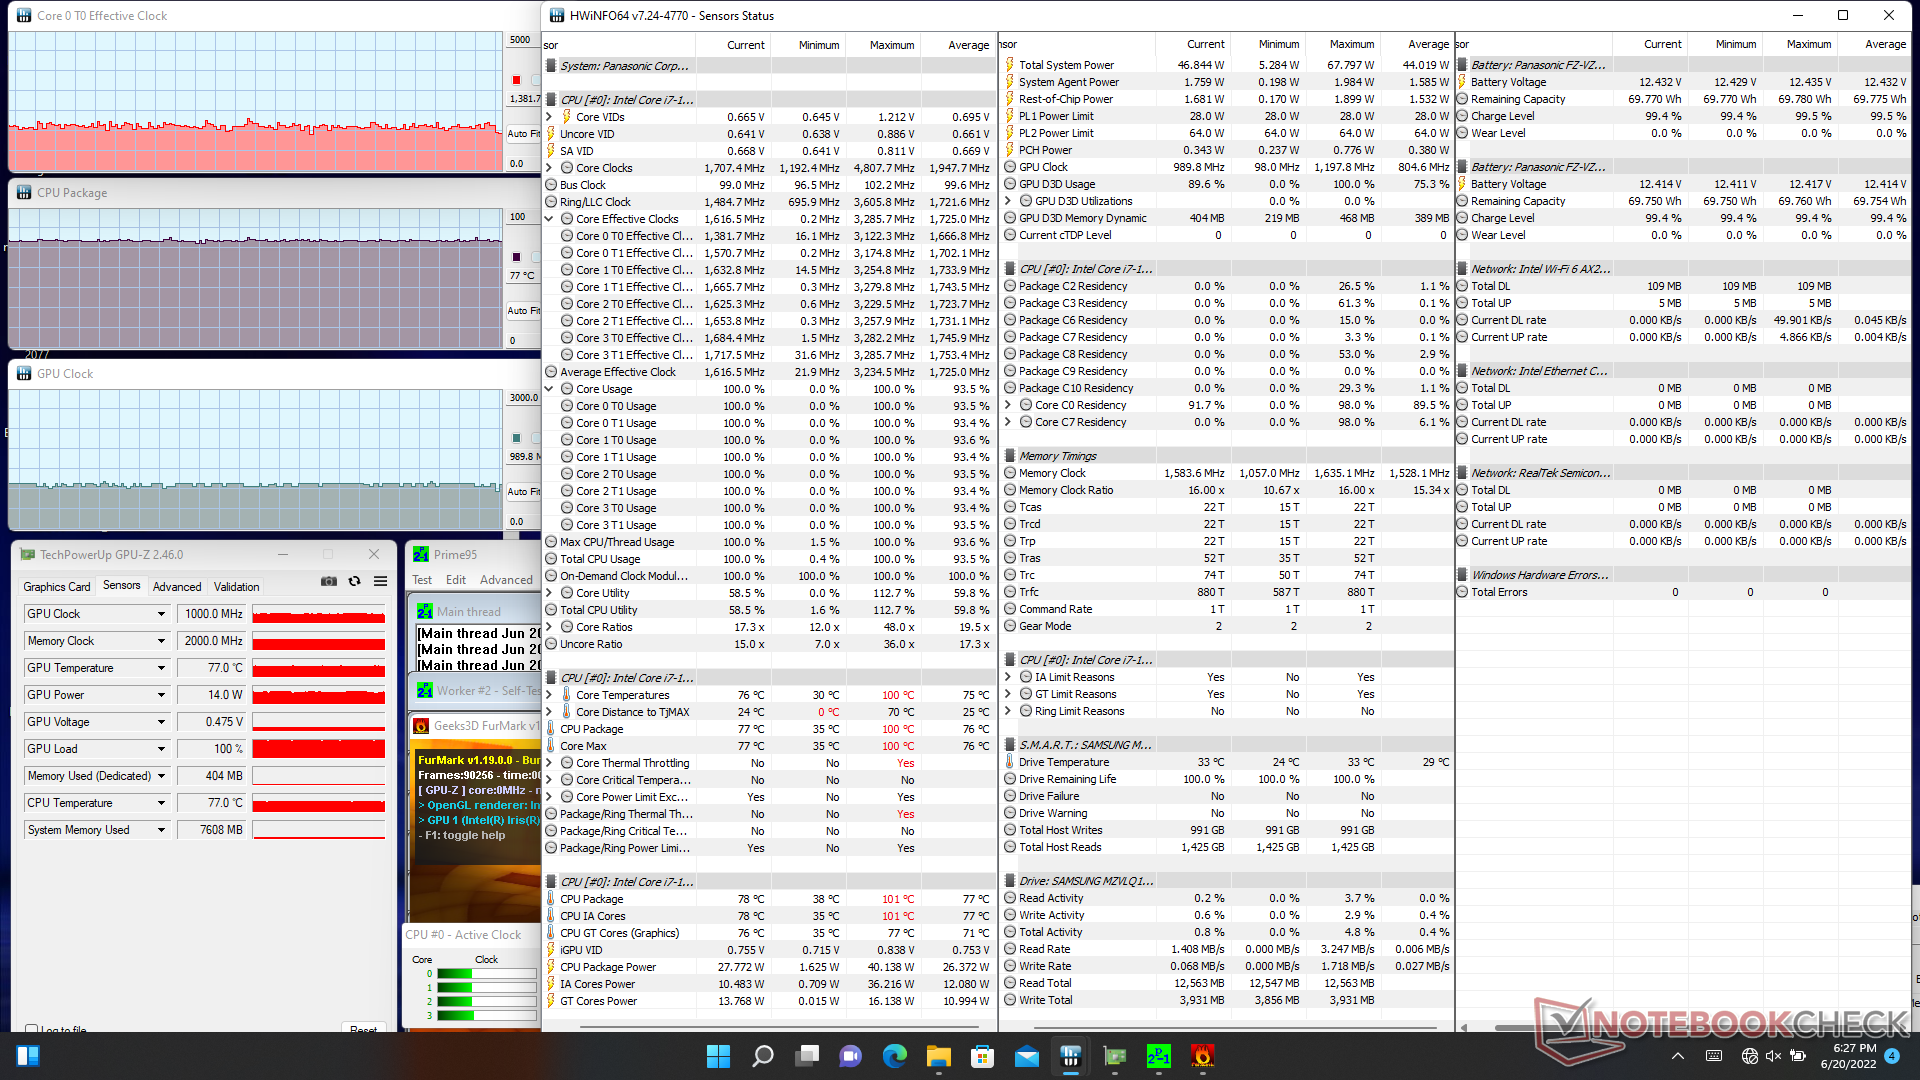
| Relógio CPU (GHz) | Relógio GPU (MHz) | Temperatura média da CPU (°C) | |
| System Idle | -- | -- | 38 |
| Prime95 Stress | 2.7 | -- | 97 |
| Prime95 + FurMark Stress | 1.4 - 1.6 | 1000 | 77 |
| Witcher 3 Estresse | 1.4 - 1.6 | 1300 | 83 |
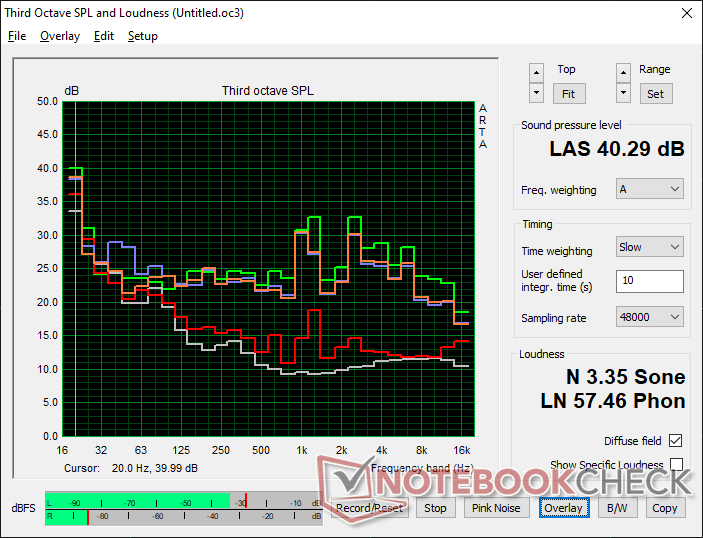
Oradores
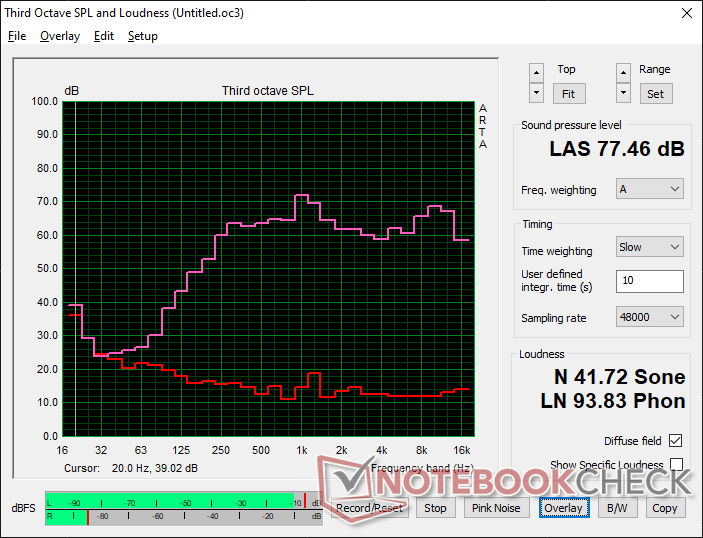
Panasonic Toughbook 40 análise de áudio
(±) | o volume do alto-falante é médio, mas bom (###valor### dB)
Graves 100 - 315Hz
(±) | graves reduzidos - em média 11.5% menor que a mediana
(±) | a linearidade dos graves é média (11.6% delta para a frequência anterior)
Médios 400 - 2.000 Hz
(+) | médios equilibrados - apenas 3.3% longe da mediana
(+) | médios são lineares (5.5% delta para frequência anterior)
Altos 2 - 16 kHz
(+) | agudos equilibrados - apenas 2.5% longe da mediana
(+) | os máximos são lineares (4.8% delta da frequência anterior)
Geral 100 - 16.000 Hz
(+) | o som geral é linear (13.1% diferença em relação à mediana)
Comparado com a mesma classe
» 7% de todos os dispositivos testados nesta classe foram melhores, 2% semelhantes, 91% piores
» O melhor teve um delta de 7%, a média foi 21%, o pior foi 53%
Comparado com todos os dispositivos testados
» 13% de todos os dispositivos testados foram melhores, 3% semelhantes, 84% piores
» O melhor teve um delta de 4%, a média foi 23%, o pior foi 134%
Apple MacBook Pro 16 2021 M1 Pro análise de áudio
(+) | os alto-falantes podem tocar relativamente alto (###valor### dB)
Graves 100 - 315Hz
(+) | bons graves - apenas 3.8% longe da mediana
(+) | o baixo é linear (5.2% delta para a frequência anterior)
Médios 400 - 2.000 Hz
(+) | médios equilibrados - apenas 1.3% longe da mediana
(+) | médios são lineares (2.1% delta para frequência anterior)
Altos 2 - 16 kHz
(+) | agudos equilibrados - apenas 1.9% longe da mediana
(+) | os máximos são lineares (2.7% delta da frequência anterior)
Geral 100 - 16.000 Hz
(+) | o som geral é linear (4.6% diferença em relação à mediana)
Comparado com a mesma classe
» 0% de todos os dispositivos testados nesta classe foram melhores, 0% semelhantes, 100% piores
» O melhor teve um delta de 5%, a média foi 17%, o pior foi 45%
Comparado com todos os dispositivos testados
» 0% de todos os dispositivos testados foram melhores, 0% semelhantes, 100% piores
» O melhor teve um delta de 4%, a média foi 23%, o pior foi 134%
Gestão de energia
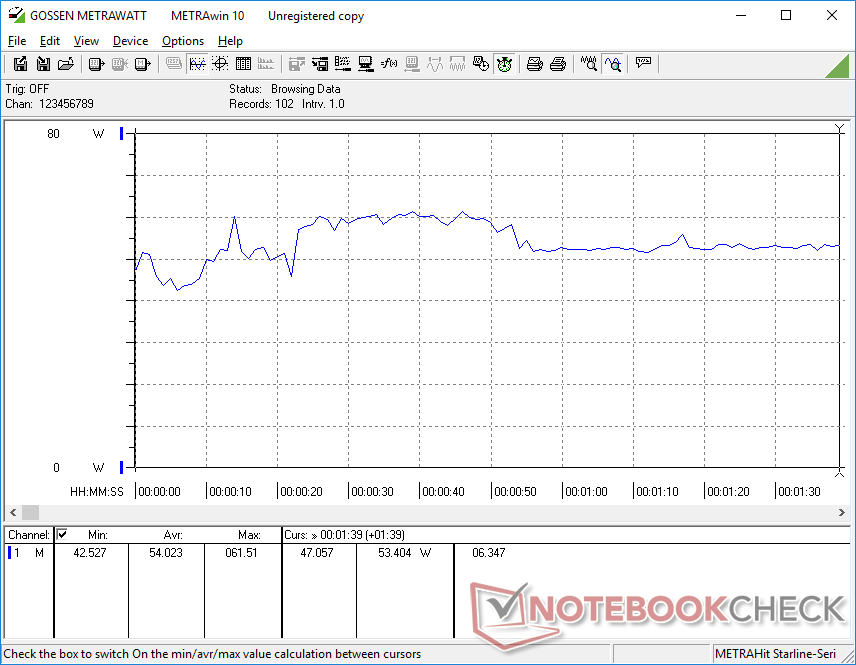
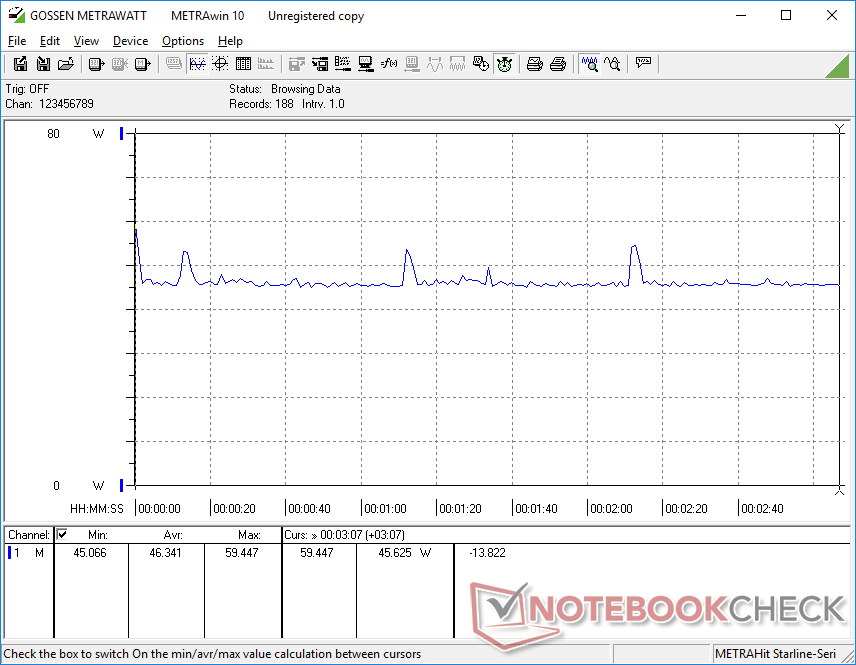
Consumo de energia
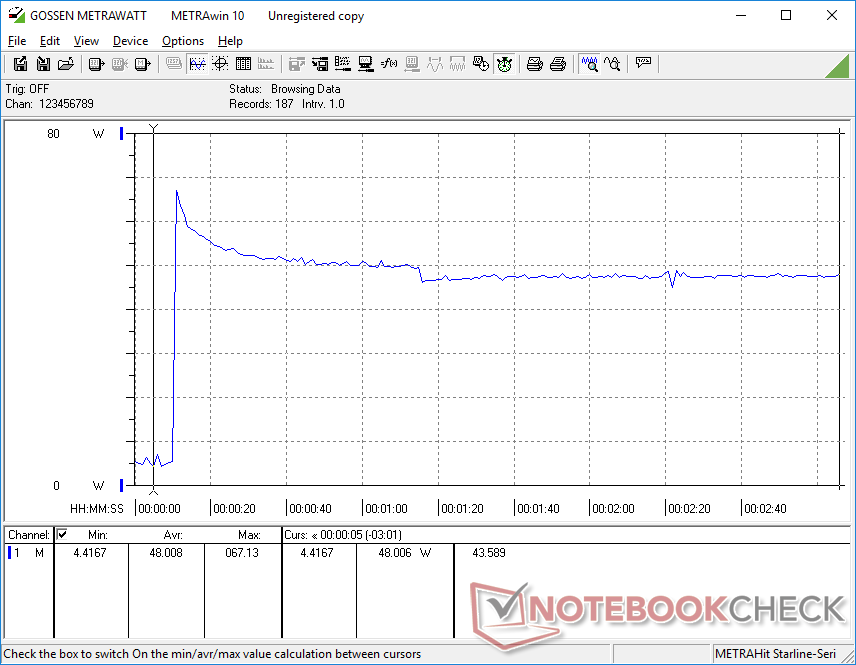
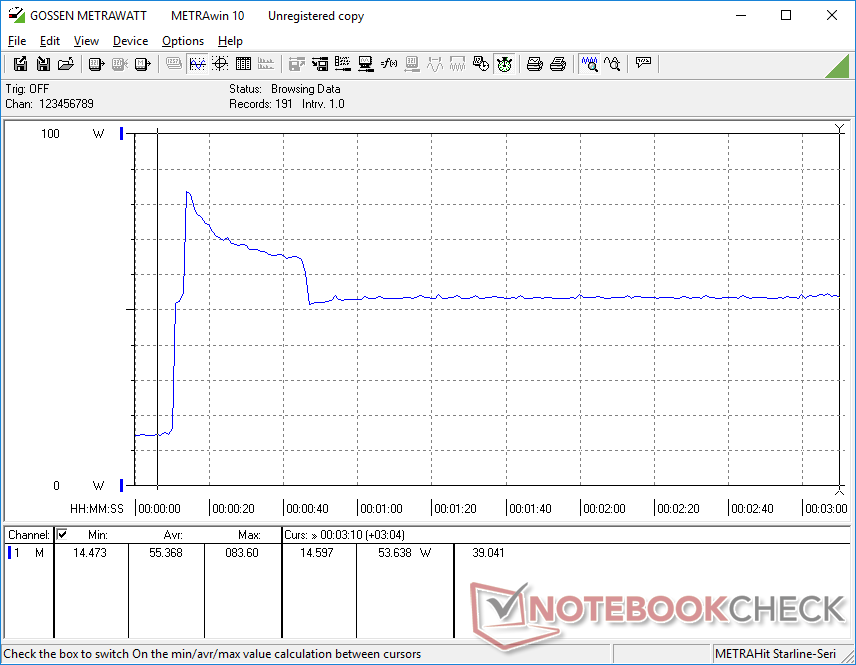
A manipulação na área de trabalho consome entre 4 W e 14 W, dependendo do nível de brilho e do perfil de potência. O simples aumento do brilho de 0% para 100% exige cerca de 8 W a mais devido à luz de fundo brilhante de 1400-nit
O consumo de energia sob carga é semelhante ao de outros modelos robustos alimentados por CPUs série U do 11º gênero Core, incluindo o Toughbook FZ-55 MK2 da própria Panasonic. Tiger Lake-U oferece imensos ganhos de desempenho por watt em relação aos modelos robustos da geração mais antiga, tais como o Latitude 5420 com os gráficos Kaby Lake-R e Radeon RX 540
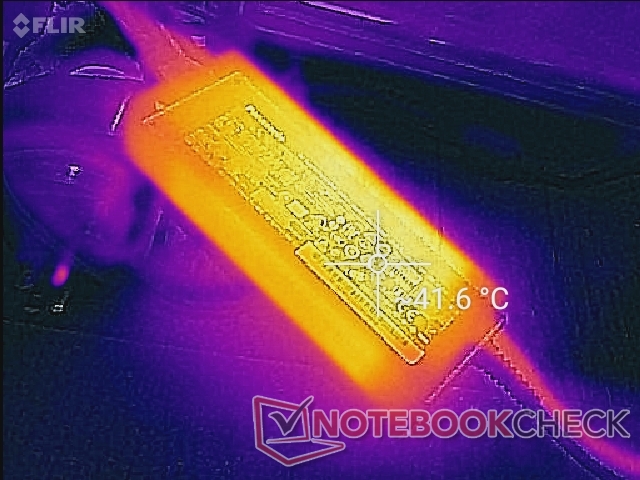
Somos capazes de registrar um draw máximo de 83,6 W do pequeno (~14 x 5,4 x 3,1 cm) adaptador AC de 110 W ao executar Prime95 e FurMark stress. Este pico é de curta duração, como mostram nossas capturas de tela abaixo, devido a limitações térmicas.
| desligado | |
| Ocioso | |
| Carga |
|
Key:
min: | |
| Panasonic Toughbook 40 i7-1185G7, Iris Xe G7 96EUs, Samsung PM991 MZVLQ1T0HALB, IPS, 1920x1080, 14" | Panasonic Toughbook FZ-55 MK2 i7-1185G7, Iris Xe G7 96EUs, Toshiba KIOXIA KBG4AZNV512G M.2 2280 OPAL, IPS, 1920x1080, 14" | Getac S410 Gen 4 i7-1185G7, Iris Xe G7 96EUs, SSSTC CA5-8D256, IPS, 1920x1080, 14" | Dell Latitude 5420 Rugged-P85G i7-8650U, Radeon RX 540, SK hynix PC401 NVMe 500 GB, IPS, 1920x1080, 14" | Acer Enduro Urban N3 EUN314 i7-1165G7, Iris Xe G7 96EUs, Samsung PM991 MZVLQ1T0HALB, IPS, 1920x1080, 14" | Durabook S14I i7-1165G7, Iris Xe G7 96EUs, UDinfo M2P M2P80DE512GBAEP, TN, 1920x1080, 14" | |
|---|---|---|---|---|---|---|
| Power Consumption | 12% | -11% | -16% | 34% | -11% | |
| Idle Minimum * (Watt) | 4.9 | 3.5 29% | 8.3 -69% | 4.8 2% | 3.8 22% | 6.8 -39% |
| Idle Average * (Watt) | 12.3 | 10.4 15% | 10.5 15% | 13.6 -11% | 8 35% | 16.4 -33% |
| Idle Maximum * (Watt) | 14 | 10.5 25% | 14.9 -6% | 13.8 1% | 8.7 38% | 16.9 -21% |
| Load Average * (Watt) | 54 | 45.4 16% | 48.6 10% | 67.8 -26% | 34.6 36% | 39.2 27% |
| Witcher 3 ultra * (Watt) | 46.3 | 43 7% | 50.9 -10% | 69.1 -49% | 35.4 24% | |
| Load Maximum * (Watt) | 83.6 | 99.3 -19% | 90.1 -8% | 93.5 -12% | 45.4 46% | 73.1 13% |
* ... menor é melhor
Power Consumption Witcher 3 / Stresstest
Power Consumption external Monitor
Vida útil da bateria
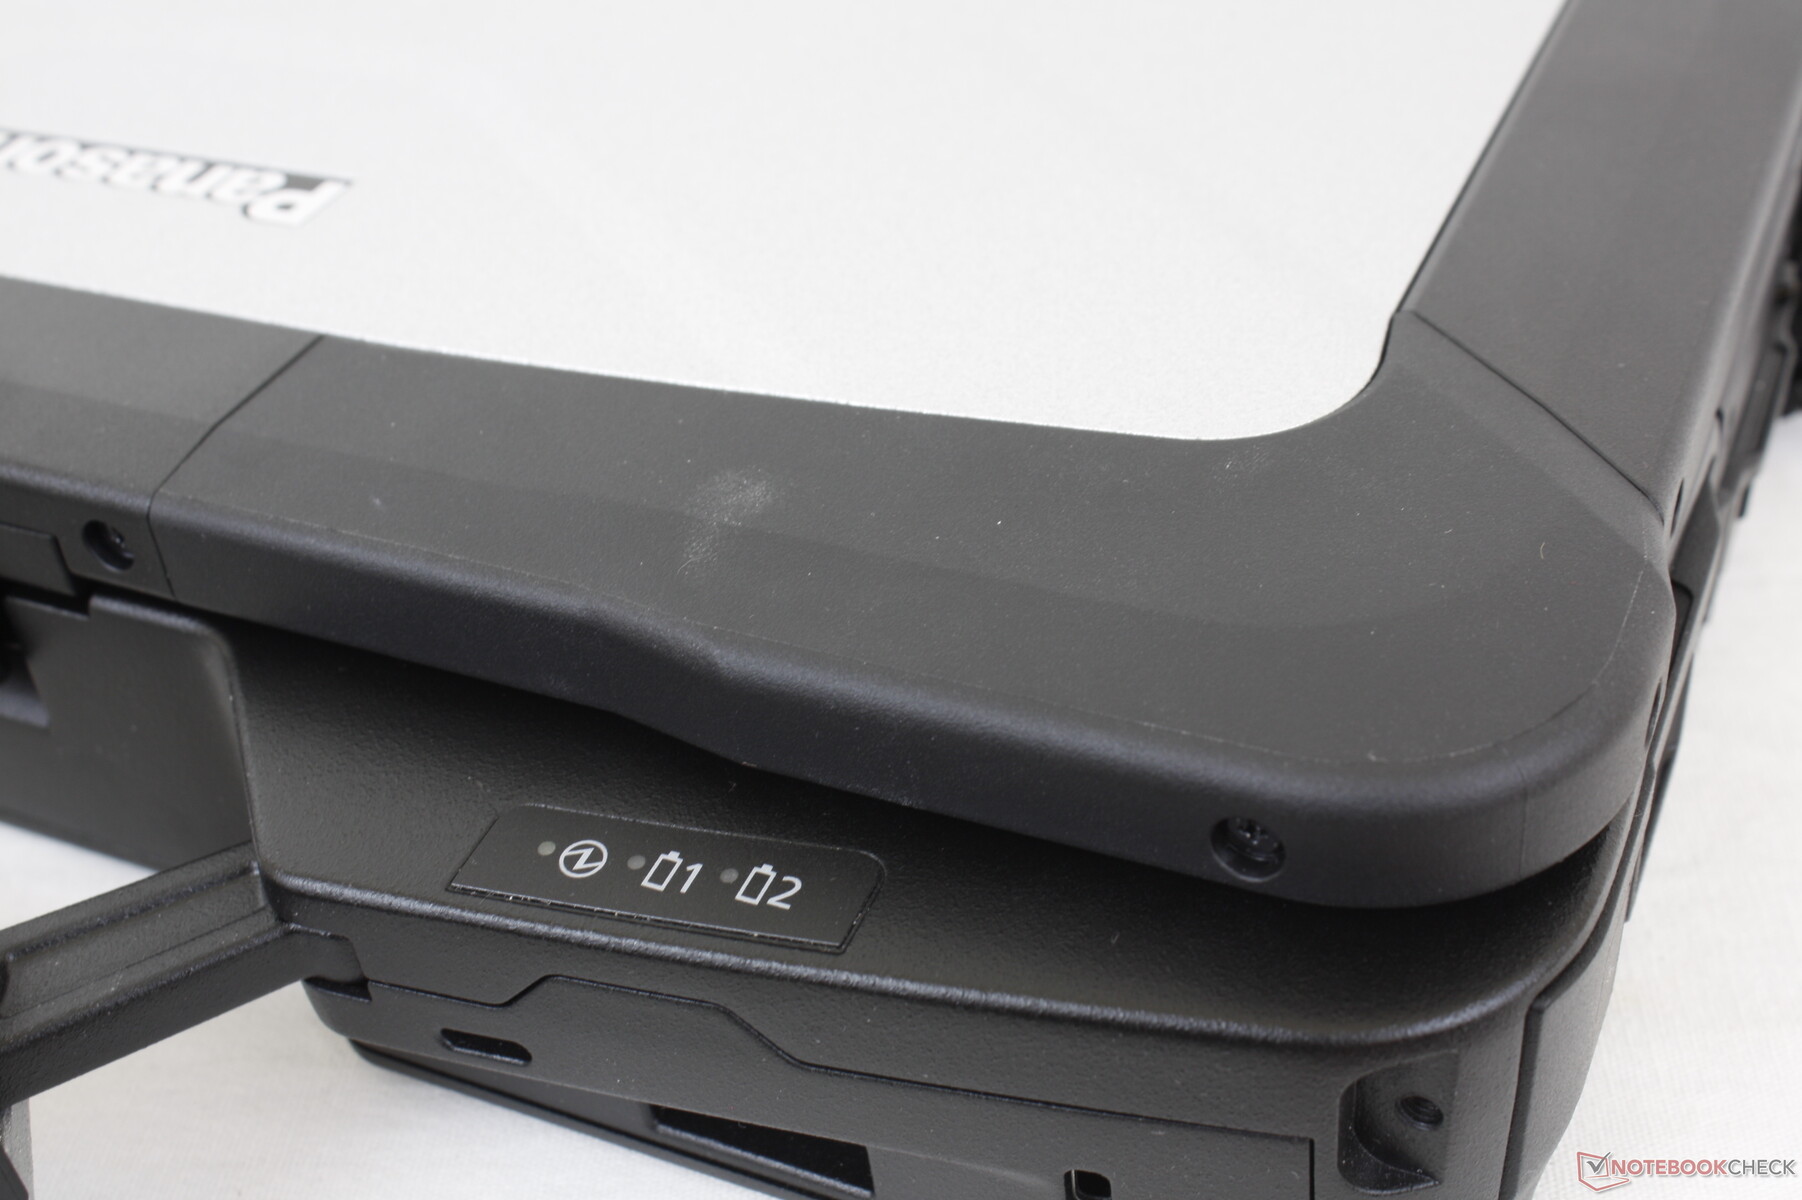
Nossa unidade de teste é fornecida com duas baterias removíveis de 68 Wh que ocupam cada uma uma ranhura de expansão ao longo das laterais do chassi. Baterias adicionais também podem ser fixadas no fundo do chassi por um tempo de funcionamento ainda mais longo. Somos capazes de gravar quase 19 horas de navegação WLAN no mundo real a 150-nit de brilho com nossas duas baterias acopladas antes de precisarmos recarregar
Por falar em recarga, a taxa de recarga é infelizmente extremamente lenta. O sistema só carrega uma bateria de cada vez, mesmo que duas estejam ligadas e cada bateria leva cerca de 2,5 a 3 horas para carregar completamente. Em comparação, a maioria dos laptops comuns pode recarregar totalmente em apenas 1,5 a 2 horas
O carregamento USB-C é suportado e, portanto, certos adaptadores USB-C de terceiros podem ser usados no lugar do adaptador AC proprietário.
| Panasonic Toughbook 40 i7-1185G7, Iris Xe G7 96EUs, 136 Wh | Panasonic Toughbook FZ-55 MK2 i7-1185G7, Iris Xe G7 96EUs, 71 Wh | Getac S410 Gen 4 i7-1185G7, Iris Xe G7 96EUs, 194 Wh | Dell Latitude 5420 Rugged-P85G i7-8650U, Radeon RX 540, 102 Wh | Acer Enduro Urban N3 EUN314 i7-1165G7, Iris Xe G7 96EUs, 50.3 Wh | Durabook S14I i7-1165G7, Iris Xe G7 96EUs, 50 Wh | |
|---|---|---|---|---|---|---|
| Duração da bateria | -28% | 51% | -15% | -66% | -71% | |
| WiFi v1.3 (h) | 19 | 13.6 -28% | 28.6 51% | 16.2 -15% | 6.4 -66% | 5.5 -71% |
| Reader / Idle (h) | 31.4 | |||||
| Load (h) | 3.2 |
Pro
Contra
Veredicto
a capacidade de suportar não apenas um ou dois, mas quatro slots de expansão especializados diferentes dá ao Toughbook 40 pernas mais longas e mais versatilidade em sua categoria. Se os módulos xPAK removíveis não forem práticos para seus cenários de uso, então o apelo do Toughbook 40 cai significativamente. Alternativas como o Latitude 7424 Rugged Extreme são totalmente robustas e menores, embora sem as capacidades de expansão da Panasonic.
Há alguns aspectos irritantes que gostaríamos de ver melhorados. As abas que cobrem as portas, por exemplo, são difíceis de segurar e abrir ou fechar. A tela cintilante está presente e não há opções de gama mais ampla disponíveis para cores mais profundas. O desempenho do SSD também poderia ser melhor enquanto o carregamento da bateria é muito lento. Tais inconvenientes podem não importar, dependendo do caso de uso.
Preço e Disponibilidade
Os usuários podem solicitar um orçamento da Panasonic através da página oficial do produto aqui.
Price comparison

