Breve Análise do Portátil Lenovo IdeaPad 330 15 (Ryzen 5 2500U)
| SD Card Reader | |
| average JPG Copy Test (av. of 3 runs) | |
| Lenovo IdeaPad 330-15ARR 81D2005CUS (Toshiba Exceria Pro SDXC 64 GB UHS-II) | |
| Acer TravelMate P2510-G2-MG-50WE (Toshiba Exceria Pro SDXC 64 GB UHS-II) | |
| Lenovo Ideapad 530S-15IKB (Toshiba Exceria Pro SDXC 64 GB UHS-II) | |
| maximum AS SSD Seq Read Test (1GB) | |
| Lenovo IdeaPad 330-15ARR 81D2005CUS (Toshiba Exceria Pro SDXC 64 GB UHS-II) | |
| Lenovo Ideapad 530S-15IKB (Toshiba Exceria Pro SDXC 64 GB UHS-II) | |
| Acer TravelMate P2510-G2-MG-50WE (Toshiba Exceria Pro SDXC 64 GB UHS-II) | |
| Networking | |
| iperf3 transmit AX12 | |
| Lenovo Ideapad 530S-15IKB | |
| Huawei MateBook D 15-53010BAJ | |
| Lenovo IdeaPad 330-15ARR 81D2005CUS | |
| iperf3 receive AX12 | |
| Lenovo Ideapad 530S-15IKB | |
| Huawei MateBook D 15-53010BAJ | |
| Lenovo IdeaPad 330-15ARR 81D2005CUS | |
| |||||||||||||||||||||||||
iluminação: 84 %
iluminação com acumulador: 252.2 cd/m²
Contraste: 467:1 (Preto: 0.54 cd/m²)
ΔE ColorChecker Calman: 12.36 | ∀{0.5-29.43 Ø4.71}
calibrated: 4.43
ΔE Greyscale Calman: 12.2 | ∀{0.09-98 Ø4.96}
54.5% sRGB (Argyll 1.6.3 3D)
34.6% AdobeRGB 1998 (Argyll 1.6.3 3D)
37.57% AdobeRGB 1998 (Argyll 3D)
54.7% sRGB (Argyll 3D)
36.36% Display P3 (Argyll 3D)
Gamma: 1.83
CCT: 13028 K
| Lenovo IdeaPad 330-15ARR 81D2005CUS AUO B156HTN03.8, TN LED, 15.6", 1920x1080 | Huawei MateBook D 15-53010BAJ AU Optronics B156HW02, IPS, 15.6", 1920x1080 | HP Pavilion 15-cs0053cl AU Optronics B156XW02 V0, TN LED, 15.6", 1366x768 | Asus VivoBook 15 F510UF-ES71 LG Philips LP156WF9-SPK2, IPS, 15.6", 1920x1080 | Lenovo Ideapad 530S-15IKB N156HCA-EAB, IPS, 15.6", 1920x1080 | |
|---|---|---|---|---|---|
| Display | 12% | 6% | 8% | 15% | |
| Display P3 Coverage (%) | 36.36 | 40.96 13% | 38.37 6% | 39.35 8% | 41.84 15% |
| sRGB Coverage (%) | 54.7 | 60.9 11% | 57.7 5% | 59.2 8% | 62.4 14% |
| AdobeRGB 1998 Coverage (%) | 37.57 | 42.24 12% | 39.65 6% | 40.65 8% | 43.32 15% |
| Response Times | -17% | 5% | 2% | -31% | |
| Response Time Grey 50% / Grey 80% * (ms) | 38.8 ? | 36.4 ? 6% | 43.6 ? -12% | 27.2 ? 30% | 37.2 ? 4% |
| Response Time Black / White * (ms) | 19.6 ? | 27.2 ? -39% | 15.2 ? 22% | 24.8 ? -27% | 32.4 ? -65% |
| PWM Frequency (Hz) | 25770 ? | ||||
| Screen | 29% | 10% | 27% | 34% | |
| Brightness middle (cd/m²) | 252.2 | 265.7 5% | 220.1 -13% | 257 2% | 285.1 13% |
| Brightness (cd/m²) | 251 | 258 3% | 210 -16% | 246 -2% | 271 8% |
| Brightness Distribution (%) | 84 | 91 8% | 93 11% | 89 6% | 88 5% |
| Black Level * (cd/m²) | 0.54 | 0.31 43% | 0.29 46% | 0.34 37% | 0.28 48% |
| Contrast (:1) | 467 | 857 84% | 759 63% | 756 62% | 1018 118% |
| Colorchecker dE 2000 * | 12.36 | 6.01 51% | 11.4 8% | 4.54 63% | 4.38 65% |
| Colorchecker dE 2000 max. * | 24.75 | 18.87 24% | 25.96 -5% | 16 35% | 24.07 3% |
| Colorchecker dE 2000 calibrated * | 4.43 | 3.94 11% | 4.09 8% | 3.61 19% | 3.95 11% |
| Greyscale dE 2000 * | 12.2 | 5 59% | 12 2% | 4.6 62% | 3.1 75% |
| Gamma | 1.83 120% | 2.7 81% | 2.09 105% | 2.44 90% | 2.24 98% |
| CCT | 13028 50% | 6569 99% | 12625 51% | 7096 92% | 6705 97% |
| Color Space (Percent of AdobeRGB 1998) (%) | 34.6 | 42.24 22% | 36.5 5% | 37.5 8% | 40 16% |
| Color Space (Percent of sRGB) (%) | 54.5 | 60.92 12% | 57.5 6% | 59.2 9% | 62 14% |
| Média Total (Programa/Configurações) | 8% /
20% | 7% /
9% | 12% /
21% | 6% /
22% |
* ... menor é melhor
Exibir tempos de resposta
| ↔ Tempo de resposta preto para branco | ||
|---|---|---|
| 19.6 ms ... ascensão ↗ e queda ↘ combinadas | ↗ 15.6 ms ascensão | 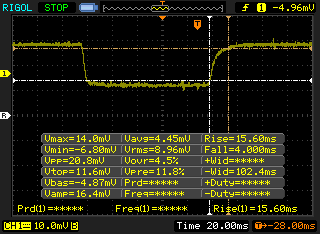 |
| ↘ 4 ms queda | ||
| A tela mostra boas taxas de resposta em nossos testes, mas pode ser muito lenta para jogadores competitivos. Em comparação, todos os dispositivos testados variam de 0.1 (mínimo) a 240 (máximo) ms. » 43 % de todos os dispositivos são melhores. Isso significa que o tempo de resposta medido é semelhante à média de todos os dispositivos testados (19.8 ms). | ||
| ↔ Tempo de resposta 50% cinza a 80% cinza | ||
| 38.8 ms ... ascensão ↗ e queda ↘ combinadas | ↗ 20 ms ascensão | 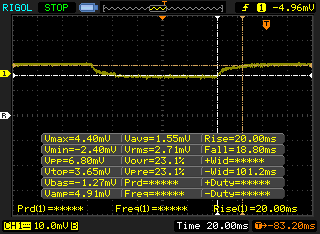 |
| ↘ 18.8 ms queda | ||
| A tela mostra taxas de resposta lentas em nossos testes e será insatisfatória para os jogadores. Em comparação, todos os dispositivos testados variam de 0.165 (mínimo) a 636 (máximo) ms. » 58 % de todos os dispositivos são melhores. Isso significa que o tempo de resposta medido é pior que a média de todos os dispositivos testados (30.9 ms). | ||
Cintilação da tela / PWM (modulação por largura de pulso)
| Tela tremeluzindo / PWM não detectado | 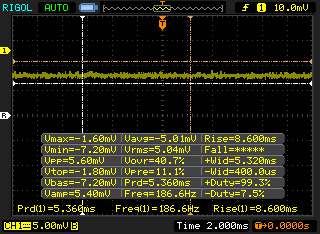 | ||
[pwm_comparison] Em comparação: 52 % de todos os dispositivos testados não usam PWM para escurecer a tela. Se PWM foi detectado, uma média de 7744 (mínimo: 5 - máximo: 343500) Hz foi medida. | |||
| wPrime 2.10 - 1024m | |
| Acer TravelMate P449-M-7407 | |
| Lenovo ThinkPad 25 | |
| Média AMD Ryzen 5 2500U (251 - 376, n=2) | |
| Lenovo ThinkPad X380 Yoga-20LH000LUS | |
| Acer Swift 3 SF315-41-R6J9 | |
* ... menor é melhor
| PCMark 8 Home Score Accelerated v2 | 3049 pontos | |
| PCMark 8 Work Score Accelerated v2 | 3437 pontos | |
| PCMark 10 Score | 2881 pontos | |
Ajuda | ||
| Lenovo IdeaPad 330-15ARR 81D2005CUS SK Hynix Canvas SC311 256GB HFS256G32TNF | Lenovo Ideapad 530S-15IKB SK hynix PC401 HFS256GD9TNG | Acer Swift 3 SF315-41-R6J9 Micron SSD 1100 SED 512GB, M.2 (MTFDDAV512TBN) | Asus VivoBook E200HA-FD0041TS Hynix HBG4a2 32 GB eMMC | Lenovo IdeaPad Flex-1570 81CA000RUS SK Hynix PC401 512GB M.2 (HFS512GD9TNG) | |
|---|---|---|---|---|---|
| AS SSD | 80% | -8% | -120% | 143% | |
| Copy Game MB/s (MB/s) | 262.4 | 301.1 15% | 221.7 -16% | 56.8 -78% | 684 161% |
| Copy Program MB/s (MB/s) | 334 | 233.5 -30% | 174.4 -48% | 38.74 -88% | 495.6 48% |
| Copy ISO MB/s (MB/s) | 434.5 | 868 100% | 262.5 -40% | 60.7 -86% | 1013 133% |
| Score Total (Points) | 752 | 1387 84% | 727 -3% | 135 -82% | 2123 182% |
| Score Write (Points) | 295 | 415 41% | 275 -7% | 48 -84% | 832 182% |
| Score Read (Points) | 296 | 690 133% | 297 0% | 54 -82% | 860 191% |
| Access Time Write * (ms) | 0.08 | 0.051 36% | 0.072 10% | 0.575 -619% | 0.051 36% |
| Access Time Read * (ms) | 0.102 | 0.06 41% | 0.078 24% | 0.228 -124% | 0.045 56% |
| 4K-64 Write (MB/s) | 203.6 | 271.6 33% | 187 -8% | 25.33 -88% | 612 201% |
| 4K-64 Read (MB/s) | 228.5 | 431.3 89% | 231.8 1% | 23.97 -90% | 660 189% |
| 4K Write (MB/s) | 45.41 | 88.4 95% | 49.43 9% | 10.55 -77% | 99.5 119% |
| 4K Read (MB/s) | 23.4 | 38.69 65% | 20.27 -13% | 14.01 -40% | 40.59 73% |
| Seq Write (MB/s) | 459.6 | 550 20% | 384.7 -16% | 124.7 -73% | 1209 163% |
| Seq Read (MB/s) | 441.6 | 2205 399% | 448.1 1% | 160.8 -64% | 1596 261% |
* ... menor é melhor

| 3DMark 11 | |
| 1280x720 Performance GPU | |
| Lenovo IdeaPad 530s-14IKB | |
| Acer Swift 3 SF315-41-R6J9 | |
| Média AMD Radeon RX Vega 8 (Ryzen 2000/3000) (1668 - 4317, n=44) | |
| Apple MacBook Pro 13 2018 Touchbar i5 | |
| Asus VivoBook S410UQ-NH74 | |
| Lenovo IdeaPad Flex-1570 81CA000RUS | |
| Lenovo IdeaPad 330-15ARR 81D2005CUS | |
| Asus VivoBook E200HA-FD0041TS | |
| 1280x720 Performance Combined | |
| Lenovo IdeaPad 530s-14IKB | |
| Lenovo IdeaPad Flex-1570 81CA000RUS | |
| Acer Swift 3 SF315-41-R6J9 | |
| Apple MacBook Pro 13 2018 Touchbar i5 | |
| Média AMD Radeon RX Vega 8 (Ryzen 2000/3000) (1232 - 3871, n=44) | |
| Asus VivoBook S410UQ-NH74 | |
| Lenovo IdeaPad 330-15ARR 81D2005CUS | |
| Asus VivoBook E200HA-FD0041TS | |
| 3DMark 11 Performance | 2241 pontos | |
| 3DMark Cloud Gate Standard Score | 7161 pontos | |
| 3DMark Fire Strike Score | 1066 pontos | |
Ajuda | ||
| baixo | média | alto | ultra | |
|---|---|---|---|---|
| BioShock Infinite (2013) | 68.9 | 7.6 | ||
| The Witcher 3 (2015) | 22 |
Barulho
| Ocioso |
| 28.1 / 31.6 / 32.8 dB |
| Carga |
| 36.5 / 32.8 dB |
 | ||
30 dB silencioso 40 dB(A) audível 50 dB(A) ruidosamente alto |
||
min: | ||
| Lenovo IdeaPad 330-15ARR 81D2005CUS Vega 8, R5 2500U, SK Hynix Canvas SC311 256GB HFS256G32TNF | Lenovo Ideapad 530S-15IKB UHD Graphics 620, i5-8250U, SK hynix PC401 HFS256GD9TNG | Huawei MateBook D 15-53010BAJ GeForce MX150, i5-8250U, Samsung SSD PM981 MZVLB512HAJQ | HP Pavilion 15-cs0053cl UHD Graphics 620, i5-8250U, Toshiba MQ04ABF100 | Asus VivoBook 15 F510UF-ES71 GeForce MX130, i5-8550U, Seagate Mobile HDD 1TB ST1000LM035 | |
|---|---|---|---|---|---|
| Noise | 6% | -11% | -1% | -16% | |
| desligado / ambiente * (dB) | 28.1 | 28 -0% | 27.8 1% | 28.2 -0% | 28.5 -1% |
| Idle Minimum * (dB) | 28.1 | 28 -0% | 29.4 -5% | 31.7 -13% | 30.8 -10% |
| Idle Average * (dB) | 31.6 | 28 11% | 29.6 6% | 31.7 -0% | 30.8 3% |
| Idle Maximum * (dB) | 32.8 | 30.1 8% | 29.6 10% | 32 2% | 31 5% |
| Load Average * (dB) | 36.5 | 30.2 17% | 43.5 -19% | 32.8 10% | 45.6 -25% |
| Witcher 3 ultra * (dB) | 32.8 | 43.5 -33% | 45.6 -39% | ||
| Load Maximum * (dB) | 32.8 | 33.2 -1% | 45.8 -40% | 35 -7% | 46.7 -42% |
* ... menor é melhor
(+) A temperatura máxima no lado superior é 36.8 °C / 98 F, em comparação com a média de 34.3 °C / 94 F , variando de 21.2 a 62.5 °C para a classe Office.
(±) A parte inferior aquece até um máximo de 42 °C / 108 F, em comparação com a média de 36.8 °C / 98 F
(+) Em uso inativo, a temperatura média para o lado superior é 26.4 °C / 80 F, em comparação com a média do dispositivo de 29.5 °C / ### class_avg_f### F.
(+) Jogando The Witcher 3, a temperatura média para o lado superior é 30.7 °C / 87 F, em comparação com a média do dispositivo de 29.5 °C / ## #class_avg_f### F.
(+) Os apoios para as mãos e o touchpad estão atingindo a temperatura máxima da pele (34 °C / 93.2 F) e, portanto, não estão quentes.
(-) A temperatura média da área do apoio para as mãos de dispositivos semelhantes foi 27.6 °C / 81.7 F (-6.4 °C / -11.5 F).
Lenovo IdeaPad 330-15ARR 81D2005CUS análise de áudio
(-) | alto-falantes não muito altos (###valor### dB)
Graves 100 - 315Hz
(-) | quase nenhum baixo - em média 22% menor que a mediana
(±) | a linearidade dos graves é média (11.9% delta para a frequência anterior)
Médios 400 - 2.000 Hz
(+) | médios equilibrados - apenas 3.6% longe da mediana
(±) | a linearidade dos médios é média (10.2% delta para frequência anterior)
Altos 2 - 16 kHz
(+) | agudos equilibrados - apenas 3.8% longe da mediana
(±) | a linearidade dos máximos é média (10.7% delta para frequência anterior)
Geral 100 - 16.000 Hz
(±) | a linearidade do som geral é média (25.4% diferença em relação à mediana)
Comparado com a mesma classe
» 78% de todos os dispositivos testados nesta classe foram melhores, 6% semelhantes, 17% piores
» O melhor teve um delta de 7%, a média foi 21%, o pior foi 53%
Comparado com todos os dispositivos testados
» 78% de todos os dispositivos testados foram melhores, 5% semelhantes, 17% piores
» O melhor teve um delta de 4%, a média foi 23%, o pior foi 134%
Apple MacBook 12 (Early 2016) 1.1 GHz análise de áudio
(+) | os alto-falantes podem tocar relativamente alto (###valor### dB)
Graves 100 - 315Hz
(±) | graves reduzidos - em média 11.3% menor que a mediana
(±) | a linearidade dos graves é média (14.2% delta para a frequência anterior)
Médios 400 - 2.000 Hz
(+) | médios equilibrados - apenas 2.4% longe da mediana
(+) | médios são lineares (5.5% delta para frequência anterior)
Altos 2 - 16 kHz
(+) | agudos equilibrados - apenas 2% longe da mediana
(+) | os máximos são lineares (4.5% delta da frequência anterior)
Geral 100 - 16.000 Hz
(+) | o som geral é linear (10.2% diferença em relação à mediana)
Comparado com a mesma classe
» 7% de todos os dispositivos testados nesta classe foram melhores, 2% semelhantes, 90% piores
» O melhor teve um delta de 5%, a média foi 18%, o pior foi 53%
Comparado com todos os dispositivos testados
» 5% de todos os dispositivos testados foram melhores, 1% semelhantes, 94% piores
» O melhor teve um delta de 4%, a média foi 23%, o pior foi 134%
| desligado | |
| Ocioso | |
| Carga |
|
Key:
min: | |
| Lenovo IdeaPad 330-15ARR 81D2005CUS R5 2500U, Vega 8, SK Hynix Canvas SC311 256GB HFS256G32TNF, TN LED, 1920x1080, 15.6" | Lenovo Ideapad 530S-15IKB i5-8250U, UHD Graphics 620, SK hynix PC401 HFS256GD9TNG, IPS, 1920x1080, 15.6" | Huawei MateBook D 15-53010BAJ i5-8250U, GeForce MX150, Samsung SSD PM981 MZVLB512HAJQ, IPS, 1920x1080, 15.6" | HP Pavilion 15-cs0053cl i5-8250U, UHD Graphics 620, Toshiba MQ04ABF100, TN LED, 1366x768, 15.6" | Asus VivoBook 15 F510UF-ES71 i5-8550U, GeForce MX130, Seagate Mobile HDD 1TB ST1000LM035, IPS, 1920x1080, 15.6" | |
|---|---|---|---|---|---|
| Power Consumption | 20% | -27% | 16% | -25% | |
| Idle Minimum * (Watt) | 7.6 | 3.5 54% | 4.2 45% | 5.6 26% | 5.9 22% |
| Idle Average * (Watt) | 10.6 | 5.6 47% | 7.2 32% | 7.1 33% | 7 34% |
| Idle Maximum * (Watt) | 11.8 | 10.3 13% | 12.1 -3% | 7.9 33% | 8.5 28% |
| Load Average * (Watt) | 24.1 | 30.5 -27% | 51.1 -112% | 32.8 -36% | 54.5 -126% |
| Witcher 3 ultra * (Watt) | 30.3 | 52.7 -74% | 50.6 -67% | ||
| Load Maximum * (Watt) | 39.4 | 33.8 14% | 59.9 -52% | 30.5 23% | 55.7 -41% |
* ... menor é melhor
| Lenovo IdeaPad 330-15ARR 81D2005CUS R5 2500U, Vega 8, 35 Wh | Lenovo Ideapad 530S-15IKB i5-8250U, UHD Graphics 620, 45 Wh | Huawei MateBook D 15-53010BAJ i5-8250U, GeForce MX150, 43.3 Wh | HP Pavilion 15-cs0053cl i5-8250U, UHD Graphics 620, 41 Wh | Asus VivoBook 15 F510UF-ES71 i5-8550U, GeForce MX130, 42 Wh | |
|---|---|---|---|---|---|
| Duração da bateria | 63% | 93% | 75% | -2% | |
| WiFi v1.3 (h) | 4 | 6.5 63% | 7.7 93% | 7 75% | 3.9 -2% |
| Reader / Idle (h) | 15.2 | 12 | |||
| Load (h) | 1.2 | 2.2 |
Pro
Contra
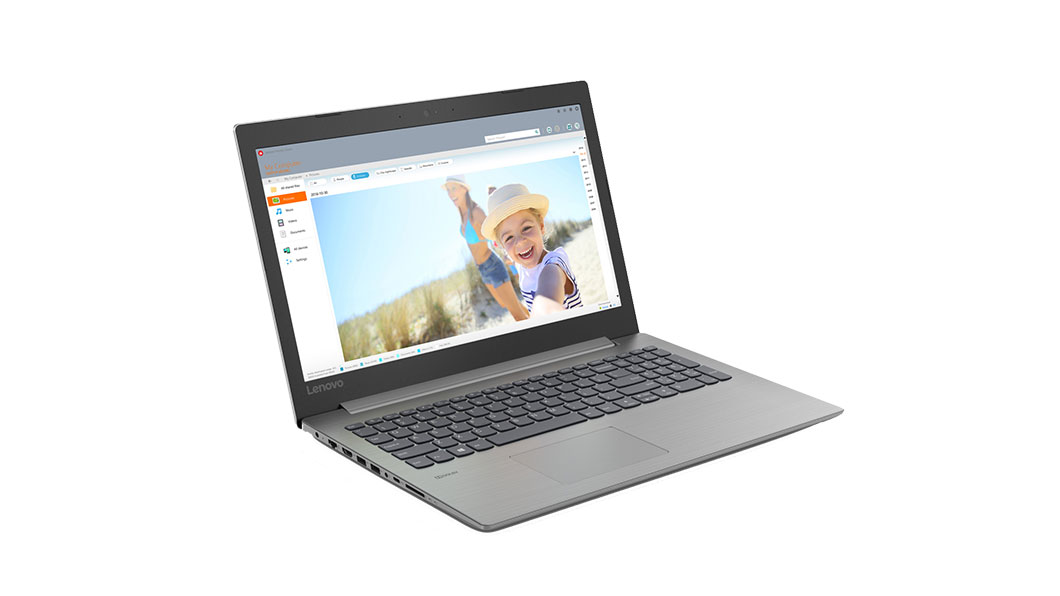
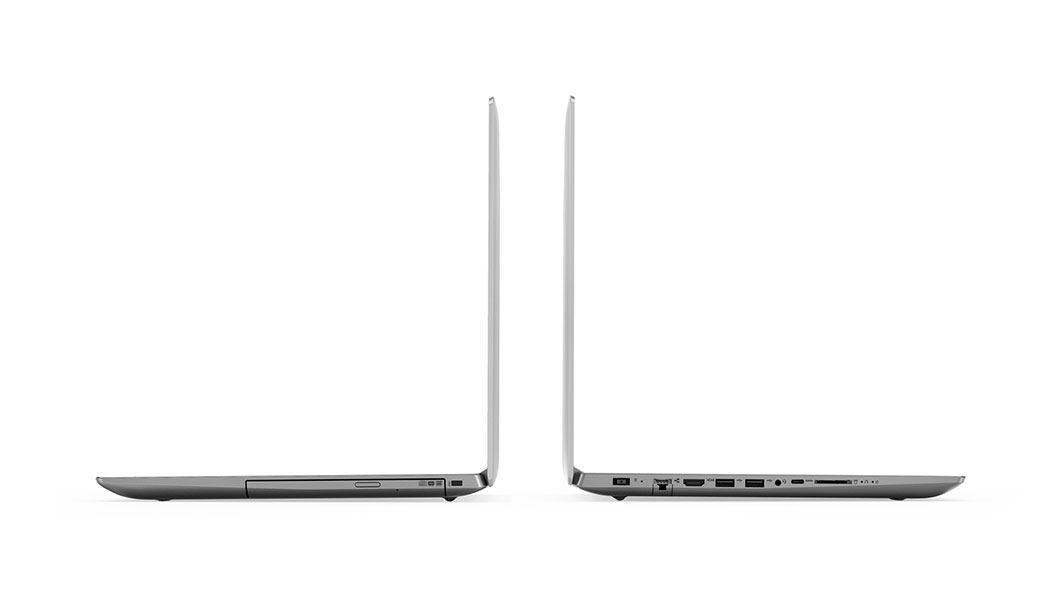
O Ideapad 330 de 15 polegadas é uma solução multimídia barata e, portanto, não esperamos muito do sistema. Seu chassi é suave, se não brando, e seu painel mate é ótimo para reduzir o brilho. É também um dos poucos portáteis fornecidos com USB Type-C e uma unidade óptica para usuários que possam querer eles numa máquina.
Ainda há uma longa lista de qualidades decepcionantes, apesar do baixo preço pedido. O equilíbrio de cores e RGB de fábrica é péssimo, portanto, a calibração do usuário final é recomendável para uma experiência geral melhor, especialmente ao reproduzir vídeos. O afogamento é severo em quase 41%, de acordo com nosso teste de loop CineBench R15. Assim, enquanto o Ryzen 5 2500U é uma poderosa alternativa da Intel no papel, os proprietários do Lenovo não se beneficiarão totalmente do processador AMD quando estiverem jogando ou sob altas cargas. O SKU mais caro com o mais potente Ryzen 7 2700U poderia ser potencialmente uma compra ruim, já que a nossa configuração menos exigente do Ryzen 5 2500U já está sobrecarregada. A duração da bateria também é curta, o que torna o Ideapad 330 um companheiro de viagem ruim.
Para revisões futuras, esperamos ver o carregamento USB Type-C em vez do adaptador CA proprietário e talvez outra porta USB tipo A na borda direita. Uma tela mais brilhante, maior tempo de duração da bateria e redução do afogamento de desempenho também ajudariam a melhorar essa máquina. A recente atualização do HP Pavilion 15 é a opção mais potente, em geral, para a mesma faixa de preço.
Existem algumas noções básicas que o Ideapad 330 poderia ter feito melhor sem aumentar o preço acessível. Uma tela melhor calibrada, controles manuais do ventilador para o streaming silencioso, redução do afogamento do desempenho e uma porta USB Type-A na borda direita poderiam ter feito do Ideapad 330 uma compra mais fácil pelo preço. Tal como está, o sistema é meramente mediano.
Lenovo IdeaPad 330-15ARR 81D2005CUS
- 09/20/2018 v6 (old)
Allen Ngo
Price comparison
