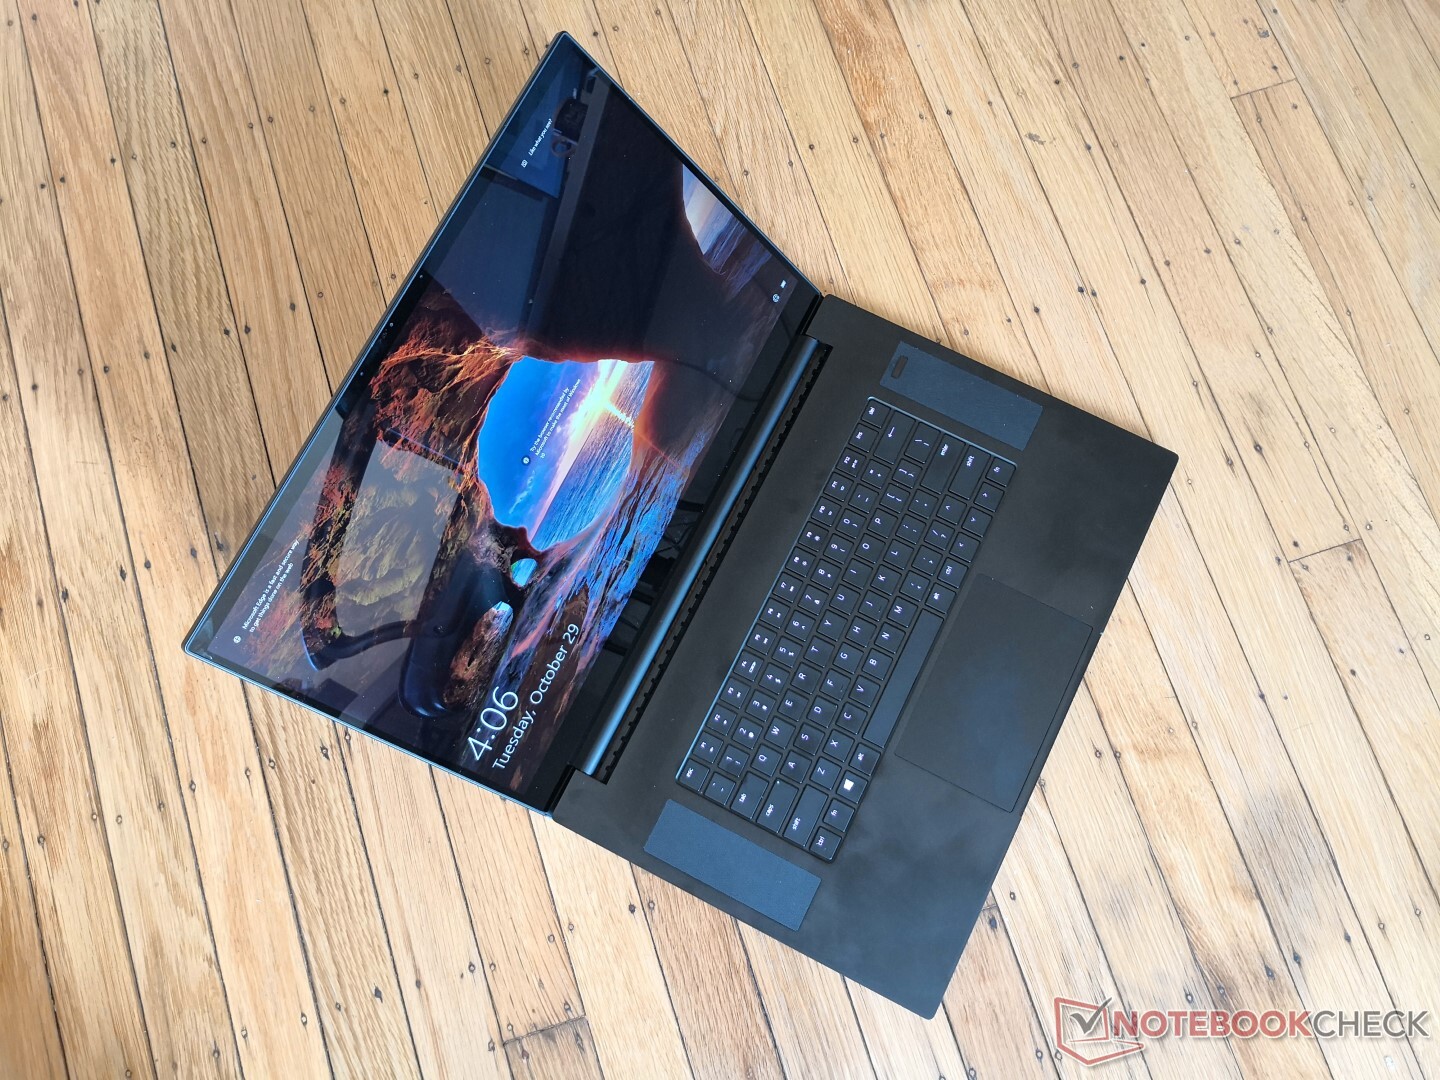
Breve Análise do Portátil Razer Blade Pro 17 4K UHD 120 Hz: Finalmente, uma tela 4K de 17 Polegadas Quase Sem Ghosting
Avaliação | Data | Modelo | Peso | Altura | Size | Resolução | Preço |
|---|---|---|---|---|---|---|---|
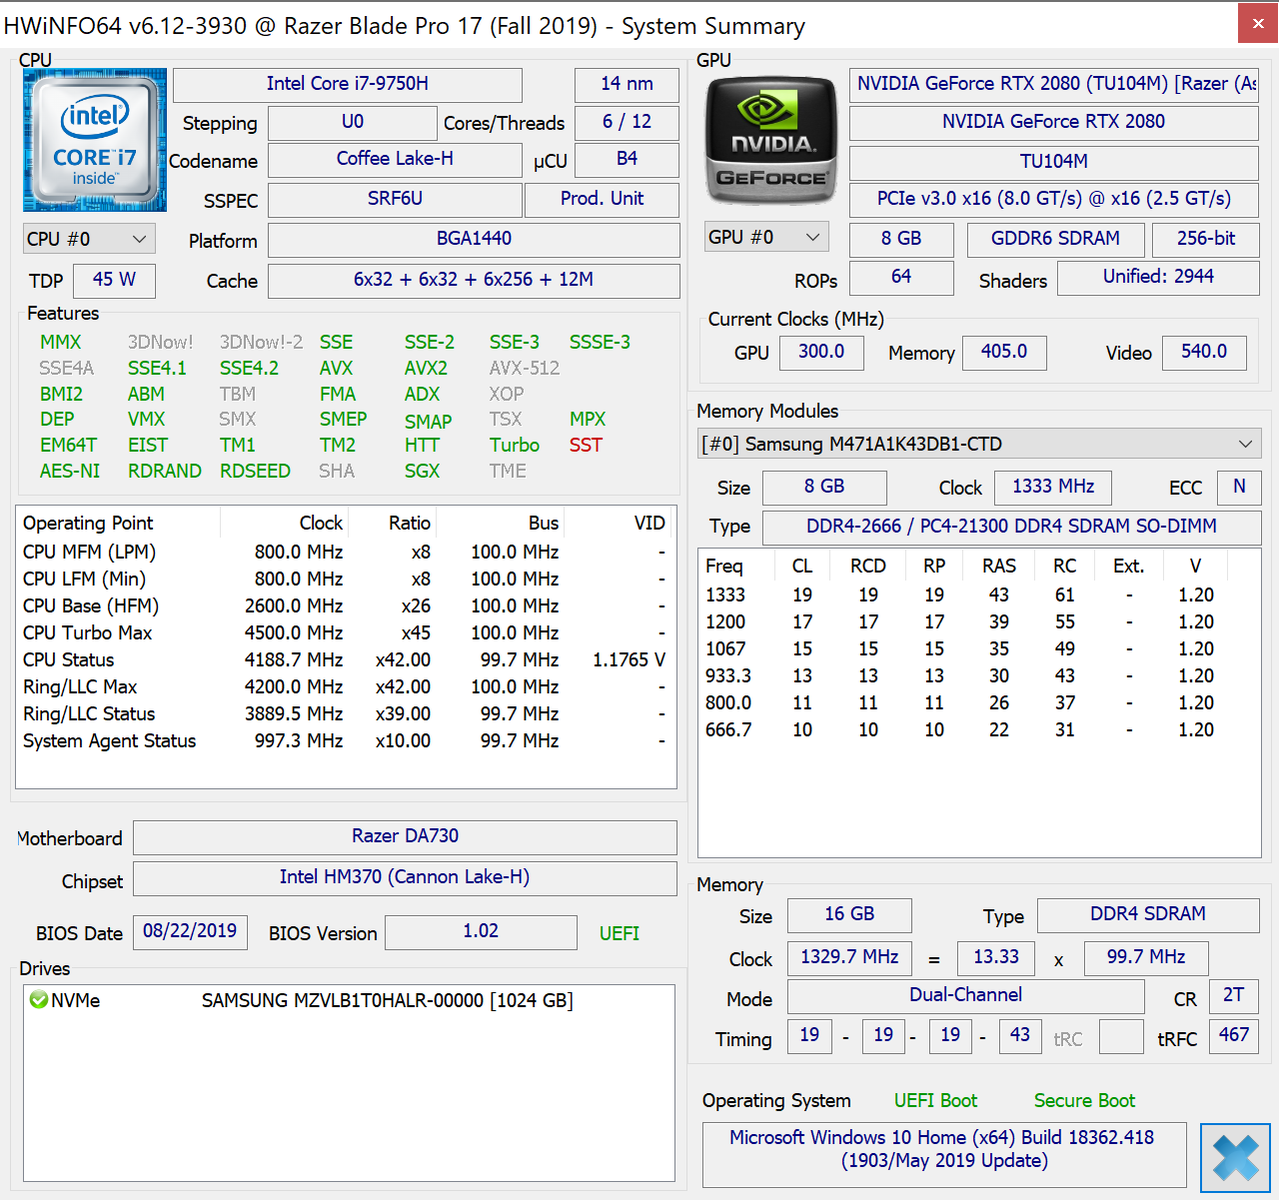
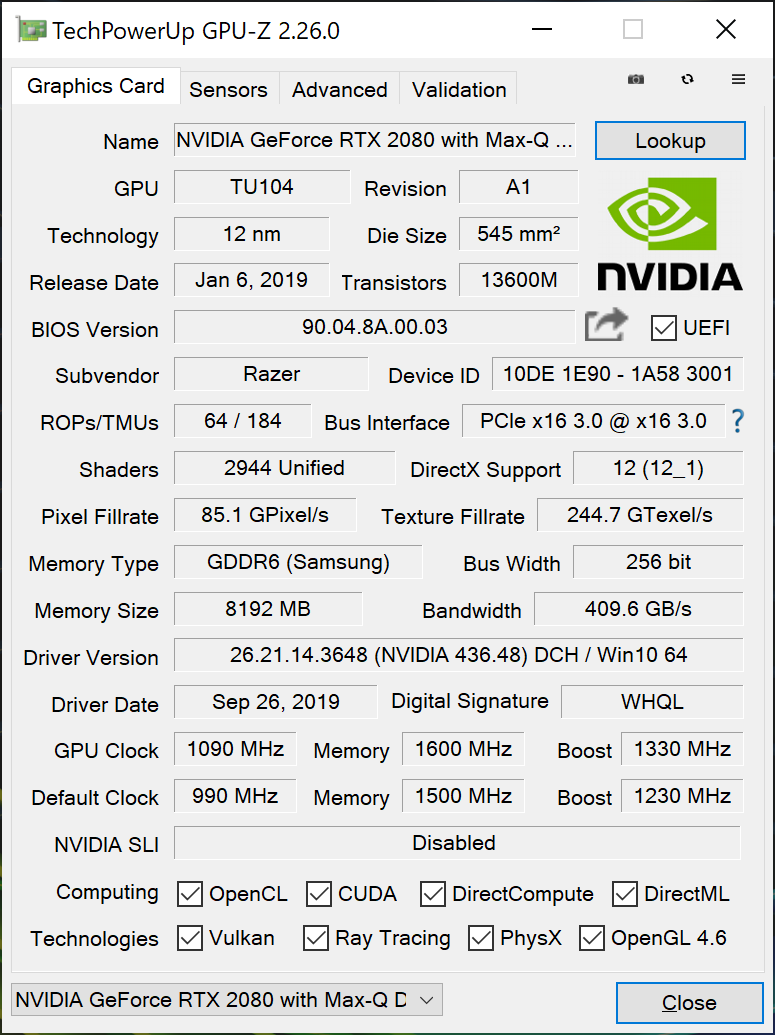
| 86.7 % v7 (old) | 11/2019 | Razer Blade Pro 17 4K UHD 120 Hz i7-9750H, GeForce RTX 2080 Max-Q | 2.8 kg | 19.9 mm | 17.30" | 3840x2160 | |
| 82.9 % v7 (old) | 07/2019 | MSI GS75 Stealth 9SG i7-9750H, GeForce RTX 2080 Max-Q | 2.3 kg | 18.9 mm | 17.30" | 1920x1080 | |
| 85.6 % v6 (old) | 03/2019 | Asus Zephyrus S GX701GX i7-8750H, GeForce RTX 2080 Max-Q | 2.6 kg | 19 mm | 17.30" | 1920x1080 | |
| 83.2 % v7 (old) | 10/2019 | Lenovo Legion Y740-17IRH i7-9750H, GeForce RTX 2060 Mobile | 3 kg | 23 mm | 17.30" | 1920x1080 | |
| 86.1 % v7 (old) | 09/2019 | Gigabyte Aero 17 XA RP77 i9-9980HK, GeForce RTX 2070 Max-Q | 2.5 kg | 21.4 mm | 17.30" | 3840x2160 |
| SD Card Reader | |
| average JPG Copy Test (av. of 3 runs) | |
| Gigabyte Aero 17 XA RP77 (Toshiba Exceria Pro SDXC 64 GB UHS-II) | |
| Eurocom Nightsky RX15 (Toshiba Exceria Pro SDXC 64 GB UHS-II) | |
| Razer Blade Pro 17 4K UHD 120 Hz (Toshiba Exceria Pro SDXC 64 GB UHS-II) | |
| Razer Blade Pro 2017 (Toshiba Exceria Pro SDXC 64 GB UHS-II) | |
| HP Pavilion Gaming 15-ec0017ng (Toshiba Exceria Pro SDXC 64 GB UHS-II) | |
| maximum AS SSD Seq Read Test (1GB) | |
| Gigabyte Aero 17 XA RP77 (Toshiba Exceria Pro SDXC 64 GB UHS-II) | |
| Eurocom Nightsky RX15 (Toshiba Exceria Pro SDXC 64 GB UHS-II) | |
| Razer Blade Pro 17 4K UHD 120 Hz (Toshiba Exceria Pro SDXC 64 GB UHS-II) | |
| Razer Blade Pro 2017 (Toshiba Exceria Pro SDXC 64 GB UHS-II) | |
| HP Pavilion Gaming 15-ec0017ng (Toshiba Exceria Pro SDXC 64 GB UHS-II) | |
| |||||||||||||||||||||||||
iluminação: 91 %
iluminação com acumulador: 346.7 cd/m²
Contraste: 1284:1 (Preto: 0.27 cd/m²)
ΔE ColorChecker Calman: 5.62 | ∀{0.5-29.43 Ø4.72}
calibrated: 3.81
ΔE Greyscale Calman: 5.5 | ∀{0.09-98 Ø4.97}
100% sRGB (Argyll 1.6.3 3D)
87.2% AdobeRGB 1998 (Argyll 1.6.3 3D)
98.6% AdobeRGB 1998 (Argyll 3D)
99.9% sRGB (Argyll 3D)
84.8% Display P3 (Argyll 3D)
Gamma: 2.25
CCT: 6175 K
| Razer Blade Pro 17 4K UHD 120 Hz AU Optronics B173ZAN03.3, IPS, 17.3", 3840x2160 | Razer Blade Pro 17 RTX 2080 Max-Q AU Optronics B173HAN04.0, IPS, 17.3", 1920x1080 | Razer Blade Pro 2017 Sharp LQ173D1JW33 (SHP145A), IGZO, 17.3", 3840x2160 | Gigabyte Aero 17 XA RP77 AU Optronics B173ZAN03.2, IPS, 17.3", 3840x2160 | Dell XPS 15 7590 9980HK GTX 1650 Samsung 156WR04, SDCA029, OLED, 15.6", 3840x2160 | MSI P65 Creator 9SF-657 AU Optronics AUO41EB, IPS, 15.6", 3840x2160 | |
|---|---|---|---|---|---|---|
| Display | -26% | 2% | 1% | -1% | 0% | |
| Display P3 Coverage (%) | 84.8 | 60.6 -29% | 88.9 5% | 86.8 2% | 88.1 4% | 84.4 0% |
| sRGB Coverage (%) | 99.9 | 89 -11% | 100 0% | 100 0% | 99.6 0% | 100 0% |
| AdobeRGB 1998 Coverage (%) | 98.6 | 62.1 -37% | 99.7 1% | 99.5 1% | 91.8 -7% | 98.5 0% |
| Response Times | 32% | -285% | -196% | 81% | -217% | |
| Response Time Grey 50% / Grey 80% * (ms) | 15.2 ? | 6.8 ? 55% | 60.8 ? -300% | 45.6 ? -200% | 2.3 ? 85% | 51 ? -236% |
| Response Time Black / White * (ms) | 10.4 ? | 9.6 ? 8% | 38.4 ? -269% | 30.4 ? -192% | 2.4 ? 77% | 31 ? -198% |
| PWM Frequency (Hz) | 204.9 ? | 59.5 ? | ||||
| Screen | 6% | -6% | 25% | 7% | -1% | |
| Brightness middle (cd/m²) | 346.7 | 299.3 -14% | 230 -34% | 667.3 92% | 421.2 21% | 445 28% |
| Brightness (cd/m²) | 332 | 294 -11% | 207 -38% | 633 91% | 417 26% | 462 39% |
| Brightness Distribution (%) | 91 | 94 3% | 83 -9% | 90 -1% | 94 3% | 83 -9% |
| Black Level * (cd/m²) | 0.27 | 0.29 -7% | 0.2 26% | 0.46 -70% | 0.5 -85% | |
| Contrast (:1) | 1284 | 1032 -20% | 1150 -10% | 1451 13% | 890 -31% | |
| Colorchecker dE 2000 * | 5.62 | 2.55 55% | 5.62 -0% | 3.53 37% | 6.06 -8% | 4.75 15% |
| Colorchecker dE 2000 max. * | 9.36 | 4.73 49% | 10.24 -9% | 6.88 26% | 11.89 -27% | 7.79 17% |
| Colorchecker dE 2000 calibrated * | 3.81 | 2.9 24% | 3.79 1% | |||
| Greyscale dE 2000 * | 5.5 | 3.5 36% | 4.54 17% | 0.9 84% | 2.8 49% | 4.49 18% |
| Gamma | 2.25 98% | 2.28 96% | 2.36 93% | 2.17 101% | 2.15 102% | 2.49 88% |
| CCT | 6175 105% | 7101 92% | 6625 98% | 6533 99% | 6235 104% | 7374 88% |
| Color Space (Percent of AdobeRGB 1998) (%) | 87.2 | 57 -35% | 88 1% | 87.1 0% | 81 -7% | 87 0% |
| Color Space (Percent of sRGB) (%) | 100 | 88.7 -11% | 100 0% | 100 0% | 99.6 0% | 100 0% |
| Média Total (Programa/Configurações) | 4% /
3% | -96% /
-41% | -57% /
-7% | 29% /
17% | -73% /
-29% |
* ... menor é melhor
Exibir tempos de resposta
| ↔ Tempo de resposta preto para branco | ||
|---|---|---|
| 10.4 ms ... ascensão ↗ e queda ↘ combinadas | ↗ 5.2 ms ascensão | 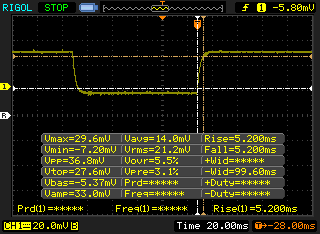 |
| ↘ 5.2 ms queda | ||
| A tela mostra boas taxas de resposta em nossos testes, mas pode ser muito lenta para jogadores competitivos. Em comparação, todos os dispositivos testados variam de 0.1 (mínimo) a 240 (máximo) ms. » 28 % de todos os dispositivos são melhores. Isso significa que o tempo de resposta medido é melhor que a média de todos os dispositivos testados (19.9 ms). | ||
| ↔ Tempo de resposta 50% cinza a 80% cinza | ||
| 15.2 ms ... ascensão ↗ e queda ↘ combinadas | ↗ 8.4 ms ascensão | 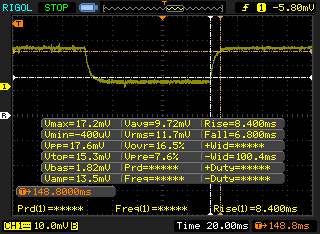 |
| ↘ 6.8 ms queda | ||
| A tela mostra boas taxas de resposta em nossos testes, mas pode ser muito lenta para jogadores competitivos. Em comparação, todos os dispositivos testados variam de 0.165 (mínimo) a 636 (máximo) ms. » 29 % de todos os dispositivos são melhores. Isso significa que o tempo de resposta medido é melhor que a média de todos os dispositivos testados (31.1 ms). | ||
Cintilação da tela / PWM (modulação por largura de pulso)
| Tela tremeluzindo / PWM não detectado | 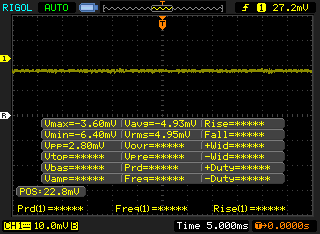 | ||
[pwm_comparison] Em comparação: 52 % de todos os dispositivos testados não usam PWM para escurecer a tela. Se PWM foi detectado, uma média de 7784 (mínimo: 5 - máximo: 343500) Hz foi medida. | |||
| Cinebench R11.5 | |
| CPU Single 64Bit | |
| Corsair One i160 | |
| MSI GE75 9SG | |
| Média Intel Core i7-9750H (1.96 - 2.19, n=10) | |
| Razer Blade Pro 2017 | |
| CPU Multi 64Bit | |
| Corsair One i160 | |
| MSI GE75 9SG | |
| Média Intel Core i7-9750H (11.3 - 14.1, n=10) | |
| Razer Blade Pro 2017 | |
| Cinebench R10 | |
| Rendering Multiple CPUs 32Bit | |
| Corsair One i160 | |
| Eurocom Nightsky RX15 | |
| MSI GE75 9SG | |
| Média Intel Core i7-9750H (28251 - 36304, n=13) | |
| HP Pavilion Gaming 15-ec0017ng | |
| Rendering Single 32Bit | |
| Eurocom Nightsky RX15 | |
| Corsair One i160 | |
| MSI GE75 9SG | |
| Média Intel Core i7-9750H (6659 - 7214, n=13) | |
| HP Pavilion Gaming 15-ec0017ng | |
| wPrime 2.10 - 1024m | |
| Média Intel Core i7-9750H (n=1) | |
| MSI GE75 9SG | |
| Eurocom Nightsky RX15 | |
| Corsair One i160 | |
* ... menor é melhor
| PCMark 8 Home Score Accelerated v2 | 4255 pontos | |
| PCMark 8 Work Score Accelerated v2 | 4755 pontos | |
| PCMark 10 Score | 6202 pontos | |
Ajuda | ||
| Razer Blade Pro 17 4K UHD 120 Hz Samsung SSD PM981 MZVLB1T0HALR | Razer Blade Pro 17 RTX 2080 Max-Q Samsung SSD PM981 MZVLB512HAJQ | Razer Blade Pro 17 RTX 2060 Samsung SSD PM981 MZVLB512HAJQ | Razer Blade Pro 2017 2x Samsung SSD PM951 MZVLV256HCHP (RAID 0) | MSI GS75 Stealth 9SG 2x Samsung SSD PM981 MZVLB1T0HALR (RAID 0) | Asus Zephyrus S GX701GX Samsung SSD PM981 MZVLB1T0HALR | |
|---|---|---|---|---|---|---|
| AS SSD | -11% | -6% | -22% | -3% | -4% | |
| Seq Read (MB/s) | 1881 | 1831 -3% | 1810 -4% | 2599 38% | 2855 52% | 911 -52% |
| Seq Write (MB/s) | 2354 | 1744 -26% | 1797 -24% | 588 -75% | 2687 14% | 2347 0% |
| 4K Read (MB/s) | 43.42 | 45.16 4% | 48.43 12% | 37.57 -13% | 30.31 -30% | 53 22% |
| 4K Write (MB/s) | 104.1 | 107.1 3% | 106 2% | 104.4 0% | 96.3 -7% | 122.5 18% |
| 4K-64 Read (MB/s) | 1805 | 1240 -31% | 1156 -36% | 1116 -38% | 1460 -19% | 1577 -13% |
| 4K-64 Write (MB/s) | 1775 | 1695 -5% | 1748 -2% | 513 -71% | 1224 -31% | 1734 -2% |
| Access Time Read * (ms) | 0.049 | 0.064 -31% | 0.057 -16% | 0.051 -4% | 0.054 -10% | 0.08 -63% |
| Access Time Write * (ms) | 0.106 | 0.037 65% | 0.035 67% | 0.036 66% | 0.038 64% | 0.031 71% |
| Score Read (Points) | 2037 | 1468 -28% | 1385 -32% | 1414 -31% | 1776 -13% | 1721 -16% |
| Score Write (Points) | 2115 | 1977 -7% | 2033 -4% | 676 -68% | 1589 -25% | 2091 -1% |
| Score Total (Points) | 5215 | 4197 -20% | 4135 -21% | 2715 -48% | 4259 -18% | 4771 -9% |
| Copy ISO MB/s (MB/s) | 1877 | 2086 11% | 1984 6% | 2226 19% | ||
| Copy Program MB/s (MB/s) | 539 | 425.5 -21% | 588 9% | 426.4 -21% | ||
| Copy Game MB/s (MB/s) | 1368 | 555 -59% | 835 -39% | 1152 -16% |
* ... menor é melhor

| 3DMark 11 | |
| 1280x720 Performance GPU | |
| Nvidia GeForce RTX 2080 Super | |
| Asus ROG G703GXR | |
| Nvidia GeForce GTX 1080 Founders Edition | |
| Razer Blade Pro 17 4K UHD 120 Hz | |
| Média NVIDIA GeForce RTX 2080 Max-Q (23386 - 30910, n=20) | |
| Asus Strix Scar III G531GW-AZ062T | |
| Razer Blade Pro 2017 | |
| Alienware 15 R3 Max-Q | |
| Alienware 17 R5 | |
| Razer Blade Pro 17 RTX 2060 | |
| Dell G5 15 5590-P8RVW | |
| Razer Blade 15 GTX 1660 Ti | |
| 1280x720 Performance Combined | |
| Nvidia GeForce RTX 2080 Super | |
| Razer Blade Pro 17 4K UHD 120 Hz | |
| Asus ROG G703GXR | |
| Razer Blade Pro 17 RTX 2060 | |
| Dell G5 15 5590-P8RVW | |
| Média NVIDIA GeForce RTX 2080 Max-Q (9212 - 14894, n=20) | |
| Nvidia GeForce GTX 1080 Founders Edition | |
| Razer Blade 15 GTX 1660 Ti | |
| Alienware 17 R5 | |
| Asus Strix Scar III G531GW-AZ062T | |
| Razer Blade Pro 2017 | |
| Alienware 15 R3 Max-Q | |
| 3DMark 11 Performance | 22165 pontos | |
| 3DMark Cloud Gate Standard Score | 38524 pontos | |
| 3DMark Fire Strike Score | 18629 pontos | |
| 3DMark Time Spy Score | 7973 pontos | |
Ajuda | ||
| Shadow of the Tomb Raider - 1920x1080 Highest Preset AA:T | |
| Corsair One i160 | |
| Nvidia GeForce RTX 2080 Super | |
| MSI GE75 9SG | |
| Razer Blade Pro 17 4K UHD 120 Hz | |
| Eurocom Nightsky RX15 | |
| Média NVIDIA GeForce RTX 2080 Max-Q (71 - 105, n=8) | |
| Razer Blade Pro 17 RTX 2060 | |
| Asus Strix Scar III G531GW-AZ062T | |
| Gigabyte Aero 17 XA RP77 | |
| Asus Zephyrus S GX701GX | |
| Lenovo Legion Y740-17IRH | |
| Razer Blade 15 GTX 1660 Ti | |
| MSI GF65 9SD | |
| HP Pavilion Gaming 15-ec0017ng | |
| Dell XPS 15 7590 9980HK GTX 1650 | |
| The Witcher 3 - 1920x1080 Ultra Graphics & Postprocessing (HBAO+) | |
| Corsair One i160 | |
| Nvidia GeForce RTX 2080 Super | |
| Asus ROG G703GXR | |
| MSI GE75 9SG | |
| Razer Blade Pro 17 4K UHD 120 Hz | |
| Razer Blade Pro 17 RTX 2080 Max-Q | |
| Asus Zephyrus S GX701GX | |
| MSI P65 Creator 9SF-657 | |
| Eurocom Nightsky RX15 | |
| Média NVIDIA GeForce RTX 2080 Max-Q (65.7 - 92.7, n=22) | |
| MSI GS75 Stealth 9SG | |
| Nvidia GeForce GTX 1080 Founders Edition | |
| Asus Strix Scar III G531GW-AZ062T | |
| Razer Blade 15 RTX 2070 Max-Q | |
| Gigabyte Aero 17 XA RP77 | |
| Razer Blade Pro 17 RTX 2060 | |
| Razer Blade Pro 2017 | |
| Alienware 15 R3 Max-Q | |
| Dell G5 15 5590-P8RVW | |
| Alienware 17 R5 | |
| MSI GF65 9SD | |
| Lenovo Legion Y740-17IRH | |
| HP Pavilion Gaming 15-ec0017ng | |
| Razer Blade 15 GTX 1660 Ti | |
| Dell G3 3590 | |
| Dell XPS 15 7590 9980HK GTX 1650 | |
| Lenovo Legion Y730-15ICH i5-8300H | |
| Razer Blade Stealth i7-8565U | |
| Razer Blade Stealth i7-1065G7 Iris Plus | |
| baixo | média | alto | ultra | 4K | |
|---|---|---|---|---|---|
| BioShock Infinite (2013) | 349.6 | 311.9 | 284.1 | 189.5 | |
| The Witcher 3 (2015) | 325 | 258.7 | 179.9 | 92.7 | 65.5 |
| Shadow of the Tomb Raider (2018) | 132 | 118 | 111 | 105 | 40 |
(±) Jogando The Witcher 3, a temperatura média para o lado superior é 35.6 °C / 96 F, em comparação com a média do dispositivo de 33.9 °C / ## #class_avg_f### F.
(+) Os apoios para as mãos e o touchpad estão atingindo a temperatura máxima da pele (34 °C / 93.2 F) e, portanto, não estão quentes.
(-) A temperatura média da área do apoio para as mãos de dispositivos semelhantes foi 28.8 °C / 83.8 F (-5.2 °C / -9.4 F).
| desligado | |
| Ocioso | |
| Carga |
|
Key:
min: | |
| Razer Blade Pro 17 4K UHD 120 Hz i7-9750H, GeForce RTX 2080 Max-Q, Samsung SSD PM981 MZVLB1T0HALR, IPS, 3840x2160, 17.3" | Razer Blade Pro 17 RTX 2080 Max-Q i7-9750H, GeForce RTX 2080 Max-Q, Samsung SSD PM981 MZVLB512HAJQ, IPS, 1920x1080, 17.3" | Razer Blade Pro 17 RTX 2060 i7-9750H, GeForce RTX 2060 Mobile, Samsung SSD PM981 MZVLB512HAJQ, IPS, 1920x1080, 17.3" | Razer Blade Pro 2017 i7-7820HK, GeForce GTX 1080 Mobile, 2x Samsung SSD PM951 MZVLV256HCHP (RAID 0), IGZO, 3840x2160, 17.3" | MSI GS75 Stealth 9SG i7-9750H, GeForce RTX 2080 Max-Q, 2x Samsung SSD PM981 MZVLB1T0HALR (RAID 0), IPS, 1920x1080, 17.3" | Asus Zephyrus S GX701GX i7-8750H, GeForce RTX 2080 Max-Q, Samsung SSD PM981 MZVLB1T0HALR, IPS, 1920x1080, 17.3" | |
|---|---|---|---|---|---|---|
| Power Consumption | 26% | 25% | -2% | 30% | 24% | |
| Idle Minimum * (Watt) | 34.2 | 16.2 53% | 16 53% | 31 9% | 13 62% | 19 44% |
| Idle Average * (Watt) | 37.2 | 20.4 45% | 21.7 42% | 36 3% | 17 54% | 22 41% |
| Idle Maximum * (Watt) | 50 | 26.1 48% | 26.1 48% | 44 12% | 25 50% | 30 40% |
| Load Average * (Watt) | 106.1 | 96.5 9% | 105.6 -0% | 107 -1% | 96 10% | 104 2% |
| Witcher 3 ultra * (Watt) | 178.7 | 182.9 -2% | 161.8 9% | 212 -19% | 156 13% | 167 7% |
| Load Maximum * (Watt) | 223.6 | 214.3 4% | 225.3 -1% | 258 -15% | 239 -7% | 203 9% |
* ... menor é melhor
| Razer Blade Pro 17 4K UHD 120 Hz i7-9750H, GeForce RTX 2080 Max-Q, 70 Wh | Razer Blade Pro 17 RTX 2080 Max-Q i7-9750H, GeForce RTX 2080 Max-Q, 70 Wh | Razer Blade Pro 17 RTX 2060 i7-9750H, GeForce RTX 2060 Mobile, 70 Wh | Razer Blade Pro 2017 i7-7820HK, GeForce GTX 1080 Mobile, 99 Wh | MSI GS75 Stealth 9SG i7-9750H, GeForce RTX 2080 Max-Q, 80.25 Wh | Asus Zephyrus S GX701GX i7-8750H, GeForce RTX 2080 Max-Q, 76 Wh | |
|---|---|---|---|---|---|---|
| Duração da bateria | 27% | 22% | -11% | 62% | 3% | |
| WiFi v1.3 (h) | 3.7 | 4.7 27% | 4.5 22% | 3.3 -11% | 6 62% | 3.8 3% |
| Reader / Idle (h) | 4.9 | 4.2 | 7.7 | 5 | ||
| Load (h) | 1.4 | 1.4 | 1.2 | 0.9 |
Pro
Contra
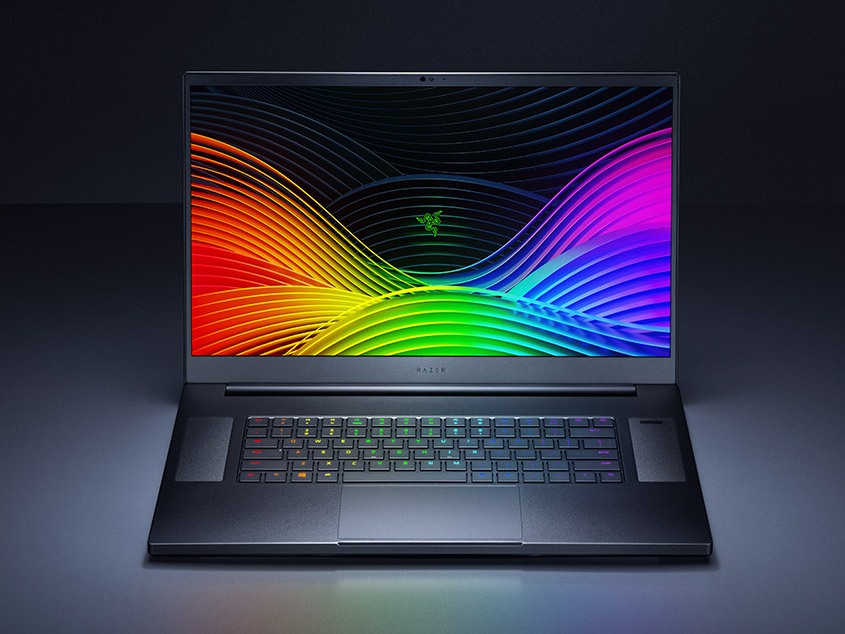
Os jogos nunca foram tão fluentes ou nítidos em um portátil de 17,3 polegadas por causa do novo painel nos jogos. Anteriormente, jogar em um portátil 4K de 17,3 polegadas implicaria tempos de resposta lentos, um limitador de 60 Hz e ghosting muito perceptível. A nova tela de 120 Hz no Razer aborda todas essas preocupações. Lembre-se de que é Não necessariamente alcançar 120 FPS estáveis para aproveitar as vantagens de um painel de 120 Hz e realmente esperamos que os portáteis de 17,3 polegadas concorrentes ofereçam eventualmente opções similares de 120 Hz em 4K no futuro. Mas, por enquanto, o Razer Blade Pro 17 é o único dispositivo no qual você pode encontrar esse painel em particular.
No entanto, os pequenos erros que encontramos em nossa unidade prejudicam a experiência. Aplicativos e tarefas comuns, como GeForce Experience e a comutação gráfica, devem estar funcionando por primeira vez, especialmente em uma máquina de US$ 3.700. Felizmente, esses engasgos parecem ser problemas de software em vez de hardware que, esperamos, possam ser corrigidos posteriormente.
Gostaríamos de ver o G-Sync em futuras revisões, que combinariam muito bem com um painel 4K. A comutação manual de gráficos suporta Optimus e G-Sync, como em alguns modelos Asus Zephyrus.
Pela primeira vez uma experiência de jogo 4K fluente e quase sem ghosting em um portátil de 120 Hz de 17,3 polegadas. Alguns bugs precisam ser corrigidos e o G-Sync definitivamente estaria na nossa lista de recursos desejados para o futuro.
Razer Blade Pro 17 4K UHD 120 Hz
- 10/31/2019 v7 (old)
Allen Ngo
Price comparison
