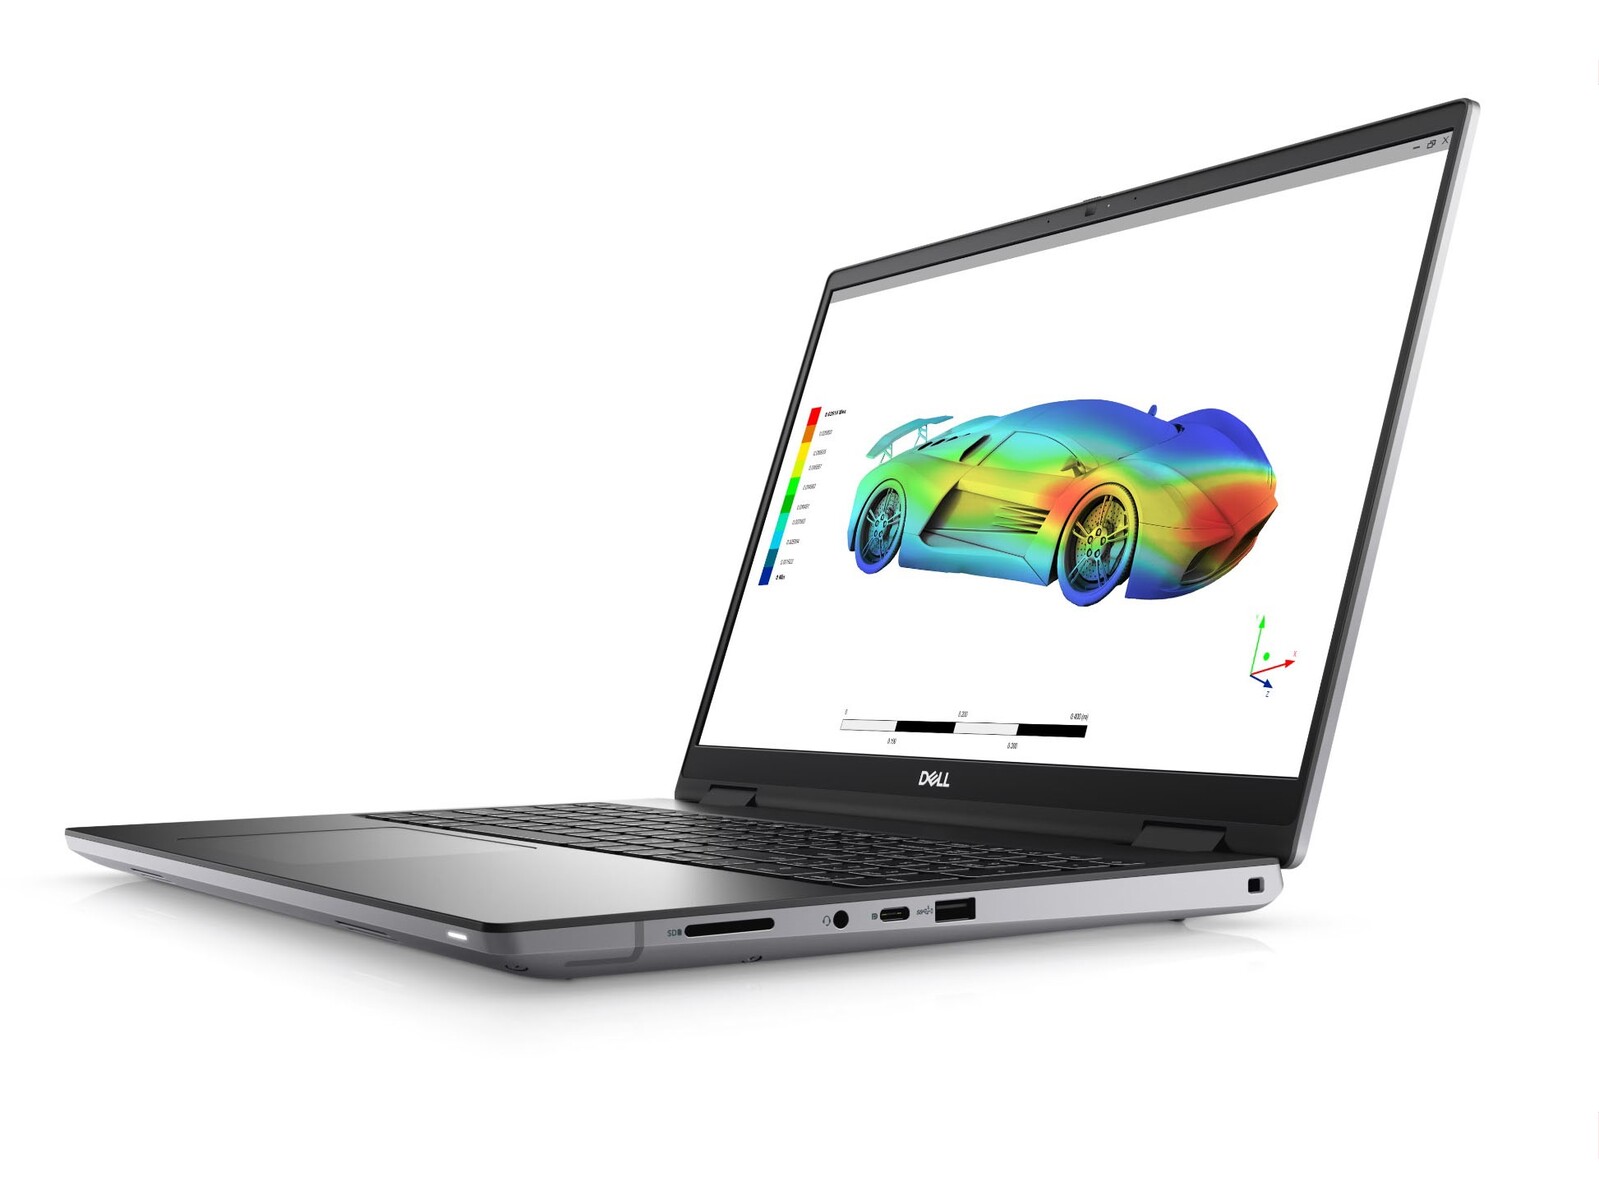
Nvidia RTX A5500 debut: Dell Precision 7670 Revisão da estação de trabalho de desempenho
A Dell está assumindo muitos riscos com sua nova série Precision 7670. Não só é a primeiro laptop de produção a utilizar o CAMMmas a série em si consiste em um modelo mais fino e um modelo mais potente e grosso (chamado de "Performance" ou "Ultimate"), dependendo da configuração. Revisamos o modelo mais fino no mês passado e agora vamos dar uma olhada no modelo mais grosso.
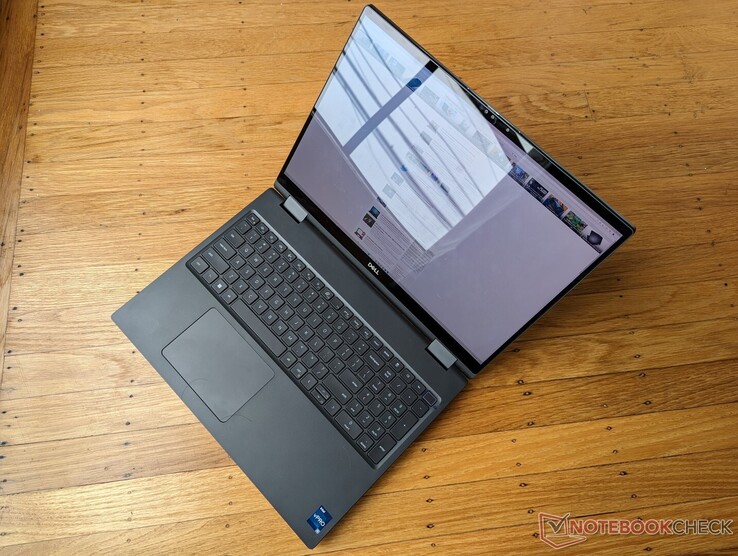
Além de suas pequenas diferenças na altura Z, os dois modelos compartilham exatamente o mesmo design e as mesmas características de chassis. Recomendamos verificar nossos revisão existente sobre o diluente Precision 7670 para saber mais sobre as características físicas da série.
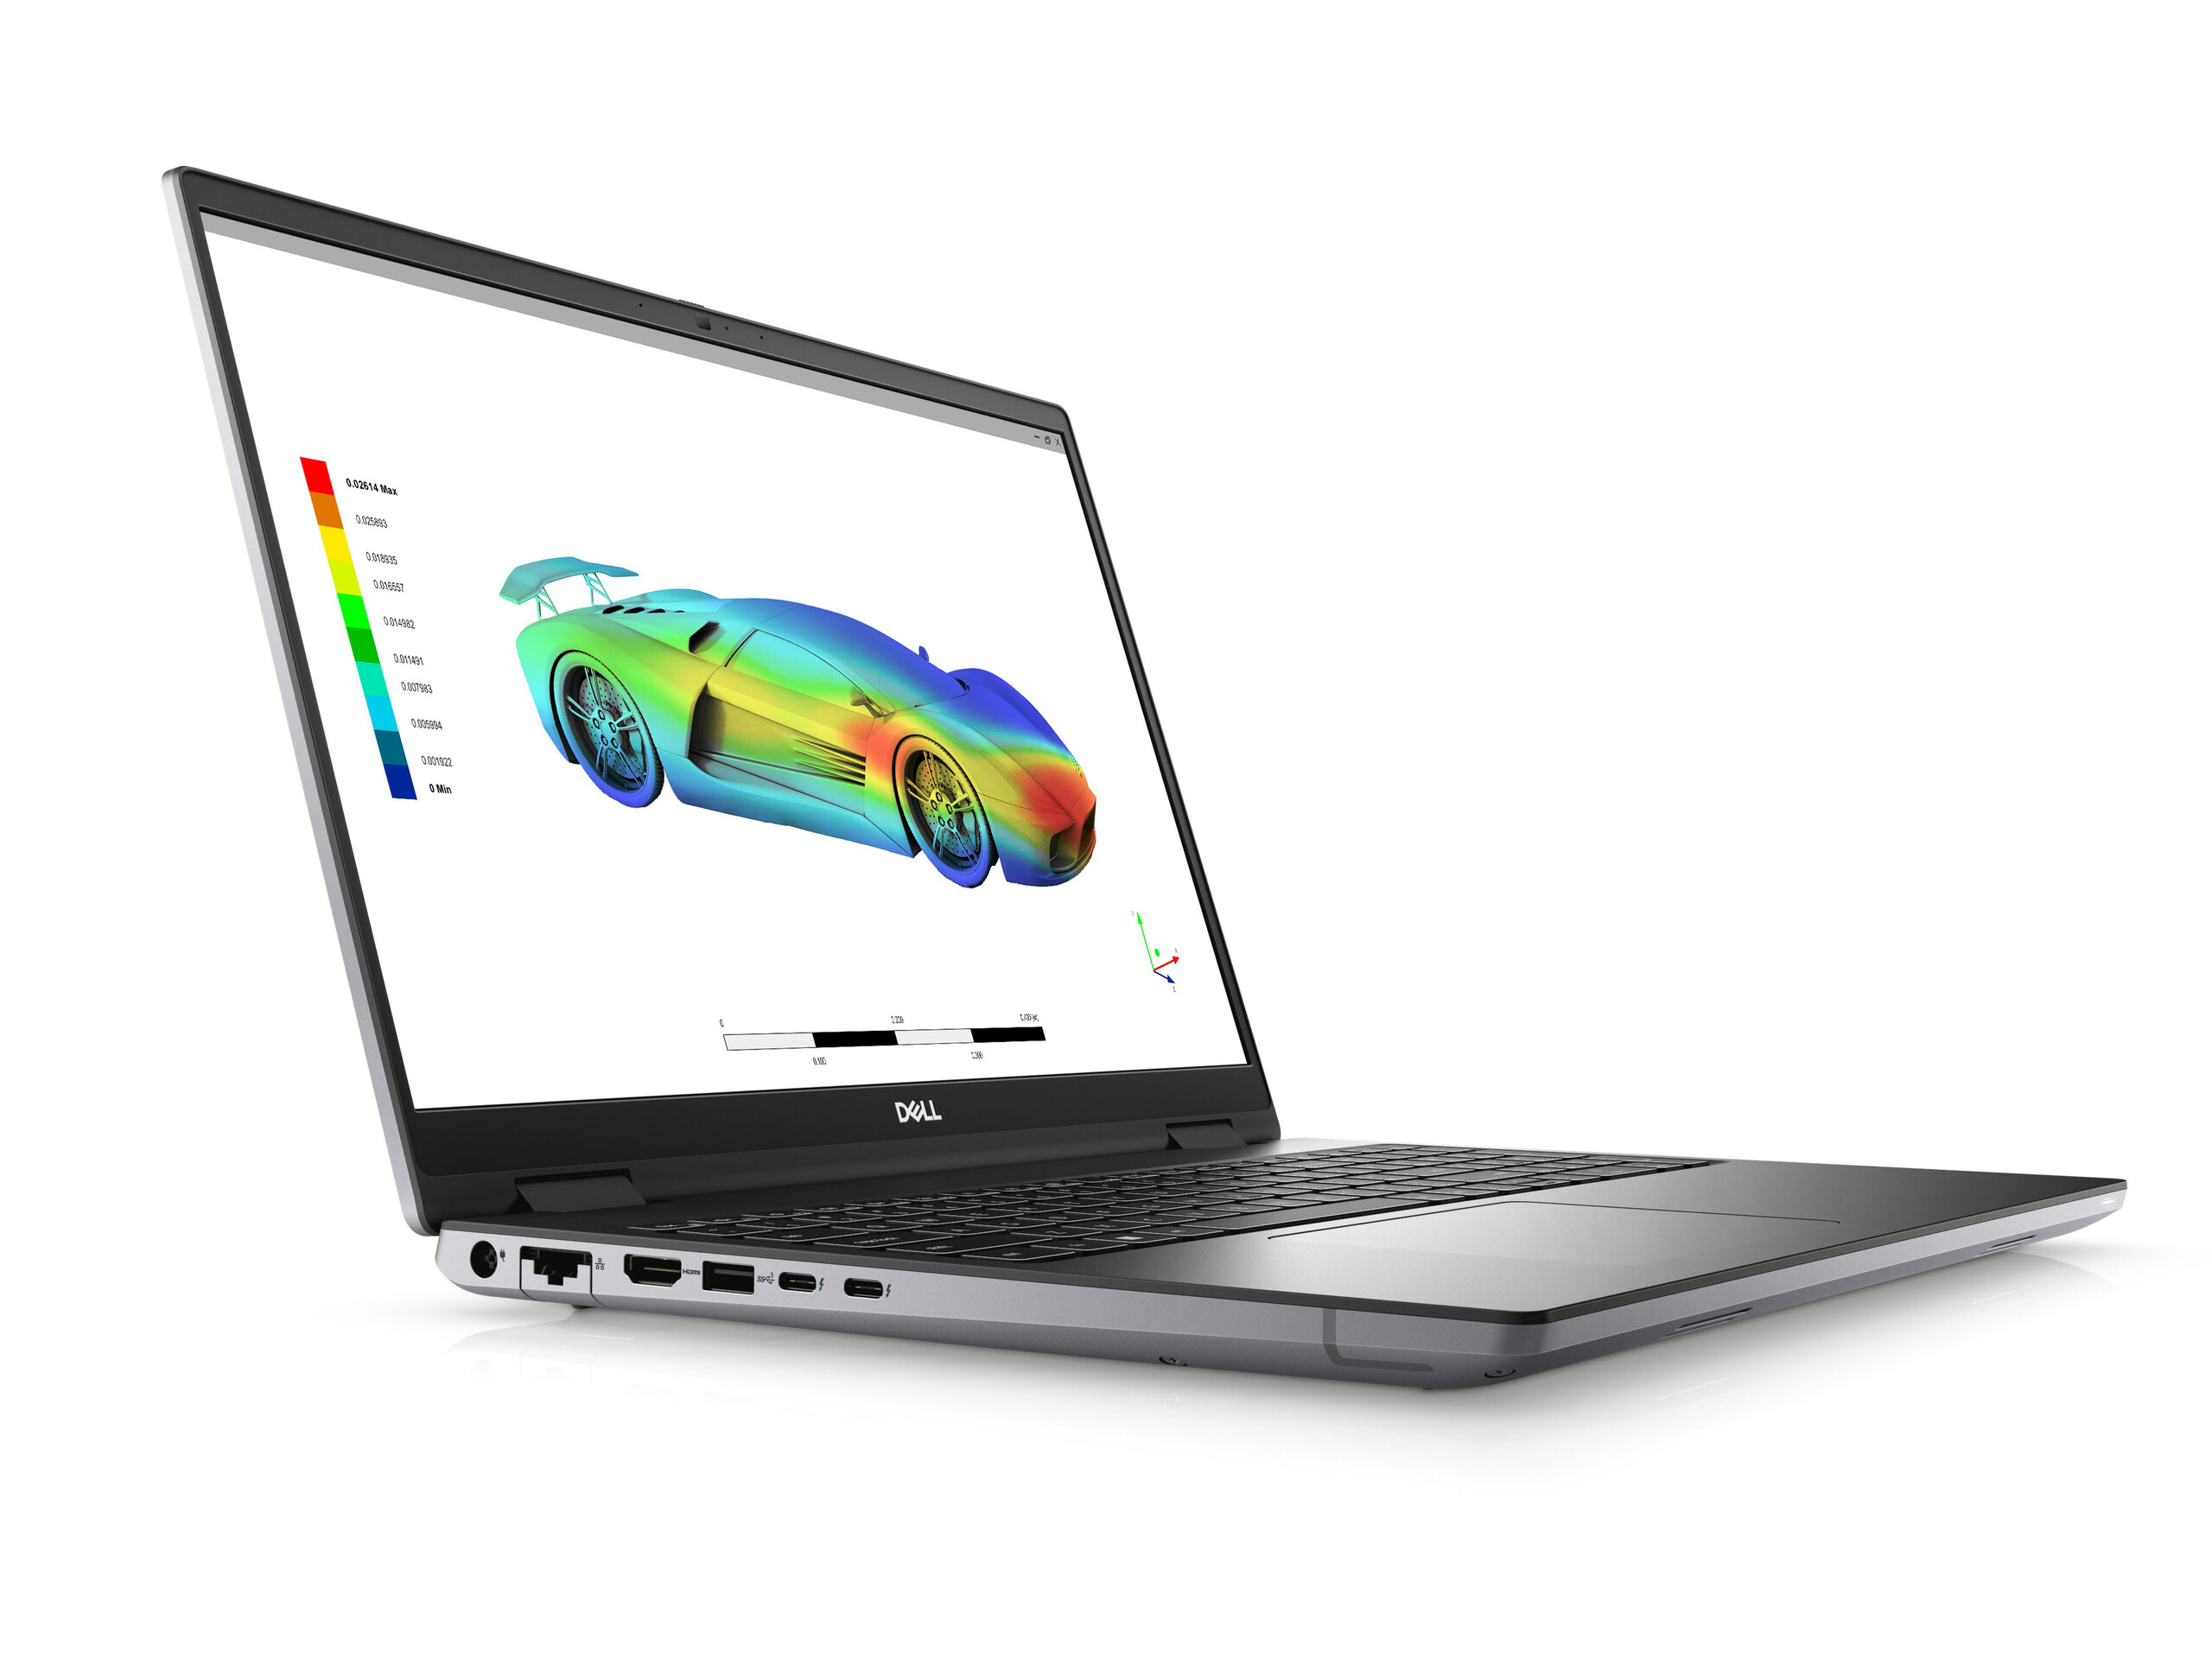
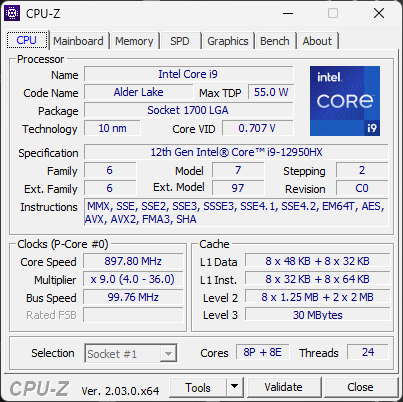
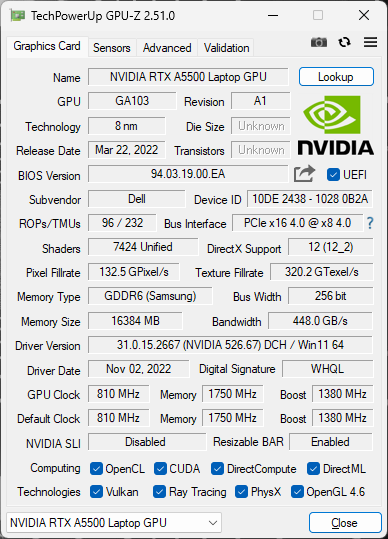
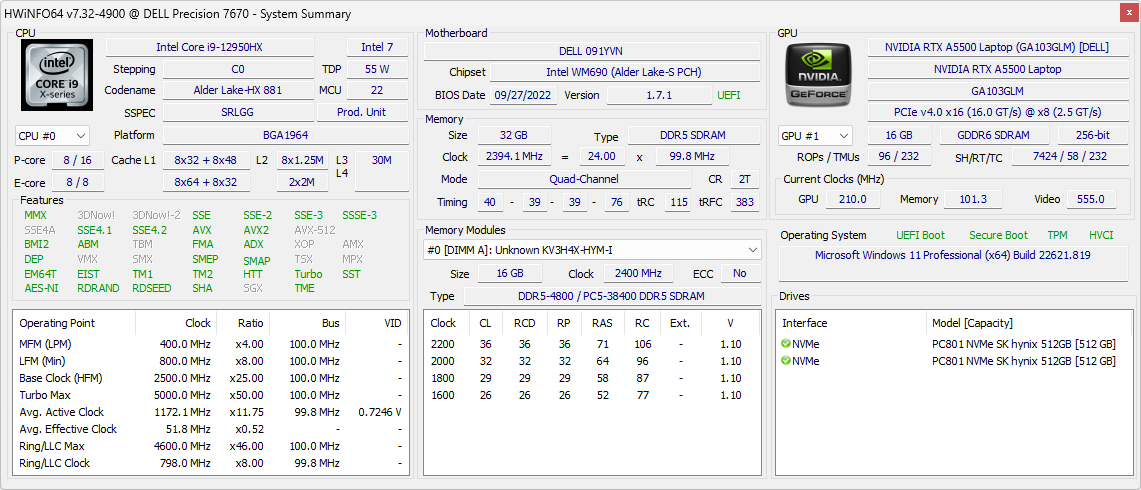
Nossa unidade de revisão específica é a configuração mais alta com a CPU Core i9-12950HX, GPU RTX A5500 e tela sensível ao toque OLED 2400p 16:10 por aproximadamente $7000 USD. SKUs menores vão até o Core i7-12850HX ou RTX A4500, mas todas as opções vêm com a mesma tela sensível ao toque IPS 2400p. Em contraste, o mais fino Precision 7670 só pode ir até a GPU RTX A2000.
Os concorrentes neste espaço incluem outras estações de trabalho móveis de 16 polegadas, como oMSI CreatorPro Z16P,HP ZBook Studio 16ouLenovo ThinkPad P1 G4.
Mais análises da Dell:
Possíveis concorrentes em comparação
Avaliação | Data | Modelo | Peso | Altura | Size | Resolução | Preço |
|---|---|---|---|---|---|---|---|
| 89.1 % v7 (old) | 12/2022 | Dell Precision 7000 7670 Performance i9-12950HX, RTX A5500 Laptop GPU | 2.8 kg | 25.95 mm | 16.00" | 3840x2400 | |
| 84.3 % v7 (old) | 11/2022 | MSI CreatorPro Z16P B12UKST i7-12700H, RTX A3000 Laptop GPU | 2.4 kg | 19 mm | 16.00" | 2560x1600 | |
| 90.1 % v7 (old) | 11/2022 | HP ZBook Studio 16 G9 62U04EA i7-12800H, RTX A2000 Laptop GPU | 1.8 kg | 19 mm | 16.00" | 3840x2400 | |
| 82.9 % v7 (old) | 10/2022 | HP ZBook Firefly 16 G9-6B897EA i7-1265U, T550 Laptop GPU | 2 kg | 19.2 mm | 16.00" | 1920x1200 | |
| 89.3 % v7 (old) | Lenovo ThinkPad P1 G4-20Y4Z9DVUS i7-11800H, T1200 Laptop GPU | 1.8 kg | 17.7 mm | 16.00" | 2560x1600 | ||
| 88.4 % v7 (old) | 10/2022 | Dell Precision 7670 i7-12850HX, RTX A2000 Laptop GPU | 2.7 kg | 24.7 mm | 16.00" | 3840x2400 |
Caso
O comprimento e a largura são idênticos aos do emagrecedor regular Precision 7670, enquanto a espessura e o peso foram aumentados em cerca de 1,3 mm e 100 g, respectivamente. É difícil notar as diferenças na prática, pois o regular Precision 7670 já é uma das estações de trabalho móveis mais grossas e pesadas.
Leitor de cartões SD
| SD Card Reader | |
| average JPG Copy Test (av. of 3 runs) | |
| Lenovo ThinkPad P1 G4-20Y4Z9DVUS (Angelbird AV Pro V60) | |
| Dell Precision 7670 (Toshiba Exceria Pro SDXC 64 GB UHS-II) | |
| Dell Precision 7000 7670 Performance (Toshiba Exceria Pro SDXC 64 GB UHS-II) | |
| MSI CreatorPro Z16P B12UKST (AV Pro V60) | |
| HP ZBook Studio 16 G9 62U04EA (Angelbird AV PRO V60) | |
| maximum AS SSD Seq Read Test (1GB) | |
| Dell Precision 7670 (Toshiba Exceria Pro SDXC 64 GB UHS-II) | |
| Dell Precision 7000 7670 Performance (Toshiba Exceria Pro SDXC 64 GB UHS-II) | |
| Lenovo ThinkPad P1 G4-20Y4Z9DVUS (Angelbird AV Pro V60) | |
| MSI CreatorPro Z16P B12UKST (AV Pro V60) | |
| HP ZBook Studio 16 G9 62U04EA (Angelbird AV PRO V60) | |
Comunicação
Embora o Intel AX211 esteja presente em todos Precision 7670 SKUs, o desempenho é mais lento do que o esperado em nossa unidade de teste específica. A taxa média de transmissão é de apenas 891 Mbps quando emparelhada com nossa rede de 6 Ghz, em comparação com quase o dobro da taxa de transmissão no MSI CreatorPro Z16P ou HP ZBook Firefly 16 G9 cada um com o mesmo módulo AX211. Repetimos este teste seis vezes em dois dias diferentes só para ter certeza, mas os resultados não melhorariam.
| Networking | |
| iperf3 transmit AX12 | |
| Lenovo ThinkPad P1 G4-20Y4Z9DVUS | |
| iperf3 receive AX12 | |
| Lenovo ThinkPad P1 G4-20Y4Z9DVUS | |
| iperf3 receive AXE11000 6GHz | |
| MSI CreatorPro Z16P B12UKST | |
| HP ZBook Studio 16 G9 62U04EA | |
| HP ZBook Firefly 16 G9-6B897EA | |
| Dell Precision 7000 7670 Performance | |
| Dell Precision 7670 | |
| iperf3 receive AXE11000 | |
| Dell Precision 7000 7670 Performance | |
| iperf3 transmit AXE11000 | |
| Dell Precision 7000 7670 Performance | |
| iperf3 transmit AXE11000 6GHz | |
| MSI CreatorPro Z16P B12UKST | |
| HP ZBook Firefly 16 G9-6B897EA | |
| HP ZBook Studio 16 G9 62U04EA | |
| Dell Precision 7670 | |
| Dell Precision 7000 7670 Performance | |
Webcam


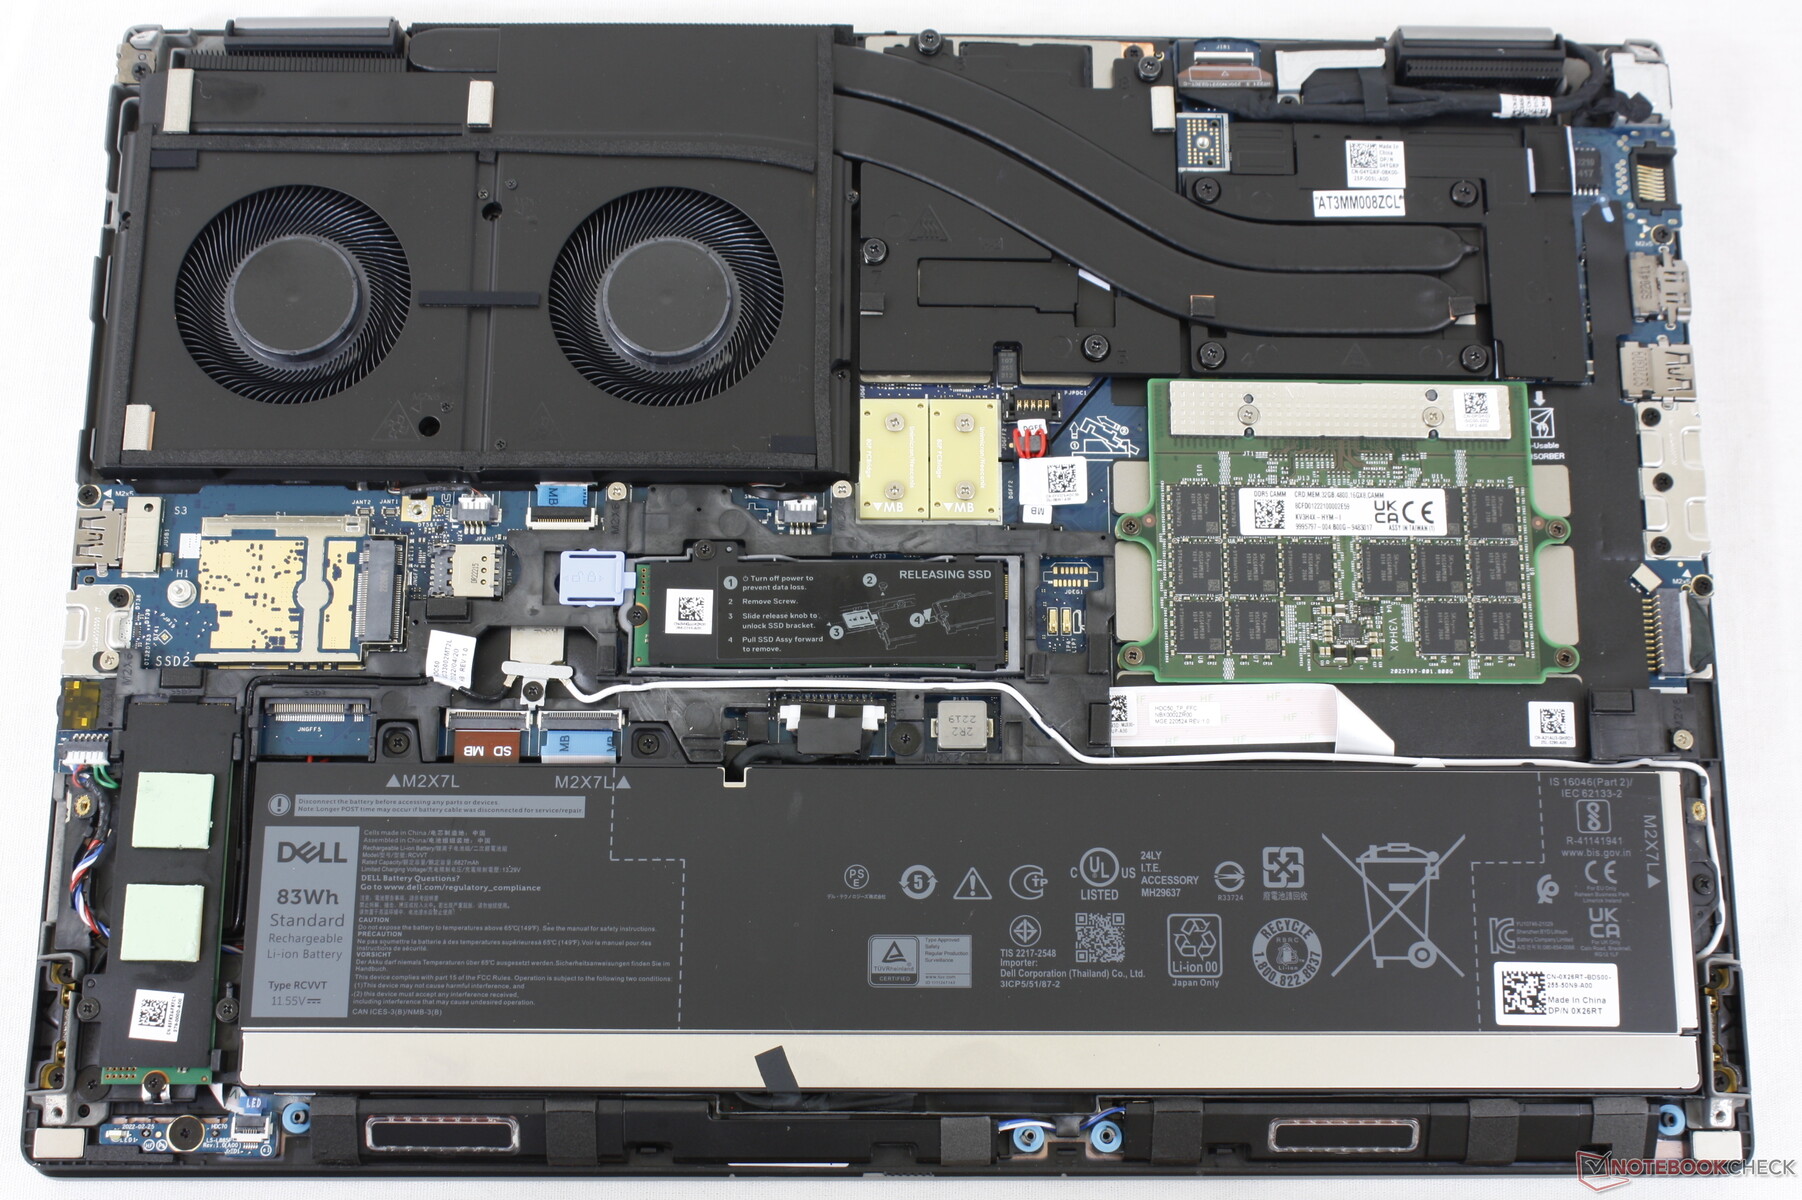
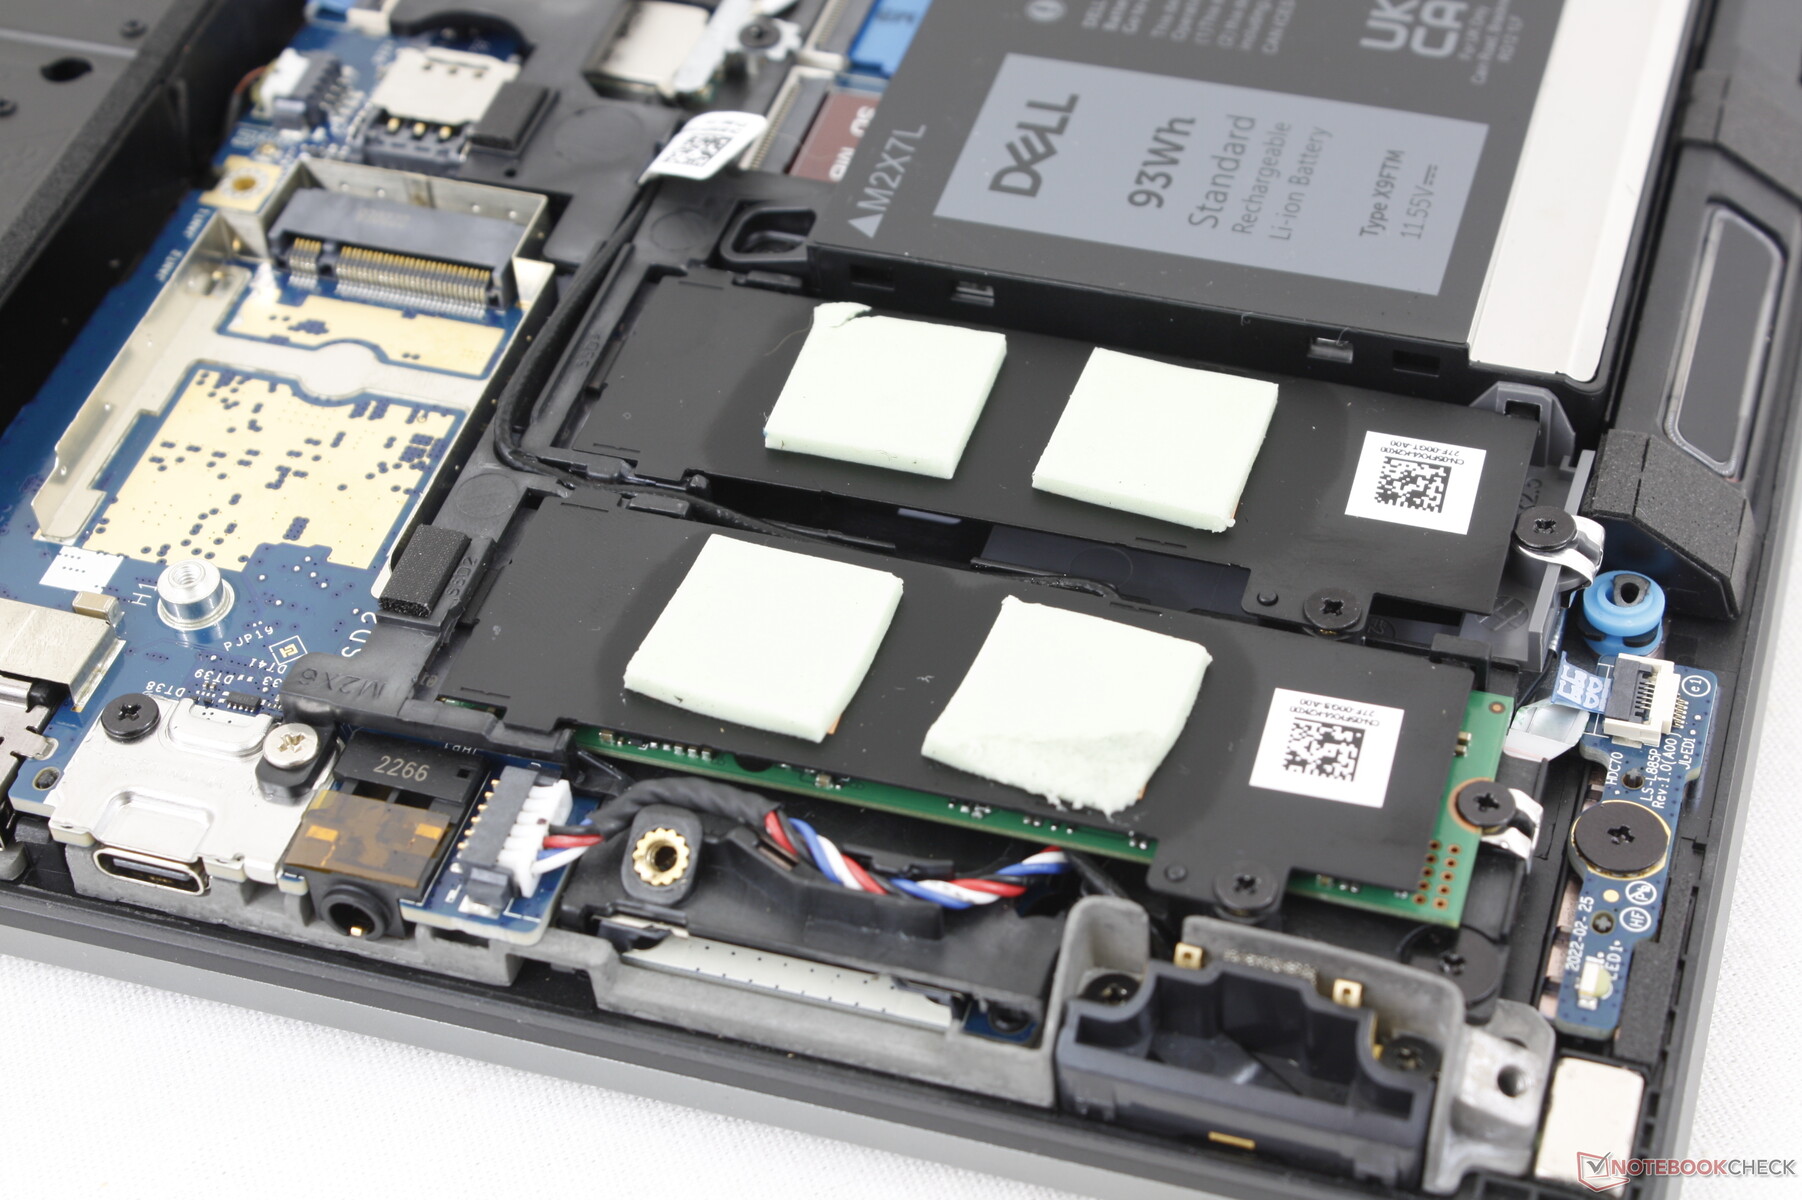
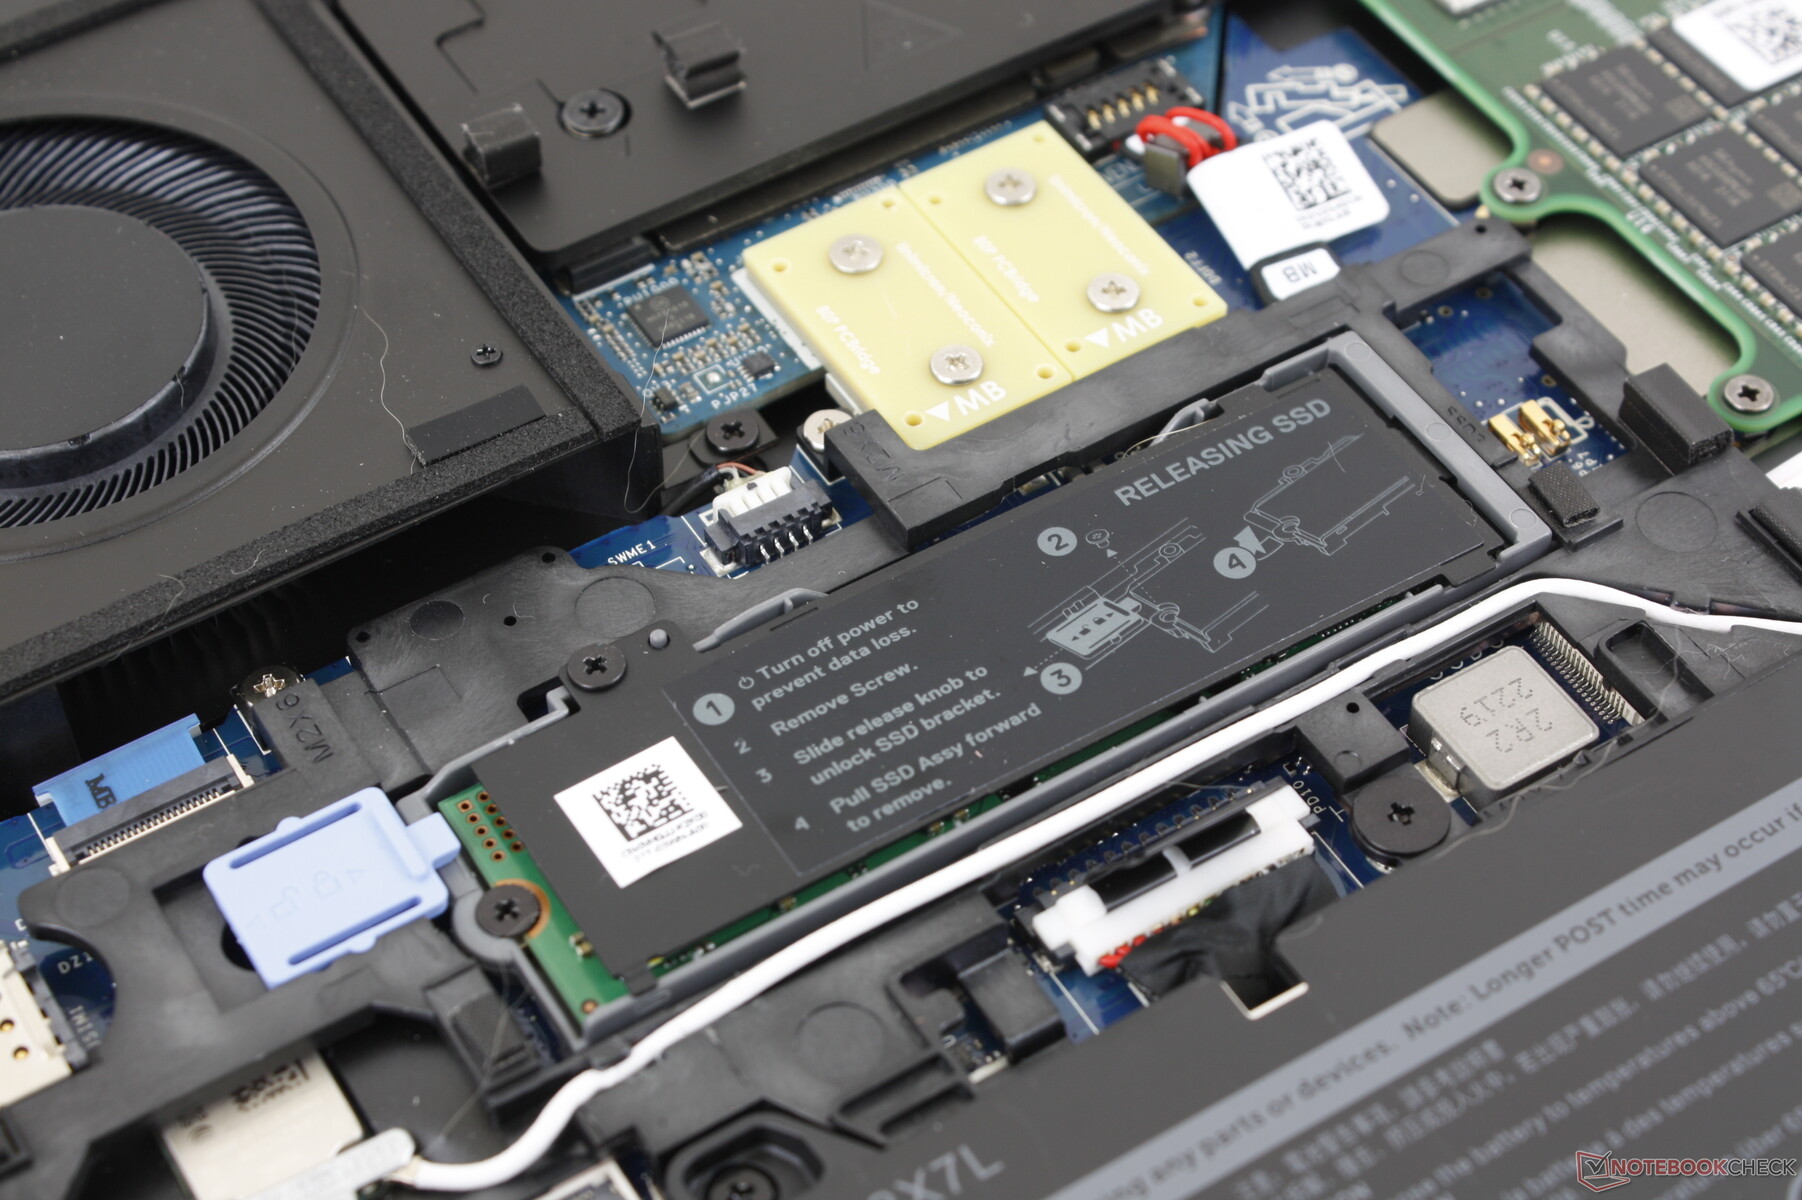
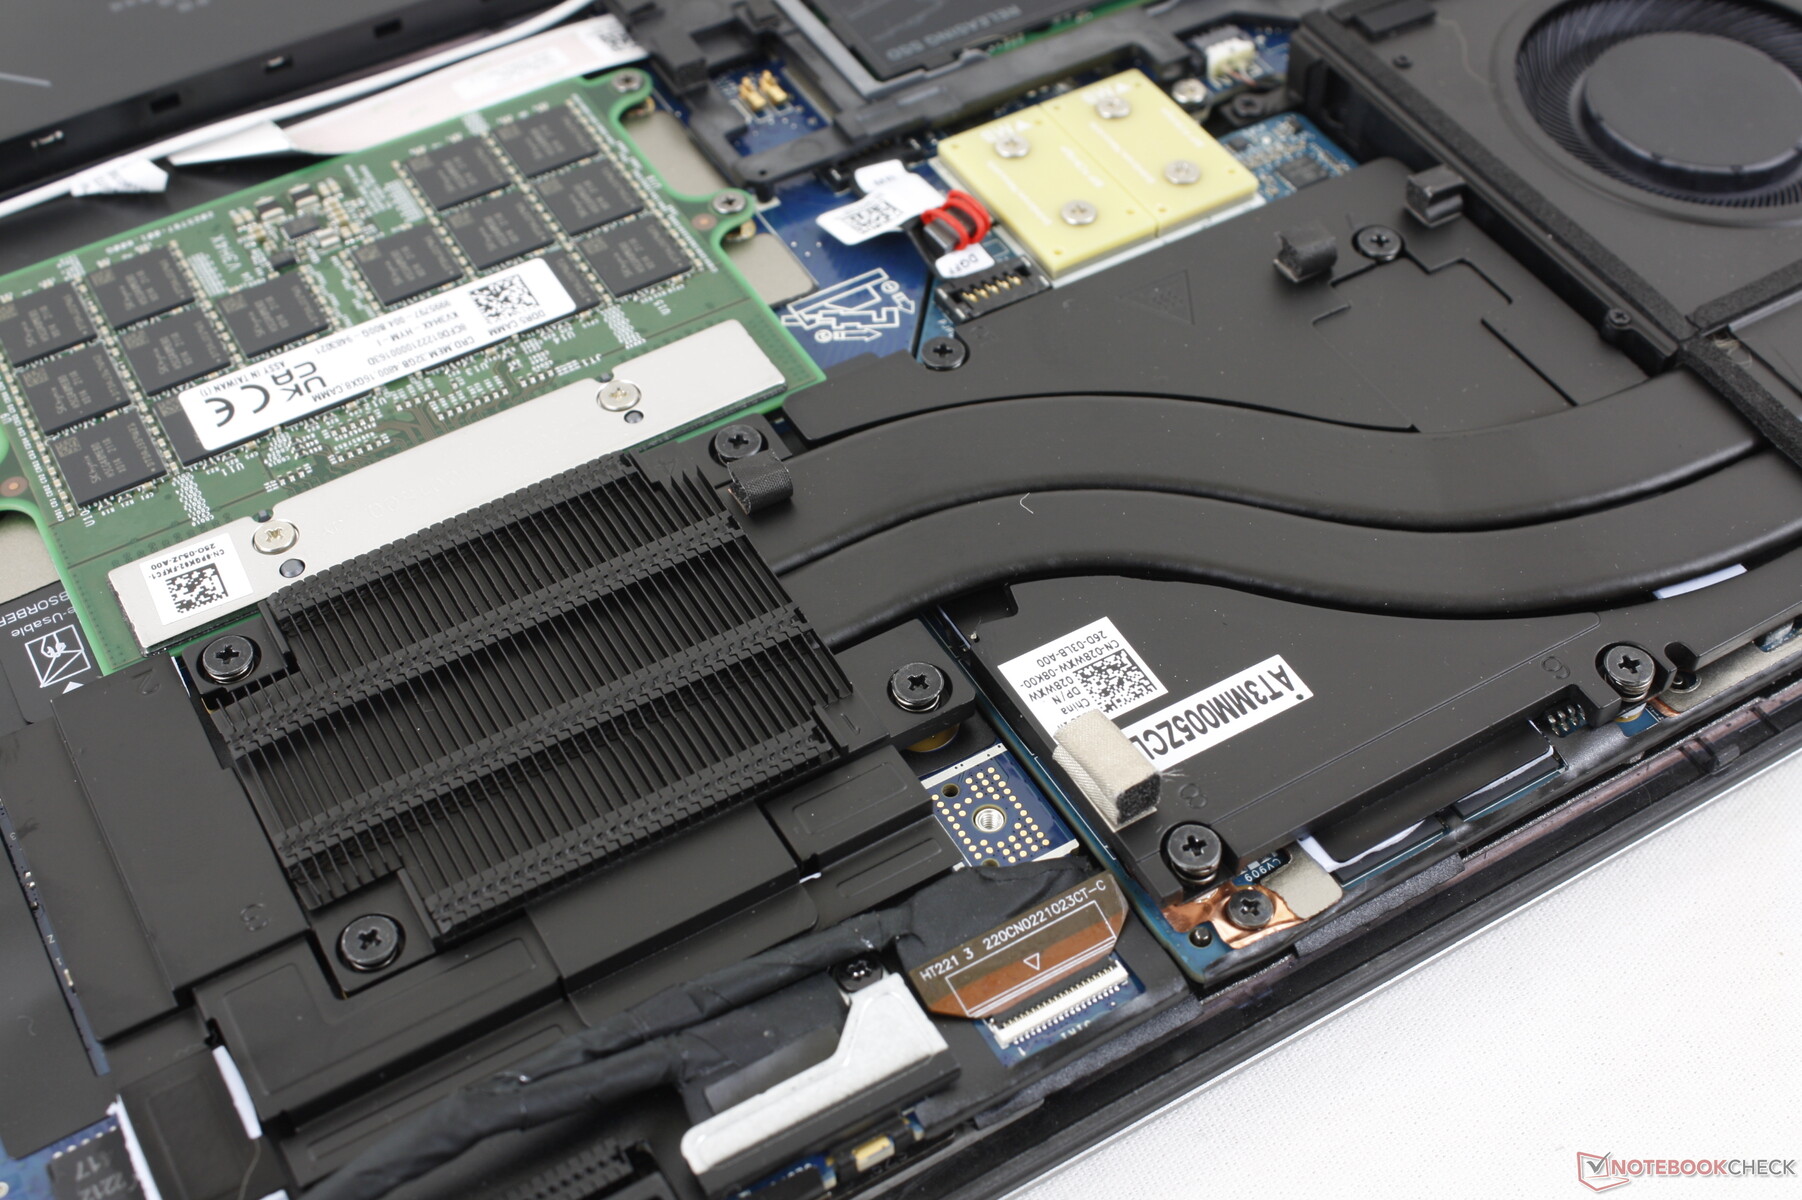
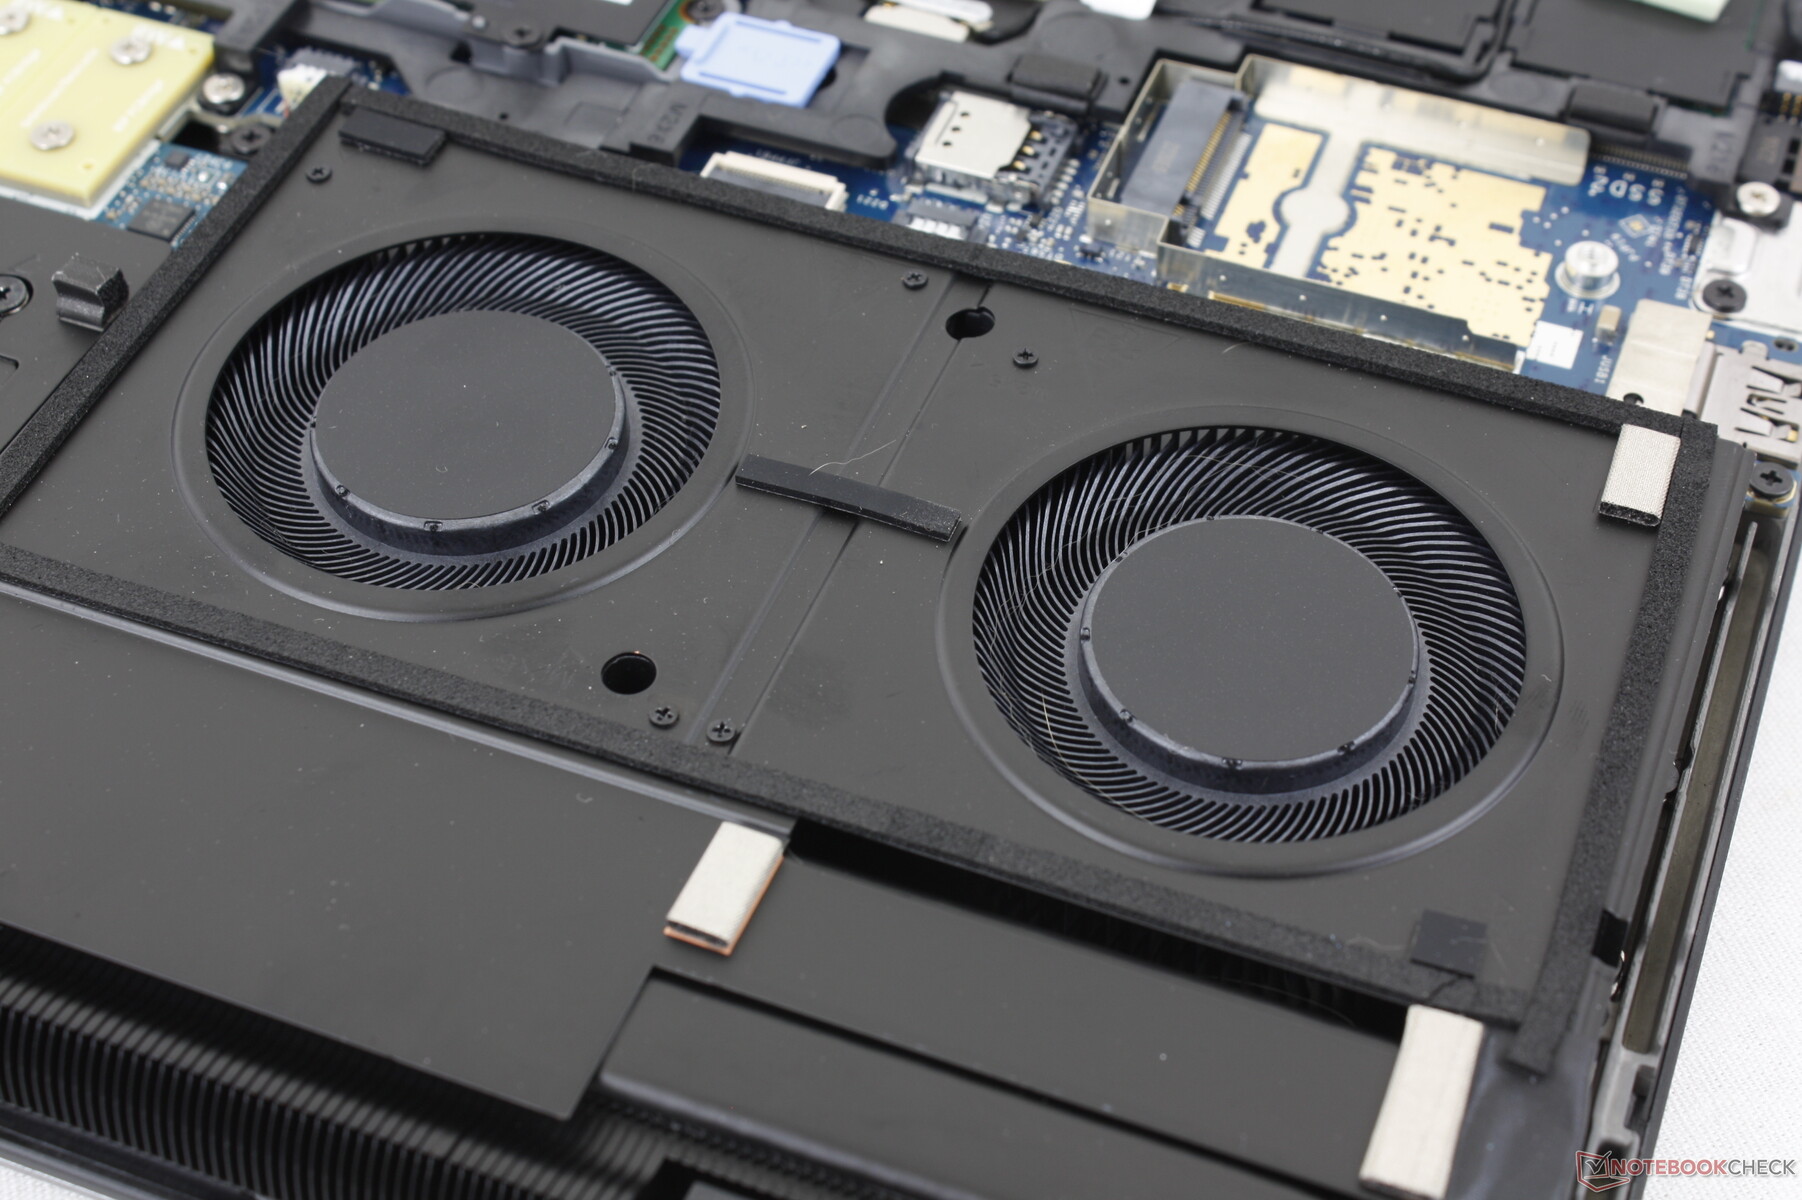
Manutenção
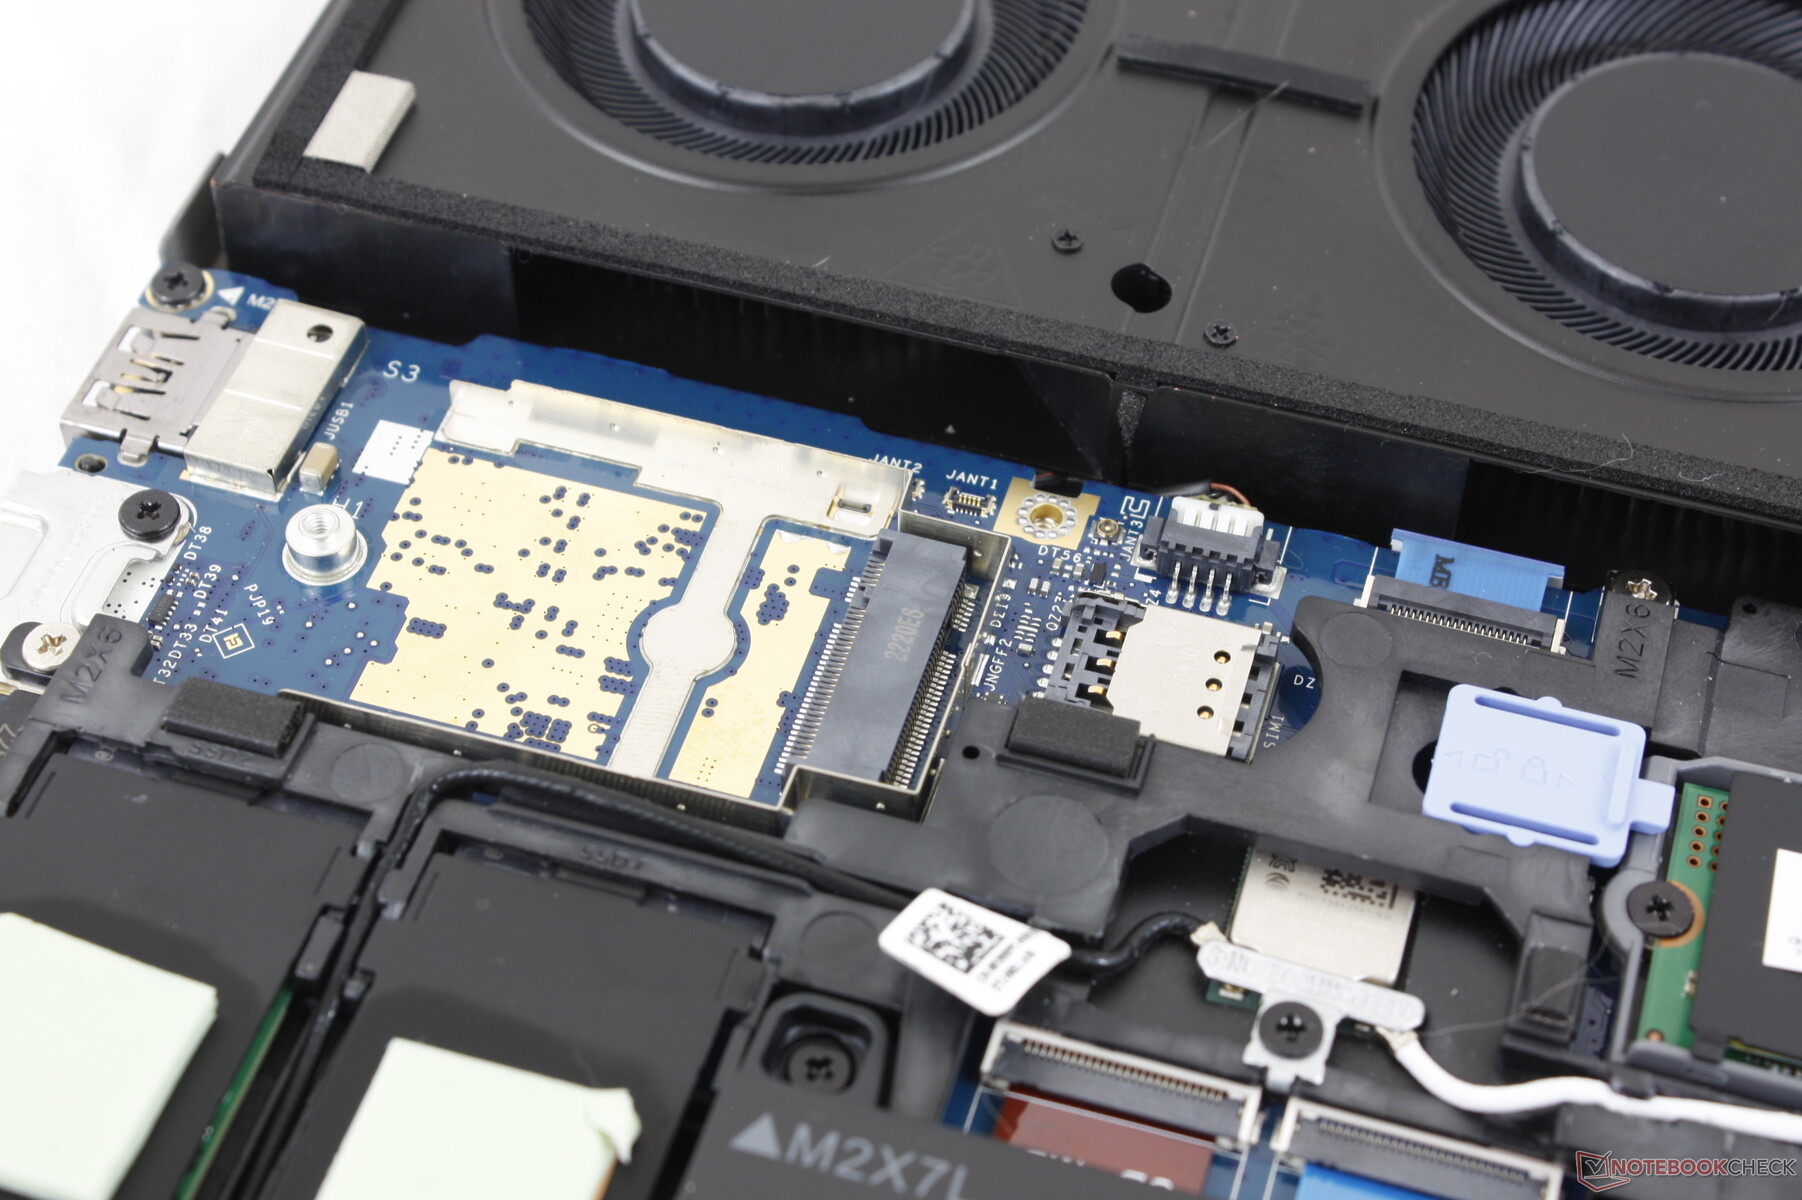
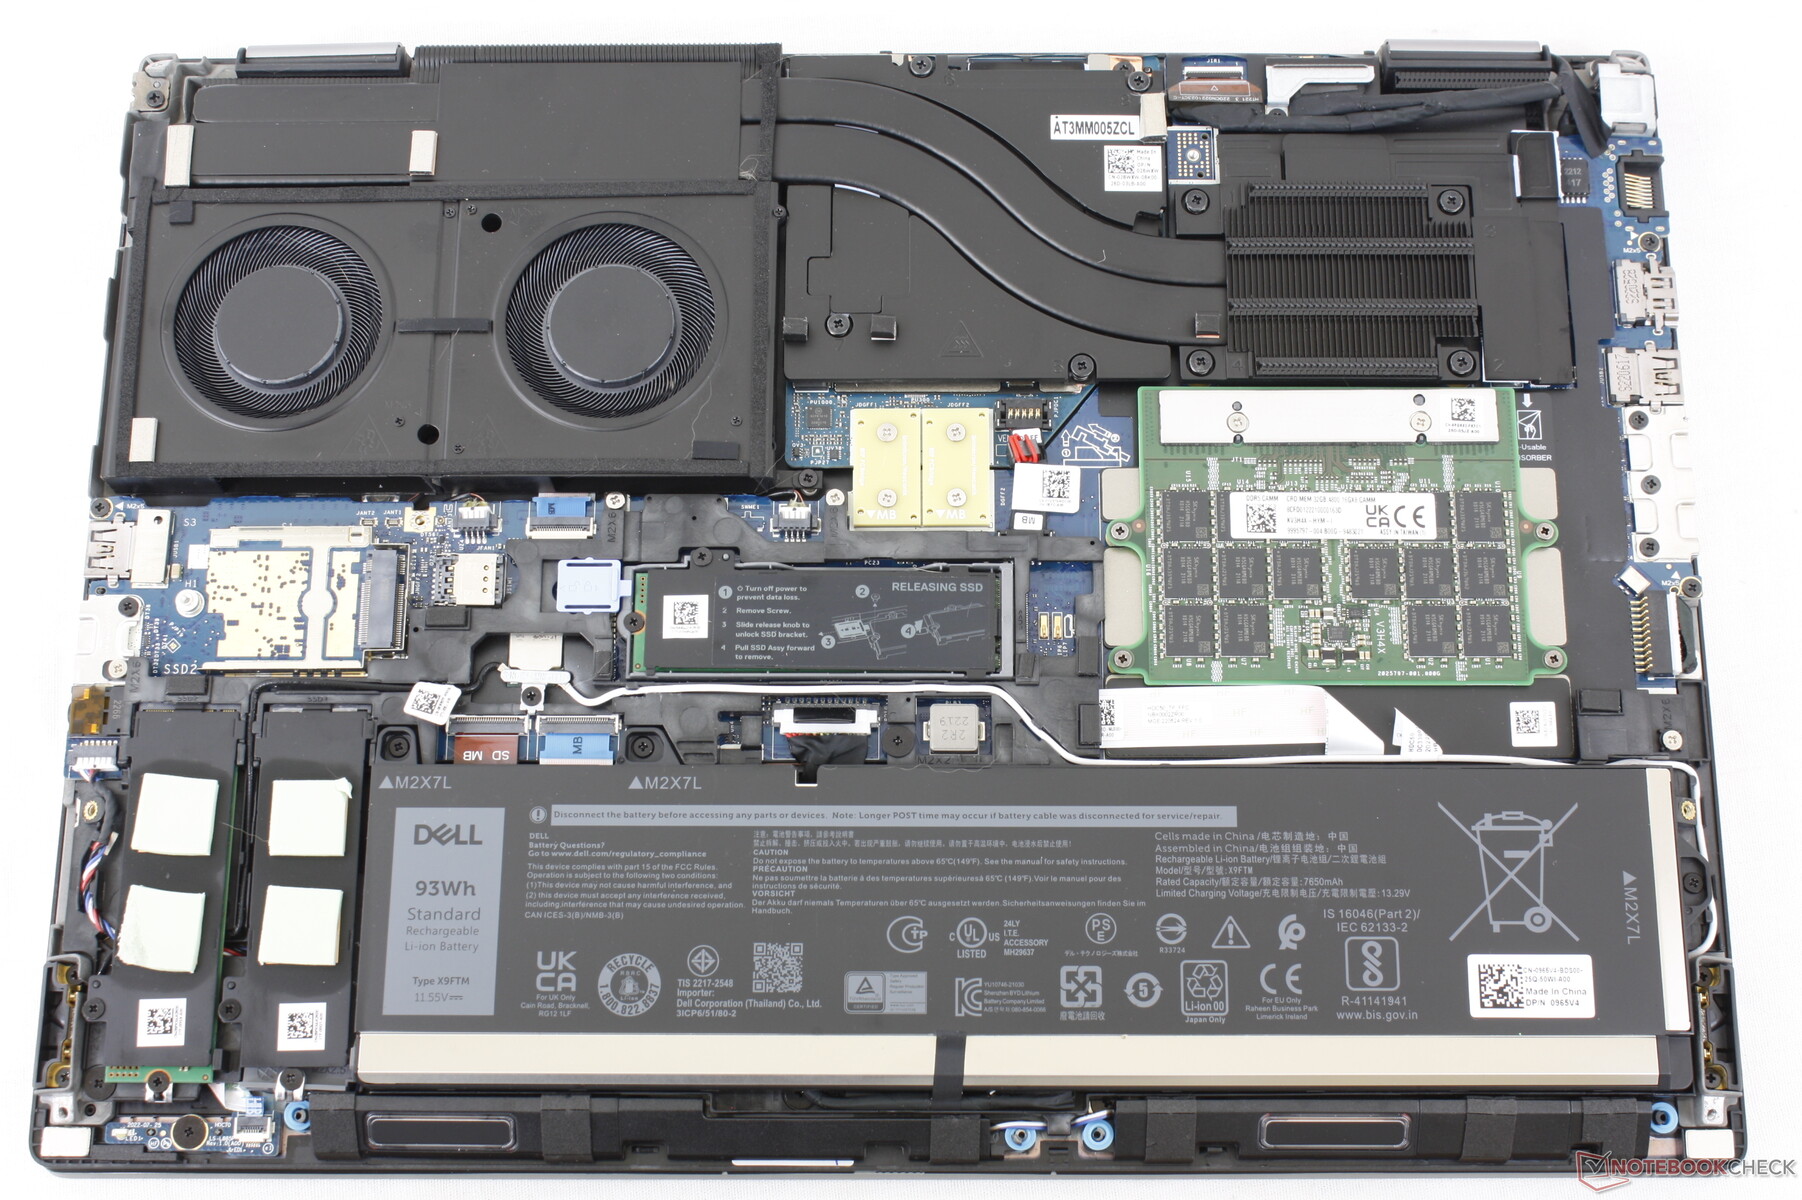
O painel inferior é fixado por seis parafusos Philips para facilitar a manutenção. O interior é semelhante ao mais fino Precision 7670, exceto pelas diferenças na capacidade da bateria, número de compartimentos de armazenamento disponíveis e presença de um pequeno dissipador de calor.
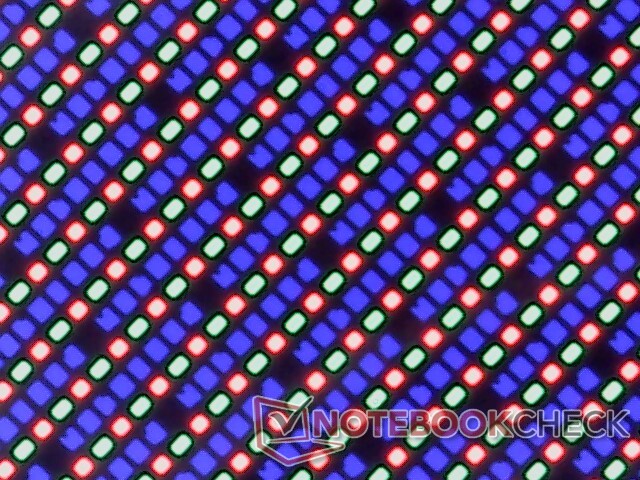
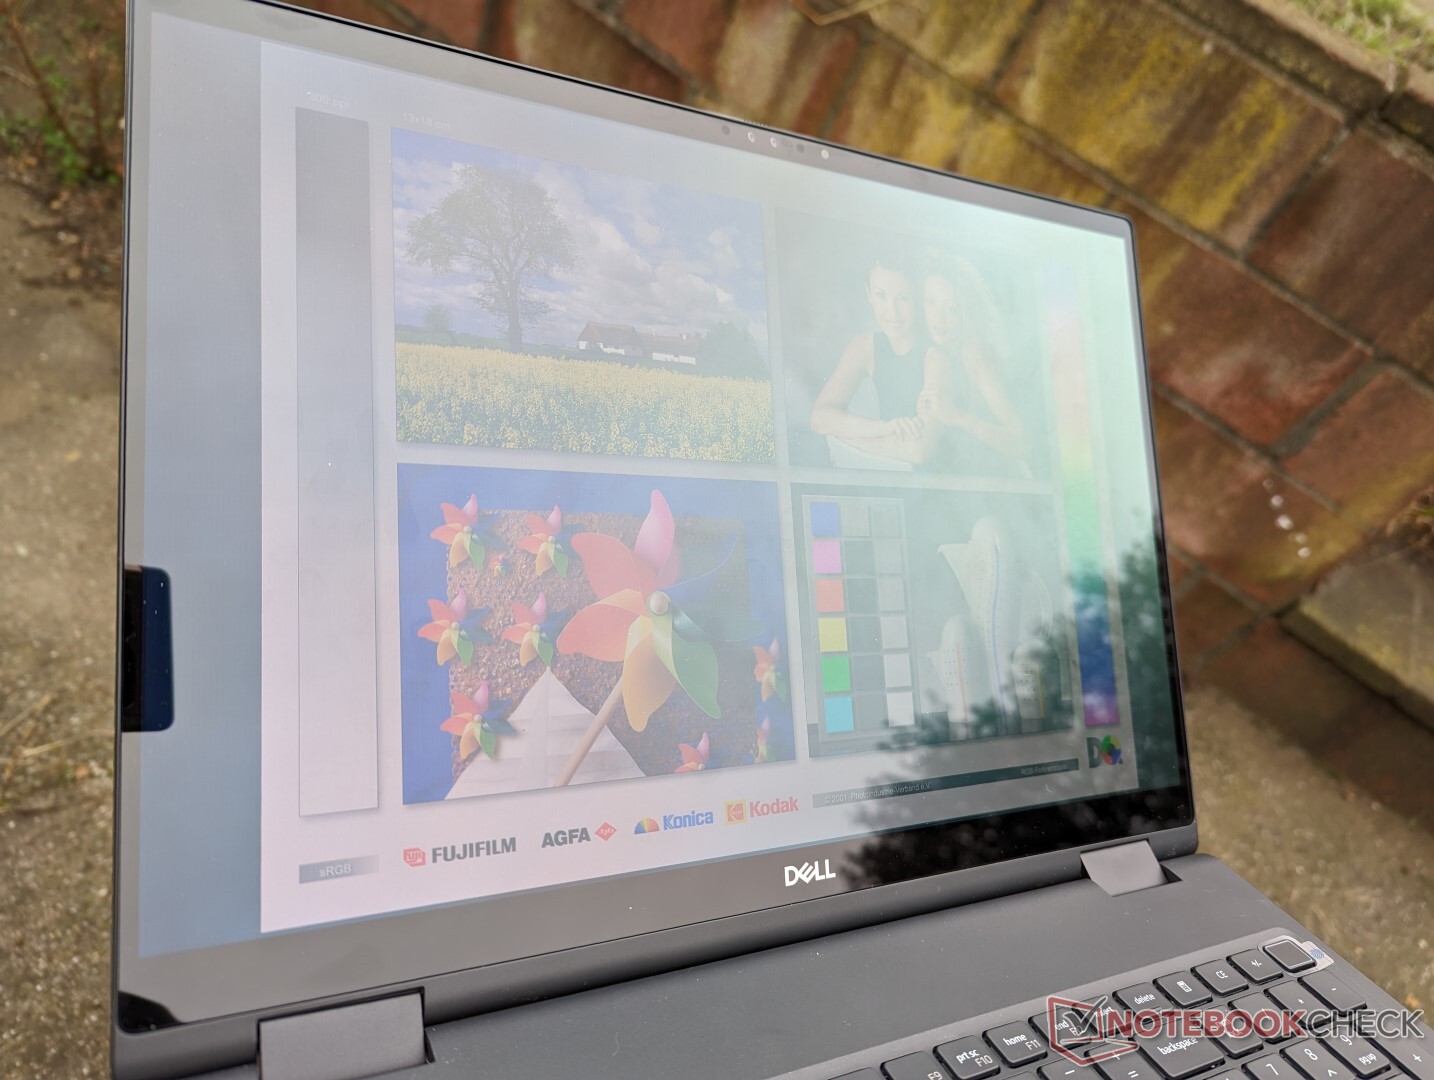
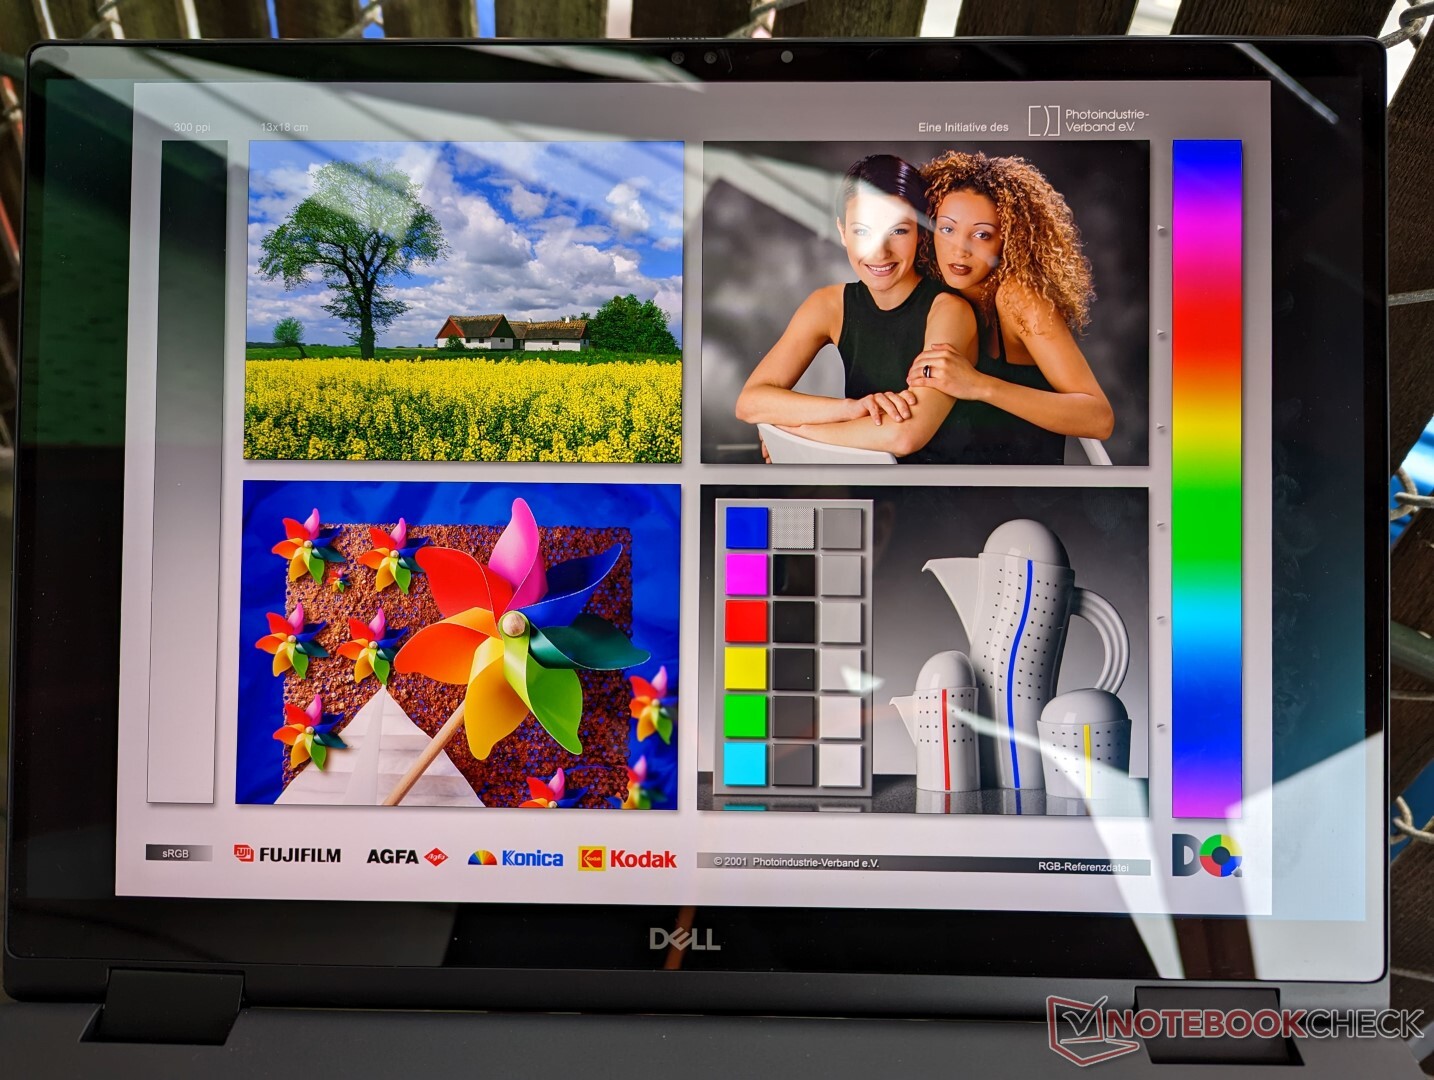
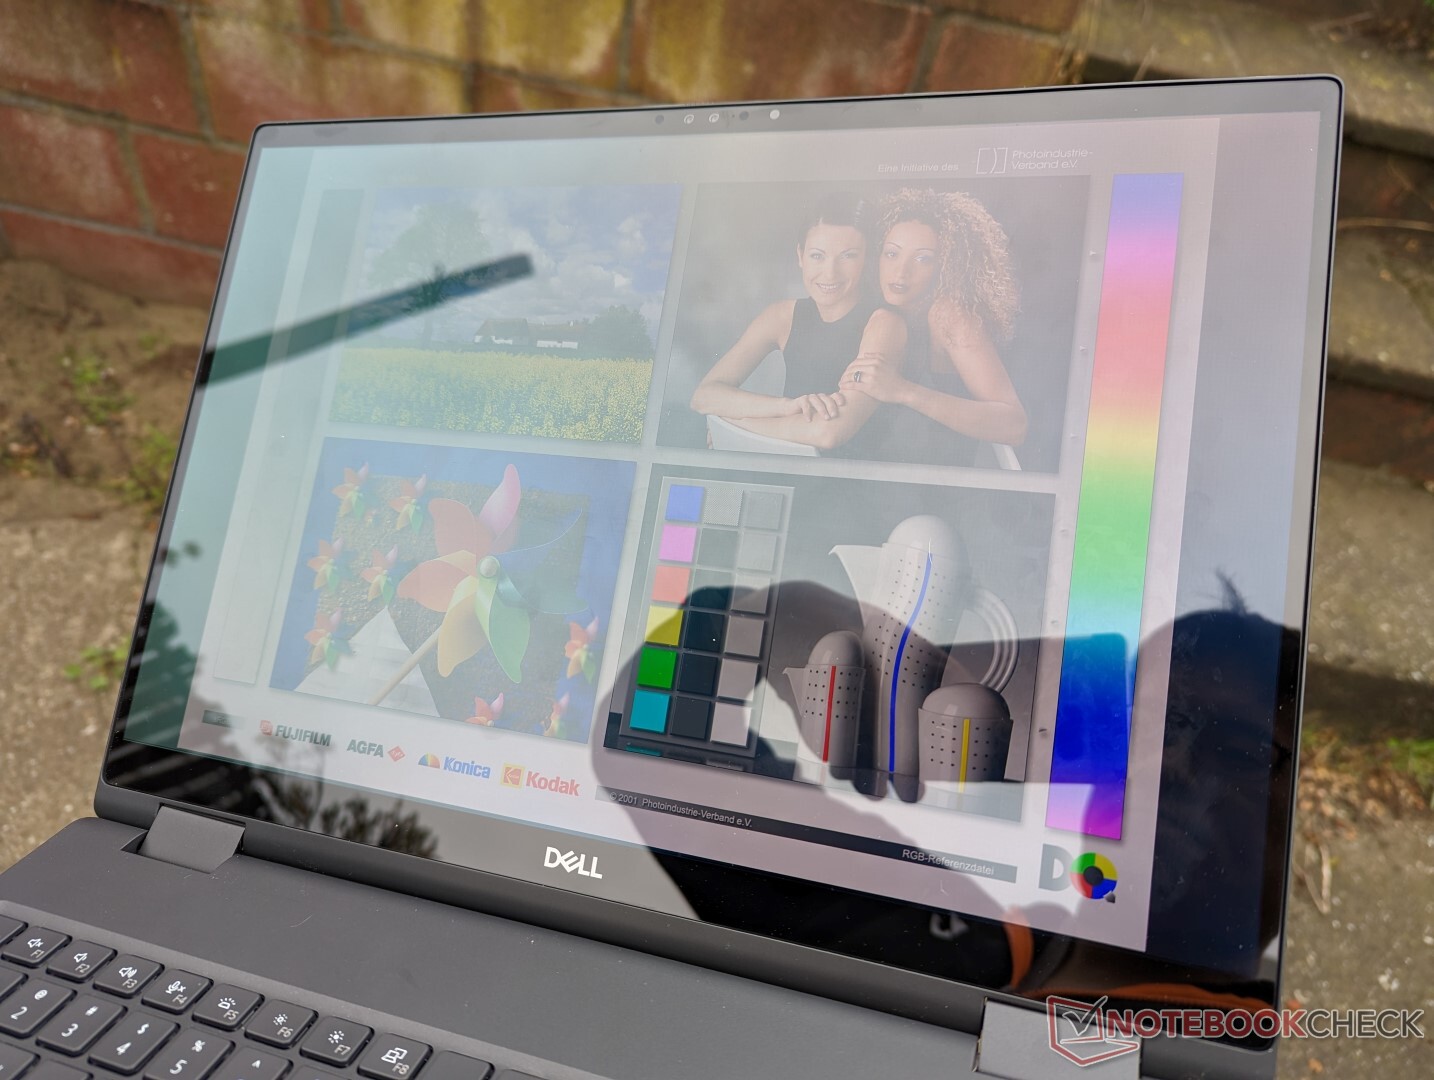
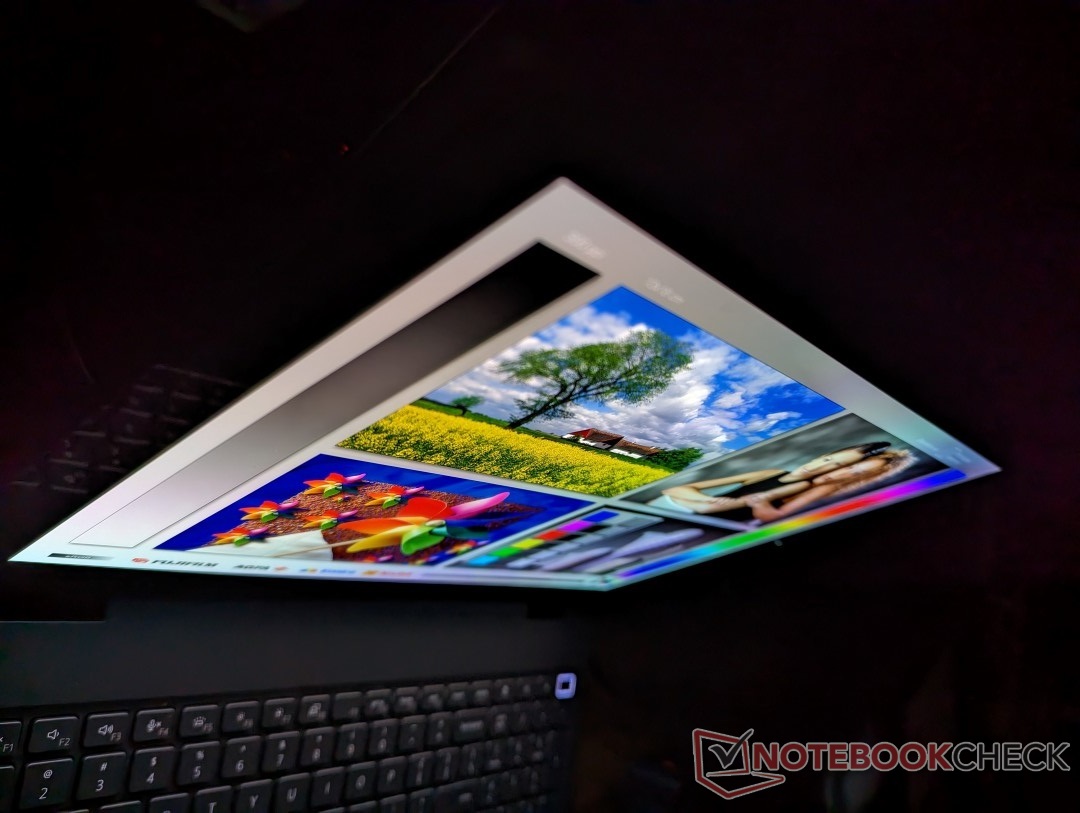
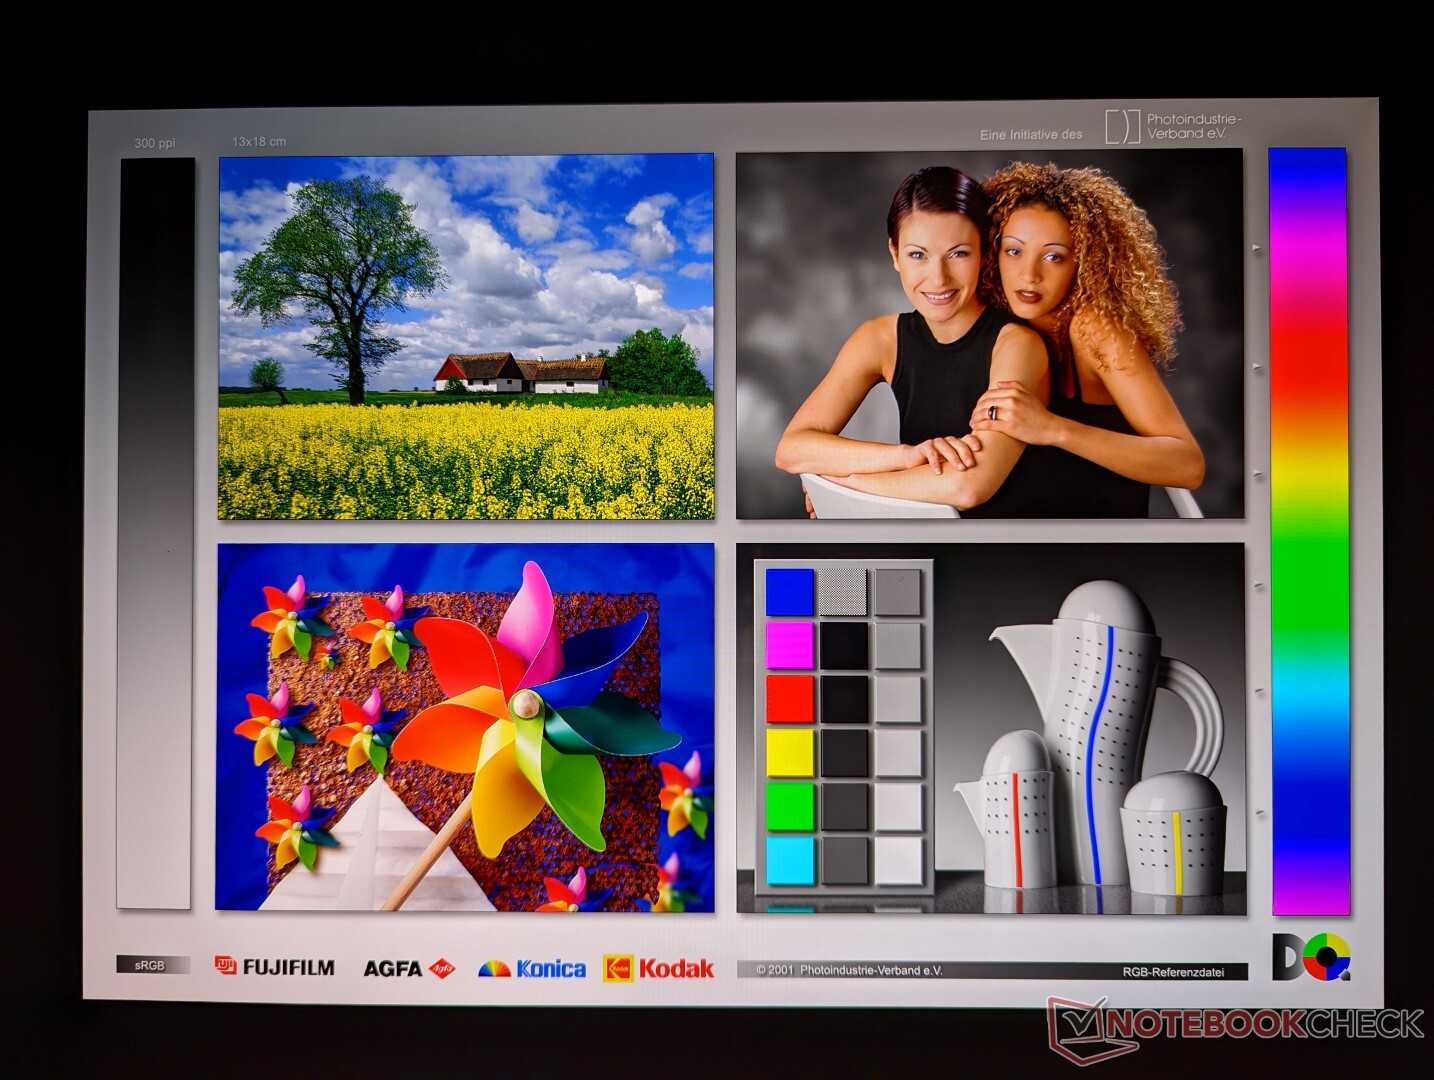
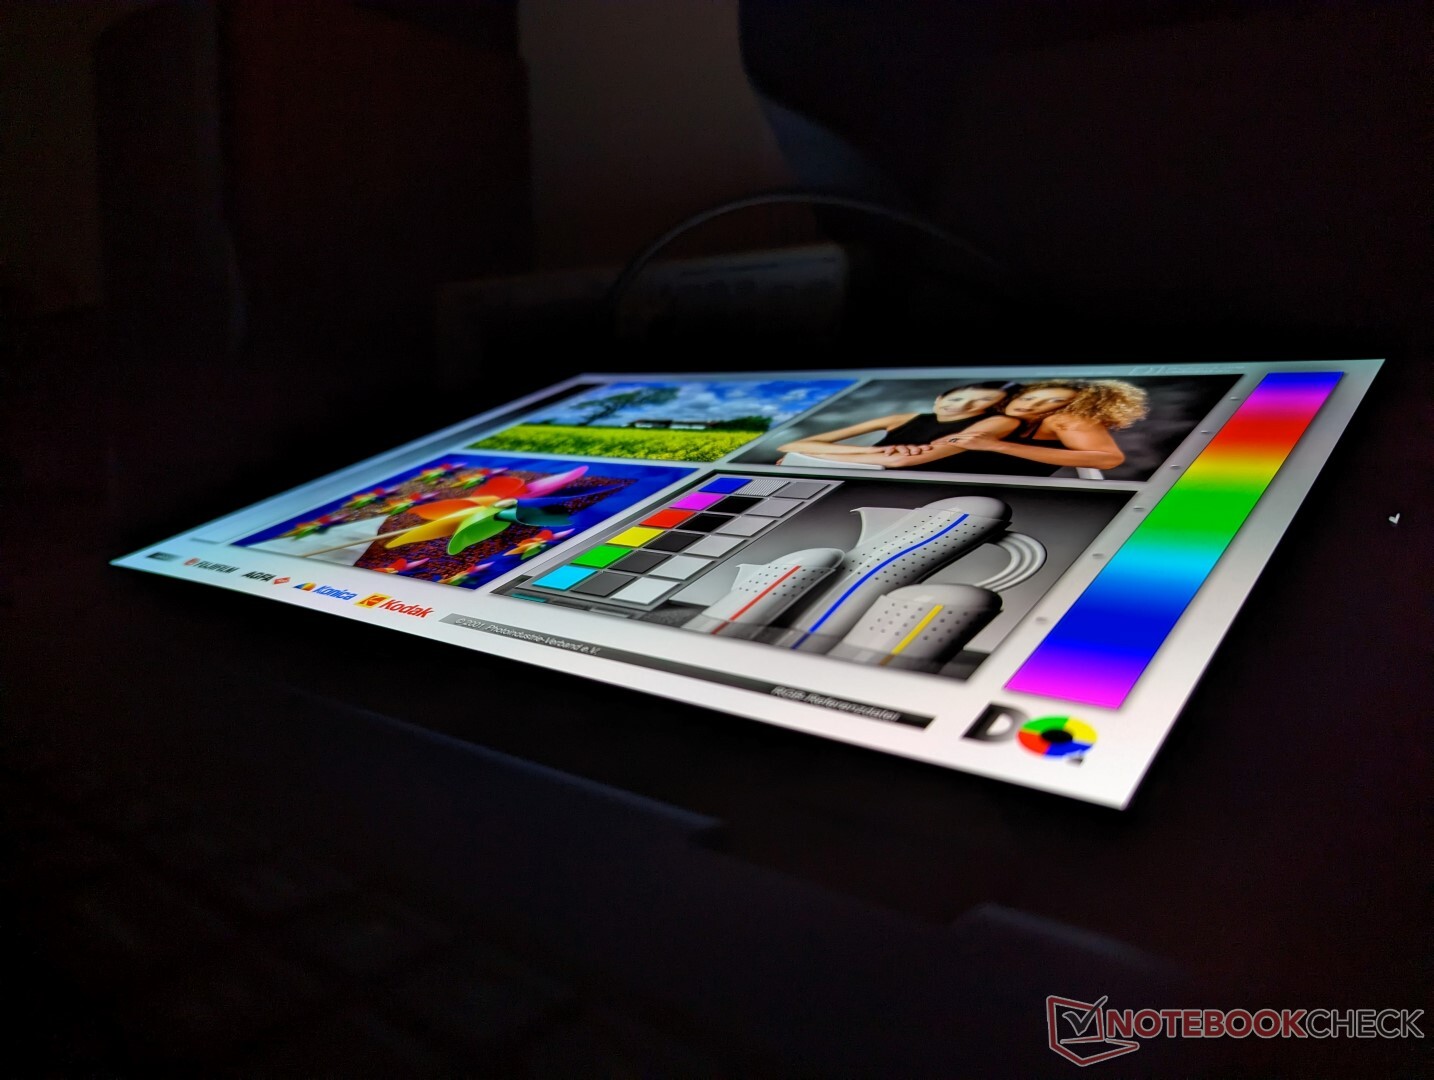
Mostrar
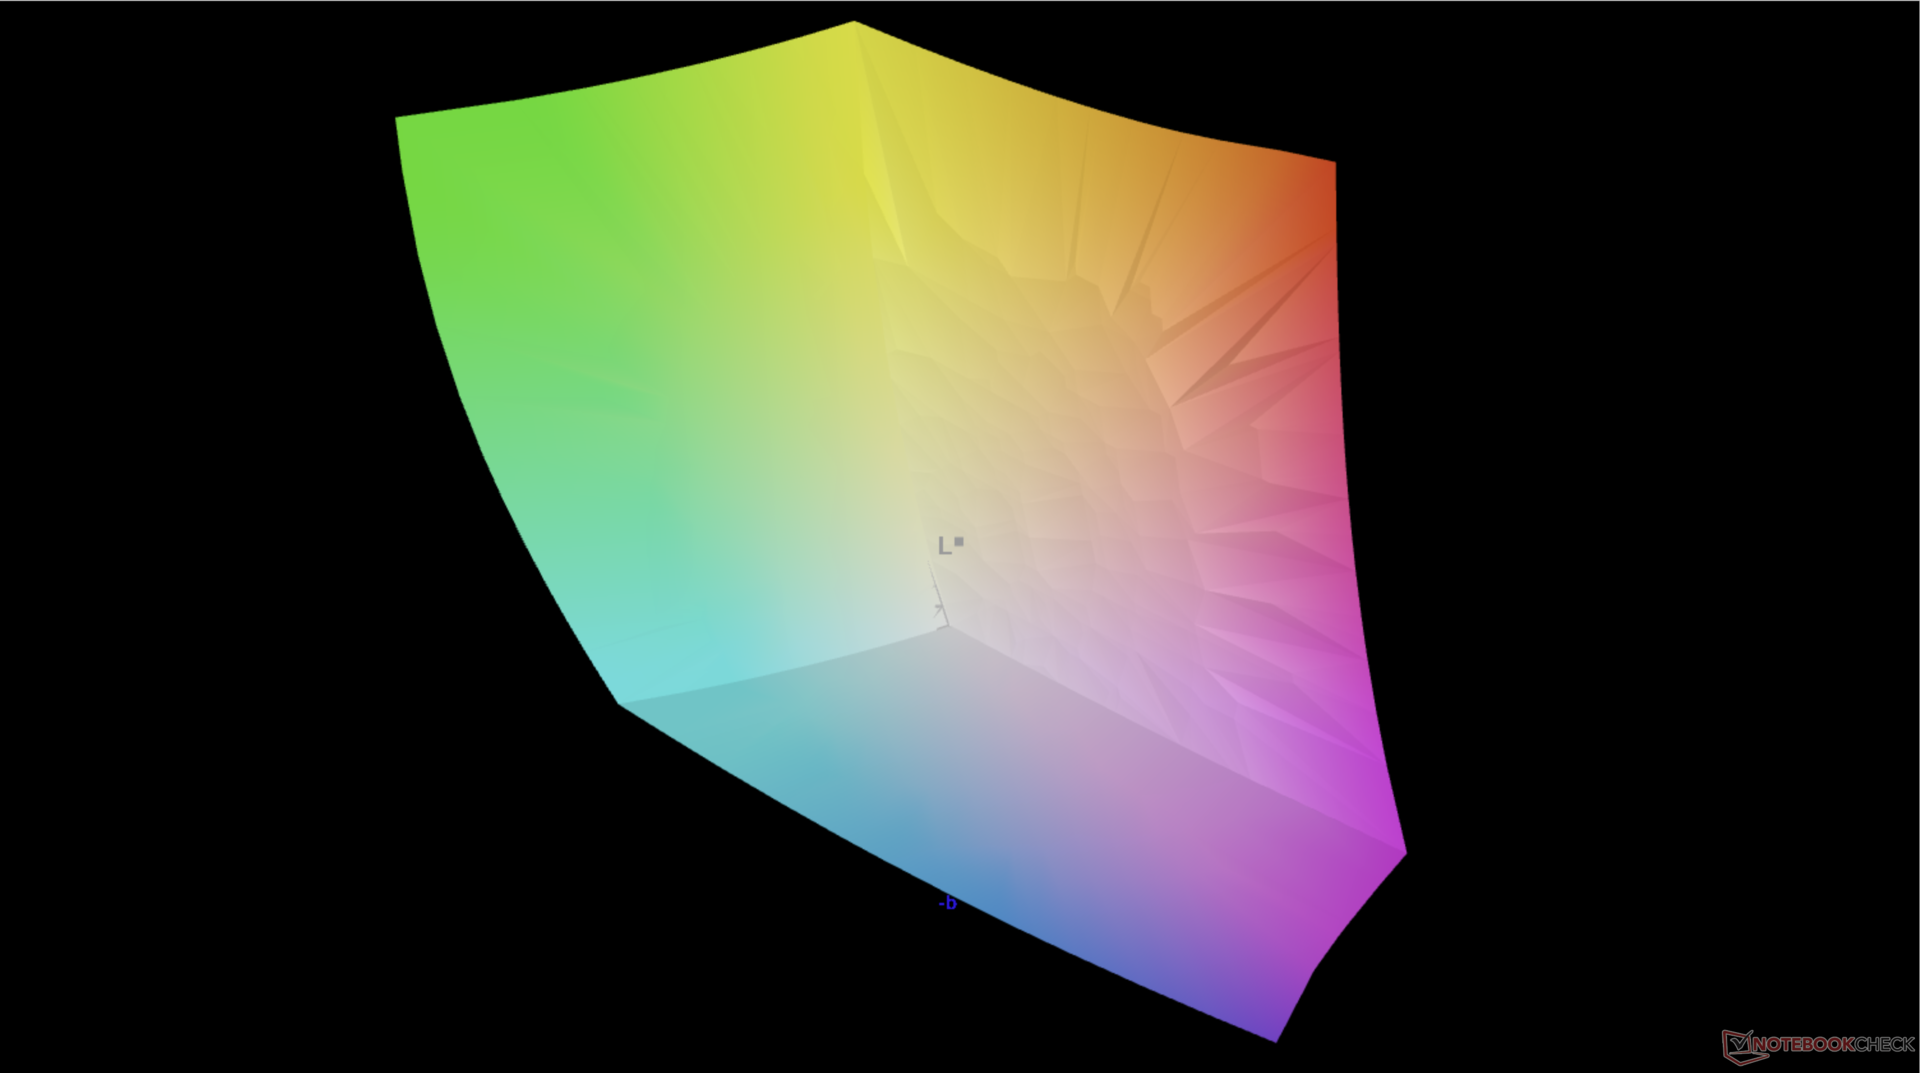
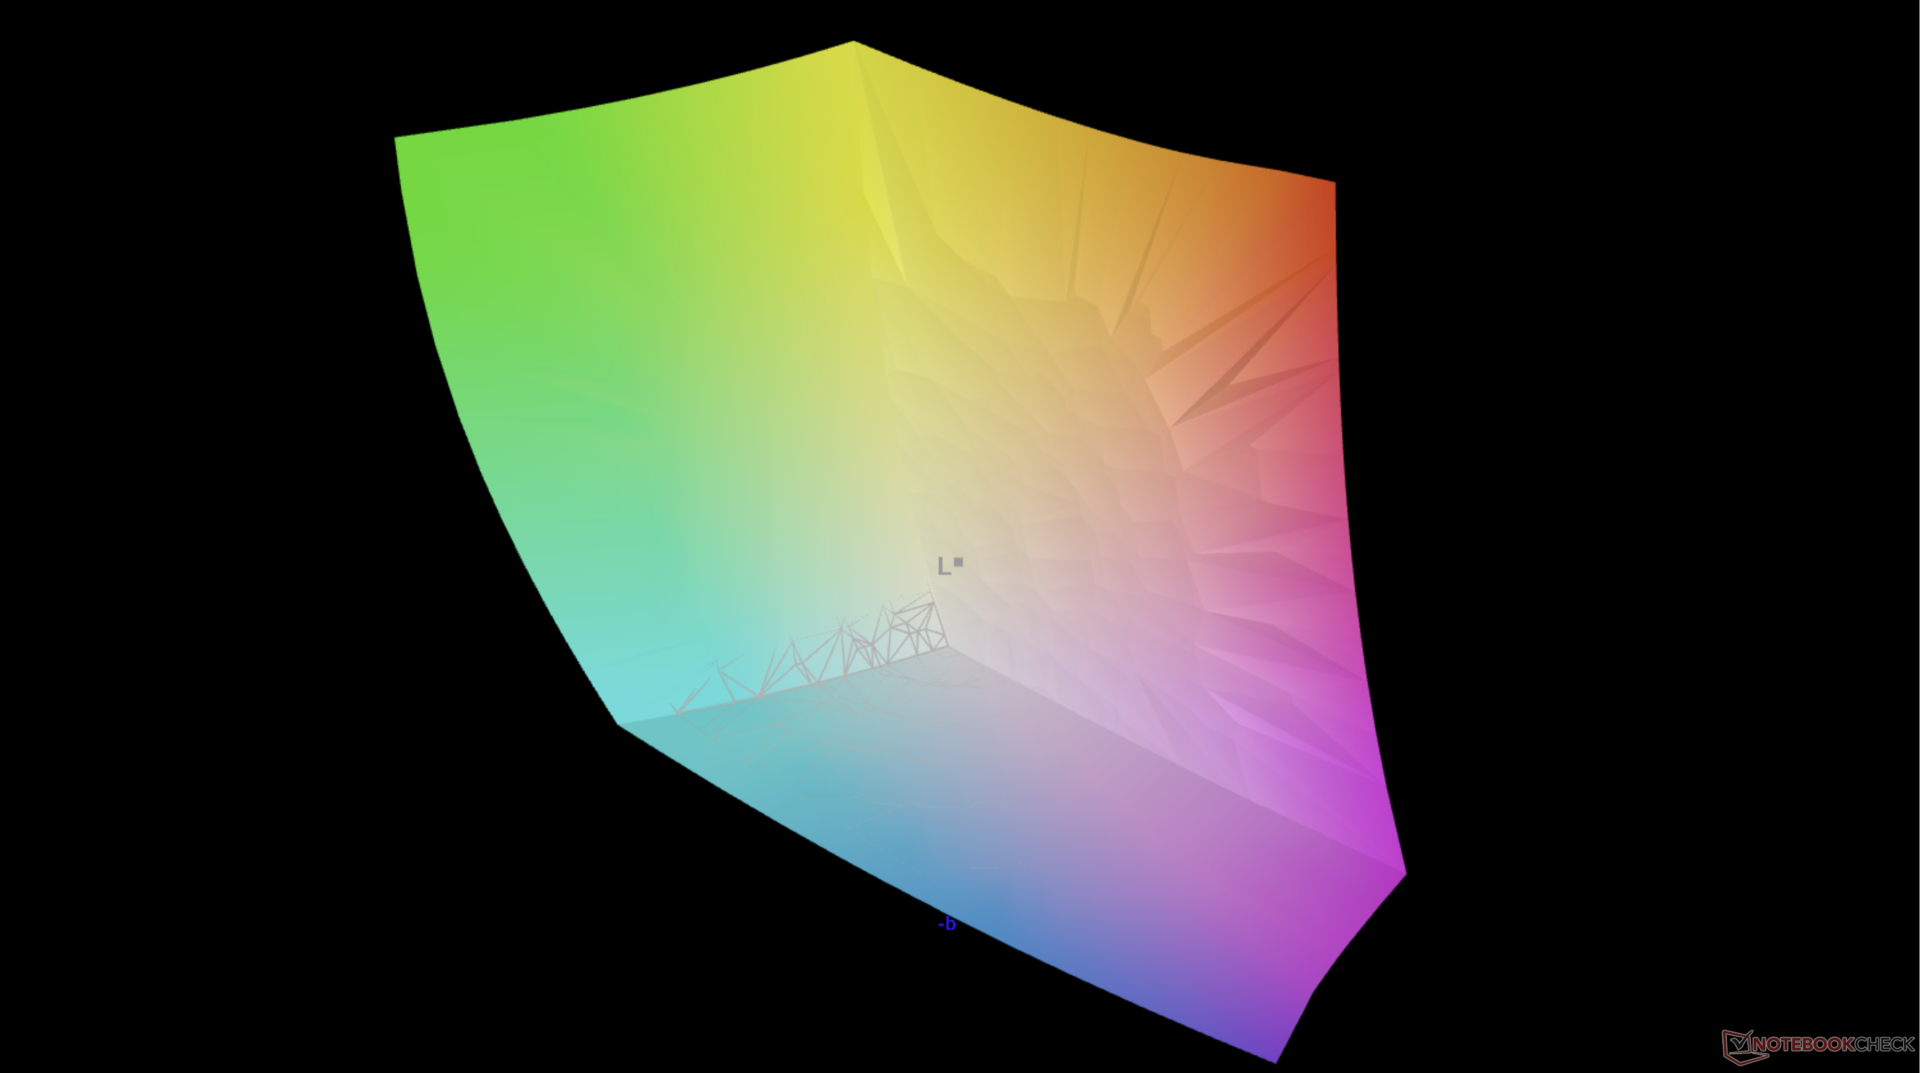
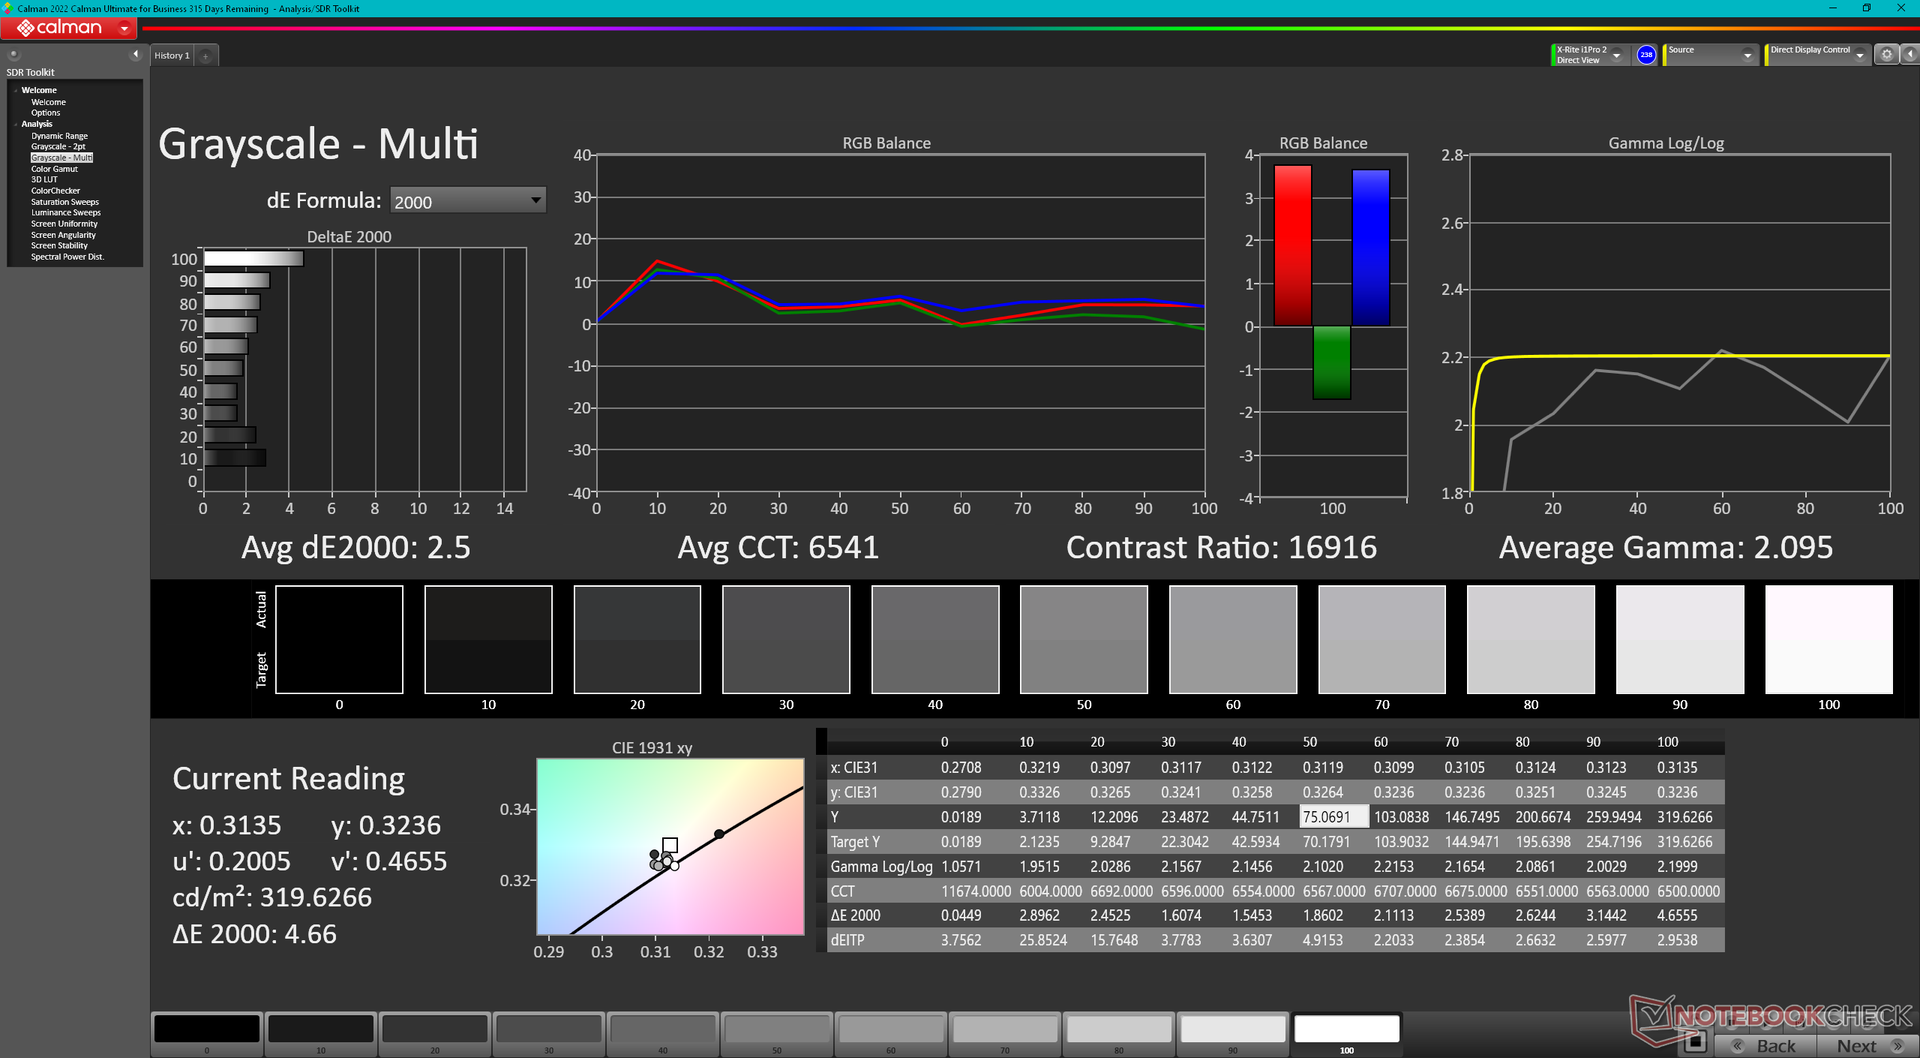
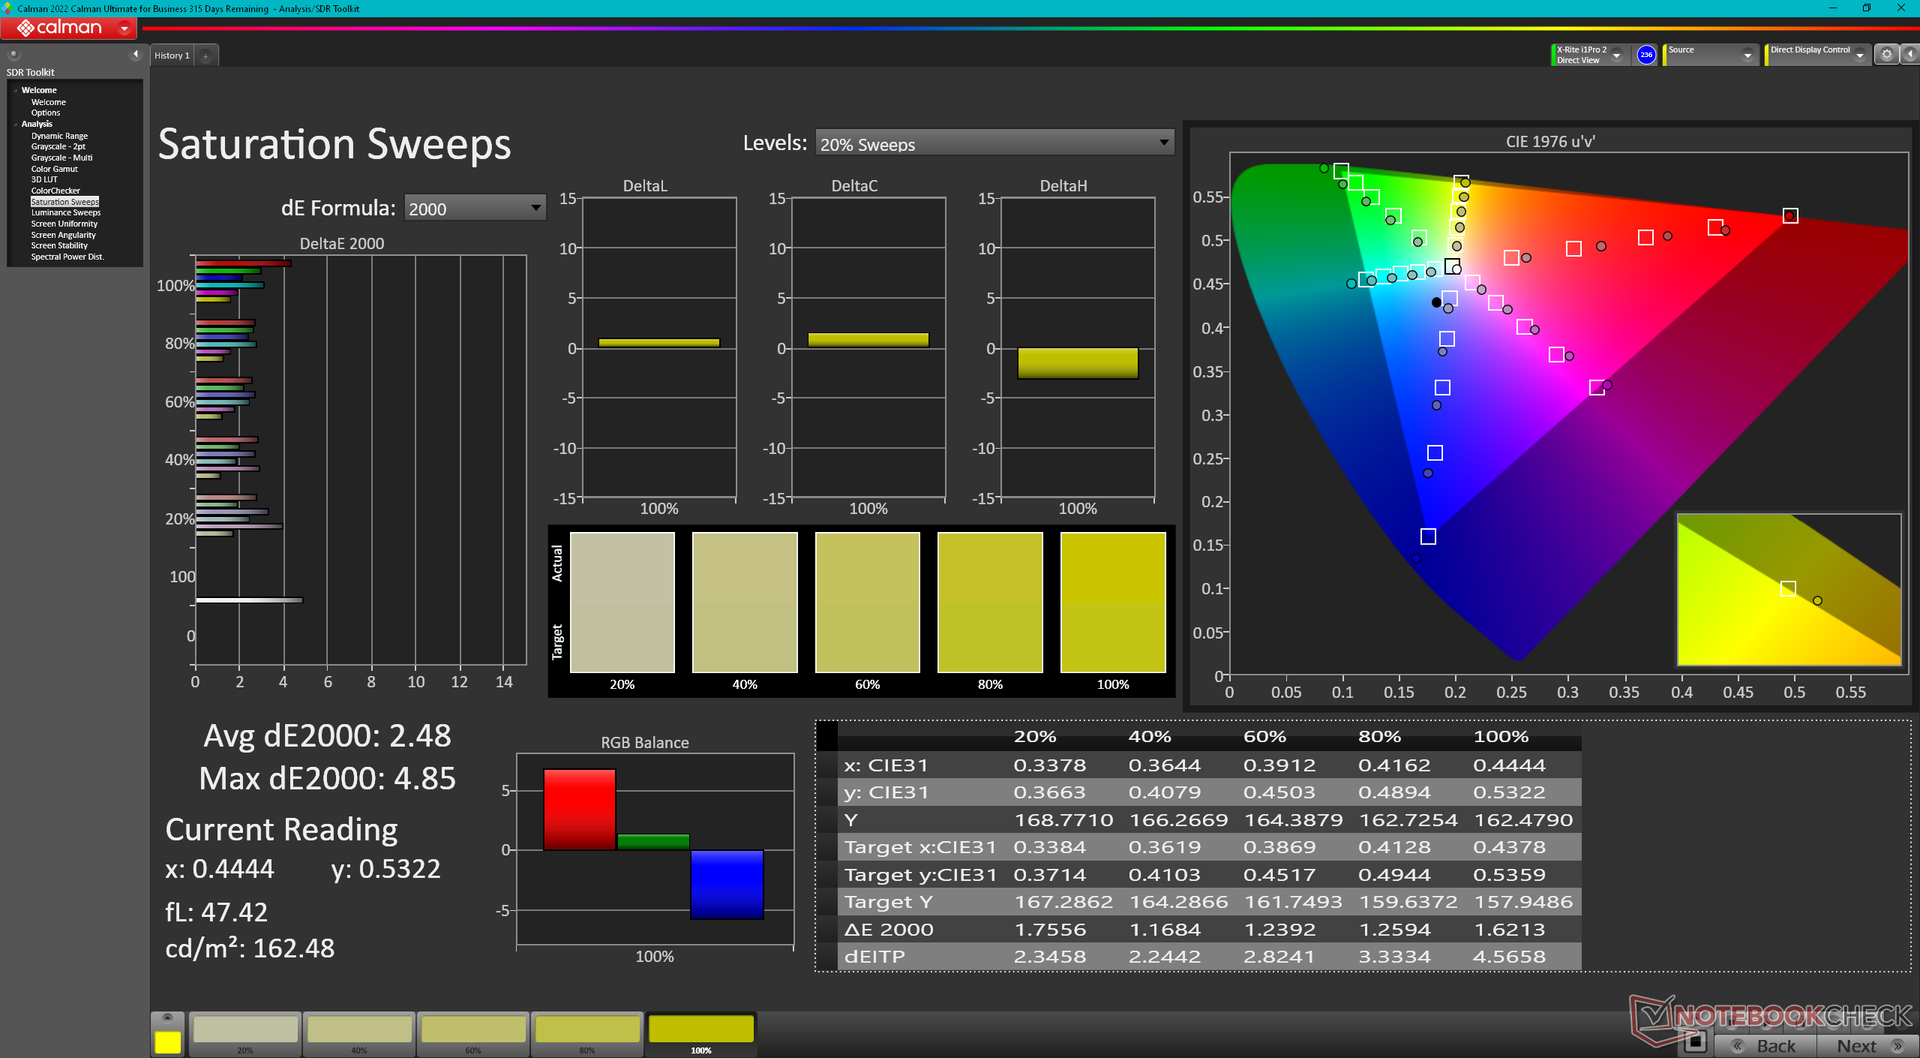
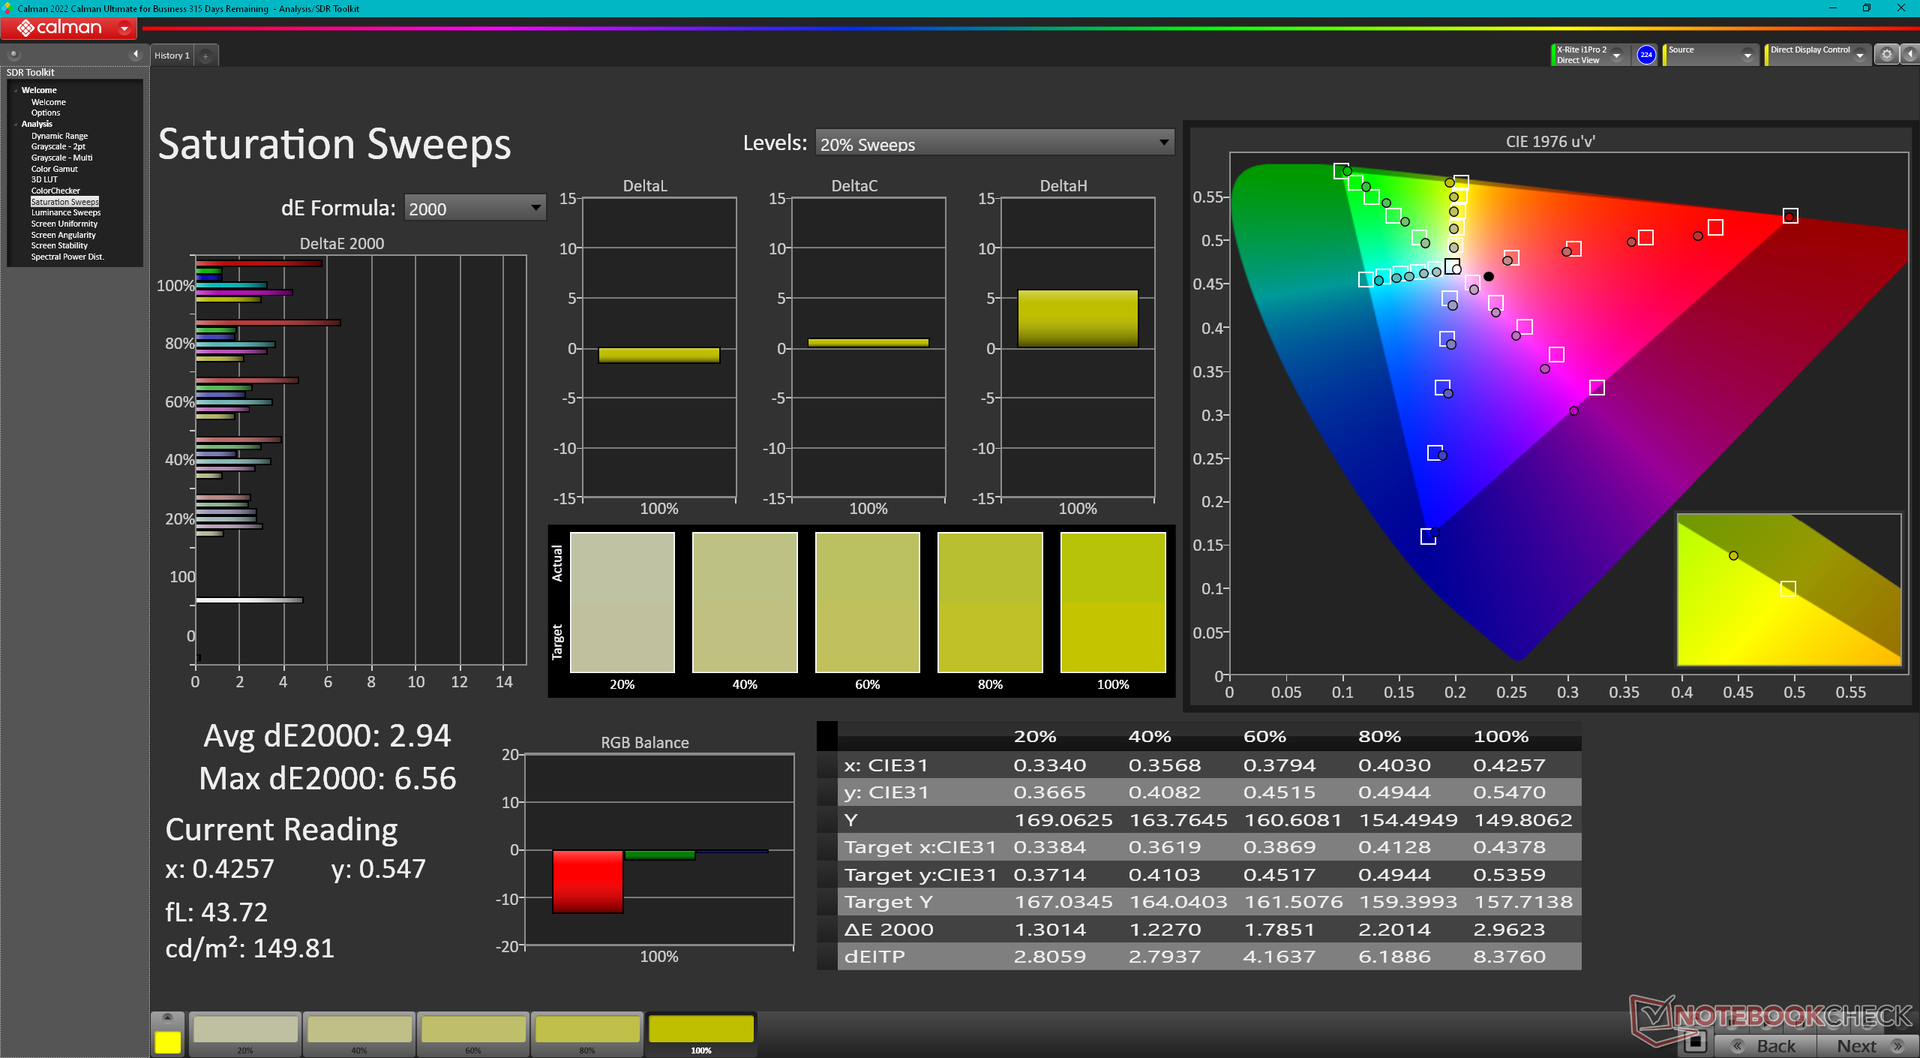
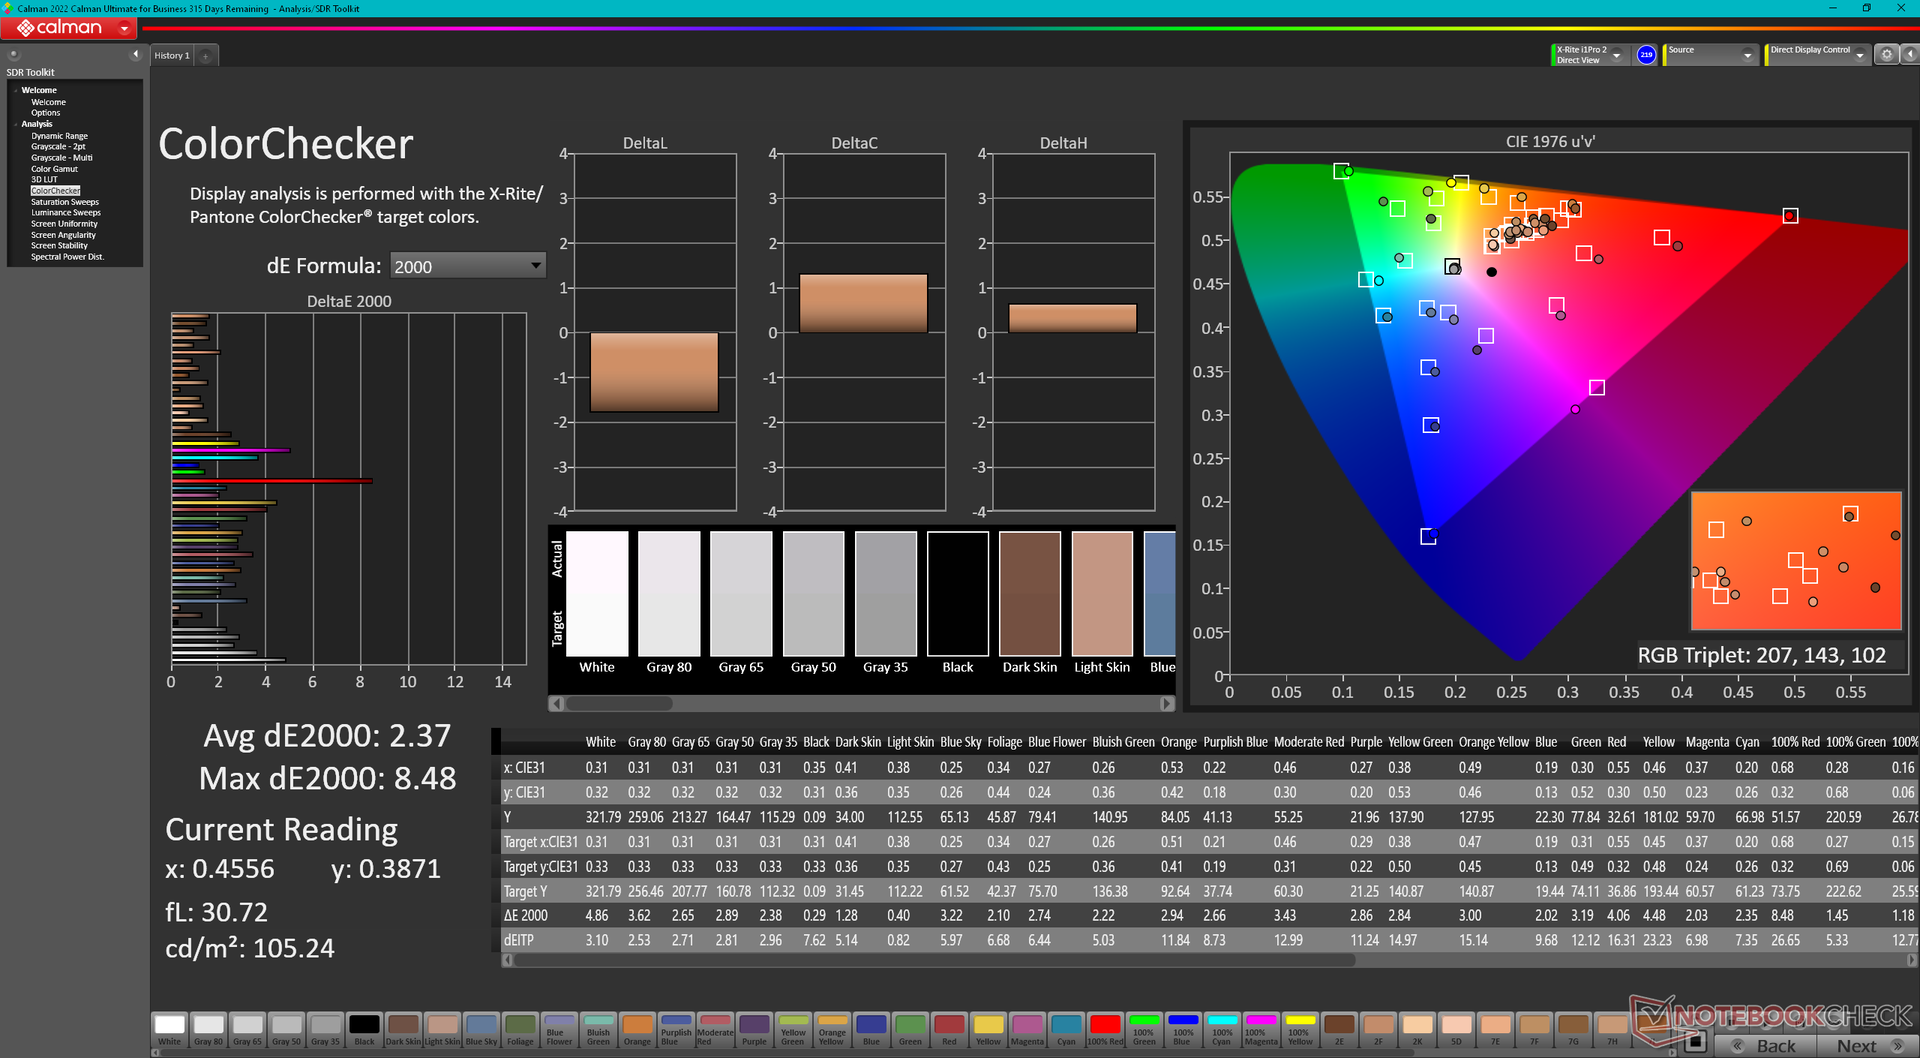
As opções de exibição são idênticas às disponíveis no diluente Precision 7670. Nossa unidade de teste utiliza o mesmo painel OLED 160YV03 da Samsung, prometendo cores P3 completas.
| |||||||||||||||||||||||||
iluminação: 97 %
iluminação com acumulador: 325.2 cd/m²
Contraste: ∞:1 (Preto: 0 cd/m²)
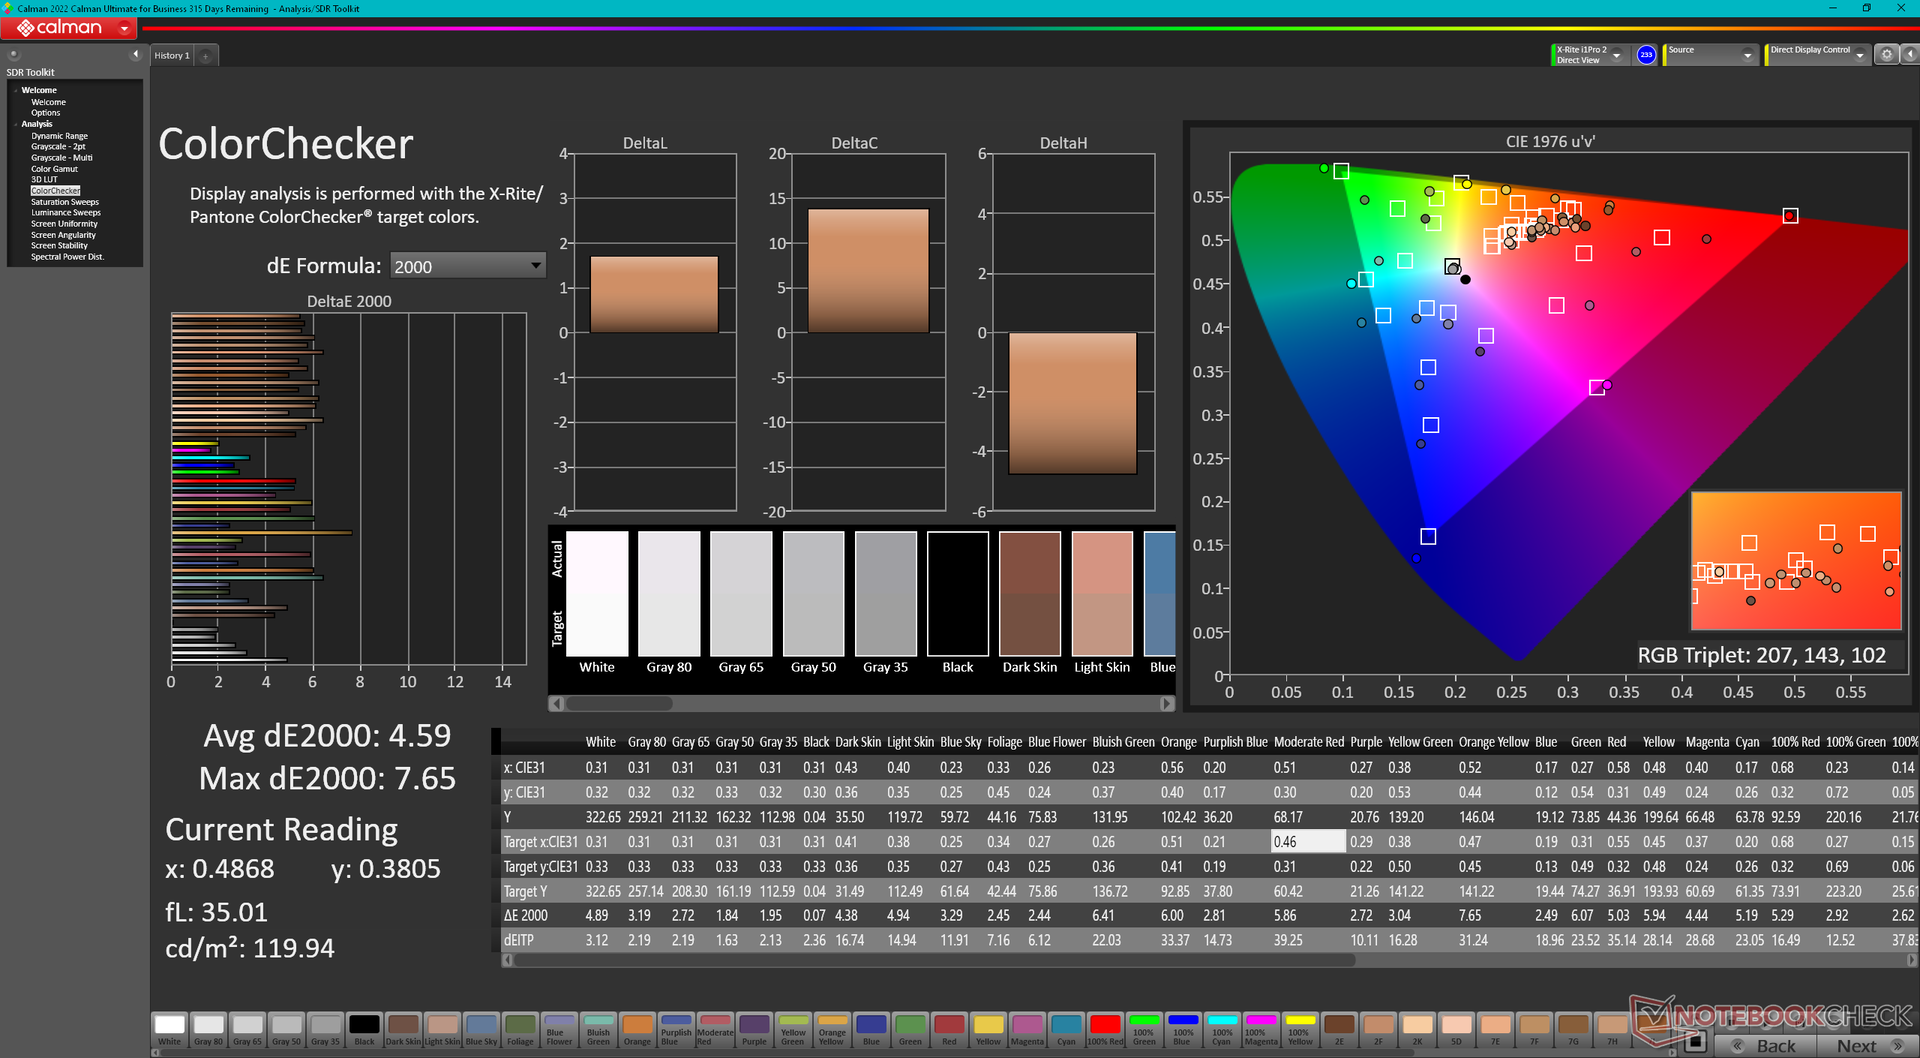
ΔE ColorChecker Calman: 4.59 | ∀{0.5-29.43 Ø4.72}
ΔE Greyscale Calman: 2.5 | ∀{0.09-98 Ø4.97}
98.1% AdobeRGB 1998 (Argyll 3D)
100% sRGB (Argyll 3D)
99.9% Display P3 (Argyll 3D)
Gamma: 2.1
CCT: 6541 K
| Dell Precision 7000 7670 Performance Samsung 160YV03, OLED, 3840x2400, 16" | MSI CreatorPro Z16P B12UKST B160QAN02.N, IPS, 2560x1600, 16" | HP ZBook Studio 16 G9 62U04EA BOE0A52, IPS, 3840x2400, 16" | HP ZBook Firefly 16 G9-6B897EA BOE0A02, IPS, 1920x1200, 16" | Lenovo ThinkPad P1 G4-20Y4Z9DVUS NE160QDM-N63, IPS, 2560x1600, 16" | Dell Precision 7670 Samsung 160YV03, OLED, 3840x2400, 16" | |
|---|---|---|---|---|---|---|
| Display | -4% | -5% | -22% | -17% | -0% | |
| Display P3 Coverage (%) | 99.9 | 97.6 -2% | 97.5 -2% | 68.1 -32% | 72.7 -27% | 99.9 0% |
| sRGB Coverage (%) | 100 | 99.9 0% | 99.9 0% | 96.1 -4% | 99.3 -1% | 100 0% |
| AdobeRGB 1998 Coverage (%) | 98.1 | 87.4 -11% | 86.3 -12% | 70 -29% | 74.7 -24% | 97.5 -1% |
| Response Times | -441% | -475% | -1843% | -1550% | -4% | |
| Response Time Grey 50% / Grey 80% * (ms) | 1.84 ? | 12.8 ? -596% | 15.3 ? -732% | 52.8 ? -2770% | 40.8 -2117% | 1.9 ? -3% |
| Response Time Black / White * (ms) | 1.92 ? | 7.4 ? -285% | 6.1 ? -218% | 19.5 ? -916% | 20.8 -983% | 2 ? -4% |
| PWM Frequency (Hz) | 59.52 ? | 59.5 ? | ||||
| Screen | 32% | 50% | 4% | 7% | 2% | |
| Brightness middle (cd/m²) | 325.2 | 407 25% | 554 70% | 526 62% | 441 36% | 340.1 5% |
| Brightness (cd/m²) | 328 | 388 18% | 516 57% | 499 52% | 420 28% | 342 4% |
| Brightness Distribution (%) | 97 | 88 -9% | 84 -13% | 93 -4% | 90 -7% | 98 1% |
| Black Level * (cd/m²) | 0.36 | 0.47 | 0.31 | 0.27 | ||
| Colorchecker dE 2000 * | 4.59 | 1.3 72% | 1 78% | 3.6 22% | 2.6 43% | 2.5 46% |
| Colorchecker dE 2000 max. * | 7.65 | 2.5 67% | 2.4 69% | 6.6 14% | 6 22% | 8.19 -7% |
| Greyscale dE 2000 * | 2.5 | 2.1 16% | 1.6 36% | 5.5 -120% | 4.5 -80% | 3.5 -40% |
| Gamma | 2.1 105% | 2.26 97% | 2.29 96% | 2.02 109% | 2.18 101% | 2.12 104% |
| CCT | 6541 99% | 6437 101% | 6458 101% | 6527 100% | 6623 98% | 6704 97% |
| Contrast (:1) | 1131 | 1179 | 1697 | 1633 | ||
| Colorchecker dE 2000 calibrated * | 0.7 | 0.6 | 2.6 | 1.2 | ||
| Média Total (Programa/Configurações) | -138% /
-64% | -143% /
-61% | -620% /
-339% | -520% /
-283% | -1% /
0% |
* ... menor é melhor
Exibir tempos de resposta
| ↔ Tempo de resposta preto para branco | ||
|---|---|---|
| 1.92 ms ... ascensão ↗ e queda ↘ combinadas | ↗ 0.92 ms ascensão | 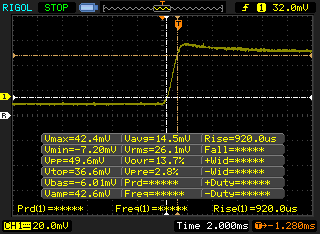 |
| ↘ 1 ms queda | ||
| A tela mostra taxas de resposta muito rápidas em nossos testes e deve ser muito adequada para jogos em ritmo acelerado. Em comparação, todos os dispositivos testados variam de 0.1 (mínimo) a 240 (máximo) ms. » 11 % de todos os dispositivos são melhores. Isso significa que o tempo de resposta medido é melhor que a média de todos os dispositivos testados (19.8 ms). | ||
| ↔ Tempo de resposta 50% cinza a 80% cinza | ||
| 1.84 ms ... ascensão ↗ e queda ↘ combinadas | ↗ 0.92 ms ascensão | 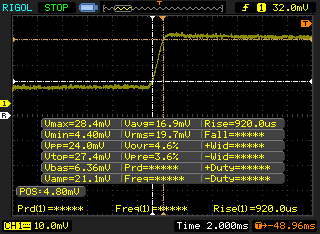 |
| ↘ 0.92 ms queda | ||
| A tela mostra taxas de resposta muito rápidas em nossos testes e deve ser muito adequada para jogos em ritmo acelerado. Em comparação, todos os dispositivos testados variam de 0.165 (mínimo) a 636 (máximo) ms. » 9 % de todos os dispositivos são melhores. Isso significa que o tempo de resposta medido é melhor que a média de todos os dispositivos testados (31 ms). | ||
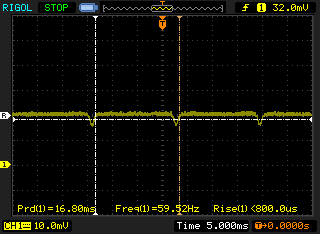
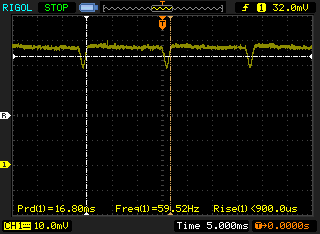
Cintilação da tela / PWM (modulação por largura de pulso)
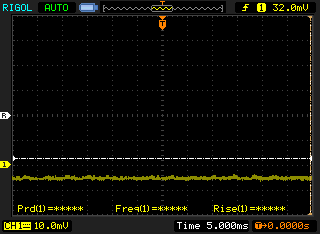
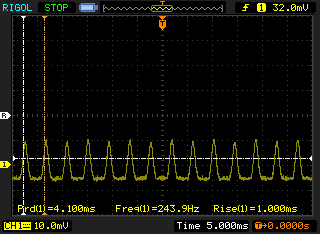
| Tela tremeluzindo/PWM detectado | 59.52 Hz | ≤ 100 % configuração de brilho | 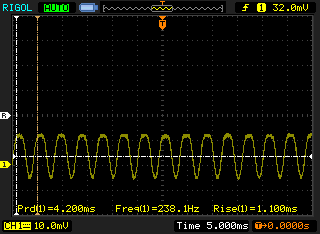 |
A luz de fundo da tela pisca em 59.52 Hz (pior caso, por exemplo, utilizando PWM) Cintilação detectada em uma configuração de brilho de 100 % e abaixo. Não deve haver cintilação ou PWM acima desta configuração de brilho. A frequência de 59.52 Hz é muito baixa, portanto a oscilação pode causar fadiga ocular e dores de cabeça após uso prolongado. [pwm_comparison] Em comparação: 52 % de todos os dispositivos testados não usam PWM para escurecer a tela. Se PWM foi detectado, uma média de 7763 (mínimo: 5 - máximo: 343500) Hz foi medida. | |||
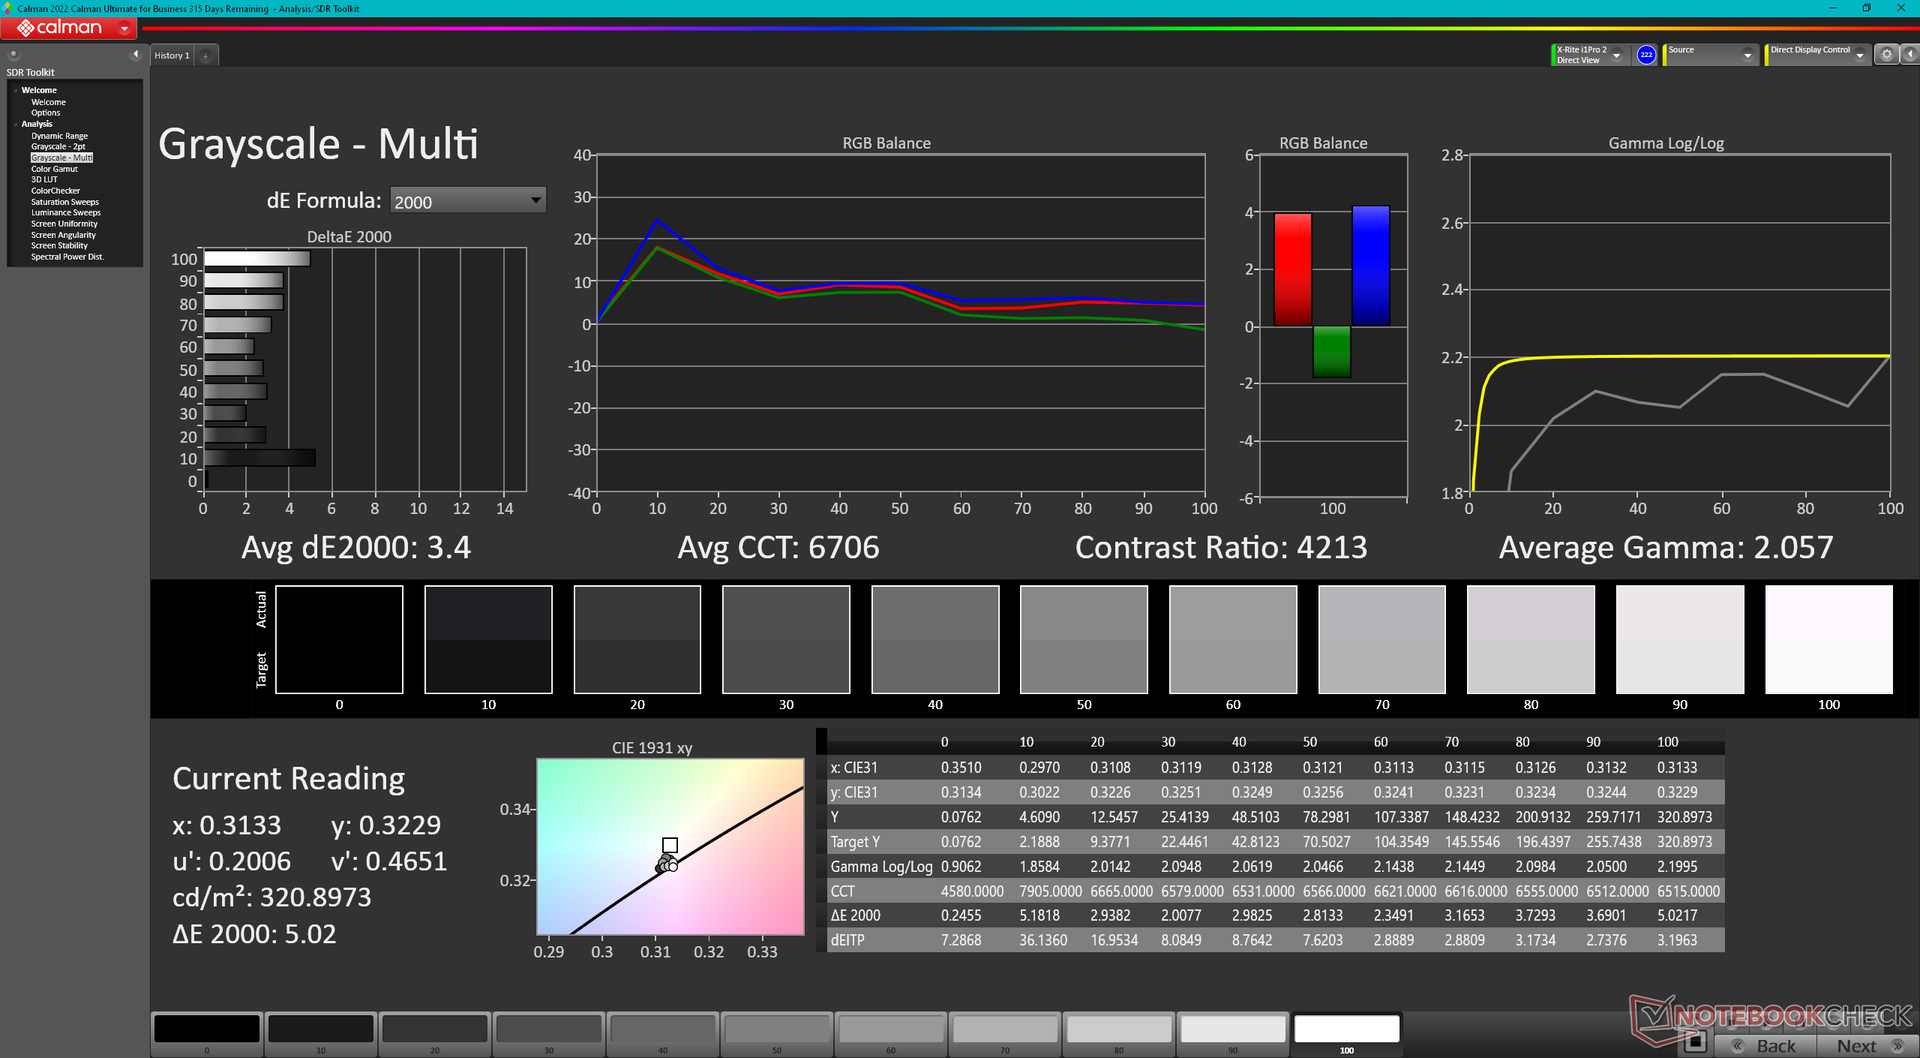
A cintilação está presente em todas as configurações de luminosidade como na maioria dos painéis OLED. Somos capazes de registrar uma freqüência de 238,1 Hz de 0 a 57% de brilho e 59,5 Hz de 58% ao máximo.

Desempenho
Condições de teste
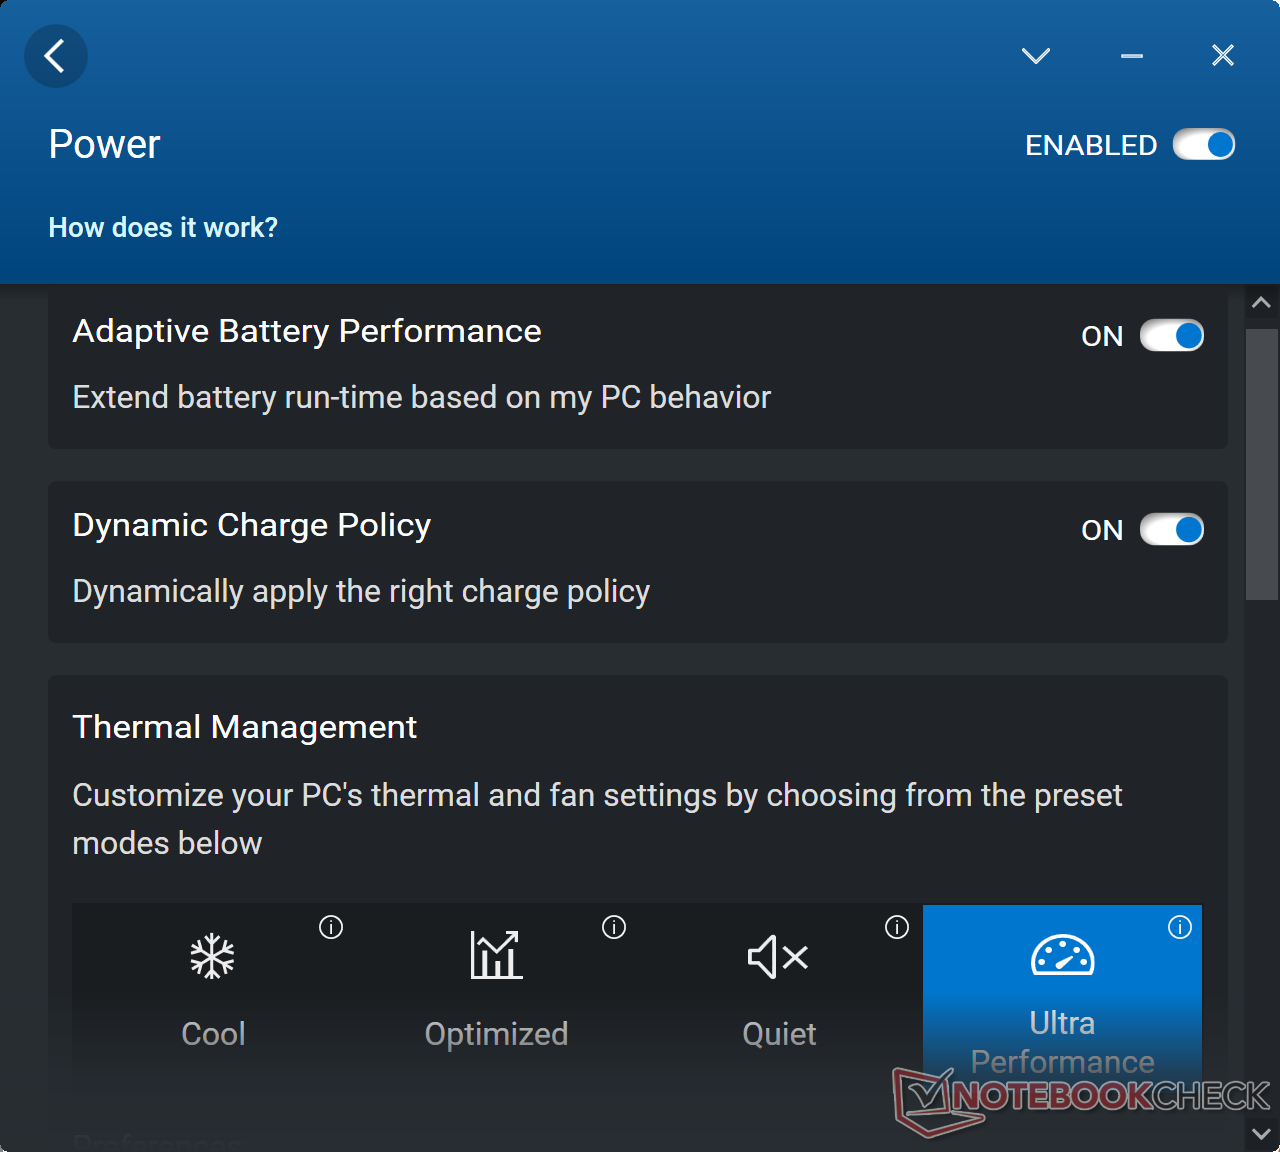
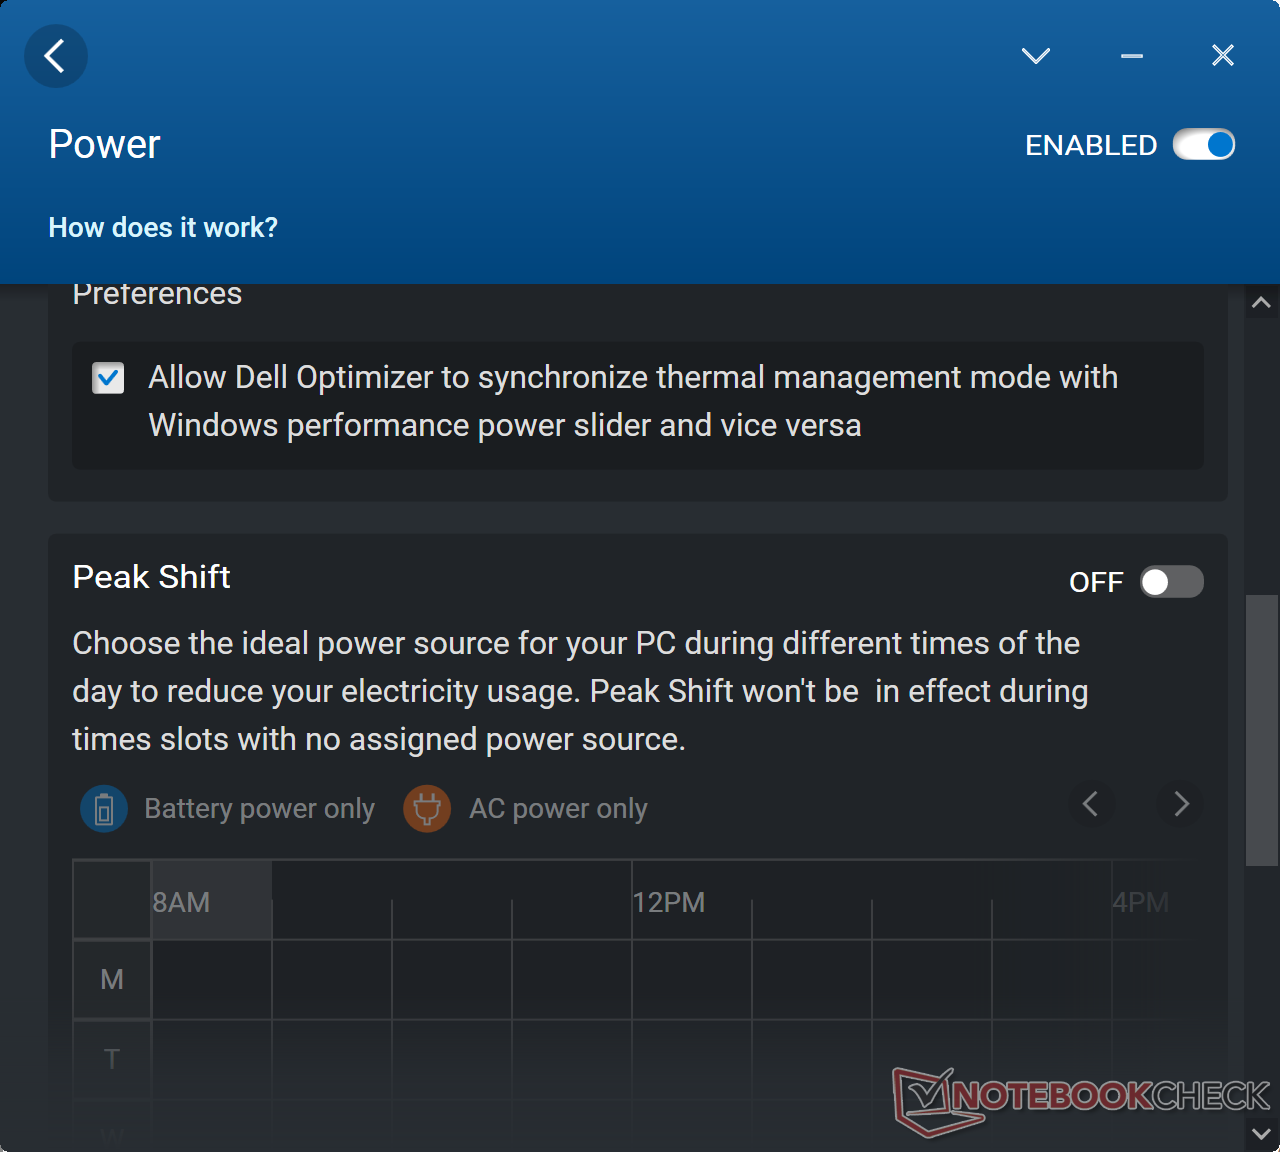
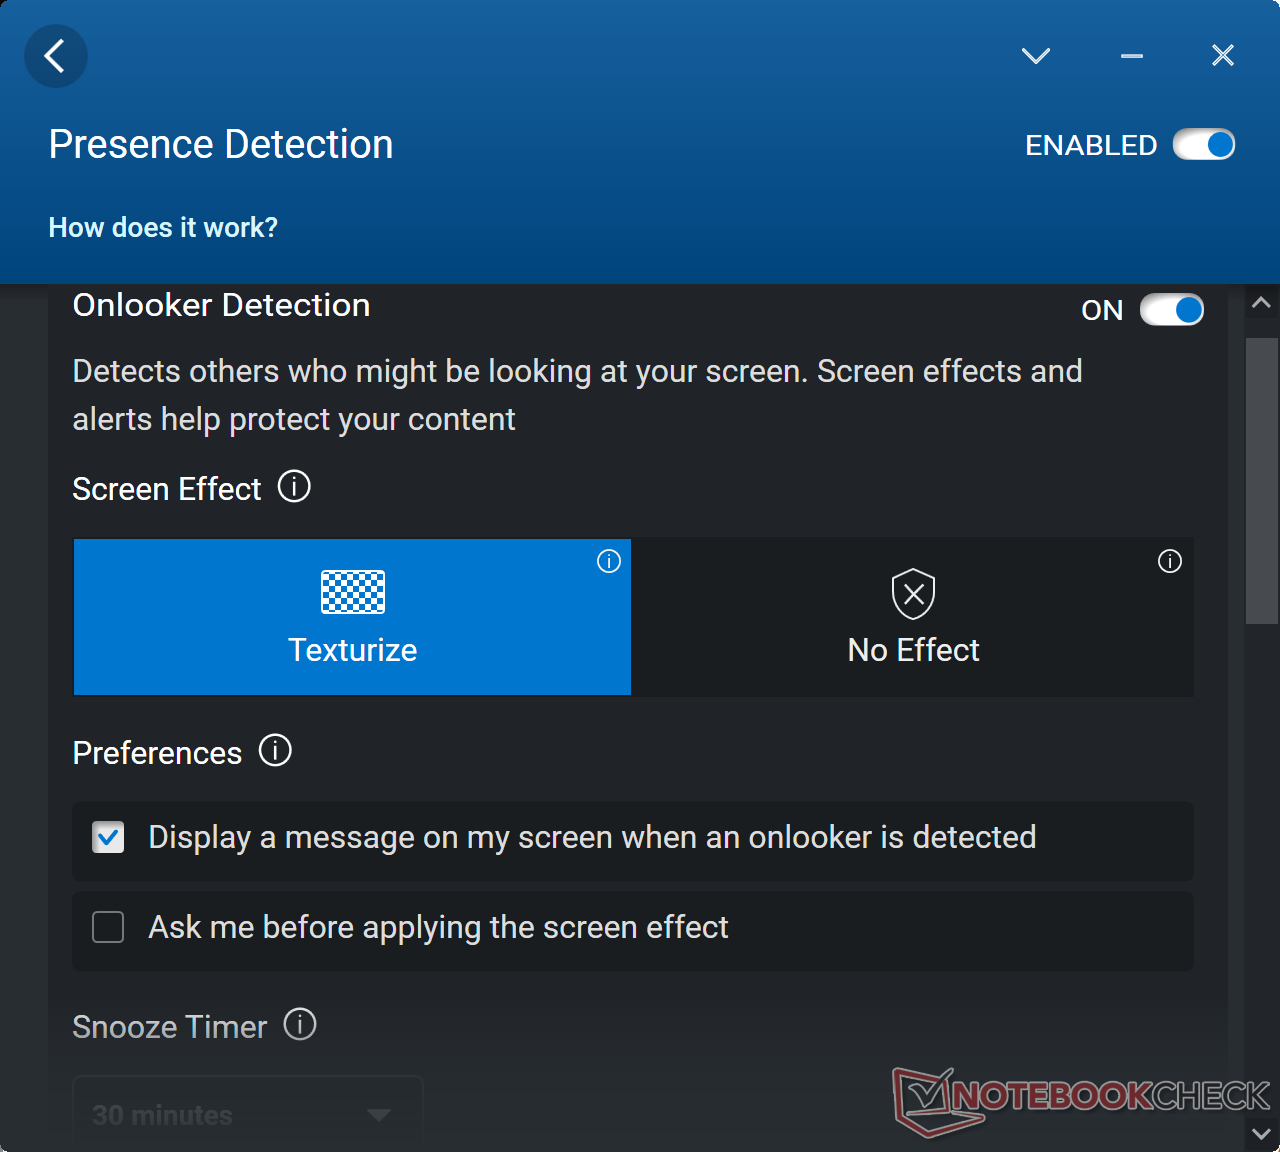
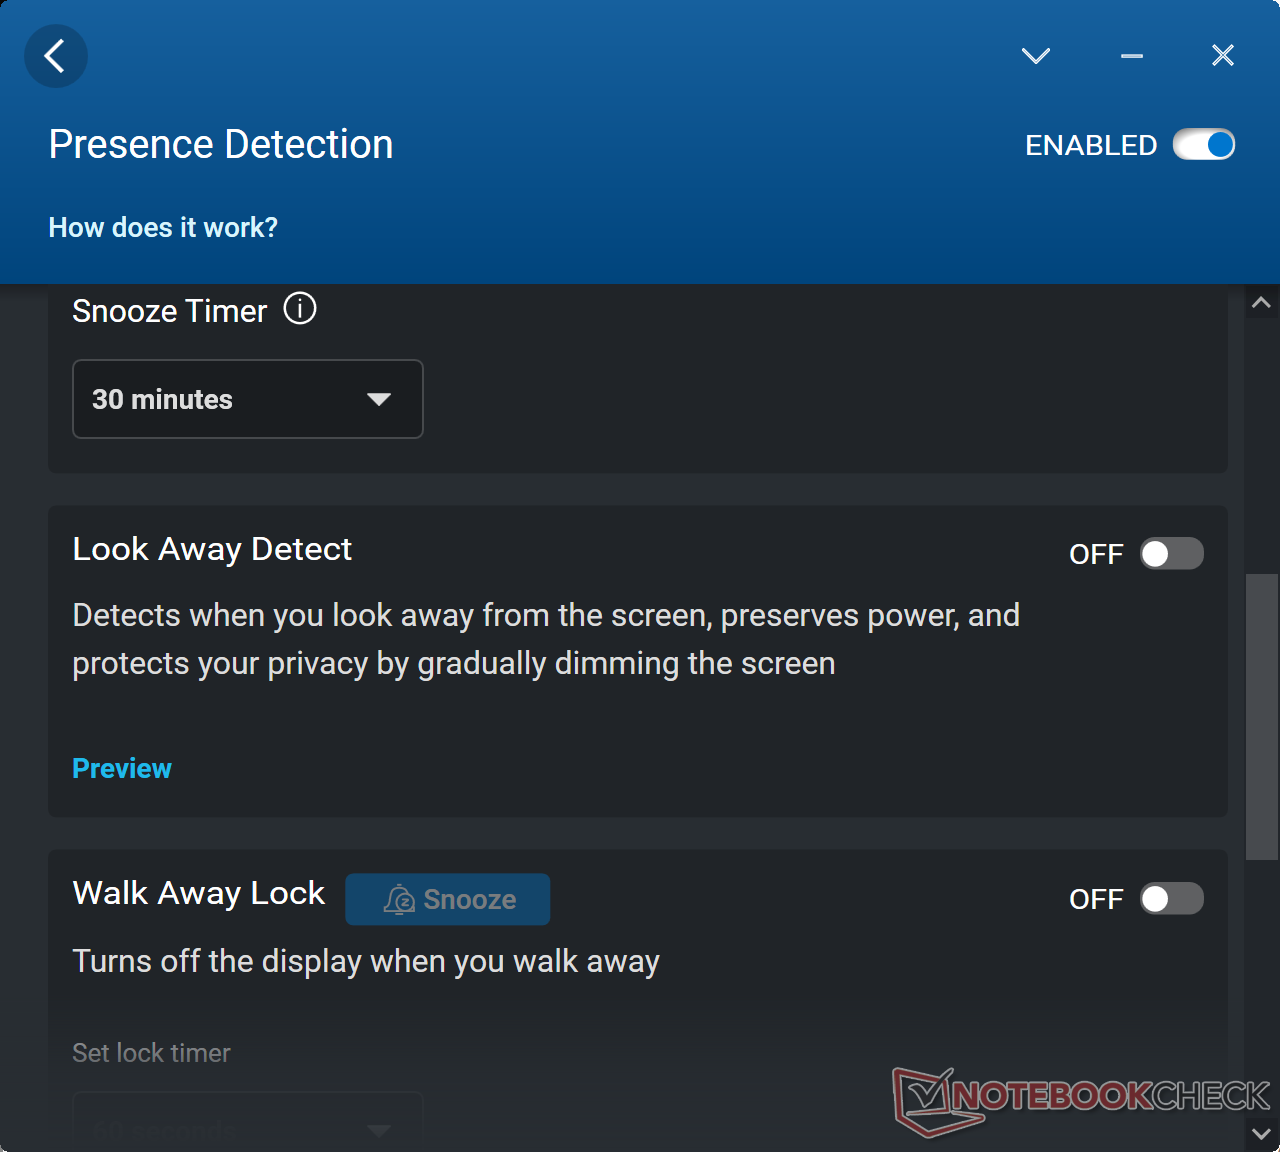
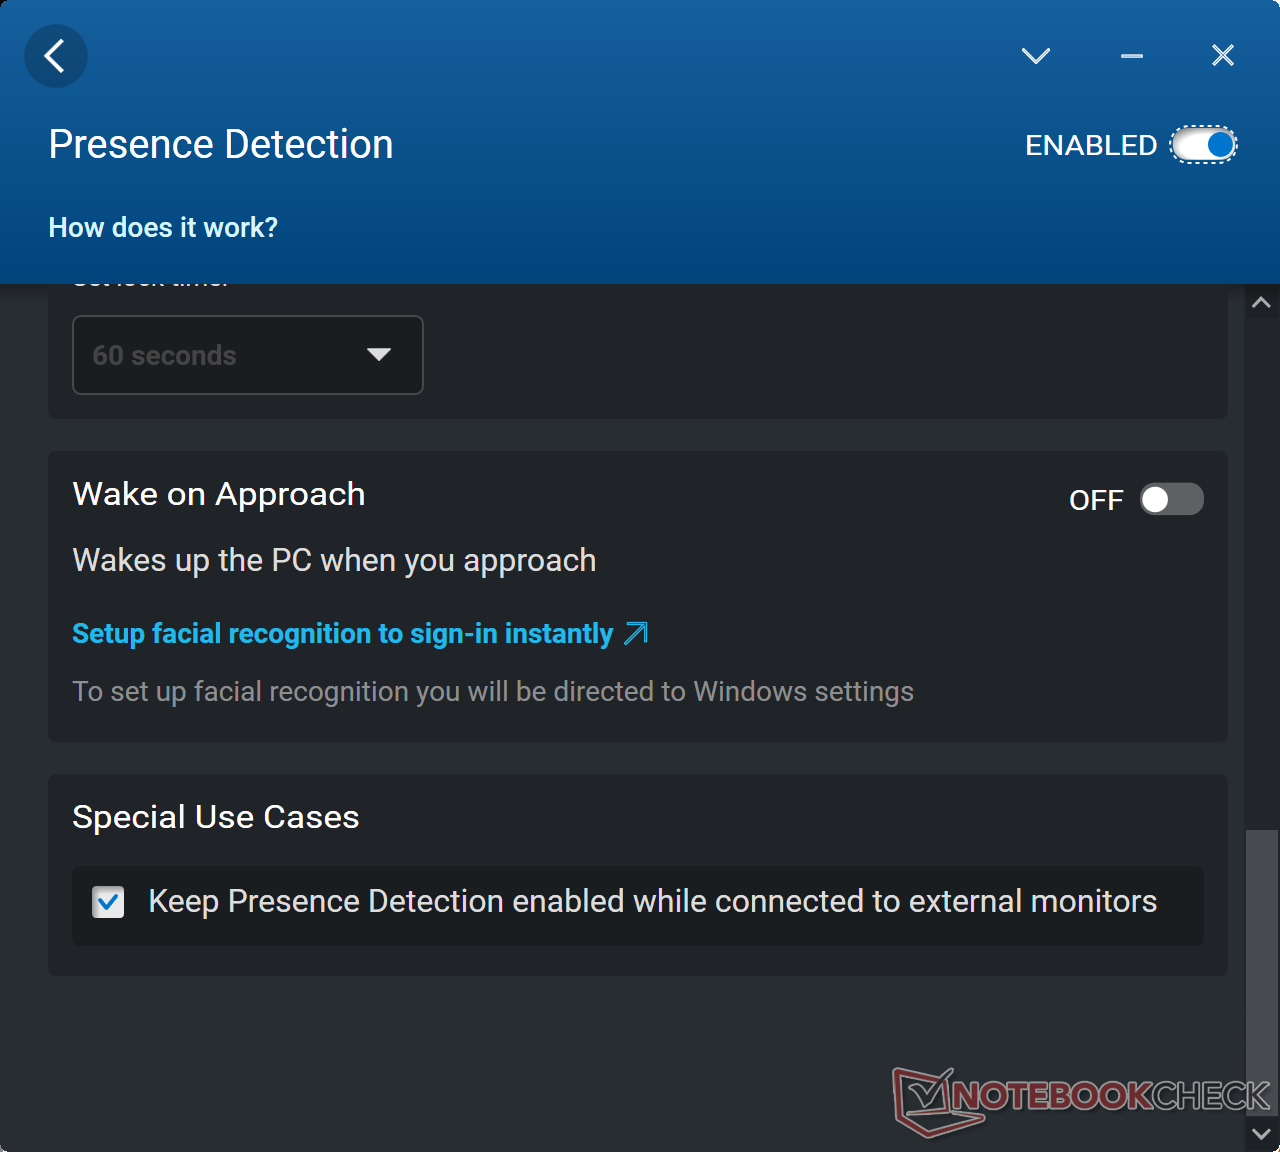
Ajustamos nossa unidade para o modo Ultra Performance através do software Dell Optimizer e da GPU para gráficos discretos antes de executar quaisquer benchmarks de performance abaixo. É altamente recomendável que os proprietários se familiarizem com o Optimizer, pois ele é o centro para controlar muitas características específicas do laptop, incluindo Detecção de presença e comportamento de carga
Não podemos encontrar nenhuma chave MUX em nenhum lugar no software ou BIOS.
Processador
O desempenho de múltiplas roscas é apenas cerca de 8 a 14% mais rápido do que oNúcleo i7-12850HX em nosso emagrecedor Precision 7670. A margem estreita não é inesperada, mas o aspecto mais surpreendente é a sustentabilidade um pouco pobre do Turbo Boost de nossaNúcleo i9-12950HX. Ao executar o CineBench R15 xT em loop, o desempenho cairia cerca de 17% ao longo do tempo, em vez de permanecer estável durante todo o tempo. O déficit de desempenho é semelhante ao que observamos no regular Precision 7670, apesar do perfil mais grosso do nosso modelo de desempenho.
Cinebench R15 Multi Loop
Cinebench R23: Multi Core | Single Core
Cinebench R15: CPU Multi 64Bit | CPU Single 64Bit
Blender: v2.79 BMW27 CPU
7-Zip 18.03: 7z b 4 | 7z b 4 -mmt1
Geekbench 5.5: Multi-Core | Single-Core
HWBOT x265 Benchmark v2.2: 4k Preset
LibreOffice : 20 Documents To PDF
R Benchmark 2.5: Overall mean
| Cinebench R20 / CPU (Multi Core) | |
| Média Intel Core i9-12950HX (6625 - 8777, n=7) | |
| MSI CreatorPro Z16P B12UKST | |
| Dell Precision 7000 7670 Performance | |
| HP ZBook Studio 16 G9 62U04EA | |
| Dell Precision 7670 | |
| Lenovo ThinkPad P1 G4-20Y4Z9DVUS | |
| HP ZBook Firefly 16 G9-6B897EA | |
| Cinebench R20 / CPU (Single Core) | |
| Média Intel Core i9-12950HX (703 - 741, n=7) | |
| HP ZBook Studio 16 G9 62U04EA | |
| Dell Precision 7000 7670 Performance | |
| Dell Precision 7670 | |
| MSI CreatorPro Z16P B12UKST | |
| Lenovo ThinkPad P1 G4-20Y4Z9DVUS | |
| HP ZBook Firefly 16 G9-6B897EA | |
| Cinebench R23 / Multi Core | |
| Média Intel Core i9-12950HX (16277 - 23113, n=7) | |
| MSI CreatorPro Z16P B12UKST | |
| HP ZBook Studio 16 G9 62U04EA | |
| Dell Precision 7000 7670 Performance | |
| Dell Precision 7670 | |
| Lenovo ThinkPad P1 G4-20Y4Z9DVUS | |
| HP ZBook Firefly 16 G9-6B897EA | |
| Cinebench R23 / Single Core | |
| HP ZBook Studio 16 G9 62U04EA | |
| Média Intel Core i9-12950HX (1465 - 1922, n=7) | |
| MSI CreatorPro Z16P B12UKST | |
| Dell Precision 7670 | |
| Lenovo ThinkPad P1 G4-20Y4Z9DVUS | |
| Dell Precision 7000 7670 Performance | |
| HP ZBook Firefly 16 G9-6B897EA | |
| Cinebench R15 / CPU Multi 64Bit | |
| Média Intel Core i9-12950HX (2464 - 3530, n=7) | |
| Dell Precision 7000 7670 Performance | |
| HP ZBook Studio 16 G9 62U04EA | |
| Dell Precision 7670 | |
| MSI CreatorPro Z16P B12UKST | |
| Lenovo ThinkPad P1 G4-20Y4Z9DVUS | |
| HP ZBook Firefly 16 G9-6B897EA | |
| Cinebench R15 / CPU Single 64Bit | |
| HP ZBook Studio 16 G9 62U04EA | |
| Dell Precision 7000 7670 Performance | |
| Média Intel Core i9-12950HX (167 - 276, n=7) | |
| Dell Precision 7670 | |
| MSI CreatorPro Z16P B12UKST | |
| Lenovo ThinkPad P1 G4-20Y4Z9DVUS | |
| HP ZBook Firefly 16 G9-6B897EA | |
| Blender / v2.79 BMW27 CPU | |
| HP ZBook Firefly 16 G9-6B897EA | |
| Lenovo ThinkPad P1 G4-20Y4Z9DVUS | |
| Dell Precision 7670 | |
| MSI CreatorPro Z16P B12UKST | |
| Dell Precision 7000 7670 Performance | |
| HP ZBook Studio 16 G9 62U04EA | |
| Média Intel Core i9-12950HX (138 - 193, n=7) | |
| 7-Zip 18.03 / 7z b 4 | |
| Média Intel Core i9-12950HX (65637 - 85019, n=7) | |
| HP ZBook Studio 16 G9 62U04EA | |
| MSI CreatorPro Z16P B12UKST | |
| Dell Precision 7000 7670 Performance | |
| Dell Precision 7670 | |
| Lenovo ThinkPad P1 G4-20Y4Z9DVUS | |
| HP ZBook Firefly 16 G9-6B897EA | |
| 7-Zip 18.03 / 7z b 4 -mmt1 | |
| Média Intel Core i9-12950HX (6022 - 6318, n=7) | |
| Dell Precision 7000 7670 Performance | |
| HP ZBook Studio 16 G9 62U04EA | |
| MSI CreatorPro Z16P B12UKST | |
| Dell Precision 7670 | |
| Lenovo ThinkPad P1 G4-20Y4Z9DVUS | |
| HP ZBook Firefly 16 G9-6B897EA | |
| Geekbench 5.5 / Multi-Core | |
| Média Intel Core i9-12950HX (14028 - 16009, n=7) | |
| Dell Precision 7000 7670 Performance | |
| HP ZBook Studio 16 G9 62U04EA | |
| MSI CreatorPro Z16P B12UKST | |
| Dell Precision 7670 | |
| Lenovo ThinkPad P1 G4-20Y4Z9DVUS | |
| HP ZBook Firefly 16 G9-6B897EA | |
| Geekbench 5.5 / Single-Core | |
| Dell Precision 7000 7670 Performance | |
| Média Intel Core i9-12950HX (1847 - 1945, n=7) | |
| HP ZBook Studio 16 G9 62U04EA | |
| HP ZBook Firefly 16 G9-6B897EA | |
| MSI CreatorPro Z16P B12UKST | |
| Dell Precision 7670 | |
| Lenovo ThinkPad P1 G4-20Y4Z9DVUS | |
| HWBOT x265 Benchmark v2.2 / 4k Preset | |
| Média Intel Core i9-12950HX (18.6 - 26.5, n=7) | |
| HP ZBook Studio 16 G9 62U04EA | |
| MSI CreatorPro Z16P B12UKST | |
| Dell Precision 7000 7670 Performance | |
| Dell Precision 7670 | |
| Lenovo ThinkPad P1 G4-20Y4Z9DVUS | |
| HP ZBook Firefly 16 G9-6B897EA | |
| LibreOffice / 20 Documents To PDF | |
| HP ZBook Firefly 16 G9-6B897EA | |
| Lenovo ThinkPad P1 G4-20Y4Z9DVUS | |
| Dell Precision 7670 | |
| Dell Precision 7000 7670 Performance | |
| HP ZBook Studio 16 G9 62U04EA | |
| Média Intel Core i9-12950HX (34.7 - 45.4, n=7) | |
| MSI CreatorPro Z16P B12UKST | |
| R Benchmark 2.5 / Overall mean | |
| Lenovo ThinkPad P1 G4-20Y4Z9DVUS | |
| HP ZBook Firefly 16 G9-6B897EA | |
| Dell Precision 7670 | |
| MSI CreatorPro Z16P B12UKST | |
| Dell Precision 7000 7670 Performance | |
| HP ZBook Studio 16 G9 62U04EA | |
| Média Intel Core i9-12950HX (0.4251 - 0.4515, n=7) | |
* ... menor é melhor
AIDA64: FP32 Ray-Trace | FPU Julia | CPU SHA3 | CPU Queen | FPU SinJulia | FPU Mandel | CPU AES | CPU ZLib | FP64 Ray-Trace | CPU PhotoWorxx
| Performance rating | |
| Média Intel Core i9-12950HX | |
| MSI CreatorPro Z16P B12UKST | |
| HP ZBook Studio 16 G9 62U04EA | |
| Dell Precision 7000 7670 Performance | |
| Lenovo ThinkPad P1 G4-20Y4Z9DVUS | |
| Dell Precision 7670 | |
| HP ZBook Firefly 16 G9-6B897EA | |
| AIDA64 / FP32 Ray-Trace | |
| Média Intel Core i9-12950HX (15499 - 22868, n=7) | |
| Dell Precision 7000 7670 Performance | |
| Lenovo ThinkPad P1 G4-20Y4Z9DVUS | |
| HP ZBook Studio 16 G9 62U04EA | |
| MSI CreatorPro Z16P B12UKST | |
| Dell Precision 7670 | |
| HP ZBook Firefly 16 G9-6B897EA | |
| AIDA64 / FPU Julia | |
| Média Intel Core i9-12950HX (77846 - 115907, n=7) | |
| HP ZBook Studio 16 G9 62U04EA | |
| Dell Precision 7000 7670 Performance | |
| MSI CreatorPro Z16P B12UKST | |
| Dell Precision 7670 | |
| Lenovo ThinkPad P1 G4-20Y4Z9DVUS | |
| HP ZBook Firefly 16 G9-6B897EA | |
| AIDA64 / CPU SHA3 | |
| Lenovo ThinkPad P1 G4-20Y4Z9DVUS | |
| Média Intel Core i9-12950HX (3426 - 5069, n=7) | |
| HP ZBook Studio 16 G9 62U04EA | |
| MSI CreatorPro Z16P B12UKST | |
| Dell Precision 7000 7670 Performance | |
| Dell Precision 7670 | |
| HP ZBook Firefly 16 G9-6B897EA | |
| AIDA64 / CPU Queen | |
| HP ZBook Studio 16 G9 62U04EA | |
| Média Intel Core i9-12950HX (102752 - 104726, n=7) | |
| Dell Precision 7000 7670 Performance | |
| MSI CreatorPro Z16P B12UKST | |
| Lenovo ThinkPad P1 G4-20Y4Z9DVUS | |
| HP ZBook Firefly 16 G9-6B897EA | |
| Dell Precision 7670 | |
| AIDA64 / FPU SinJulia | |
| Média Intel Core i9-12950HX (10134 - 12823, n=7) | |
| Dell Precision 7000 7670 Performance | |
| Dell Precision 7670 | |
| Lenovo ThinkPad P1 G4-20Y4Z9DVUS | |
| HP ZBook Studio 16 G9 62U04EA | |
| MSI CreatorPro Z16P B12UKST | |
| HP ZBook Firefly 16 G9-6B897EA | |
| AIDA64 / FPU Mandel | |
| Média Intel Core i9-12950HX (37146 - 57340, n=7) | |
| HP ZBook Studio 16 G9 62U04EA | |
| Lenovo ThinkPad P1 G4-20Y4Z9DVUS | |
| Dell Precision 7000 7670 Performance | |
| MSI CreatorPro Z16P B12UKST | |
| Dell Precision 7670 | |
| HP ZBook Firefly 16 G9-6B897EA | |
| AIDA64 / CPU AES | |
| MSI CreatorPro Z16P B12UKST | |
| Média Intel Core i9-12950HX (72599 - 181128, n=7) | |
| Lenovo ThinkPad P1 G4-20Y4Z9DVUS | |
| HP ZBook Studio 16 G9 62U04EA | |
| Dell Precision 7000 7670 Performance | |
| Dell Precision 7670 | |
| HP ZBook Firefly 16 G9-6B897EA | |
| AIDA64 / CPU ZLib | |
| Média Intel Core i9-12950HX (996 - 1417, n=7) | |
| HP ZBook Studio 16 G9 62U04EA | |
| MSI CreatorPro Z16P B12UKST | |
| Dell Precision 7000 7670 Performance | |
| Dell Precision 7670 | |
| Lenovo ThinkPad P1 G4-20Y4Z9DVUS | |
| HP ZBook Firefly 16 G9-6B897EA | |
| AIDA64 / FP64 Ray-Trace | |
| Média Intel Core i9-12950HX (8455 - 12432, n=7) | |
| HP ZBook Studio 16 G9 62U04EA | |
| Dell Precision 7000 7670 Performance | |
| Lenovo ThinkPad P1 G4-20Y4Z9DVUS | |
| MSI CreatorPro Z16P B12UKST | |
| Dell Precision 7670 | |
| HP ZBook Firefly 16 G9-6B897EA | |
| AIDA64 / CPU PhotoWorxx | |
| MSI CreatorPro Z16P B12UKST | |
| Dell Precision 7000 7670 Performance | |
| Dell Precision 7670 | |
| Média Intel Core i9-12950HX (35479 - 42655, n=7) | |
| HP ZBook Studio 16 G9 62U04EA | |
| HP ZBook Firefly 16 G9-6B897EA | |
| Lenovo ThinkPad P1 G4-20Y4Z9DVUS | |
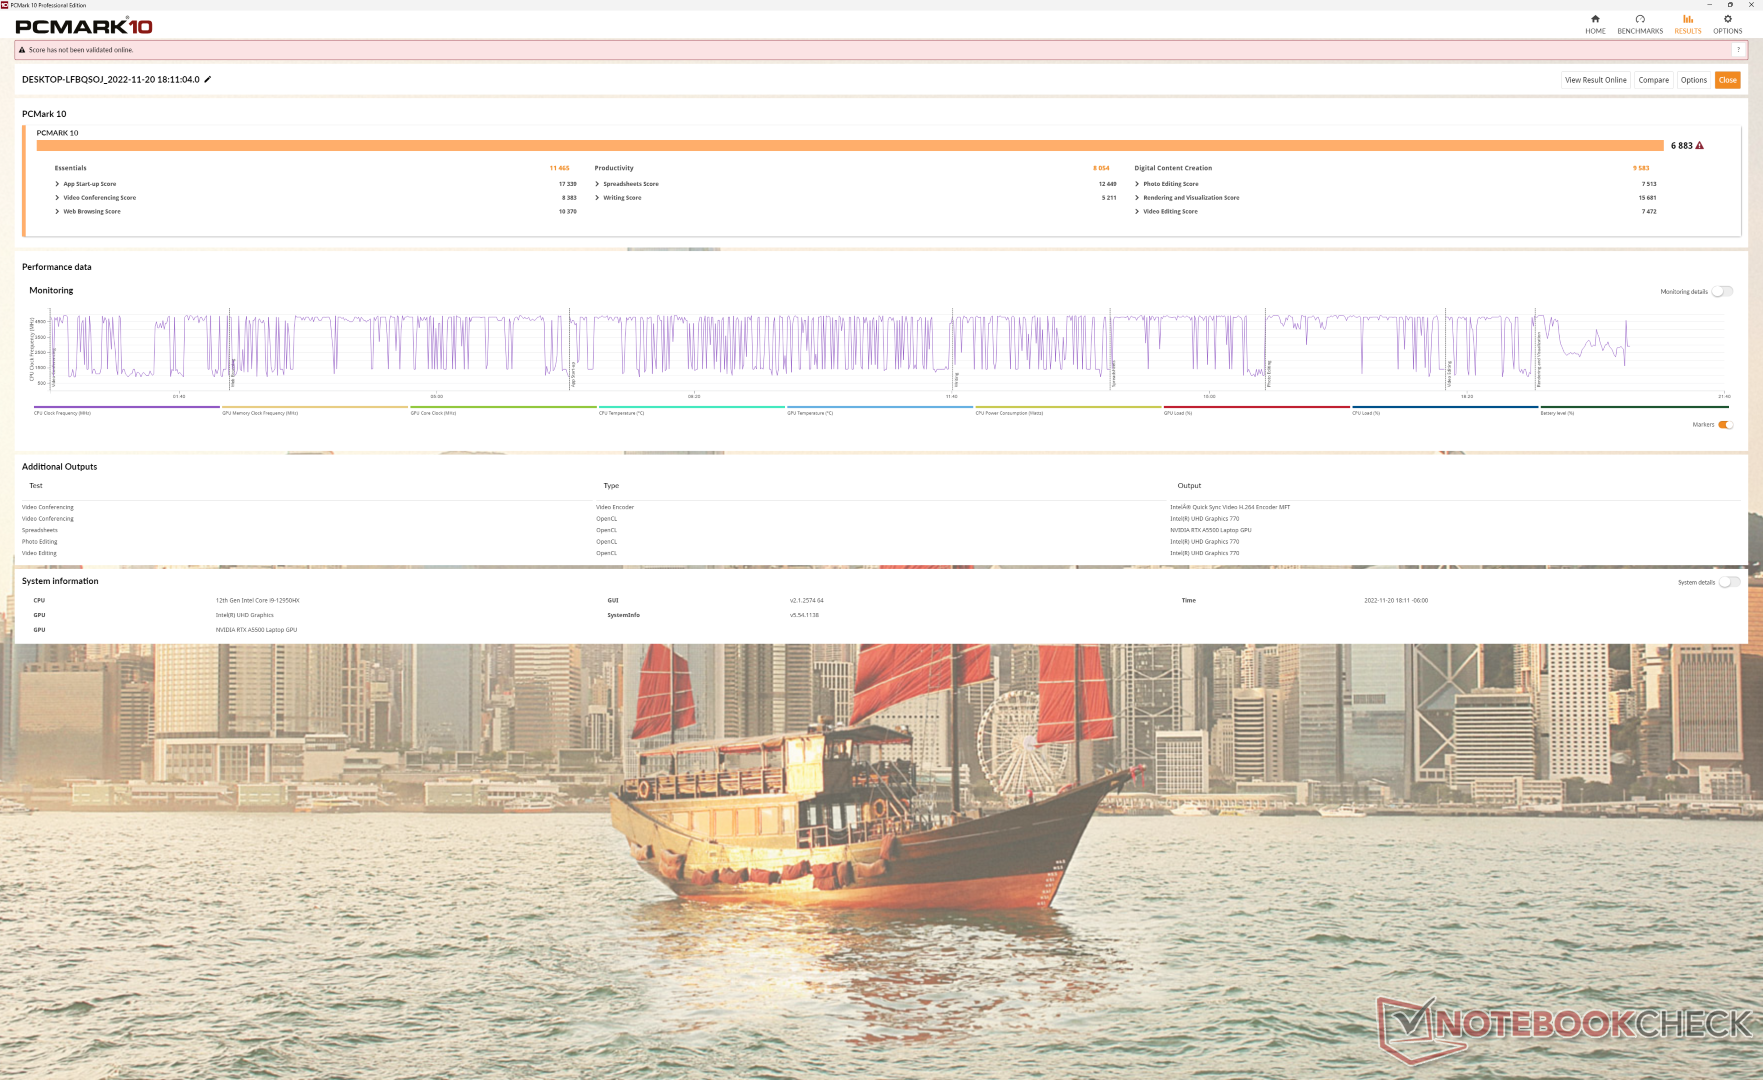
Desempenho do sistema
Os resultados da PCMark são comparáveis aos das estações de trabalho móveis mais avançadas atualmente disponíveis, incluindo oHP ZBook Fury 15 G8.
CrossMark: Overall | Productivity | Creativity | Responsiveness
| PCMark 10 / Score | |
| MSI CreatorPro Z16P B12UKST | |
| MSI WE76 11UM-456 | |
| Média Intel Core i9-12950HX, NVIDIA RTX A5500 Laptop GPU (6883 - 7236, n=3) | |
| Dell Precision 7000 7670 Performance | |
| Dell Precision 7670 | |
| HP ZBook Studio 16 G9 62U04EA | |
| Lenovo ThinkPad P1 G4-20Y4Z9DVUS | |
| HP ZBook Firefly 16 G9-6B897EA | |
| PCMark 10 / Essentials | |
| Dell Precision 7000 7670 Performance | |
| Média Intel Core i9-12950HX, NVIDIA RTX A5500 Laptop GPU (10898 - 11465, n=3) | |
| MSI CreatorPro Z16P B12UKST | |
| Dell Precision 7670 | |
| HP ZBook Firefly 16 G9-6B897EA | |
| Lenovo ThinkPad P1 G4-20Y4Z9DVUS | |
| MSI WE76 11UM-456 | |
| HP ZBook Studio 16 G9 62U04EA | |
| PCMark 10 / Productivity | |
| MSI WE76 11UM-456 | |
| MSI CreatorPro Z16P B12UKST | |
| Dell Precision 7670 | |
| Média Intel Core i9-12950HX, NVIDIA RTX A5500 Laptop GPU (8054 - 9489, n=3) | |
| HP ZBook Firefly 16 G9-6B897EA | |
| Lenovo ThinkPad P1 G4-20Y4Z9DVUS | |
| Dell Precision 7000 7670 Performance | |
| HP ZBook Studio 16 G9 62U04EA | |
| PCMark 10 / Digital Content Creation | |
| MSI WE76 11UM-456 | |
| MSI CreatorPro Z16P B12UKST | |
| Dell Precision 7000 7670 Performance | |
| Média Intel Core i9-12950HX, NVIDIA RTX A5500 Laptop GPU (9155 - 9944, n=3) | |
| HP ZBook Studio 16 G9 62U04EA | |
| Dell Precision 7670 | |
| Lenovo ThinkPad P1 G4-20Y4Z9DVUS | |
| HP ZBook Firefly 16 G9-6B897EA | |
| CrossMark / Overall | |
| MSI CreatorPro Z16P B12UKST | |
| Média Intel Core i9-12950HX, NVIDIA RTX A5500 Laptop GPU (1801 - 1889, n=3) | |
| HP ZBook Studio 16 G9 62U04EA | |
| Dell Precision 7000 7670 Performance | |
| MSI WE76 11UM-456 | |
| HP ZBook Firefly 16 G9-6B897EA | |
| Lenovo ThinkPad P1 G4-20Y4Z9DVUS | |
| Dell Precision 7670 | |
| CrossMark / Productivity | |
| MSI CreatorPro Z16P B12UKST | |
| Média Intel Core i9-12950HX, NVIDIA RTX A5500 Laptop GPU (1684 - 1785, n=3) | |
| HP ZBook Studio 16 G9 62U04EA | |
| Dell Precision 7000 7670 Performance | |
| MSI WE76 11UM-456 | |
| HP ZBook Firefly 16 G9-6B897EA | |
| Lenovo ThinkPad P1 G4-20Y4Z9DVUS | |
| Dell Precision 7670 | |
| CrossMark / Creativity | |
| Média Intel Core i9-12950HX, NVIDIA RTX A5500 Laptop GPU (2042 - 2192, n=3) | |
| HP ZBook Studio 16 G9 62U04EA | |
| MSI CreatorPro Z16P B12UKST | |
| Dell Precision 7000 7670 Performance | |
| MSI WE76 11UM-456 | |
| HP ZBook Firefly 16 G9-6B897EA | |
| Dell Precision 7670 | |
| Lenovo ThinkPad P1 G4-20Y4Z9DVUS | |
| CrossMark / Responsiveness | |
| MSI CreatorPro Z16P B12UKST | |
| HP ZBook Studio 16 G9 62U04EA | |
| Média Intel Core i9-12950HX, NVIDIA RTX A5500 Laptop GPU (1501 - 1585, n=3) | |
| Dell Precision 7000 7670 Performance | |
| MSI WE76 11UM-456 | |
| HP ZBook Firefly 16 G9-6B897EA | |
| Lenovo ThinkPad P1 G4-20Y4Z9DVUS | |
| Dell Precision 7670 | |
| PCMark 10 Score | 6883 pontos | |
Ajuda | ||
| AIDA64 / Memory Copy | |
| Dell Precision 7000 7670 Performance | |
| Média Intel Core i9-12950HX (59731 - 64732, n=7) | |
| Dell Precision 7670 | |
| MSI CreatorPro Z16P B12UKST | |
| HP ZBook Studio 16 G9 62U04EA | |
| HP ZBook Firefly 16 G9-6B897EA | |
| Lenovo ThinkPad P1 G4-20Y4Z9DVUS | |
| AIDA64 / Memory Read | |
| Dell Precision 7670 | |
| Dell Precision 7000 7670 Performance | |
| Média Intel Core i9-12950HX (59744 - 70359, n=7) | |
| MSI CreatorPro Z16P B12UKST | |
| HP ZBook Studio 16 G9 62U04EA | |
| HP ZBook Firefly 16 G9-6B897EA | |
| Lenovo ThinkPad P1 G4-20Y4Z9DVUS | |
| AIDA64 / Memory Write | |
| MSI CreatorPro Z16P B12UKST | |
| Dell Precision 7000 7670 Performance | |
| HP ZBook Studio 16 G9 62U04EA | |
| Dell Precision 7670 | |
| Média Intel Core i9-12950HX (57750 - 67899, n=7) | |
| HP ZBook Firefly 16 G9-6B897EA | |
| Lenovo ThinkPad P1 G4-20Y4Z9DVUS | |
| AIDA64 / Memory Latency | |
| MSI CreatorPro Z16P B12UKST | |
| HP ZBook Firefly 16 G9-6B897EA | |
| HP ZBook Studio 16 G9 62U04EA | |
| Dell Precision 7670 | |
| Média Intel Core i9-12950HX (84.5 - 92.2, n=7) | |
| Dell Precision 7000 7670 Performance | |
| Lenovo ThinkPad P1 G4-20Y4Z9DVUS | |
* ... menor é melhor
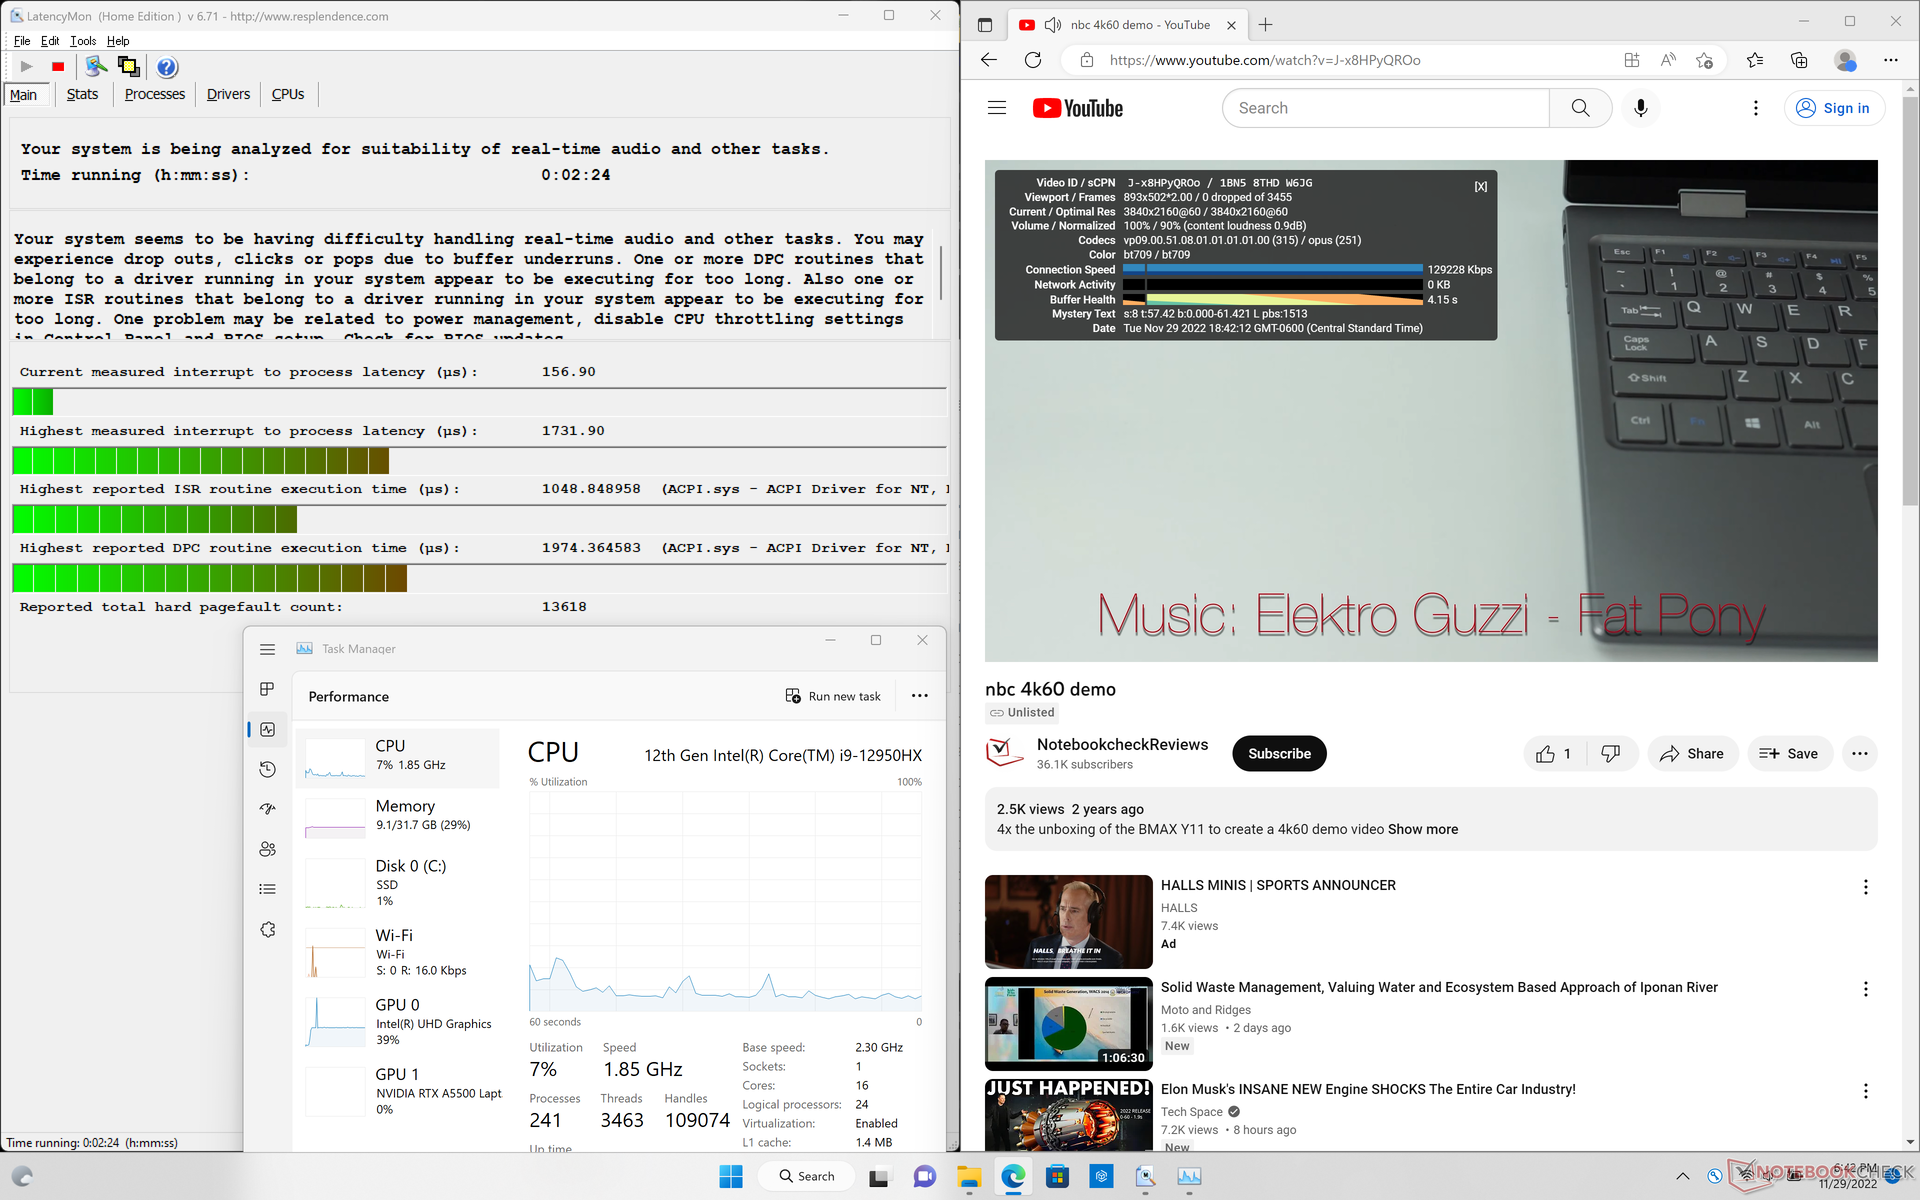
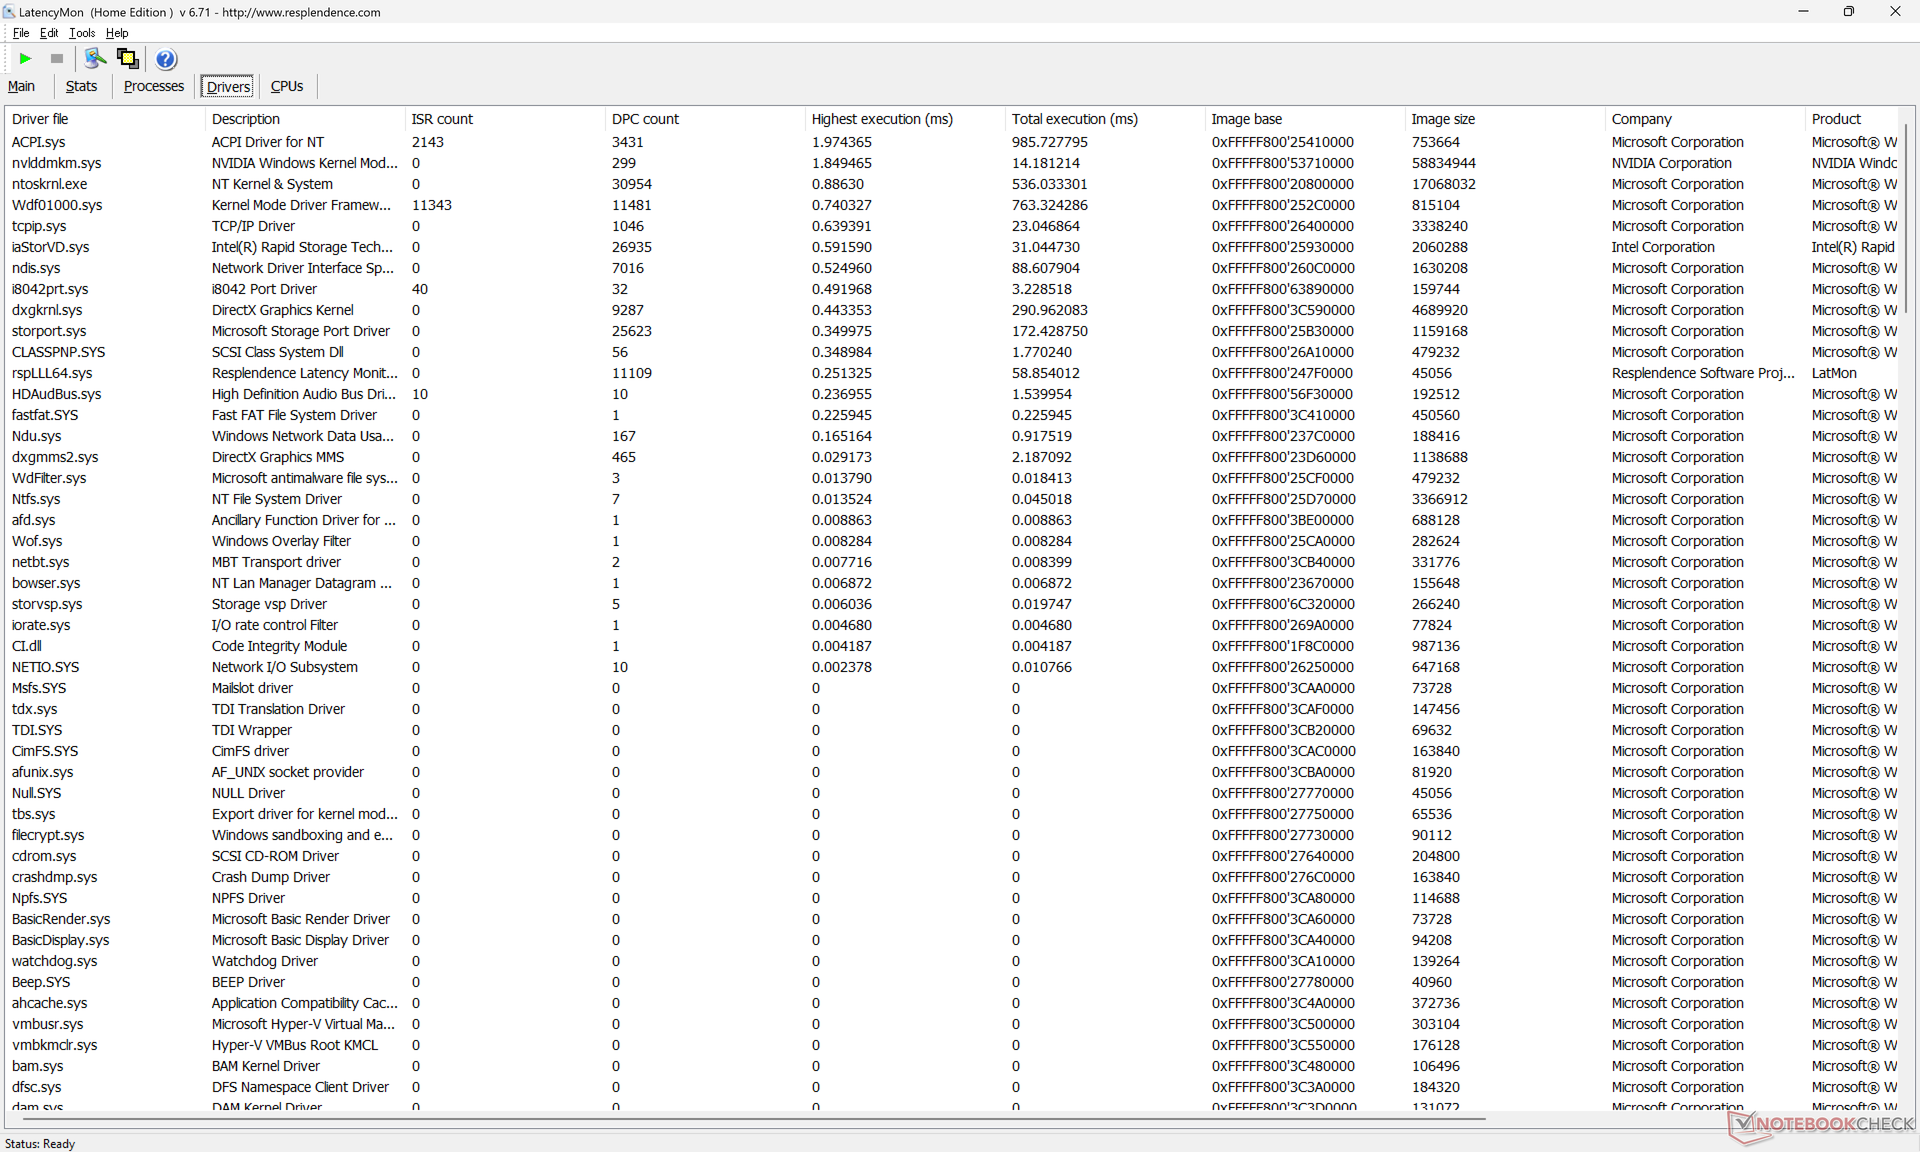
Latência do DPC
LatencyMon revela problemas de DPC ao abrir várias abas do navegador em nossa página inicial, mesmo após vários testes. a reprodução de vídeo de 4K a 60 FPS é, de outra forma, suave e sem qualquer queda de quadros.
| DPC Latencies / LatencyMon - interrupt to process latency (max), Web, Youtube, Prime95 | |
| Dell Precision 7000 7670 Performance | |
| Lenovo ThinkPad P1 G4-20Y4Z9DVUS | |
| Dell Precision 7670 | |
| HP ZBook Studio 16 G9 62U04EA | |
| HP ZBook Firefly 16 G9-6B897EA | |
| MSI CreatorPro Z16P B12UKST | |
* ... menor é melhor
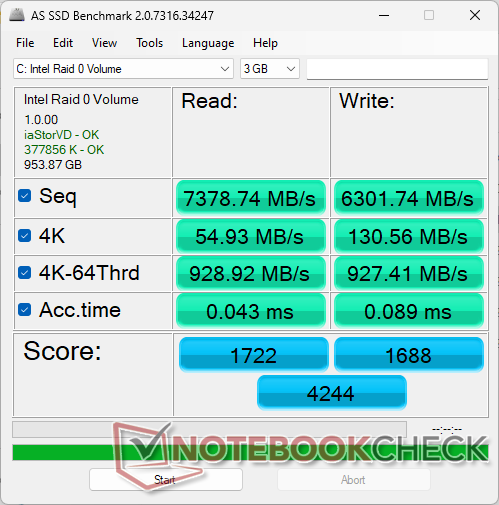
Dispositivos de armazenamento
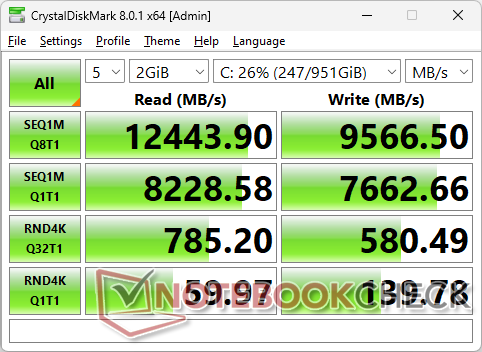
Os usuários podem instalar até três PCIe4 x4 NVMe M.2 2280 SSDs em vez de apenas duas no modelo regular mais fino. O dois SK Hynix PC801 em nossa unidade são instalados em configuração RAID 0 para taxas de leitura e gravação seqüenciais do mundo real insanamente altas de cerca de 13000 MB/s e 10000 MB/s, respectivamente. Cada slot SSD vem com seu próprio espalhador de calor e almofada térmica para dissipação de calor.

| Drive Performance rating - Percent | |
| MSI CreatorPro Z16P B12UKST -8! | |
| Dell Precision 7670 | |
| Dell Precision 7000 7670 Performance | |
| HP ZBook Studio 16 G9 62U04EA | |
| Lenovo ThinkPad P1 G4-20Y4Z9DVUS | |
| HP ZBook Firefly 16 G9-6B897EA | |
| Global Average -3 | |
* ... menor é melhor
Disk Throttling: DiskSpd Read Loop, Queue Depth 8
Desempenho da GPU
O RTX A5500 é aproximadamente 60 a 80 por cento mais rápido que o RTX A2000 no emagrecedor Precision 7670 ser uma das estações de trabalho móveis mais rápidas atualmente no mercado. Não é muito melhor do que as estações de dois anos de idade Quadro RTX 5000 no Acer ConceptD 9 Pro ou Asus ProArt StudioBook Pro Xno entanto, mesmo em termos de desempenho de traçado de raio. O RTX A5000 na maior de 17,3 polegadas MSI WE76 supera o desempenho de nosso RTX A5500 na maioria dos benchmarks.
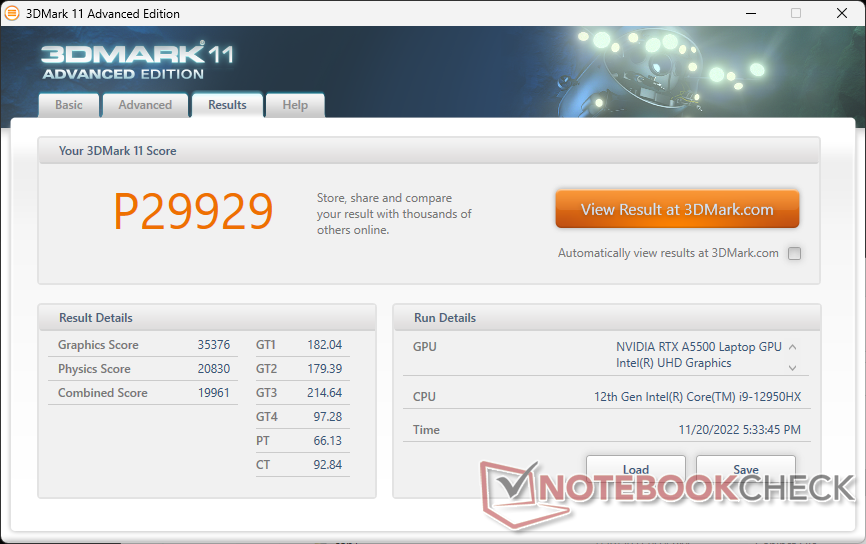
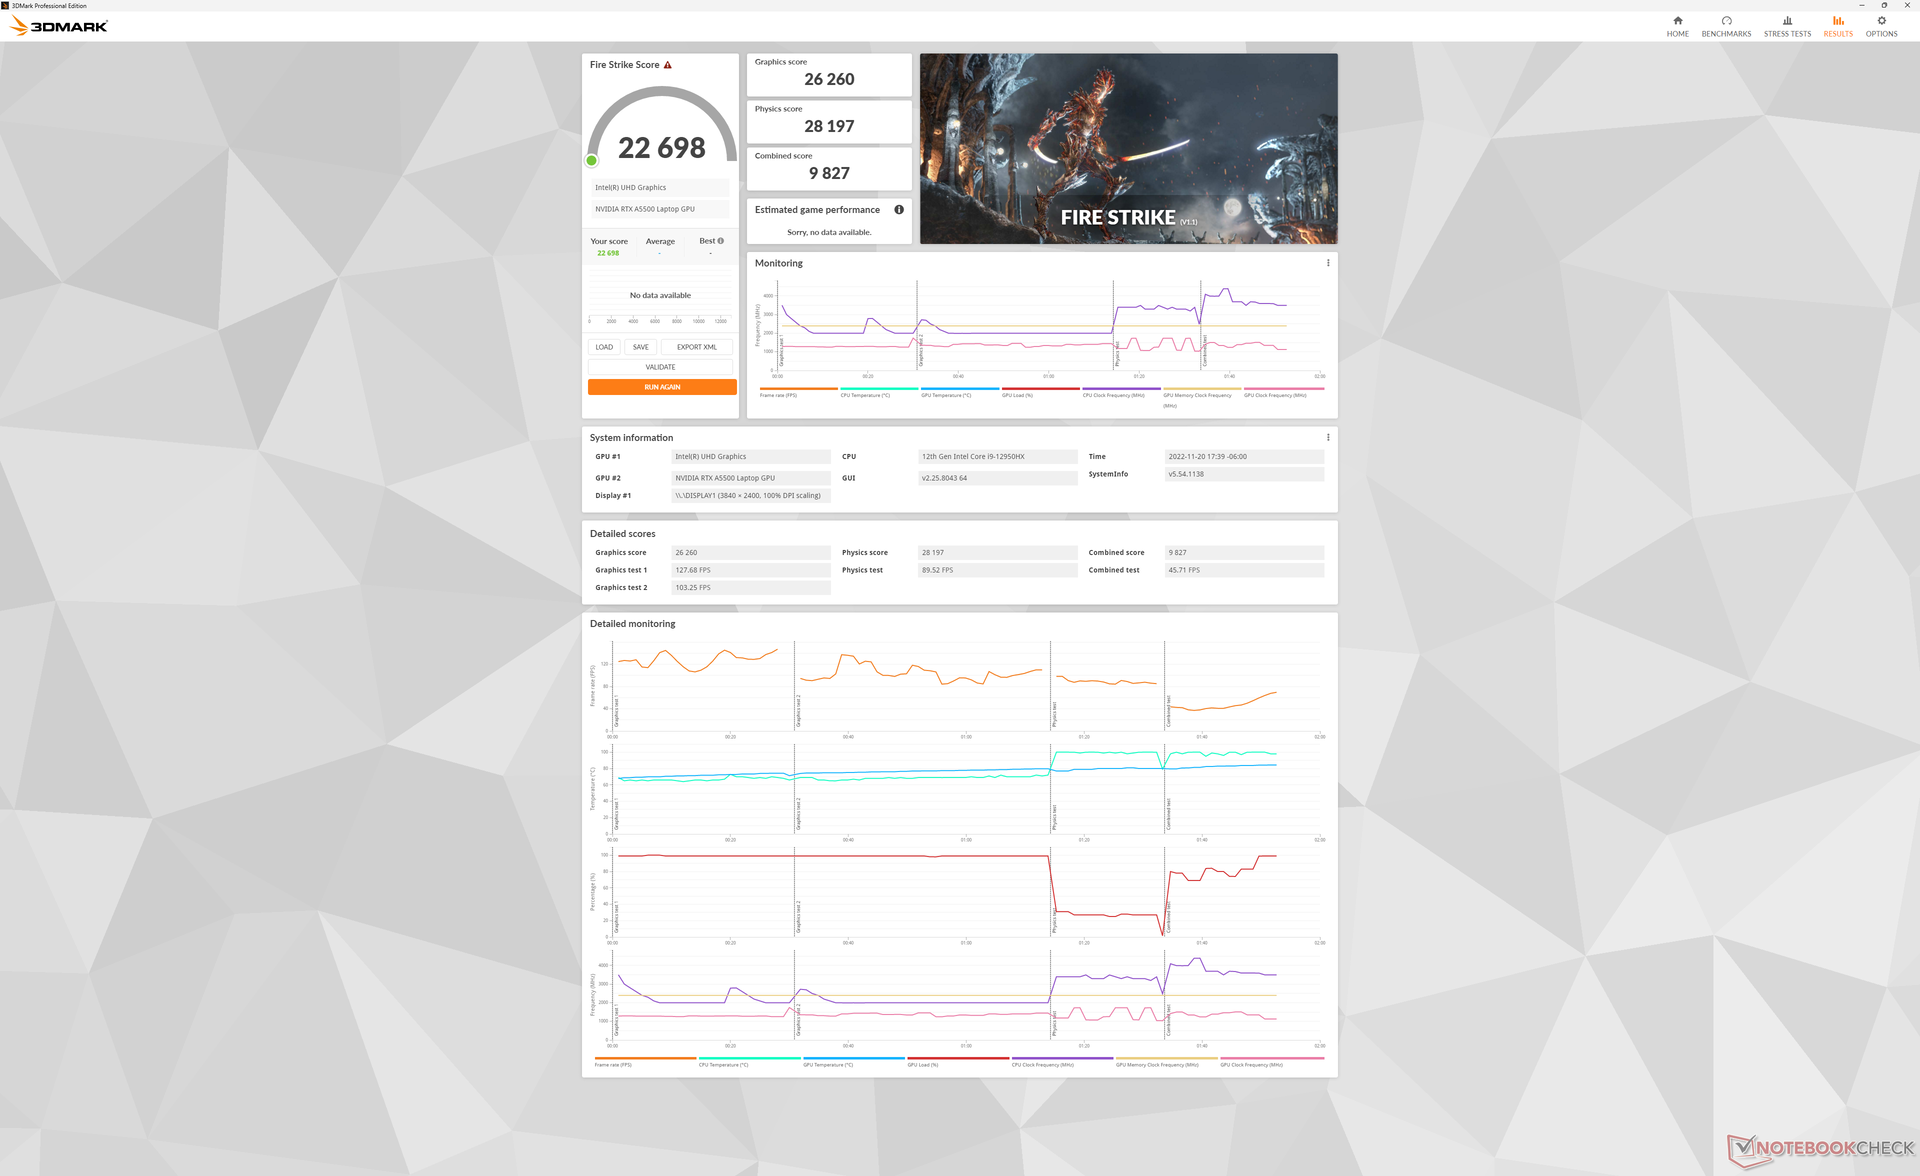
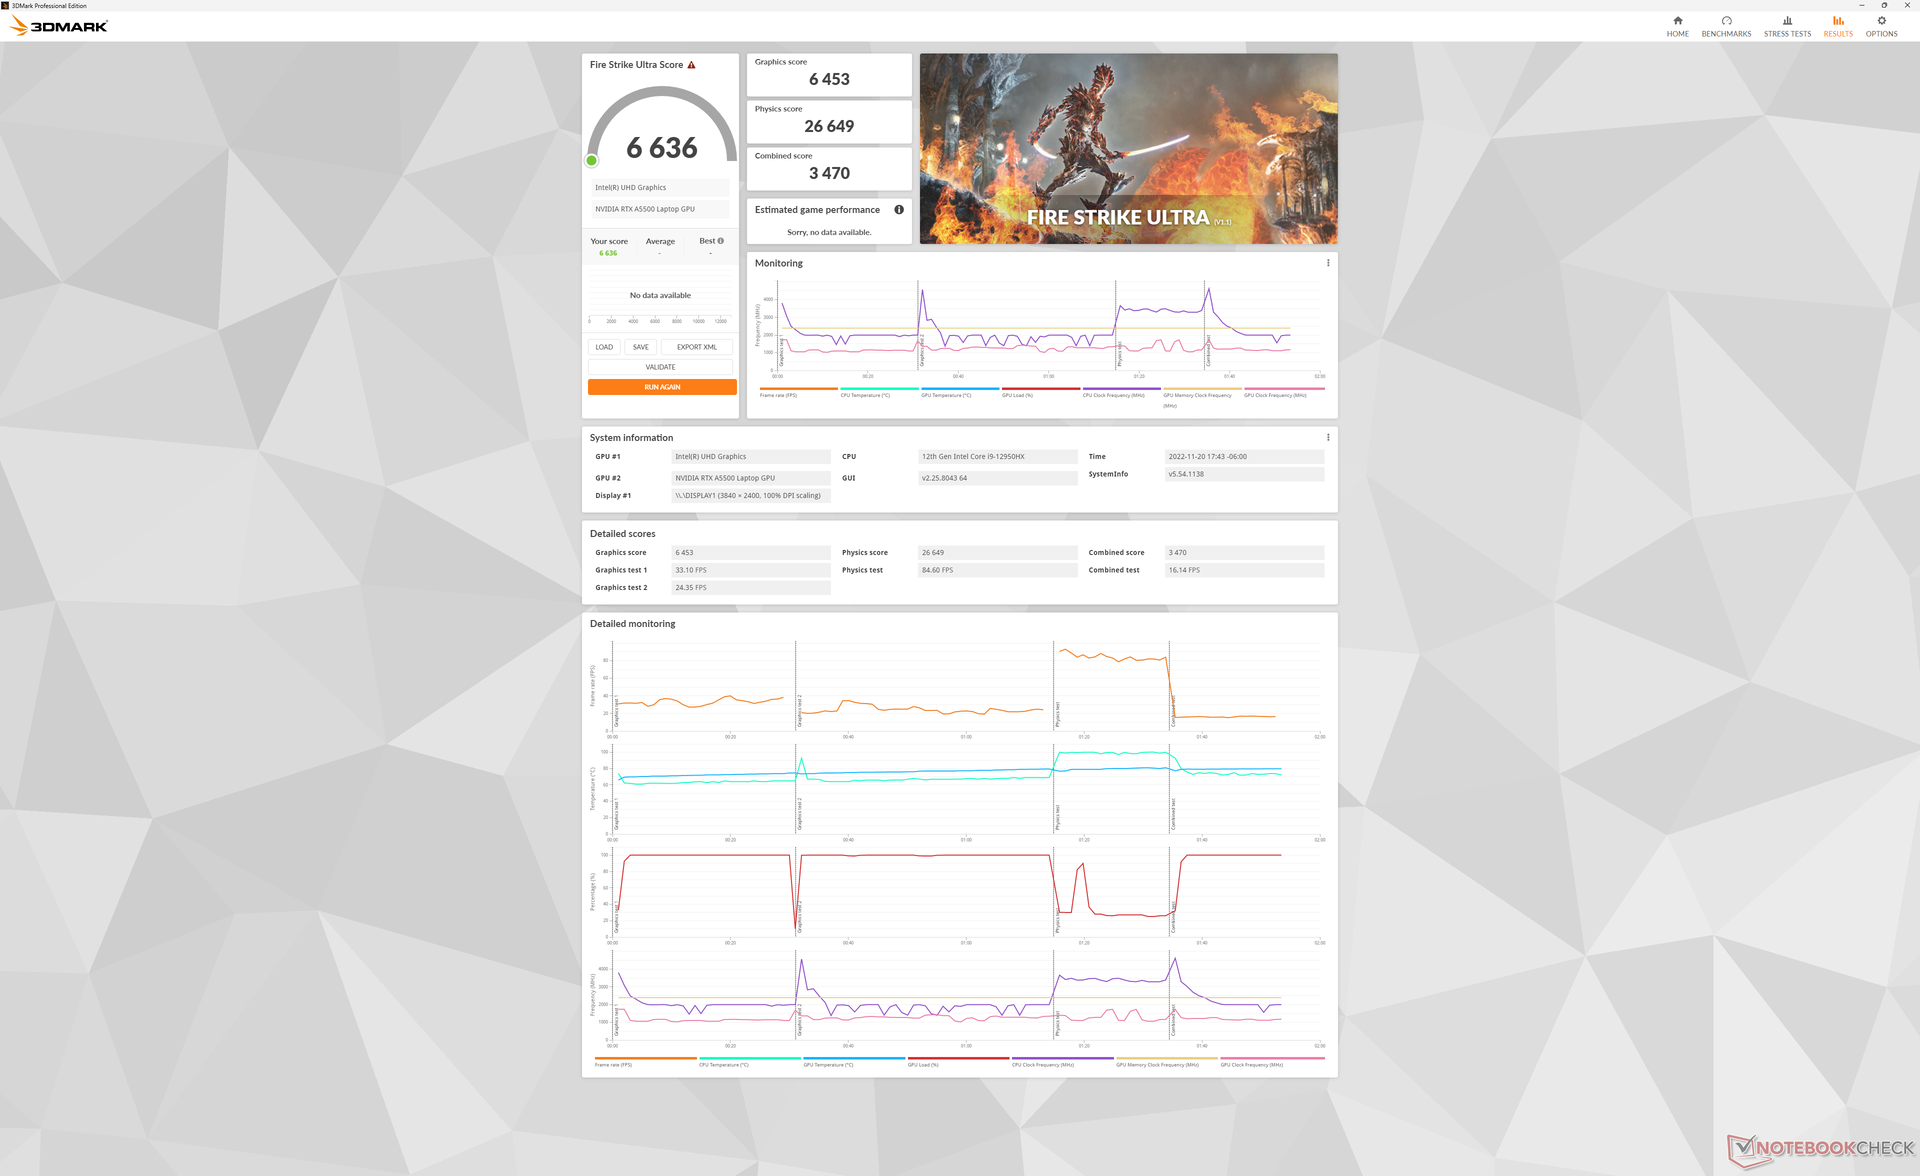
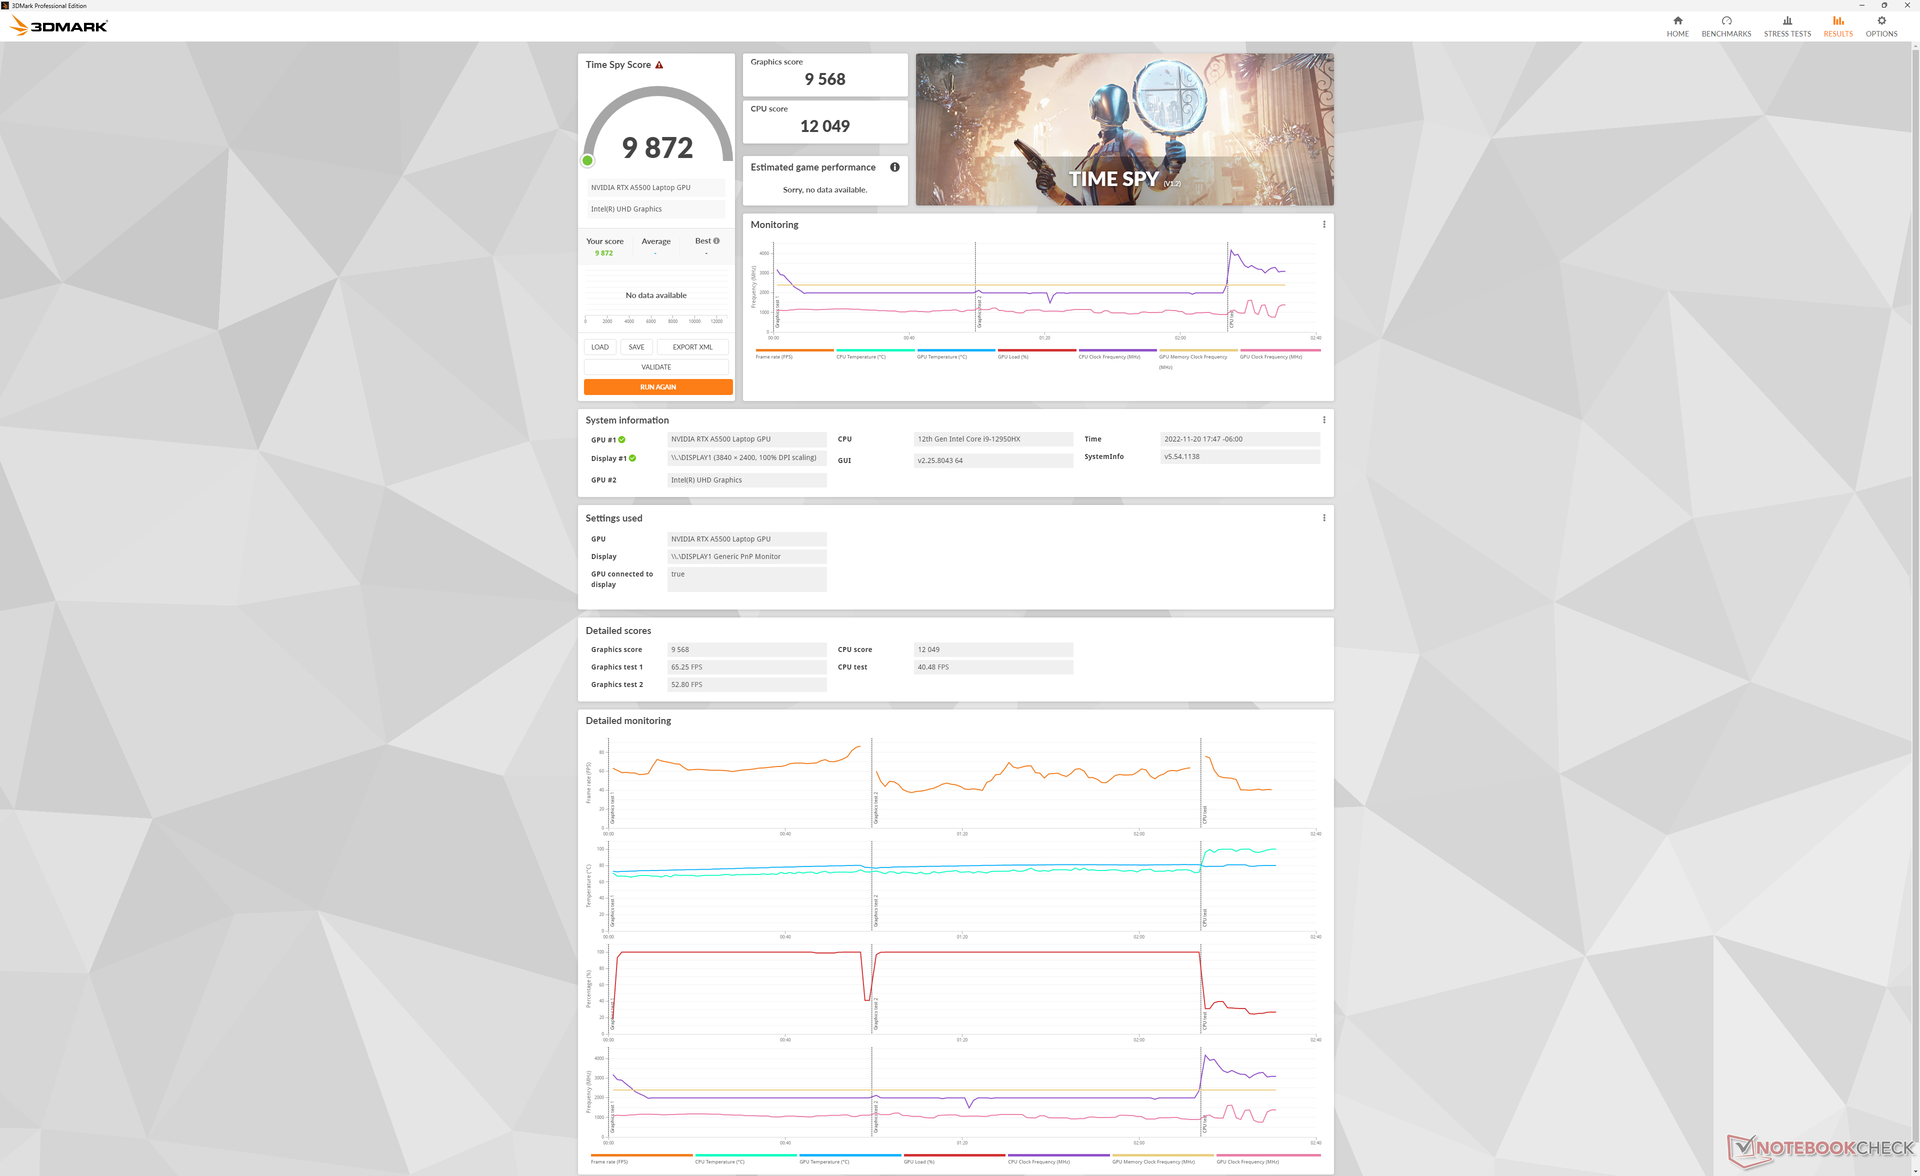
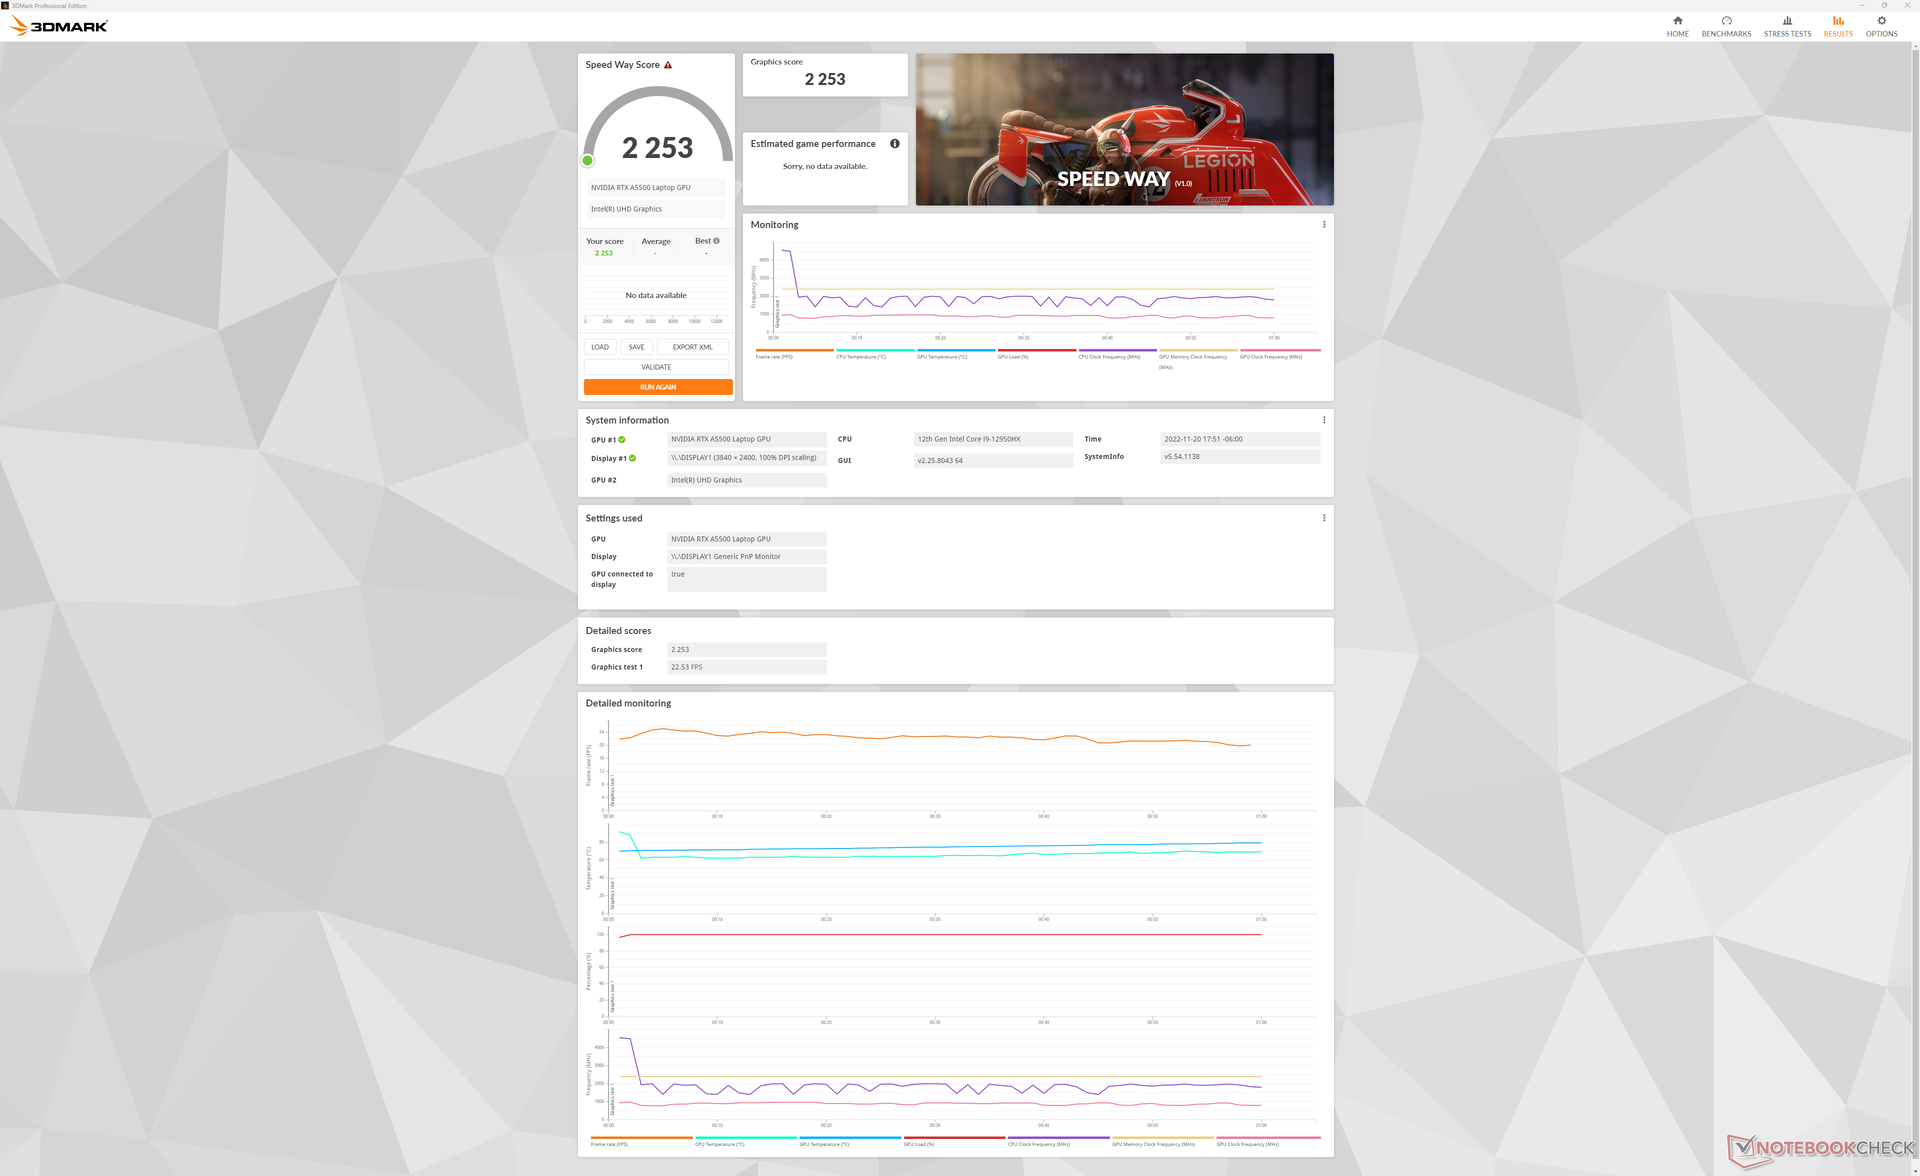
| 3DMark 11 Performance | 29929 pontos | |
| 3DMark Fire Strike Score | 22698 pontos | |
| 3DMark Time Spy Score | 9872 pontos | |
Ajuda | ||
* ... menor é melhor
| Performance rating - Percent | |
| Dell Precision 7000 7670 Performance | |
| MSI CreatorPro Z16P B12UKST | |
| Dell Precision 7670 | |
| HP ZBook Studio 16 G9 62U04EA | |
| Lenovo ThinkPad P1 G4-20Y4Z9DVUS -2! | |
| HP ZBook Firefly 16 G9-6B897EA | |
| The Witcher 3 - 1920x1080 Ultra Graphics & Postprocessing (HBAO+) | |
| Dell Precision 7000 7670 Performance | |
| MSI CreatorPro Z16P B12UKST | |
| Dell Precision 7670 | |
| HP ZBook Studio 16 G9 62U04EA | |
| Lenovo ThinkPad P1 G4-20Y4Z9DVUS | |
| HP ZBook Firefly 16 G9-6B897EA | |
| GTA V - 1920x1080 Highest AA:4xMSAA + FX AF:16x | |
| Dell Precision 7000 7670 Performance | |
| MSI CreatorPro Z16P B12UKST | |
| Dell Precision 7670 | |
| HP ZBook Studio 16 G9 62U04EA | |
| HP ZBook Firefly 16 G9-6B897EA | |
| Final Fantasy XV Benchmark - 1920x1080 High Quality | |
| Dell Precision 7000 7670 Performance | |
| MSI CreatorPro Z16P B12UKST | |
| Dell Precision 7670 | |
| HP ZBook Studio 16 G9 62U04EA | |
| Lenovo ThinkPad P1 G4-20Y4Z9DVUS | |
| HP ZBook Firefly 16 G9-6B897EA | |
| Strange Brigade - 1920x1080 ultra AA:ultra AF:16 | |
| Dell Precision 7000 7670 Performance | |
| MSI CreatorPro Z16P B12UKST | |
| Dell Precision 7670 | |
| HP ZBook Studio 16 G9 62U04EA | |
| HP ZBook Firefly 16 G9-6B897EA | |
| Dota 2 Reborn - 1920x1080 ultra (3/3) best looking | |
| Dell Precision 7000 7670 Performance | |
| HP ZBook Studio 16 G9 62U04EA | |
| MSI CreatorPro Z16P B12UKST | |
| Dell Precision 7670 | |
| Lenovo ThinkPad P1 G4-20Y4Z9DVUS | |
| HP ZBook Firefly 16 G9-6B897EA | |
| X-Plane 11.11 - 1920x1080 high (fps_test=3) | |
| Dell Precision 7000 7670 Performance | |
| MSI CreatorPro Z16P B12UKST | |
| HP ZBook Studio 16 G9 62U04EA | |
| Dell Precision 7670 | |
| Lenovo ThinkPad P1 G4-20Y4Z9DVUS | |
| HP ZBook Firefly 16 G9-6B897EA | |
| Cyberpunk 2077 1.6 | |
| 1920x1080 Low Preset | |
| Dell Precision 7000 7670 Performance | |
| Dell Precision 7670 | |
| MSI CreatorPro Z16P B12UKST | |
| HP ZBook Studio 16 G9 62U04EA | |
| 1920x1080 Medium Preset | |
| Dell Precision 7000 7670 Performance | |
| MSI CreatorPro Z16P B12UKST | |
| Dell Precision 7670 | |
| HP ZBook Studio 16 G9 62U04EA | |
| 1920x1080 High Preset | |
| Dell Precision 7000 7670 Performance | |
| Dell Precision 7670 | |
| MSI CreatorPro Z16P B12UKST | |
| HP ZBook Studio 16 G9 62U04EA | |
| 1920x1080 Ultra Preset | |
| Dell Precision 7000 7670 Performance | |
| Dell Precision 7670 | |
| MSI CreatorPro Z16P B12UKST | |
| HP ZBook Studio 16 G9 62U04EA | |
| 2560x1440 Ultra Preset | |
| Dell Precision 7000 7670 Performance | |
| Dell Precision 7670 | |
| MSI CreatorPro Z16P B12UKST | |
| HP ZBook Studio 16 G9 62U04EA | |
| 3840x2160 Ultra Preset | |
| Dell Precision 7000 7670 Performance | |
Quando ocioso em Witcher 3 durante uma hora, pudemos registrar mergulhos maciços em taxas de quadros cerca de 10 minutos no teste, como mostra o gráfico abaixo. Isto sugere uma priorização deficiente do programa ou a interrupção da atividade de fundo que pode potencialmente interferir com o desempenho do programa principal em foco.
Witcher 3 FPS Chart
| baixo | média | alto | ultra | QHD | 4K | |
|---|---|---|---|---|---|---|
| GTA V (2015) | 183.4 | 178.1 | 166.2 | 102.6 | 99.2 | |
| The Witcher 3 (2015) | 421.2 | 306.8 | 205.4 | 101.5 | 62.5 | |
| Dota 2 Reborn (2015) | 193.3 | 171.3 | 161.8 | 152.9 | 131.4 | |
| Final Fantasy XV Benchmark (2018) | 170.1 | 138.9 | 107.8 | 78.9 | 43.5 | |
| X-Plane 11.11 (2018) | 146.2 | 134.3 | 107.8 | 92.7 | ||
| Strange Brigade (2018) | 377 | 244 | 200 | 177.9 | 129.3 | |
| Metro Exodus (2019) | 171 | 125.8 | 95.3 | 75.7 | 58.5 | 31.3 |
| Borderlands 3 (2019) | 162.9 | 135.4 | 110.4 | 89.3 | 62.7 | 30.2 |
| Gears Tactics (2020) | 314.1 | 189.7 | 139.2 | 110.1 | 77.1 | 34.9 |
| Horizon Zero Dawn (2020) | 139 | 130 | 111 | 101 | 89 | 42 |
| Watch Dogs Legion (2020) | 119 | 98 | 93 | 77 | 58 | 30 |
| Dirt 5 (2020) | 167.6 | 130 | 114.8 | 92.2 | 71.9 | 39.8 |
| Hitman 3 (2021) | 229 | 186.6 | 179.9 | 161.4 | 104.6 | 43.8 |
| Far Cry 6 (2021) | 132 | 115 | 104 | 95 | 79 | 42 |
| Guardians of the Galaxy (2021) | 142 | 124 | 137 | 134 | 104 | 49 |
| God of War (2022) | 128.9 | 119.6 | 105.6 | 79 | 62.2 | 35.6 |
| Cyberpunk 2077 1.6 (2022) | 93.9 | 80.2 | 79.3 | 75.7 | 45.3 | 17.8 |
| F1 22 (2022) | 190.8 | 188.2 | 163.1 | 66.4 | 40.8 | 18.8 |
Emissões
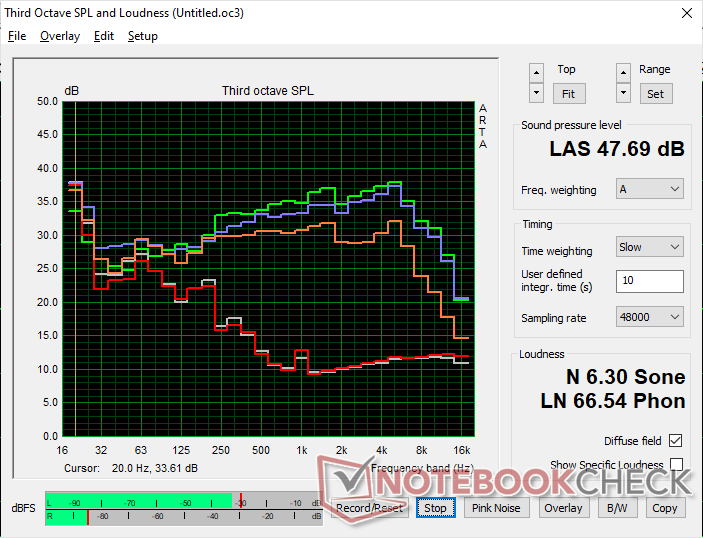
Ruído do sistema
Os ventiladores dentro do Precision 7670 Performance tendem a pulsar mais freqüentemente do que os ventiladores no mais fino Precision 7670 provavelmente devido ao teto Turbo Boost mais alto do Core i9-12950HX versus o Core i7-12850HX. Entretanto, isto não deve ser um problema quando o perfil de potência é ajustado para o modo Equilibrado ou Silencioso
O ruído geral do ventilador é geralmente mais silencioso do que o que gravamos no mais fino Precision 7670. As cargas de jogo se estabilizariam na faixa de 42 a 47 dB(A) em comparação com a faixa de 45 a 49 dB(A) do modelo menor. Somos capazes de atingir um máximo de 48 dB(A) quando tanto a CPU quanto a GPU estão a 100% de utilização.
Barulho
| Ocioso |
| 24 / 24 / 38 dB |
| Carga |
| 46.3 / 47.9 dB |
 | ||
30 dB silencioso 40 dB(A) audível 50 dB(A) ruidosamente alto |
||
min: | ||
| Dell Precision 7000 7670 Performance RTX A5500 Laptop GPU, i9-12950HX | MSI CreatorPro Z16P B12UKST RTX A3000 Laptop GPU, i7-12700H, Samsung PM9A1 MZVL21T0HCLR | HP ZBook Studio 16 G9 62U04EA RTX A2000 Laptop GPU, i7-12800H, Micron 3400 1TB MTFDKBA1T0TFH | HP ZBook Firefly 16 G9-6B897EA T550 Laptop GPU, i7-1265U, Samsung PM9A1 MZVL21T0HCLR | Lenovo ThinkPad P1 G4-20Y4Z9DVUS T1200 Laptop GPU, i7-11800H, Samsung PM9A1 MZVL2512HCJQ | Dell Precision 7670 RTX A2000 Laptop GPU, i7-12850HX, SK Hynix HFS001TEJ9X115N | |
|---|---|---|---|---|---|---|
| Noise | 1% | 3% | 10% | 2% | 4% | |
| desligado / ambiente * (dB) | 23.9 | 24.1 -1% | 24 -0% | 23.8 -0% | 24.3 -2% | 22.7 5% |
| Idle Minimum * (dB) | 24 | 27.1 -13% | 24 -0% | 23.8 1% | 24.3 -1% | 22.9 5% |
| Idle Average * (dB) | 24 | 27.1 -13% | 27.7 -15% | 23.8 1% | 24.3 -1% | 22.9 5% |
| Idle Maximum * (dB) | 38 | 27.1 29% | 27.7 27% | 23.8 37% | 26.6 30% | 24.5 36% |
| Load Average * (dB) | 46.3 | 42.9 7% | 39.8 14% | 39.4 15% | 46.8 -1% | 48.7 -5% |
| Witcher 3 ultra * (dB) | 41.9 | 44 -5% | 44.3 -6% | 40.5 3% | 46.8 -12% | 45.2 -8% |
| Load Maximum * (dB) | 47.9 | 47 2% | 47.7 -0% | 41.4 14% | 46.8 2% | 52.1 -9% |
* ... menor é melhor
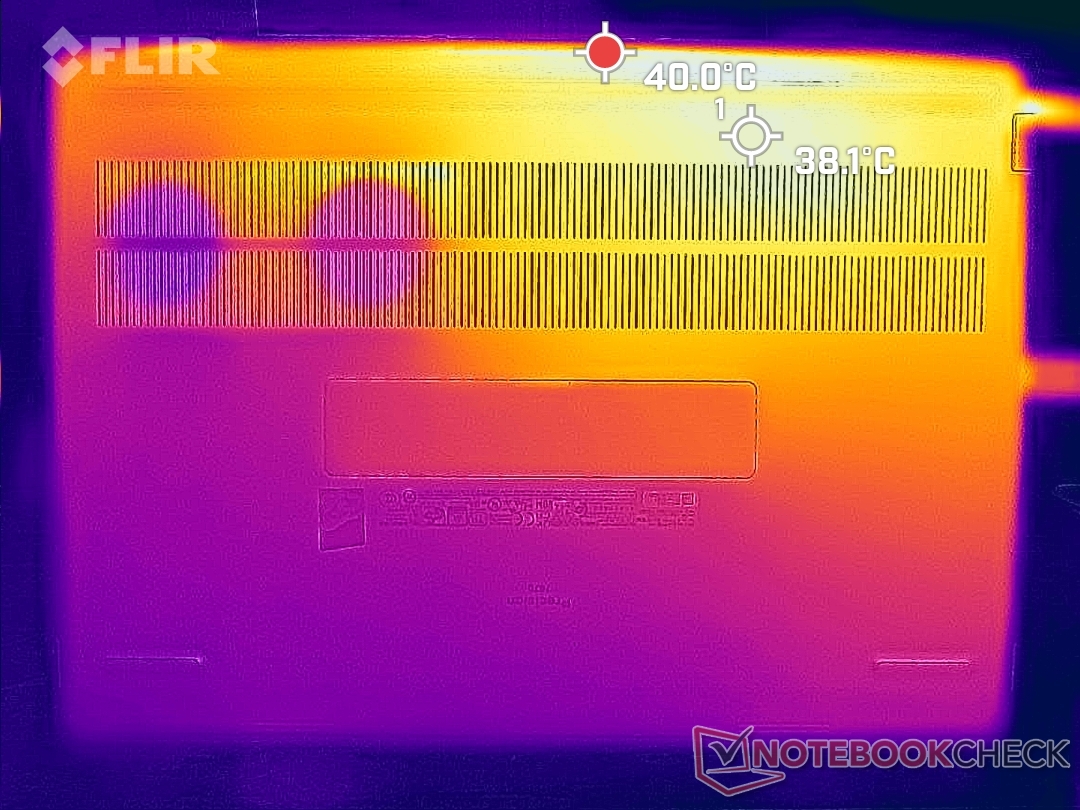
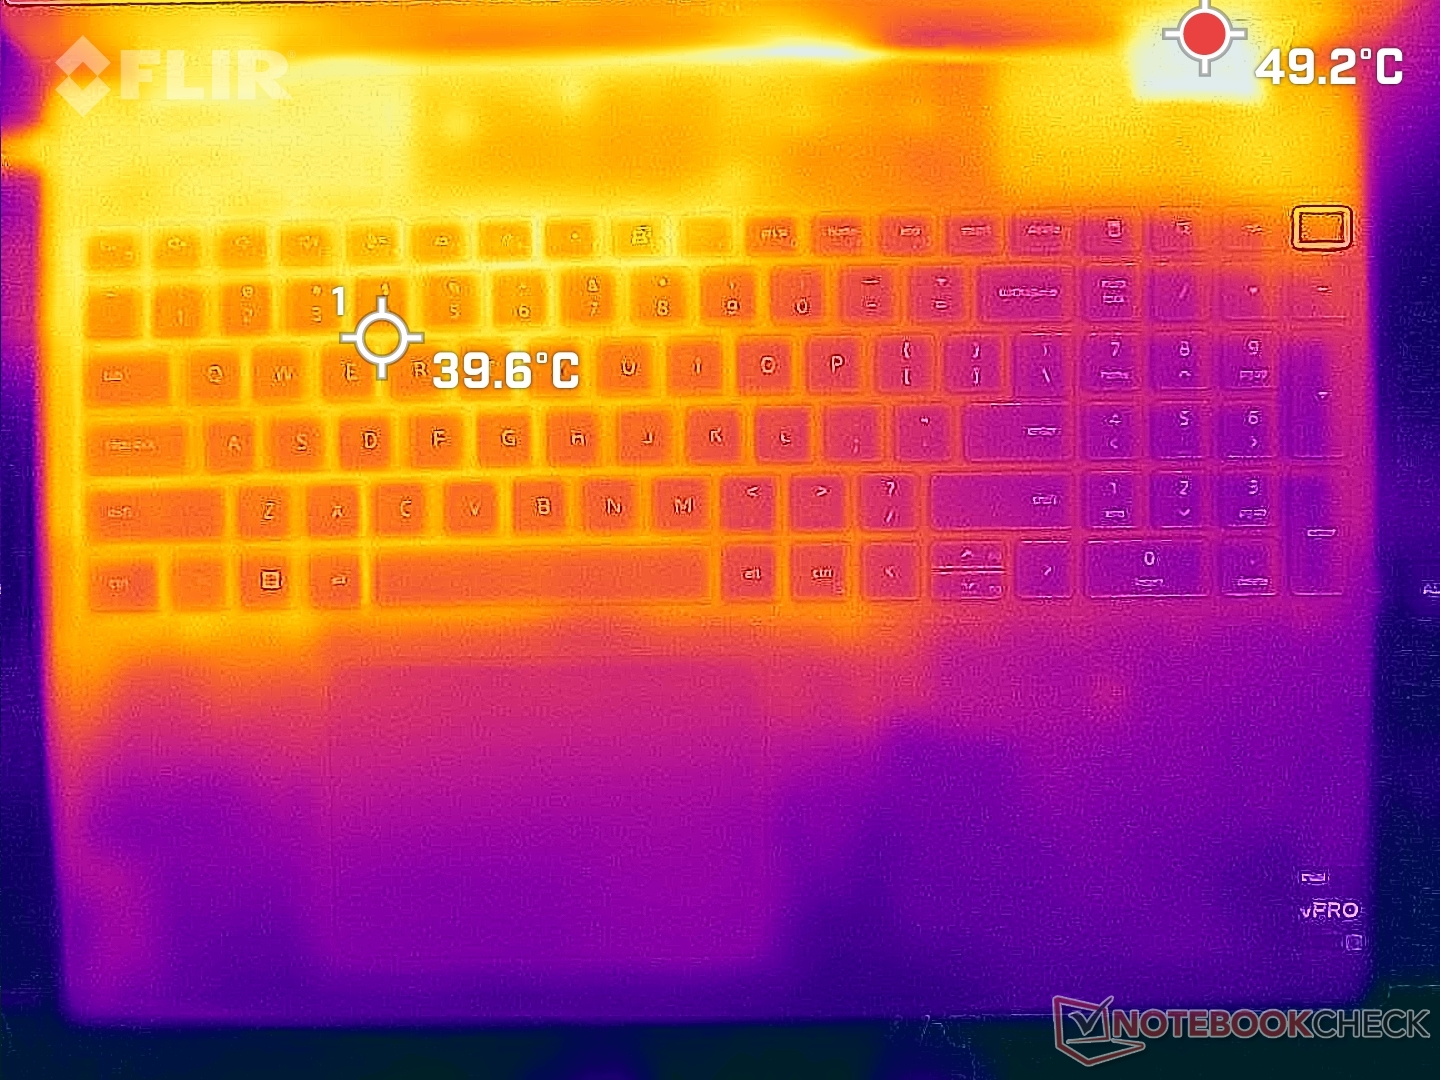
Temperatura
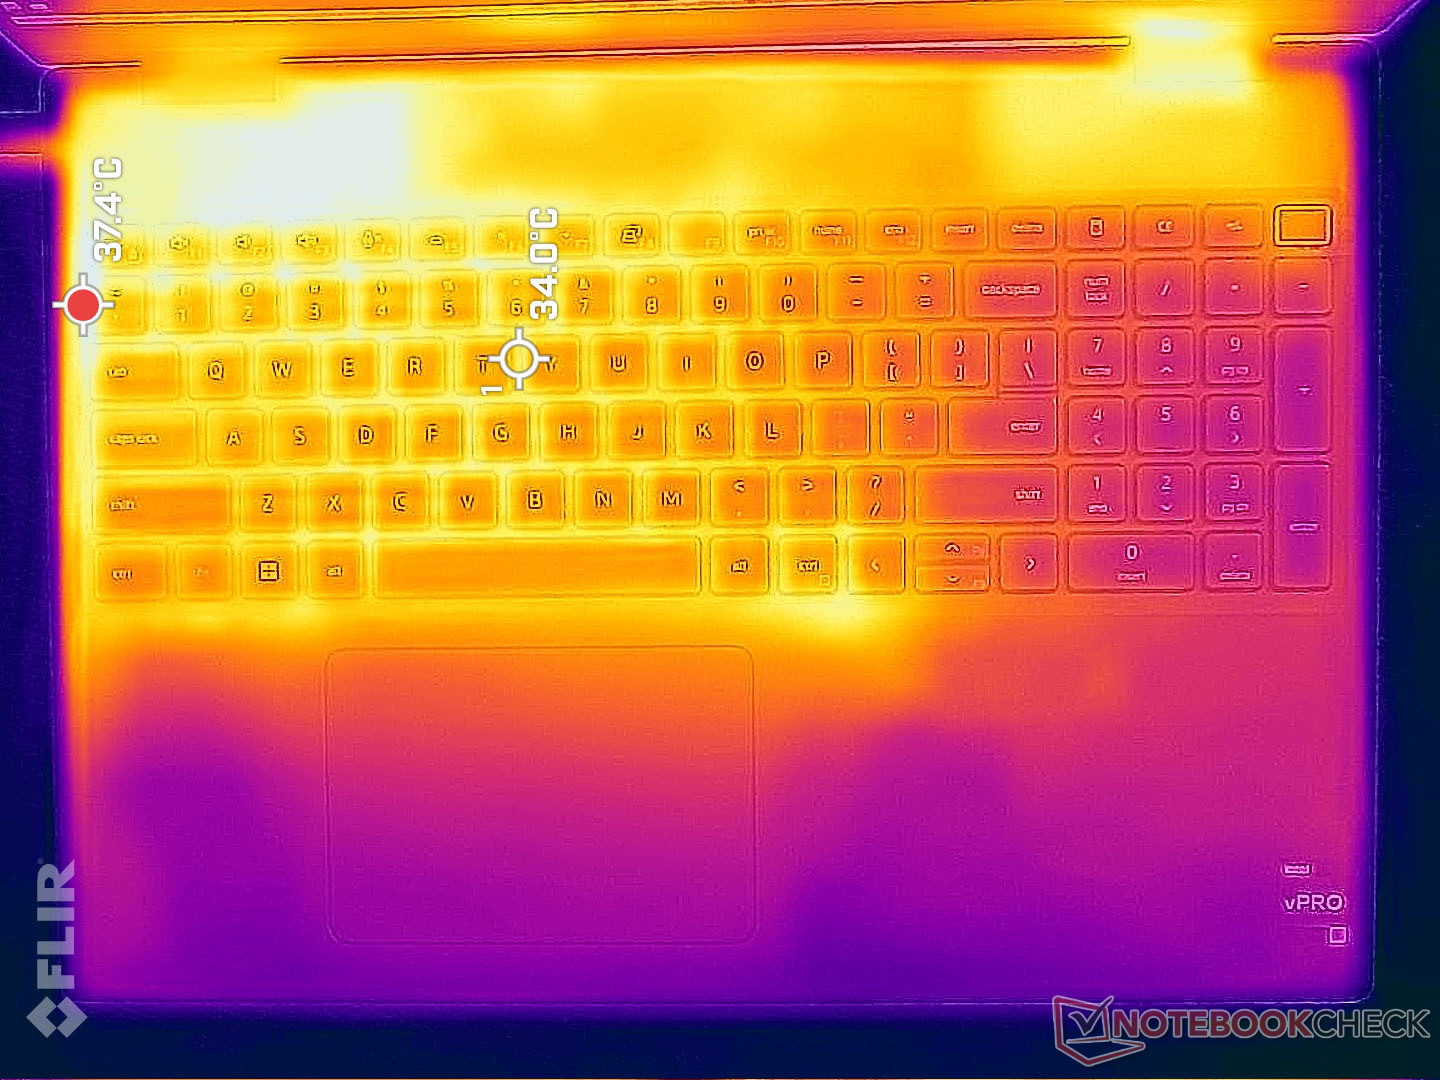
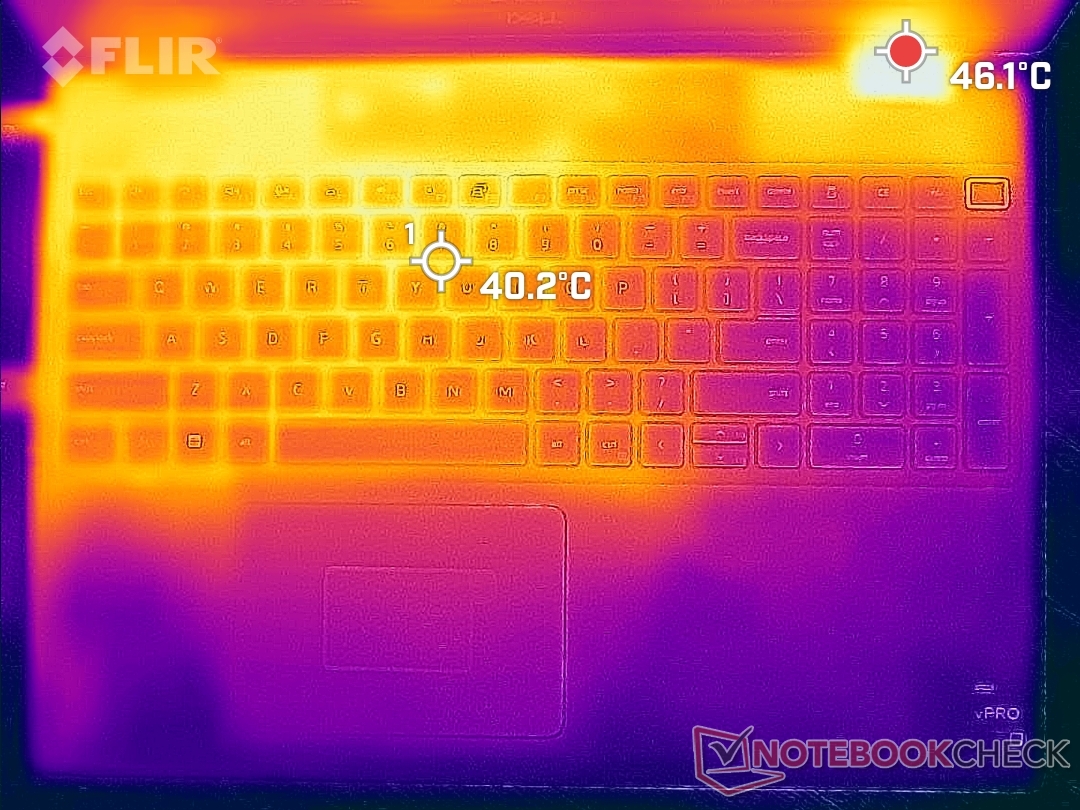
As temperaturas de superfície são de fato um pouco mais quentes do que as que registramos no site regular Precision 7670. Pontos quentes no teclado e na parte traseira quando se corre com cargas exigentes como jogos por períodos prolongados podem chegar a cerca de 40 C cada, em comparação com 35 C no modelo regular mais fino. Estes resultados correspondem às nossas medições de temperatura central na próxima seção abaixo, onde nossa CPU e GPU se estabilizariam em temperaturas mais quentes.
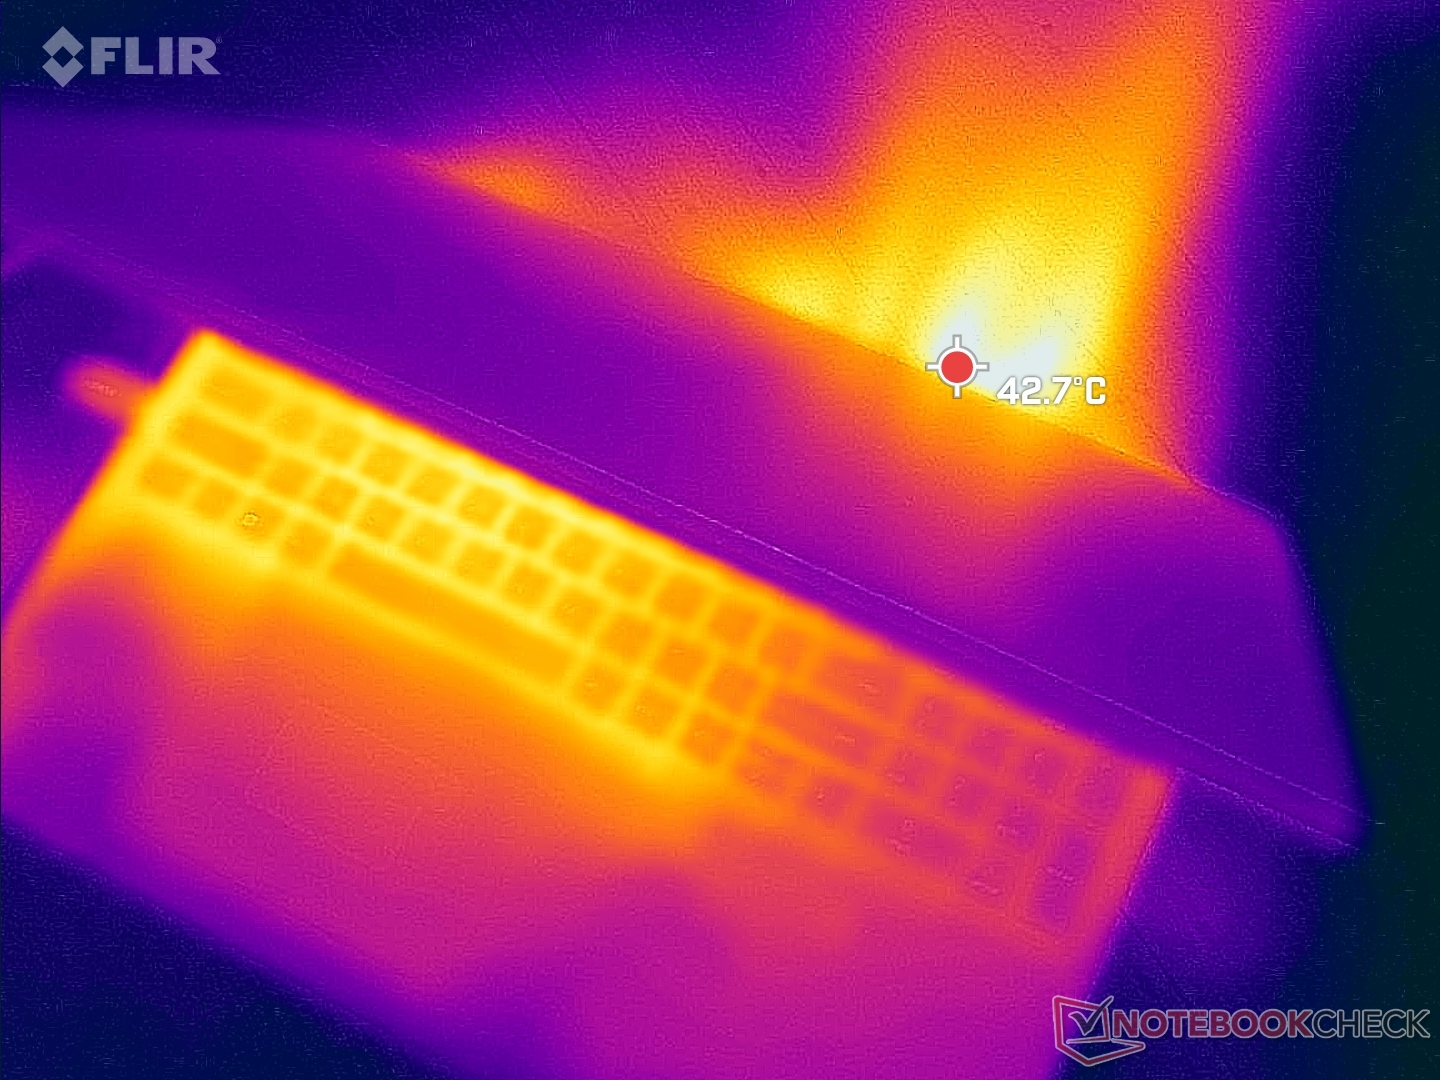
(-) A temperatura máxima no lado superior é 53 °C / 127 F, em comparação com a média de 38.2 °C / 101 F , variando de 22.2 a 69.8 °C para a classe Workstation.
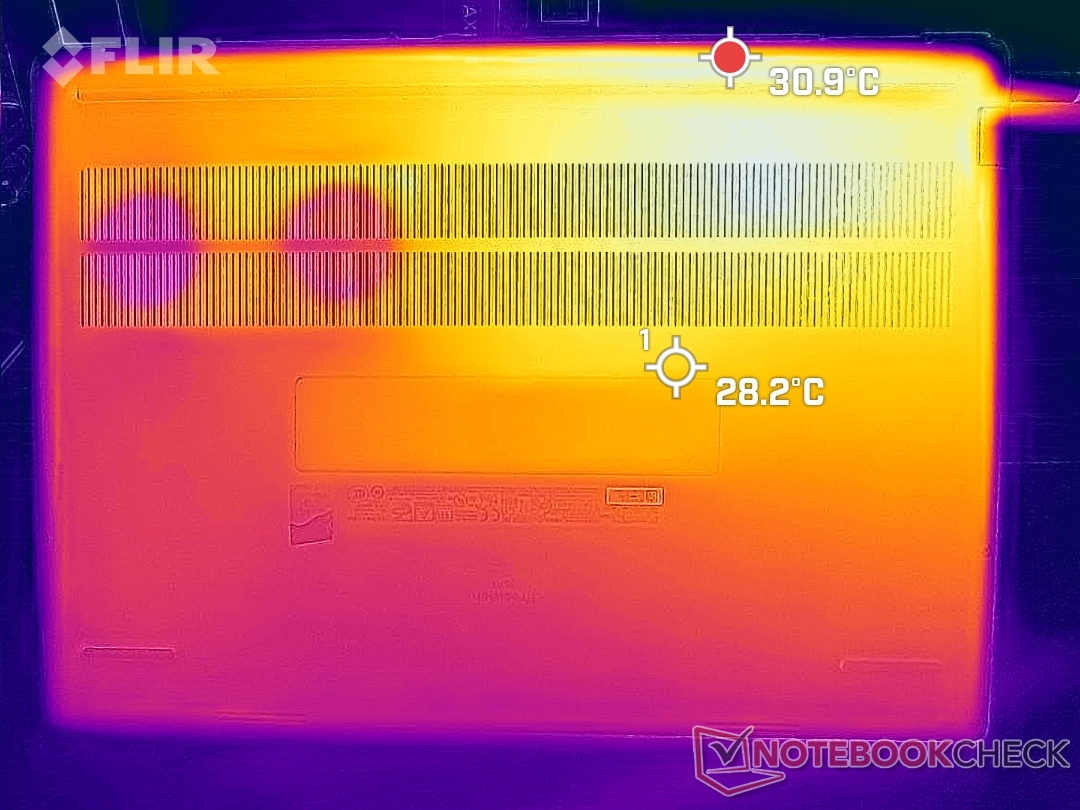
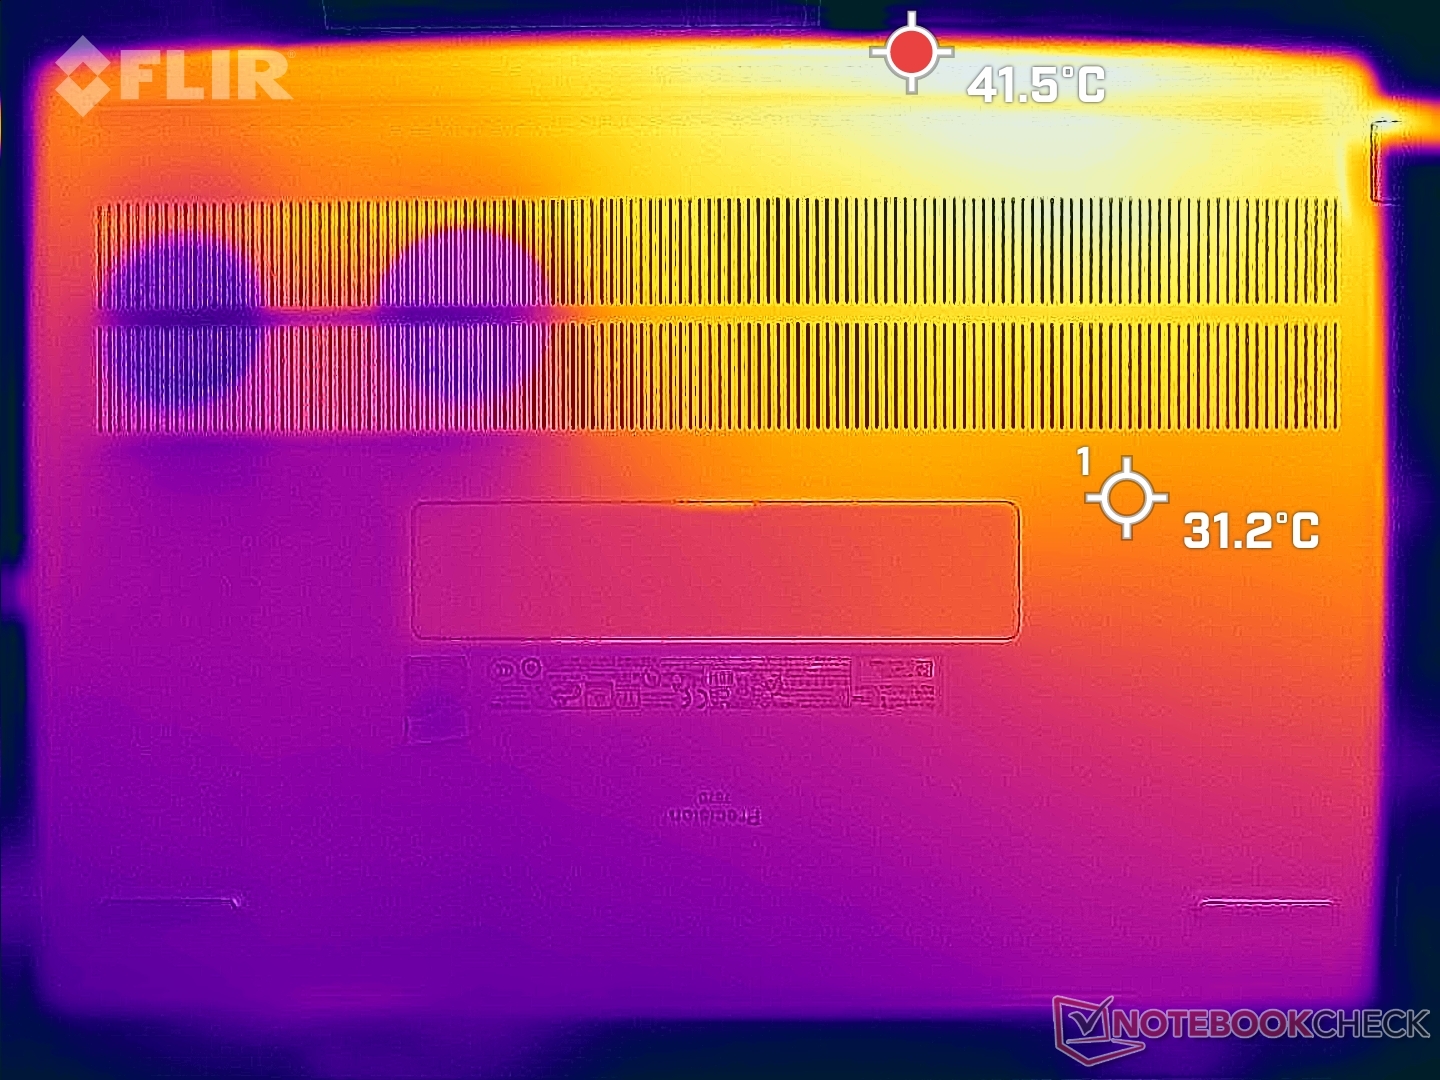
(±) A parte inferior aquece até um máximo de 43.2 °C / 110 F, em comparação com a média de 41.1 °C / 106 F
(+) Em uso inativo, a temperatura média para o lado superior é 31.8 °C / 89 F, em comparação com a média do dispositivo de 32 °C / ### class_avg_f### F.
(±) Jogando The Witcher 3, a temperatura média para o lado superior é 37 °C / 99 F, em comparação com a média do dispositivo de 32 °C / ## #class_avg_f### F.
(+) Os apoios para as mãos e o touchpad são mais frios que a temperatura da pele, com um máximo de 30.6 °C / 87.1 F e, portanto, são frios ao toque.
(-) A temperatura média da área do apoio para as mãos de dispositivos semelhantes foi 27.8 °C / 82 F (-2.8 °C / -5.1 F).
| Dell Precision 7000 7670 Performance Intel Core i9-12950HX, NVIDIA RTX A5500 Laptop GPU | MSI CreatorPro Z16P B12UKST Intel Core i7-12700H, NVIDIA RTX A3000 Laptop GPU | HP ZBook Studio 16 G9 62U04EA Intel Core i7-12800H, NVIDIA RTX A2000 Laptop GPU | HP ZBook Firefly 16 G9-6B897EA Intel Core i7-1265U, NVIDIA T550 Laptop GPU | Lenovo ThinkPad P1 G4-20Y4Z9DVUS Intel Core i7-11800H, NVIDIA T1200 Laptop GPU | Dell Precision 7670 Intel Core i7-12850HX, NVIDIA RTX A2000 Laptop GPU | |
|---|---|---|---|---|---|---|
| Heat | -2% | 9% | 8% | 7% | 4% | |
| Maximum Upper Side * (°C) | 53 | 56.3 -6% | 38.7 27% | 42.1 21% | 49.9 6% | 51 4% |
| Maximum Bottom * (°C) | 43.2 | 68.3 -58% | 53.4 -24% | 48 -11% | 56.7 -31% | 45.8 -6% |
| Idle Upper Side * (°C) | 36.8 | 25.2 32% | 27.3 26% | 29.9 19% | 25.5 31% | 31.8 14% |
| Idle Bottom * (°C) | 33.8 | 25.9 23% | 31.6 7% | 32.9 3% | 26.2 22% | 32.6 4% |
* ... menor é melhor
Teste de estresse
Ao executar Prime95 para enfatizar a CPU, as taxas de clock e a temperatura saltariam quase instantaneamente para 3,4 GHz e 99 C, respectivamente, e a uma alta absorção de energia do processador de 147 W. Esta alta de uma temperatura não é sustentável e, portanto, as taxas de clock e a temperatura cairiam rapidamente para 2,3 GHz e 78 C, respectivamente, e a uma absorção final de energia do processador de 76 W. A queda constante no potencial de Turbo Boost corresponde aos resultados de nosso teste de loop do CineBench R15 xT acima, onde as pontuações diminuiriam lentamente antes de se estabilizarem com o tempo.
Temperaturas da CPU e da GPU quando em funcionamento Witcher 3 se estabilizariam em 77 C e 82 C, respectivamente, em comparação com 70 C e 80 C no normal emagrecedor Precision 7670.
O desempenho é limitado se funcionar com energia de bateria. Fire Strike em baterias retornaria as pontuações 18901 e 9254 pontos, respectivamente, em comparação com 28197 e 26260 pontos quando em rede elétrica.
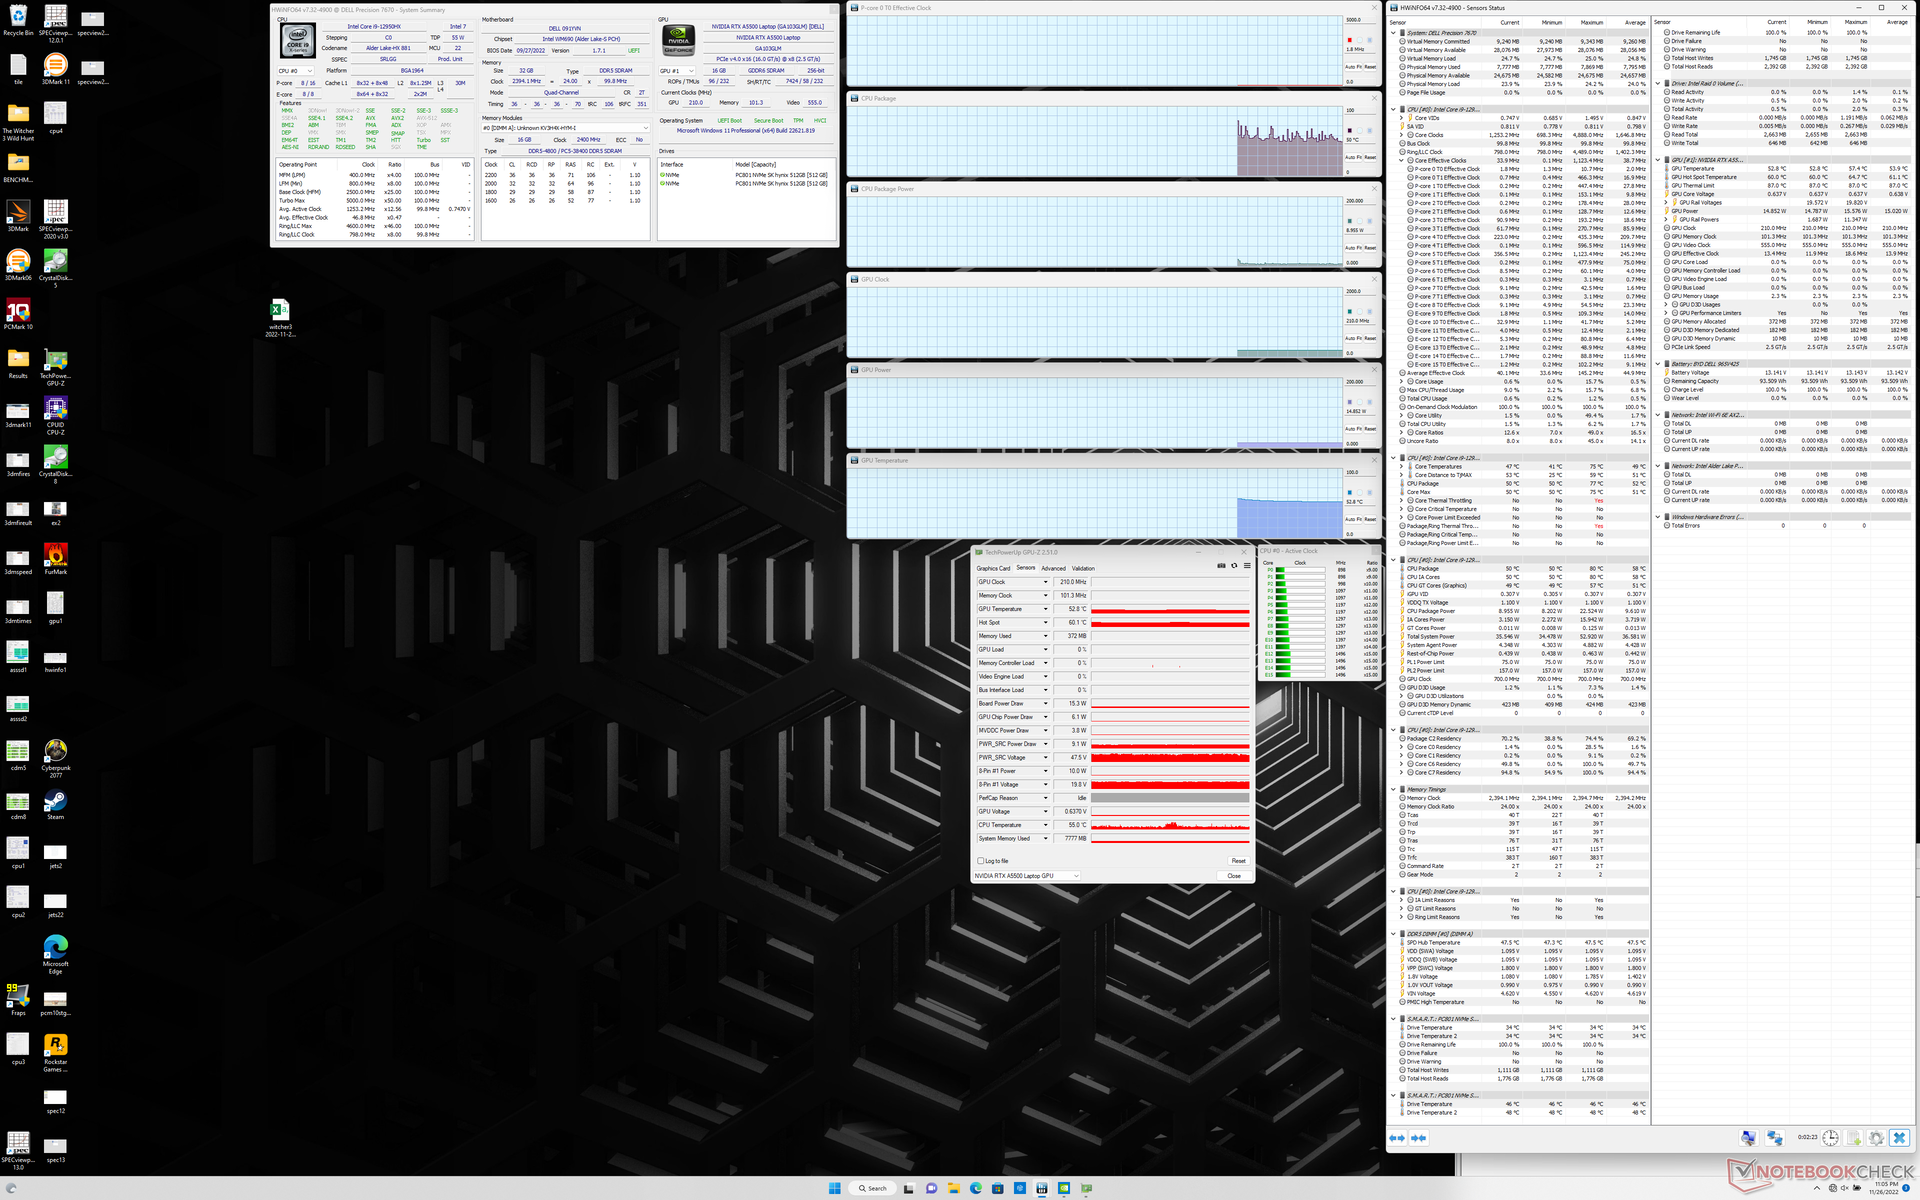
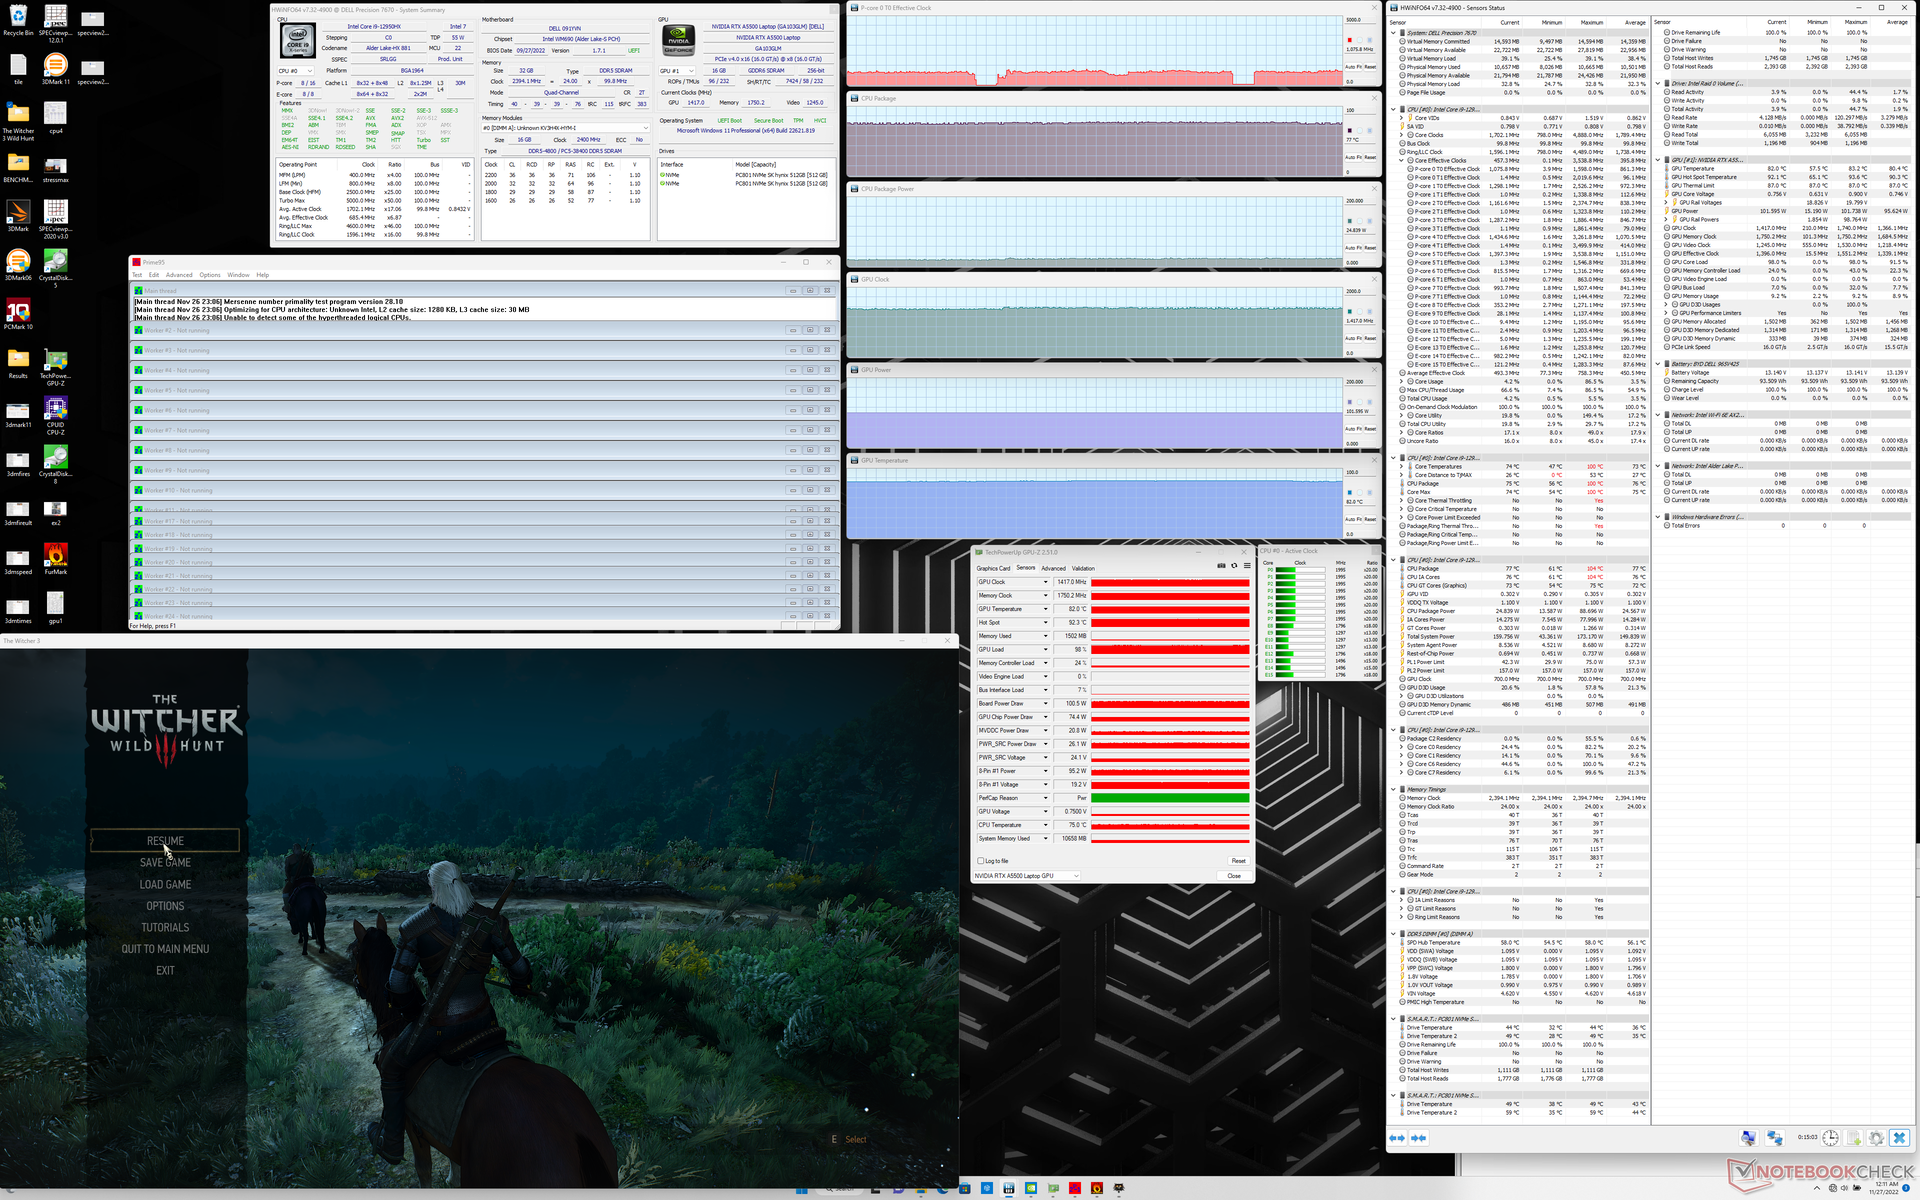
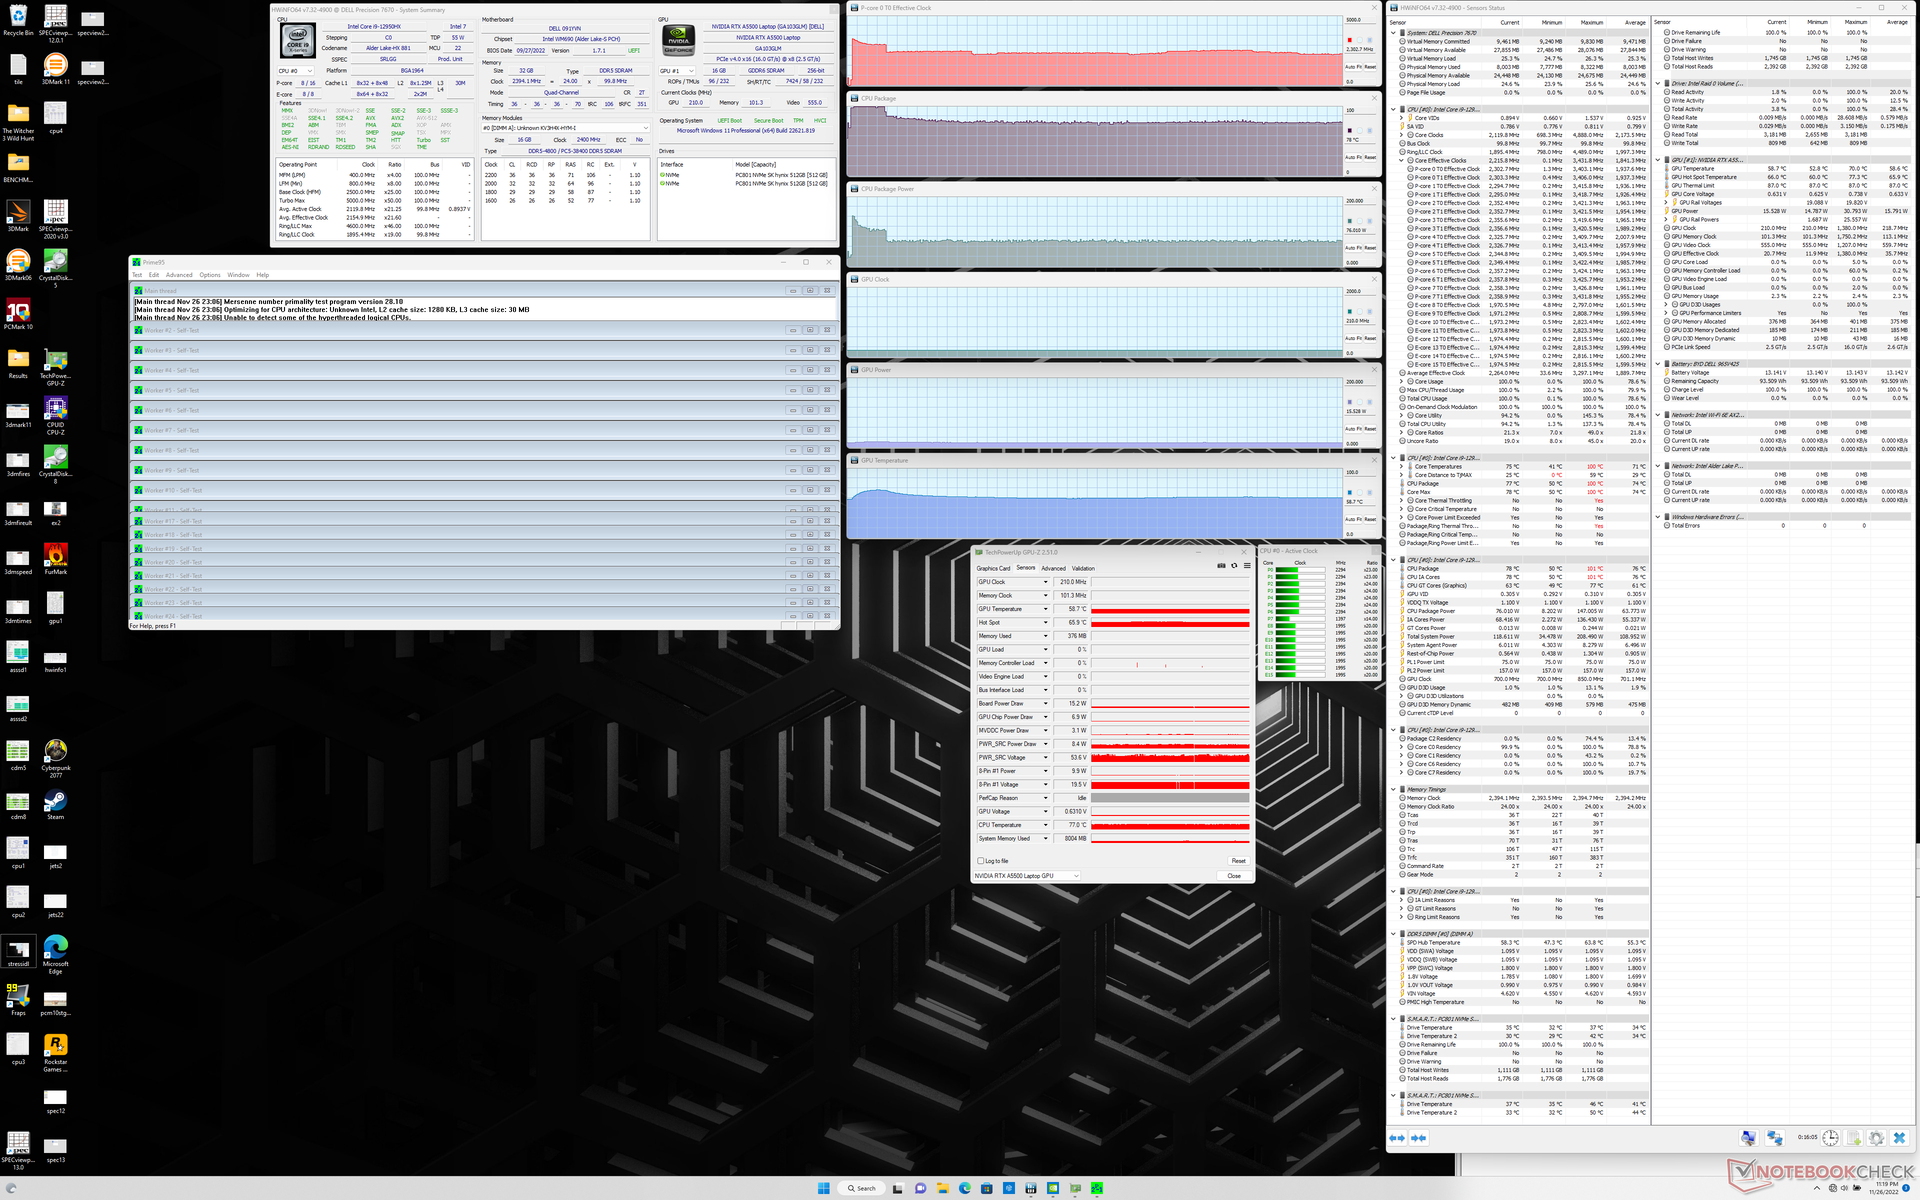
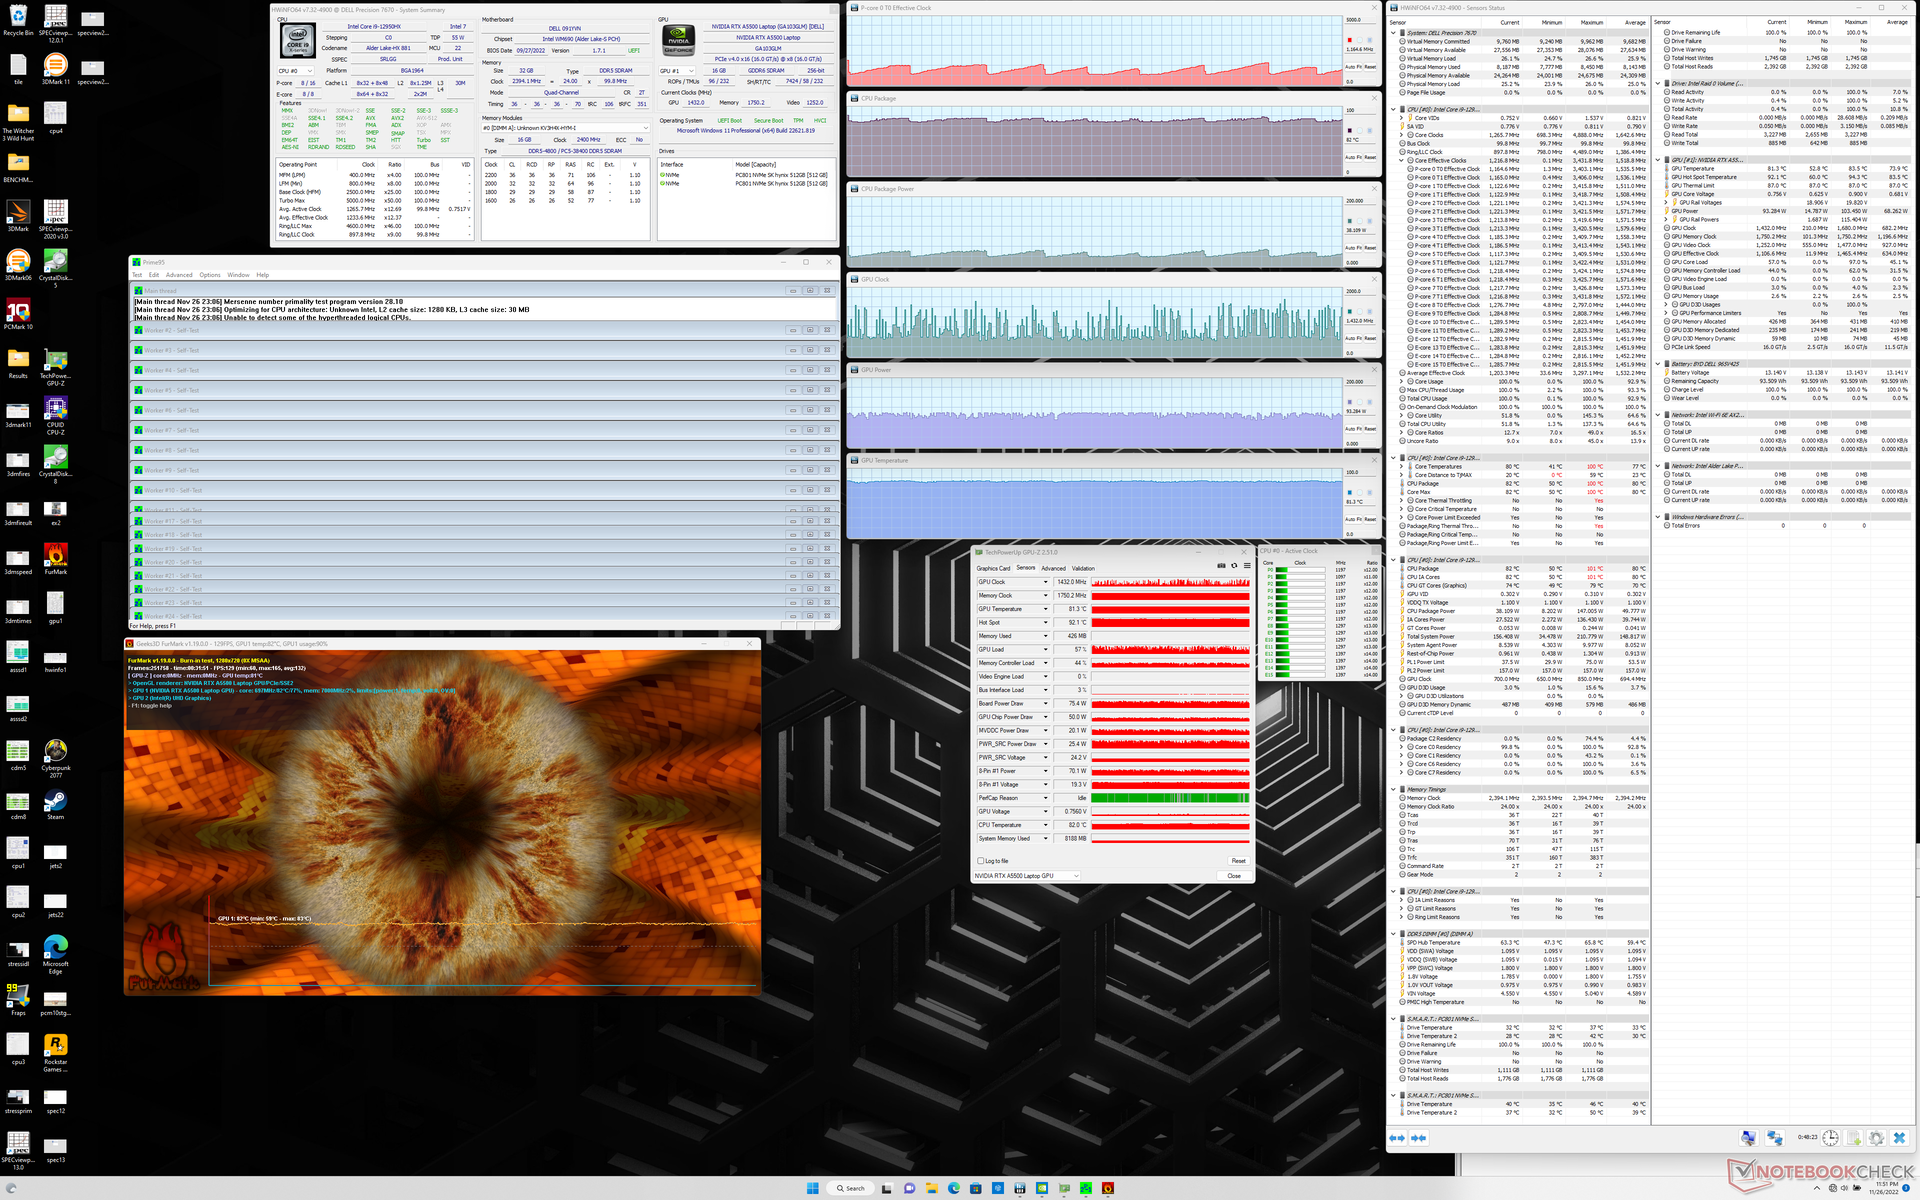
| Relógio CPU (GHz) | Relógio GPU (MHz) | Temperatura média da CPU (°C) | Temperatura média da GPU (°C) | |
| System Idle | -- | -- | 50 | 53 |
| Prime95 Stress | 2.3 | -- | 78 | 59 |
| Prime95 + FurMark Stress | 0,8 - 1,4 | 500 - 1555 | 79 - 83 | 81 |
| Witcher 3 Estresse | 1.1 | 1417 | 77 | 82 |
Oradores
Verificar o som dos alto-falantes embutidos (som, ruído, baixo, volume máximo,...) em diferentes gêneros musicais / telefonia, comparar dentro da categoria de dispositivos, características especiais (software),... Como os dispositivos de áudio externo podem ser conectados? Teste as interfaces de som, quando apropriado. Analisar a tabela de ruído rosa.
Breve revisão:Analise o alto-falante. cerca de 250 caracteres
Dell Precision 7000 7670 Performance análise de áudio
(+) | os alto-falantes podem tocar relativamente alto (###valor### dB)
Graves 100 - 315Hz
(-) | quase nenhum baixo - em média 15.1% menor que a mediana
(±) | a linearidade dos graves é média (7.1% delta para a frequência anterior)
Médios 400 - 2.000 Hz
(+) | médios equilibrados - apenas 2.9% longe da mediana
(+) | médios são lineares (3.7% delta para frequência anterior)
Altos 2 - 16 kHz
(+) | agudos equilibrados - apenas 3.5% longe da mediana
(+) | os máximos são lineares (1.6% delta da frequência anterior)
Geral 100 - 16.000 Hz
(+) | o som geral é linear (10.4% diferença em relação à mediana)
Comparado com a mesma classe
» 6% de todos os dispositivos testados nesta classe foram melhores, 6% semelhantes, 88% piores
» O melhor teve um delta de 7%, a média foi 17%, o pior foi 35%
Comparado com todos os dispositivos testados
» 5% de todos os dispositivos testados foram melhores, 1% semelhantes, 93% piores
» O melhor teve um delta de 4%, a média foi 23%, o pior foi 134%
Apple MacBook Pro 16 2021 M1 Pro análise de áudio
(+) | os alto-falantes podem tocar relativamente alto (###valor### dB)
Graves 100 - 315Hz
(+) | bons graves - apenas 3.8% longe da mediana
(+) | o baixo é linear (5.2% delta para a frequência anterior)
Médios 400 - 2.000 Hz
(+) | médios equilibrados - apenas 1.3% longe da mediana
(+) | médios são lineares (2.1% delta para frequência anterior)
Altos 2 - 16 kHz
(+) | agudos equilibrados - apenas 1.9% longe da mediana
(+) | os máximos são lineares (2.7% delta da frequência anterior)
Geral 100 - 16.000 Hz
(+) | o som geral é linear (4.6% diferença em relação à mediana)
Comparado com a mesma classe
» 0% de todos os dispositivos testados nesta classe foram melhores, 0% semelhantes, 100% piores
» O melhor teve um delta de 5%, a média foi 17%, o pior foi 45%
Comparado com todos os dispositivos testados
» 0% de todos os dispositivos testados foram melhores, 0% semelhantes, 100% piores
» O melhor teve um delta de 4%, a média foi 23%, o pior foi 134%
Gestão de energia
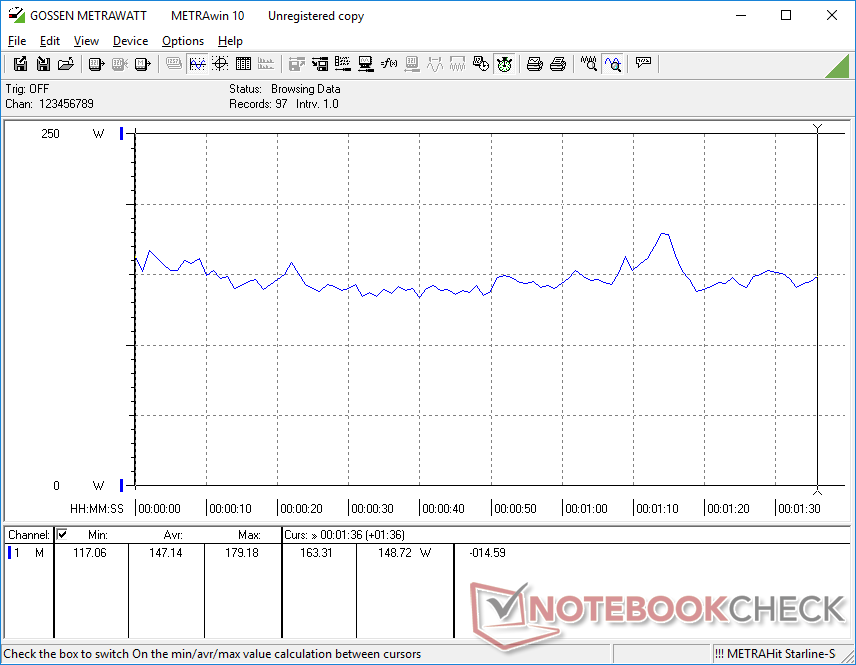
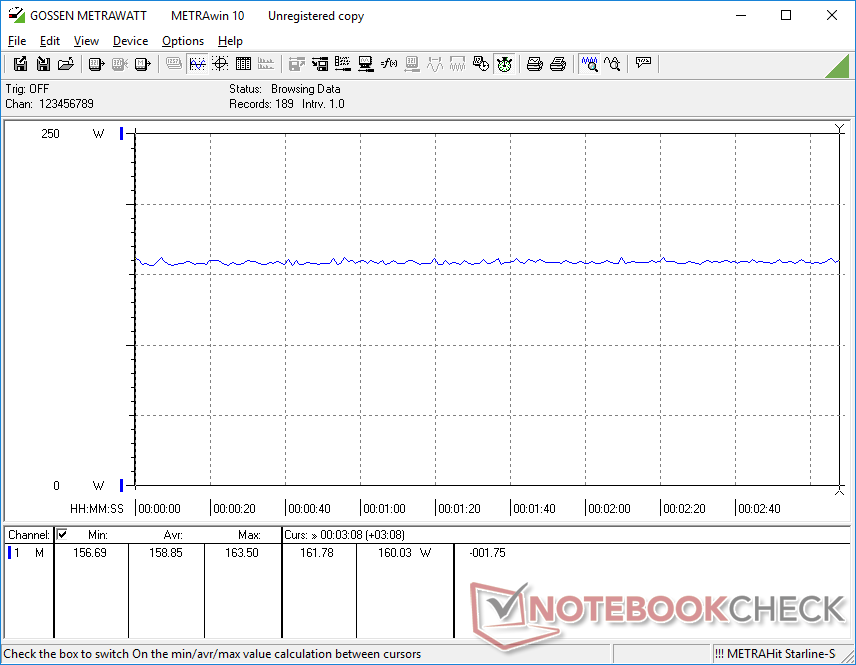
Consumo de energia
O regular Precision 7670 já é uma máquina faminta de energia e o Precision 7670 Performance é ainda mais. Simplesmente ociosa na área de trabalho exige entre 16 W e 47 W, dependendo do nível de brilho, perfil de potência e das cores OLED na tela. A maioria das outras estações de trabalho normalmente pairam na faixa média de 15 W em comparação
Ao rodar cargas exigentes como jogos, nossa unidade empataria cerca de 159 W em comparação com 134 W no normal Precision 7670. O aumento de 19 por cento no consumo de energia é relativamente pequeno considerando o aumento de 70 a 80 por cento no potencial gráfico sobre o Quadro A2000
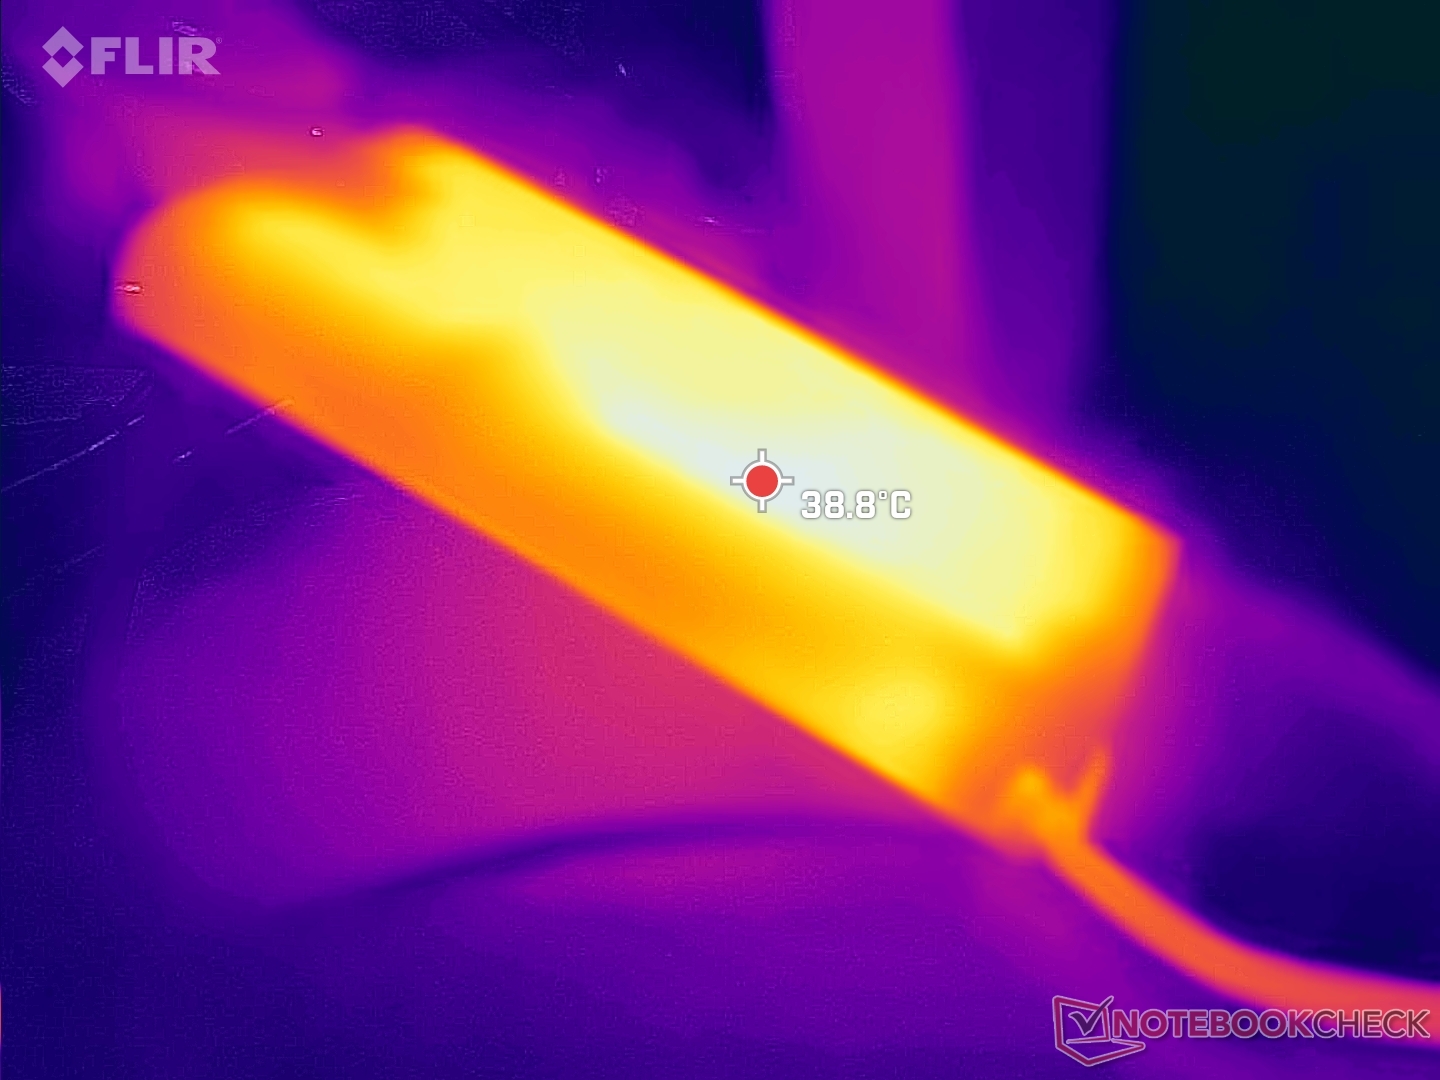
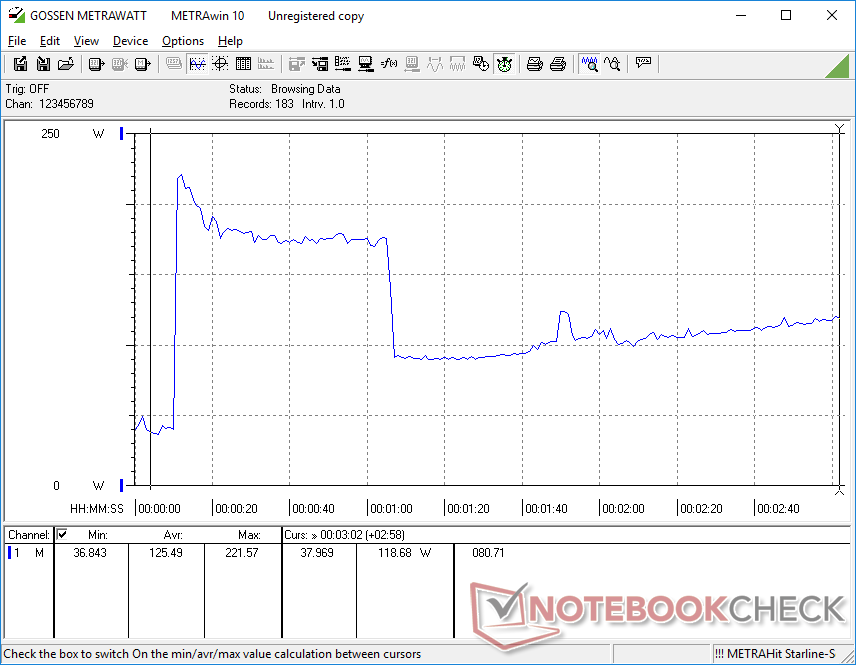
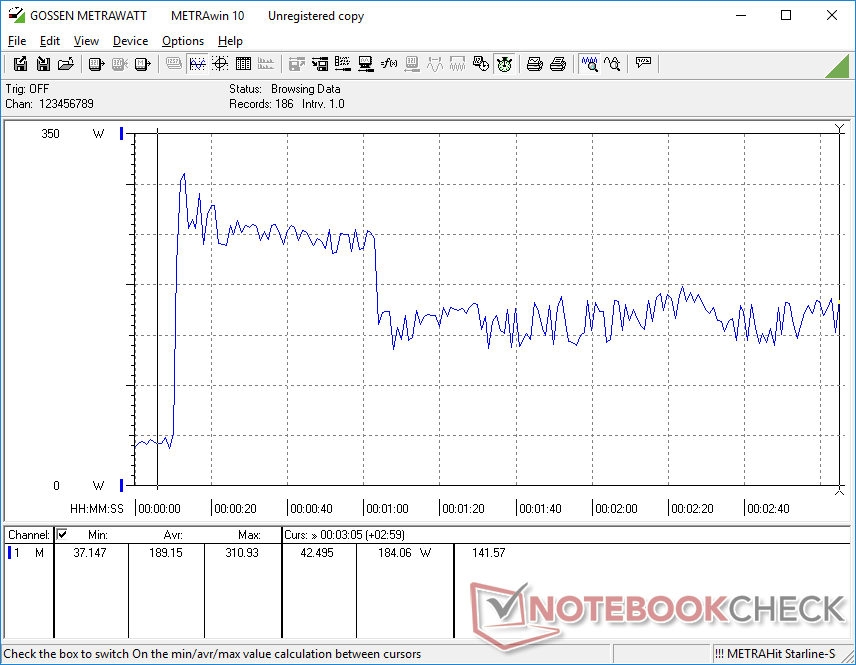
Um adaptador de 240 W AC de tamanho médio (~15,2 x 7,8 x 2,3 cm) está incluído, enquanto que o regular Precision 7670 é fornecido com um adaptador AC menor de 180 W. Somos capazes de registrar um consumo máximo temporário de 311 W do adaptador quando tanto a CPU quanto a GPU estiverem em 100% de utilização, como mostrado pelas telas abaixo. Isto sugere tanto um desempenho Turbo Boost limitado quanto um adaptador potencialmente subaproveitado, dado o quão exigentes os internos podem ser.
| desligado | |
| Ocioso | |
| Carga |
|
Key:
min: | |
| Dell Precision 7000 7670 Performance i9-12950HX, RTX A5500 Laptop GPU, , OLED, 3840x2400, 16" | MSI CreatorPro Z16P B12UKST i7-12700H, RTX A3000 Laptop GPU, Samsung PM9A1 MZVL21T0HCLR, IPS, 2560x1600, 16" | HP ZBook Studio 16 G9 62U04EA i7-12800H, RTX A2000 Laptop GPU, Micron 3400 1TB MTFDKBA1T0TFH, IPS, 3840x2400, 16" | HP ZBook Firefly 16 G9-6B897EA i7-1265U, T550 Laptop GPU, Samsung PM9A1 MZVL21T0HCLR, IPS, 1920x1200, 16" | Lenovo ThinkPad P1 G4-20Y4Z9DVUS i7-11800H, T1200 Laptop GPU, Samsung PM9A1 MZVL2512HCJQ, IPS, 2560x1600, 16" | Dell Precision 7670 i7-12850HX, RTX A2000 Laptop GPU, SK Hynix HFS001TEJ9X115N, OLED, 3840x2400, 16" | MSI WE76 11UM-456 i9-11980HK, RTX A5000 Laptop GPU, Samsung PM9A1 MZVL22T0HBLB, IPS, 3840x2160, 17.3" | |
|---|---|---|---|---|---|---|---|
| Power Consumption | 37% | 44% | 73% | 48% | 36% | 19% | |
| Idle Minimum * (Watt) | 16.4 | 10.8 34% | 7.2 56% | 4.5 73% | 9.9 40% | 7.5 54% | 10.5 36% |
| Idle Average * (Watt) | 35.9 | 16.3 55% | 18.1 50% | 8 78% | 13.9 61% | 9.5 74% | 18.6 48% |
| Idle Maximum * (Watt) | 47 | 16.9 64% | 18.5 61% | 8.7 81% | 14.6 69% | 28.4 40% | 20 57% |
| Load Average * (Watt) | 147.1 | 111.7 24% | 112.8 23% | 48.3 67% | 95 35% | 139.1 5% | 132.4 10% |
| Witcher 3 ultra * (Watt) | 158.8 | 152.1 4% | 106.7 33% | 45.3 71% | 98.9 38% | 134 16% | 232 -46% |
| Load Maximum * (Watt) | 311 | 177.4 43% | 186 40% | 94.7 70% | 170.8 45% | 220.8 29% | 281.6 9% |
* ... menor é melhor
Power Consumption Witcher 3 / Stresstest
Power Consumption external Monitor
Vida útil da bateria
A capacidade da bateria é ligeiramente maior desta vez aos 93 Wh em comparação com os 83 Wh no mais fino Precision 7670. Apesar disso, o tempo de execução da WLAN é menor em quase uma hora em nosso modelo Performance devido aos internos mais potentes.
A carga de capacidade vazia a plena permanece lenta em cerca de 2,5 horas.
| Dell Precision 7000 7670 Performance i9-12950HX, RTX A5500 Laptop GPU, 93 Wh | MSI CreatorPro Z16P B12UKST i7-12700H, RTX A3000 Laptop GPU, 90 Wh | HP ZBook Studio 16 G9 62U04EA i7-12800H, RTX A2000 Laptop GPU, 86 Wh | HP ZBook Firefly 16 G9-6B897EA i7-1265U, T550 Laptop GPU, 76 Wh | Lenovo ThinkPad P1 G4-20Y4Z9DVUS i7-11800H, T1200 Laptop GPU, 90 Wh | Dell Precision 7670 i7-12850HX, RTX A2000 Laptop GPU, 83 Wh | |
|---|---|---|---|---|---|---|
| Duração da bateria | 23% | 34% | 177% | 87% | 26% | |
| WiFi v1.3 (h) | 4.7 | 5.8 23% | 6.3 34% | 13 177% | 8.8 87% | 5.9 26% |
| H.264 (h) | 8.5 | 18.4 | ||||
| Load (h) | 1.1 | 2 | 1.3 | |||
| Reader / Idle (h) | 7.9 |
Pro
Contra
Veredicto
O desempenho Precision 7670 é apenas um pouco mais grosso e pesado que o norma Precision 7670mas oferece cerca de 10% e 80% mais rápido desempenho de CPU e GPU, respectivamente, do que o modelo padrão se configurado com as mais altas opções de processador. Se você não pretende explorar as vantagens da GPU em particular, então há poucos motivos para possuir o modelo de Performance sobre o modelo padrão, já que as outras vantagens são relativamente menores.
O Precision 7670 Performance oferece quando se trata de opções e recursos de processador de alta qualidade. No entanto, o potencial limitado do Turbo Boost, as altas temperaturas do núcleo e os problemas de latência do DPC são um tanto decepcionantes de se ver.
Há muito espaço para melhorias no que diz respeito ao desempenho geral. Apesar de ser o modelo de desempenho mais espesso, as temperaturas do núcleo não são melhores do que no modelo padrão. Conseqüentemente, o CPU Turbo Boost dura muito menos do que o previsto, o que o público alvo entusiasta pode não apreciar. As altas latências do DPC, o desempenho irregular do WiFi, o alto consumo de energia em inatividade e o adaptador AC subdimensionado são outros problemas que não deveriam acontecer em uma estação de trabalho profissional como esta.
Preço e Disponibilidade
A Dell está agora enviando o Precision 7670 Performance começando em $5300 USD para a configuração de base até mais de $7000 USD quando configurado com a mesma CPU e GPU que nossa unidade de teste.
Dell Precision 7000 7670 Performance
- 12/03/2022 v7 (old)
Allen Ngo
Price comparison

