LG Gram 14T90P revisão de conversível: A Lenovo Yoga e HP Spectre challenger
O 16:10 LG Gram 14T90P sucede à geração mais antiga 16:9 Gram 14T90N introduzindo opções mais rápidas de processadores Intel 11th gen e um novo design de chassis para ser uma atualização completa da série. Como todos os outros modelos Gram, o Gram 14T90P tem como objetivo maximizar a qualidade de exibição e, ao mesmo tempo, minimizar o peso para ser um dos laptops mais leves da série Core U para sua categoria de tamanho.
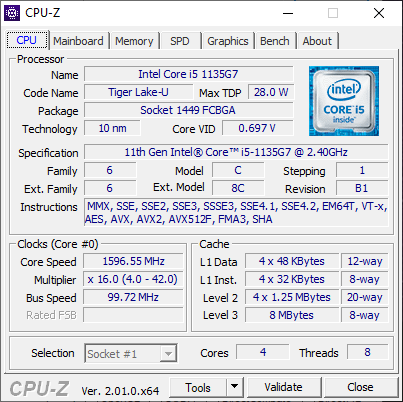
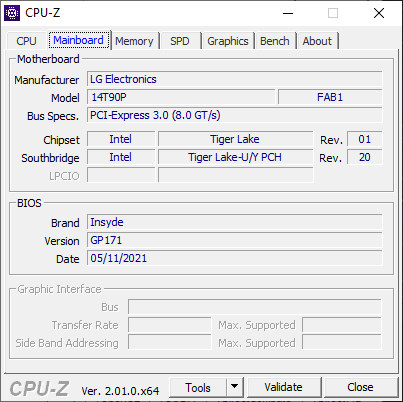
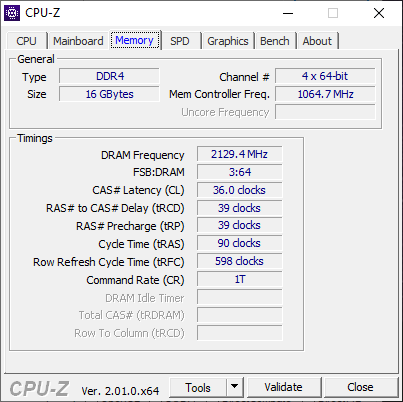
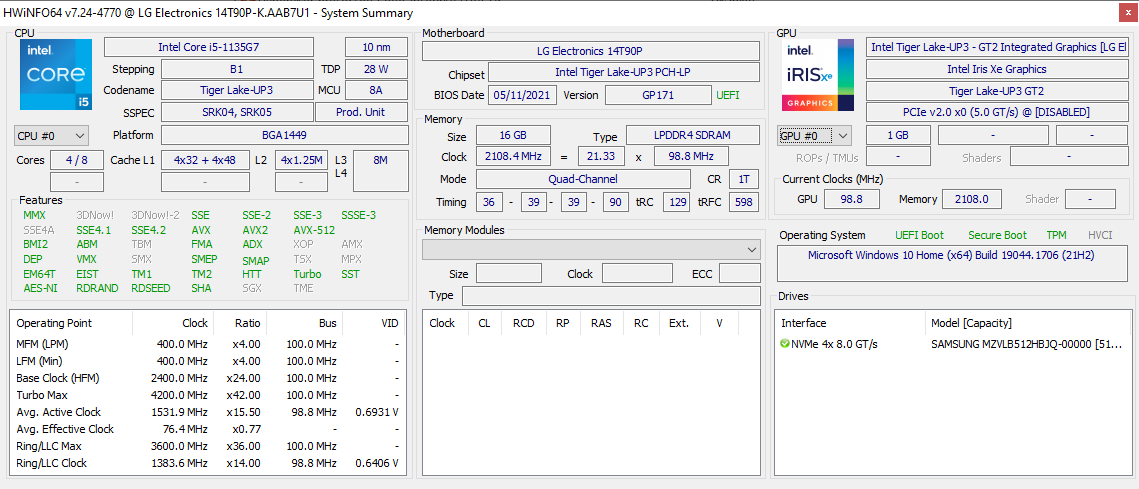
Nossa unidade em revisão foi configurada com a CPU Core i5-1135G7, 16 GB de RAM soldada, 512 GB NVMe SSD, e uma tela sensível ao toque IPS de 14 polegadas de 1200p por aproximadamente US$ 1000 a US$ 1100 de varejo. Outras SKUs estão disponíveis com o Core i7-1165G7, mas todas vêm com o mesmo painel de 1200p.
Os concorrentes diretos neste espaço incluem outros sub-portáteis de alta qualidade conversíveis como o Asus Zenbook Flip 14, HP Spectre x360 14, Dell XPS 13 2 em 1, MSI Summit E13 Flipou Lenovo Yoga 9 14.
Mais análises da LG:
Potenciais Concorrentes em Comparação
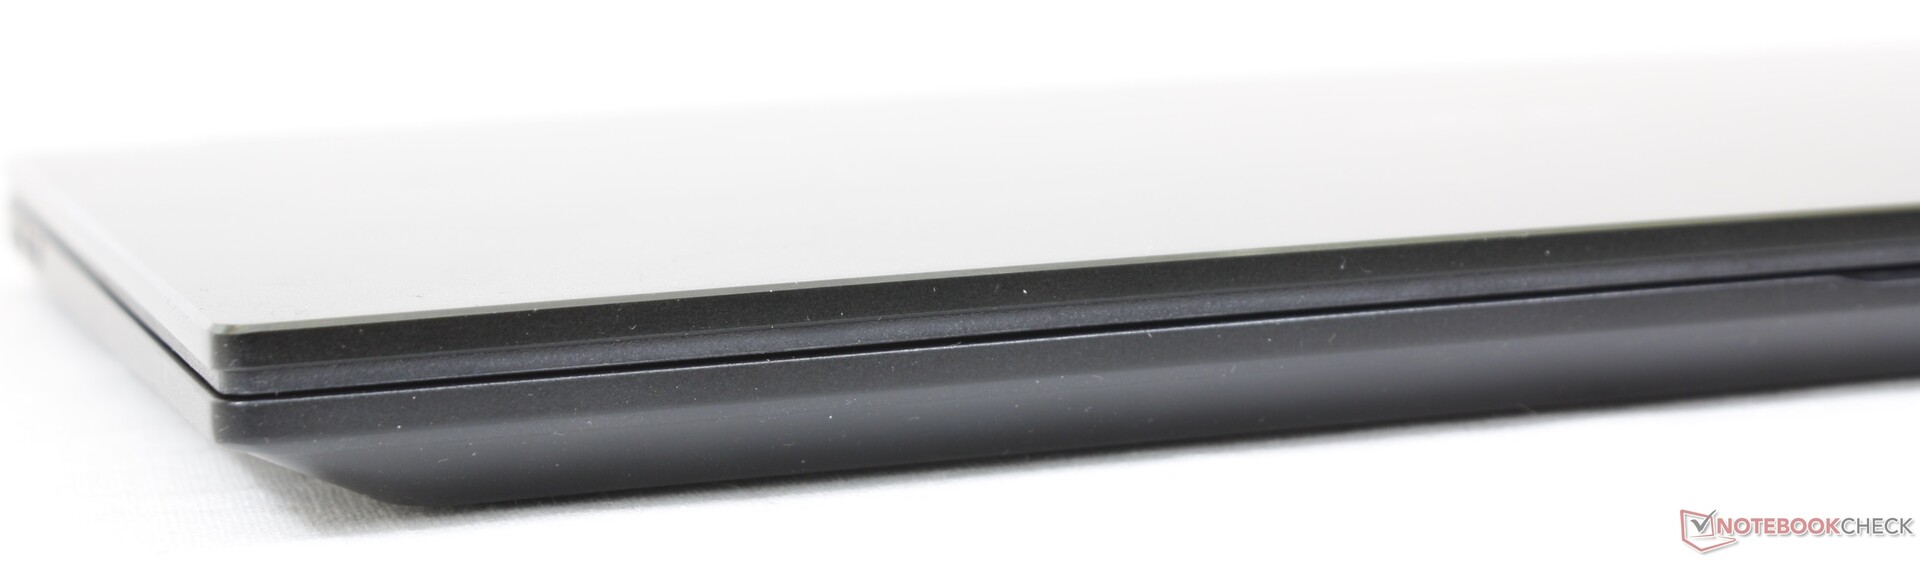
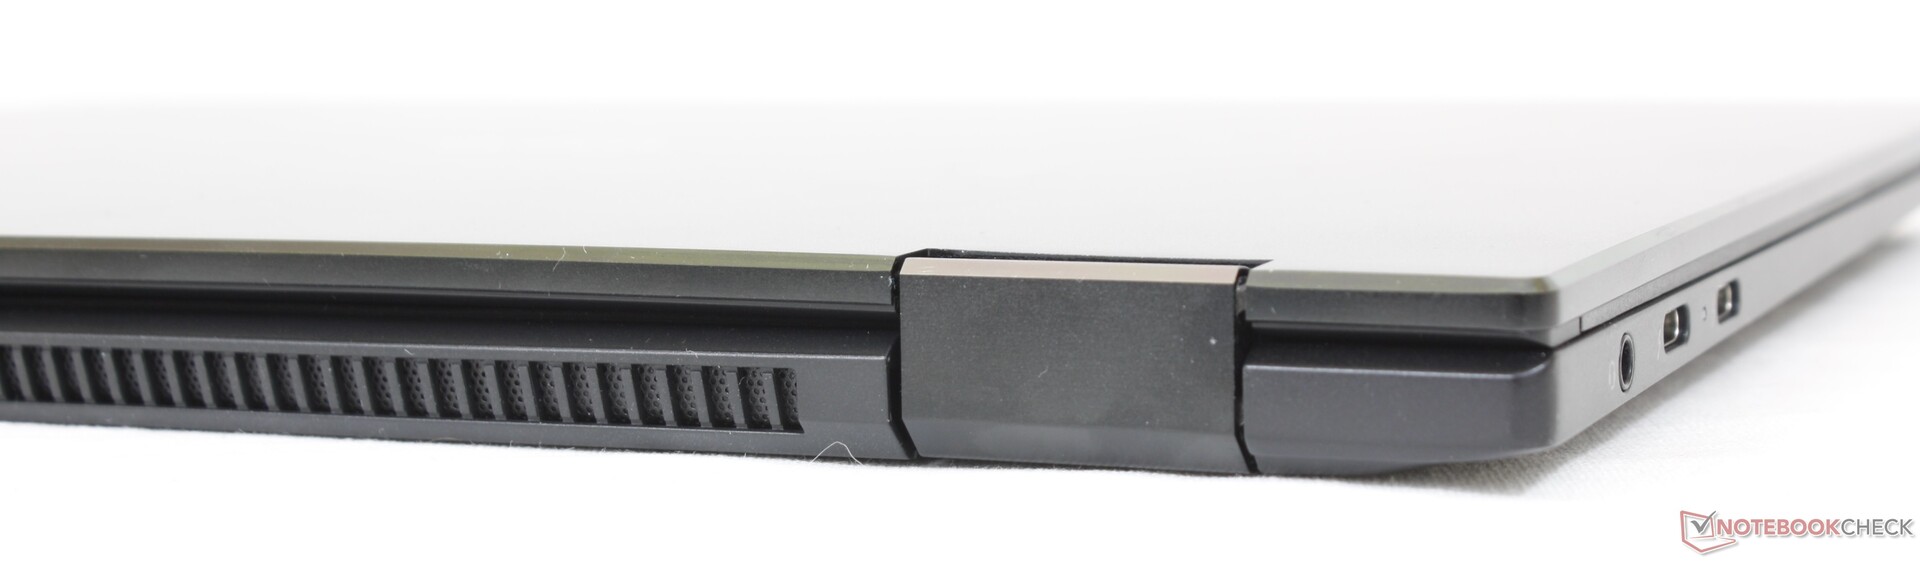
Estojo - Atualização significativa a partir do desenho mais antigo
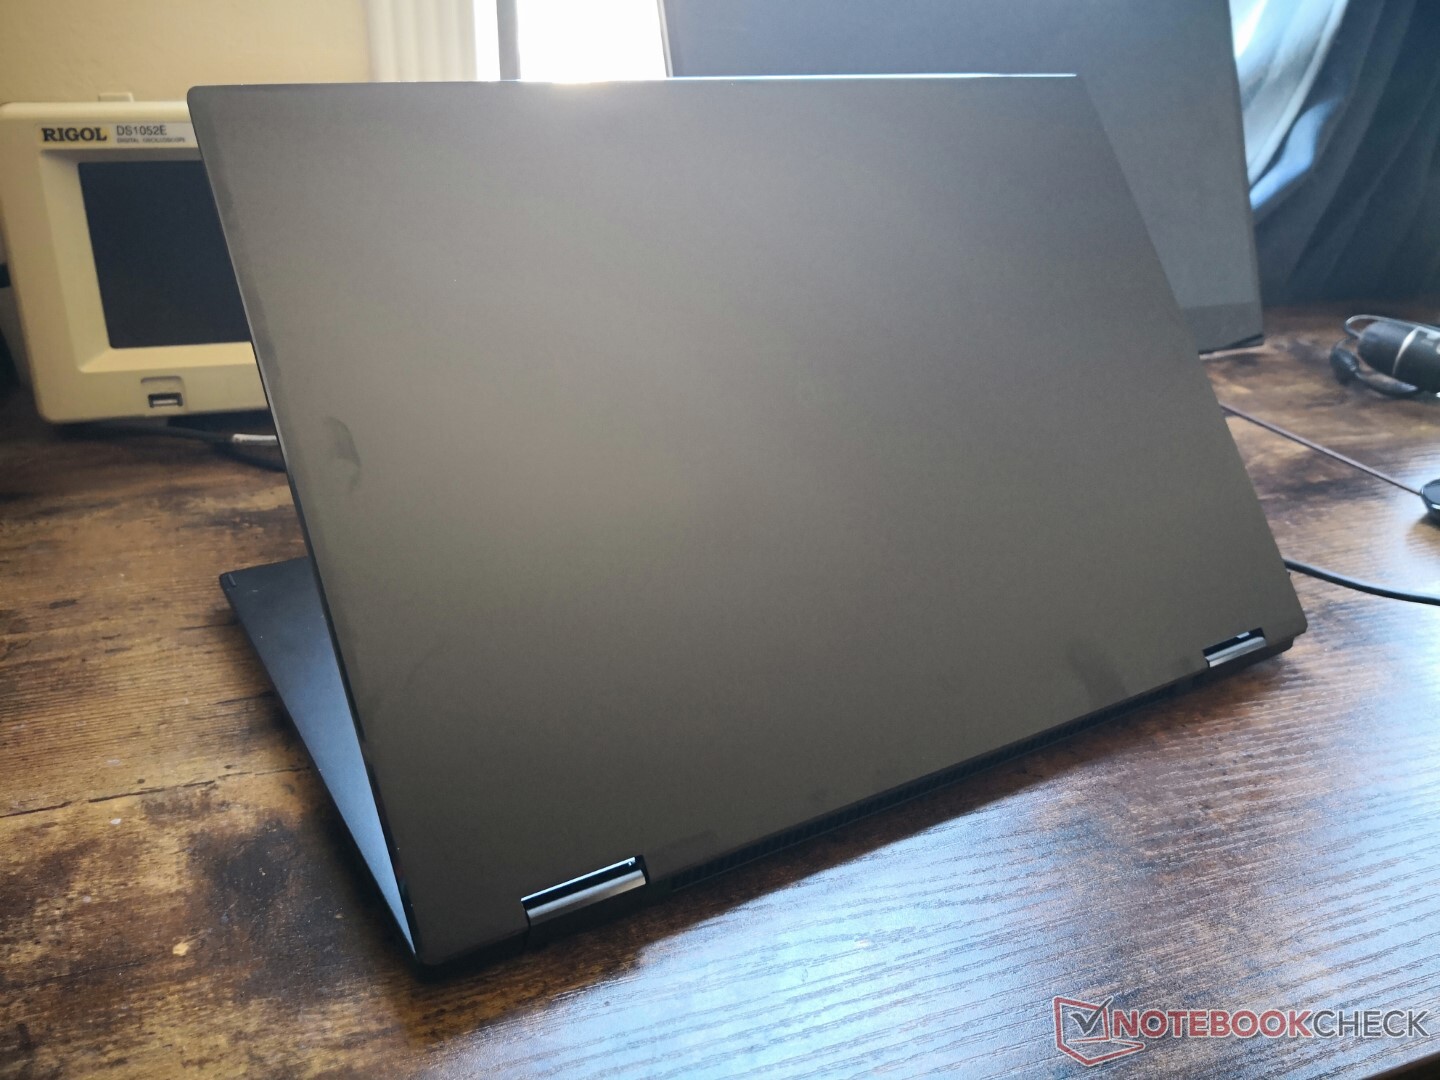
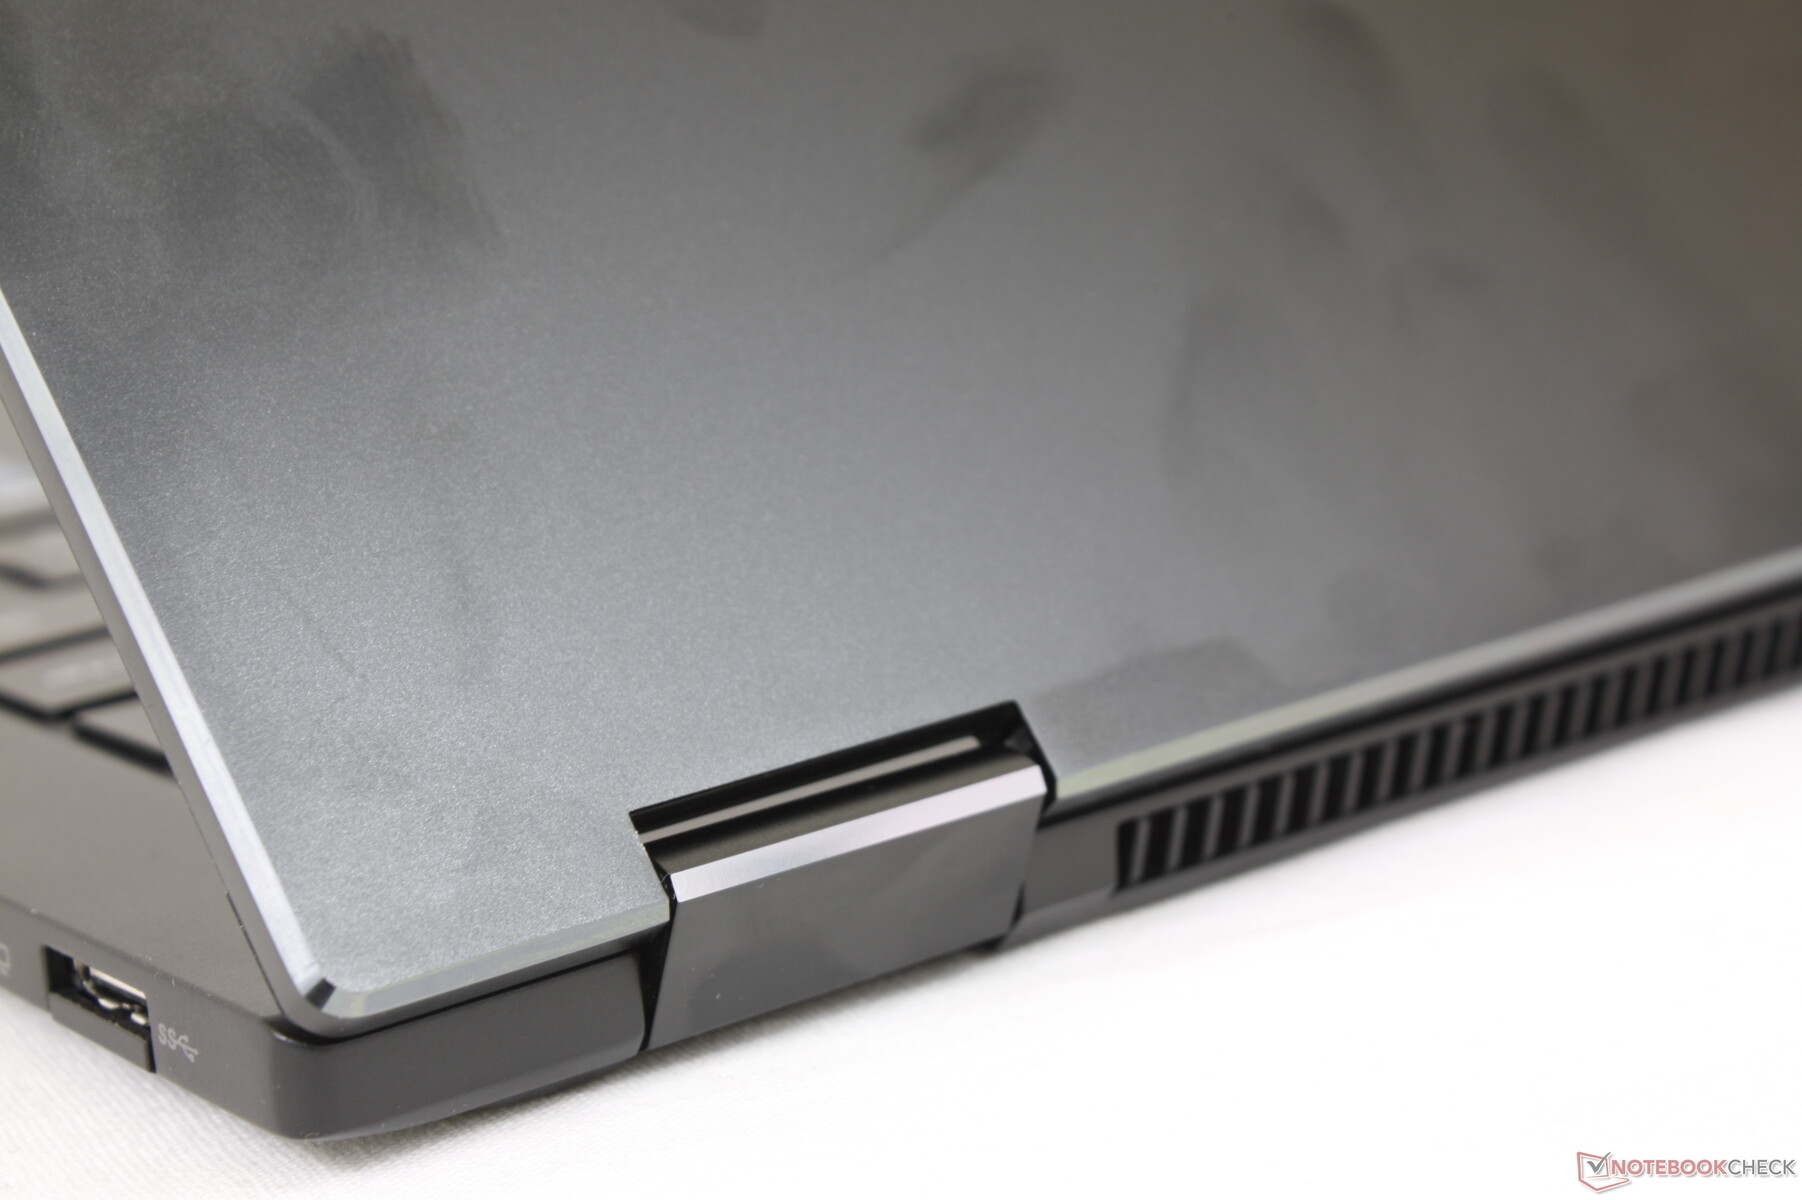
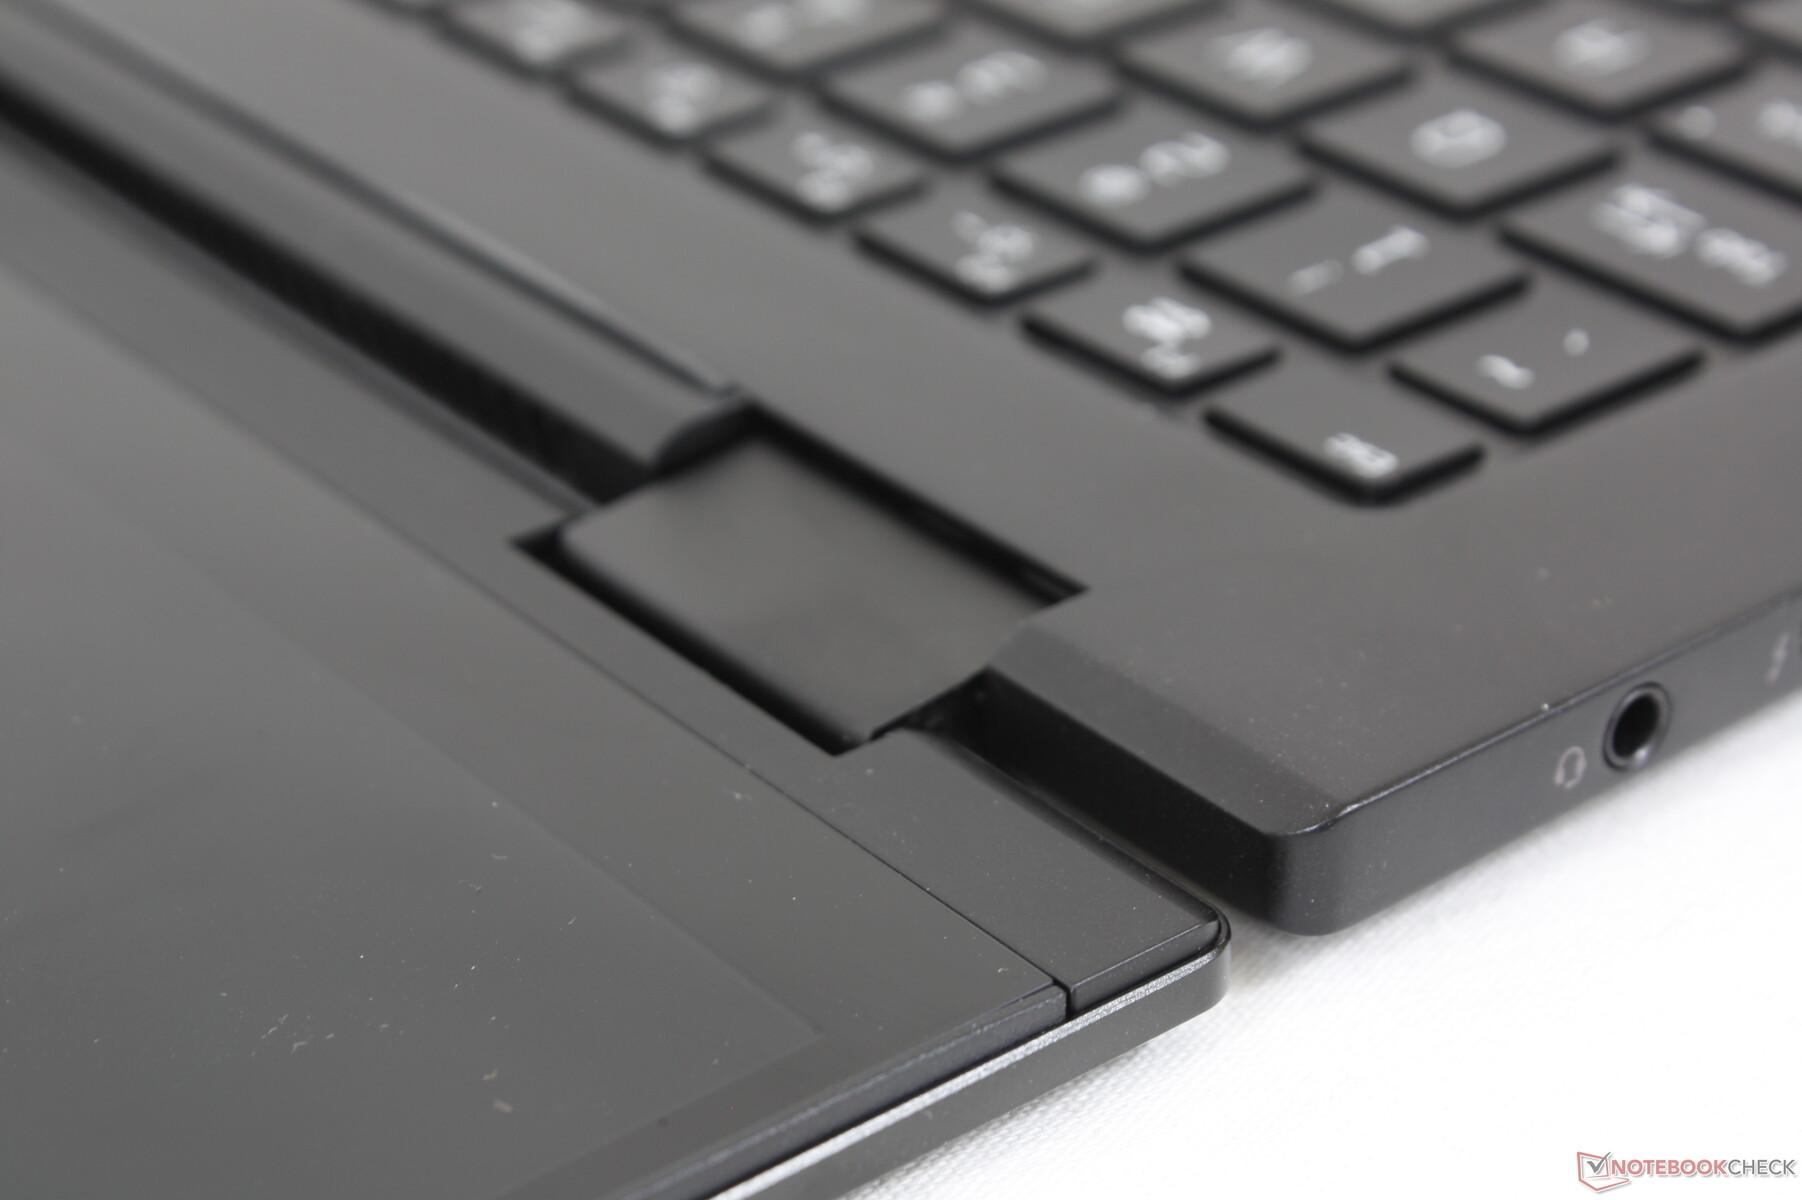
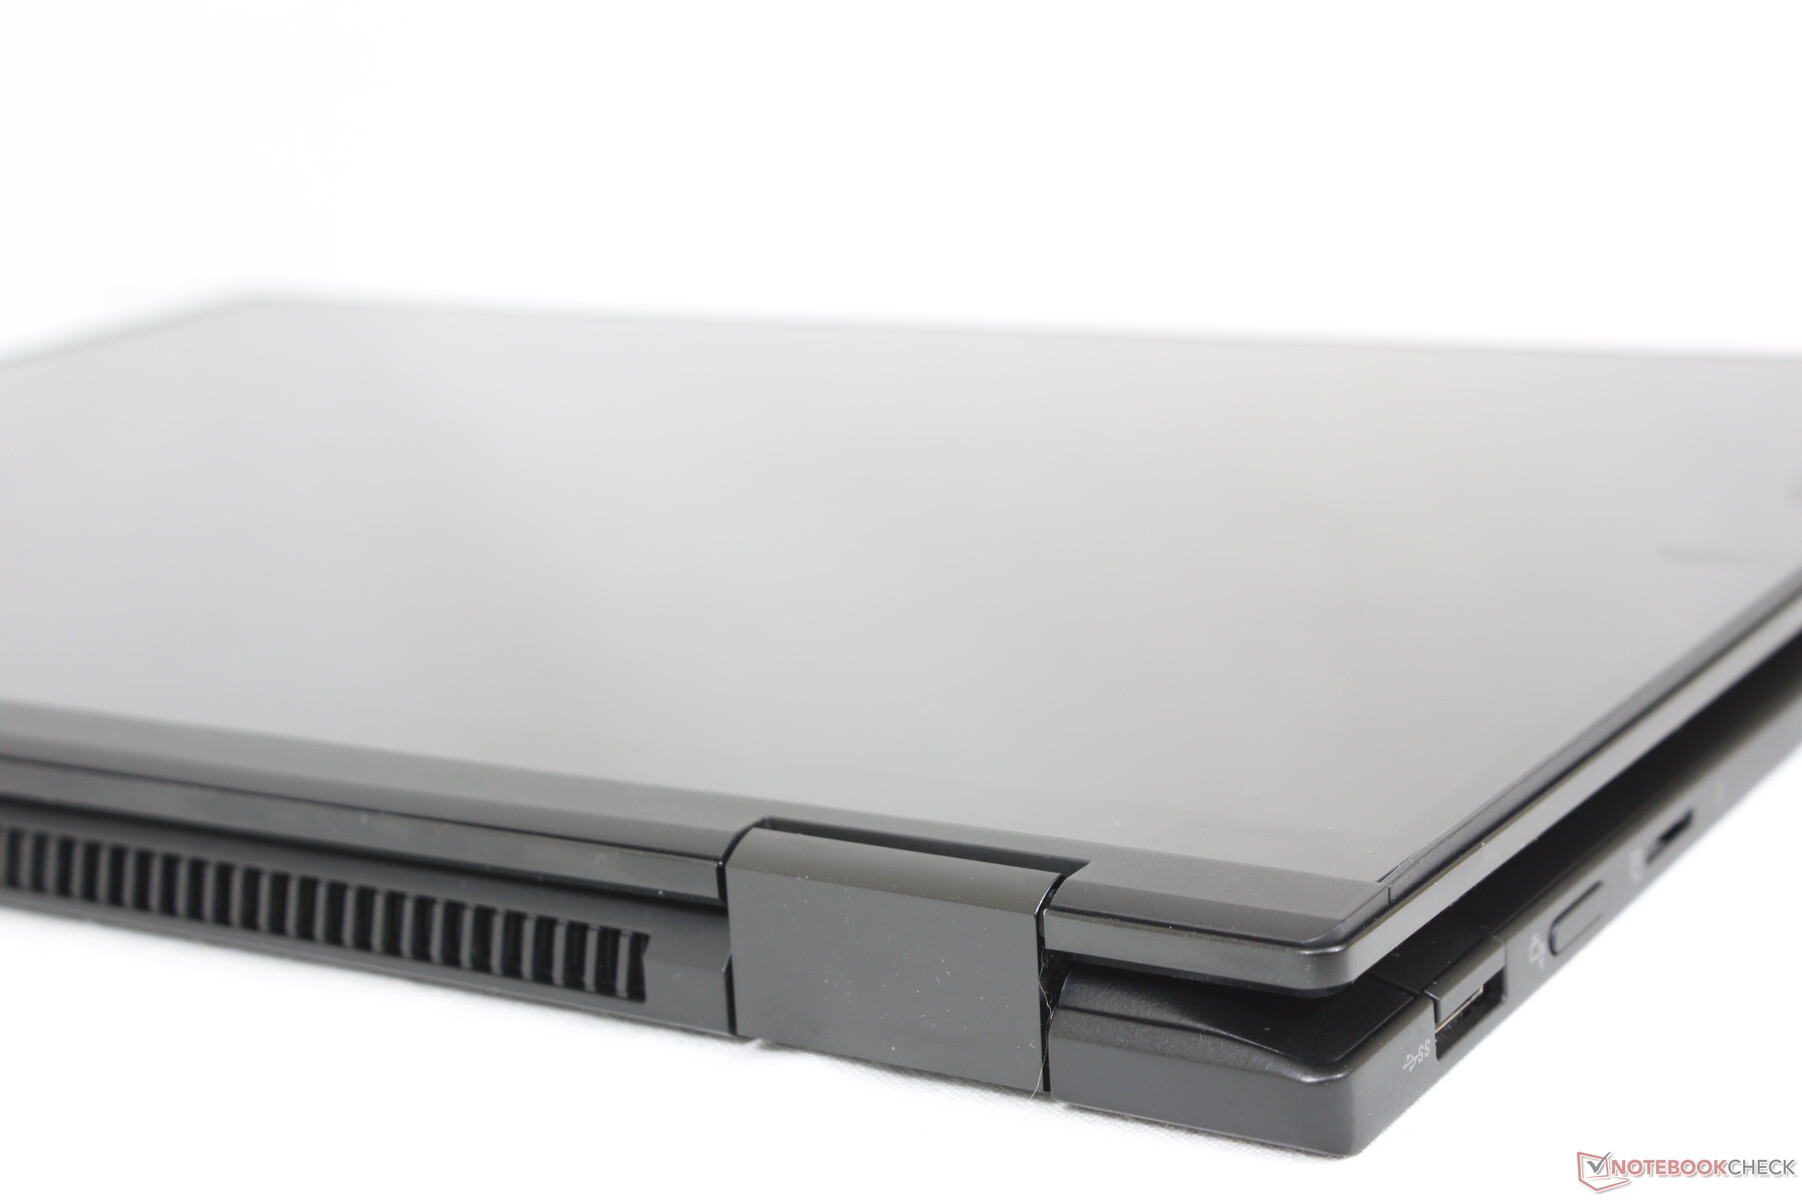
O design do chassi é essencialmente uma versão miniaturizada do recente Gram de 16 polegadas 16T90P. Pode não ser tão marcante visualmente a série Dell XPS, HP Spectre ou Asus Zenbook, mas compensa isso ao ser mais leve e certificado sob as especificações MIL-STD 810G. Sua base e tampa também são mais firmes do que no antigo Gram 14T90N com torção mínima e sem rangidos para ser menos propensa a flexões ou danos do que com o Samsung Galaxy Série Book Pro 360.
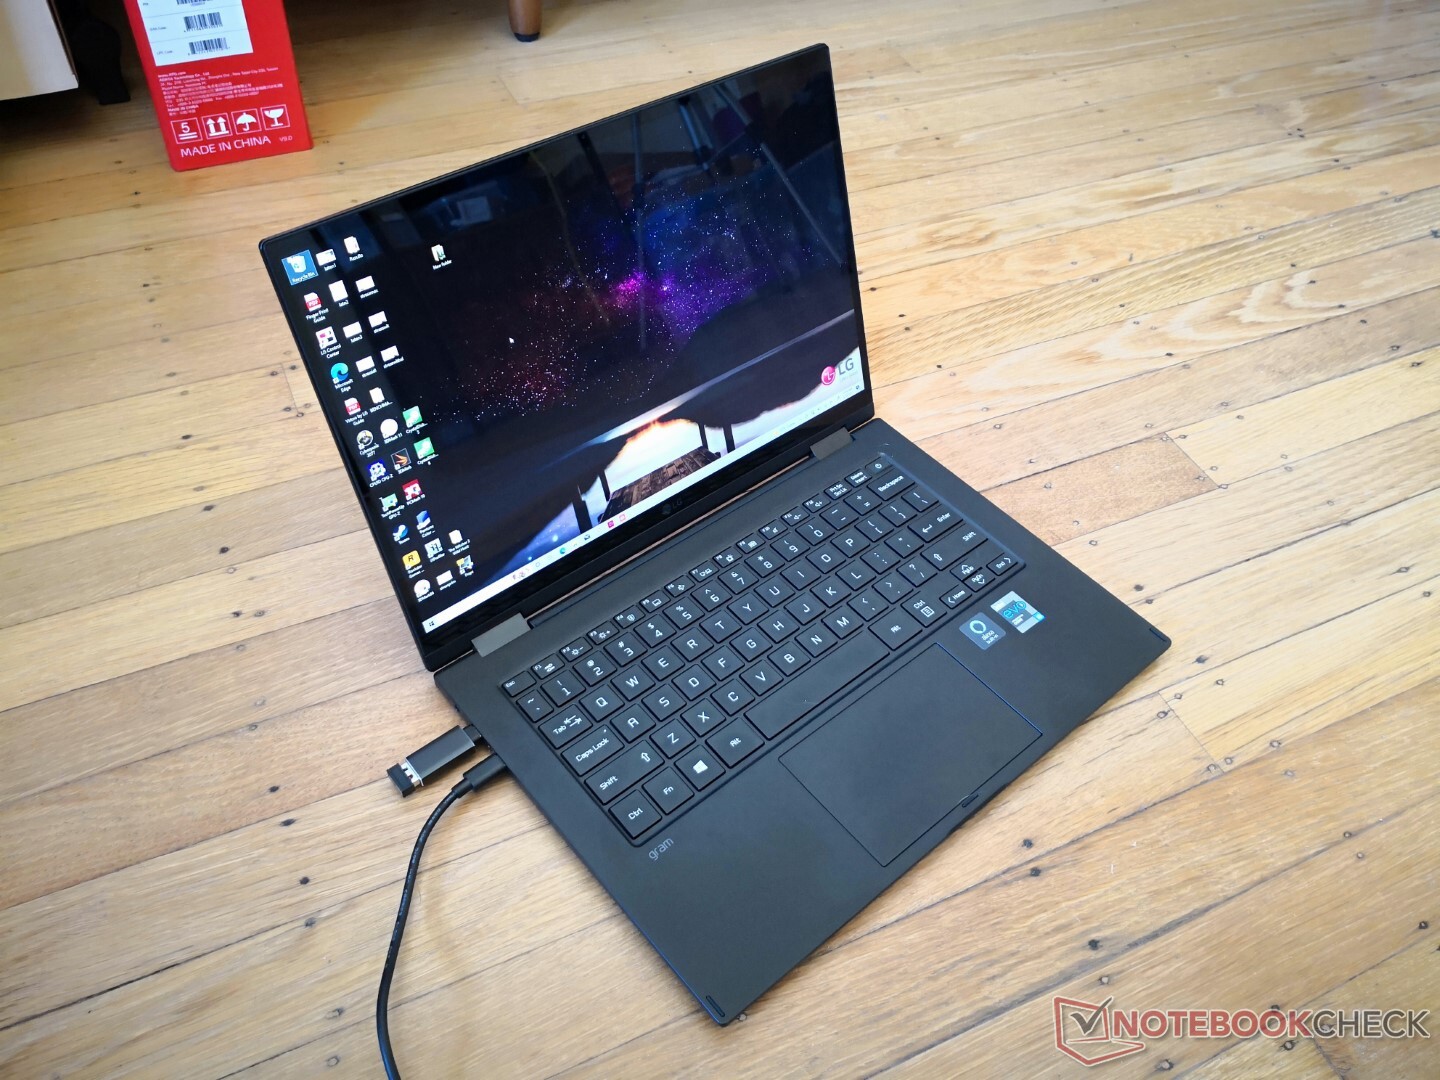
As dimensões são ligeiramente diferentes das do Gram 14T90N anterior, mas o volume total e o peso são quase os mesmos. Assim, os usuários estão obtendo uma tela 16:10 maior ao toque sem a necessidade de um chassi maior ou mais pesado. O sistema é cerca de 100 g a 200 g mais leve que a maioria dos conversíveis concorrentes, o que é perceptível ao manusear ou viajar.
Comparação de tamanhos
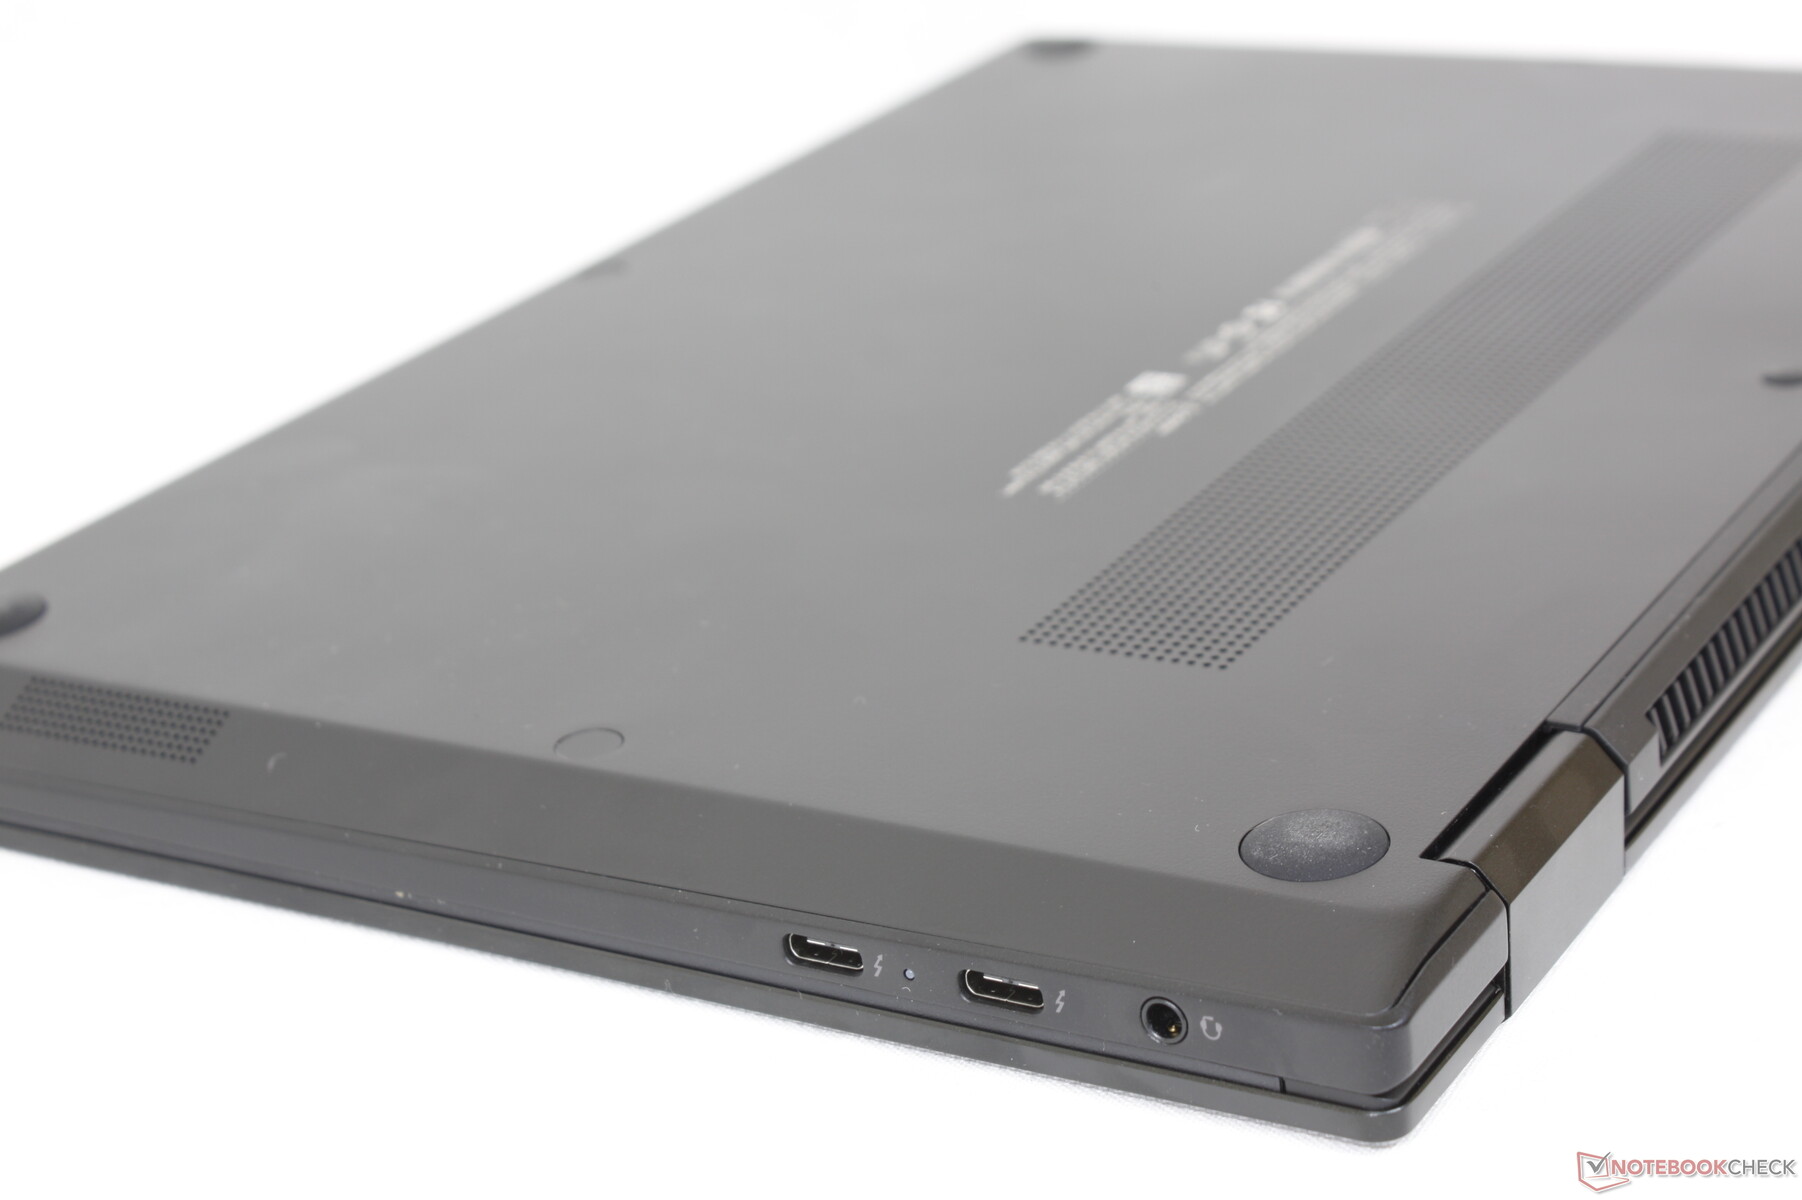
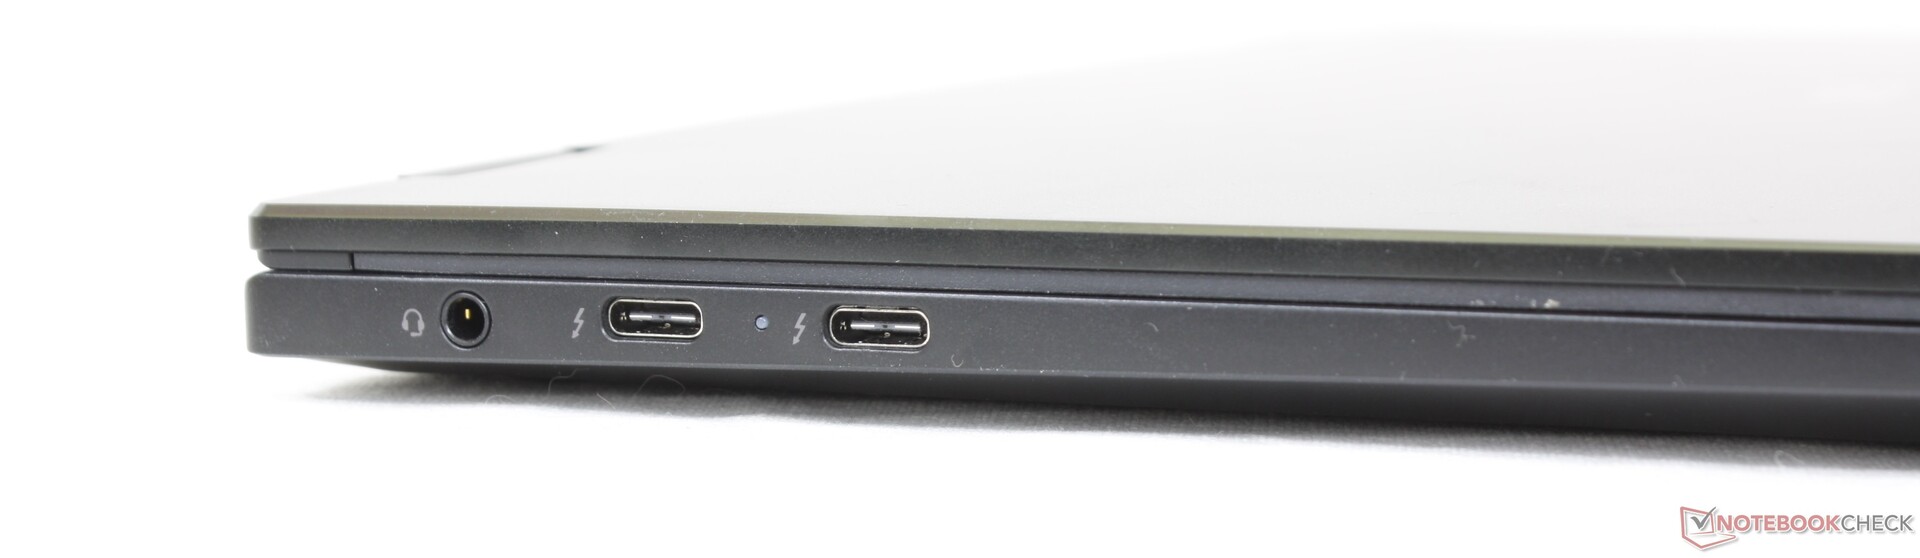
Conectividade - 2x Thunderbolt 4
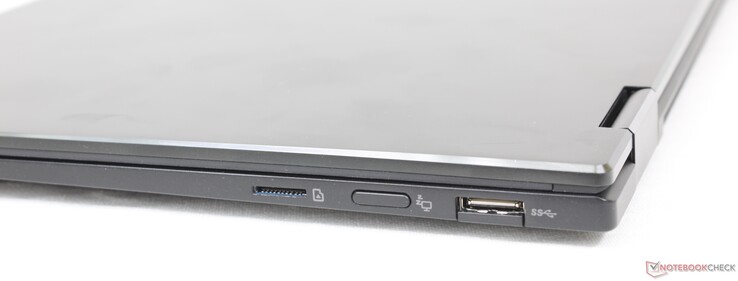
As opções de porta são idênticas às do Gram 16T90P maior. A grama 14T90P deixou cair a porta HDMI e o slot de travamento Kensington como encontrado na grama 14Z90P ou 14T90N, oferecendo menos opções do que a 14Z90P. Há apenas uma porta USB-A em tamanho real em vez de duas, por exemplo, o que significa que os proprietários são incentivados a utilizar acessórios USB-C ou estações de acoplamento em vez disso.
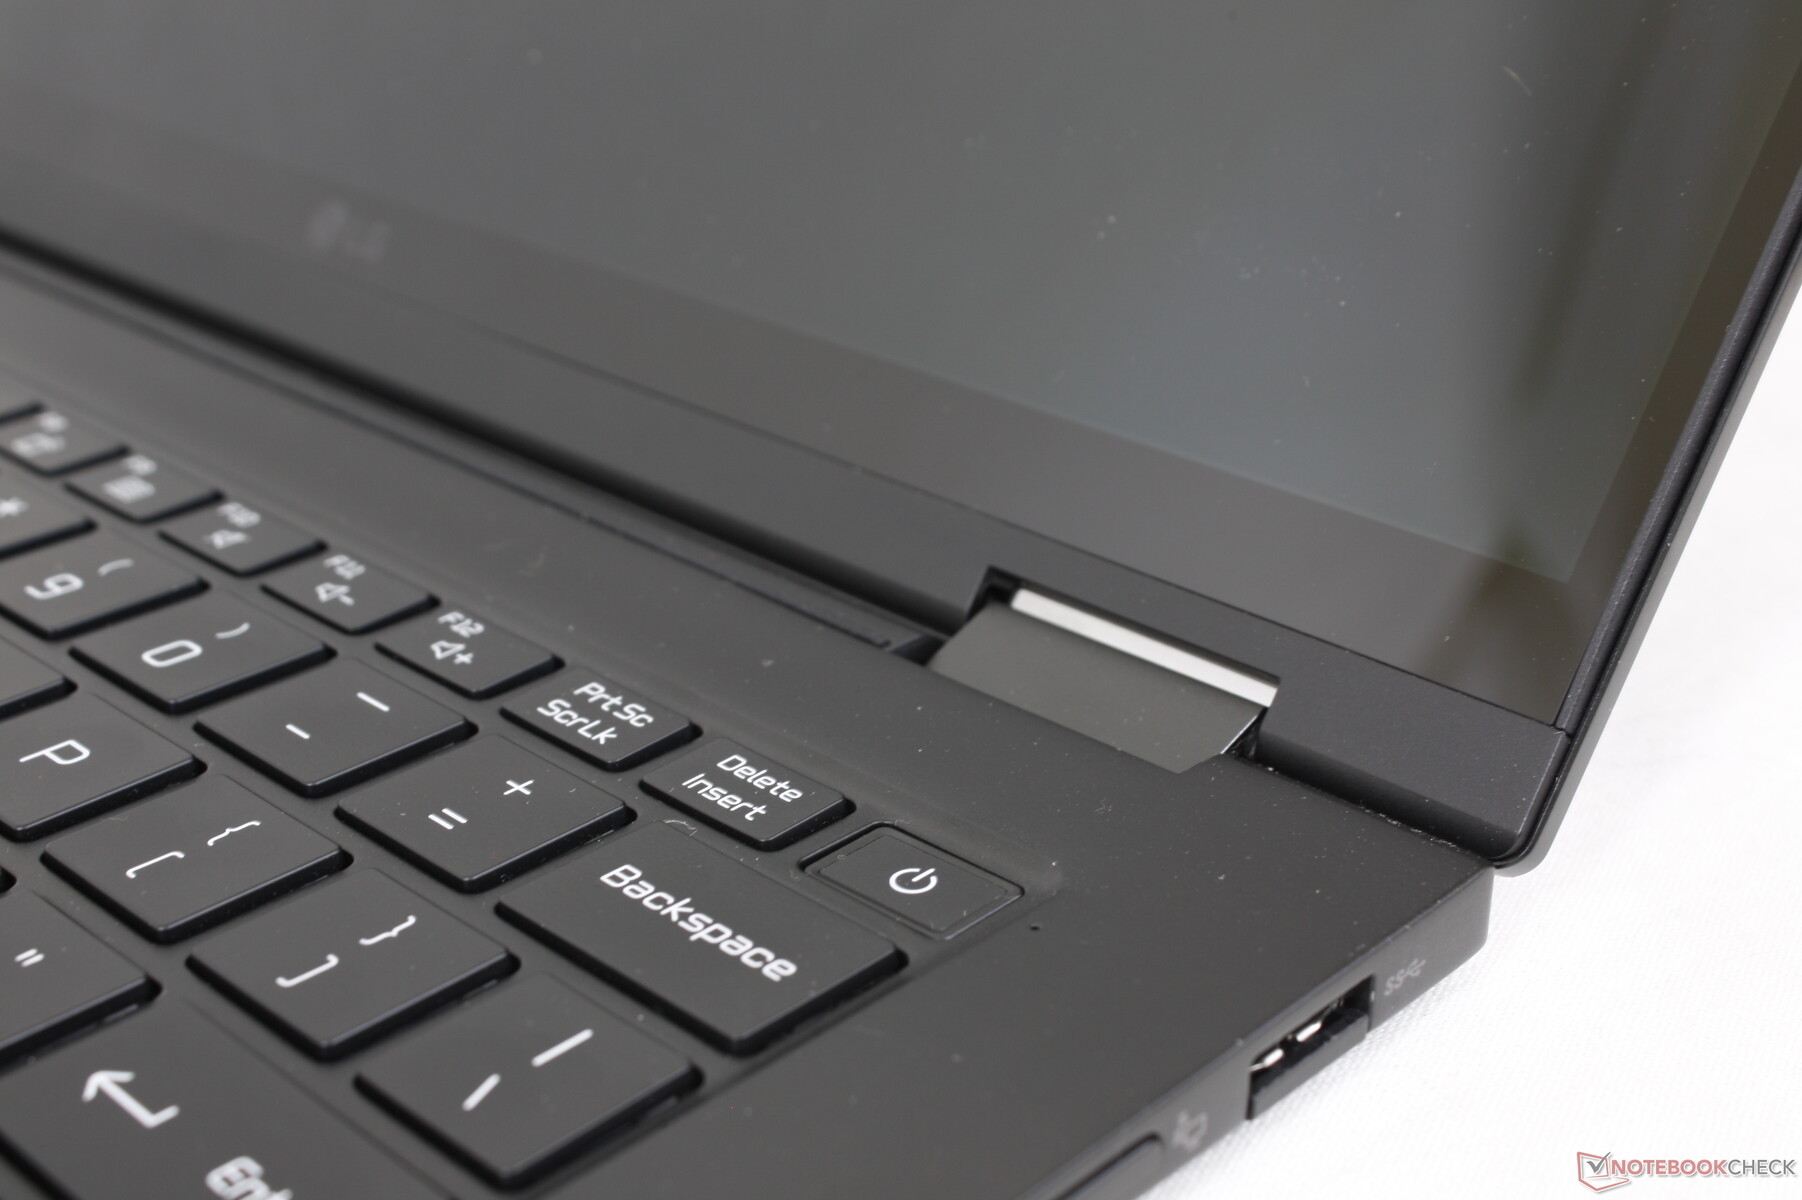
Pressionar o botão ao longo da borda direita liga ou desliga o visor. É uma característica estranha que não vemos em muitos outros conversíveis e infelizmente não é personalizável pelo usuário.
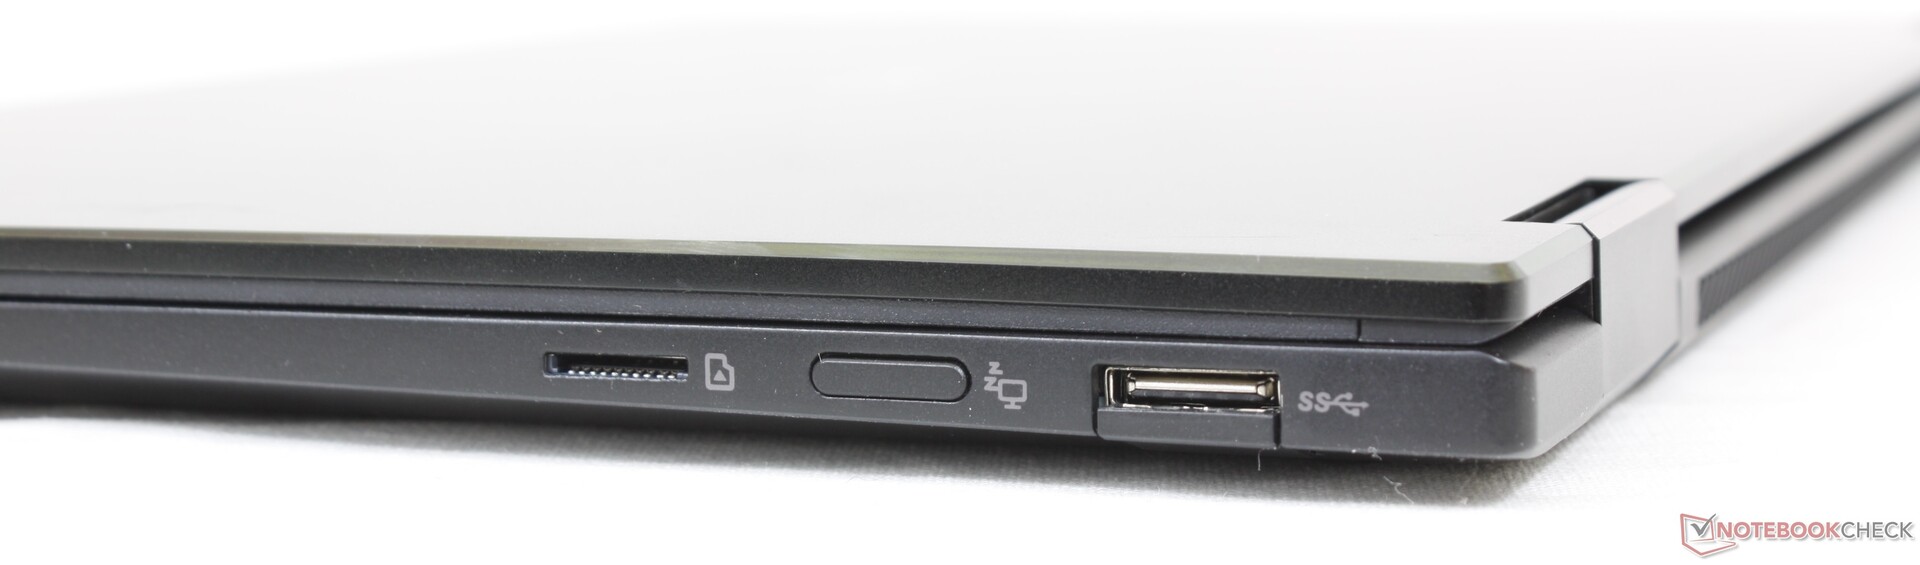
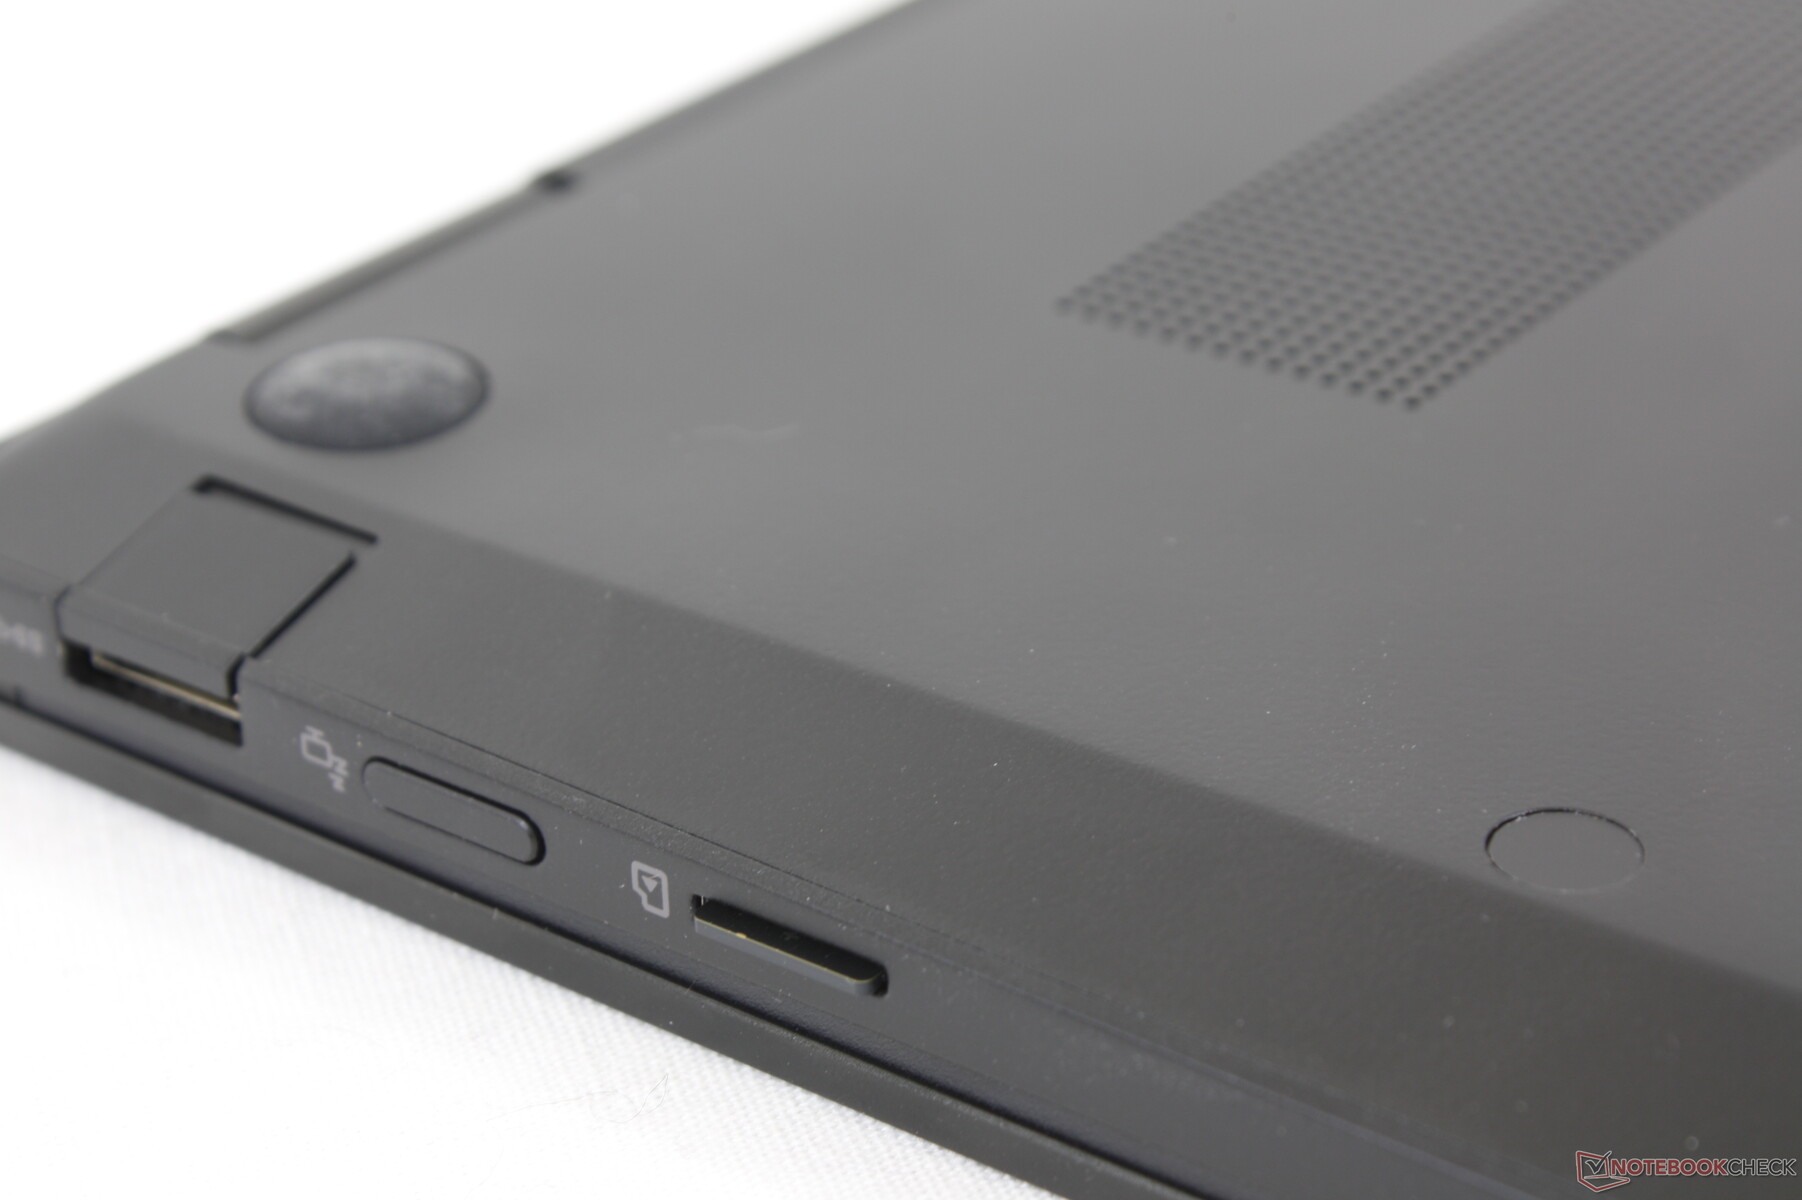
Leitor de cartões SD
As taxas de transferência do leitor de cartões MicroSD com mola são em média de cerca de 85 MB/s. A transferência de 1 GB de fotos de nossa placa UHS-II para o desktop leva cerca de 15 segundos para ser semelhante a todos os outros modelos Gram até o momento.
| SD Card Reader | |
| average JPG Copy Test (av. of 3 runs) | |
| HP Spectre x360 14-ea0378ng (Toshiba Exceria Pro M501 microSDXC 64GB) | |
| Dell XPS 13 9310 2-in-1 (AV Pro V60) | |
| Asus ZenBook Flip 14 UN5401QA-KN085W (AV Pro SD microSD 128 GB V60) | |
| LG Gram 14T90N (Toshiba Exceria Pro M501 64 GB UHS-II) | |
| MSI Summit E13 Flip Evo A11MT (AV PRO microSD 128 GB V60) | |
| LG Gram 14T90P (AV Pro V60) | |
| maximum AS SSD Seq Read Test (1GB) | |
| HP Spectre x360 14-ea0378ng (Toshiba Exceria Pro M501 microSDXC 64GB) | |
| Dell XPS 13 9310 2-in-1 (AV Pro V60) | |
| Asus ZenBook Flip 14 UN5401QA-KN085W (AV Pro SD microSD 128 GB V60) | |
| LG Gram 14T90P (AV Pro V60) | |
| MSI Summit E13 Flip Evo A11MT (AV PRO microSD 128 GB V60) | |
| LG Gram 14T90N (Toshiba Exceria Pro M501 64 GB UHS-II) | |
Comunicação
Um Intel AX201 vem como padrão para suporte a Wi-Fi 6 e Bluetooth 5.2. Não tivemos problemas de conectividade quando emparelhamos com nosso Asus GT-AXE11000, ao contrário do que observamos no recente Asus Zenbook Pro 15.
| Networking | |
| iperf3 transmit AX12 | |
| Asus ZenBook Flip 14 UN5401QA-KN085W | |
| Lenovo Yoga 9 14IAP7 82LU0001US | |
| Dell XPS 13 9310 2-in-1 | |
| HP Spectre x360 14-ea0378ng | |
| MSI Summit E13 Flip Evo A11MT | |
| LG Gram 14T90N | |
| iperf3 receive AX12 | |
| Asus ZenBook Flip 14 UN5401QA-KN085W | |
| Dell XPS 13 9310 2-in-1 | |
| Lenovo Yoga 9 14IAP7 82LU0001US | |
| MSI Summit E13 Flip Evo A11MT | |
| LG Gram 14T90N | |
| HP Spectre x360 14-ea0378ng | |
| iperf3 receive AXE11000 | |
| LG Gram 14T90P | |
| iperf3 transmit AXE11000 | |
| LG Gram 14T90P | |
Webcam
A câmera é de apenas 720p sem suporte para Windows Olá ou mesmo um obturador de privacidade. Isto definitivamente precisa ser abordado em modelos futuros.


Manutenção
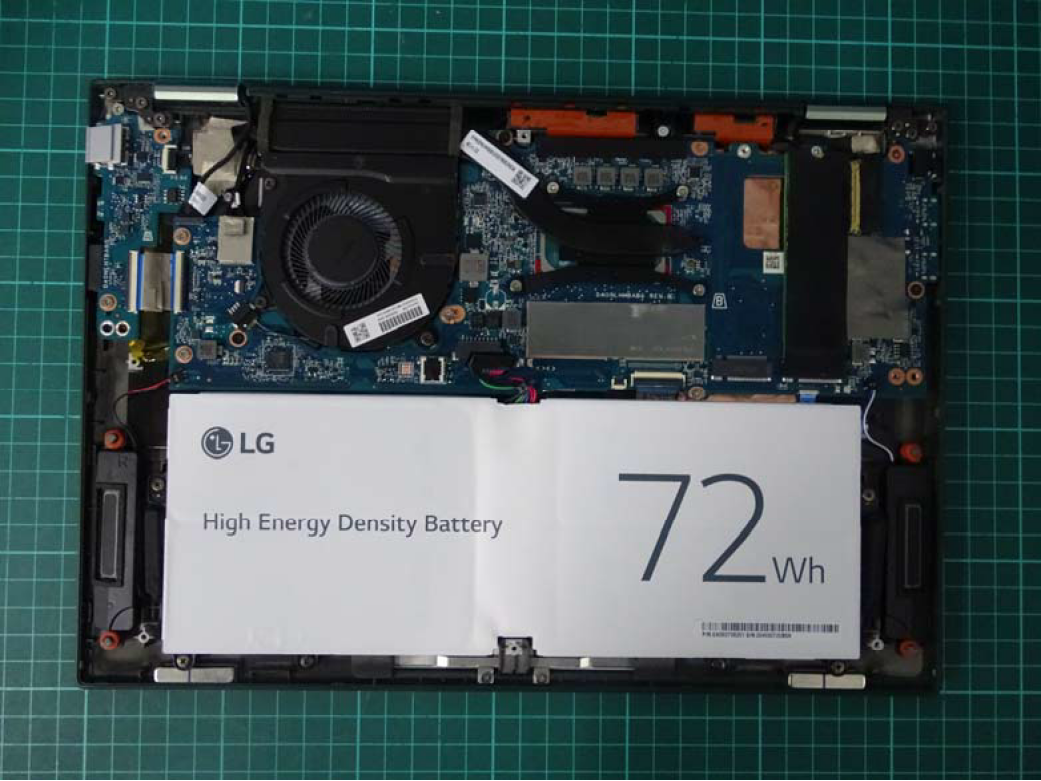
Como em qualquer outro laptop Gram até agora, o painel inferior foi projetado para ser muito difícil de abrir, pois os parafusos estão escondidos debaixo de adesivos e pés de borracha. É uma pena porque o sistema pode suportar até dois SSDs M.2 2280 internos em vez de um para espaço de armazenamento adicional, mas o LG tornou incômodo para os proprietários a tarefa de adicionar seus próprios drives
Tanto a RAM quanto a WLAN são soldadas e não podem ser atualizadas pelo usuário
Uma vez que não conseguimos abrir nossa unidade de teste sem danificá-la, podemos consultar as imagens oficiais da FCC aqui.
Acessórios e Garantia
A caixa de varejo inclui uma caneta stylus ativa Wacom https://www.lg.com/us/mobile-accessories/lg-aaa77804301-wacom-active-stylus-pen junto com a papelada usual e o adaptador AC. Aplica-se a garantia limitada padrão de um ano.
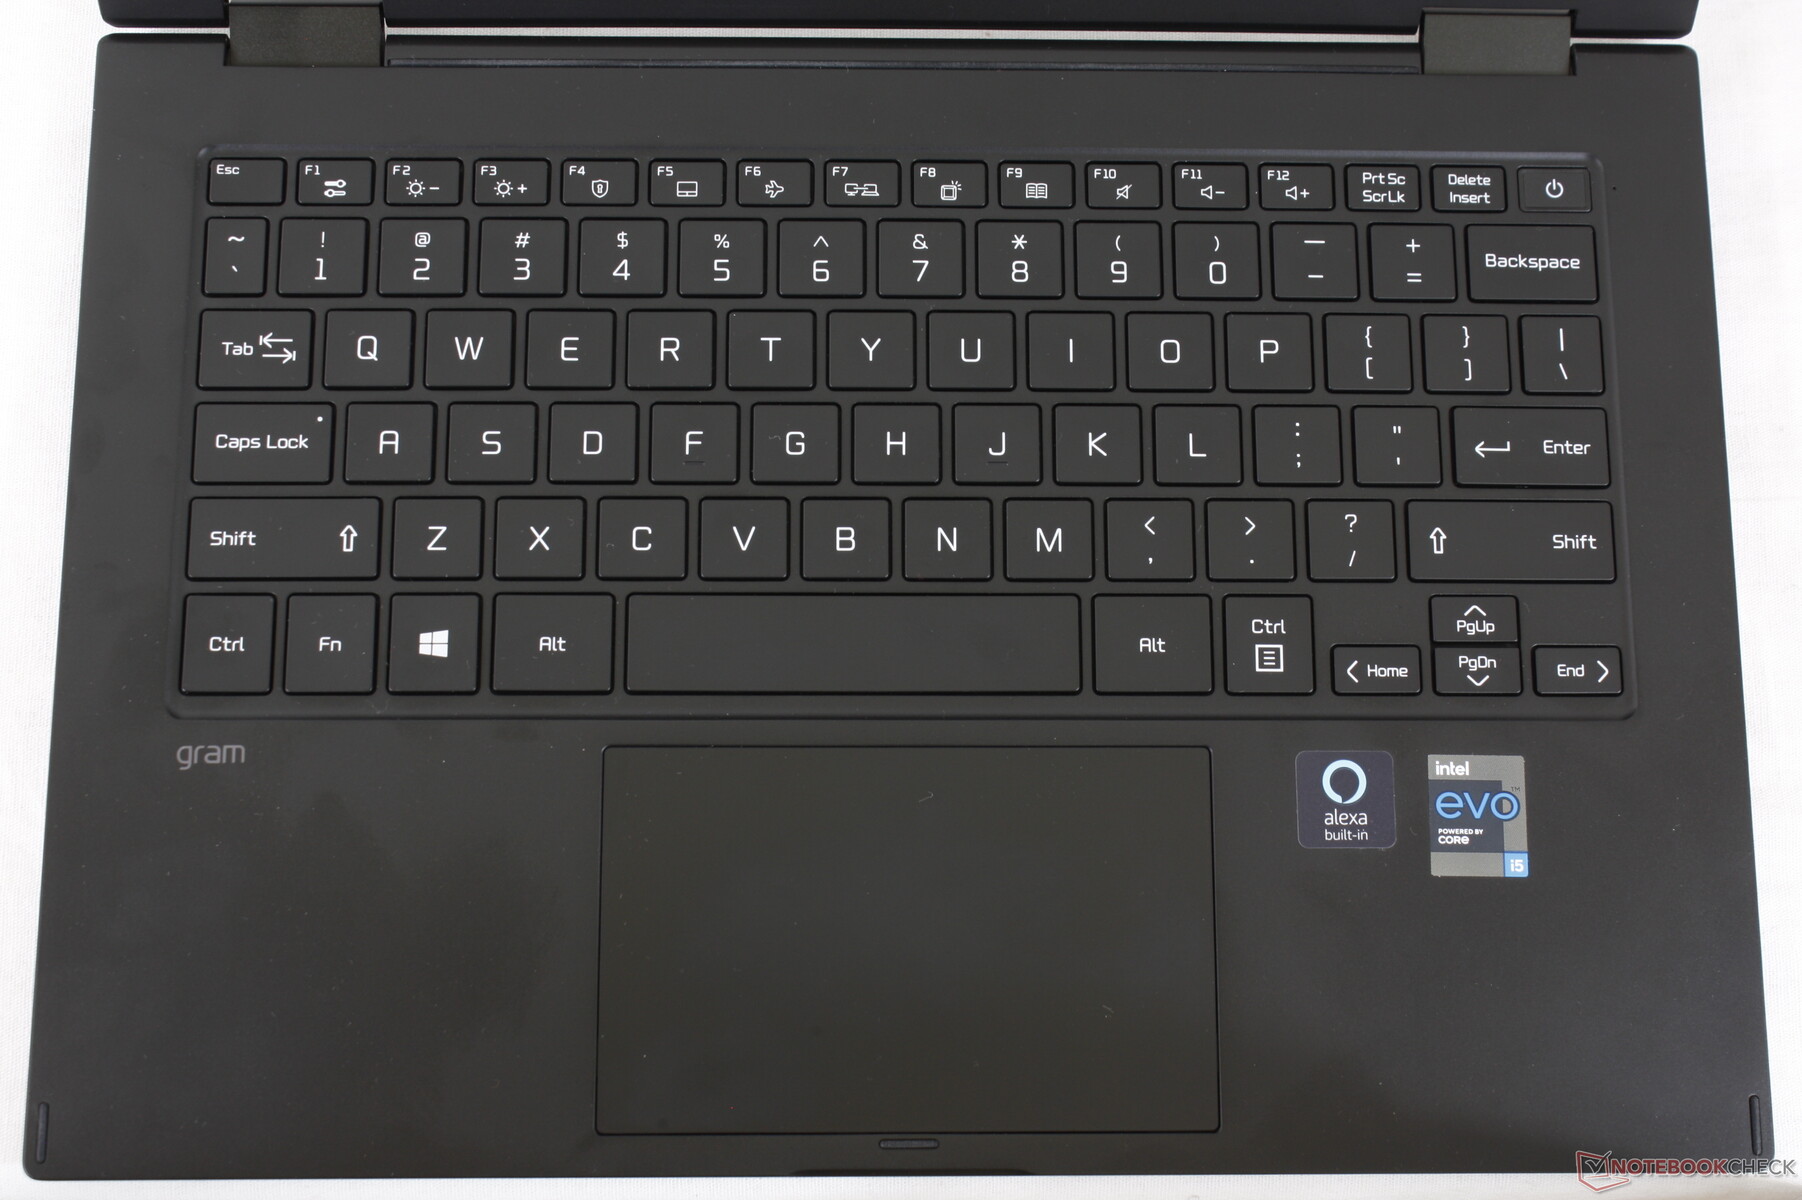
Dispositivos de entrada - Grande Teclado, Meh Clickpad
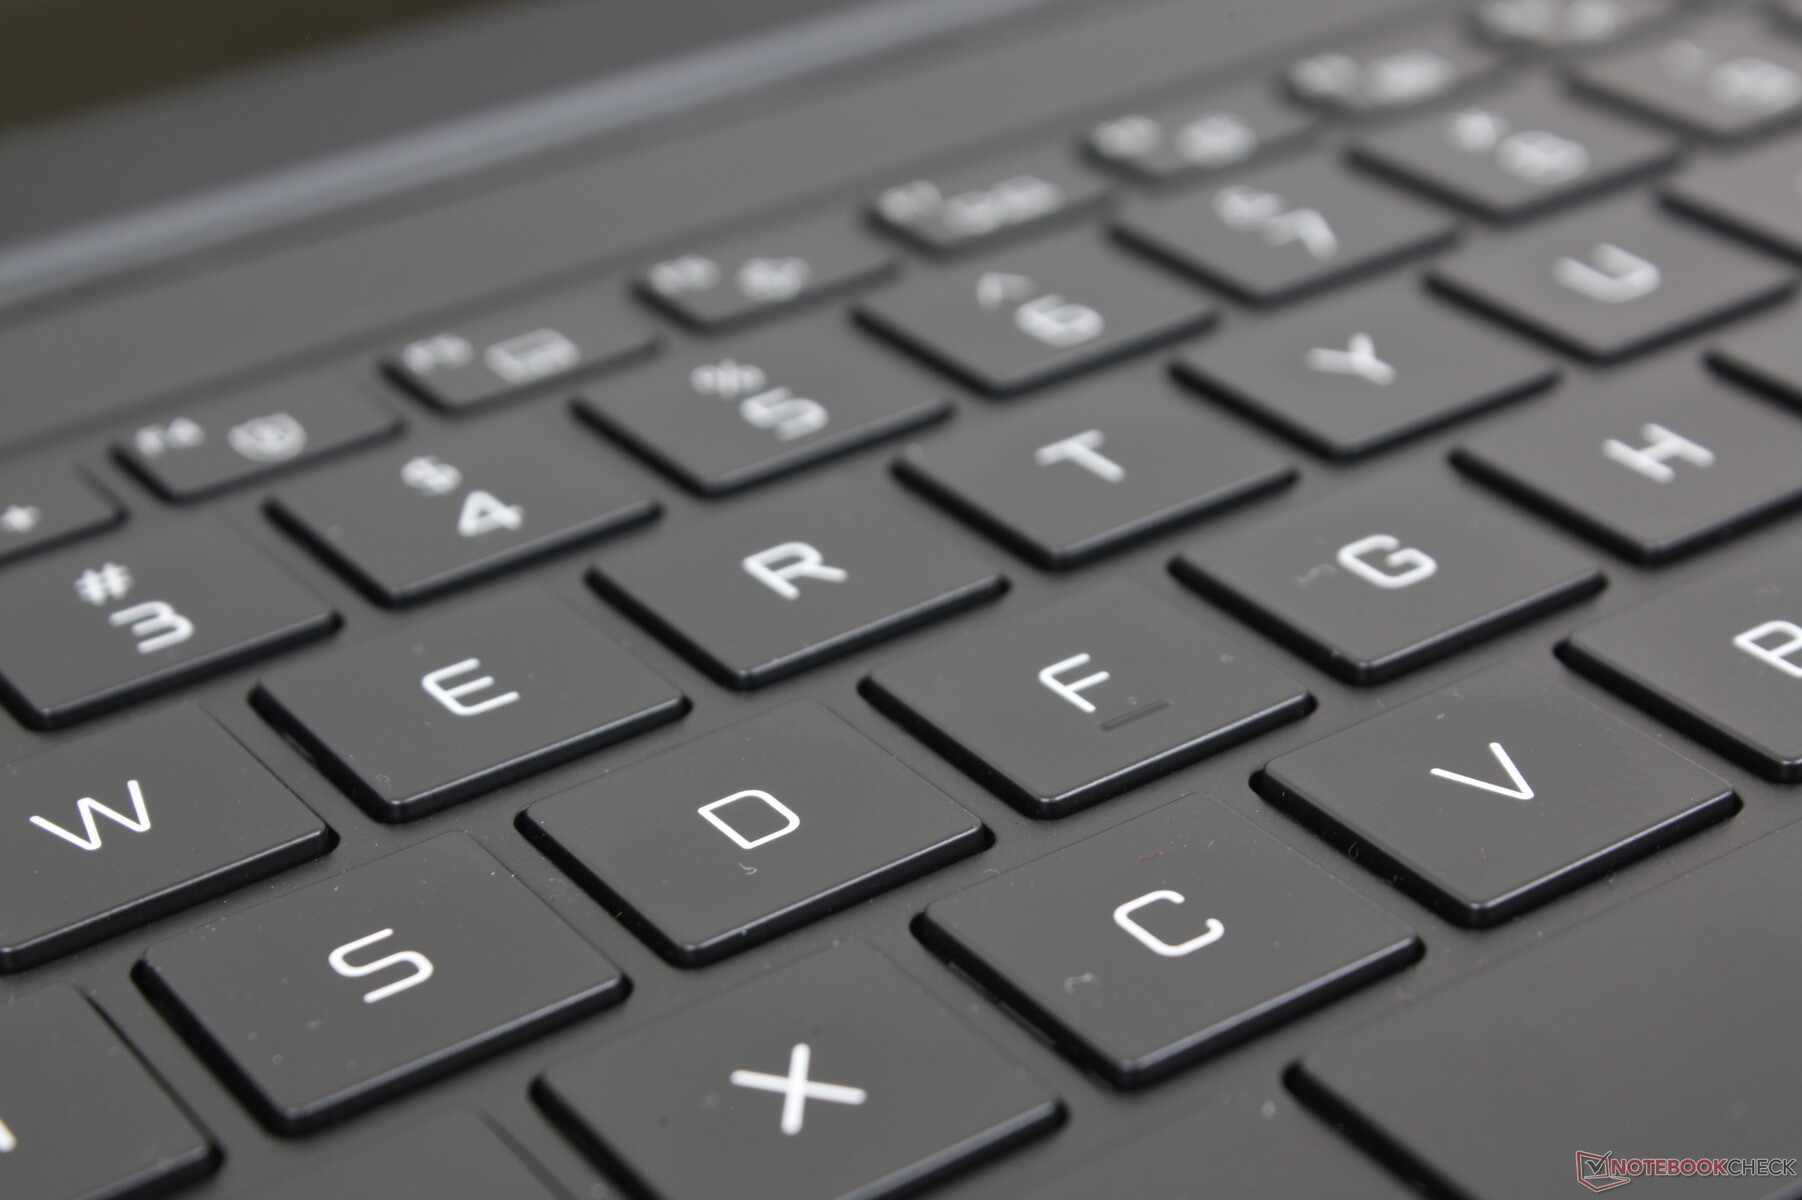
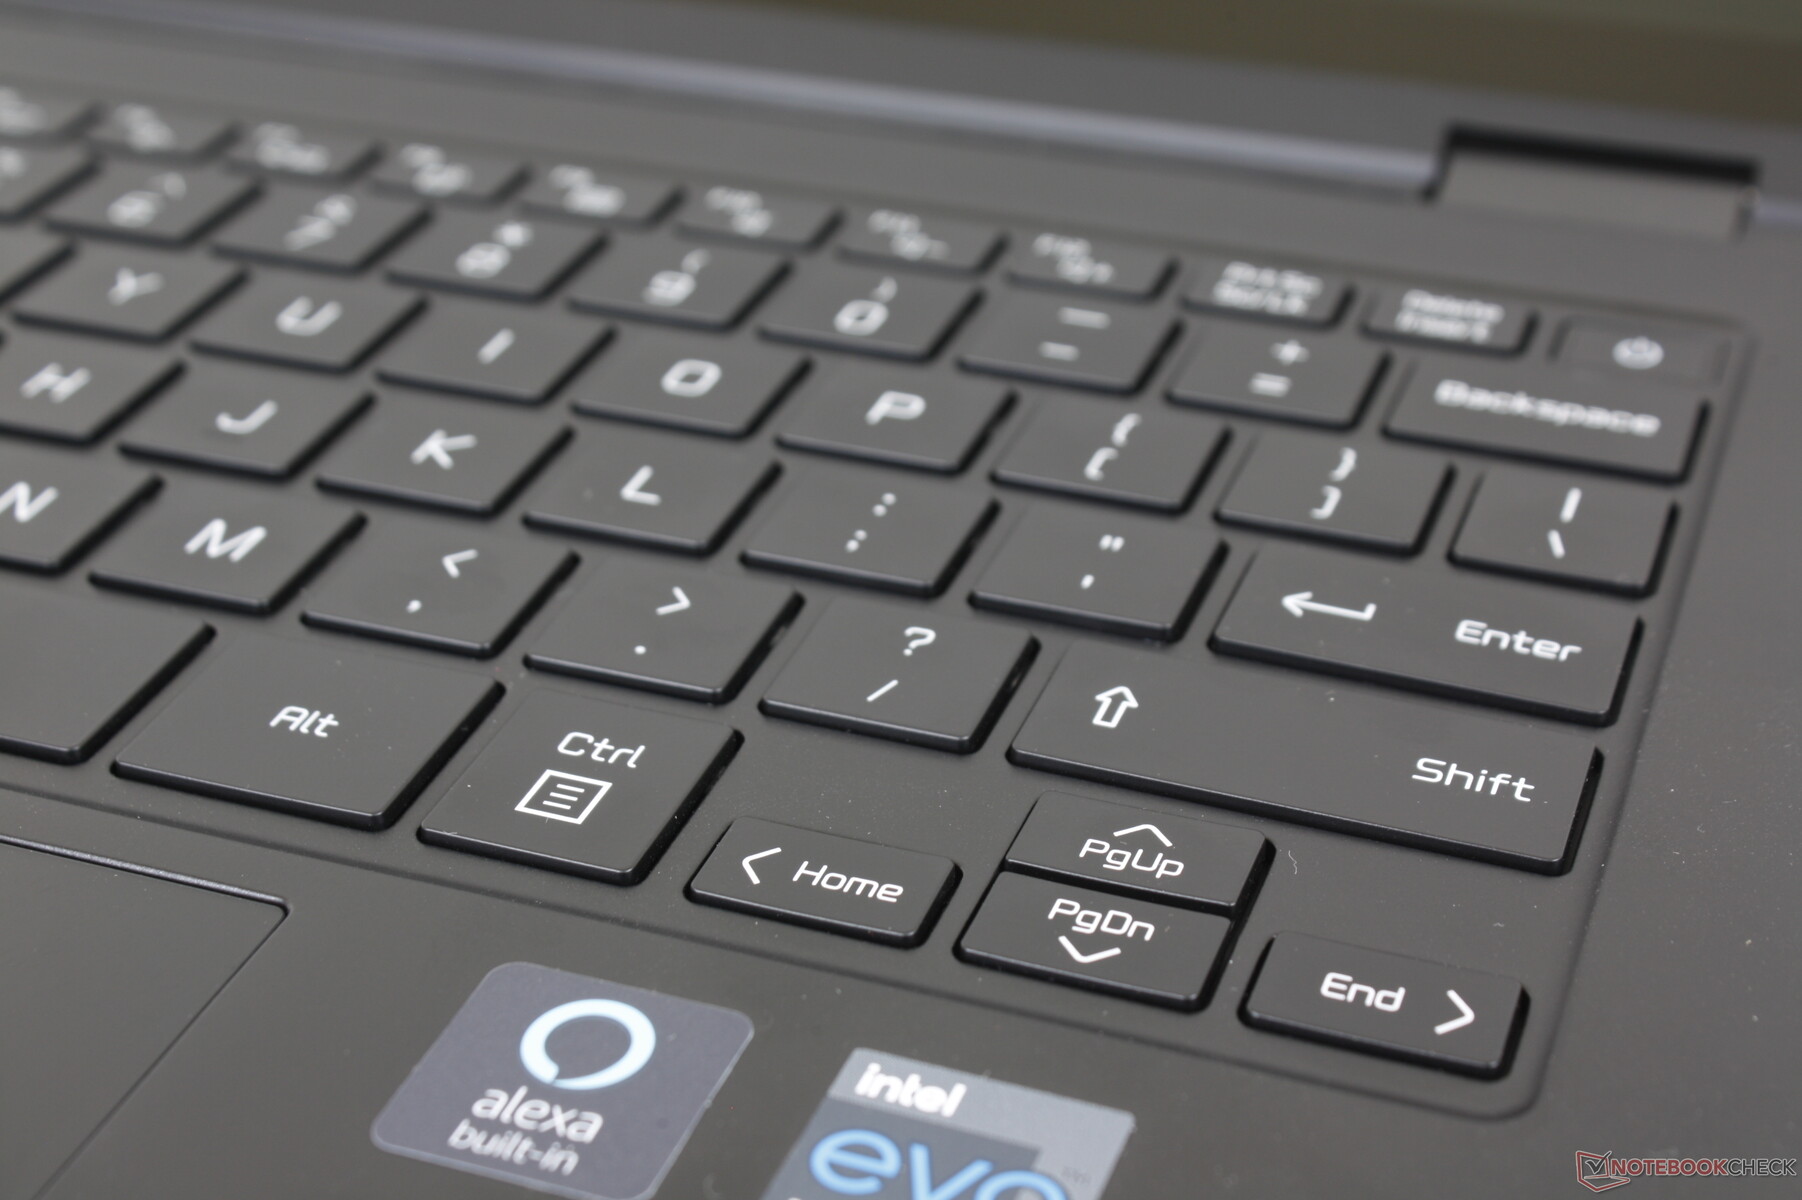
Teclado
O feedback das teclas do teclado é visivelmente mais firme e menos esponjoso do que na maioria dos outros Ultrabooks. Se você estiver acostumado a digitar em teclas de teclado mais macias como em um Asus Vivobook, HP Pavilion, Lenovo IdeaPad, ou mesmo no Razer Blade, então você terá uma surpresa de como as teclas são mais rígidas no Gram 14T90P. Uma conseqüência das chaves mais firmes, porém, é um ruído mais alto do que a média para uma experiência de digitação um pouco mais ruidosa.
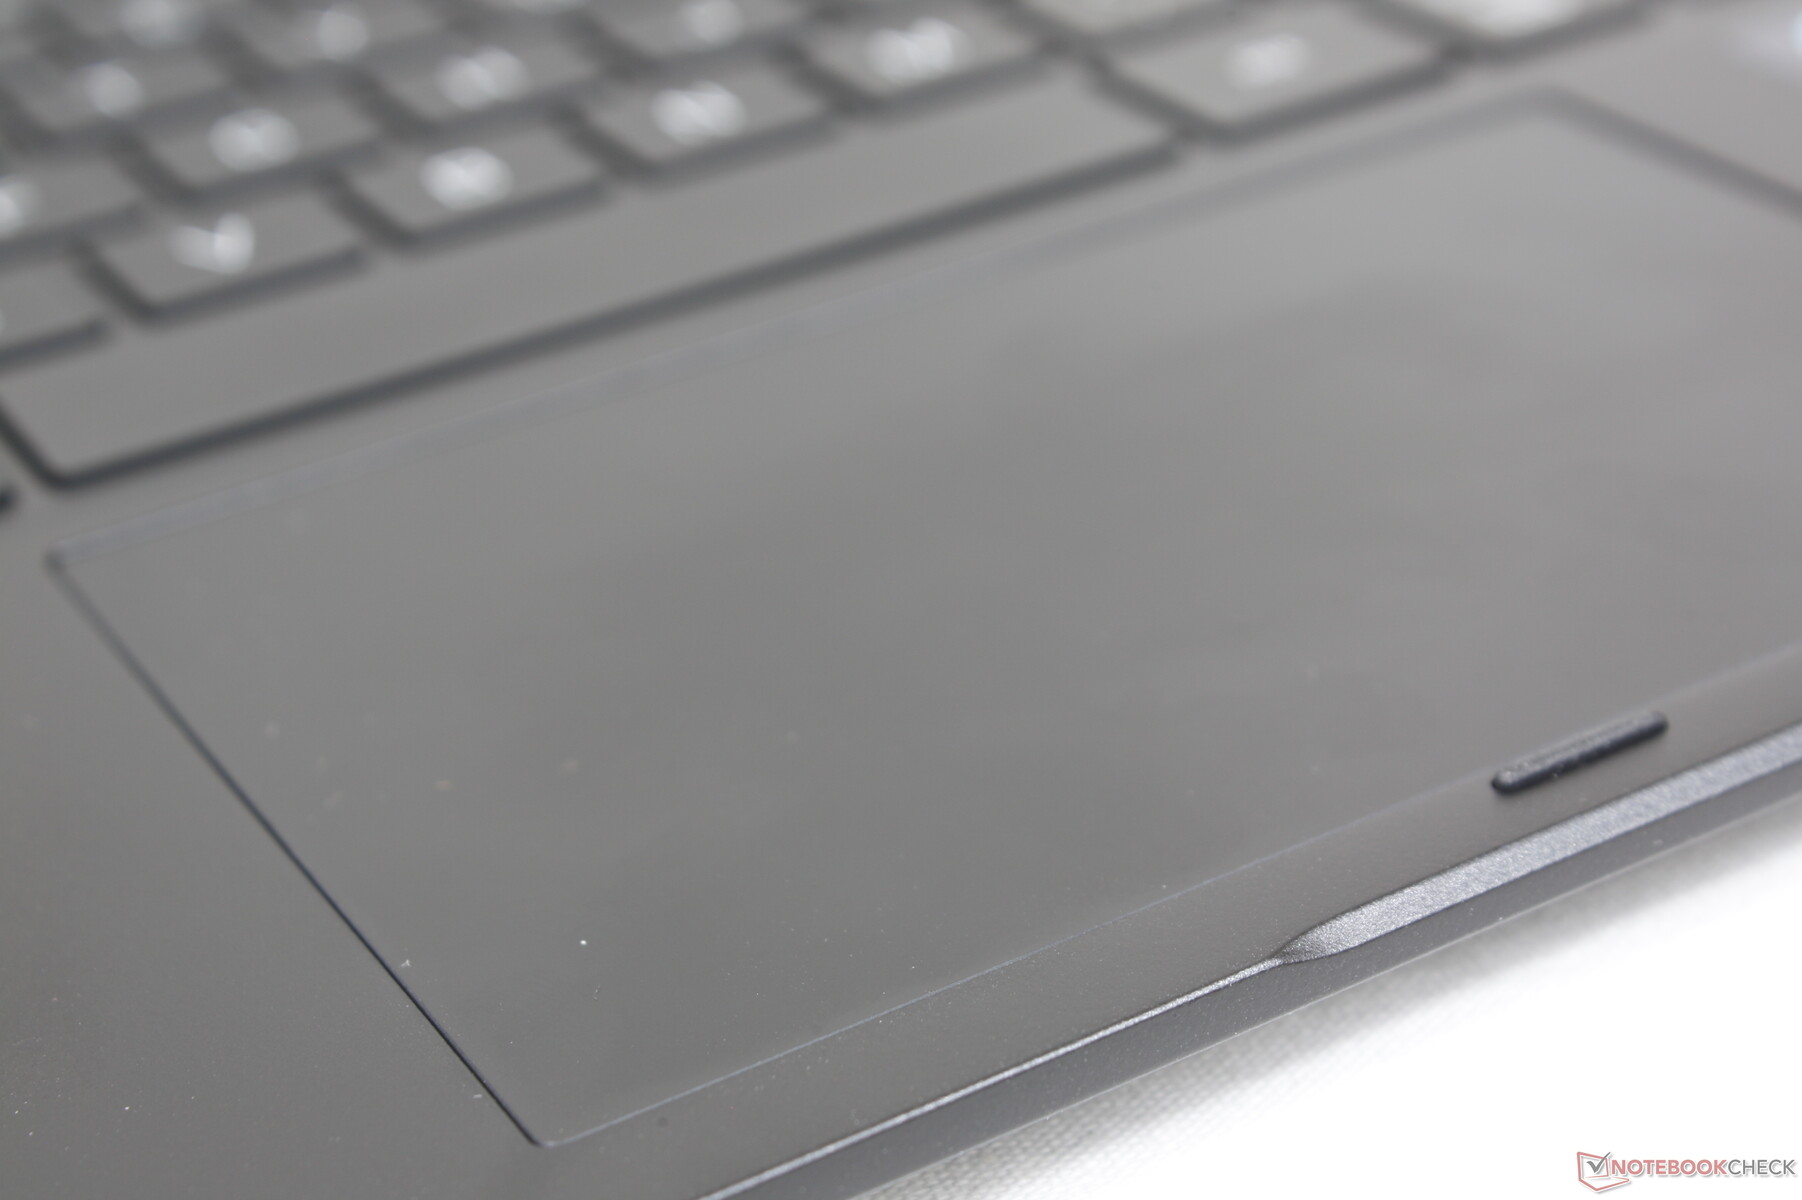
Touchpad
Estamos menos impressionados com o clickpad quando comparado com o teclado. Embora seja maior que o clickpad no Gram 14T90N (11,3 x 7 cm vs. 10,5 x 6,5 cm) para facilitar o controle do cursor e as entradas multi-toque, o feedback dos cliques é muito suave e silencioso. Um feedback mais firme teria proporcionado uma sensação mais satisfatória.
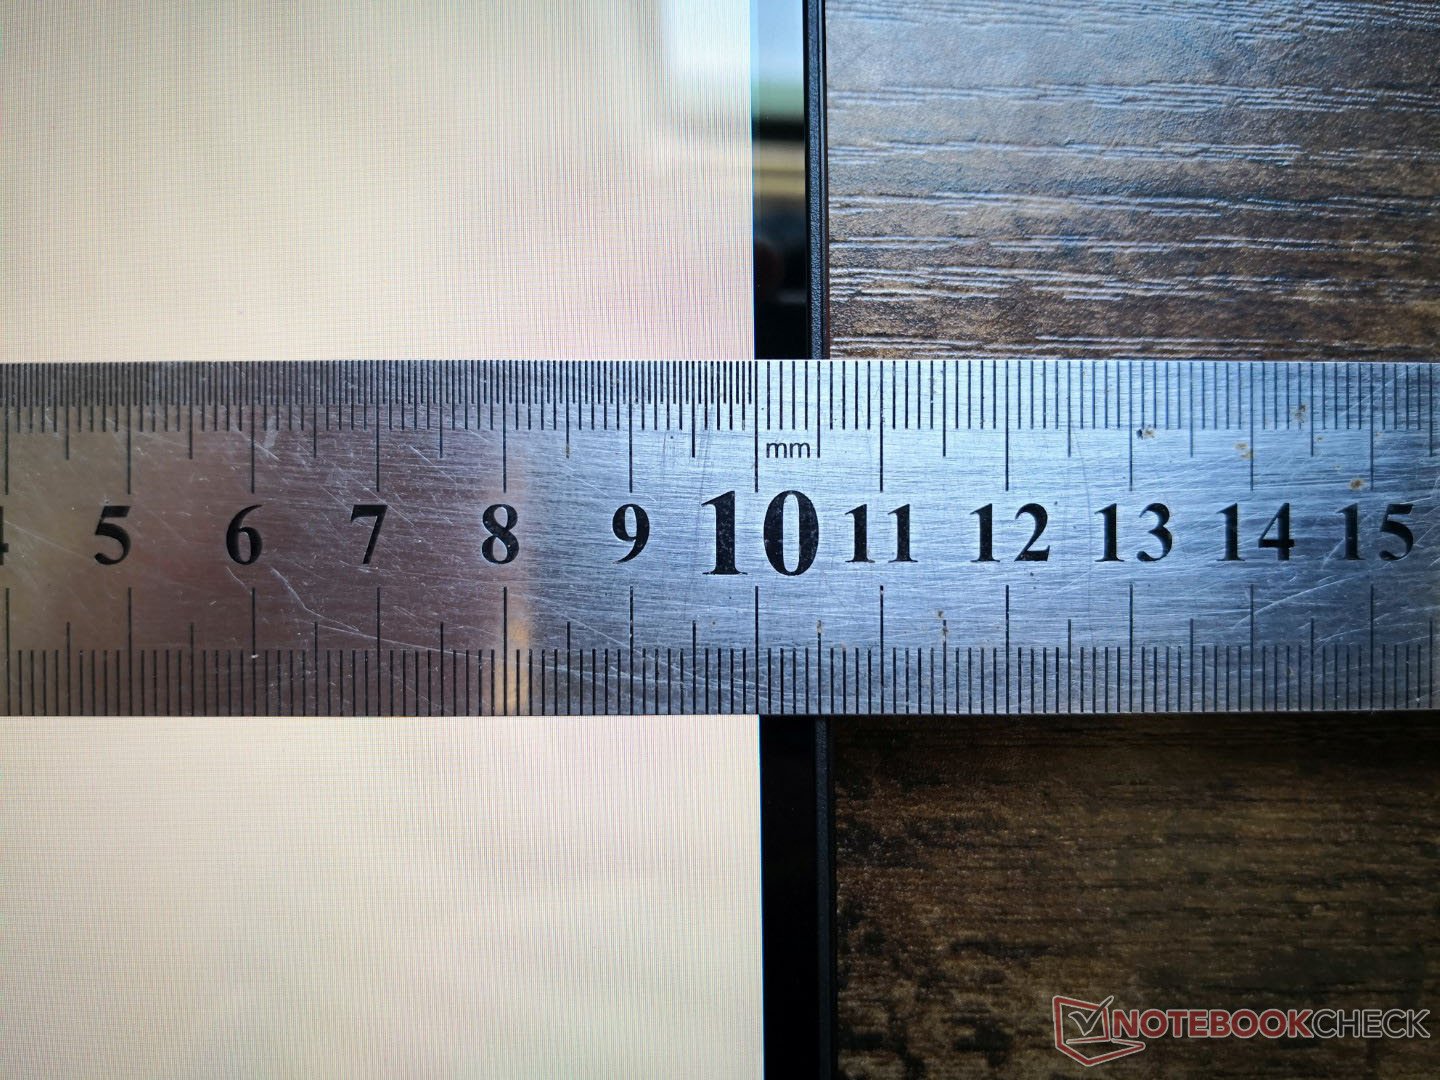
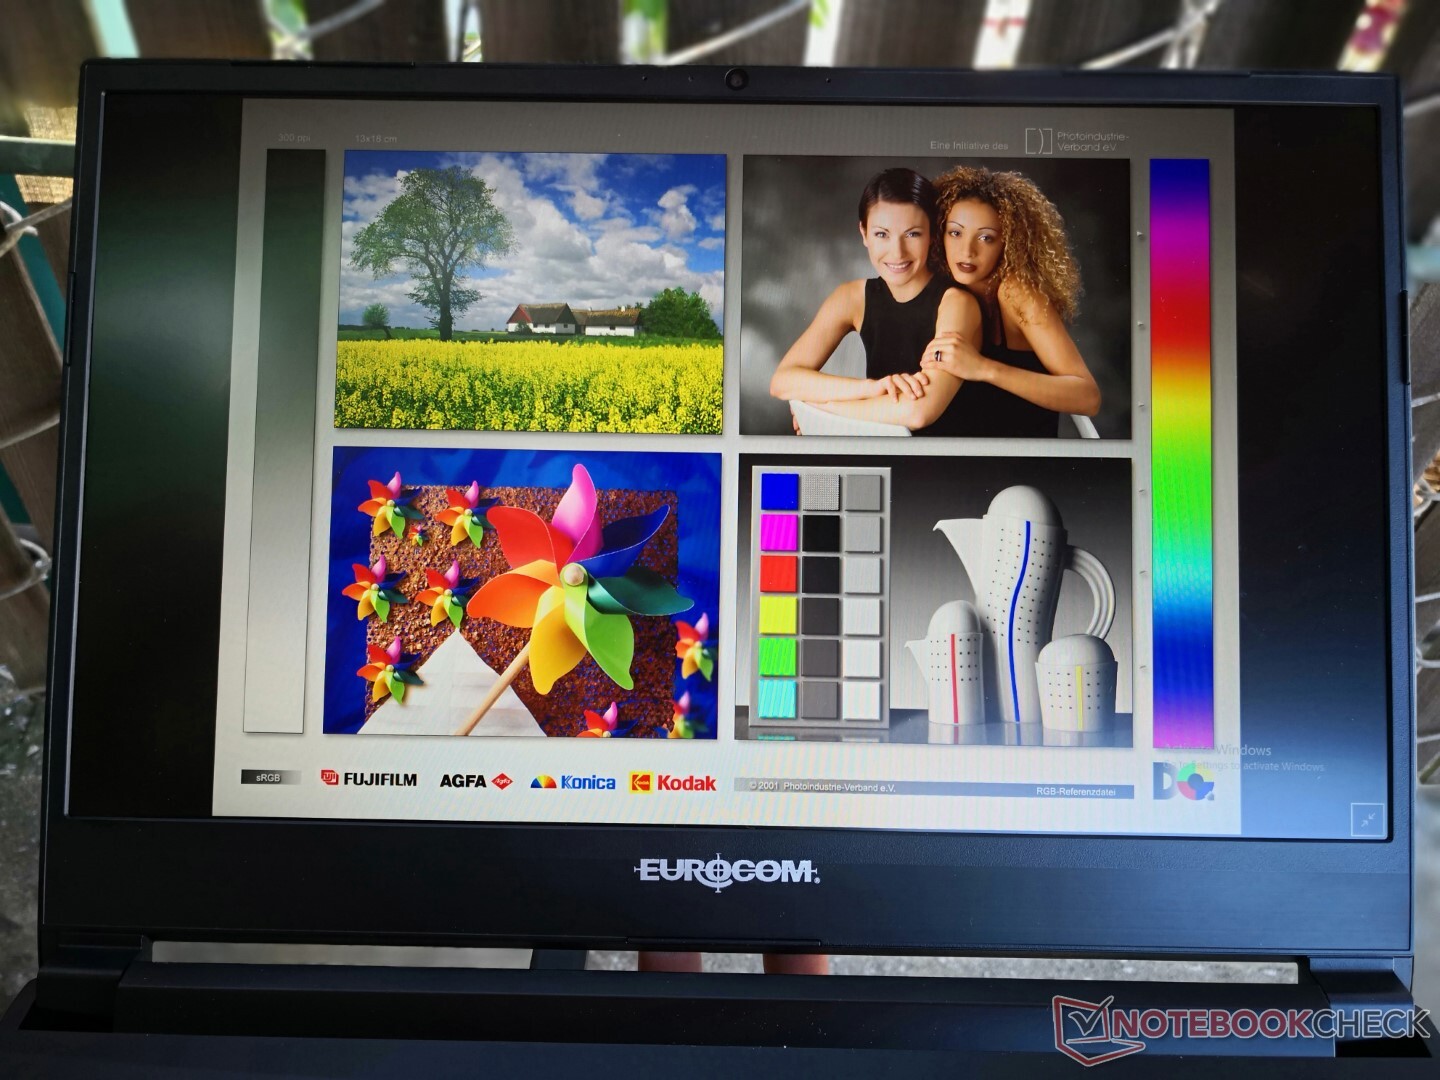
Display - Afiado com cores excelentes
O LG Gram 14T90P utiliza o mesmo painel IPS LG Philips LP140WU1-SPA1 de alta qualidade encontrado no Gram 14Z90P. Assim, atributos como reprodução de cores, tempos de resposta e contraste são praticamente iguais entre eles para uma experiência de visualização muito semelhante.
Quando comparado ao display no Gram 14T90N, nosso Gram 14T90P oferece cores mais profundas e tempos de resposta um pouco mais rápidos em preto-branco e cinza cinza, sem impacto no brilho ou contraste. Mesmo assim, adoraríamos ver painéis OLED e/ou 90 Hz no futuro, pois tais características estão se tornando a norma em sub-portáteis high-end como nos concorrentesAsus Zenbook Flip 14.
| |||||||||||||||||||||||||
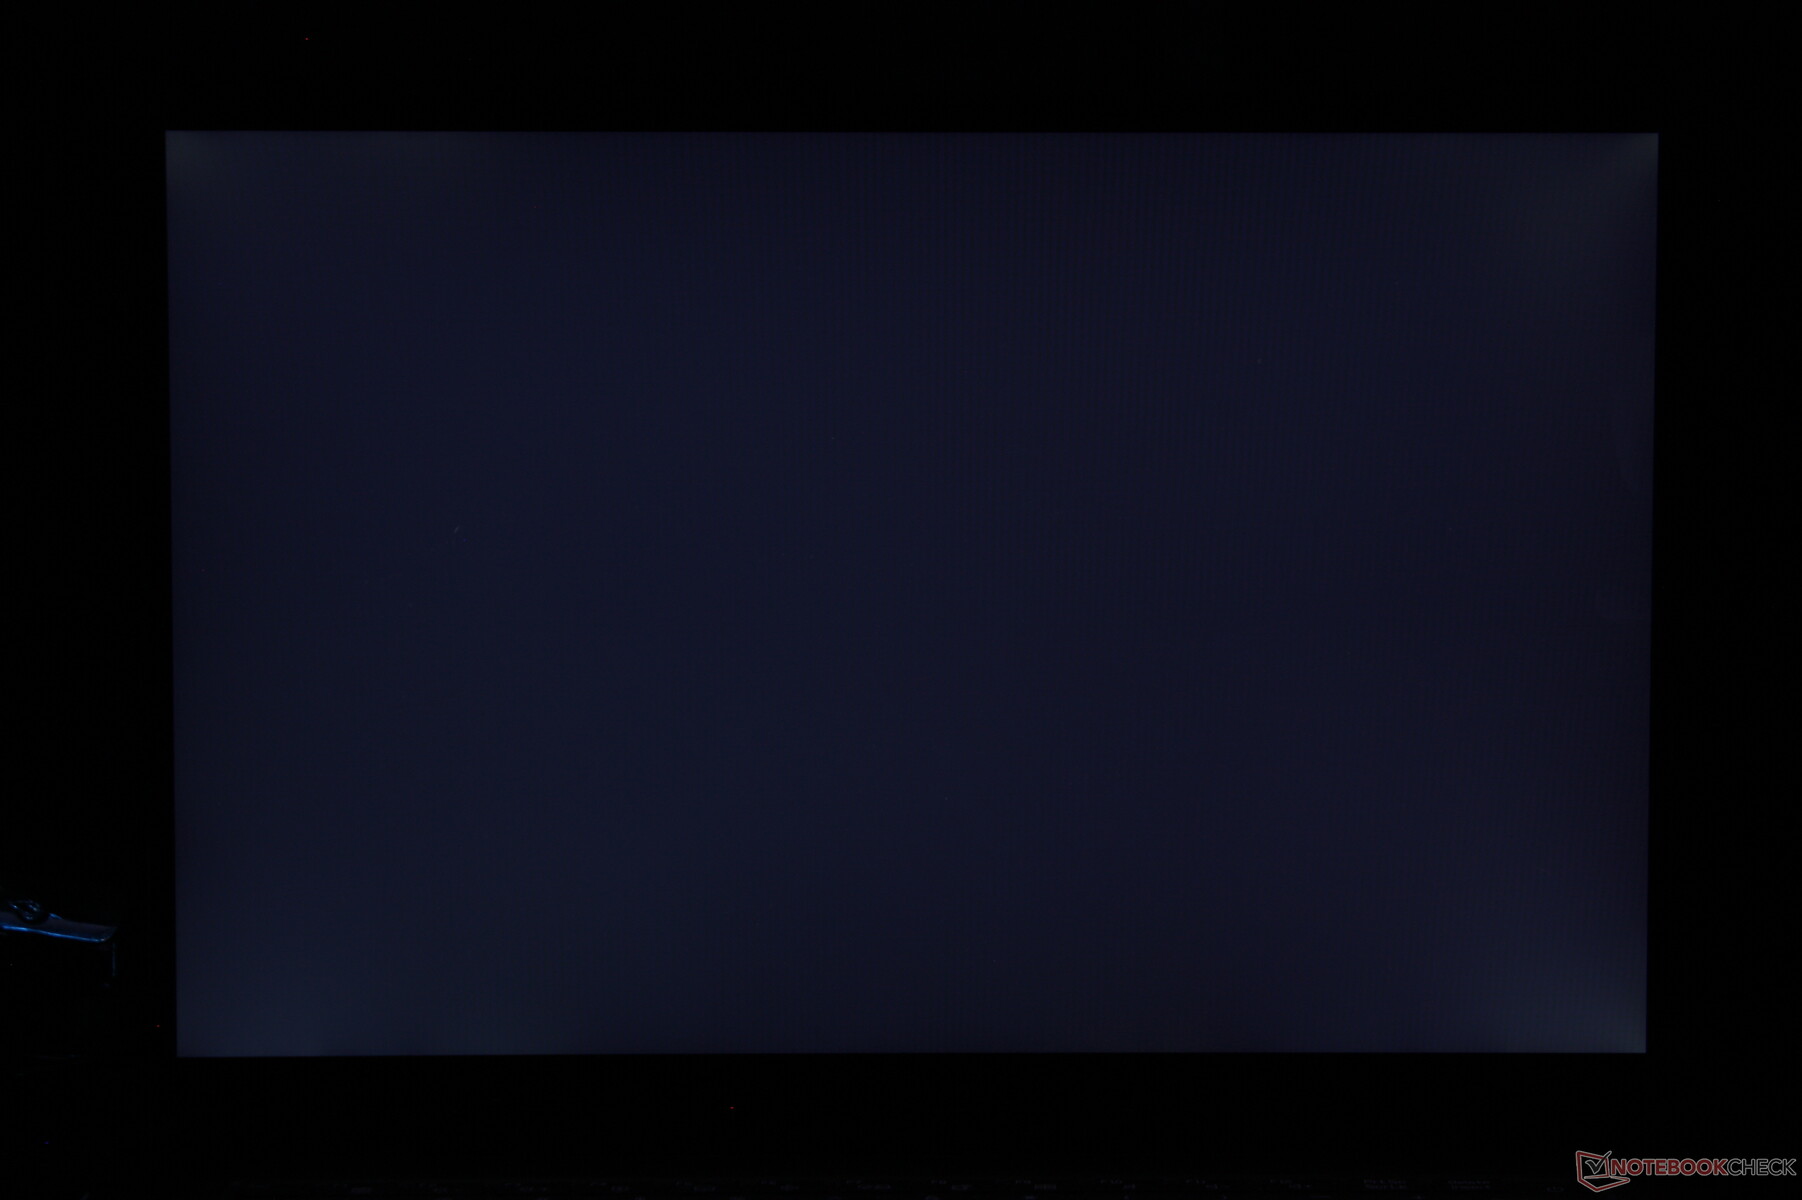
iluminação: 87 %
iluminação com acumulador: 305.5 cd/m²
Contraste: 1131:1 (Preto: 0.27 cd/m²)
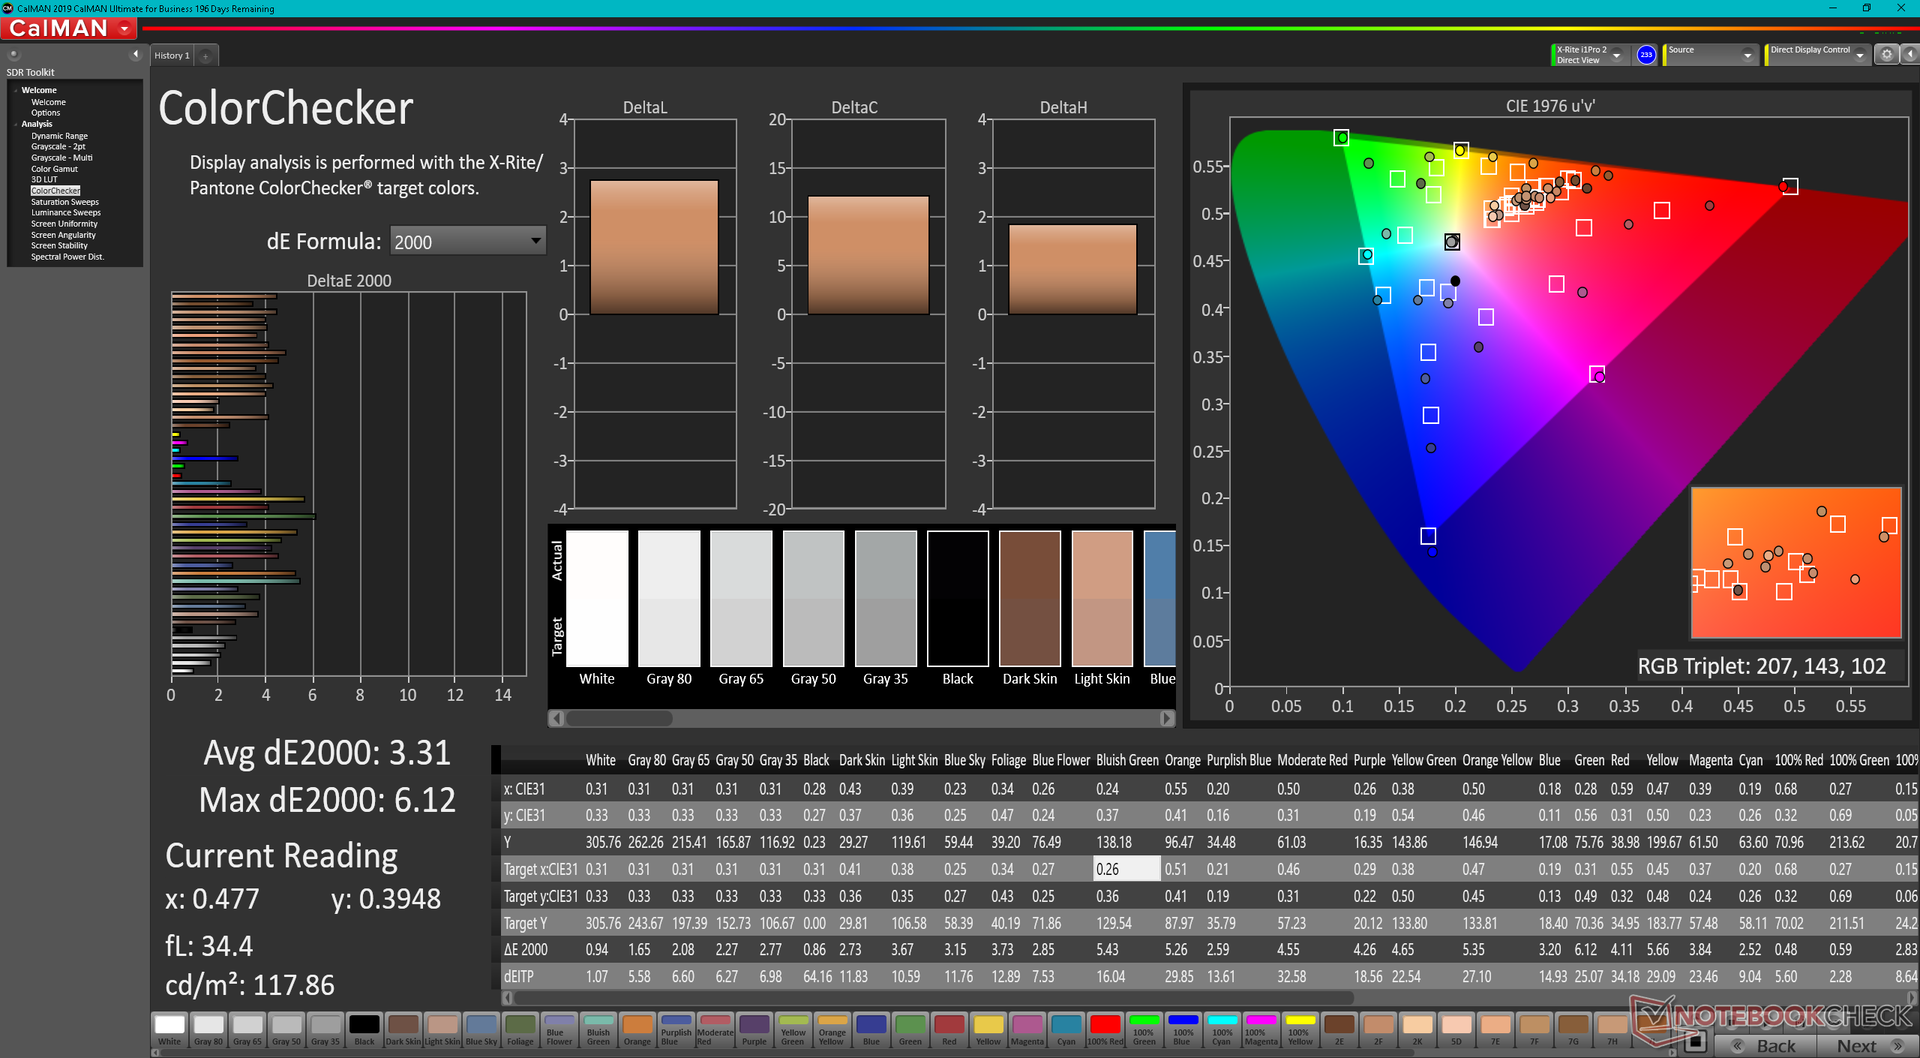
ΔE ColorChecker Calman: 3.31 | ∀{0.5-29.43 Ø4.71}
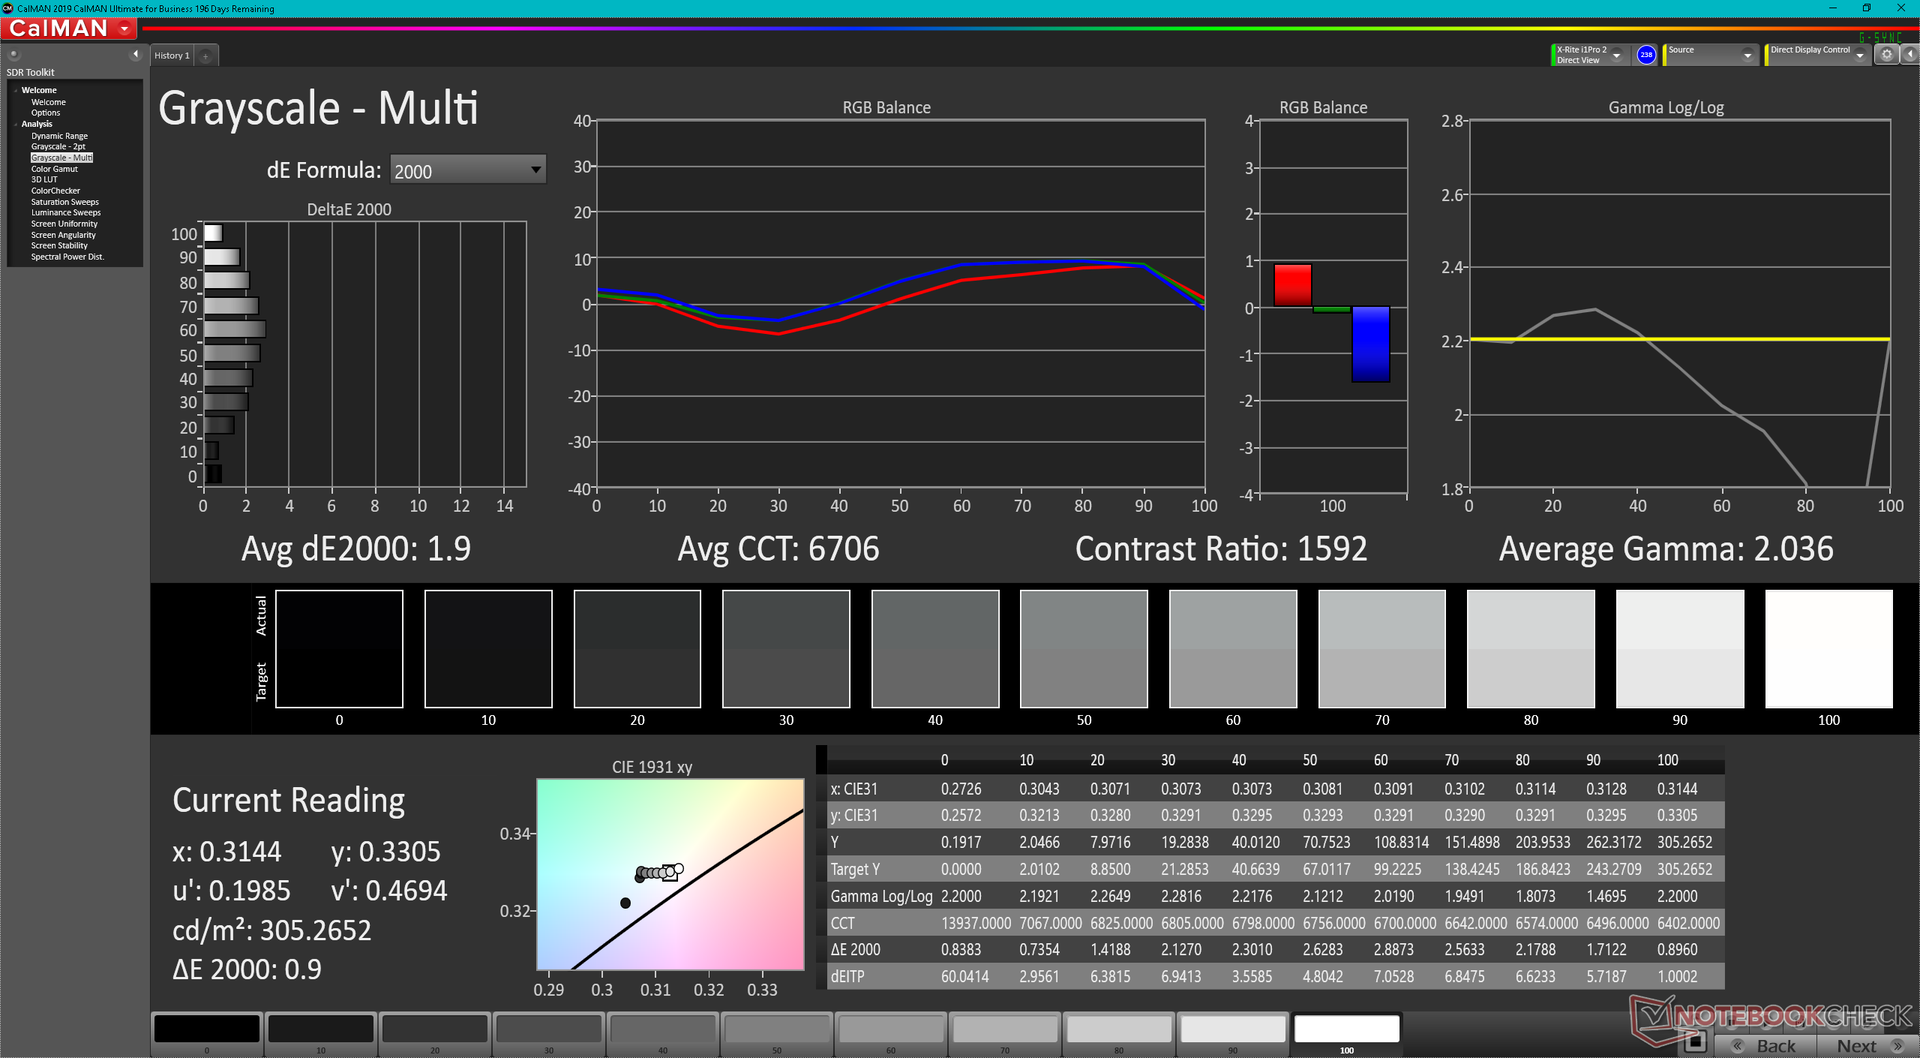
ΔE Greyscale Calman: 1.9 | ∀{0.09-98 Ø4.96}
100% sRGB (Argyll 3D)
98.8% Display P3 (Argyll 3D)
Gamma: 2.04
CCT: 6706 K
| LG Gram 14T90P LG Philips LP140WU1-SPA1, IPS, 1900x1200, 14" | Dell XPS 13 9310 2-in-1 Sharp LQ134N1, IPS, 1920x1200, 13.4" | Lenovo Yoga 9 14IAP7 82LU0001US Lenovo LEN140WQ+, OLED, 2880x1800, 14" | Asus ZenBook Flip 14 UN5401QA-KN085W SDC4154, OLED, 2880x1800, 14" | HP Spectre x360 14-ea0378ng Samsung SDC4148, OLED, 3000x2000, 13.5" | MSI Summit E13 Flip Evo A11MT Sharp LQ134N1JW53, IPS, 1920x1200, 13.4" | LG Gram 14T90N LG Philips LP140WFA-SPY1, IPS, 1920x1080, 14" | |
|---|---|---|---|---|---|---|---|
| Display | -15% | 1% | 1% | 1% | -15% | -19% | |
| Display P3 Coverage (%) | 98.8 | 69.7 -29% | 99.8 1% | 99.7 1% | 99.9 1% | 69.8 -29% | 65 -34% |
| sRGB Coverage (%) | 100 | 99 -1% | 100 0% | 100 0% | 100 0% | 98.8 -1% | 95.7 -4% |
| AdobeRGB 1998 Coverage (%) | 71.7 | 98.7 | 98.6 | 96.1 | 70.6 | 66.7 | |
| Response Times | -31% | 97% | 94% | 94% | -46% | -16% | |
| Response Time Grey 50% / Grey 80% * (ms) | 44 ? | 55.6 ? -26% | 1.2 ? 97% | 2 ? 95% | 2 ? 95% | 64 ? -45% | 54 ? -23% |
| Response Time Black / White * (ms) | 30 ? | 40.4 ? -35% | 1.2 ? 96% | 2 ? 93% | 2 ? 93% | 44 ? -47% | 32.8 ? -9% |
| PWM Frequency (Hz) | 2500 ? | 347.2 ? | 250 ? | ||||
| Screen | -16% | -13% | 11% | 419% | 38% | -12% | |
| Brightness middle (cd/m²) | 305.5 | 555.7 82% | 367.3 20% | 366 20% | 370 21% | 551.3 80% | 322.2 5% |
| Brightness (cd/m²) | 289 | 528 83% | 369 28% | 369 28% | 374 29% | 517 79% | 301 4% |
| Brightness Distribution (%) | 87 | 90 3% | 97 11% | 96 10% | 90 3% | 91 5% | 86 -1% |
| Black Level * (cd/m²) | 0.27 | 0.35 -30% | 0.01 96% | 0.37 -37% | 0.25 7% | ||
| Contrast (:1) | 1131 | 1588 40% | 37000 3171% | 1490 32% | 1289 14% | ||
| Colorchecker dE 2000 * | 3.31 | 4.83 -46% | 5.2 -57% | 2.84 14% | 2.57 22% | 1.45 56% | 3.62 -9% |
| Colorchecker dE 2000 max. * | 6.12 | 8.46 -38% | 8.04 -31% | 5.29 14% | 4.52 26% | 2.86 53% | 6.9 -13% |
| Greyscale dE 2000 * | 1.9 | 6.1 -221% | 2.8 -47% | 2.32 -22% | 2.2 -16% | 1.3 32% | 3.9 -105% |
| Gamma | 2.04 108% | 1.98 111% | 2.21 100% | 2.44 90% | 2.36 93% | 2.14 103% | 2.43 91% |
| CCT | 6706 97% | 6686 97% | 5992 108% | 6170 105% | 6154 106% | 6580 99% | 6344 102% |
| Colorchecker dE 2000 calibrated * | 0.76 | 2.81 | 2.31 | 1.7 | 1.22 | ||
| Color Space (Percent of AdobeRGB 1998) (%) | 85.8 | 65 | 61.3 | ||||
| Color Space (Percent of sRGB) (%) | 100 | 99 | 95.6 | ||||
| Média Total (Programa/Configurações) | -21% /
-18% | 28% /
12% | 35% /
25% | 171% /
295% | -8% /
15% | -16% /
-14% |
* ... menor é melhor
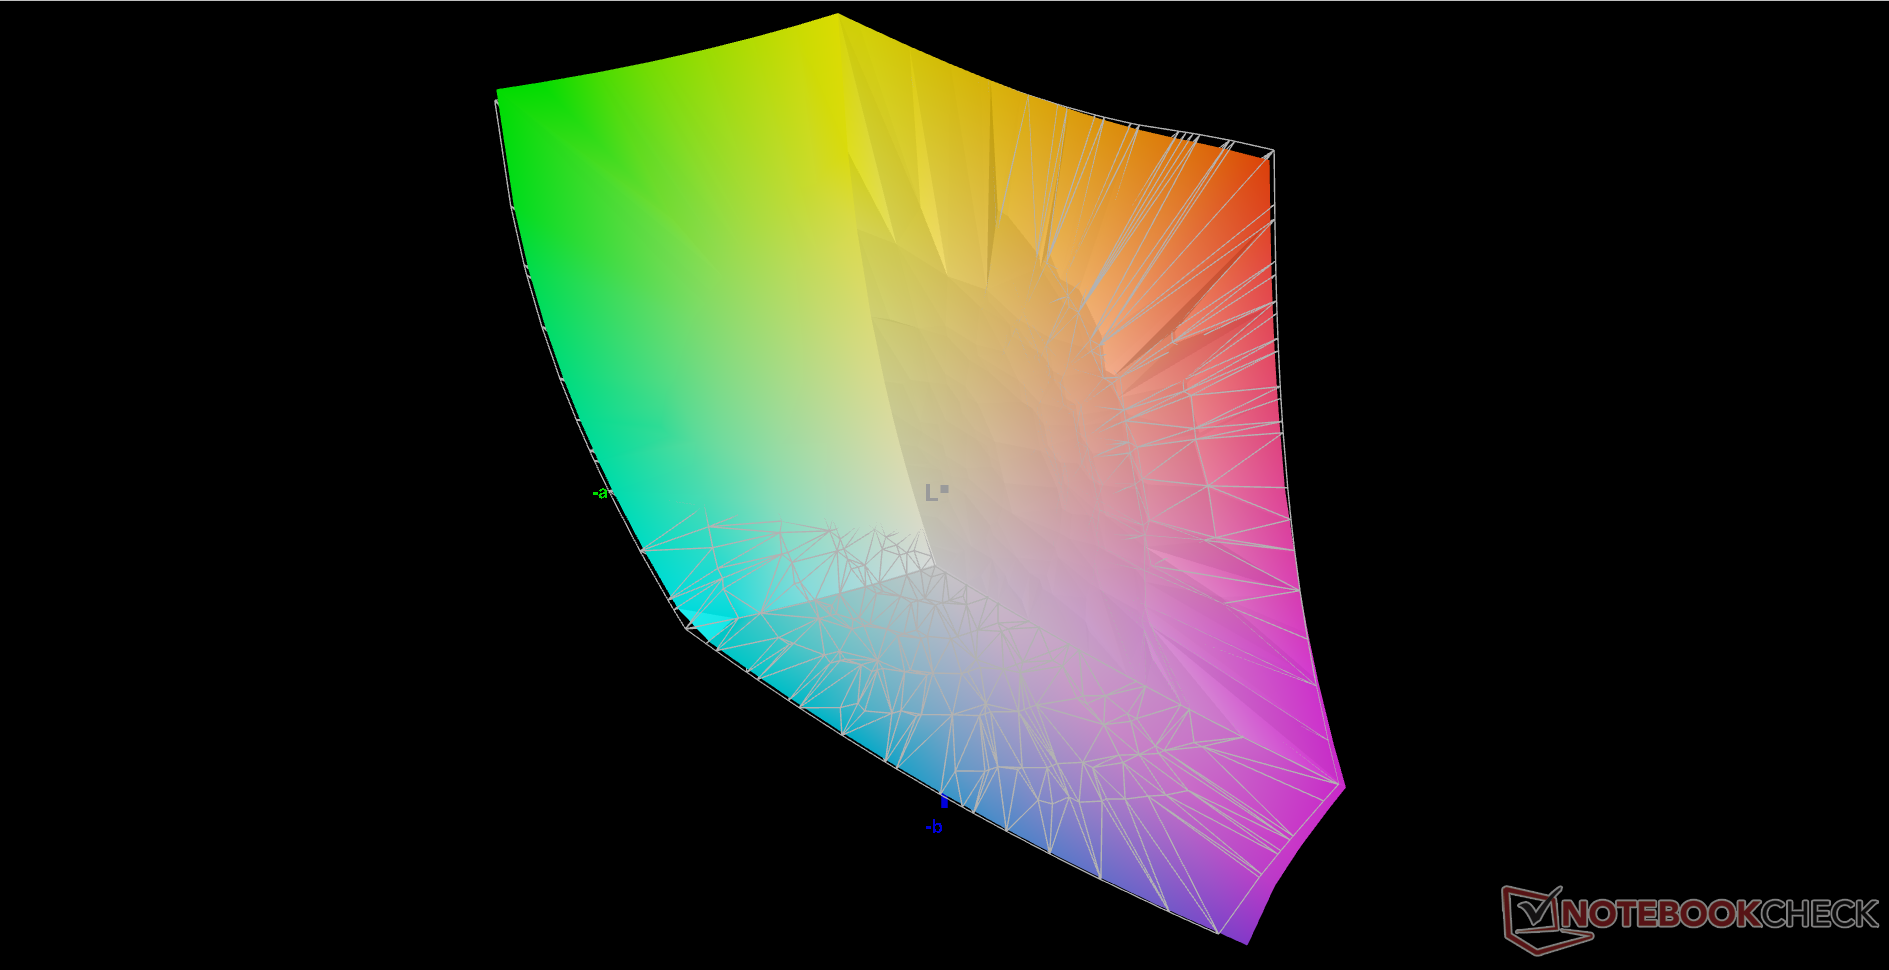
A LG anuncia 99% de cobertura DCI-P3 e podemos confirmar o mesmo com nosso próprio colorímetro X-Rite. O cálculo do AdobeRGB resulta em um erro estranhamente, mas a cobertura deve ser muito semelhante em ~99%. Este é um dos poucos painéis IPS de 14 polegadas 16:10 para oferecer uma gama semelhante à maioria dos painéis OLED.
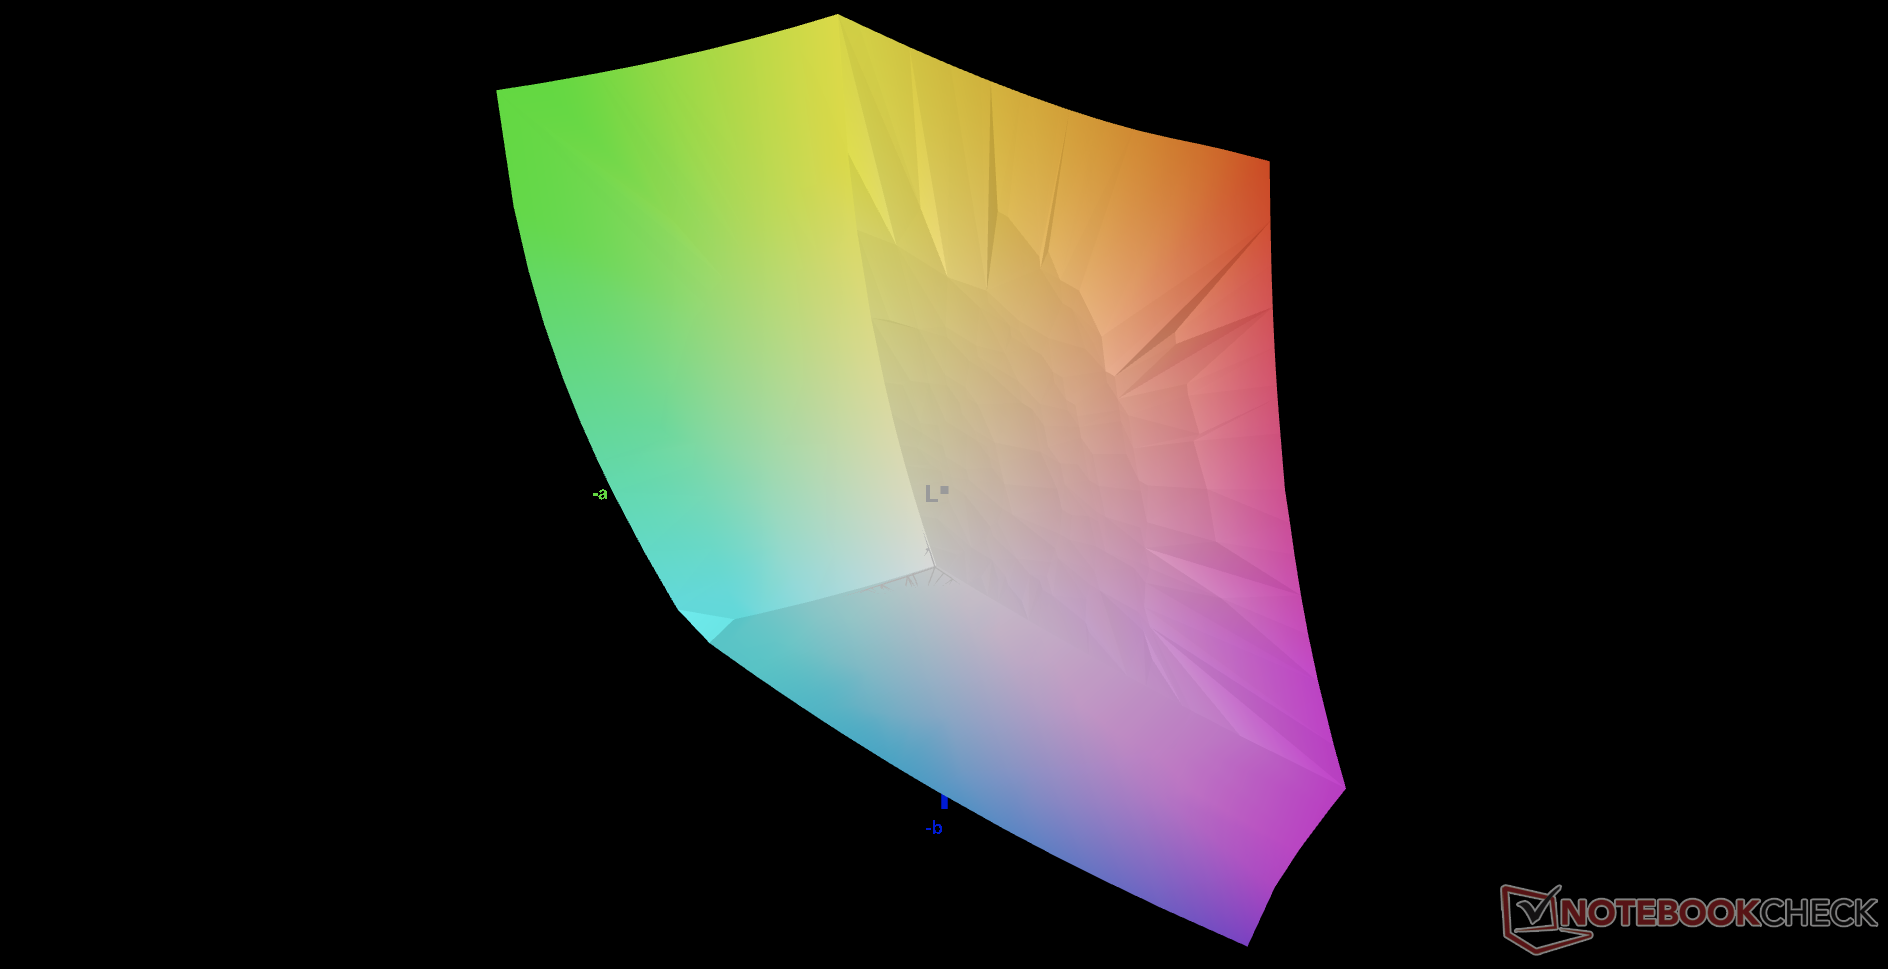
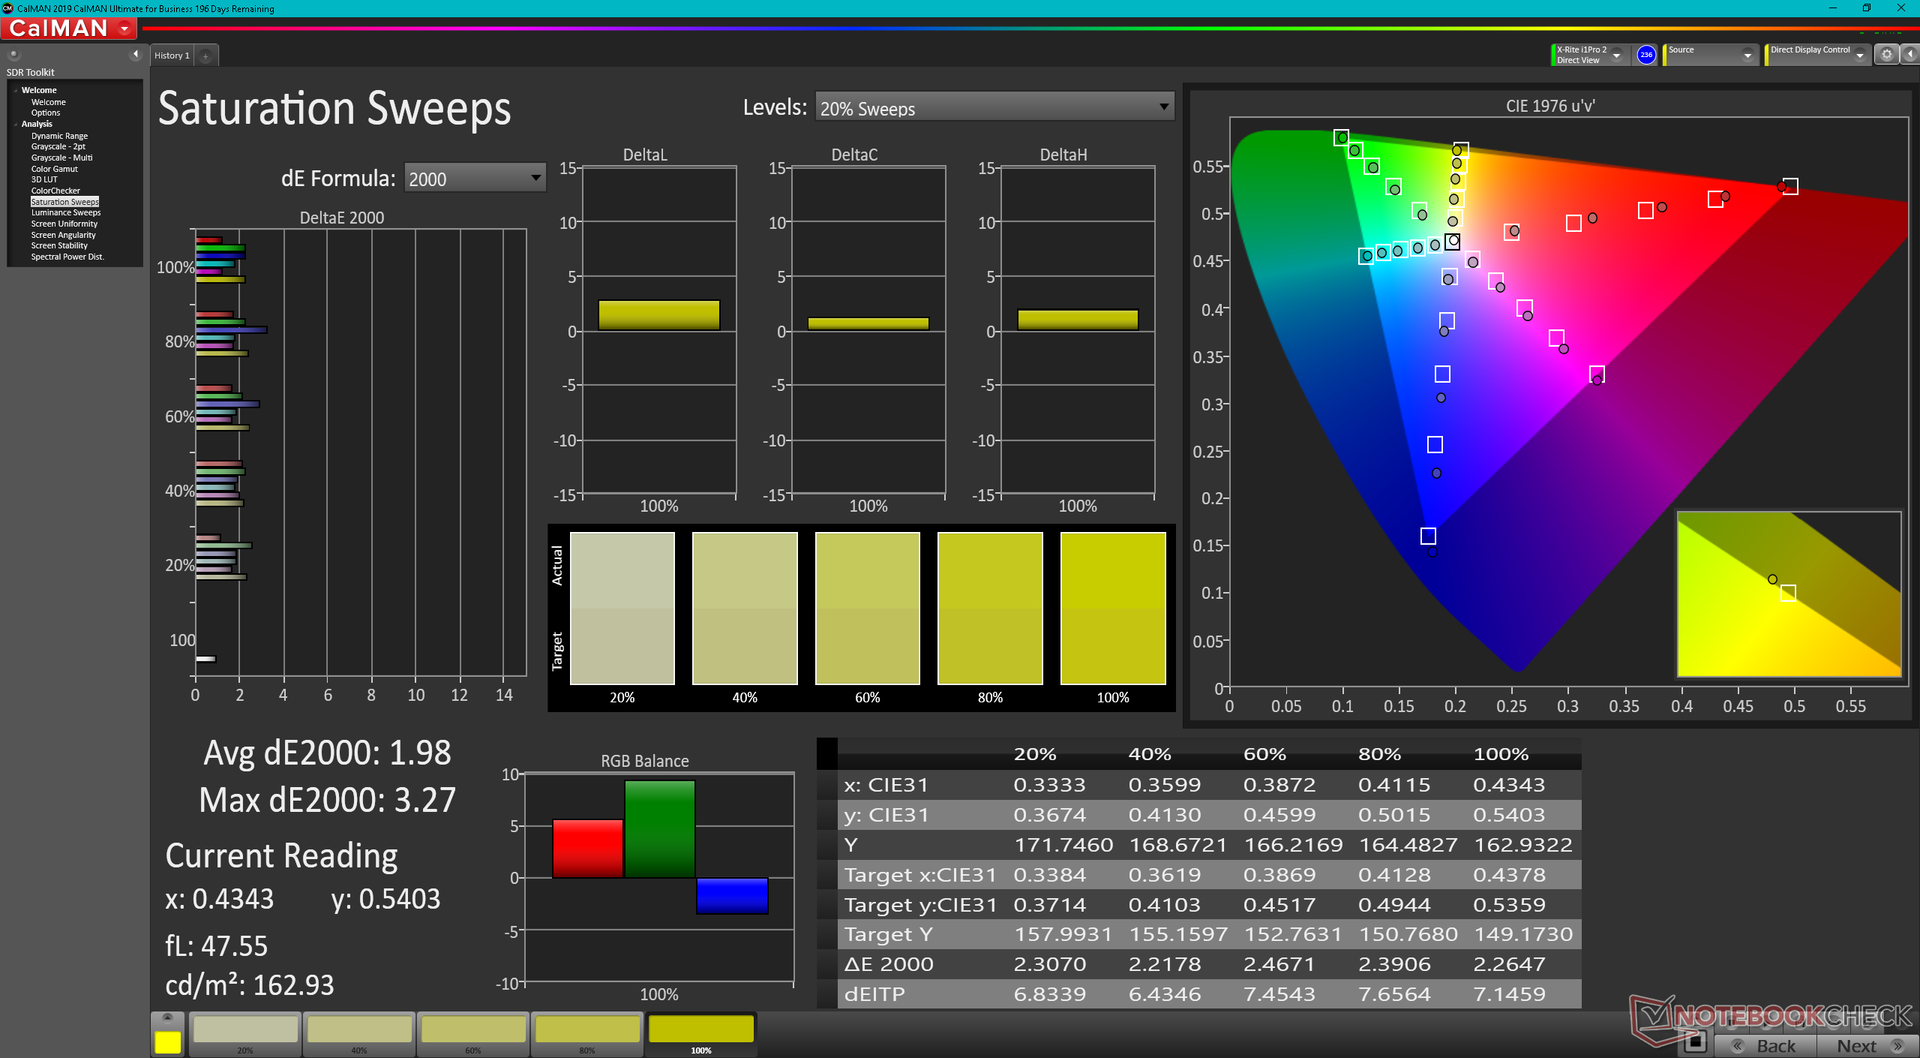
O display é decentemente calibrado fora da caixa. Os valores médios de escala de cinza e ColorChecker DeltaE ficariam em apenas 1,9 e 3,31, respectivamente.
Exibir tempos de resposta
| ↔ Tempo de resposta preto para branco | ||
|---|---|---|
| 30 ms ... ascensão ↗ e queda ↘ combinadas | ↗ 15.2 ms ascensão | 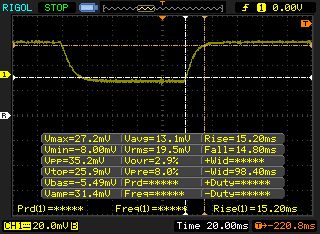 |
| ↘ 14.8 ms queda | ||
| A tela mostra taxas de resposta lentas em nossos testes e será insatisfatória para os jogadores. Em comparação, todos os dispositivos testados variam de 0.1 (mínimo) a 240 (máximo) ms. » 80 % de todos os dispositivos são melhores. Isso significa que o tempo de resposta medido é pior que a média de todos os dispositivos testados (19.8 ms). | ||
| ↔ Tempo de resposta 50% cinza a 80% cinza | ||
| 44 ms ... ascensão ↗ e queda ↘ combinadas | ↗ 21.2 ms ascensão | 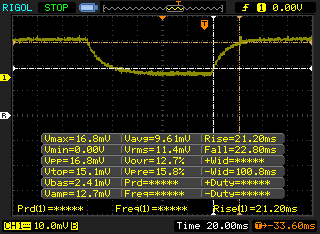 |
| ↘ 22.8 ms queda | ||
| A tela mostra taxas de resposta lentas em nossos testes e será insatisfatória para os jogadores. Em comparação, todos os dispositivos testados variam de 0.165 (mínimo) a 636 (máximo) ms. » 73 % de todos os dispositivos são melhores. Isso significa que o tempo de resposta medido é pior que a média de todos os dispositivos testados (31 ms). | ||
Cintilação da tela / PWM (modulação por largura de pulso)
| Tela tremeluzindo / PWM não detectado | 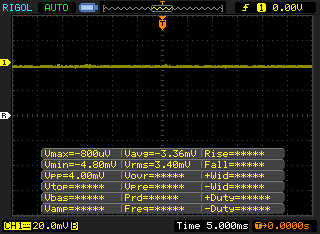 | ||
[pwm_comparison] Em comparação: 52 % de todos os dispositivos testados não usam PWM para escurecer a tela. Se PWM foi detectado, uma média de 7757 (mínimo: 5 - máximo: 343500) Hz foi medida. | |||
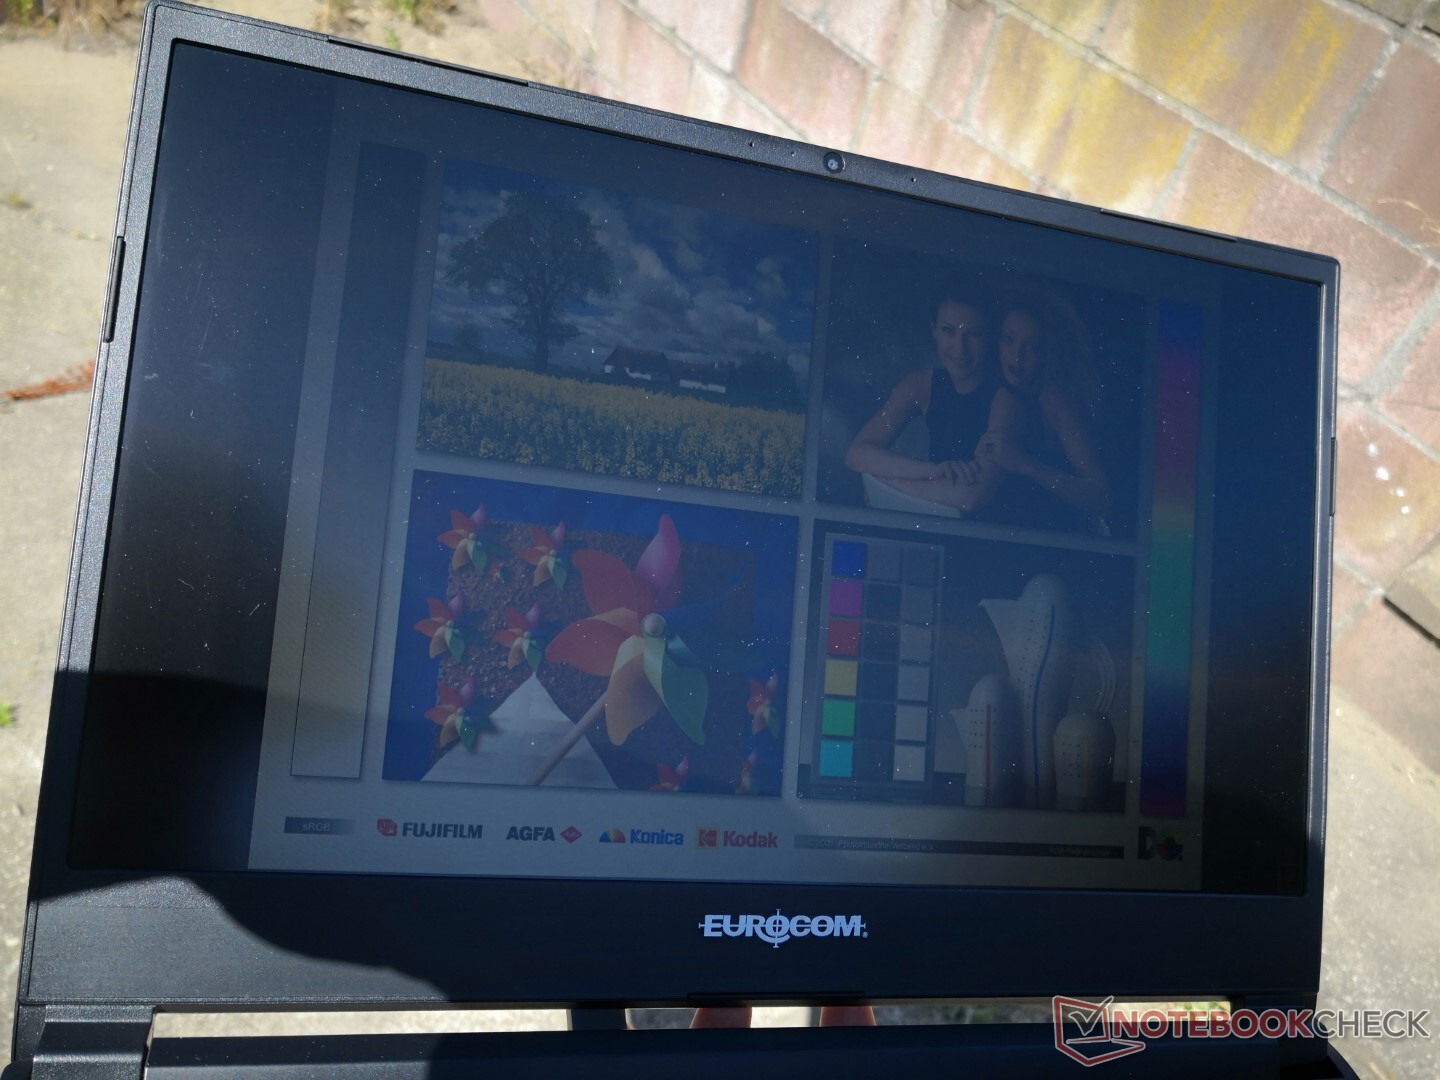
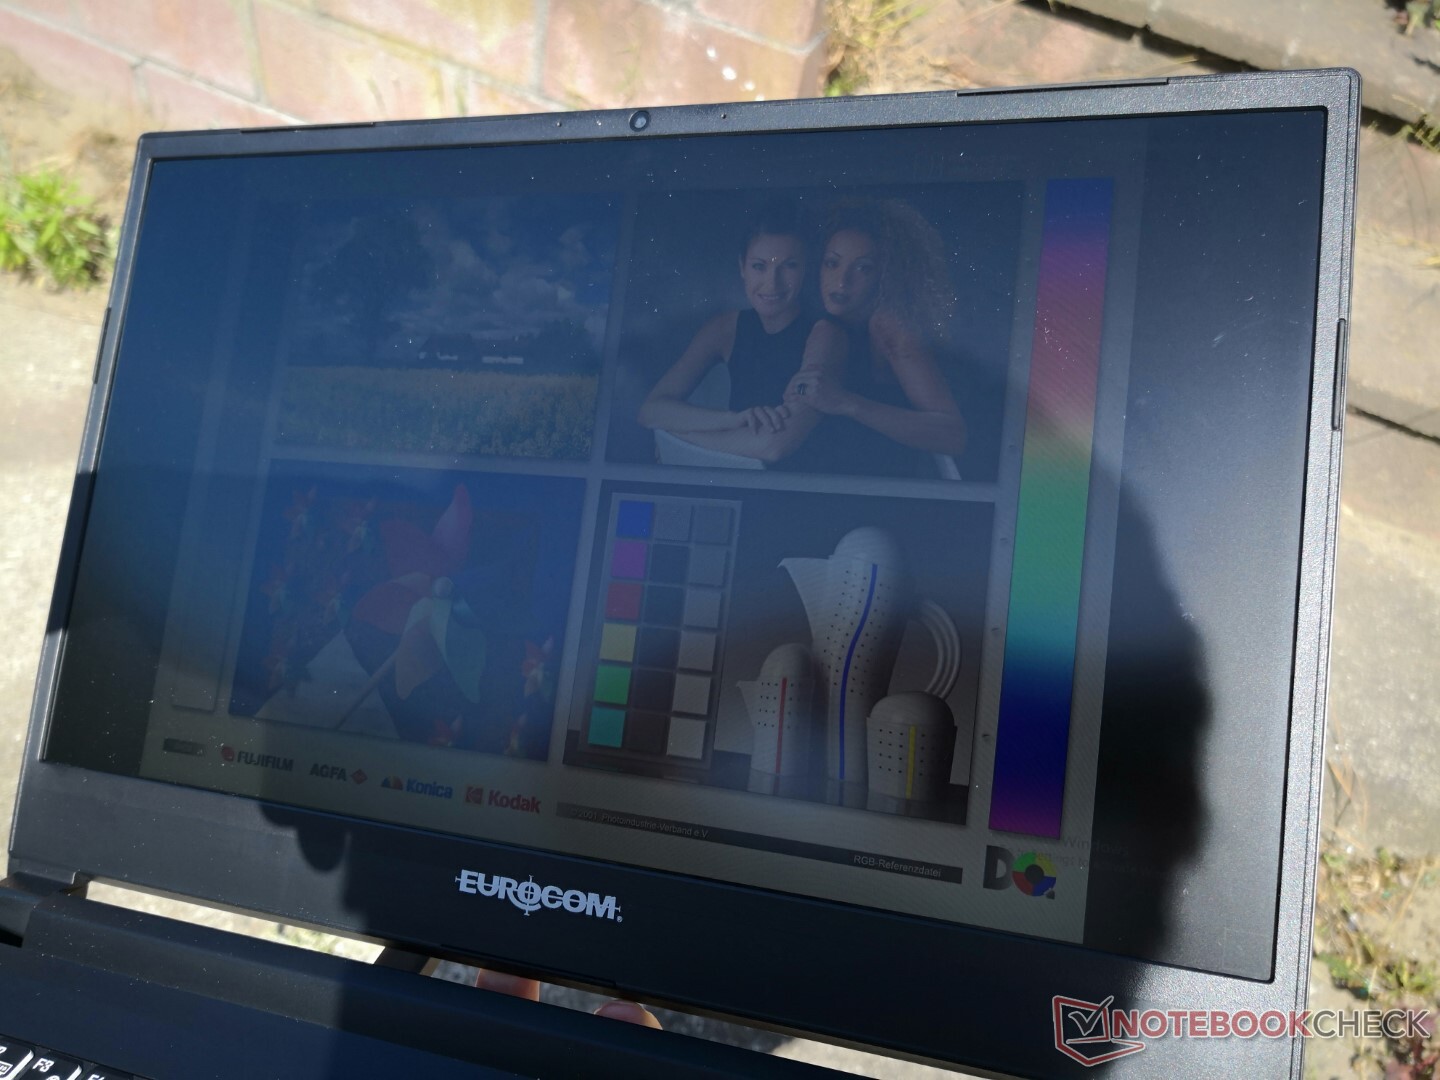
Com 300 lêndeas, o display é brilhante o suficiente para condições internas, mas não quase onde ele precisa estar para uma visão confortável ao ar livre. Alternativas como oDell XPS 13 9310 2 em 1 ou MSI Summit E13 Flip têm displays muito mais brilhantes com mais de 500 lêndeas cada um para serem mais facilmente visualizados ao ar livre.
Desempenho - 11ª geração Intel
Condições de teste
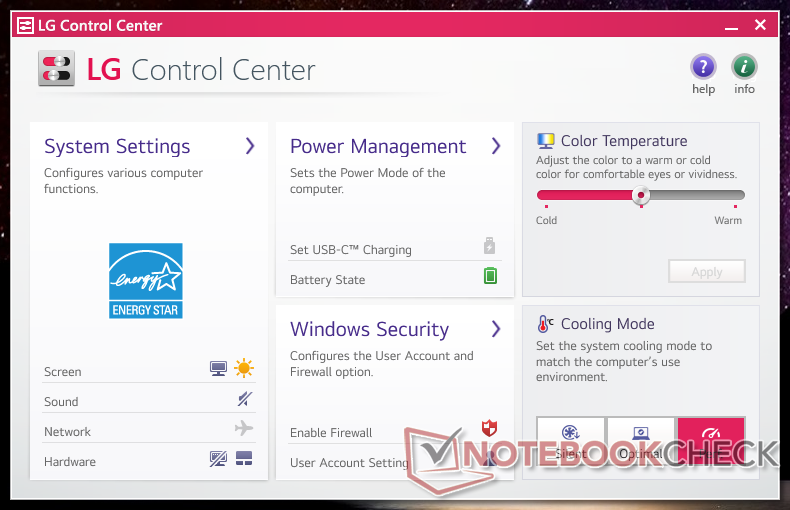
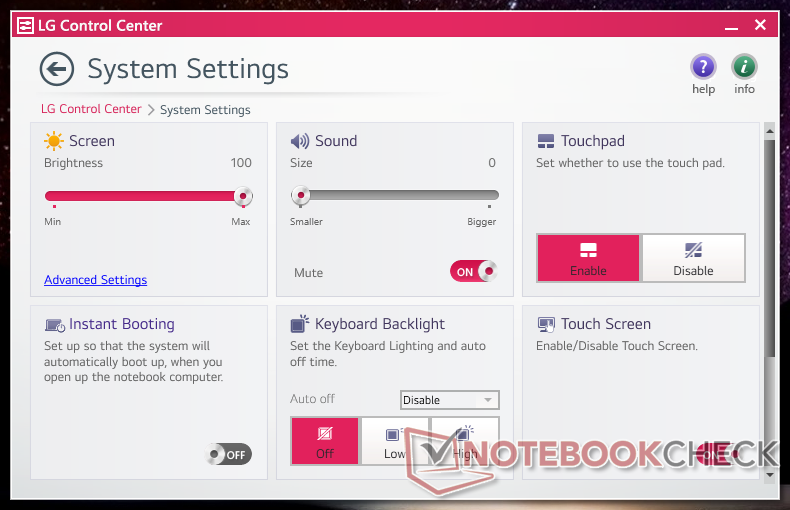
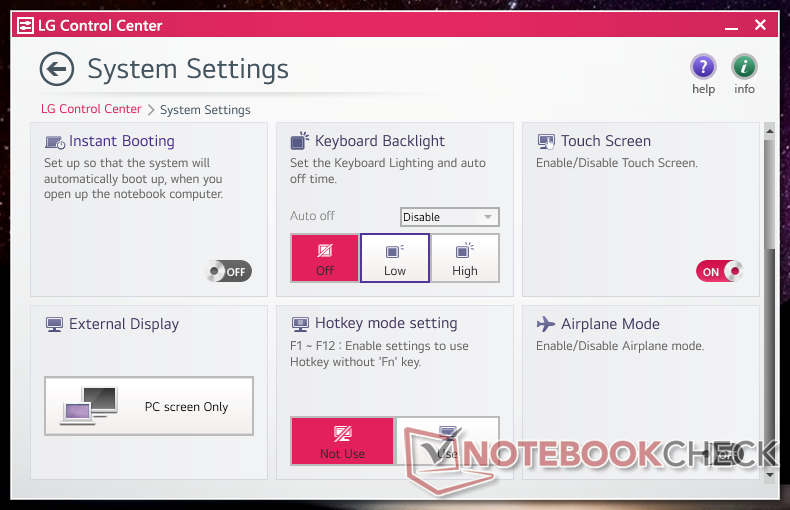
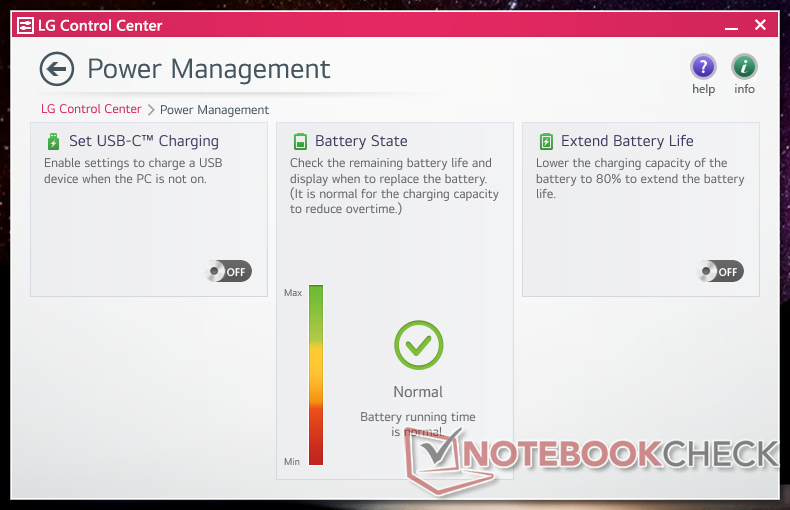
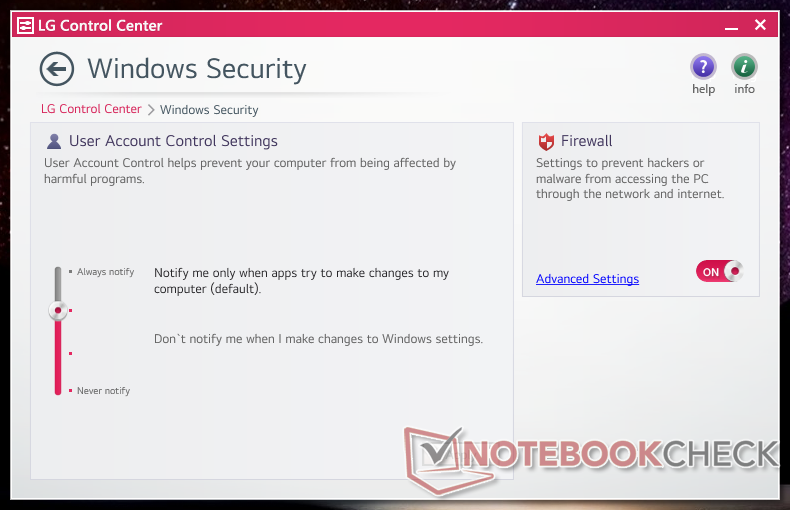
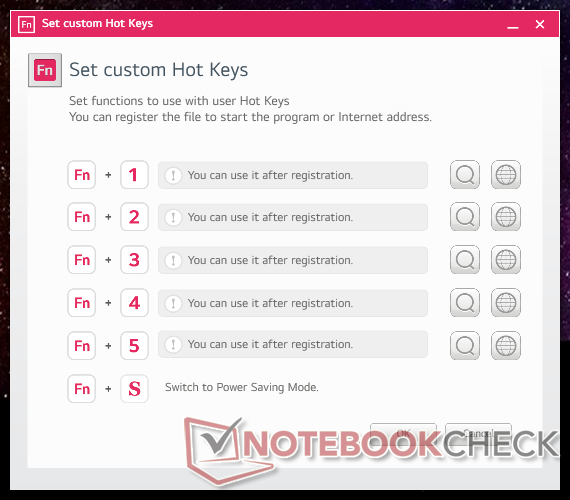
Nossa unidade foi configurada para o modo Performance antes de executar quaisquer benchmarks de performance para as mais altas pontuações possíveis. É altamente recomendável se familiarizar com o software pré-instalado do LG Control Center, pois as principais configurações e características são alternadas aqui, como mostrado pelas telas abaixo. Curiosamente, a interface do software é muito pequena e não pode ser maximizada
Note que o sistema será automaticamente reinicializado para o modo Balanceado após cada reinicialização ou desligamento, mesmo que o perfil de potência tenha sido definido para Silencioso ou Desempenho antes.
Processador
O desempenho da CPU está dentro de alguns pontos percentuais da média do laptop em nosso banco de dados equipado com o mesmo Núcleo i5-1135G7 processador. Assim, o desempenho não está sendo estrangulado por muito só para caber em um projeto de chassi conversível ultraleve. Atualização para o Núcleo i7-1165G7 A SKU tem o potencial de aumentar o desempenho multi-tarefa em até 25%, mas provavelmente será muito menor, pois o Core i5 em nossa configuração já pode atingir temperaturas superiores a 90 C
A sustentabilidade do Turbo Boost é boa, mas não perfeita. Ao executar o CineBench R15 xT em loop, nossa pontuação inicial de 796 pontos eventualmente cairia e se estabilizaria em cerca de 666 pontos para representar uma queda de desempenho de 16% ao longo do tempo, devido a limitações térmicas. Tanto o Dell Latitude 14 eAcer Swift 3 SF314 são capazes de executar o mesmo processador consistentemente mais rápido, como mostra nosso gráfico de comparação abaixo.
Cinebench R15 Multi Loop
Cinebench R23: Multi Core | Single Core
Cinebench R15: CPU Multi 64Bit | CPU Single 64Bit
Blender: v2.79 BMW27 CPU
7-Zip 18.03: 7z b 4 | 7z b 4 -mmt1
Geekbench 5.5: Multi-Core | Single-Core
HWBOT x265 Benchmark v2.2: 4k Preset
LibreOffice : 20 Documents To PDF
R Benchmark 2.5: Overall mean
Cinebench R23: Multi Core | Single Core
Cinebench R15: CPU Multi 64Bit | CPU Single 64Bit
Blender: v2.79 BMW27 CPU
7-Zip 18.03: 7z b 4 | 7z b 4 -mmt1
Geekbench 5.5: Multi-Core | Single-Core
HWBOT x265 Benchmark v2.2: 4k Preset
LibreOffice : 20 Documents To PDF
R Benchmark 2.5: Overall mean
* ... menor é melhor
AIDA64: FP32 Ray-Trace | FPU Julia | CPU SHA3 | CPU Queen | FPU SinJulia | FPU Mandel | CPU AES | CPU ZLib | FP64 Ray-Trace | CPU PhotoWorxx
| Performance rating | |
| Asus ZenBook Flip 14 UN5401QA-KN085W | |
| Lenovo Yoga 9 14IAP7 82LU0001US | |
| MSI Summit E13 Flip Evo A11MT | |
| LG Gram 14T90P | |
| Dell XPS 13 9310 2-in-1 | |
| Média Intel Core i5-1135G7 | |
| HP Spectre x360 14-ea0378ng | |
| AIDA64 / FP32 Ray-Trace | |
| Asus ZenBook Flip 14 UN5401QA-KN085W | |
| MSI Summit E13 Flip Evo A11MT | |
| LG Gram 14T90P | |
| Dell XPS 13 9310 2-in-1 | |
| Média Intel Core i5-1135G7 (4313 - 7952, n=45) | |
| Lenovo Yoga 9 14IAP7 82LU0001US | |
| HP Spectre x360 14-ea0378ng | |
| AIDA64 / FPU Julia | |
| Asus ZenBook Flip 14 UN5401QA-KN085W | |
| MSI Summit E13 Flip Evo A11MT | |
| Dell XPS 13 9310 2-in-1 | |
| LG Gram 14T90P | |
| Média Intel Core i5-1135G7 (19402 - 32283, n=45) | |
| Lenovo Yoga 9 14IAP7 82LU0001US | |
| HP Spectre x360 14-ea0378ng | |
| AIDA64 / CPU SHA3 | |
| Asus ZenBook Flip 14 UN5401QA-KN085W | |
| MSI Summit E13 Flip Evo A11MT | |
| Dell XPS 13 9310 2-in-1 | |
| LG Gram 14T90P | |
| Lenovo Yoga 9 14IAP7 82LU0001US | |
| Média Intel Core i5-1135G7 (1316 - 2172, n=45) | |
| HP Spectre x360 14-ea0378ng | |
| AIDA64 / CPU Queen | |
| Asus ZenBook Flip 14 UN5401QA-KN085W | |
| Lenovo Yoga 9 14IAP7 82LU0001US | |
| MSI Summit E13 Flip Evo A11MT | |
| HP Spectre x360 14-ea0378ng | |
| Dell XPS 13 9310 2-in-1 | |
| LG Gram 14T90P | |
| Média Intel Core i5-1135G7 (39000 - 46951, n=45) | |
| AIDA64 / FPU SinJulia | |
| Asus ZenBook Flip 14 UN5401QA-KN085W | |
| Lenovo Yoga 9 14IAP7 82LU0001US | |
| MSI Summit E13 Flip Evo A11MT | |
| LG Gram 14T90P | |
| Dell XPS 13 9310 2-in-1 | |
| Média Intel Core i5-1135G7 (3497 - 4445, n=45) | |
| HP Spectre x360 14-ea0378ng | |
| AIDA64 / FPU Mandel | |
| Asus ZenBook Flip 14 UN5401QA-KN085W | |
| MSI Summit E13 Flip Evo A11MT | |
| Dell XPS 13 9310 2-in-1 | |
| LG Gram 14T90P | |
| Média Intel Core i5-1135G7 (12569 - 19635, n=45) | |
| Lenovo Yoga 9 14IAP7 82LU0001US | |
| HP Spectre x360 14-ea0378ng | |
| AIDA64 / CPU AES | |
| Asus ZenBook Flip 14 UN5401QA-KN085W | |
| MSI Summit E13 Flip Evo A11MT | |
| Dell XPS 13 9310 2-in-1 | |
| LG Gram 14T90P | |
| Média Intel Core i5-1135G7 (28988 - 67977, n=45) | |
| HP Spectre x360 14-ea0378ng | |
| Lenovo Yoga 9 14IAP7 82LU0001US | |
| AIDA64 / CPU ZLib | |
| Asus ZenBook Flip 14 UN5401QA-KN085W | |
| Lenovo Yoga 9 14IAP7 82LU0001US | |
| MSI Summit E13 Flip Evo A11MT | |
| LG Gram 14T90P | |
| Dell XPS 13 9310 2-in-1 | |
| Média Intel Core i5-1135G7 (265 - 373, n=51) | |
| HP Spectre x360 14-ea0378ng | |
| AIDA64 / FP64 Ray-Trace | |
| Asus ZenBook Flip 14 UN5401QA-KN085W | |
| MSI Summit E13 Flip Evo A11MT | |
| LG Gram 14T90P | |
| Dell XPS 13 9310 2-in-1 | |
| Média Intel Core i5-1135G7 (2226 - 4291, n=45) | |
| Lenovo Yoga 9 14IAP7 82LU0001US | |
| HP Spectre x360 14-ea0378ng | |
| AIDA64 / CPU PhotoWorxx | |
| Lenovo Yoga 9 14IAP7 82LU0001US | |
| LG Gram 14T90P | |
| MSI Summit E13 Flip Evo A11MT | |
| Dell XPS 13 9310 2-in-1 | |
| HP Spectre x360 14-ea0378ng | |
| Média Intel Core i5-1135G7 (9004 - 45366, n=45) | |
| Asus ZenBook Flip 14 UN5401QA-KN085W | |
Desempenho do sistema
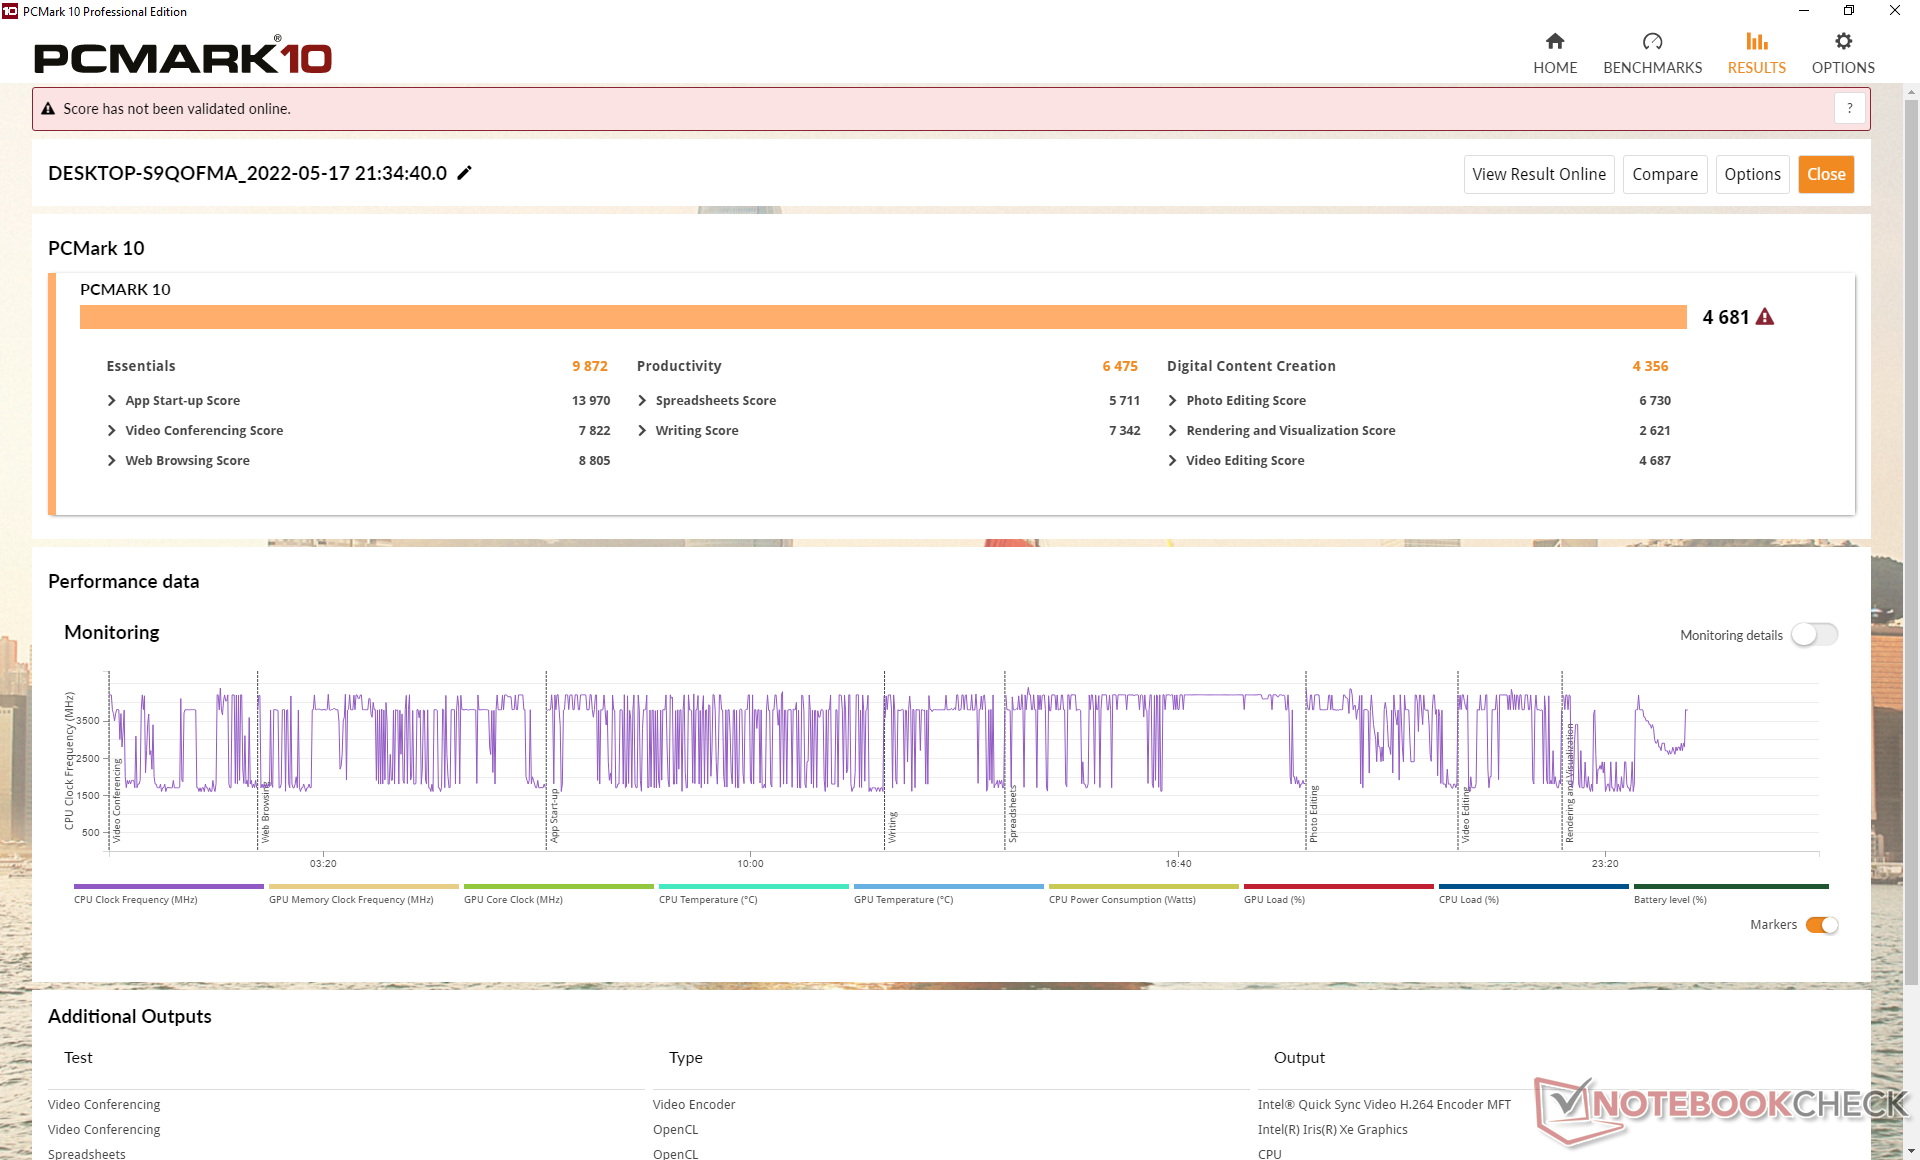
Os resultados do PCMark 10 são geralmente mais altos do que no antigo Gram 14T90N, especialmente no sub-teste de Criação de Conteúdo Digital, onde o desempenho da GPU é favorecido. Nossa pontuação de Produtividade, no entanto, é menor por razões desconhecidas.
CrossMark: Overall | Productivity | Creativity | Responsiveness
| PCMark 10 / Score | |
| Asus ZenBook Flip 14 UN5401QA-KN085W | |
| Lenovo Yoga 9 14IAP7 82LU0001US | |
| Dell XPS 13 9310 2-in-1 | |
| MSI Summit E13 Flip Evo A11MT | |
| LG Gram 14T90P | |
| Média Intel Core i5-1135G7, Intel Iris Xe Graphics G7 80EUs (4026 - 4952, n=53) | |
| HP Spectre x360 14-ea0378ng | |
| LG Gram 14T90N | |
| PCMark 10 / Essentials | |
| Lenovo Yoga 9 14IAP7 82LU0001US | |
| Dell XPS 13 9310 2-in-1 | |
| Asus ZenBook Flip 14 UN5401QA-KN085W | |
| LG Gram 14T90P | |
| HP Spectre x360 14-ea0378ng | |
| Média Intel Core i5-1135G7, Intel Iris Xe Graphics G7 80EUs (8149 - 9917, n=53) | |
| LG Gram 14T90N | |
| MSI Summit E13 Flip Evo A11MT | |
| PCMark 10 / Productivity | |
| Asus ZenBook Flip 14 UN5401QA-KN085W | |
| LG Gram 14T90N | |
| MSI Summit E13 Flip Evo A11MT | |
| Dell XPS 13 9310 2-in-1 | |
| LG Gram 14T90P | |
| Lenovo Yoga 9 14IAP7 82LU0001US | |
| HP Spectre x360 14-ea0378ng | |
| Média Intel Core i5-1135G7, Intel Iris Xe Graphics G7 80EUs (5040 - 6619, n=53) | |
| PCMark 10 / Digital Content Creation | |
| Lenovo Yoga 9 14IAP7 82LU0001US | |
| Asus ZenBook Flip 14 UN5401QA-KN085W | |
| Dell XPS 13 9310 2-in-1 | |
| MSI Summit E13 Flip Evo A11MT | |
| Média Intel Core i5-1135G7, Intel Iris Xe Graphics G7 80EUs (3548 - 5255, n=53) | |
| LG Gram 14T90P | |
| HP Spectre x360 14-ea0378ng | |
| LG Gram 14T90N | |
| CrossMark / Overall | |
| Lenovo Yoga 9 14IAP7 82LU0001US | |
| LG Gram 14T90P | |
| Média Intel Core i5-1135G7, Intel Iris Xe Graphics G7 80EUs (1058 - 1293, n=11) | |
| CrossMark / Productivity | |
| Lenovo Yoga 9 14IAP7 82LU0001US | |
| LG Gram 14T90P | |
| Média Intel Core i5-1135G7, Intel Iris Xe Graphics G7 80EUs (1148 - 1332, n=11) | |
| CrossMark / Creativity | |
| Lenovo Yoga 9 14IAP7 82LU0001US | |
| LG Gram 14T90P | |
| Média Intel Core i5-1135G7, Intel Iris Xe Graphics G7 80EUs (895 - 1263, n=11) | |
| CrossMark / Responsiveness | |
| Lenovo Yoga 9 14IAP7 82LU0001US | |
| LG Gram 14T90P | |
| Média Intel Core i5-1135G7, Intel Iris Xe Graphics G7 80EUs (923 - 1320, n=11) | |
| PCMark 10 Score | 4681 pontos | |
Ajuda | ||
| AIDA64 / Memory Copy | |
| Lenovo Yoga 9 14IAP7 82LU0001US | |
| LG Gram 14T90P | |
| Dell XPS 13 9310 2-in-1 | |
| MSI Summit E13 Flip Evo A11MT | |
| HP Spectre x360 14-ea0378ng | |
| Média Intel Core i5-1135G7 (17443 - 63889, n=45) | |
| Asus ZenBook Flip 14 UN5401QA-KN085W | |
| AIDA64 / Memory Read | |
| Lenovo Yoga 9 14IAP7 82LU0001US | |
| LG Gram 14T90P | |
| Dell XPS 13 9310 2-in-1 | |
| MSI Summit E13 Flip Evo A11MT | |
| HP Spectre x360 14-ea0378ng | |
| Média Intel Core i5-1135G7 (19716 - 63705, n=45) | |
| Asus ZenBook Flip 14 UN5401QA-KN085W | |
| AIDA64 / Memory Write | |
| LG Gram 14T90P | |
| Dell XPS 13 9310 2-in-1 | |
| Lenovo Yoga 9 14IAP7 82LU0001US | |
| MSI Summit E13 Flip Evo A11MT | |
| HP Spectre x360 14-ea0378ng | |
| Média Intel Core i5-1135G7 (18722 - 66778, n=45) | |
| Asus ZenBook Flip 14 UN5401QA-KN085W | |
| AIDA64 / Memory Latency | |
| Asus ZenBook Flip 14 UN5401QA-KN085W | |
| MSI Summit E13 Flip Evo A11MT | |
| Dell XPS 13 9310 2-in-1 | |
| HP Spectre x360 14-ea0378ng | |
| LG Gram 14T90P | |
| Média Intel Core i5-1135G7 (68.3 - 107, n=51) | |
* ... menor é melhor
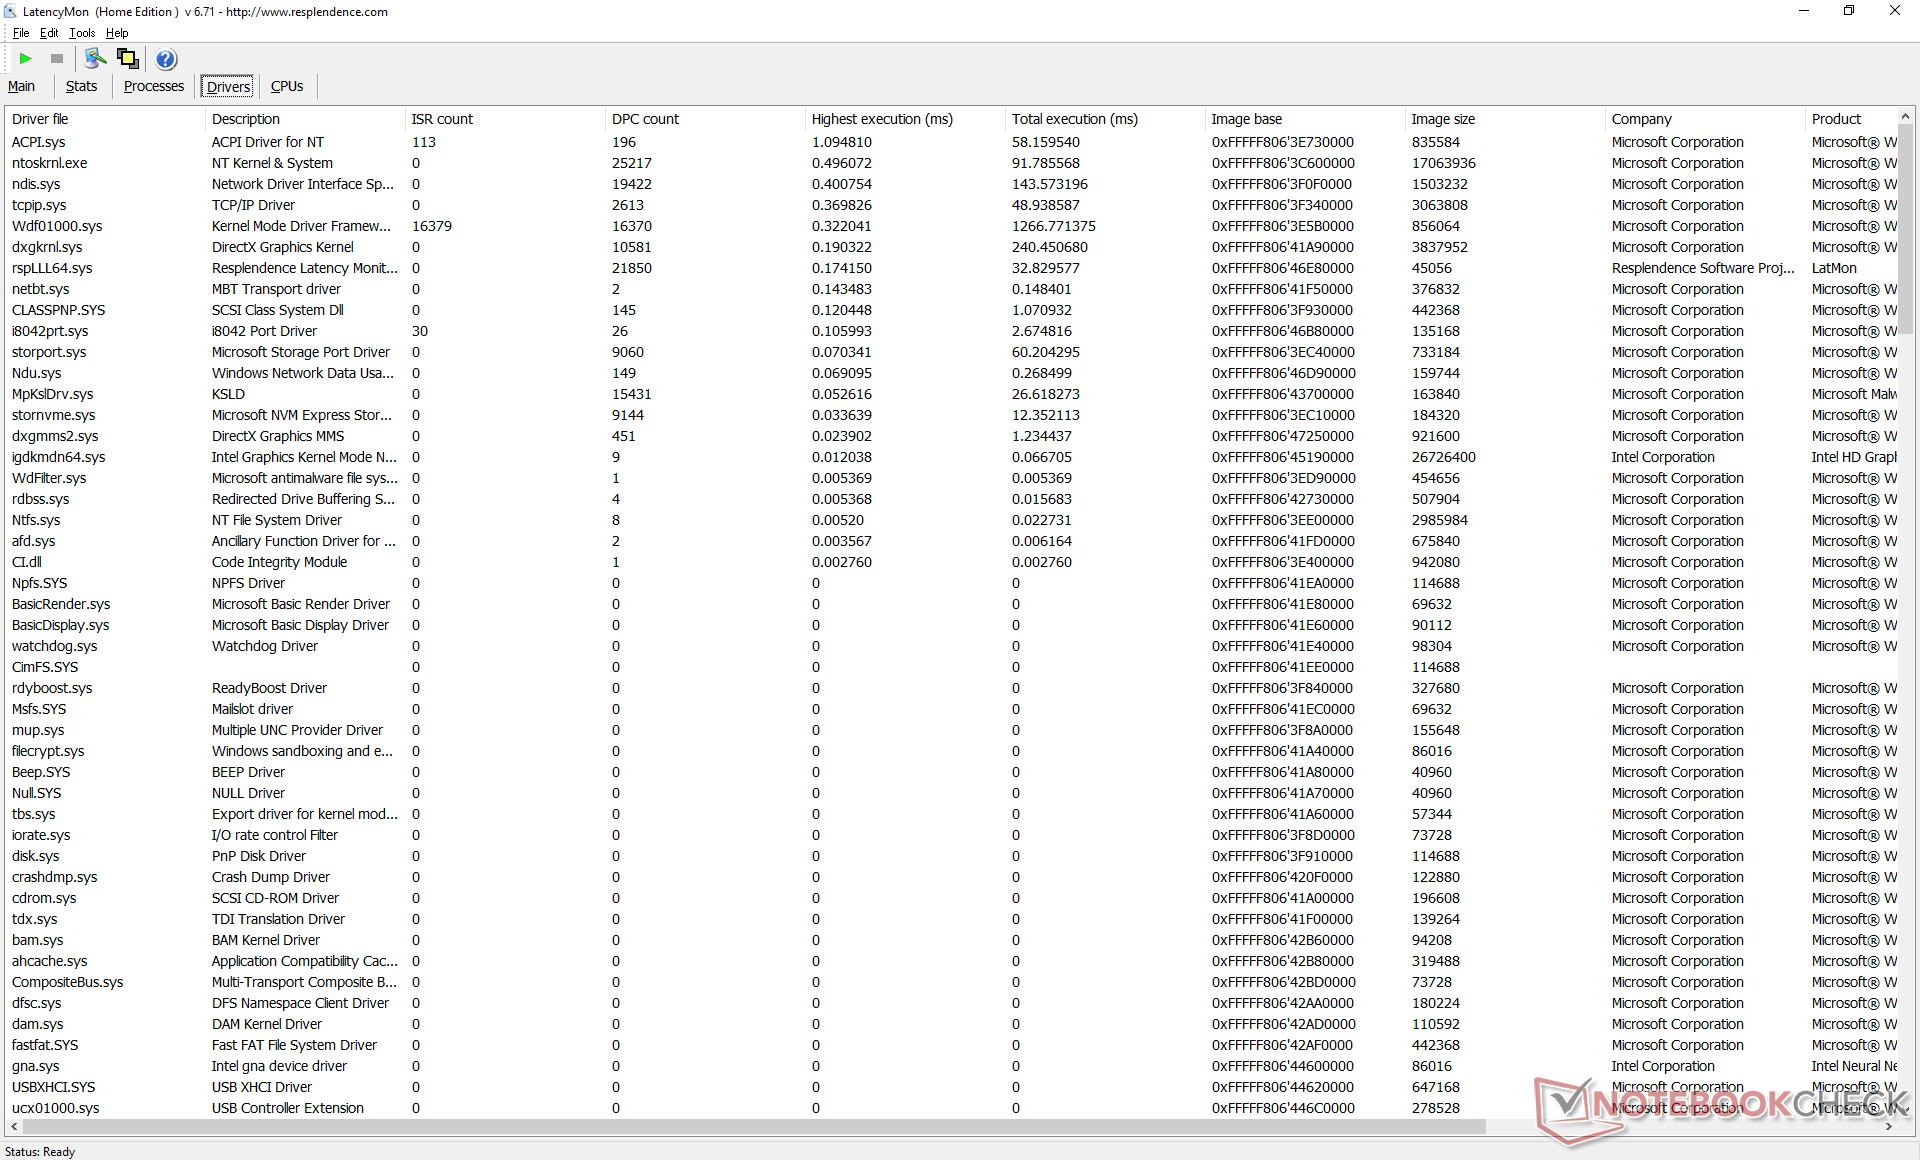
Latência do DPC
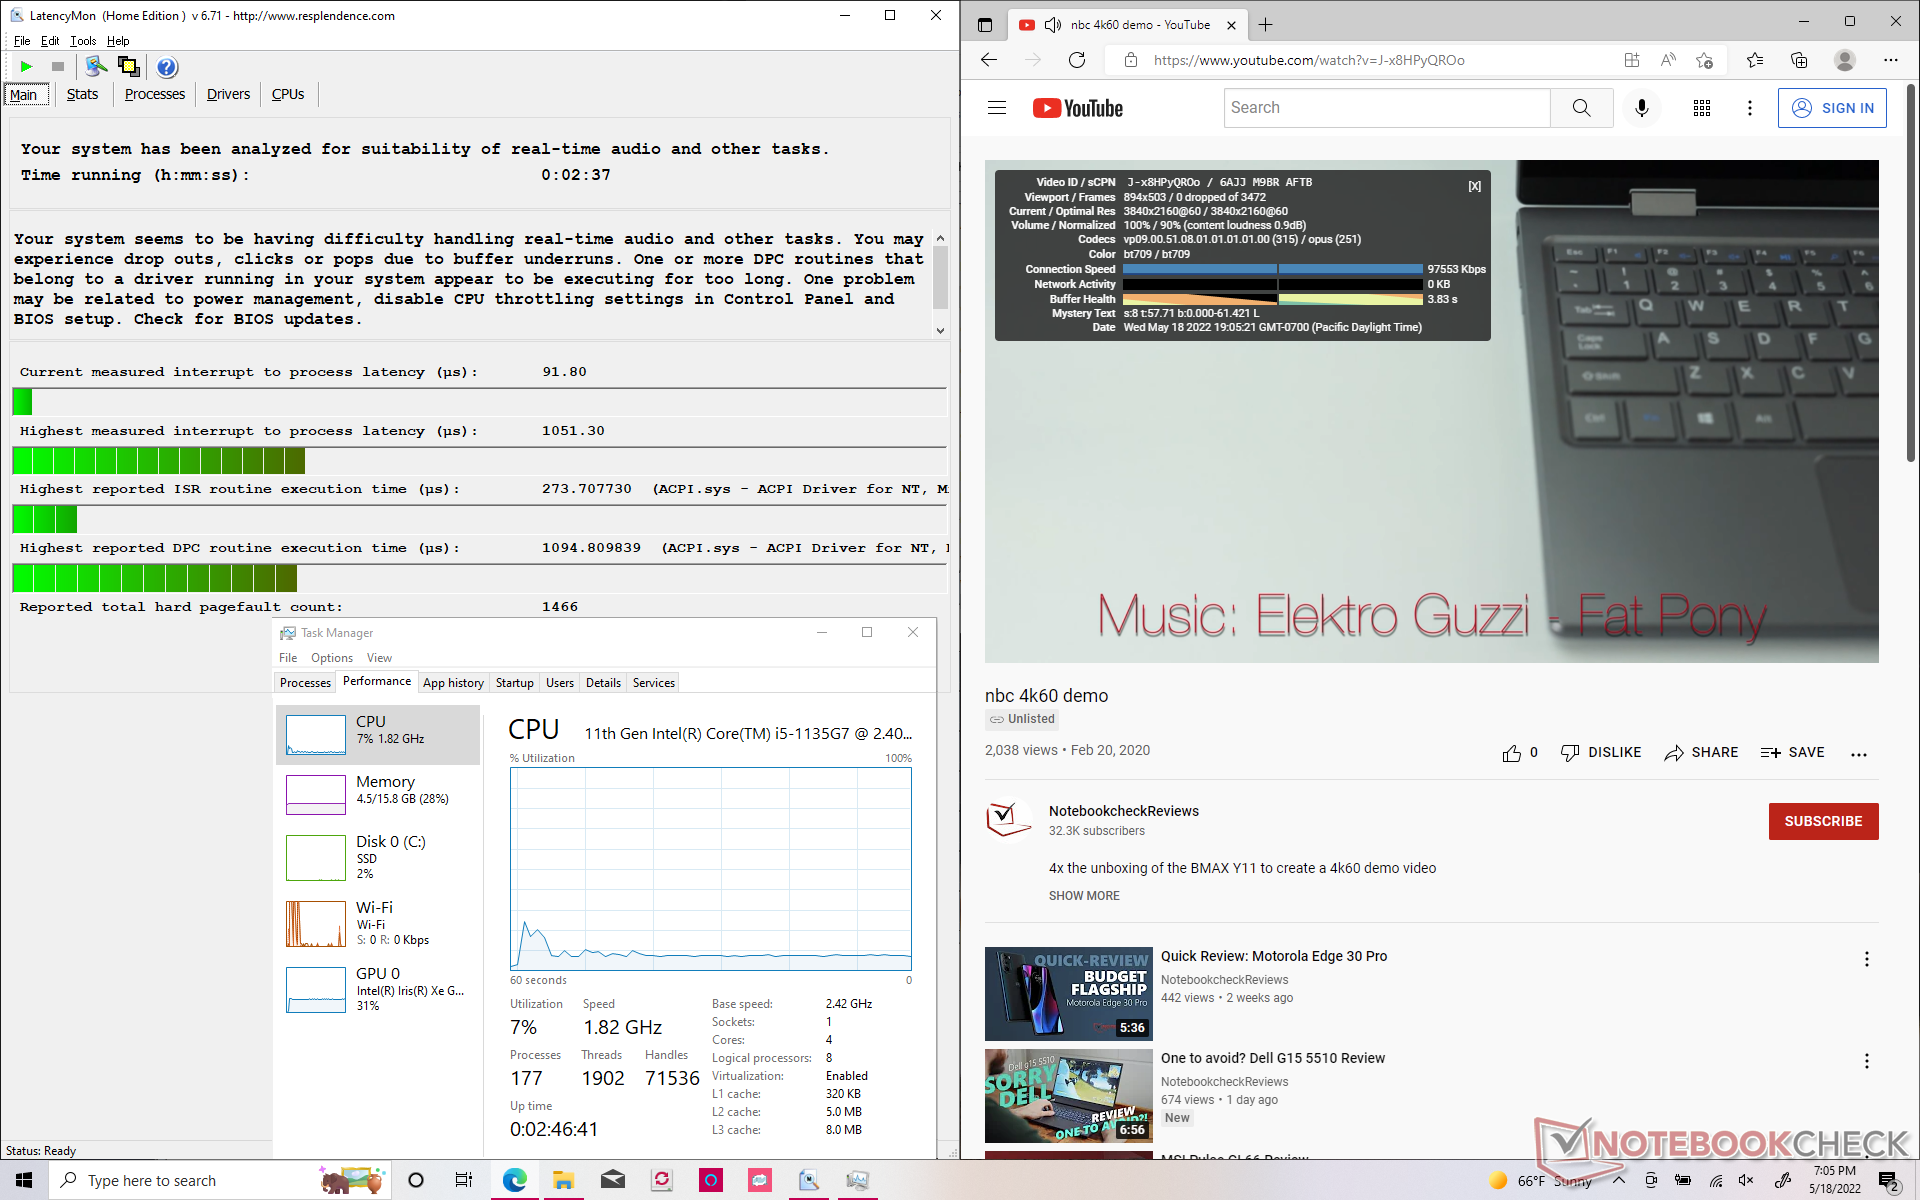
LatencyMon mostra pequenos problemas de DPC ao abrir várias abas do navegador em nossa página inicial. a reprodução de vídeo 4K a 60 FPS é perfeita, sem absolutamente nenhuma queda de quadros.
| DPC Latencies / LatencyMon - interrupt to process latency (max), Web, Youtube, Prime95 | |
| MSI Summit E13 Flip Evo A11MT | |
| HP Spectre x360 14-ea0378ng | |
| Lenovo Yoga 9 14IAP7 82LU0001US | |
| LG Gram 14T90N | |
| LG Gram 14T90P | |
| Asus ZenBook Flip 14 UN5401QA-KN085W | |
| Dell XPS 13 9310 2-in-1 | |
* ... menor é melhor
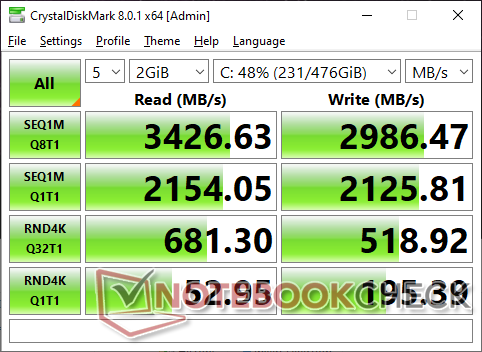
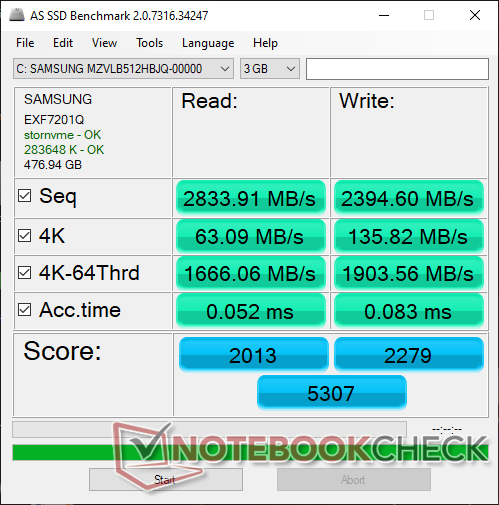
Dispositivos de armazenamento - Navios com acionamentos PCIe3
Nossa unidade vem com os mesmos 512 GBSamsung PM981a PCIe3 x4 NVMe SSD como na Gram 14T90N, embora a placa-mãe Tiger Lake-UP3 deva ser capaz de suportar upgrades de usuários finais PCIe4 x4 para velocidades mais rápidas. No entanto, a PM981a não tem problemas em manter sua taxa máxima de transferência de ~3400 MB/s durante longos períodos em nossos testes. Ela continua sendo uma das unidades PCIe3 NVMe mais rápidas para os consumidores.

* ... menor é melhor
Disk Throttling: DiskSpd Read Loop, Queue Depth 8
Desempenho da GPU
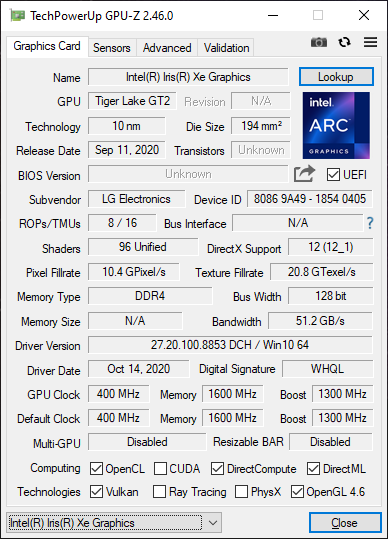
Desempenho gráfico a partir do sistema integrado Iris Xe 80 EUs é excelente e mais rápido do que na maioria dos outros laptops equipados com a mesma GPU. Quando comparado com o mais comum Core i7 Iris Xe 96 EUso nosso Core i5 Iris Xe 80 EU pode ser cerca de 15 a 30 por cento mais lento. Ainda é uma melhoria significativa em relação ao UHD Graphics 620 no antigo Gram 14T90N, no entanto
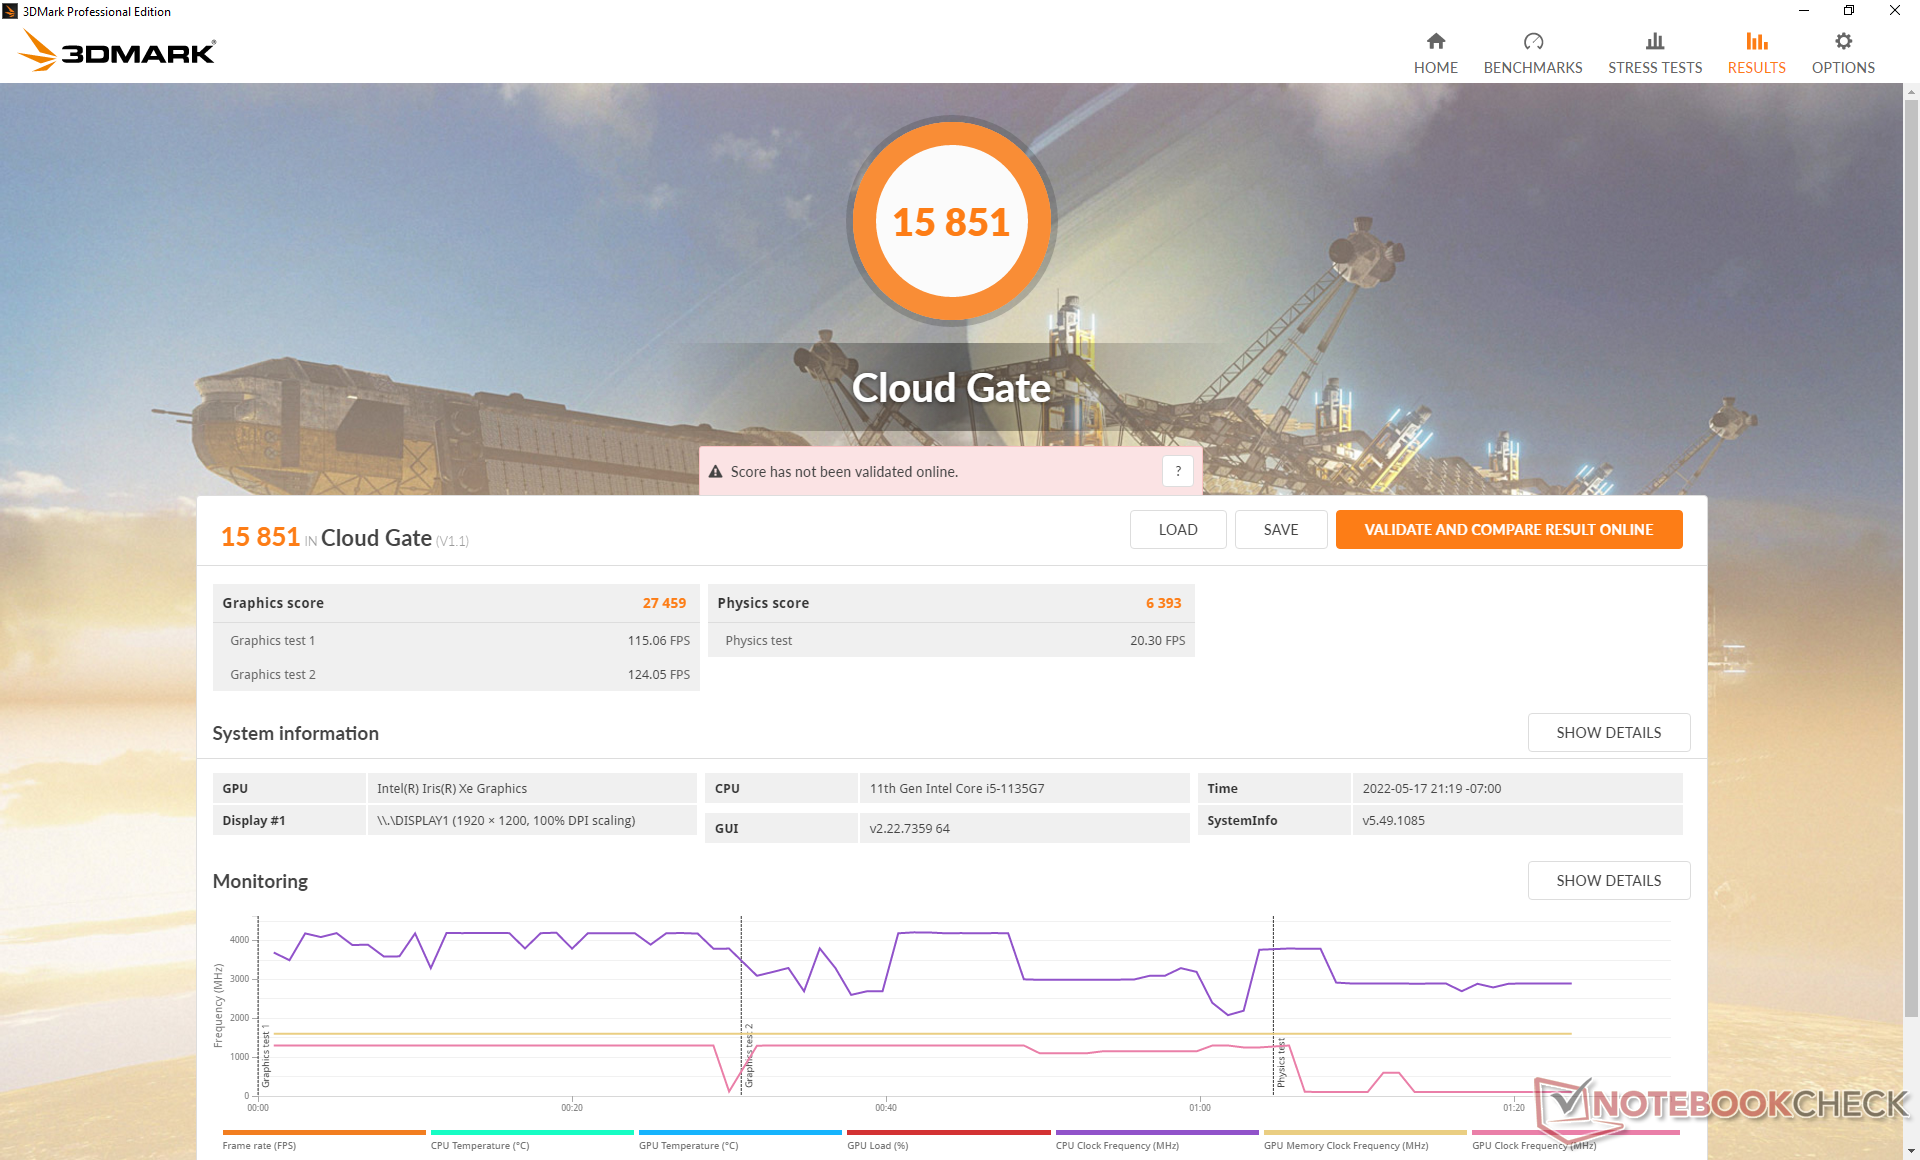
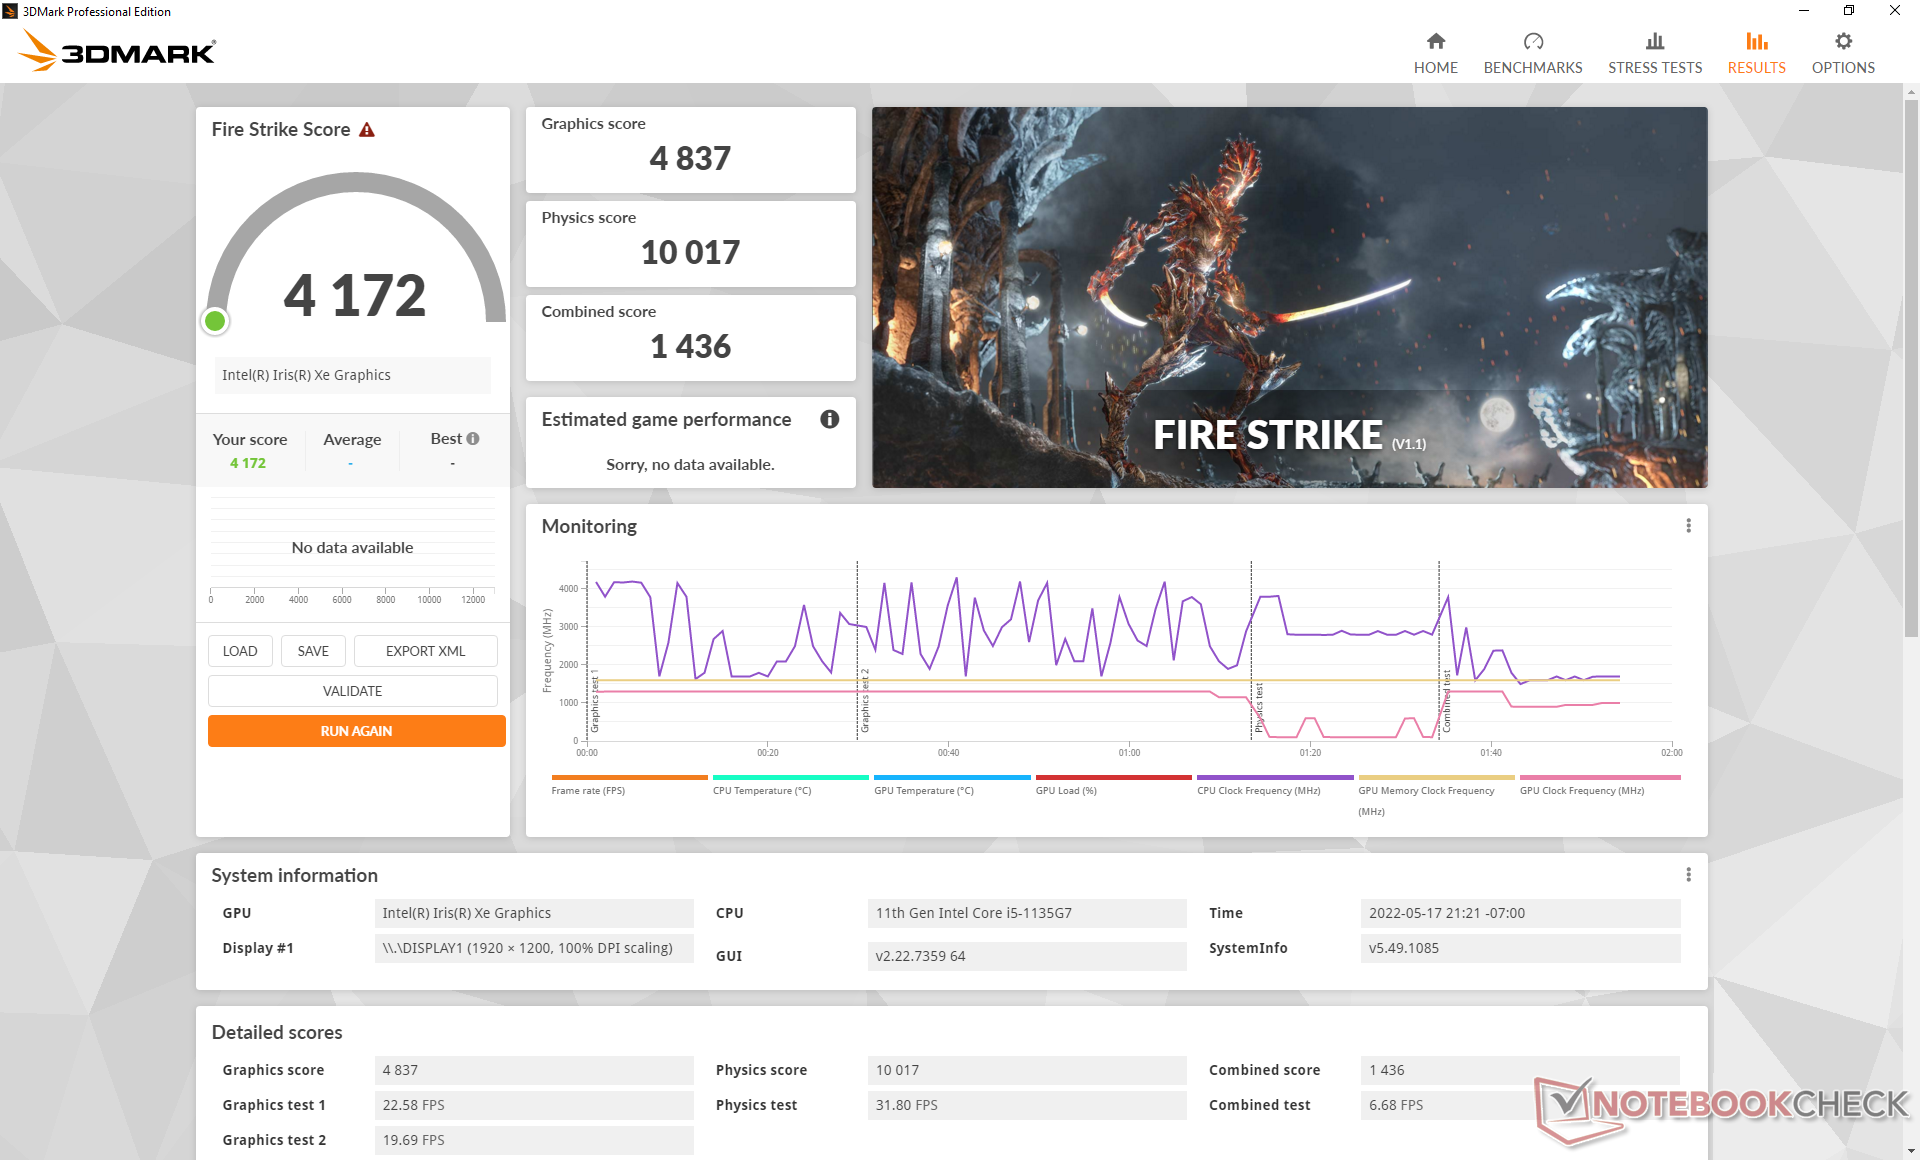
Infelizmente, o desempenho não é tão estável quanto gostaríamos. Quando ociosos em Witcher 3 em configurações de Baixa 720p, por exemplo, as taxas de quadros flutuariam entre 75 e 85 FPS em vez de permanecerem estáveis como na maioria dos outros laptops. Correr Fire Strike duas vezes seguidas também resultaria em uma discrepância relativamente ampla de pontuação física (10017 pontos vs. 11226 pontos). Recomendamos permitir que o vsync limite o rasgo da tela e os tempos de frame instável.
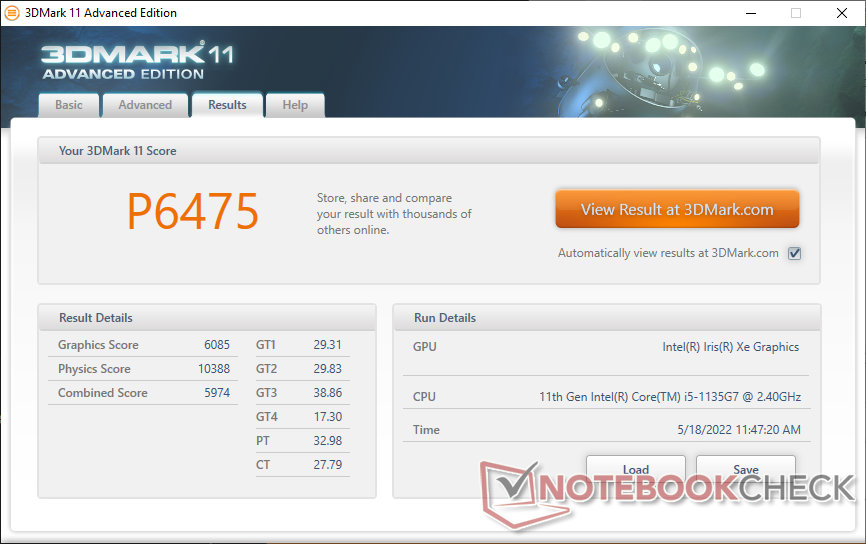
| 3DMark 11 Performance | 6475 pontos | |
| 3DMark Cloud Gate Standard Score | 15851 pontos | |
| 3DMark Fire Strike Score | 4172 pontos | |
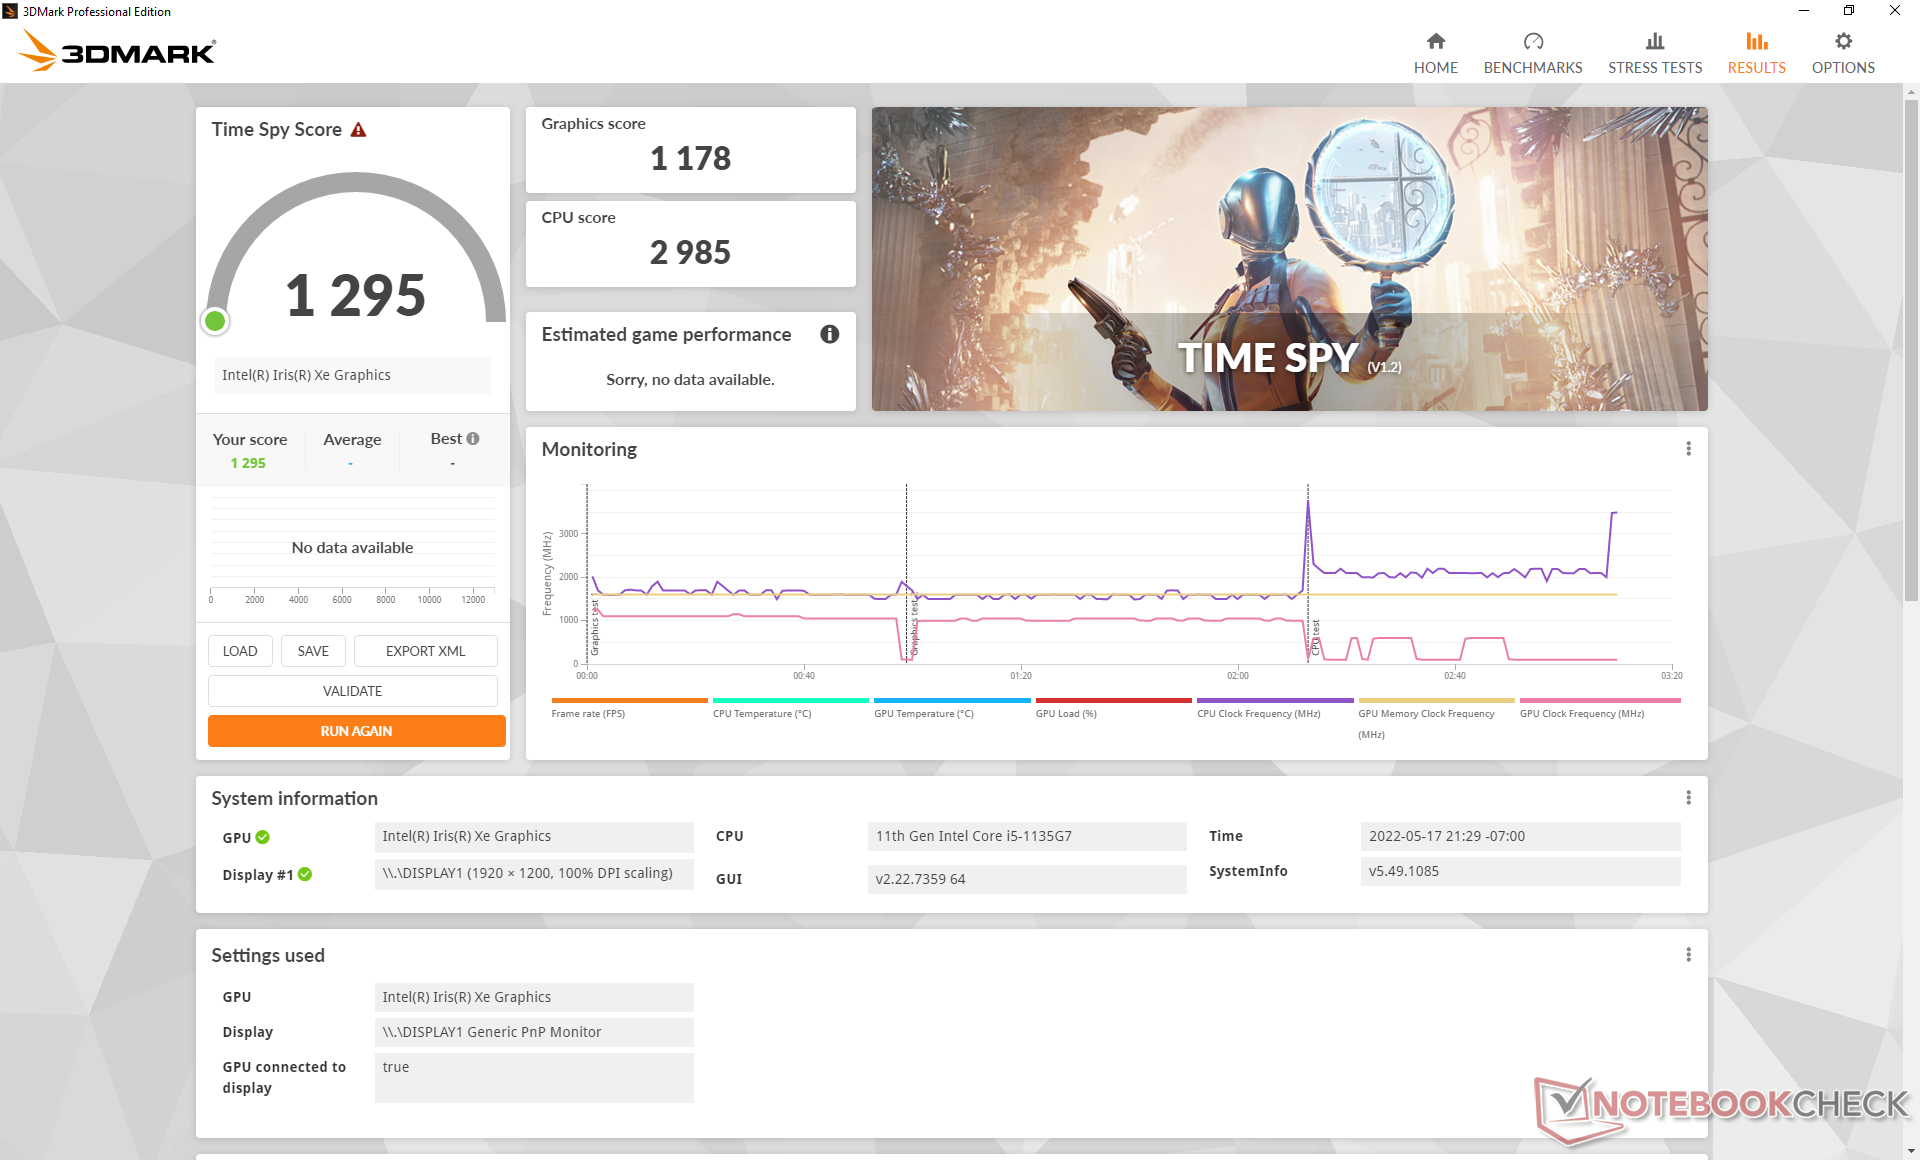
| 3DMark Time Spy Score | 1295 pontos | |
Ajuda | ||
Witcher 3 FPS Chart
| baixo | média | alto | ultra | |
|---|---|---|---|---|
| GTA V (2015) | 83.3 | 75.1 | 25.9 | 11.4 |
| The Witcher 3 (2015) | 89.8 | 55.6 | 32.3 | 14.1 |
| Dota 2 Reborn (2015) | 85.8 | 73.3 | 46 | 42.2 |
| Final Fantasy XV Benchmark (2018) | 34.4 | 20.1 | 15.6 | |
| X-Plane 11.11 (2018) | 40.5 | 32.8 | 30.2 | |
| Strange Brigade (2018) | 88.3 | 36.3 | 28.4 | 23.2 |
Emissões
Ruído do sistema - Silencioso sob a maioria das condições
O comportamento do ruído do ventilador é semelhante ao que observamos no Gram 14T90N, que já era uma máquina relativamente silenciosa. Somos capazes de medir apenas 28,3 dB(A) mesmo depois de executar a primeira cena de referência do 3DMark 06 para ser mais silenciosa do que o Dell XPS 13, Lenovo Yoga 9 14e Asus ZenBook Flip 14 quando em condições semelhantes. O ruído dos ventiladores parece ser superior a 35 dB(A) quando se joga ou se a CPU está em 100% de utilização.
Barulho
| Ocioso |
| 25.5 / 25.5 / 25.5 dB |
| Carga |
| 28.3 / 35 dB |
 | ||
30 dB silencioso 40 dB(A) audível 50 dB(A) ruidosamente alto |
||
min: | ||
| LG Gram 14T90P Iris Xe G7 80EUs, i5-1135G7, Samsung SSD PM981a MZVLB512HBJQ | Dell XPS 13 9310 2-in-1 Iris Xe G7 96EUs, i7-1165G7, Toshiba BG4 KBG40ZPZ512G | Lenovo Yoga 9 14IAP7 82LU0001US Iris Xe G7 96EUs, i7-1260P, Samsung PM9A1 MZVL2512HCJQ | Asus ZenBook Flip 14 UN5401QA-KN085W Vega 8, R7 5800H, Intel SSD 600p SSDPEKKW512G7 | HP Spectre x360 14-ea0378ng Iris Xe G7 96EUs, i7-1165G7, Intel Optane Memory H10 with Solid State Storage 32GB + 1TB HBRPEKNX0203AH(L/H) | MSI Summit E13 Flip Evo A11MT Iris Xe G7 96EUs, i7-1185G7, Phison 1TB SM2801T24GKBB4S-E162 | LG Gram 14T90N UHD Graphics 620, i7-10510U, Samsung SSD PM981a MZVLB512HBJQ | |
|---|---|---|---|---|---|---|---|
| Noise | -7% | -5% | -13% | -8% | -12% | -16% | |
| desligado / ambiente * (dB) | 25.4 | 24.3 4% | 22.9 10% | 26 -2% | 26 -2% | 24.5 4% | 29 -14% |
| Idle Minimum * (dB) | 25.5 | 24.8 3% | 23.3 9% | 26 -2% | 26 -2% | 24.7 3% | 30 -18% |
| Idle Average * (dB) | 25.5 | 24.8 3% | 23.5 8% | 26 -2% | 26 -2% | 24.7 3% | 30 -18% |
| Idle Maximum * (dB) | 25.5 | 24.8 3% | 23.5 8% | 27.3 -7% | 26 -2% | 26.4 -4% | 30 -18% |
| Load Average * (dB) | 28.3 | 38 -34% | 33.2 -17% | 39.8 -41% | 37.5 -33% | 37.8 -34% | 35.2 -24% |
| Witcher 3 ultra * (dB) | 35 | 38 -9% | 44.9 -28% | 41.4 -18% | |||
| Load Maximum * (dB) | 35 | 41.5 -19% | 44.6 -27% | 42.4 -21% | 36.3 -4% | 48.8 -39% | 37 -6% |
* ... menor é melhor
Temperatura
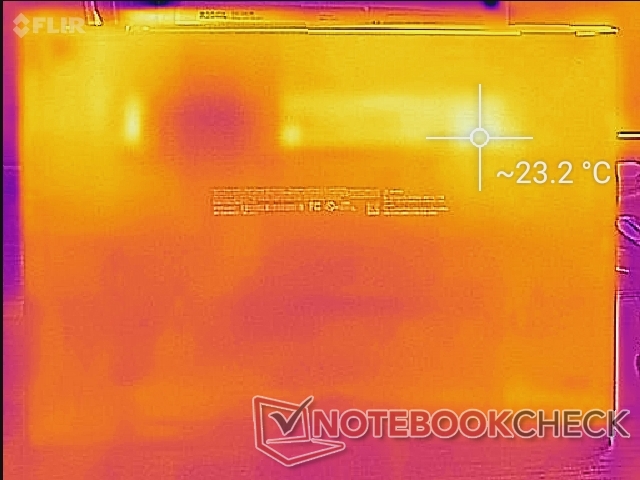
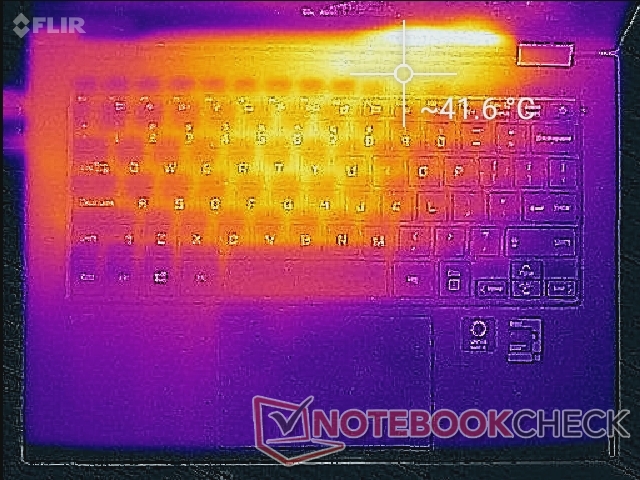
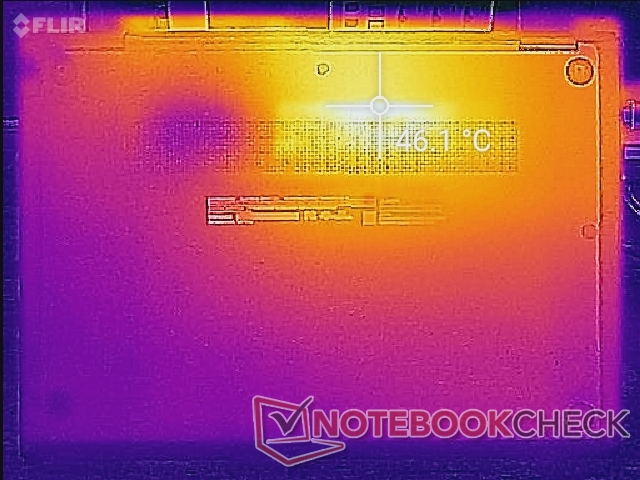
As temperaturas de superfície são mais frias do que as observadas na competição Lenovo Yoga 9 14IAP7, quando se corre com cargas baixas, enquanto que entre elas são mais ou menos as mesmas quando se corre com cargas mais exigentes. Os pontos quentes estão mais próximos do centro do teclado onde pode chegar a 40 C para ser comparável ao Gram 14T90N ou à Lenovo acima mencionada.
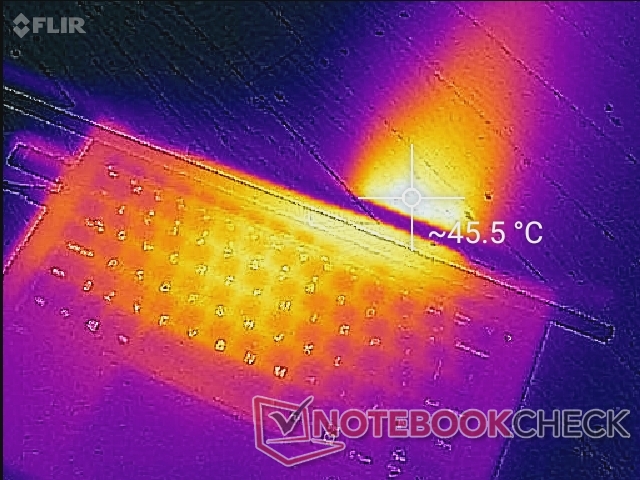
(±) A temperatura máxima no lado superior é 41.6 °C / 107 F, em comparação com a média de 35.4 °C / 96 F , variando de 19.6 a 60 °C para a classe Convertible.
(-) A parte inferior aquece até um máximo de 46.2 °C / 115 F, em comparação com a média de 36.9 °C / 98 F
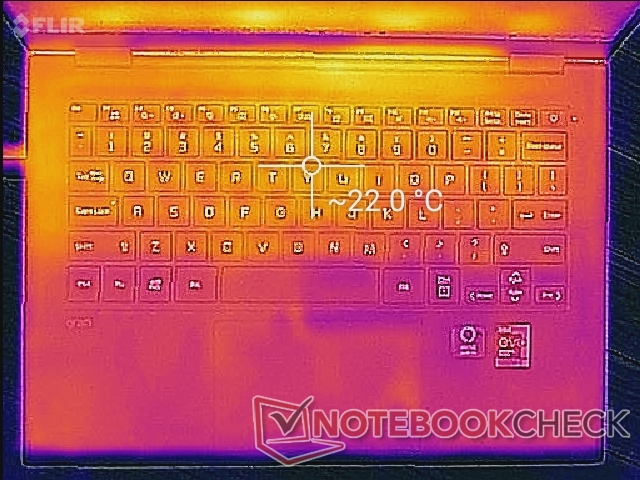
(+) Em uso inativo, a temperatura média para o lado superior é 21.6 °C / 71 F, em comparação com a média do dispositivo de 30.3 °C / ### class_avg_f### F.
(+) Os apoios para as mãos e o touchpad são mais frios que a temperatura da pele, com um máximo de 26.2 °C / 79.2 F e, portanto, são frios ao toque.
(±) A temperatura média da área do apoio para as mãos de dispositivos semelhantes foi 28 °C / 82.4 F (+1.8 °C / 3.2 F).
| LG Gram 14T90P Intel Core i5-1135G7, Intel Iris Xe Graphics G7 80EUs | Dell XPS 13 9310 2-in-1 Intel Core i7-1165G7, Intel Iris Xe Graphics G7 96EUs | Lenovo Yoga 9 14IAP7 82LU0001US Intel Core i7-1260P, Intel Iris Xe Graphics G7 96EUs | Asus ZenBook Flip 14 UN5401QA-KN085W AMD Ryzen 7 5800H, AMD Radeon RX Vega 8 (Ryzen 4000/5000) | HP Spectre x360 14-ea0378ng Intel Core i7-1165G7, Intel Iris Xe Graphics G7 96EUs | MSI Summit E13 Flip Evo A11MT Intel Core i7-1185G7, Intel Iris Xe Graphics G7 96EUs | LG Gram 14T90N Intel Core i7-10510U, Intel UHD Graphics 620 | |
|---|---|---|---|---|---|---|---|
| Heat | -12% | -29% | -29% | -8% | -33% | -14% | |
| Maximum Upper Side * (°C) | 41.6 | 51 -23% | 43.2 -4% | 42.7 -3% | 37.1 11% | 52 -25% | 43.2 -4% |
| Maximum Bottom * (°C) | 46.2 | 45.4 2% | 45.6 1% | 53.1 -15% | 43.1 7% | 57.4 -24% | 41.6 10% |
| Idle Upper Side * (°C) | 22.6 | 24.4 -8% | 34.6 -53% | 32.9 -46% | 29 -28% | 30.4 -35% | 29.2 -29% |
| Idle Bottom * (°C) | 23.2 | 27.4 -18% | 37 -59% | 35.2 -52% | 28.6 -23% | 34.2 -47% | 30.6 -32% |
* ... menor é melhor
Teste de estresse
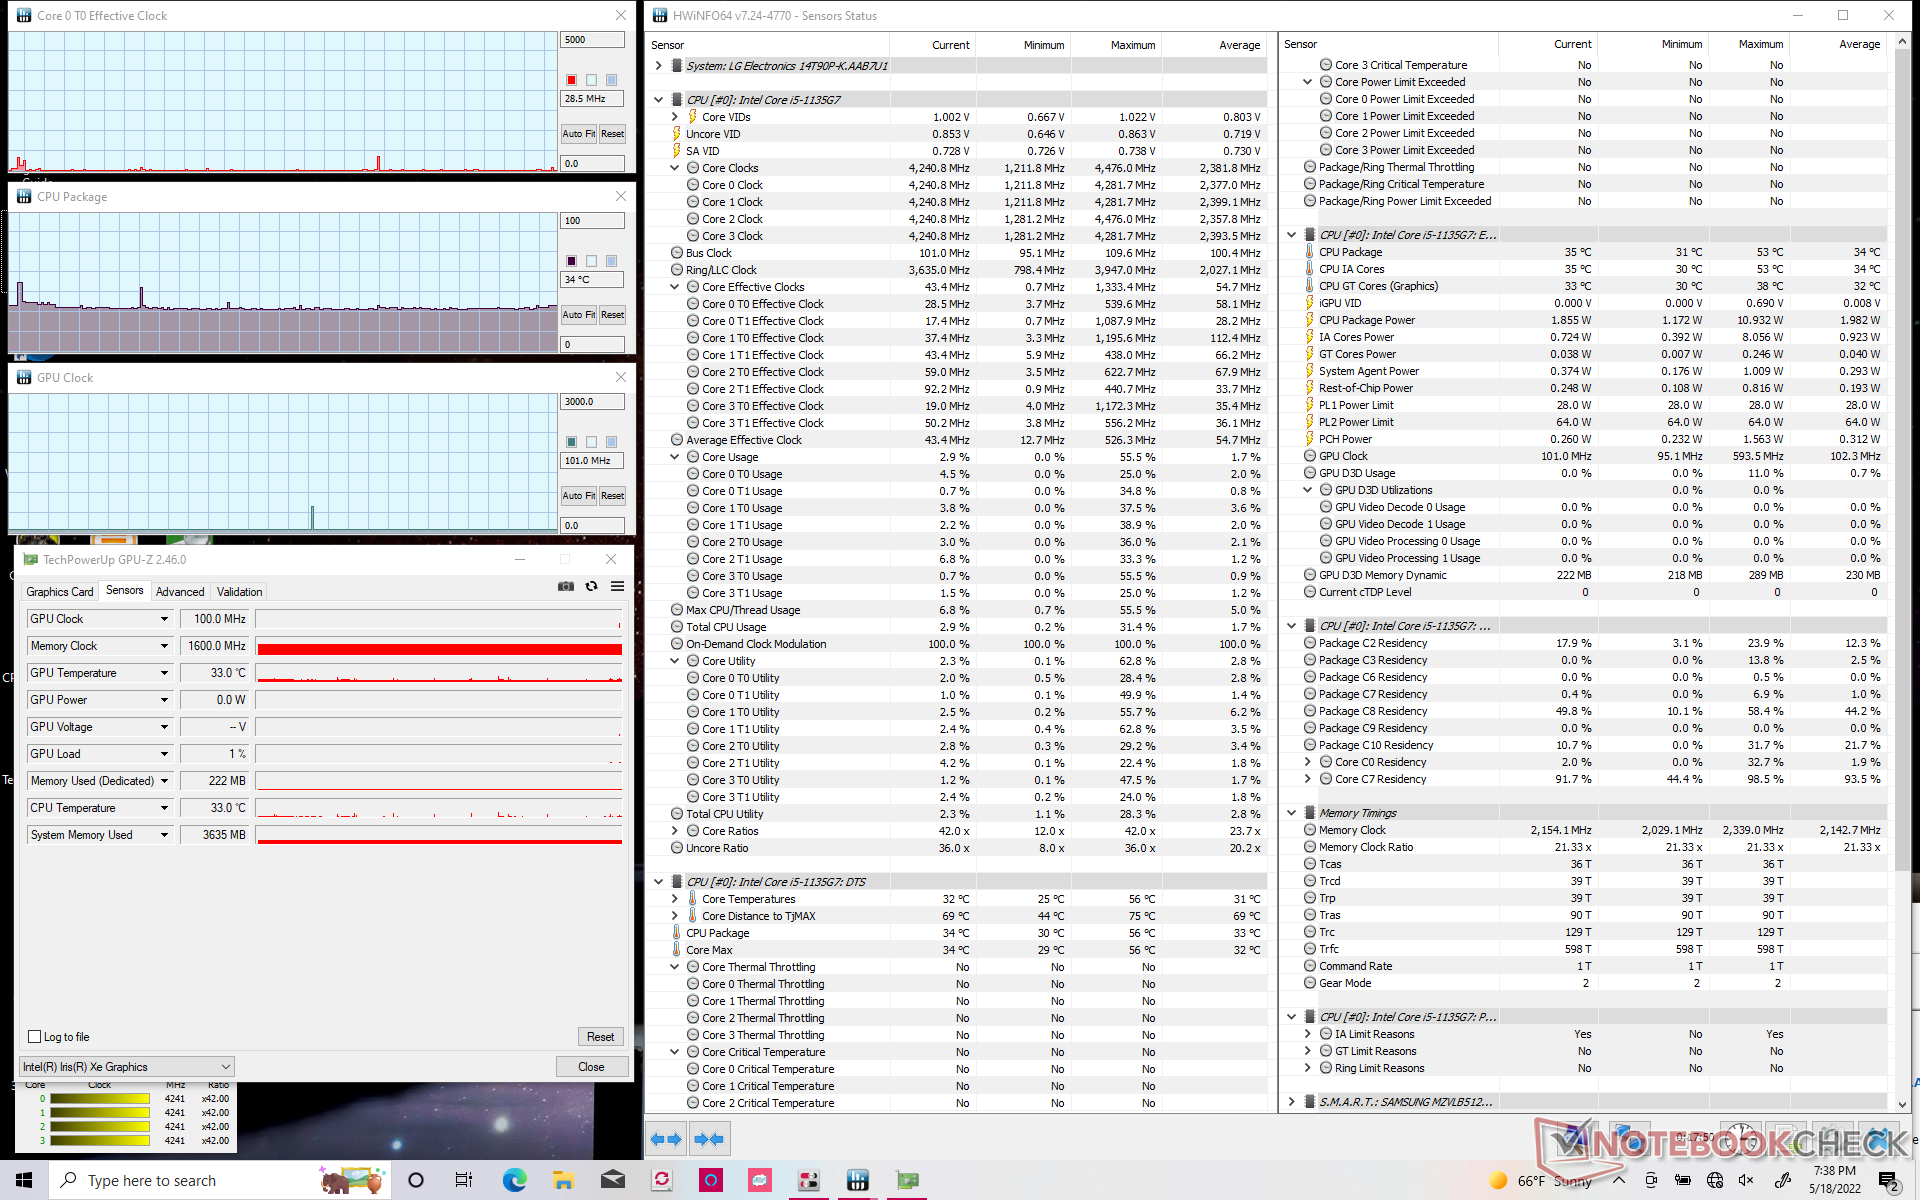
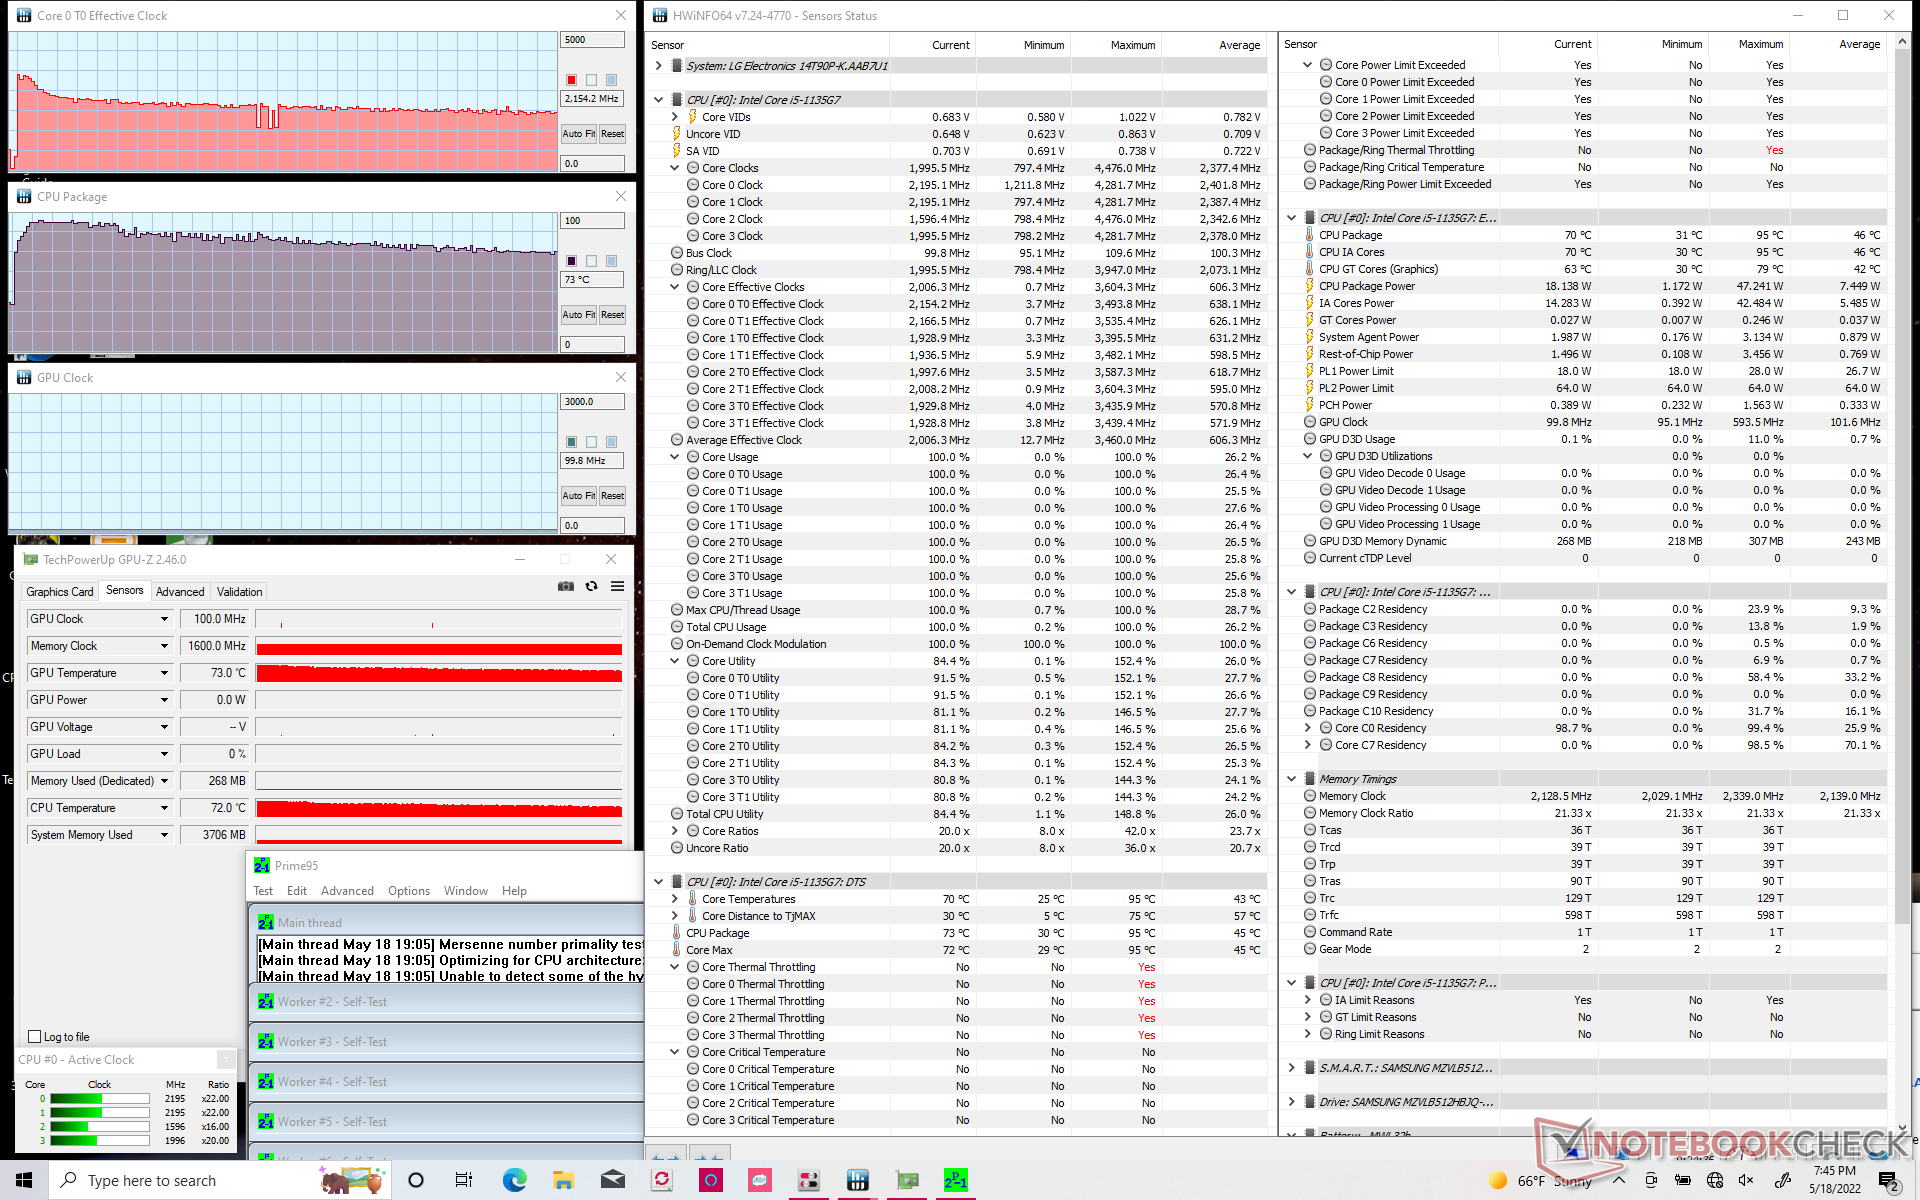
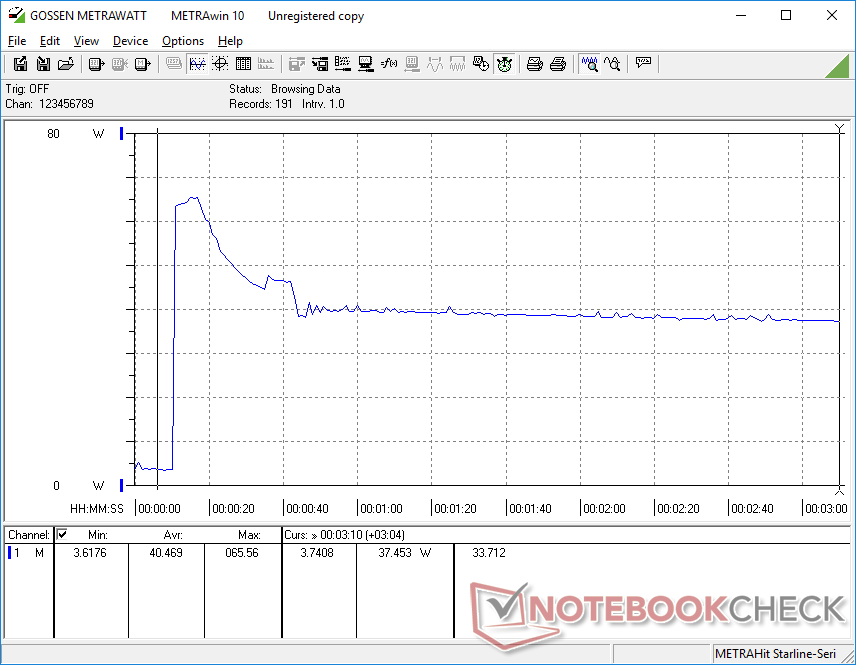
Quando estressada sob Prime95, a CPU aumentaria para 3,5 GHz e 95 C por alguns segundos antes de cair constantemente e eventualmente se estabilizar em 2,1 GHz e 73 C. Suspeitamos que o processador não estabilizará em taxas de relógio mais altas para manter a temperatura da pele sob controle. O TDP da CPU seria tão alto quanto 47 W durante o início do teste antes de se estabilizar em apenas 18 W como resultado. Em comparação, executando este mesmo teste no HP Spectre x360 14 com o Core i7-1165G7 resultaria em uma taxa de relógio e temperatura de CPU de 2,1 - 3,4 GHz e 75 - 95 C, respectivamente, para um desempenho superior em média.
A execução no modo Performance resulta em taxas de relógio e temperaturas mais altas, como mostrado por nossos gráficos e tabela abaixo.
O desempenho não será limitado se funcionar com energia de bateria como Fire Strike pontuação na rede elétrica e em baterias são muito semelhantes.
| Relógio CPU (GHz) | Relógio GPU (MHz) | Temperatura média da CPU (°C) | |
| System Idle | -- | -- | 34 |
| Prime95 Stress | 2.1 | -- | 73 |
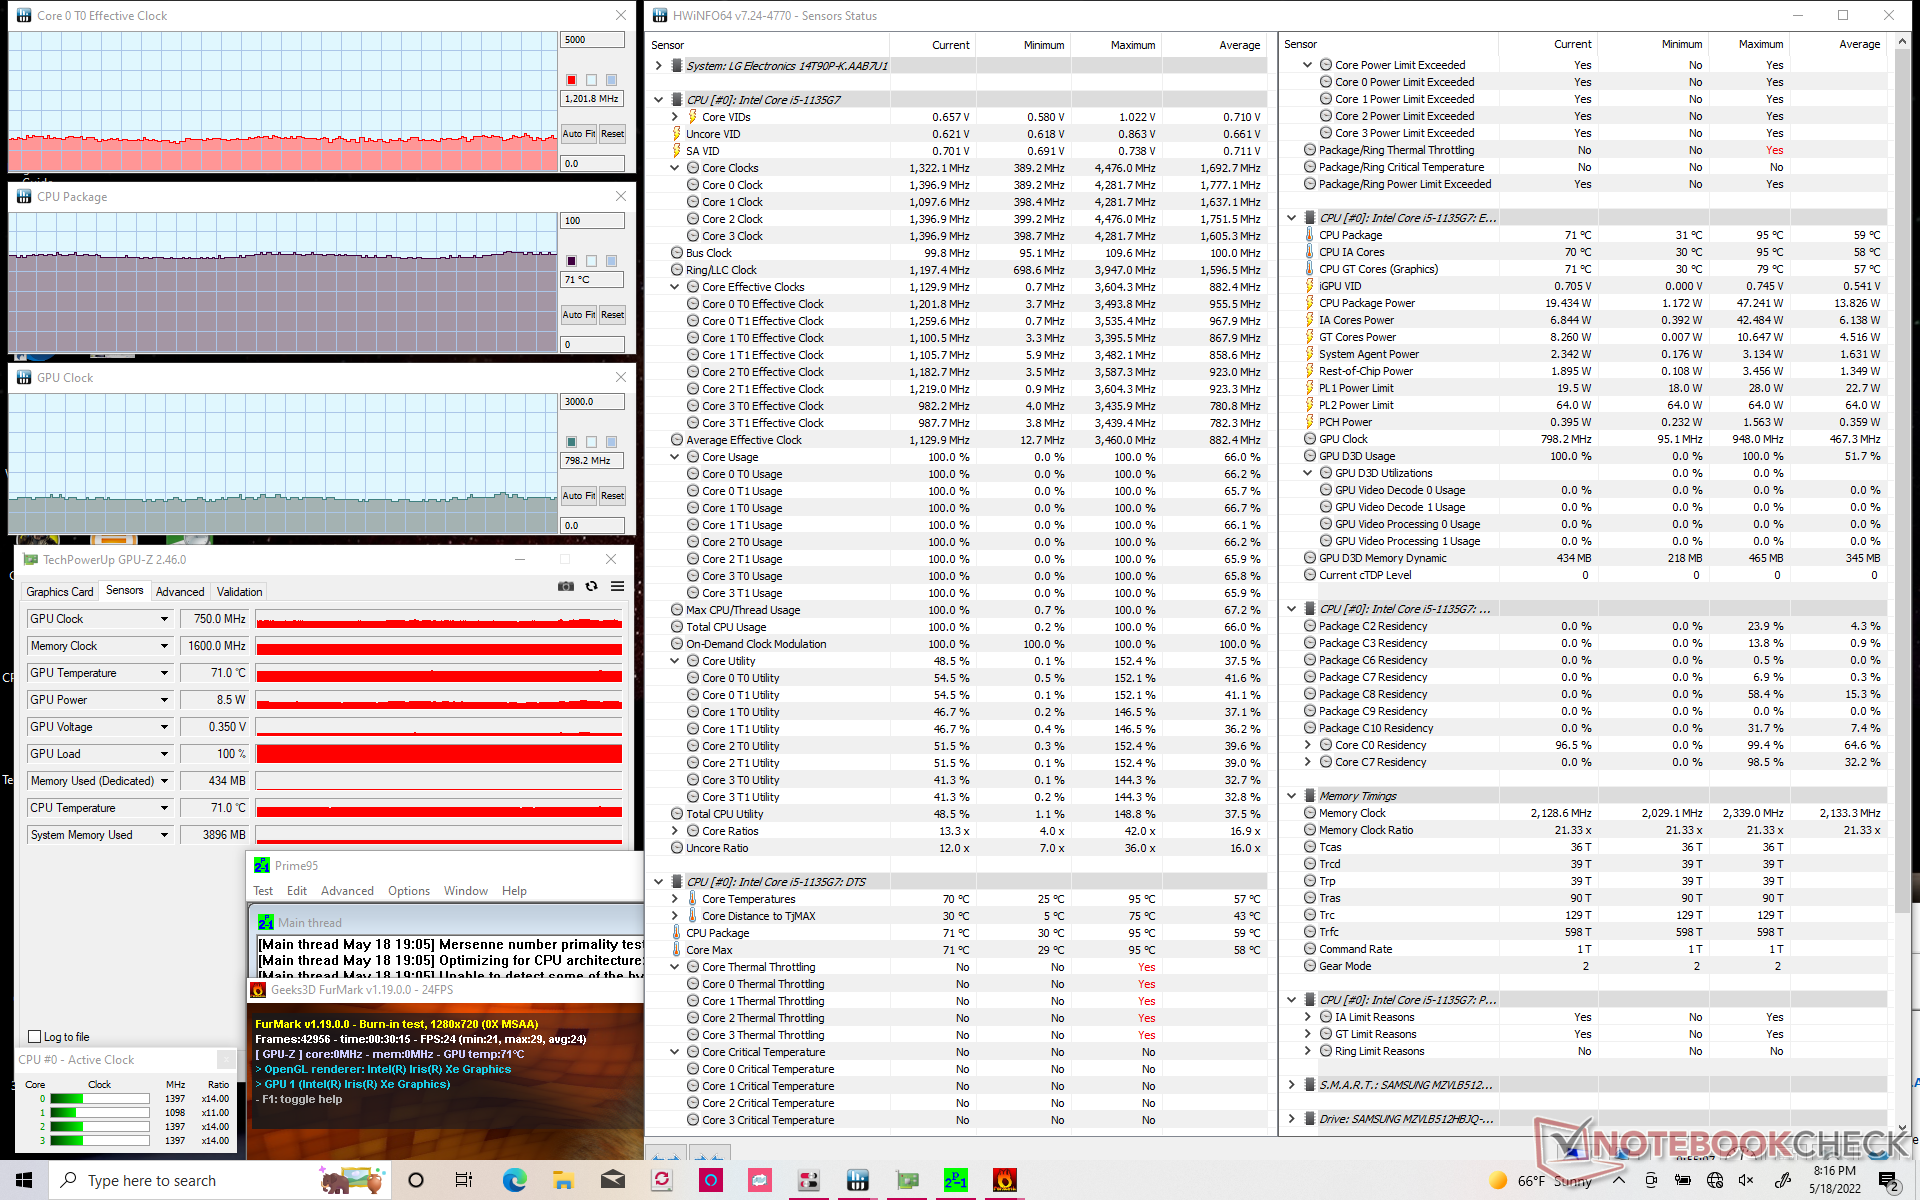
| Prime95 + FurMark Stress | ~1.2 | 750 - 900 | 71 |
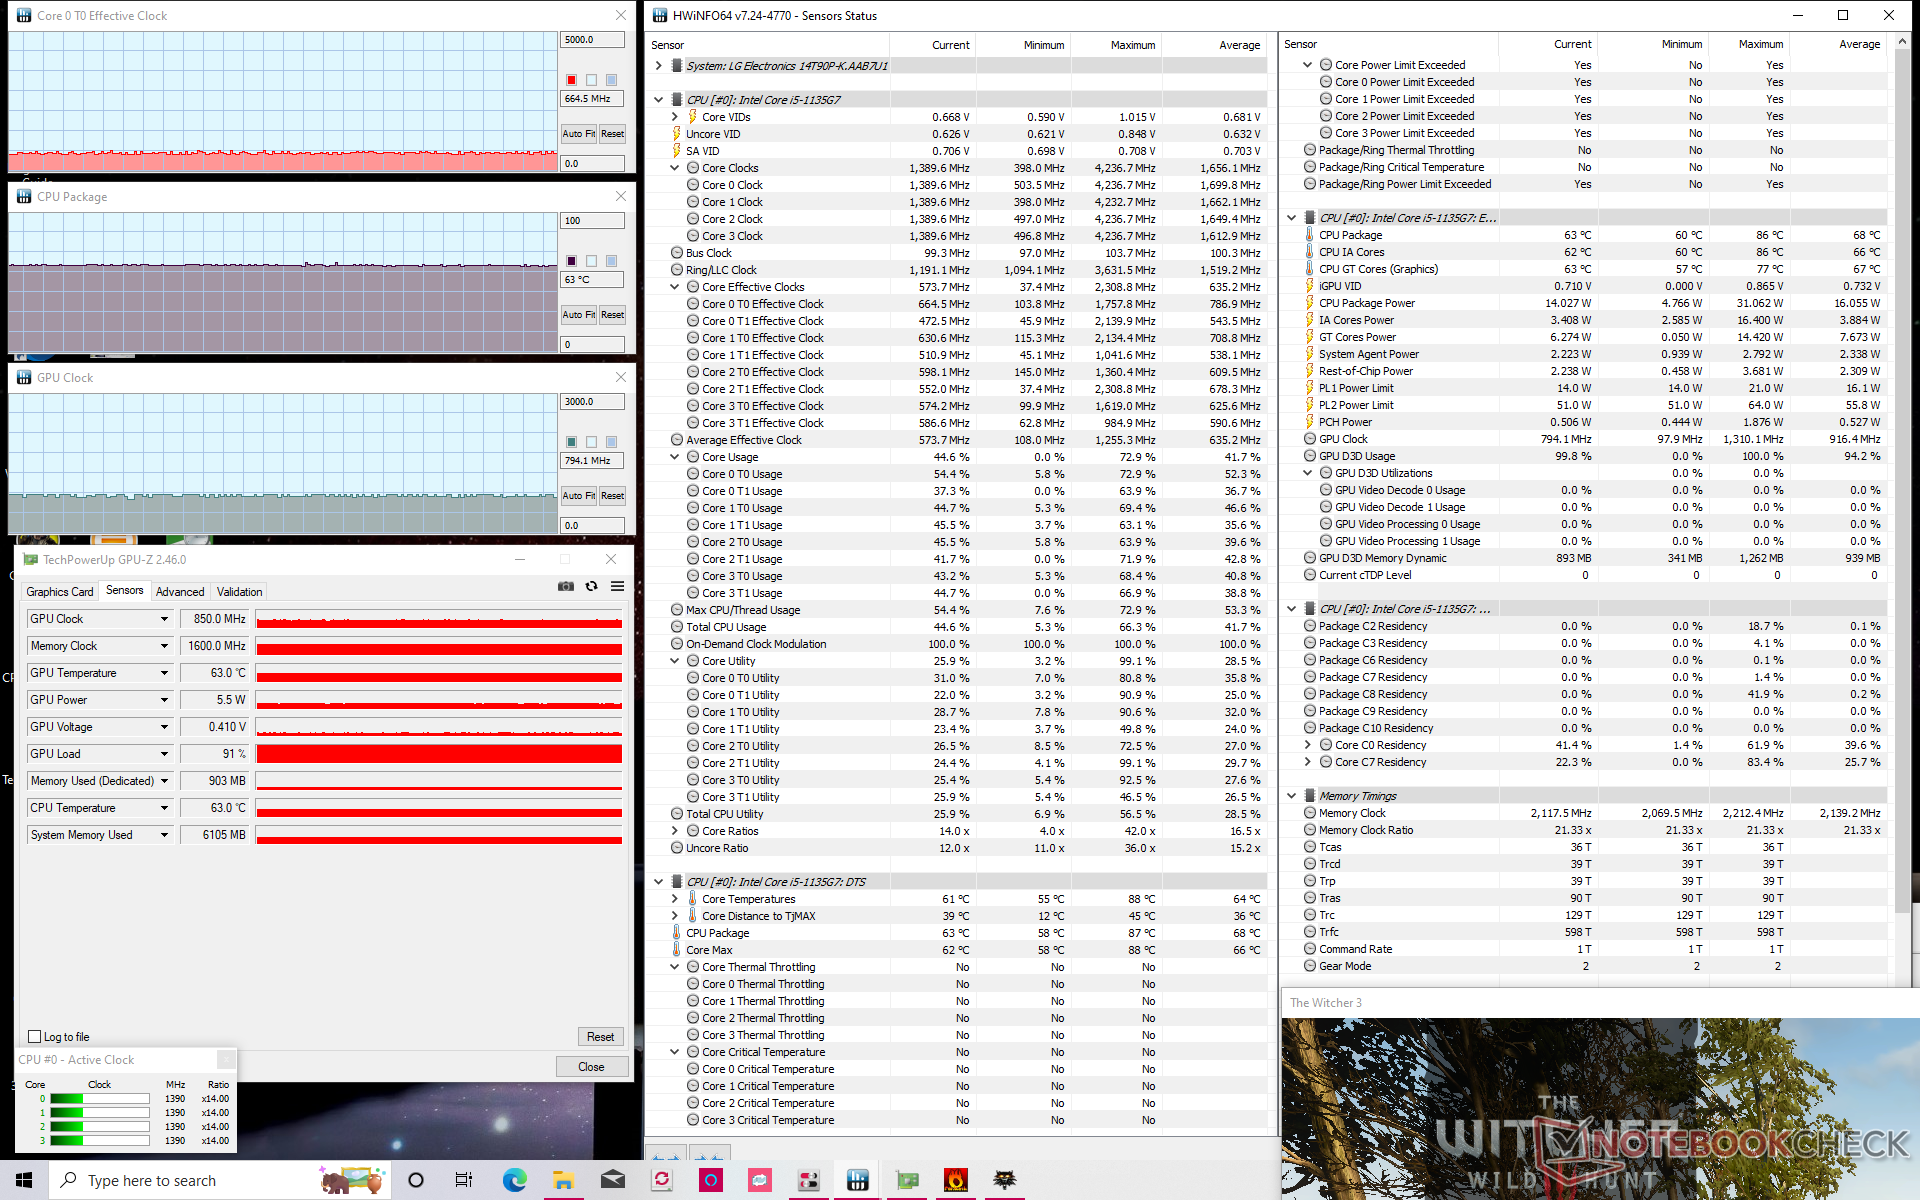
| Witcher 3 Tensão (perfil de potência equilibrado) | 0.6 | 800 | 63 |
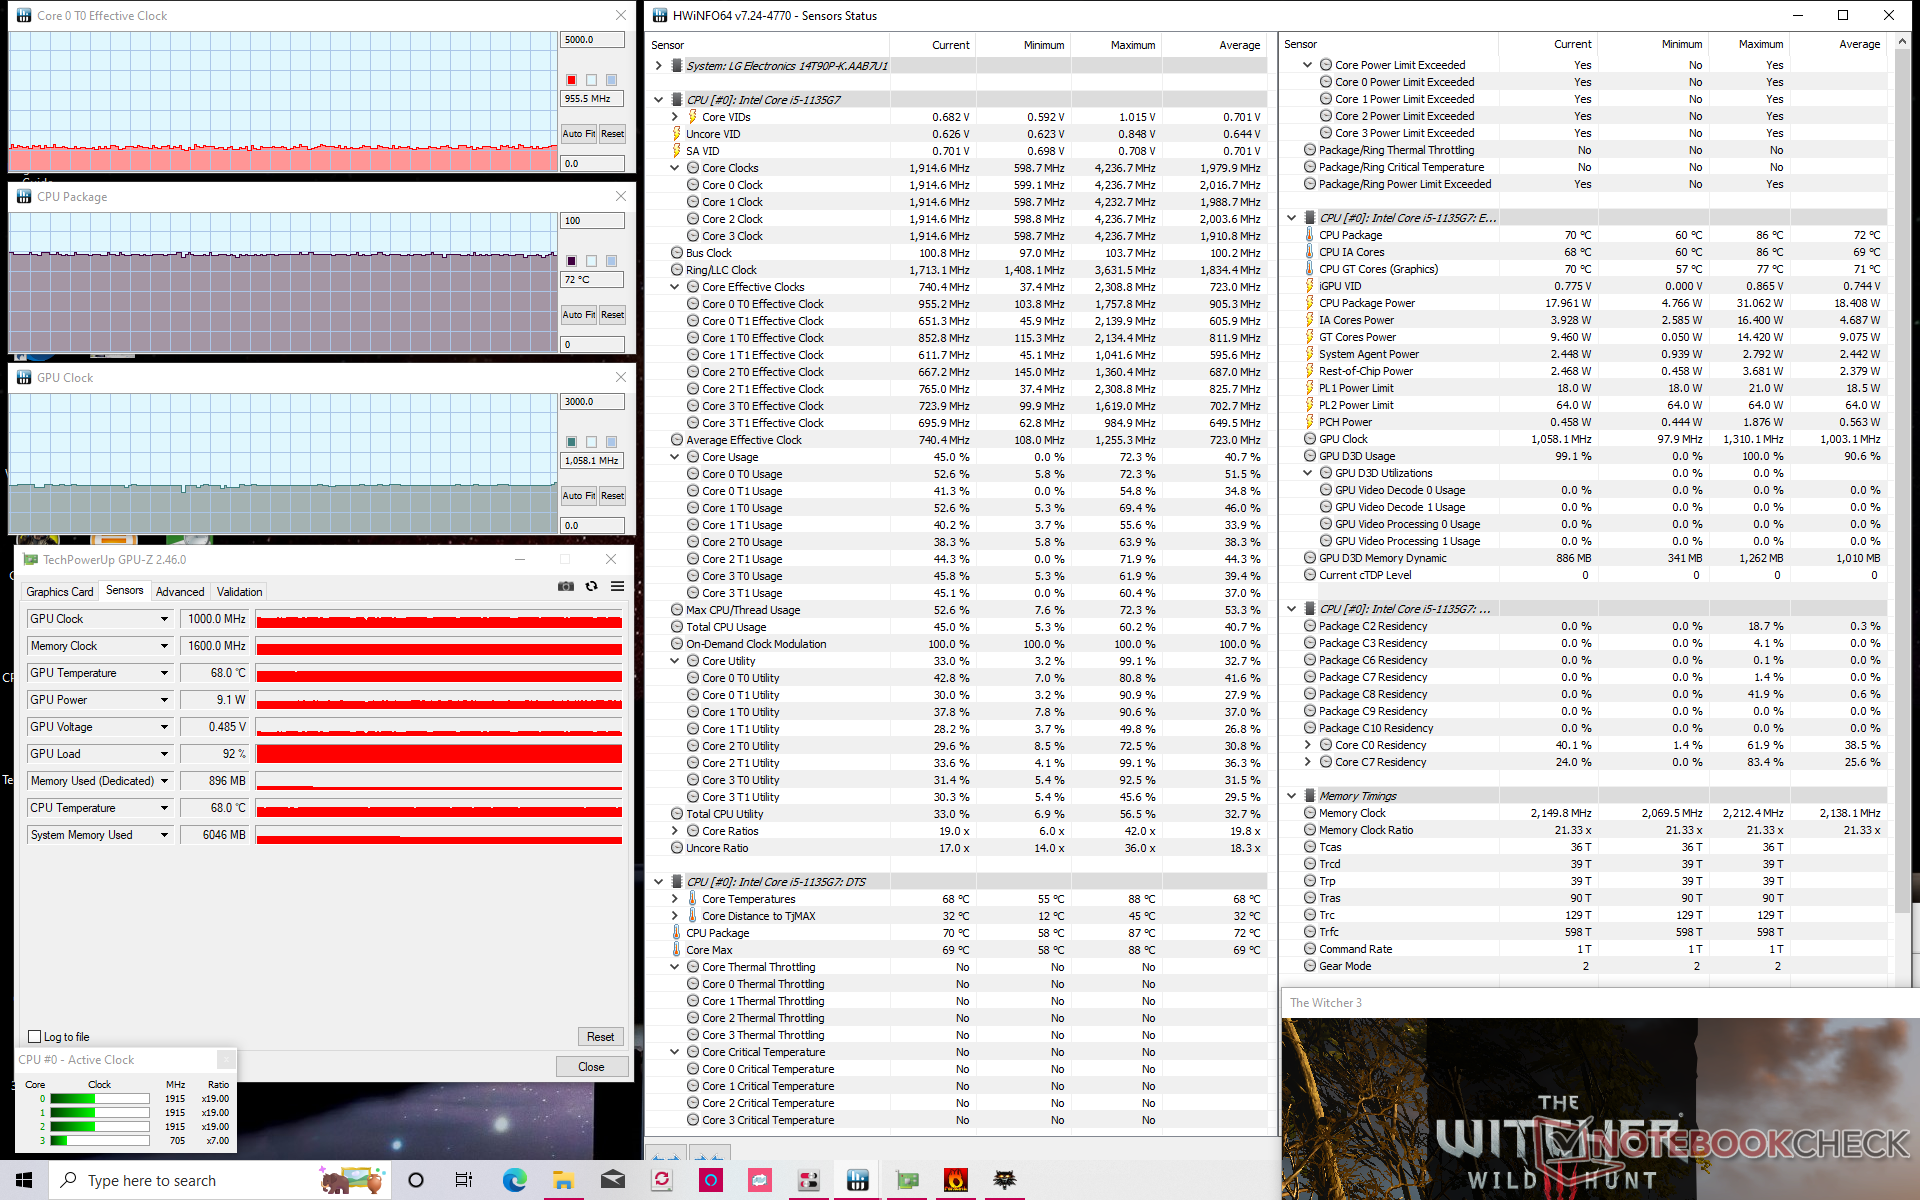
| Witcher 3 Stress (Perfil de potência de desempenho) | ~1.0 | 1000 | 72 |
Oradores
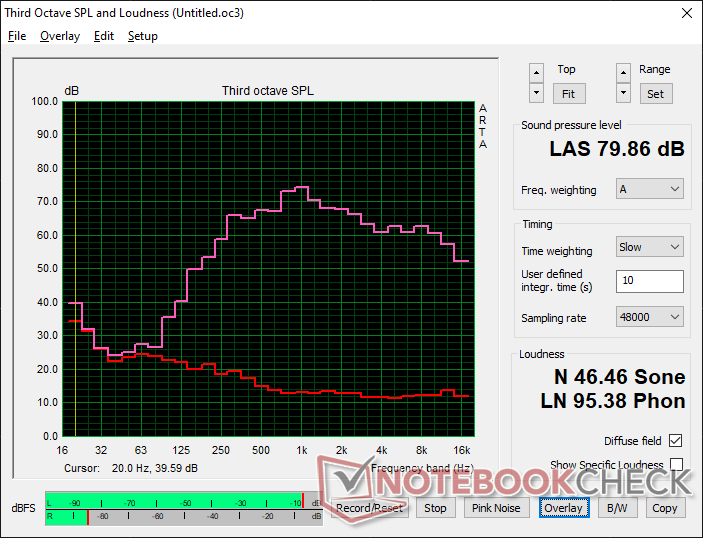
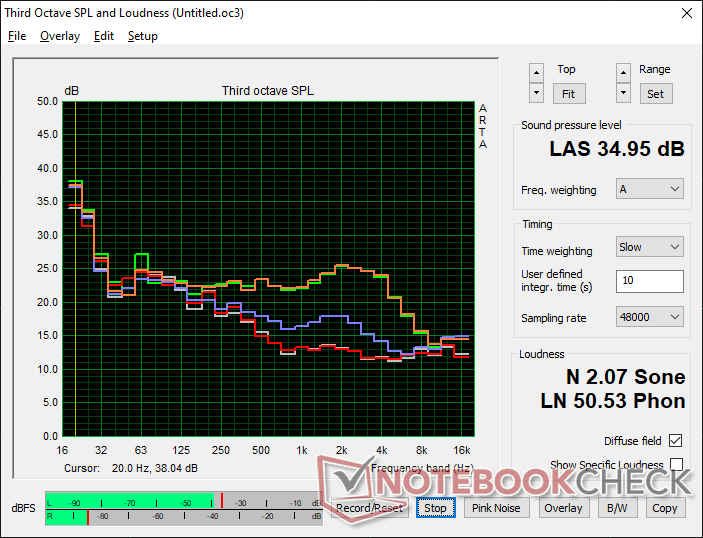
LG Gram 14T90P análise de áudio
(±) | o volume do alto-falante é médio, mas bom (###valor### dB)
Graves 100 - 315Hz
(±) | graves reduzidos - em média 13.1% menor que a mediana
(±) | a linearidade dos graves é média (13.3% delta para a frequência anterior)
Médios 400 - 2.000 Hz
(±) | médios mais altos - em média 6.6% maior que a mediana
(+) | médios são lineares (4.3% delta para frequência anterior)
Altos 2 - 16 kHz
(+) | agudos equilibrados - apenas 1.3% longe da mediana
(+) | os máximos são lineares (3.9% delta da frequência anterior)
Geral 100 - 16.000 Hz
(±) | a linearidade do som geral é média (15.3% diferença em relação à mediana)
Comparado com a mesma classe
» 25% de todos os dispositivos testados nesta classe foram melhores, 5% semelhantes, 70% piores
» O melhor teve um delta de 6%, a média foi 20%, o pior foi 57%
Comparado com todos os dispositivos testados
» 22% de todos os dispositivos testados foram melhores, 4% semelhantes, 74% piores
» O melhor teve um delta de 4%, a média foi 23%, o pior foi 134%
Apple MacBook Pro 16 2021 M1 Pro análise de áudio
(+) | os alto-falantes podem tocar relativamente alto (###valor### dB)
Graves 100 - 315Hz
(+) | bons graves - apenas 3.8% longe da mediana
(+) | o baixo é linear (5.2% delta para a frequência anterior)
Médios 400 - 2.000 Hz
(+) | médios equilibrados - apenas 1.3% longe da mediana
(+) | médios são lineares (2.1% delta para frequência anterior)
Altos 2 - 16 kHz
(+) | agudos equilibrados - apenas 1.9% longe da mediana
(+) | os máximos são lineares (2.7% delta da frequência anterior)
Geral 100 - 16.000 Hz
(+) | o som geral é linear (4.6% diferença em relação à mediana)
Comparado com a mesma classe
» 0% de todos os dispositivos testados nesta classe foram melhores, 0% semelhantes, 100% piores
» O melhor teve um delta de 5%, a média foi 17%, o pior foi 45%
Comparado com todos os dispositivos testados
» 0% de todos os dispositivos testados foram melhores, 0% semelhantes, 100% piores
» O melhor teve um delta de 4%, a média foi 23%, o pior foi 134%
Gestão de energia
Consumo de energia
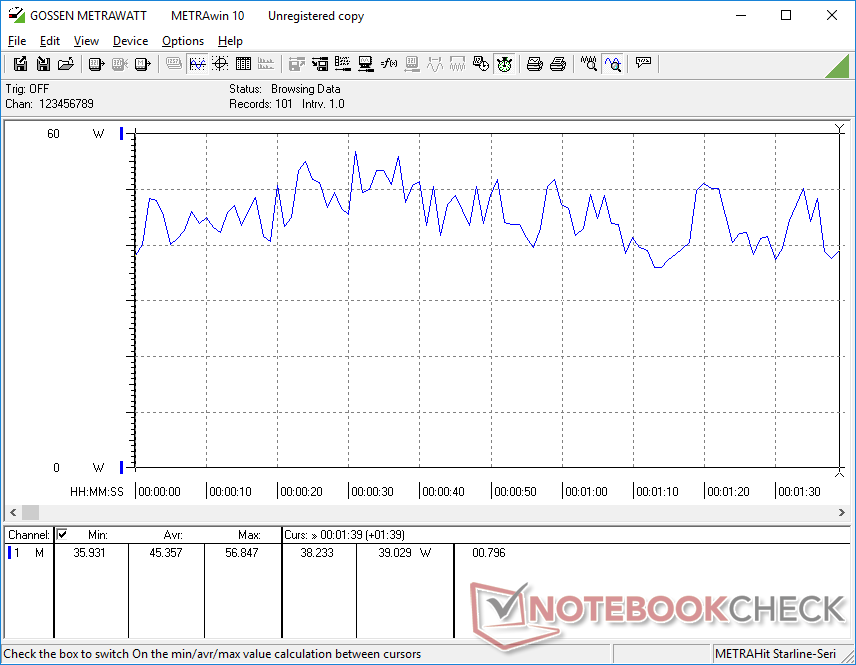
O sistema é muito eficiente no consumo de energia, consumindo apenas 2 W a 7 W quando ocioso na área de trabalho, dependendo do perfil de energia e da configuração de brilho. A execução de cargas de nível de jogo exigirá cerca de 45 W ou cerca de 36% mais potência do que no LG Gram 14T90N. O desempenho da GPU é pelo menos 2x a 3x mais rápido, no entanto, e assim, o maior consumo de energia vale bem os ganhos em gráficos
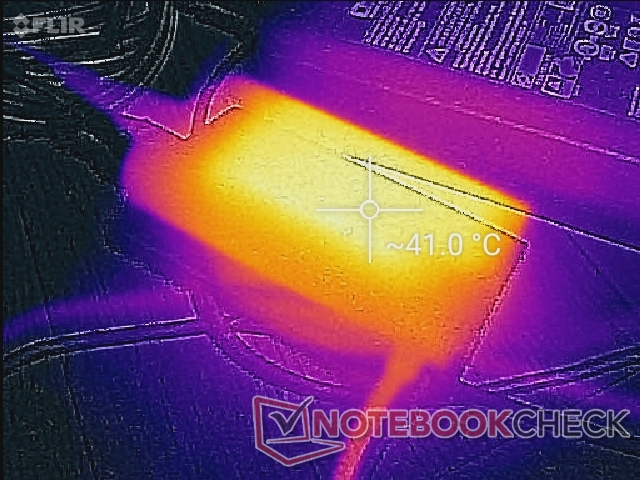
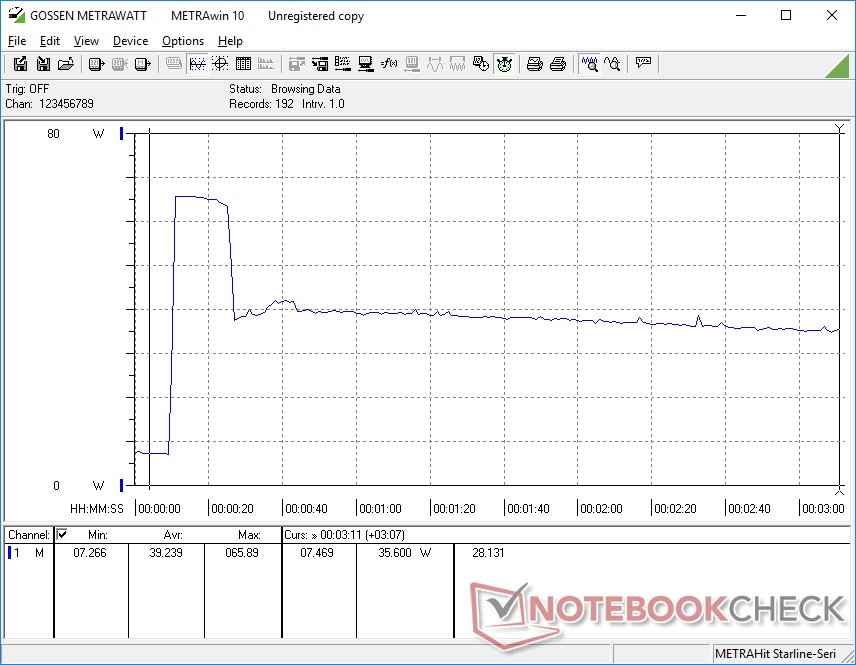
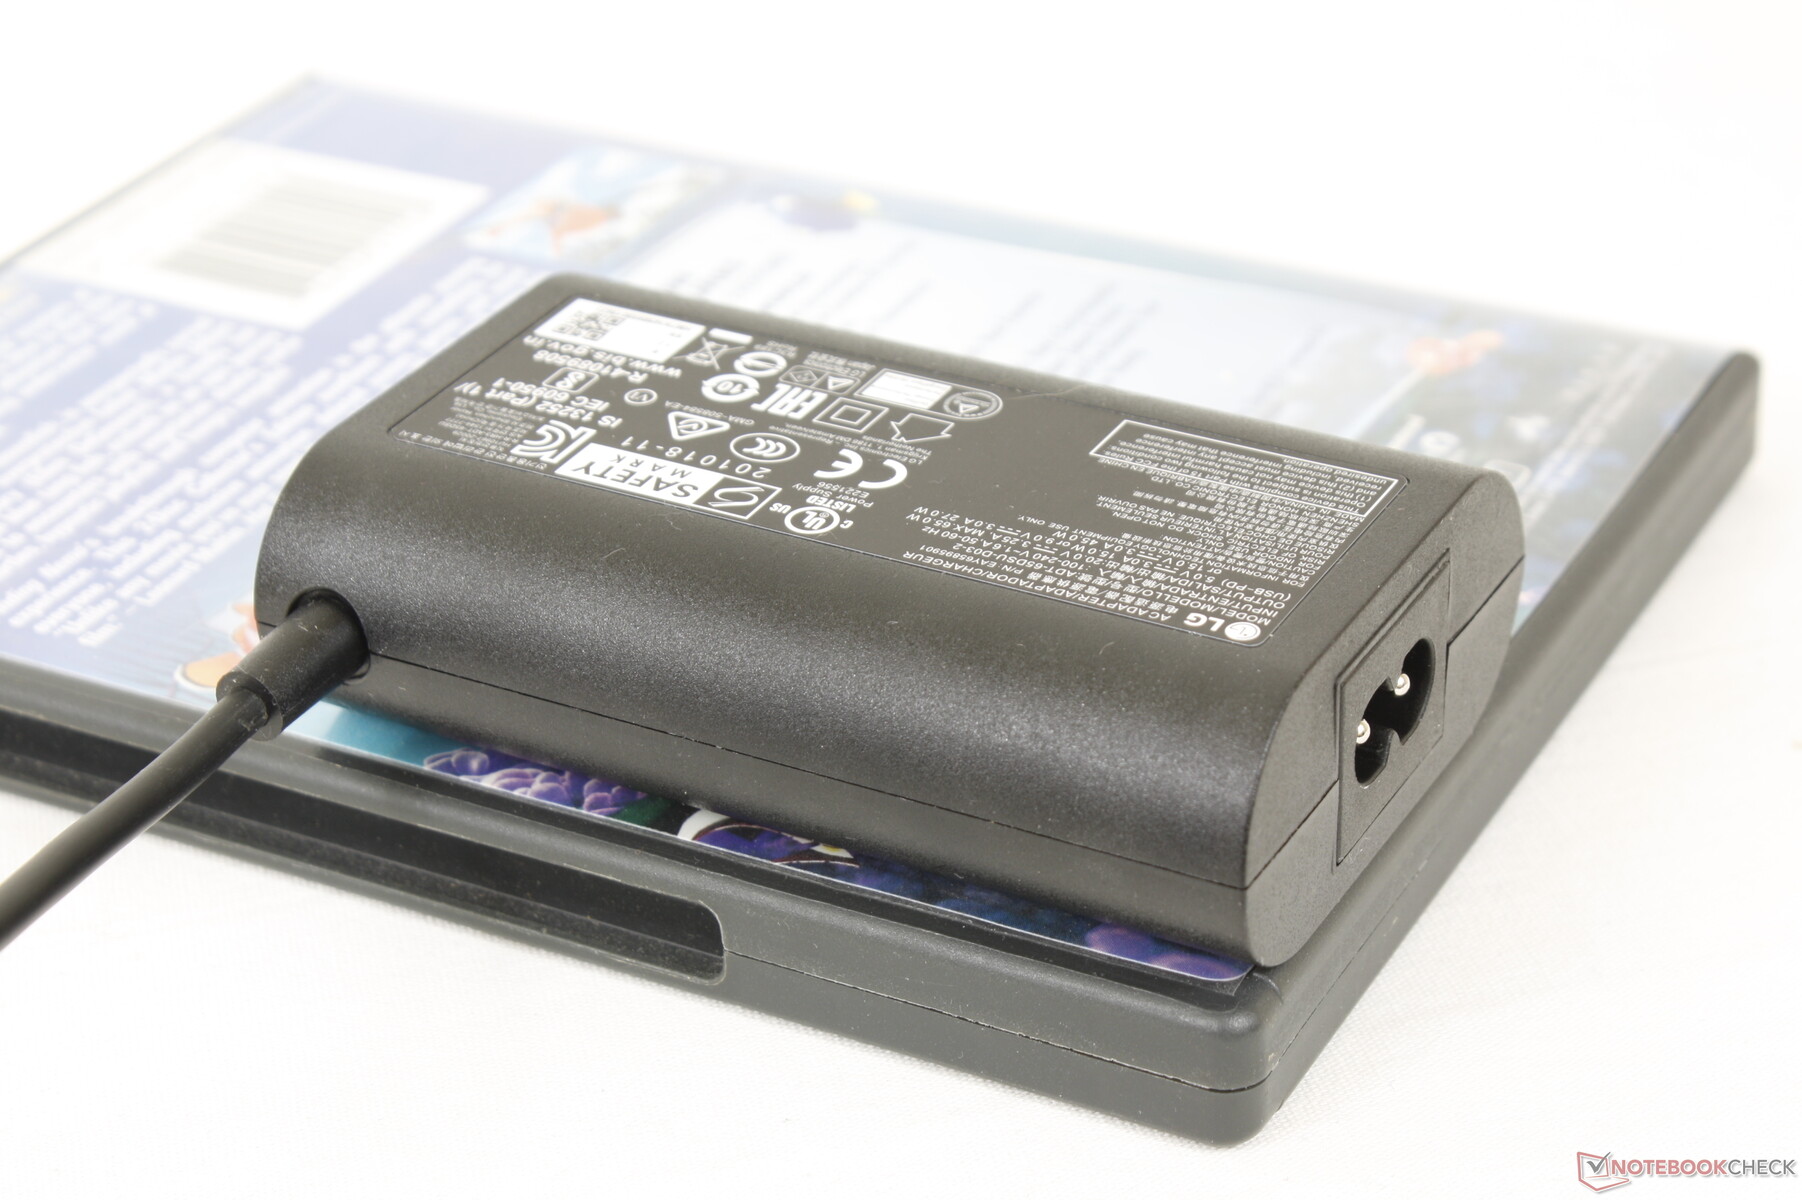
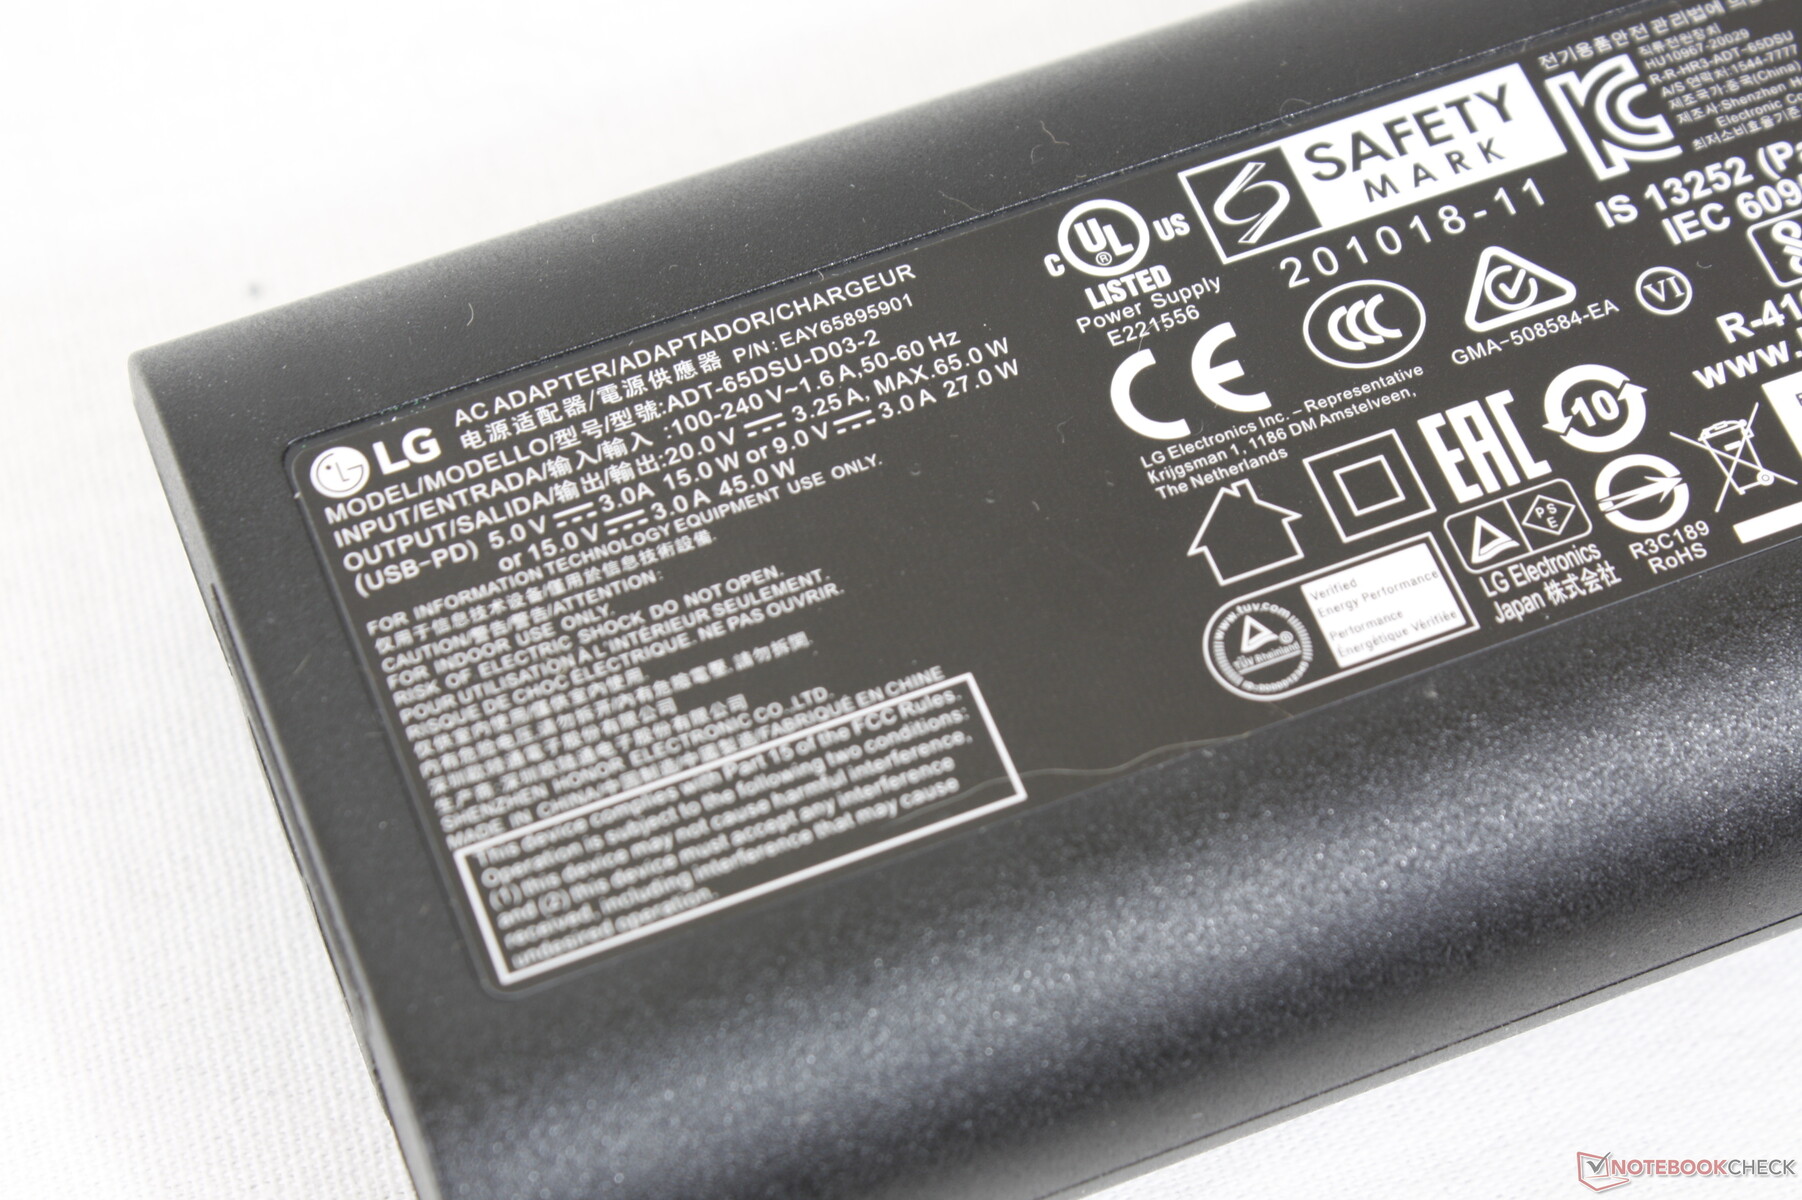
Somos capazes de registrar um consumo máximo temporário de 66 W do pequeno (~9,8 x 6 x 2,7 cm) adaptador USB-C AC de 65 W quando a CPU está em 100% de utilização.
| desligado | |
| Ocioso | |
| Carga |
|
Key:
min: | |
| LG Gram 14T90P i5-1135G7, Iris Xe G7 80EUs, Samsung SSD PM981a MZVLB512HBJQ, IPS, 1900x1200, 14" | Dell XPS 13 9310 2-in-1 i7-1165G7, Iris Xe G7 96EUs, Toshiba BG4 KBG40ZPZ512G, IPS, 1920x1200, 13.4" | Lenovo Yoga 9 14IAP7 82LU0001US i7-1260P, Iris Xe G7 96EUs, Samsung PM9A1 MZVL2512HCJQ, OLED, 2880x1800, 14" | Asus ZenBook Flip 14 UN5401QA-KN085W R7 5800H, Vega 8, Intel SSD 600p SSDPEKKW512G7, OLED, 2880x1800, 14" | HP Spectre x360 14-ea0378ng i7-1165G7, Iris Xe G7 96EUs, Intel Optane Memory H10 with Solid State Storage 32GB + 1TB HBRPEKNX0203AH(L/H), OLED, 3000x2000, 13.5" | MSI Summit E13 Flip Evo A11MT i7-1185G7, Iris Xe G7 96EUs, Phison 1TB SM2801T24GKBB4S-E162, IPS, 1920x1200, 13.4" | LG Gram 14T90N i7-10510U, UHD Graphics 620, Samsung SSD PM981a MZVLB512HBJQ, IPS, 1920x1080, 14" | |
|---|---|---|---|---|---|---|---|
| Power Consumption | 6% | -93% | -57% | -52% | -36% | 10% | |
| Idle Minimum * (Watt) | 2.8 | 2.6 7% | 8 -186% | 6.4 -129% | 6.3 -125% | 4.8 -71% | 2.9 -4% |
| Idle Average * (Watt) | 5.5 | 6.4 -16% | 14 -155% | 9.4 -71% | 11.2 -104% | 8.4 -53% | 5.8 -5% |
| Idle Maximum * (Watt) | 6.4 | 7.7 -20% | 14.4 -125% | 10.7 -67% | 13.3 -108% | 8.6 -34% | 6.2 3% |
| Load Average * (Watt) | 45.4 | 29.9 34% | 59.6 -31% | 52.2 -15% | 32 30% | 47.1 -4% | 32.9 28% |
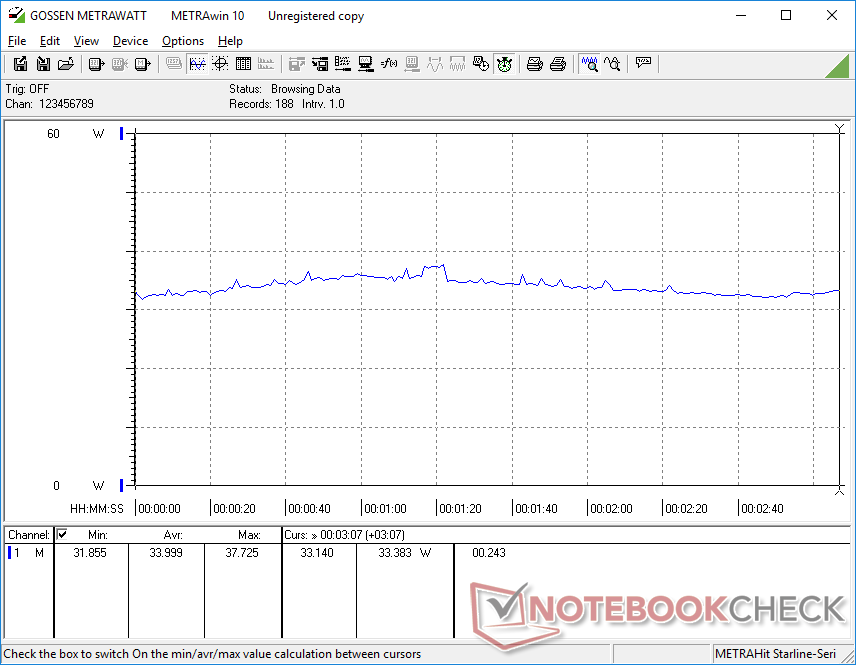
| Witcher 3 ultra * (Watt) | 34 | 32.2 5% | 53.6 -58% | 53 -56% | 51.6 -52% | ||
| Load Maximum * (Watt) | 65.9 | 47.5 28% | 68.1 -3% | 69 -5% | 35.6 46% | 65.9 -0% | 48.5 26% |
* ... menor é melhor
Power Consumption Witcher 3 / Stresstest
Power Consumption external Monitor
Duração da Bateria - Dia Inteiro de Navegação
A capacidade da bateria é a mesma do antigo Gram 14T90N a 72 Wh. Talvez sem coincidência, seus tempos de execução WLAN também são quase idênticos em pouco mais de 12 horas de uso no mundo real. É bom ver que a vida útil da bateria não é atingida mesmo que o desempenho do processador tenha aumentado significativamente quando comparado ao Comet Lake-U do 10º gênero
A carga de capacidade vazia a plena é muito lenta a 2,5 horas em comparação com 1,5 horas ou mais rápido na maioria dos outros Ultrabooks.
| LG Gram 14T90P i5-1135G7, Iris Xe G7 80EUs, 72 Wh | Dell XPS 13 9310 2-in-1 i7-1165G7, Iris Xe G7 96EUs, 51 Wh | Lenovo Yoga 9 14IAP7 82LU0001US i7-1260P, Iris Xe G7 96EUs, 75 Wh | Asus ZenBook Flip 14 UN5401QA-KN085W R7 5800H, Vega 8, 63 Wh | HP Spectre x360 14-ea0378ng i7-1165G7, Iris Xe G7 96EUs, 66 Wh | MSI Summit E13 Flip Evo A11MT i7-1185G7, Iris Xe G7 96EUs, 70 Wh | LG Gram 14T90N i7-10510U, UHD Graphics 620, 72 Wh | |
|---|---|---|---|---|---|---|---|
| Duração da bateria | 18% | -44% | -19% | -12% | -15% | 8% | |
| WiFi v1.3 (h) | 12.1 | 10.7 -12% | 6.8 -44% | 8.7 -28% | 7.8 -36% | 11.2 -7% | 12.5 3% |
| Load (h) | 2.3 | 3.4 48% | 2.1 -9% | 2.6 13% | 1.8 -22% | 2.6 13% | |
| Reader / Idle (h) | 25.4 | 13.4 | 21.1 | 32.8 | |||
| H.264 (h) | 9 | 11.1 |
Pro
Contra
Veredicto - O Veredicto a Receber
O peso mais leve que a média, a nítida tela sensível ao toque 16:10 DCI-P3 e a excelente duração da bateria são os destaques do Gram 14T90P. Seu novo design é mais forte sem adicionar peso para manter uma das maiores vantagens da série Gram 14 polegadas sobre concorrentes como o mais pesado Lenovo Yoga 9 14, HP Spectre x360 14, ou Dell XPS 13 2 em 1. O chassi pode ser um pouco menos rígido, mas a economia de peso pode valer a pena para os viajantes ou estudantes.
O Gram 14T90P é a atualização completa que a série Gram de 14 polegadas precisava.
Infelizmente, há uma lista decente de armadilhas que gostaríamos de ver melhorada. A taxa de carga lenta, taxas de quadros instáveis quando se joga, clickpad esponjoso, brilho médio da tela, falta de suporte do Windows Olá, dificuldade de manutenção e rigidez média das dobradiças, tudo isso traz para baixo um excelente conversível de 14 polegadas. Se a LG pode corrigir estes inconvenientes principais mantendo o baixo peso, então o Gram 14 ficaria facilmente de pé com alternativas mais populares da Dell, Lenovo, ou HP.
Preço e Disponibilidade
LG Gram 14T90P
- 05/21/2022 v7 (old)
Allen Ngo
Price comparison

