Framework Laptop 13.5 Intel 12th gen review: Como a superfície da Microsoft, mas na verdade reparável
O laptop original de 13,5 polegadas Framework Laptop lançado em 2021 equipado com processadores Intel 11th gen Tiger Lake-U. Em contraste com outros modelos ultrafinos de fabricantes maiores, muitas vezes fechados e de difícil manutenção, o projeto da estrutura priorizaria a reparabilidade e incentivaria as atualizações para o usuário final. Na verdade, o fabricante vende abertamente componentes individuais de um laptop a la carte, caso os proprietários precisem substituir qualquer peça. O último modelo 2022 está agora disponível com CPUs Intel 12th gen Alder Lake-P mais rápidas, mas com o mesmo design geral de chassi para preservar a compatibilidade com os acessórios e componentes existentes
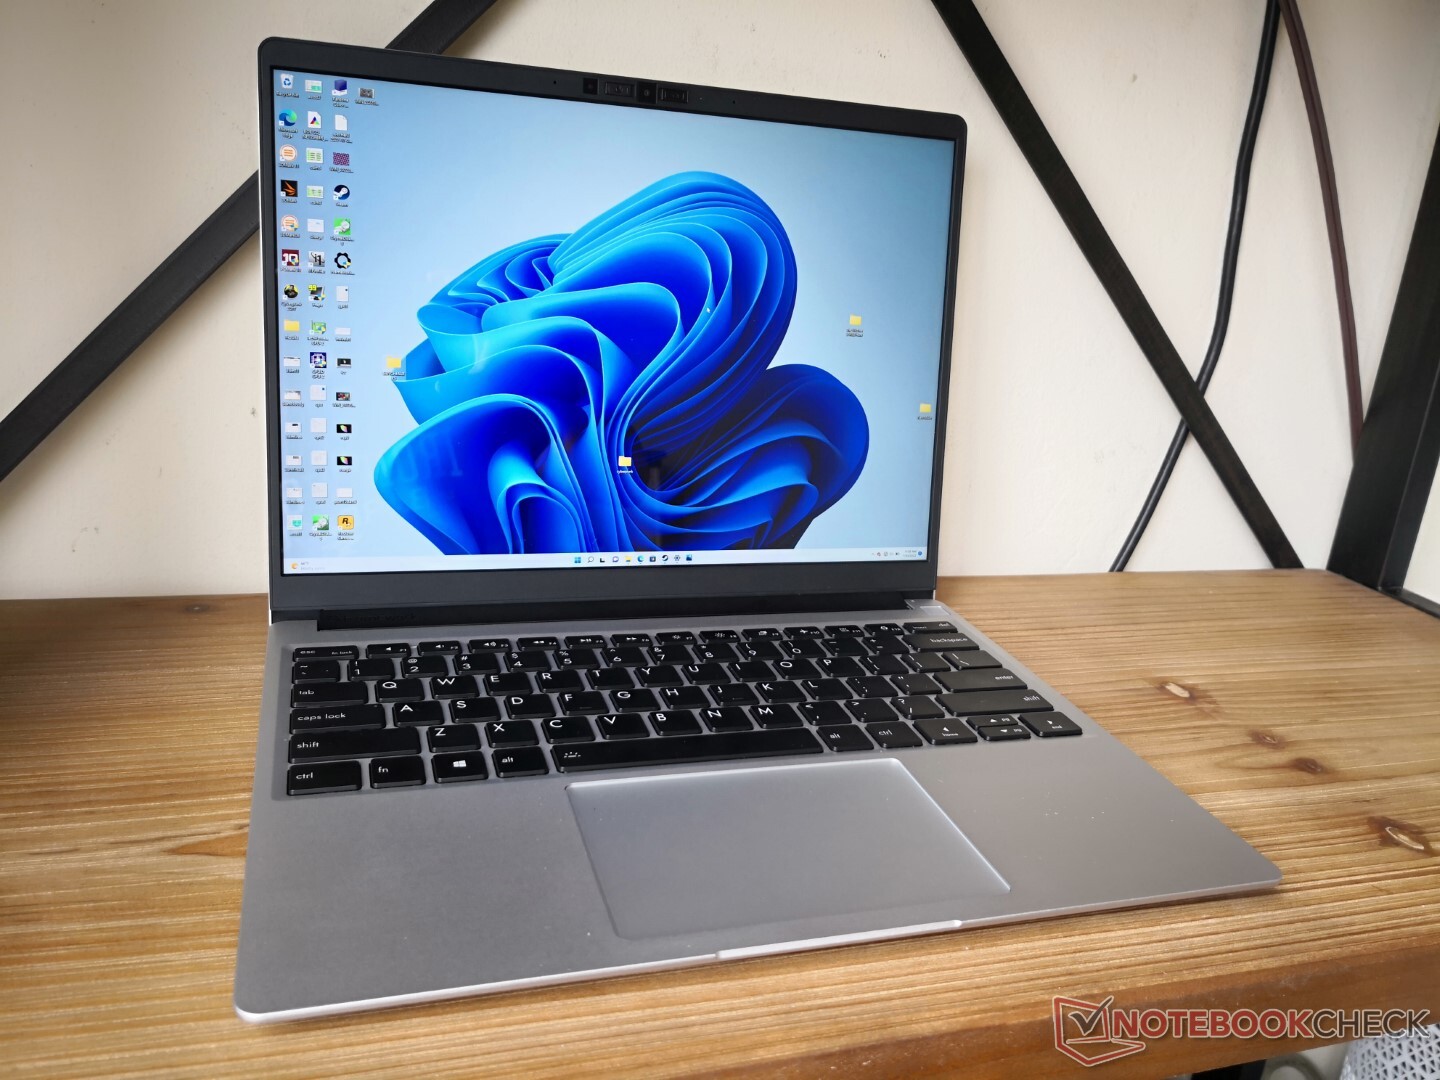
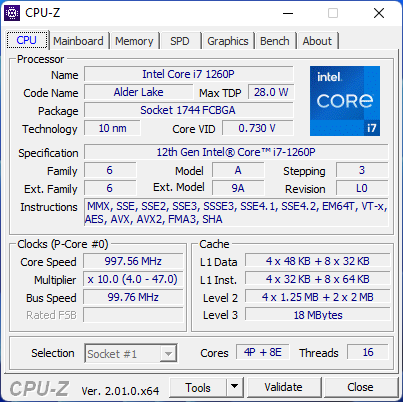
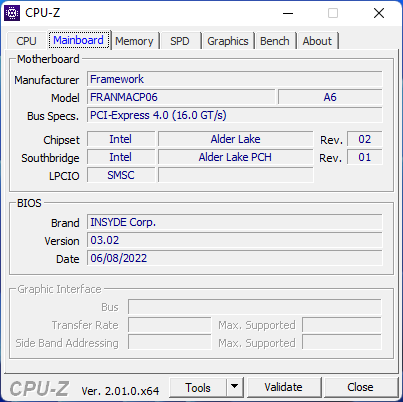
Como o esqueleto não mudou, recomendamos verificar nossa revisão existente no modelo 2021 para mais informações sobre os atributos físicos do modelo 2022. Tudo, desde o display até o teclado e a maioria dos materiais, está de volta sem grandes alterações. Nossa unidade de revisão particular vem com o Core i7-1260P por aproximadamente US$1450, mas os usuários podem configurar com o menor i5-1240P ou maior i7-1280P, se desejarem. Todas as SKUs ainda vêm com o mesmo painel IPS 2256 x 1504, no entanto.
As alternativas para o Framework Laptop incluem outros Ultrabooks de 13 polegadas como o HP Spectre x360 14, Lenovo ThinkPad X1, Asus Zenbook S13, e naturalmente o Microsoft Surface Laptop 4 13.
Possíveis concorrentes em comparação
Avaliação | Data | Modelo | Peso | Altura | Size | Resolução | Preço |
|---|---|---|---|---|---|---|---|
| 85.1 % v7 (old) | 07/2022 | Framework Laptop 13.5 12th Gen Intel i7-1260P, Iris Xe G7 96EUs | 1.3 kg | 15.85 mm | 13.50" | 2256x1504 | |
| 85.4 % v7 (old) | 07/2021 | Framework Laptop 13.5 i7-1165G7, Iris Xe G7 96EUs | 1.3 kg | 15.85 mm | 13.50" | 2256x1504 | |
| 88.5 % v7 (old) | Lenovo ThinkPad X1 Titanium Yoga G1 20QB0016GE i5-1140G7, Iris Xe G7 80EUs | 1.2 kg | 11.5 mm | 13.50" | 2256x1504 | ||
| 84 % v7 (old) | 08/2021 | HP EliteBook Folio 13.5-3G2L2EA SD 8cx Gen 2 5G, Adreno 680 | 1.3 kg | 16 mm | 13.50" | 1920x1280 | |
| 85.2 % v7 (old) | 05/2021 | Microsoft Surface Laptop 4 13 Ryzen 5 R5 4680U, Vega 7 | 1.3 kg | 14 mm | 13.50" | 2256x1504 | |
| 89.5 % v7 (old) | 05/2021 | HP Spectre x360 14-ea0378ng i7-1165G7, Iris Xe G7 96EUs | 1.3 kg | 16.9 mm | 13.50" | 3000x2000 |
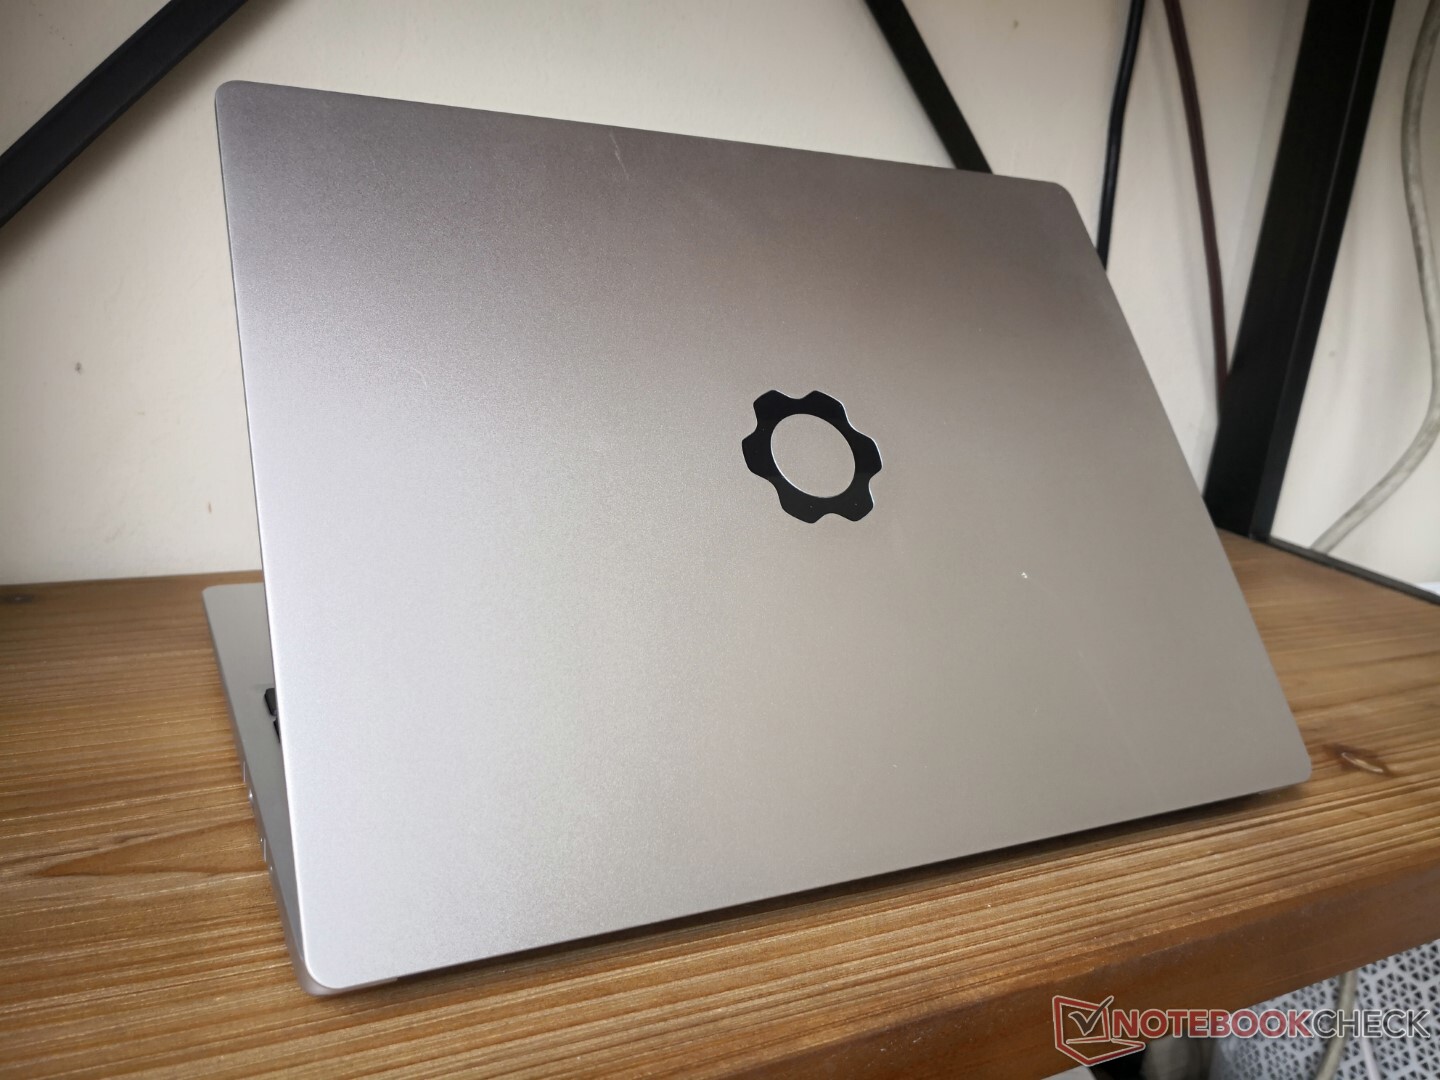
Caso
A única mudança feita no chassi envolve uma mudança para a fabricação e montagem CNC para a tampa superior para melhorar a rigidez da tampa sem alterar as dimensões gerais. Achamos que a tampa é frágil na versão 2021 e, portanto, o novo design é uma mudança bem-vinda. Mesmo assim, as tampas da maioria das alternativas concorrentes como o XPS 13, Spectre x360 14, Zenbook S13, Razer Blade Stealthou MateBook série X continuam a ser muito mais fortes e mais rígidos. O projeto da estrutura carece notavelmente de quaisquer opções de vidro Gorilla que teriam reforçado e endurecido a tampa.
Leitor de cartões SD
| SD Card Reader | |
| average JPG Copy Test (av. of 3 runs) | |
| HP Spectre x360 14-ea0378ng (Toshiba Exceria Pro M501 microSDXC 64GB) | |
| Framework Laptop 13.5 (AV Pro UHS-II V60) | |
| Framework Laptop 13.5 12th Gen Intel (AV Pro UHS-II V60) | |
| maximum AS SSD Seq Read Test (1GB) | |
| HP Spectre x360 14-ea0378ng (Toshiba Exceria Pro M501 microSDXC 64GB) | |
| Framework Laptop 13.5 (AV Pro UHS-II V60) | |
| Framework Laptop 13.5 12th Gen Intel (AV Pro UHS-II V60) | |
Comunicação
Embora o módulo Intel AX210 não tenha mudado em relação ao modelo do ano passado, desde então atualizamos nossos roteadores de teste para suportar a conectividade de 6 GHz e, portanto, as taxas médias de transferência mais rápidas podem ser registradas como mostrado abaixo.
Ainda não há opções 4G ou WAN disponíveis.
| Networking | |
| iperf3 transmit AX12 | |
| Microsoft Surface Laptop 4 13 Ryzen 5 | |
| Framework Laptop 13.5 | |
| HP Spectre x360 14-ea0378ng | |
| HP EliteBook Folio 13.5-3G2L2EA | |
| iperf3 receive AX12 | |
| Microsoft Surface Laptop 4 13 Ryzen 5 | |
| Framework Laptop 13.5 | |
| HP Spectre x360 14-ea0378ng | |
| HP EliteBook Folio 13.5-3G2L2EA | |
| iperf3 receive AXE11000 6GHz | |
| Framework Laptop 13.5 12th Gen Intel | |
| iperf3 transmit AXE11000 6GHz | |
| Framework Laptop 13.5 12th Gen Intel | |
Webcam


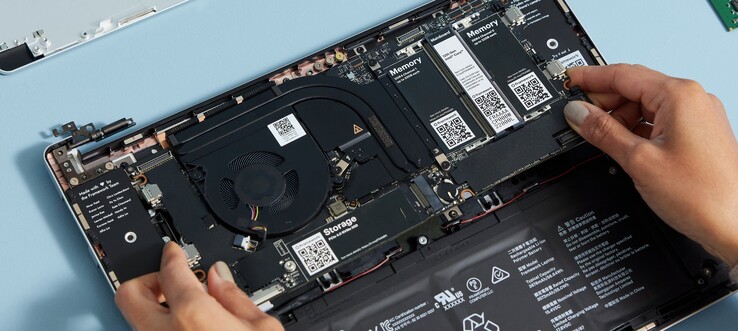
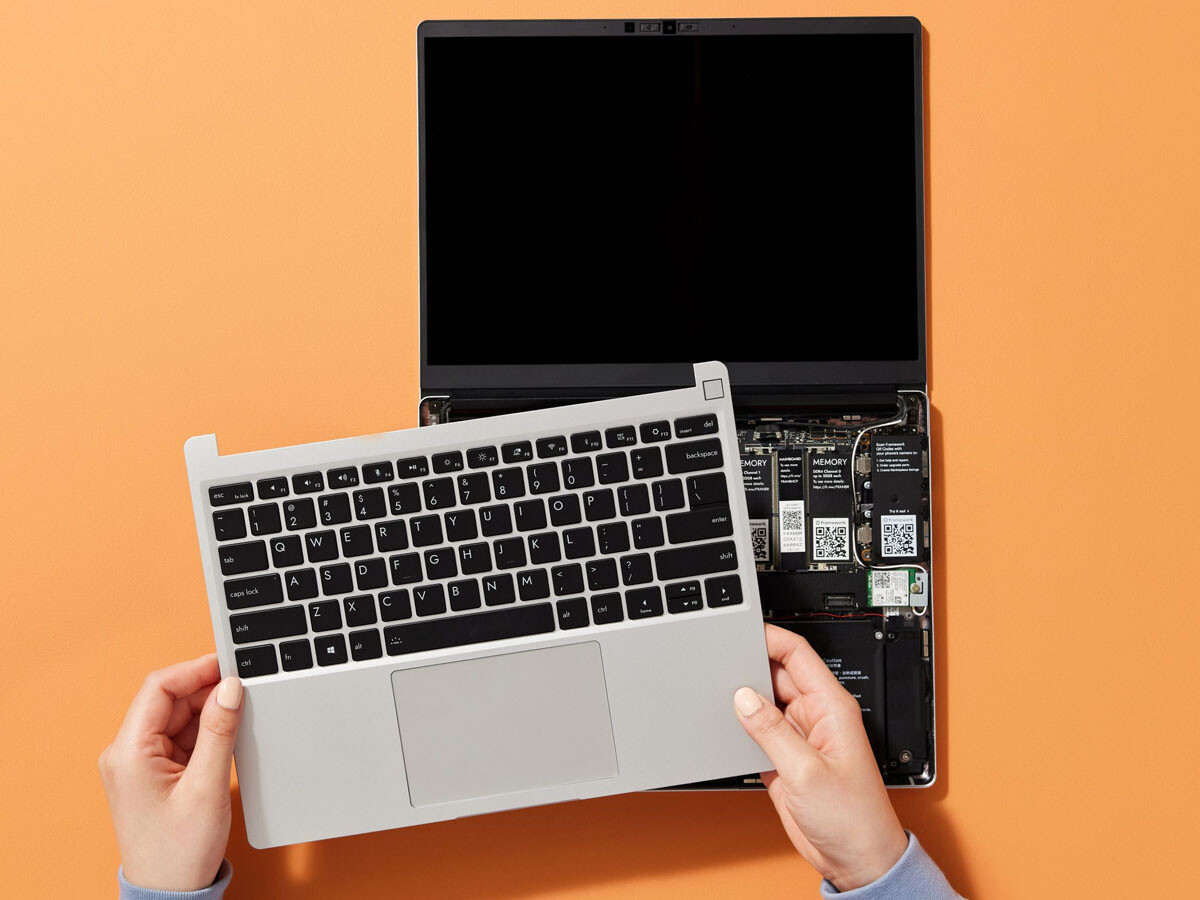
Manutenção
A unidade é um dos modelos de laptop mais fáceis de atender, como seria de se esperar. A estrutura também vende placas-mãe e kits de bricolagem para os usuários que desejam montar o laptop eles mesmos.
Acessórios
As exclusivas placas de expansão baseadas em USB-C voltaram todas este ano, além de uma nova placa de expansão Ethernet que suporta velocidades de até 2,5 Gbit. Todas são opcionais e configuráveis no checkout. O fabricante continuará a desenvolver diferentes cartões de expansão com base na demanda do usuário.
Cada caixa de varejo inclui uma chave Torx para a manutenção da unidade.
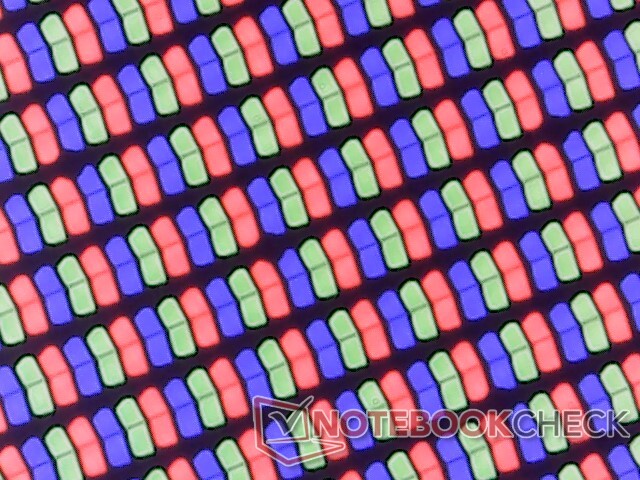
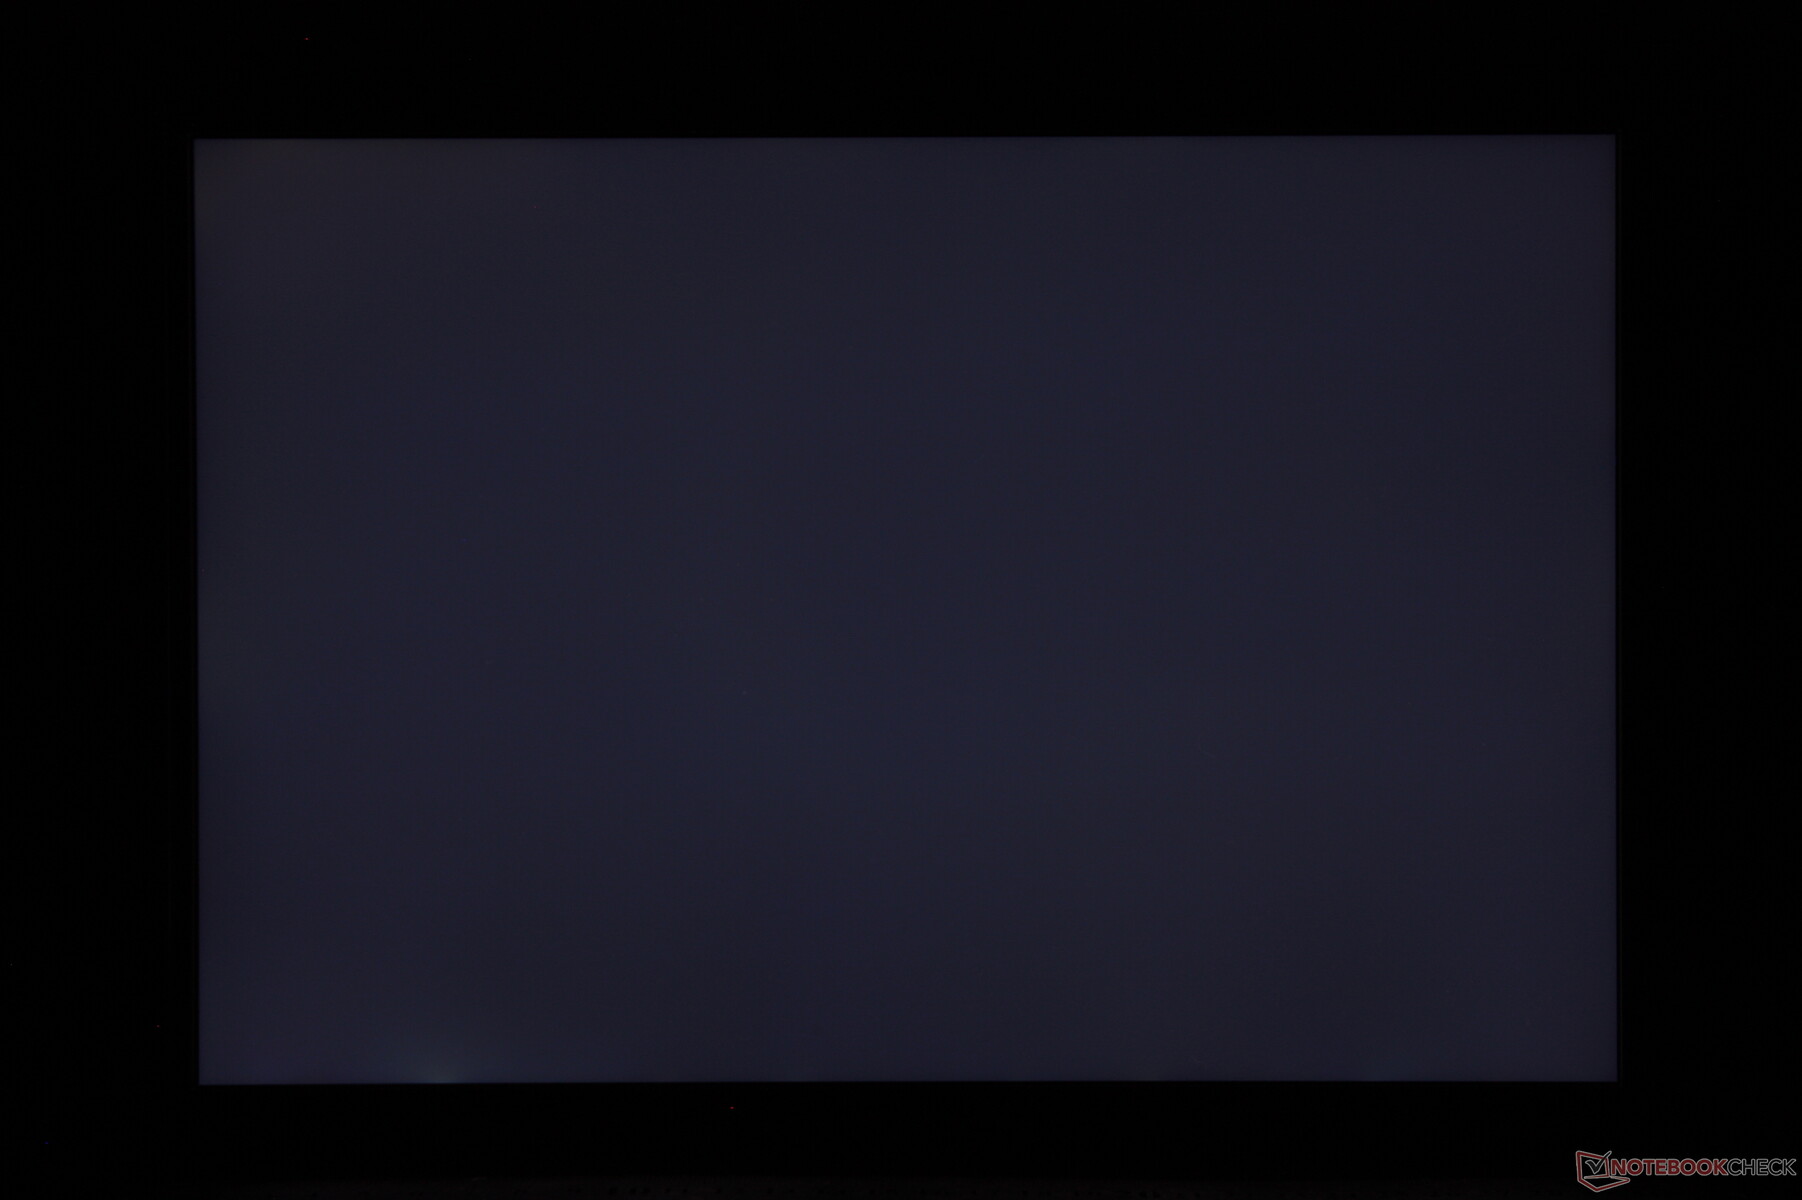
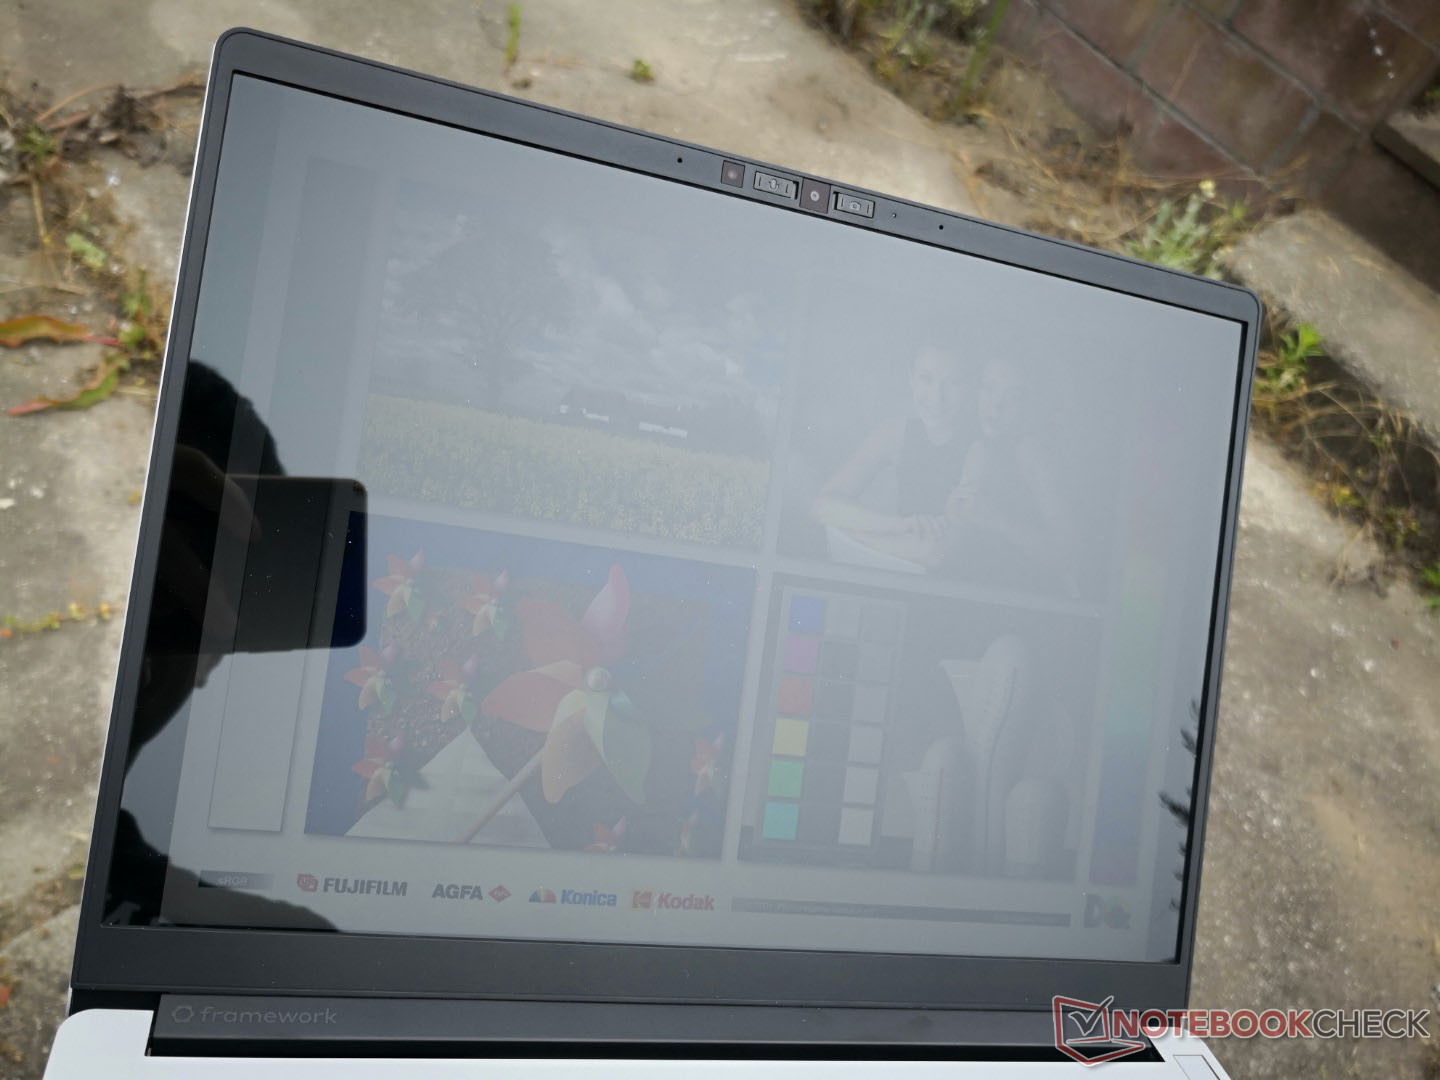
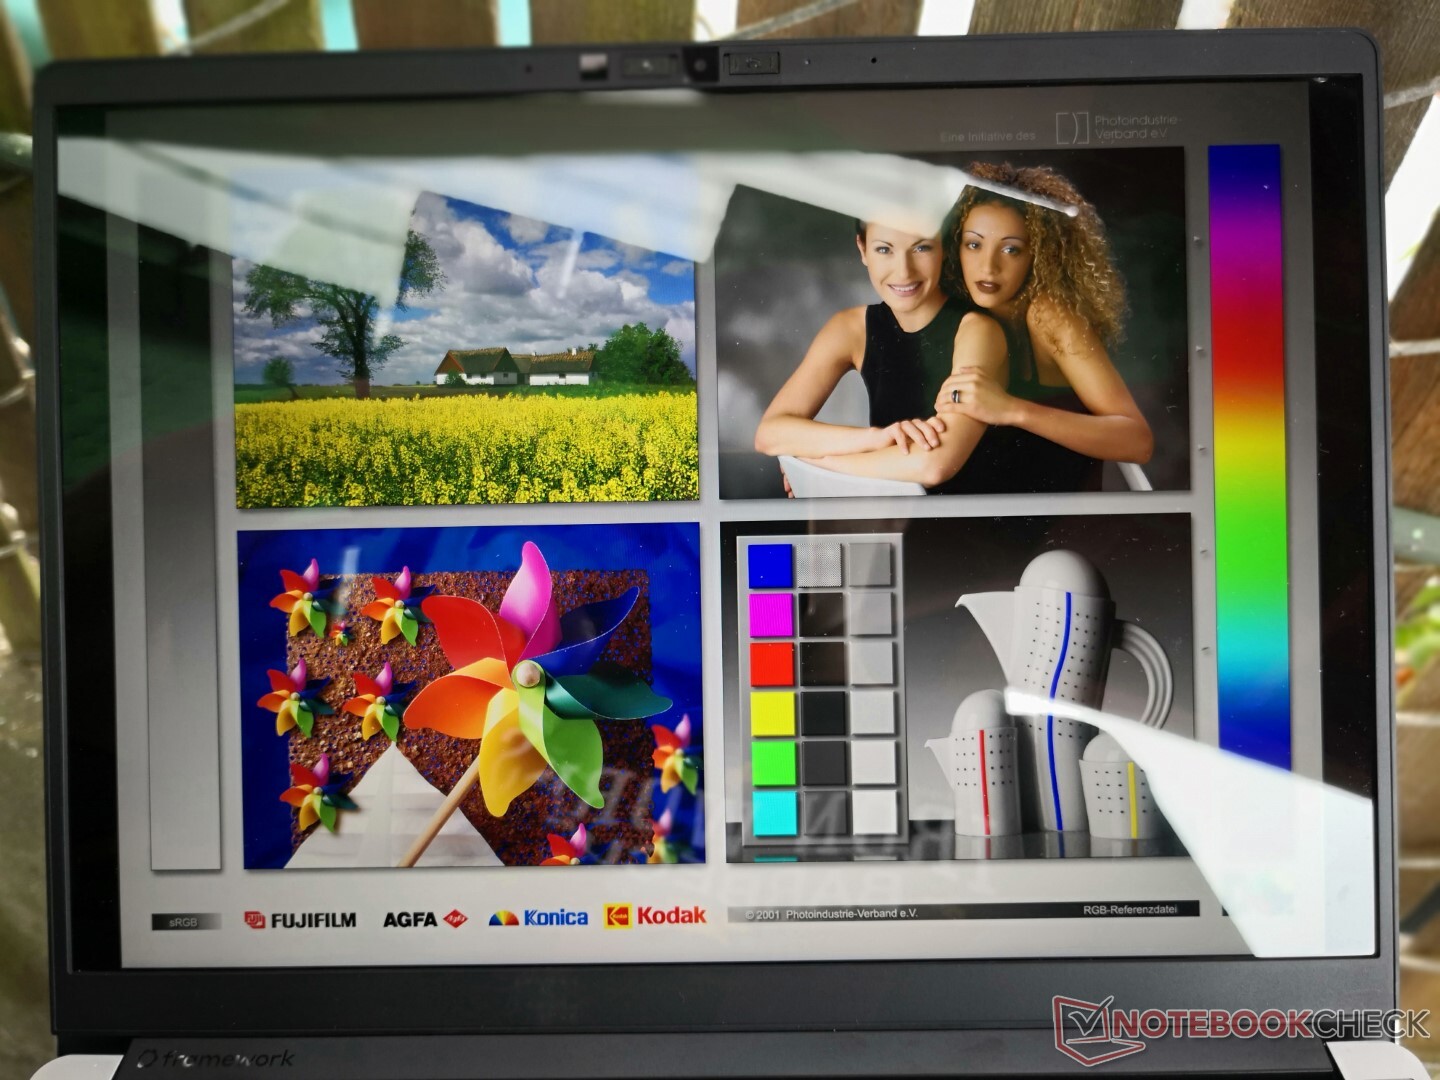
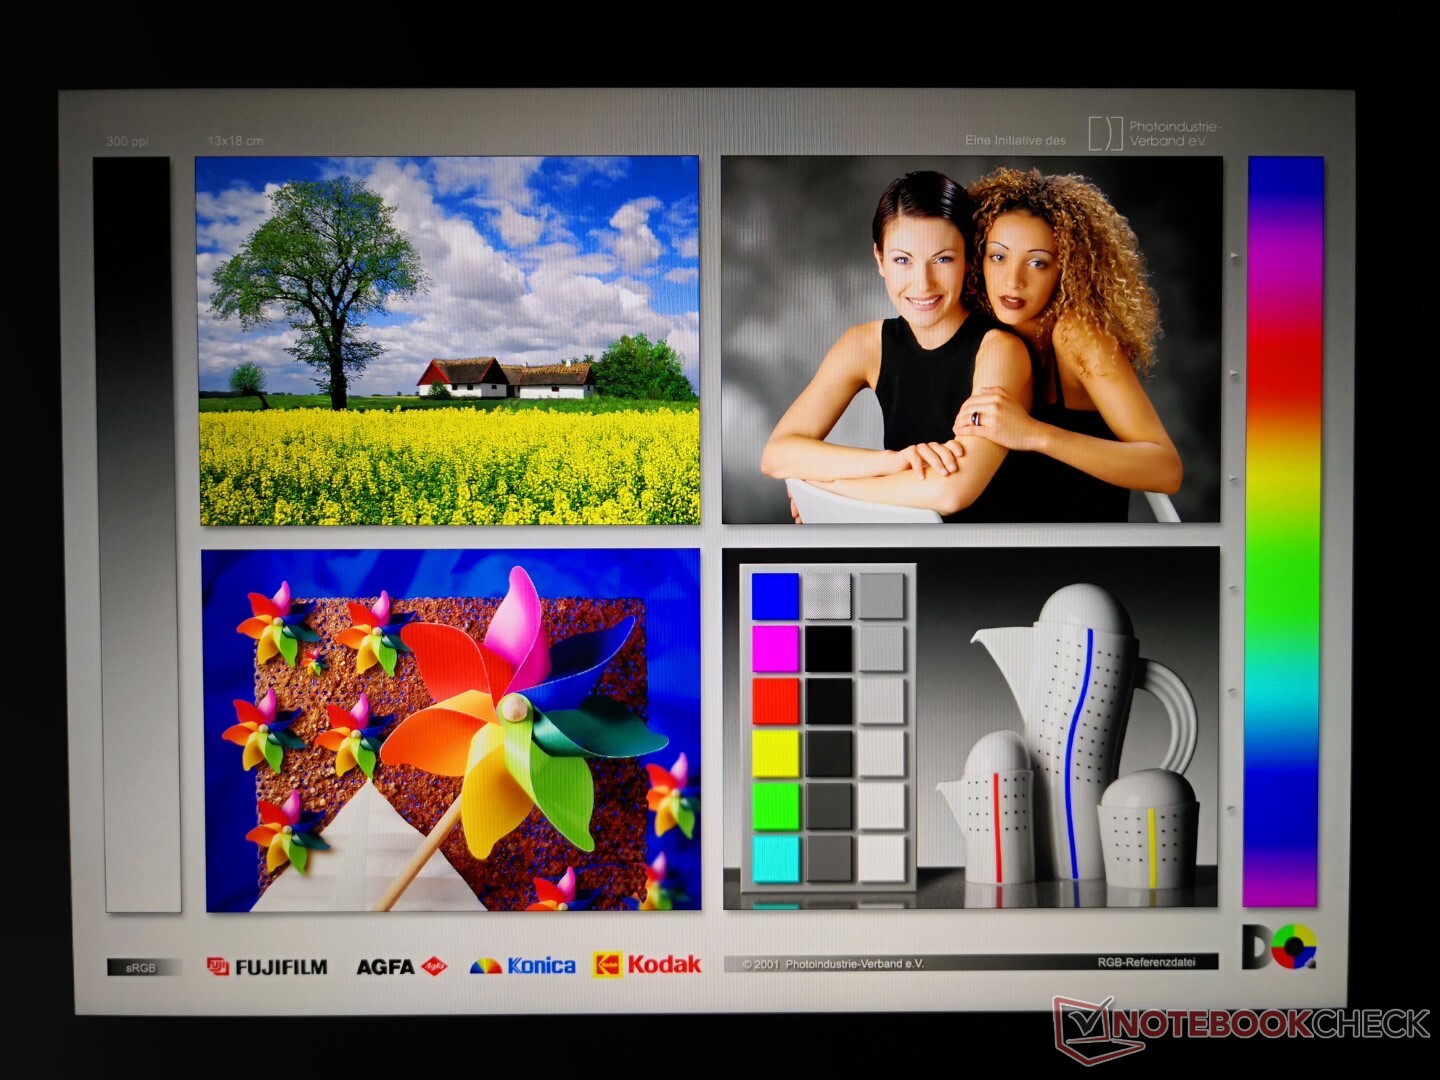
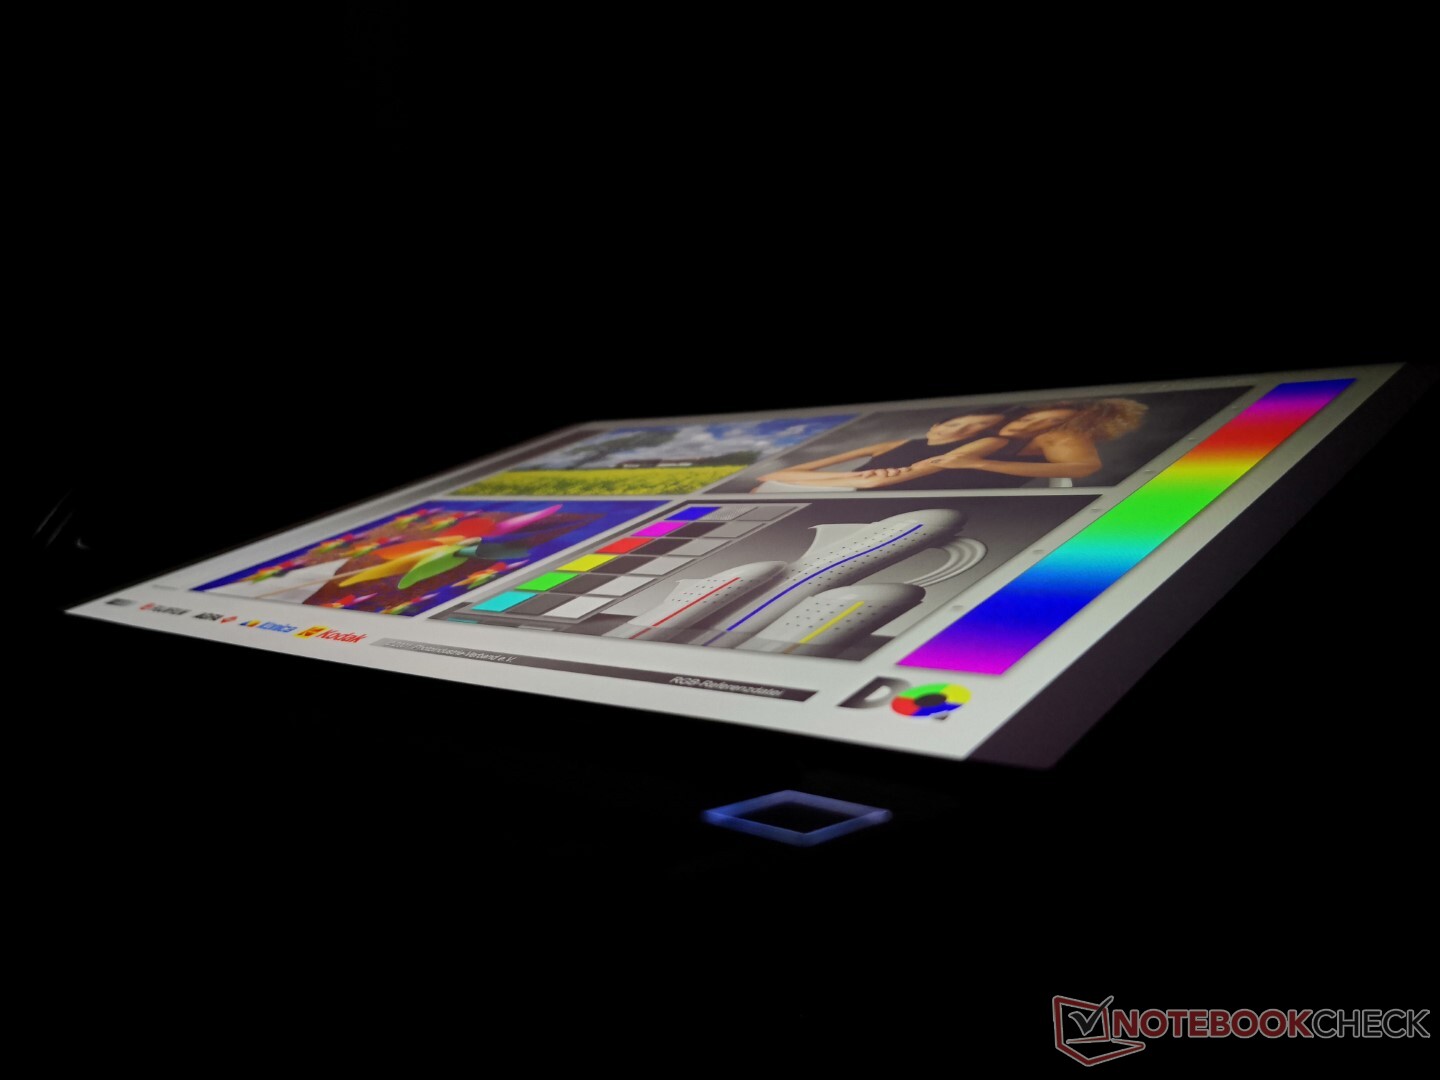
Mostrar
| |||||||||||||||||||||||||
iluminação: 90 %
iluminação com acumulador: 449.6 cd/m²
Contraste: 1450:1 (Preto: 0.31 cd/m²)
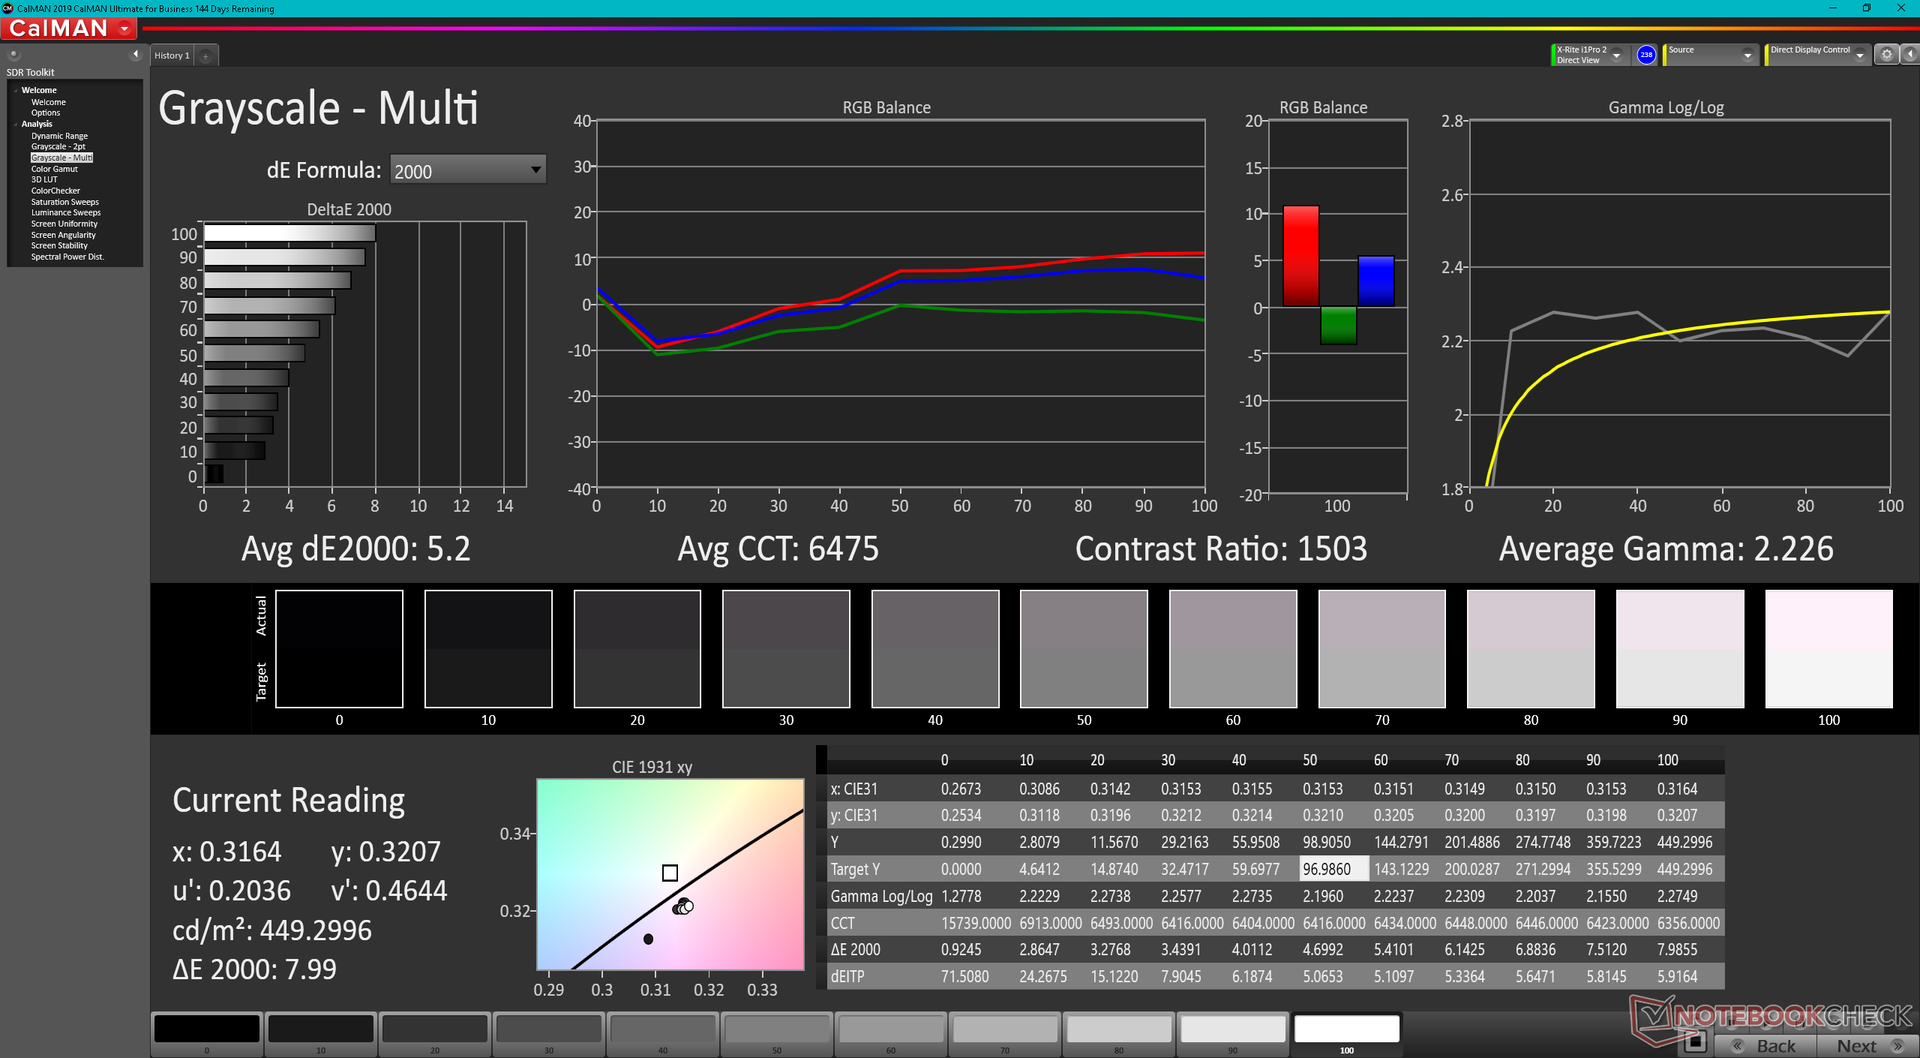
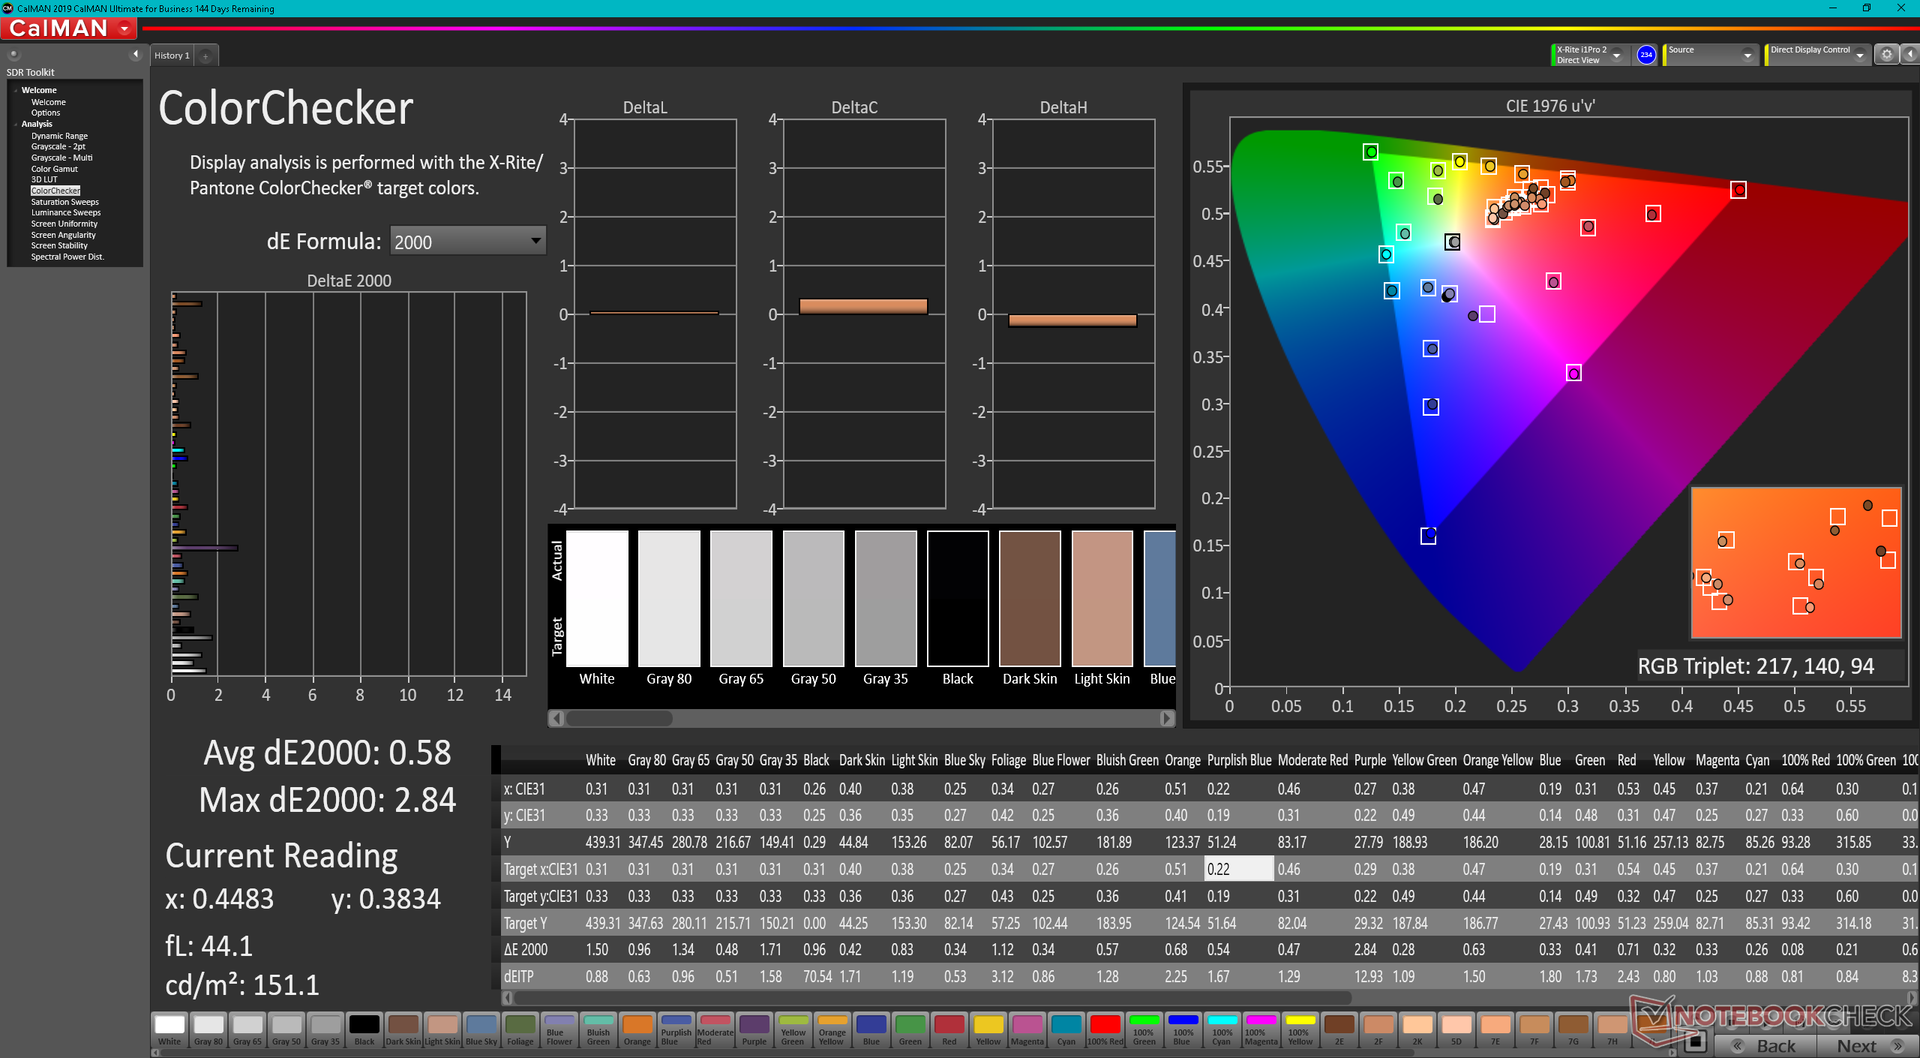
ΔE ColorChecker Calman: 2.76 | ∀{0.5-29.43 Ø4.71}
calibrated: 0.58
ΔE Greyscale Calman: 5.2 | ∀{0.09-98 Ø4.96}
71.1% AdobeRGB 1998 (Argyll 3D)
99.4% sRGB (Argyll 3D)
69.9% Display P3 (Argyll 3D)
Gamma: 2.23
CCT: 6475 K
| Framework Laptop 13.5 12th Gen Intel BOE CQ NE135FBM-N41, IPS, 2256x1504, 13.5" | Framework Laptop 13.5 BOE CQ NE135FBM-N41, IPS, 2256x1504, 13.5" | Lenovo ThinkPad X1 Titanium Yoga G1 20QB0016GE LPM135M467, IPS LED, 2256x1504, 13.5" | HP EliteBook Folio 13.5-3G2L2EA LGD0663, IPS, 1920x1280, 13.5" | HP Spectre x360 14-ea0378ng Samsung SDC4148, OLED, 3000x2000, 13.5" | Microsoft Surface Laptop 4 13 i7 LQ135P1JX51, IPS, 2256x1504, 13.5" | |
|---|---|---|---|---|---|---|
| Display | -1% | -3% | 26% | -5% | ||
| Display P3 Coverage (%) | 69.9 | 69 -1% | 66.8 -4% | 99.9 43% | 64.7 -7% | |
| sRGB Coverage (%) | 99.4 | 99.3 0% | 98 -1% | 100 1% | 97.2 -2% | |
| AdobeRGB 1998 Coverage (%) | 71.1 | 70.3 -1% | 68.6 -4% | 96.1 35% | 66.9 -6% | |
| Response Times | -46% | -72% | -13% | 94% | -63% | |
| Response Time Grey 50% / Grey 80% * (ms) | 34.7 ? | 55.6 ? -60% | 64 ? -84% | 44 ? -27% | 2 ? 94% | 62.8 ? -81% |
| Response Time Black / White * (ms) | 27.5 ? | 36 ? -31% | 44 ? -60% | 27 ? 2% | 2 ? 93% | 39.8 ? -45% |
| PWM Frequency (Hz) | 250 ? | 21930 ? | ||||
| Screen | -8% | 14% | -9% | 259% | 3% | |
| Brightness middle (cd/m²) | 449.6 | 449 0% | 465 3% | 250 -44% | 370 -18% | 413 -8% |
| Brightness (cd/m²) | 431 | 435 1% | 451 5% | 226 -48% | 374 -13% | 400 -7% |
| Brightness Distribution (%) | 90 | 93 3% | 92 2% | 82 -9% | 90 0% | 94 4% |
| Black Level * (cd/m²) | 0.31 | 0.39 -26% | 0.28 10% | 0.215 31% | 0.01 97% | 0.29 6% |
| Contrast (:1) | 1450 | 1151 -21% | 1661 15% | 1163 -20% | 37000 2452% | 1424 -2% |
| Colorchecker dE 2000 * | 2.76 | 2.34 15% | 2 28% | 3.59 -30% | 2.57 7% | 2.8 -1% |
| Colorchecker dE 2000 max. * | 7.96 | 7.07 11% | 4.7 41% | 5.9 26% | 4.52 43% | 7.2 10% |
| Colorchecker dE 2000 calibrated * | 0.58 | 0.96 -66% | 0.7 -21% | 2.31 -298% | 0.8 -38% | |
| Greyscale dE 2000 * | 5.2 | 4.7 10% | 2.9 44% | 3.99 23% | 2.2 58% | 1.9 63% |
| Gamma | 2.23 99% | 2.29 96% | 2.09 105% | 2.98 74% | 2.36 93% | 2.12 104% |
| CCT | 6475 100% | 6760 96% | 6181 105% | 6765 96% | 6154 106% | 6510 100% |
| Color Space (Percent of AdobeRGB 1998) (%) | 85.8 | 61.6 | ||||
| Color Space (Percent of sRGB) (%) | 100 | 97.2 | ||||
| Média Total (Programa/Configurações) | -18% /
-12% | -20% /
-2% | -11% /
-10% | 126% /
185% | -22% /
-8% |
* ... menor é melhor
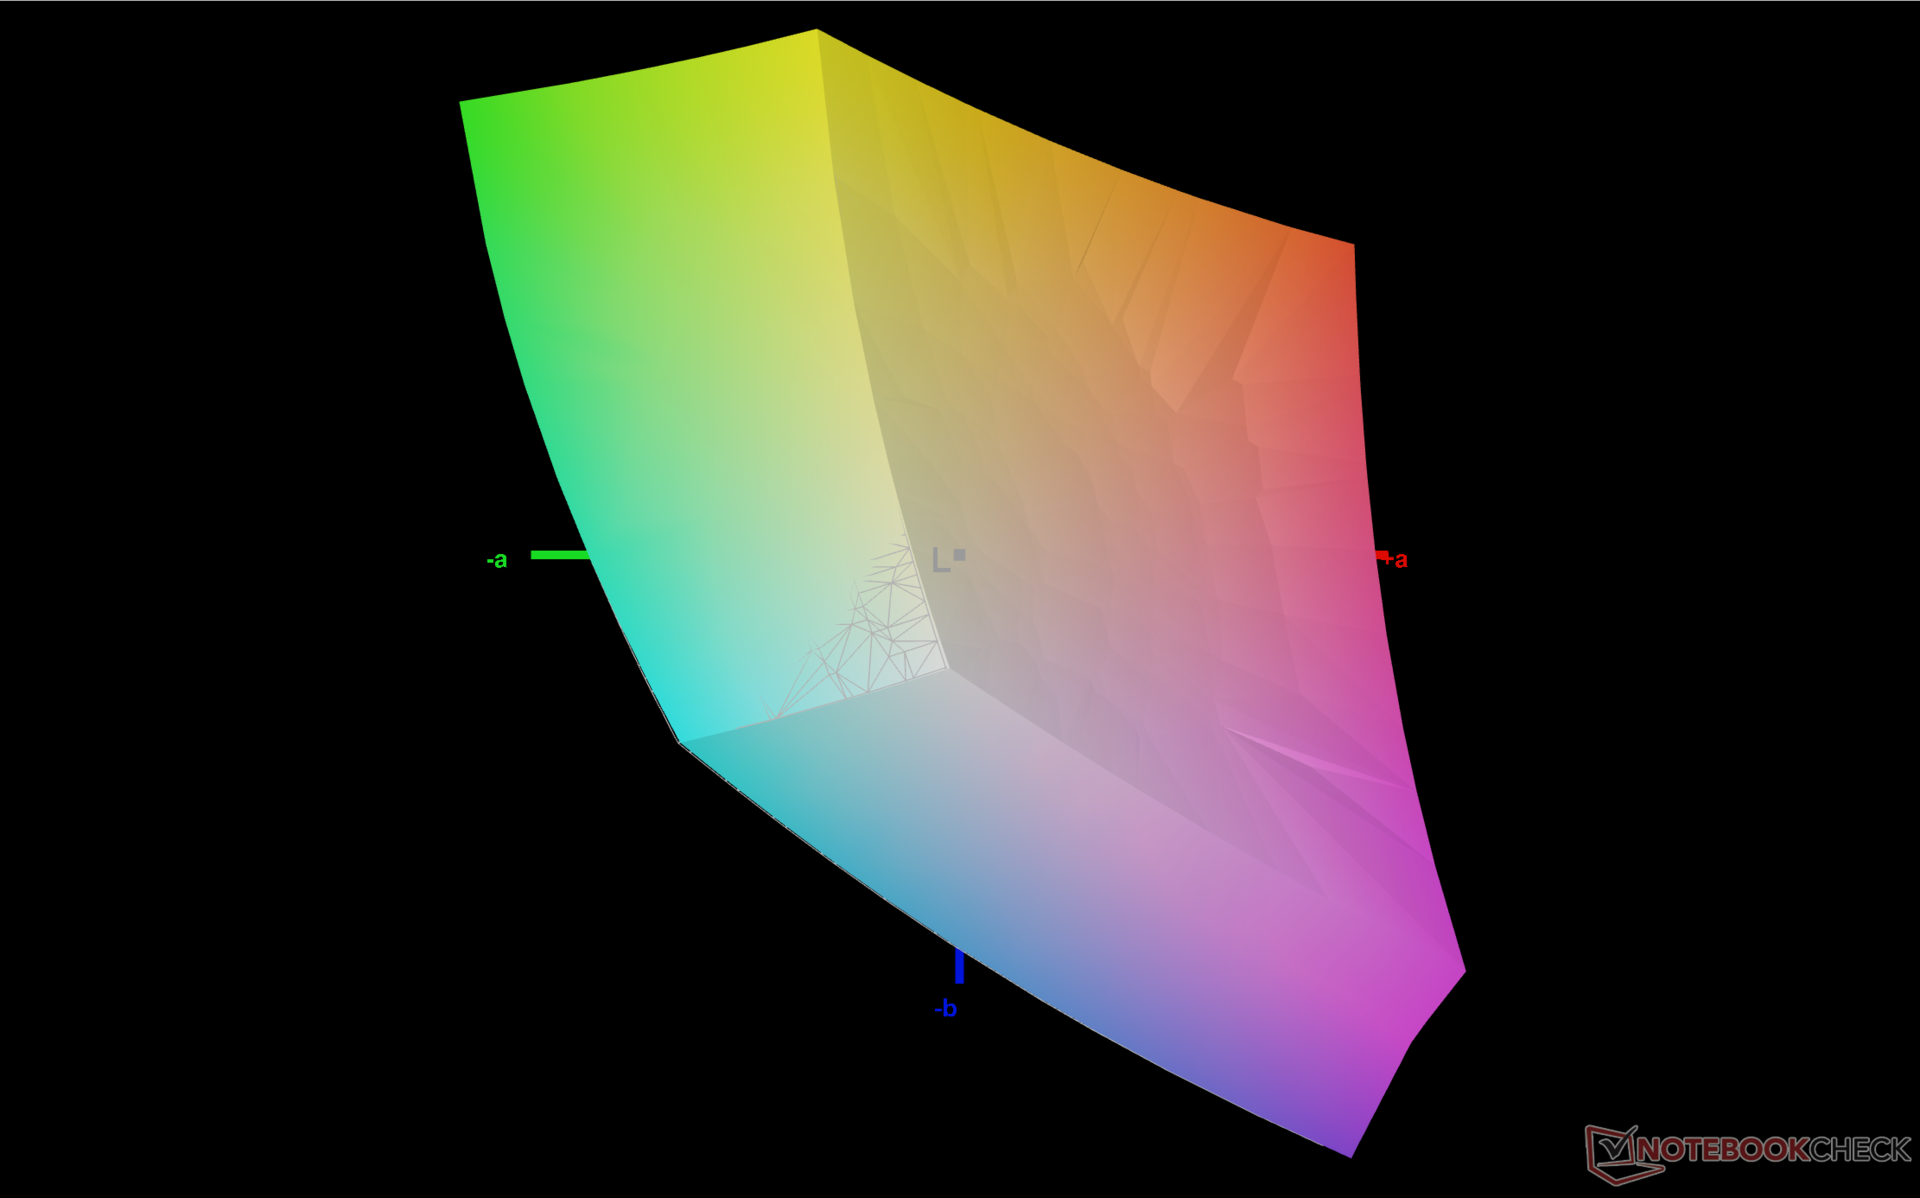
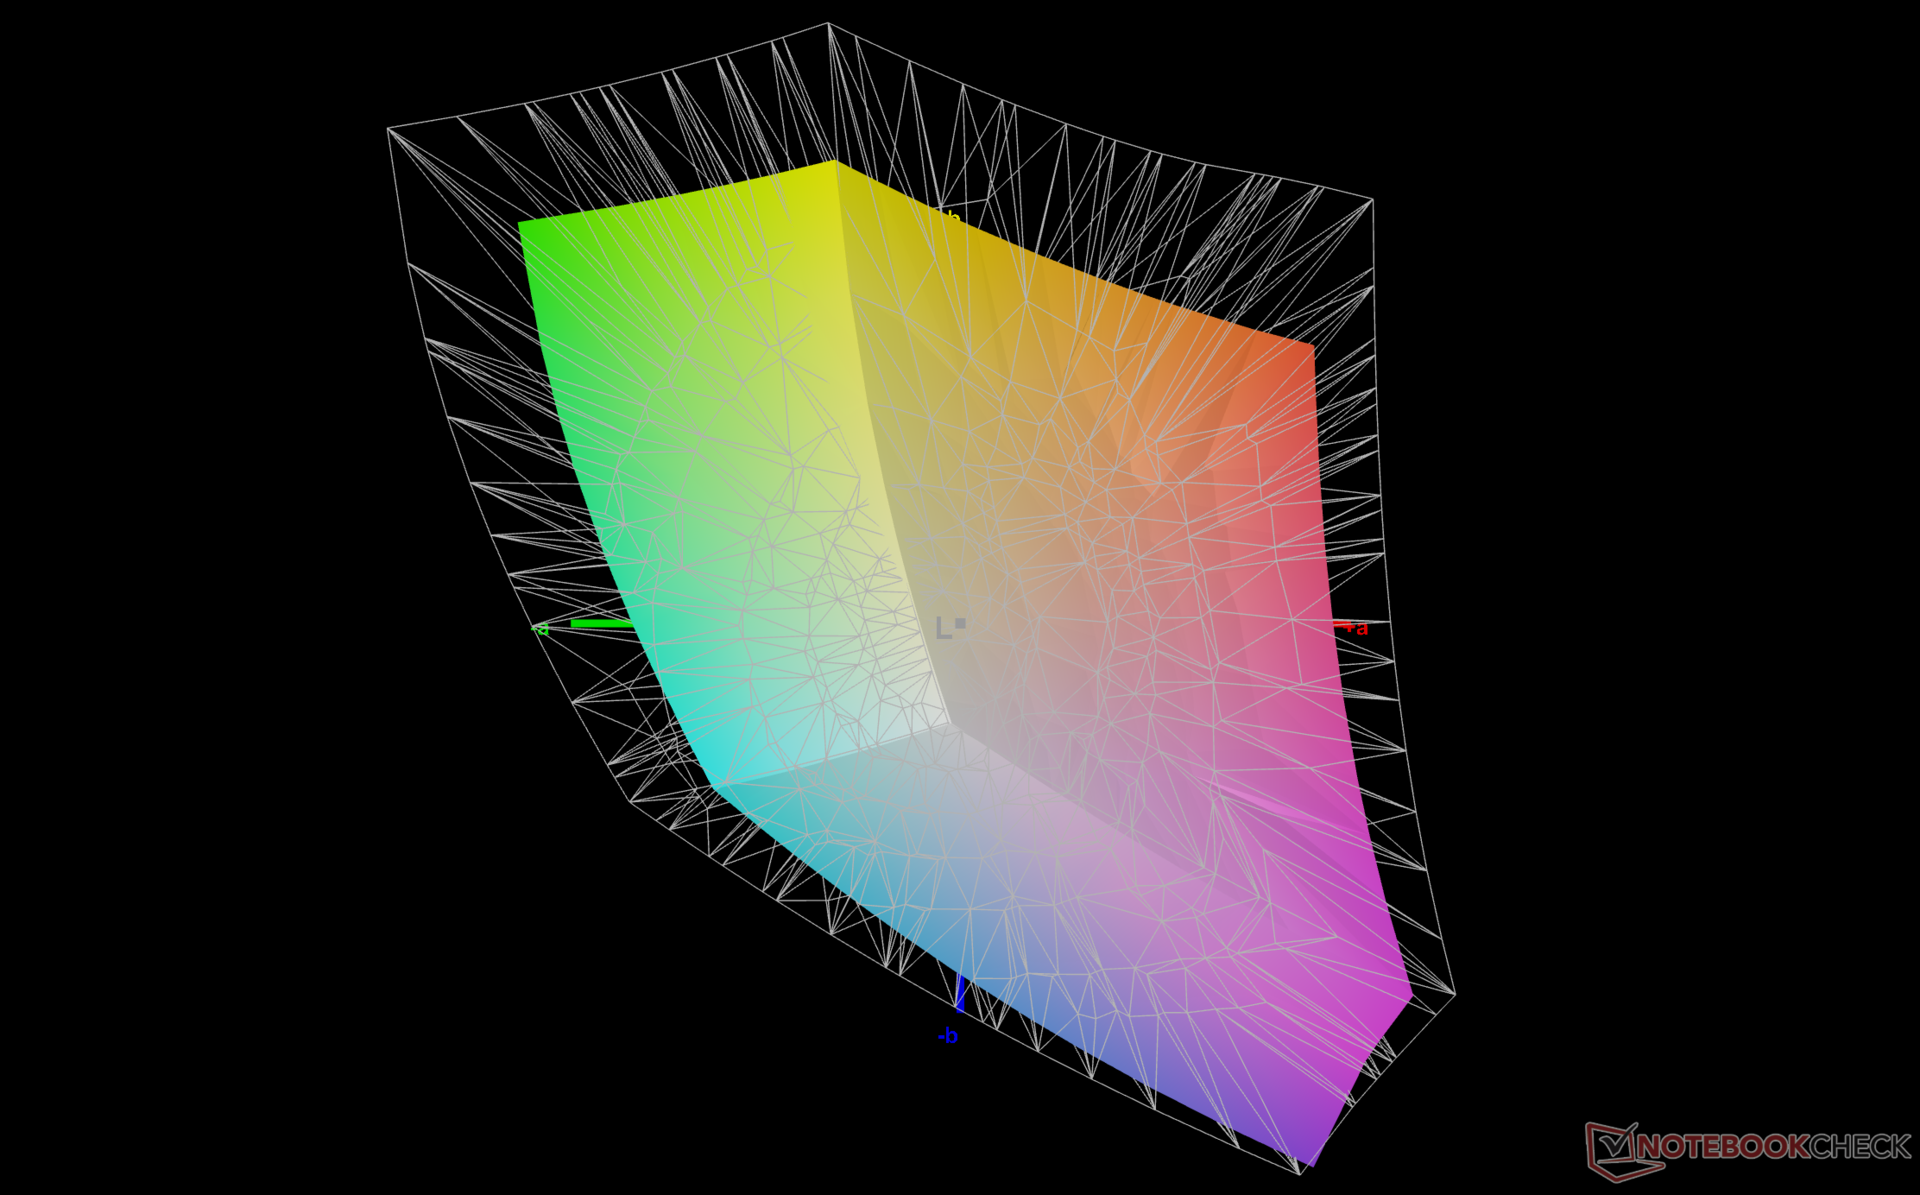
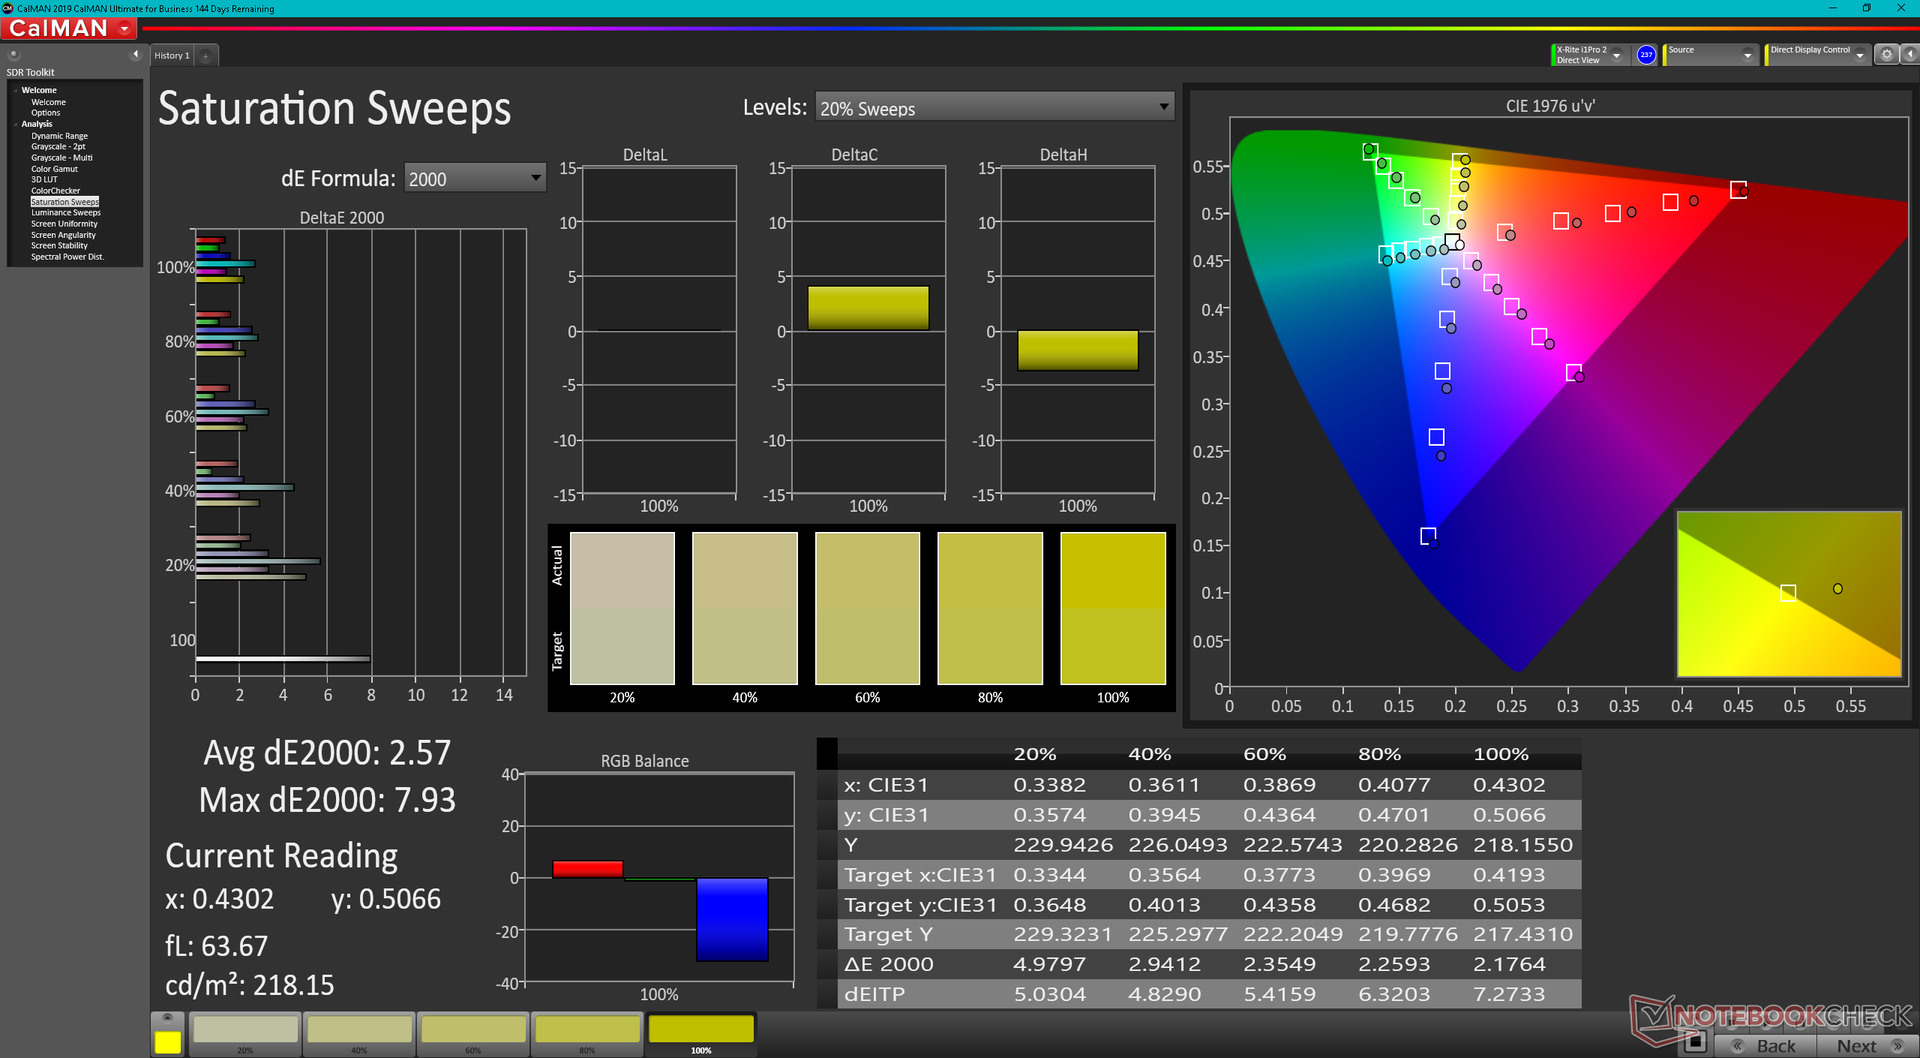
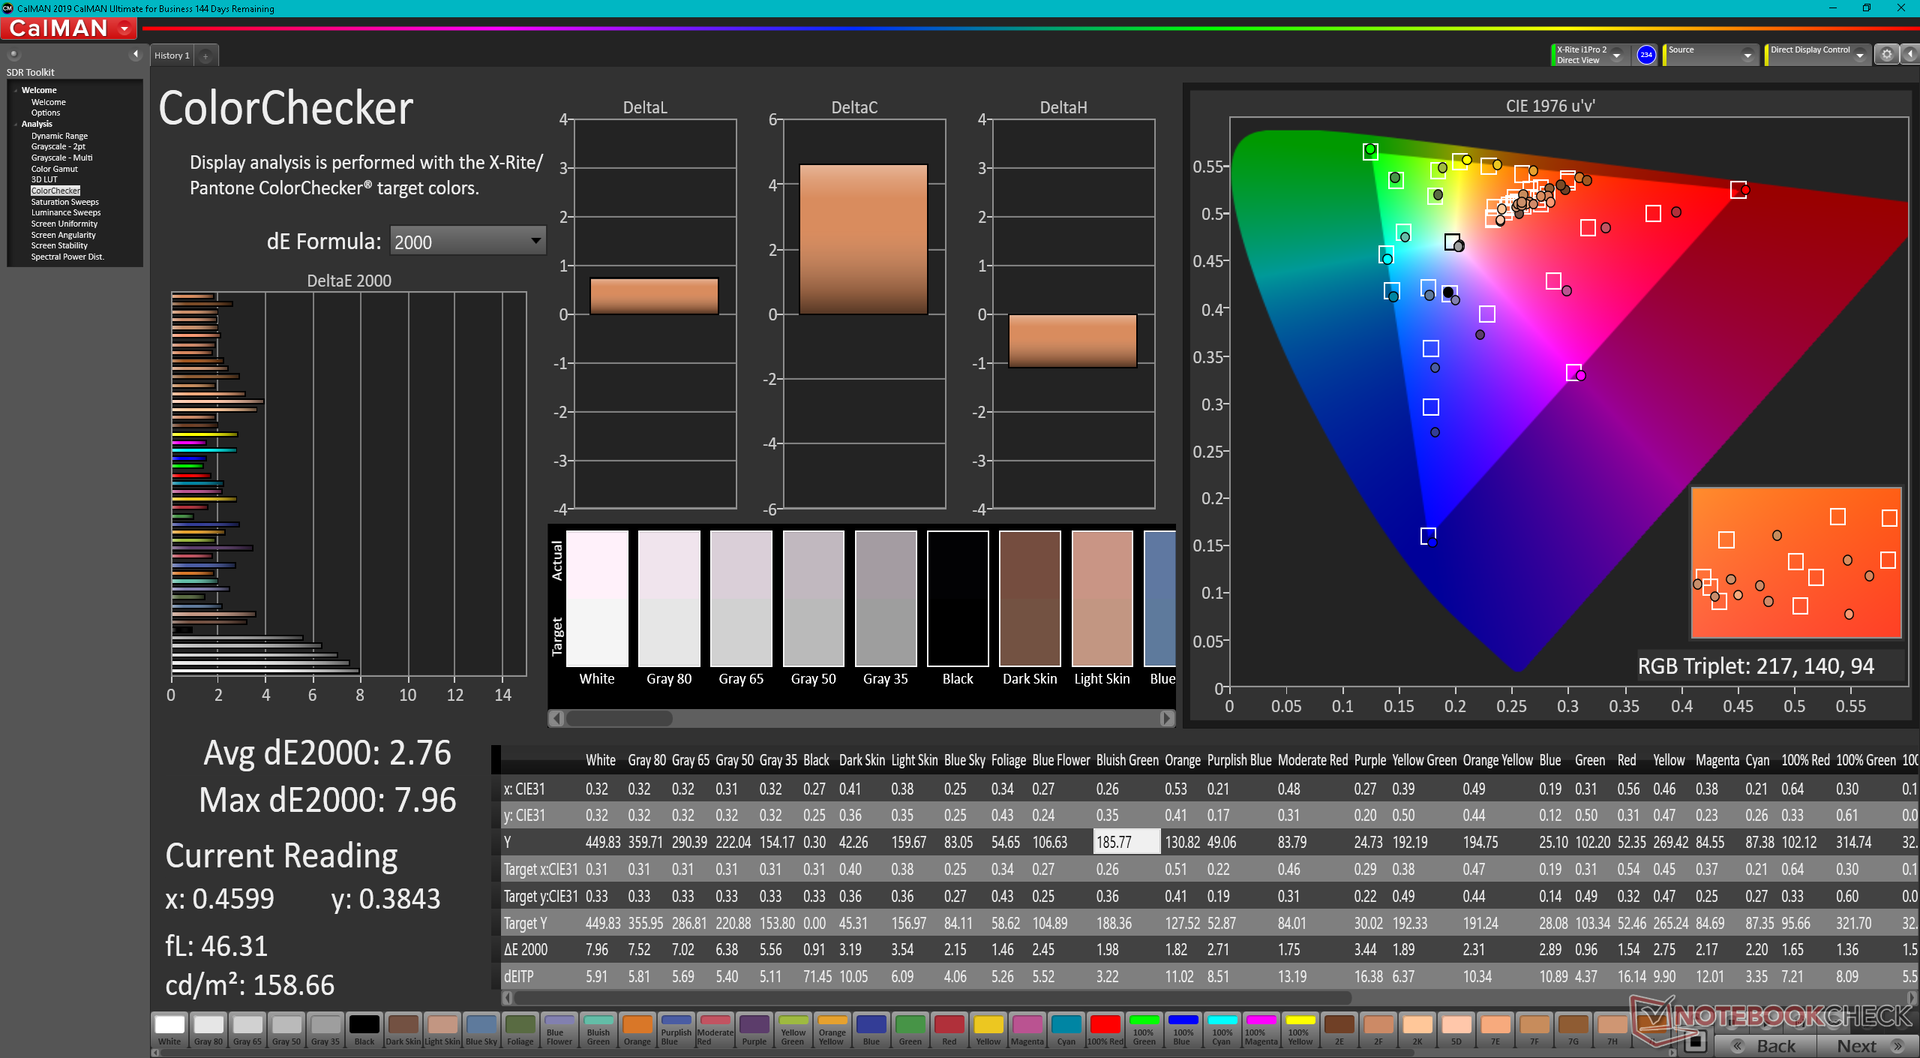
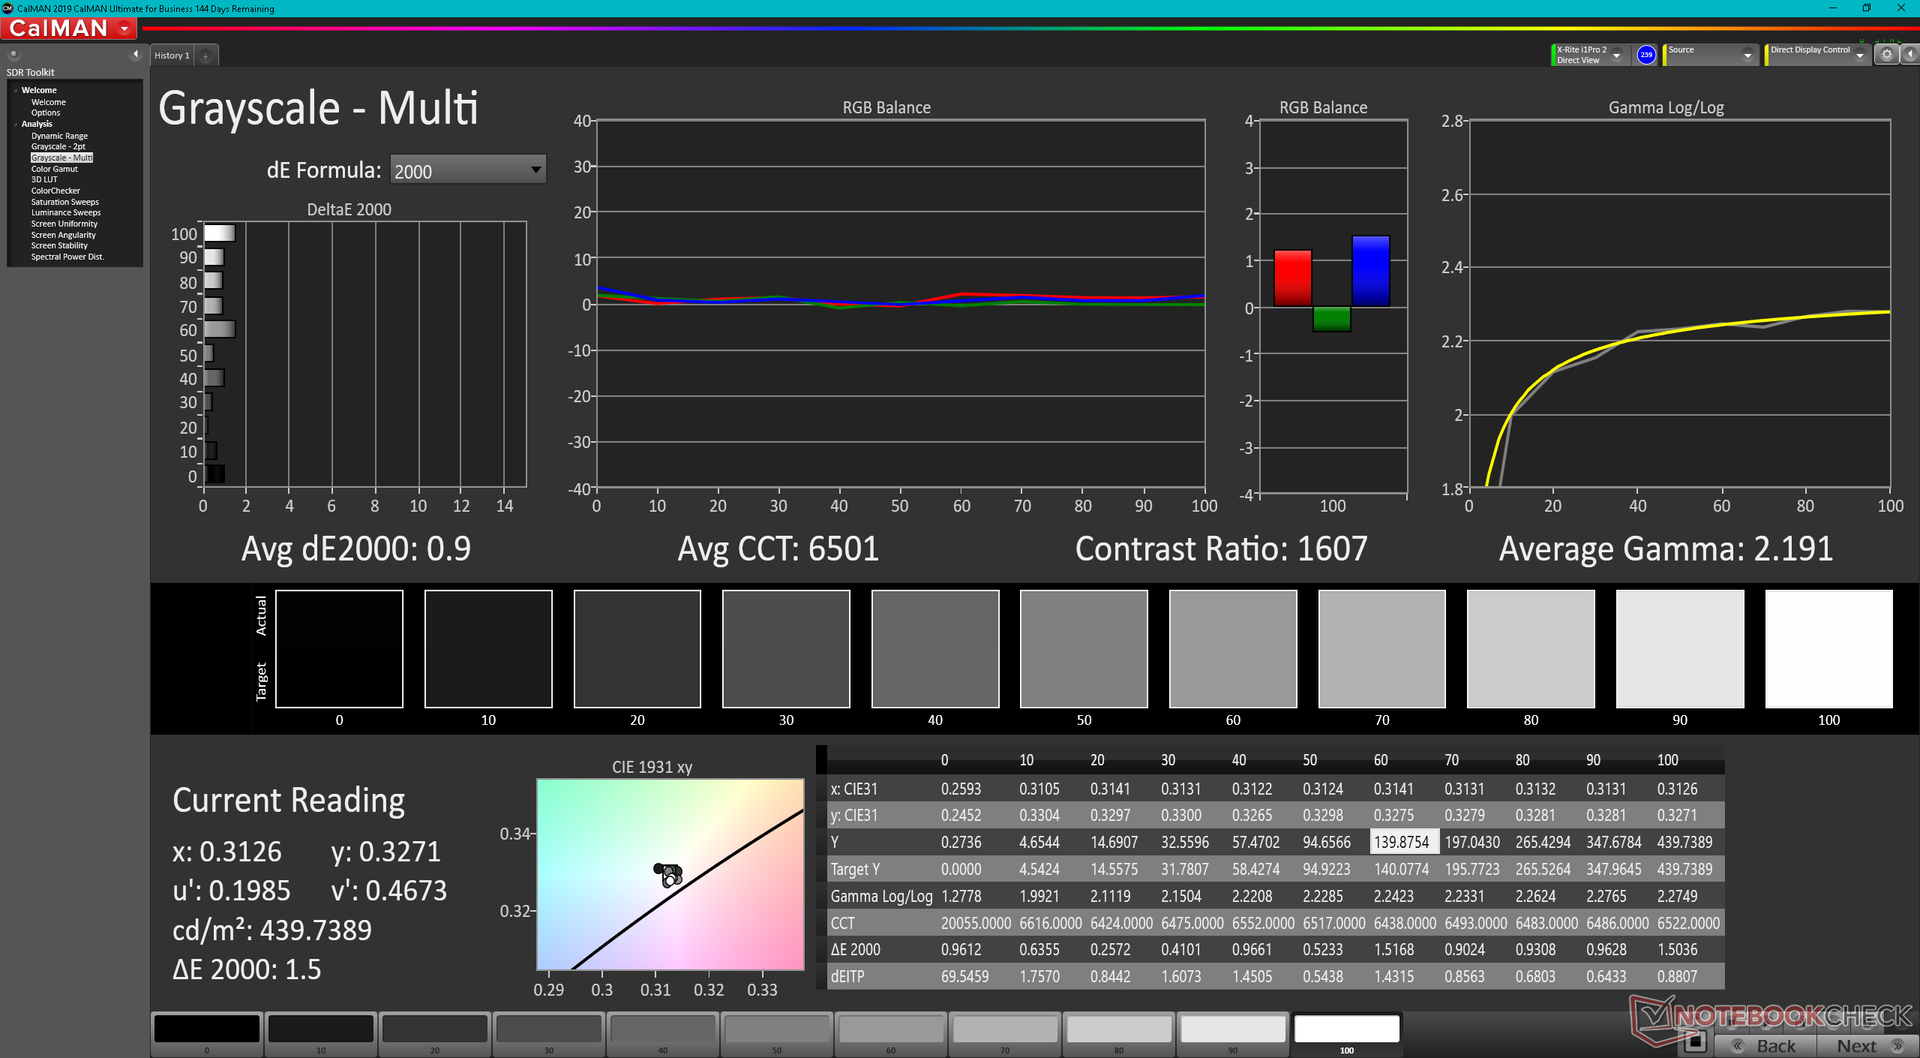
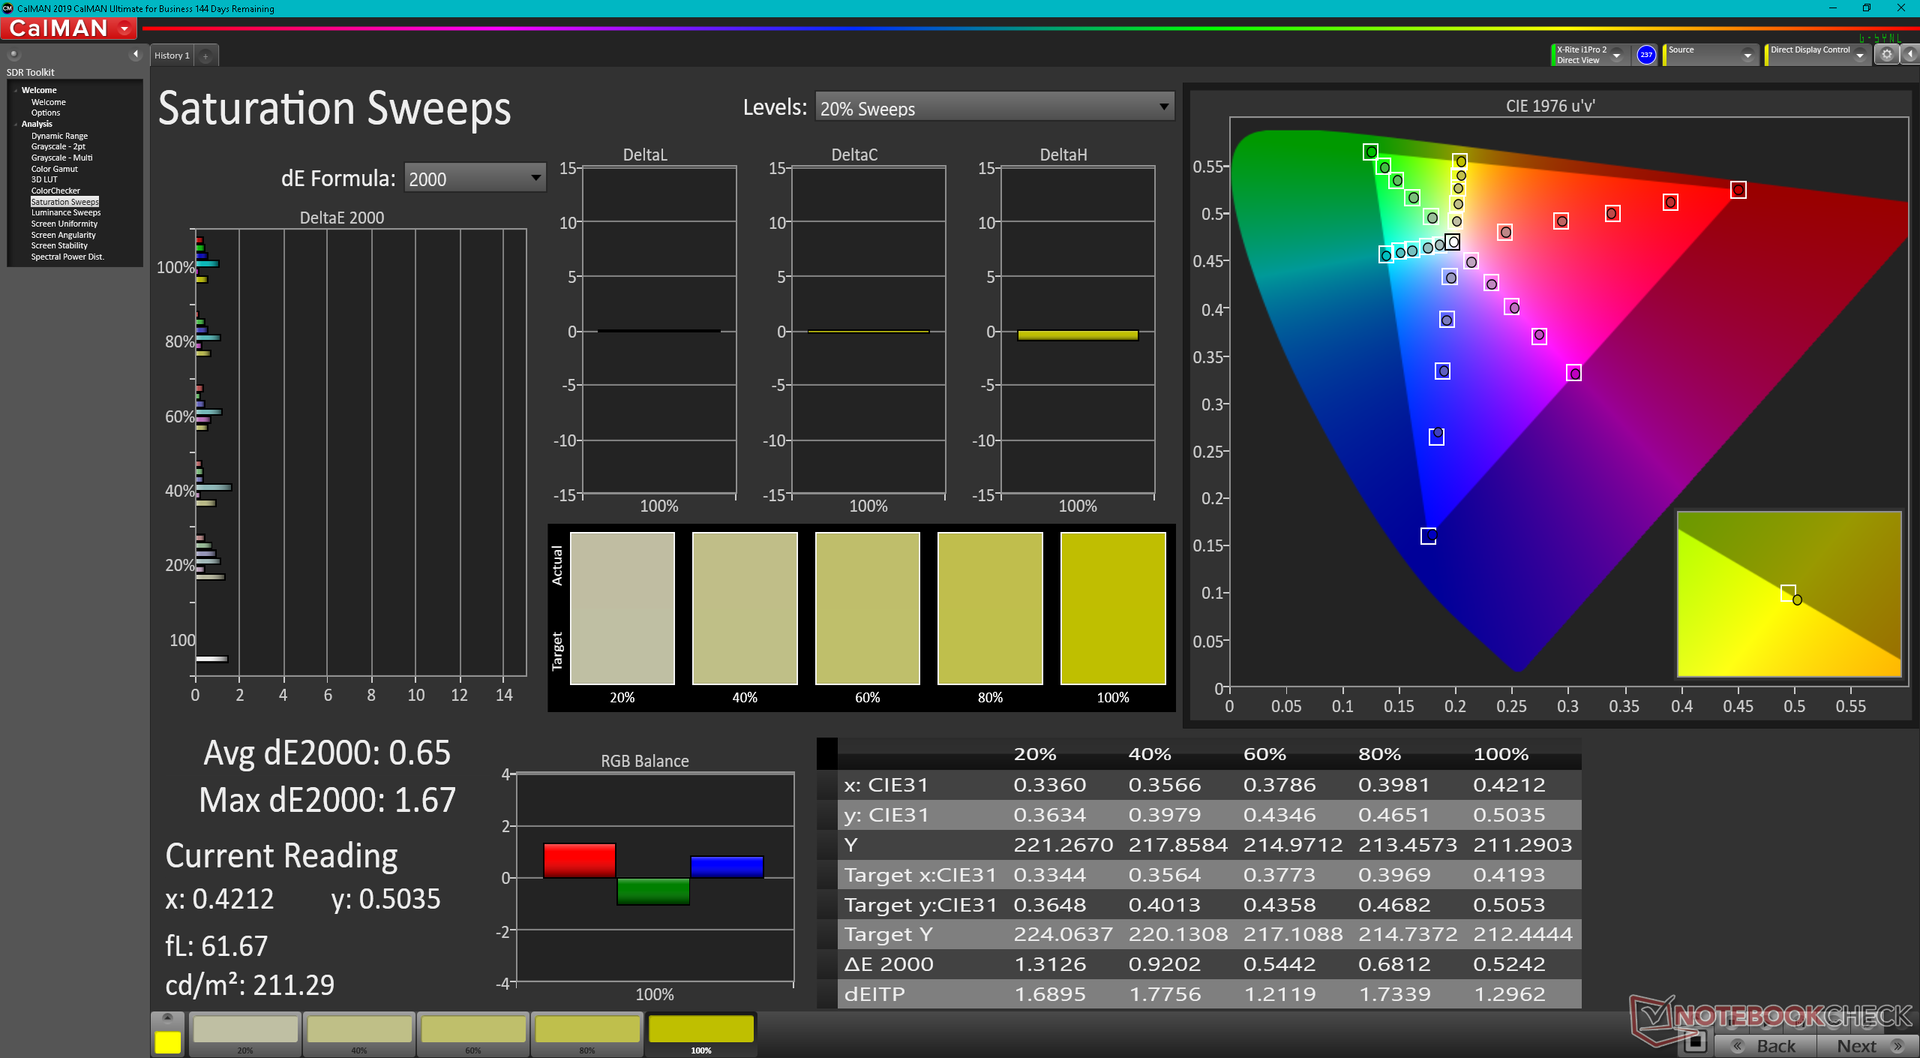
O fabricante não calibra seu laptop de estrutura na fábrica, o que é uma pena, uma vez que o painel oferece cobertura completa sRGB. Os valores médios de escala de cinza e cor DeltaE em nossa unidade de teste seriam de 5,2 e 2,76 out-of-the-box, respectivamente, em comparação com apenas 0,9 e 0,58 depois de calibrarmos nós mesmos o painel. A temperatura da cor em particular é muito quente sem uma calibração adequada. Recomendamos aplicar nosso perfil de ICM acima para obter o máximo do display.
Exibir tempos de resposta
| ↔ Tempo de resposta preto para branco | ||
|---|---|---|
| 27.5 ms ... ascensão ↗ e queda ↘ combinadas | ↗ 14.8 ms ascensão | 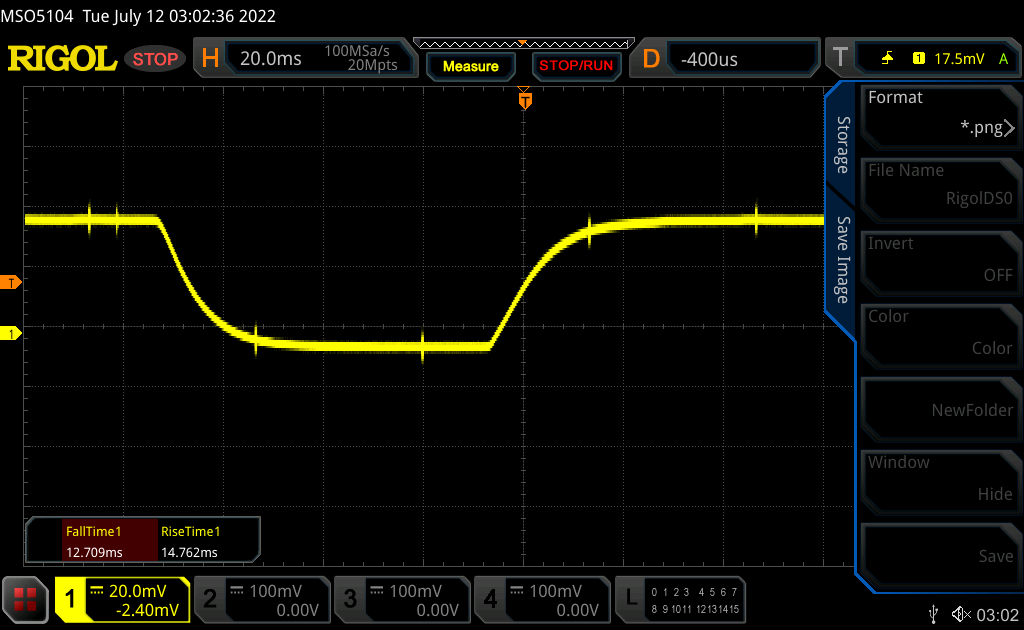 |
| ↘ 12.7 ms queda | ||
| A tela mostra taxas de resposta relativamente lentas em nossos testes e pode ser muito lenta para os jogadores. Em comparação, todos os dispositivos testados variam de 0.1 (mínimo) a 240 (máximo) ms. » 70 % de todos os dispositivos são melhores. Isso significa que o tempo de resposta medido é pior que a média de todos os dispositivos testados (19.8 ms). | ||
| ↔ Tempo de resposta 50% cinza a 80% cinza | ||
| 34.7 ms ... ascensão ↗ e queda ↘ combinadas | ↗ 17.7 ms ascensão | 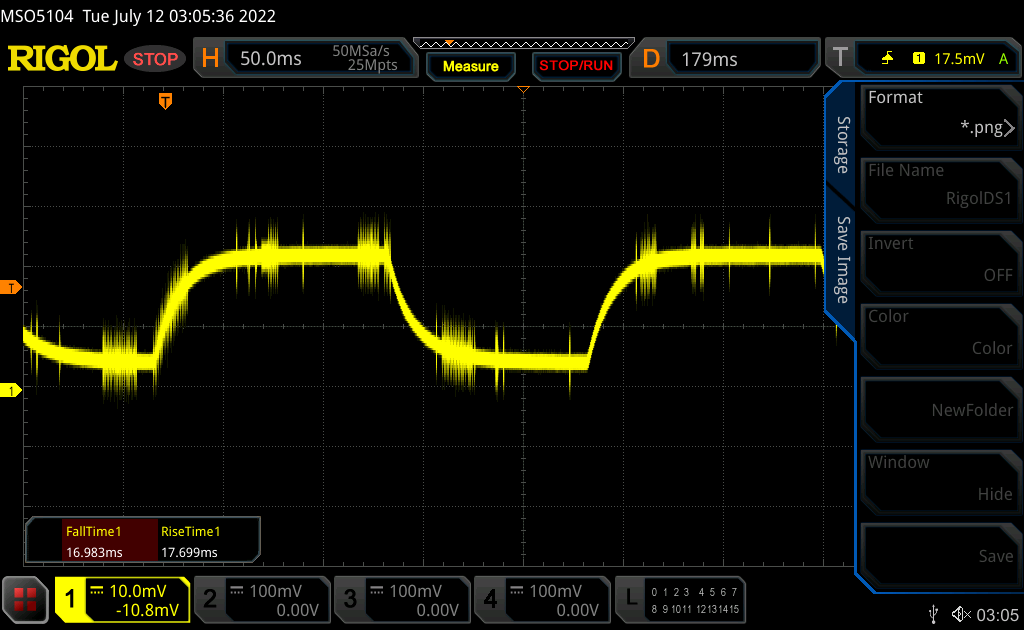 |
| ↘ 17 ms queda | ||
| A tela mostra taxas de resposta lentas em nossos testes e será insatisfatória para os jogadores. Em comparação, todos os dispositivos testados variam de 0.165 (mínimo) a 636 (máximo) ms. » 49 % de todos os dispositivos são melhores. Isso significa que o tempo de resposta medido é pior que a média de todos os dispositivos testados (31 ms). | ||
Cintilação da tela / PWM (modulação por largura de pulso)
| Tela tremeluzindo / PWM não detectado | 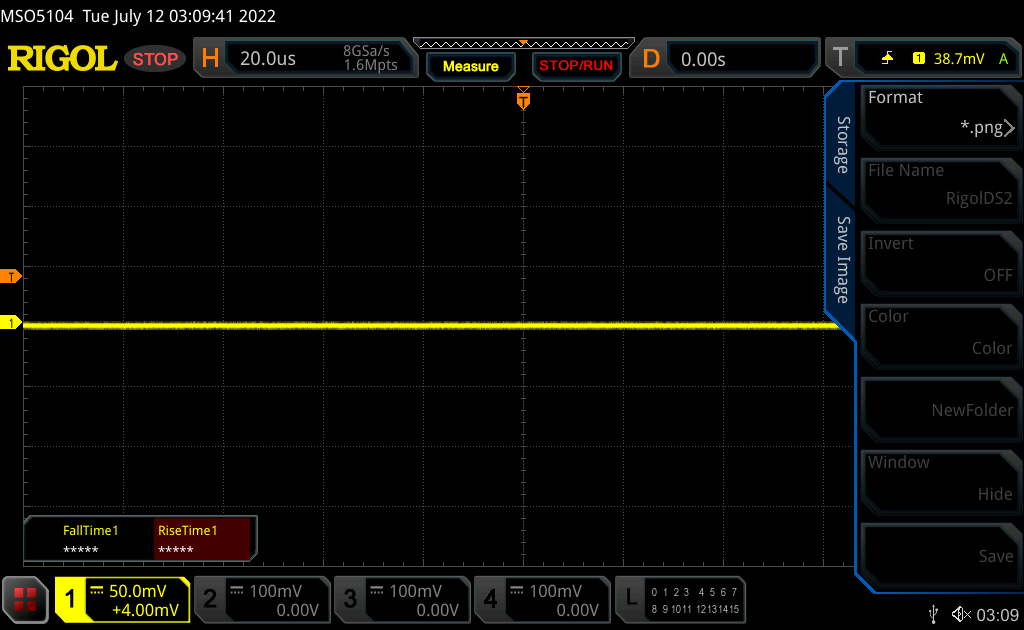 | ||
[pwm_comparison] Em comparação: 52 % de todos os dispositivos testados não usam PWM para escurecer a tela. Se PWM foi detectado, uma média de 7757 (mínimo: 5 - máximo: 343500) Hz foi medida. | |||
Desempenho
Condições de teste
Ajustamos nossa unidade para o modo Performance via Windows antes de executar quaisquer benchmarks de performance abaixo.
Processador
Quando comparado com o Núcleo i7-1165G7 no laptop de estrutura original, o Núcleo i7-1260P no modelo de estrutura de 2022 pode oferecer um desempenho de rosca única e rosca múltipla 20% e 90% mais rápido, respectivamente. De fato, o modelo Framework funciona 20 a 25% mais rápido do que a média dos portáteis em nosso banco de dados rodando na mesma CPU Core i7-1260P até o momento. Estamos felizes em ver o fabricante oferecendo CPUs da série P do 12º gênero em vez das CPUs da série U do 12º gênero como a Núcleo i5-1235U e i7-1255U oferecem benefícios de desempenho muito menores em relação à série U do 11º gênero
Desgraduação para a Núcleo i5-1240P de nosso Core i7-1260P deve acarretar um déficit de desempenho de 45 por cento em vários tópicos enquanto se atualiza para o Núcleo i7-1280P só aumentaria o desempenho em cerca de 10%. Como tal, o Core i7-1260P SKU é a opção mais recomendada.
Cinebench R15 Multi Loop
Cinebench R23: Multi Core | Single Core
Cinebench R15: CPU Multi 64Bit | CPU Single 64Bit
Blender: v2.79 BMW27 CPU
7-Zip 18.03: 7z b 4 | 7z b 4 -mmt1
Geekbench 5.5: Multi-Core | Single-Core
HWBOT x265 Benchmark v2.2: 4k Preset
LibreOffice : 20 Documents To PDF
R Benchmark 2.5: Overall mean
Cinebench R23: Multi Core | Single Core
Cinebench R15: CPU Multi 64Bit | CPU Single 64Bit
Blender: v2.79 BMW27 CPU
7-Zip 18.03: 7z b 4 | 7z b 4 -mmt1
Geekbench 5.5: Multi-Core | Single-Core
HWBOT x265 Benchmark v2.2: 4k Preset
LibreOffice : 20 Documents To PDF
R Benchmark 2.5: Overall mean
* ... menor é melhor
AIDA64: FP32 Ray-Trace | FPU Julia | CPU SHA3 | CPU Queen | FPU SinJulia | FPU Mandel | CPU AES | CPU ZLib | FP64 Ray-Trace | CPU PhotoWorxx
| Performance rating | |
| Microsoft Surface Laptop 4 13 Ryzen 5 | |
| Framework Laptop 13.5 12th Gen Intel | |
| Média Intel Core i7-1260P | |
| Framework Laptop 13.5 | |
| HP Spectre x360 14-ea0378ng | |
| Lenovo ThinkPad X1 Titanium Yoga G1 20QB0016GE | |
| AIDA64 / FP32 Ray-Trace | |
| Microsoft Surface Laptop 4 13 Ryzen 5 | |
| Framework Laptop 13.5 | |
| Média Intel Core i7-1260P (2176 - 10898, n=26) | |
| Framework Laptop 13.5 12th Gen Intel | |
| HP Spectre x360 14-ea0378ng | |
| Lenovo ThinkPad X1 Titanium Yoga G1 20QB0016GE | |
| AIDA64 / FPU Julia | |
| Microsoft Surface Laptop 4 13 Ryzen 5 | |
| Média Intel Core i7-1260P (11015 - 56906, n=26) | |
| Framework Laptop 13.5 | |
| Framework Laptop 13.5 12th Gen Intel | |
| Lenovo ThinkPad X1 Titanium Yoga G1 20QB0016GE | |
| HP Spectre x360 14-ea0378ng | |
| AIDA64 / CPU SHA3 | |
| Framework Laptop 13.5 | |
| Framework Laptop 13.5 12th Gen Intel | |
| Média Intel Core i7-1260P (669 - 2709, n=26) | |
| Microsoft Surface Laptop 4 13 Ryzen 5 | |
| Lenovo ThinkPad X1 Titanium Yoga G1 20QB0016GE | |
| HP Spectre x360 14-ea0378ng | |
| AIDA64 / CPU Queen | |
| Framework Laptop 13.5 12th Gen Intel | |
| Média Intel Core i7-1260P (42571 - 82493, n=26) | |
| Microsoft Surface Laptop 4 13 Ryzen 5 | |
| HP Spectre x360 14-ea0378ng | |
| Framework Laptop 13.5 | |
| Lenovo ThinkPad X1 Titanium Yoga G1 20QB0016GE | |
| AIDA64 / FPU SinJulia | |
| Microsoft Surface Laptop 4 13 Ryzen 5 | |
| Framework Laptop 13.5 12th Gen Intel | |
| Média Intel Core i7-1260P (2901 - 6975, n=26) | |
| Framework Laptop 13.5 | |
| HP Spectre x360 14-ea0378ng | |
| Lenovo ThinkPad X1 Titanium Yoga G1 20QB0016GE | |
| AIDA64 / FPU Mandel | |
| Microsoft Surface Laptop 4 13 Ryzen 5 | |
| Framework Laptop 13.5 | |
| Média Intel Core i7-1260P (5950 - 26376, n=26) | |
| Framework Laptop 13.5 12th Gen Intel | |
| HP Spectre x360 14-ea0378ng | |
| Lenovo ThinkPad X1 Titanium Yoga G1 20QB0016GE | |
| AIDA64 / CPU AES | |
| Framework Laptop 13.5 | |
| Framework Laptop 13.5 12th Gen Intel | |
| Lenovo ThinkPad X1 Titanium Yoga G1 20QB0016GE | |
| HP Spectre x360 14-ea0378ng | |
| Média Intel Core i7-1260P (16041 - 92356, n=26) | |
| Microsoft Surface Laptop 4 13 Ryzen 5 | |
| AIDA64 / CPU ZLib | |
| Framework Laptop 13.5 12th Gen Intel | |
| Média Intel Core i7-1260P (259 - 771, n=26) | |
| Microsoft Surface Laptop 4 13 Ryzen 5 | |
| Framework Laptop 13.5 | |
| HP Spectre x360 14-ea0378ng | |
| Lenovo ThinkPad X1 Titanium Yoga G1 20QB0016GE | |
| AIDA64 / FP64 Ray-Trace | |
| Microsoft Surface Laptop 4 13 Ryzen 5 | |
| Framework Laptop 13.5 | |
| Média Intel Core i7-1260P (1237 - 5858, n=26) | |
| Framework Laptop 13.5 12th Gen Intel | |
| HP Spectre x360 14-ea0378ng | |
| Lenovo ThinkPad X1 Titanium Yoga G1 20QB0016GE | |
| AIDA64 / CPU PhotoWorxx | |
| HP Spectre x360 14-ea0378ng | |
| Lenovo ThinkPad X1 Titanium Yoga G1 20QB0016GE | |
| Média Intel Core i7-1260P (13261 - 43652, n=26) | |
| Framework Laptop 13.5 12th Gen Intel | |
| Microsoft Surface Laptop 4 13 Ryzen 5 | |
| Framework Laptop 13.5 | |
Desempenho do sistema
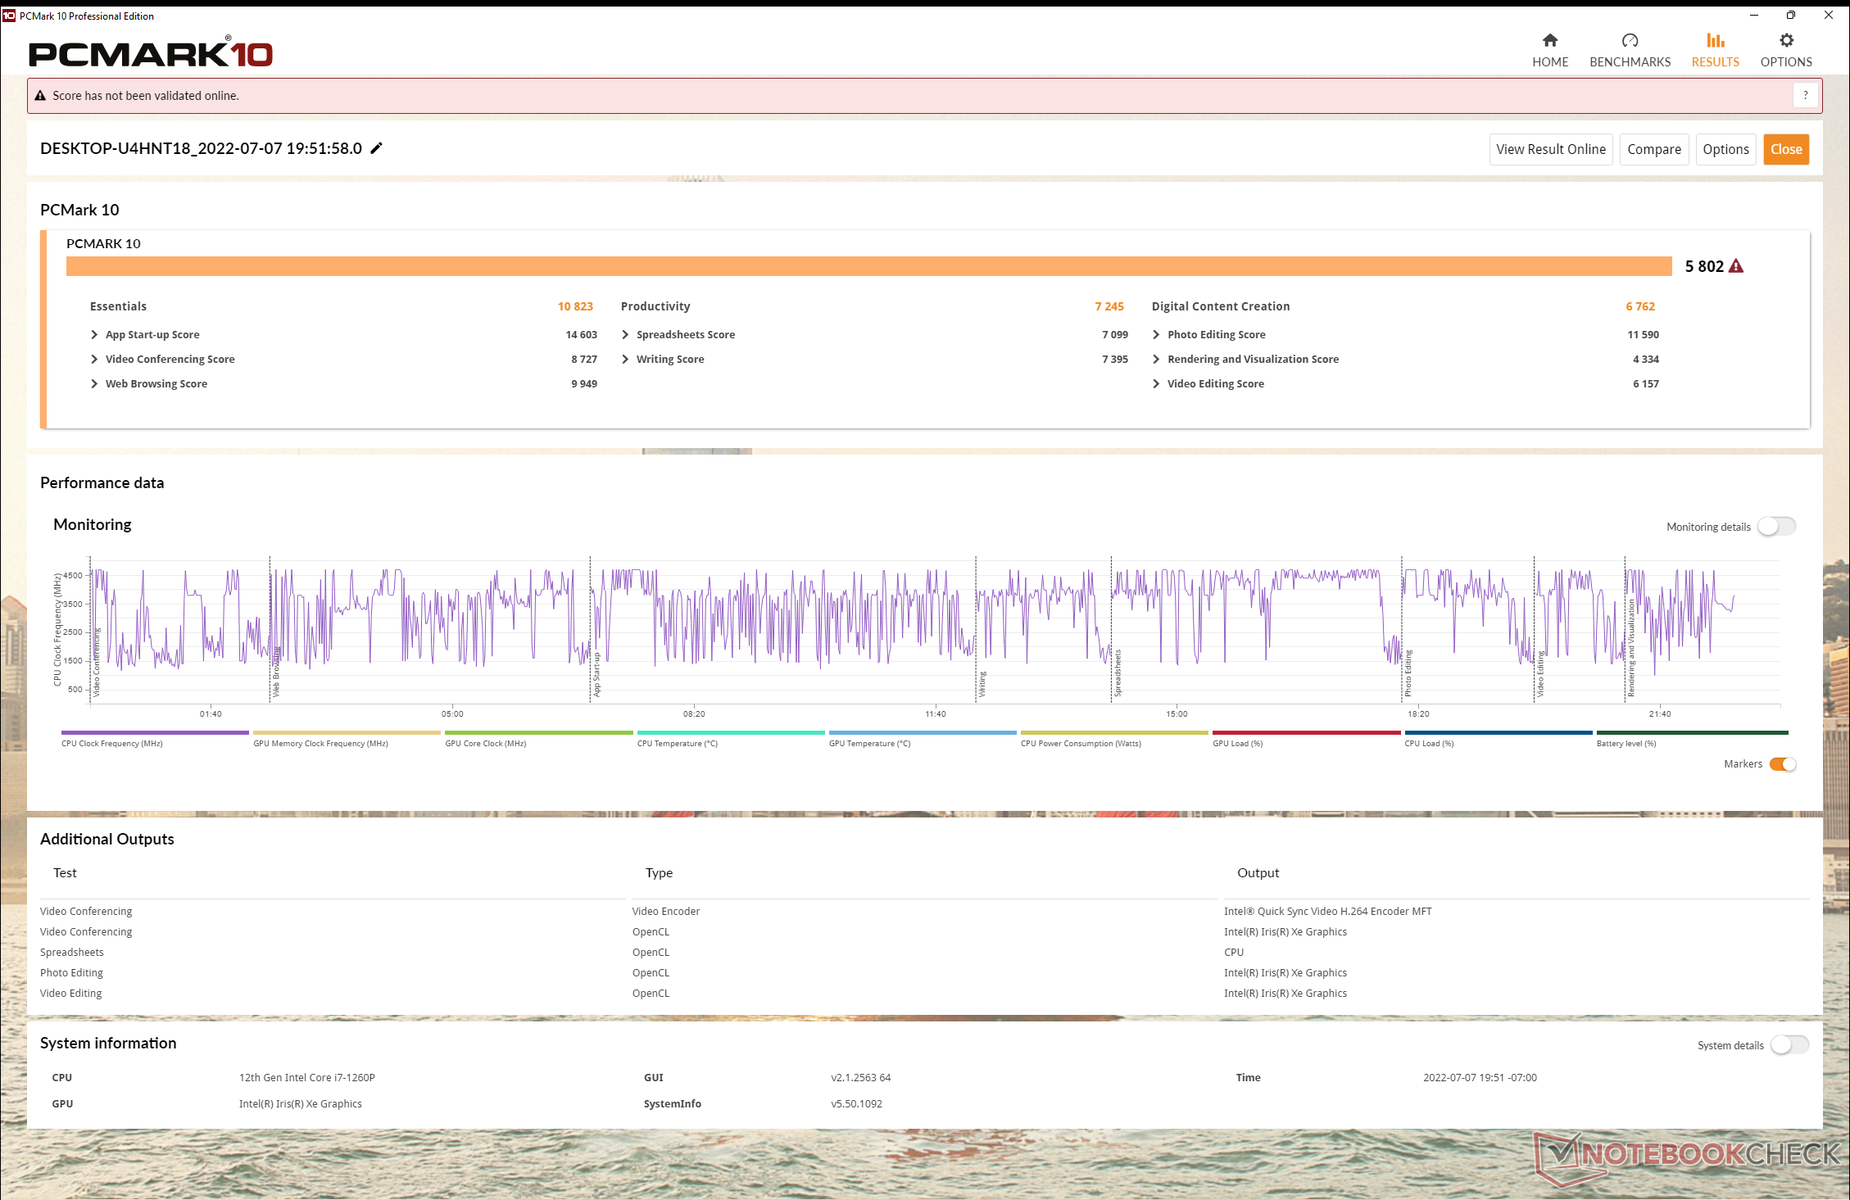
Os resultados do PCMark 10 são consistentemente mais altos do que os do ano passado no Framework Laptop e na maioria dos outros Ultrabooks rodando em CPUs do 11º gênero ou mais antigas para esse fim.
CrossMark: Overall | Productivity | Creativity | Responsiveness
| PCMark 10 / Score | |
| Framework Laptop 13.5 12th Gen Intel | |
| Média Intel Core i7-1260P, Intel Iris Xe Graphics G7 96EUs (4796 - 6068, n=17) | |
| Framework Laptop 13.5 | |
| Microsoft Surface Laptop 4 13 Ryzen 5 | |
| HP Spectre x360 14-ea0378ng | |
| Lenovo ThinkPad X1 Titanium Yoga G1 20QB0016GE | |
| PCMark 10 / Essentials | |
| Framework Laptop 13.5 12th Gen Intel | |
| Média Intel Core i7-1260P, Intel Iris Xe Graphics G7 96EUs (9260 - 11251, n=17) | |
| Framework Laptop 13.5 | |
| Lenovo ThinkPad X1 Titanium Yoga G1 20QB0016GE | |
| HP Spectre x360 14-ea0378ng | |
| Microsoft Surface Laptop 4 13 Ryzen 5 | |
| PCMark 10 / Productivity | |
| Framework Laptop 13.5 12th Gen Intel | |
| Média Intel Core i7-1260P, Intel Iris Xe Graphics G7 96EUs (6167 - 8629, n=17) | |
| Microsoft Surface Laptop 4 13 Ryzen 5 | |
| HP Spectre x360 14-ea0378ng | |
| Lenovo ThinkPad X1 Titanium Yoga G1 20QB0016GE | |
| Framework Laptop 13.5 | |
| PCMark 10 / Digital Content Creation | |
| Framework Laptop 13.5 12th Gen Intel | |
| Média Intel Core i7-1260P, Intel Iris Xe Graphics G7 96EUs (5231 - 6908, n=17) | |
| Framework Laptop 13.5 | |
| Microsoft Surface Laptop 4 13 Ryzen 5 | |
| HP Spectre x360 14-ea0378ng | |
| Lenovo ThinkPad X1 Titanium Yoga G1 20QB0016GE | |
| CrossMark / Overall | |
| Framework Laptop 13.5 12th Gen Intel | |
| Média Intel Core i7-1260P, Intel Iris Xe Graphics G7 96EUs (1484 - 1811, n=16) | |
| CrossMark / Productivity | |
| Framework Laptop 13.5 12th Gen Intel | |
| Média Intel Core i7-1260P, Intel Iris Xe Graphics G7 96EUs (1486 - 1755, n=16) | |
| CrossMark / Creativity | |
| Framework Laptop 13.5 12th Gen Intel | |
| Média Intel Core i7-1260P, Intel Iris Xe Graphics G7 96EUs (1451 - 1872, n=16) | |
| CrossMark / Responsiveness | |
| Framework Laptop 13.5 12th Gen Intel | |
| Média Intel Core i7-1260P, Intel Iris Xe Graphics G7 96EUs (1253 - 1807, n=16) | |
| PCMark 10 Score | 5802 pontos | |
Ajuda | ||
| AIDA64 / Memory Copy | |
| HP Spectre x360 14-ea0378ng | |
| Lenovo ThinkPad X1 Titanium Yoga G1 20QB0016GE | |
| Média Intel Core i7-1260P (25125 - 71544, n=25) | |
| Framework Laptop 13.5 12th Gen Intel | |
| Microsoft Surface Laptop 4 13 Ryzen 5 | |
| Framework Laptop 13.5 | |
| AIDA64 / Memory Read | |
| Lenovo ThinkPad X1 Titanium Yoga G1 20QB0016GE | |
| Média Intel Core i7-1260P (24983 - 72065, n=25) | |
| HP Spectre x360 14-ea0378ng | |
| Framework Laptop 13.5 12th Gen Intel | |
| Microsoft Surface Laptop 4 13 Ryzen 5 | |
| Framework Laptop 13.5 | |
| AIDA64 / Memory Write | |
| Lenovo ThinkPad X1 Titanium Yoga G1 20QB0016GE | |
| HP Spectre x360 14-ea0378ng | |
| Média Intel Core i7-1260P (23512 - 66799, n=25) | |
| Framework Laptop 13.5 12th Gen Intel | |
| Microsoft Surface Laptop 4 13 Ryzen 5 | |
| Framework Laptop 13.5 | |
| AIDA64 / Memory Latency | |
| Microsoft Surface Laptop 4 13 Ryzen 5 | |
| Lenovo ThinkPad X1 Titanium Yoga G1 20QB0016GE | |
| HP Spectre x360 14-ea0378ng | |
| Framework Laptop 13.5 12th Gen Intel | |
| Média Intel Core i7-1260P (77.9 - 118.4, n=21) | |
| Framework Laptop 13.5 | |
* ... menor é melhor
Latência do DPC
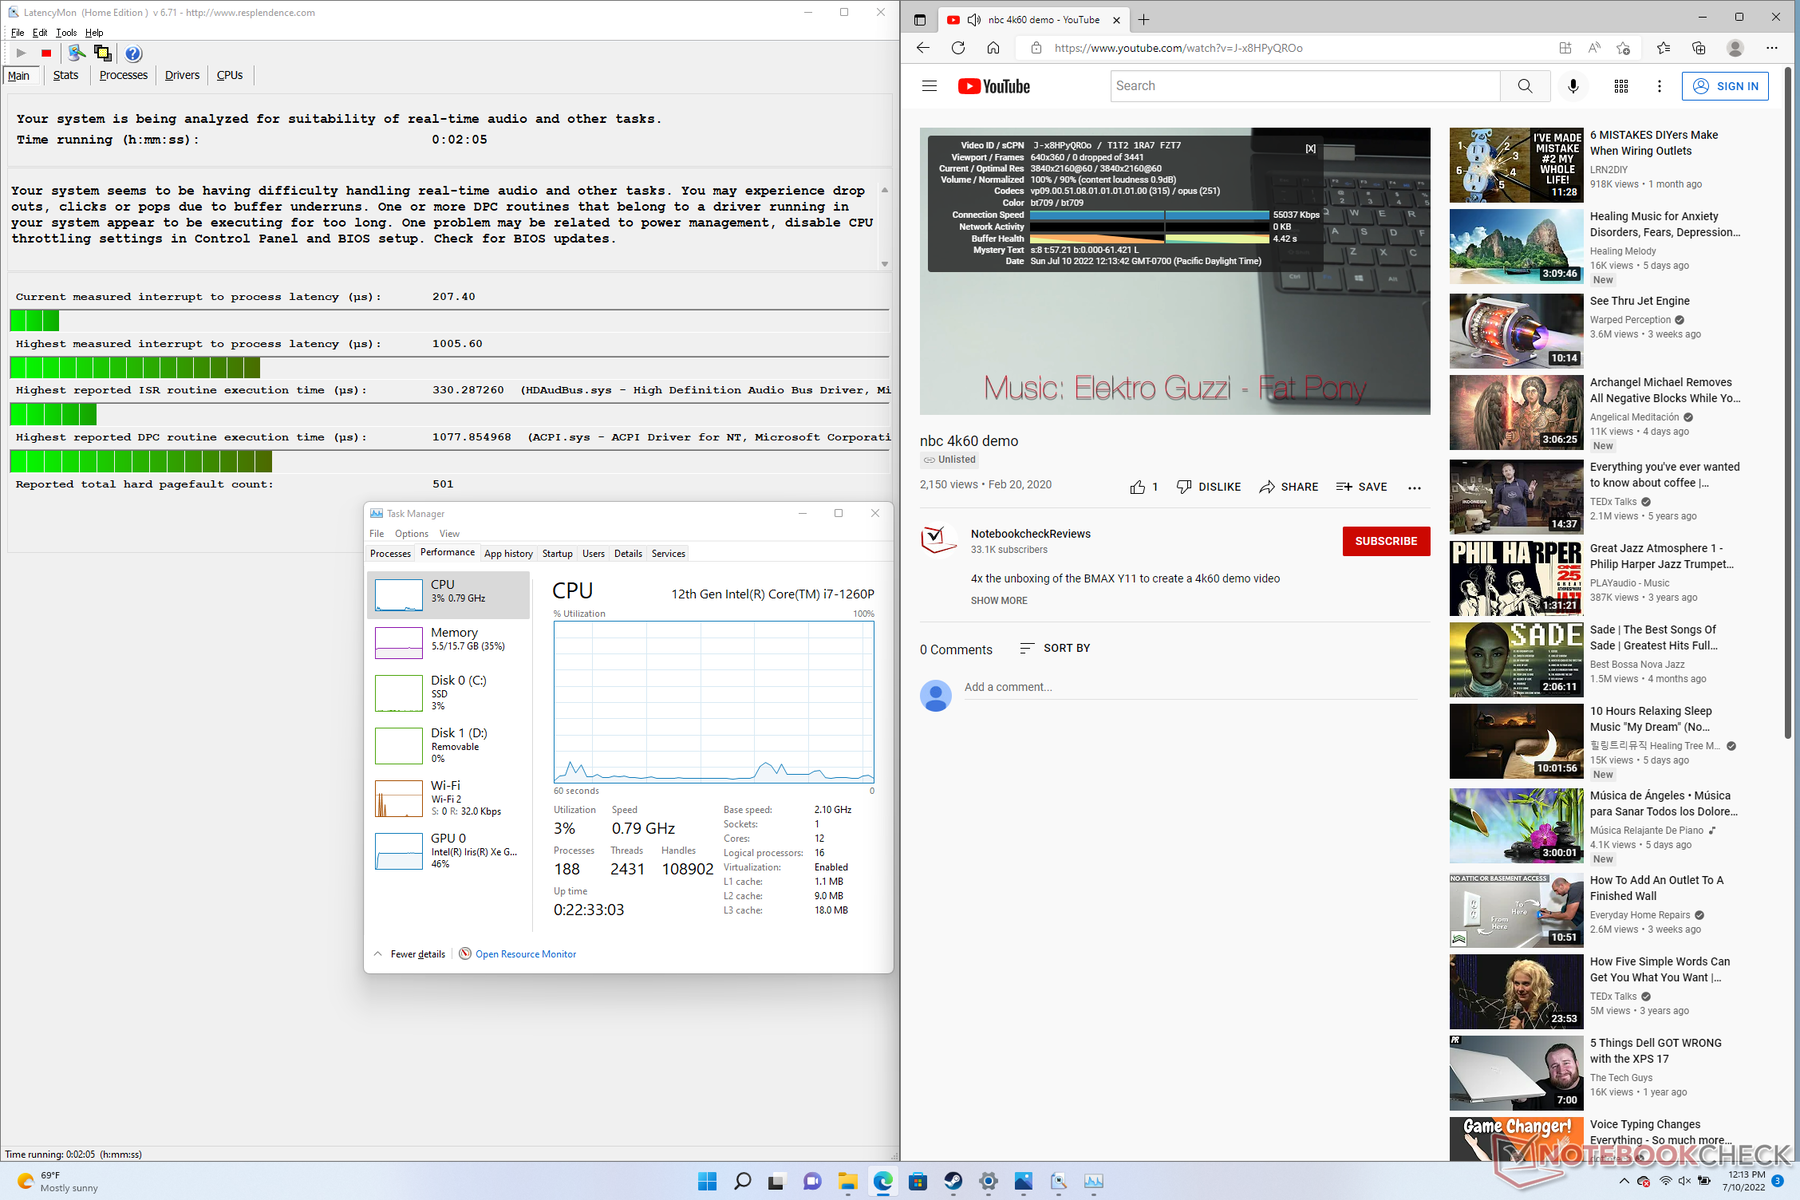
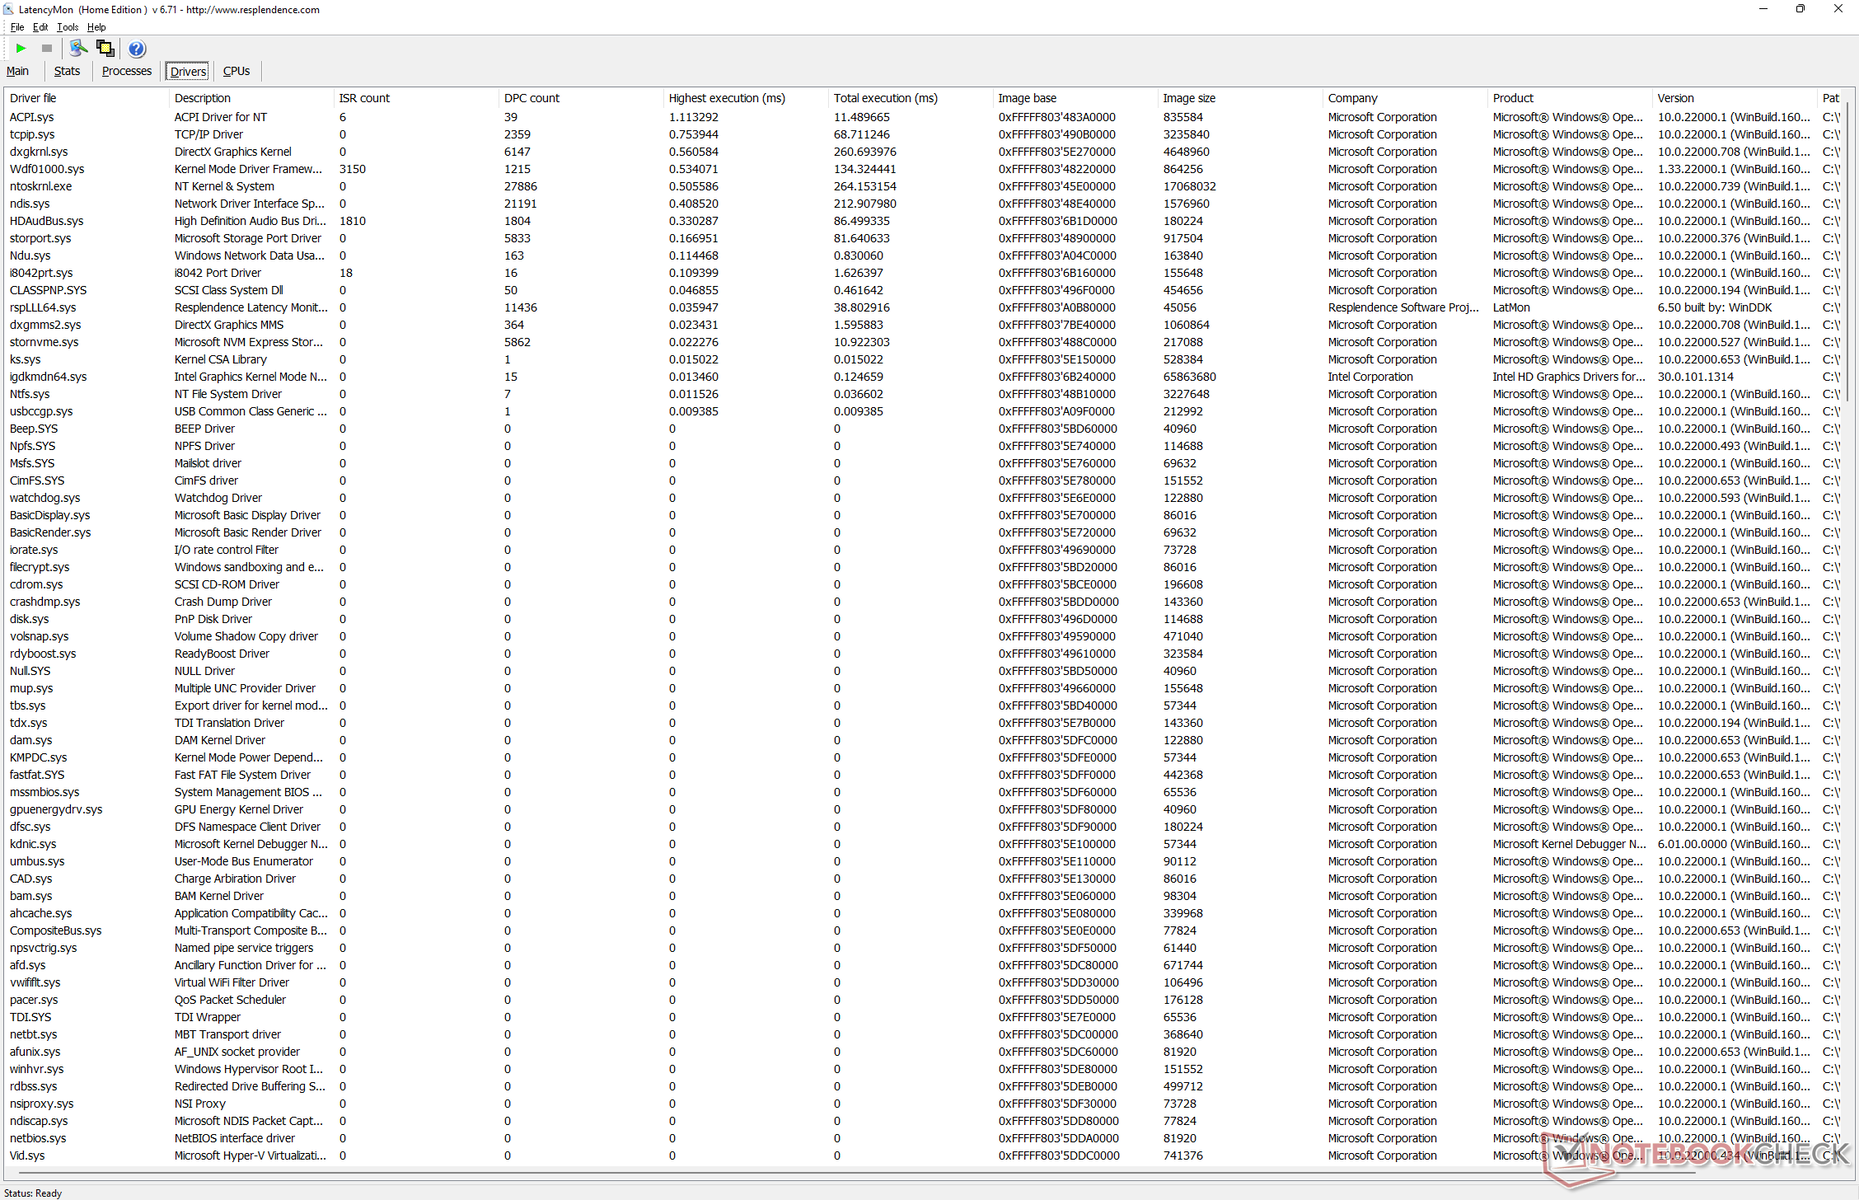
LatencyMon revela pequenos problemas de DPC ao abrir várias abas do navegador em nossa página inicial. a reprodução de vídeo de 4K a 60 FPS é perfeita e sem queda de quadros.
| DPC Latencies / LatencyMon - interrupt to process latency (max), Web, Youtube, Prime95 | |
| Framework Laptop 13.5 | |
| HP Spectre x360 14-ea0378ng | |
| Framework Laptop 13.5 12th Gen Intel | |
| Microsoft Surface Laptop 4 13 Ryzen 5 | |
| Lenovo ThinkPad X1 Titanium Yoga G1 20QB0016GE | |
* ... menor é melhor
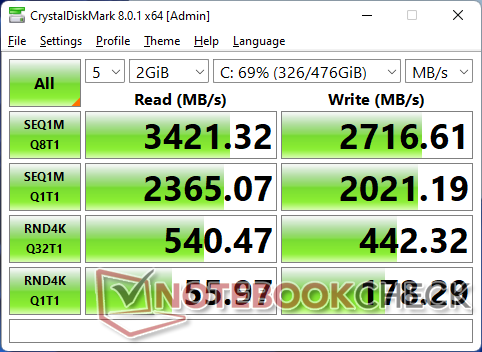
Dispositivos de armazenamento
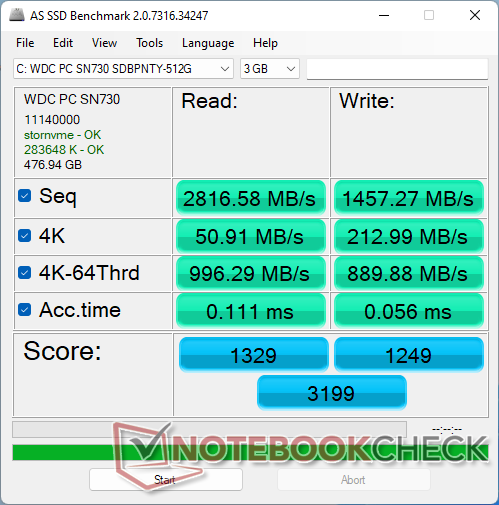
Enquanto nossa unidade de estrutura 2021 enviaria com um PCIe4 x4 WD SN850 M.2 NVMe SSD, nossa unidade 2022 enviaria com um PCIe3 x4 mais lentoWD SN730 SSD em vez disso. Os usuários ainda podem atualizar para um SSD PCIe4 x4 mais rápido, é claro.
Apenas um drive interno é suportado.

| Drive Performance rating - Percent | |
| Framework Laptop 13.5 | |
| Framework Laptop 13.5 12th Gen Intel | |
| Lenovo ThinkPad X1 Titanium Yoga G1 20QB0016GE | |
| HP Spectre x360 14-ea0378ng | |
| Microsoft Surface Laptop 4 13 Ryzen 5 | |
| HP EliteBook Folio 13.5-3G2L2EA -8! | |
* ... menor é melhor
Disk Throttling: DiskSpd Read Loop, Queue Depth 8
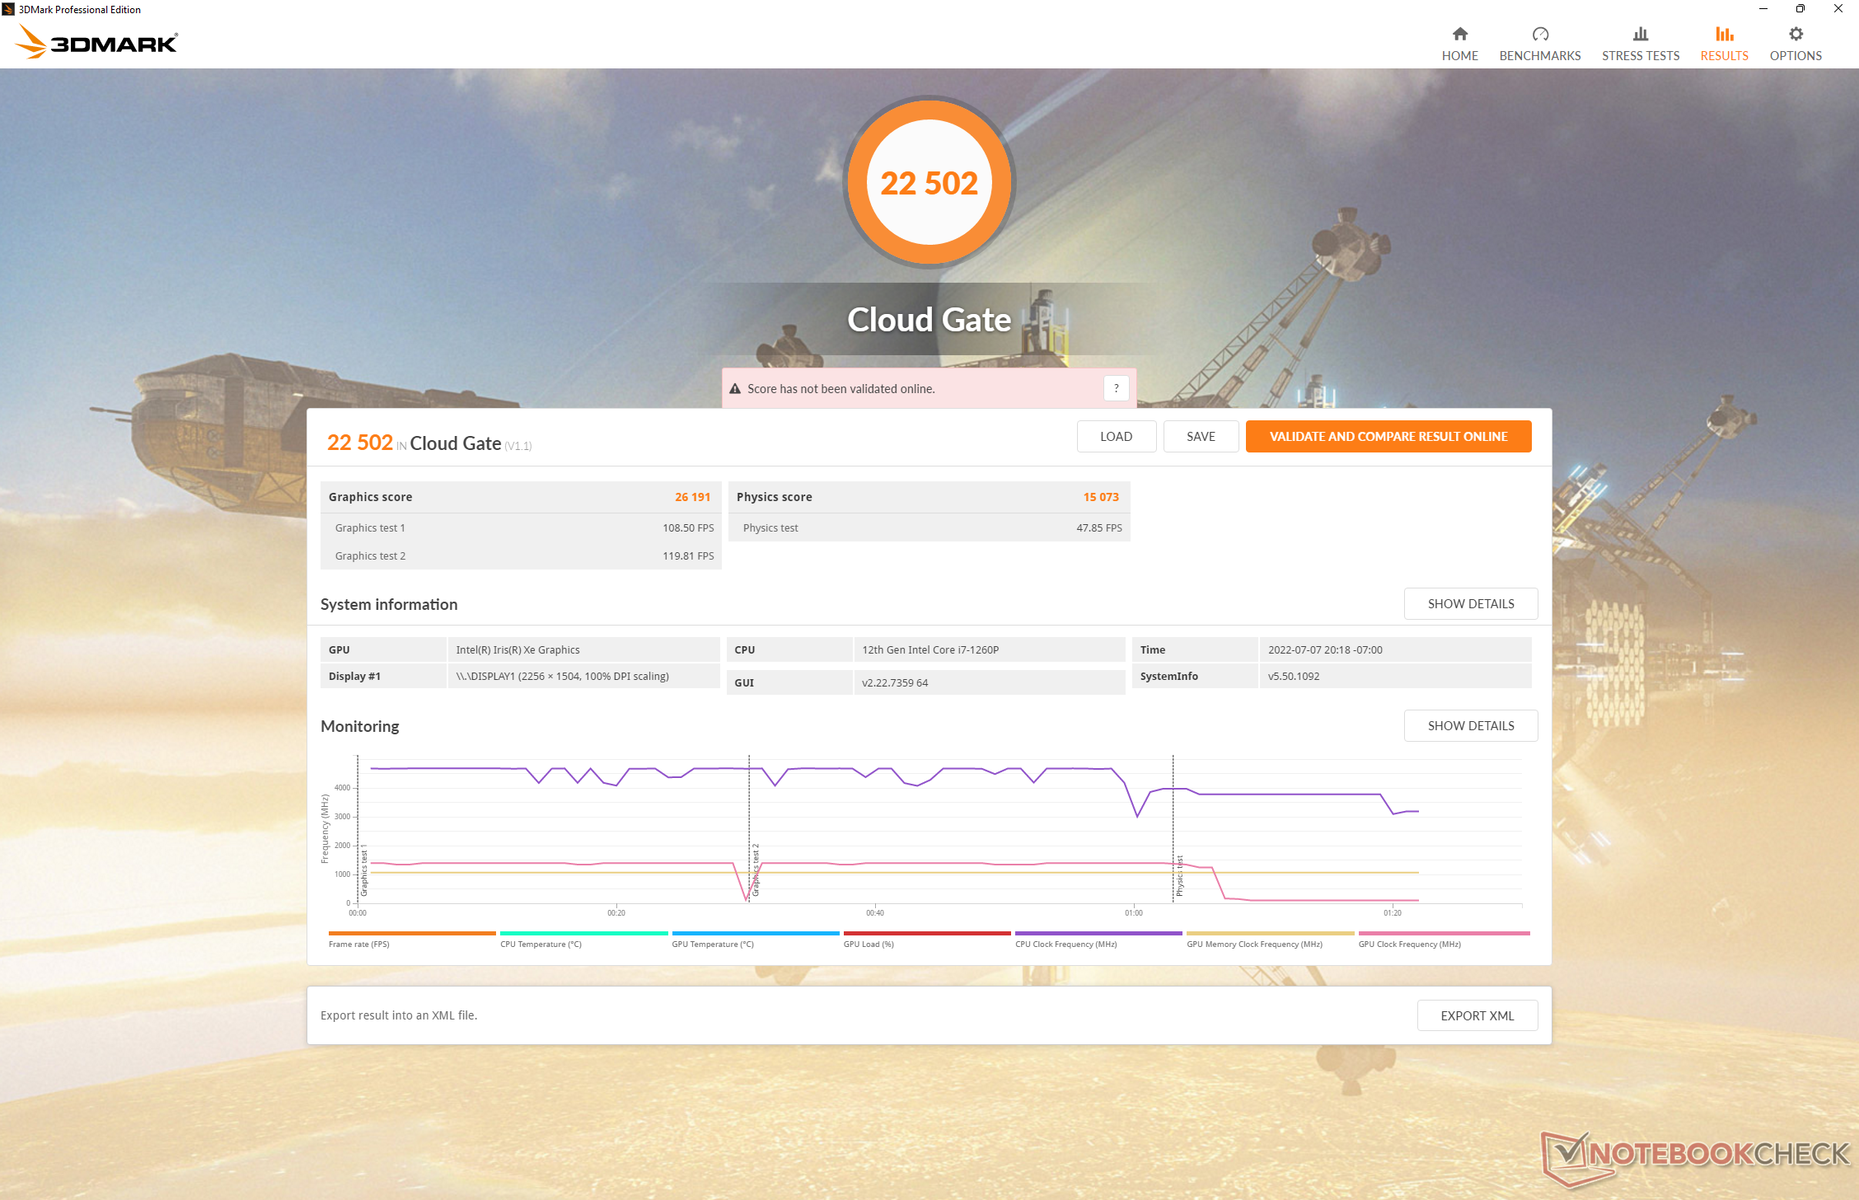
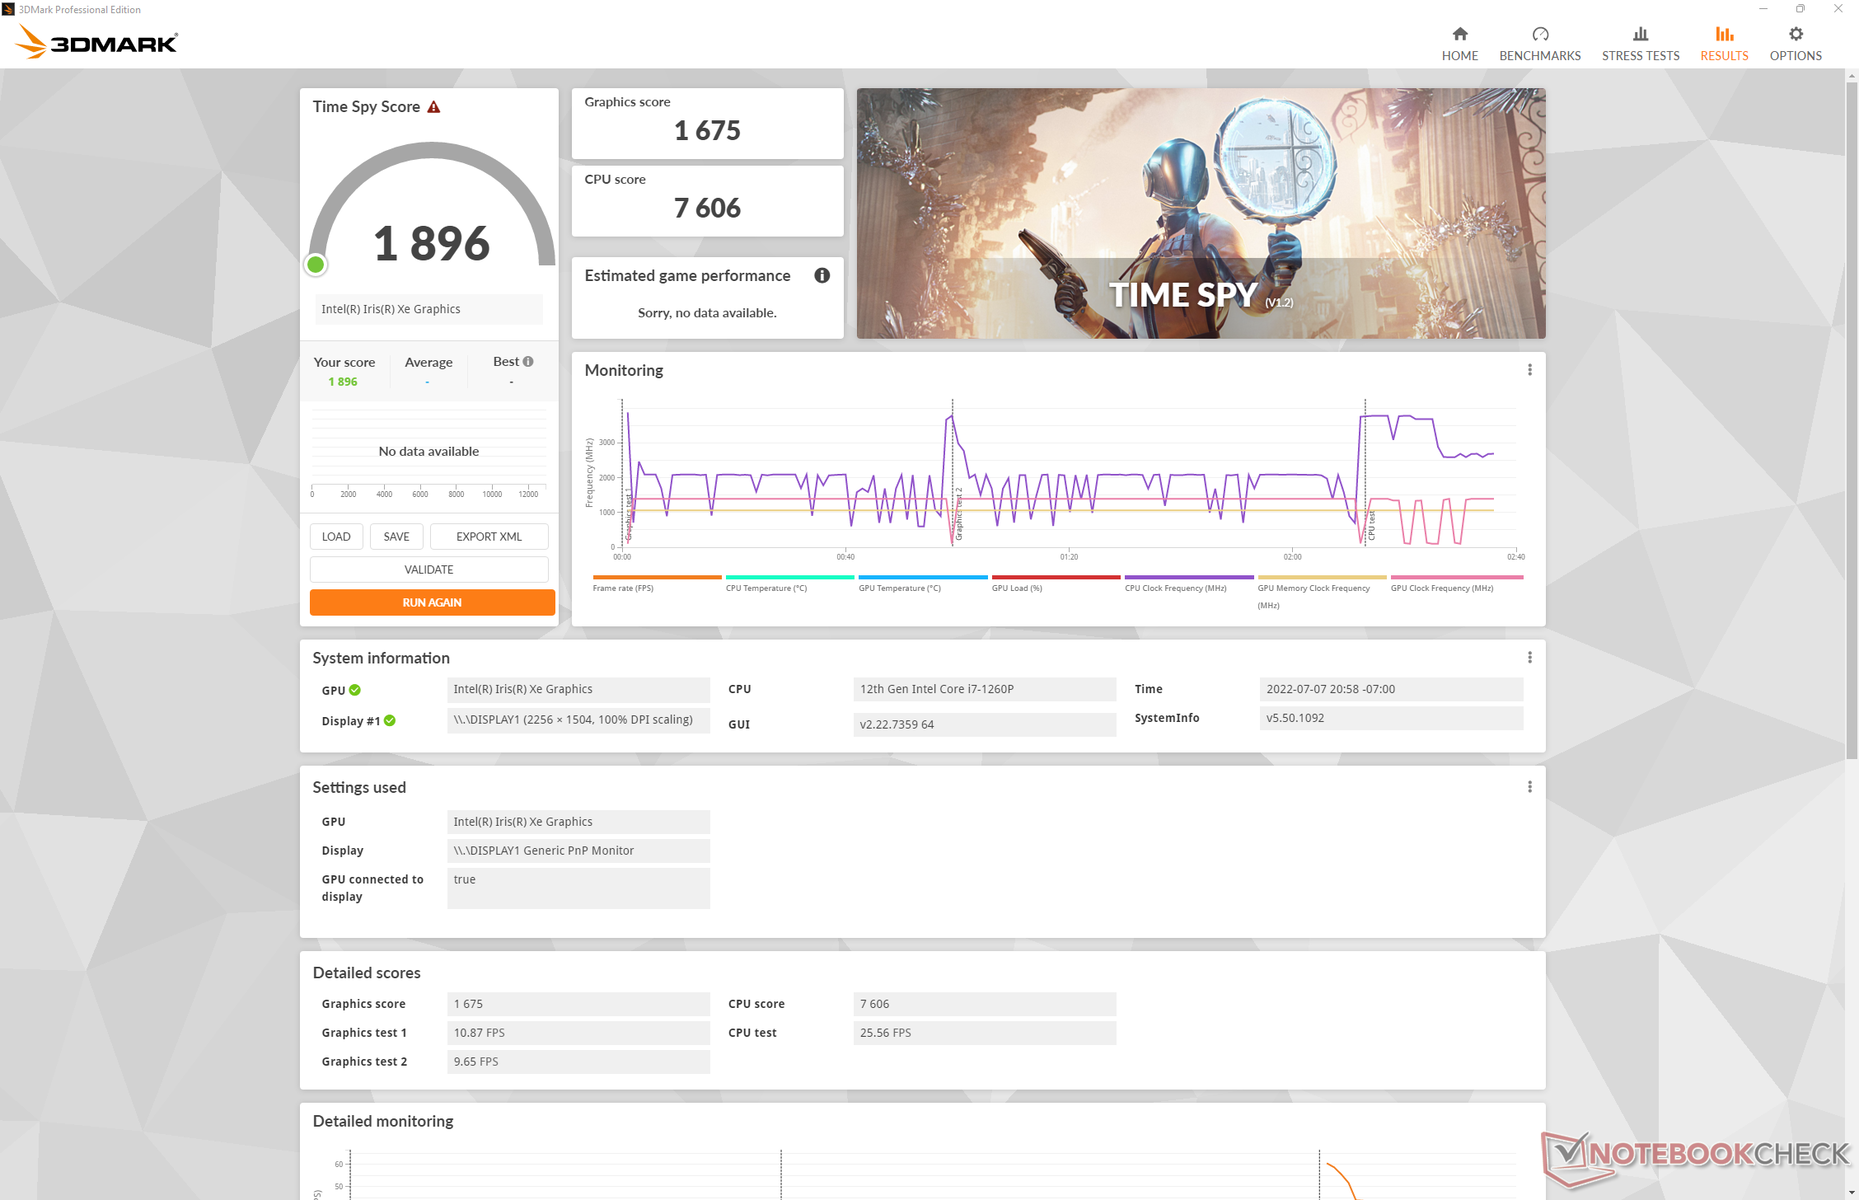
Desempenho da GPU
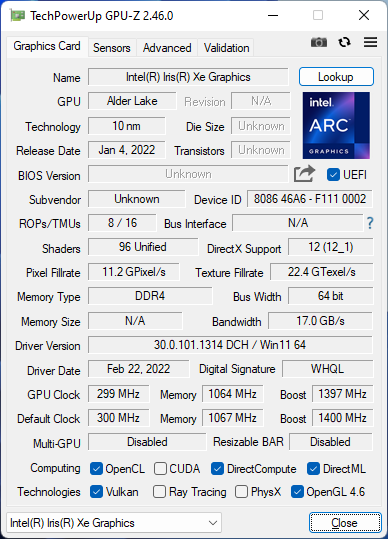
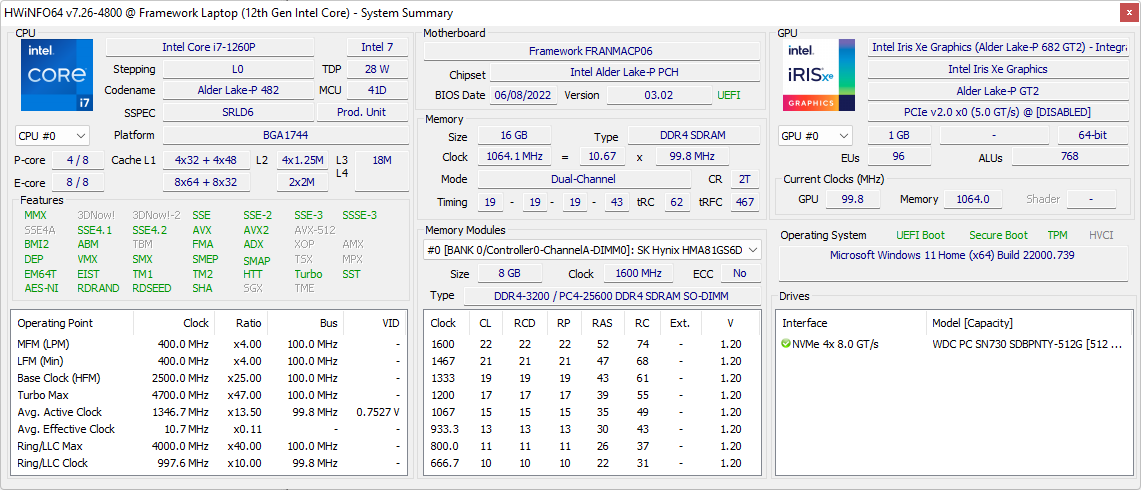
O desempenho gráfico é cerca de 5% a 15% mais rápido do que a média dos portáteis em nosso banco de dados equipados com o mesmo Iris Xe 96 EUs. O desempenho foi muito mais lento em nossa unidade de teste original de 2021 devido ao fato de ela funcionar com memória de um único canal. Se os gráficos são importantes para suas cargas de trabalho, então é altamente recomendável configurar com memória de canal duplo.
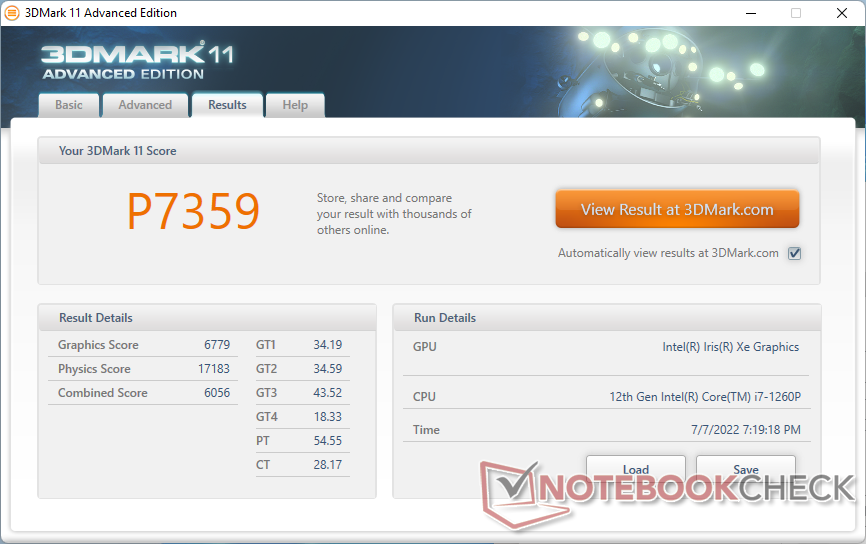
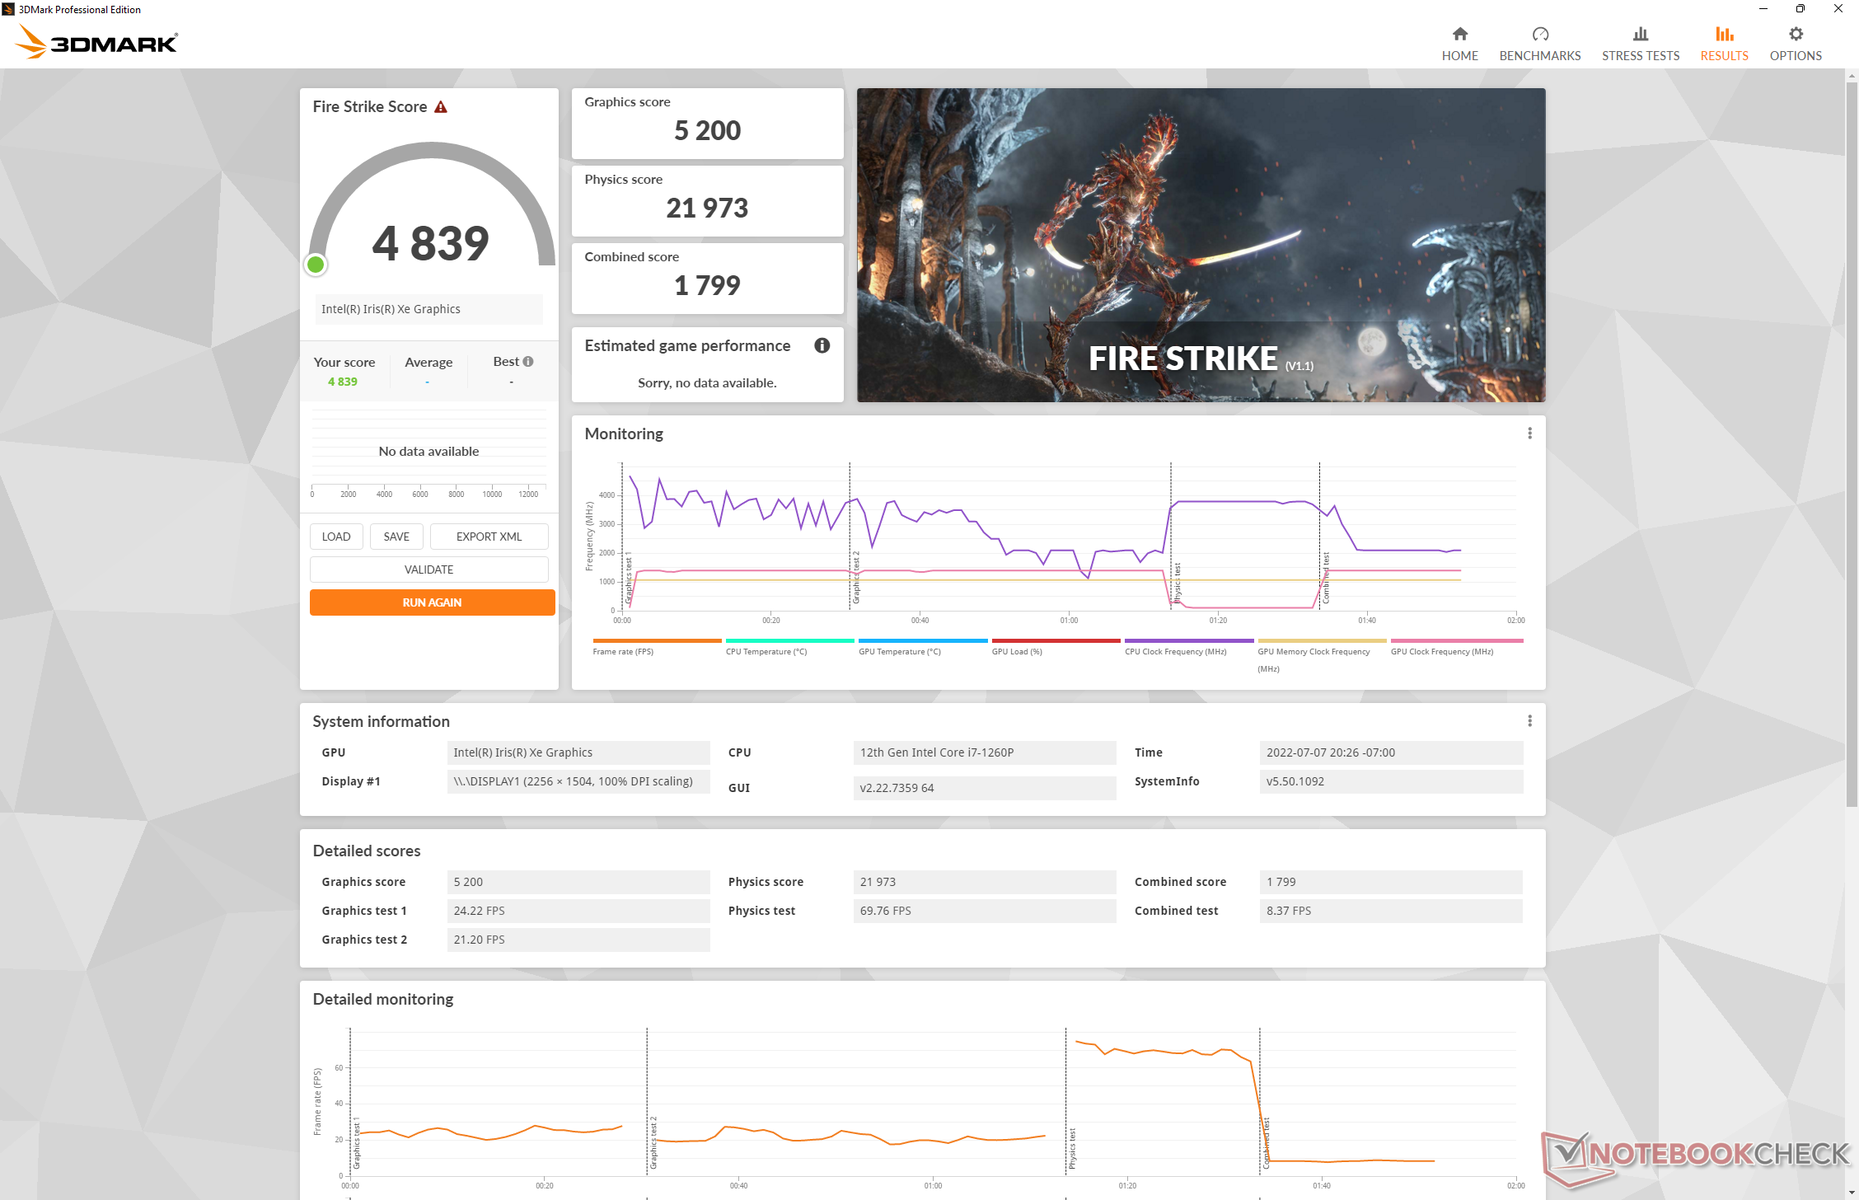
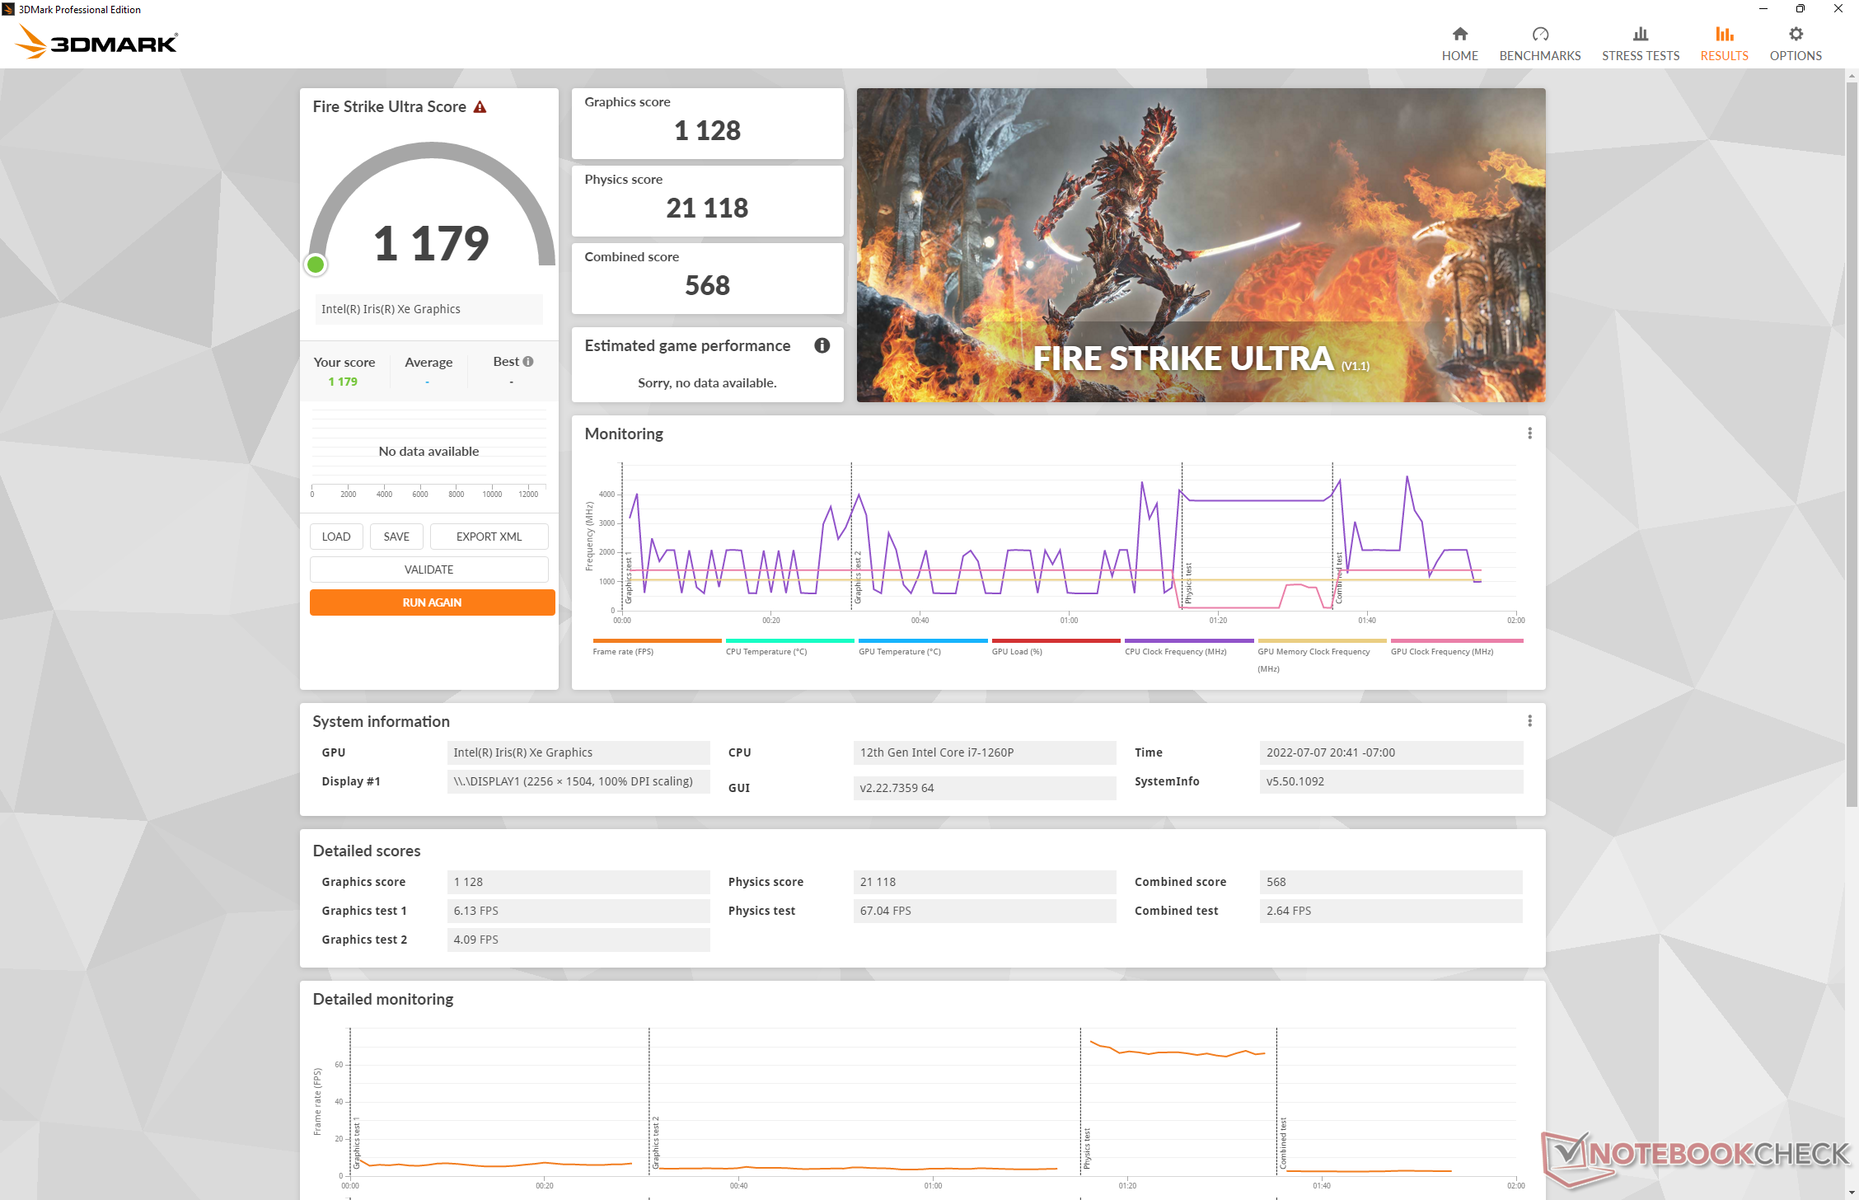
| 3DMark 11 Performance | 7359 pontos | |
| 3DMark Cloud Gate Standard Score | 22502 pontos | |
| 3DMark Fire Strike Score | 4839 pontos | |
| 3DMark Time Spy Score | 1896 pontos | |
Ajuda | ||
| Cyberpunk 2077 1.6 | |
| 1920x1080 Low Preset | |
| Asus Zenbook S 13 OLED | |
| Framework Laptop 13.5 12th Gen Intel | |
| Média Intel Iris Xe Graphics G7 96EUs (13 - 25.9, n=42) | |
| 1920x1080 Medium Preset | |
| Asus Zenbook S 13 OLED | |
| Framework Laptop 13.5 12th Gen Intel | |
| Média Intel Iris Xe Graphics G7 96EUs (10.8 - 21.7, n=37) | |
| 1920x1080 High Preset | |
| Asus Zenbook S 13 OLED | |
| Framework Laptop 13.5 12th Gen Intel | |
| Média Intel Iris Xe Graphics G7 96EUs (9.8 - 16.9, n=34) | |
| 1920x1080 Ultra Preset | |
| Asus Zenbook S 13 OLED | |
| Framework Laptop 13.5 12th Gen Intel | |
| Média Intel Iris Xe Graphics G7 96EUs (7.4 - 16.8, n=32) | |
Witcher 3 FPS Chart
| baixo | média | alto | ultra | |
|---|---|---|---|---|
| GTA V (2015) | 117.5 | 96.9 | 20 | 8.36 |
| The Witcher 3 (2015) | 97.5 | 60.5 | 32.3 | 15.1 |
| Dota 2 Reborn (2015) | 121.7 | 90.3 | 62.6 | 57.7 |
| Final Fantasy XV Benchmark (2018) | 42.5 | 23.3 | 23.3 | |
| X-Plane 11.11 (2018) | 62.6 | 45.9 | 41.3 | |
| Strange Brigade (2018) | 90.2 | 39.6 | 32.6 | 26.2 |
| Cyberpunk 2077 1.6 (2022) | 21.9 | 18.5 | 13.7 | 11.2 |
Emissões
Ruído do sistema
O ruído dos ventiladores permanece mais alto do que na maioria dos outros Ultrabooks, particularmente quando sob carga. A execução da primeira cena de referência do 3DMark 06 para simular cargas médias resultaria em um ruído do ventilador de 47 dB(A) para ser um dos sub-portáteis mais altos da série U que testamos. Se for jogar, o ruído dos ventiladores tende a oscilar entre 41 e 47 dB(A). Espere um sistema alto se você pretende executar cargas exigentes para explorar o rápido desempenho do processador.
Se você pretende executar cargas menos exigentes como navegação ou transmissão de vídeo, o ruído do ventilador tende a permanecer abaixo de 28 dB(A) contra um fundo silencioso de 22,8 dB(A). A pulsação dos ventiladores nesta faixa não é suficientemente alta para distrair.

Barulho
| Ocioso |
| 23 / 23 / 23 dB |
| Carga |
| 47.3 / 49.8 dB |
 | ||
30 dB silencioso 40 dB(A) audível 50 dB(A) ruidosamente alto |
||
min: | ||
| Framework Laptop 13.5 12th Gen Intel Iris Xe G7 96EUs, i7-1260P, WDC PC SN730 SDBPNTY-512G | Framework Laptop 13.5 Iris Xe G7 96EUs, i7-1165G7, Western Digital WD_BLACK SN850 WDS100T1X0E | Lenovo ThinkPad X1 Titanium Yoga G1 20QB0016GE Iris Xe G7 80EUs, i5-1140G7, Lenovo UMIS RPJTJ256MEE1OWX | Microsoft Surface Laptop 4 13 Ryzen 5 Vega 7, R5 4680U, Samsung PM991 MZ9LQ256HBJQ | HP Spectre x360 14-ea0378ng Iris Xe G7 96EUs, i7-1165G7, Intel Optane Memory H10 with Solid State Storage 32GB + 1TB HBRPEKNX0203AH(L/H) | |
|---|---|---|---|---|---|
| Noise | -1% | -2% | 1% | -1% | |
| desligado / ambiente * (dB) | 22.8 | 23.9 -5% | 25.61 -12% | 24.6 -8% | 26 -14% |
| Idle Minimum * (dB) | 23 | 23.9 -4% | 25.61 -11% | 24.6 -7% | 26 -13% |
| Idle Average * (dB) | 23 | 23.9 -4% | 25.61 -11% | 24.6 -7% | 26 -13% |
| Idle Maximum * (dB) | 23 | 23.9 -4% | 25.61 -11% | 24.6 -7% | 26 -13% |
| Load Average * (dB) | 47.3 | 45.6 4% | 40.14 15% | 39.5 16% | 37.5 21% |
| Witcher 3 ultra * (dB) | 47.3 | 47.1 -0% | |||
| Load Maximum * (dB) | 49.8 | 47.9 4% | 40.14 19% | 39.5 21% | 36.3 27% |
* ... menor é melhor
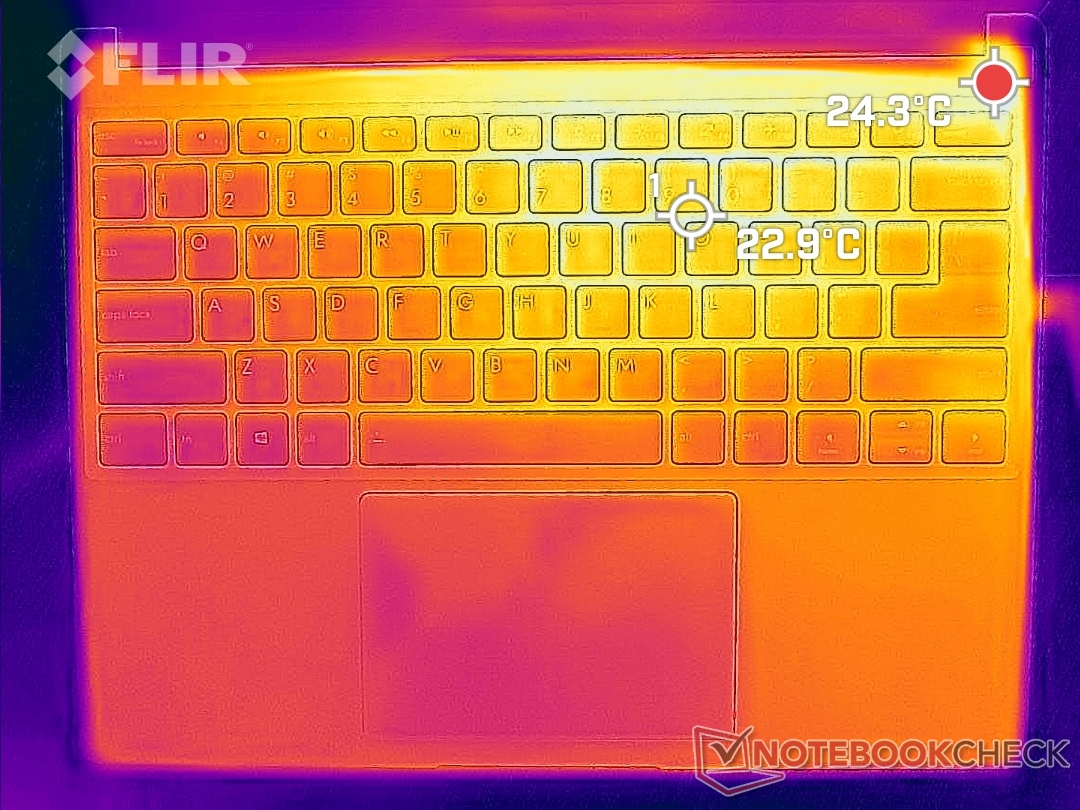
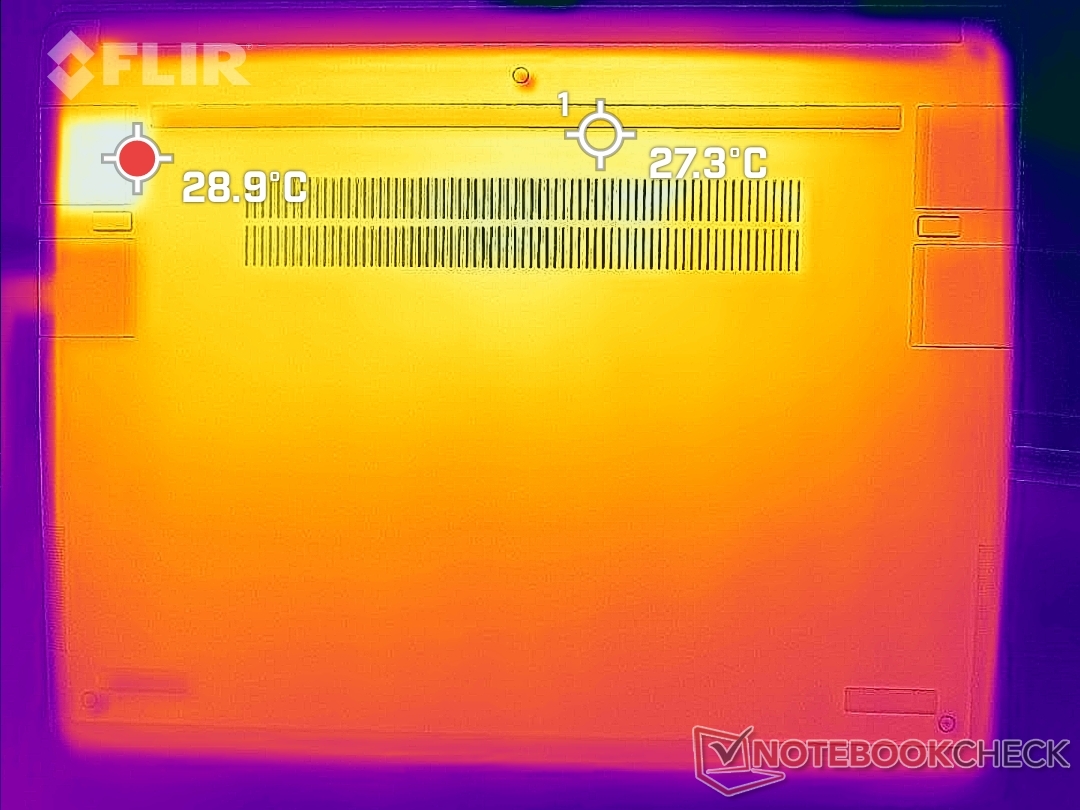
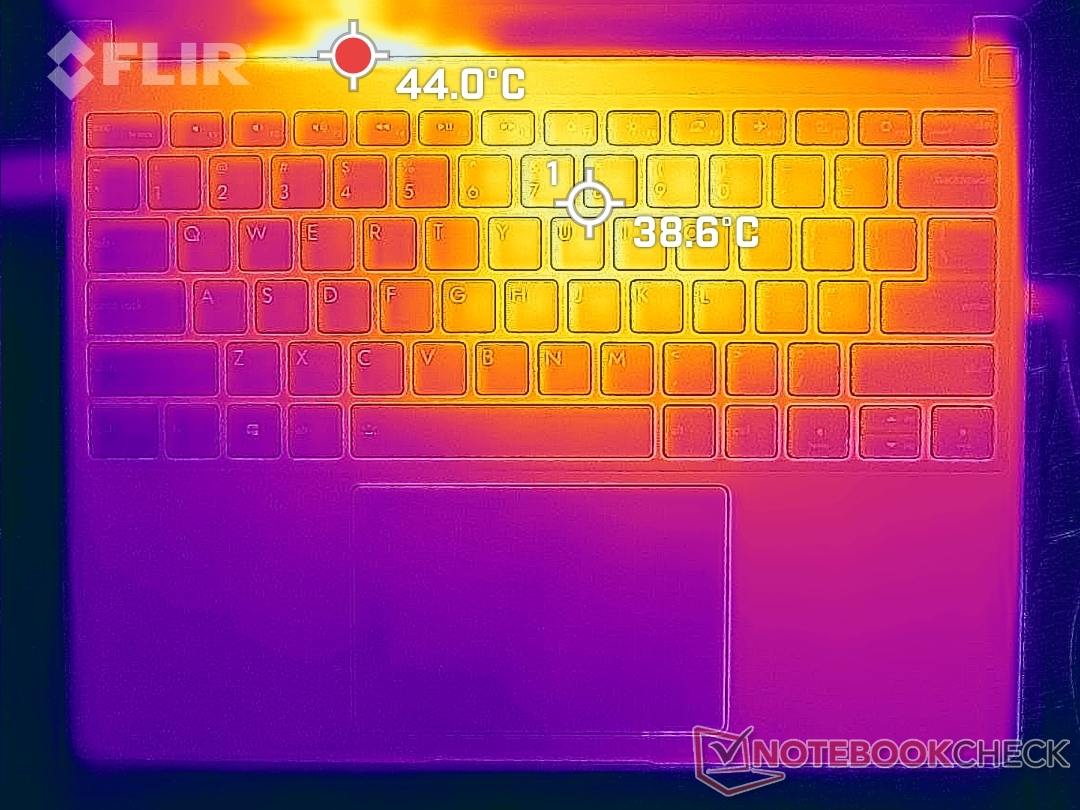
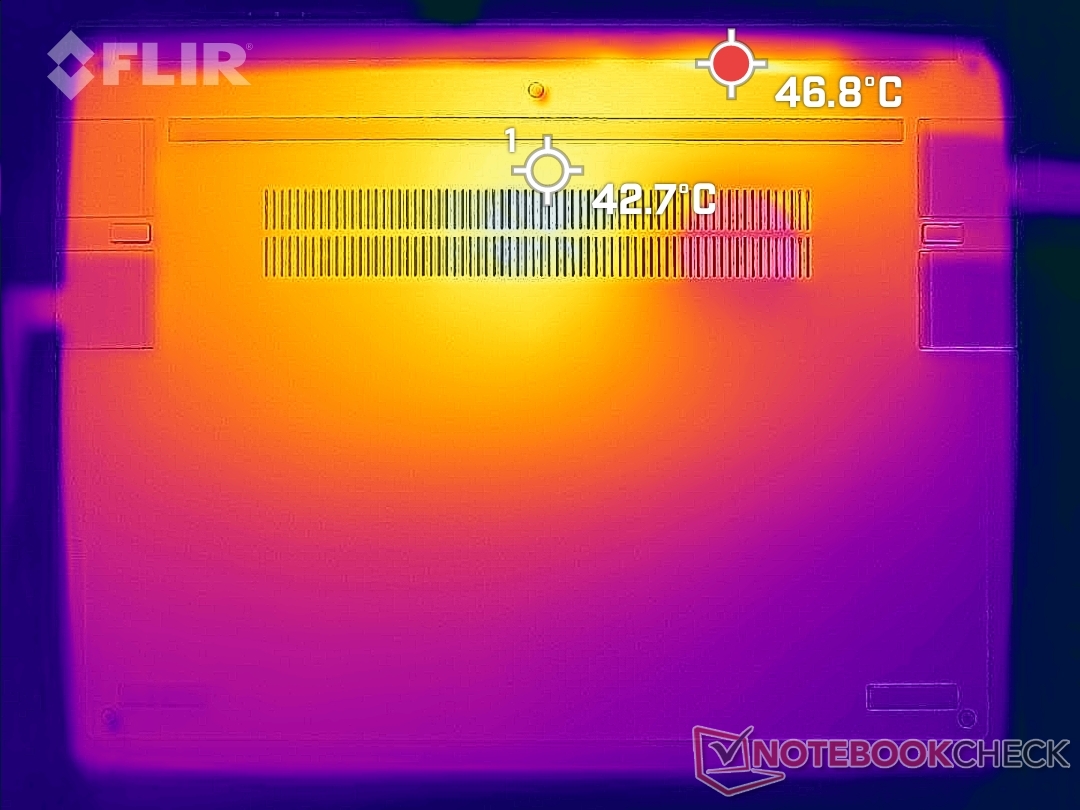
Temperatura
Os pontos quentes superficiais podem chegar a 39 C e 43 C na parte superior e inferior, respectivamente, em comparação com 45 C e 46 C no Laptop Superficial 4 13 ou 40 C e 51 C no HP Spectre x360 14. Não é quente o suficiente para ser incômodo, mas é definitivamente perceptível durante o uso. Grandes grelhas de ventilação no fundo poderiam ter melhorado as térmicas.
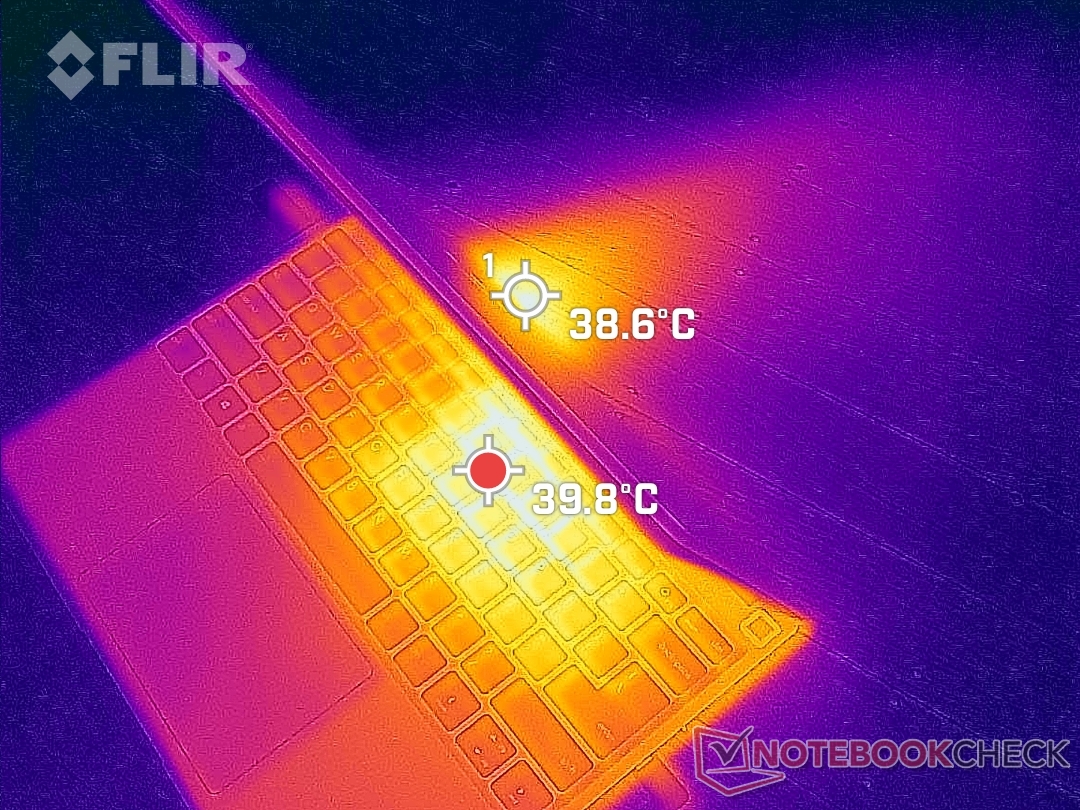
(+) A temperatura máxima no lado superior é 36.8 °C / 98 F, em comparação com a média de 34.3 °C / 94 F , variando de 21.2 a 62.5 °C para a classe Office.
(±) A parte inferior aquece até um máximo de 42.4 °C / 108 F, em comparação com a média de 36.8 °C / 98 F
(+) Em uso inativo, a temperatura média para o lado superior é 21.2 °C / 70 F, em comparação com a média do dispositivo de 29.5 °C / ### class_avg_f### F.
(+) Os apoios para as mãos e o touchpad são mais frios que a temperatura da pele, com um máximo de 24.4 °C / 75.9 F e, portanto, são frios ao toque.
(+) A temperatura média da área do apoio para as mãos de dispositivos semelhantes foi 27.5 °C / 81.5 F (+3.1 °C / 5.6 F).
| Framework Laptop 13.5 12th Gen Intel Intel Core i7-1260P, Intel Iris Xe Graphics G7 96EUs | Framework Laptop 13.5 Intel Core i7-1165G7, Intel Iris Xe Graphics G7 96EUs | Lenovo ThinkPad X1 Titanium Yoga G1 20QB0016GE Intel Core i5-1140G7, Intel Iris Xe Graphics G7 80EUs | HP EliteBook Folio 13.5-3G2L2EA Qualcomm Snapdragon 8cx Gen 2 5G, Qualcomm Adreno 680 | Microsoft Surface Laptop 4 13 Ryzen 5 AMD Ryzen 5 4680U, AMD Radeon RX Vega 7 | HP Spectre x360 14-ea0378ng Intel Core i7-1165G7, Intel Iris Xe Graphics G7 96EUs | |
|---|---|---|---|---|---|---|
| Heat | -5% | -9% | 8% | -6% | -6% | |
| Maximum Upper Side * (°C) | 36.8 | 47.2 -28% | 46.3 -26% | 34.3 7% | 45.8 -24% | 37.1 -1% |
| Maximum Bottom * (°C) | 42.4 | 39.4 7% | 43.3 -2% | 35.4 17% | 45.5 -7% | 43.1 -2% |
| Idle Upper Side * (°C) | 24.2 | 25.2 -4% | 26.8 -11% | 25.7 -6% | 24.9 -3% | 29 -20% |
| Idle Bottom * (°C) | 29 | 27.8 4% | 28.3 2% | 25.1 13% | 25.7 11% | 28.6 1% |
* ... menor é melhor
Teste de estresse
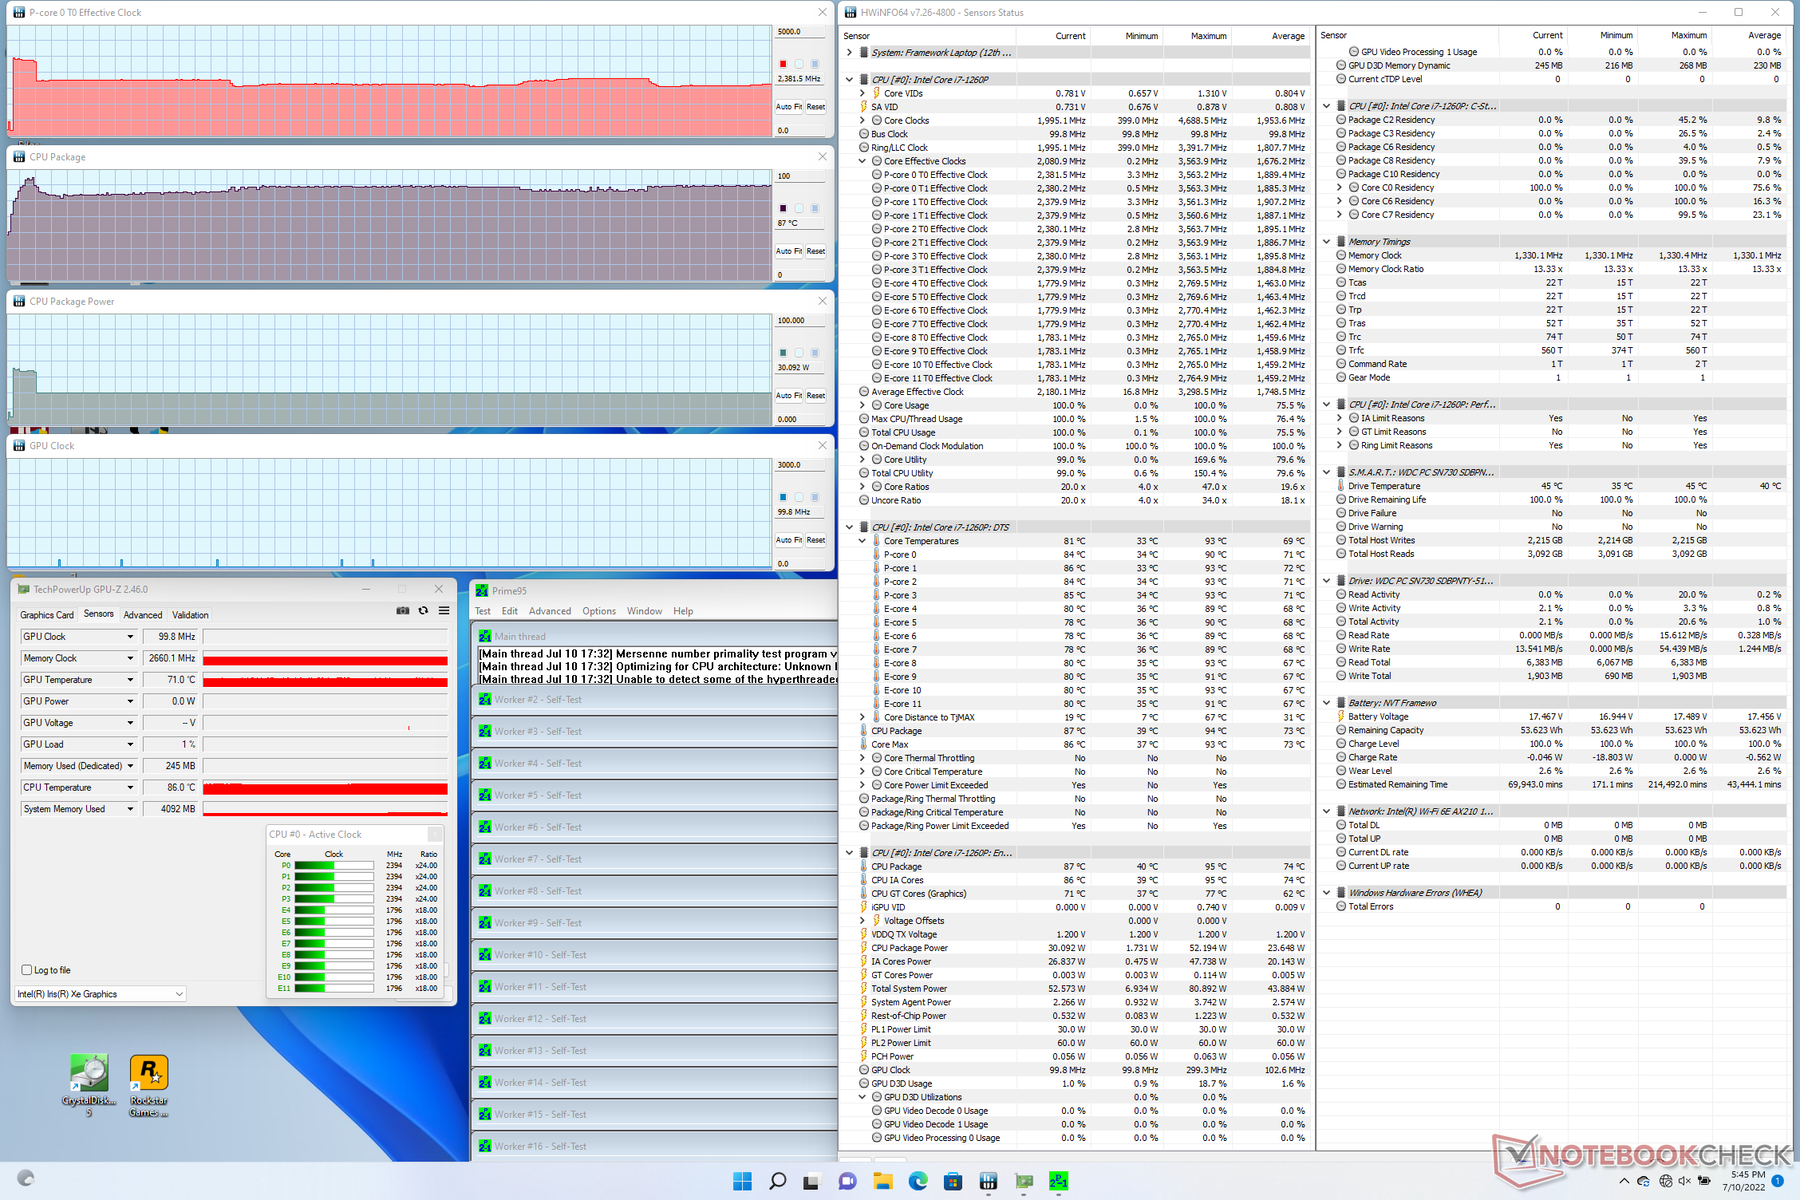
Ao executar Prime95, as taxas de relógio da CPU aumentariam para 3,5 GHz durante os primeiros 10 segundos ou mais até atingir uma temperatura central de 94 C. As taxas de relógio e o pacote de energia da CPU cairiam então para a faixa de 2,4 a 2,6 GHz e de 52 W a 30 W, respectivamente, a fim de manter uma temperatura central mais fria de 87 C. As temperaturas centrais globais ainda são visivelmente mais quentes do que as registradas no modelo do ano passado, onde as temperaturas se estabilizariam em 82 C quando sob condições semelhantes.
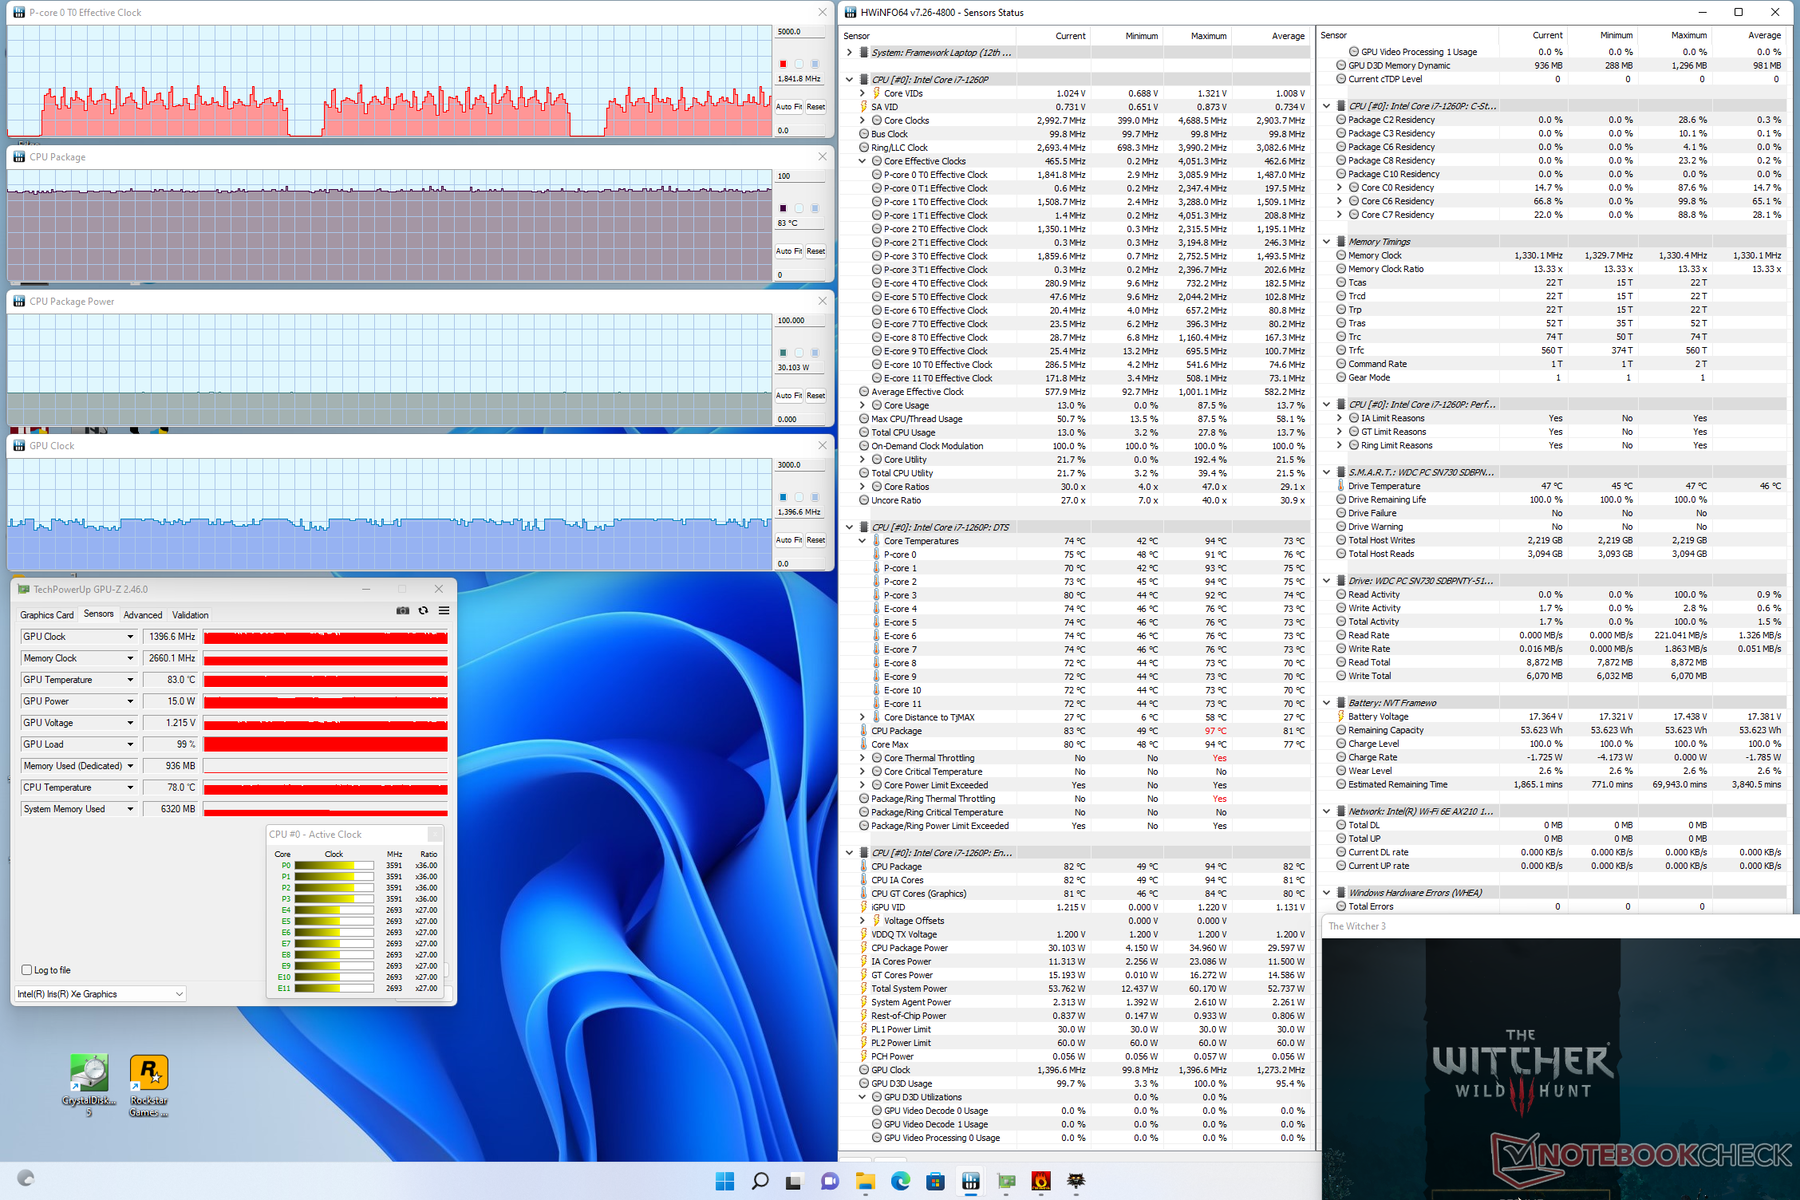
Ao rodar Witcher 3 para representar cargas de jogo, a temperatura central seria novamente mais quente do que no modelo do ano passado (83 C vs. 73 C).
Correr com a energia da bateria pode ter um leve impacto no desempenho da CPU. Um teste 3DMark 11 com baterias retornaria pontuações de Física e Gráficos de 14919 e 6604 pontos, respectivamente, em comparação com 17183 e 6779 pontos quando em rede elétrica.
| Relógio CPU (GHz) | Relógio GPU (MHz) | Temperatura média da CPU (°C) | |
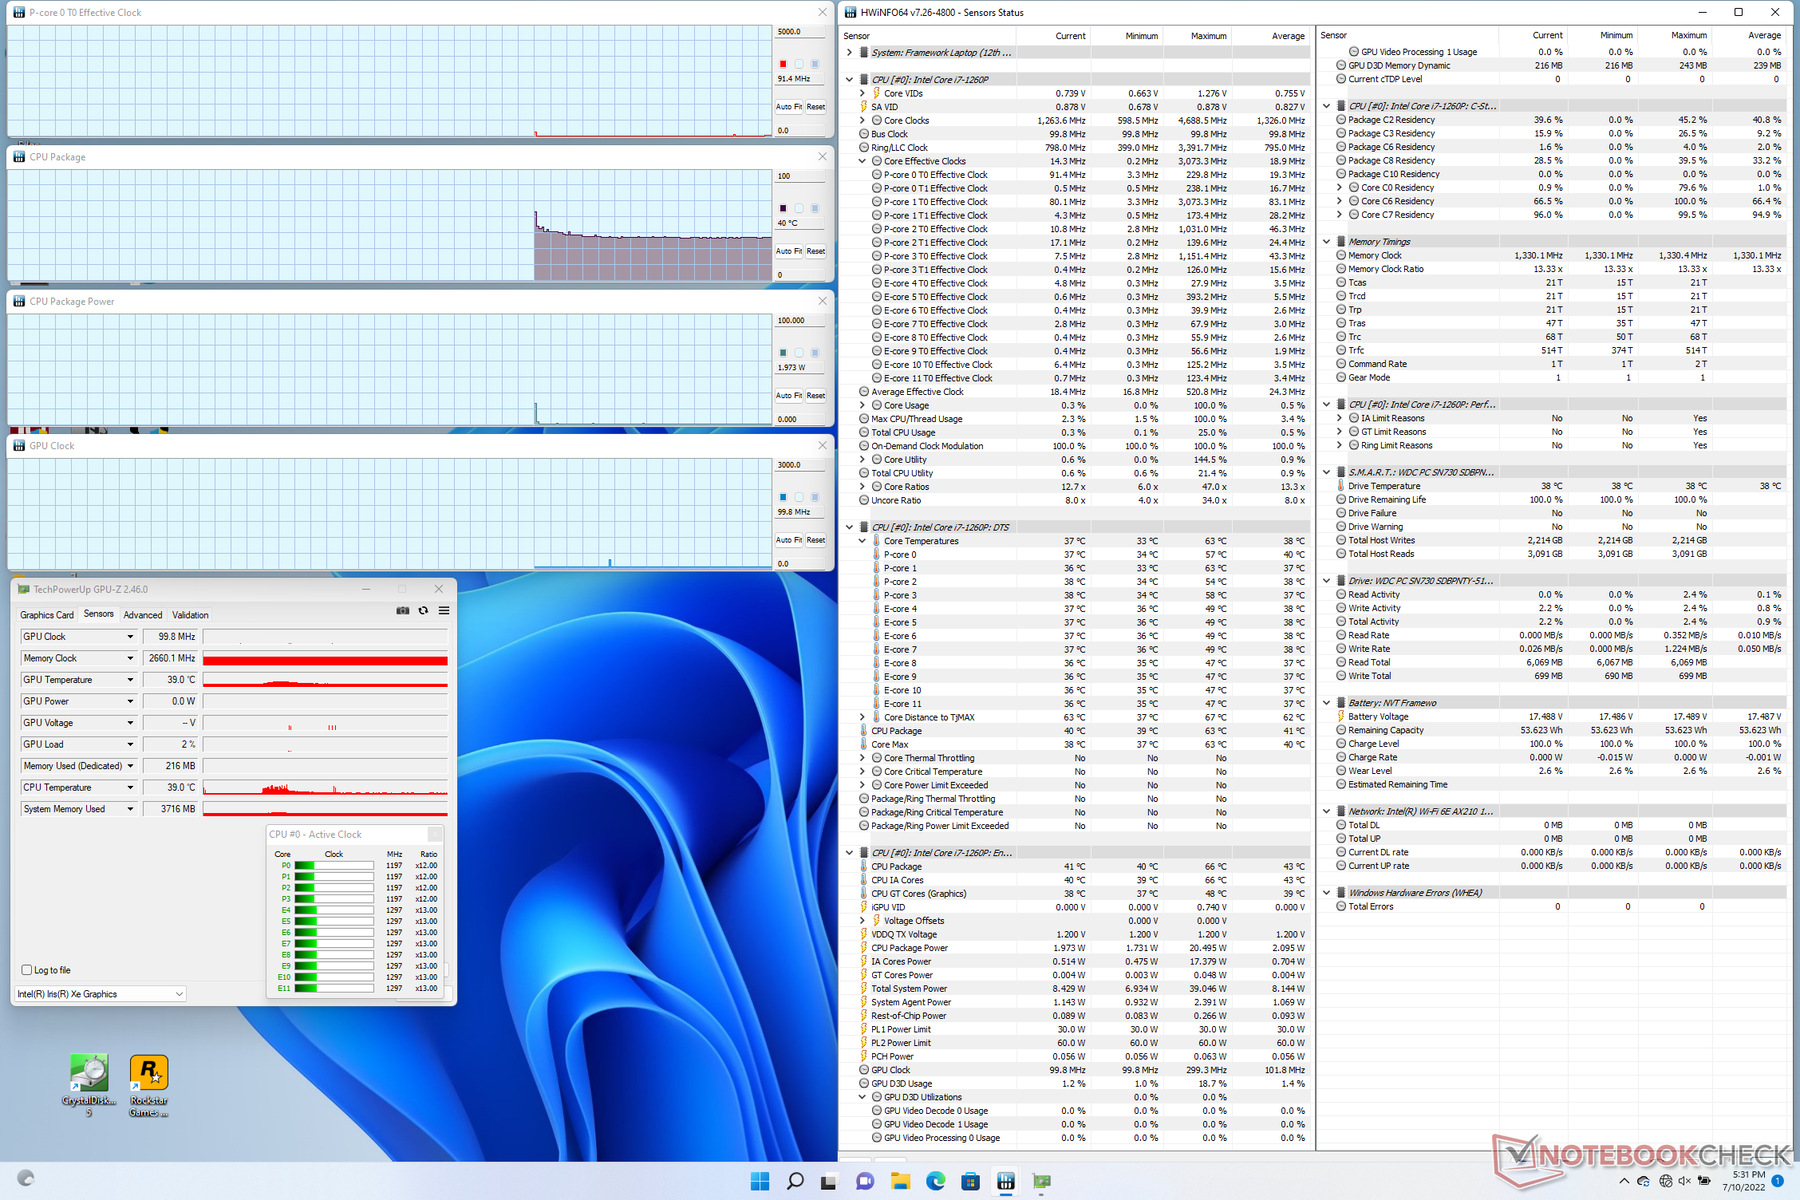
| System Idle | -- | -- | 40 |
| Prime95 Stress | 2.4 - 2.6 | -- | 87 |
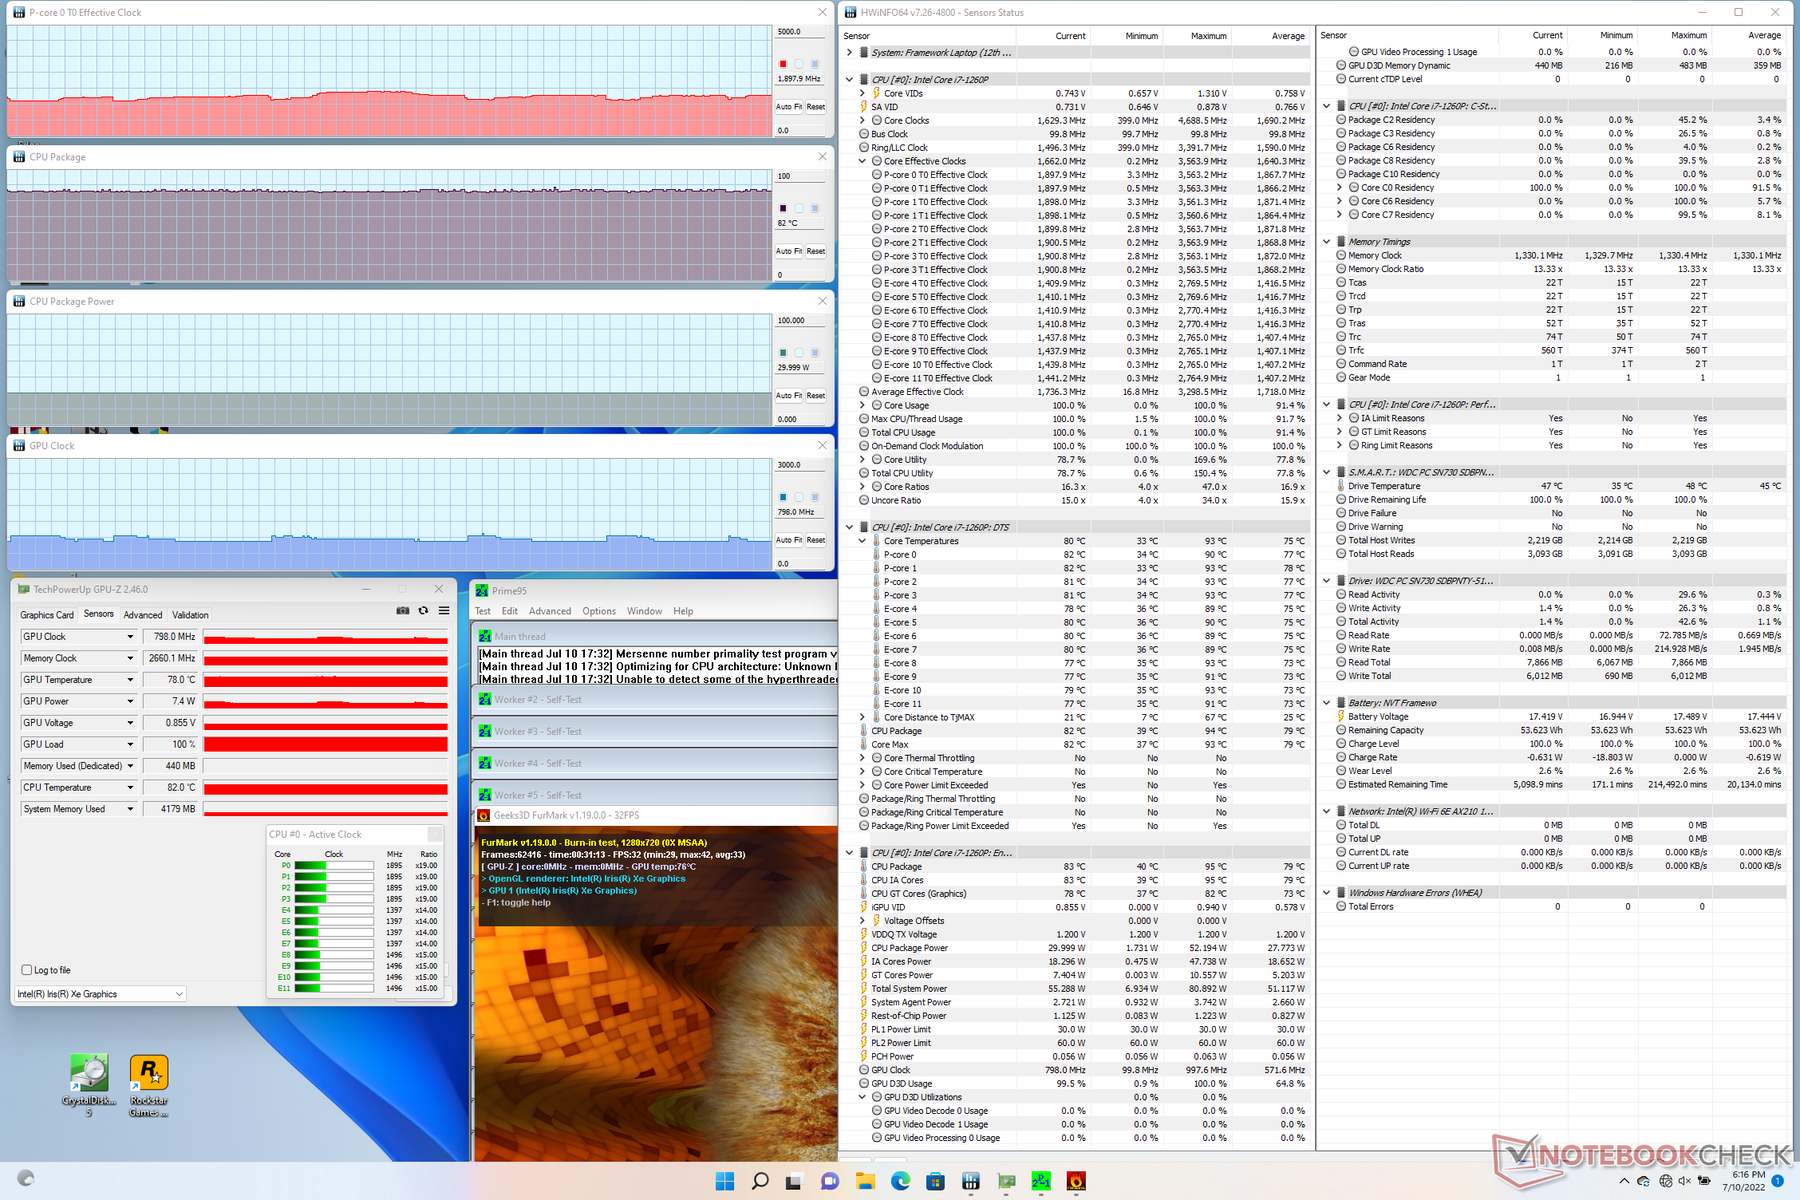
| Prime95 + FurMark Stress | 1.7 - 1.9 | 0.8 - 0.9 | 82 |
| Witcher 3 Estresse | ~1.8 | 1396 | 83 |
Oradores
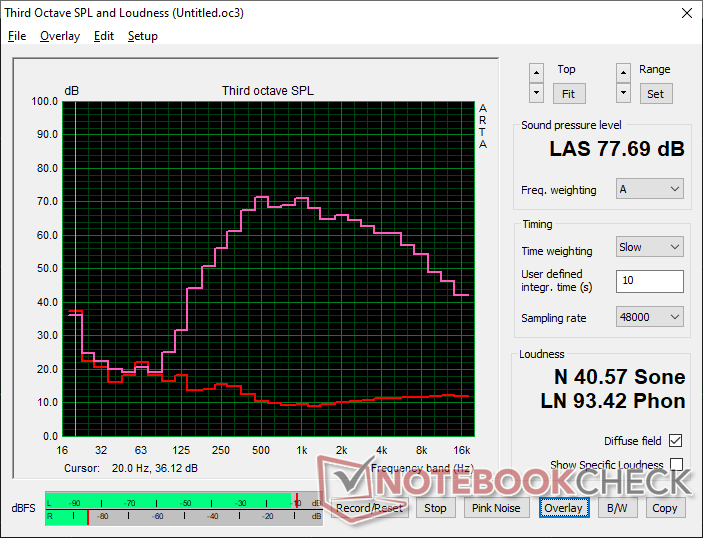
Framework Laptop 13.5 12th Gen Intel análise de áudio
(±) | o volume do alto-falante é médio, mas bom (###valor### dB)
Graves 100 - 315Hz
(-) | quase nenhum baixo - em média 16.1% menor que a mediana
(±) | a linearidade dos graves é média (14.3% delta para a frequência anterior)
Médios 400 - 2.000 Hz
(±) | médios mais altos - em média 7.5% maior que a mediana
(+) | médios são lineares (5.9% delta para frequência anterior)
Altos 2 - 16 kHz
(+) | agudos equilibrados - apenas 4% longe da mediana
(+) | os máximos são lineares (5% delta da frequência anterior)
Geral 100 - 16.000 Hz
(±) | a linearidade do som geral é média (20.7% diferença em relação à mediana)
Comparado com a mesma classe
» 48% de todos os dispositivos testados nesta classe foram melhores, 10% semelhantes, 42% piores
» O melhor teve um delta de 7%, a média foi 21%, o pior foi 53%
Comparado com todos os dispositivos testados
» 56% de todos os dispositivos testados foram melhores, 8% semelhantes, 36% piores
» O melhor teve um delta de 4%, a média foi 23%, o pior foi 134%
Apple MacBook Pro 16 2021 M1 Pro análise de áudio
(+) | os alto-falantes podem tocar relativamente alto (###valor### dB)
Graves 100 - 315Hz
(+) | bons graves - apenas 3.8% longe da mediana
(+) | o baixo é linear (5.2% delta para a frequência anterior)
Médios 400 - 2.000 Hz
(+) | médios equilibrados - apenas 1.3% longe da mediana
(+) | médios são lineares (2.1% delta para frequência anterior)
Altos 2 - 16 kHz
(+) | agudos equilibrados - apenas 1.9% longe da mediana
(+) | os máximos são lineares (2.7% delta da frequência anterior)
Geral 100 - 16.000 Hz
(+) | o som geral é linear (4.6% diferença em relação à mediana)
Comparado com a mesma classe
» 0% de todos os dispositivos testados nesta classe foram melhores, 0% semelhantes, 100% piores
» O melhor teve um delta de 5%, a média foi 17%, o pior foi 45%
Comparado com todos os dispositivos testados
» 0% de todos os dispositivos testados foram melhores, 0% semelhantes, 100% piores
» O melhor teve um delta de 4%, a média foi 23%, o pior foi 134%
Gestão de energia
Consumo de energia
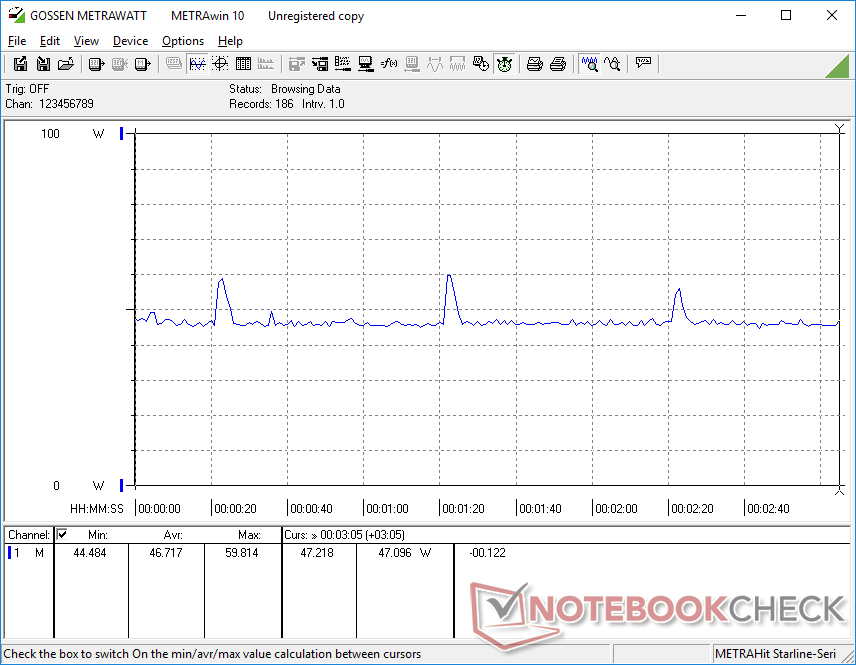
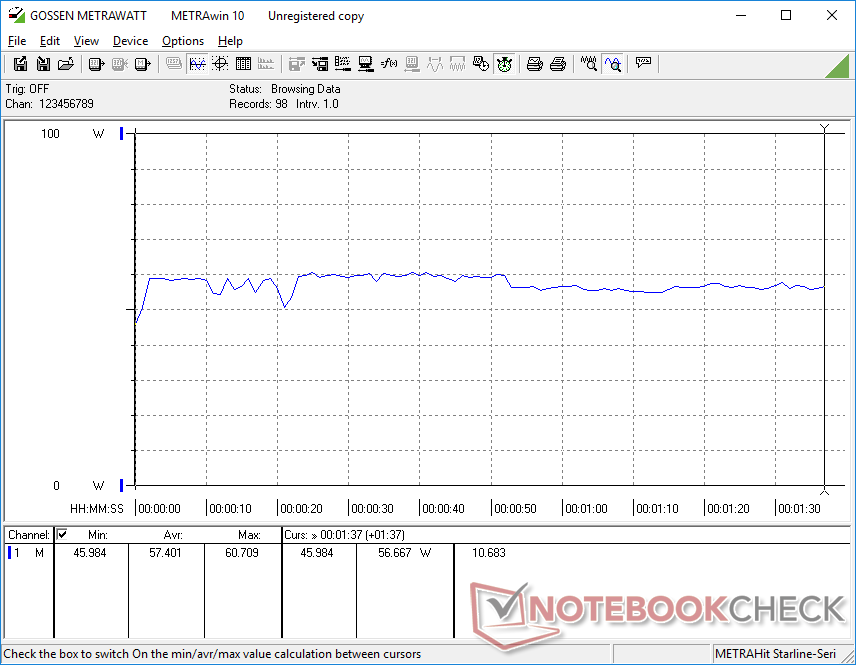
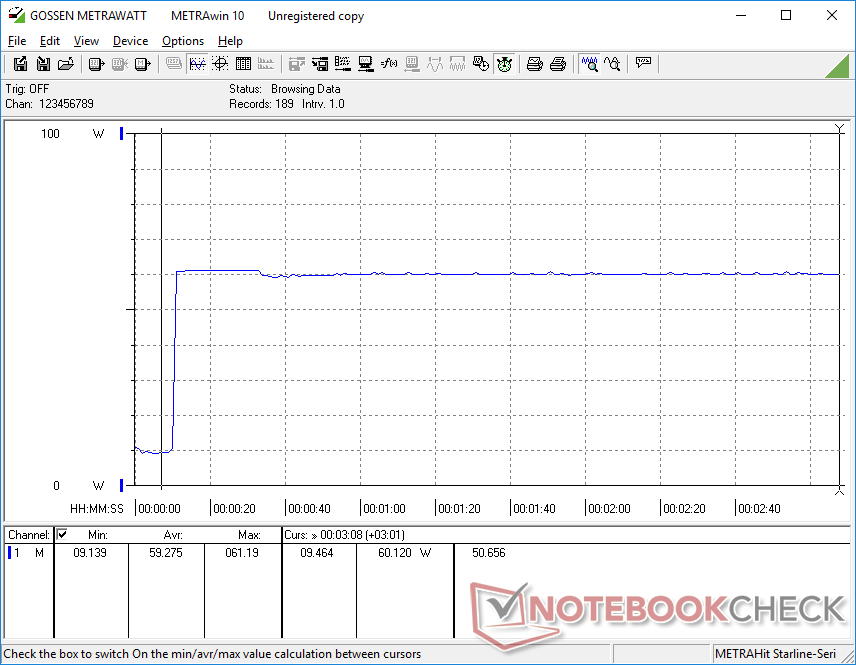
Como esperado de um sistema Alder Lake-P da 12ª geração, o consumo geral de energia é maior do que muitos laptops rodando na 11ª geração Tiger Lake-U processadores, incluindo o modelo Framework do ano passado. Rodando Prime95 consumiria 60 W para ser 25 por cento mais exigente ano após ano. O maior desempenho dos processadores não é gratuito neste aspecto
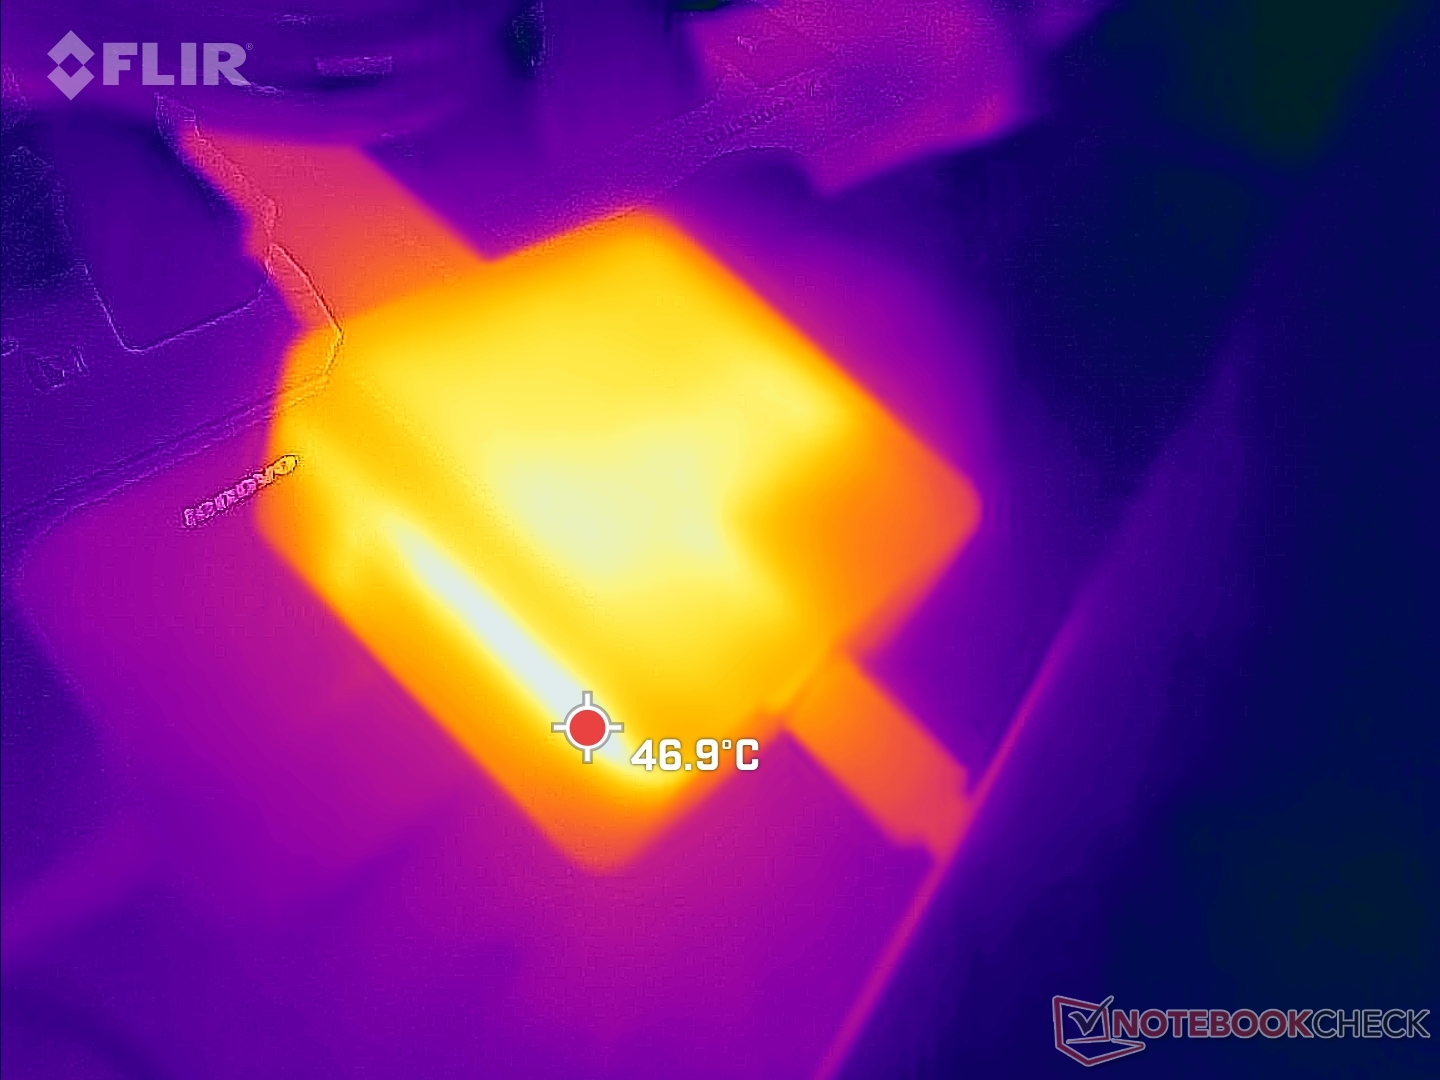
Somos capazes de registrar um consumo máximo de 61,2 W do pequeno (~5,8 x 5,8 x 2,7 cm) adaptador CA de 60 W ao rodar cargas Prime95. O fabricante não fez nenhuma alteração no adaptador AC, embora o processador mais novo seja mais exigente este ano. Um adaptador AC de maior capacidade poderia ter permitido um melhor desempenho do Turbo Boost ou um carregamento mais rápido quando o processador estiver rodando cargas exigentes. OGPD Win Max 2por exemplo, vem com a mesma CPU Core i7-1260P e ainda assim é fornecido com um adaptador AC de 100 W.

| desligado | |
| Ocioso | |
| Carga |
|
Key:
min: | |
| Framework Laptop 13.5 12th Gen Intel i7-1260P, Iris Xe G7 96EUs, WDC PC SN730 SDBPNTY-512G, IPS, 2256x1504, 13.5" | Framework Laptop 13.5 i7-1165G7, Iris Xe G7 96EUs, Western Digital WD_BLACK SN850 WDS100T1X0E, IPS, 2256x1504, 13.5" | Lenovo ThinkPad X1 Titanium Yoga G1 20QB0016GE i5-1140G7, Iris Xe G7 80EUs, Lenovo UMIS RPJTJ256MEE1OWX, IPS LED, 2256x1504, 13.5" | HP EliteBook Folio 13.5-3G2L2EA SD 8cx Gen 2 5G, Adreno 680, Toshiba XG6 KXG60ZNV512G, IPS, 1920x1280, 13.5" | Microsoft Surface Laptop 4 13 Ryzen 5 R5 4680U, Vega 7, Samsung PM991 MZ9LQ256HBJQ, IPS, 2256x1504, 13.5" | HP Spectre x360 14-ea0378ng i7-1165G7, Iris Xe G7 96EUs, Intel Optane Memory H10 with Solid State Storage 32GB + 1TB HBRPEKNX0203AH(L/H), OLED, 3000x2000, 13.5" | |
|---|---|---|---|---|---|---|
| Power Consumption | 12% | 31% | 60% | 24% | 3% | |
| Idle Minimum * (Watt) | 5.3 | 4.3 19% | 3.75 29% | 2.3 57% | 3.4 36% | 6.3 -19% |
| Idle Average * (Watt) | 8.4 | 8.2 2% | 7.75 8% | 3.7 56% | 6.3 25% | 11.2 -33% |
| Idle Maximum * (Watt) | 11.2 | 8.7 22% | 8.69 22% | 5.6 50% | 8.1 28% | 13.3 -19% |
| Load Average * (Watt) | 57.4 | 43.5 24% | 33.12 42% | 13 77% | 36.2 37% | 32 44% |
| Witcher 3 ultra * (Watt) | 46.7 | 43.5 7% | 28.7 39% | |||
| Load Maximum * (Watt) | 61.2 | 61.8 -1% | 35.19 43% | 25 59% | 64.1 -5% | 35.6 42% |
* ... menor é melhor
Power Consumption Witcher 3 / Stresstest
Power Consumption external Monitor
Vida útil da bateria
Os tempos de execução são mais curtos em apenas meia hora quando comparados com o modelo do ano passado, apesar do desempenho muito mais rápido do processador. 7.5 horas de uso de WLAN no mundo real devem ser suficientes para a maioria dos usuários, embora seja várias horas mais curto do que no Laptop de Superfície 4 13
O carregamento do vazio para a capacidade total com o adaptador AC incluído leva cerca de 90 minutos. No entanto, a carga irá diminuir significativamente quando a carga for muito alta devido ao adaptador de CA de 60 W, como mencionado acima.
| Framework Laptop 13.5 12th Gen Intel i7-1260P, Iris Xe G7 96EUs, 55 Wh | Framework Laptop 13.5 i7-1165G7, Iris Xe G7 96EUs, 55 Wh | Lenovo ThinkPad X1 Titanium Yoga G1 20QA001RGE i7-1160G7, Iris Xe G7 96EUs, 44.5 Wh | HP EliteBook Folio 13.5-3G2L2EA SD 8cx Gen 2 5G, Adreno 680, 46 Wh | Microsoft Surface Laptop 4 13 Ryzen 5 R5 4680U, Vega 7, 47.4 Wh | HP Spectre x360 14-ea0378ng i7-1165G7, Iris Xe G7 96EUs, 66 Wh | |
|---|---|---|---|---|---|---|
| Duração da bateria | 7% | 12% | 95% | 45% | 4% | |
| WiFi v1.3 (h) | 7.5 | 8 7% | 8.4 12% | 14.6 95% | 10.9 45% | 7.8 4% |
| H.264 (h) | 11.4 | 11.1 | ||||
| Load (h) | 1.9 | 4.2 | 2.6 | |||
| Reader / Idle (h) | 13.4 |
Pro
Contra
Veredicto - Uma solução de longo prazo
A estrutura havia prometido que seu projeto de laptop permitiria atualizações fáceis sempre que a última geração de processadores estivesse disponível. O modelo de 2022 fez exatamente isso com os kits de atualização da placa-mãe "faça você mesmo" para os proprietários existentes ou com configurações prontas para uso para os recém-chegados que desejassem saltar a bordo. Quando comparado ao modelo 2021 com o Intel 11th gen, o modelo 2022 pode oferecer um aumento de desempenho da CPU de até 90% que os entusiastas certamente podem apreciar. No entanto, ele vem ao custo de temperaturas centrais mais quentes e vida útil ligeiramente mais curta da bateria, mas as compensações podem valer a pena, dependendo dos cenários de uso.
Além da atualização da CPU, a experiência permanece a mesma que pode ser tanto boa quanto ruim. É bom para a consistência e previsibilidade garantidas entre as atualizações anuais, mas também é ruim, pois certos inconvenientes não podem ser resolvidos com muita facilidade. Os mais recentes Ultrabooks como os de Asuspor exemplo, estão começando a ser enviados tanto com displays OLED Intel/AMD quanto com alta taxa de atualização, enquanto o modelo Framework continua a ter apenas uma opção de display e sem CPUs Ryzen. A base e a tampa ainda são mais suscetíveis a ranger e torcer do que os modelos emblemáticos da Dell, HP, ou Lenovo. Adoraríamos ver também as opções WAN e IR talvez na forma de uma placa de expansão se não for possível mudar a placa-mãe interna. A inclusão de algumas dessas características poderia ser difícil, pois o fabricante está limitado a seu projeto original de chassis e peças 2021.
Mesmo com os desafios percebidos em mente, eles não tiram da alta personalização ou do design de fácil utilização do Laptop Framework. Os proprietários que valorizam a reparabilidade e a facilidade de aquisição de peças de reposição para seus caros produtos acharão o Framework Laptop menos frustrante de usar do que uma alternativa fechada como o Superfície Laptop.
Preço e Disponibilidade
A estrutura é agora recebendo pedidos para seu Laptop Intel de 12ª geração a partir de US$1050 para a versão Core i5 ou US$1450 para nossa configuração de revisão.
Framework Laptop 13.5 12th Gen Intel
- 07/12/2022 v7 (old)
Allen Ngo
Price comparison

