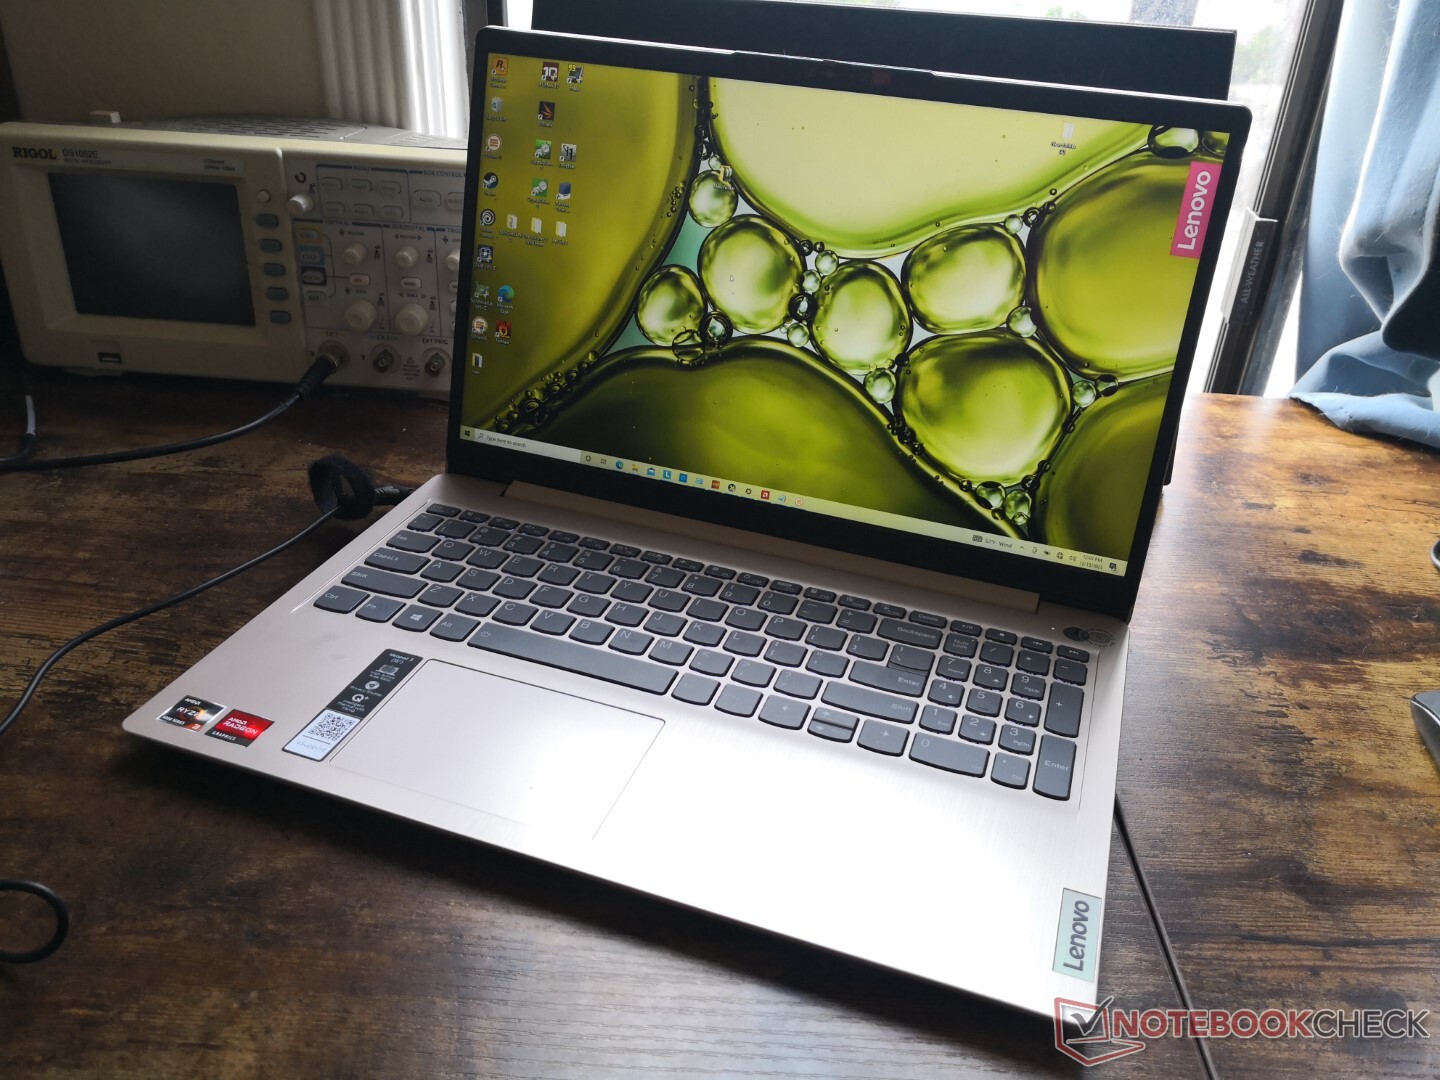
Ryzen 3 superando o Core i3: Lenovo IdeaPad 3 15ALC6 revisão de laptop
A família IdeaPad 3 é o lar dos modelos de laptop de baixo custo que estão abaixo dos já baratos famílias IdeaPad 5 e IdeaPad 7. Se você estiver com um orçamento muito apertado, então os baixos preços iniciais de uma IdeaPad 3 podem parecer atraentes.
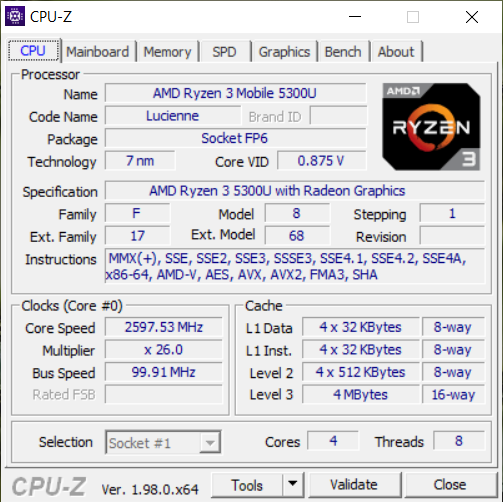
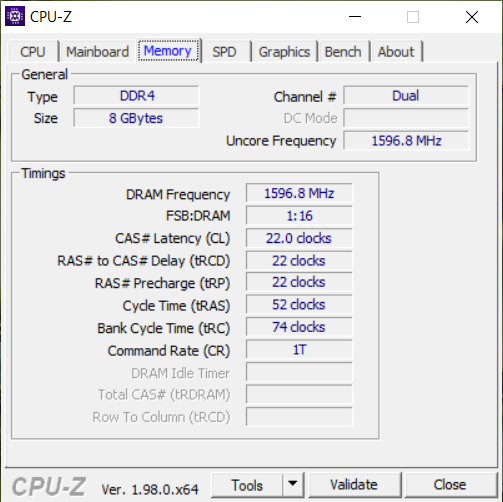
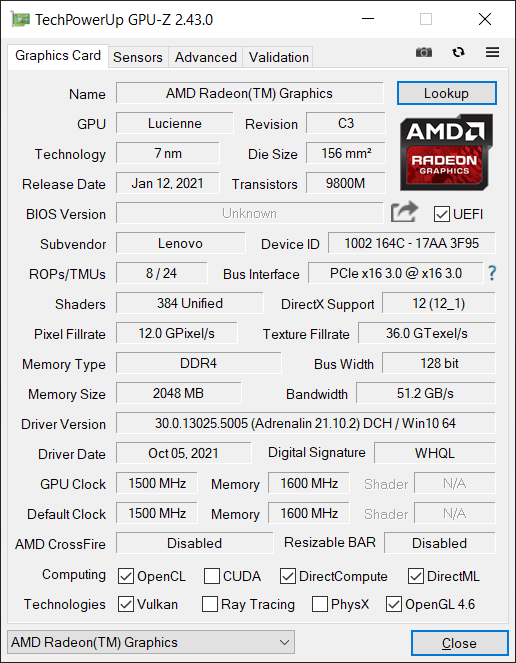
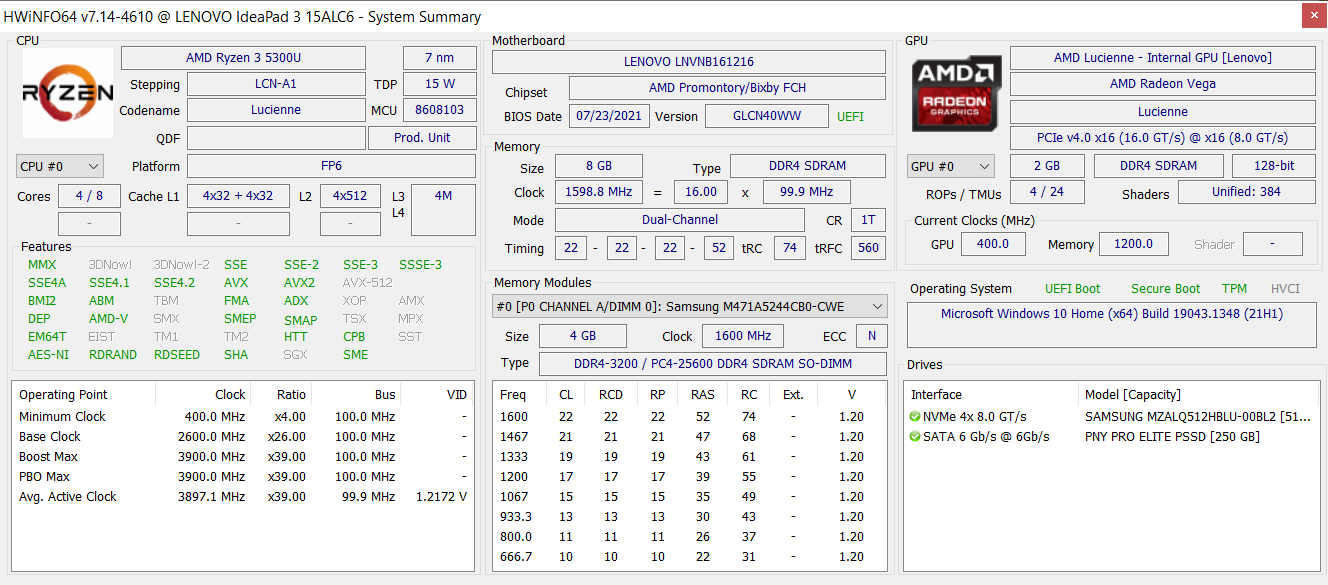
Nossa unidade de teste vem com a CPU Ryzen 3 5300U Zen 2 quad-core, 8 GB de RAM, 1080p IPS display, e 512 GB PCIe3 NVMe SSD por aproximadamente $539 USD no varejo ou ainda menos quando à venda. SKUs superiores podem estar disponíveis com o Ryzen 5 5500U ou Ryzen 7 5700U e com mais RAM ou armazenamento. Os concorrentes do IdeaPad 3 incluem outros laptops de consumo baratos como o HP Pavilion 15, Asus VivoBook série F, Dell Inspiron série, ou o Acer Aspire 3 série.
Mais análises da Lenovo:
Potential Competitors in Comparison
Avaliação | Data | Modelo | Peso | Altura | Size | Resolução | Preço |
|---|---|---|---|---|---|---|---|
| 80.4 % v7 (old) | 12/2021 | Lenovo IdeaPad 3 15ALC6 R3 5300U, Vega 6 | 1.7 kg | 19.9 mm | 15.60" | 1920x1080 | |
| 83 % v7 (old) | 07/2020 | Lenovo IdeaPad 5 15IIL05 i5-1035G1, GeForce MX350 | 1.7 kg | 17.9 mm | 15.60" | 1920x1080 | |
| 81.4 % v7 (old) | 01/2020 | Lenovo Ideapad S540-15IML i5-10210U, GeForce MX250 | 1.9 kg | 17 mm | 15.60" | 1920x1080 | |
| 80.5 % v7 (old) | 10/2021 | Dell Inspiron 15 3501 i7-1165G7, Iris Xe G7 96EUs | 2 kg | 19.9 mm | 15.60" | 1920x1080 | |
| 81.2 % v7 (old) | 06/2021 | HP Pavilion 15-eg i7-1165G7, GeForce MX450 | 1.7 kg | 17.9 mm | 15.60" | 1920x1080 | |
| 80.5 % v7 (old) | 11/2021 | Asus VivoBook 15 KM513UA-L503TS R5 5500U, Vega 7 | 1.8 kg | 18.6 mm | 15.60" | 1920x1080 |
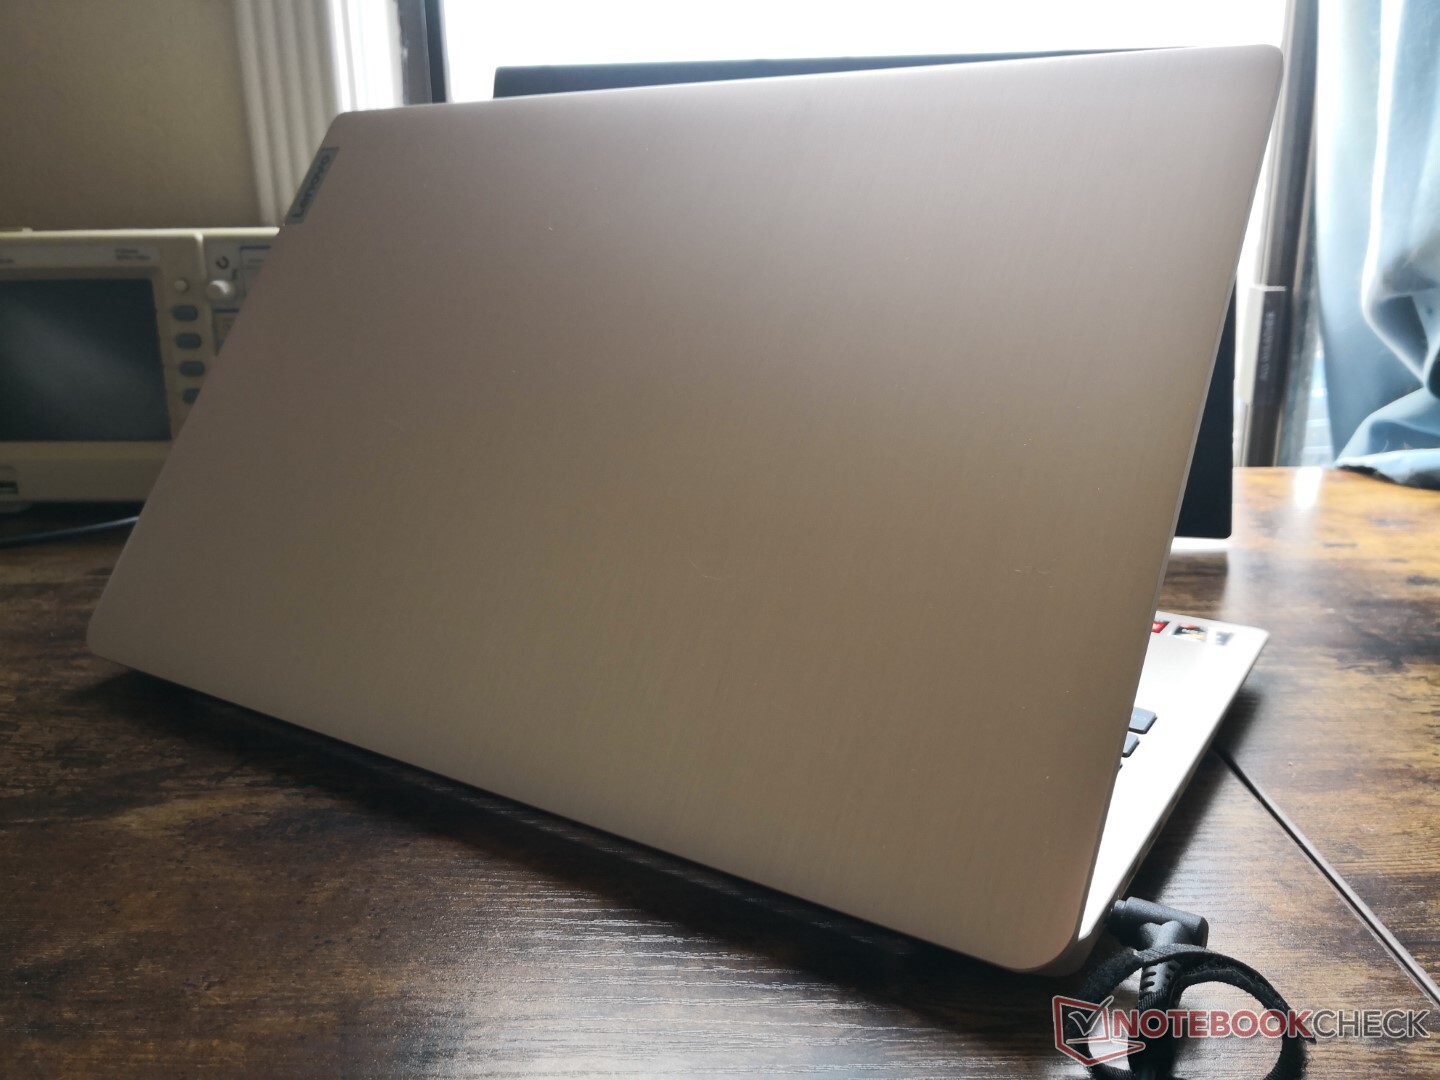
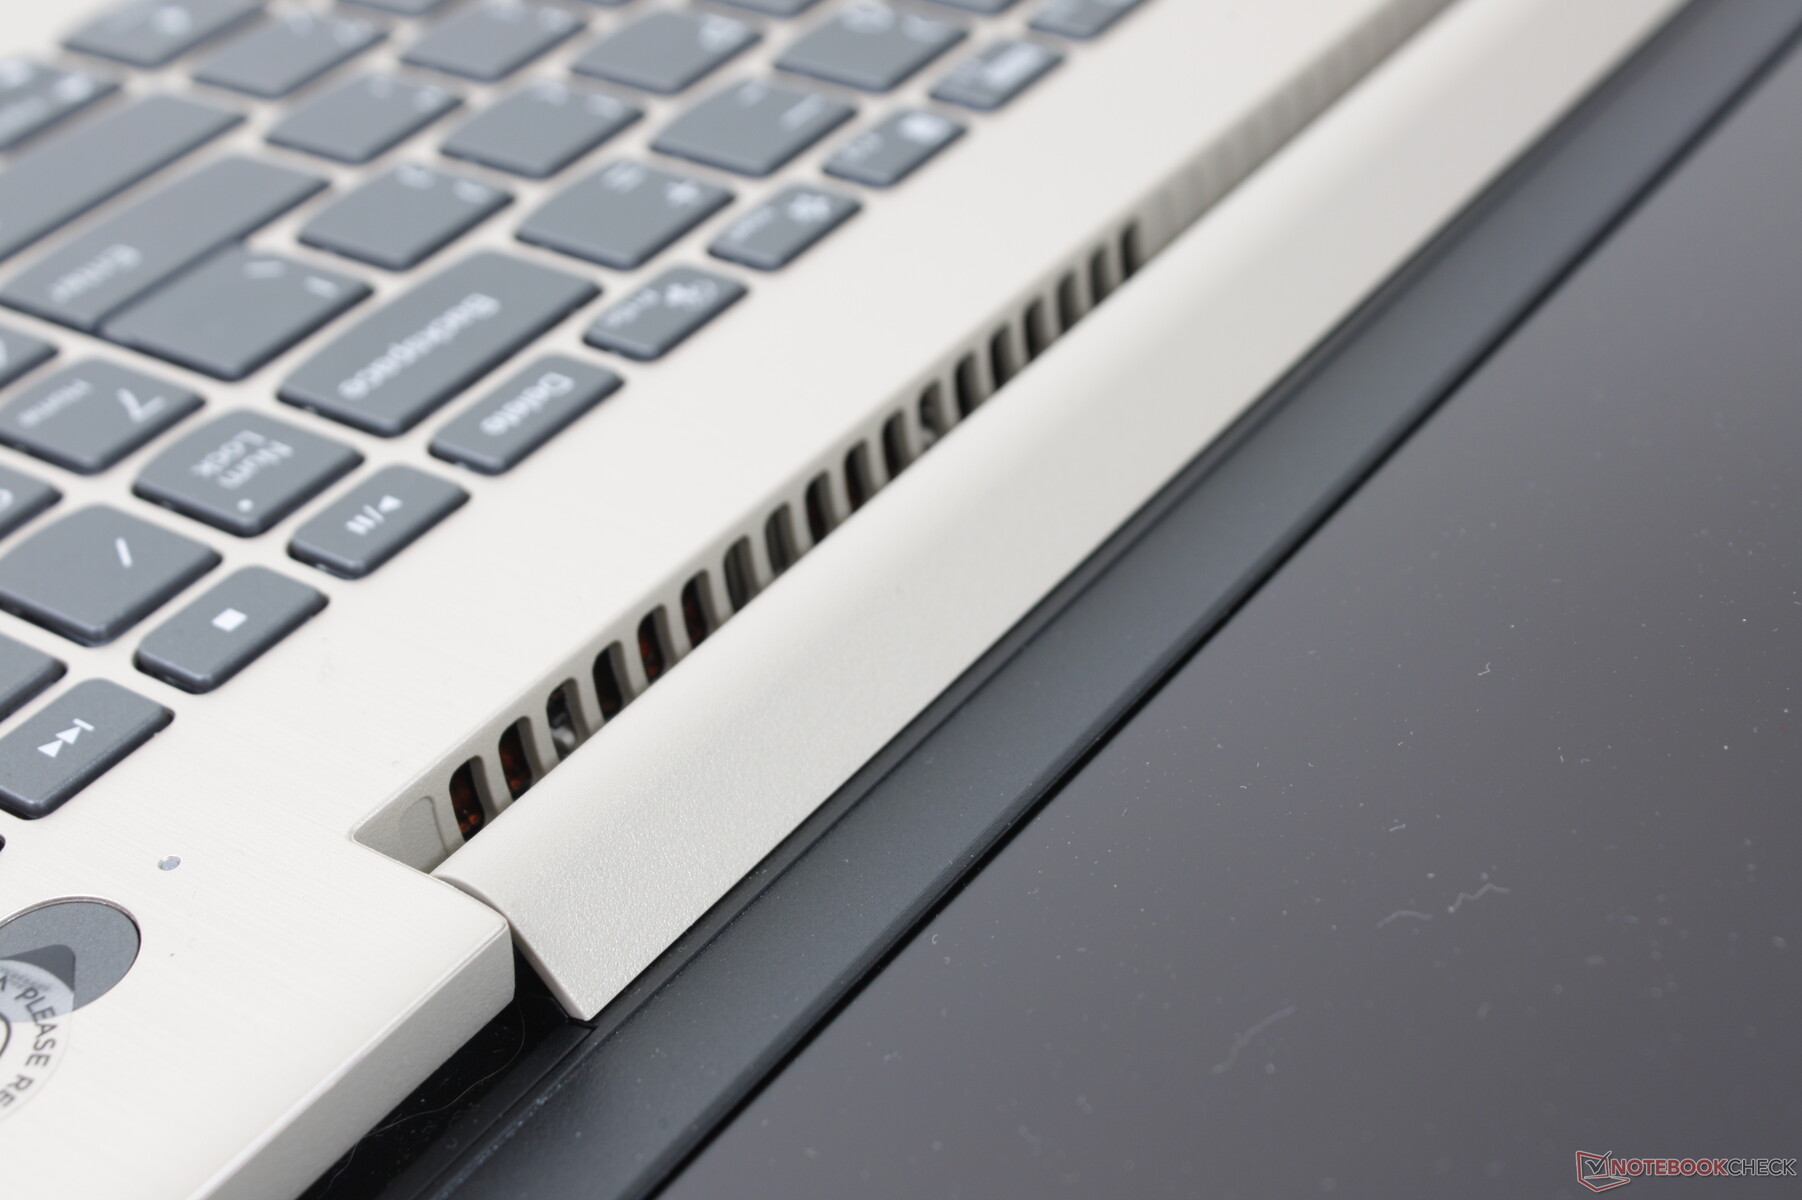
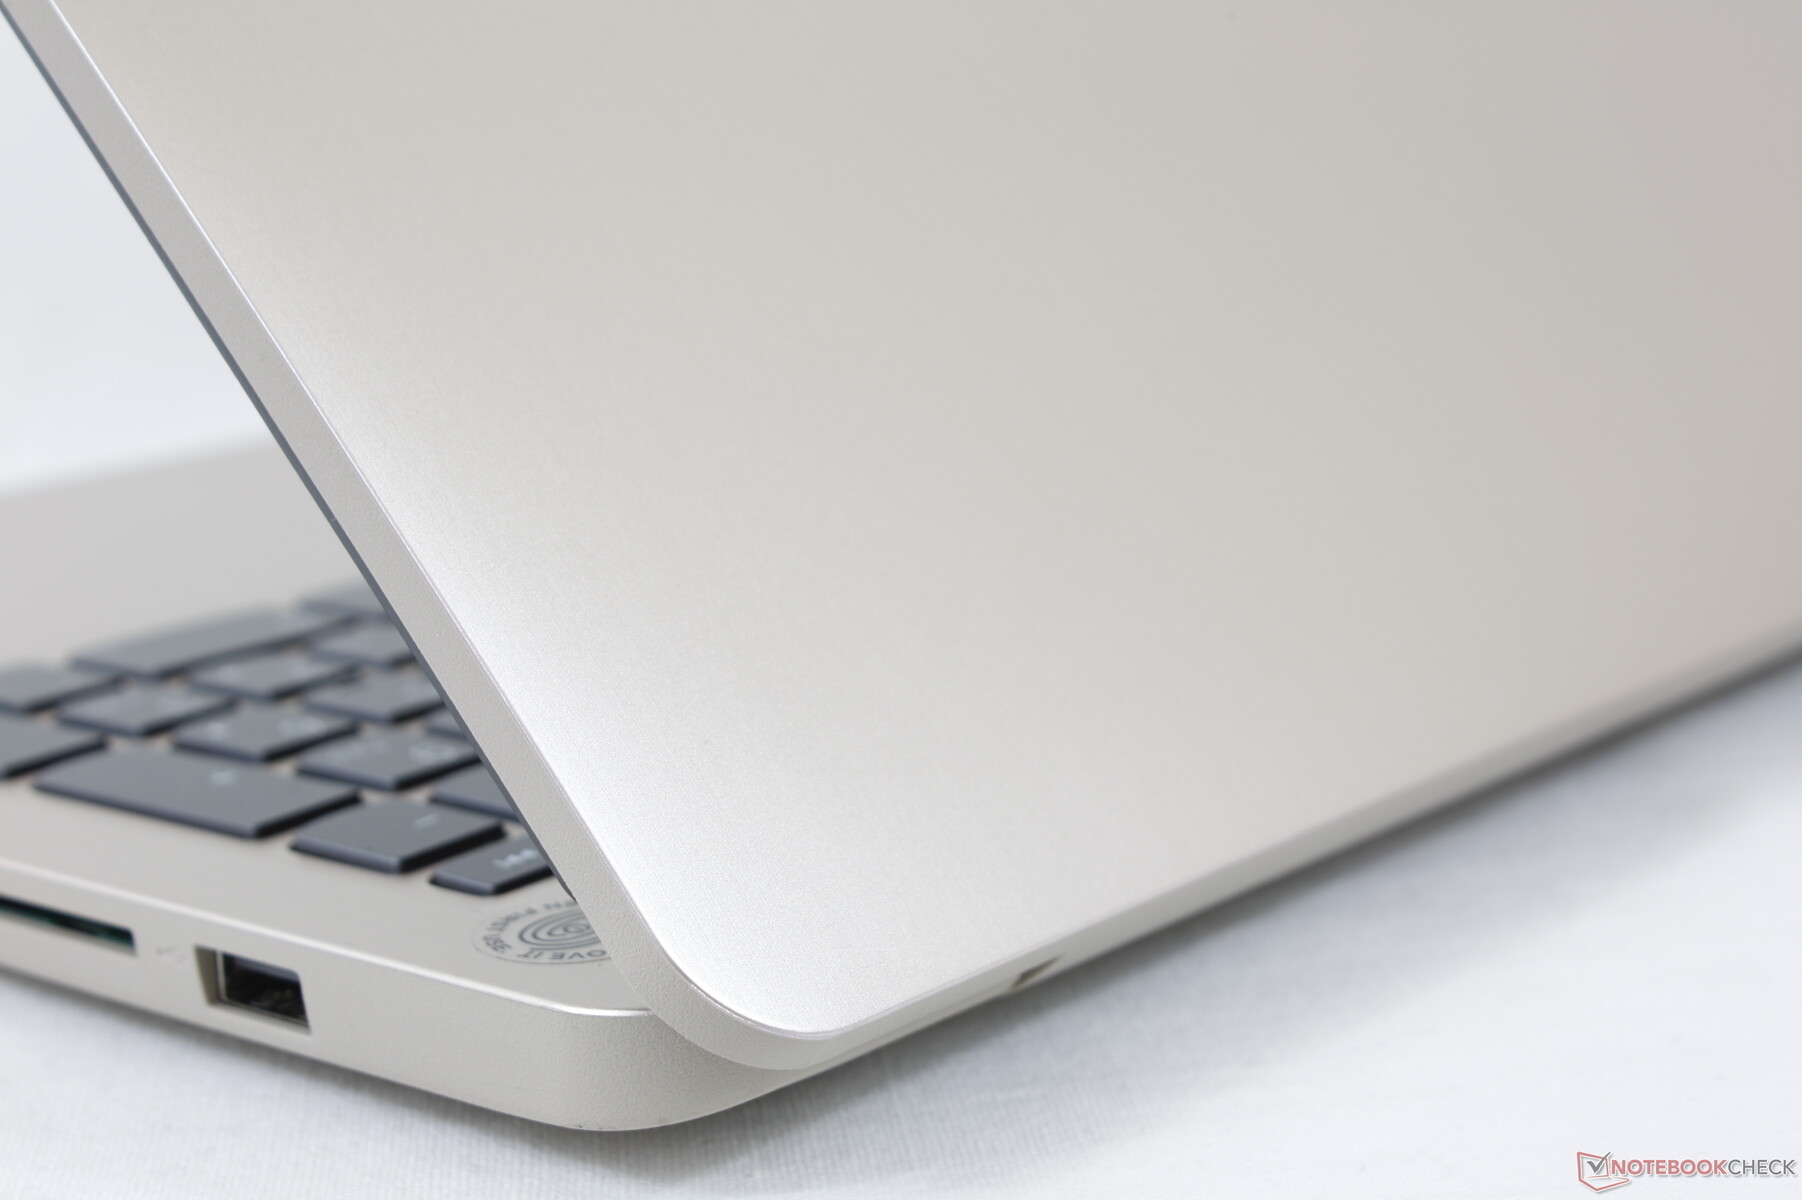
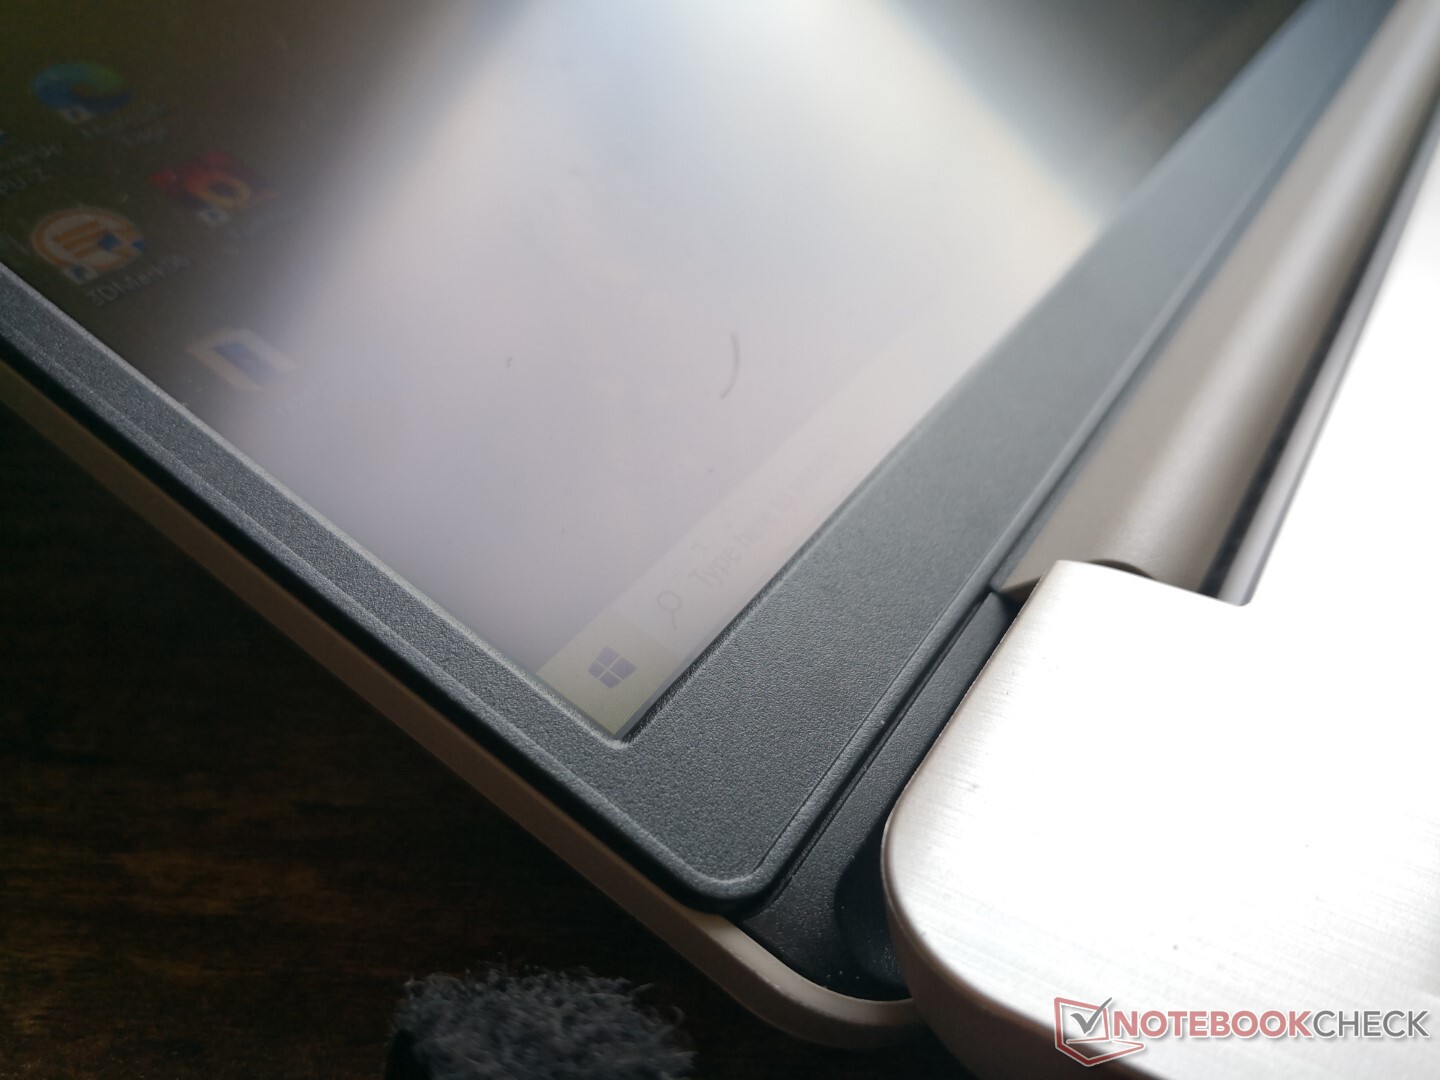
Estojo - Aparência Barata
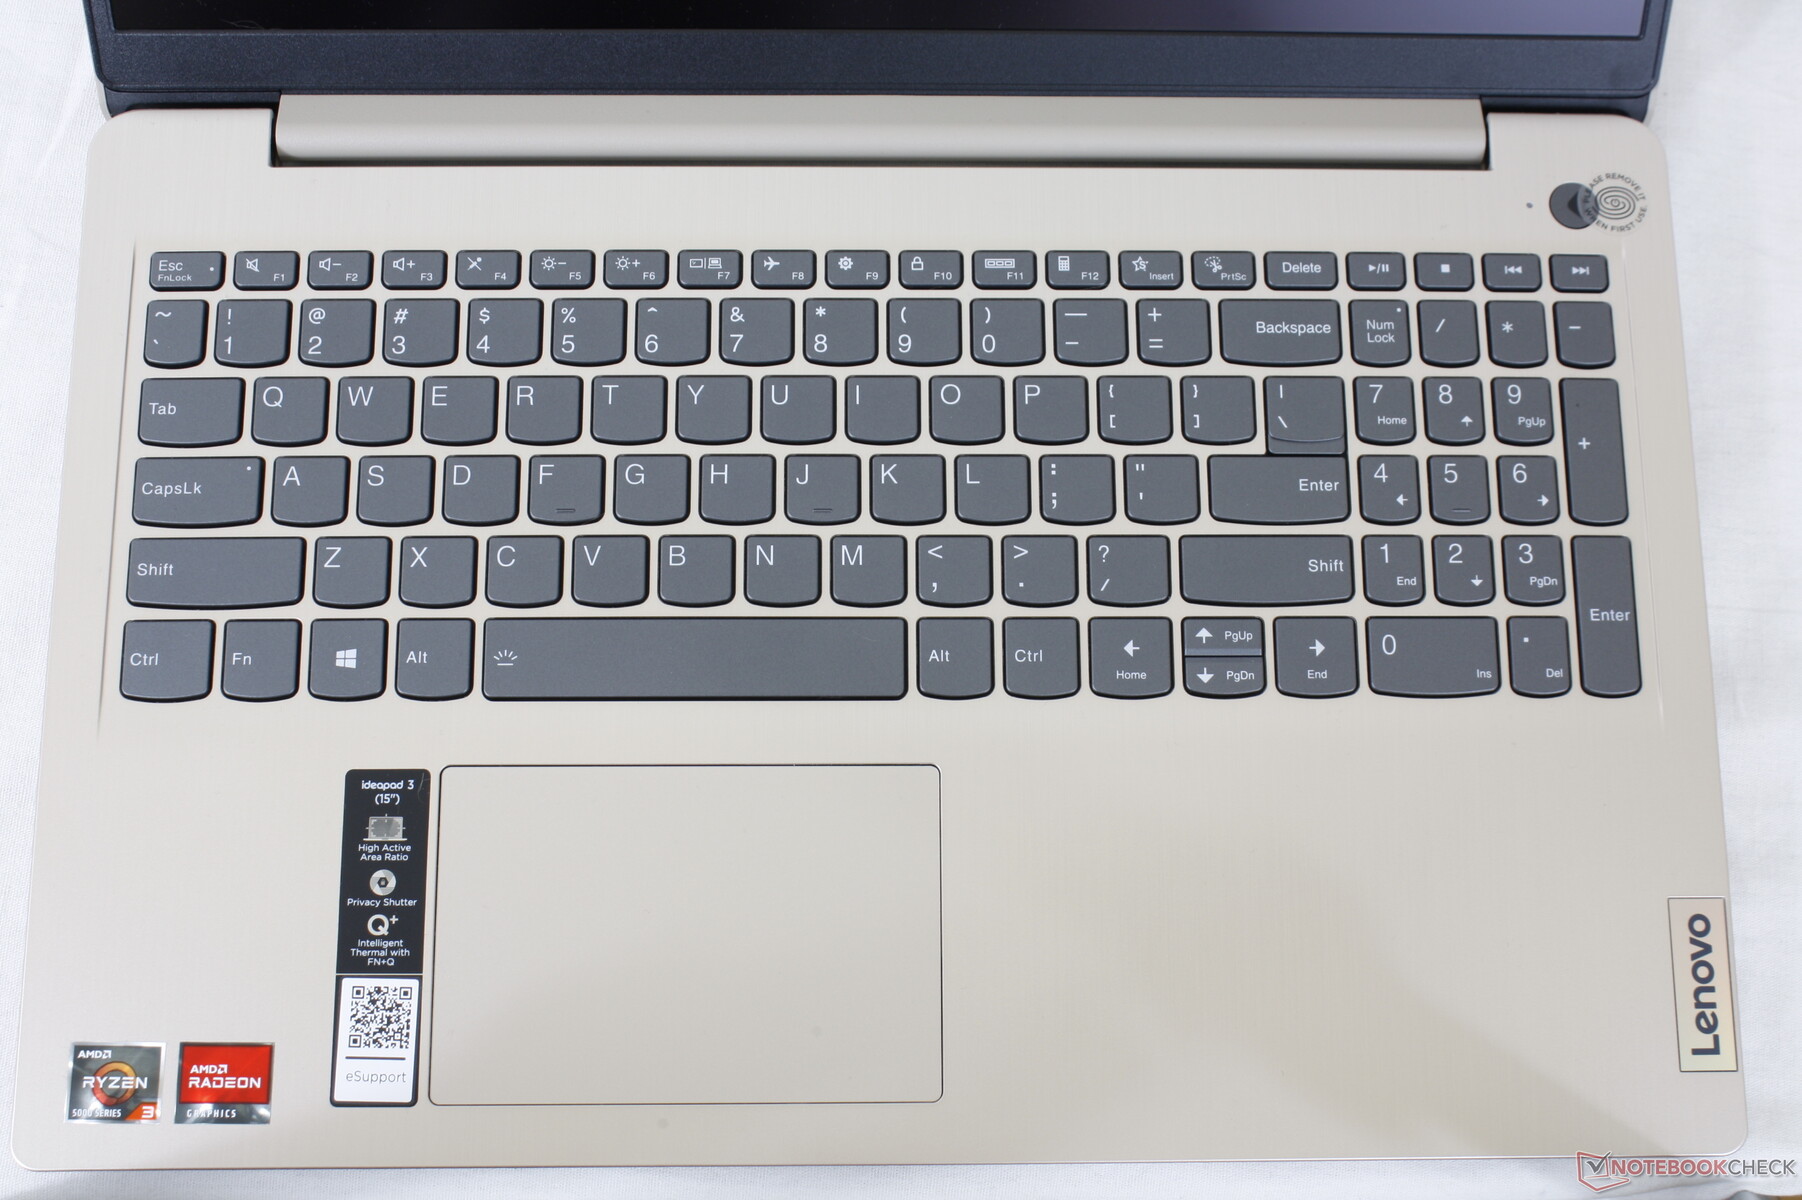
O teclado e a tampa externa utilizam alumínio escovado para melhorar a estética. No entanto, o chassi apresenta tanto flexionamento quanto rangidos leves, mas audíveis também. A rigidez geral é ligeiramente pior que a da HP concorrente Pavilion 15 ou dos modelos Asus VivoBook 15.
O tamanho e as dimensões do chassi são quase idênticos aos do Pavilion 15 e VivoBook 15, o que significa que os usuários não receberão nenhum peso ou benefícios de viagem ao escolherem a Lenovo. O Inspiron 3501 é notavelmente maior e mais pesada do que as três.
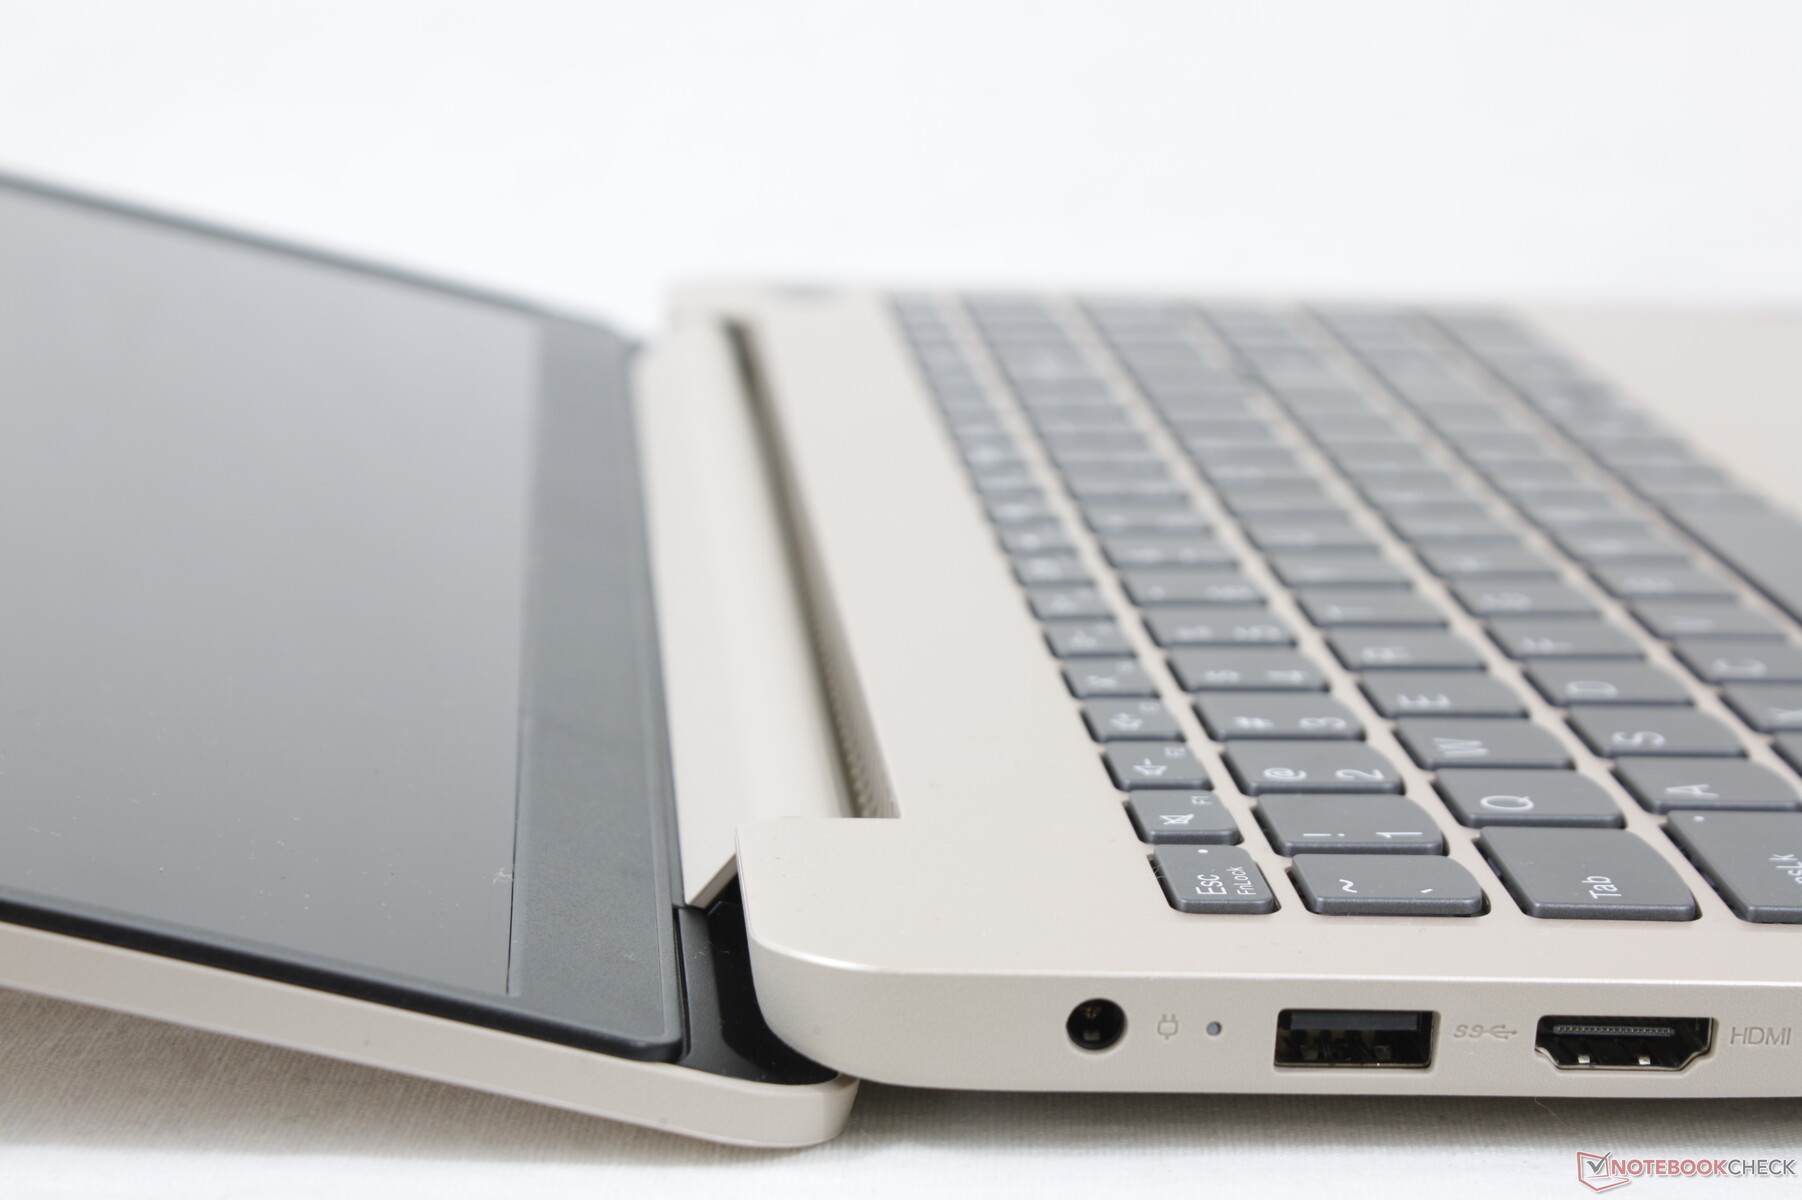
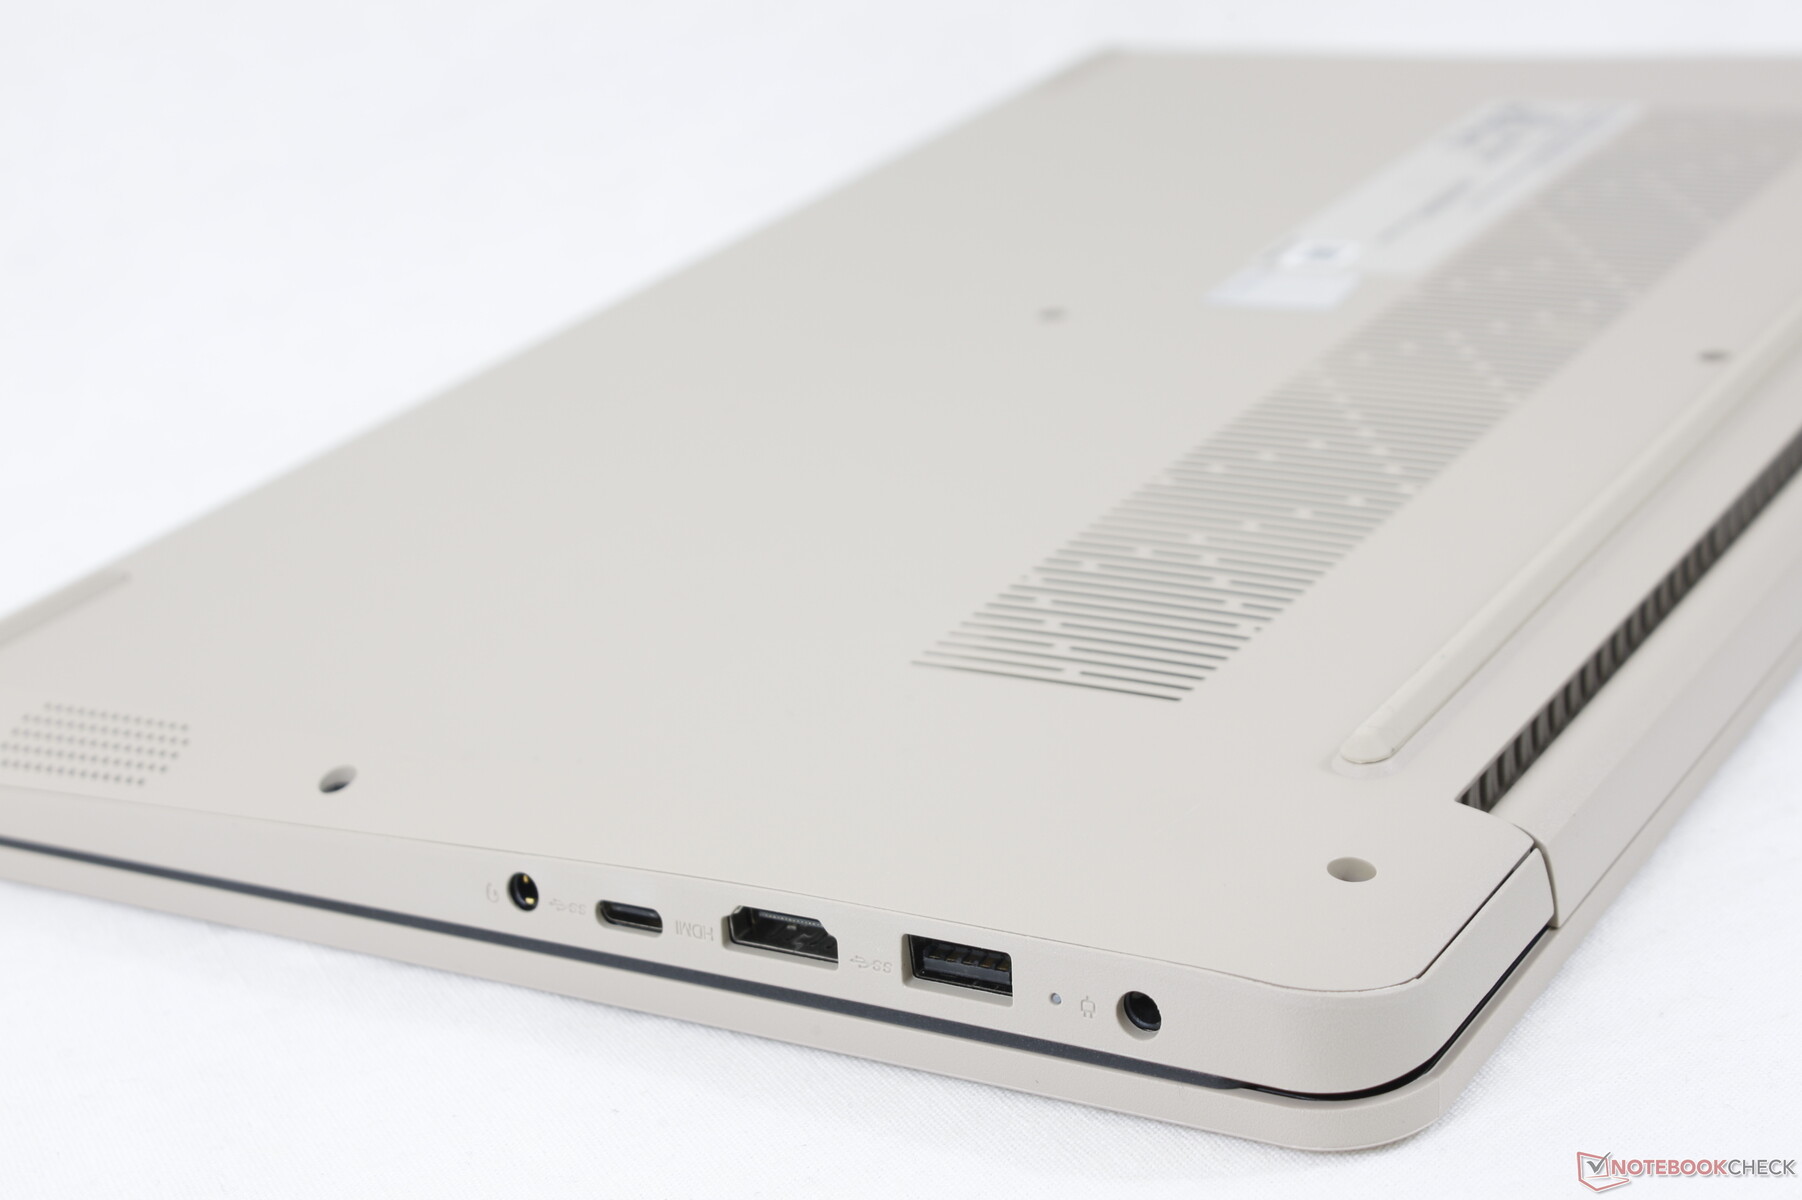
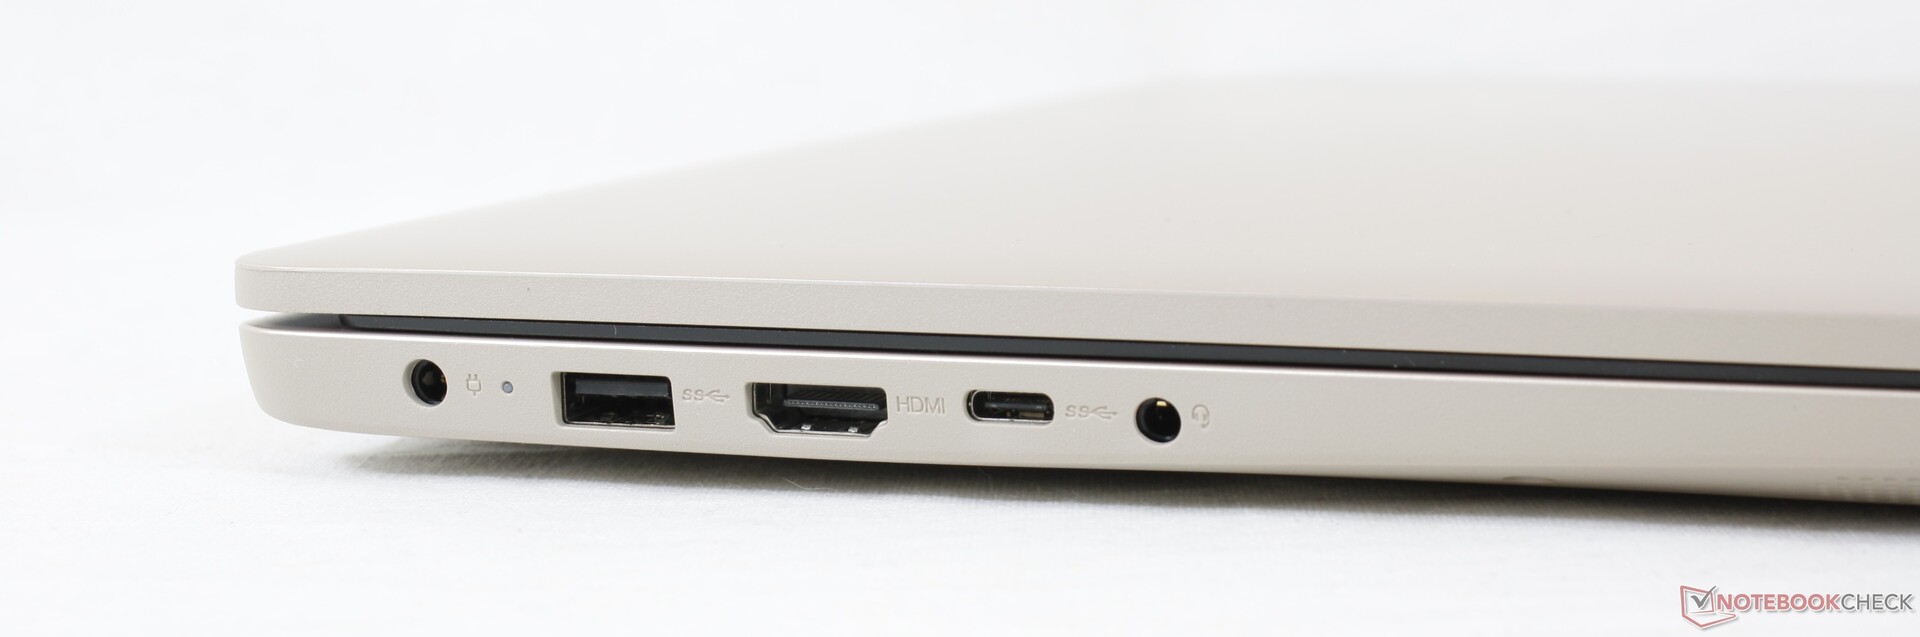
Conectividade - Porta USB-C Neutered
As opções de porta e o posicionamento são ambos diferentes do que você encontrará em outros laptops IdeaPad como o IdeaPad S340, IdeaPad 3 14,IdeaPad S540ou o IdeaPad 5 15. Talvez o mais importante a ter em mente é que a única porta USB-C não suporta Power Delivery ou DisplayPort ao contrário das portas USB-C na maioria dos laptops Intel. Em vez disso, a saída de vídeo deve ser feita via HDMI.
Vale mencionar que tivemos problemas de energia ao tentar conectar nosso SSD externo PNY Pro Elite à porta USB-C. Não temos certeza se isto é específico para nossa unidade ou se é um problema mais generalizado.
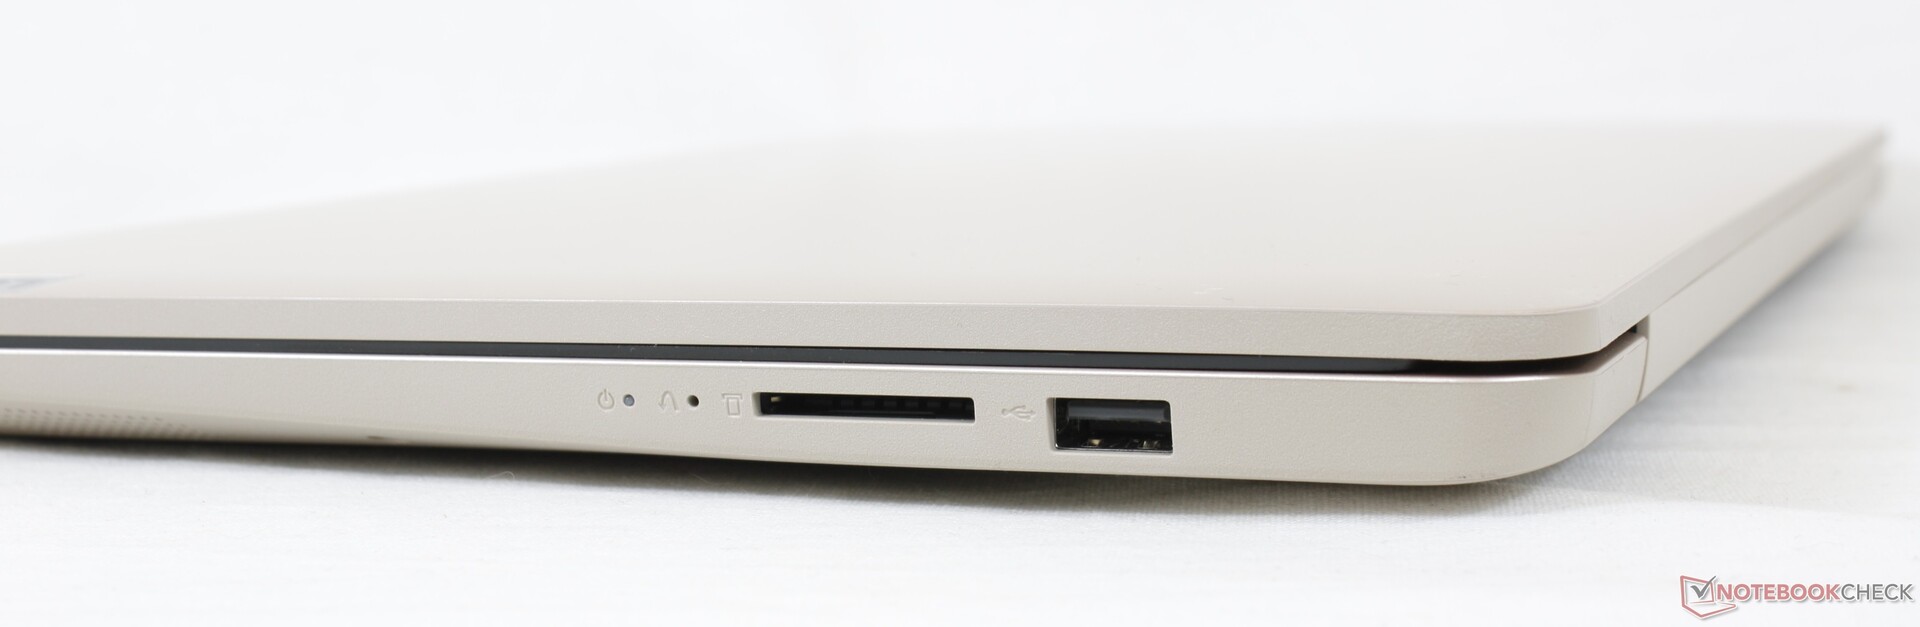
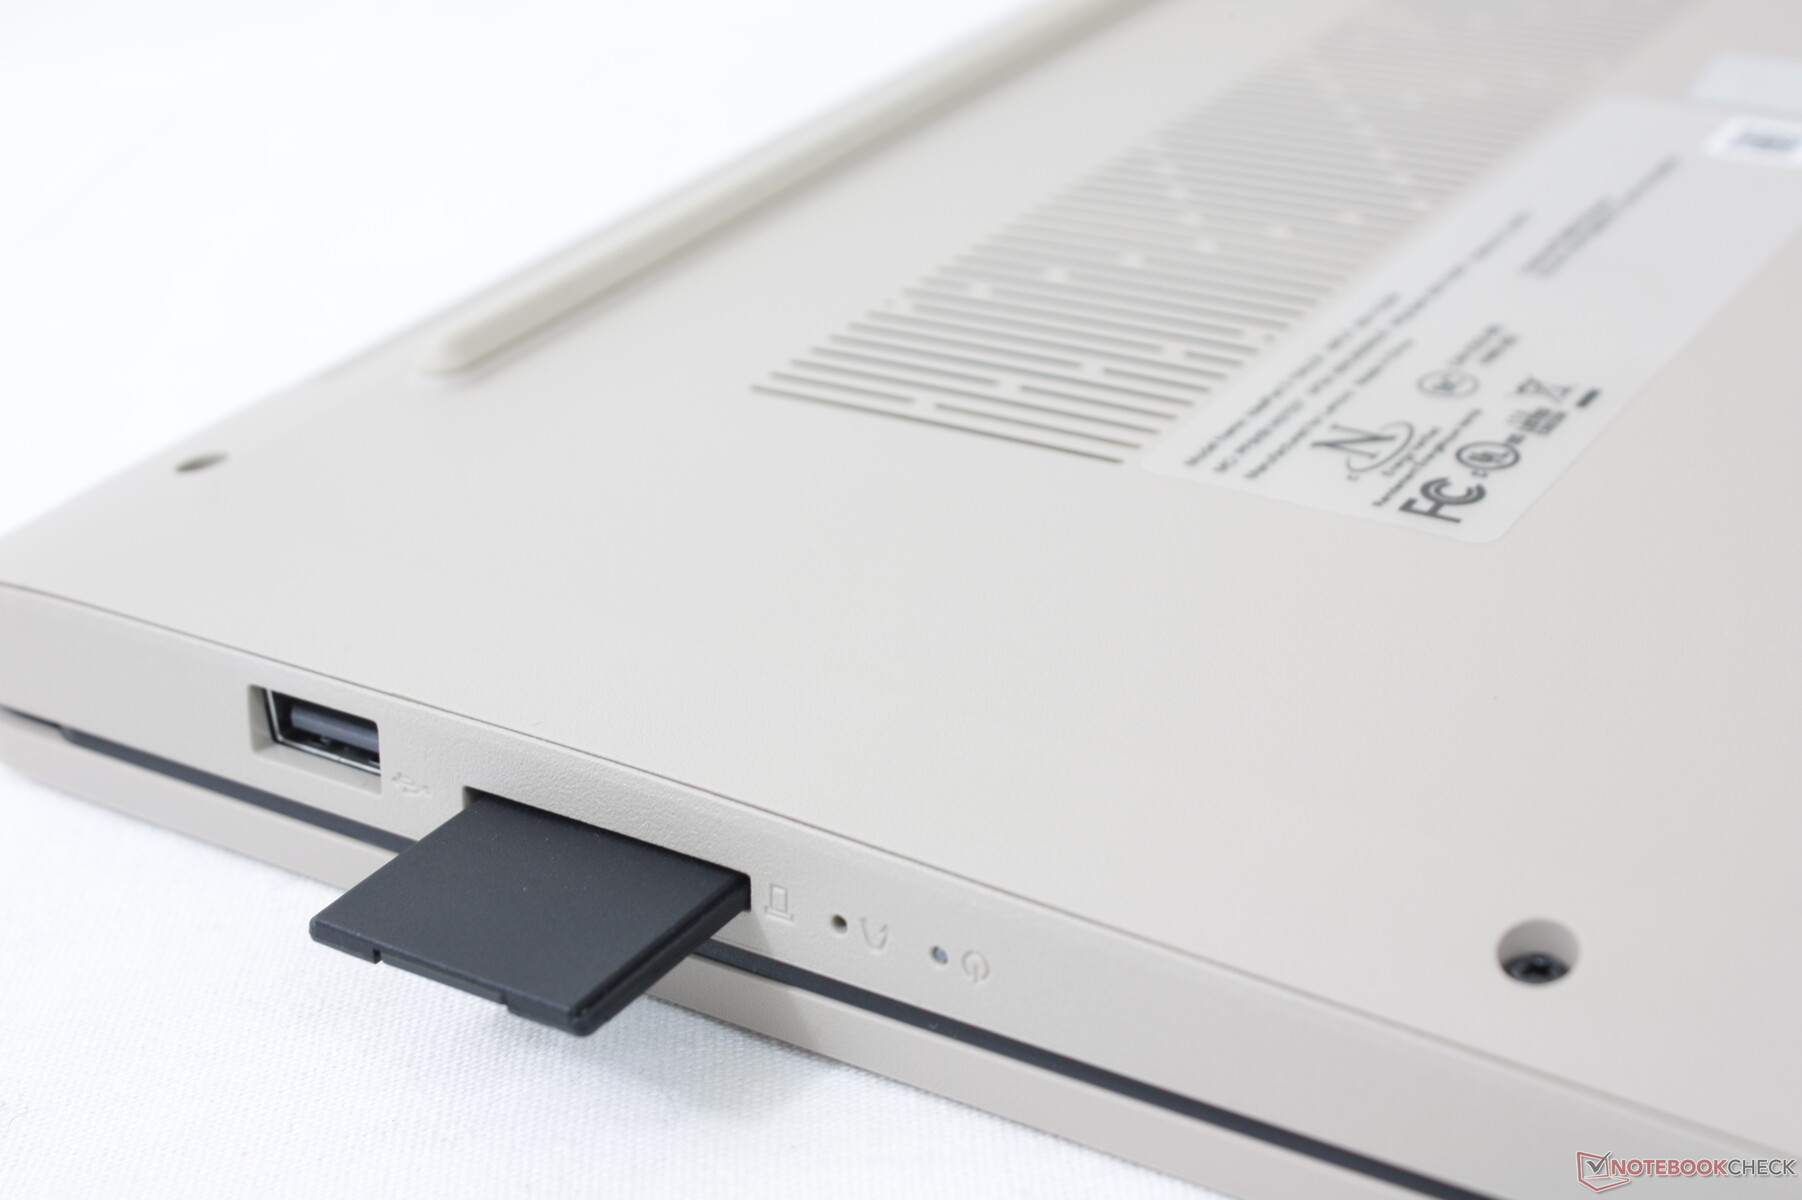
Leitor de cartões SD
O leitor de cartões SD integrado é lento. A transferência de 1 GB de imagens de nosso cartão de teste UHS-II para a área de trabalho leva cerca de 36 segundos, em comparação com cerca da metade do que está no site Pavilion 15. O leitor de cartões também não está carregado por mola e, portanto, os cartões totalmente inseridos ainda se projetarão para um manuseio potencialmente inseguro.
| SD Card Reader | |
| average JPG Copy Test (av. of 3 runs) | |
| Lenovo Ideapad S540-15IML (Toshiba Exceria Pro SDXC 64 GB UHS-II) | |
| HP Pavilion 15-eg (AV PRO microSD 128 GB V60) | |
| Asus VivoBook 15 KM513UA-L503TS (AV PRO microSD 128 GB V60) | |
| Lenovo IdeaPad 3 15ALC6 (AV PRO microSD 128 GB V60) | |
| Lenovo IdeaPad 5 15IIL05 (Toshiba Exceria Pro SDXC 64 GB UHS-II) | |
| Dell Inspiron 15 3501 (AV Pro SD 128 GB V60) | |
| maximum AS SSD Seq Read Test (1GB) | |
| Lenovo Ideapad S540-15IML (Toshiba Exceria Pro SDXC 64 GB UHS-II) | |
| HP Pavilion 15-eg (AV PRO microSD 128 GB V60) | |
| Lenovo IdeaPad 3 15ALC6 (AV PRO microSD 128 GB V60) | |
| Asus VivoBook 15 KM513UA-L503TS (AV PRO microSD 128 GB V60) | |
| Lenovo IdeaPad 5 15IIL05 (Toshiba Exceria Pro SDXC 64 GB UHS-II) | |
| Dell Inspiron 15 3501 (AV Pro SD microSD 128 GB V60) | |
Comunicação
Nossa configuração utiliza Wi-Fi 5 em vez de Wi-Fi 6, o que provavelmente economizará em custos. As taxas de transferência são estáveis quando emparelhadas com nosso roteador de teste Netgear RAX200.
Webcam
A qualidade da webcam é ruim com apenas 1 MP. Além disso, não há sensor IR para suporte ao Windows. Um obturador manual de privacidade vem de série.


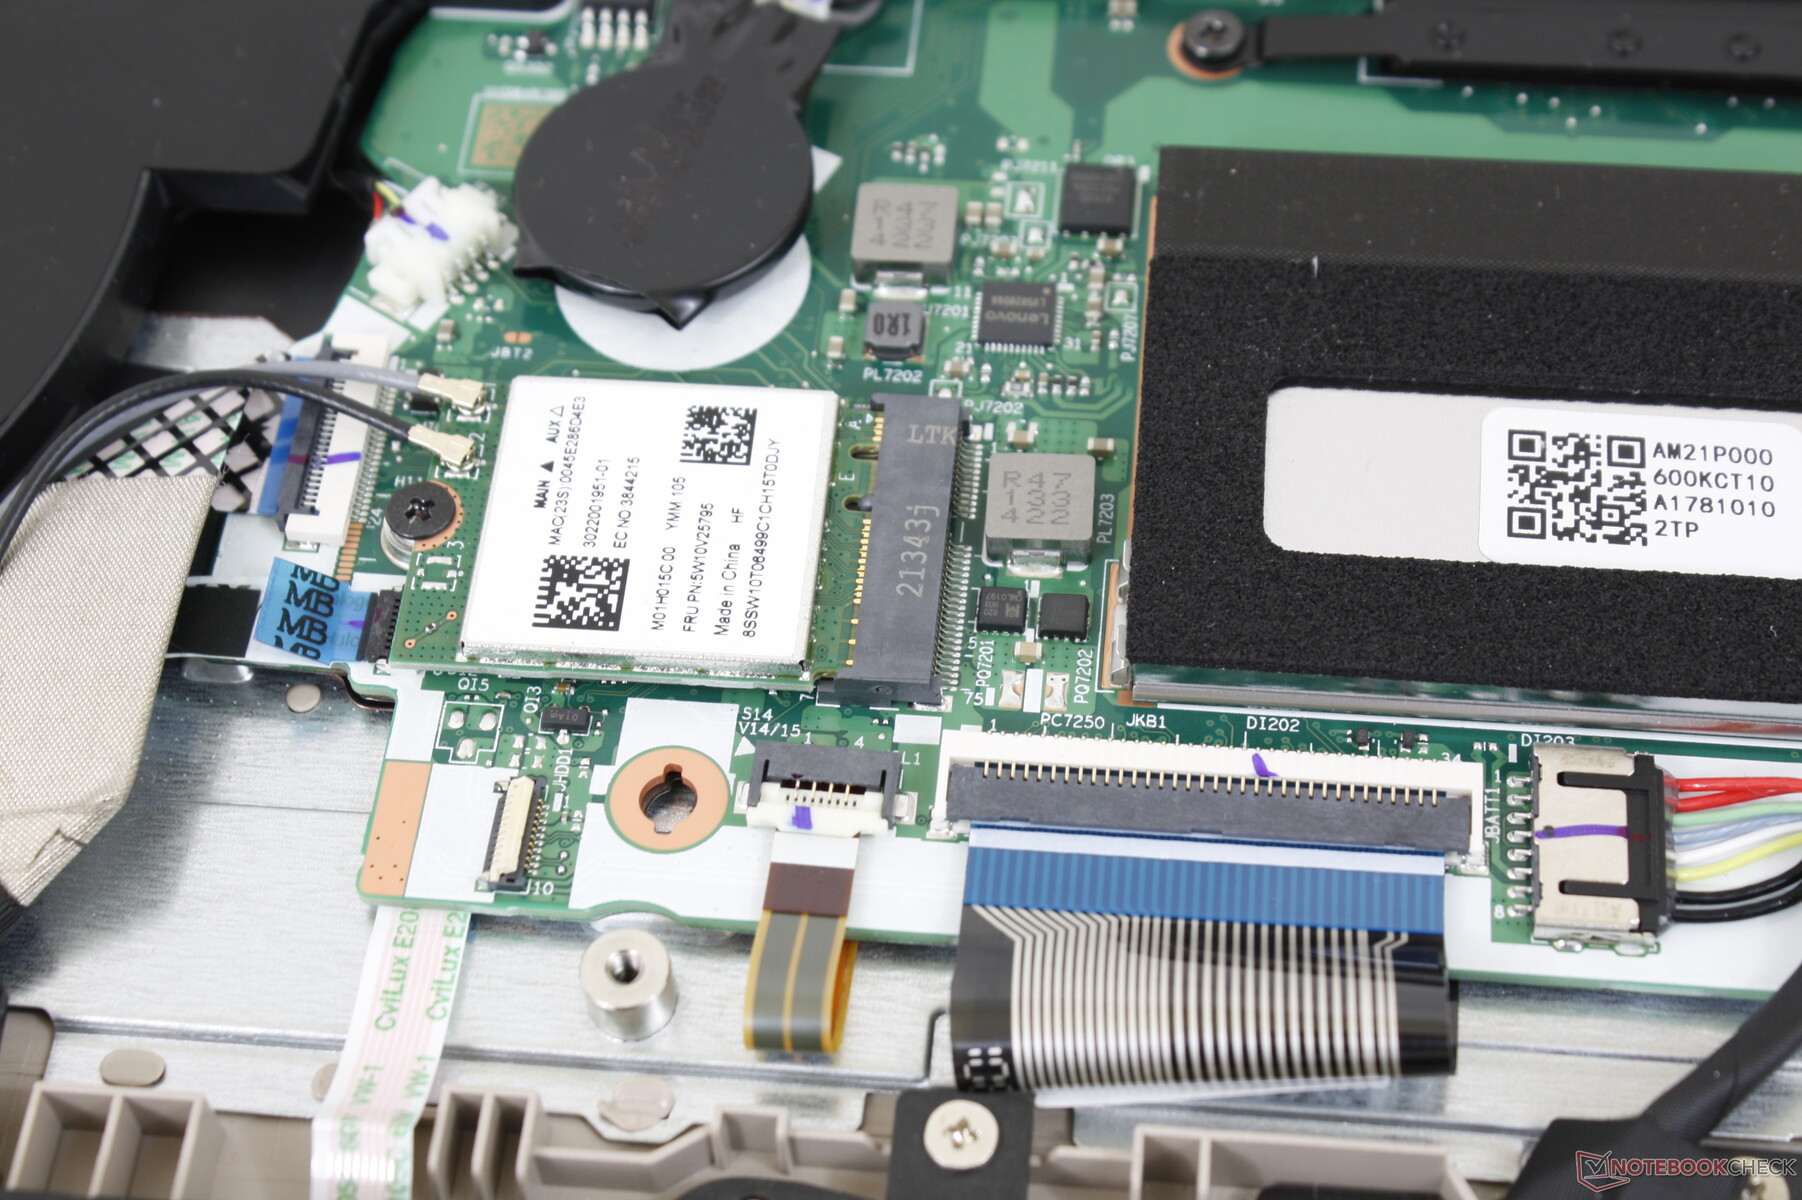
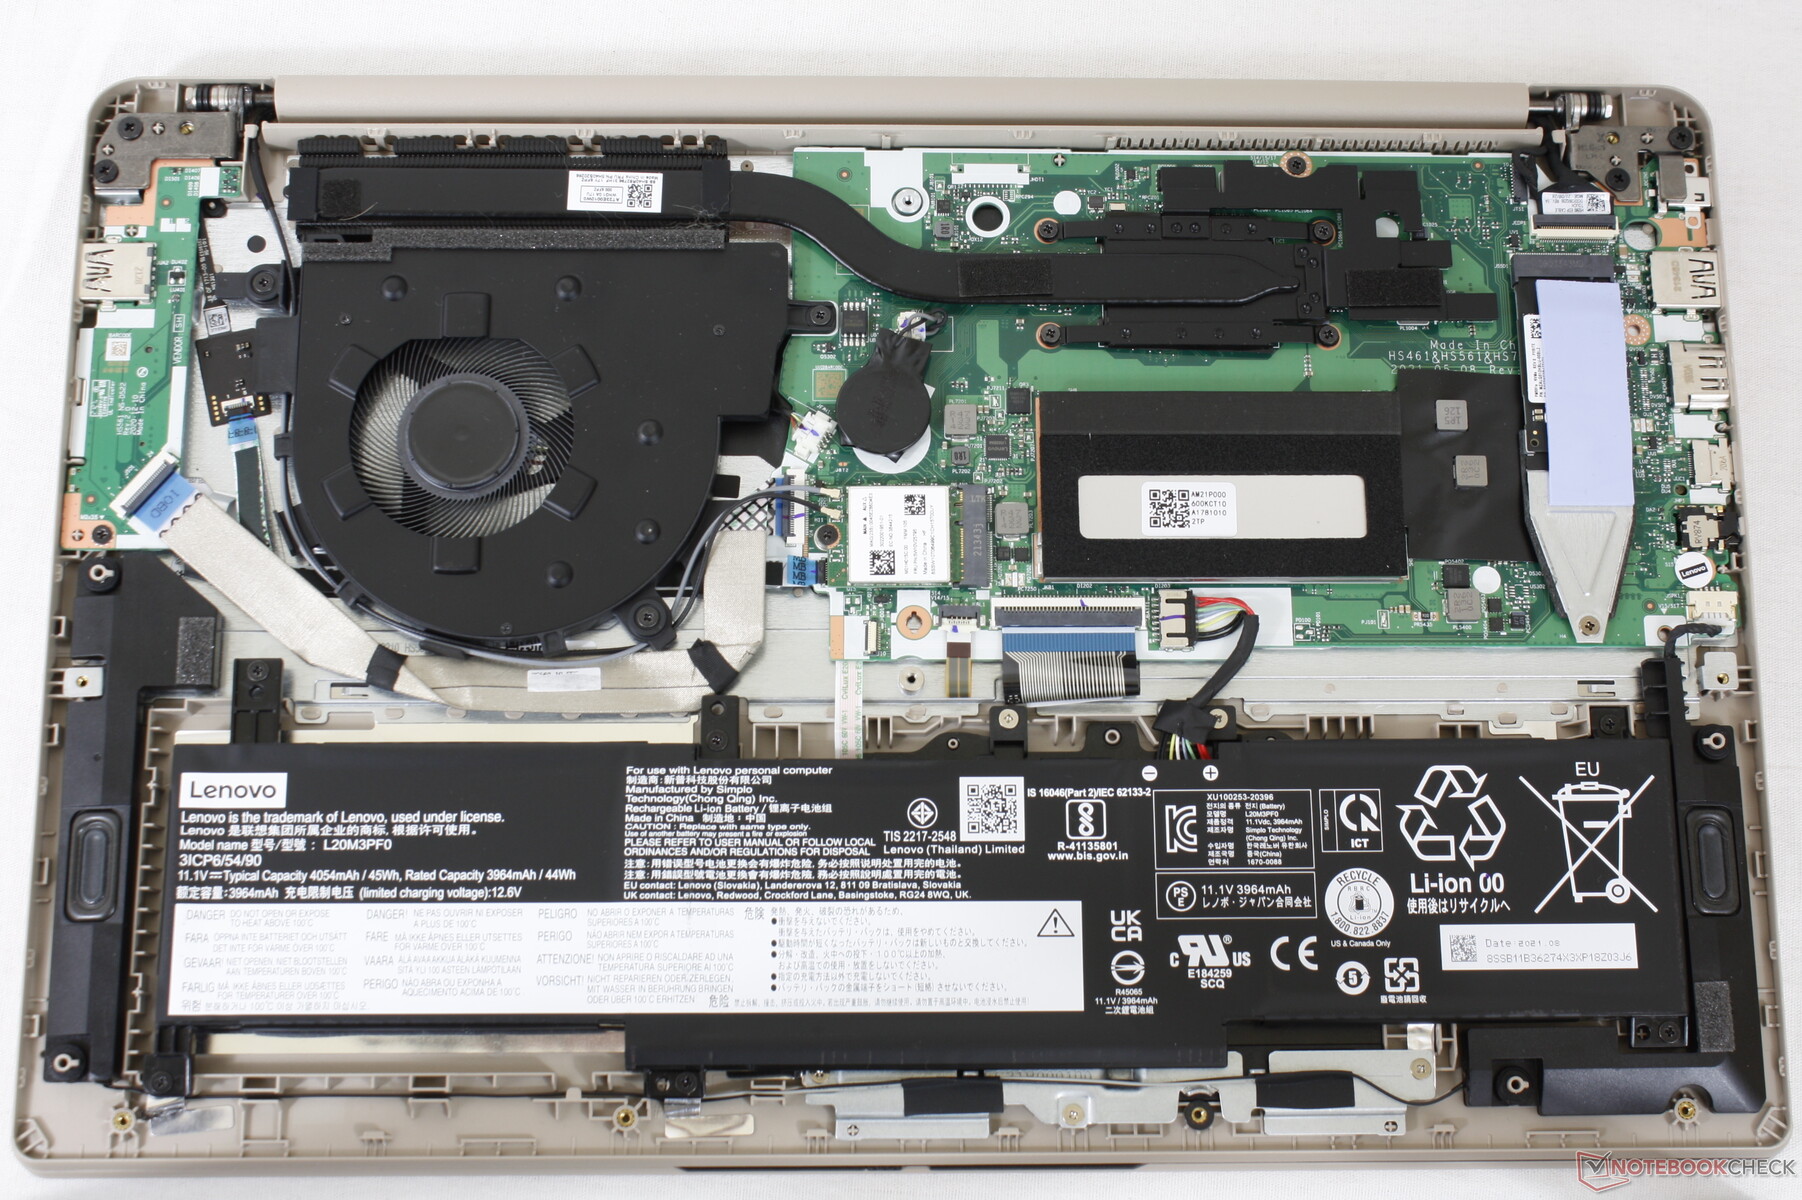
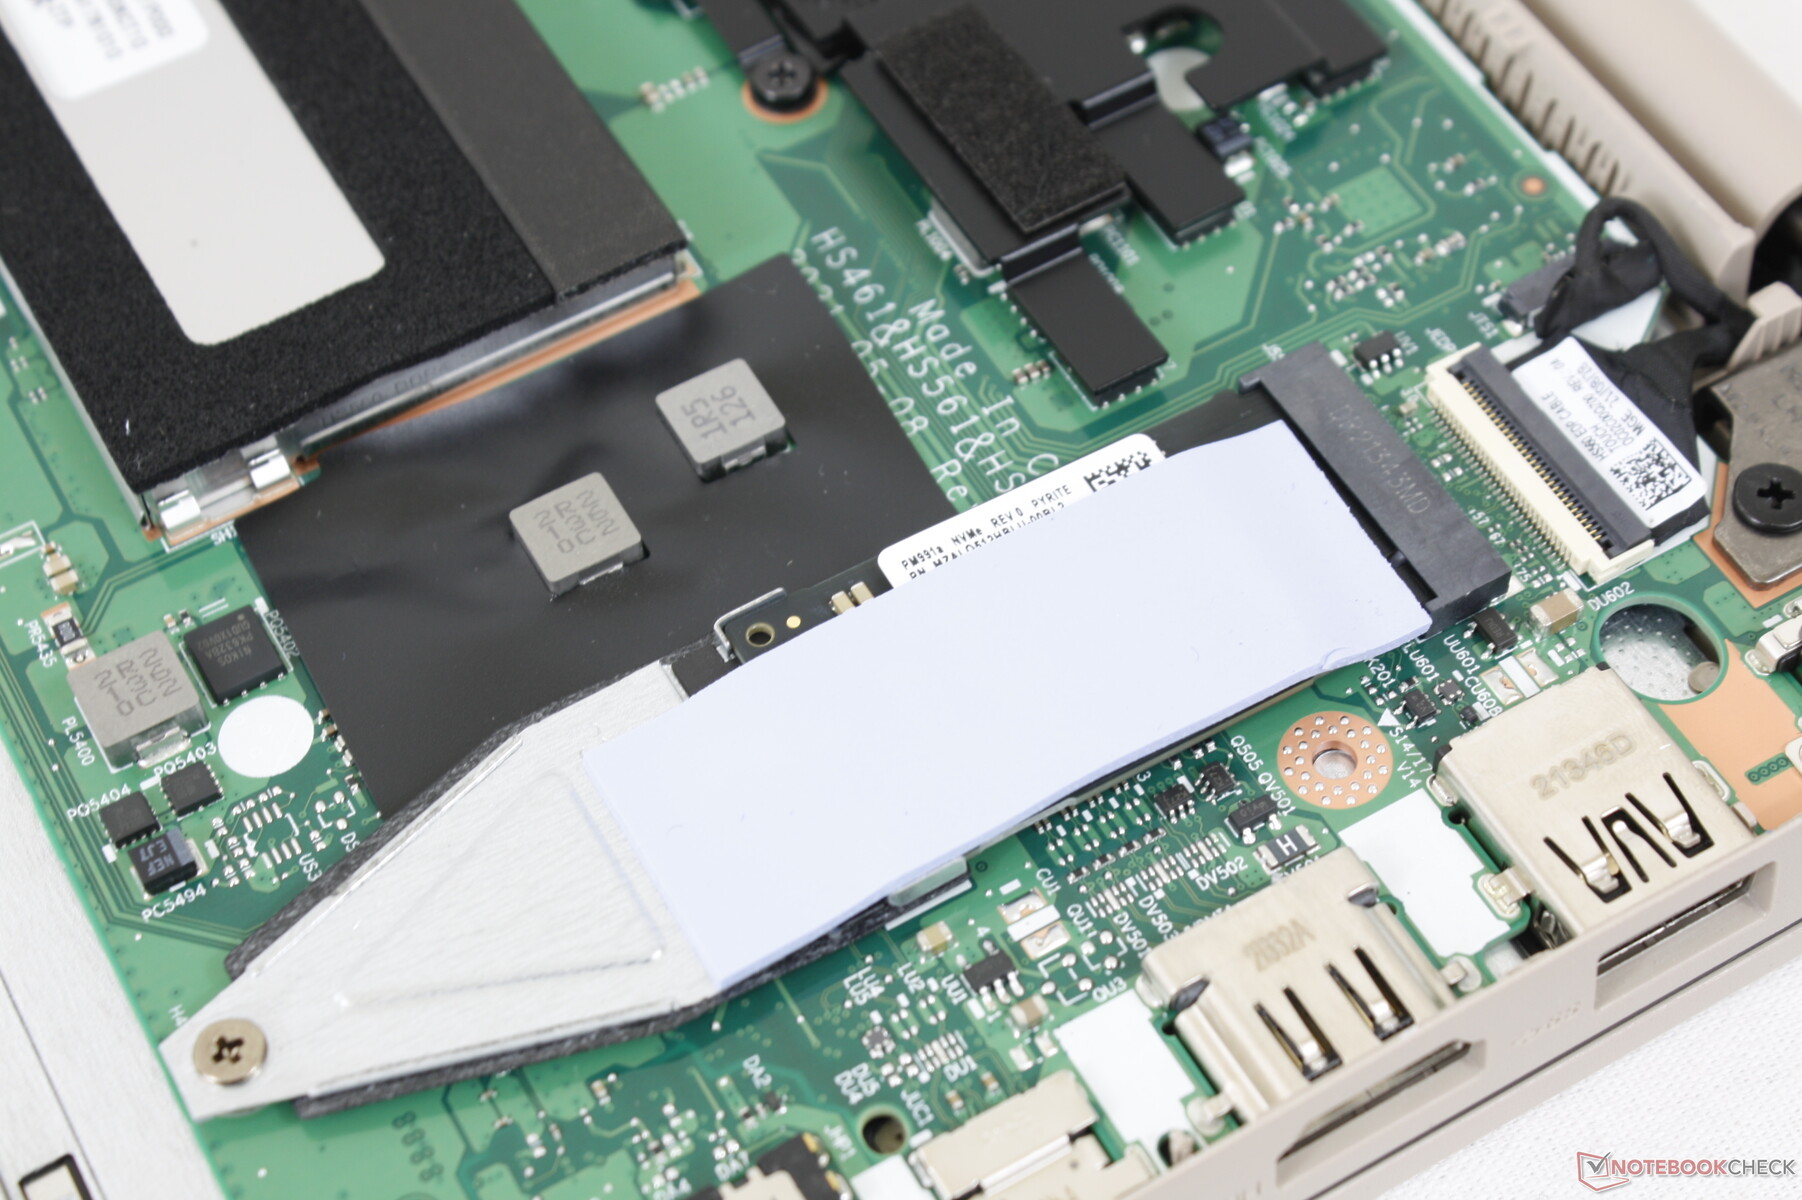
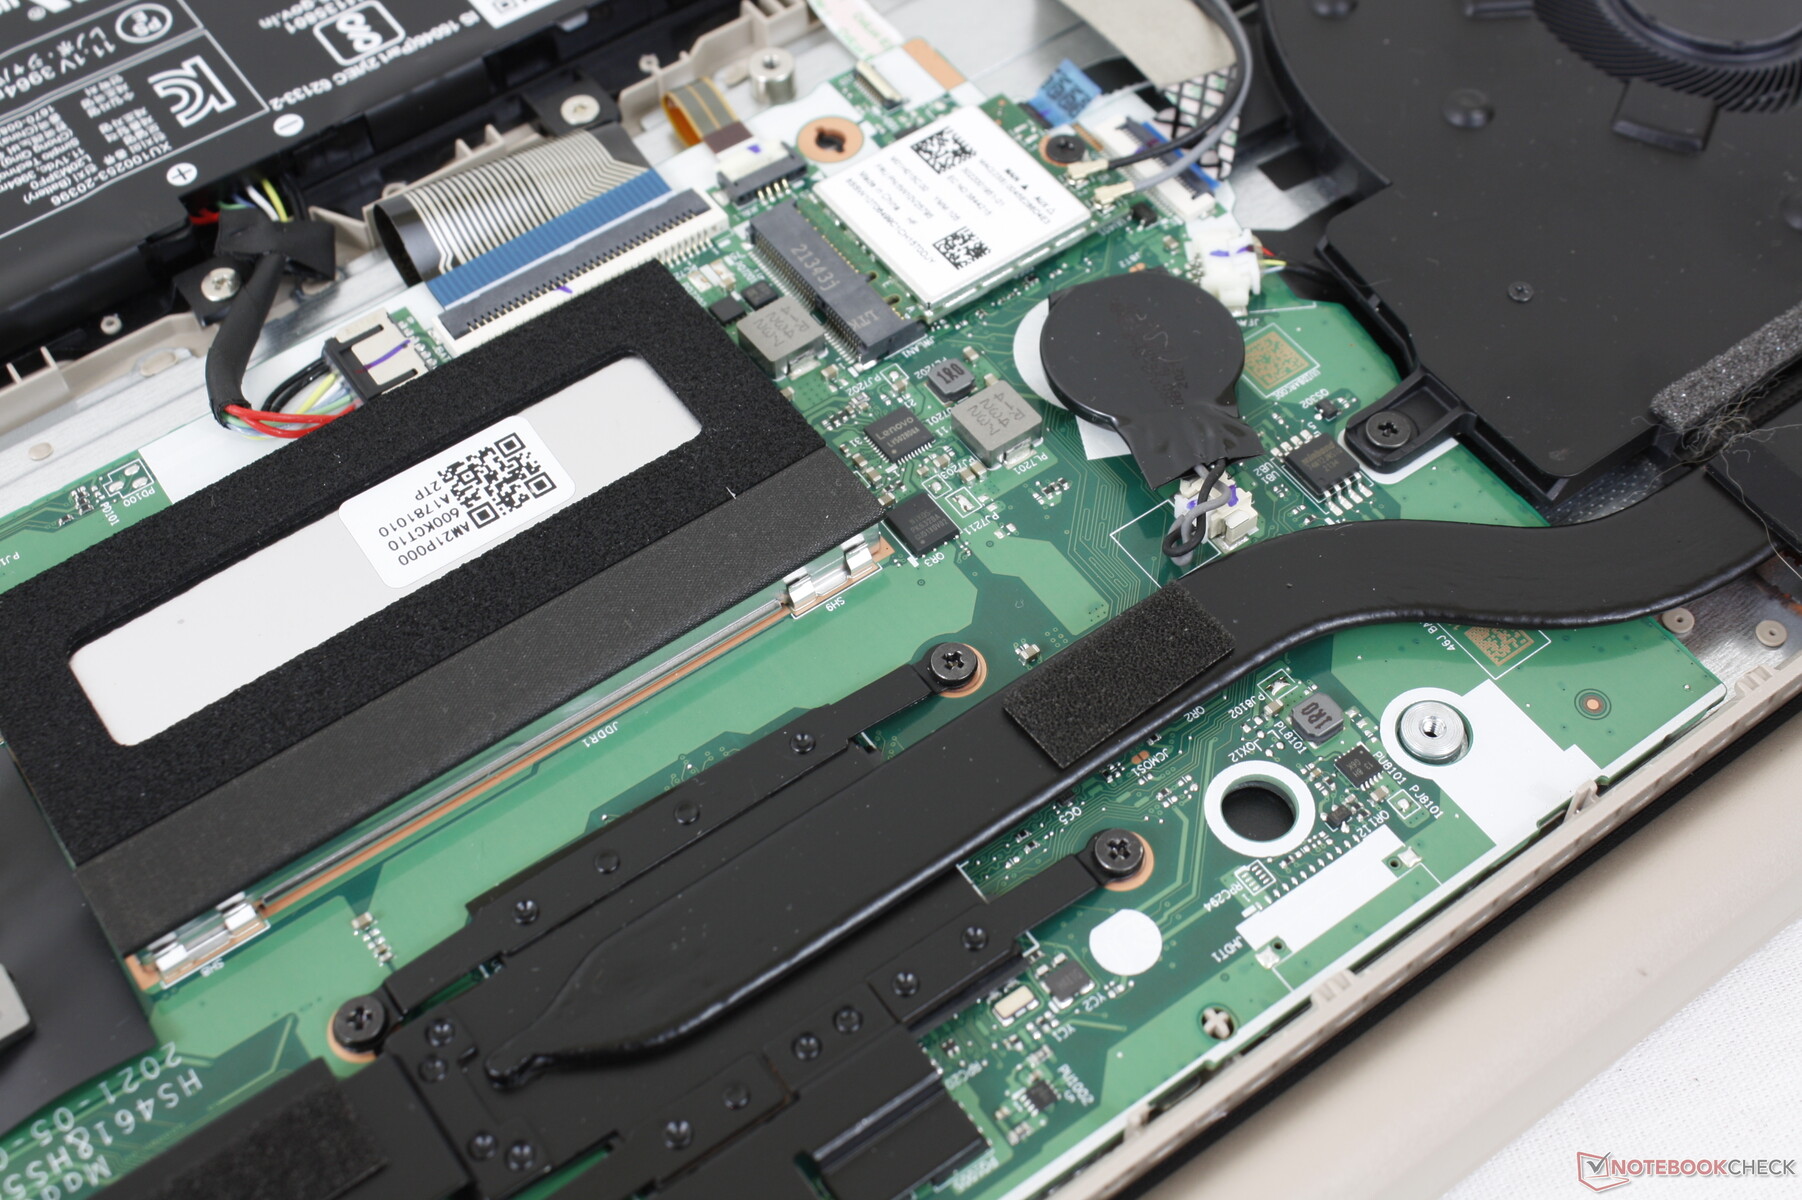
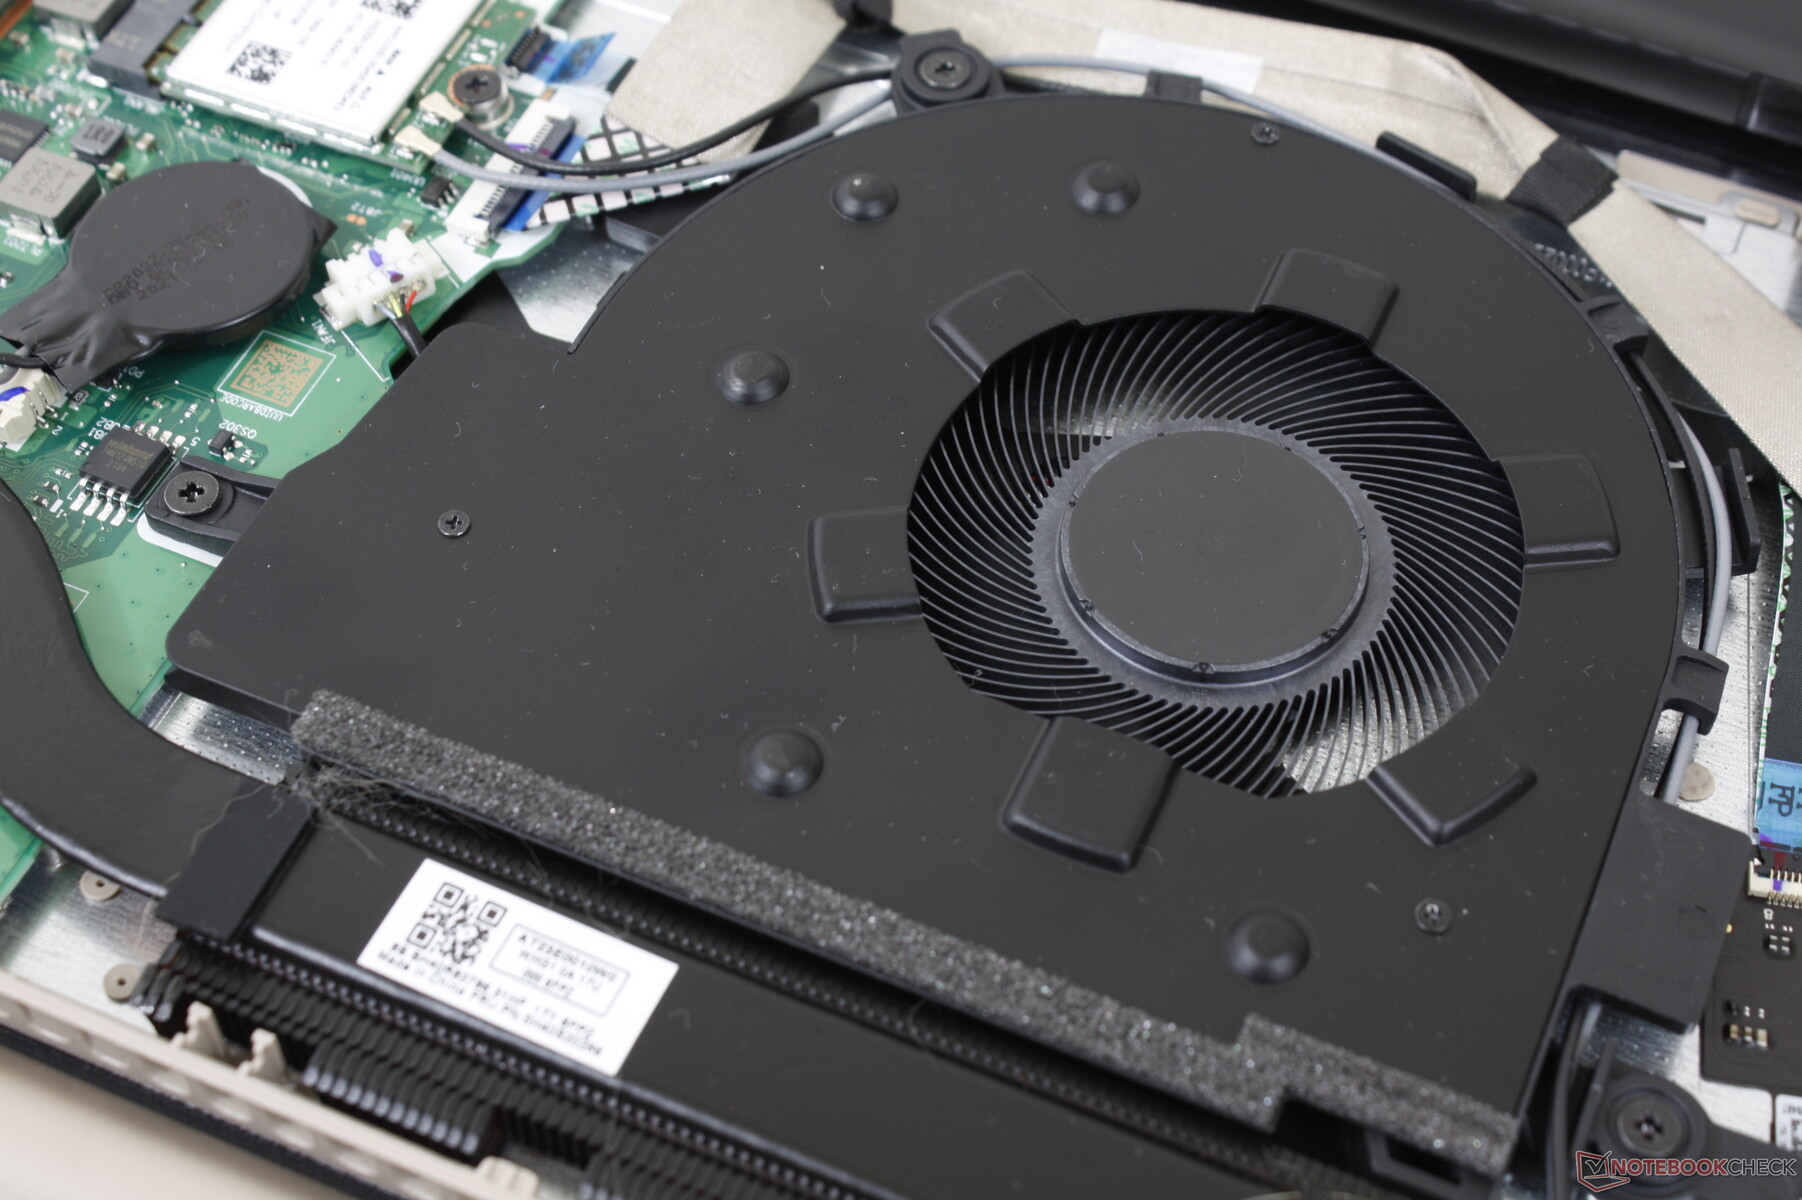
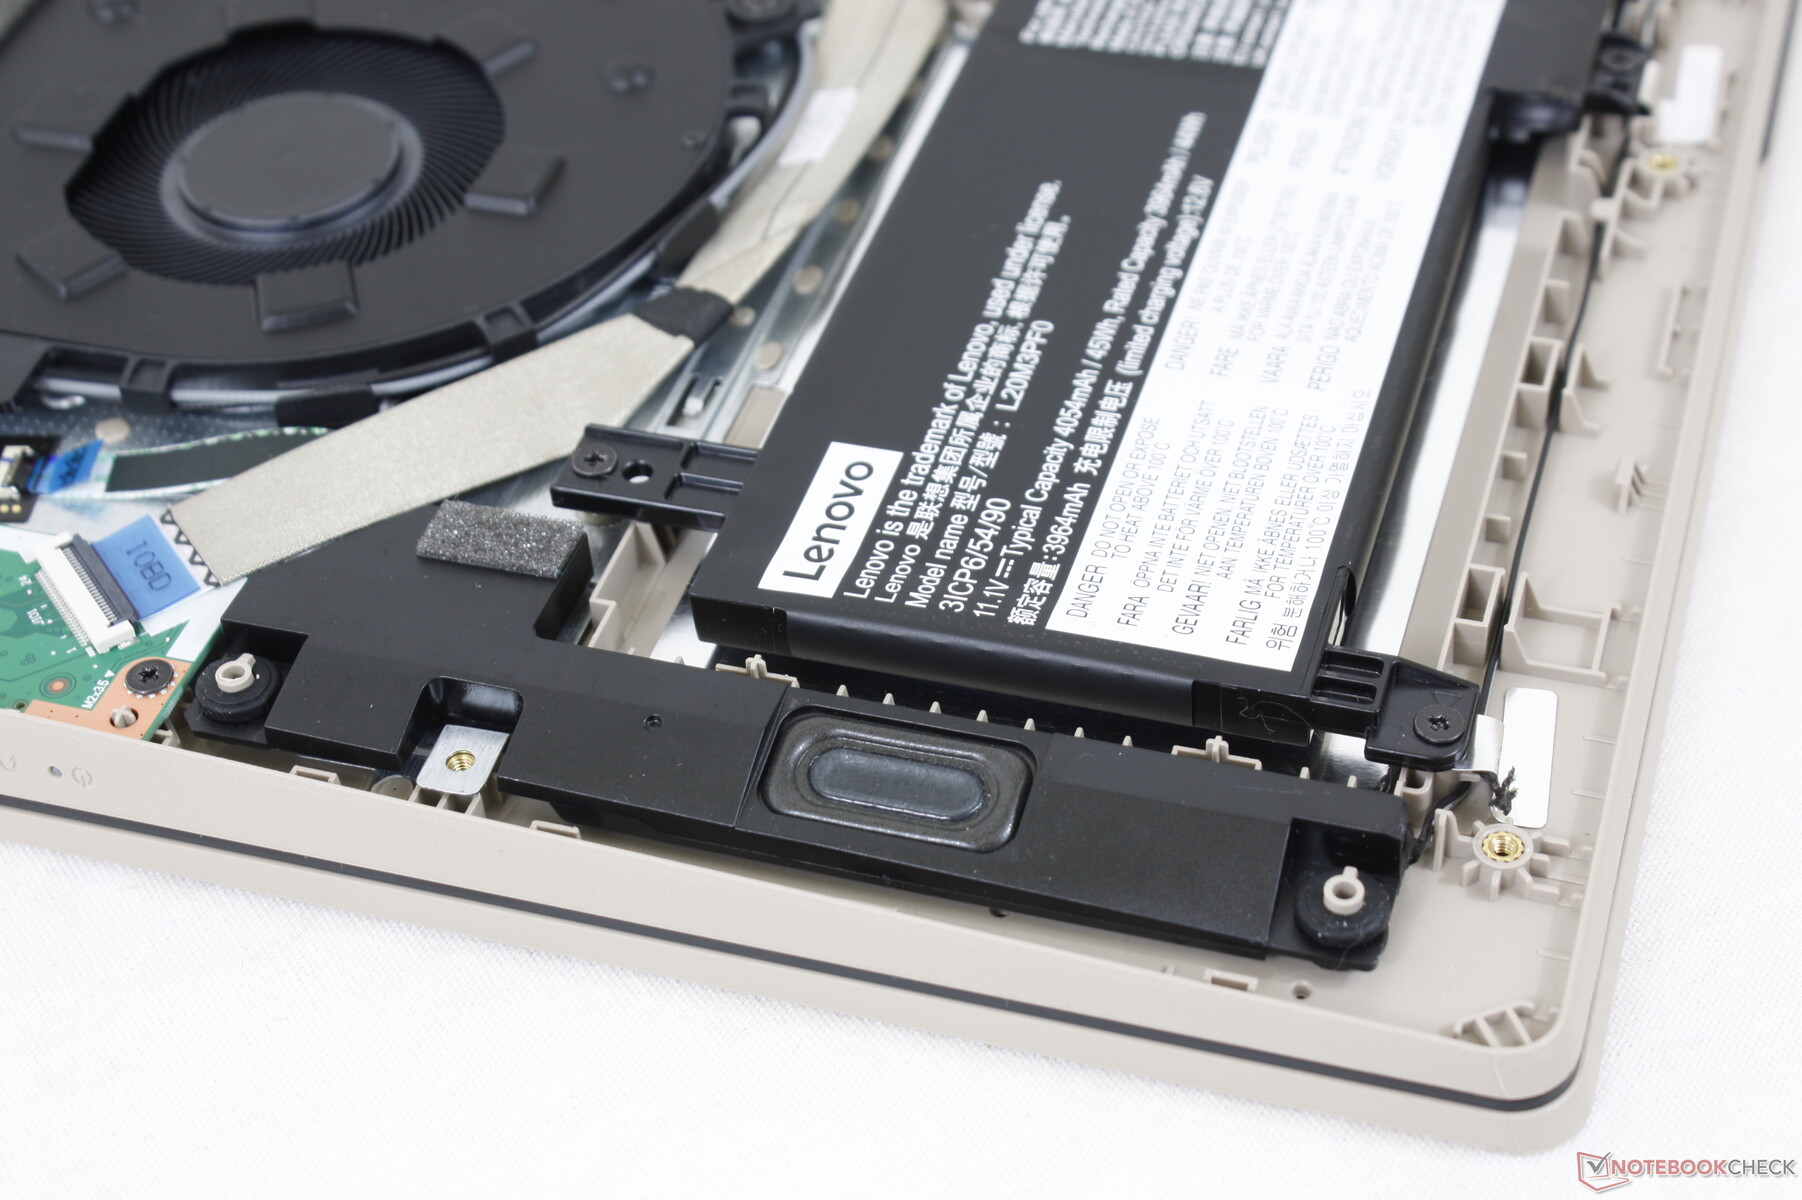
Manutenção - Fácil de abrir
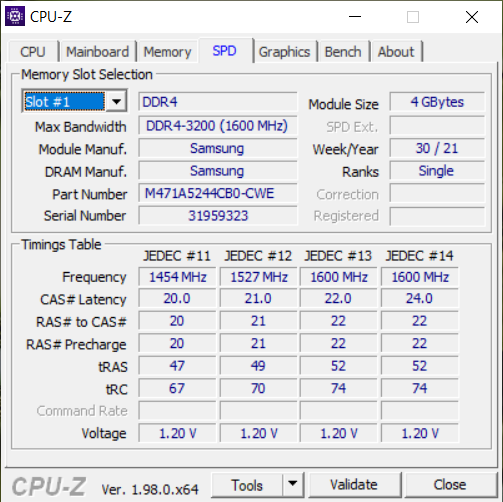
O painel inferior pode ser facilmente removido com apenas uma chave de fenda Philips, enquanto muitos outros laptops de orçamento são normalmente mais difíceis de serem reparados. Os usuários verão apenas um slot M.2 PCIe3 x4 2280 para armazenamento, um slot WLAN e um slot SODIMM para complementar os 4 GB de RAM soldados.
Acessórios e Garantia
Não há extras na caixa além do adaptador AC e da papelada. Aplica-se a habitual garantia limitada de um ano do fabricante
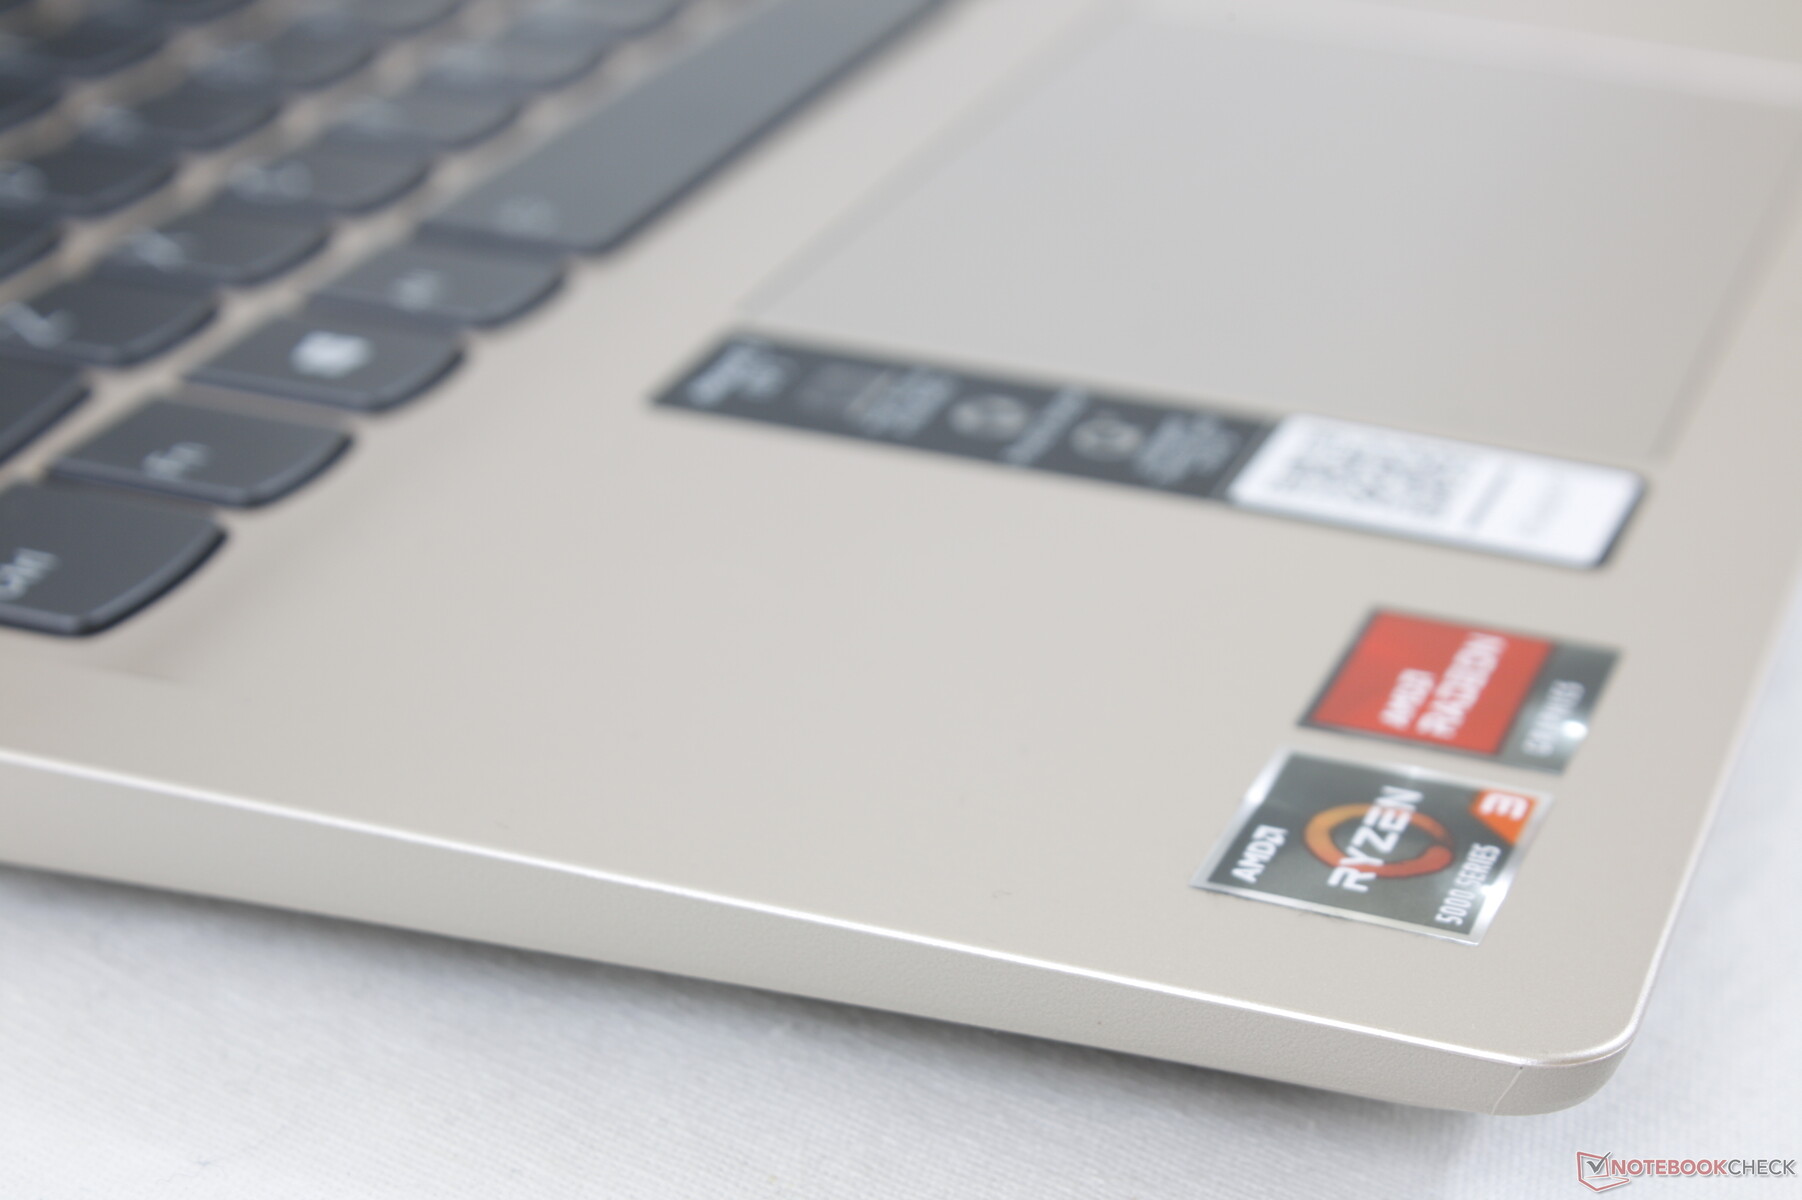
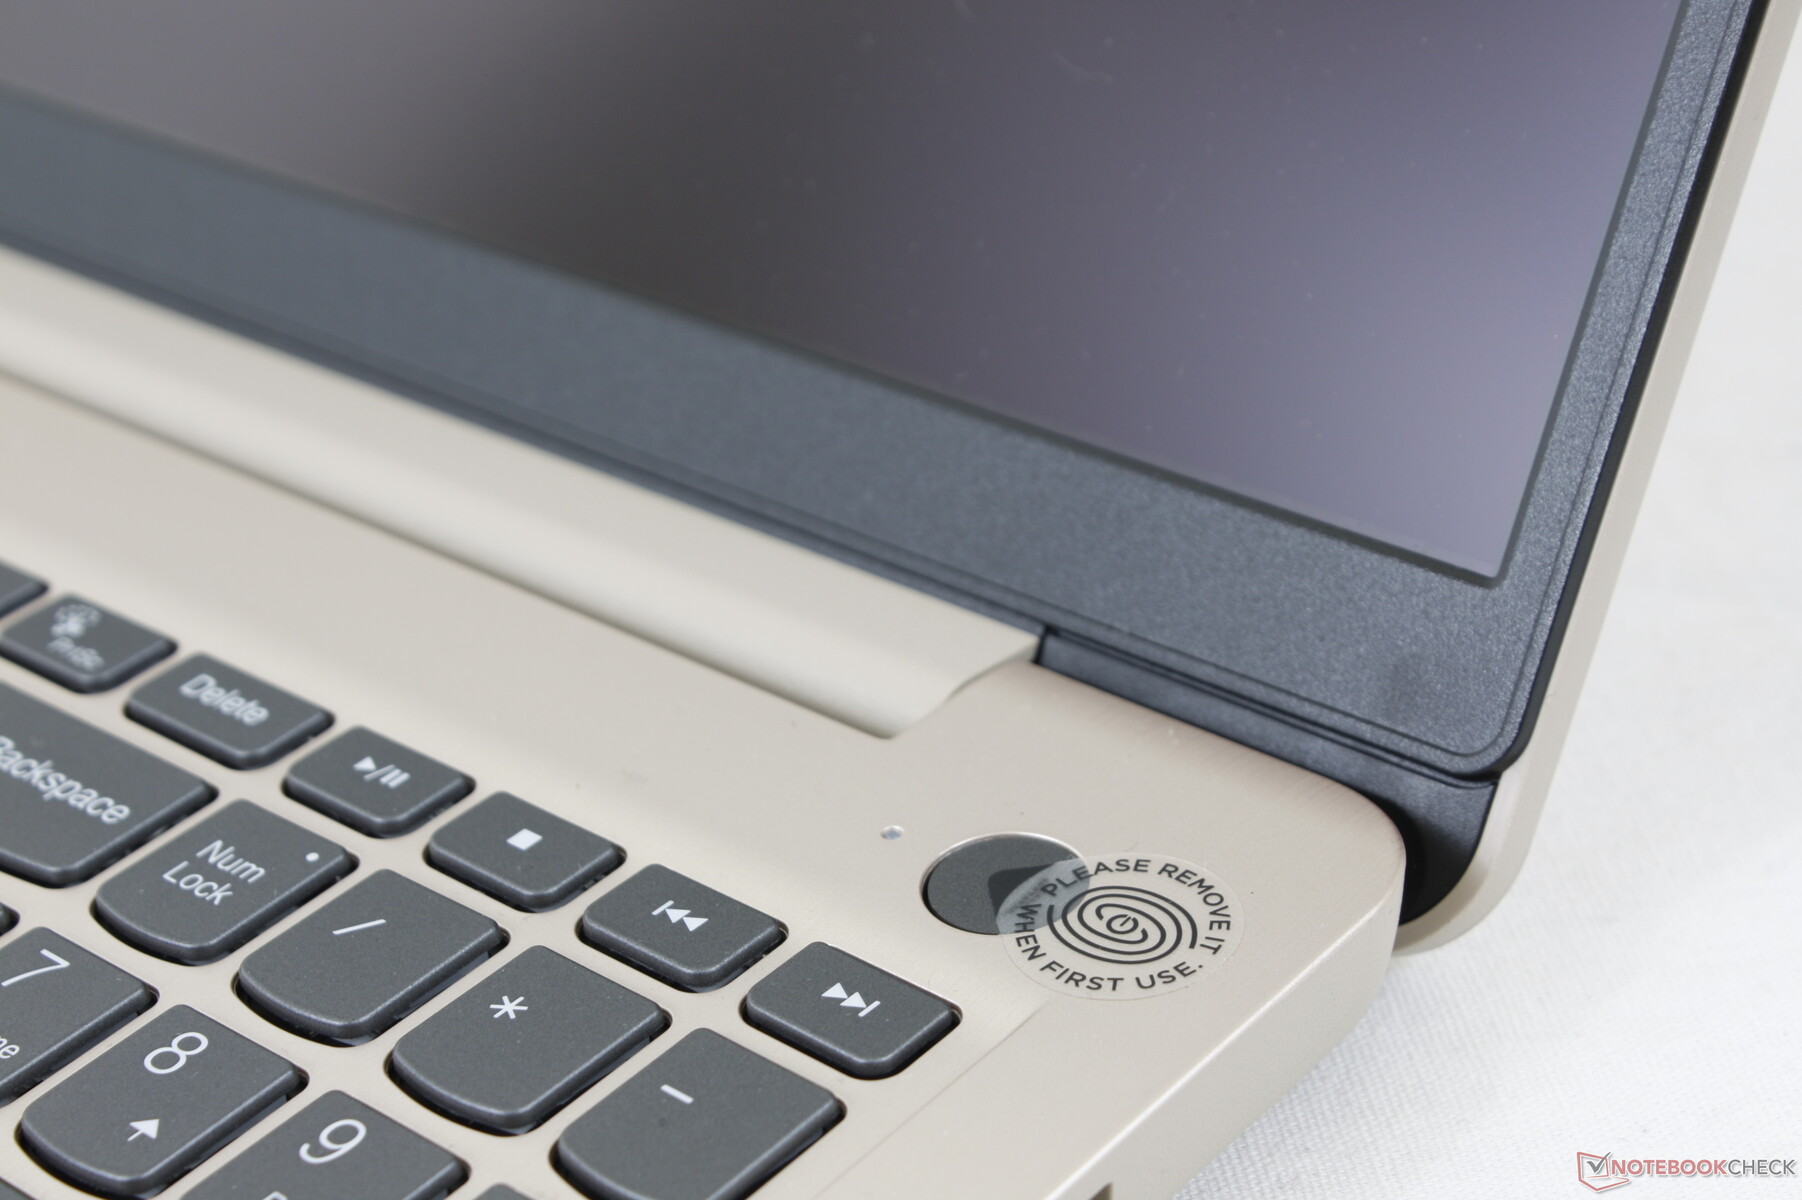
Dispositivos de entrada - Spongy Clickpad
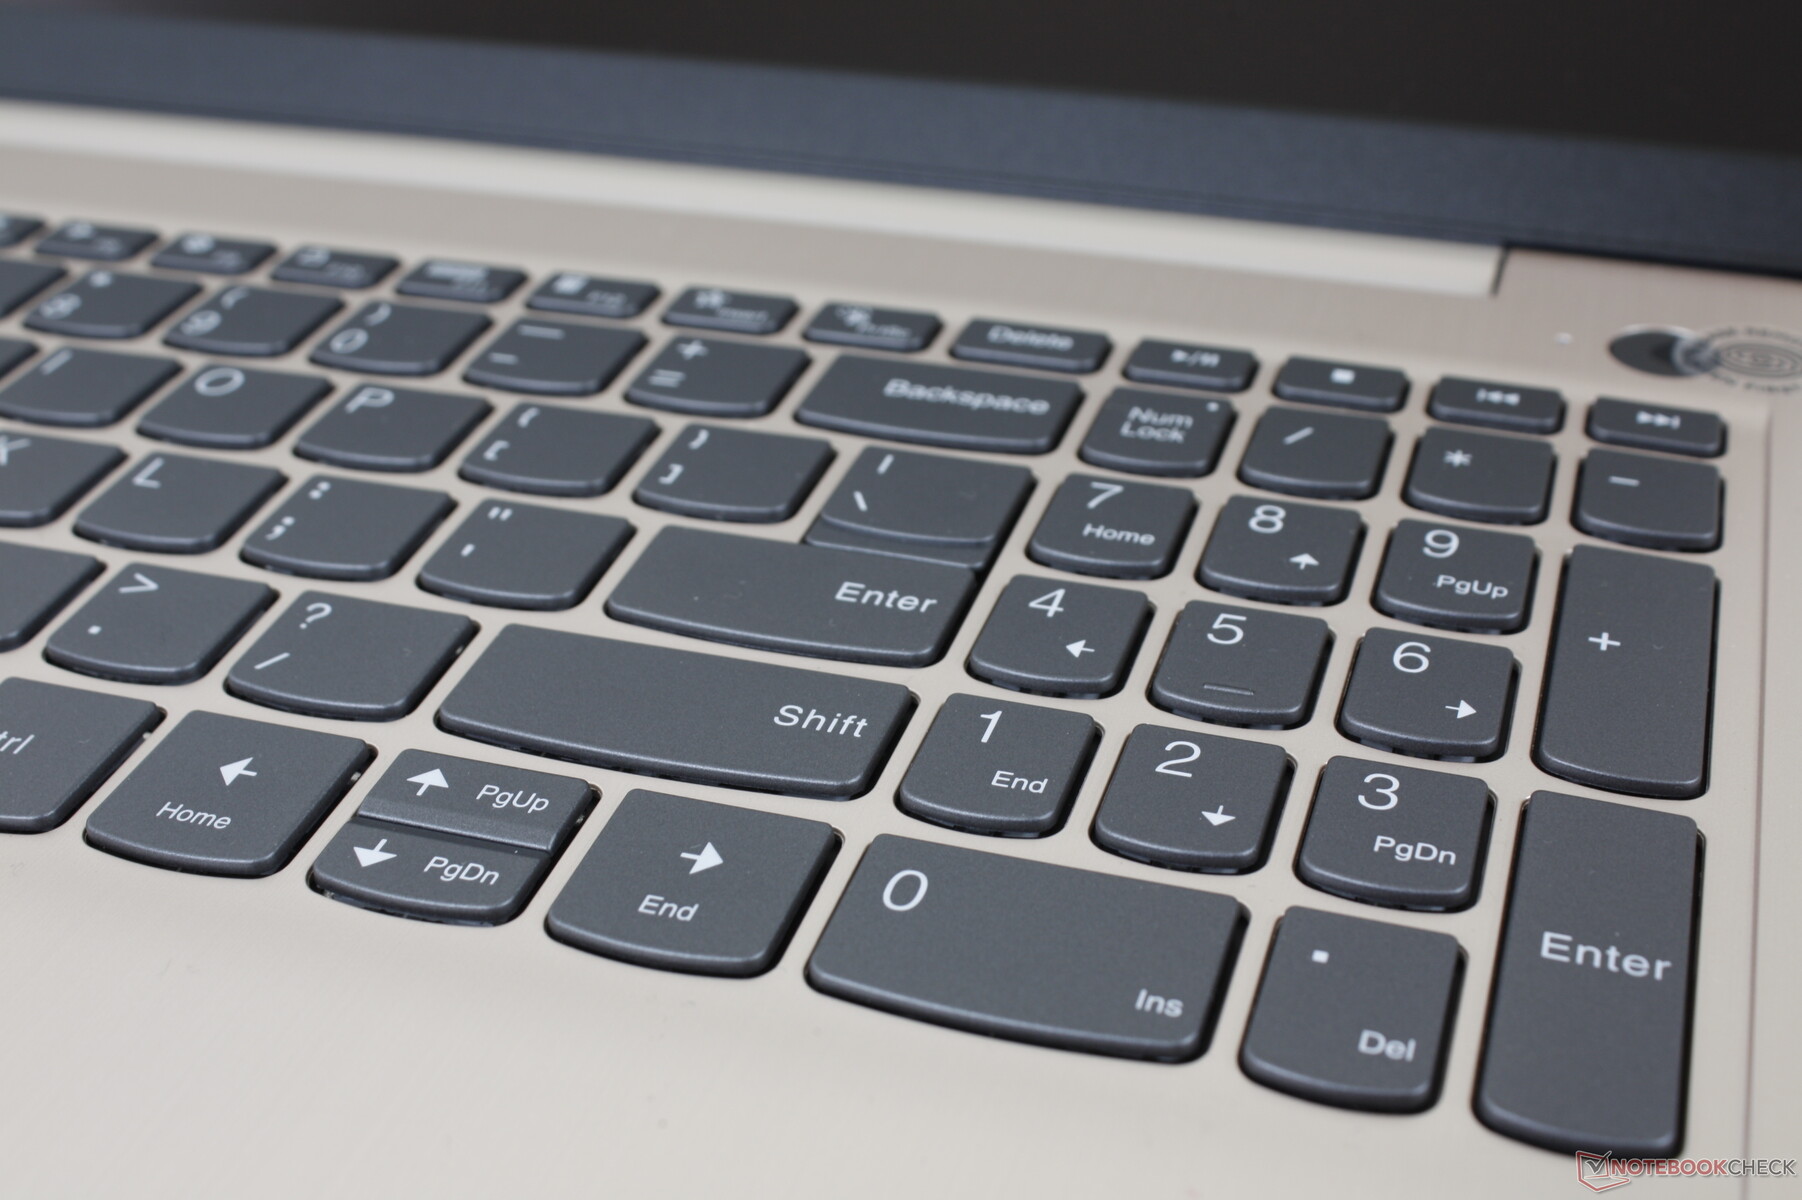
Teclado
As teclas retroiluminadas têm viagens curtas com feedback relativamente fraco quando pressionadas especialmente quando comparadas com as teclas de um ThinkPad ou laptop HP Spectre de preço mais baixo. O ruído das teclas é mais silencioso do que o esperado como resultado da retroalimentação suave.
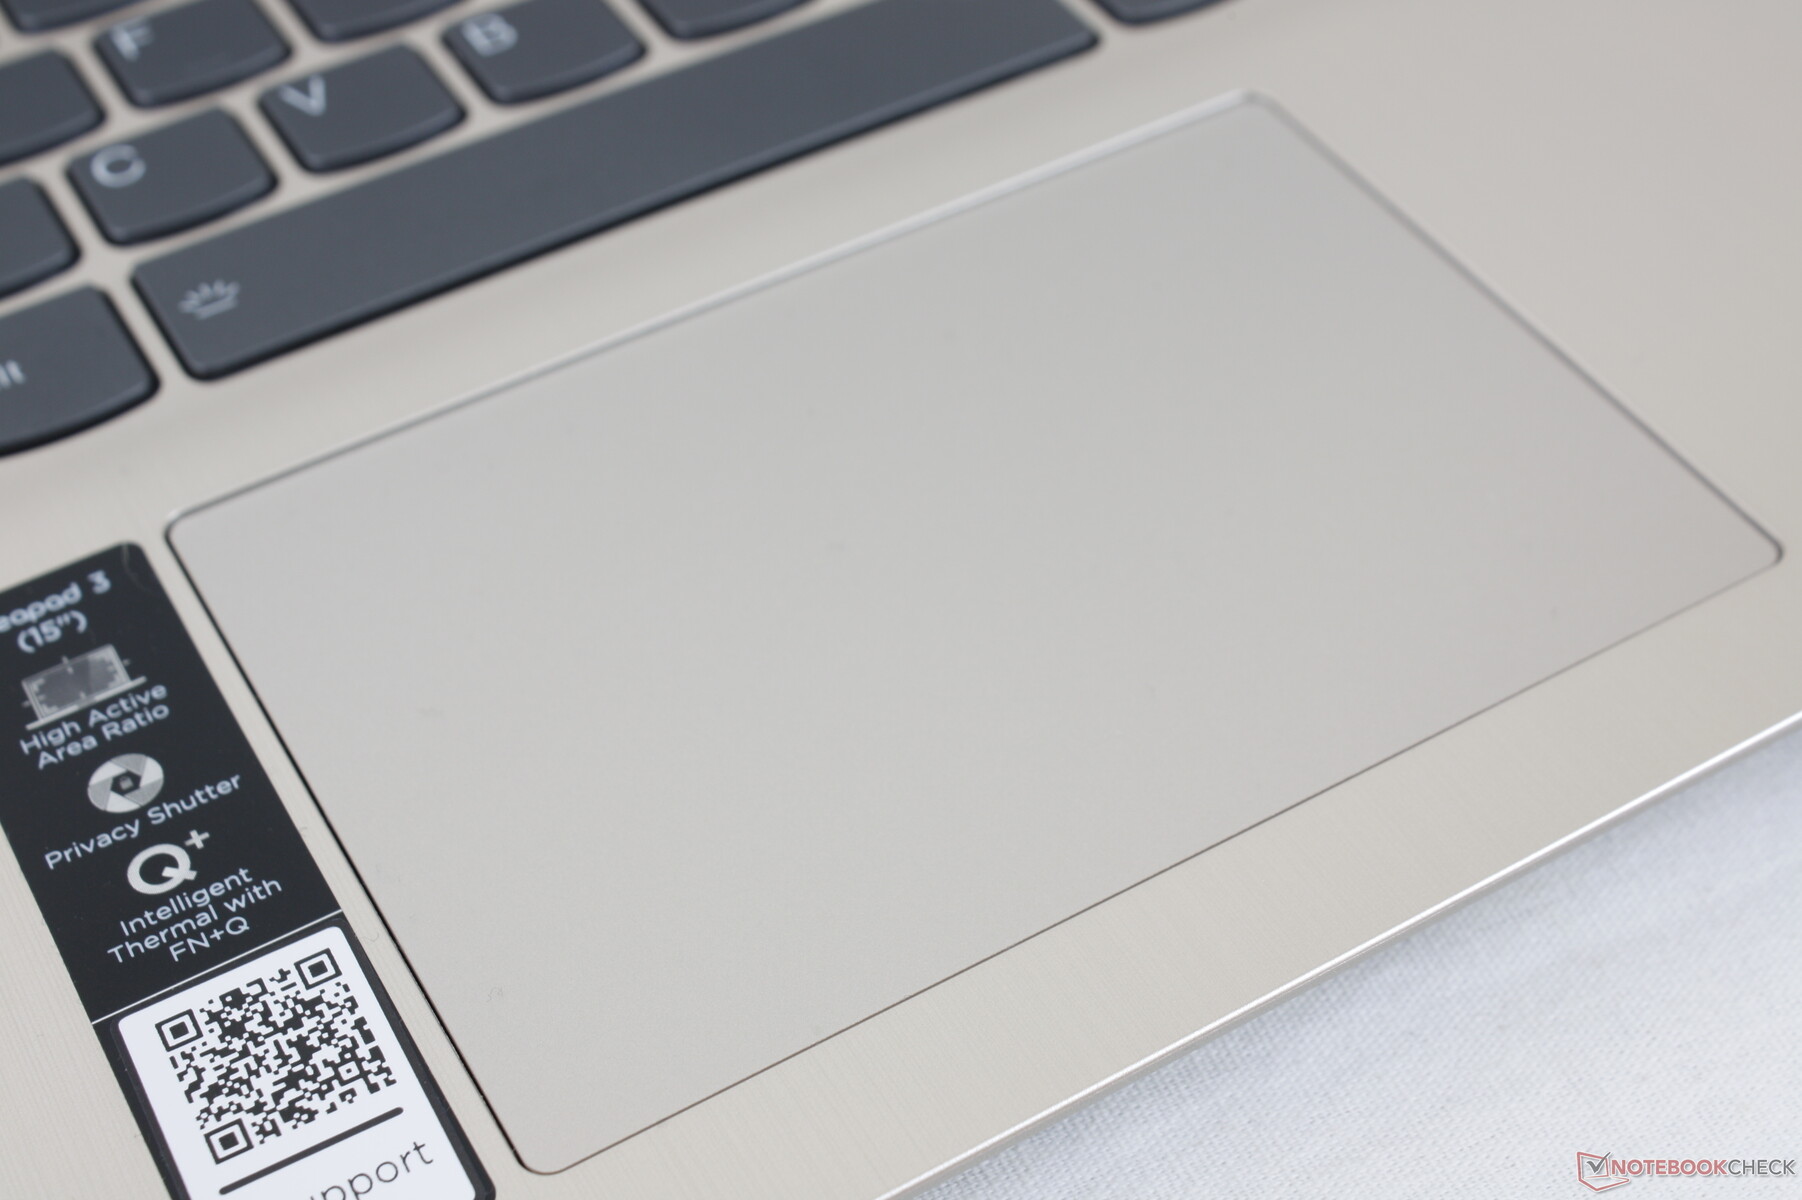
Touchpad
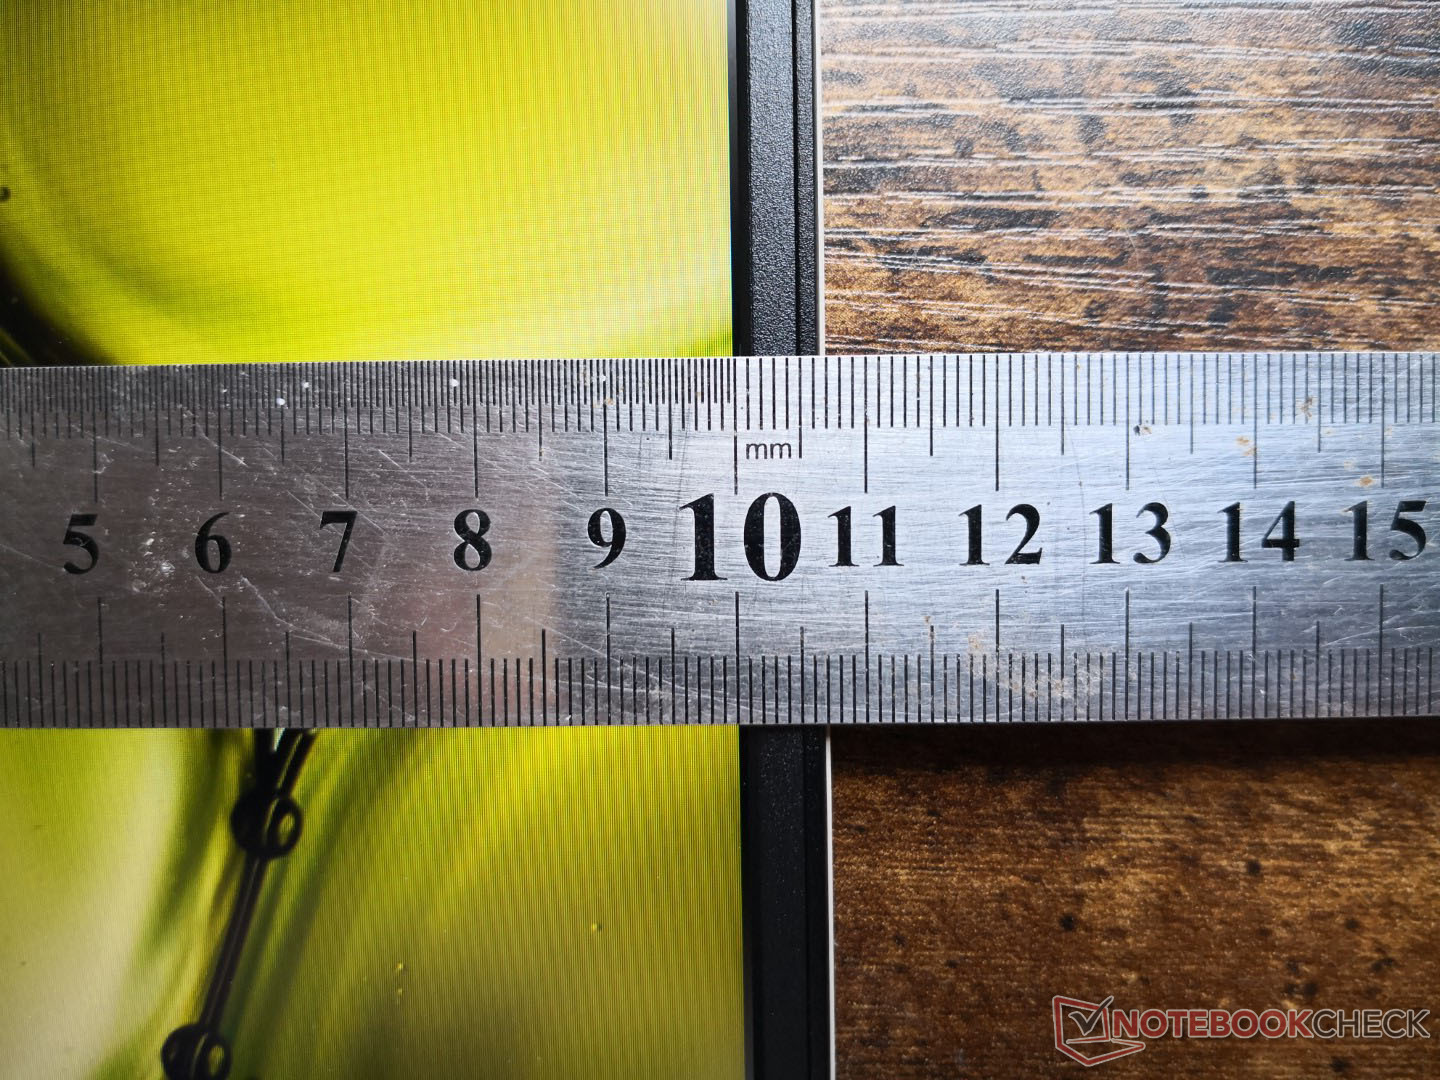
O clickpad é um pouco menor do que o da tela de 14 polegadas IdeaPad 5 Pro 14 (10 x 7 cm vs. 10,5 x 7 cm). O deslizamento é suave em velocidades médias ou altas, enquanto o dedo tende a grudar em velocidades mais lentas para um clique mais preciso. Infelizmente, clicar no clickpad parece superficial e esponjoso, com um feedback insatisfatório.

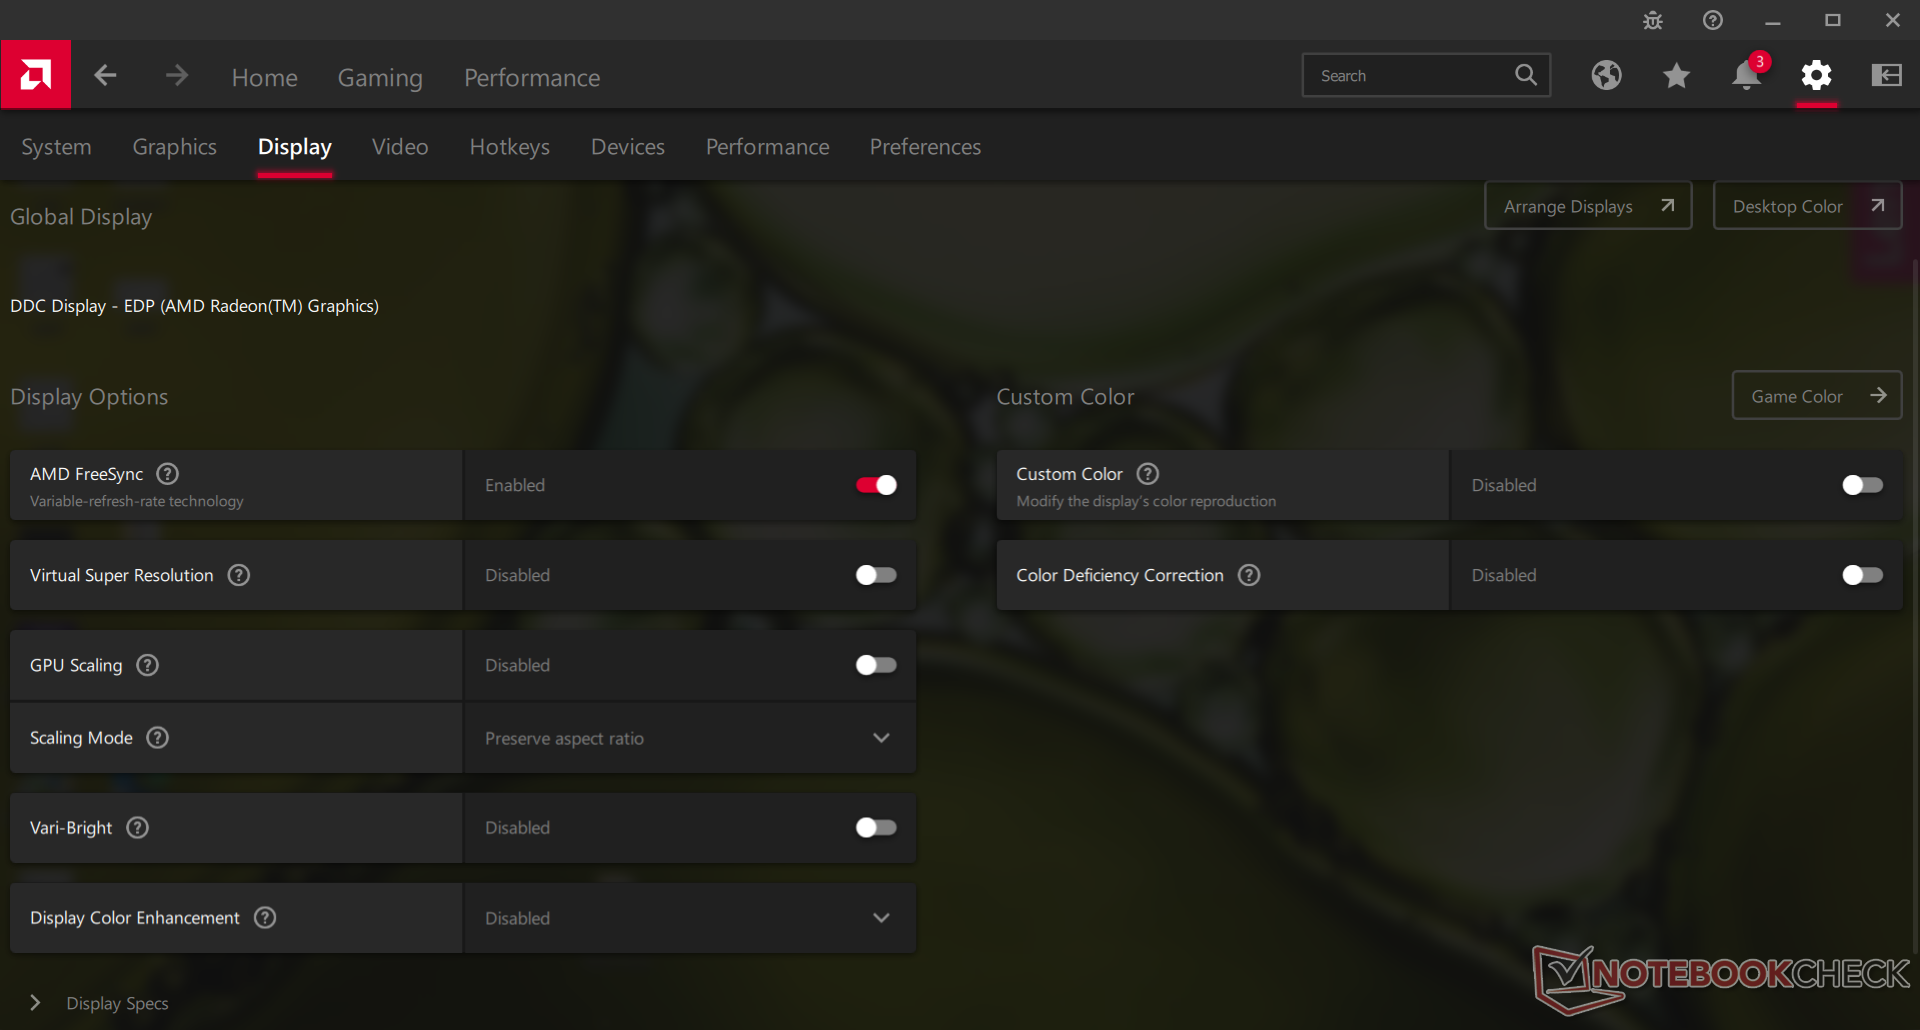
Tela - Suporte FreeSync e Touchscreen
O painel IPS BOE CQ NV156FHM-T07 não pode ser encontrado em nenhum outro laptop em nosso banco de dados. Embora sua alta relação de contraste de 1400:1 e tempos razoáveis de resposta em preto e branco mereçam elogios, suas cores são, na melhor das hipóteses, medíocres e não são tão vibrantes quanto as telas de um modelo de Yoga.
Talvez o aspecto mais notável da tela seja que ela também é uma tela sensível ao toque com suporte FreeSync, o que é quase inaudito para um laptop de menos de 500 dólares. Tais características provavelmente só apelarão para um subconjunto muito pequeno do público-alvo.


| |||||||||||||||||||||||||
iluminação: 84 %
iluminação com acumulador: 336.4 cd/m²
Contraste: 1402:1 (Preto: 0.24 cd/m²)
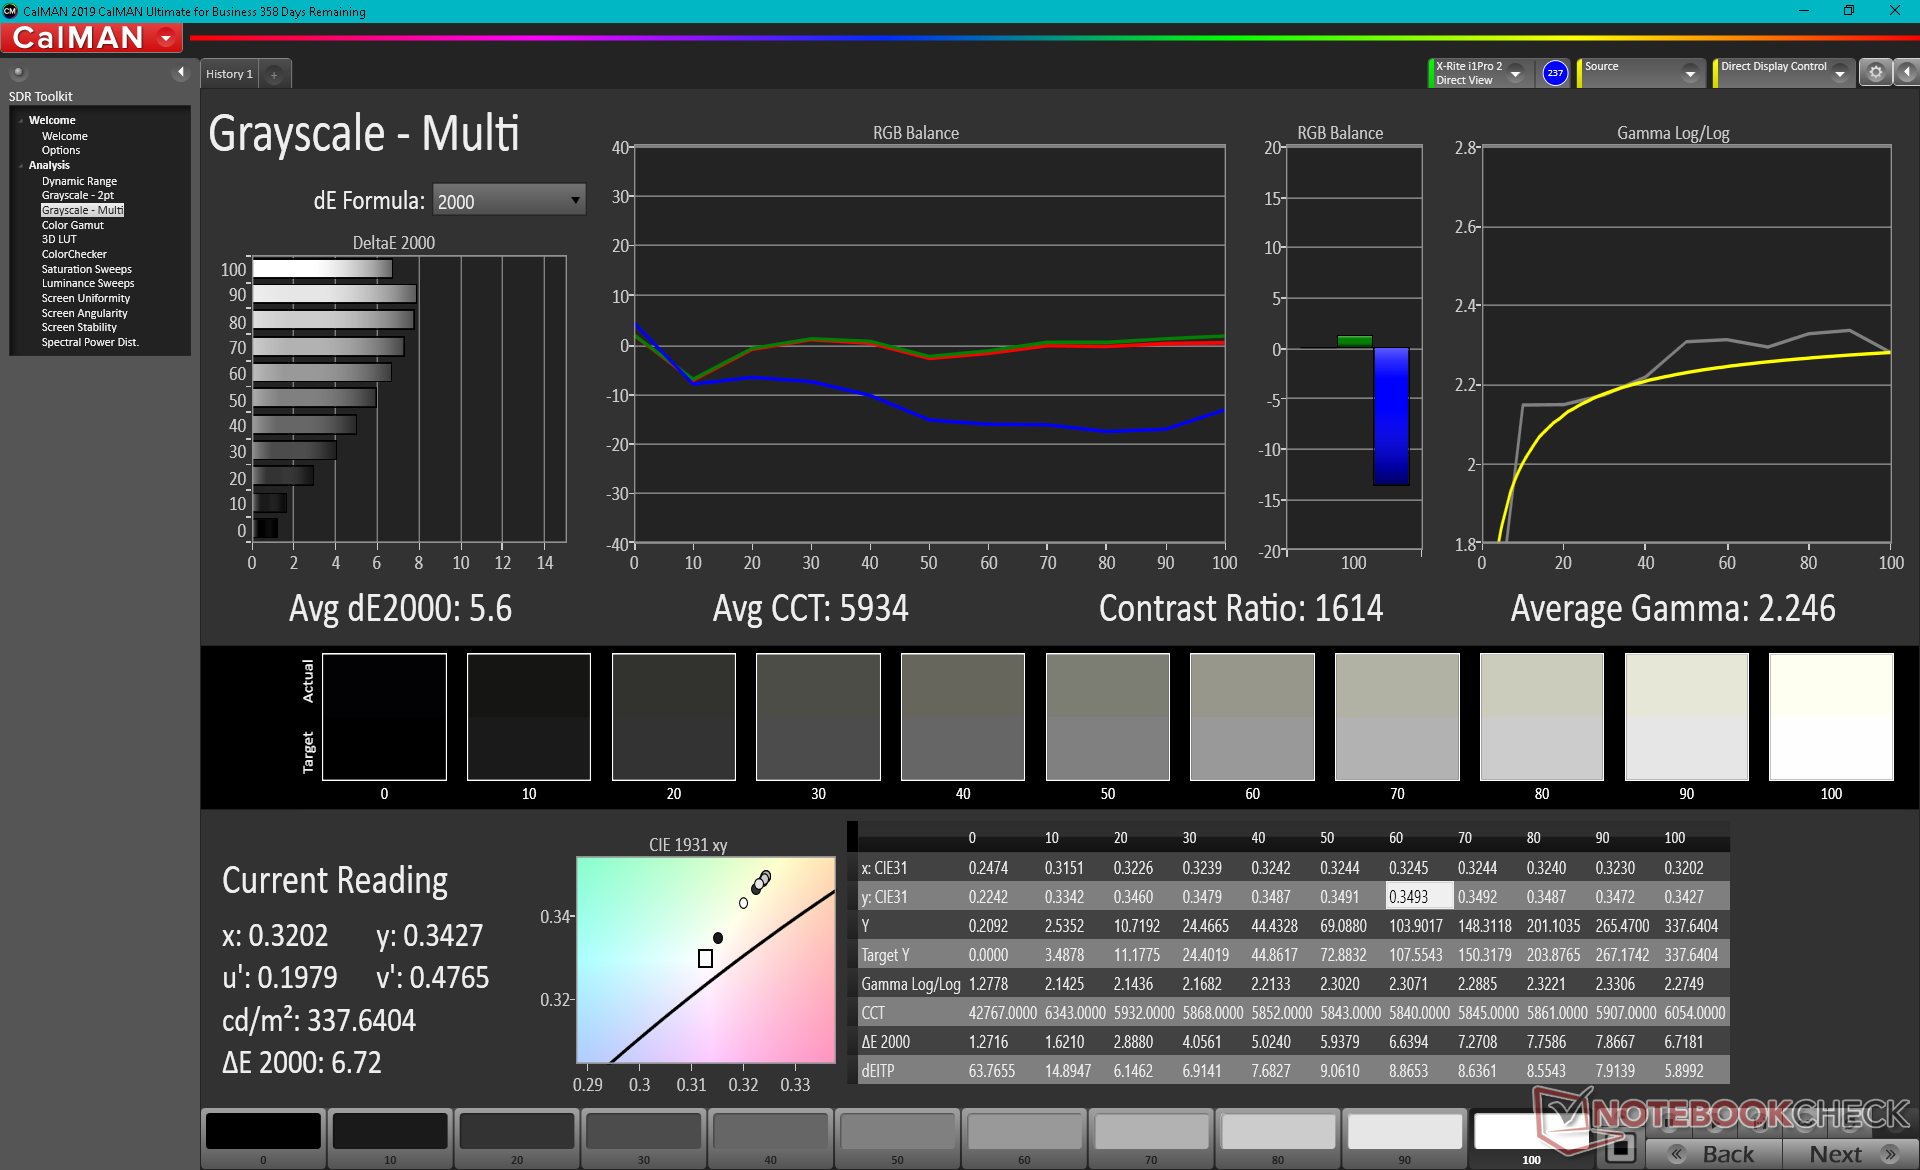
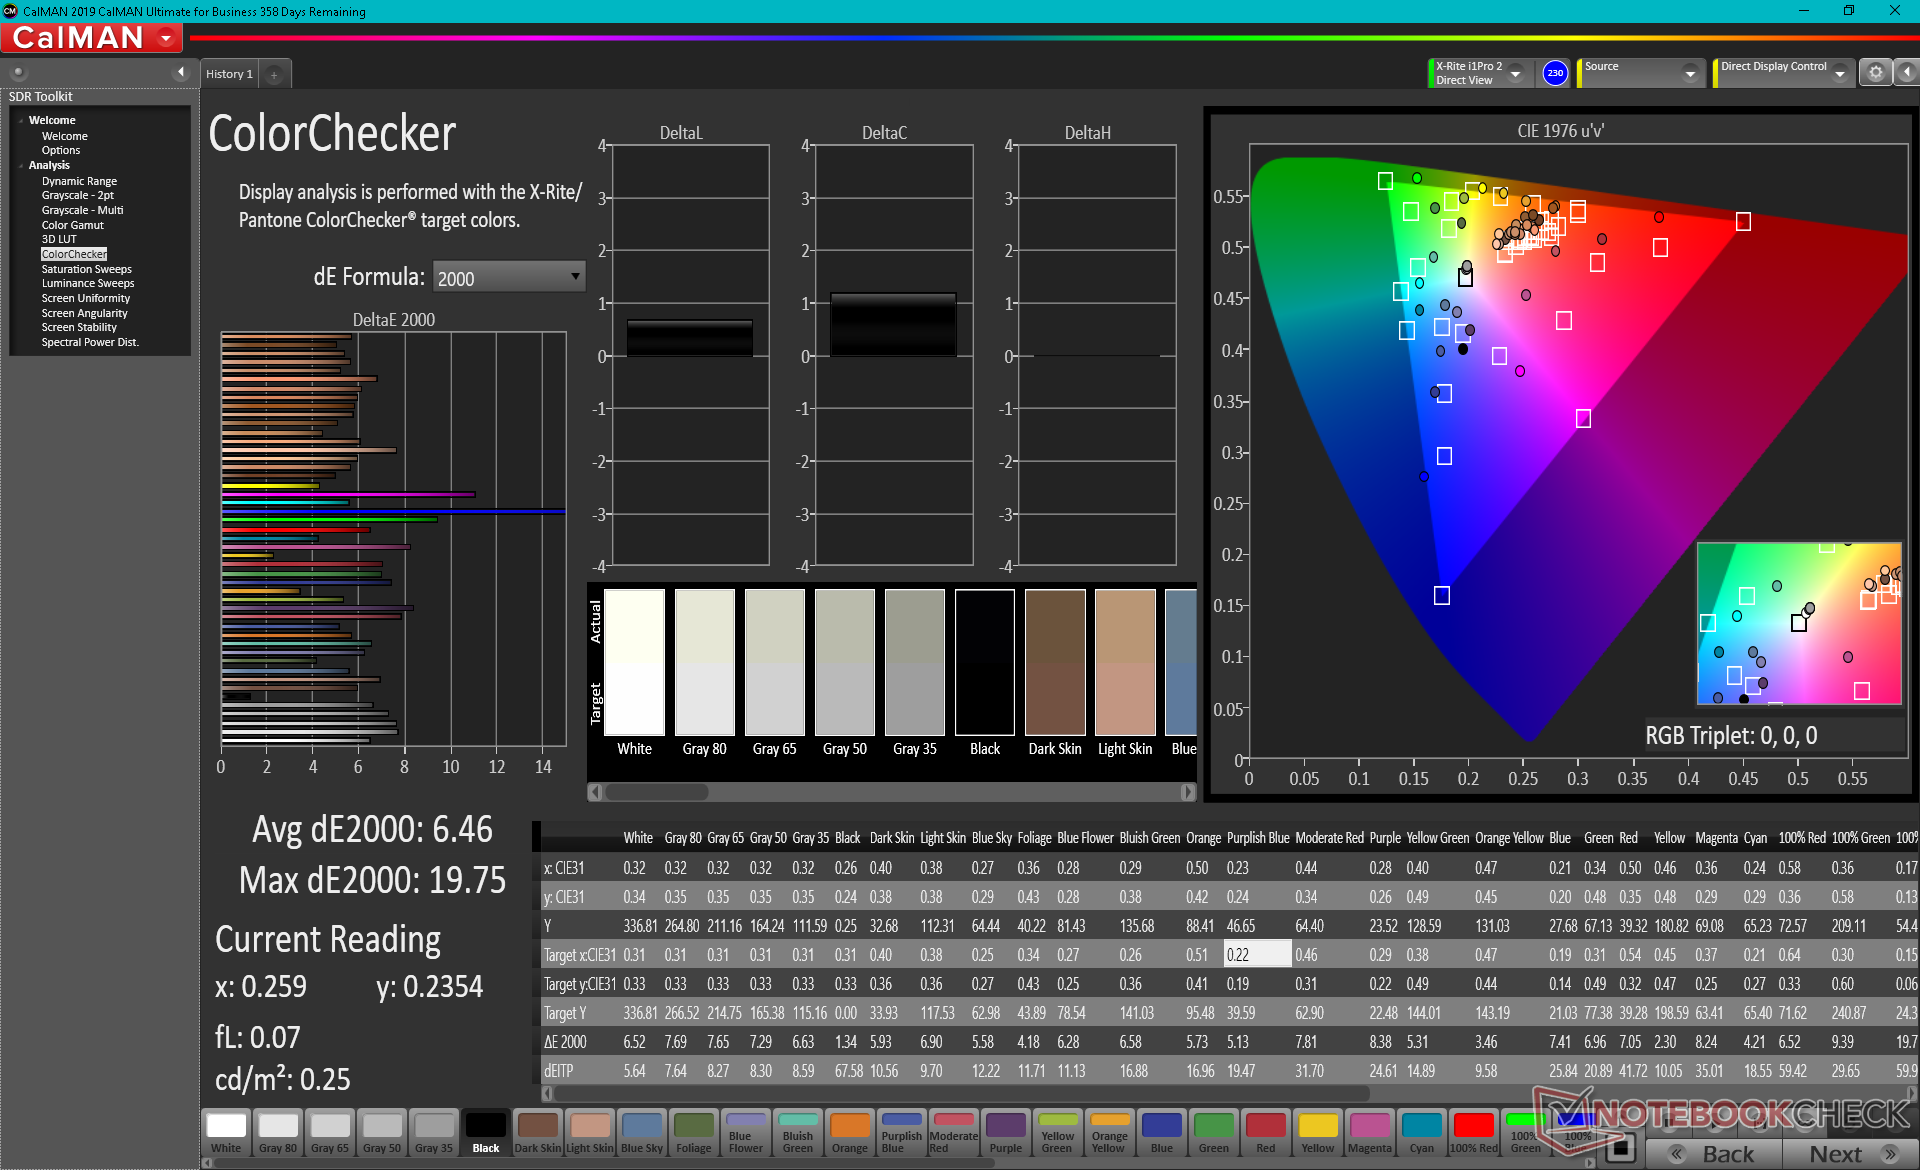
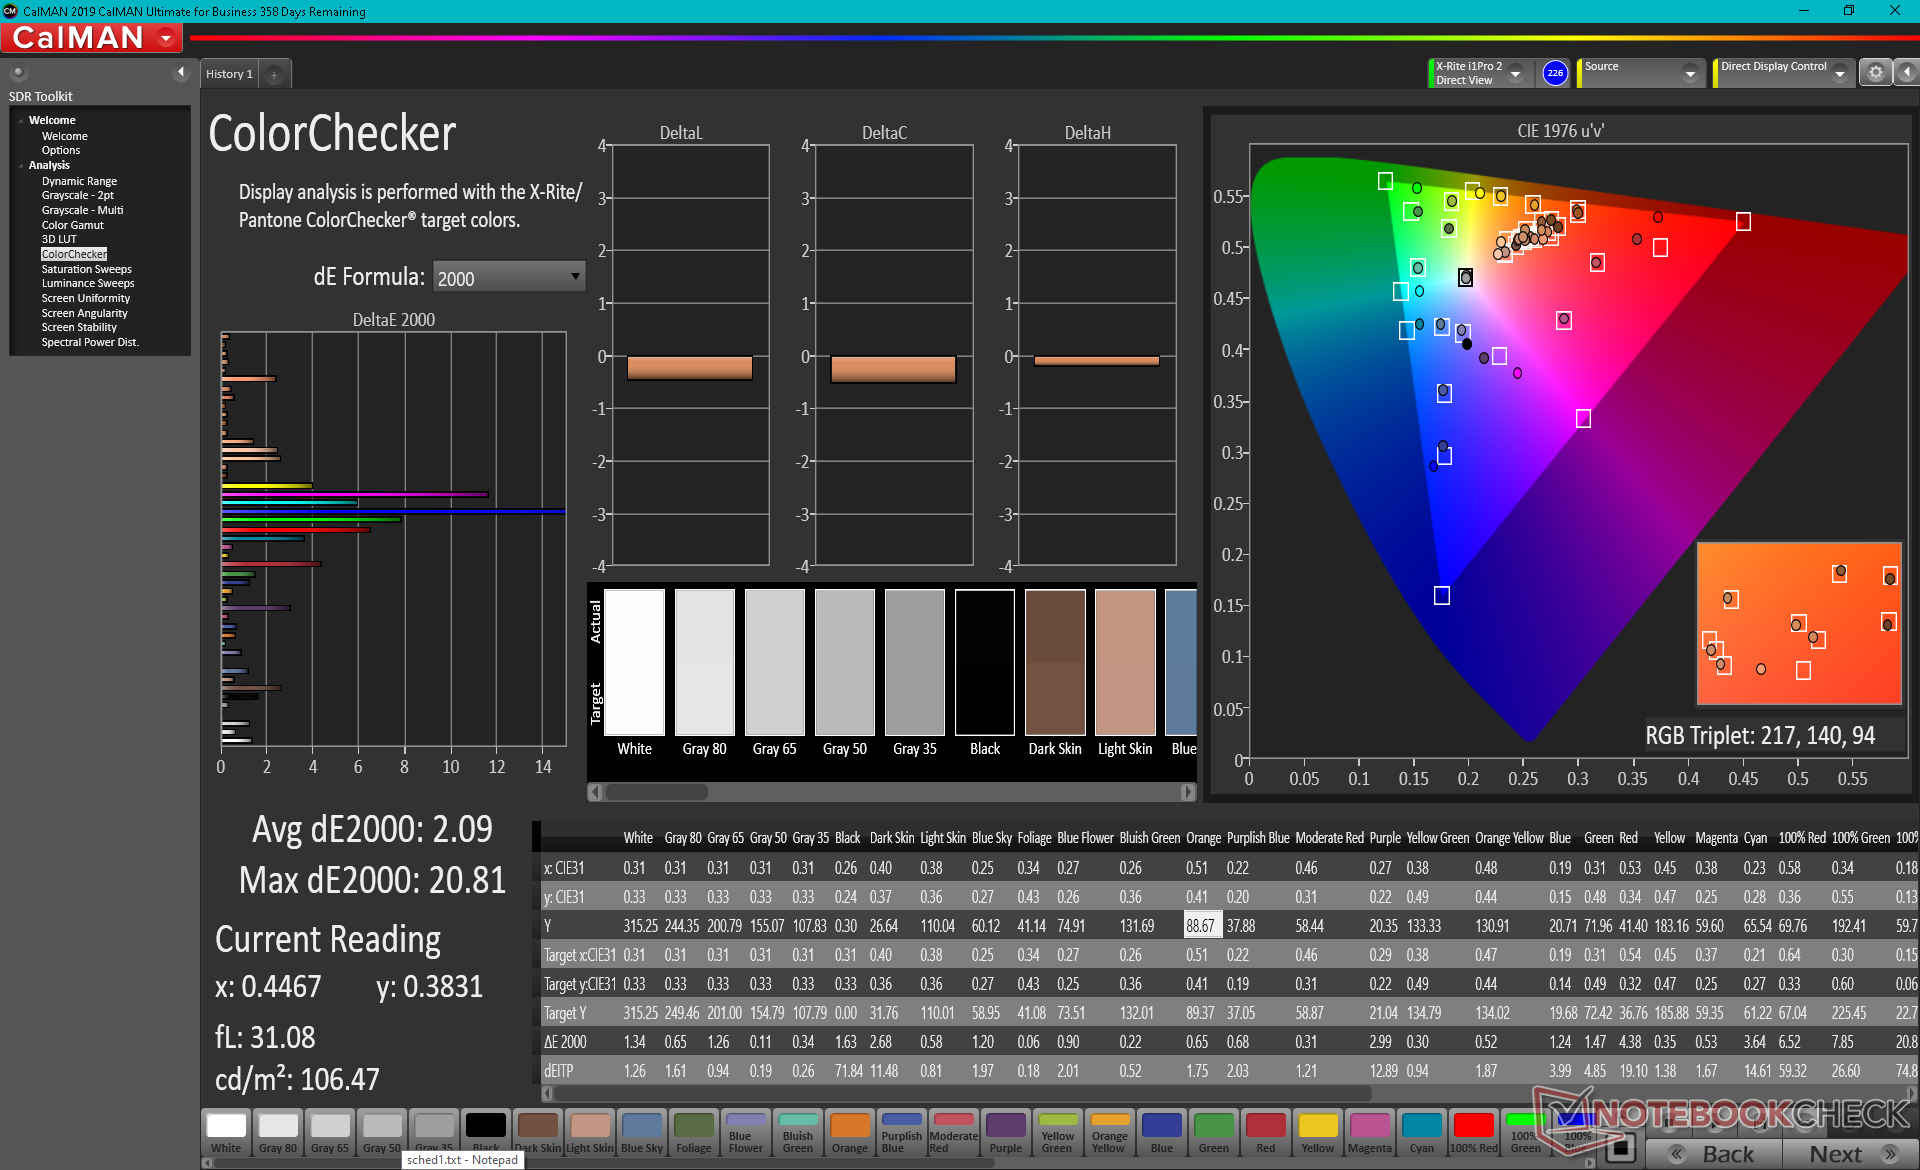
ΔE ColorChecker Calman: 6.46 | ∀{0.5-29.43 Ø4.71}
calibrated: 2.09
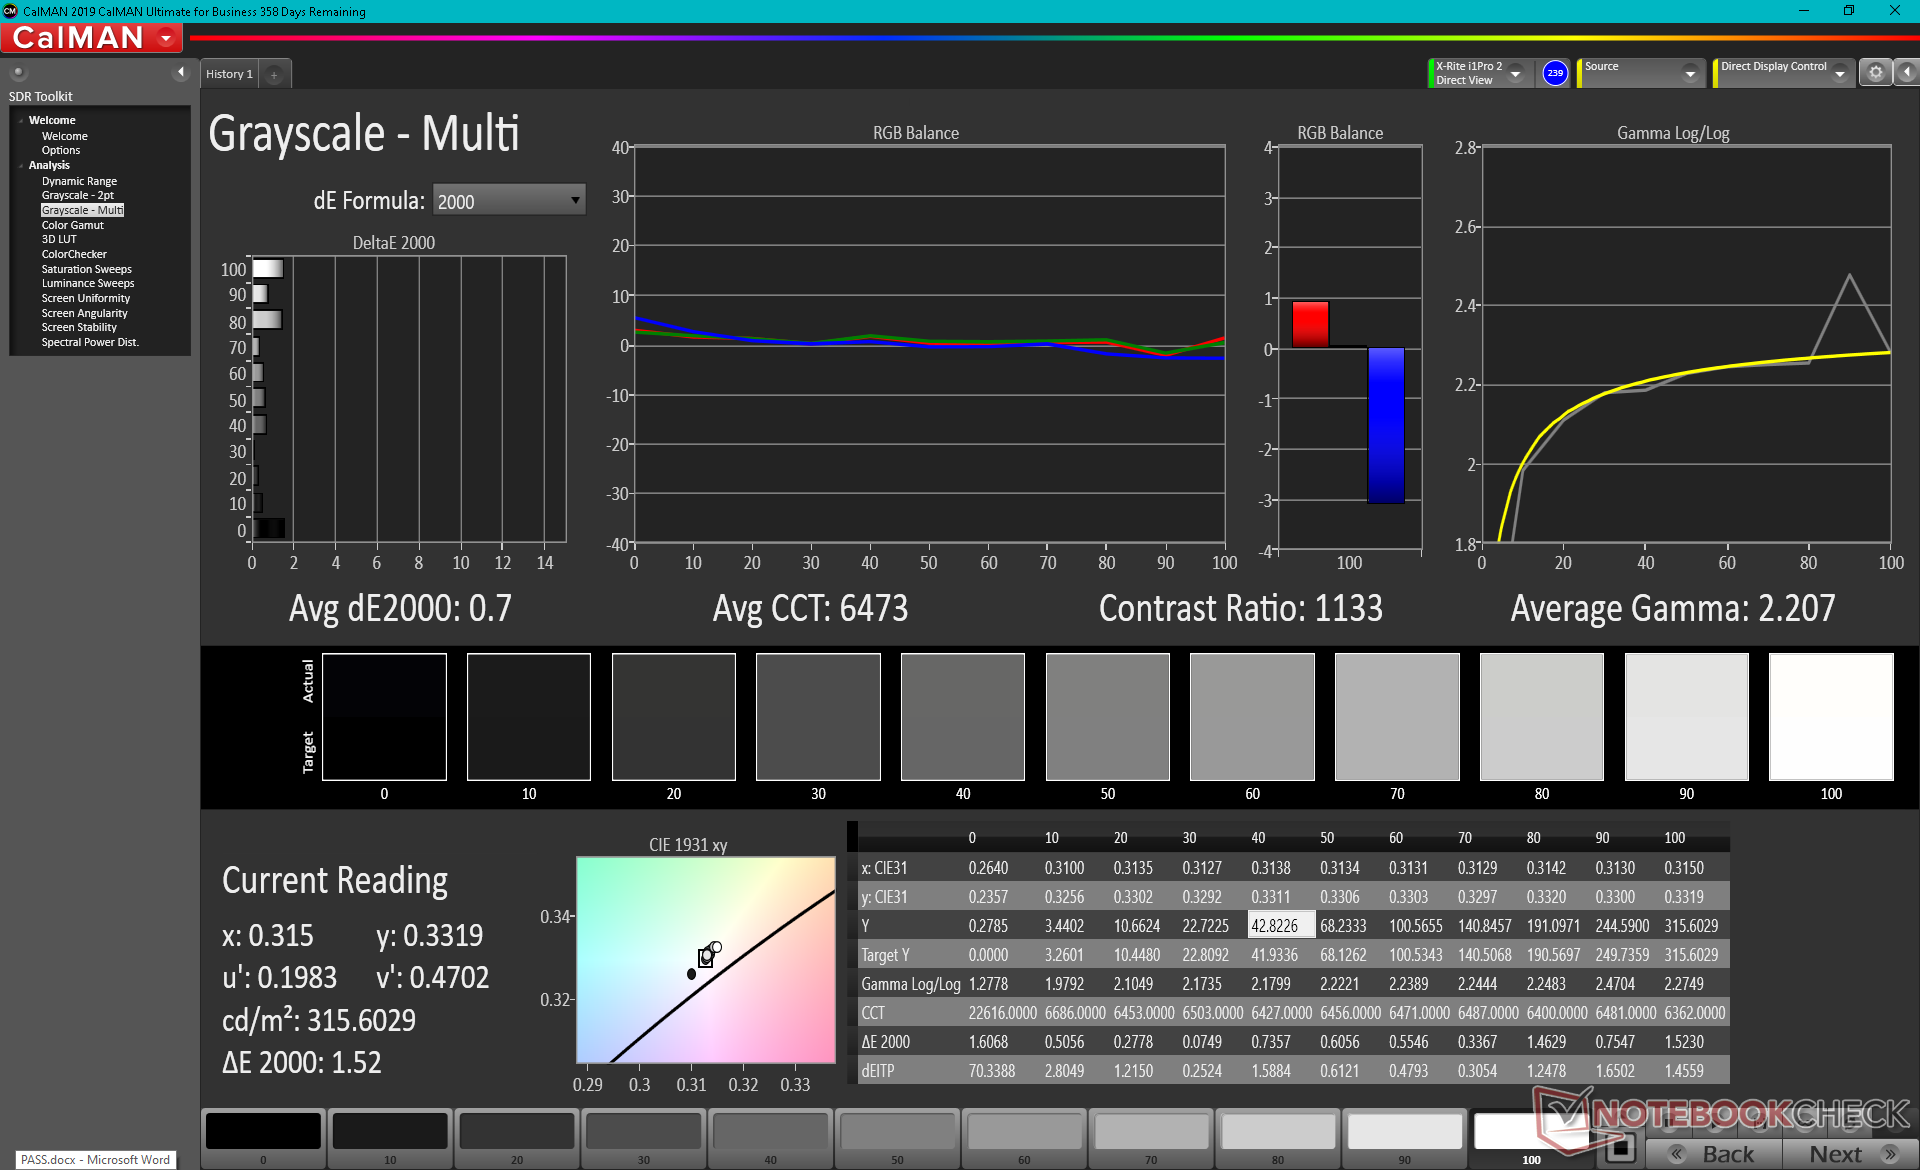
ΔE Greyscale Calman: 5.6 | ∀{0.09-98 Ø4.96}
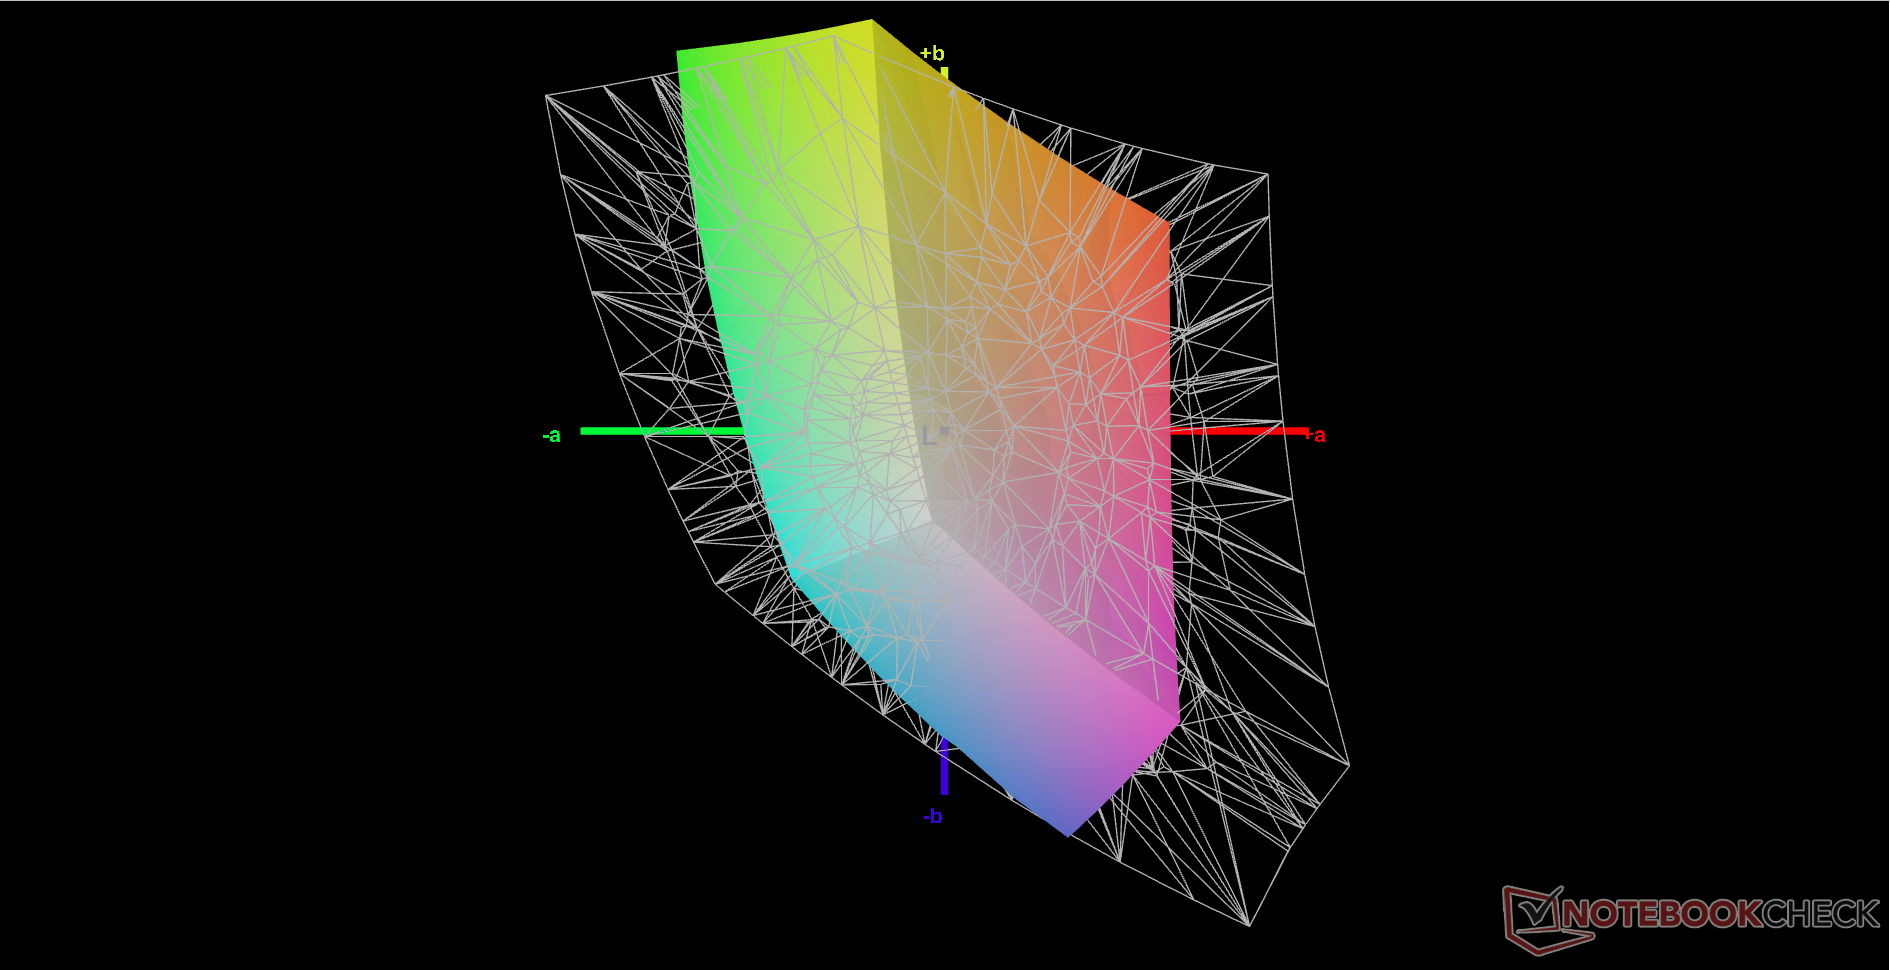
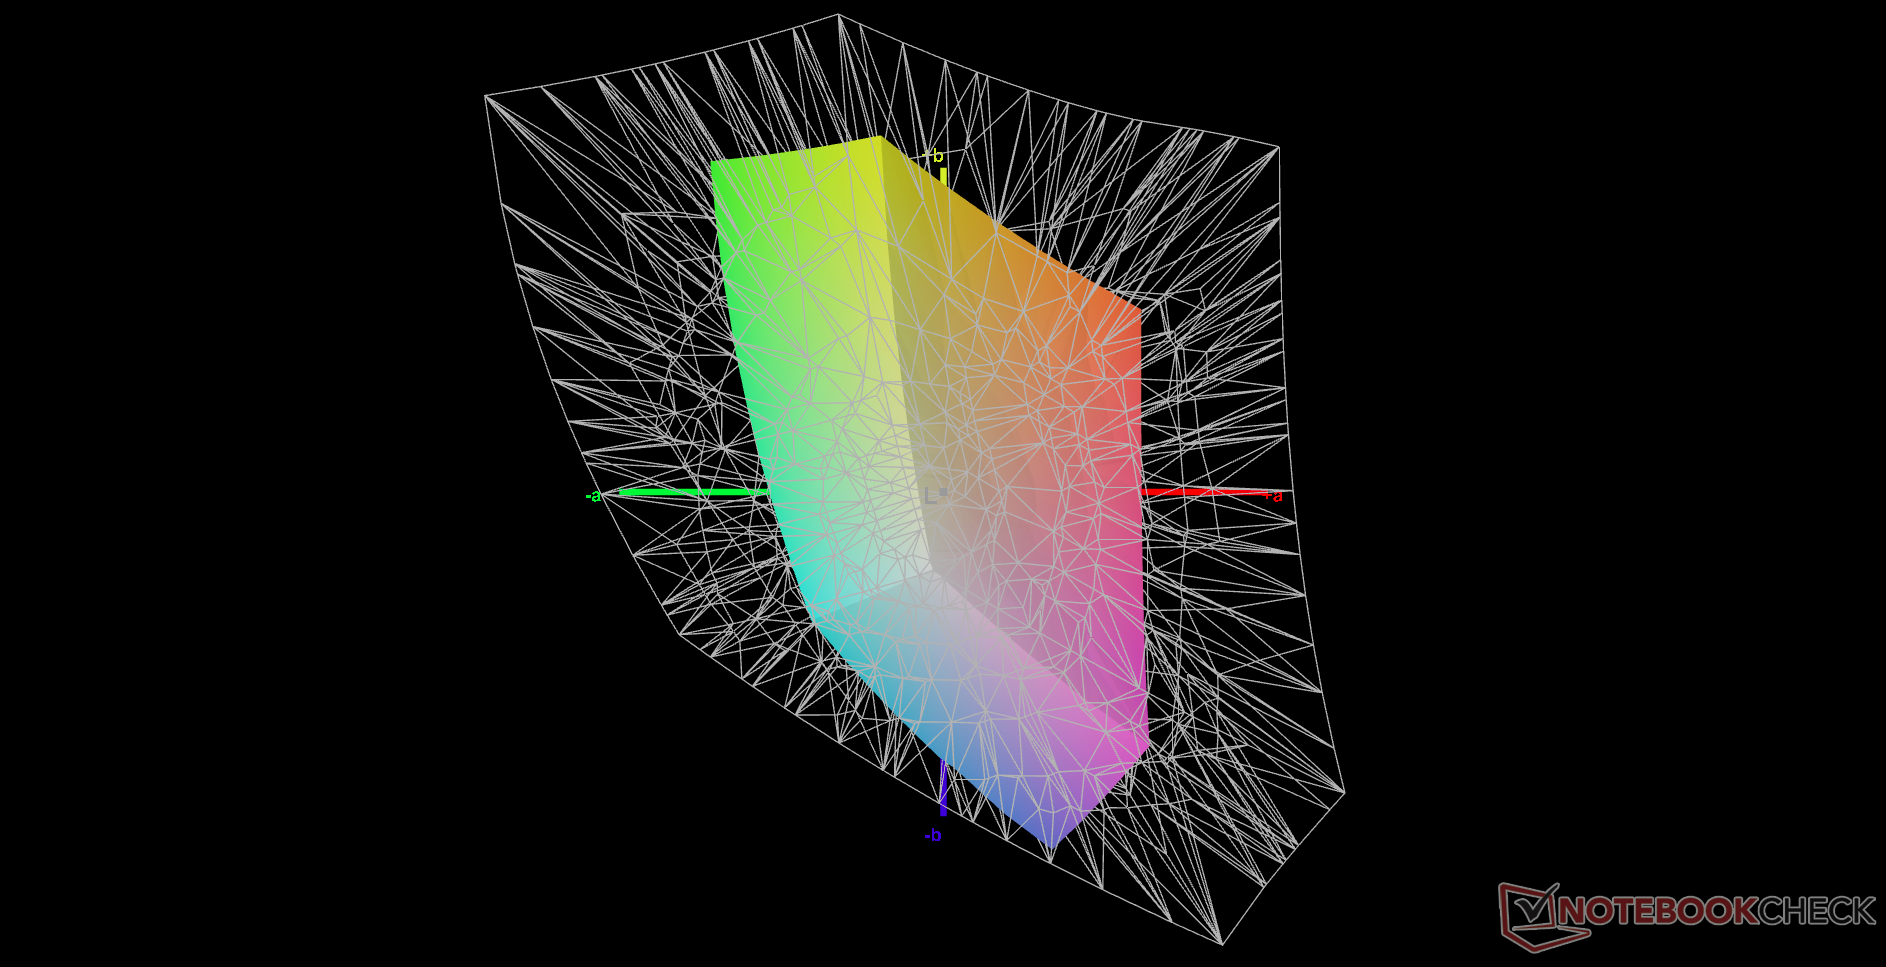
41.2% AdobeRGB 1998 (Argyll 3D)
57.7% sRGB (Argyll 3D)
40% Display P3 (Argyll 3D)
Gamma: 2.25
CCT: 5934 K
| Lenovo IdeaPad 3 15ALC6 BOE CQ NV156FHM-T07, IPS, 1920x1080, 15.6" | Lenovo IdeaPad 5 15IIL05 AU Optronics B156HAN02.1, IPS, 1920x1080, 15.6" | Lenovo Ideapad S540-15IML BOEhydis NV156FHM-N61 (BOE06FB), IPS, 1920x1080, 15.6" | Dell Inspiron 15 3501 BOE NV15N3D (Dell P/N: N39X1), IPS, 1920x1080, 15.6" | HP Pavilion 15-eg Chi Mei CMN1523, IPS, 1920x1080, 15.6" | Asus VivoBook 15 KM513UA-L503TS Samsung ATNA56YX03-0, OLED, 1920x1080, 15.6" | |
|---|---|---|---|---|---|---|
| Display | -5% | 57% | 0% | 9% | 119% | |
| Display P3 Coverage (%) | 40 | 37.63 -6% | 66.8 67% | 39.4 -1% | 42.9 7% | 99.9 150% |
| sRGB Coverage (%) | 57.7 | 56.5 -2% | 86.5 50% | 58.7 2% | 64 11% | 100 73% |
| AdobeRGB 1998 Coverage (%) | 41.2 | 38.88 -6% | 63.2 53% | 40.7 -1% | 44.4 8% | 96.7 135% |
| Response Times | -32% | -62% | -43% | 13% | 94% | |
| Response Time Grey 50% / Grey 80% * (ms) | 24.8 ? | 42 ? -69% | 49.6 ? -100% | 43 ? -73% | 22.8 ? 8% | 0.89 ? 96% |
| Response Time Black / White * (ms) | 28.4 ? | 27 ? 5% | 34.8 ? -23% | 32 ? -13% | 23.6 ? 17% | 2.31 ? 92% |
| PWM Frequency (Hz) | 202 ? | 1000 ? | 26320 ? | 60 ? | ||
| Screen | -15% | 5% | 21% | -7% | 33% | |
| Brightness middle (cd/m²) | 336.4 | 340 1% | 299 -11% | 271 -19% | 294.3 -13% | 401 19% |
| Brightness (cd/m²) | 318 | 325 2% | 278 -13% | 263 -17% | 251 -21% | 403 27% |
| Brightness Distribution (%) | 84 | 88 5% | 87 4% | 92 10% | 76 -10% | 98 17% |
| Black Level * (cd/m²) | 0.24 | 0.27 -13% | 0.25 -4% | 0.15 37% | 0.26 -8% | |
| Contrast (:1) | 1402 | 1259 -10% | 1196 -15% | 1807 29% | 1132 -19% | |
| Colorchecker dE 2000 * | 6.46 | 6.62 -2% | 4.32 33% | 4.83 25% | 4.08 37% | 3.24 50% |
| Colorchecker dE 2000 max. * | 19.75 | 21.05 -7% | 9.3 53% | 7 65% | 19.49 1% | 6.42 67% |
| Colorchecker dE 2000 calibrated * | 2.09 | 4.71 -125% | 2.58 -23% | 3.7 -77% | 2.13 -2% | |
| Greyscale dE 2000 * | 5.6 | 4.61 18% | 4.21 25% | 3.36 40% | 3 46% | 2.7 52% |
| Gamma | 2.25 98% | 2.74 80% | 2.39 92% | 2.56 86% | 2.21 100% | 2.14 103% |
| CCT | 5934 110% | 6262 104% | 6799 96% | 6764 96% | 6616 98% | 6374 102% |
| Color Space (Percent of AdobeRGB 1998) (%) | 36 | 57 | ||||
| Color Space (Percent of sRGB) (%) | 56 | 86 | ||||
| Média Total (Programa/Configurações) | -17% /
-15% | 0% /
7% | -7% /
6% | 5% /
-1% | 82% /
65% |
* ... menor é melhor
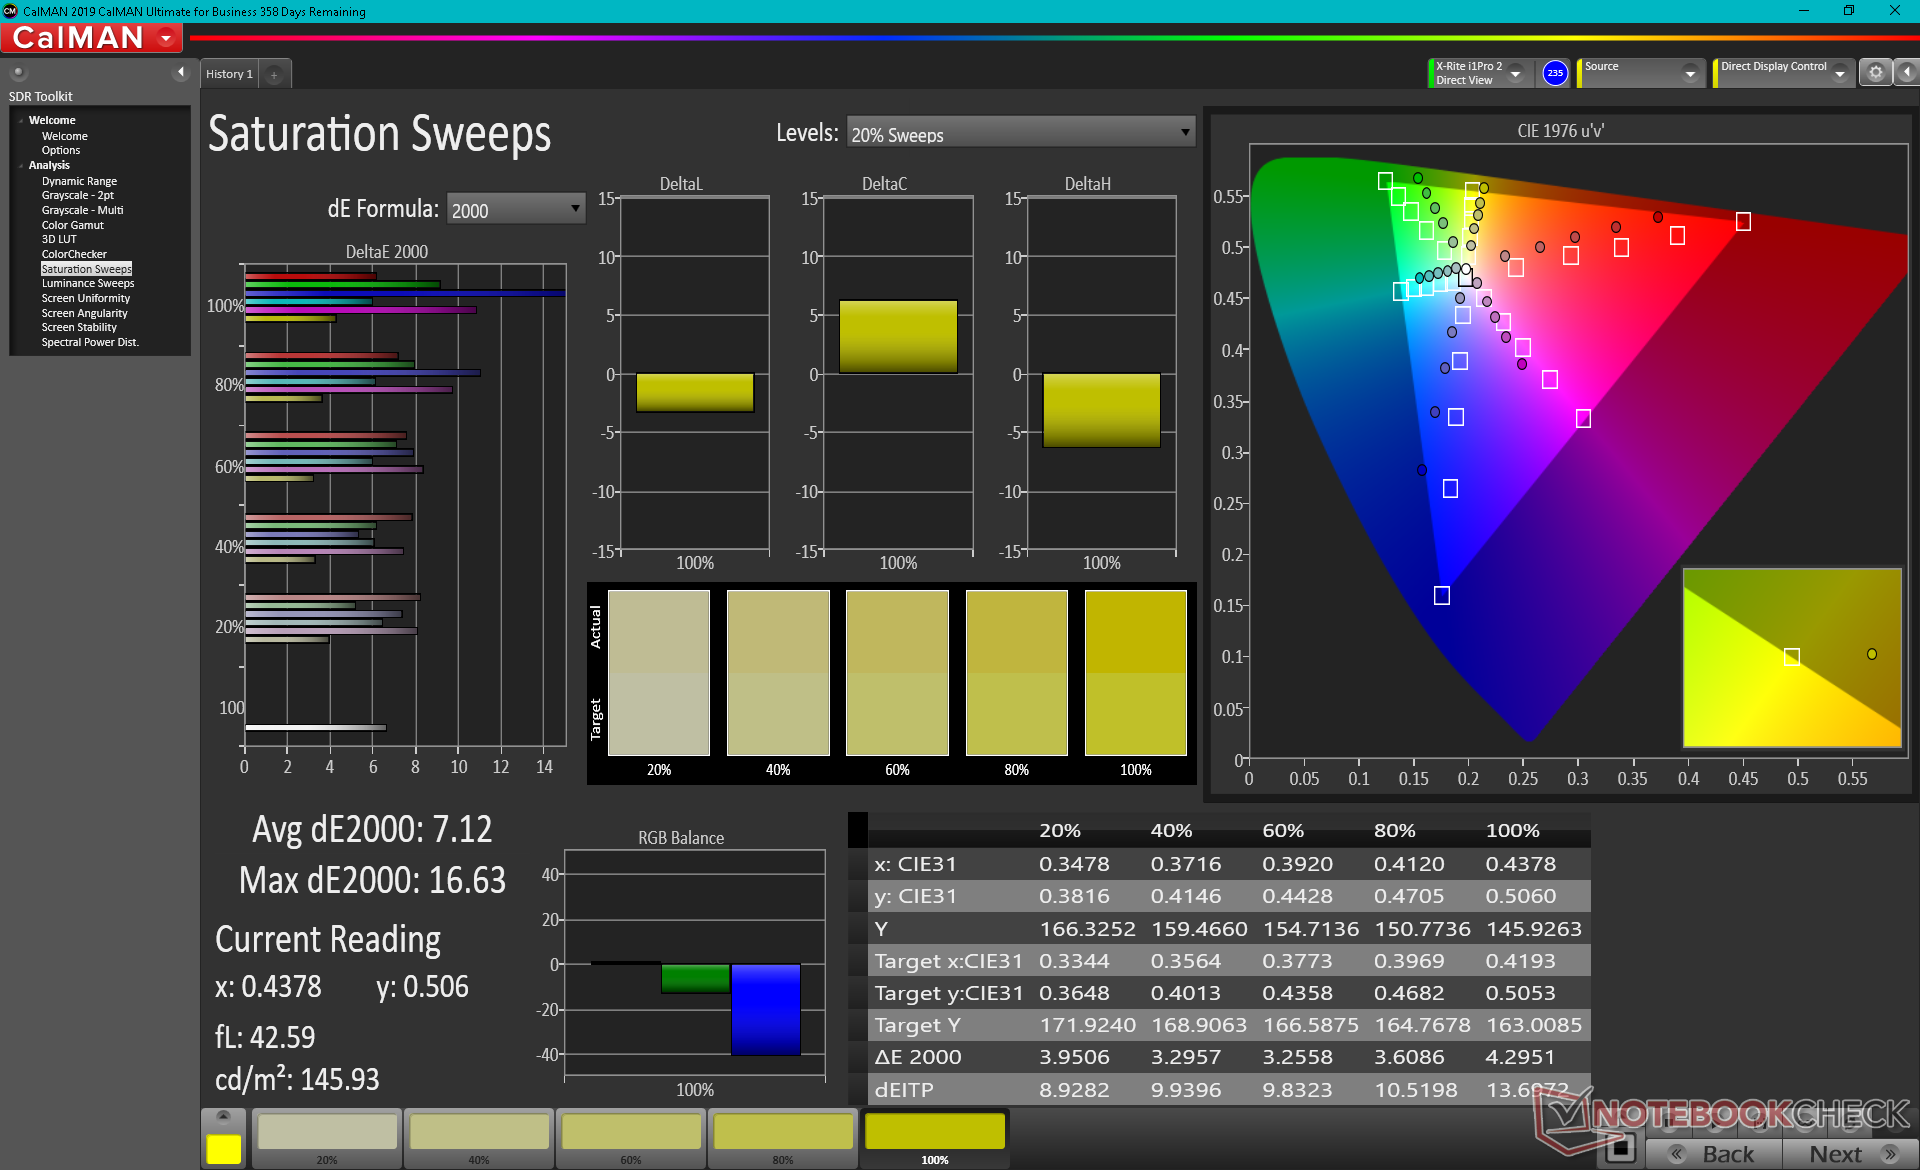
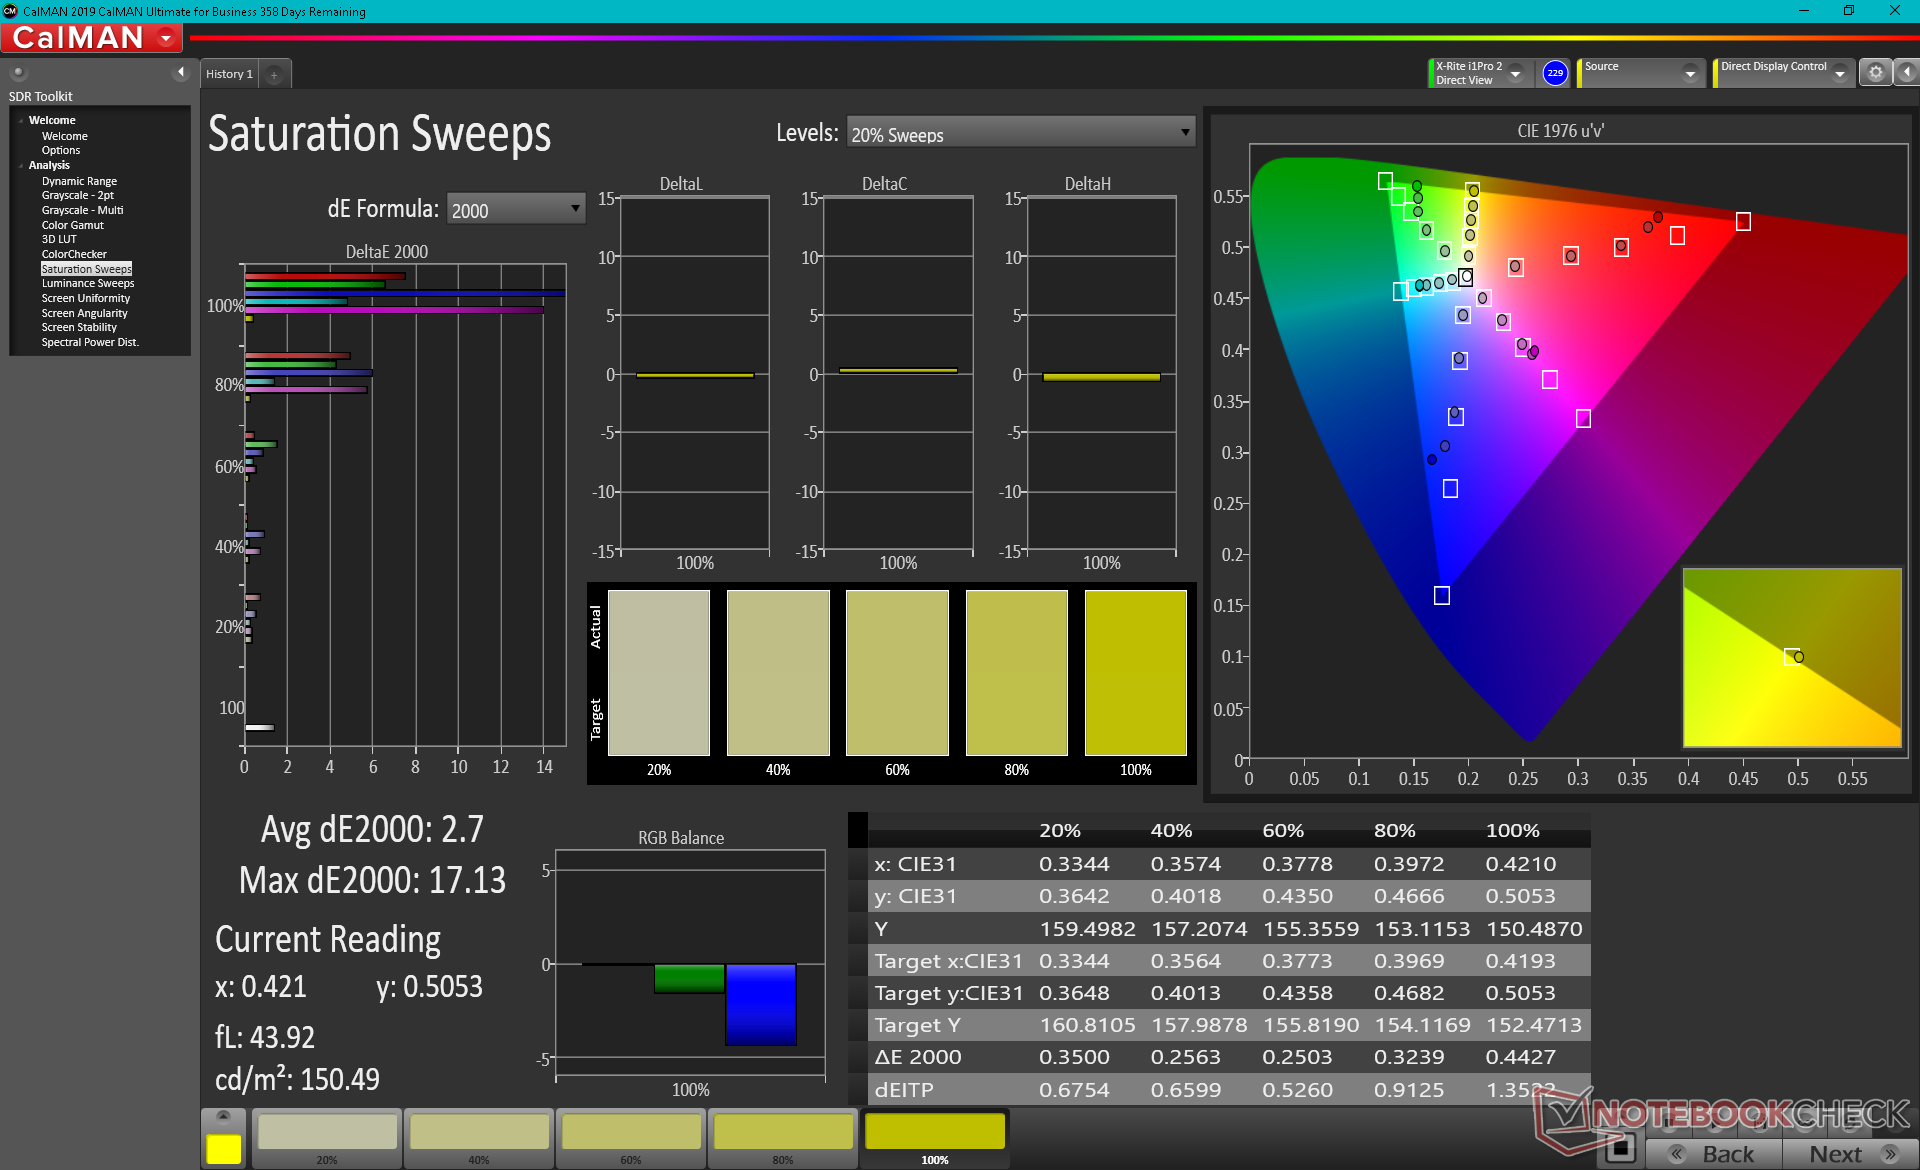
O espaço de cores é estreito em apenas 58% do sRGB em comparação com 90% ou mais em Ultrabooks de preço médio ou superior
A exibição não é bem calibrada fora da caixa como seria de se esperar na maioria dos laptops de orçamento. A temperatura da cor, por exemplo, é muito quente. Calibrar nós mesmos o painel com um colorímetro X-Rite melhoraria significativamente os valores médios do DeltaE, como mostram nossos resultados abaixo. No entanto, as cores ainda são imprecisas em altos níveis de saturação devido ao limitado espaço de cor mencionado acima, sendo o Azul o infrator mais notável
Exibir tempos de resposta
| ↔ Tempo de resposta preto para branco | ||
|---|---|---|
| 28.4 ms ... ascensão ↗ e queda ↘ combinadas | ↗ 17.2 ms ascensão | 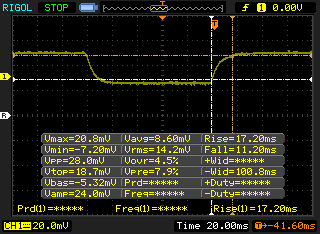 |
| ↘ 11.2 ms queda | ||
| A tela mostra taxas de resposta relativamente lentas em nossos testes e pode ser muito lenta para os jogadores. Em comparação, todos os dispositivos testados variam de 0.1 (mínimo) a 240 (máximo) ms. » 75 % de todos os dispositivos são melhores. Isso significa que o tempo de resposta medido é pior que a média de todos os dispositivos testados (19.8 ms). | ||
| ↔ Tempo de resposta 50% cinza a 80% cinza | ||
| 24.8 ms ... ascensão ↗ e queda ↘ combinadas | ↗ 10.8 ms ascensão | 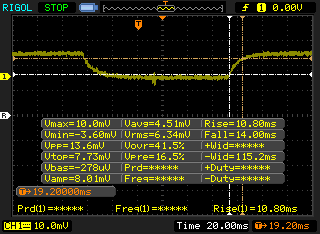 |
| ↘ 14 ms queda | ||
| A tela mostra boas taxas de resposta em nossos testes, mas pode ser muito lenta para jogadores competitivos. Em comparação, todos os dispositivos testados variam de 0.165 (mínimo) a 636 (máximo) ms. » 35 % de todos os dispositivos são melhores. Isso significa que o tempo de resposta medido é melhor que a média de todos os dispositivos testados (31 ms). | ||
Cintilação da tela / PWM (modulação por largura de pulso)
| Tela tremeluzindo / PWM não detectado | 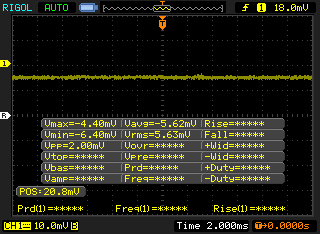 | ||
[pwm_comparison] Em comparação: 52 % de todos os dispositivos testados não usam PWM para escurecer a tela. Se PWM foi detectado, uma média de 7757 (mínimo: 5 - máximo: 343500) Hz foi medida. | |||
A visibilidade ao ar livre é decente quando sob a sombra, devido ao visor razoavelmente brilhante de 300 nit. Basta ter certeza de desativar o AMD Vari-Bright que é ativado por padrão através do software AMD ou então a luminosidade máxima diminuirá automaticamente ao funcionar com a bateria

Desempenho
Condições de teste
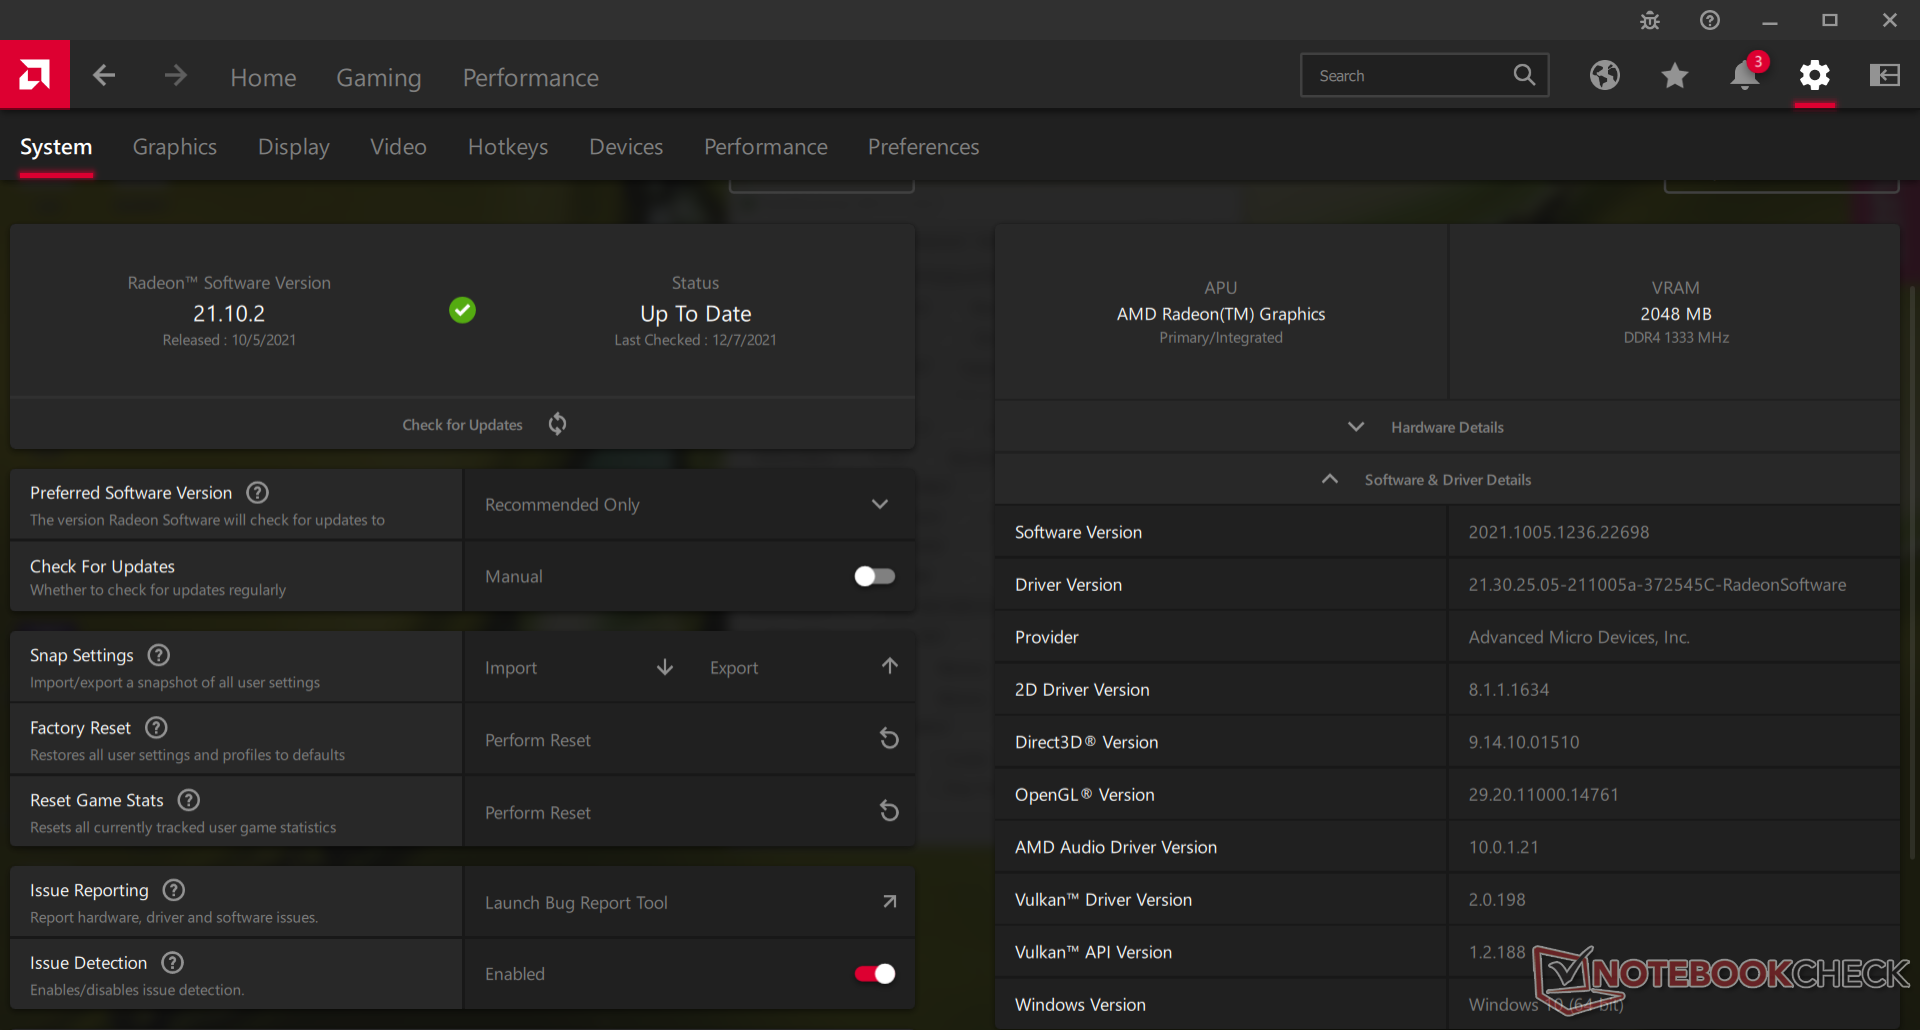
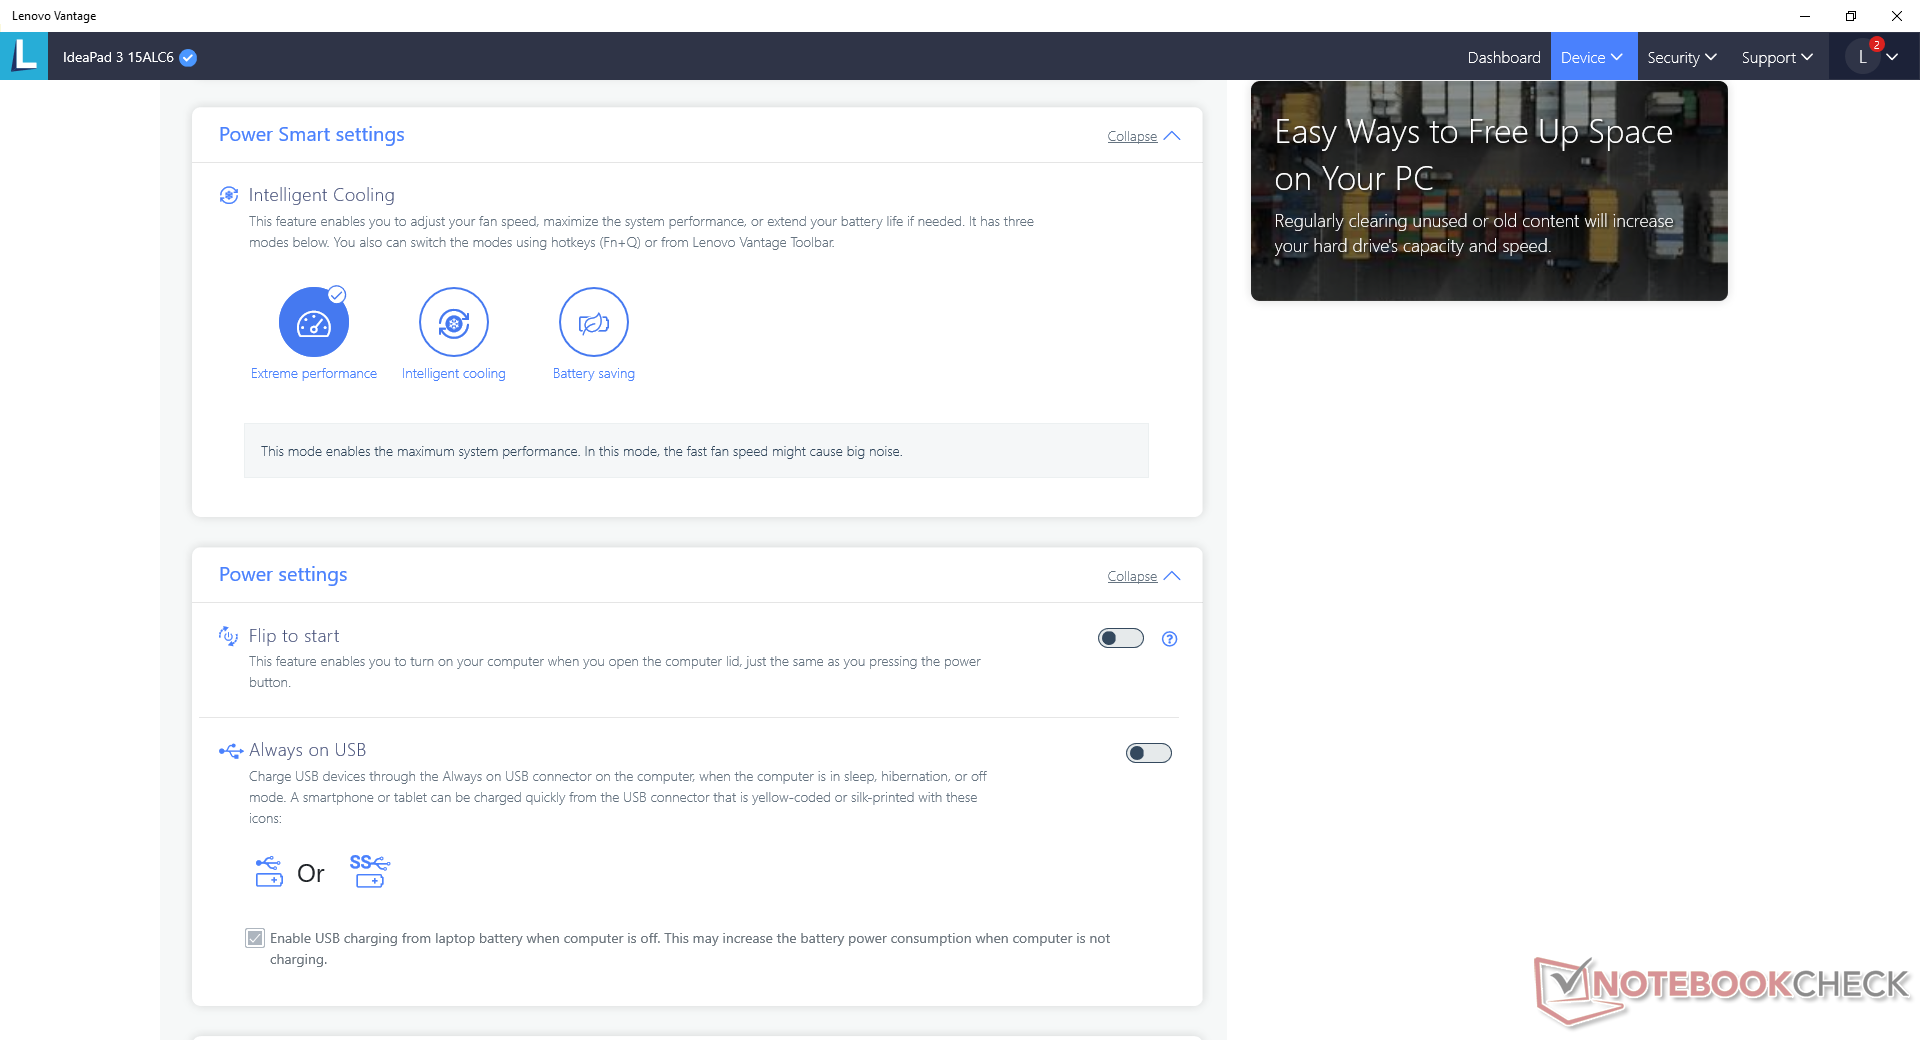
Nossa unidade foi configurada para o modo Extreme Performance através do software Lenovo Vantage pré-instalado para obter as mais altas pontuações de referência possíveis. Recomendamos aos usuários que se familiarizem tanto com o Vantage quanto com o software AMD Radeon, pois muitas das principais características e atualizações do sistema são alternadas aqui.
Processador - Rápido para um Ryzen 3
O desempenho bruto da CPU é excelente quando se considera que o Ryzen 3 está posicionado como uma alternativa Core i3. Sua vantagem mais marcante reside em seu desempenho multi-fio, que pode ser até 70 a 80 por cento mais rápido do que os concorrentes Núcleo i3-1115G4 desde o Ryzen 3 5300U processador tem o dobro dos núcleos físicos. O desempenho bruto multi-fio é na verdade comparável ao doNúcleo i7-1165G7 enquanto o desempenho com uma única linha é apenas cerca de 25% mais lento.
A sustentabilidade do desempenho é excelente, sem grandes problemas de estrangulamento ao executar o CineBench R15 xT em um loop contínuo.
Cinebench R15 Multi Loop
Cinebench R23: Multi Core | Single Core
Cinebench R20: CPU (Multi Core) | CPU (Single Core)
Cinebench R15: CPU Multi 64Bit | CPU Single 64Bit
Blender: v2.79 BMW27 CPU
7-Zip 18.03: 7z b 4 | 7z b 4 -mmt1
Geekbench 5.5: Multi-Core | Single-Core
HWBOT x265 Benchmark v2.2: 4k Preset
LibreOffice : 20 Documents To PDF
R Benchmark 2.5: Overall mean
| CPU Performance rating | |
| Asus VivoBook S15 D533UA | |
| MSI Prestige 15 A10SC -10! | |
| Asus VivoBook 15 KM513UA-L503TS | |
| HP Pavilion 15-eg -2! | |
| HP Pavilion x360 15-er0155ng | |
| Lenovo IdeaPad 3 15ALC6 | |
| Lenovo IdeaPad 5 15IIL05 -2! | |
| Média AMD Ryzen 3 5300U | |
| Lenovo Ideapad S540-15IML -10! | |
| Lenovo ThinkPad L15 G2-20X4S0KU00 | |
| Teclast TBOLT F15 Pro | |
| HP 255 G7 159P1EA | |
| Beelink U59 -2! | |
| Cinebench R23 / Multi Core | |
| Asus VivoBook S15 D533UA | |
| Asus VivoBook 15 KM513UA-L503TS | |
| Asus VivoBook 15 KM513UA-L503TS | |
| Lenovo IdeaPad 3 15ALC6 | |
| Média AMD Ryzen 3 5300U (4772 - 5522, n=3) | |
| HP Pavilion 15-eg | |
| HP Pavilion x360 15-er0155ng | |
| Lenovo ThinkPad L15 G2-20X4S0KU00 | |
| Beelink U59 | |
| Teclast TBOLT F15 Pro | |
| HP 255 G7 159P1EA | |
| Cinebench R23 / Single Core | |
| HP Pavilion 15-eg | |
| HP Pavilion x360 15-er0155ng | |
| Lenovo ThinkPad L15 G2-20X4S0KU00 | |
| Asus VivoBook S15 D533UA | |
| Asus VivoBook 15 KM513UA-L503TS | |
| Asus VivoBook 15 KM513UA-L503TS | |
| Lenovo IdeaPad 3 15ALC6 | |
| Média AMD Ryzen 3 5300U (1102 - 1129, n=3) | |
| Teclast TBOLT F15 Pro | |
| HP 255 G7 159P1EA | |
| Beelink U59 | |
| Cinebench R20 / CPU (Multi Core) | |
| Asus VivoBook S15 D533UA | |
| Asus VivoBook 15 KM513UA-L503TS | |
| Asus VivoBook 15 KM513UA-L503TS | |
| MSI Prestige 15 A10SC | |
| Lenovo IdeaPad 3 15ALC6 | |
| Média AMD Ryzen 3 5300U (1883 - 2138, n=4) | |
| HP Pavilion 15-eg | |
| Lenovo IdeaPad 5 15IIL05 | |
| HP Pavilion x360 15-er0155ng | |
| Lenovo Ideapad S540-15IML | |
| Lenovo ThinkPad L15 G2-20X4S0KU00 | |
| Beelink U59 | |
| Teclast TBOLT F15 Pro | |
| HP 255 G7 159P1EA | |
| Cinebench R20 / CPU (Single Core) | |
| HP Pavilion 15-eg | |
| HP Pavilion x360 15-er0155ng | |
| Lenovo ThinkPad L15 G2-20X4S0KU00 | |
| Asus VivoBook S15 D533UA | |
| MSI Prestige 15 A10SC | |
| Asus VivoBook 15 KM513UA-L503TS | |
| Asus VivoBook 15 KM513UA-L503TS | |
| Lenovo IdeaPad 3 15ALC6 | |
| Média AMD Ryzen 3 5300U (431 - 441, n=4) | |
| Lenovo IdeaPad 5 15IIL05 | |
| Lenovo Ideapad S540-15IML | |
| Teclast TBOLT F15 Pro | |
| HP 255 G7 159P1EA | |
| Beelink U59 | |
| Cinebench R15 / CPU Multi 64Bit | |
| Asus VivoBook S15 D533UA | |
| Asus VivoBook 15 KM513UA-L503TS | |
| Asus VivoBook 15 KM513UA-L503TS | |
| MSI Prestige 15 A10SC | |
| Lenovo IdeaPad 3 15ALC6 | |
| Média AMD Ryzen 3 5300U (832 - 915, n=3) | |
| Lenovo IdeaPad 5 15IIL05 | |
| HP Pavilion 15-eg | |
| HP Pavilion x360 15-er0155ng | |
| Lenovo Ideapad S540-15IML | |
| Lenovo ThinkPad L15 G2-20X4S0KU00 | |
| Beelink U59 | |
| HP 255 G7 159P1EA | |
| Teclast TBOLT F15 Pro | |
| Cinebench R15 / CPU Single 64Bit | |
| HP Pavilion 15-eg | |
| HP Pavilion x360 15-er0155ng | |
| Lenovo ThinkPad L15 G2-20X4S0KU00 | |
| MSI Prestige 15 A10SC | |
| Asus VivoBook S15 D533UA | |
| Asus VivoBook 15 KM513UA-L503TS | |
| Asus VivoBook 15 KM513UA-L503TS | |
| Lenovo Ideapad S540-15IML | |
| Lenovo IdeaPad 5 15IIL05 | |
| Lenovo IdeaPad 3 15ALC6 | |
| Média AMD Ryzen 3 5300U (166 - 170, n=3) | |
| Teclast TBOLT F15 Pro | |
| HP 255 G7 159P1EA | |
| Beelink U59 | |
| Blender / v2.79 BMW27 CPU | |
| Beelink U59 | |
| HP 255 G7 159P1EA | |
| Teclast TBOLT F15 Pro | |
| Lenovo ThinkPad L15 G2-20X4S0KU00 | |
| HP Pavilion x360 15-er0155ng | |
| Lenovo IdeaPad 5 15IIL05 | |
| HP Pavilion 15-eg | |
| Média AMD Ryzen 3 5300U (524 - 617, n=3) | |
| Lenovo IdeaPad 3 15ALC6 | |
| Asus VivoBook 15 KM513UA-L503TS | |
| Asus VivoBook 15 KM513UA-L503TS | |
| Asus VivoBook S15 D533UA | |
| 7-Zip 18.03 / 7z b 4 | |
| Asus VivoBook S15 D533UA | |
| Asus VivoBook 15 KM513UA-L503TS | |
| Asus VivoBook 15 KM513UA-L503TS | |
| Lenovo IdeaPad 3 15ALC6 | |
| HP Pavilion 15-eg | |
| HP Pavilion x360 15-er0155ng | |
| Média AMD Ryzen 3 5300U (19170 - 24366, n=3) | |
| Lenovo IdeaPad 5 15IIL05 | |
| Lenovo ThinkPad L15 G2-20X4S0KU00 | |
| Beelink U59 | |
| Teclast TBOLT F15 Pro | |
| HP 255 G7 159P1EA | |
| 7-Zip 18.03 / 7z b 4 -mmt1 | |
| HP Pavilion 15-eg | |
| HP Pavilion x360 15-er0155ng | |
| Asus VivoBook S15 D533UA | |
| Lenovo ThinkPad L15 G2-20X4S0KU00 | |
| Asus VivoBook 15 KM513UA-L503TS | |
| Asus VivoBook 15 KM513UA-L503TS | |
| Lenovo IdeaPad 5 15IIL05 | |
| Lenovo IdeaPad 3 15ALC6 | |
| Média AMD Ryzen 3 5300U (3755 - 4198, n=3) | |
| Teclast TBOLT F15 Pro | |
| HP 255 G7 159P1EA | |
| Beelink U59 | |
| Geekbench 5.5 / Multi-Core | |
| Asus VivoBook S15 D533UA | |
| Asus VivoBook 15 KM513UA-L503TS | |
| Asus VivoBook 15 KM513UA-L503TS | |
| HP Pavilion x360 15-er0155ng | |
| Lenovo IdeaPad 3 15ALC6 | |
| Lenovo IdeaPad 5 15IIL05 | |
| Média AMD Ryzen 3 5300U (3730 - 4191, n=3) | |
| Teclast TBOLT F15 Pro | |
| Lenovo ThinkPad L15 G2-20X4S0KU00 | |
| HP 255 G7 159P1EA | |
| Geekbench 5.5 / Single-Core | |
| HP Pavilion x360 15-er0155ng | |
| Lenovo ThinkPad L15 G2-20X4S0KU00 | |
| Lenovo IdeaPad 5 15IIL05 | |
| Asus VivoBook S15 D533UA | |
| Teclast TBOLT F15 Pro | |
| Asus VivoBook 15 KM513UA-L503TS | |
| Asus VivoBook 15 KM513UA-L503TS | |
| Lenovo IdeaPad 3 15ALC6 | |
| Média AMD Ryzen 3 5300U (1040 - 1080, n=3) | |
| HP 255 G7 159P1EA | |
| HWBOT x265 Benchmark v2.2 / 4k Preset | |
| Asus VivoBook S15 D533UA | |
| Asus VivoBook 15 KM513UA-L503TS | |
| Asus VivoBook 15 KM513UA-L503TS | |
| Lenovo IdeaPad 3 15ALC6 | |
| HP Pavilion 15-eg | |
| Lenovo IdeaPad 5 15IIL05 | |
| Média AMD Ryzen 3 5300U (5.87 - 6.74, n=3) | |
| HP Pavilion x360 15-er0155ng | |
| Lenovo ThinkPad L15 G2-20X4S0KU00 | |
| Teclast TBOLT F15 Pro | |
| Beelink U59 | |
| HP 255 G7 159P1EA | |
| LibreOffice / 20 Documents To PDF | |
| Beelink U59 | |
| HP 255 G7 159P1EA | |
| Teclast TBOLT F15 Pro | |
| Média AMD Ryzen 3 5300U (63.4 - 77.1, n=3) | |
| Lenovo IdeaPad 3 15ALC6 | |
| Asus VivoBook 15 KM513UA-L503TS | |
| Asus VivoBook S15 D533UA | |
| Lenovo IdeaPad 5 15IIL05 | |
| Lenovo ThinkPad L15 G2-20X4S0KU00 | |
| HP Pavilion x360 15-er0155ng | |
| HP Pavilion 15-eg | |
| R Benchmark 2.5 / Overall mean | |
| Beelink U59 | |
| HP 255 G7 159P1EA | |
| Teclast TBOLT F15 Pro | |
| Lenovo IdeaPad 5 15IIL05 | |
| Lenovo ThinkPad L15 G2-20X4S0KU00 | |
| Média AMD Ryzen 3 5300U (0.654 - 0.664, n=3) | |
| Lenovo IdeaPad 3 15ALC6 | |
| Asus VivoBook 15 KM513UA-L503TS | |
| Asus VivoBook 15 KM513UA-L503TS | |
| HP Pavilion x360 15-er0155ng | |
| Asus VivoBook S15 D533UA | |
| HP Pavilion 15-eg | |
Cinebench R23: Multi Core | Single Core
Cinebench R20: CPU (Multi Core) | CPU (Single Core)
Cinebench R15: CPU Multi 64Bit | CPU Single 64Bit
Blender: v2.79 BMW27 CPU
7-Zip 18.03: 7z b 4 | 7z b 4 -mmt1
Geekbench 5.5: Multi-Core | Single-Core
HWBOT x265 Benchmark v2.2: 4k Preset
LibreOffice : 20 Documents To PDF
R Benchmark 2.5: Overall mean
* ... menor é melhor
AIDA64: FP32 Ray-Trace | FPU Julia | CPU SHA3 | CPU Queen | FPU SinJulia | FPU Mandel | CPU AES | CPU ZLib | FP64 Ray-Trace | CPU PhotoWorxx
| Performance rating | |
| Asus VivoBook 15 KM513UA-L503TS | |
| HP Pavilion 15-eg | |
| Lenovo IdeaPad 3 15ALC6 | |
| Lenovo IdeaPad 5 15IIL05 | |
| Dell Inspiron 15 3501 | |
| Média AMD Ryzen 3 5300U | |
| AIDA64 / FP32 Ray-Trace | |
| Asus VivoBook 15 KM513UA-L503TS | |
| Lenovo IdeaPad 3 15ALC6 | |
| Lenovo IdeaPad 5 15IIL05 | |
| HP Pavilion 15-eg | |
| Dell Inspiron 15 3501 | |
| Média AMD Ryzen 3 5300U (3612 - 7053, n=3) | |
| AIDA64 / FPU Julia | |
| Asus VivoBook 15 KM513UA-L503TS | |
| Lenovo IdeaPad 3 15ALC6 | |
| Média AMD Ryzen 3 5300U (33606 - 37829, n=3) | |
| Lenovo IdeaPad 5 15IIL05 | |
| HP Pavilion 15-eg | |
| Dell Inspiron 15 3501 | |
| AIDA64 / CPU SHA3 | |
| Lenovo IdeaPad 5 15IIL05 | |
| HP Pavilion 15-eg | |
| Dell Inspiron 15 3501 | |
| Asus VivoBook 15 KM513UA-L503TS | |
| Lenovo IdeaPad 3 15ALC6 | |
| Média AMD Ryzen 3 5300U (1244 - 1248, n=2) | |
| AIDA64 / CPU Queen | |
| Asus VivoBook 15 KM513UA-L503TS | |
| Lenovo IdeaPad 3 15ALC6 | |
| Média AMD Ryzen 3 5300U (51280 - 51454, n=3) | |
| HP Pavilion 15-eg | |
| Dell Inspiron 15 3501 | |
| Lenovo IdeaPad 5 15IIL05 | |
| AIDA64 / FPU SinJulia | |
| Asus VivoBook 15 KM513UA-L503TS | |
| Lenovo IdeaPad 3 15ALC6 | |
| Média AMD Ryzen 3 5300U (6686 - 6703, n=3) | |
| HP Pavilion 15-eg | |
| Dell Inspiron 15 3501 | |
| Lenovo IdeaPad 5 15IIL05 | |
| AIDA64 / FPU Mandel | |
| Asus VivoBook 15 KM513UA-L503TS | |
| Lenovo IdeaPad 3 15ALC6 | |
| Média AMD Ryzen 3 5300U (17564 - 20109, n=3) | |
| HP Pavilion 15-eg | |
| Lenovo IdeaPad 5 15IIL05 | |
| Dell Inspiron 15 3501 | |
| AIDA64 / CPU AES | |
| HP Pavilion 15-eg | |
| Dell Inspiron 15 3501 | |
| Lenovo IdeaPad 5 15IIL05 | |
| Asus VivoBook 15 KM513UA-L503TS | |
| Lenovo IdeaPad 3 15ALC6 | |
| Média AMD Ryzen 3 5300U (19307 - 34964, n=3) | |
| AIDA64 / CPU ZLib | |
| Asus VivoBook 15 KM513UA-L503TS | |
| Lenovo IdeaPad 3 15ALC6 | |
| Média AMD Ryzen 3 5300U (374 - 396, n=3) | |
| Dell Inspiron 15 3501 | |
| Lenovo IdeaPad 5 15IIL05 | |
| HP Pavilion 15-eg | |
| AIDA64 / FP64 Ray-Trace | |
| Asus VivoBook 15 KM513UA-L503TS | |
| Lenovo IdeaPad 3 15ALC6 | |
| Média AMD Ryzen 3 5300U (3199 - 3768, n=3) | |
| Lenovo IdeaPad 5 15IIL05 | |
| Dell Inspiron 15 3501 | |
| HP Pavilion 15-eg | |
| AIDA64 / CPU PhotoWorxx | |
| HP Pavilion 15-eg | |
| Lenovo IdeaPad 5 15IIL05 | |
| Lenovo IdeaPad 3 15ALC6 | |
| Dell Inspiron 15 3501 | |
| Média AMD Ryzen 3 5300U (16799 - 17037, n=3) | |
| Asus VivoBook 15 KM513UA-L503TS | |
Desempenho do sistema
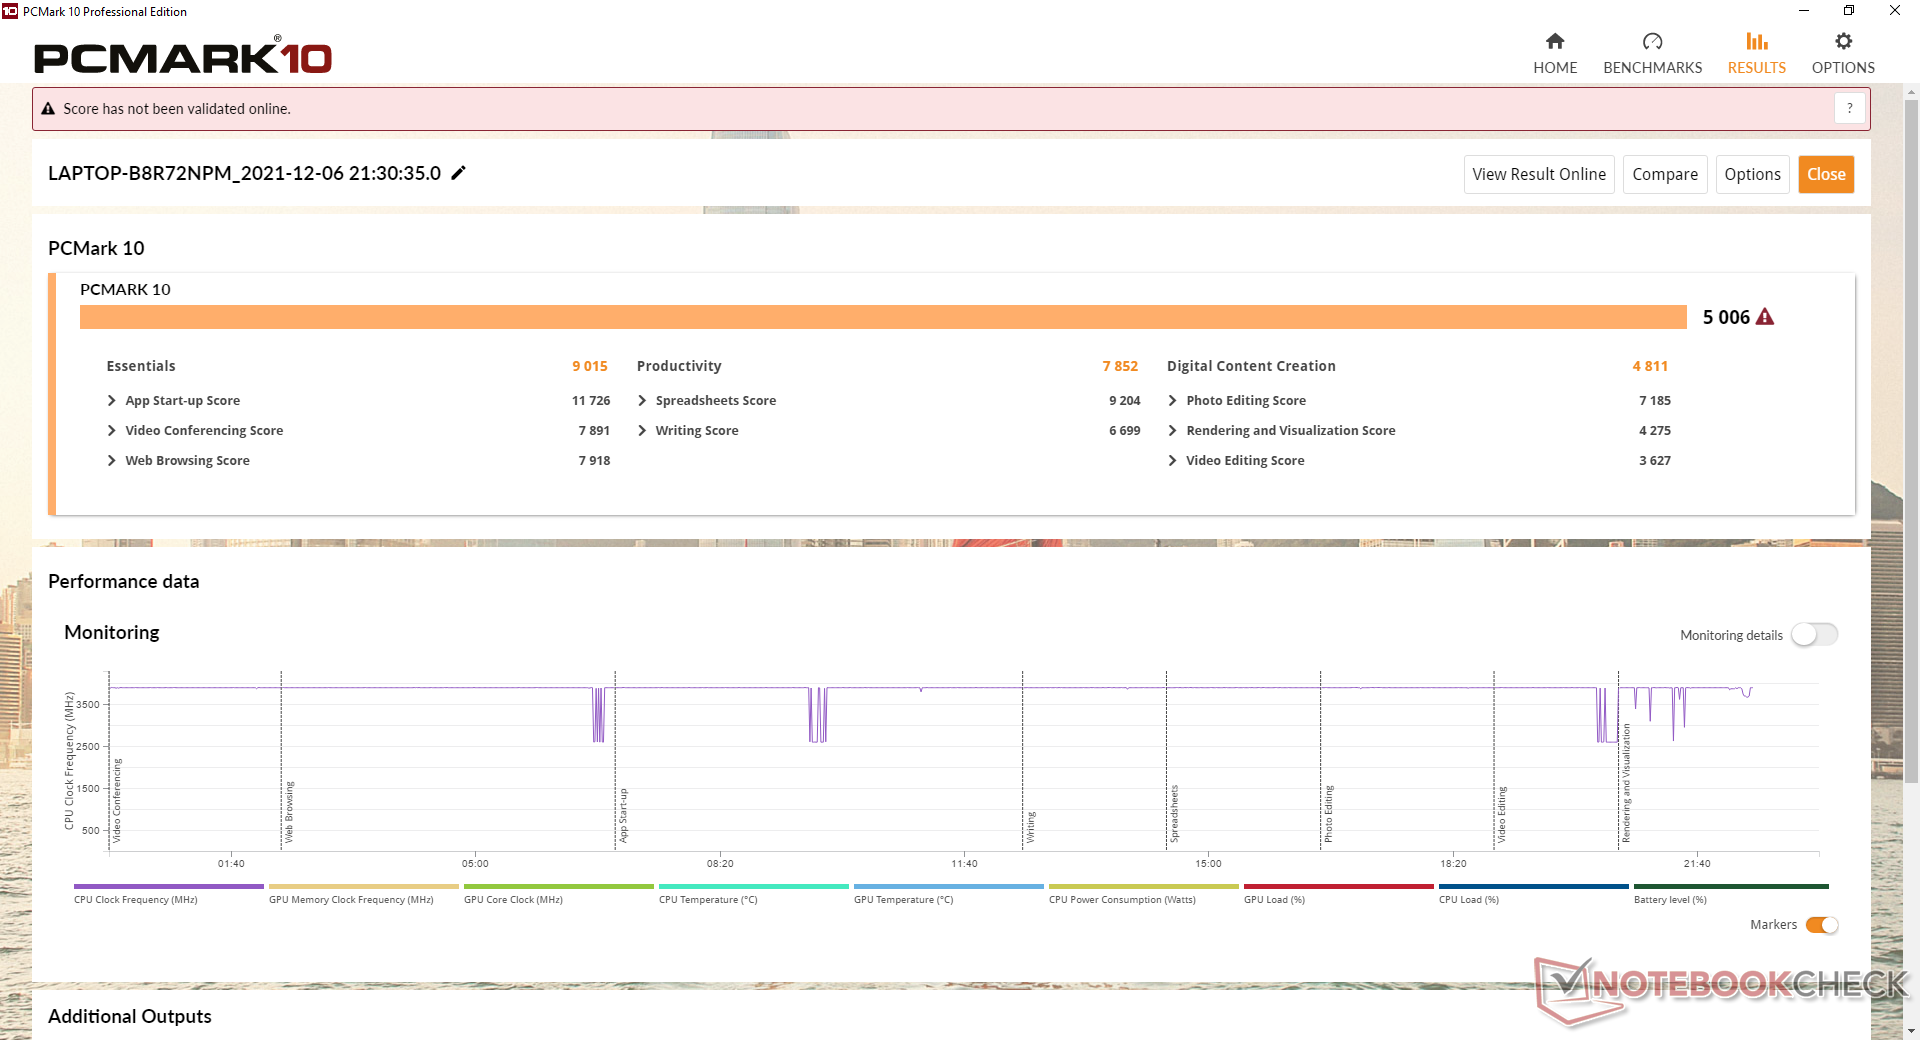
Os resultados da PCMark são comparáveis aos laptops executados no Intel Core i7-1165G7 mais caro, como o Dell Inspiron 15 3501. A experiência da IU é igualmente suave e amanteigada, apesar de "apenas" funcionar com uma CPU Ryzen 3 de orçamento.
| PCMark 10 / Score | |
| HP Pavilion 15-eg | |
| Asus VivoBook 15 KM513UA-L503TS | |
| Lenovo IdeaPad 3 15ALC6 | |
| Dell Inspiron 15 3501 | |
| Média AMD Ryzen 3 5300U, AMD Radeon RX Vega 6 (Ryzen 4000/5000) (4299 - 5006, n=3) | |
| Lenovo Ideapad S540-15IML | |
| Lenovo IdeaPad 5 15IIL05 | |
| PCMark 10 / Essentials | |
| HP Pavilion 15-eg | |
| Dell Inspiron 15 3501 | |
| Lenovo Ideapad S540-15IML | |
| Asus VivoBook 15 KM513UA-L503TS | |
| Lenovo IdeaPad 3 15ALC6 | |
| Média AMD Ryzen 3 5300U, AMD Radeon RX Vega 6 (Ryzen 4000/5000) (7833 - 9015, n=3) | |
| Lenovo IdeaPad 5 15IIL05 | |
| PCMark 10 / Productivity | |
| HP Pavilion 15-eg | |
| Lenovo IdeaPad 3 15ALC6 | |
| Asus VivoBook 15 KM513UA-L503TS | |
| Lenovo Ideapad S540-15IML | |
| Média AMD Ryzen 3 5300U, AMD Radeon RX Vega 6 (Ryzen 4000/5000) (6596 - 7852, n=3) | |
| Lenovo IdeaPad 5 15IIL05 | |
| Dell Inspiron 15 3501 | |
| PCMark 10 / Digital Content Creation | |
| HP Pavilion 15-eg | |
| Asus VivoBook 15 KM513UA-L503TS | |
| Dell Inspiron 15 3501 | |
| Lenovo IdeaPad 3 15ALC6 | |
| Média AMD Ryzen 3 5300U, AMD Radeon RX Vega 6 (Ryzen 4000/5000) (4136 - 4811, n=3) | |
| Lenovo IdeaPad 5 15IIL05 | |
| Lenovo Ideapad S540-15IML | |
| PCMark 10 Score | 5006 pontos | |
Ajuda | ||
| AIDA64 / Memory Copy | |
| HP Pavilion 15-eg | |
| Asus VivoBook 15 KM513UA-L503TS | |
| Lenovo IdeaPad 5 15IIL05 | |
| Média AMD Ryzen 3 5300U (30710 - 36092, n=3) | |
| Lenovo IdeaPad 3 15ALC6 | |
| Dell Inspiron 15 3501 | |
| AIDA64 / Memory Read | |
| HP Pavilion 15-eg | |
| Asus VivoBook 15 KM513UA-L503TS | |
| Lenovo IdeaPad 5 15IIL05 | |
| Dell Inspiron 15 3501 | |
| Lenovo IdeaPad 3 15ALC6 | |
| Média AMD Ryzen 3 5300U (34493 - 35443, n=3) | |
| AIDA64 / Memory Write | |
| HP Pavilion 15-eg | |
| Lenovo IdeaPad 5 15IIL05 | |
| Média AMD Ryzen 3 5300U (38052 - 40554, n=3) | |
| Asus VivoBook 15 KM513UA-L503TS | |
| Lenovo IdeaPad 3 15ALC6 | |
| Dell Inspiron 15 3501 | |
| AIDA64 / Memory Latency | |
| Média AMD Ryzen 3 5300U (97.1 - 113.5, n=3) | |
| Lenovo IdeaPad 3 15ALC6 | |
| Asus VivoBook 15 KM513UA-L503TS | |
| Dell Inspiron 15 3501 | |
| Lenovo IdeaPad 5 15IIL05 | |
| HP Pavilion 15-eg | |
* ... menor é melhor
Latência do DPC
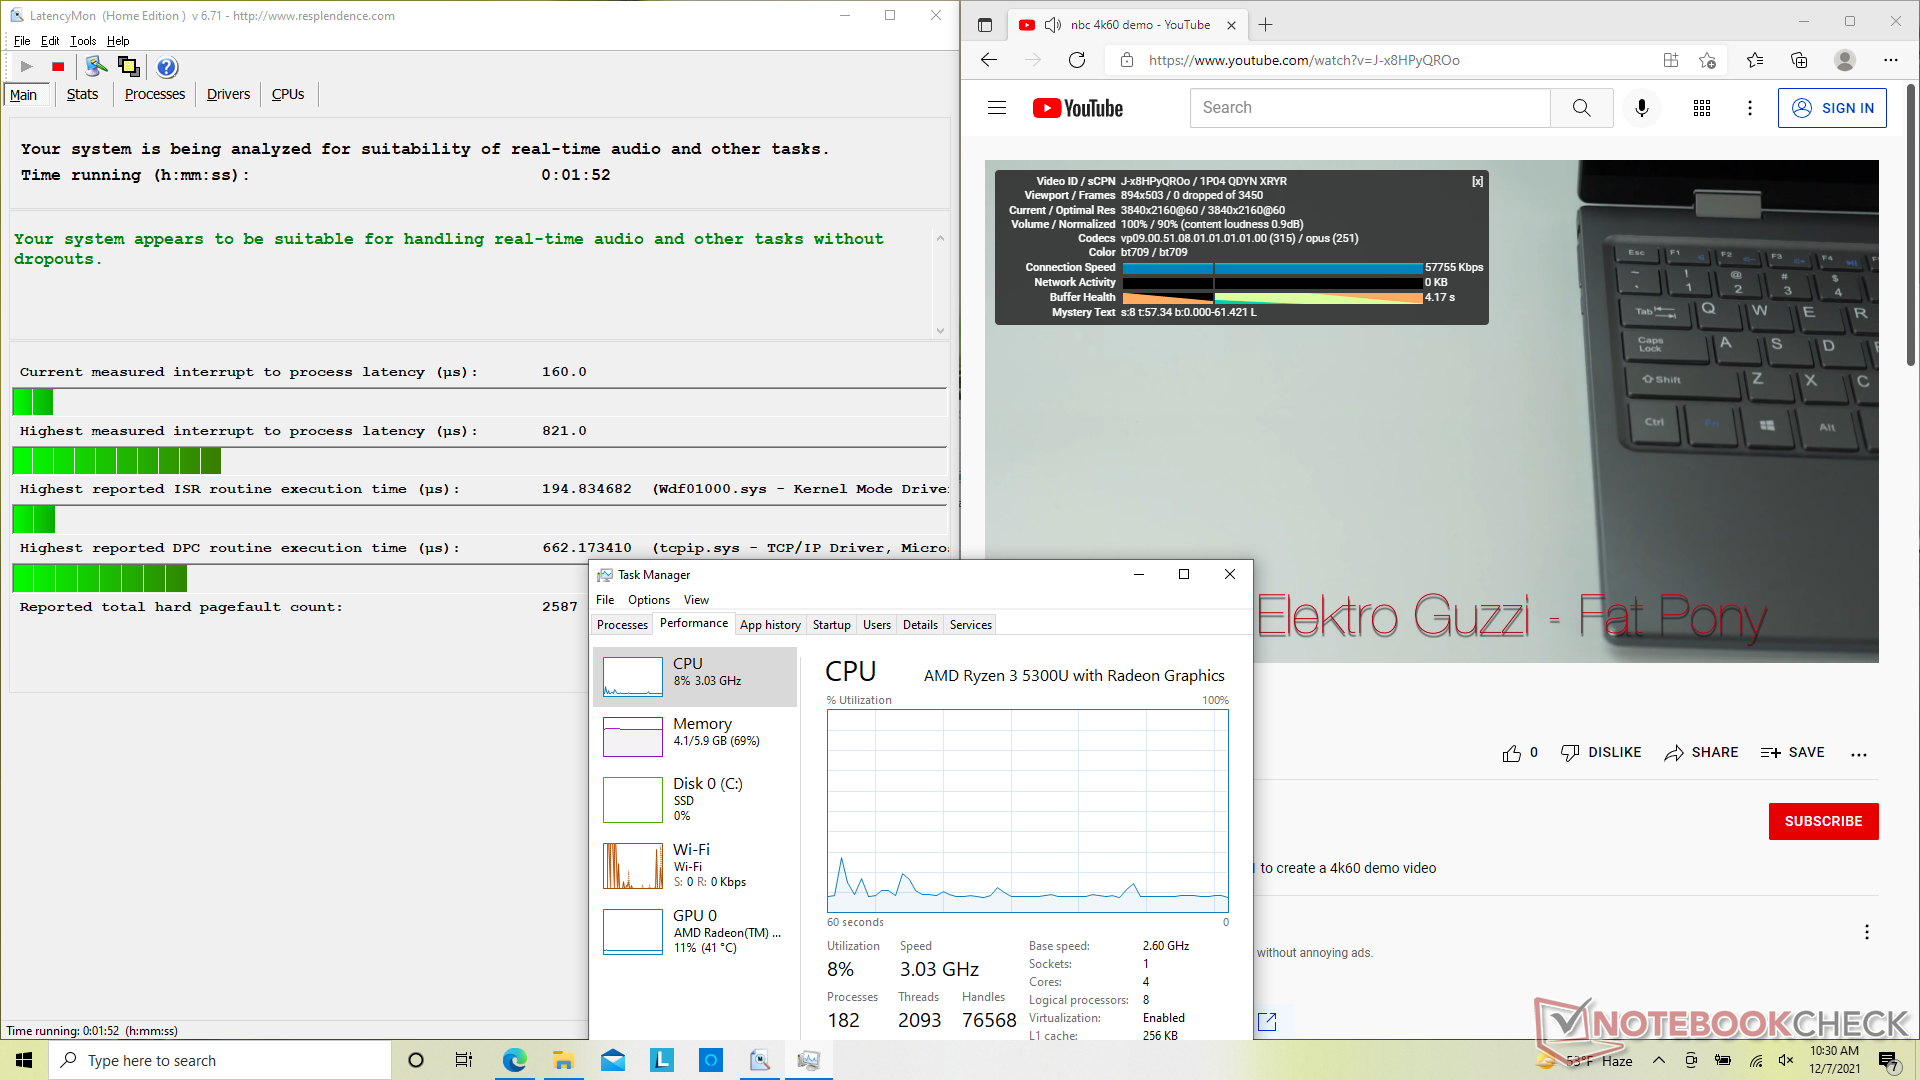
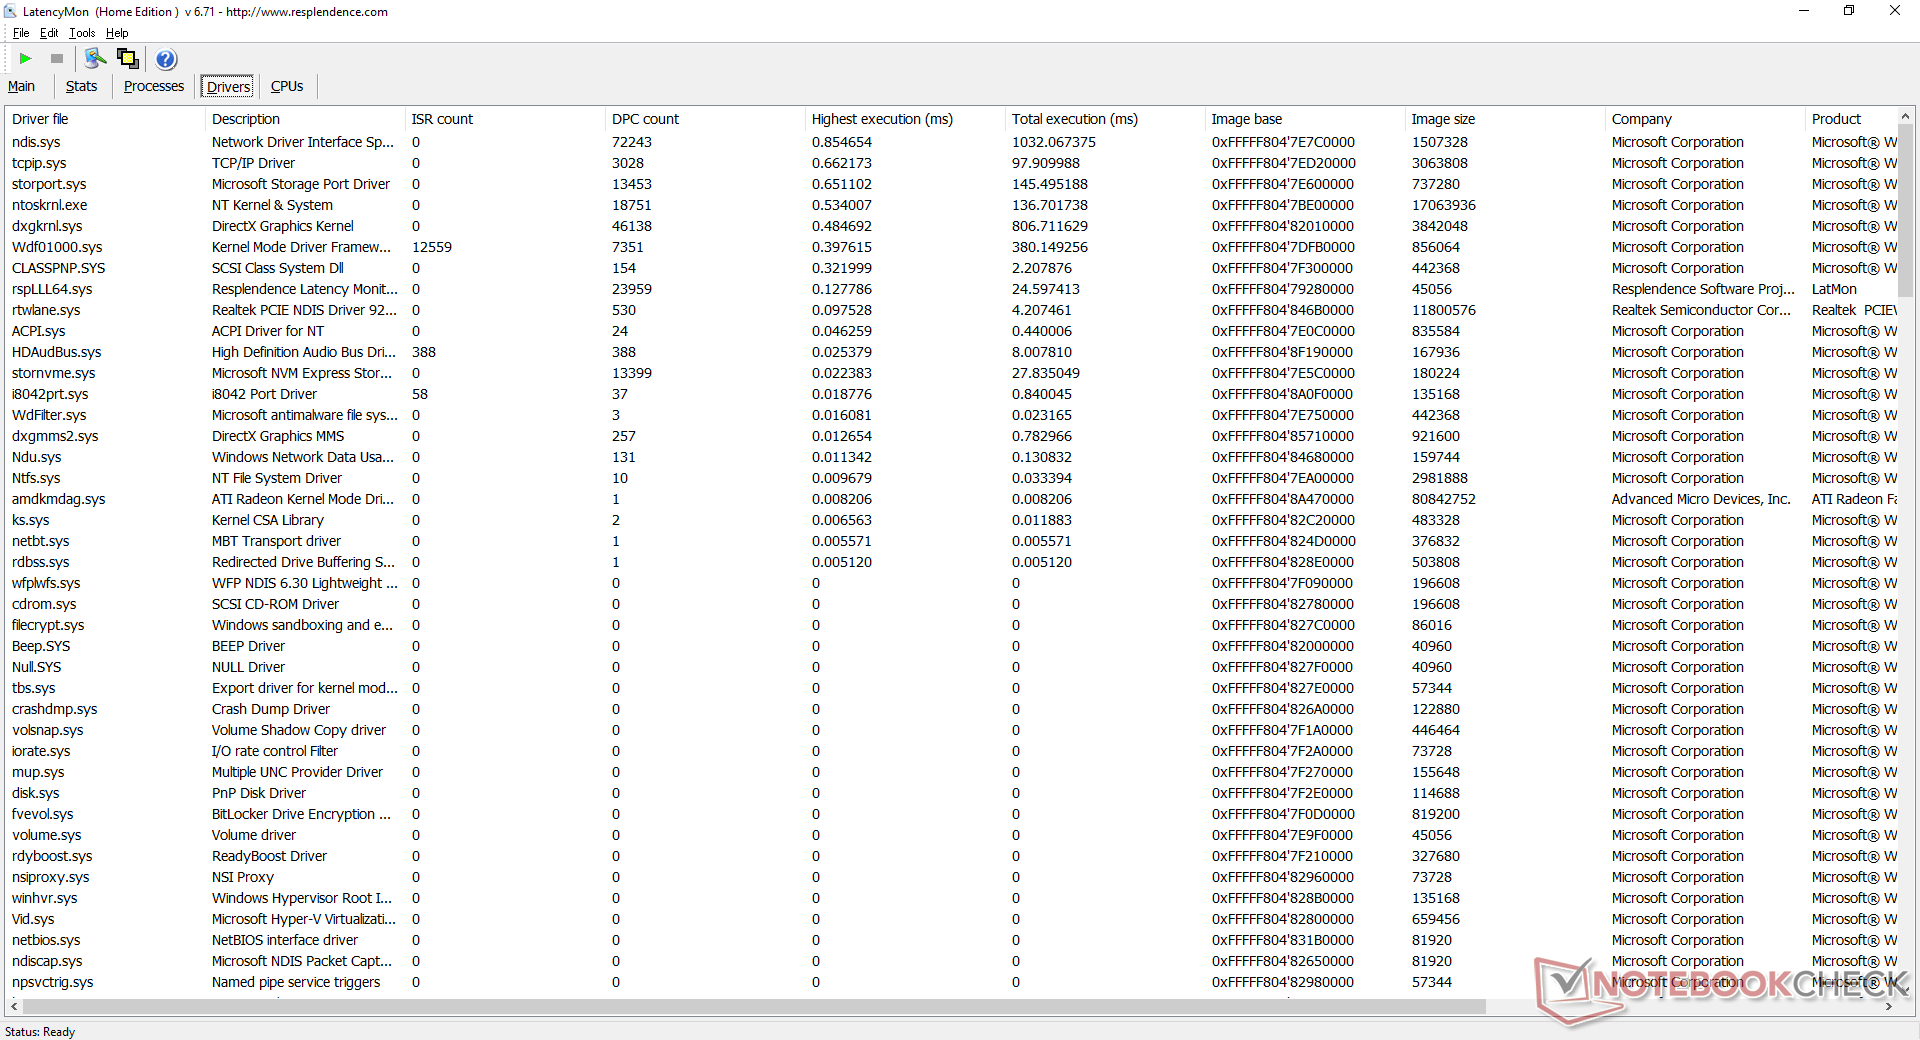
LatencyMon não mostra problemas de latência ao abrir várias abas do navegador em nossa página inicial. A reprodução de vídeo de 4K a 60 FPS é perfeita com utilização mínima de CPU e GPU e sem queda de quadros.
| DPC Latencies / LatencyMon - interrupt to process latency (max), Web, Youtube, Prime95 | |
| HP Pavilion 15-eg | |
| Asus VivoBook 15 KM513UA-L503TS | |
| Dell Inspiron 15 3501 | |
| Lenovo IdeaPad 3 15ALC6 | |
| Lenovo IdeaPad 5 15IIL05 | |
* ... menor é melhor
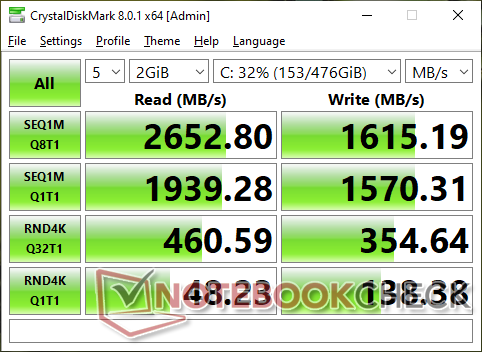
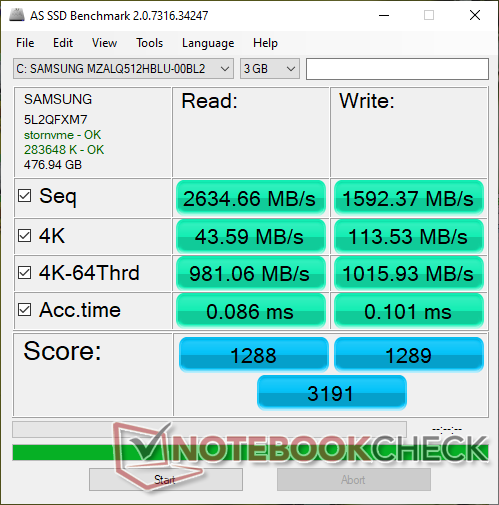
Dispositivos de armazenamento - Apenas uma ranhura M.2 2280 PCIe3 x4
Os 512 GB Samsung PM991a é um SSD PCIe3 x4 NVMe midrange superior com taxas teóricas sequenciais de leitura e escrita de 3100 MB/s e 1800 MB/s, respectivamente, de acordo com as especificações oficiais da Samsung. Entretanto, a unidade em nossa Lenovo é um pouco mais lenta com taxas de leitura e escrita no mundo real que se aproximam apenas de 2700 MB/s e 1600 MB/s, respectivamente. O desempenho parece ser mais lento se for submetido a longos períodos de estresse, como mostra nosso teste de Loop de Leitura DiskSpd abaixo, provavelmente devido a razões térmicas.

| Drive Performance rating - Percent | |
| Lenovo Ideapad S540-15IML -8! | |
| Dell Inspiron 15 3501 | |
| Lenovo IdeaPad 3 15ALC6 | |
| HP Pavilion 15-eg | |
| Lenovo IdeaPad 5 15IIL05 | |
| Asus VivoBook 15 KM513UA-L503TS | |
* ... menor é melhor
Disk Throttling: DiskSpd Read Loop, Queue Depth 8
Desempenho da GPU - Muito melhor que UHD Graphics 620
O desempenho gráfico bruto é 30 a 50 por cento mais rápido do que o Iris Xe G4 48 EUs como encontrado em muitas CPUs Intel Core i3 do 11º gênero ou aproximadamente 2x mais rápido que as comuns UHD Graphics 620. Embora o aumento de velocidade seja notável, ainda não é suficiente para executar bem a maioria dos jogos em resoluções superiores a 720p. Atualização para o Ryzen 7 5700U SKU com seu mais potenteRadeon RX Vega 8 irá aumentar o desempenho em cerca de 30% em relação ao nossoRadeon RX Vega 6.
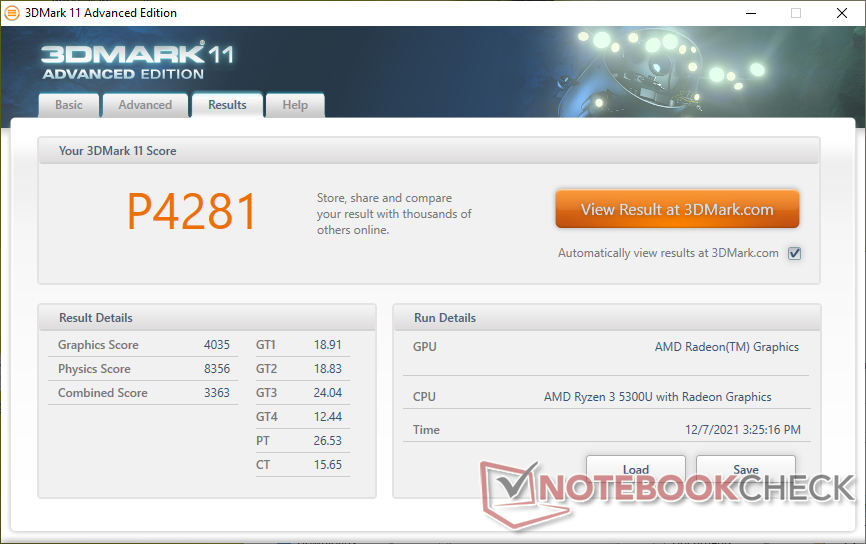
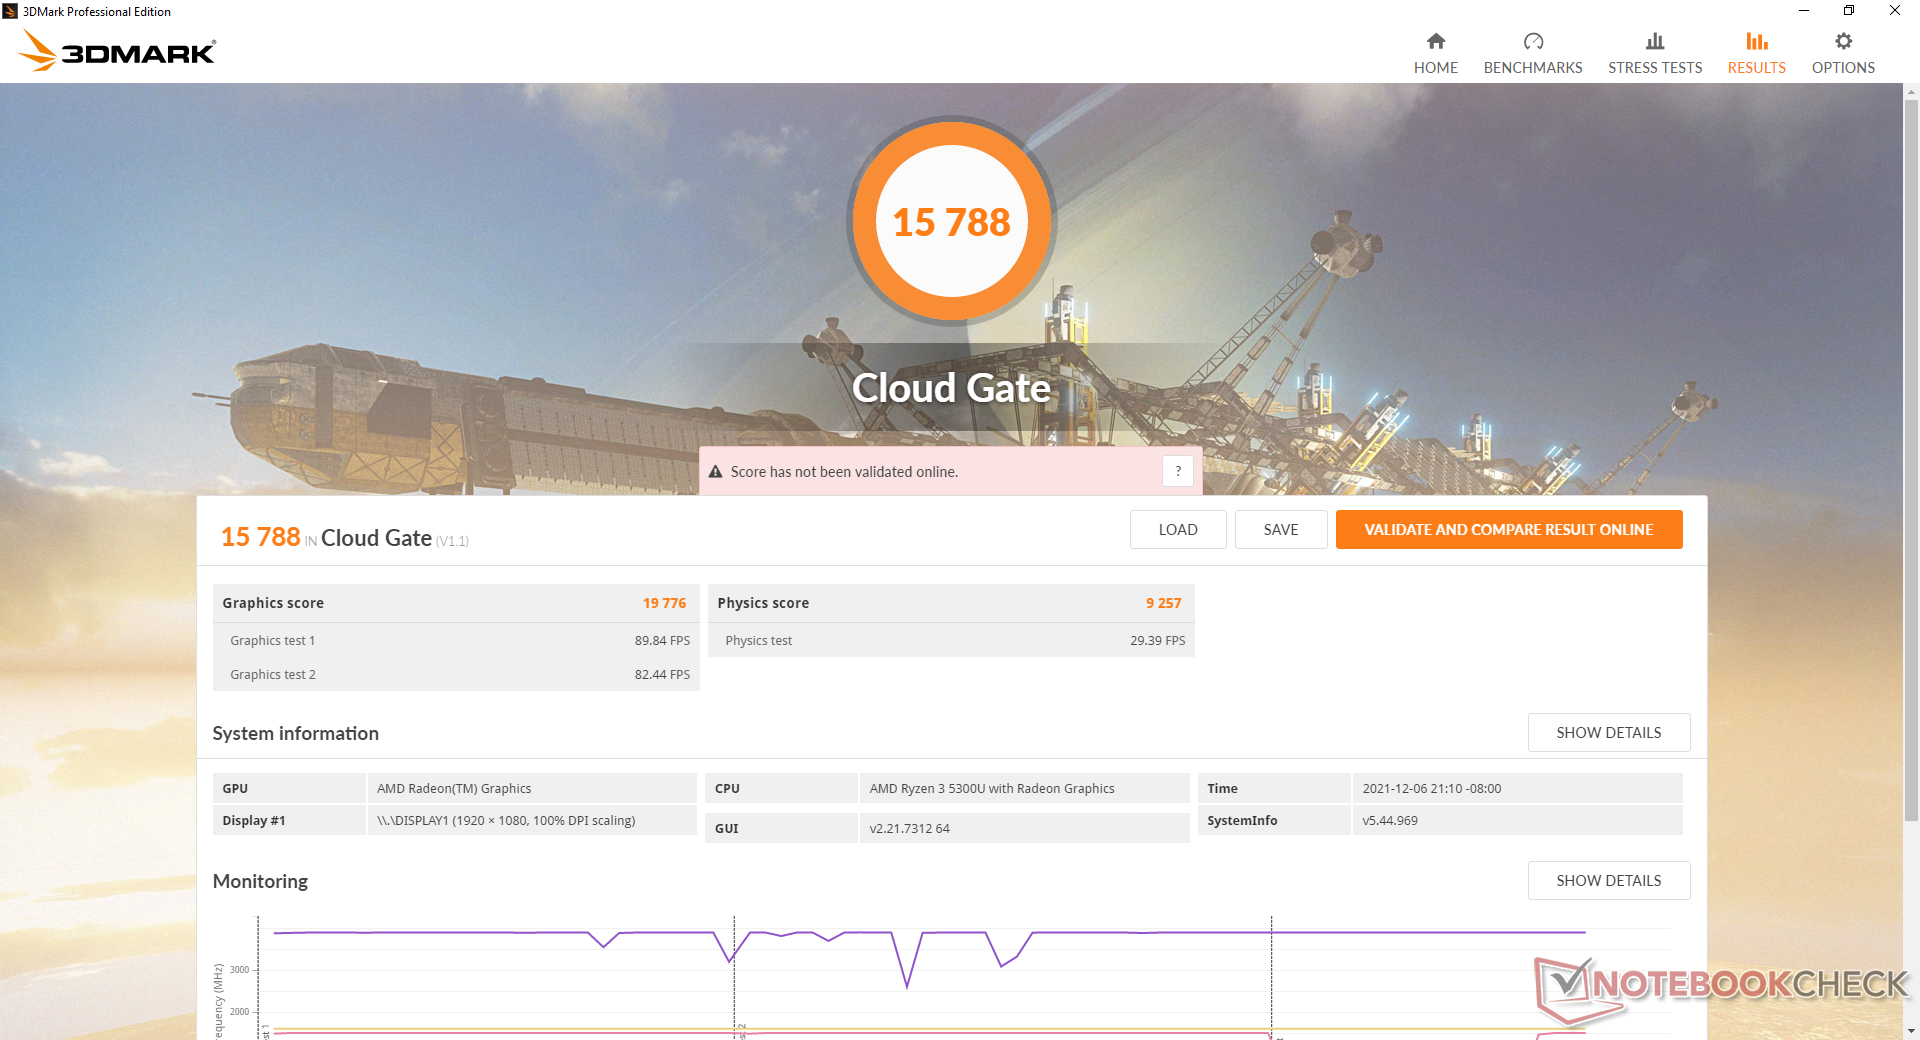
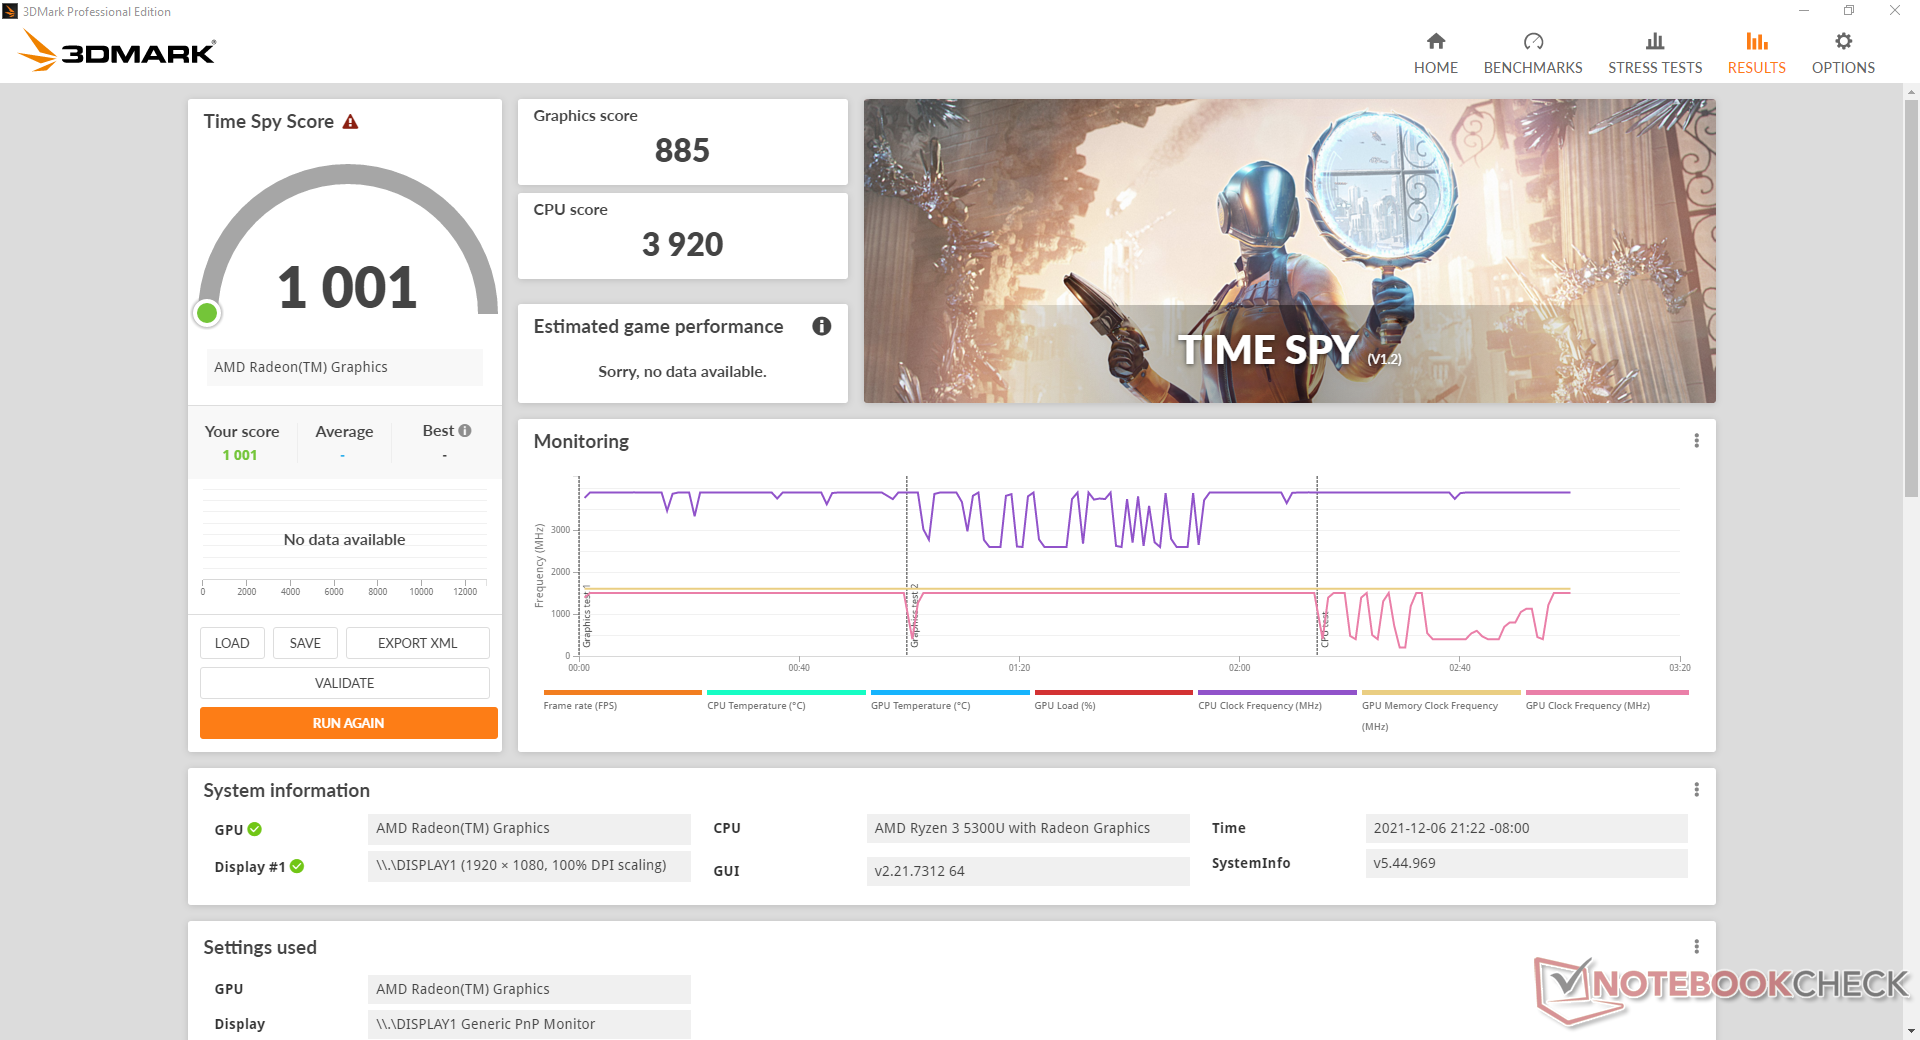
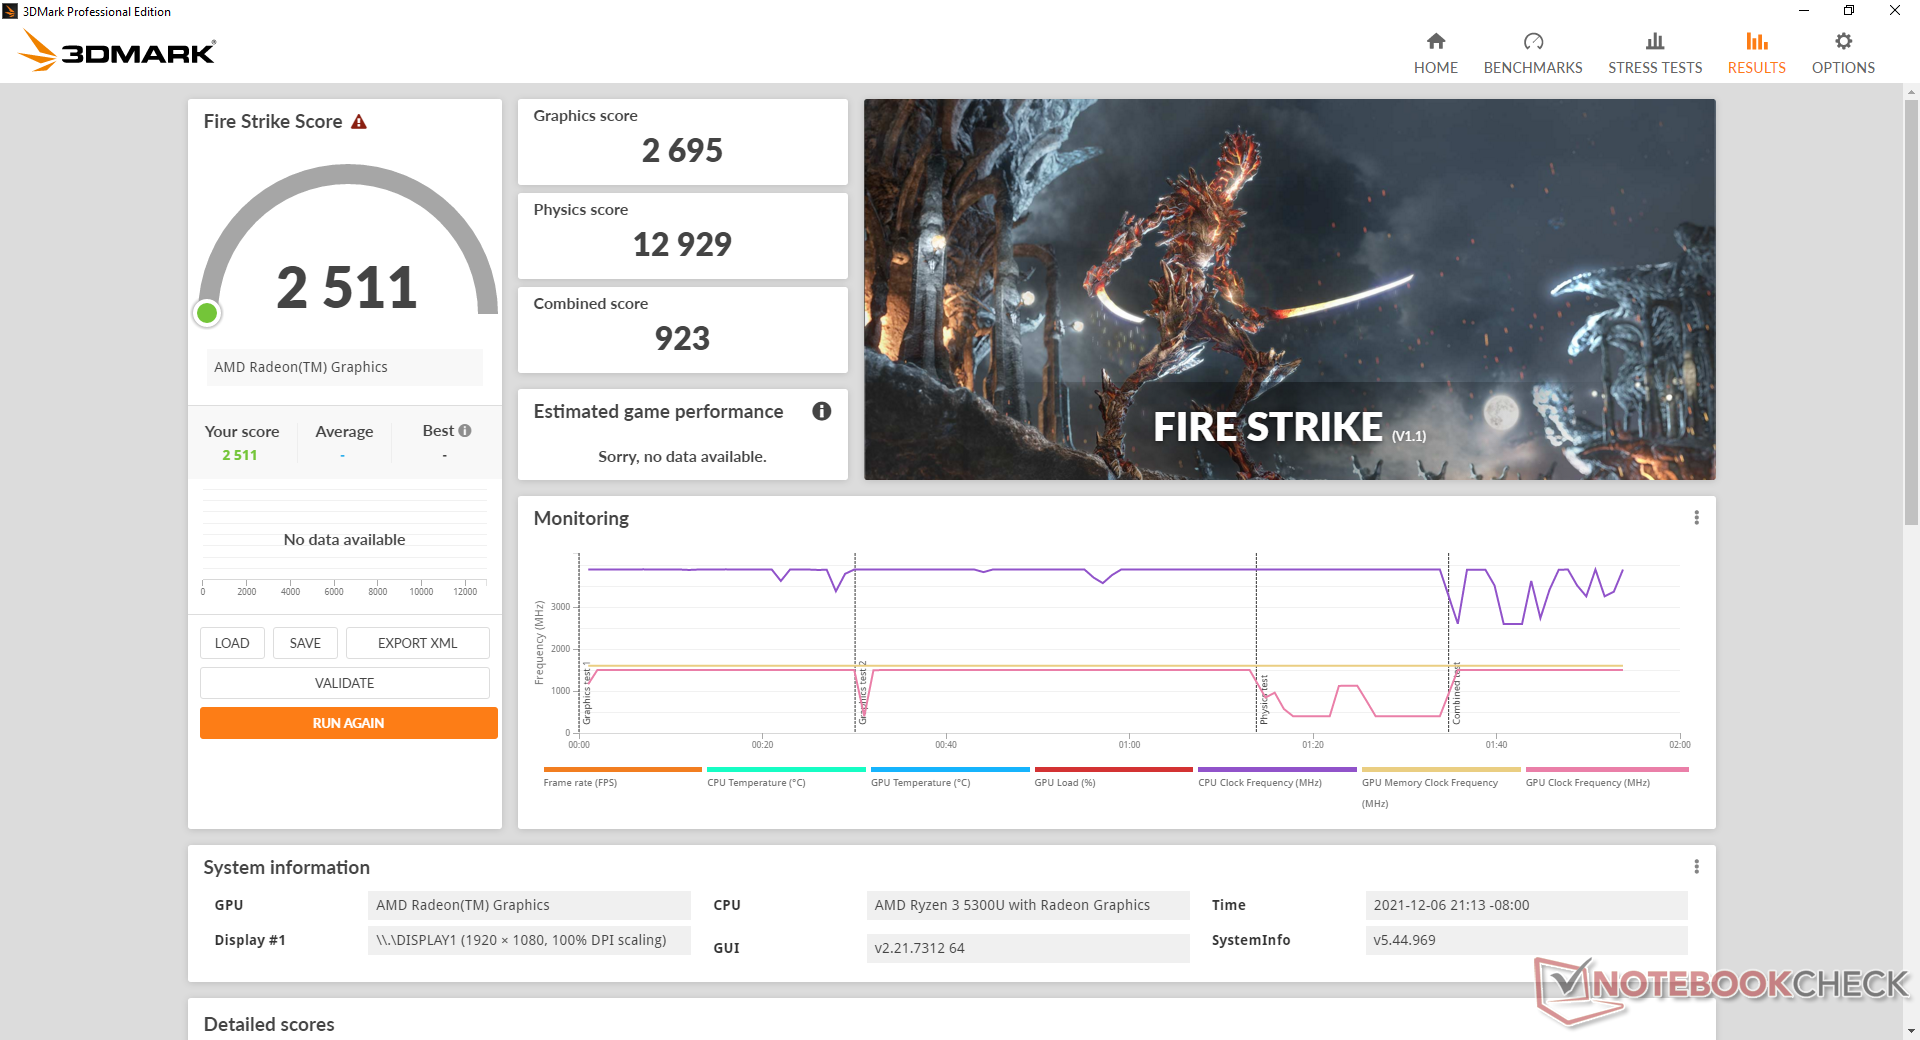
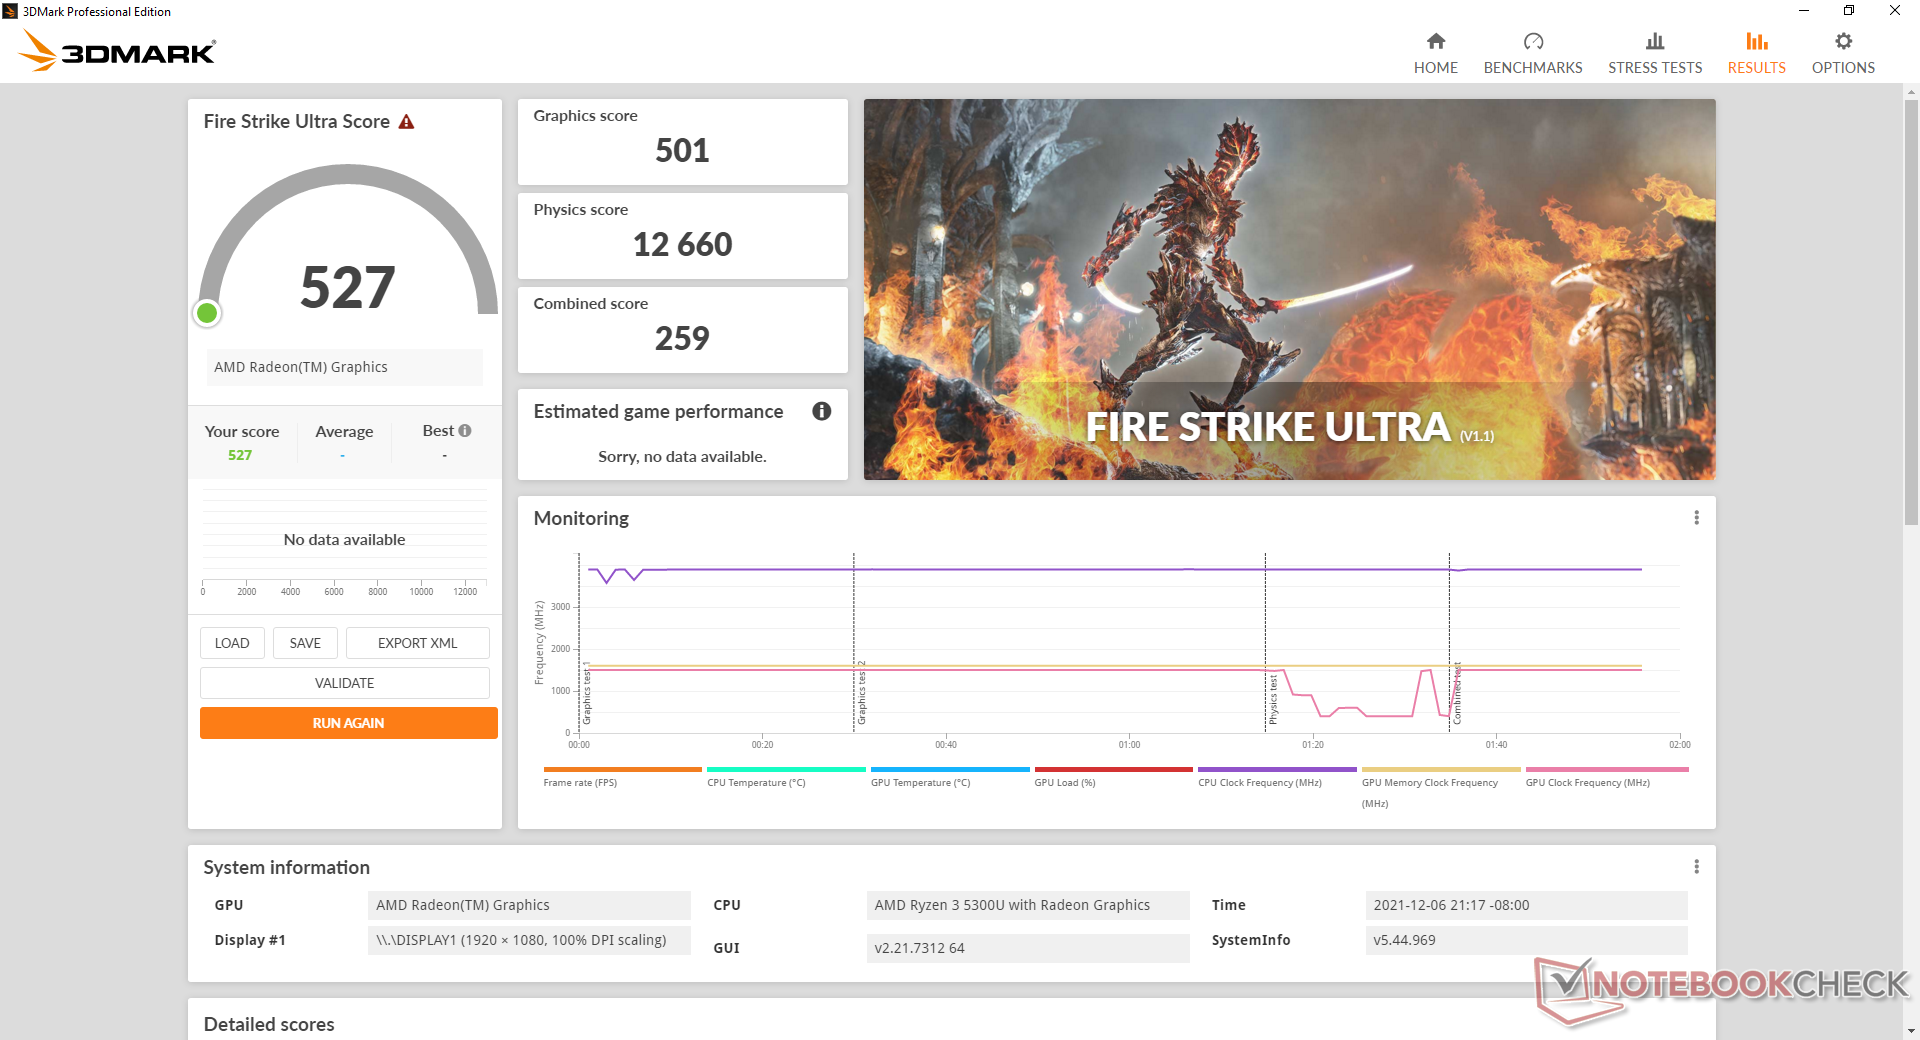
| 3DMark 11 Performance | 4281 pontos | |
| 3DMark Cloud Gate Standard Score | 15788 pontos | |
| 3DMark Fire Strike Score | 2511 pontos | |
| 3DMark Time Spy Score | 1001 pontos | |
Ajuda | ||
| Final Fantasy XV Benchmark | |
| 1280x720 Lite Quality | |
| HP Pavilion 15-eg | |
| Asus VivoBook S15 D533UA | |
| Dell Inspiron 15 3501 | |
| Asus VivoBook 15 KM513UA-L503TS | |
| HP Pavilion x360 15-er0155ng | |
| Lenovo IdeaPad 3 15ALC6 | |
| Média AMD Radeon RX Vega 6 (Ryzen 4000/5000) (15.6 - 32.2, n=9) | |
| Lenovo ThinkPad L15 G2-20X4S0KU00 | |
| Teclast TBOLT F15 Pro | |
| Beelink U59 | |
| 1920x1080 Standard Quality | |
| HP Pavilion 15-eg | |
| Dell Inspiron 15 3501 | |
| HP Pavilion x360 15-er0155ng | |
| Asus VivoBook S15 D533UA | |
| Asus VivoBook 15 KM513UA-L503TS | |
| Lenovo IdeaPad 3 15ALC6 | |
| Média AMD Radeon RX Vega 6 (Ryzen 4000/5000) (10.6 - 16.1, n=8) | |
| Teclast TBOLT F15 Pro | |
| 1920x1080 High Quality | |
| HP Pavilion 15-eg | |
| HP Pavilion x360 15-er0155ng | |
| Dell Inspiron 15 3501 | |
| Asus VivoBook S15 D533UA | |
| Asus VivoBook 15 KM513UA-L503TS | |
| Lenovo IdeaPad 3 15ALC6 | |
| Média AMD Radeon RX Vega 6 (Ryzen 4000/5000) (4.82 - 11.5, n=6) | |
| Teclast TBOLT F15 Pro | |
Witcher 3 FPS Chart
| baixo | média | alto | ultra | |
|---|---|---|---|---|
| GTA V (2015) | 81.7 | 72.5 | 20.6 | 9.41 |
| The Witcher 3 (2015) | 52.2 | 33 | 17 | 10.2 |
| Dota 2 Reborn (2015) | 95.5 | 74 | 42.4 | 40 |
| Final Fantasy XV Benchmark (2018) | 28.6 | 14.2 | 9.99 | |
| X-Plane 11.11 (2018) | 36.7 | 28 | 25.5 | |
| Far Cry 5 (2018) | 39 | 18 | 16 | 15 |
| Strange Brigade (2018) | 67.3 | 26.3 | 21.7 | 18.5 |
Emissões
Ruído do sistema - Silencioso sob a maioria das condições
O sistema é mais silencioso do que o esperado. GeForce A execução da primeira cena de referência no 3DMark 06, por exemplo, faria com que o ventilador atingisse apenas 32 dB(A) em comparação com 40 dB(A) no IdeaPad 5 ou HP Pavilion 15. Se a CPU for mais estressada por períodos mais longos, no entanto, o ruído dos ventiladores subiria constantemente até 44 dB(A) para estar mais de acordo com o que temos observado em outros laptops multimídia baratos. Em resumo, nosso IdeaPad 3 leva mais tempo para atingir os mesmos níveis máximos de ruído dos ventiladores que muitos de seus pares.
Barulho
| Ocioso |
| 25.8 / 25.8 / 25.8 dB |
| Carga |
| 32.3 / 44 dB |
 | ||
30 dB silencioso 40 dB(A) audível 50 dB(A) ruidosamente alto |
||
min: | ||
| Lenovo IdeaPad 3 15ALC6 Vega 6, R3 5300U, Samsung PM991a MZALQ512HBLU | Lenovo IdeaPad 5 15IIL05 GeForce MX350, i5-1035G1, SK hynix BC511 HFM512GDHTNI-87A0B | Lenovo Ideapad S540-15IML GeForce MX250, i5-10210U, Samsung SSD PM981a MZVLB512HBJQ | Dell Inspiron 15 3501 Iris Xe G7 96EUs, i7-1165G7, Samsung PM991a MZ9LQ512HBLU-00BD1 | HP Pavilion 15-eg GeForce MX450, i7-1165G7, Samsung PM991 MZVLQ1T0HALB | Asus VivoBook 15 KM513UA-L503TS Vega 7, R5 5500U, WDC PC SN530 SDBPMPZ-265G | |
|---|---|---|---|---|---|---|
| Noise | -21% | -21% | 0% | -5% | -12% | |
| desligado / ambiente * (dB) | 25.2 | 30.7 -22% | 30 -19% | 26 -3% | 25.4 -1% | 28.28 -12% |
| Idle Minimum * (dB) | 25.8 | 30.7 -19% | 30 -16% | 26 -1% | 25.6 1% | 28.28 -10% |
| Idle Average * (dB) | 25.8 | 30.7 -19% | 32 -24% | 26 -1% | 25.6 1% | 28.28 -10% |
| Idle Maximum * (dB) | 25.8 | 30.7 -19% | 37 -43% | 26 -1% | 25.6 1% | 28.28 -10% |
| Load Average * (dB) | 32.3 | 43.4 -34% | 41 -27% | 35.9 -11% | 39.2 -21% | 35.76 -11% |
| Witcher 3 ultra * (dB) | 32 | 43.2 -35% | 39 -22% | 39.1 -22% | 42.79 -34% | |
| Load Maximum * (dB) | 44 | 43.7 1% | 42 5% | 35.8 19% | 41.5 6% | 42.67 3% |
* ... menor é melhor
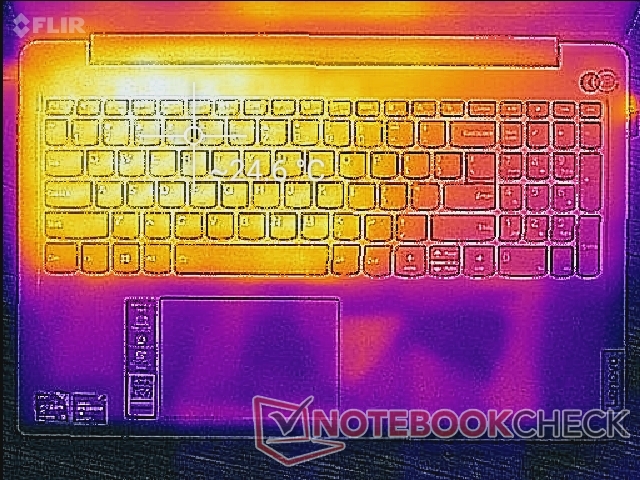
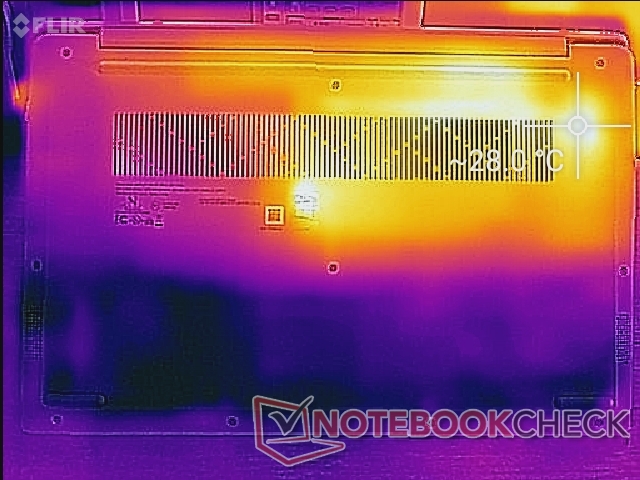
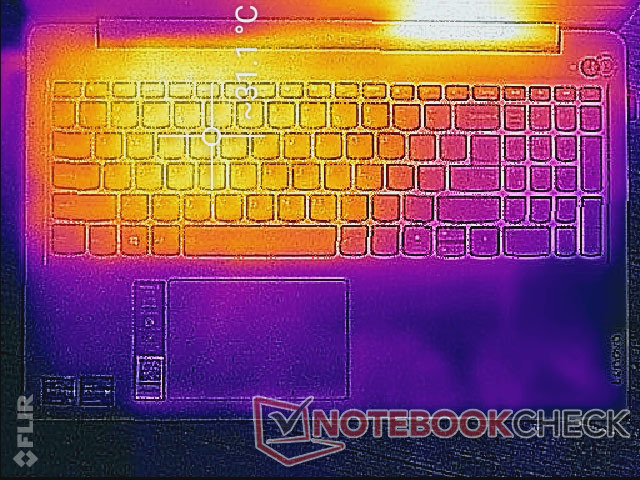
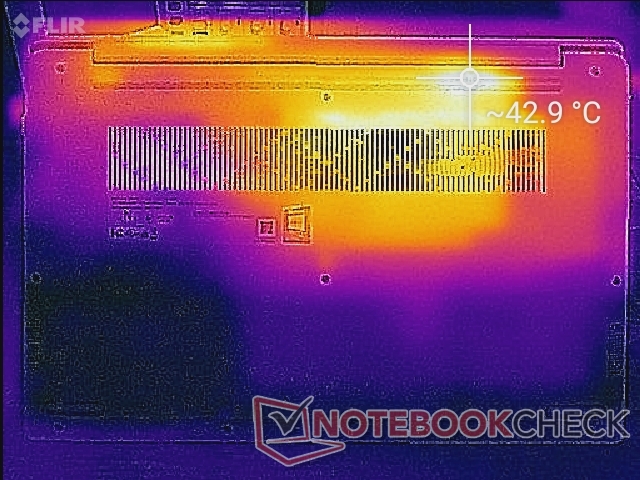
Temperatura
As temperaturas de superfície nunca são excessivamente quentes, não importa a carga, especialmente na plataforma do teclado. Os pontos quentes quando os jogos mal ultrapassam 30 C, como mostram nossos mapas de temperatura abaixo, em comparação com 40 C noAsus VivoBook 15 KM513UA. O fundo de nossa Lenovo pode atingir 43 C, mas felizmente este é apenas um pequeno ponto na parte de trás do sistema onde é pouco provável que os usuários se toquem.
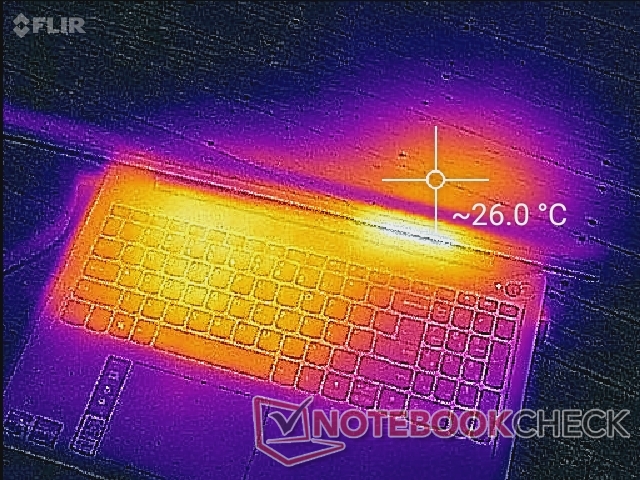
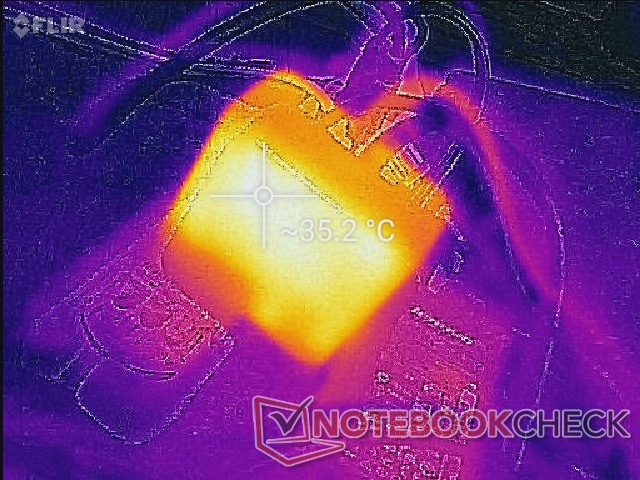
(+) A temperatura máxima no lado superior é 31.2 °C / 88 F, em comparação com a média de 36.8 °C / 98 F , variando de 21 a 71 °C para a classe Multimedia.
(±) A parte inferior aquece até um máximo de 43 °C / 109 F, em comparação com a média de 39.1 °C / 102 F
(+) Em uso inativo, a temperatura média para o lado superior é 22.8 °C / 73 F, em comparação com a média do dispositivo de 31.3 °C / ### class_avg_f### F.
(+) Os apoios para as mãos e o touchpad são mais frios que a temperatura da pele, com um máximo de 21 °C / 69.8 F e, portanto, são frios ao toque.
(+) A temperatura média da área do apoio para as mãos de dispositivos semelhantes foi 28.7 °C / 83.7 F (+7.7 °C / 13.9 F).
| Lenovo IdeaPad 3 15ALC6 AMD Ryzen 3 5300U, AMD Radeon RX Vega 6 (Ryzen 4000/5000) | Lenovo IdeaPad 5 15IIL05 Intel Core i5-1035G1, NVIDIA GeForce MX350 | Lenovo Ideapad S540-15IML Intel Core i5-10210U, NVIDIA GeForce MX250 | Dell Inspiron 15 3501 Intel Core i7-1165G7, Intel Iris Xe Graphics G7 96EUs | HP Pavilion 15-eg Intel Core i7-1165G7, NVIDIA GeForce MX450 | Asus VivoBook 15 KM513UA-L503TS AMD Ryzen 5 5500U, AMD Radeon RX Vega 7 | |
|---|---|---|---|---|---|---|
| Heat | -21% | -8% | -15% | -19% | -22% | |
| Maximum Upper Side * (°C) | 31.2 | 43.1 -38% | 42 -35% | 45.6 -46% | 44 -41% | 43.8 -40% |
| Maximum Bottom * (°C) | 43 | 50.9 -18% | 45 -5% | 41 5% | 53.4 -24% | 42.2 2% |
| Idle Upper Side * (°C) | 24.8 | 29 -17% | 25 -1% | 28.2 -14% | 27.4 -10% | 33.4 -35% |
| Idle Bottom * (°C) | 28.2 | 31 -10% | 26 8% | 29.1 -3% | 28.8 -2% | 32.6 -16% |
* ... menor é melhor
Teste de estresse
Ao rodar Prime95 para enfatizar a CPU, as taxas de relógio aumentariam para 3,9 GHz e em um pico de potência de 29 W antes de atingir uma temperatura central de 80 C cerca de 30 segundos depois. Depois disso, as taxas de clock e a potência do pacote cairiam ligeiramente para 3,7 GHz e 24 W, respectivamente, a fim de manter uma temperatura central mais fria de 72 C.
Quando em funcionamento Witcher 3A GPU integrada se estabilizaria em 1500 MHz, conforme anunciado. A temperatura central também se estabilizaria em apenas 57 C em comparação com 74 C na IdeaPad 5 Pro 14 mais rápida e mais fina.
O funcionamento com a energia da bateria terá impacto no desempenho. Um 3DMark 11 funcionando com baterias retornaria pontuações de Física e Gráficos de 7818 e 3818 pontos, respectivamente, em comparação com 8356 e 4035 pontos quando em rede elétrica.
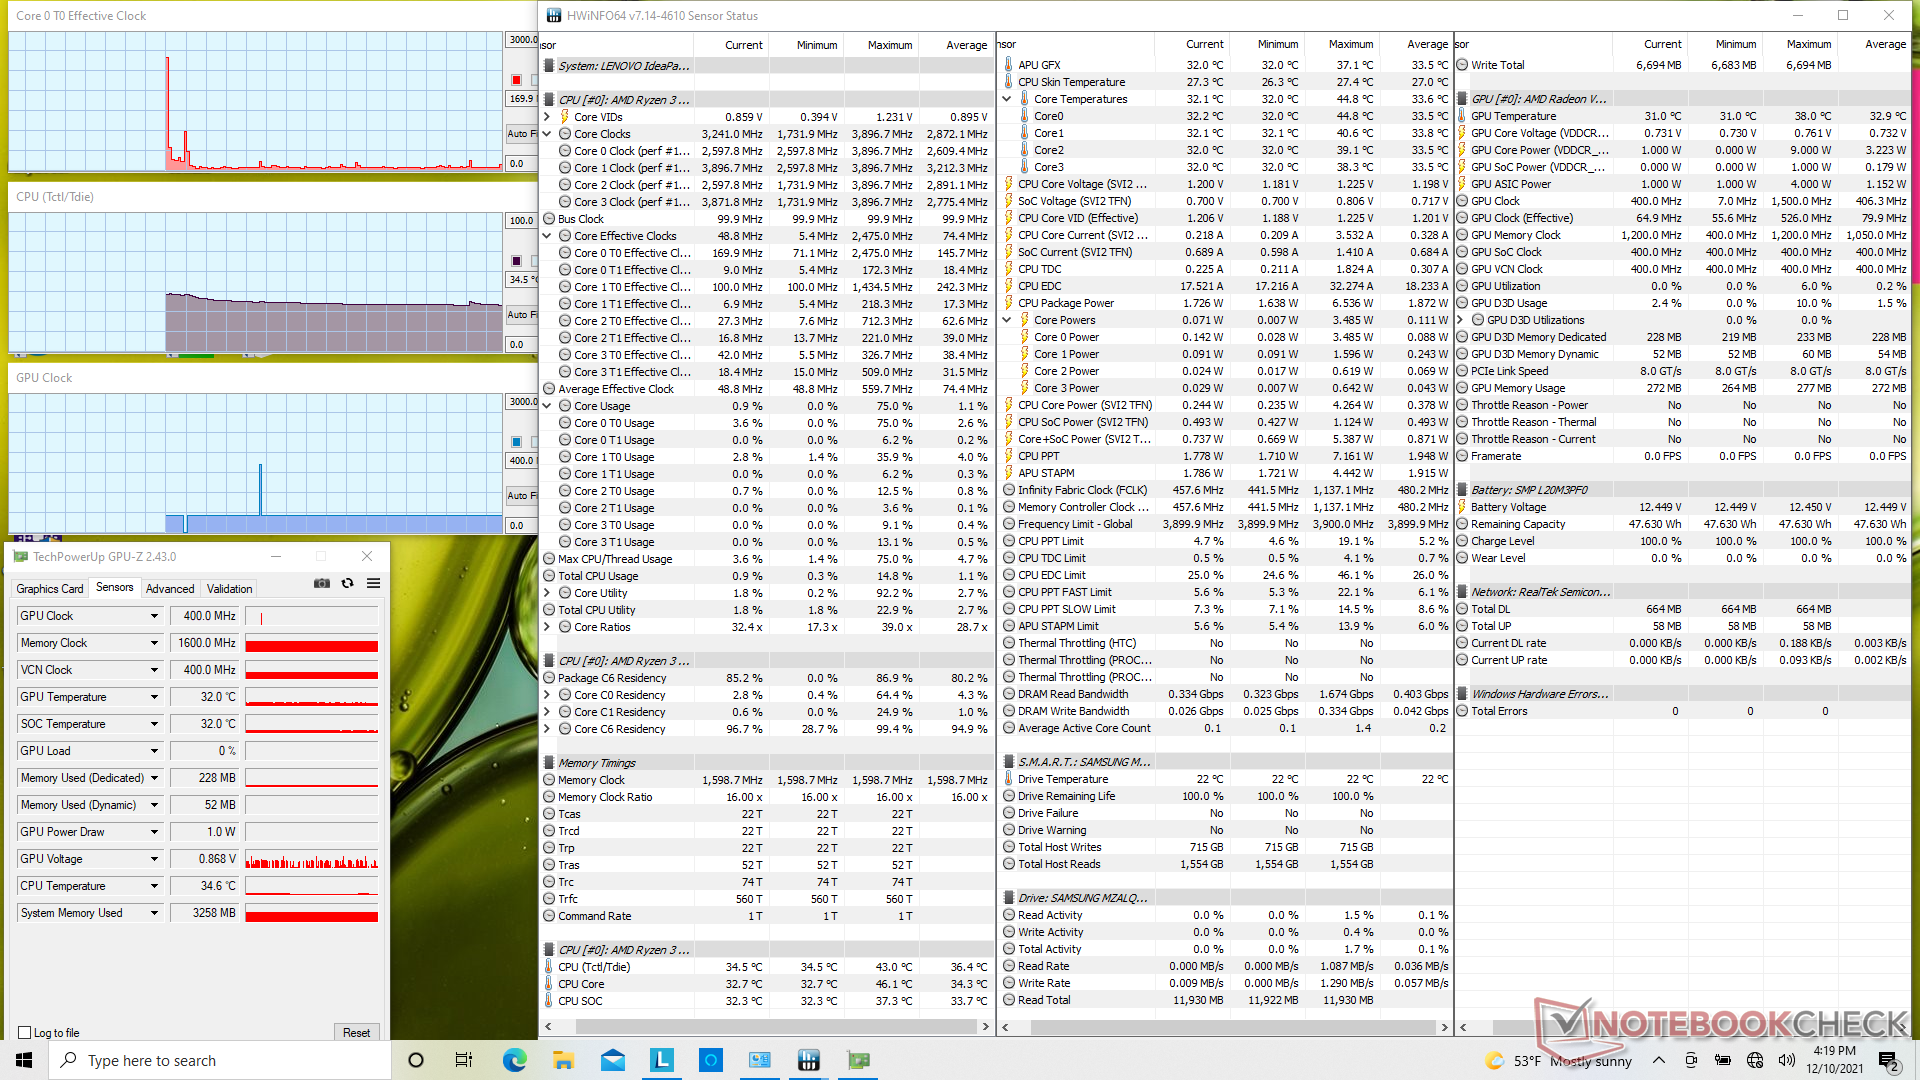
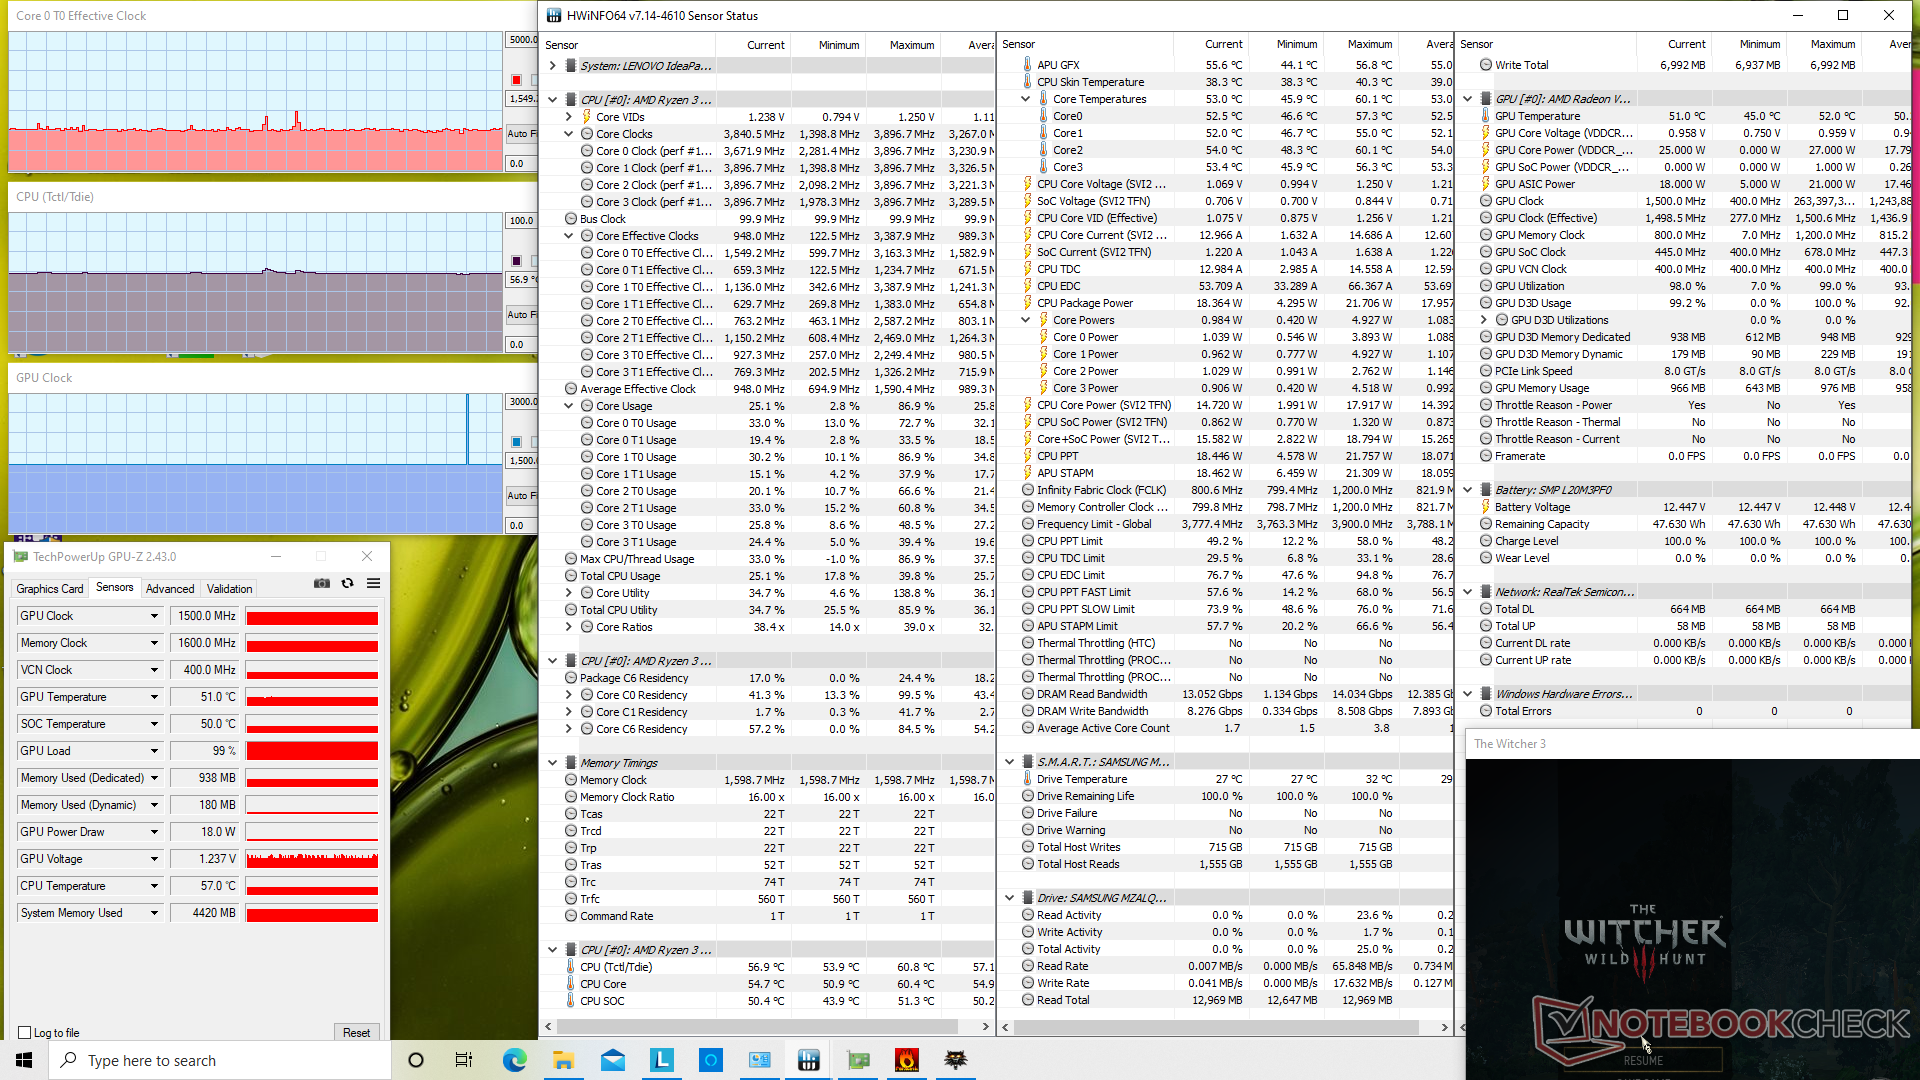
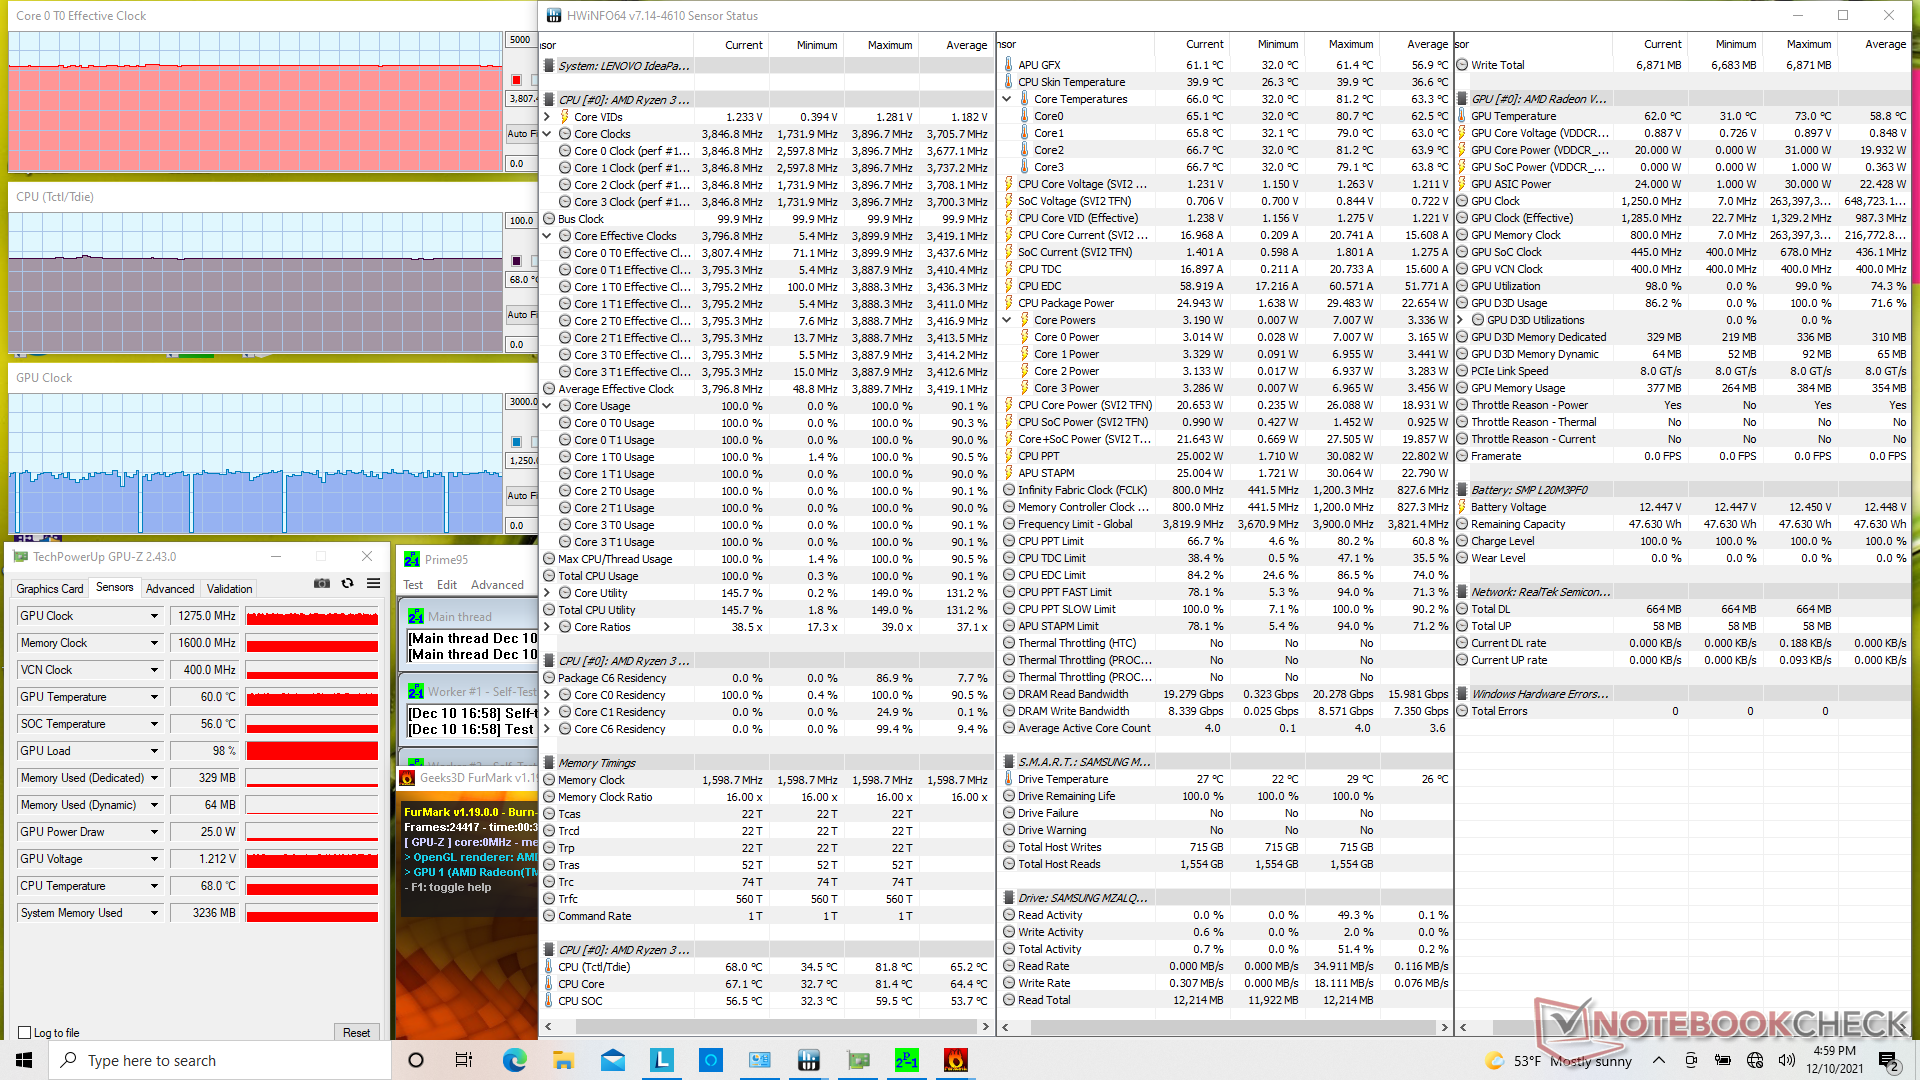
| RelógioCPU (GHz) | RelógioGPU (MHz) | Temperaturamédiada CPU (°C) | |
| System Idle | -- | --35 | |
| Prime95 Stress | 3.8 | --74 | |
| Prime95 + FurMark Stress | 3.8 | 1250 | 68 |
| Witcher 3 Stress | 1.6 | 1500 | 57 |
Oradores
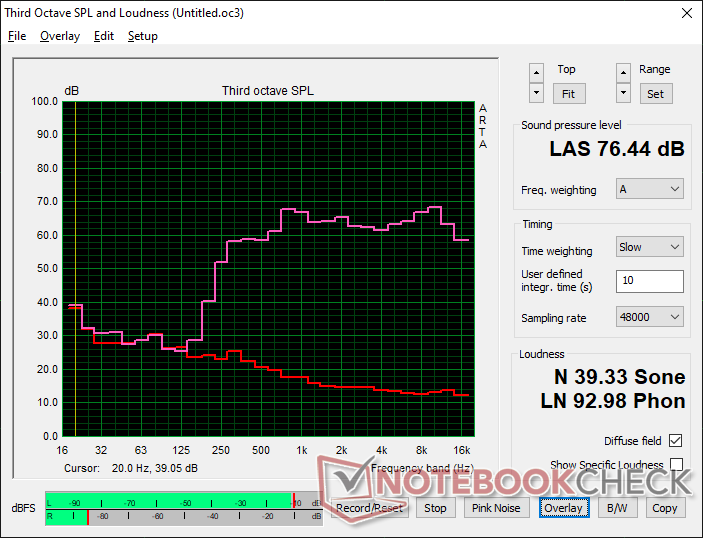
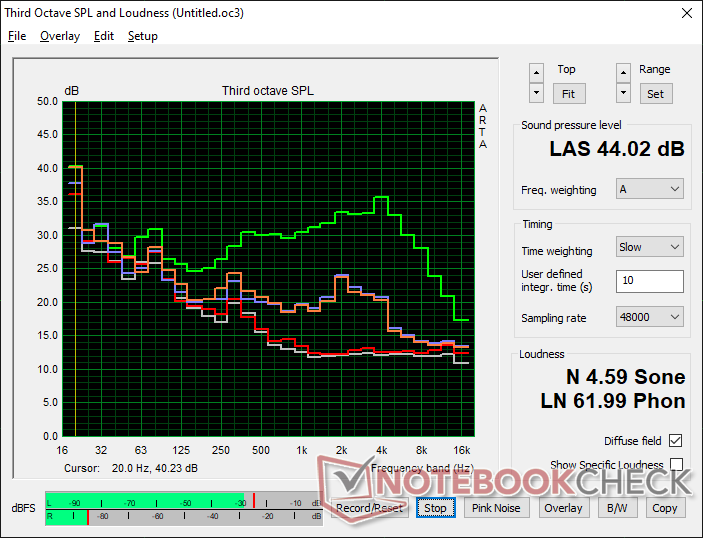
Lenovo IdeaPad 3 15ALC6 análise de áudio
(±) | o volume do alto-falante é médio, mas bom (###valor### dB)
Graves 100 - 315Hz
(-) | quase nenhum baixo - em média 24% menor que a mediana
(±) | a linearidade dos graves é média (13.4% delta para a frequência anterior)
Médios 400 - 2.000 Hz
(+) | médios equilibrados - apenas 3.1% longe da mediana
(+) | médios são lineares (4.2% delta para frequência anterior)
Altos 2 - 16 kHz
(+) | agudos equilibrados - apenas 2.1% longe da mediana
(+) | os máximos são lineares (3.4% delta da frequência anterior)
Geral 100 - 16.000 Hz
(±) | a linearidade do som geral é média (19.3% diferença em relação à mediana)
Comparado com a mesma classe
» 62% de todos os dispositivos testados nesta classe foram melhores, 8% semelhantes, 30% piores
» O melhor teve um delta de 5%, a média foi 17%, o pior foi 45%
Comparado com todos os dispositivos testados
» 47% de todos os dispositivos testados foram melhores, 8% semelhantes, 46% piores
» O melhor teve um delta de 4%, a média foi 23%, o pior foi 134%
Apple MacBook 12 (Early 2016) 1.1 GHz análise de áudio
(+) | os alto-falantes podem tocar relativamente alto (###valor### dB)
Graves 100 - 315Hz
(±) | graves reduzidos - em média 11.3% menor que a mediana
(±) | a linearidade dos graves é média (14.2% delta para a frequência anterior)
Médios 400 - 2.000 Hz
(+) | médios equilibrados - apenas 2.4% longe da mediana
(+) | médios são lineares (5.5% delta para frequência anterior)
Altos 2 - 16 kHz
(+) | agudos equilibrados - apenas 2% longe da mediana
(+) | os máximos são lineares (4.5% delta da frequência anterior)
Geral 100 - 16.000 Hz
(+) | o som geral é linear (10.2% diferença em relação à mediana)
Comparado com a mesma classe
» 7% de todos os dispositivos testados nesta classe foram melhores, 2% semelhantes, 90% piores
» O melhor teve um delta de 5%, a média foi 18%, o pior foi 53%
Comparado com todos os dispositivos testados
» 5% de todos os dispositivos testados foram melhores, 1% semelhantes, 94% piores
» O melhor teve um delta de 4%, a média foi 23%, o pior foi 134%
Gestão de energia
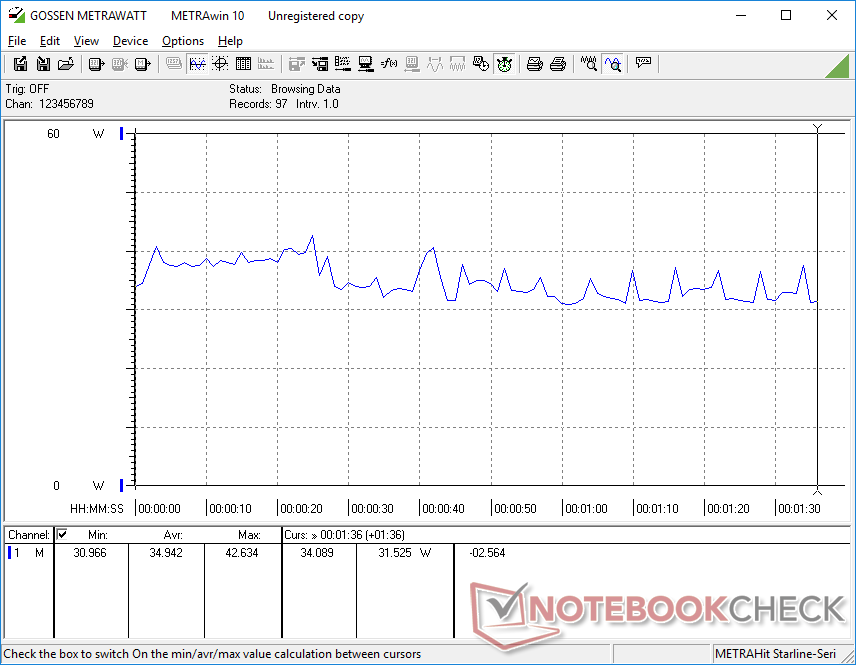
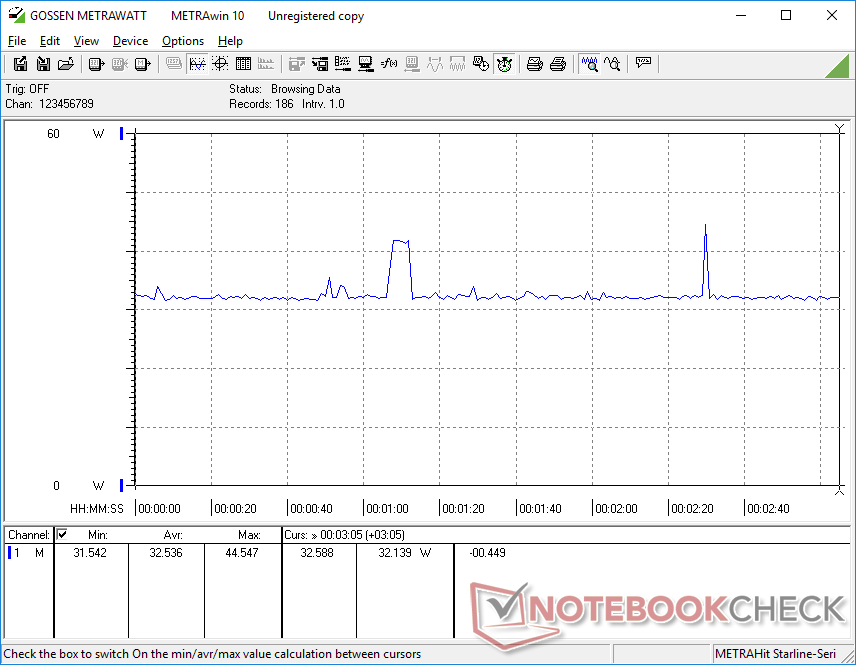
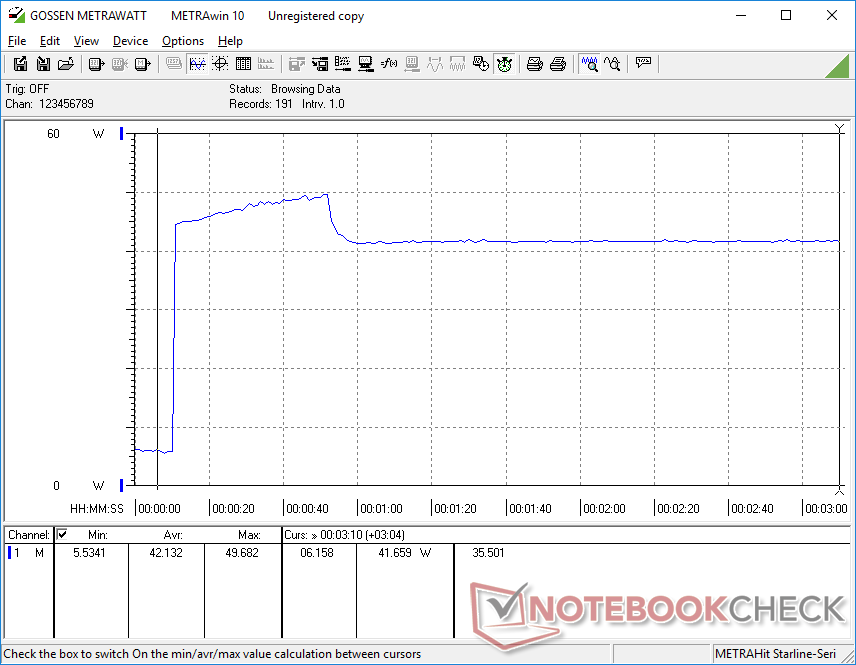
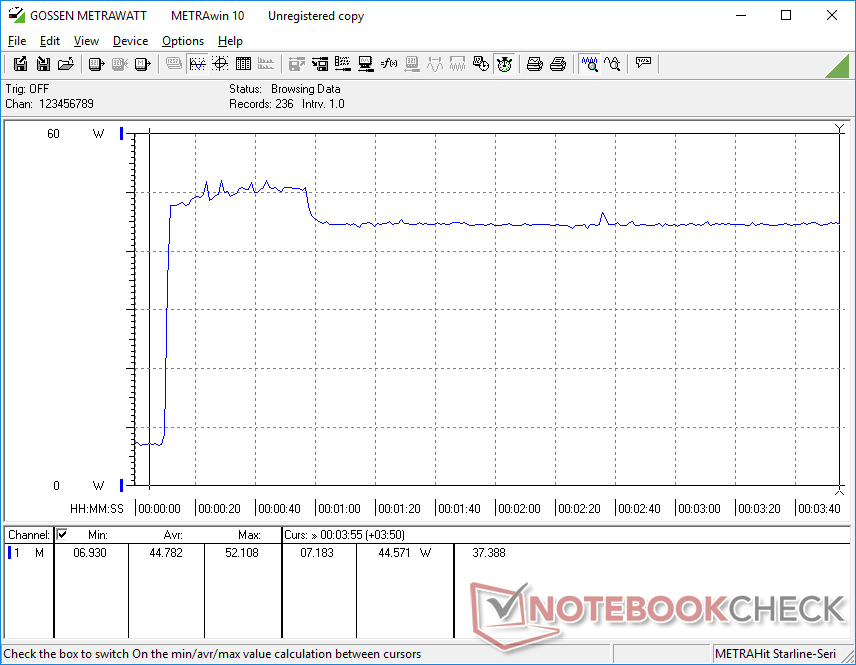
Consumo de energia - Alto desempenho da CPU por watt
O sistema é mais exigente do que o Core i3-powered Lenovo ThinkPad L15 G2 quando se trabalha com cargas médias ou superiores. A execução do 3DMark 06, por exemplo, consumiria quase 37% a mais de energia em nosso IdeaPad. As vantagens de desempenho de nossa CPU Ryzen 3 sobre a alternativa Core i3 podem valer a pena o aumento do consumo de energia para muitos usuários. Quaisquer diferenças no consumo de energia ao executar cargas menores como navegação na web ou streaming de vídeo são mínimas.
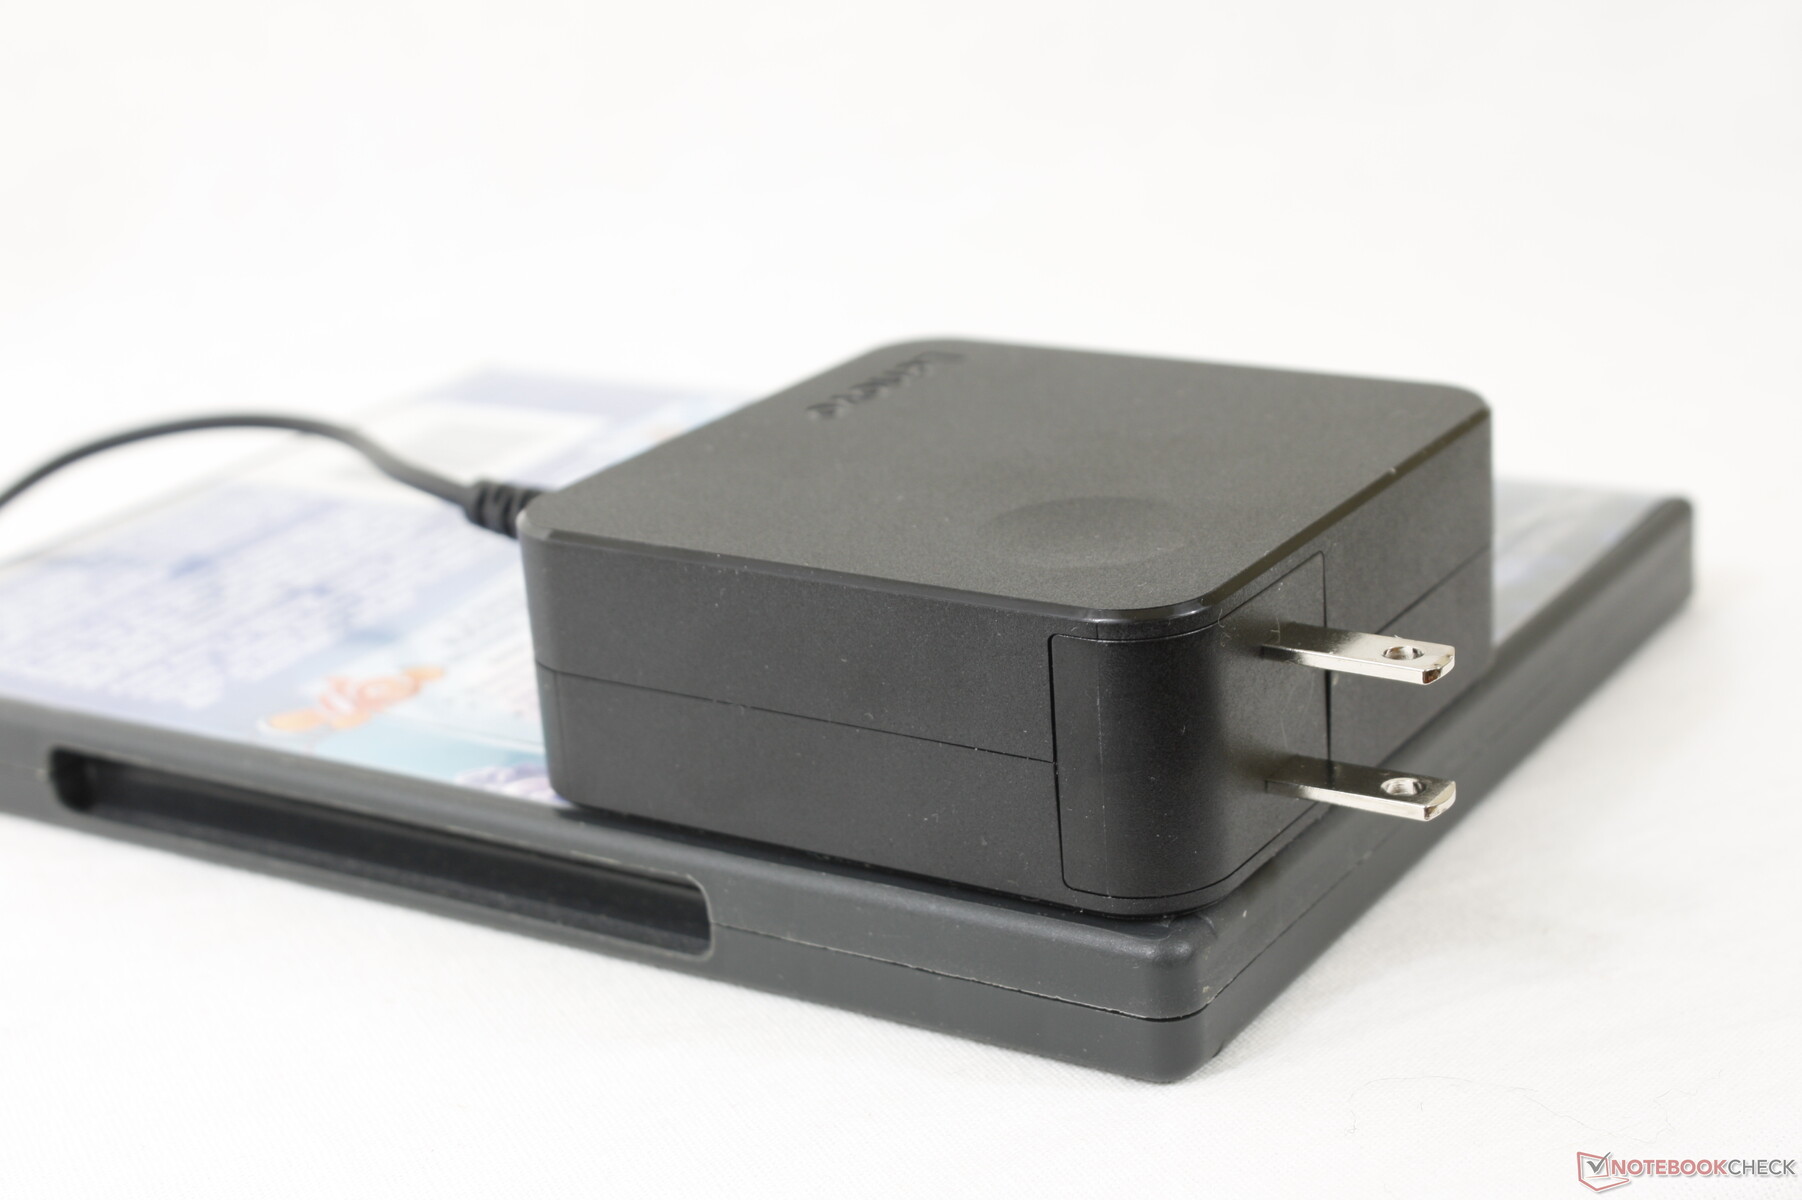
Somos capazes de registrar um draw máximo temporário de 52 W do pequeno (~7,5 x 7,5 x 2,8 cm) adaptador CA de 65 W. Os dentes do adaptador infelizmente não são retráteis, o que pode ser um incômodo durante a viagem.
| desligado | |
| Ocioso | |
| Carga |
|
Key:
min: | |
| Lenovo IdeaPad 3 15ALC6 R3 5300U, Vega 6, Samsung PM991a MZALQ512HBLU, IPS, 1920x1080, 15.6" | Lenovo IdeaPad 5 15IIL05 i5-1035G1, GeForce MX350, SK hynix BC511 HFM512GDHTNI-87A0B, IPS, 1920x1080, 15.6" | Lenovo Ideapad S540-15IML i5-10210U, GeForce MX250, Samsung SSD PM981a MZVLB512HBJQ, IPS, 1920x1080, 15.6" | Dell Inspiron 15 3501 i7-1165G7, Iris Xe G7 96EUs, Samsung PM991a MZ9LQ512HBLU-00BD1, IPS, 1920x1080, 15.6" | Asus VivoBook 15 KM513UA-L503TS R5 5500U, Vega 7, WDC PC SN530 SDBPMPZ-265G, OLED, 1920x1080, 15.6" | Lenovo ThinkPad L15 G2-20X4S0KU00 i3-1115G4, UHD Graphics Xe G4 48EUs, Samsung SSD PM981a MZVLB256HBHQ, IPS, 1920x1080, 15.6" | |
|---|---|---|---|---|---|---|
| Power Consumption | -50% | -33% | 1% | -10% | -3% | |
| Idle Minimum * (Watt) | 5.6 | 4.9 12% | 5 11% | 3.6 36% | 4.96 11% | 4.08 27% |
| Idle Average * (Watt) | 6 | 9.1 -52% | 7 -17% | 6.4 -7% | 7.38 -23% | 8 -33% |
| Idle Maximum * (Watt) | 7 | 11.6 -66% | 10 -43% | 7.9 -13% | 7.79 -11% | 8.89 -27% |
| Load Average * (Watt) | 34.9 | 65 -86% | 64 -83% | 39 -12% | 41.77 -20% | 25.64 27% |
| Witcher 3 ultra * (Watt) | 32.5 | 59 -82% | 44 -35% | 37.6 -16% | 38.2 -18% | 31.7 2% |
| Load Maximum * (Watt) | 52.1 | 65.3 -25% | 67 -29% | 41.8 20% | 50.95 2% | 60.31 -16% |
* ... menor é melhor
Power Consumption Witcher 3 / Stresstest
Power Consumption external Monitor
Vida útil da bateria - Baixa capacidade, longos tempos de funcionamento
A capacidade da bateria é pequena a 45 Wh, o que é de se esperar de um sistema de orçamento. Entretanto, os tempos de execução ainda são excelentes a quase 10,5 horas de WLAN do mundo real para ser comparável ao IdeaPad 5, mais caro.
A carga de vazio a cheio leva pouco menos de 2,5 horas em comparação com 1,5 horas na maioria dos outros Ultrabooks. Infelizmente, o sistema não pode ser recarregado via USB-C.
| Lenovo IdeaPad 3 15ALC6 R3 5300U, Vega 6, 45 Wh | Lenovo IdeaPad 5 15IIL05 i5-1035G1, GeForce MX350, 70 Wh | Lenovo Ideapad S540-15IML i5-10210U, GeForce MX250, 70 Wh | Dell Inspiron 15 3501 i7-1165G7, Iris Xe G7 96EUs, 42 Wh | HP Pavilion 15-eg i7-1165G7, GeForce MX450, 41 Wh | Asus VivoBook 15 KM513UA-L503TS R5 5500U, Vega 7, 42 Wh | |
|---|---|---|---|---|---|---|
| Duração da bateria | 23% | 17% | -35% | -29% | -41% | |
| Reader / Idle (h) | 20.1 | 23.2 15% | 30.2 50% | 15 -25% | 11.8 -41% | |
| WiFi v1.3 (h) | 10.5 | 11.4 9% | 12.1 15% | 6.8 -35% | 6.6 -37% | 6.4 -39% |
| Load (h) | 1.6 | 2.3 44% | 1.4 -13% | 1.2 -25% | 0.9 -44% | |
| H.264 (h) | 16.1 |
Pro
Contra
Veredicto - Dando ao Core i3 uma corrida por seu dinheiro
O IdeaPad 3 15ALC6 tem três características fortes que muitos outros modelos em sua faixa de preço carecem: facilidade de manutenção, uma tela sensível ao toque brilhante FreeSync, e uma CPU surpreendentemente rápida. Estes atributos contribuem para a longevidade do sistema, pois os proprietários podem facilmente adicionar mais armazenamento ou RAM ao longo da linha e ter confiança de que o Ryzen 3 5300U não estará desatualizado muito cedo. A vida útil da bateria e o ruído do ventilador são longos e silenciosos, respectivamente, devido em parte à eficiência do processador.
A rápida CPU Ryzen 3 5300U impulsiona um laptop de baixo custo com qualidade de construção, cores e estética medíocres.
Há sempre cantos cortados associados a laptops econômicos e o IdeaPad 3 não é exceção. Neste caso, o sistema sofre de teclas relativamente macias, clickpad esponjoso, um design de chassi fraco e reprodução de cores rasas. Este último em particular é comum em quase todos os laptops orçamentários e por isso não podemos destacar a Lenovo por suas cores ruins, mas o chassi poderia definitivamente usar algum trabalho para fazê-lo sentir-se mais forte e mais duradouro.
Preço e Disponibilidade
O IdeaPad 3 15ALC6 está agora amplamente disponível com as opções Core i3, Core i5, e Ryzen 5 em Newegg, Melhor compra, Amazônia, e Walmart a partir de cerca de $500 USD. Nossa configuração de teste Ryzen 3 é uma SKU muito mais incomum.
Lenovo IdeaPad 3 15ALC6
- 12/14/2021 v7 (old)
Allen Ngo
Price comparison

