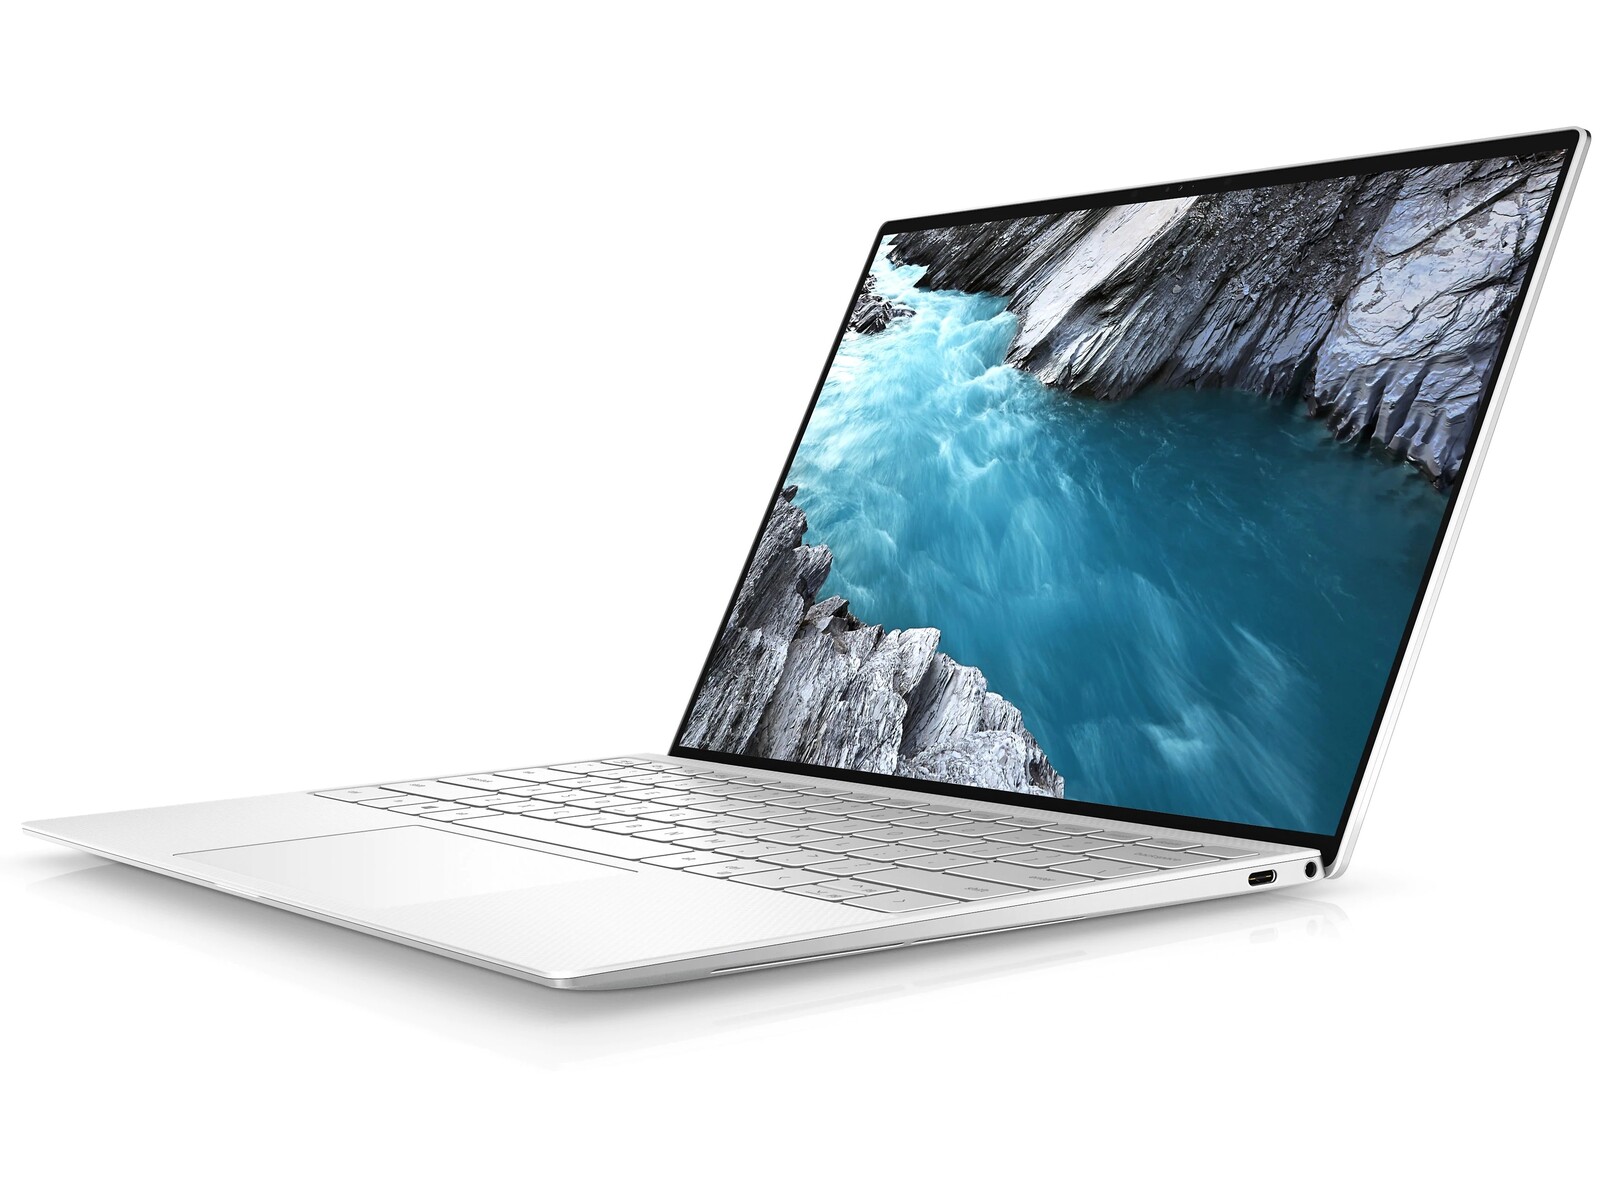
Dell XPS 13 9310 OLED Laptop Review: É melhor que o IPS?
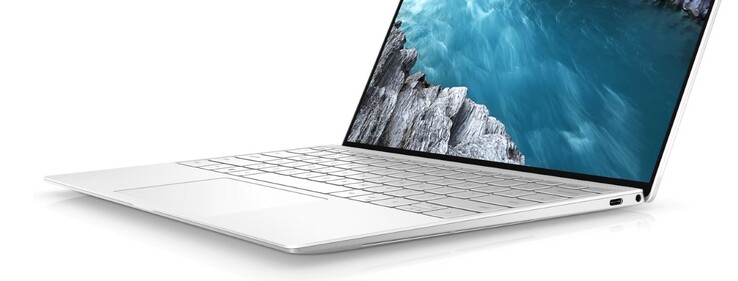
O XPS 13 9310 lançado no final do ano passado juntamente com a 11ª geração da série Tiger Lake da Intel. As configurações na época incluíam as opções FHD (1920 x 1200) e 4K (3840 x 2400), todas com painéis IPS. A Dell havia prometido ao OLED vir em uma data posterior para complementar as SKUs IPS existentes.
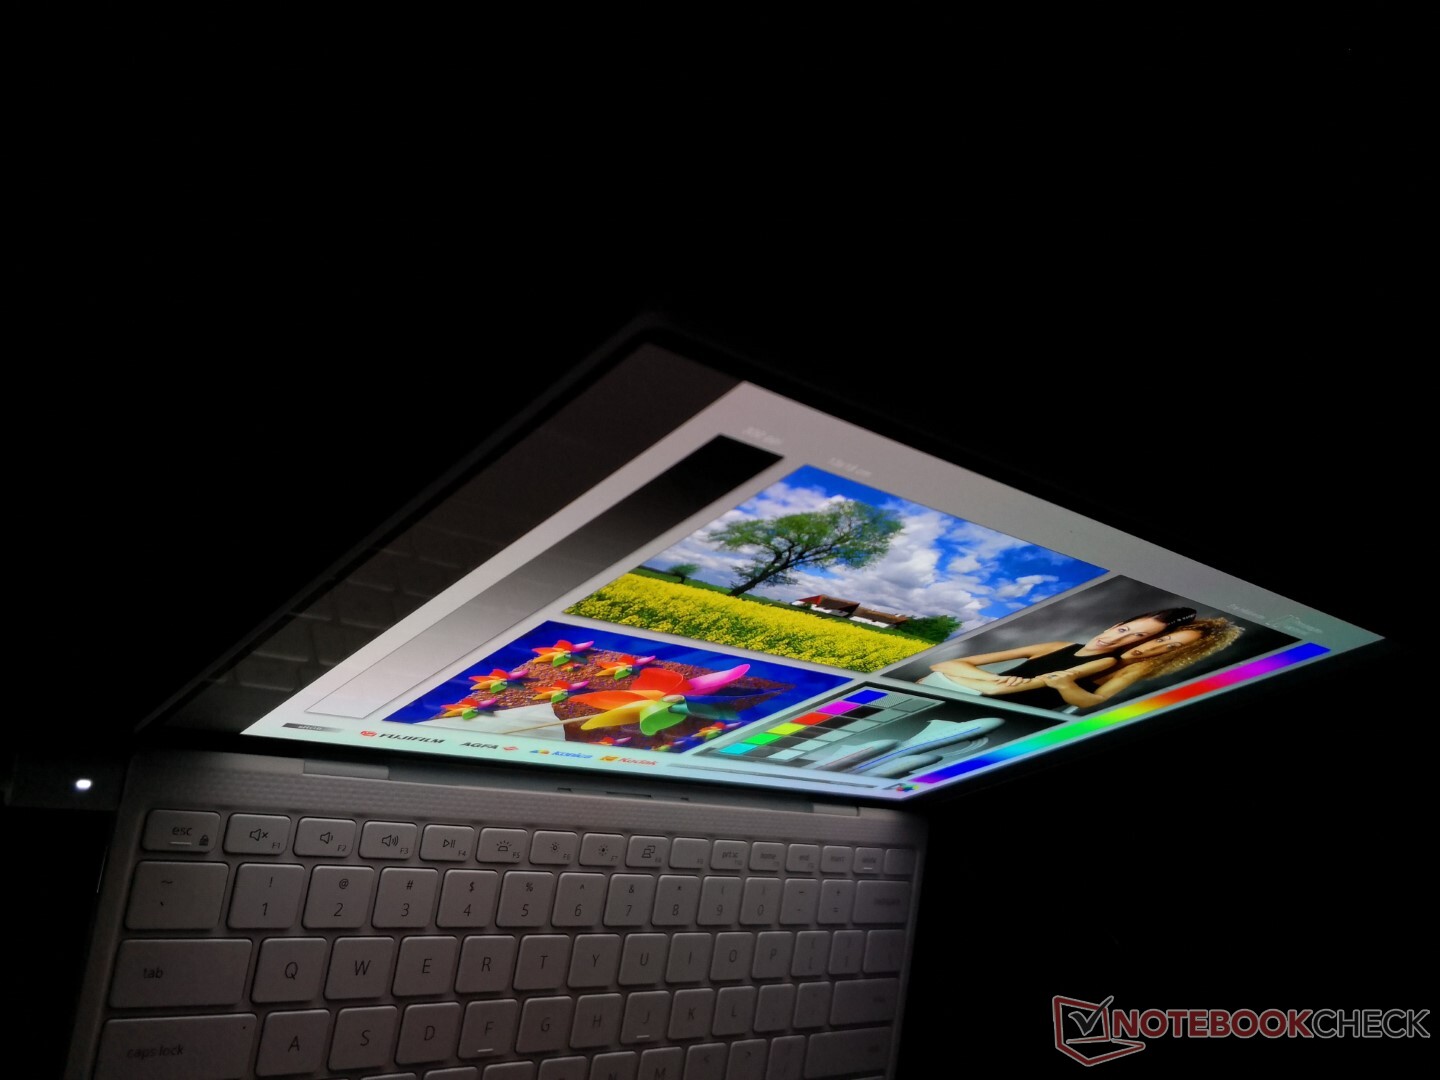
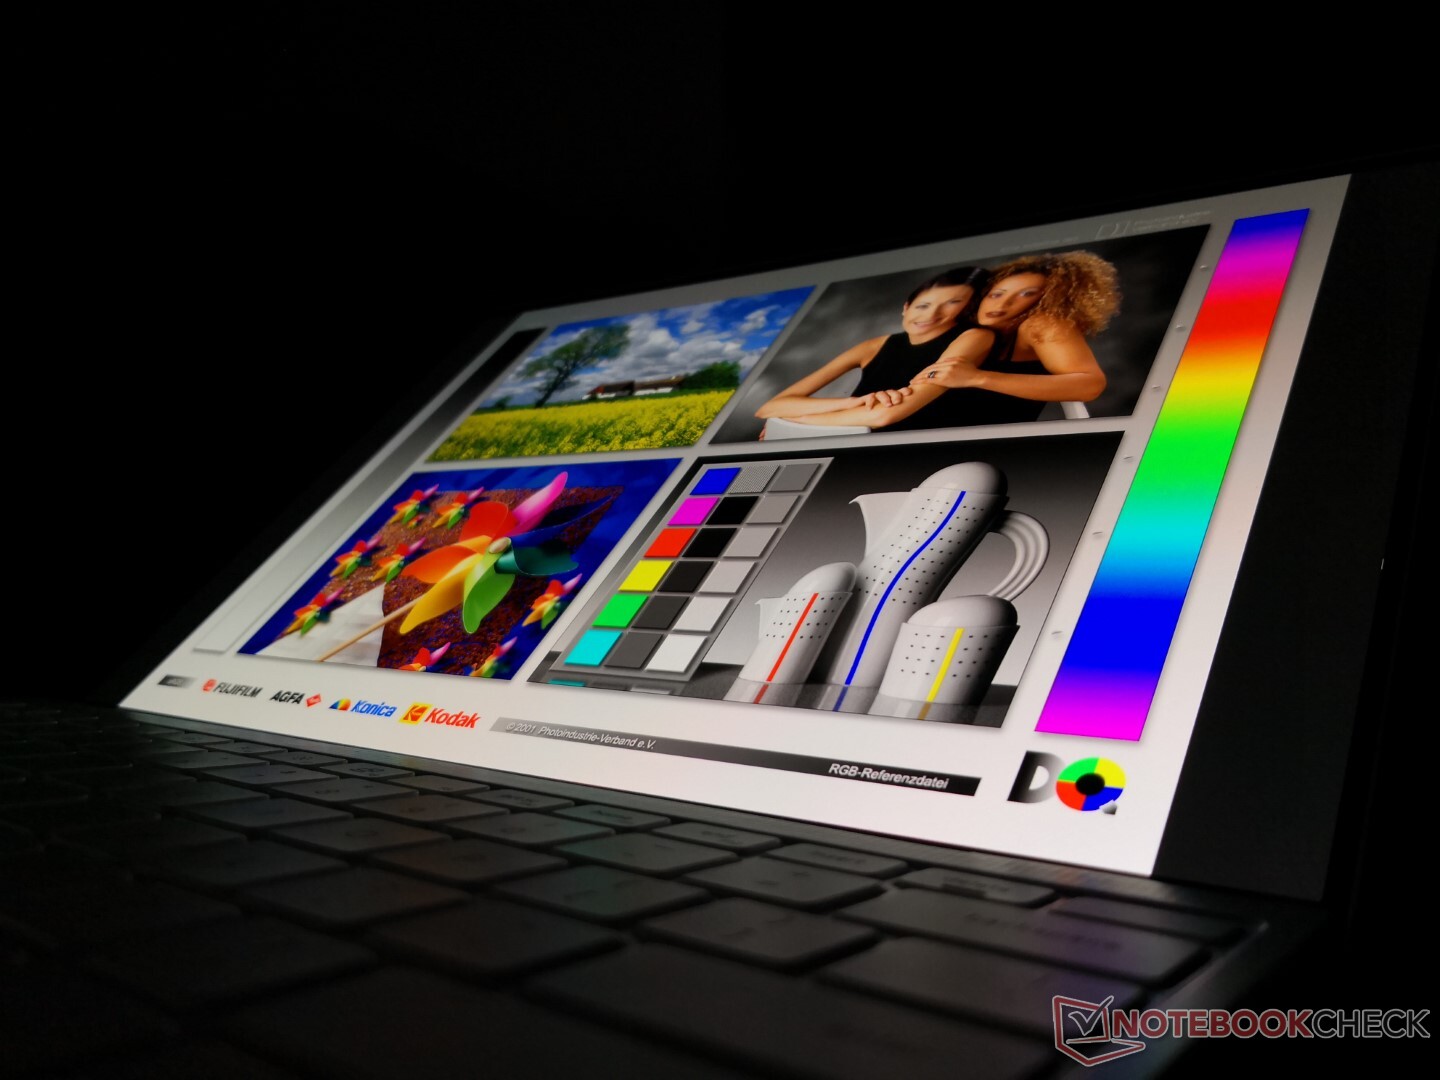
Agora, na metade de 2021, o prometido OLED SKU está finalmente sendo enviado aos clientes por cerca de $1650 USD completo com a CPU Core i7-1185G7, 16 GB de RAM soldada, e 3,5K (3456 x 2160) de resolução touchscreen. É verdade que outros laptops de bandeira tiveram opções OLED por muito mais tempo, mas esta é a primeira vez que o vemos em um formato de 16:10 de 13,4 polegadas.
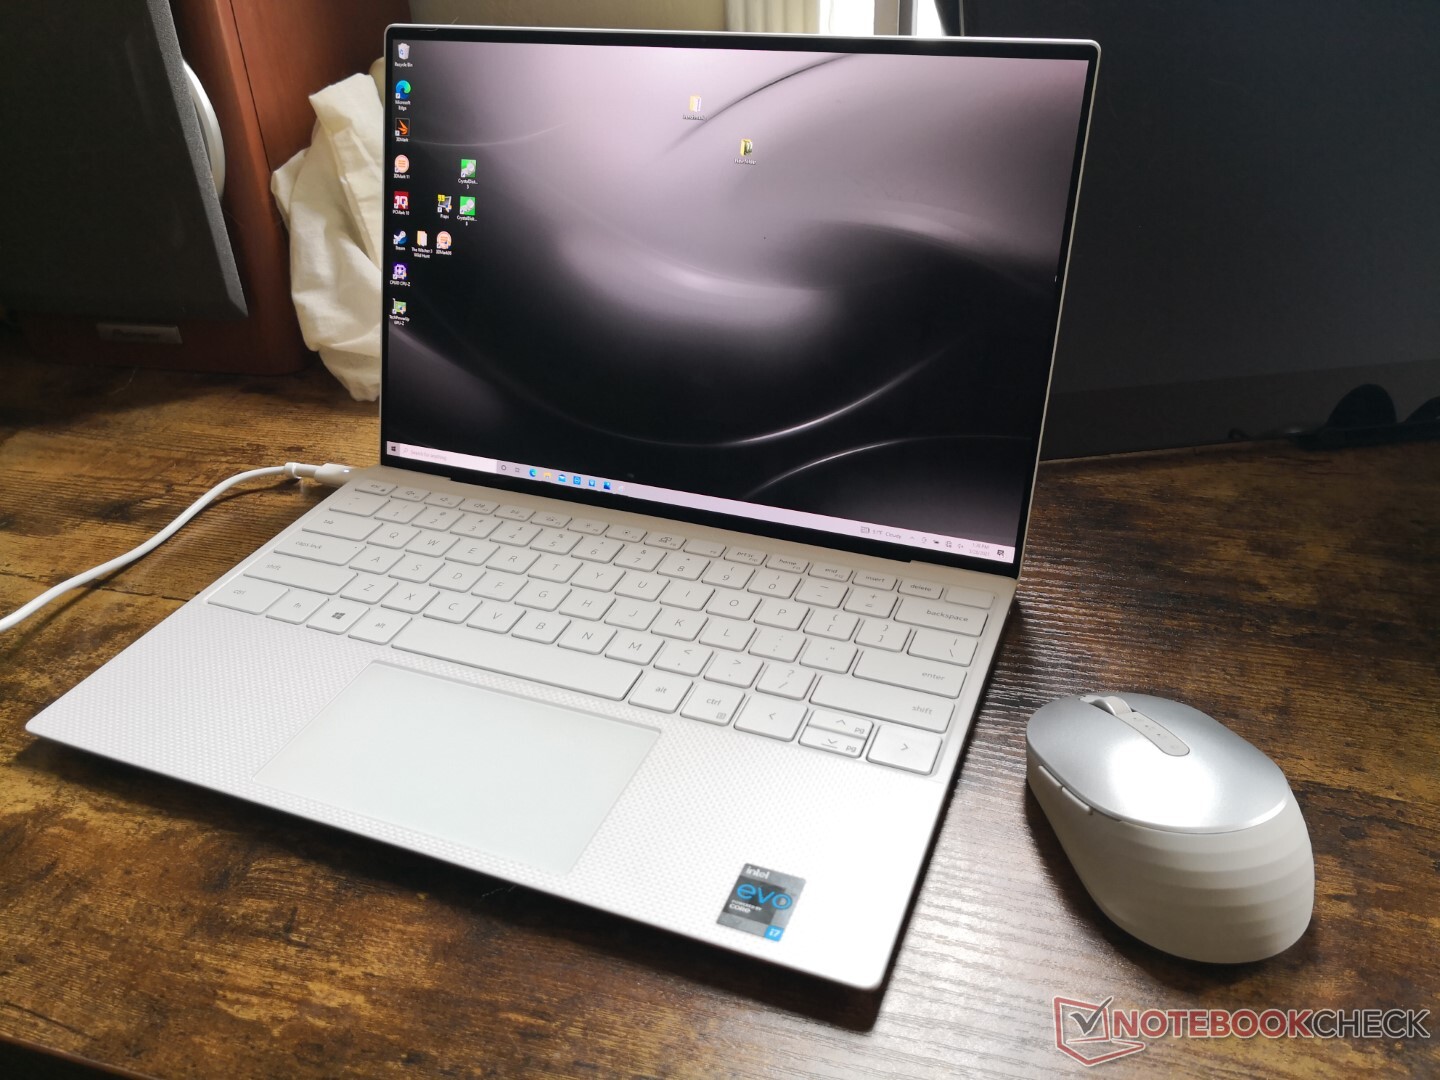
Recomendamos verificar nossas três revisões existentes sobre o XPS 13 9310 FHD, XPS 13 9310 4Ke XPS 13 9300 para saber mais sobre o chassi e suas características, pois o XPS 13 9310 OLED é visualmente idêntico a estas configurações. Esta revisão se concentrará mais na tela OLED touchscreen e no que os usuários podem esperar dela quando comparada com as opções habituais do IPS XPS 13.
Mais análises da Dell:
potential competitors in comparison
Avaliação | Data | Modelo | Peso | Altura | Size | Resolução | Preço |
|---|---|---|---|---|---|---|---|
| 88.3 % v7 (old) | 06/2021 | Dell XPS 13 9310 OLED i7-1185G7, Iris Xe G7 96EUs | 1.2 kg | 14.8 mm | 13.40" | 3456x2160 | |
| 87.4 % v7 (old) | 12/2020 | Dell XPS 13 9310 Core i7 4K i7-1185G7, Iris Xe G7 96EUs | 1.3 kg | 14.8 mm | 13.40" | 3840x2400 | |
| 88.1 % v7 (old) | 11/2020 | Dell XPS 13 9310 Core i7 FHD i7-1165G7, Iris Xe G7 96EUs | 1.3 kg | 14.8 mm | 13.40" | 1920x1200 | |
| 85.9 % v7 (old) | 11/2019 | Dell XPS 13 7390 Core i7-10710U i7-10710U, UHD Graphics 620 | 1.2 kg | 11.6 mm | 13.30" | 3840x2160 | |
| 86.9 % v7 (old) | 04/2021 | MSI Summit E13 Flip Evo A11MT i7-1185G7, Iris Xe G7 96EUs | 1.4 kg | 14.9 mm | 13.40" | 1920x1200 | |
v (old) | 09/2021 | Asus ZenBook 13 OLED UM325UA R7 5700U, Vega 8 | 1.1 kg | 14.8 mm | 13.30" | 1920x1080 |
Caso
Leitor de cartões SD
| SD Card Reader | |
| average JPG Copy Test (av. of 3 runs) | |
| Dell XPS 13 9310 Core i7 FHD (Toshiba Exceria Pro M501 64 GB UHS-II) | |
| Dell XPS 13 9310 Core i7 4K (Toshiba Exceria Pro M501 32 GB UHS-II) | |
| Dell XPS 13 9310 OLED (AV PRO microSD 128 GB V60) | |
| Dell XPS 13 7390 Core i7-10710U (Toshiba Exceria Pro M501 64 GB UHS-II) | |
| MSI Summit E13 Flip Evo A11MT (AV PRO microSD 128 GB V60) | |
| maximum AS SSD Seq Read Test (1GB) | |
| Dell XPS 13 9310 Core i7 4K (Toshiba Exceria Pro M501 32 GB UHS-II) | |
| Dell XPS 13 9310 Core i7 FHD (Toshiba Exceria Pro M501 64 GB UHS-II) | |
| Dell XPS 13 7390 Core i7-10710U (Toshiba Exceria Pro M501 64 GB UHS-II) | |
| Dell XPS 13 9310 OLED (AV PRO microSD 128 GB V60) | |
| MSI Summit E13 Flip Evo A11MT (AV PRO microSD 128 GB V60) | |
Comunicação
As taxas de transmissão são mais lentas do que as que experimentamos em nossas unidades de teste XPS 13 mais antigas, mesmo depois de repetir este teste várias vezes. Na prática, porém, a conexão permanece estável e confiável para o streaming e a navegação.
Webcam


Mostrar
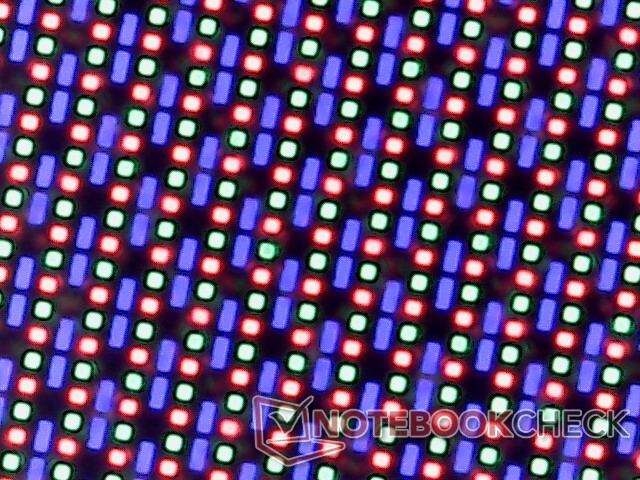
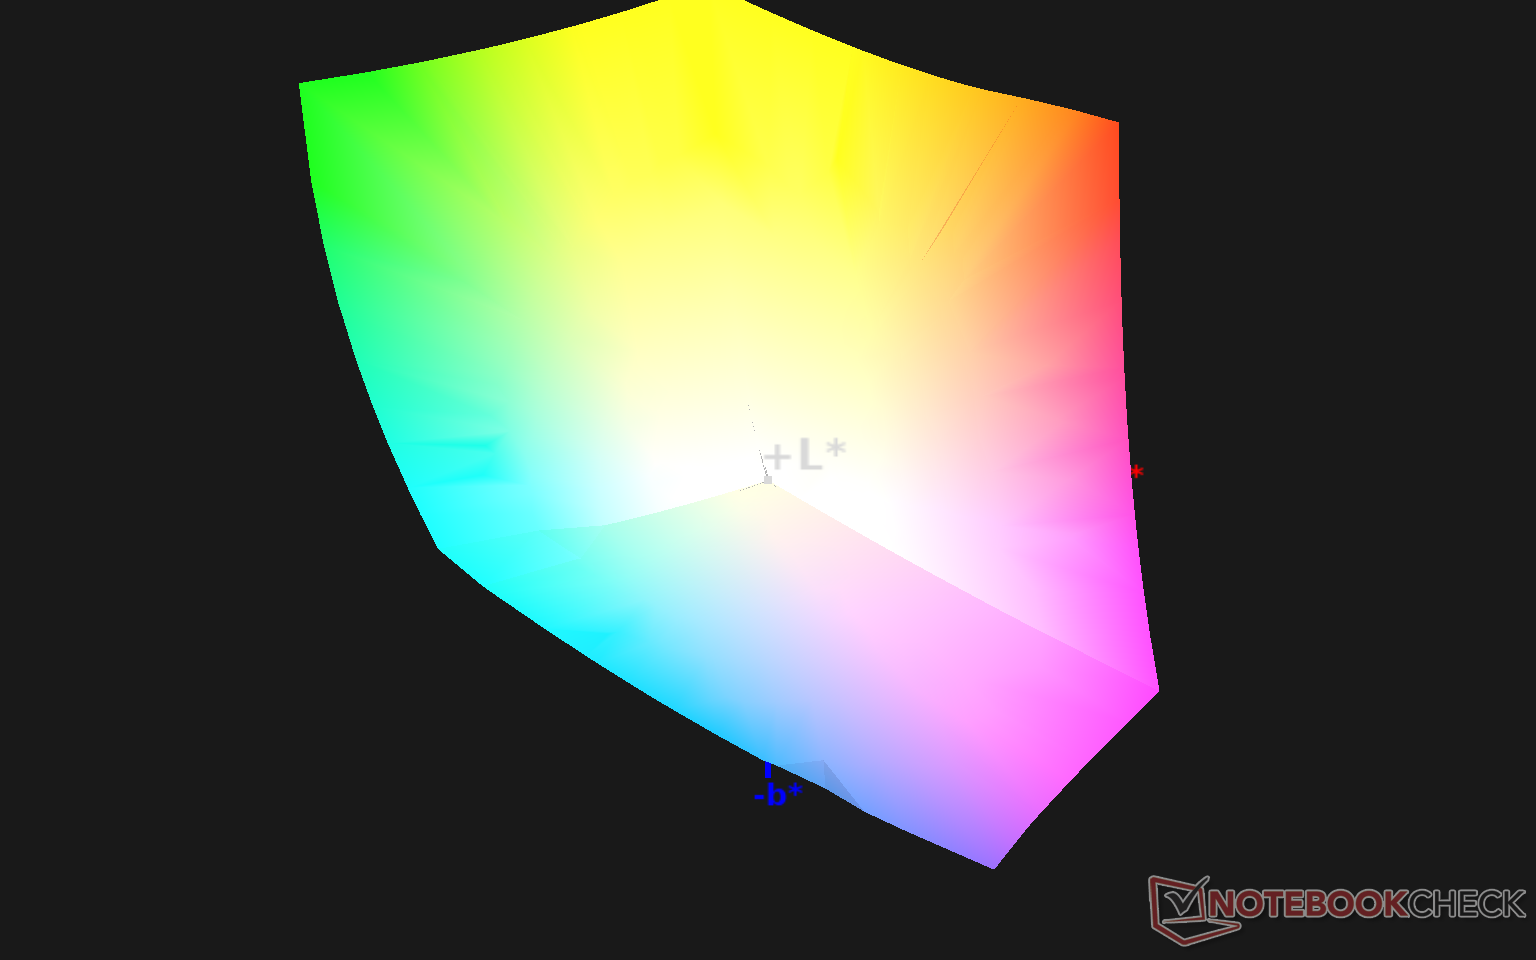
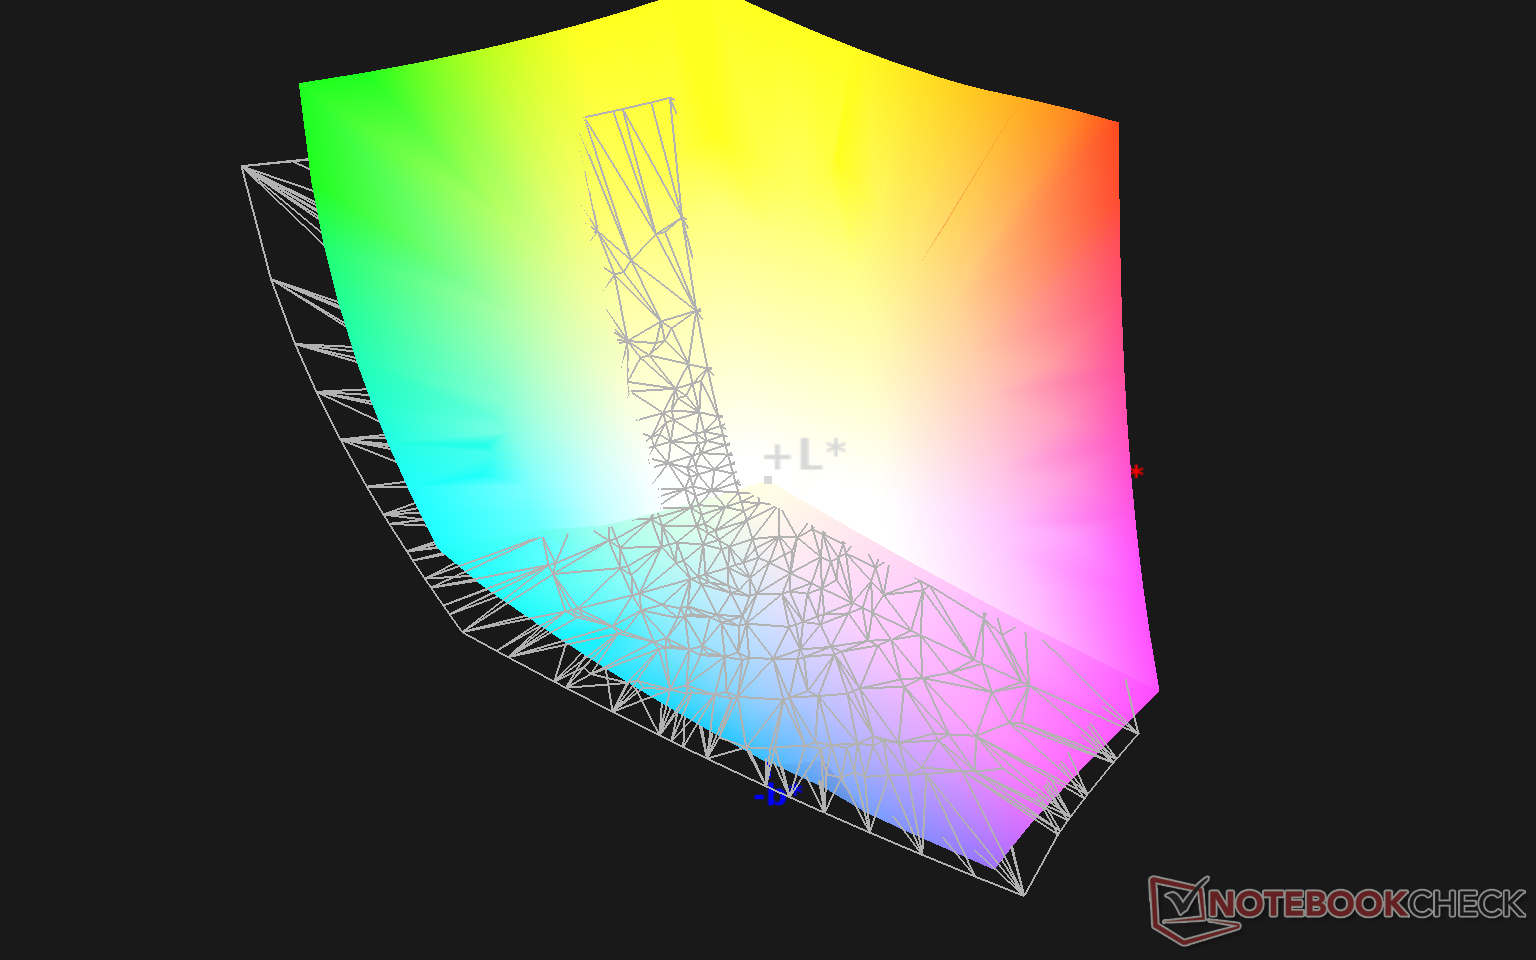
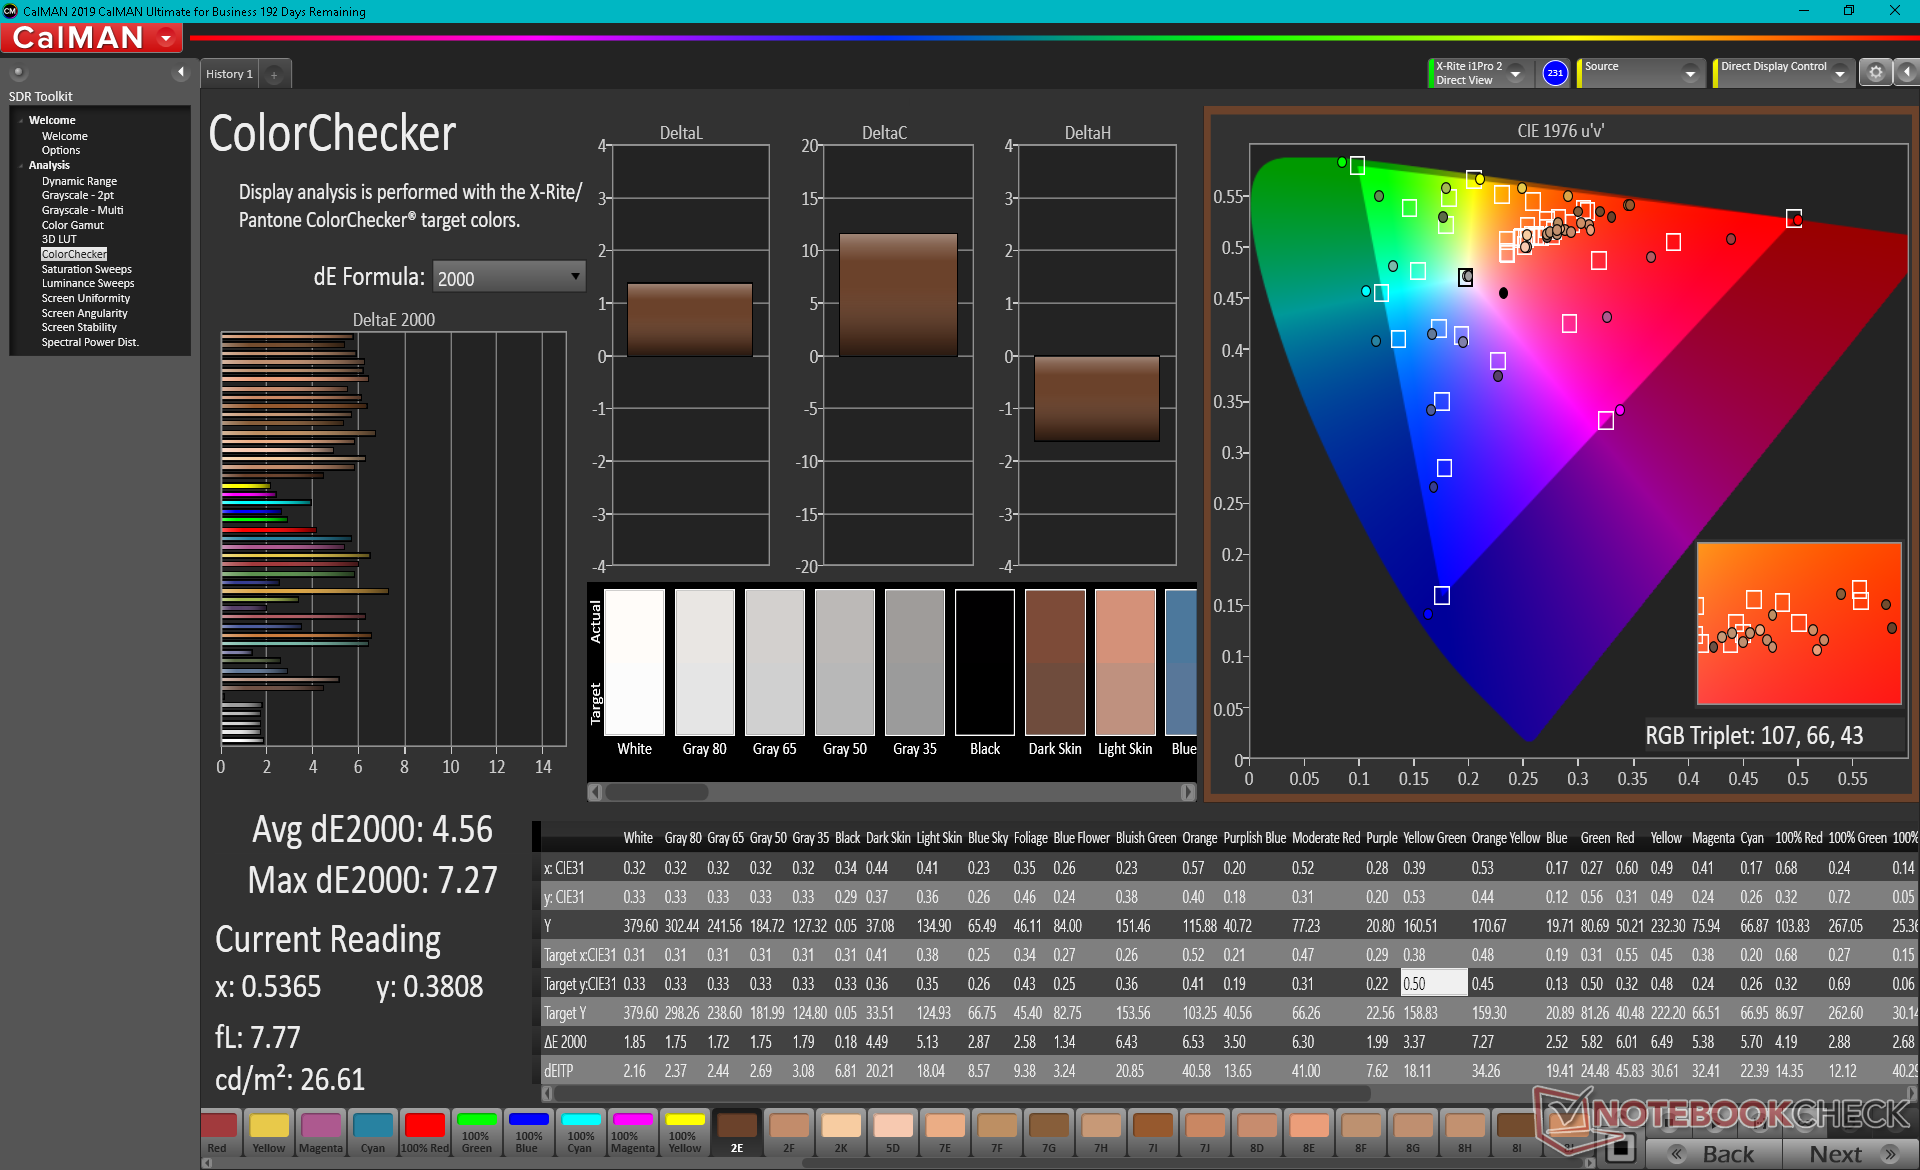
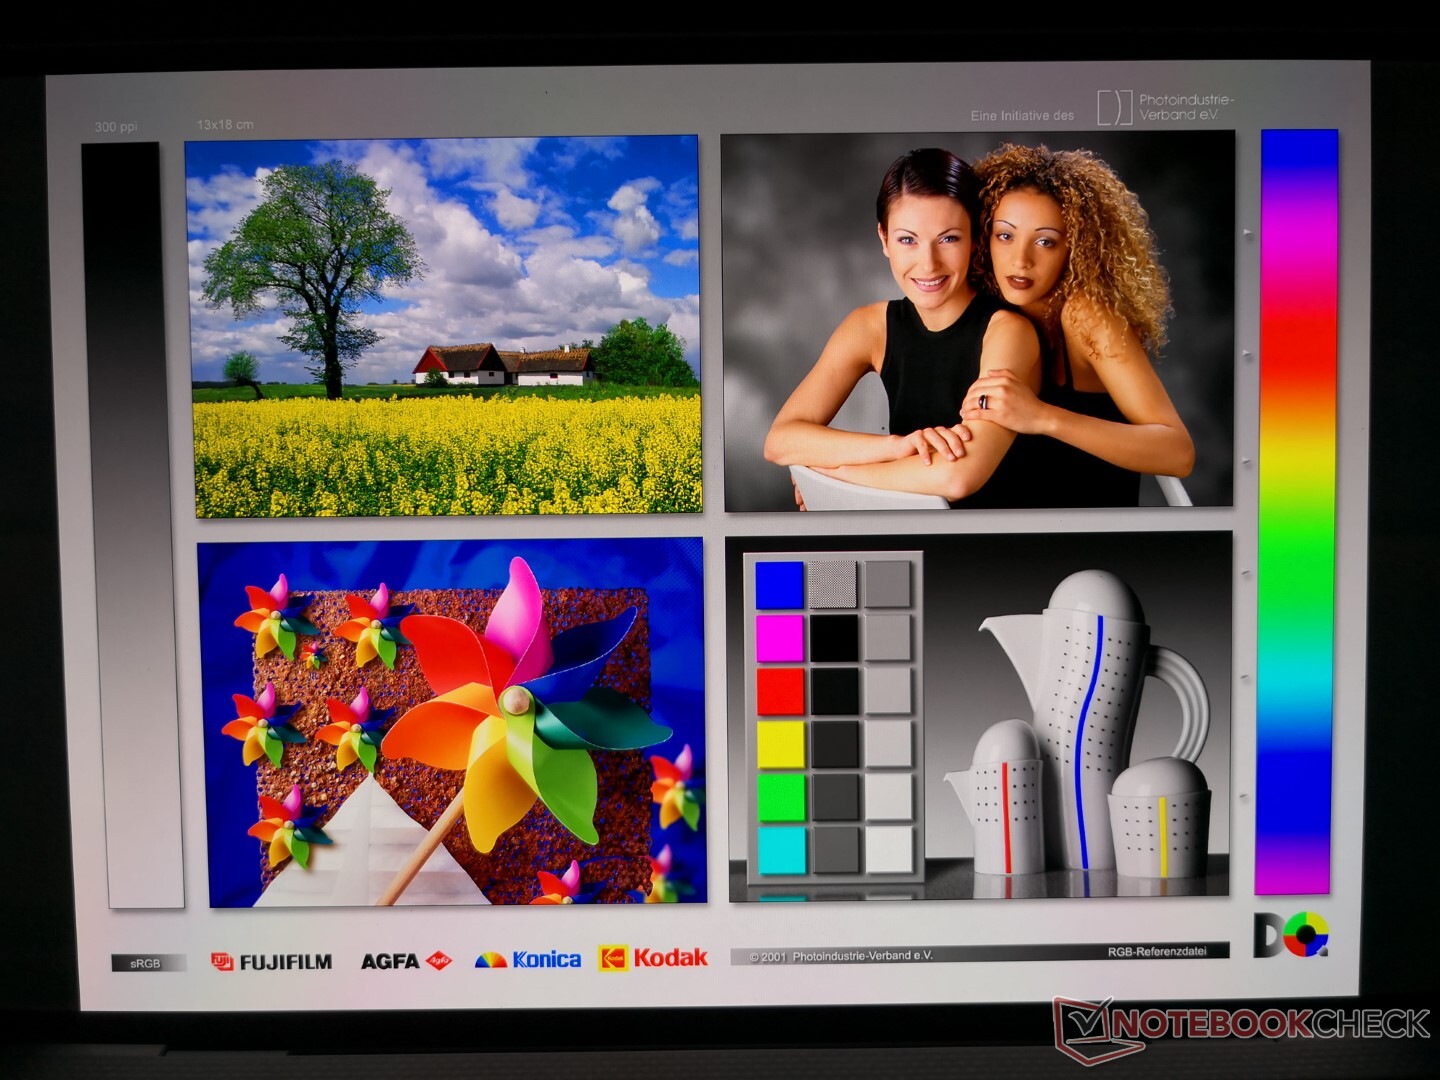
Como a resolução nativa é 3,5K (3456 x 2160) em vez de 4K (3840 x 2400), o PPI é ligeiramente mais baixo que na configuração IPS 4K XPS 13 (304 x 338). Suspeitamos que a resolução é menor porque atualmente não há painéis OLED 4K disponíveis no fator de forma 16:10 de 13,4 polegadas. No entanto, isto pode funcionar a favor do OLED em alguns casos, pois o texto pode ser muito pequeno na tela do 4K 338 PPI.
As três maiores vantagens de nossos OLED SKU em relação aos outros XPS 13 IPS SKUs são os tempos de resposta mais rápidos em preto e branco, a relação de contraste infinita e a maior cobertura de cores DCI-P3. As cores aparecem sem quase nenhum fantasma para uma qualidade de imagem surpreendente, especialmente durante a reprodução do filme
Embora a tela suporte HDR, as configurações padrão do Windows 10 desabilitarão automaticamente o HDR ao ser executado com bateria para aumentar a vida útil da bateria. Esta transição de HDR para não-HDR ou vice-versa envolve um piscar de tela momentâneo sempre que o laptop é conectado a uma tomada. Felizmente, os usuários podem facilmente alternar as configurações padrão digitando "Windows HD Color" na barra de busca do menu Iniciar, certificando-se de que "Use HDR" esteja definido como "On", e então definindo as opções de bateria para "Optimize for image quality" ao invés de "Optimize for battery life". Você saberá que as configurações estão funcionando quando a tela estiver piscando ao trocar entre a energia do adaptador AC e a energia da bateria.
| |||||||||||||||||||||||||
iluminação: 97 %
iluminação com acumulador: 384 cd/m²
Contraste: ∞:1 (Preto: 0 cd/m²)
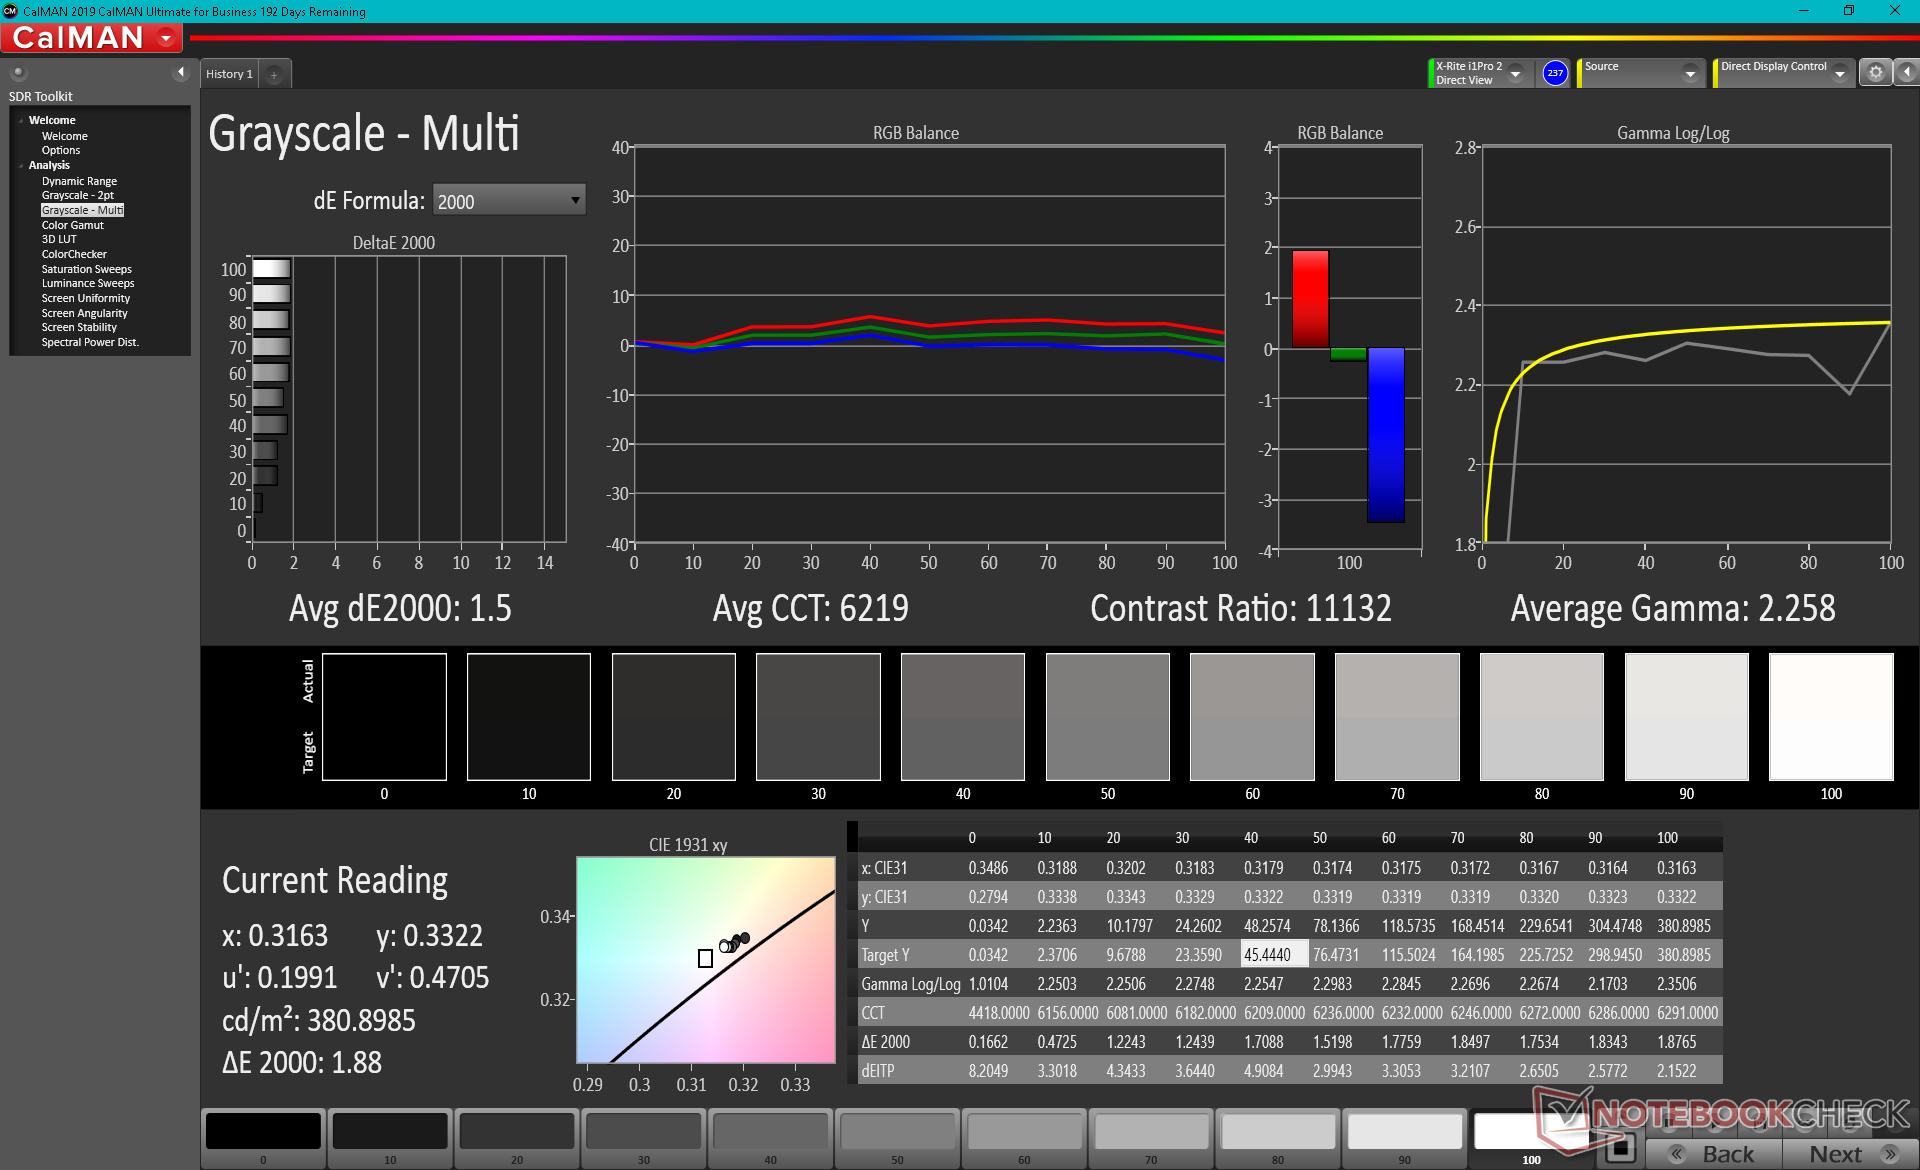
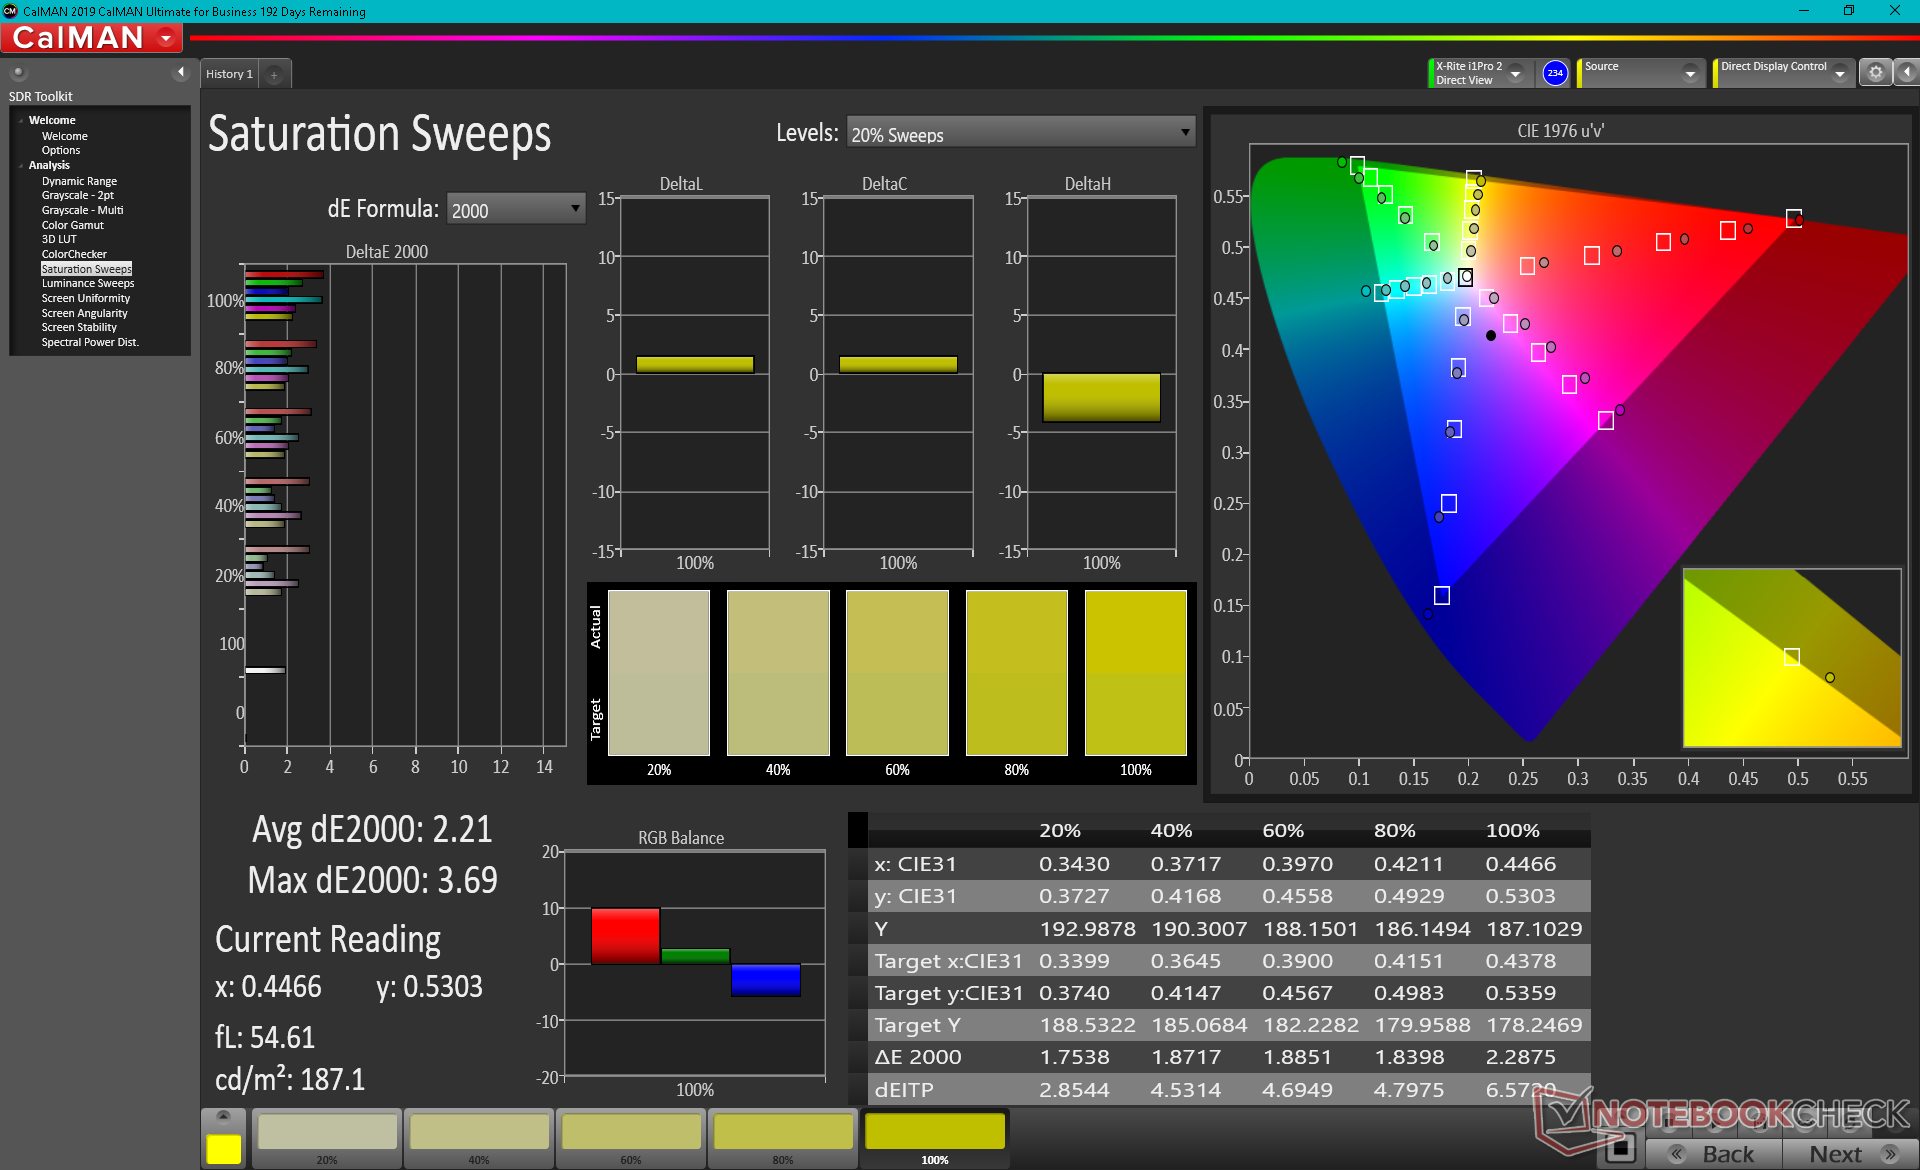
ΔE ColorChecker Calman: 4.56 | ∀{0.5-29.43 Ø4.71}
calibrated: 4.52
ΔE Greyscale Calman: 1.5 | ∀{0.09-98 Ø4.96}
100% sRGB (Argyll 1.6.3 3D)
87.1% AdobeRGB 1998 (Argyll 1.6.3 3D)
97.7% AdobeRGB 1998 (Argyll 3D)
100% sRGB (Argyll 3D)
99.7% Display P3 (Argyll 3D)
Gamma: 2.26
CCT: 6219 K
| Dell XPS 13 9310 OLED Samsung 134XK01, OLED, 13.4", 3456x2160 | Dell XPS 13 9310 Core i7 4K Sharp LQ134R1, IPS, 13.4", 3840x2400 | Dell XPS 13 9310 Core i7 FHD Sharp LQ134N1, IPS, 13.4", 1920x1200 | Dell XPS 13 7390 Core i7-10710U AU Optronics B133ZAN, Dell P/N: 90NTH, IPS, 13.3", 3840x2160 | MSI Summit E13 Flip Evo A11MT Sharp LQ134N1JW53, IPS, 13.4", 1920x1200 | |
|---|---|---|---|---|---|
| Display | -13% | -18% | -25% | -20% | |
| Display P3 Coverage (%) | 99.7 | 80.2 -20% | 70.9 -29% | 63.4 -36% | 69.8 -30% |
| sRGB Coverage (%) | 100 | 100 0% | 99.1 -1% | 93.7 -6% | 98.8 -1% |
| AdobeRGB 1998 Coverage (%) | 97.7 | 78.9 -19% | 72.9 -25% | 64.3 -34% | 70.6 -28% |
| Response Times | -2164% | -1837% | -1836% | -2355% | |
| Response Time Grey 50% / Grey 80% * (ms) | 2.2 ? | 59.2 ? -2591% | 52 ? -2264% | 51.6 ? -2245% | 64 ? -2809% |
| Response Time Black / White * (ms) | 2.2 ? | 40.4 ? -1736% | 33.2 ? -1409% | 33.6 ? -1427% | 44 ? -1900% |
| PWM Frequency (Hz) | 240.4 ? | 2137 ? | 2475 ? | ||
| Screen | 3% | -9% | -50% | 28% | |
| Brightness middle (cd/m²) | 384 | 508.7 32% | 543.3 41% | 408.2 6% | 551.3 44% |
| Brightness (cd/m²) | 387 | 479 24% | 524 35% | 399 3% | 517 34% |
| Brightness Distribution (%) | 97 | 84 -13% | 92 -5% | 89 -8% | 91 -6% |
| Black Level * (cd/m²) | 0.3 | 0.38 | 0.39 | 0.37 | |
| Colorchecker dE 2000 * | 4.56 | 2.72 40% | 3.02 34% | 4.6 -1% | 1.45 68% |
| Colorchecker dE 2000 max. * | 7.27 | 4.7 35% | 7.61 -5% | 11.84 -63% | 2.86 61% |
| Colorchecker dE 2000 calibrated * | 4.52 | 1.92 58% | 1.23 73% | 2.03 55% | 1.7 62% |
| Greyscale dE 2000 * | 1.5 | 3.4 -127% | 5 -233% | 7.5 -400% | 1.3 13% |
| Gamma | 2.26 97% | 2.11 104% | 2.02 109% | 2.12 104% | 2.14 103% |
| CCT | 6219 105% | 6245 104% | 6550 99% | 7966 82% | 6580 99% |
| Color Space (Percent of AdobeRGB 1998) (%) | 87.1 | 70.7 -19% | 66.8 -23% | 59.5 -32% | 65 -25% |
| Color Space (Percent of sRGB) (%) | 100 | 100 0% | 99.6 0% | 93.5 -6% | 99 -1% |
| Contrast (:1) | 1696 | 1430 | 1047 | 1490 | |
| Média Total (Programa/Configurações) | -725% /
-310% | -621% /
-272% | -637% /
-300% | -782% /
-323% |
* ... menor é melhor
O espaço de cores cobre todo o sRGB (ou aproximadamente 158 por cento) e 87 por cento do AdobeRGB. Seu volume se estende mais para os espaços vermelho, amarelo e verde do que o AdobeRGB, que é exatamente o que esperaríamos de um painel compatível com o DCI-P3.
Exibir tempos de resposta
| ↔ Tempo de resposta preto para branco | ||
|---|---|---|
| 2.2 ms ... ascensão ↗ e queda ↘ combinadas | ↗ 1 ms ascensão | 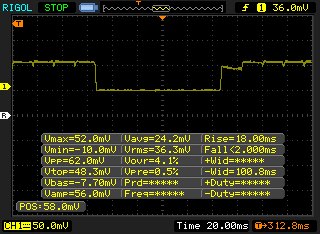 |
| ↘ 1.2 ms queda | ||
| A tela mostra taxas de resposta muito rápidas em nossos testes e deve ser muito adequada para jogos em ritmo acelerado. Em comparação, todos os dispositivos testados variam de 0.1 (mínimo) a 240 (máximo) ms. » 12 % de todos os dispositivos são melhores. Isso significa que o tempo de resposta medido é melhor que a média de todos os dispositivos testados (19.8 ms). | ||
| ↔ Tempo de resposta 50% cinza a 80% cinza | ||
| 2.2 ms ... ascensão ↗ e queda ↘ combinadas | ↗ 1.2 ms ascensão | 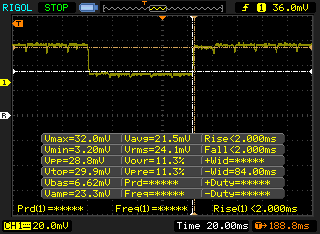 |
| ↘ 1 ms queda | ||
| A tela mostra taxas de resposta muito rápidas em nossos testes e deve ser muito adequada para jogos em ritmo acelerado. Em comparação, todos os dispositivos testados variam de 0.165 (mínimo) a 636 (máximo) ms. » 11 % de todos os dispositivos são melhores. Isso significa que o tempo de resposta medido é melhor que a média de todos os dispositivos testados (31 ms). | ||
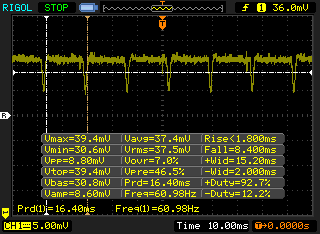
Cintilação da tela / PWM (modulação por largura de pulso)
| Tela tremeluzindo/PWM detectado | 240.4 Hz | ≤ 51 % configuração de brilho | 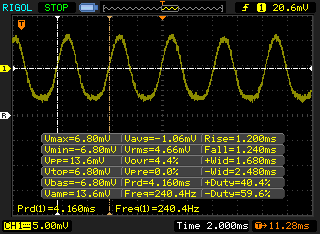 |
A luz de fundo da tela pisca em 240.4 Hz (pior caso, por exemplo, utilizando PWM) Cintilação detectada em uma configuração de brilho de 51 % e abaixo. Não deve haver cintilação ou PWM acima desta configuração de brilho. A frequência de 240.4 Hz é relativamente baixa, portanto, usuários sensíveis provavelmente notarão cintilação e sentirão fadiga ocular na configuração de brilho indicada e abaixo. [pwm_comparison] Em comparação: 52 % de todos os dispositivos testados não usam PWM para escurecer a tela. Se PWM foi detectado, uma média de 7757 (mínimo: 5 - máximo: 343500) Hz foi medida. | |||
Enquanto os painéis IPS normalmente exibiriam apenas uma freqüência de modulação de largura de pulso, este painel OLED exibe duas discretas freqüências de modulação de largura de pulso, dependendo do ajuste do nível de brilho. Somos capazes de registrar uma freqüência de 240,4 Hz e 61 Hz de 0 a 51% de brilho e 52% a máxima luminosidade, respectivamente. Em comparação, o painel IPS XPS 13 4K exibiria um PWM superior de 2137 MHz apenas de 0 a 31% de brilho. As SKUs IPS XPS 13 podem, portanto, ser a melhor opção se seus olhos forem sensíveis à cintilação da tela.

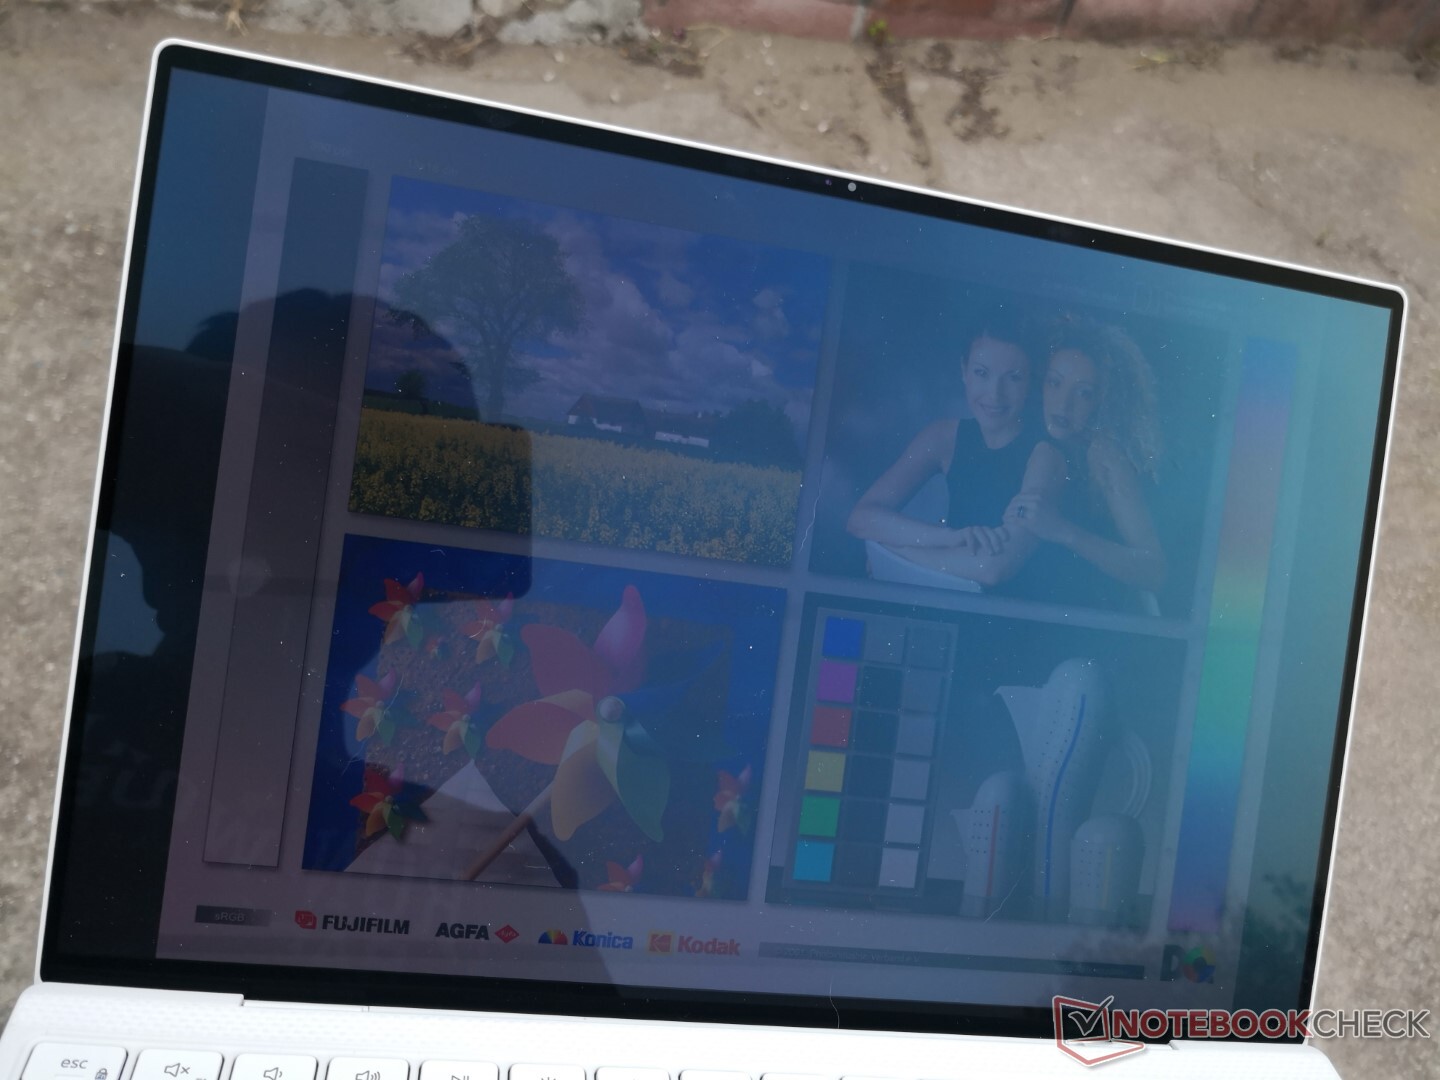
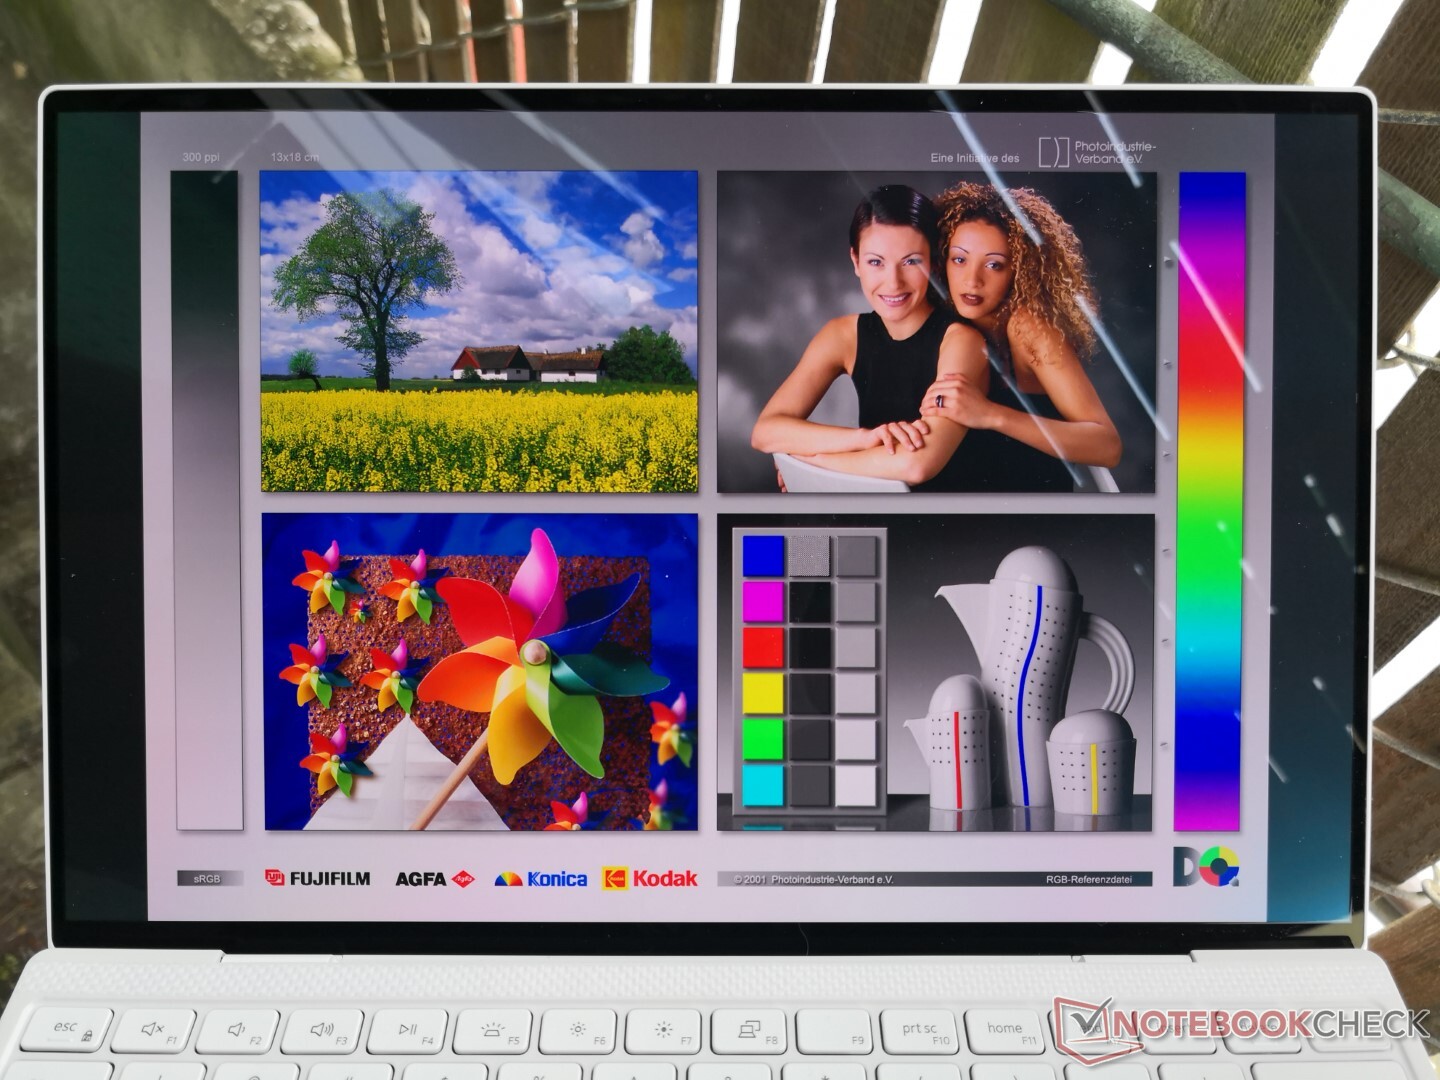
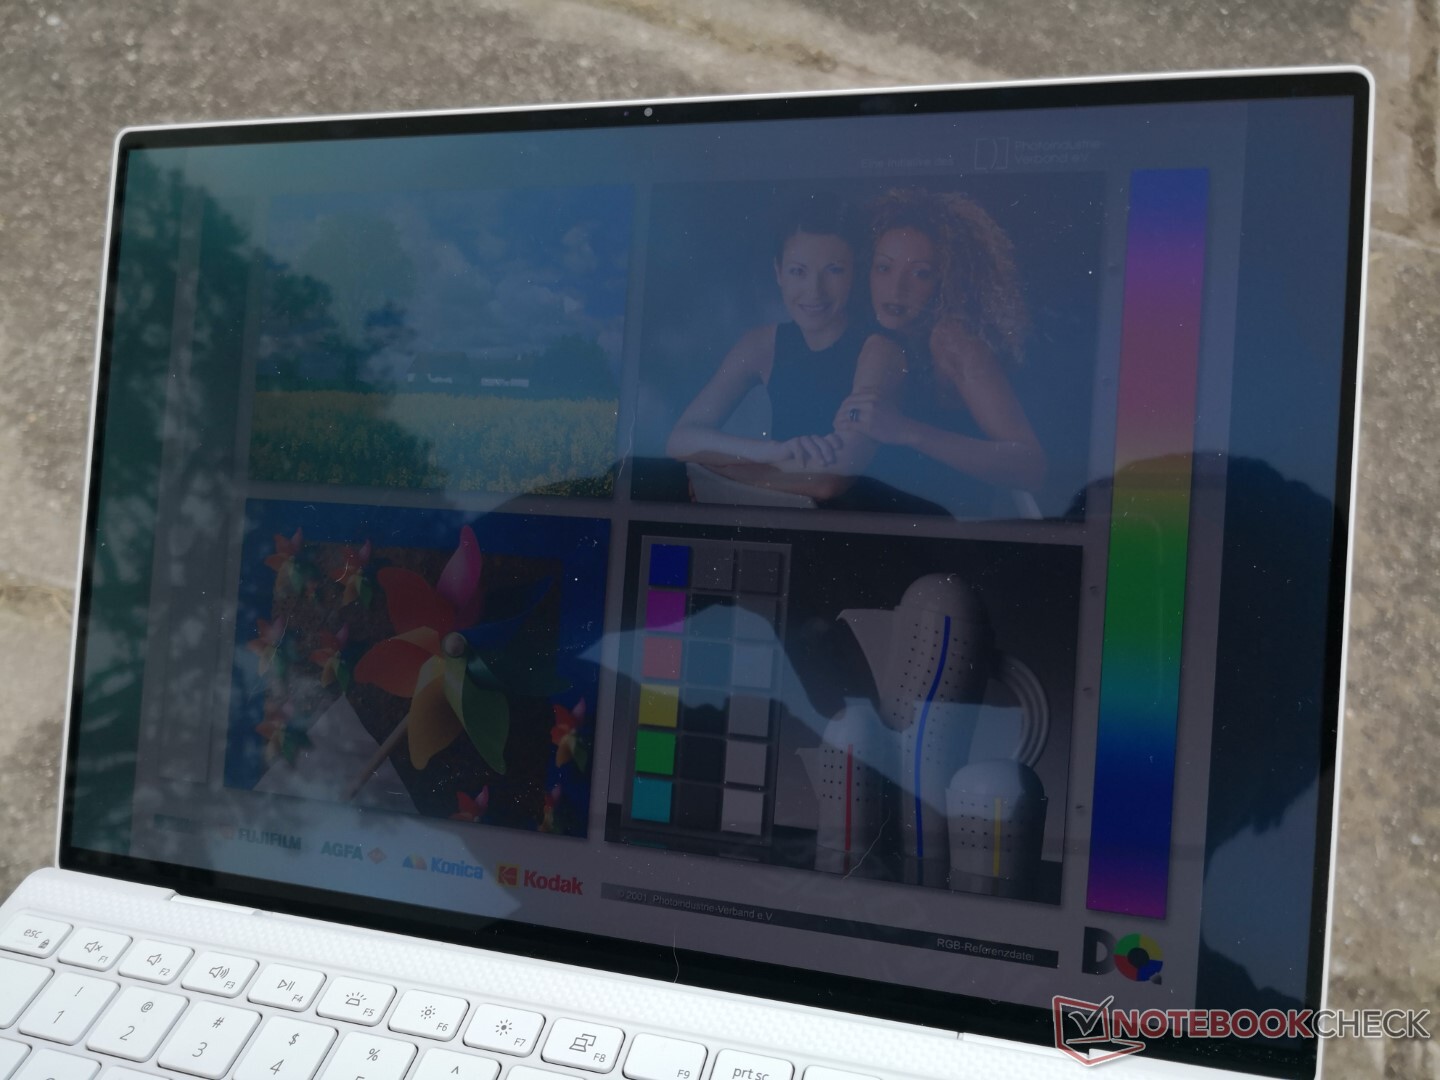
A visibilidade ao ar livre é uma miscelânea. Enquanto OLED oferece contraste mais profundo para facilitar a leitura, não é tão brilhante quanto a típica tela IPS XPS 13 (384 lêndeas vs. >500 lêndeas). Assim, o brilho continua a ser um problema sob a maioria das condições. Também vale a pena notar que a tela tem uma tonalidade azul-verde quando os reflexos são pesados, o que é outra característica única não observada no IPS.
Desempenho
Processador
Como observado em nosso revisões anteriores do XPS 13As taxas de relógio da CPU sofrem um forte ciclo ao executar benchmarks ou jogos devido a A política de Energia Dinâmica da Dell. Isto pode ser observado ao rodar o CineBench R15 xT em loop ou ao jogar jogos, uma vez que as pontuações e as taxas de quadros tendem a ciclar para refletir as taxas de relógio instáveis. Por exemplo, as pontuações do CineBench R15 xT estariam entre 609 e 765 pontos enquanto Witcher 3 as taxas de quadros estariam entre 66 e 95 simplesmente ociosas no mapa mundial.
Cinebench R23: Multi Core | Single Core
Cinebench R15: CPU Multi 64Bit | CPU Single 64Bit
Blender: v2.79 BMW27 CPU
7-Zip 18.03: 7z b 4 -mmt1 | 7z b 4
Geekbench 5.5: Single-Core | Multi-Core
HWBOT x265 Benchmark v2.2: 4k Preset
LibreOffice : 20 Documents To PDF
R Benchmark 2.5: Overall mean
| Cinebench R20 / CPU (Multi Core) | |
| Asus ZenBook 13 UM325S | |
| Lenovo Yoga Slim 7 14ARE05 82A20008GE | |
| Asus ZenBook 13 OLED UM325UA | |
| Dell XPS 13 7390 Core i7-10710U | |
| Média Intel Core i7-1185G7 (1425 - 2493, n=28) | |
| Dell XPS 13 9310 OLED | |
| Dell XPS 13 9305 Core i5 FHD | |
| HP Envy 13-ba1475ng | |
| Asus VivoBook S13 S333JA-DS51 | |
| Asus ZenBook 13 UX325JA | |
| Dell Latitude 7300-P99G | |
| HP Envy 13-ba0001ng | |
| HP Envy 13-aq0003ng | |
| Cinebench R20 / CPU (Single Core) | |
| Média Intel Core i7-1185G7 (489 - 593, n=28) | |
| Dell XPS 13 9310 OLED | |
| Asus ZenBook 13 UM325S | |
| HP Envy 13-ba1475ng | |
| Dell XPS 13 9305 Core i5 FHD | |
| Asus ZenBook 13 OLED UM325UA | |
| Lenovo Yoga Slim 7 14ARE05 82A20008GE | |
| Dell XPS 13 7390 Core i7-10710U | |
| Asus ZenBook 13 UX325JA | |
| HP Envy 13-ba0001ng | |
| Dell Latitude 7300-P99G | |
| Asus VivoBook S13 S333JA-DS51 | |
| HP Envy 13-aq0003ng | |
| Cinebench R23 / Multi Core | |
| Asus ZenBook 13 UM325S | |
| Lenovo Yoga Slim 7 14ARE05 82A20008GE | |
| Asus ZenBook 13 OLED UM325UA | |
| Dell XPS 13 9305 Core i5 FHD | |
| Média Intel Core i7-1185G7 (3610 - 6383, n=24) | |
| Dell XPS 13 9310 OLED | |
| HP Envy 13-ba1475ng | |
| Asus VivoBook S13 S333JA-DS51 | |
| Cinebench R23 / Single Core | |
| Dell XPS 13 9310 OLED | |
| Média Intel Core i7-1185G7 (1251 - 1532, n=24) | |
| Asus ZenBook 13 UM325S | |
| HP Envy 13-ba1475ng | |
| Dell XPS 13 9305 Core i5 FHD | |
| Asus ZenBook 13 OLED UM325UA | |
| Lenovo Yoga Slim 7 14ARE05 82A20008GE | |
| Asus VivoBook S13 S333JA-DS51 | |
| Cinebench R15 / CPU Multi 64Bit | |
| Asus ZenBook 13 UM325S | |
| Asus ZenBook 13 OLED UM325UA | |
| Lenovo Yoga Slim 7 14ARE05 82A20008GE | |
| Dell XPS 13 7390 Core i7-10710U | |
| Média Intel Core i7-1185G7 (617 - 1066, n=32) | |
| Dell XPS 13 9310 OLED | |
| Dell XPS 13 9305 Core i5 FHD | |
| Asus ZenBook 13 UX325JA | |
| HP Envy 13-ba1475ng | |
| Dell Latitude 7300-P99G | |
| Asus VivoBook S13 S333JA-DS51 | |
| HP Envy 13-ba0001ng | |
| HP Envy 13-aq0003ng | |
| Cinebench R15 / CPU Single 64Bit | |
| Asus ZenBook 13 UM325S | |
| Dell XPS 13 9310 OLED | |
| Média Intel Core i7-1185G7 (168 - 230, n=27) | |
| HP Envy 13-ba1475ng | |
| Dell Latitude 7300-P99G | |
| Asus ZenBook 13 OLED UM325UA | |
| Asus ZenBook 13 UX325JA | |
| Dell XPS 13 7390 Core i7-10710U | |
| Lenovo Yoga Slim 7 14ARE05 82A20008GE | |
| HP Envy 13-ba0001ng | |
| HP Envy 13-aq0003ng | |
| Asus VivoBook S13 S333JA-DS51 | |
| Blender / v2.79 BMW27 CPU | |
| Asus ZenBook 13 UX325JA | |
| HP Envy 13-ba0001ng | |
| Asus VivoBook S13 S333JA-DS51 | |
| HP Envy 13-ba1475ng | |
| Dell XPS 13 9310 OLED | |
| Dell XPS 13 9305 Core i5 FHD | |
| Média Intel Core i7-1185G7 (478 - 745, n=28) | |
| Dell XPS 13 7390 Core i7-10710U | |
| Lenovo Yoga Slim 7 14ARE05 82A20008GE | |
| Asus ZenBook 13 OLED UM325UA | |
| Asus ZenBook 13 UM325S | |
| 7-Zip 18.03 / 7z b 4 -mmt1 | |
| Asus ZenBook 13 UM325S | |
| Média Intel Core i7-1185G7 (3678 - 5507, n=27) | |
| HP Envy 13-ba1475ng | |
| HP Envy 13-ba0001ng | |
| Dell XPS 13 9305 Core i5 FHD | |
| Asus ZenBook 13 OLED UM325UA | |
| Dell XPS 13 7390 Core i7-10710U | |
| Lenovo Yoga Slim 7 14ARE05 82A20008GE | |
| Asus ZenBook 13 UX325JA | |
| Asus VivoBook S13 S333JA-DS51 | |
| Dell XPS 13 9310 OLED | |
| 7-Zip 18.03 / 7z b 4 | |
| Asus ZenBook 13 UM325S | |
| Asus ZenBook 13 OLED UM325UA | |
| Lenovo Yoga Slim 7 14ARE05 82A20008GE | |
| Dell XPS 13 7390 Core i7-10710U | |
| Dell XPS 13 9305 Core i5 FHD | |
| Média Intel Core i7-1185G7 (18812 - 27693, n=27) | |
| Dell XPS 13 9310 OLED | |
| HP Envy 13-ba1475ng | |
| Asus VivoBook S13 S333JA-DS51 | |
| HP Envy 13-ba0001ng | |
| Asus ZenBook 13 UX325JA | |
| Geekbench 5.5 / Single-Core | |
| Dell XPS 13 9310 OLED | |
| Média Intel Core i7-1185G7 (1398 - 1626, n=21) | |
| HP Envy 13-ba1475ng | |
| Asus ZenBook 13 UM325S | |
| Dell XPS 13 9305 Core i5 FHD | |
| Asus ZenBook 13 UX325JA | |
| HP Envy 13-ba0001ng | |
| Asus ZenBook 13 OLED UM325UA | |
| Asus VivoBook S13 S333JA-DS51 | |
| Lenovo Yoga Slim 7 14ARE05 82A20008GE | |
| Geekbench 5.5 / Multi-Core | |
| Asus ZenBook 13 UM325S | |
| Asus ZenBook 13 OLED UM325UA | |
| Lenovo Yoga Slim 7 14ARE05 82A20008GE | |
| Dell XPS 13 9310 OLED | |
| Média Intel Core i7-1185G7 (4620 - 5944, n=21) | |
| Dell XPS 13 9305 Core i5 FHD | |
| HP Envy 13-ba1475ng | |
| Asus ZenBook 13 UX325JA | |
| Asus VivoBook S13 S333JA-DS51 | |
| HP Envy 13-ba0001ng | |
| HWBOT x265 Benchmark v2.2 / 4k Preset | |
| Asus ZenBook 13 UM325S | |
| Lenovo Yoga Slim 7 14ARE05 82A20008GE | |
| Asus ZenBook 13 OLED UM325UA | |
| Média Intel Core i7-1185G7 (5.02 - 8.13, n=27) | |
| Dell XPS 13 9310 OLED | |
| Dell XPS 13 7390 Core i7-10710U | |
| HP Envy 13-ba1475ng | |
| Asus VivoBook S13 S333JA-DS51 | |
| HP Envy 13-ba0001ng | |
| Asus ZenBook 13 UX325JA | |
| LibreOffice / 20 Documents To PDF | |
| Lenovo Yoga Slim 7 14ARE05 82A20008GE | |
| Asus VivoBook S13 S333JA-DS51 | |
| Asus ZenBook 13 OLED UM325UA | |
| Dell XPS 13 9305 Core i5 FHD | |
| HP Envy 13-ba0001ng | |
| HP Envy 13-ba1475ng | |
| Asus ZenBook 13 UM325S | |
| Asus ZenBook 13 UX325JA | |
| Média Intel Core i7-1185G7 (41.3 - 61.7, n=26) | |
| Dell XPS 13 9310 OLED | |
| R Benchmark 2.5 / Overall mean | |
| Asus VivoBook S13 S333JA-DS51 | |
| Asus ZenBook 13 UX325JA | |
| HP Envy 13-ba0001ng | |
| Dell XPS 13 9305 Core i5 FHD | |
| Lenovo Yoga Slim 7 14ARE05 82A20008GE | |
| HP Envy 13-ba1475ng | |
| Asus ZenBook 13 OLED UM325UA | |
| Dell XPS 13 9310 OLED | |
| Média Intel Core i7-1185G7 (0.55 - 0.615, n=27) | |
| Asus ZenBook 13 UM325S | |
Cinebench R23: Multi Core | Single Core
Cinebench R15: CPU Multi 64Bit | CPU Single 64Bit
Blender: v2.79 BMW27 CPU
7-Zip 18.03: 7z b 4 -mmt1 | 7z b 4
Geekbench 5.5: Single-Core | Multi-Core
HWBOT x265 Benchmark v2.2: 4k Preset
LibreOffice : 20 Documents To PDF
R Benchmark 2.5: Overall mean
* ... menor é melhor
Desempenho do sistema
| PCMark 10 Score | 5226 pontos | |
Ajuda | ||
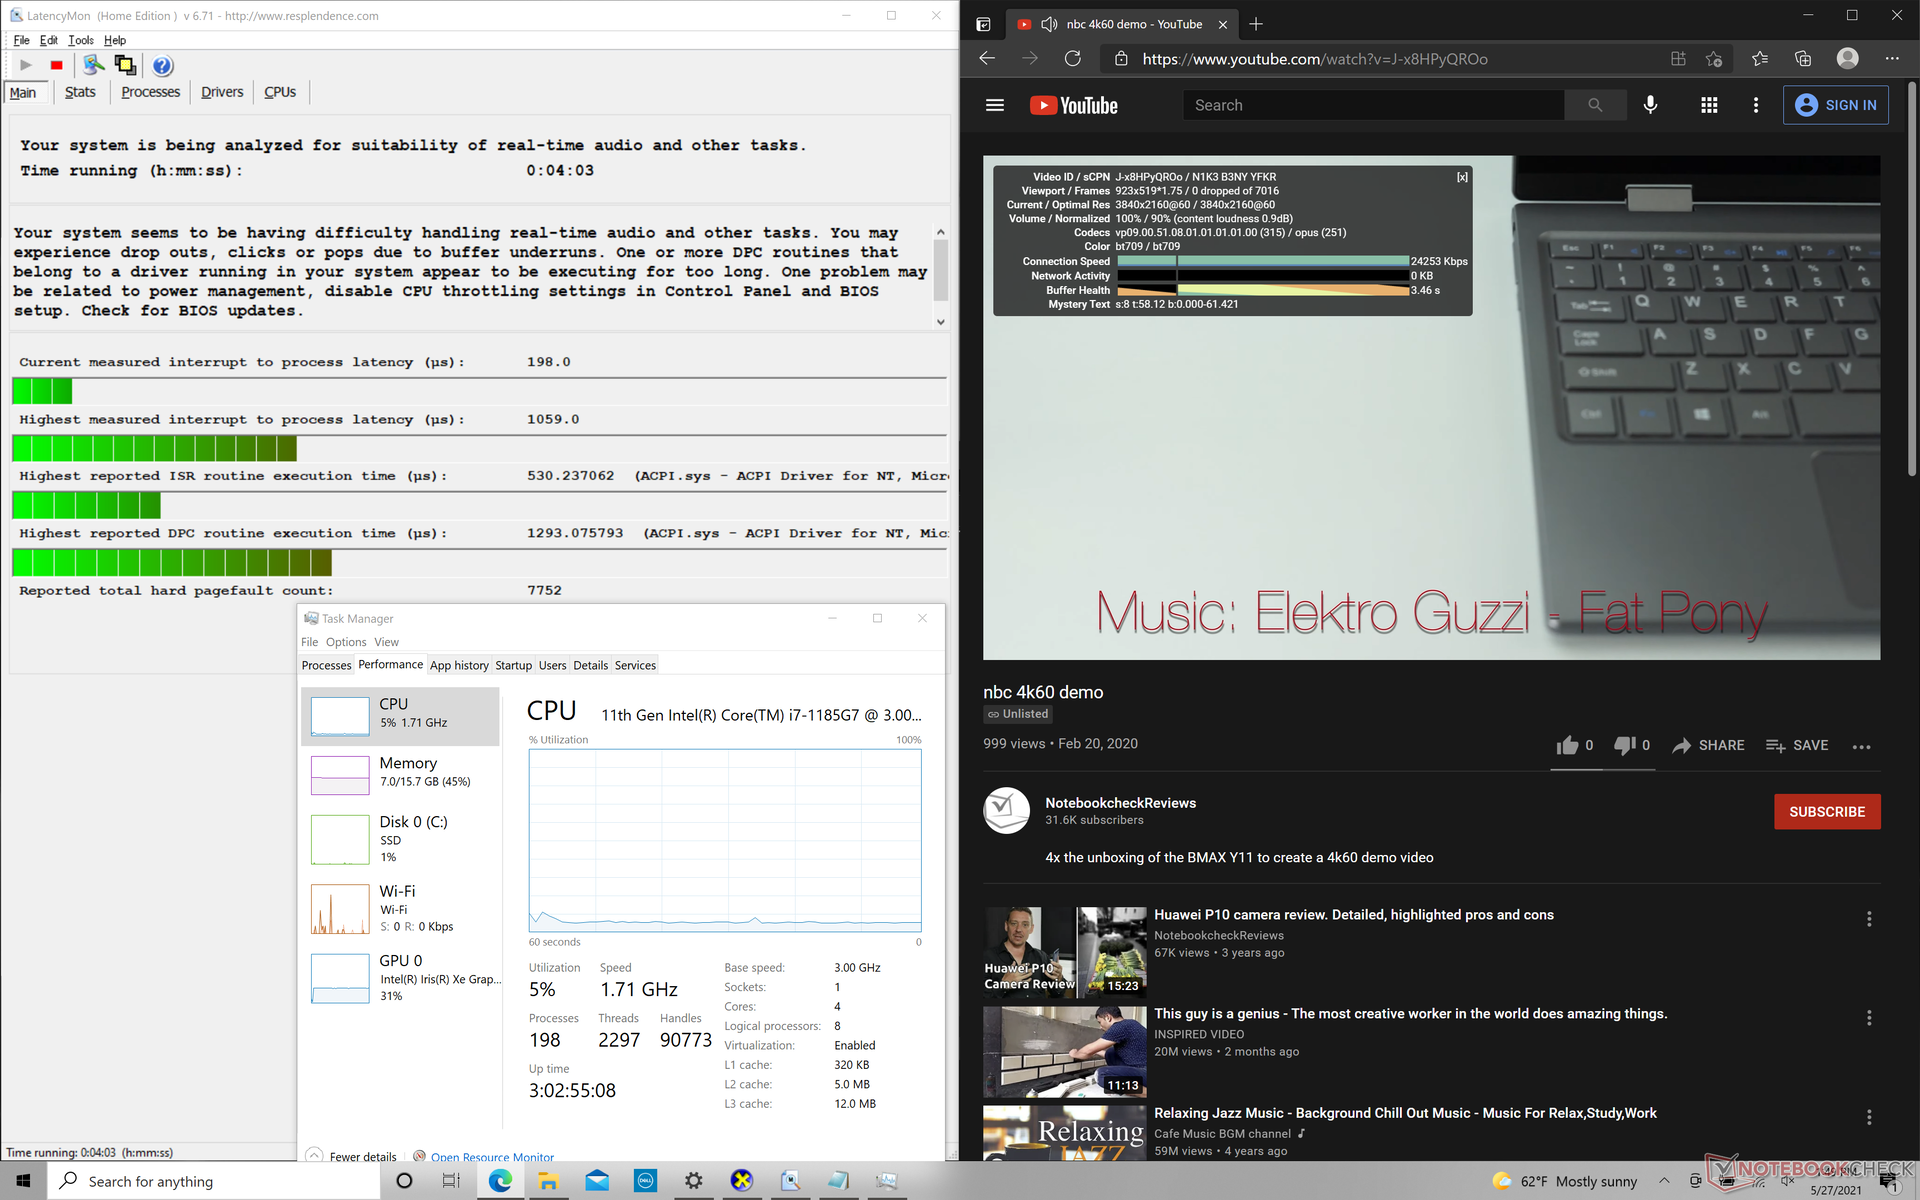
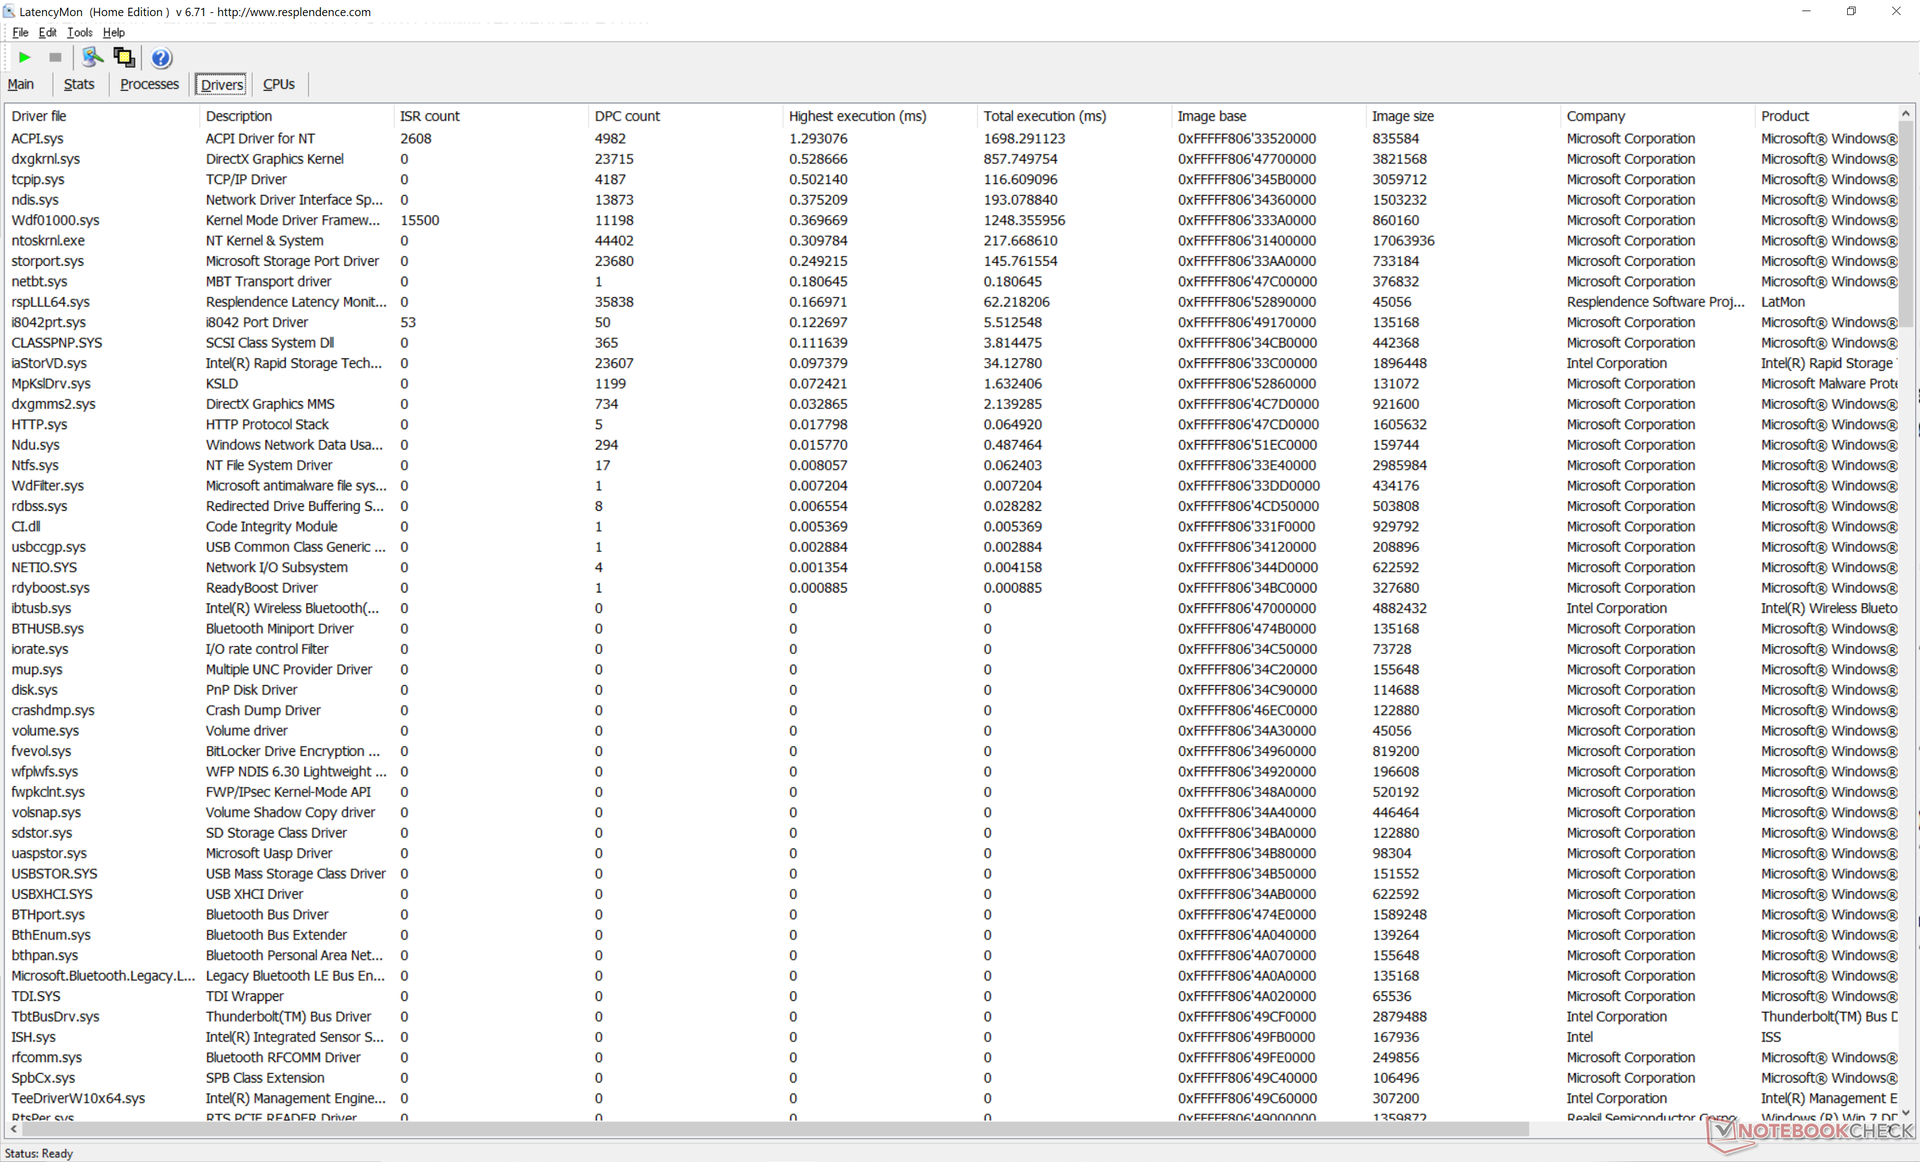
Latência do DPC
A série continua exibindo leves problemas de latência DPC. A reprodução do vídeo de 4K a 60 FPS felizmente permanece suave, sem queda de quadros.
| DPC Latencies / LatencyMon - interrupt to process latency (max), Web, Youtube, Prime95 | |
| MSI Summit E13 Flip Evo A11MT | |
| Dell XPS 13 9310 Core i7 4K | |
| Dell XPS 13 9310 OLED | |
| Dell XPS 13 9310 Core i7 FHD | |
* ... menor é melhor
Dispositivos de armazenamento
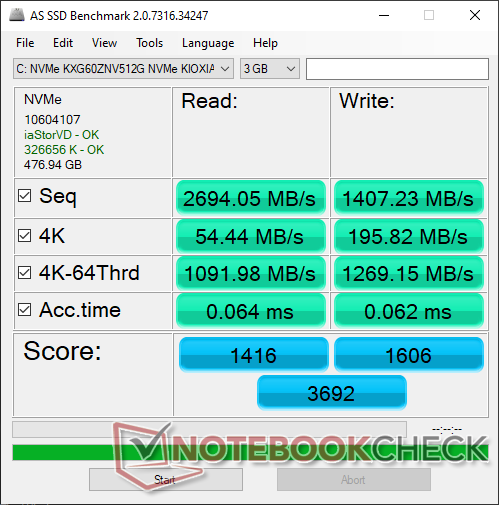
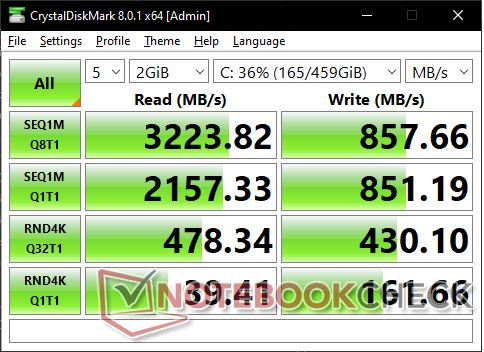
| Dell XPS 13 9310 OLED Toshiba XG6 KXG60ZNV512G | Dell XPS 13 9310 Core i7 FHD Micron 2300 512GB MTFDHBA512TDV | Dell XPS 13 7390 Core i7-10710U SK Hynix PC601 NVMe 512 GB | MSI Summit E13 Flip Evo A11MT Phison 1TB SM2801T24GKBB4S-E162 | |
|---|---|---|---|---|
| AS SSD | -43% | -25% | 23% | |
| Seq Read (MB/s) | 2694 | 2091 -22% | 1804 -33% | 3789 41% |
| Seq Write (MB/s) | 1407 | 1396 -1% | 1000 -29% | 2257 60% |
| 4K Read (MB/s) | 54.4 | 49.29 -9% | 45.1 -17% | 54.2 0% |
| 4K Write (MB/s) | 195.8 | 104.2 -47% | 115 -41% | 78.7 -60% |
| 4K-64 Read (MB/s) | 1092 | 827 -24% | 893 -18% | 1330 22% |
| 4K-64 Write (MB/s) | 1269 | 1636 29% | 732 -42% | 2038 61% |
| Access Time Read * (ms) | 0.064 | 0.066 -3% | 0.044 31% | 0.042 34% |
| Access Time Write * (ms) | 0.062 | 0.365 -489% | 0.095 -53% | 0.04 35% |
| Score Read (Points) | 1416 | 1086 -23% | 1119 -21% | 1763 25% |
| Score Write (Points) | 1606 | 1880 17% | 947 -41% | 2343 46% |
| Score Total (Points) | 3692 | 3499 -5% | 2608 -29% | 4938 34% |
| Copy ISO MB/s (MB/s) | 1782 | 1544 -13% | 1515 -15% | 2270 27% |
| Copy Program MB/s (MB/s) | 1023 | 613 -40% | 535 -48% | 670 -35% |
| Copy Game MB/s (MB/s) | 1148 | 1451 26% | 1211 5% | 1525 33% |
| CrystalDiskMark 5.2 / 6 | 41% | 30% | 95% | |
| Write 4K (MB/s) | 156.8 | 97.5 -38% | 134 -15% | 311.1 98% |
| Read 4K (MB/s) | 39.66 | 50.9 28% | 42.91 8% | 56.6 43% |
| Write Seq (MB/s) | 854 | 1811 112% | 1841 116% | 2397 181% |
| Read Seq (MB/s) | 2167 | 1836 -15% | 1707 -21% | 2277 5% |
| Write 4K Q32T1 (MB/s) | 441.1 | 521 18% | 394.7 -11% | 803 82% |
| Read 4K Q32T1 (MB/s) | 395.5 | 357.5 -10% | 398.5 1% | 849 115% |
| Write Seq Q32T1 (MB/s) | 858 | 2879 236% | 2250 162% | 2410 181% |
| Read Seq Q32T1 (MB/s) | 3258 | 3204 -2% | 3265 0% | 4954 52% |
| Média Total (Programa/Configurações) | -1% /
-13% | 3% /
-5% | 59% /
49% |
* ... menor é melhor

Disk Throttling: DiskSpd Read Loop, Queue Depth 8
Desempenho da GPU
| 3DMark 11 Performance | 6398 pontos | |
| 3DMark Cloud Gate Standard Score | 15019 pontos | |
| 3DMark Fire Strike Score | 4449 pontos | |
| 3DMark Time Spy Score | 1526 pontos | |
Ajuda | ||
| baixo | média | alto | ultra | QHD | 4K | |
|---|---|---|---|---|---|---|
| The Witcher 3 (2015) | 98.6 | 61.1 | 32 | 13.9 | ||
| Dota 2 Reborn (2015) | 76.1 | 74.7 | 41.6 | 43.4 | 21.5 | |
| Final Fantasy XV Benchmark (2018) | 35 | 19.9 | 15.1 | 15.1 | 15.1 | |
| X-Plane 11.11 (2018) | 25.1 | 35.2 | 29.4 | 17.1 | ||
| Strange Brigade (2018) | 88.4 | 33.2 | 29.7 | 22.3 | 16.9 |
Emissions
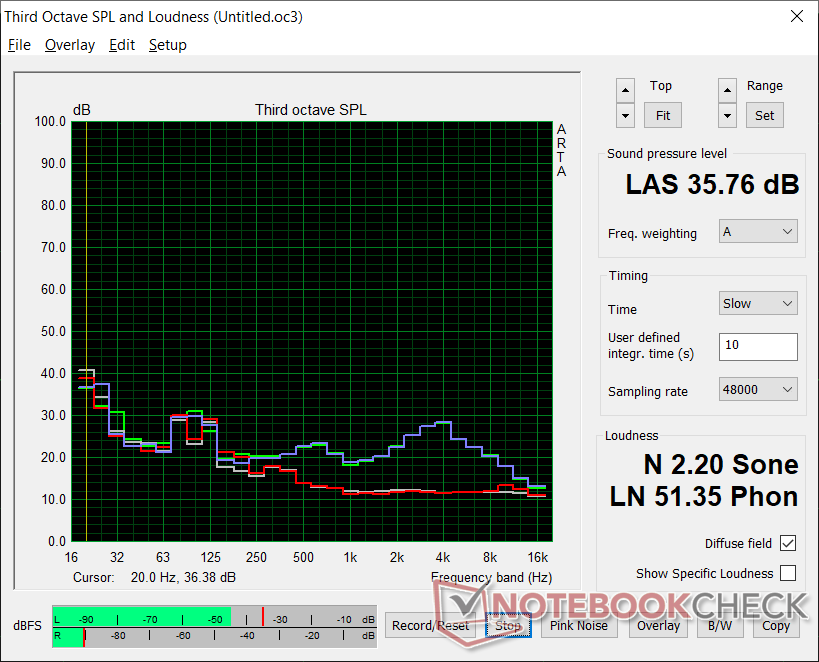
Ruído do sistema
| Dell XPS 13 9310 OLED Iris Xe G7 96EUs, i7-1185G7, Toshiba XG6 KXG60ZNV512G | Dell XPS 13 9310 Core i7 4K Iris Xe G7 96EUs, i7-1185G7, Micron 2300 512GB MTFDHBA512TDV | Dell XPS 13 9310 Core i7 FHD Iris Xe G7 96EUs, i7-1165G7, Micron 2300 512GB MTFDHBA512TDV | Dell XPS 13 7390 Core i7-10710U UHD Graphics 620, i7-10710U, SK Hynix PC601 NVMe 512 GB | MSI Summit E13 Flip Evo A11MT Iris Xe G7 96EUs, i7-1185G7, Phison 1TB SM2801T24GKBB4S-E162 | |
|---|---|---|---|---|---|
| Noise | -7% | -3% | -19% | -15% | |
| desligado / ambiente * (dB) | 24.8 | 27.7 -12% | 25.7 -4% | 28 -13% | 24.5 1% |
| Idle Minimum * (dB) | 25 | 27.8 -11% | 25.7 -3% | 28 -12% | 24.7 1% |
| Idle Average * (dB) | 25 | 27.8 -11% | 25.7 -3% | 28 -12% | 24.7 1% |
| Idle Maximum * (dB) | 25 | 27.8 -11% | 25.9 -4% | 28 -12% | 26.4 -6% |
| Load Average * (dB) | 25.3 | 27.9 -10% | 26.2 -4% | 33.7 -33% | 37.8 -49% |
| Witcher 3 ultra * (dB) | 35.8 | 32.8 8% | 36.5 -2% | 41.4 -16% | |
| Load Maximum * (dB) | 35.8 | 37 -3% | 36.6 -2% | 46.5 -30% | 48.8 -36% |
* ... menor é melhor
Barulho
| Ocioso |
| 25 / 25 / 25 dB |
| Carga |
| 25.3 / 35.8 dB |
 | ||
30 dB silencioso 40 dB(A) audível 50 dB(A) ruidosamente alto |
||
min: | ||
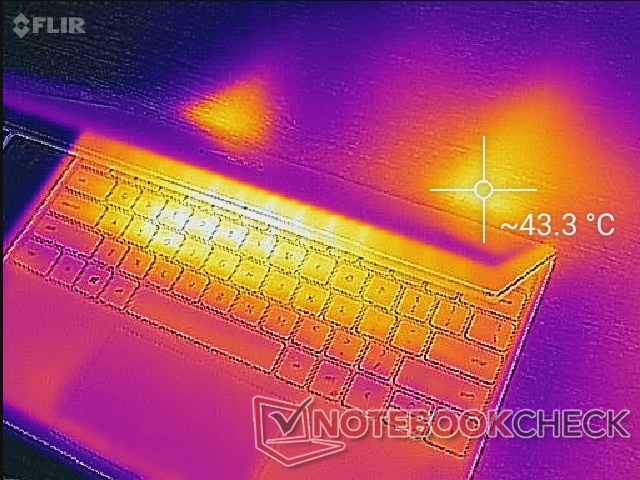
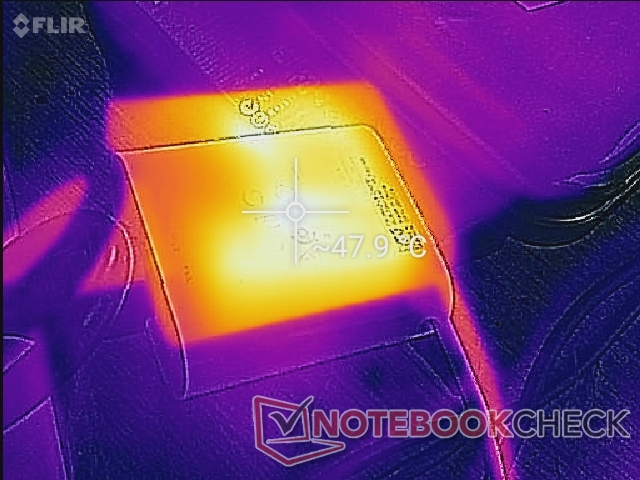
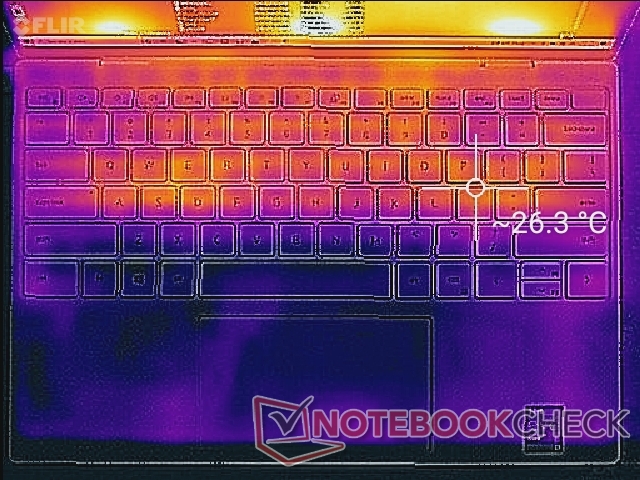
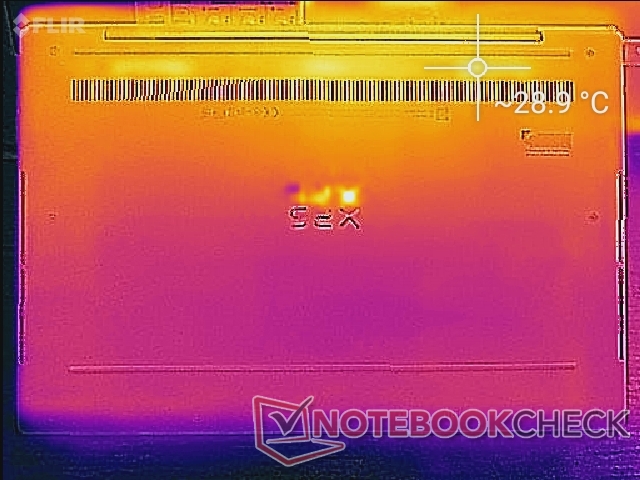
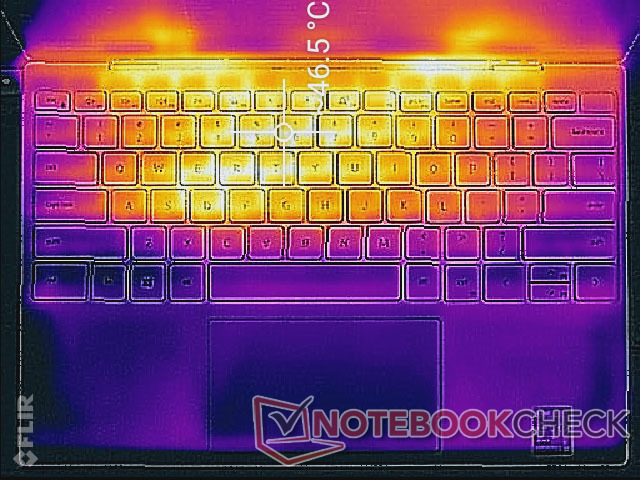
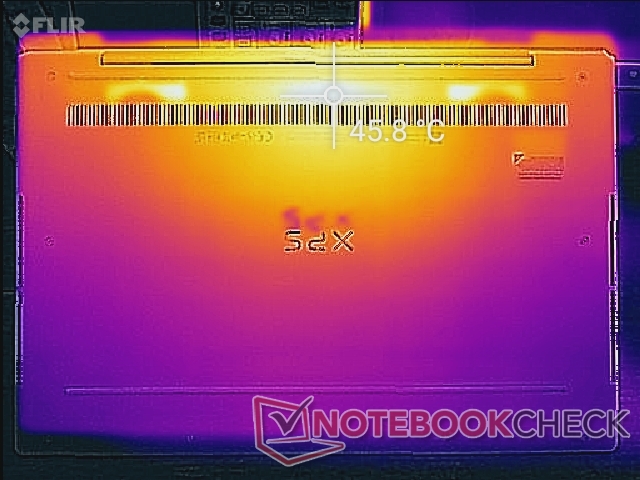
Temperatura
Oradores

Energy Management
Consumo de energia
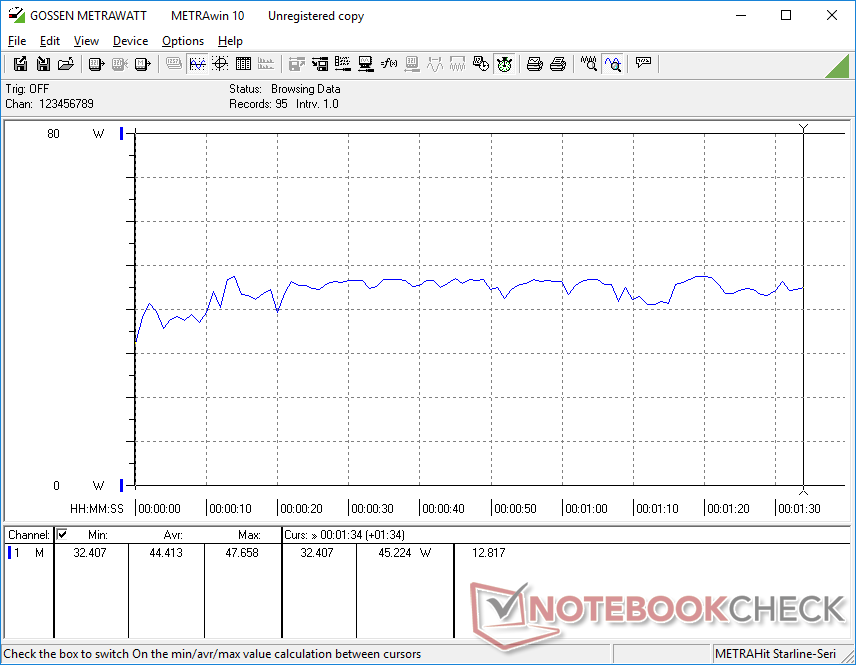
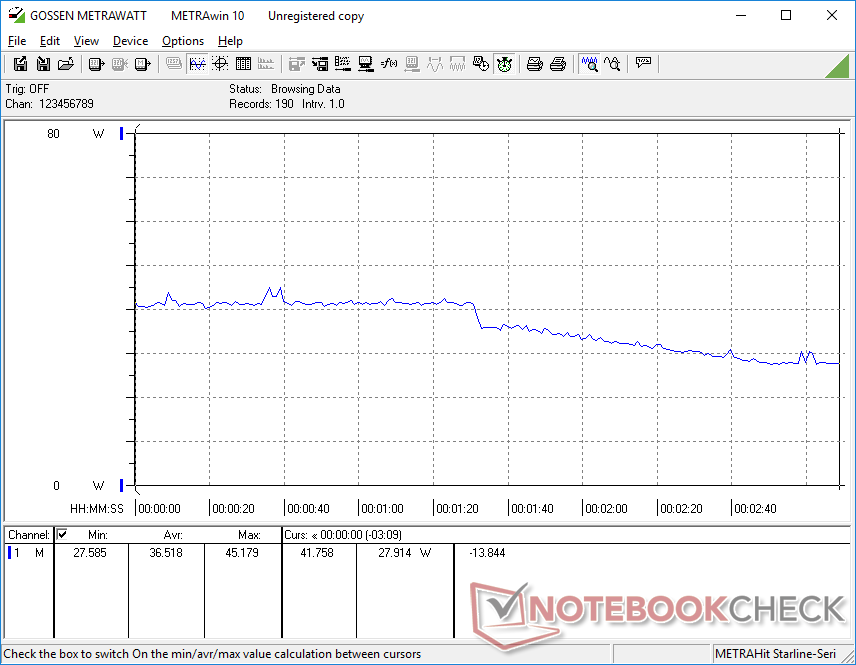
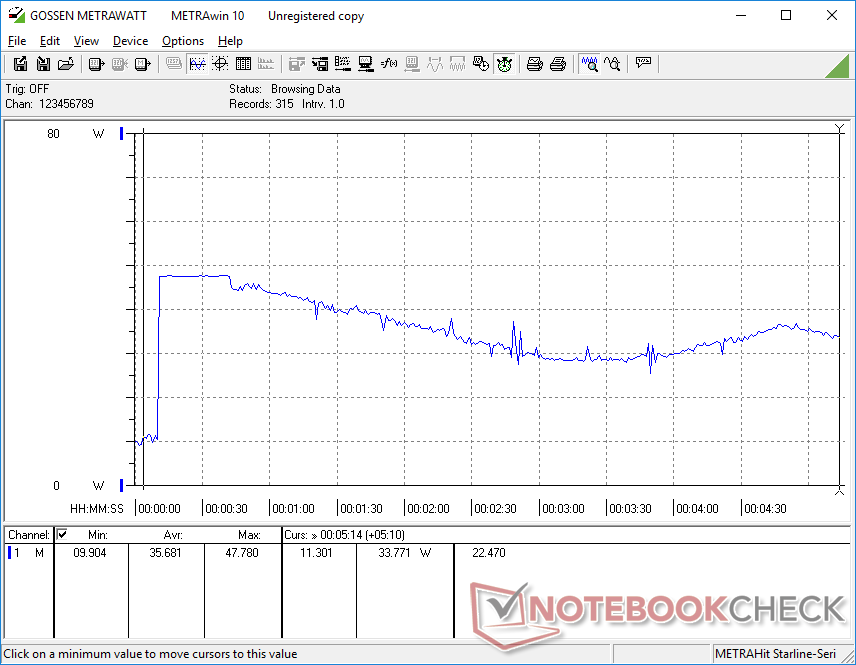
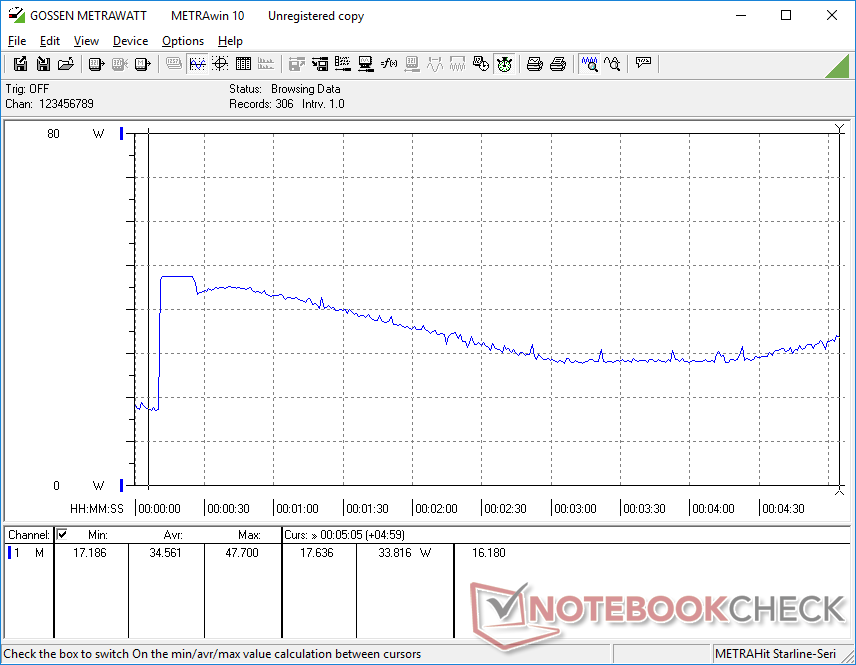
O comportamento do consumo de energia é exatamente como o que observamos na Razer Blade 15 OLED. Em resumo, é necessário mais potência para executar o visor OLED em configurações mais brilhantes e cores mais brilhantes do que em um painel IPS. Por outro lado, é necessária menos energia para rodar um visor OLED em configurações mais escuras e com cores mais escuras. Por exemplo, exibir todo o branco no ajuste de brilho máximo em nosso XPS 13 OLED consome 6,2 W a mais do que o ajuste de brilho mínimo, enquanto a diferença seria de apenas 2 W e 4 W no XPS 13 FHD IPS e XPS 13 4K IPS SKUs, respectivamente. Isso é cerca de 3x mais potência para OLED do que uma solução típica de IPS FHD
Mostrar todo o preto consome a mesma quantidade de energia, não importa o ajuste de brilho, já que os pixels OLED individuais são essencialmente desligados para um contraste infinito. Somos capazes de medir um consumo de apenas 6 W quando sob tais condições, como mostrado na tabela abaixo.
| Cor em tela cheia | Ajuste de luminosidade | Consumo de energia (W) |
|---|---|---|
| Branco | 0% | 6.1 |
| Branco | 100% | 12.3 |
| Preto | 0% | 6 |
| Preto | 100% | 6 |
| desligado | |
| Ocioso | |
| Carga |
|
Key:
min: | |
| Dell XPS 13 9310 OLED i7-1185G7, Iris Xe G7 96EUs, Toshiba XG6 KXG60ZNV512G, OLED, 3456x2160, 13.4" | Dell XPS 13 9310 Core i7 4K i7-1185G7, Iris Xe G7 96EUs, Micron 2300 512GB MTFDHBA512TDV, IPS, 3840x2400, 13.4" | Dell XPS 13 9310 Core i7 FHD i7-1165G7, Iris Xe G7 96EUs, Micron 2300 512GB MTFDHBA512TDV, IPS, 1920x1200, 13.4" | Dell XPS 13 7390 Core i7-10710U i7-10710U, UHD Graphics 620, SK Hynix PC601 NVMe 512 GB, IPS, 3840x2160, 13.3" | MSI Summit E13 Flip Evo A11MT i7-1185G7, Iris Xe G7 96EUs, Phison 1TB SM2801T24GKBB4S-E162, IPS, 1920x1200, 13.4" | |
|---|---|---|---|---|---|
| Power Consumption | -1% | 17% | 2% | -13% | |
| Idle Minimum * (Watt) | 5.7 | 4.3 25% | 3.9 32% | 4.7 18% | 4.8 16% |
| Idle Average * (Watt) | 6 | 8.3 -38% | 5.9 2% | 8.3 -38% | 8.4 -40% |
| Idle Maximum * (Watt) | 12.3 | 8.8 28% | 6.3 49% | 9 27% | 8.6 30% |
| Load Average * (Watt) | 44.4 | 46.2 -4% | 39.7 11% | 42 5% | 47.1 -6% |
| Witcher 3 ultra * (Watt) | 36.5 | 42.2 -16% | 34.8 5% | 51.6 -41% | |
| Load Maximum * (Watt) | 47.8 | 47.3 1% | 47.5 1% | 49 -3% | 65.9 -38% |
* ... menor é melhor
Vida útil da bateria
Os tempos de execução são altamente dependentes do brilho e da cor, como comprovado pelos resultados de nosso consumo de energia acima. Ao navegar na web no modo Equilibrado com o display ajustado para 150 lêndeas, conseguimos gravar um tempo de execução de 6 horas e 31 minutos com carga total. Ao executar este mesmo teste com o Windows High Contrast Mode alternado, o tempo de execução dobraria para chegar a 13 horas e 40 minutos. O modo de alto contraste nem sempre é o ideal, é claro, mas ajuda a ilustrar quanto tempo de duração da bateria pode ser prolongado simplesmente mudando a tela para cores mais escuras. Isto é especialmente verdadeiro quando se navega na web ou no processamento de texto, já que a maior parte da tela é branca nestes cenários.
A duração da bateria é visivelmente mais curta do que no XPS 13 4K IPS SKU e especialmente no XPS 13 FHD IPS SKU, onde a diferença pode ser de várias horas. Temas de cores mais escuras ou mais cinzentas são recomendados se os longos tempos de execução forem importantes. Talvez não coincidentemente, a Dell definiu o papel de parede padrão do Windows e janelas exploradoras como cinza em vez do habitual azul e branco brilhante que sempre vemos nas SKUs IPS XPS 13 normais e na maioria dos outros laptops.
| Dell XPS 13 9310 OLED i7-1185G7, Iris Xe G7 96EUs, 52 Wh | Dell XPS 13 9310 Core i7 4K i7-1185G7, Iris Xe G7 96EUs, 52 Wh | Dell XPS 13 9310 Core i7 FHD i7-1165G7, Iris Xe G7 96EUs, 52 Wh | Dell XPS 13 7390 Core i7-10710U i7-10710U, UHD Graphics 620, 52 Wh | MSI Summit E13 Flip Evo A11MT i7-1185G7, Iris Xe G7 96EUs, 70 Wh | |
|---|---|---|---|---|---|
| Duração da bateria | 11% | 69% | 29% | 72% | |
| WiFi v1.3 (h) | 6.5 | 7.2 11% | 11 69% | 8.4 29% | 11.2 72% |
| Reader / Idle (h) | 30 | 21.1 | |||
| Load (h) | 3.2 | 1.8 |
Pro
Contra
Veredicto
Muito parecido com o que concluímos com o recente HP Spectre x360 13, OLED não é o fim de toda a tecnologia quando se trata de monitores. Ele certamente tem suas vantagens sobre o IPS, mas sua lista de desvantagens é, sem dúvida, igualmente importante.
As maiores e mais óbvias vantagens estão relacionadas à qualidade da imagem. Não há como argumentar que o OLED oferece cores superiores, níveis de preto, e tempos de resposta preto-branco/cinza para uma experiência de visualização visivelmente melhor. Se este é um luxo importante para suas cargas diárias de trabalho, então o OLED terá um aspecto muito mais atraente do que o IPS.
As vantagens visuais do OLED são fáceis de notar, mas ele não vem sem alguns compromissos em outras áreas.
Os inconvenientes do OLED são geralmente menos óbvios e não tão perceptíveis à primeira vista. Em primeiro lugar, tanto o brilho quanto a resolução são mais fracos e menores, respectivamente, do que a opção XPS 13 4K. Em segundo lugar, a modulação por largura de pulso está presente em freqüências mais baixas para uma cintilação potencialmente mais perceptível. E, por último, o consumo de energia variará de forma mais selvagem, dependendo das cores e brilho atuais para uma vida útil potencialmente mais curta da bateria do que a do IPS.
Tenha em mente que o XPS 13 OLED custa aproximadamente o mesmo que o XPS 13 4K IPS. Assim, os usuários não são mais obrigados a pagar prêmios elevados apenas pelo luxo de um painel OLED, ao contrário de muitos laptops OLED anteriores. Isto torna o OLED mais fácil de recomendar hoje em dia, desde que os usuários sejam instruídos sobre seus prós e contras.
Preço e disponibilidade
A Dell só recentemente lançou o XPS 13 9310 OLED SKU e ainda não está amplamente disponível na maioria dos varejistas a partir desta escrita. O sistema está atualmente fora de estoque em Best Buy por $1949 USD, o que significa que sua melhor aposta para um OLED SKU no momento é fazendo um pedido diretamente através de Dell.com
Dell XPS 13 9310 OLED
- 08/31/2022 v7 (old)
Allen Ngo
Price comparison

