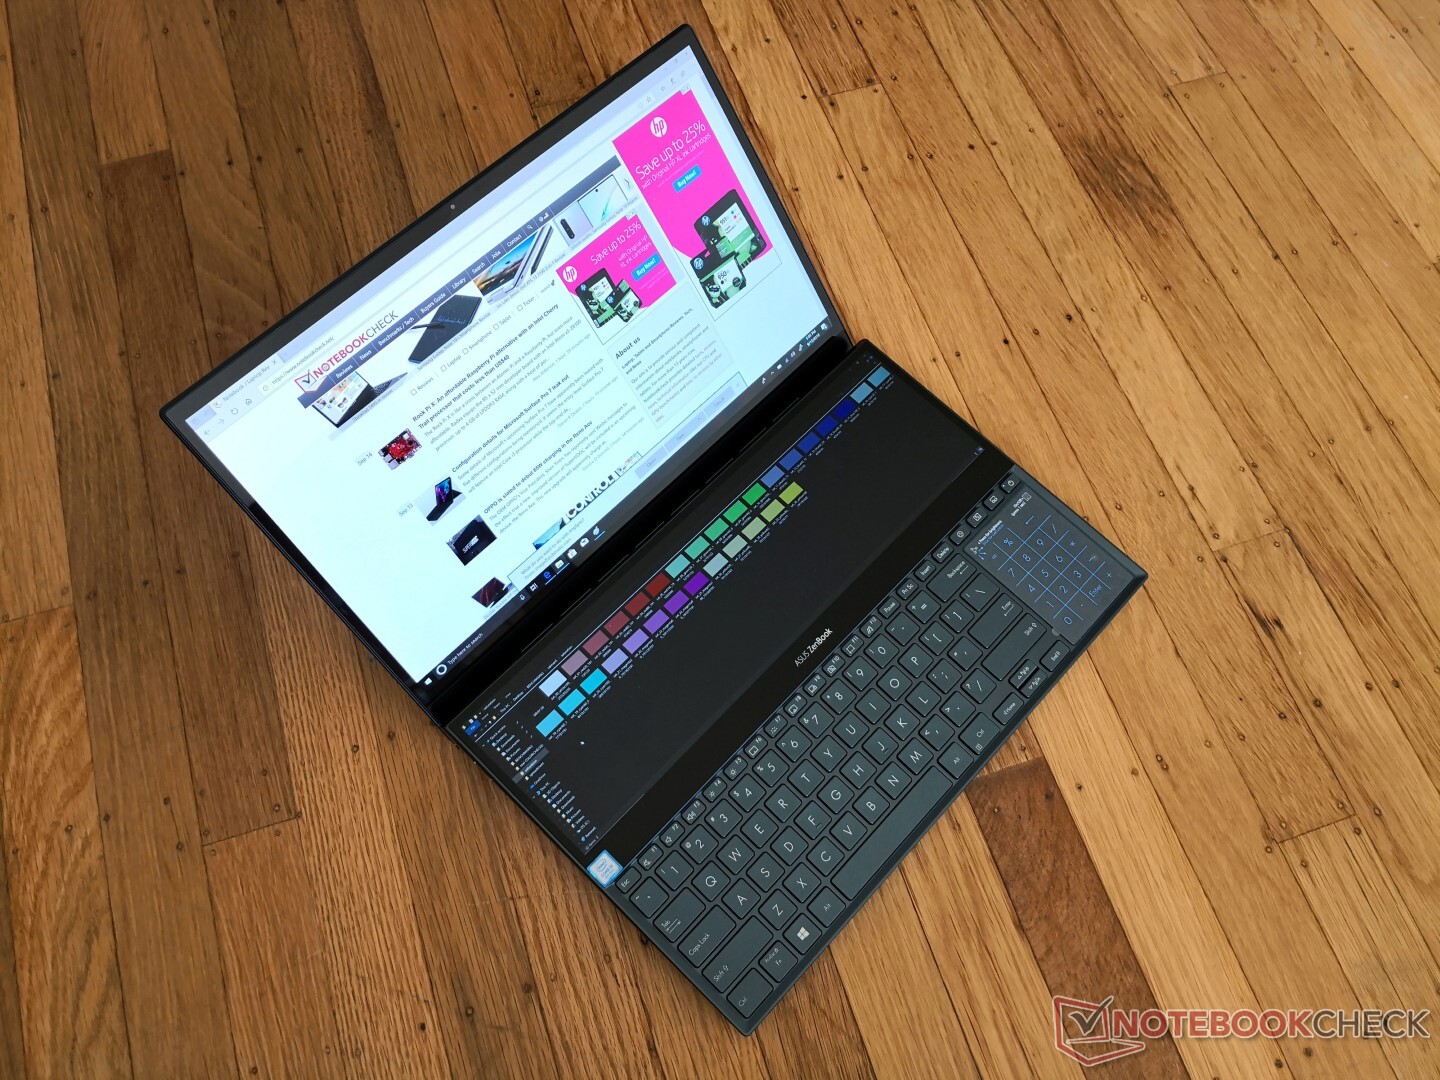
ZenBook com esteroides: Breve Análise do Portátil Asus ZenBook Pro Duo UX581
| |||||||||||||||||||||||||
iluminação: 94 %
iluminação com acumulador: 359.7 cd/m²
Contraste: ∞:1 (Preto: 0 cd/m²)
ΔE ColorChecker Calman: 5.14 | ∀{0.5-29.43 Ø4.71}
ΔE Greyscale Calman: 2.7 | ∀{0.09-98 Ø4.96}
81.3% sRGB (Argyll 1.6.3 3D)
61.8% AdobeRGB 1998 (Argyll 1.6.3 3D)
67.3% AdobeRGB 1998 (Argyll 3D)
81% sRGB (Argyll 3D)
63.5% Display P3 (Argyll 3D)
Gamma: 2
CCT: 6220 K
| Asus ZenBook Pro Duo UX581GV Samsung SDCA029, OLED, 15.6", 3840x2160 | Asus ZenBook Pro 15 UX580GE AU Optronics B156ZAN03.1, IPS, 15.6", 3840x2160 | Asus ZenBook 15 UX533FD BOE07D8, IPS, 15.6", 1920x1080 | Asus Strix Scar III G531GW Sharp LQ156M1JW09 (SHP14D3), IPS, 15.6", 1920x1080 | HP Omen X 2S 15-dg0075cl AU Optronics AUO82ED, IPS, 15.6", 1920x1080 | Dell XPS 15 7590 9980HK GTX 1650 Samsung 156WR04, SDCA029, OLED, 15.6", 3840x2160 | |
|---|---|---|---|---|---|---|
| Display | 35% | 4% | 8% | 6% | 33% | |
| Display P3 Coverage (%) | 63.5 | 85.9 35% | 67.2 6% | 66.2 4% | 66.2 4% | 88.1 39% |
| sRGB Coverage (%) | 81 | 100 23% | 88.4 9% | 96.5 19% | 92.3 14% | 99.6 23% |
| AdobeRGB 1998 Coverage (%) | 67.3 | 99.1 47% | 64.6 -4% | 67.5 0% | 67.2 0% | 91.8 36% |
| Response Times | -1339% | -1634% | -507% | -453% | 2% | |
| Response Time Grey 50% / Grey 80% * (ms) | 2.2 ? | 44 ? -1900% | 45 ? -1945% | 17.2 ? -682% | 15.2 ? -591% | 2.3 ? -5% |
| Response Time Black / White * (ms) | 2.6 ? | 22.8 ? -777% | 37 ? -1323% | 11.2 ? -331% | 10.8 ? -315% | 2.4 ? 8% |
| PWM Frequency (Hz) | 240.4 ? | 24040 ? | 59.5 ? | |||
| Screen | 9% | -18% | 11% | -15% | 1% | |
| Brightness middle (cd/m²) | 359.7 | 357.6 -1% | 311 -14% | 266 -26% | 324.8 -10% | 421.2 17% |
| Brightness (cd/m²) | 366 | 350 -4% | 303 -17% | 252 -31% | 316 -14% | 417 14% |
| Brightness Distribution (%) | 94 | 85 -10% | 81 -14% | 88 -6% | 84 -11% | 94 0% |
| Black Level * (cd/m²) | 0.35 | 0.24 | 0.27 | 0.26 | ||
| Colorchecker dE 2000 * | 5.14 | 4.12 20% | 5.1 1% | 1.81 65% | 4.96 4% | 6.06 -18% |
| Colorchecker dE 2000 max. * | 7.77 | 9.91 -28% | 8.91 -15% | 3.23 58% | 8.95 -15% | 11.89 -53% |
| Greyscale dE 2000 * | 2.7 | 1.8 33% | 4.93 -83% | 2.44 10% | 5 -85% | 2.8 -4% |
| Gamma | 2 110% | 2.17 101% | 2.44 90% | 2.42 91% | 2.21 100% | 2.15 102% |
| CCT | 6220 105% | 6613 98% | 7641 85% | 7005 93% | 7742 84% | 6235 104% |
| Color Space (Percent of AdobeRGB 1998) (%) | 61.8 | 87.5 42% | 58 -6% | 62 0% | 59.8 -3% | 81 31% |
| Color Space (Percent of sRGB) (%) | 81.3 | 100 23% | 88 8% | 97 19% | 91.8 13% | 99.6 23% |
| Contrast (:1) | 1022 | 1296 | 985 | 1249 | ||
| Colorchecker dE 2000 calibrated * | 4.23 | 2.48 | 1.03 | 3.23 | ||
| Média Total (Programa/Configurações) | -432% /
-192% | -549% /
-261% | -163% /
-69% | -154% /
-78% | 12% /
9% |
* ... menor é melhor
Exibir tempos de resposta
| ↔ Tempo de resposta preto para branco | ||
|---|---|---|
| 2.6 ms ... ascensão ↗ e queda ↘ combinadas | ↗ 1 ms ascensão | 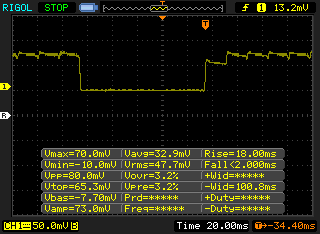 |
| ↘ 1.6 ms queda | ||
| A tela mostra taxas de resposta muito rápidas em nossos testes e deve ser muito adequada para jogos em ritmo acelerado. Em comparação, todos os dispositivos testados variam de 0.1 (mínimo) a 240 (máximo) ms. » 14 % de todos os dispositivos são melhores. Isso significa que o tempo de resposta medido é melhor que a média de todos os dispositivos testados (19.8 ms). | ||
| ↔ Tempo de resposta 50% cinza a 80% cinza | ||
| 2.2 ms ... ascensão ↗ e queda ↘ combinadas | ↗ 1 ms ascensão | 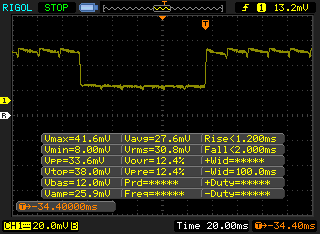 |
| ↘ 1.2 ms queda | ||
| A tela mostra taxas de resposta muito rápidas em nossos testes e deve ser muito adequada para jogos em ritmo acelerado. Em comparação, todos os dispositivos testados variam de 0.165 (mínimo) a 636 (máximo) ms. » 11 % de todos os dispositivos são melhores. Isso significa que o tempo de resposta medido é melhor que a média de todos os dispositivos testados (31 ms). | ||
Cintilação da tela / PWM (modulação por largura de pulso)
| Tela tremeluzindo/PWM detectado | 240.4 Hz | ≤ 52 % configuração de brilho | 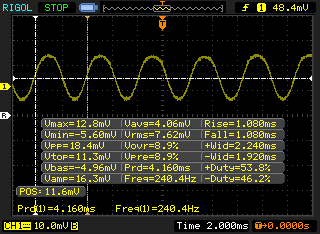 |
A luz de fundo da tela pisca em 240.4 Hz (pior caso, por exemplo, utilizando PWM) Cintilação detectada em uma configuração de brilho de 52 % e abaixo. Não deve haver cintilação ou PWM acima desta configuração de brilho. A frequência de 240.4 Hz é relativamente baixa, portanto, usuários sensíveis provavelmente notarão cintilação e sentirão fadiga ocular na configuração de brilho indicada e abaixo. [pwm_comparison] Em comparação: 52 % de todos os dispositivos testados não usam PWM para escurecer a tela. Se PWM foi detectado, uma média de 7754 (mínimo: 5 - máximo: 343500) Hz foi medida. | |||
| Cinebench R15 | |
| CPU Single 64Bit | |
| Asus Chimera G703GI | |
| Corsair One i160 | |
| Eurocom Nightsky RX15 | |
| Média Intel Core i9-9980HK (181 - 215, n=13) | |
| Asus ZenBook Pro Duo UX581GV | |
| Asus G703 | |
| Asus Strix Scar III G531GW | |
| Asus Strix Hero III G731GV | |
| Lenovo Legion Y540-17IRH | |
| Asus FX504GD | |
| Asus ROG G703GX | |
| Asus FX503VM-EH73 | |
| Asus ROG Zephyrus G15 GA502DU | |
| CPU Multi 64Bit | |
| Corsair One i160 | |
| Eurocom Nightsky RX15 | |
| Média Intel Core i9-9980HK (1327 - 1930, n=14) | |
| Asus ZenBook Pro Duo UX581GV | |
| Asus Strix Scar III G531GW | |
| Asus Chimera G703GI | |
| Asus ROG G703GX | |
| Asus Strix Hero III G731GV | |
| Asus G703 | |
| Lenovo Legion Y540-17IRH | |
| Asus ROG Zephyrus G15 GA502DU | |
| Asus FX503VM-EH73 | |
| Asus FX504GD | |
| PCMark 8 Home Score Accelerated v2 | 4157 pontos | |
| PCMark 8 Work Score Accelerated v2 | 5279 pontos | |
| PCMark 10 Score | 5654 pontos | |
Ajuda | ||
| Asus ZenBook Pro Duo UX581GV Samsung SSD PM981 MZVLB1T0HALR | Asus ZenBook Pro 15 UX580GE Samsung SSD PM961 1TB M.2 PCIe 3.0 x4 NVMe (MZVLW1T0) | Asus ZenBook 15 UX533FD WDC PC SN520 SDAPNUW-512G | Dell XPS 15 7590 9980HK GTX 1650 Toshiba XG6 KXG60ZNV1T02 | Asus Strix Scar III G531GW Intel SSD 660p 1TB SSDPEKNW010T8 | HP Omen X 2S 15-dg0075cl WDC PC SN720 SDAPNTW-1T00 | |
|---|---|---|---|---|---|---|
| AS SSD | -0% | -23% | 7% | -37% | 16% | |
| Seq Read (MB/s) | 1409 | 2099 49% | 579 -59% | 1723 22% | 1574 12% | 2105 49% |
| Seq Write (MB/s) | 1316 | 1729 31% | 411.8 -69% | 1386 5% | 1591 21% | 2493 89% |
| 4K Read (MB/s) | 44.99 | 37.78 -16% | 41.81 -7% | 43.25 -4% | 26.79 -40% | 25.01 -44% |
| 4K Write (MB/s) | 93 | 100.9 8% | 131.6 42% | 98.3 6% | 105.1 13% | 108.7 17% |
| 4K-64 Read (MB/s) | 1092 | 1431 31% | 975 -11% | 1078 -1% | 583 -47% | 1604 47% |
| 4K-64 Write (MB/s) | 1810 | 1273 -30% | 1047 -42% | 1456 -20% | 603 -67% | 1593 -12% |
| Access Time Read * (ms) | 0.041 | 0.04 2% | 0.08 -95% | 0.05 -22% | 0.128 -212% | 0.046 -12% |
| Access Time Write * (ms) | 0.118 | 0.036 69% | 0.027 77% | 0.039 67% | 0.043 64% | 0.102 14% |
| Score Read (Points) | 1278 | 1679 31% | 1075 -16% | 1294 1% | 768 -40% | 1840 44% |
| Score Write (Points) | 2034 | 1547 -24% | 1220 -40% | 1693 -17% | 867 -57% | 1951 -4% |
| Score Total (Points) | 3970 | 4065 2% | 2845 -28% | 3638 -8% | 2033 -49% | 4743 19% |
| Copy ISO MB/s (MB/s) | 2112 | 1045 -51% | 3182 51% | 2250 7% | ||
| Copy Program MB/s (MB/s) | 874 | 430.9 -51% | 984 13% | 896 3% | ||
| Copy Game MB/s (MB/s) | 1677 | 728 -57% | 1824 9% | 1854 11% |
* ... menor é melhor

| 3DMark | |
| 1280x720 Cloud Gate Standard Graphics | |
| Corsair One i160 | |
| Asus Zephyrus GX501 | |
| Asus ROG G703GX | |
| MSI RTX 2060 Gaming Z 6G | |
| Eurocom Nightsky Ti15 | |
| Asus G752VS-BA338T | |
| Média NVIDIA GeForce RTX 2060 Mobile (55324 - 116593, n=36) | |
| Asus ZenBook Pro Duo UX581GV | |
| Asus Zephyrus S GX531GM | |
| Eurocom Nightsky RX15 | |
| MSI GF75 Thin 9SC | |
| Asus ZenBook Pro 15 UX580GE | |
| 1920x1080 Fire Strike Graphics | |
| Corsair One i160 | |
| Asus ROG G703GX | |
| Eurocom Nightsky RX15 | |
| MSI RTX 2060 Gaming Z 6G | |
| Asus G752VS-BA338T | |
| Asus Zephyrus GX501 | |
| Média NVIDIA GeForce RTX 2060 Mobile (14768 - 18358, n=43) | |
| Eurocom Nightsky Ti15 | |
| Asus ZenBook Pro Duo UX581GV | |
| Asus Zephyrus S GX531GM | |
| MSI GF75 Thin 9SC | |
| Asus ZenBook Pro 15 UX580GE | |
| 2560x1440 Time Spy Graphics | |
| Corsair One i160 | |
| Asus ROG G703GX | |
| Eurocom Nightsky RX15 | |
| MSI RTX 2060 Gaming Z 6G | |
| Média NVIDIA GeForce RTX 2060 Mobile (5660 - 6910, n=41) | |
| Asus ZenBook Pro Duo UX581GV | |
| Eurocom Nightsky Ti15 | |
| Asus G752VS-BA338T | |
| Asus Zephyrus GX501 | |
| Asus Zephyrus S GX531GM | |
| MSI GF75 Thin 9SC | |
| Asus ZenBook Pro 15 UX580GE | |
| 3DMark 11 | |
| 1280x720 Performance GPU | |
| Corsair One i160 | |
| Asus ROG G703GX | |
| Eurocom Nightsky RX15 | |
| MSI RTX 2060 Gaming Z 6G | |
| Asus G752VS-BA338T | |
| Asus Zephyrus GX501 | |
| Média NVIDIA GeForce RTX 2060 Mobile (19143 - 24662, n=40) | |
| Eurocom Nightsky Ti15 | |
| Asus ZenBook Pro Duo UX581GV | |
| MSI GF75 Thin 9SC | |
| Asus Zephyrus S GX531GM | |
| Asus ZenBook Pro 15 UX580GE | |
| 1280x720 Performance Combined | |
| Corsair One i160 | |
| Eurocom Nightsky RX15 | |
| MSI RTX 2060 Gaming Z 6G | |
| Asus ZenBook Pro Duo UX581GV | |
| Eurocom Nightsky Ti15 | |
| MSI GF75 Thin 9SC | |
| Asus ROG G703GX | |
| Média NVIDIA GeForce RTX 2060 Mobile (1107 - 14726, n=40) | |
| Asus G752VS-BA338T | |
| Asus Zephyrus GX501 | |
| Asus ZenBook Pro 15 UX580GE | |
| Asus Zephyrus S GX531GM | |
| 3DMark 11 Performance | 17912 pontos | |
| 3DMark Cloud Gate Standard Score | 43412 pontos | |
| 3DMark Fire Strike Score | 13696 pontos | |
| 3DMark Time Spy Score | 6059 pontos | |
Ajuda | ||
| Shadow of the Tomb Raider - 1920x1080 Highest Preset AA:T | |
| Corsair One i160 | |
| Asus ROG G703GX | |
| Eurocom Nightsky RX15 | |
| MSI RTX 2060 Gaming Z 6G | |
| HP Omen X 2S 15-dg0075cl | |
| Média NVIDIA GeForce RTX 2060 Mobile (54 - 86, n=22) | |
| Eurocom Nightsky Ti15 | |
| Asus ZenBook Pro Duo UX581GV | |
| MSI GF75 Thin 9SC | |
| Asus Zephyrus S GX531GM | |
| Dell XPS 15 7590 9980HK GTX 1650 | |
| The Witcher 3 - 1920x1080 Ultra Graphics & Postprocessing (HBAO+) | |
| Corsair One i160 | |
| Asus ROG G703GX | |
| Eurocom Nightsky RX15 | |
| MSI RTX 2060 Gaming Z 6G | |
| HP Omen X 2S 15-dg0075cl | |
| Asus Strix Scar III G531GW | |
| Asus Zephyrus GX501 | |
| Média NVIDIA GeForce RTX 2060 Mobile (50.6 - 74, n=40) | |
| Eurocom Nightsky Ti15 | |
| Asus G752VS-BA338T | |
| Asus ZenBook Pro Duo UX581GV | |
| Asus Zephyrus S GX531GM | |
| MSI GF75 Thin 9SC | |
| Dell XPS 15 7590 9980HK GTX 1650 | |
| Asus ZenBook 15 UX533FD | |
| Asus ZenBook Pro 15 UX580GE | |
| baixo | média | alto | ultra | 4K | |
|---|---|---|---|---|---|
| The Witcher 3 (2015) | 267 | 185.4 | 112.8 | 57.2 | 41.3 |
| Rocket League (2017) | 249 | 241.9 | 180.6 | 96.2 | |
| Shadow of the Tomb Raider (2018) | 114 | 87 | 80 | 71 | 24 |
| Asus ZenBook Pro Duo UX581GV GeForce RTX 2060 Mobile, i9-9980HK, Samsung SSD PM981 MZVLB1T0HALR | Asus ZenBook Pro 15 UX580GE GeForce GTX 1050 Ti Mobile, i9-8950HK, Samsung SSD PM961 1TB M.2 PCIe 3.0 x4 NVMe (MZVLW1T0) | Asus ZenBook 15 UX533FD GeForce GTX 1050 Max-Q, i7-8565U, WDC PC SN520 SDAPNUW-512G | Dell XPS 15 7590 9980HK GTX 1650 GeForce GTX 1650 Mobile, i9-9980HK, Toshiba XG6 KXG60ZNV1T02 | Asus Strix Scar III G531GW GeForce RTX 2070 Mobile, i9-9880H, Intel SSD 660p 1TB SSDPEKNW010T8 | HP Omen X 2S 15-dg0075cl GeForce RTX 2070 Max-Q, i7-9750H, WDC PC SN720 SDAPNTW-1T00 | |
|---|---|---|---|---|---|---|
| Noise | -3% | -4% | -4% | -22% | -9% | |
| desligado / ambiente * (dB) | 28.4 | 28 1% | 30.5 -7% | 28.2 1% | 29 -2% | 29 -2% |
| Idle Minimum * (dB) | 29 | 28.6 1% | 30.5 -5% | 28.2 3% | 30 -3% | 30.5 -5% |
| Idle Average * (dB) | 29 | 29.9 -3% | 30.5 -5% | 28.2 3% | 37 -28% | 31.5 -9% |
| Idle Maximum * (dB) | 29 | 30.5 -5% | 30.5 -5% | 30.4 -5% | 39 -34% | 31.5 -9% |
| Load Average * (dB) | 35.4 | 42.5 -20% | 40.8 -15% | 43.8 -24% | 54 -53% | 40.6 -15% |
| Witcher 3 ultra * (dB) | 42 | 44.8 -7% | 47.2 -12% | 54 -29% | 49.5 -18% | |
| Load Maximum * (dB) | 50 | 44.8 10% | 41.8 16% | 47.2 6% | 54 -8% | 53.4 -7% |
* ... menor é melhor
Barulho
| Ocioso |
| 29 / 29 / 29 dB |
| Carga |
| 35.4 / 50 dB |
 | ||
30 dB silencioso 40 dB(A) audível 50 dB(A) ruidosamente alto |
||
min: | ||
(±) A temperatura máxima no lado superior é 40.4 °C / 105 F, em comparação com a média de 40.4 °C / 105 F , variando de 21.2 a 68.8 °C para a classe Gaming.
(-) A parte inferior aquece até um máximo de 47.8 °C / 118 F, em comparação com a média de 43.2 °C / 110 F
(±) Em uso inativo, a temperatura média para o lado superior é 34.5 °C / 94 F, em comparação com a média do dispositivo de 33.9 °C / ### class_avg_f### F.
(±) Jogando The Witcher 3, a temperatura média para o lado superior é 37.3 °C / 99 F, em comparação com a média do dispositivo de 33.9 °C / ## #class_avg_f### F.
(+) Os apoios para as mãos e o touchpad estão atingindo a temperatura máxima da pele (34.6 °C / 94.3 F) e, portanto, não estão quentes.
(-) A temperatura média da área do apoio para as mãos de dispositivos semelhantes foi 28.8 °C / 83.8 F (-5.8 °C / -10.5 F).
Asus ZenBook Pro Duo UX581GV análise de áudio
(±) | o volume do alto-falante é médio, mas bom (###valor### dB)
Graves 100 - 315Hz
(±) | graves reduzidos - em média 10.4% menor que a mediana
(±) | a linearidade dos graves é média (12.2% delta para a frequência anterior)
Médios 400 - 2.000 Hz
(+) | médios equilibrados - apenas 2.1% longe da mediana
(+) | médios são lineares (4.3% delta para frequência anterior)
Altos 2 - 16 kHz
(+) | agudos equilibrados - apenas 4.5% longe da mediana
(±) | a linearidade dos máximos é média (10.5% delta para frequência anterior)
Geral 100 - 16.000 Hz
(±) | a linearidade do som geral é média (19.8% diferença em relação à mediana)
Comparado com a mesma classe
» 70% de todos os dispositivos testados nesta classe foram melhores, 6% semelhantes, 24% piores
» O melhor teve um delta de 6%, a média foi 18%, o pior foi 132%
Comparado com todos os dispositivos testados
» 51% de todos os dispositivos testados foram melhores, 7% semelhantes, 42% piores
» O melhor teve um delta de 4%, a média foi 23%, o pior foi 134%
Apple MacBook 12 (Early 2016) 1.1 GHz análise de áudio
(+) | os alto-falantes podem tocar relativamente alto (###valor### dB)
Graves 100 - 315Hz
(±) | graves reduzidos - em média 11.3% menor que a mediana
(±) | a linearidade dos graves é média (14.2% delta para a frequência anterior)
Médios 400 - 2.000 Hz
(+) | médios equilibrados - apenas 2.4% longe da mediana
(+) | médios são lineares (5.5% delta para frequência anterior)
Altos 2 - 16 kHz
(+) | agudos equilibrados - apenas 2% longe da mediana
(+) | os máximos são lineares (4.5% delta da frequência anterior)
Geral 100 - 16.000 Hz
(+) | o som geral é linear (10.2% diferença em relação à mediana)
Comparado com a mesma classe
» 7% de todos os dispositivos testados nesta classe foram melhores, 2% semelhantes, 90% piores
» O melhor teve um delta de 5%, a média foi 18%, o pior foi 53%
Comparado com todos os dispositivos testados
» 5% de todos os dispositivos testados foram melhores, 1% semelhantes, 94% piores
» O melhor teve um delta de 4%, a média foi 23%, o pior foi 134%
| desligado | |
| Ocioso | |
| Carga |
|
Key:
min: | |
| Asus ZenBook Pro Duo UX581GV i9-9980HK, GeForce RTX 2060 Mobile, Samsung SSD PM981 MZVLB1T0HALR, OLED, 3840x2160, 15.6" | Asus ZenBook Pro 15 UX580GE i9-8950HK, GeForce GTX 1050 Ti Mobile, Samsung SSD PM961 1TB M.2 PCIe 3.0 x4 NVMe (MZVLW1T0), IPS, 3840x2160, 15.6" | Asus ZenBook 15 UX533FD i7-8565U, GeForce GTX 1050 Max-Q, WDC PC SN520 SDAPNUW-512G, IPS, 1920x1080, 15.6" | Dell XPS 15 7590 9980HK GTX 1650 i9-9980HK, GeForce GTX 1650 Mobile, Toshiba XG6 KXG60ZNV1T02, OLED, 3840x2160, 15.6" | Asus Strix Scar III G531GW i9-9880H, GeForce RTX 2070 Mobile, Intel SSD 660p 1TB SSDPEKNW010T8, IPS, 1920x1080, 15.6" | HP Omen X 2S 15-dg0075cl i7-9750H, GeForce RTX 2070 Max-Q, WDC PC SN720 SDAPNTW-1T00, IPS, 1920x1080, 15.6" | |
|---|---|---|---|---|---|---|
| Power Consumption | 27% | 61% | 37% | -32% | -75% | |
| Idle Minimum * (Watt) | 19.3 | 11.7 39% | 2.7 86% | 6.2 68% | 29 -50% | 46 -138% |
| Idle Average * (Watt) | 24.2 | 18.5 24% | 8 67% | 9.6 60% | 32 -32% | 59 -144% |
| Idle Maximum * (Watt) | 24.5 | 22.8 7% | 10.6 57% | 21.2 13% | 37 -51% | 65.5 -167% |
| Load Average * (Watt) | 122.3 | 97.5 20% | 74 39% | 104.3 15% | 157 -28% | 99.8 18% |
| Witcher 3 ultra * (Watt) | 137 | 102.9 25% | 91.7 33% | 173 -26% | 154.1 -12% | |
| Load Maximum * (Watt) | 208.4 | 111.1 47% | 89 57% | 135.3 35% | 217 -4% | 222.7 -7% |
* ... menor é melhor
| Asus ZenBook Pro Duo UX581GV i9-9980HK, GeForce RTX 2060 Mobile, 71 Wh | Asus ZenBook Pro 15 UX580GE i9-8950HK, GeForce GTX 1050 Ti Mobile, 71 Wh | Asus ZenBook 15 UX533FD i7-8565U, GeForce GTX 1050 Max-Q, 73 Wh | Dell XPS 15 7590 9980HK GTX 1650 i9-9980HK, GeForce GTX 1650 Mobile, 97 Wh | Asus Strix Scar III G531GW i9-9880H, GeForce RTX 2070 Mobile, 66 Wh | HP Omen X 2S 15-dg0075cl i7-9750H, GeForce RTX 2070 Max-Q, 72 Wh | |
|---|---|---|---|---|---|---|
| Duração da bateria | 18% | 107% | 81% | -28% | -42% | |
| Reader / Idle (h) | 13.1 | 14 7% | 26.5 102% | 15.2 16% | 5.5 -58% | 3.7 -72% |
| WiFi v1.3 (h) | 4.1 | 6.3 54% | 8.7 112% | 7.8 90% | 3 -27% | 2.2 -46% |
| Load (h) | 1.4 | 1.3 -7% | 2.9 107% | 3.3 136% | 1.4 0% | 1.3 -7% |
Pro
Contra
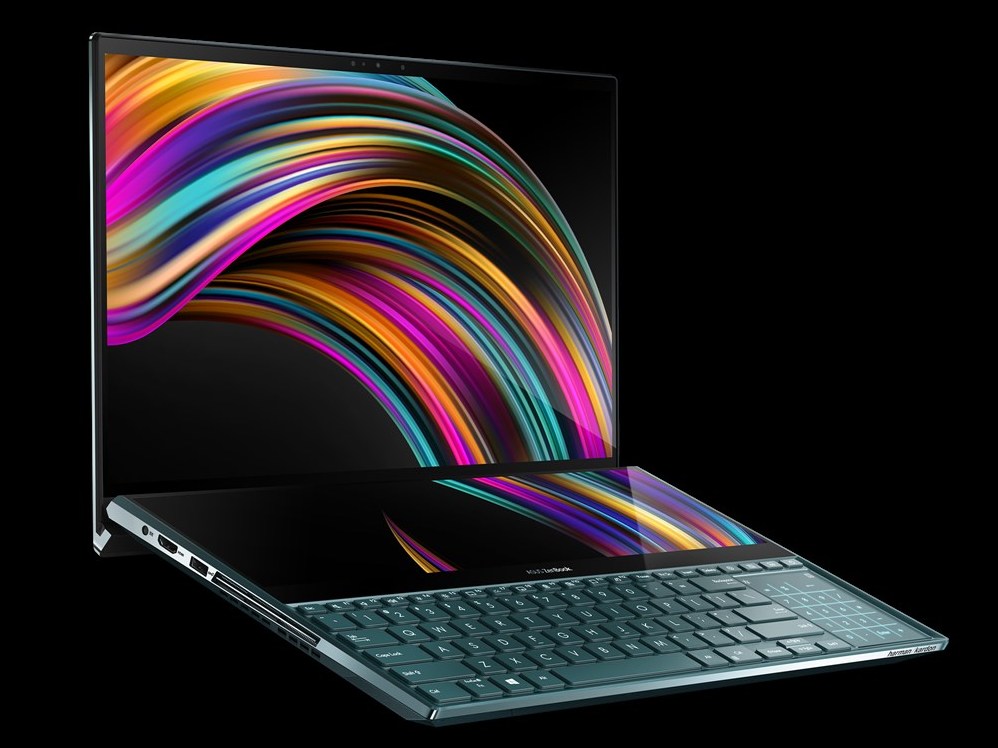

Adoramos o conceito único do ZenBook Pro Duo UX581 e o que ele representa. Ter uma segunda tela da mesma largura e mesmo PPI da tela principal torna mais ergonômico o uso do que as desproporcionais segundas telas do Razer Blade Pro 2015, Asus ZenBook 15 UX534 ou HP Omen X 2S 15. A desvantagem é que a Asus teve que fazer alguns sacrifícios importantes para integrar essa grande segunda tela. O mais notável é que o UX581 é mais grosso, pesado e significativamente mais caro que o Ultrabook ou portátil multimídia típico, o que torna este sistema mais um substituto de desktop do que algo verdadeiramente portátil.
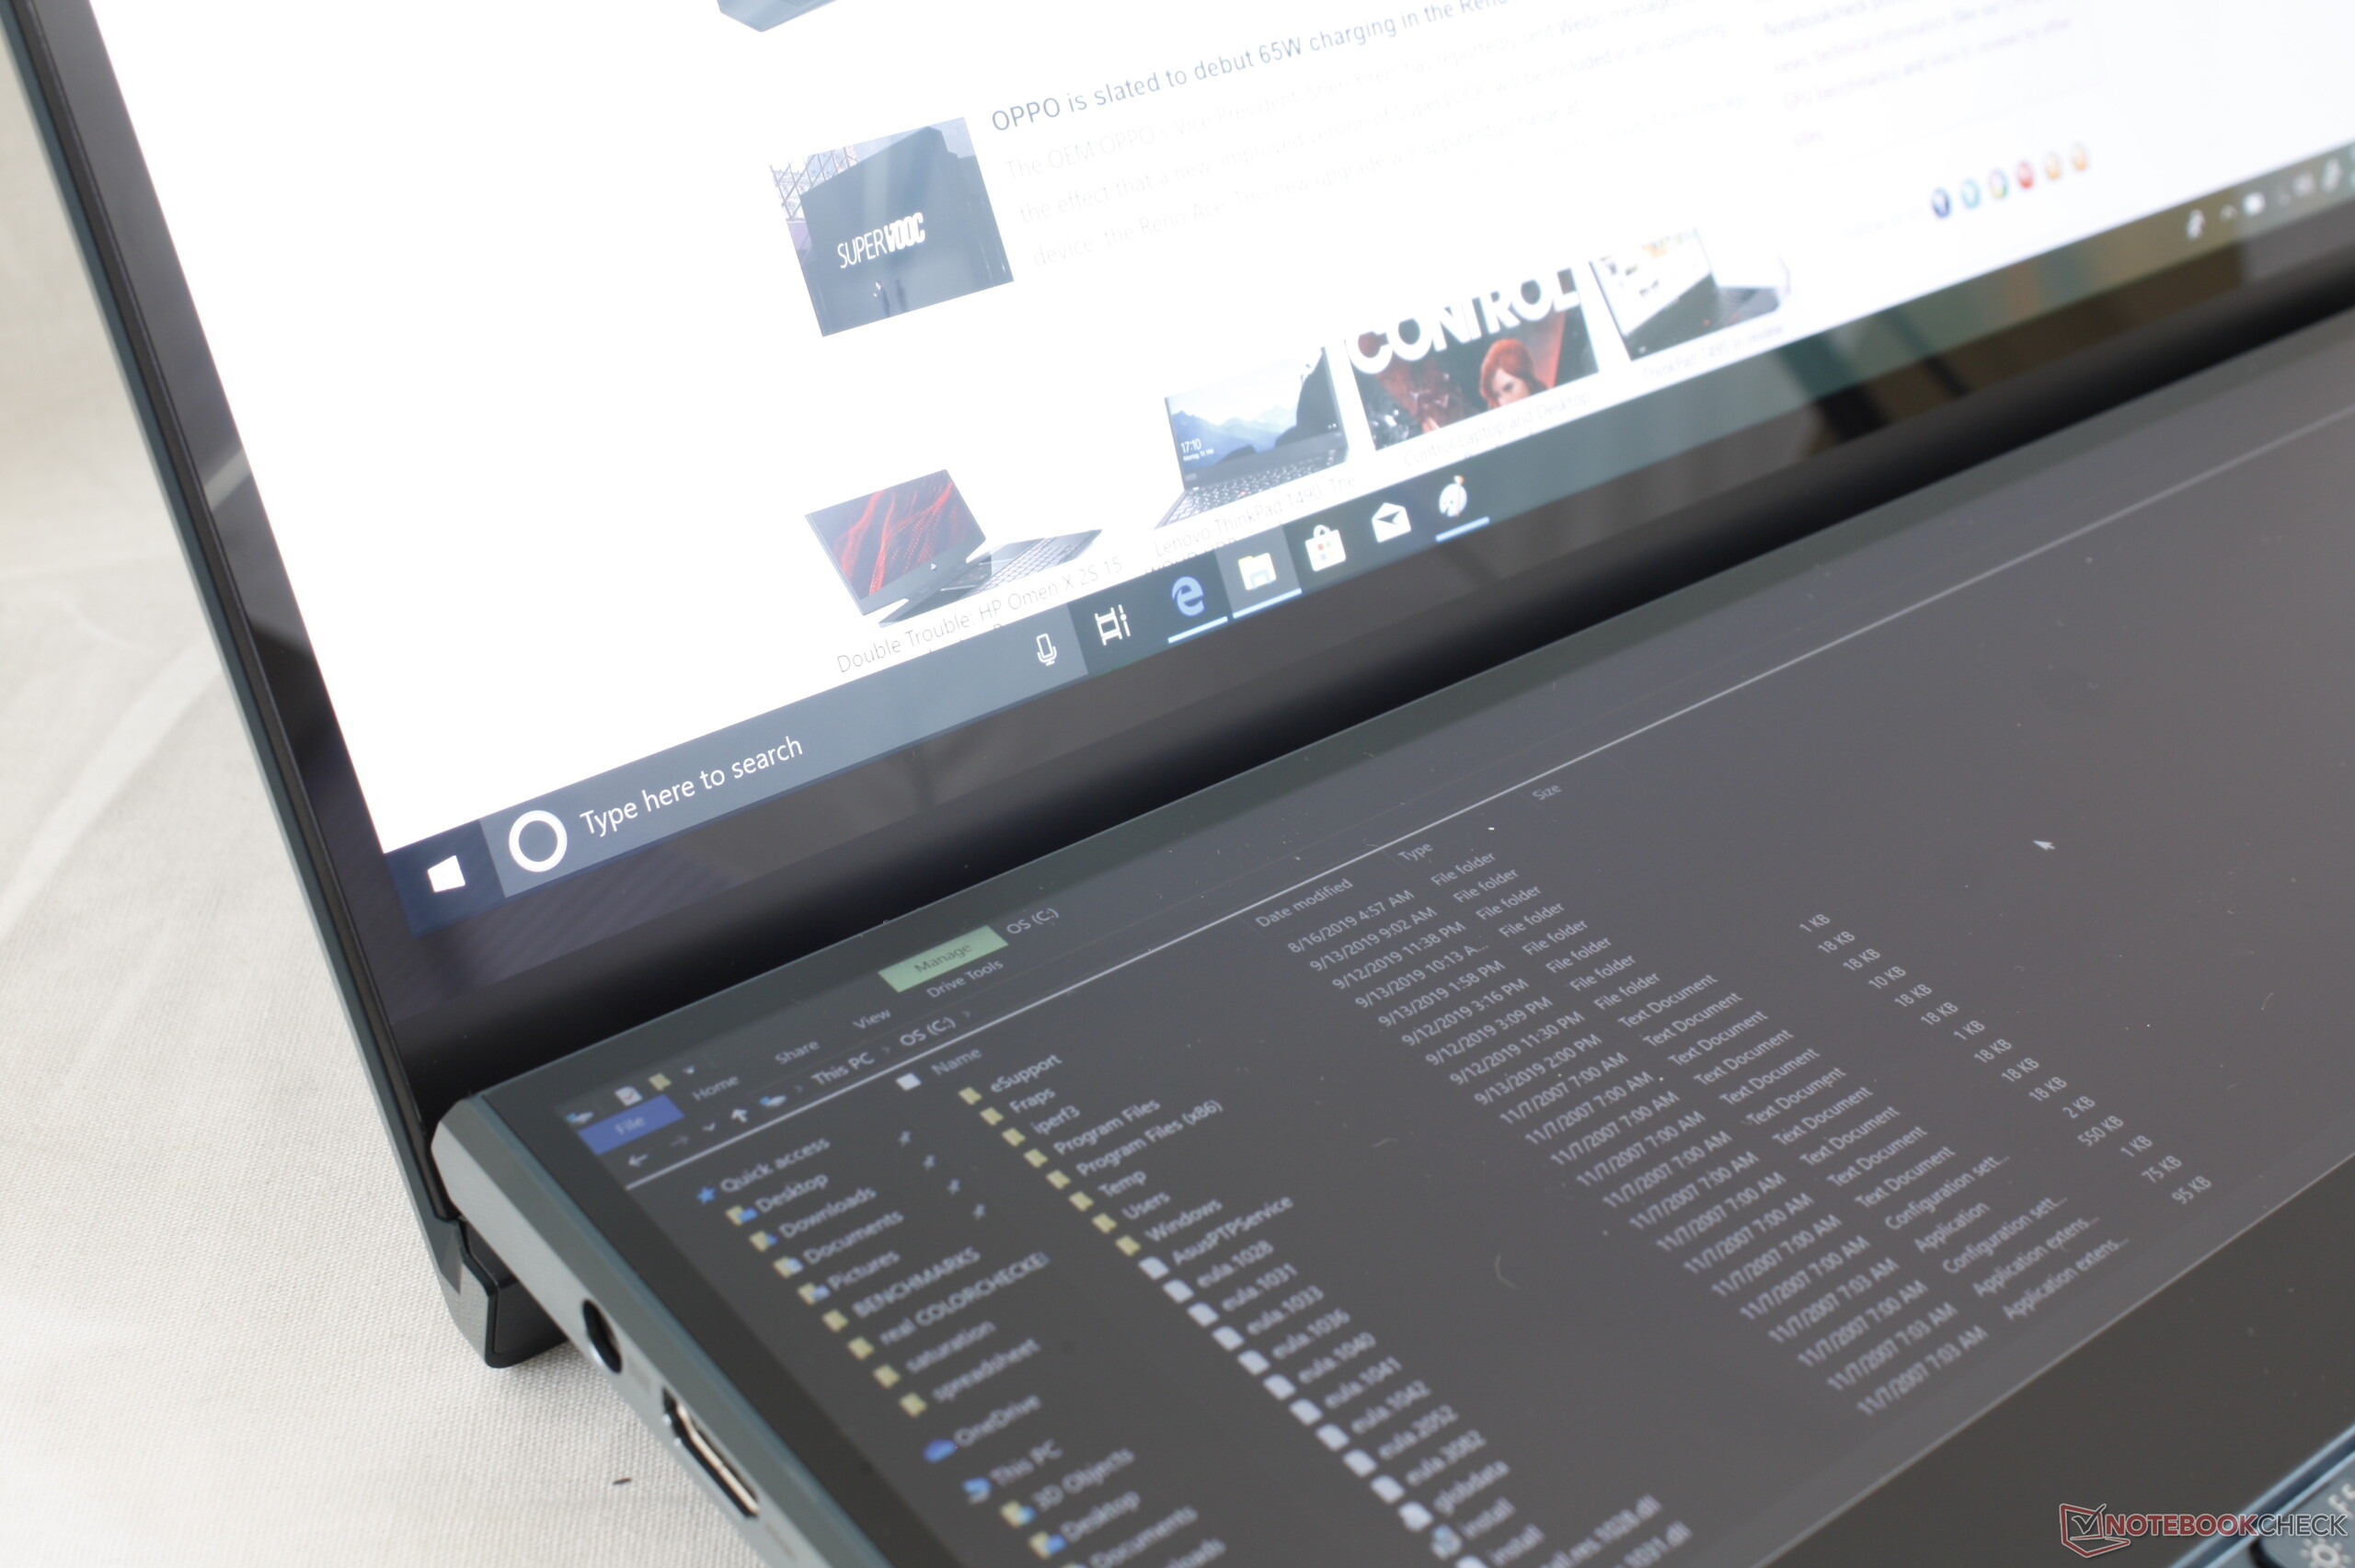
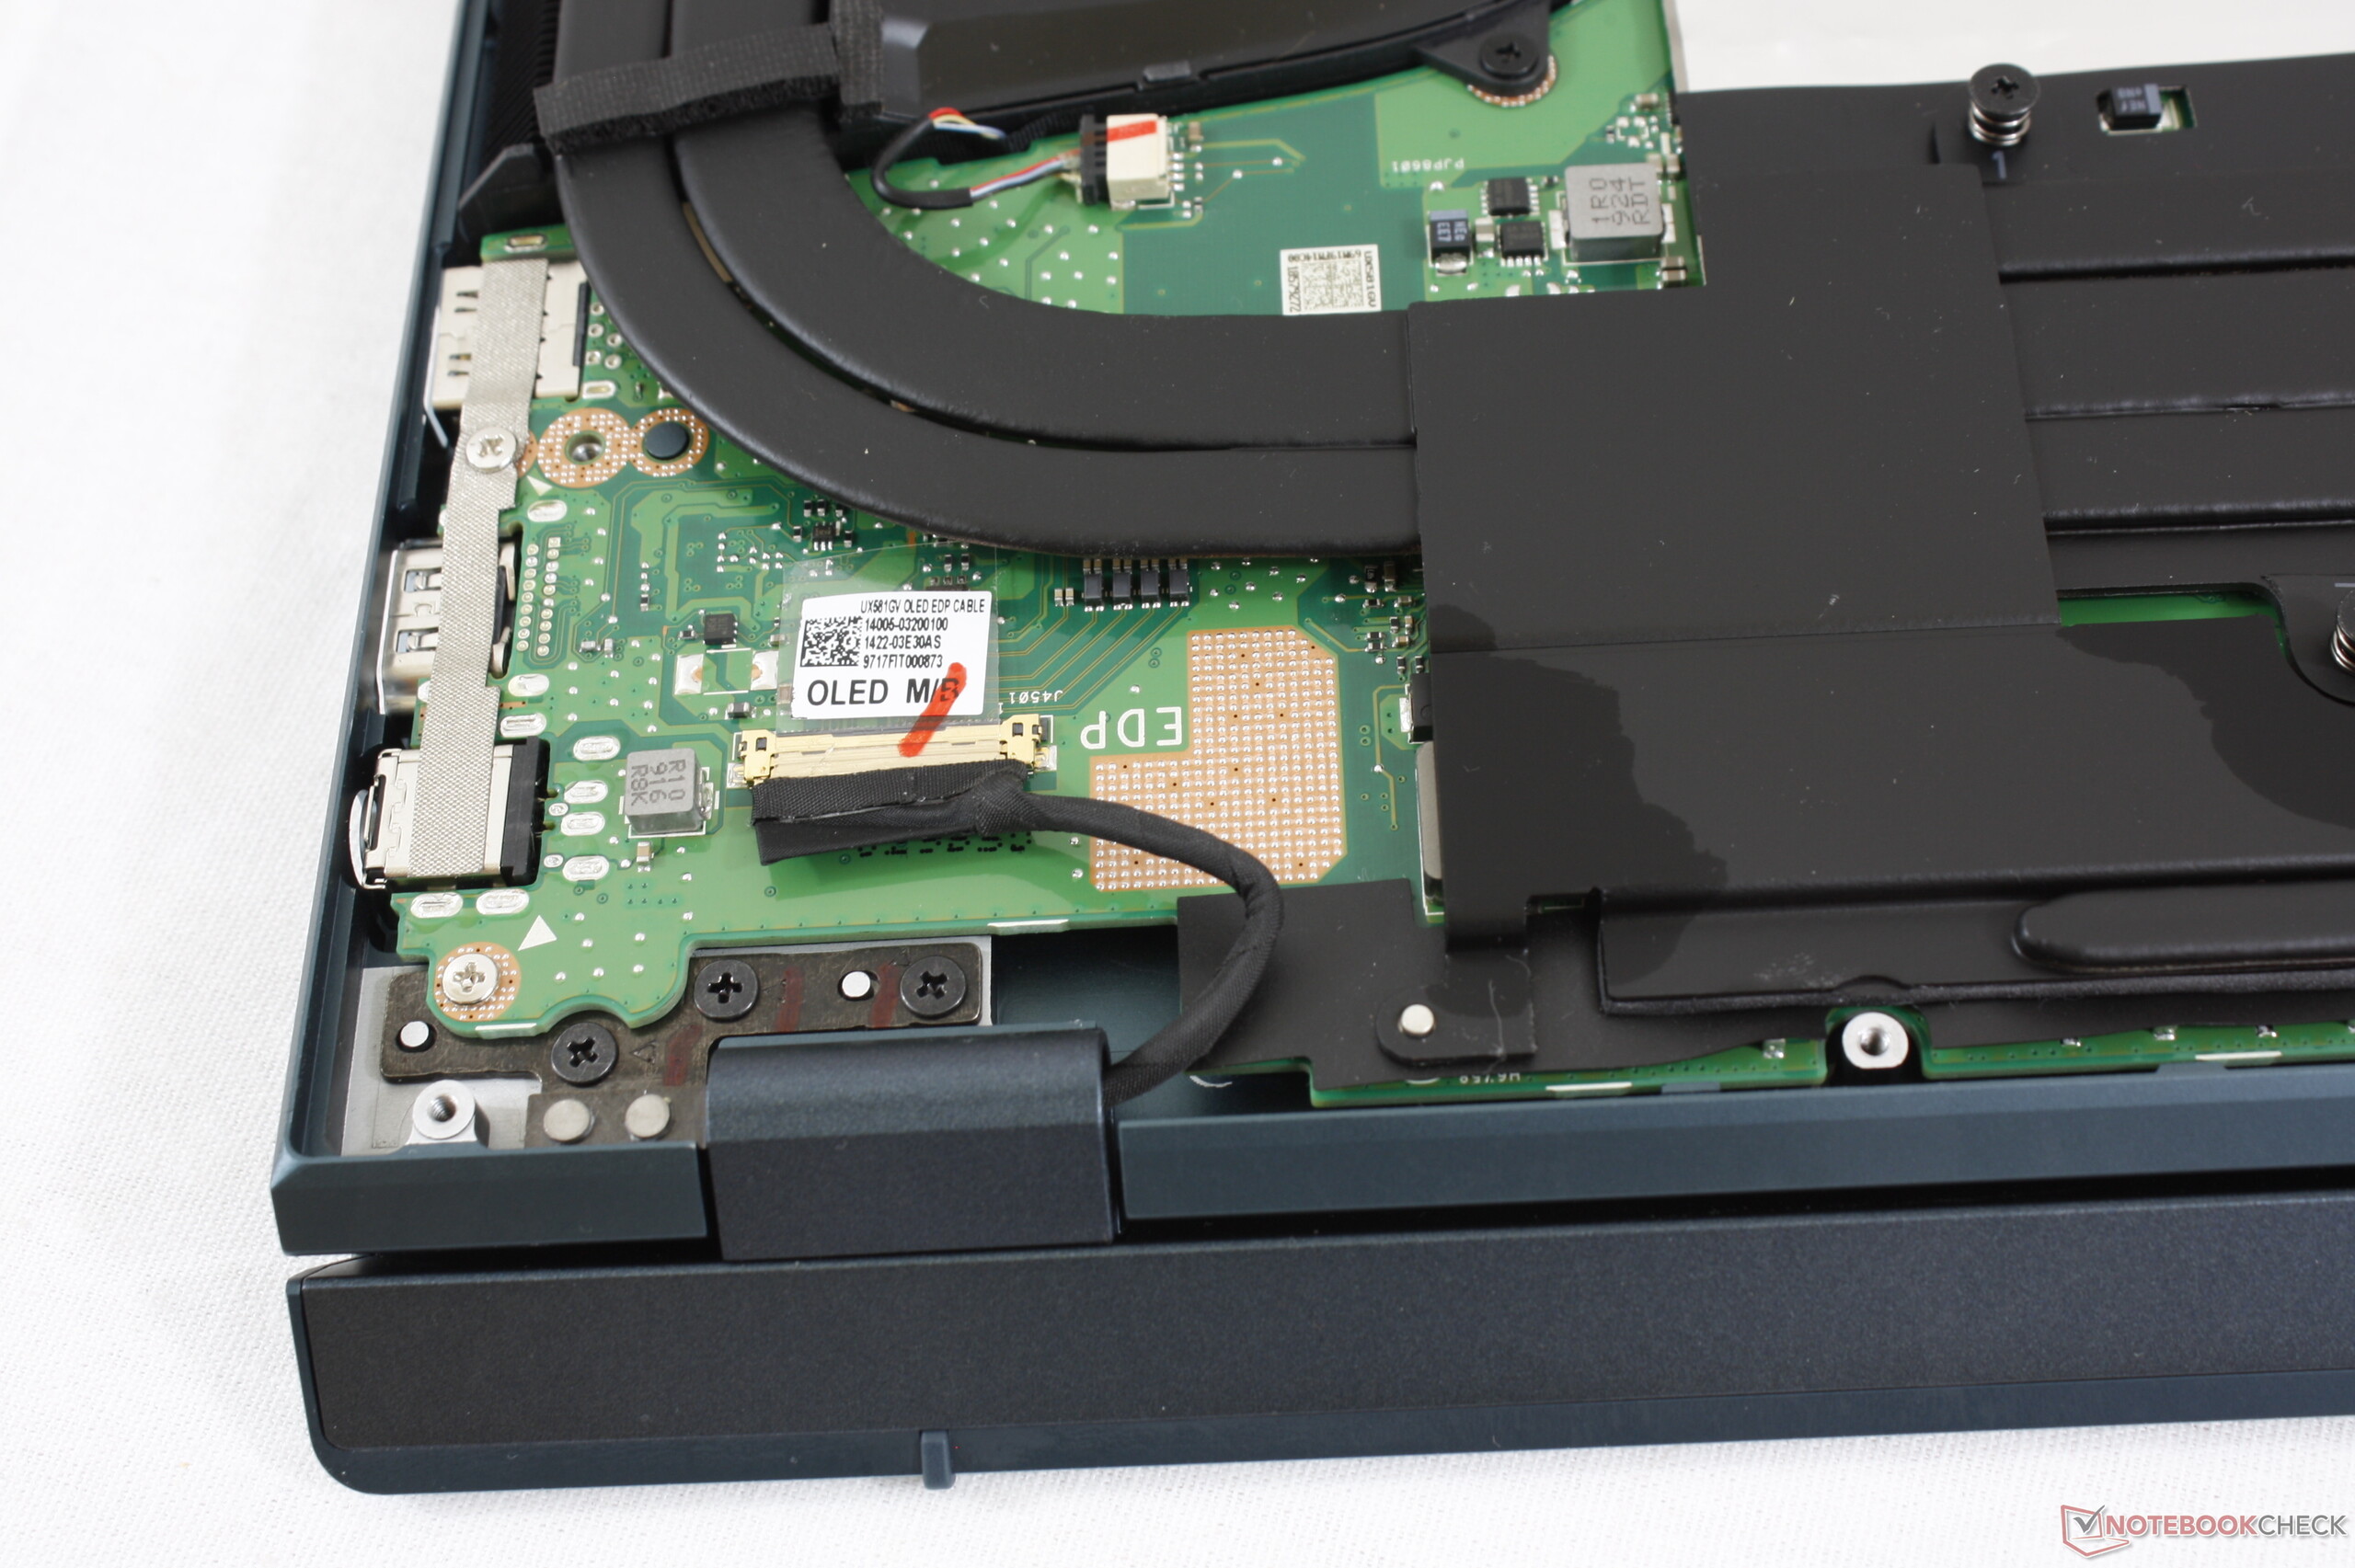
Uma estranheza que profissionais exigentes podem detestar é a disparidade na qualidade entre as duas telas. Uma OLED brilhante com tempos de resposta super rápidos inerentemente será muito diferente de uma IPS mate com tempos de resposta mais lentos. Suspeitamos que o suprimento de painéis OLED com resolução de 3840 x 1110 seja limitado e, portanto, a Asus não teve escolha a não ser usar o IPS para o ScreenPad Plus.
Outras desvantagens incluem a menor duração da bateria, um slot de armazenamento único e a falta de um leitor SD e do NumPad táctil que os criadores ou profissionais de conteúdo têm maior probabilidade de aproveitar. Idealmente, as futuras iterações do ZenBook Pro Duo seriam capazes de integrar a segunda tela em um chassi do tamanho e peso de um elegante Ultrabook Razer Blade 15, XPS 15, ou Spectre x360 15 em vez de um portátil de jogos de tamanho mediano. Até lá, você não poderá encontrar uma melhor experiência de tela dupla fora do UX581.
O Asus ZenBook Pro Duo UX581 é o portátil de tela dupla mais maduro de todos os tempos. Ele aborda algumas das desvantagens do ScreenPad original para fornecer uma experiência de desktop mais natural. No entanto, os portáteis de tela dupla ainda estão em sua infância e a série ZenBook Pro Duo certamente pode se beneficiar de um design mais leve e fino no futuro.
Asus ZenBook Pro Duo UX581GV
- 08/31/2022 v7 (old)
Allen Ngo
Price comparison
