Análise do conversível 2 em 1 Dell Inspiron 14 7435: Ryzen 5 7530U para usuários econômicos

O Inspiron 14 7435 2 em 1 é a versão AMD do Inspiron 14 7430 2 em 1 baseado em Intel. Ele substitui diretamente o Inspiron 14 7420 2 em 1 do ano passado do ano passado, com atualizações internas e externas.
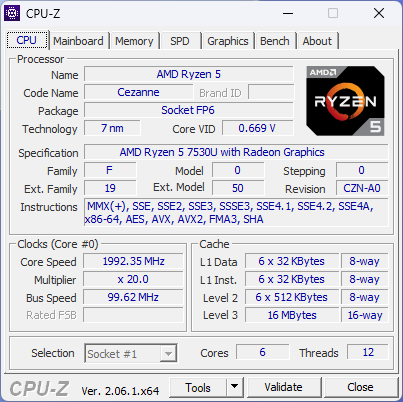
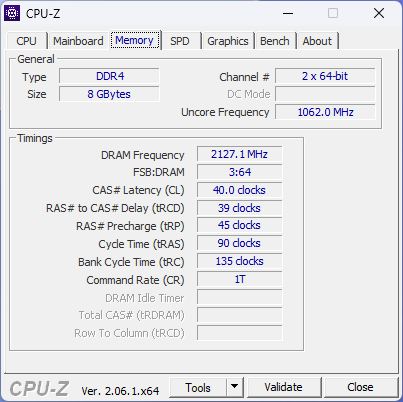
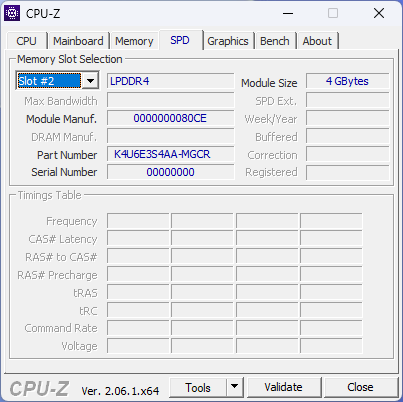
Nossa configuração de análise específica é uma SKU de baixo custo com a CPU Ryzen 5 7530U e 8 GB de RAM LPDDR4x-4266 soldada por apenas US$ 550. Uma versão mais sofisticada com o dobro de RAM e a CPU Ryzen 7 7730U também está disponível, mas todas as configurações vêm com a mesma tela sensível ao toque IPS de 1200p e gráficos Radeon Vega integrados.
Os concorrentes incluem outros conversíveis voltados para o orçamento, como o Acer Aspire 5 Spin 14,Lenovo IdeaPad Flex 7iou HP Pavilion x360 14. Existe uma versão de 16 polegadas desse modelo chamada Inspiron 16 7635 2 em 1.
Mais análises da Dell:
Possíveis concorrentes em comparação
Avaliação | Data | Modelo | Peso | Altura | Size | Resolução | Preço |
|---|---|---|---|---|---|---|---|
| 84.5 % v7 (old) | 08/2023 | Dell Inspiron 14 7435 2-in-1 R5 7530U, Vega 7 | 1.6 kg | 18.6 mm | 14.00" | 1920x1200 | |
| 83.7 % v7 (old) | 06/2022 | Dell Inspiron 14 7420 2-in-1 i7-1255U, Iris Xe G7 96EUs | 1.6 kg | 17.86 mm | 14.00" | 1920x1200 | |
| 83.2 % v7 (old) | 12/2022 | Lenovo IdeaPad Flex 7i 14IAU7 i7-1255U, Iris Xe G7 96EUs | 1.5 kg | 18.9 mm | 14.00" | 2240x1400 | |
| 82.2 % v7 (old) | 06/2023 | Acer Aspire 5 Spin 14 i5-1335U, Iris Xe G7 80EUs | 1.6 kg | 17.99 mm | 14.00" | 1920x1200 | |
| 87.5 % v7 (old) | 05/2022 | LG Gram 14T90P i5-1135G7, Iris Xe G7 80EUs | 1.2 kg | 17 mm | 14.00" | 1900x1200 | |
| 81.8 % v7 (old) | 07/2021 | HP Pavilion x360 14-dy0157ng i5-1135G7, Iris Xe G7 80EUs | 1.5 kg | 19.9 mm | 14.00" | 1920x1080 |
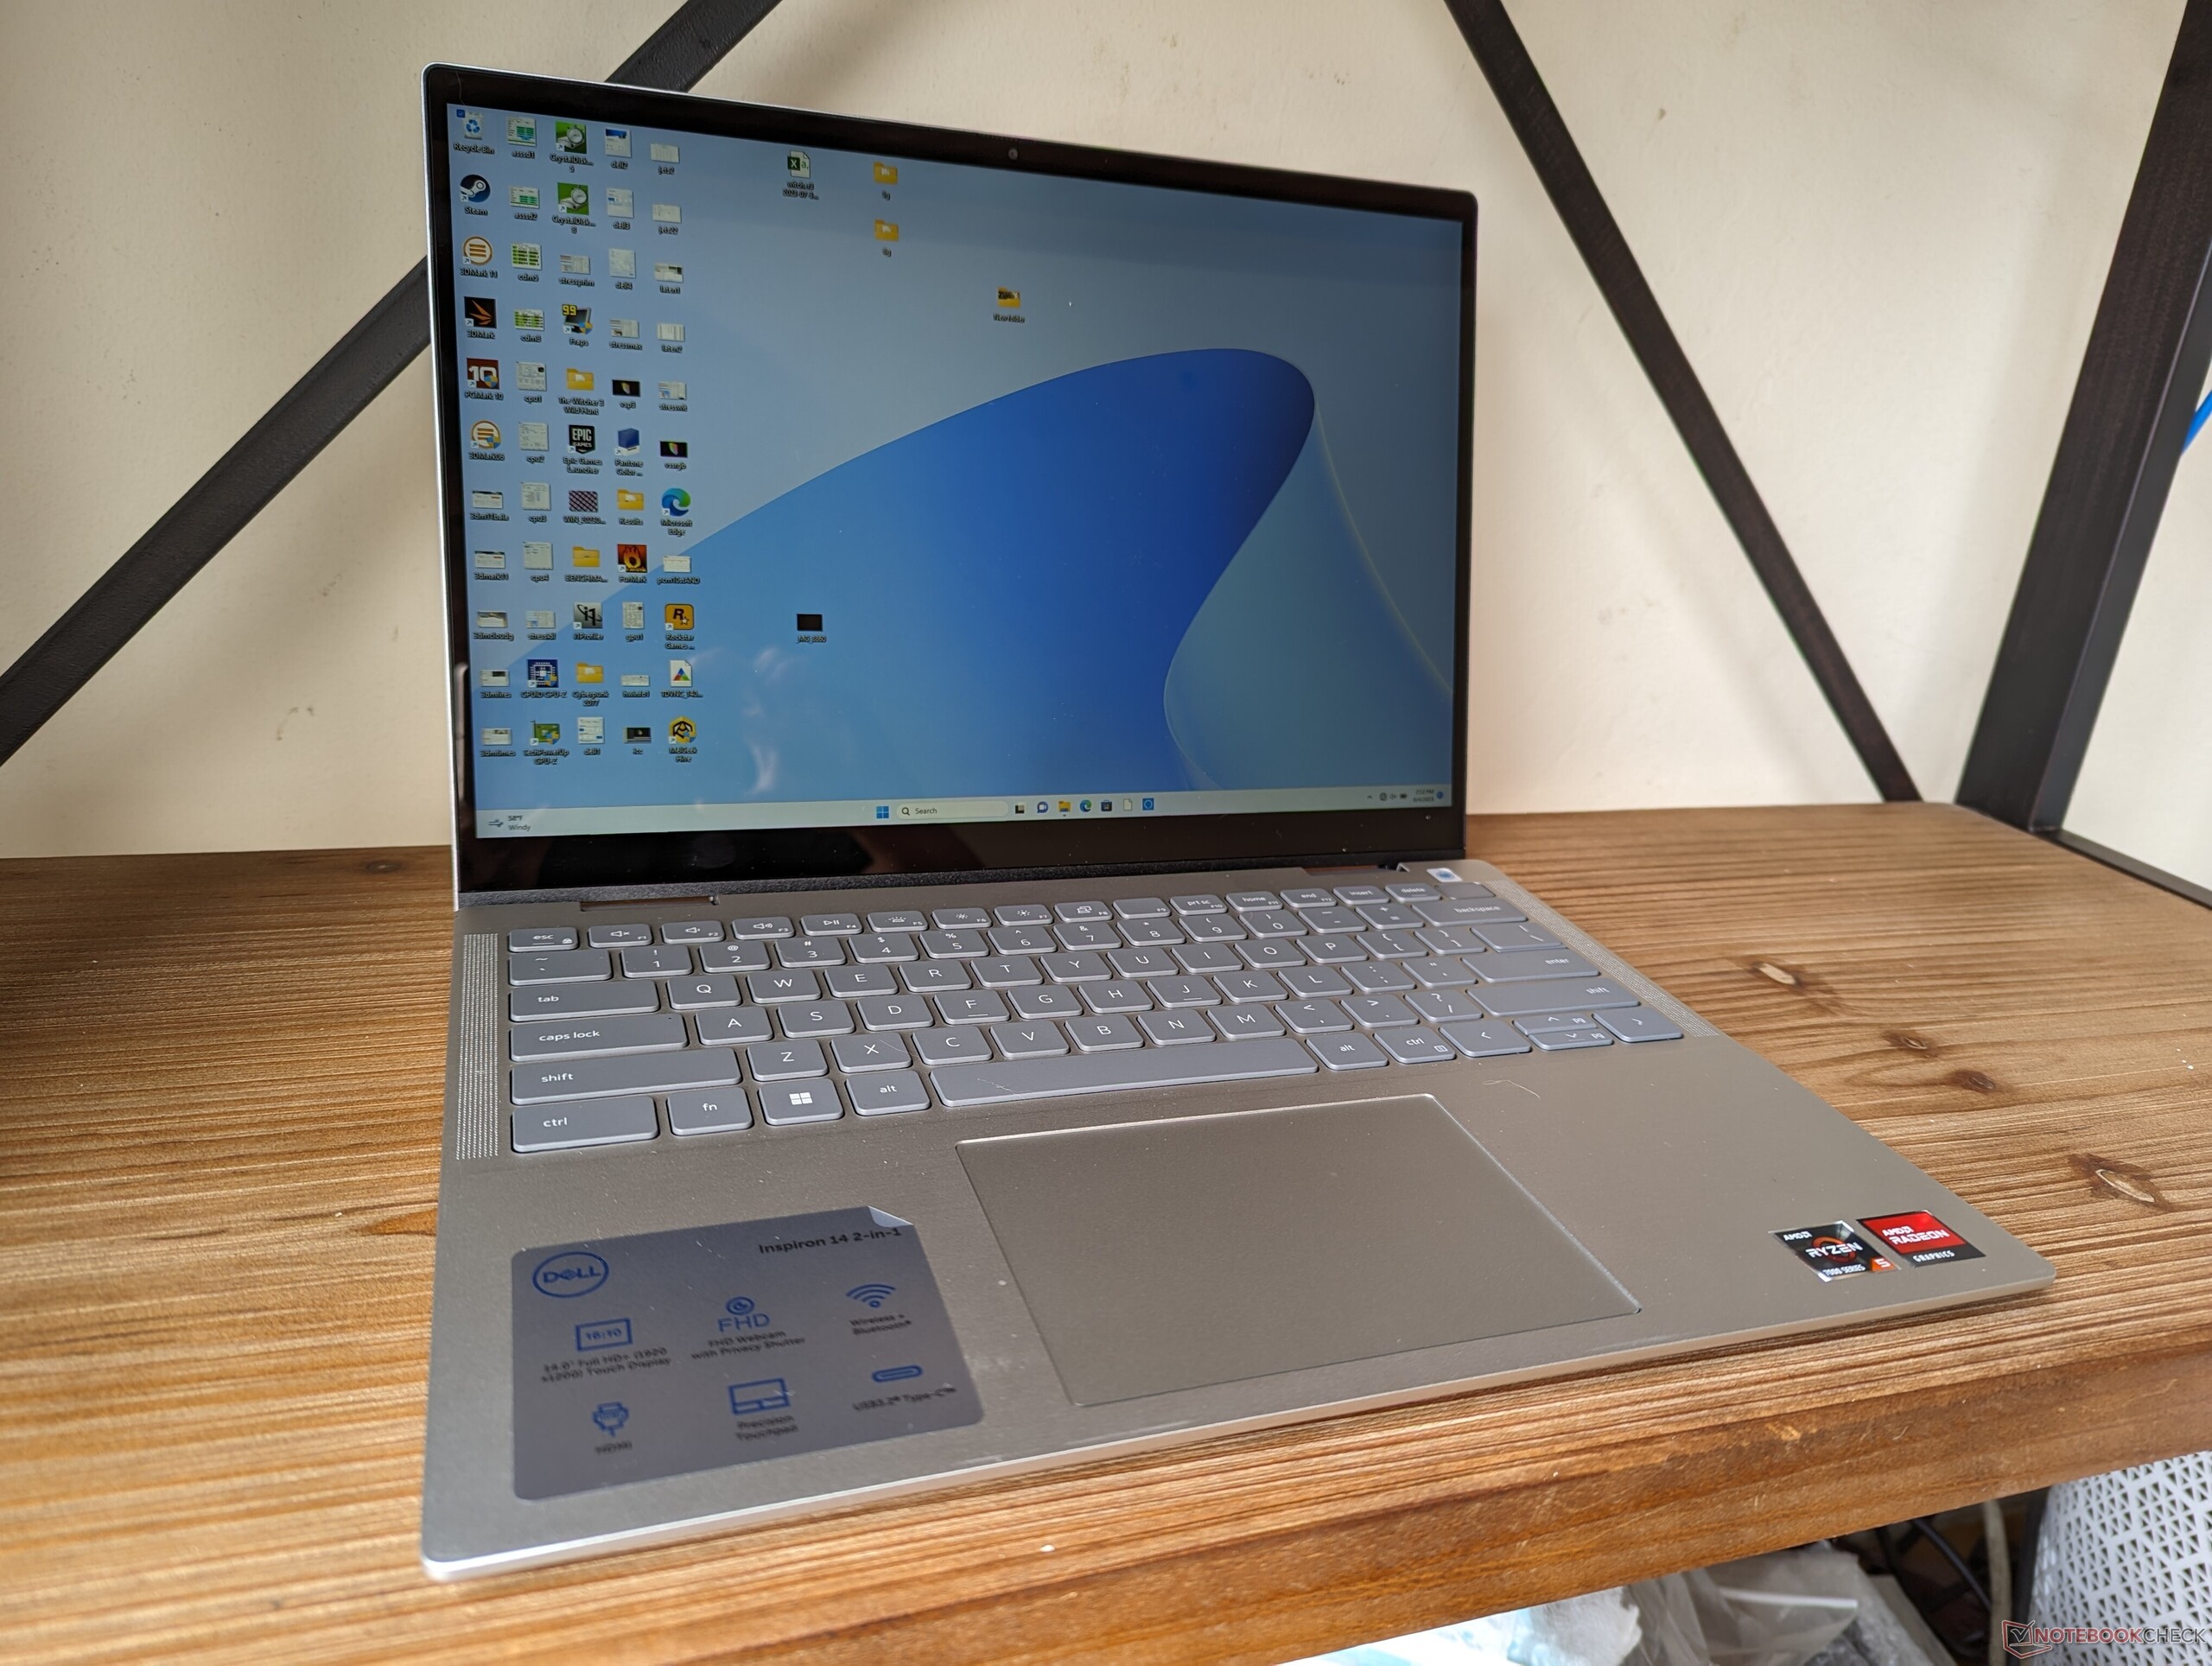
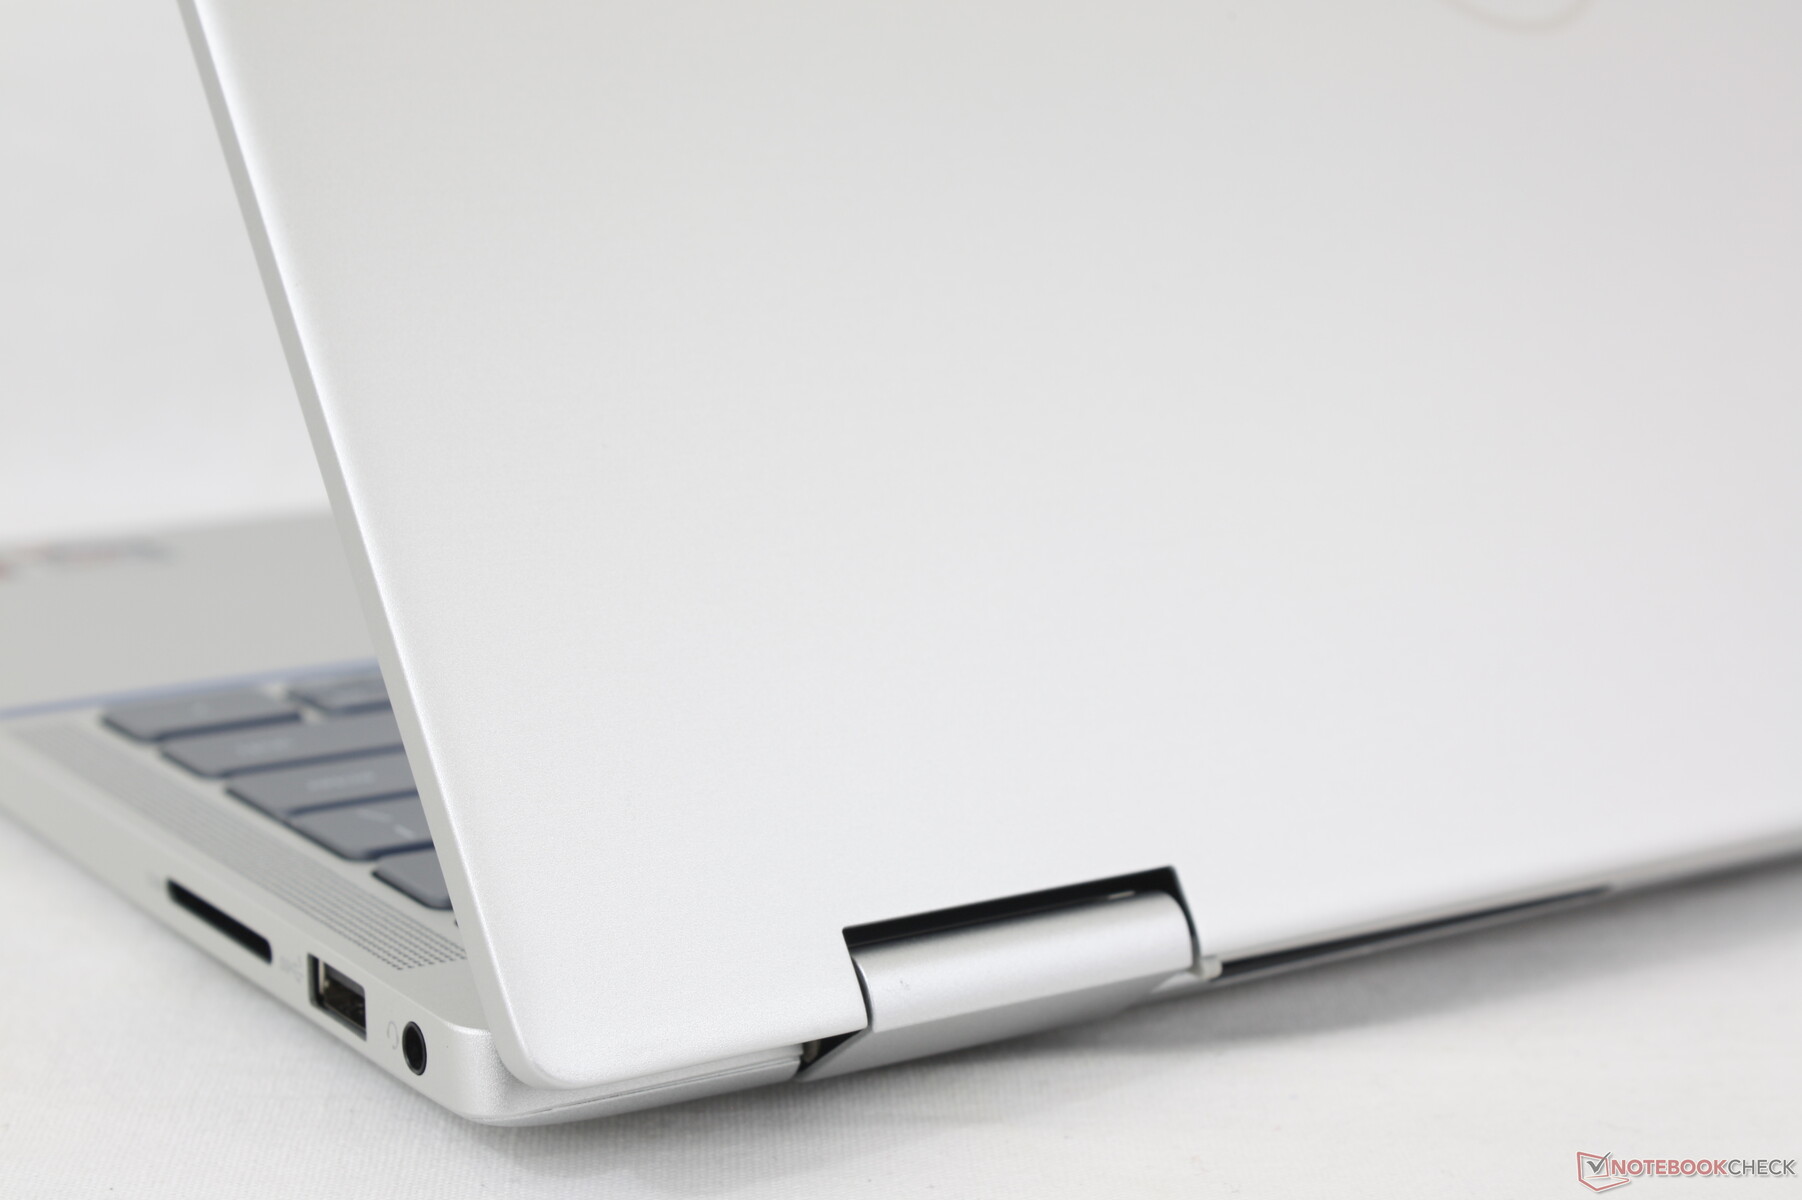
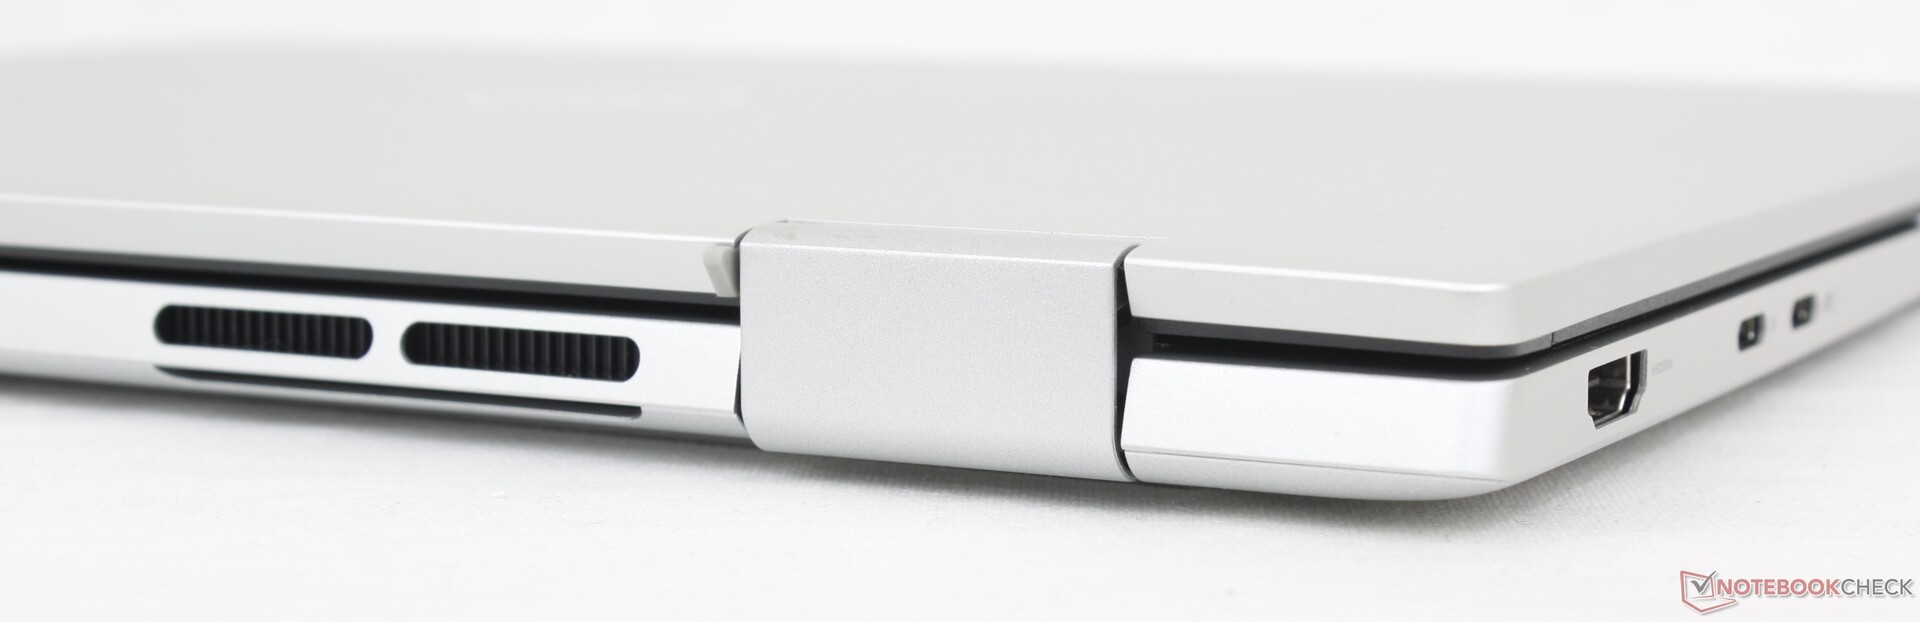
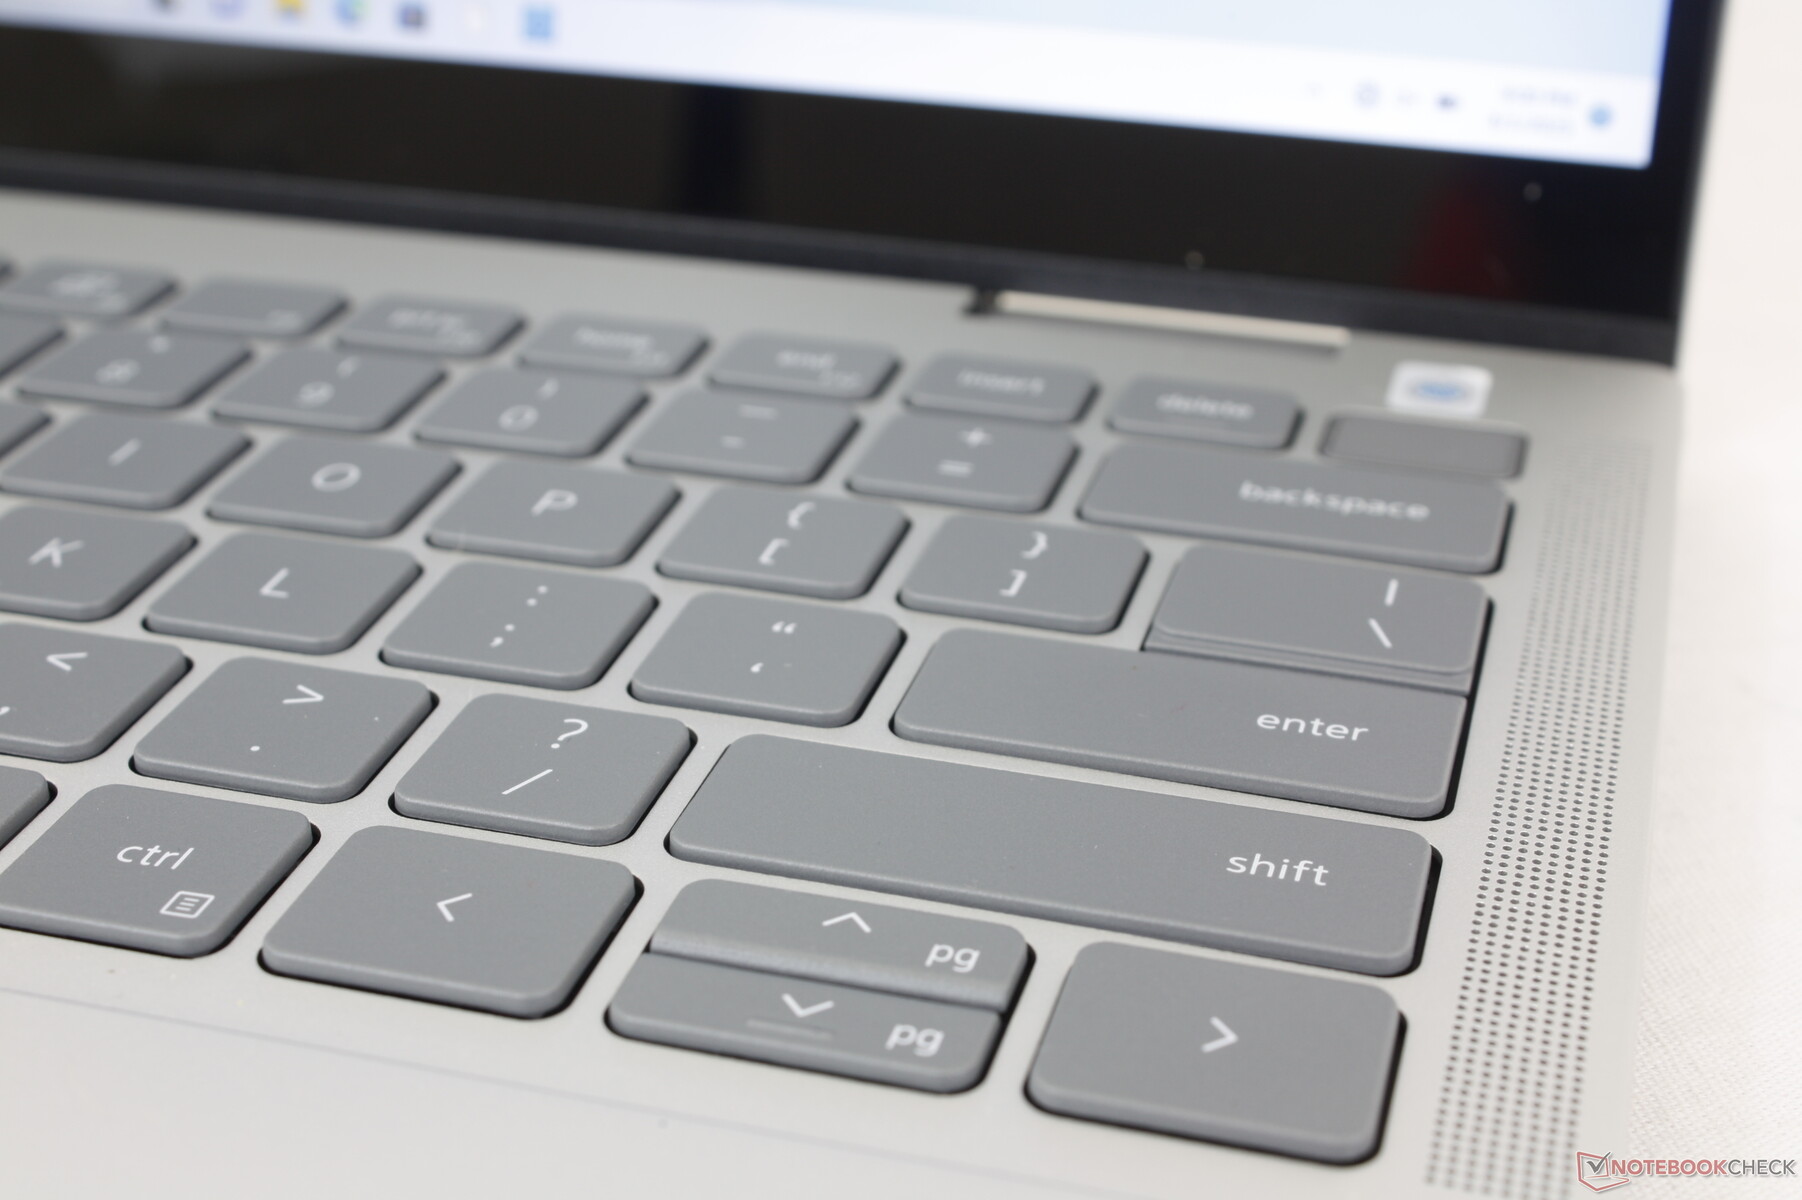
Case - alto-falantes e dobradiças revisados
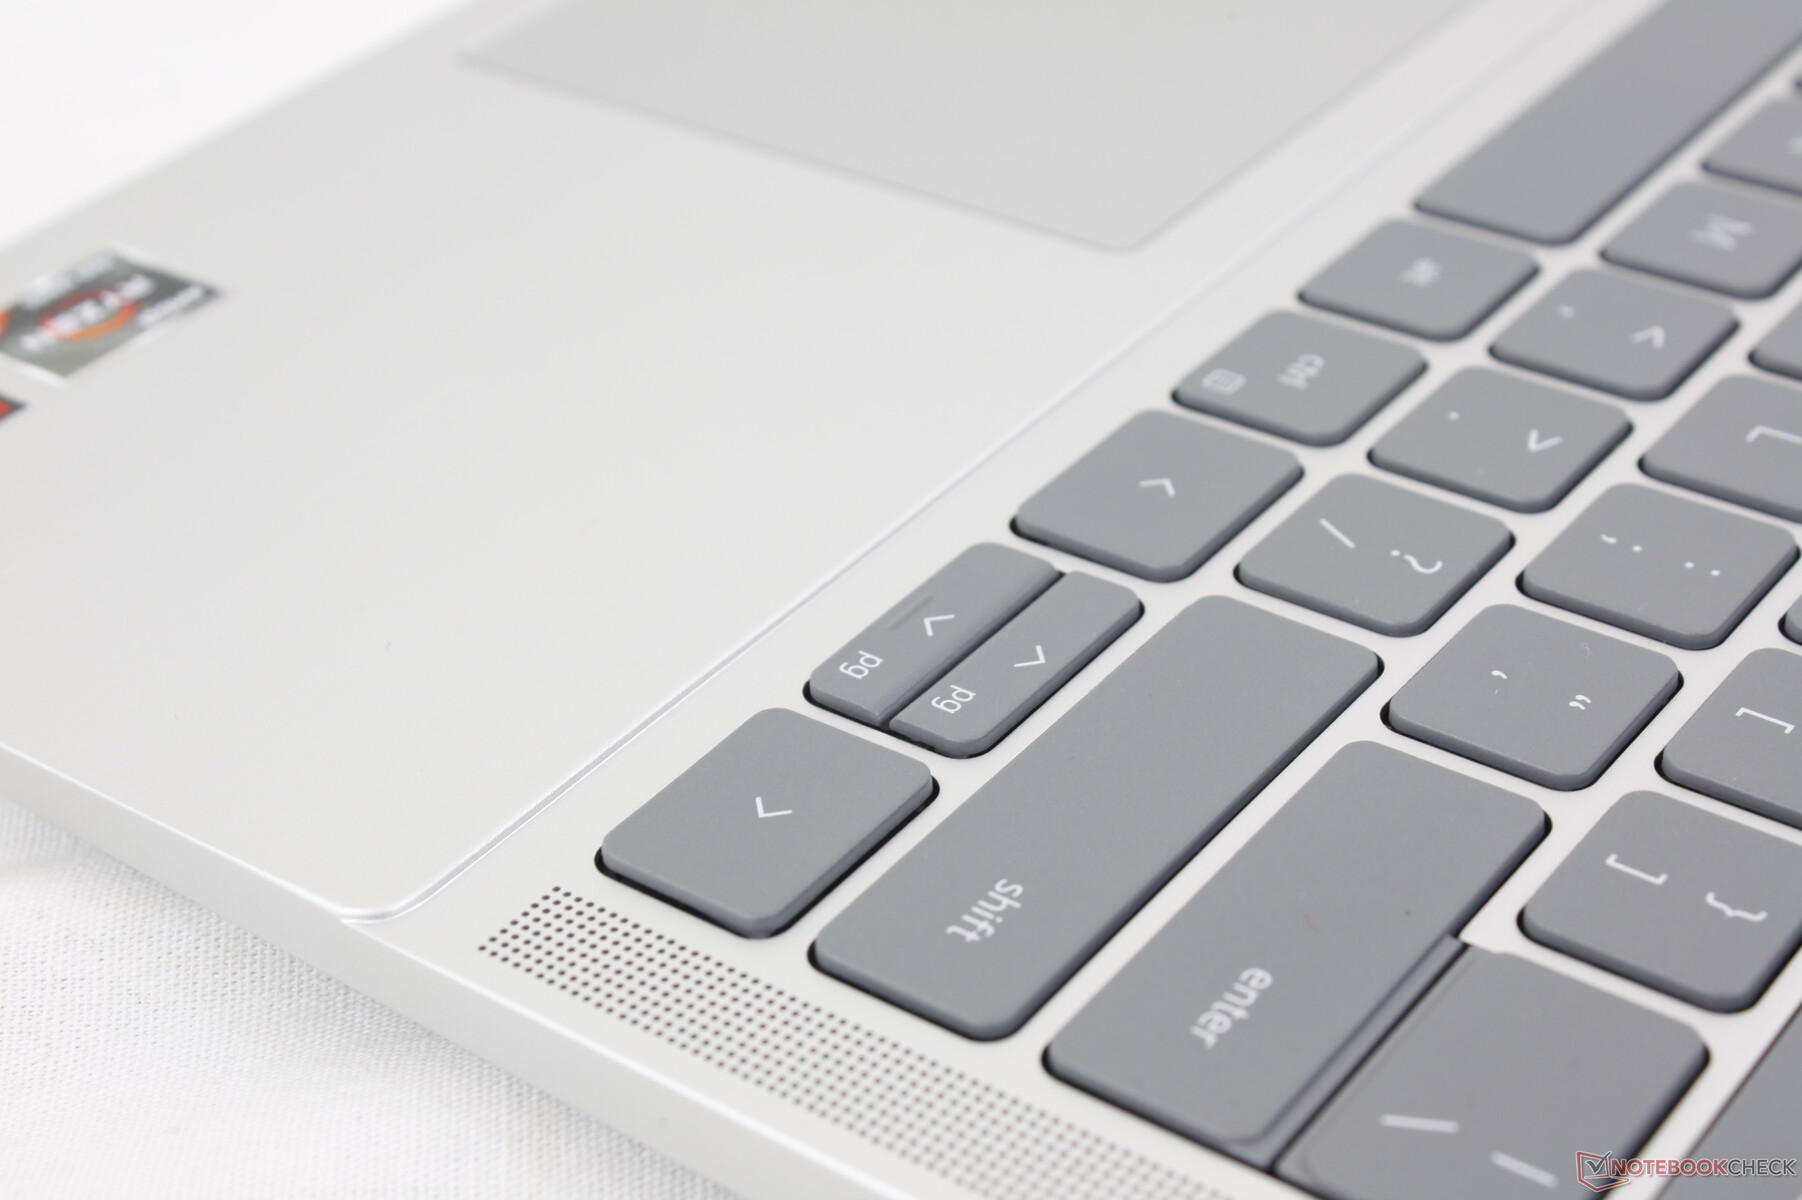
Embora pareça idêntico ao 2022 Inspiron 14 7620 2 em 1 à primeira vista, várias diferenças são perceptíveis após uma inspeção mais detalhada. Em primeiro lugar, os tão falados apoios para as mãos em Mylar foram removidos em favor de mais plástico ABS. O material especial deveria proteger os apoios para as mãos e o clickpad contra o acúmulo de gordura, mas acabou se mostrando desnecessário em um laptop econômico como este. Em segundo lugar, as dobradiças foram redesenhadas para serem um pouco maiores e mais planas, o que deve melhorar a longevidade. E, por último, os alto-falantes foram reposicionados dos cantos frontais do chassi para as bordas do teclado e agora estão voltados para cima, diretamente para o usuário.
A rigidez do chassi permanece praticamente a mesma de antes devido aos seus esqueletos semelhantes e à escolha dos materiais plásticos.
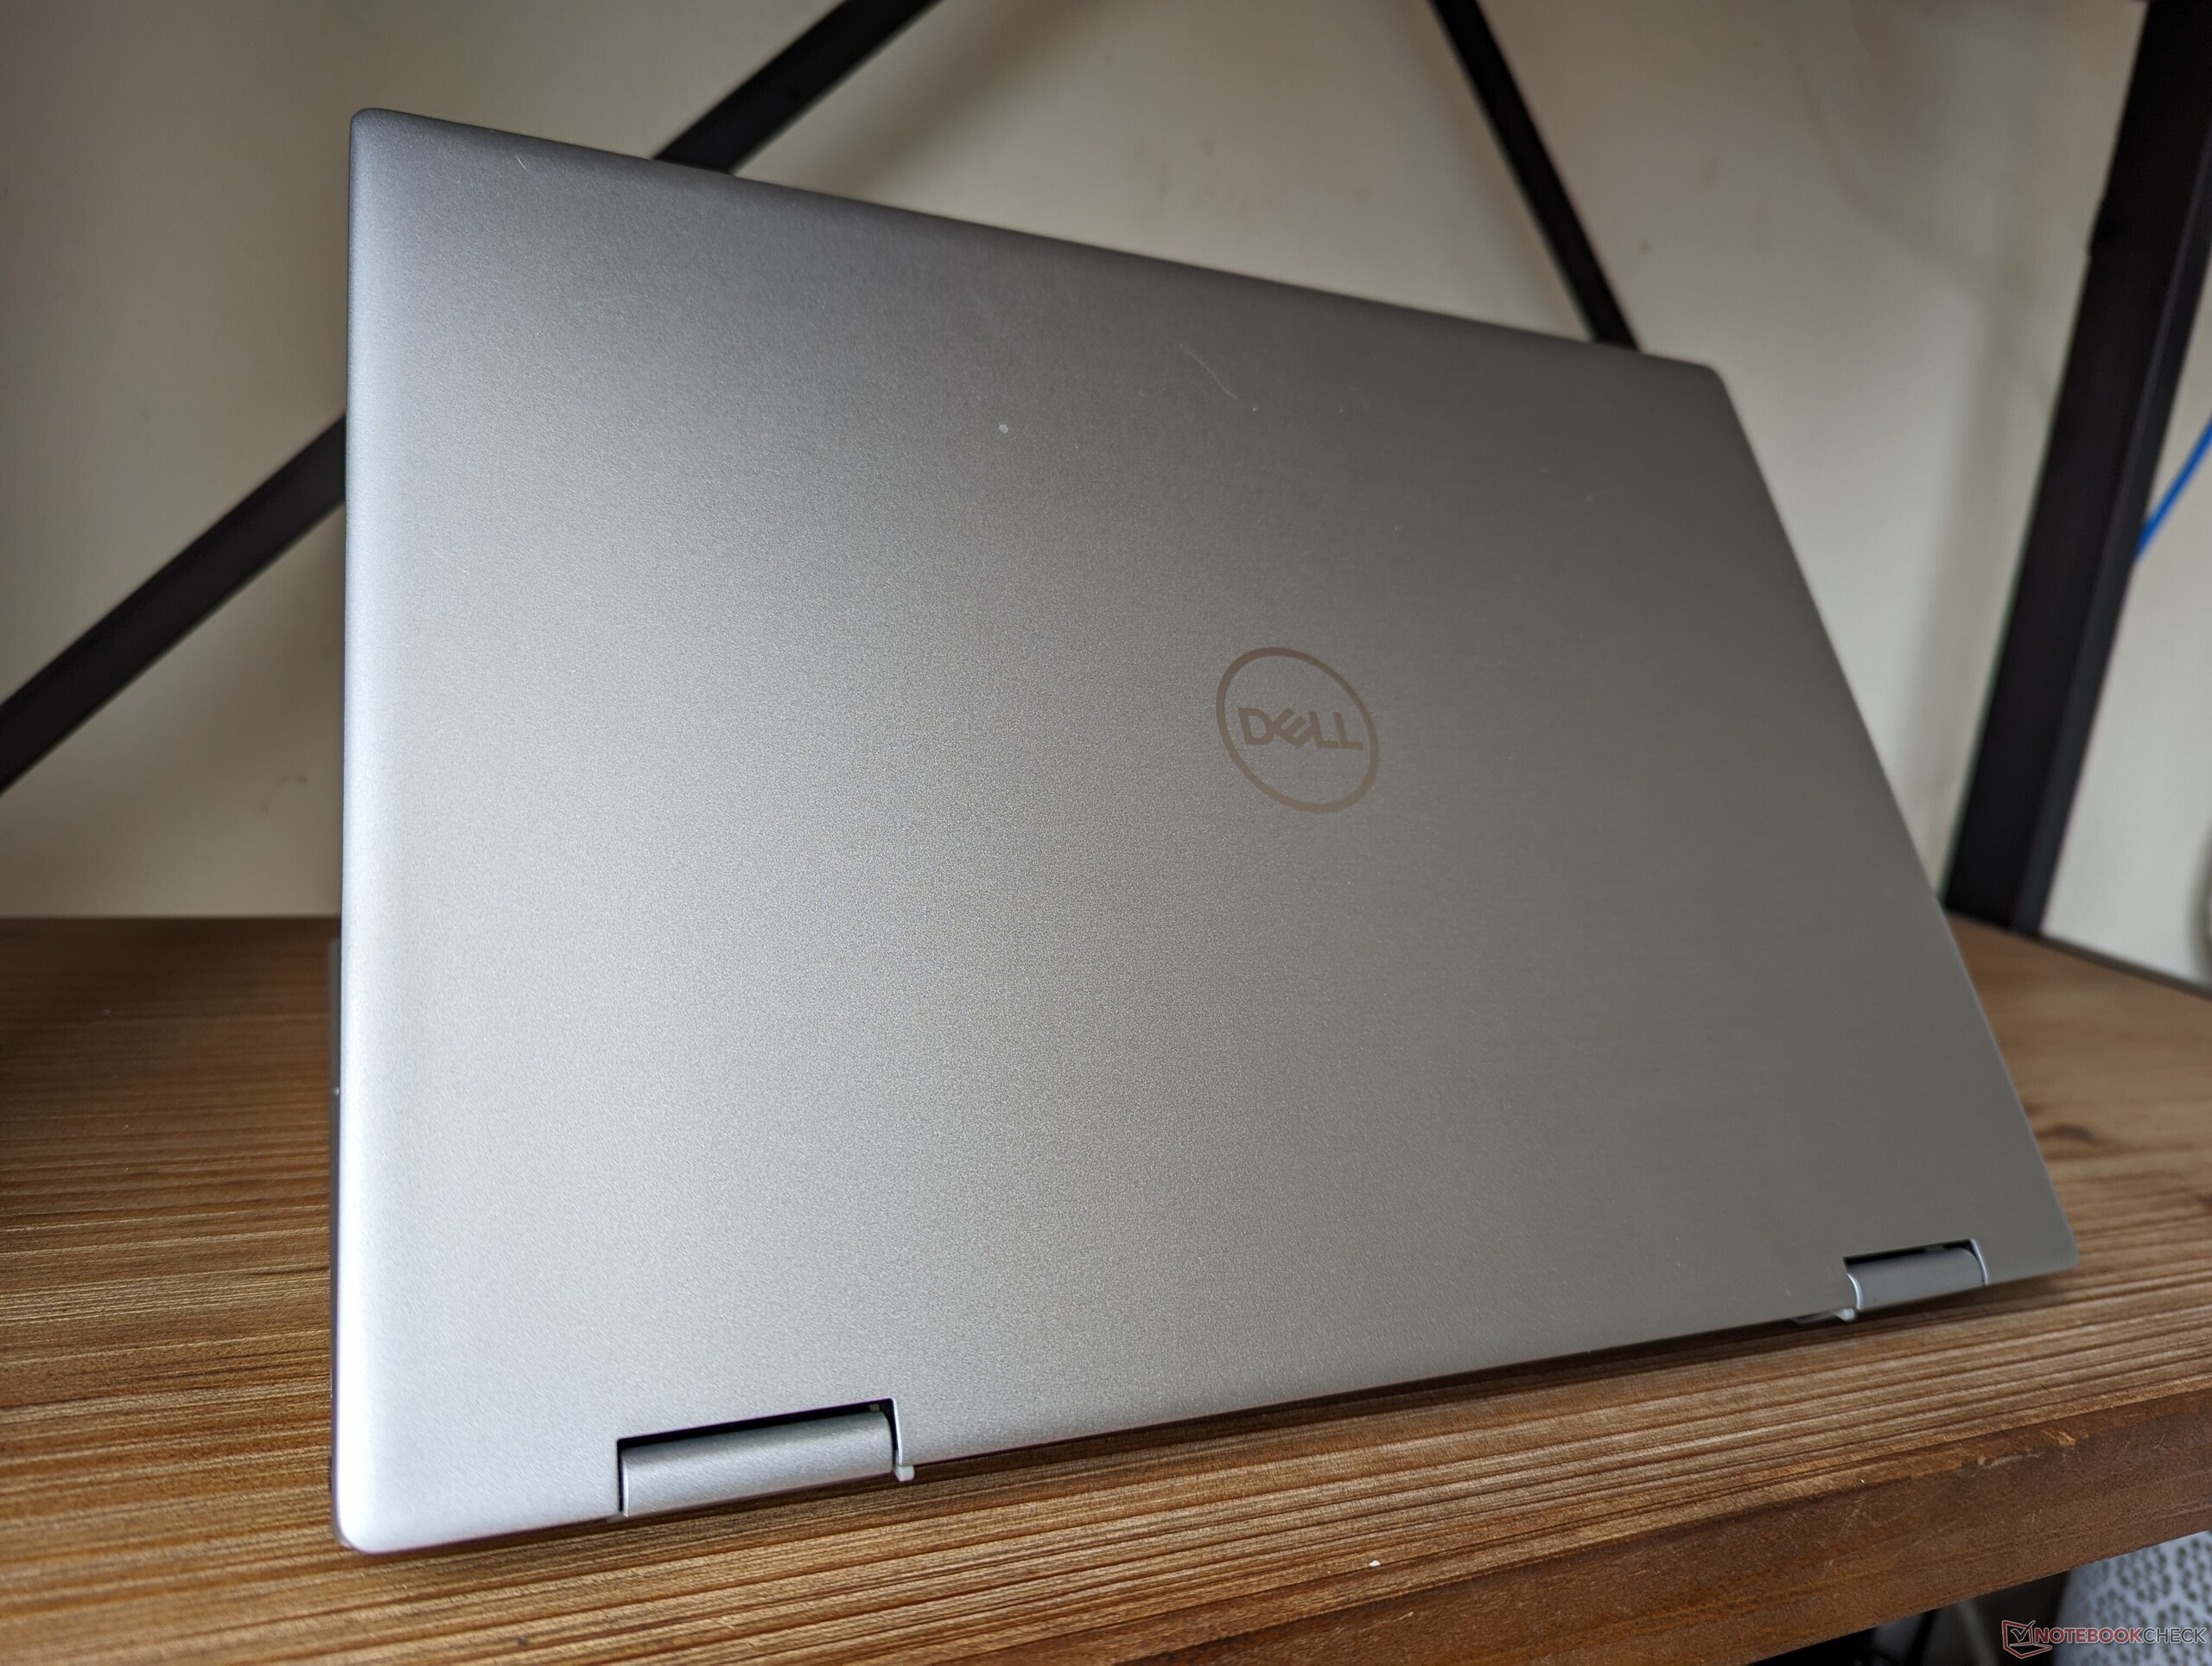
As dimensões e o peso são praticamente idênticos aos do modelo do ano passado, apesar de todas as mudanças externas e internas. Isso não é necessariamente ruim, pois o modelo ainda é comparável a alternativas como o Pavilion x360 14 ou o IdeaPad Flex 14 7i, mas a Dell poderia ter se esforçado um pouco mais para tornar o Inspiron ainda mais portátil e lucrativo para os compradores em potencial.
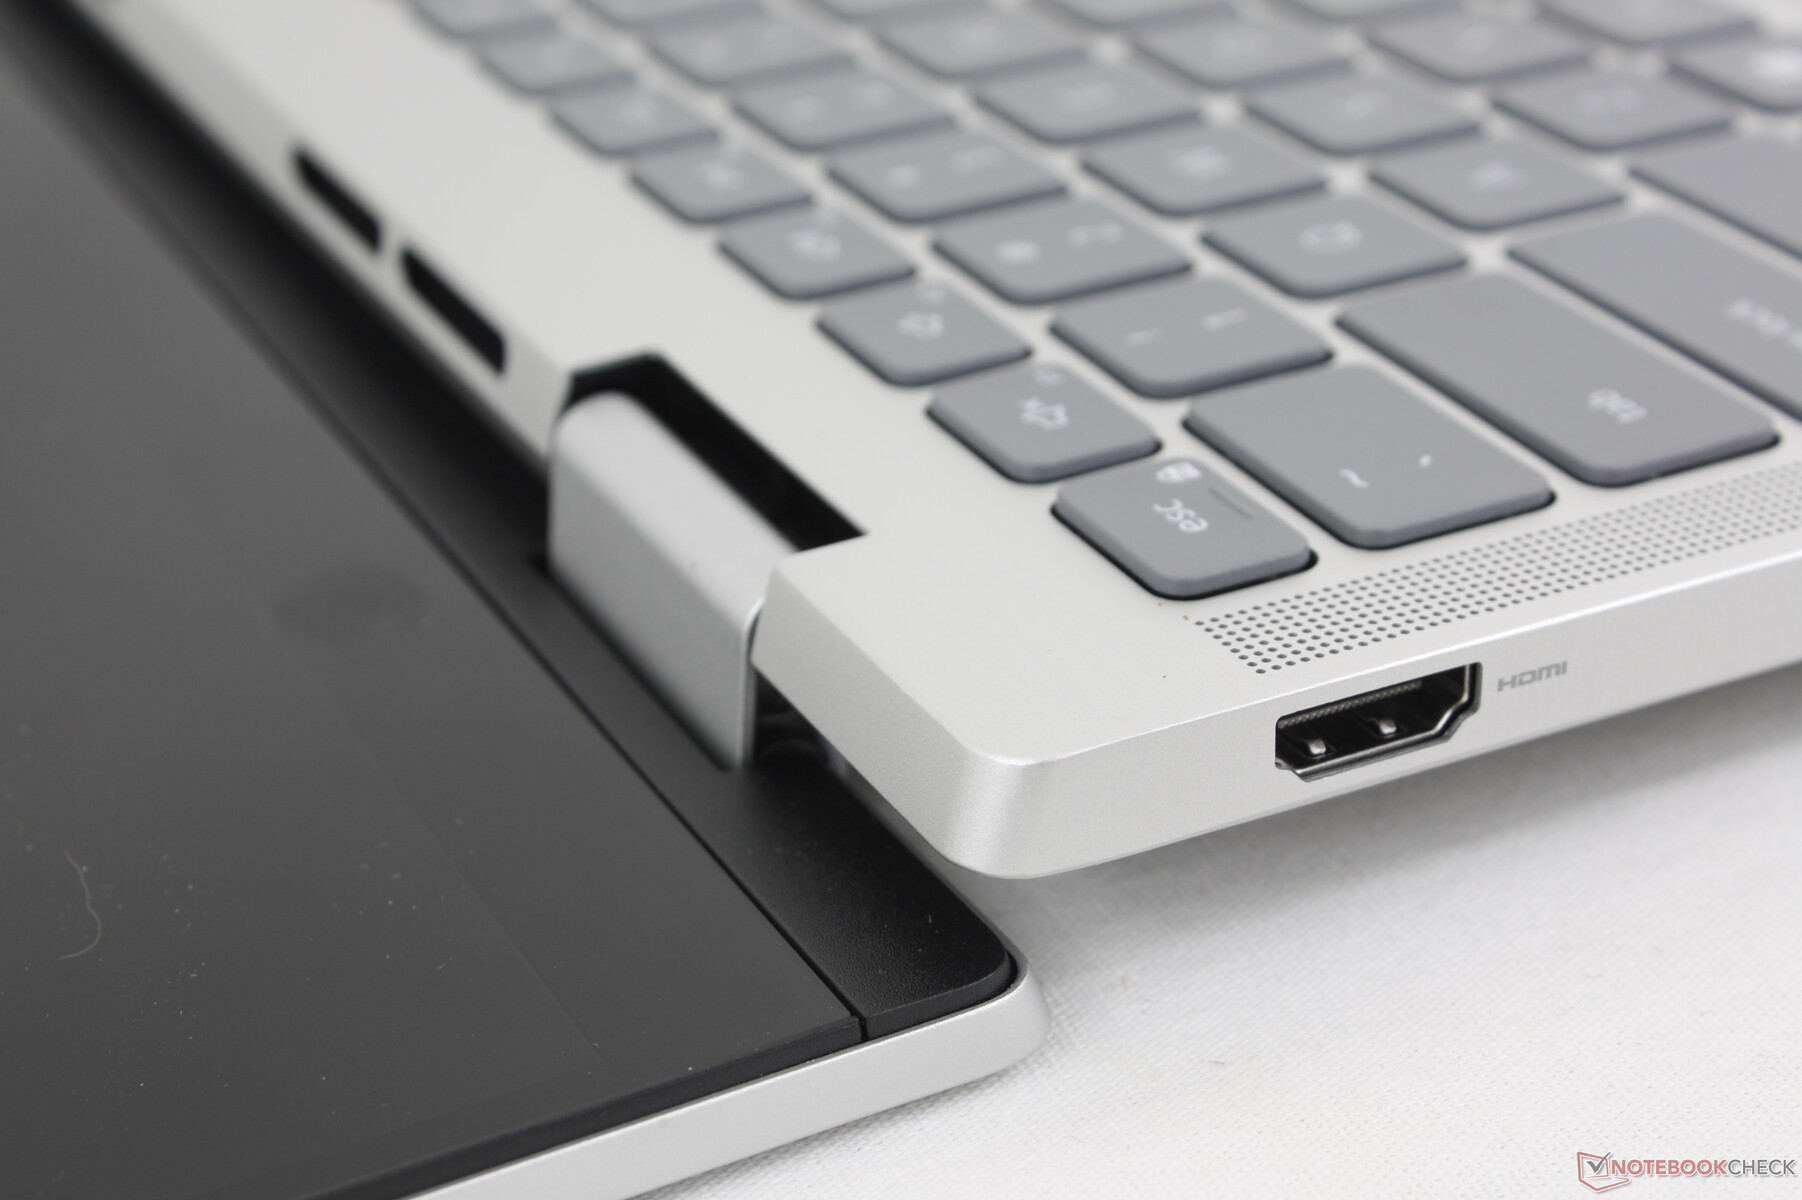
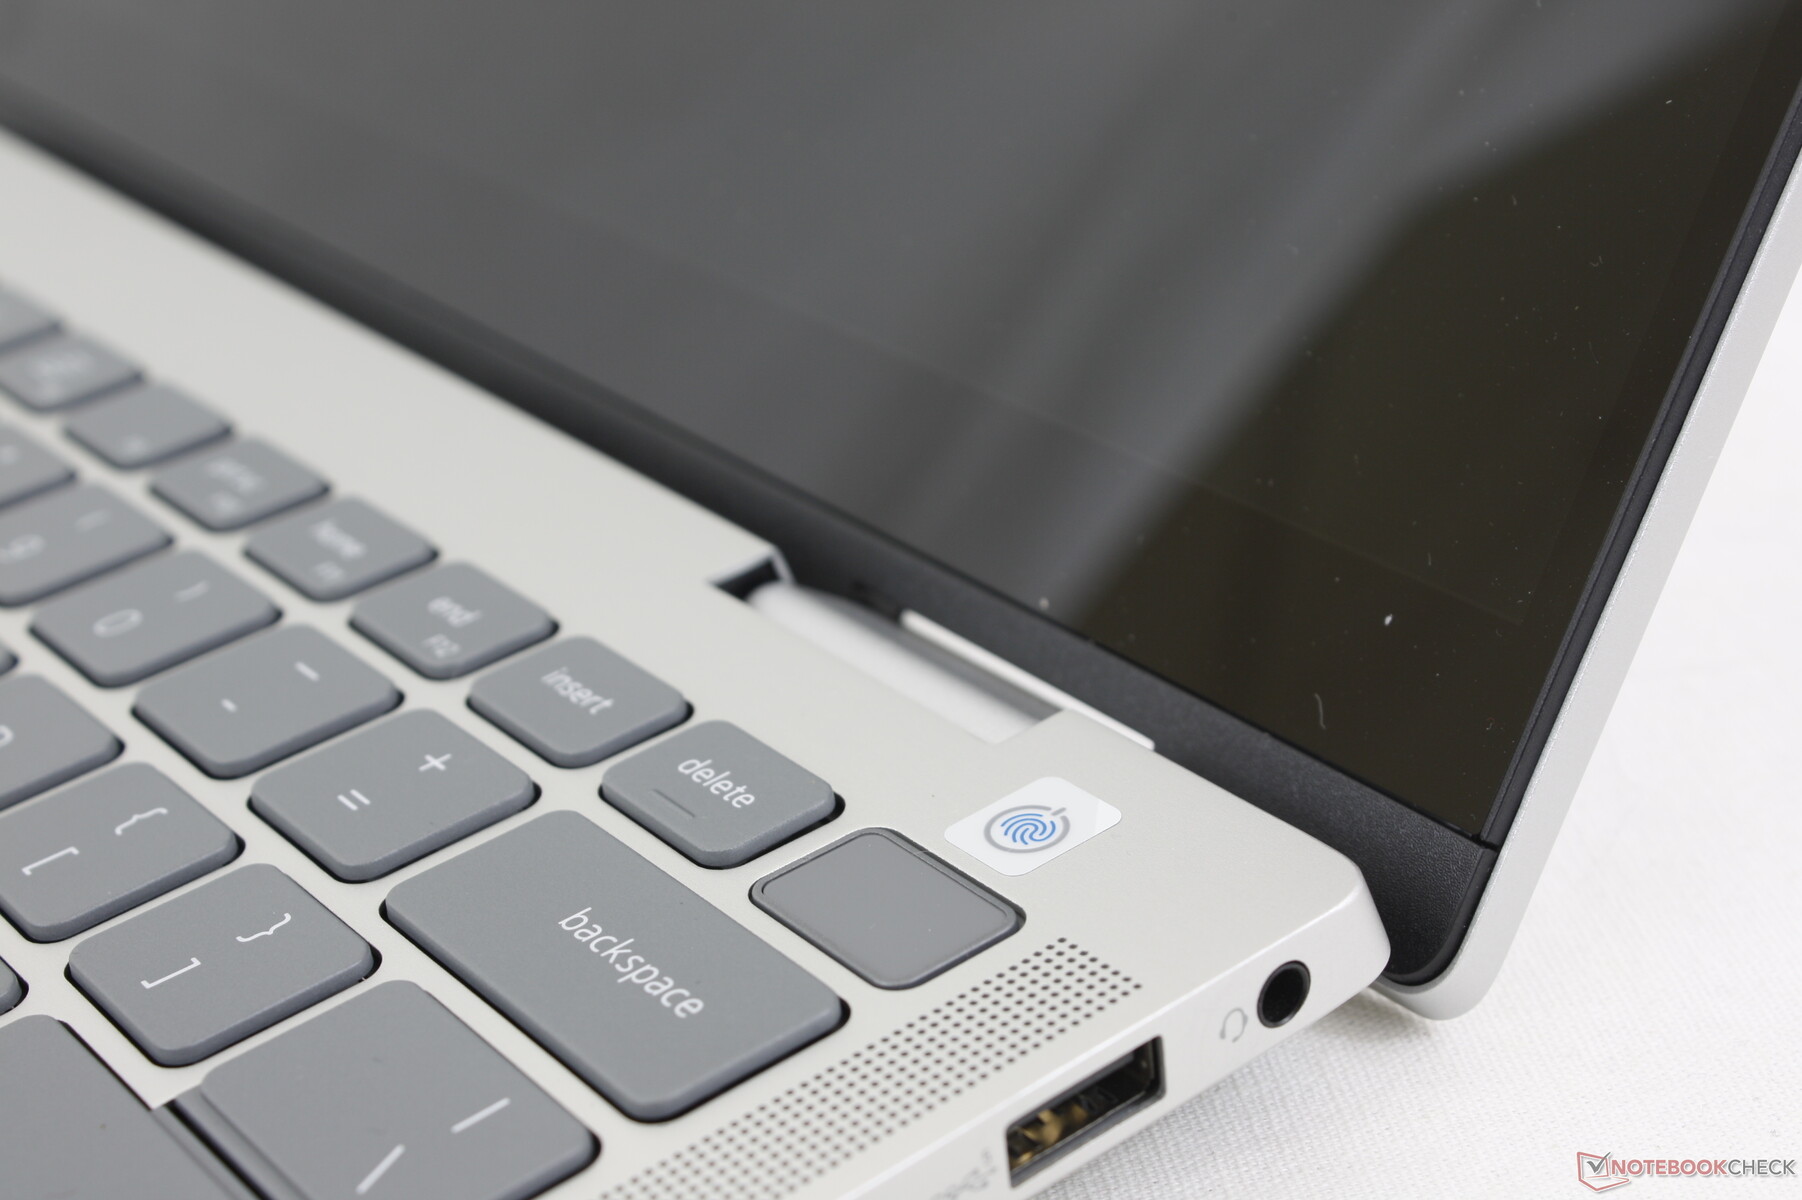
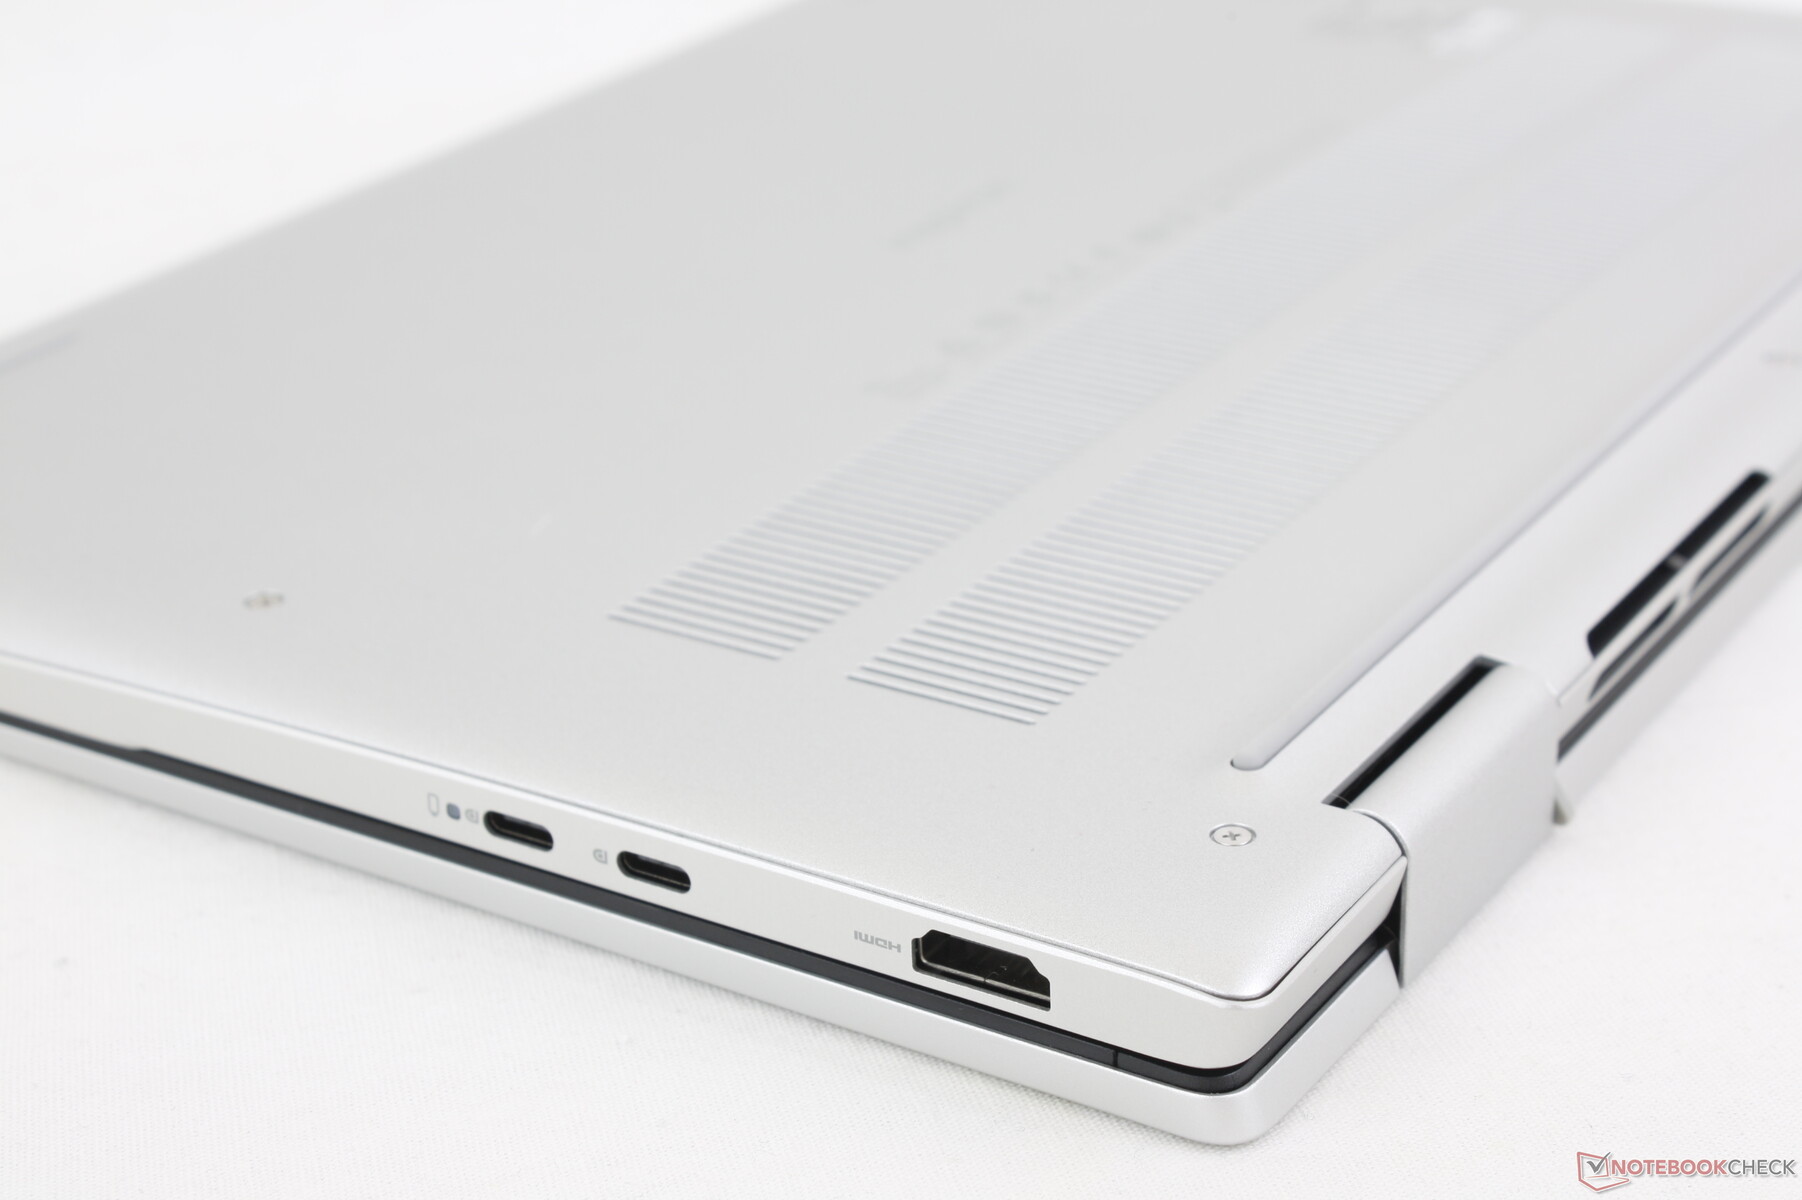
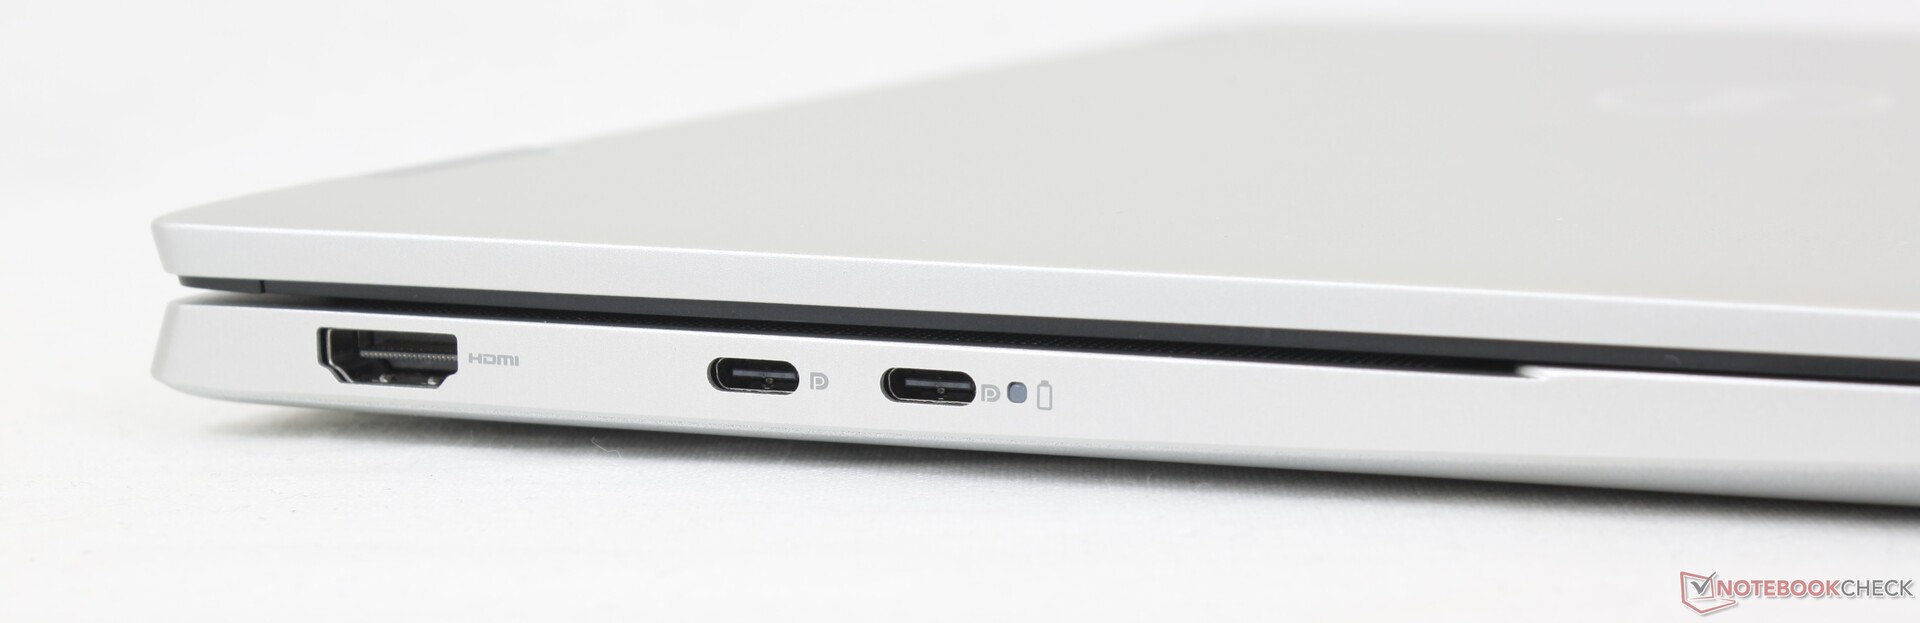
Conectividade
As opções de portas são comparáveis às do IdeaPad Flex 5i 14 e do Pavilion x360 14, com apenas pequenas diferenças no número de portas USB. Lembre-se de que as portas USB-C em nossa configuração AMD não têm suporte para Thunderbolt, ao contrário do Inspiron 7430 2 em 1 com tecnologia Intel.

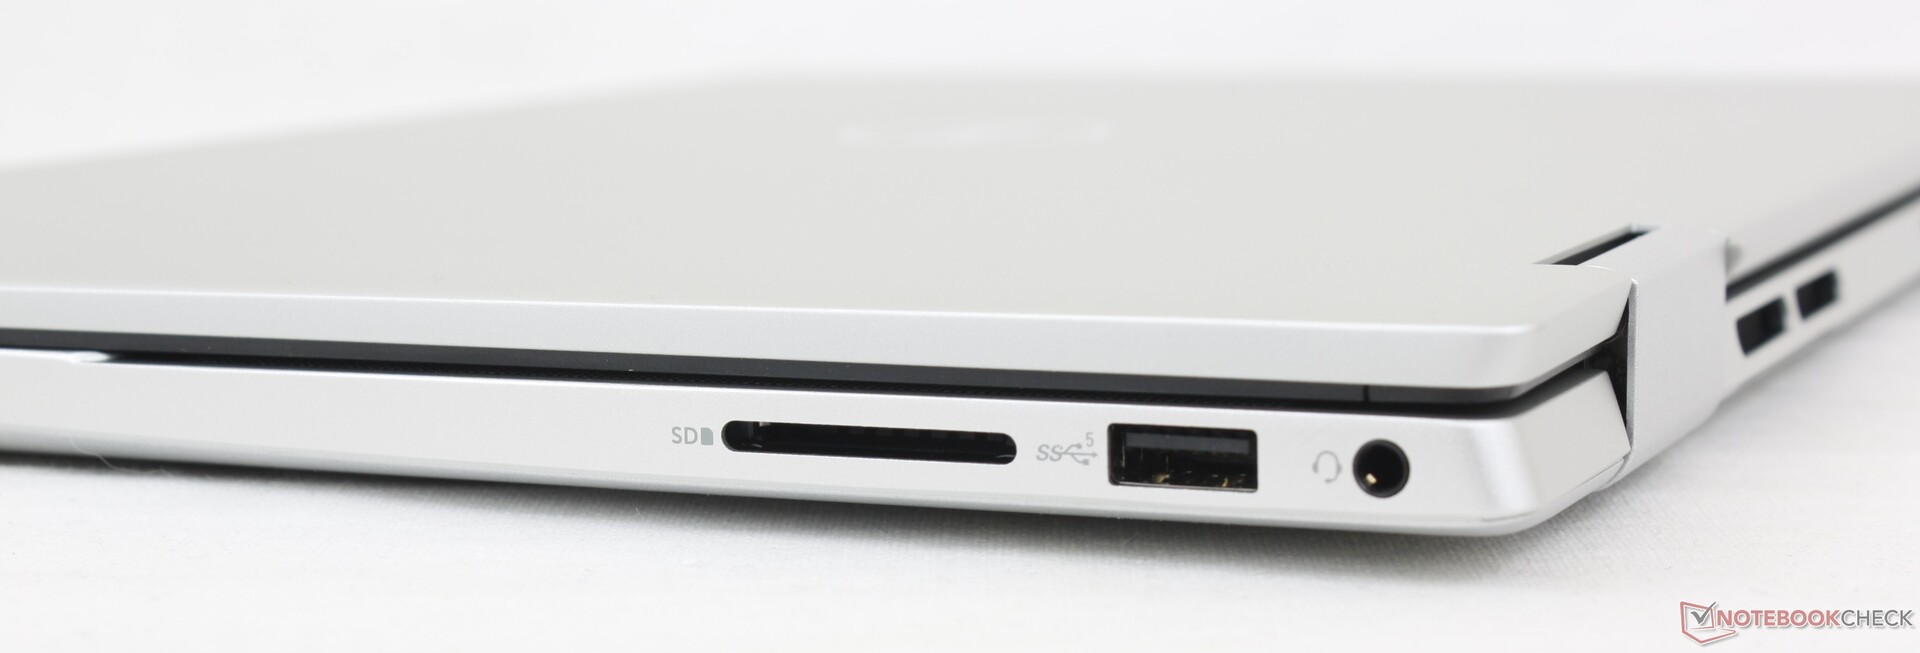
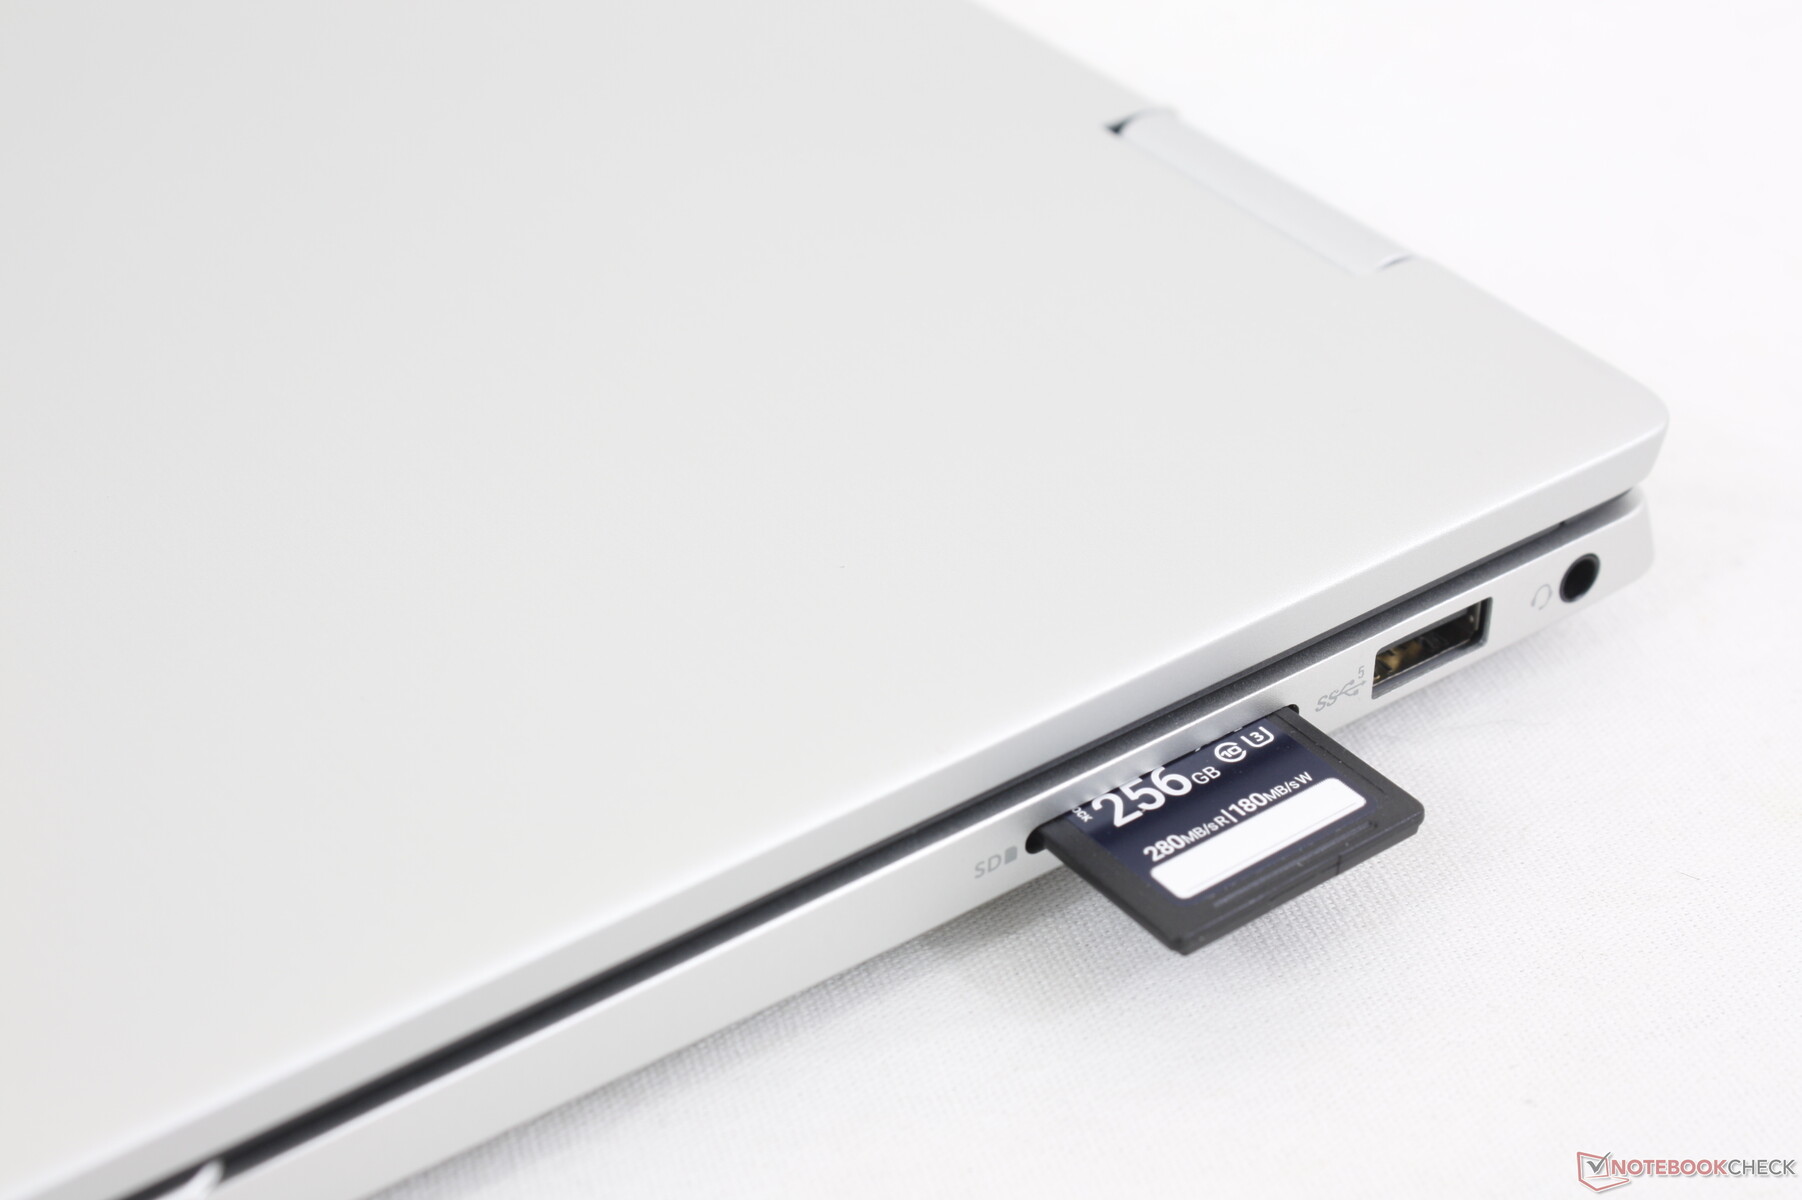
Leitor de cartão SD
As taxas de transferência do leitor de cartão SD integrado melhoraram ligeiramente de ~20 MB/s no Inspiron 7420 do ano passado para ~35 MB/s em nosso modelo mais recente. Mesmo assim, os leitores SD dos modelos concorrentes, como o IdeaPad Flex 7i ou Pavilion x360 14 são muito mais rápidos, mais de 2x.
| SD Card Reader | |
| average JPG Copy Test (av. of 3 runs) | |
| Lenovo IdeaPad Flex 7i 14IAU7 (Toshiba Exceria Pro SDXC 64 GB UHS-II) | |
| HP Pavilion x360 14-dy0157ng (Toshiba Exceria Pro M501 microSDXC 64GB) | |
| LG Gram 14T90P (AV Pro V60) | |
| Dell Inspiron 14 7435 2-in-1 (PNY EliteX-Pro60 V60 256 GB) | |
| Dell Inspiron 14 7420 2-in-1 (Toshiba Exceria Pro SDXC 64 GB UHS-II) | |
| maximum AS SSD Seq Read Test (1GB) | |
| Lenovo IdeaPad Flex 7i 14IAU7 (Toshiba Exceria Pro SDXC 64 GB UHS-II) | |
| LG Gram 14T90P (AV Pro V60) | |
| HP Pavilion x360 14-dy0157ng (Toshiba Exceria Pro M501 microSDXC 64GB) | |
| Dell Inspiron 14 7435 2-in-1 (PNY EliteX-Pro60 V60 256 GB) | |
| Dell Inspiron 14 7420 2-in-1 (Toshiba Exceria Pro SDXC 64 GB UHS-II) | |
Comunicação
Ficamos surpresos ao ver o suporte a Wi-Fi6E em nossa configuração básica. As taxas de transferência são estáveis quando emparelhadas com a rede Asus AXE11000 de 6 GHz, mas as taxas de recepção são definitivamente mais lentas do que o esperado, quase pela metade, em comparação com os notebooks com Intel AX211.
| Networking | |
| iperf3 transmit AX12 | |
| HP Pavilion x360 14-dy0157ng | |
| iperf3 receive AX12 | |
| HP Pavilion x360 14-dy0157ng | |
| iperf3 transmit AXE11000 | |
| Acer Aspire 5 Spin 14 | |
| Dell Inspiron 14 7435 2-in-1 | |
| Lenovo IdeaPad Flex 7i 14IAU7 | |
| LG Gram 14T90P | |
| iperf3 receive AXE11000 | |
| Acer Aspire 5 Spin 14 | |
| LG Gram 14T90P | |
| Lenovo IdeaPad Flex 7i 14IAU7 | |
| Dell Inspiron 14 7435 2-in-1 | |
| iperf3 transmit AXE11000 6GHz | |
| Dell Inspiron 14 7435 2-in-1 | |
| Acer Aspire 5 Spin 14 | |
| Lenovo IdeaPad Flex 7i 14IAU7 | |
| Dell Inspiron 14 7420 2-in-1 | |
| iperf3 receive AXE11000 6GHz | |
| Acer Aspire 5 Spin 14 | |
| Dell Inspiron 14 7420 2-in-1 | |
| Lenovo IdeaPad Flex 7i 14IAU7 | |
| Dell Inspiron 14 7435 2-in-1 | |
Webcam
A Dell não fez nenhuma alteração na webcam de 2 MP ou 1080p. Um obturador de privacidade está incluído, enquanto o IR continua sendo omitido para economizar nos custos.


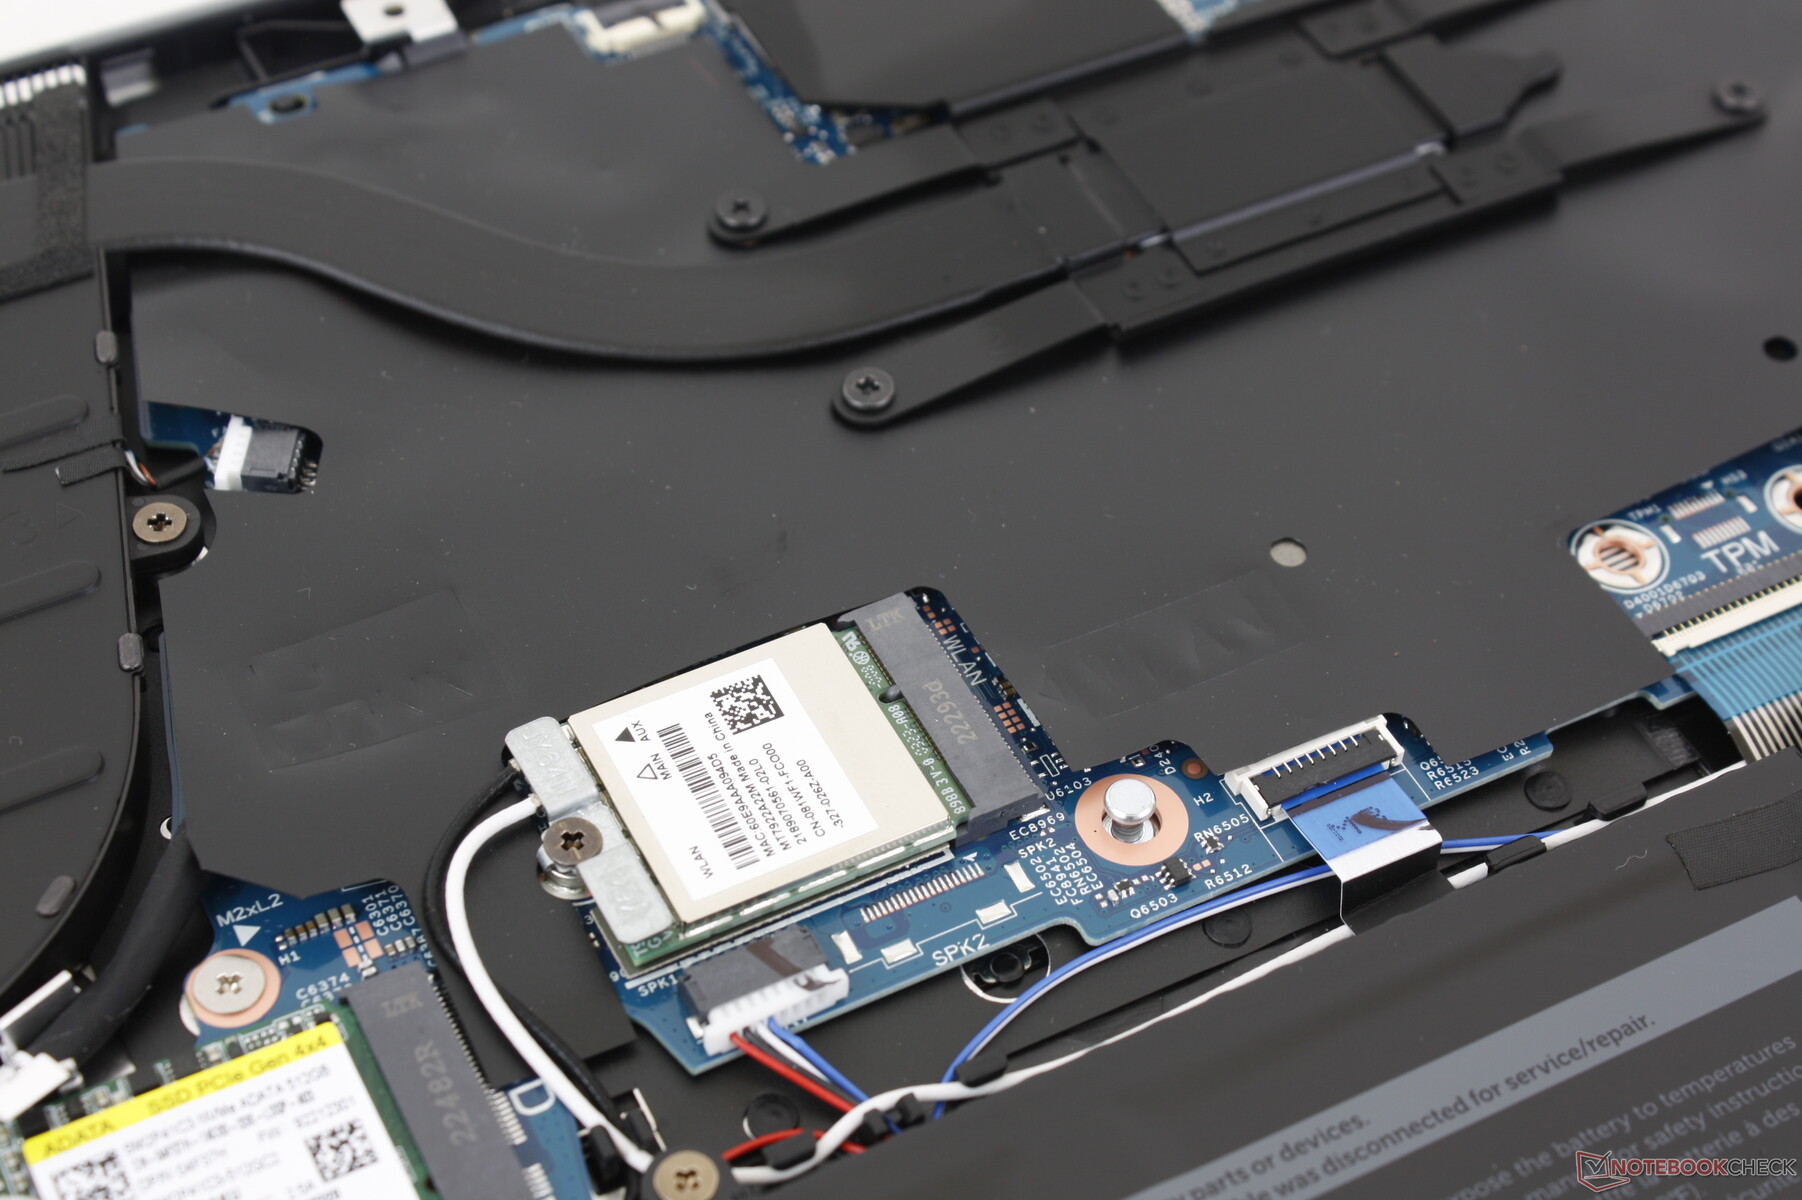
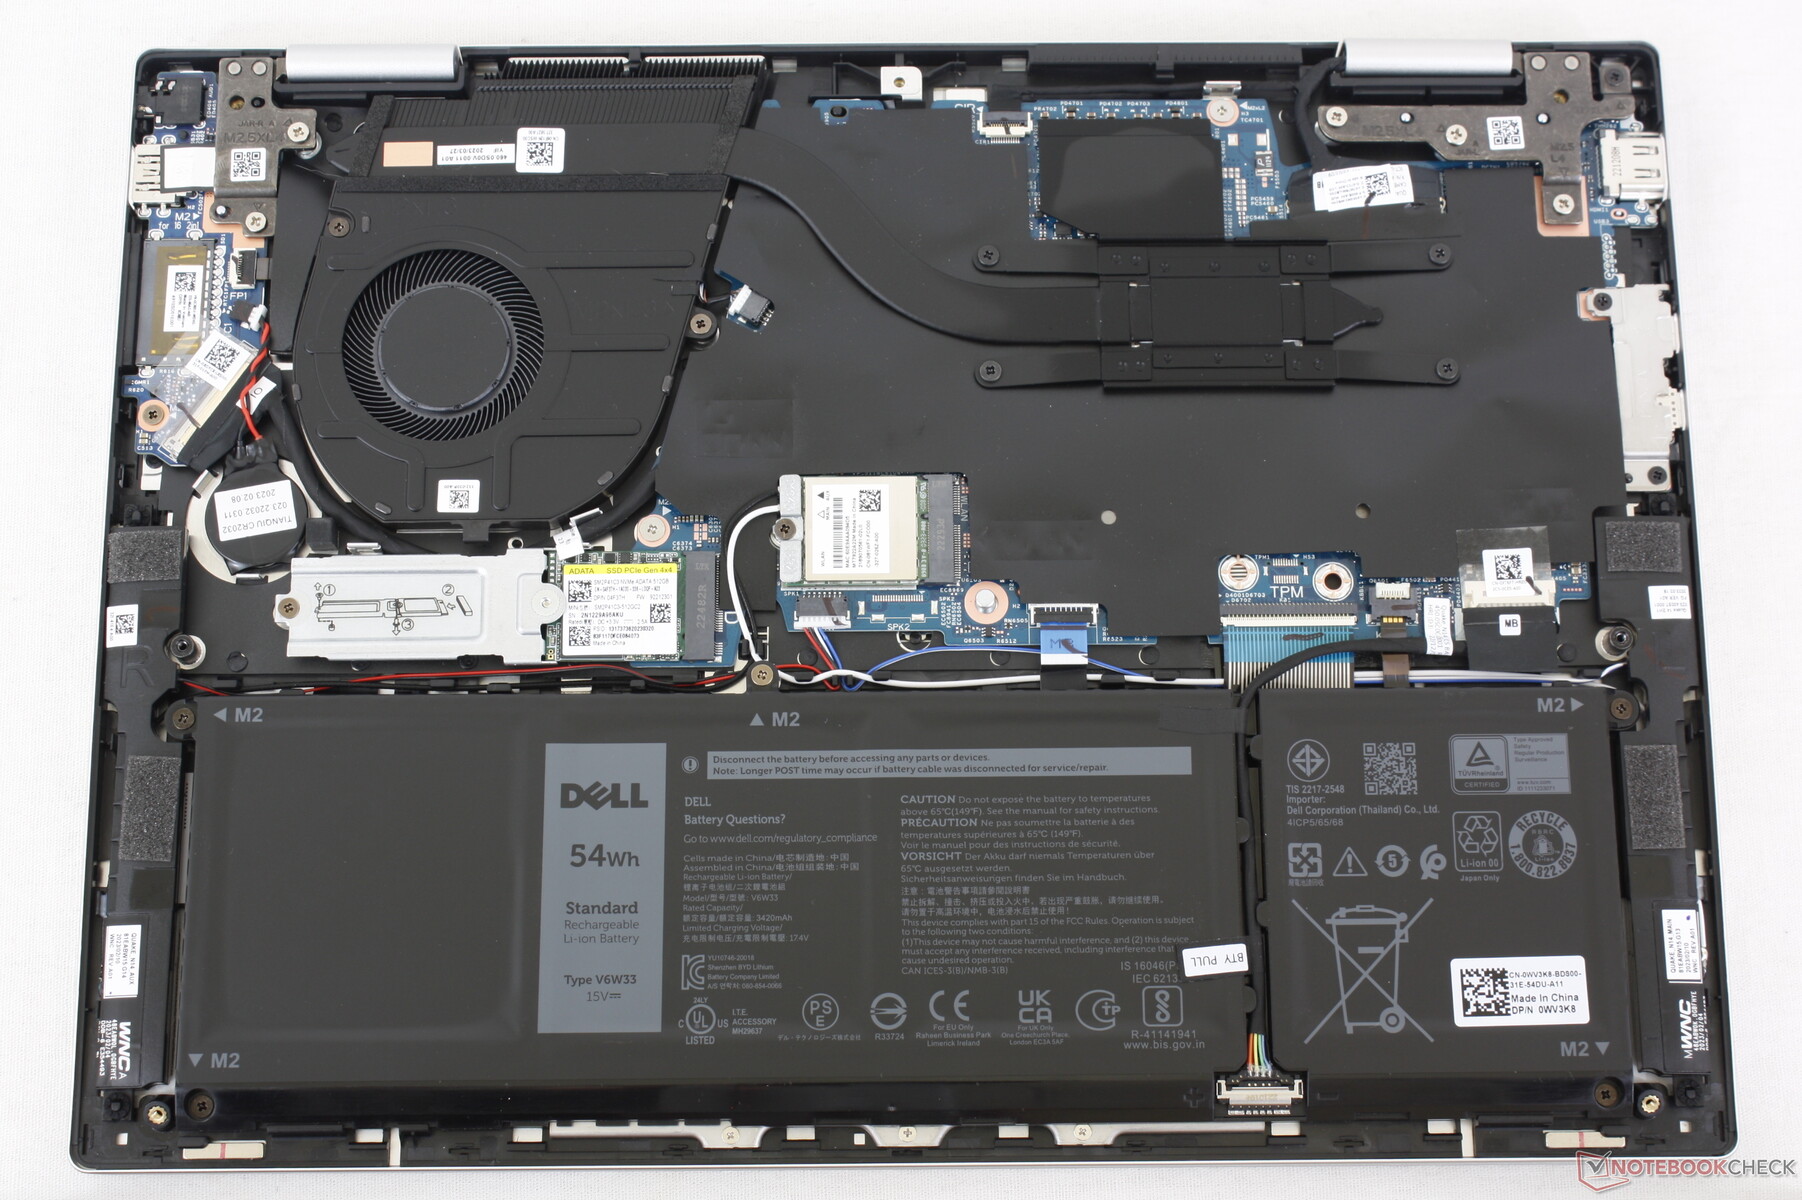
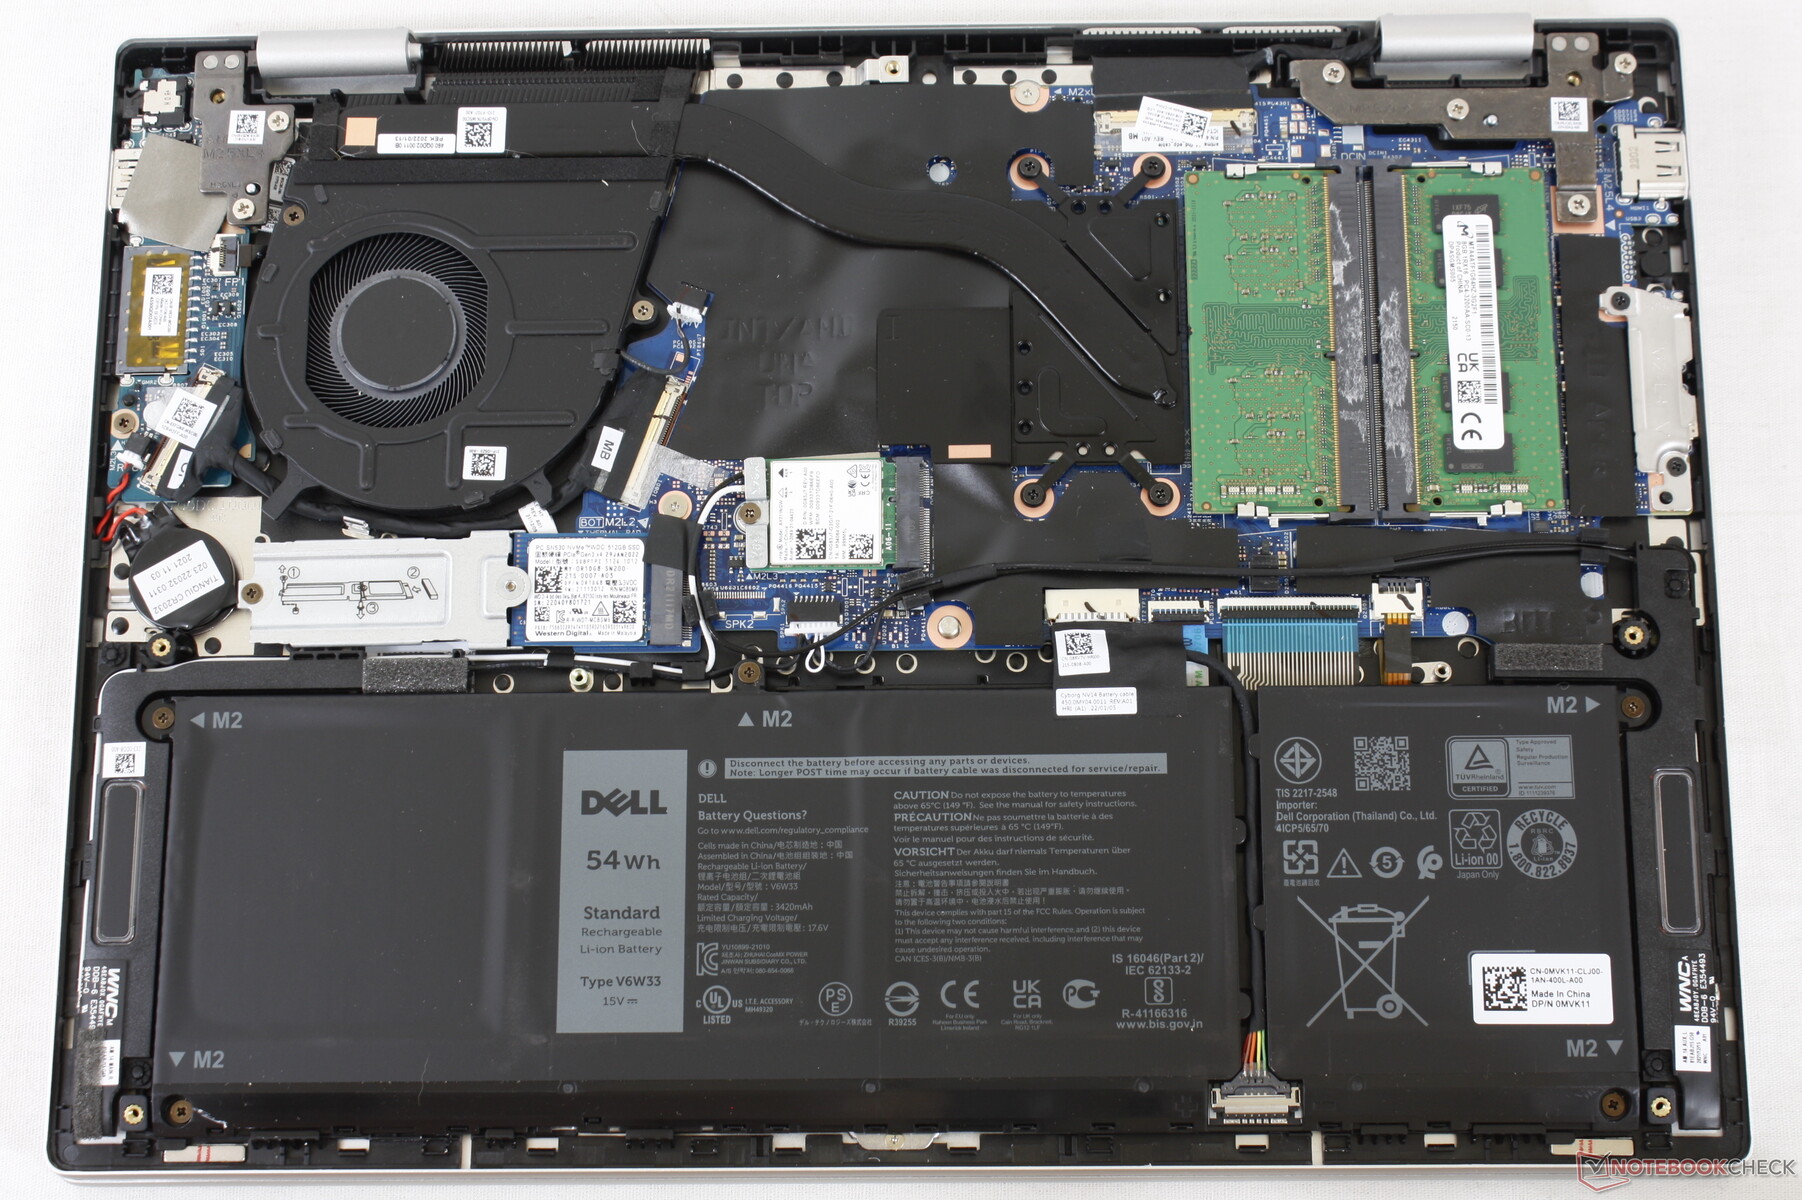
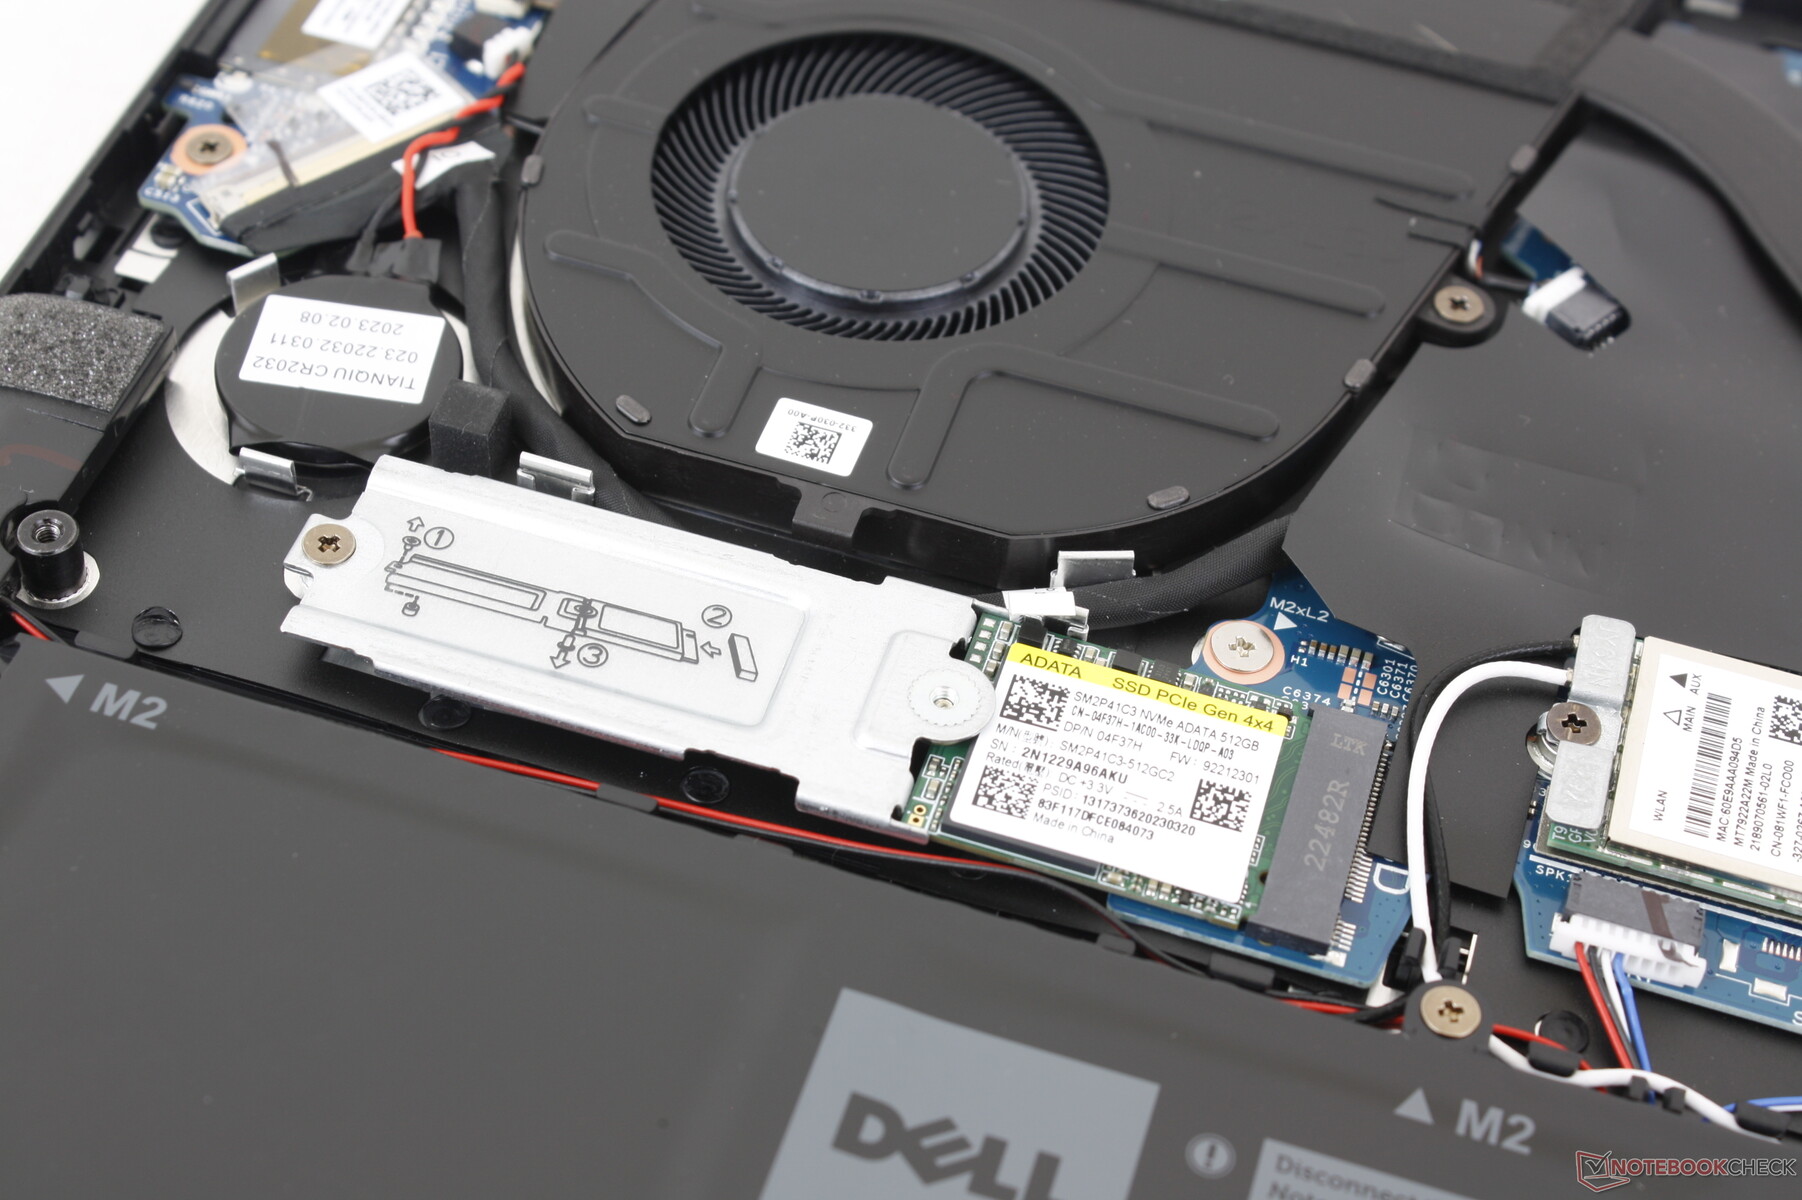
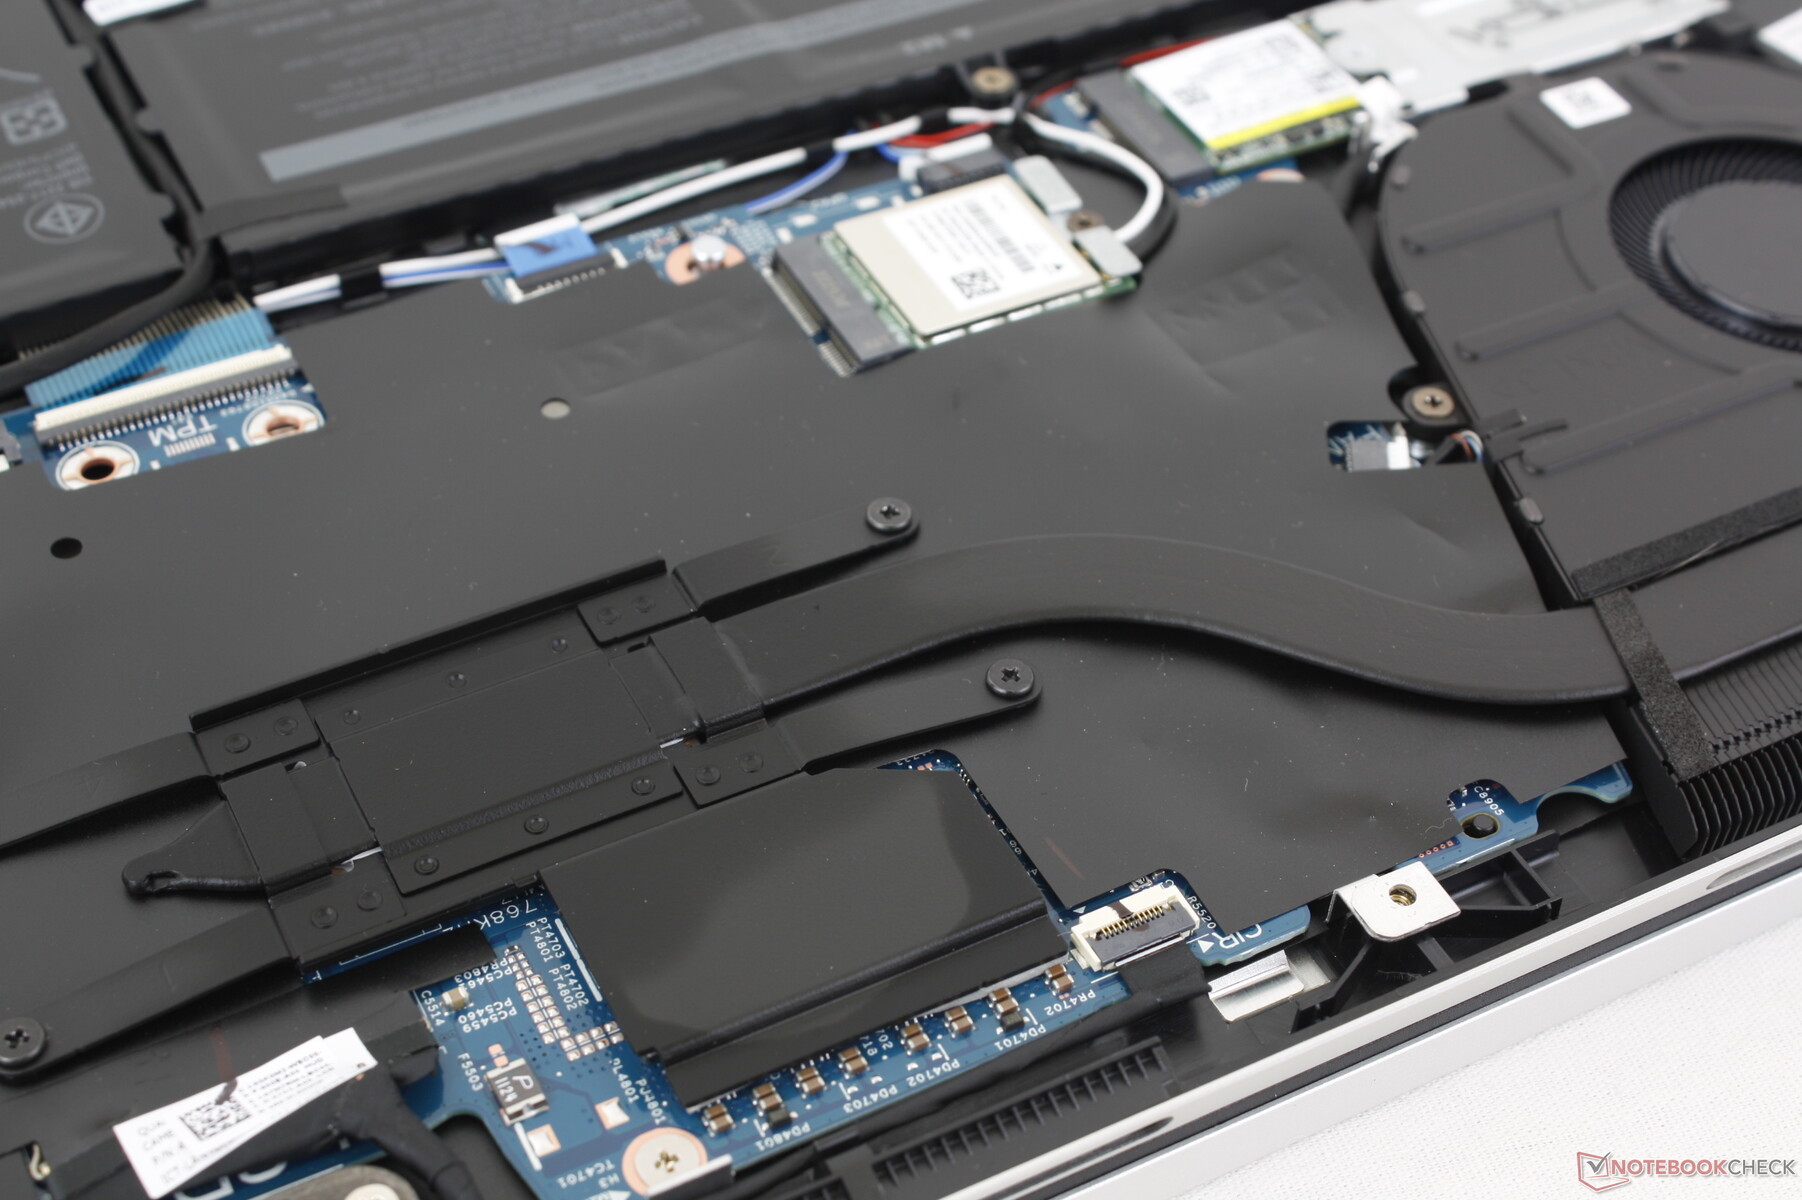
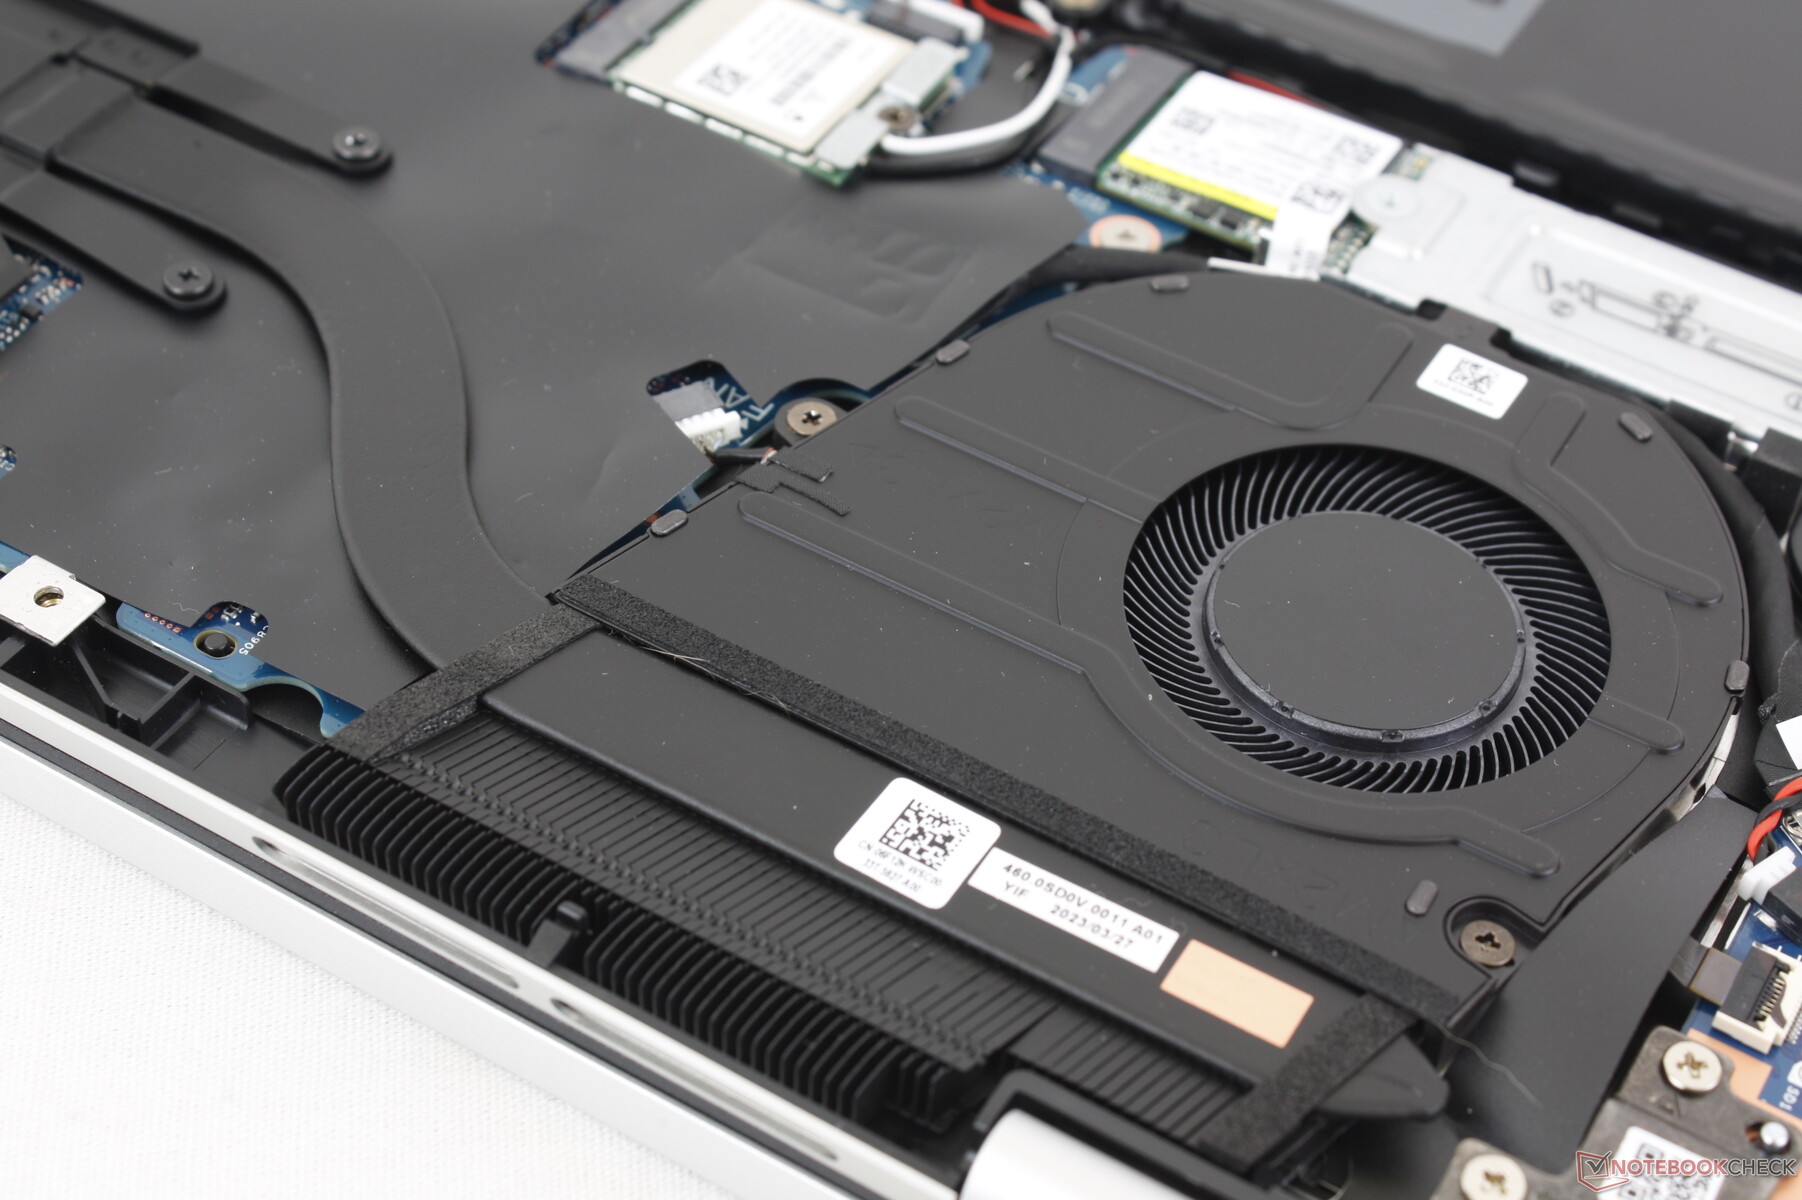
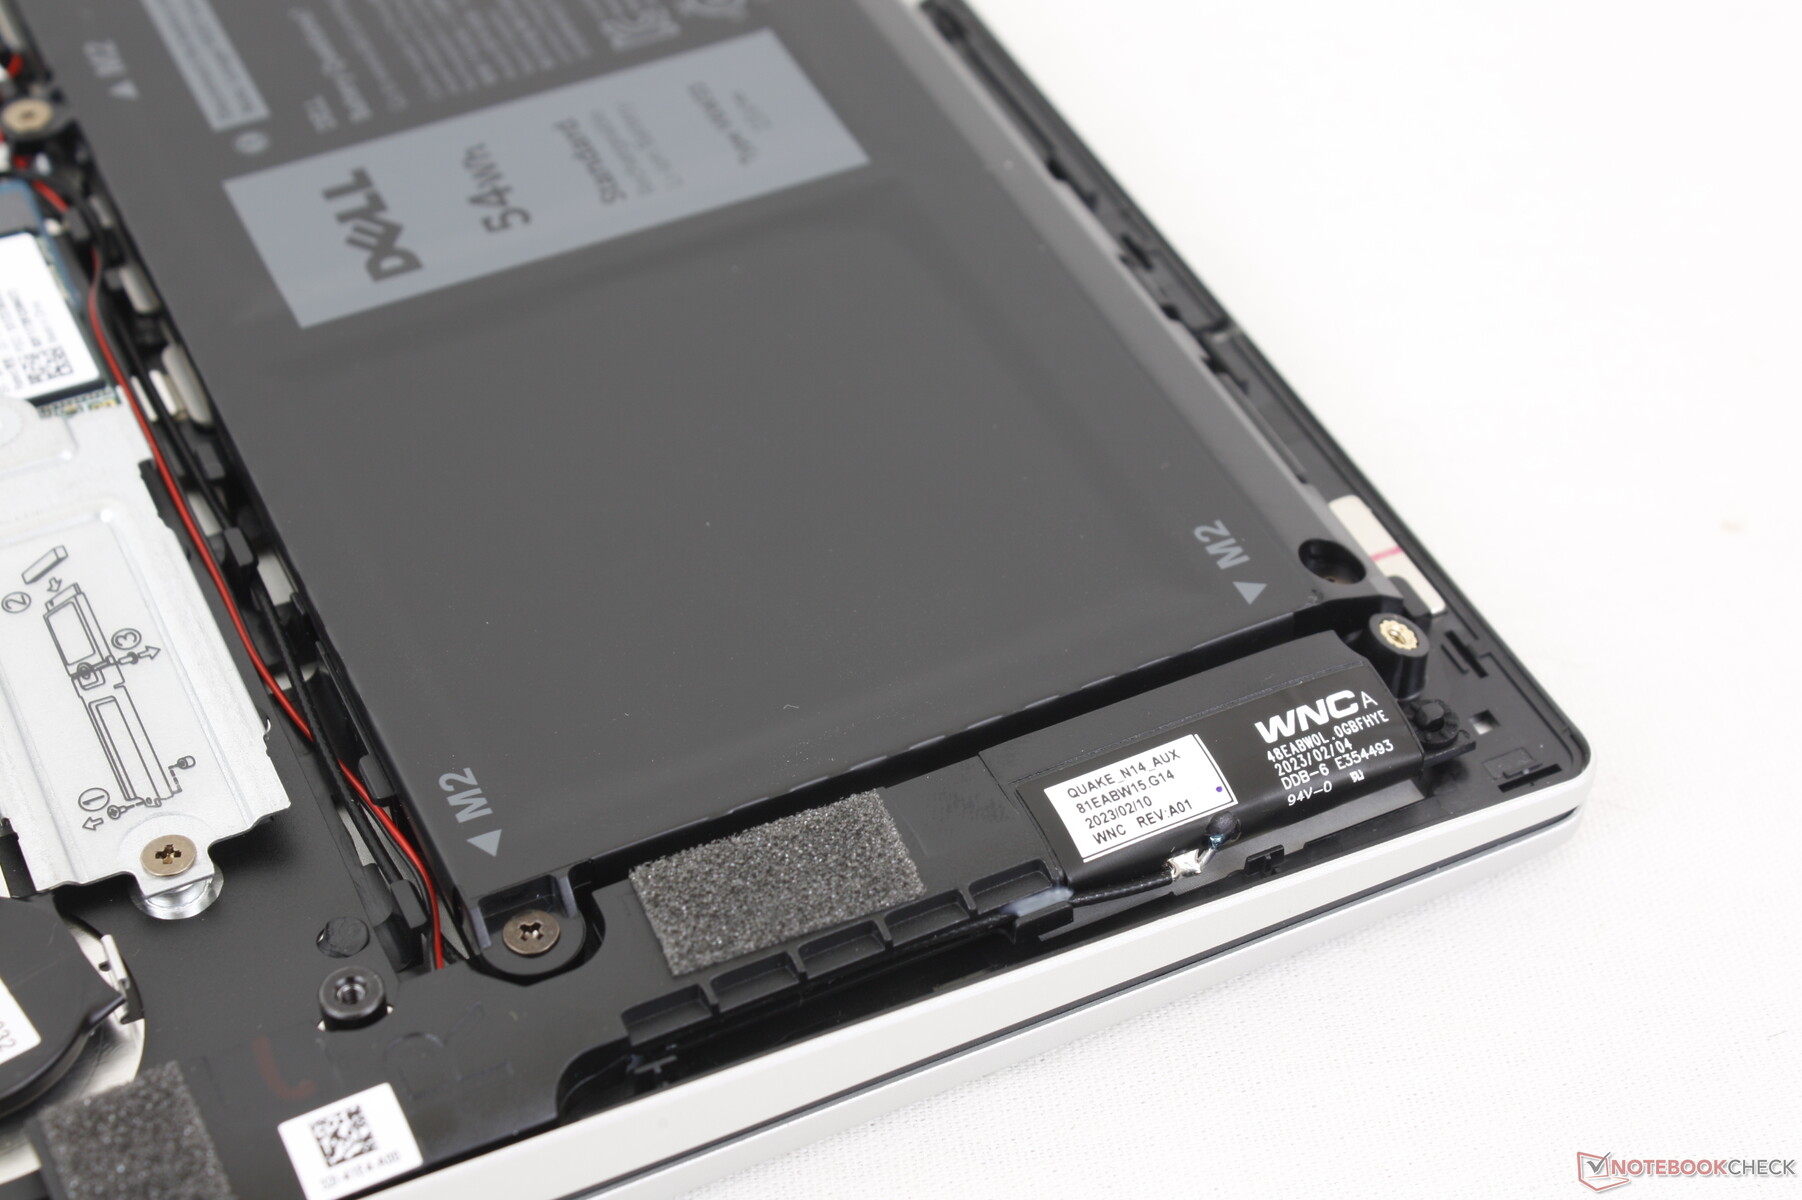
Manutenção
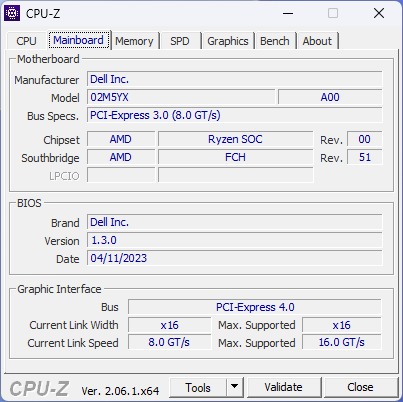
A Dell fez uma alteração importante na placa-mãe em comparação com o design do ano passado: A RAM agora é soldada em vez de encaixada, conforme mostrado nas imagens abaixo. Embora seja lamentável ver isso, a RAM soldada é comum em outros conversíveis econômicos, como o IdeaPad Flex 7 ou oAcer Aspire 5 Spin 14.
Acessórios e garantia
Não há extras na caixa além do adaptador CA e da documentação. Aplica-se a garantia limitada de um ano do fabricante.
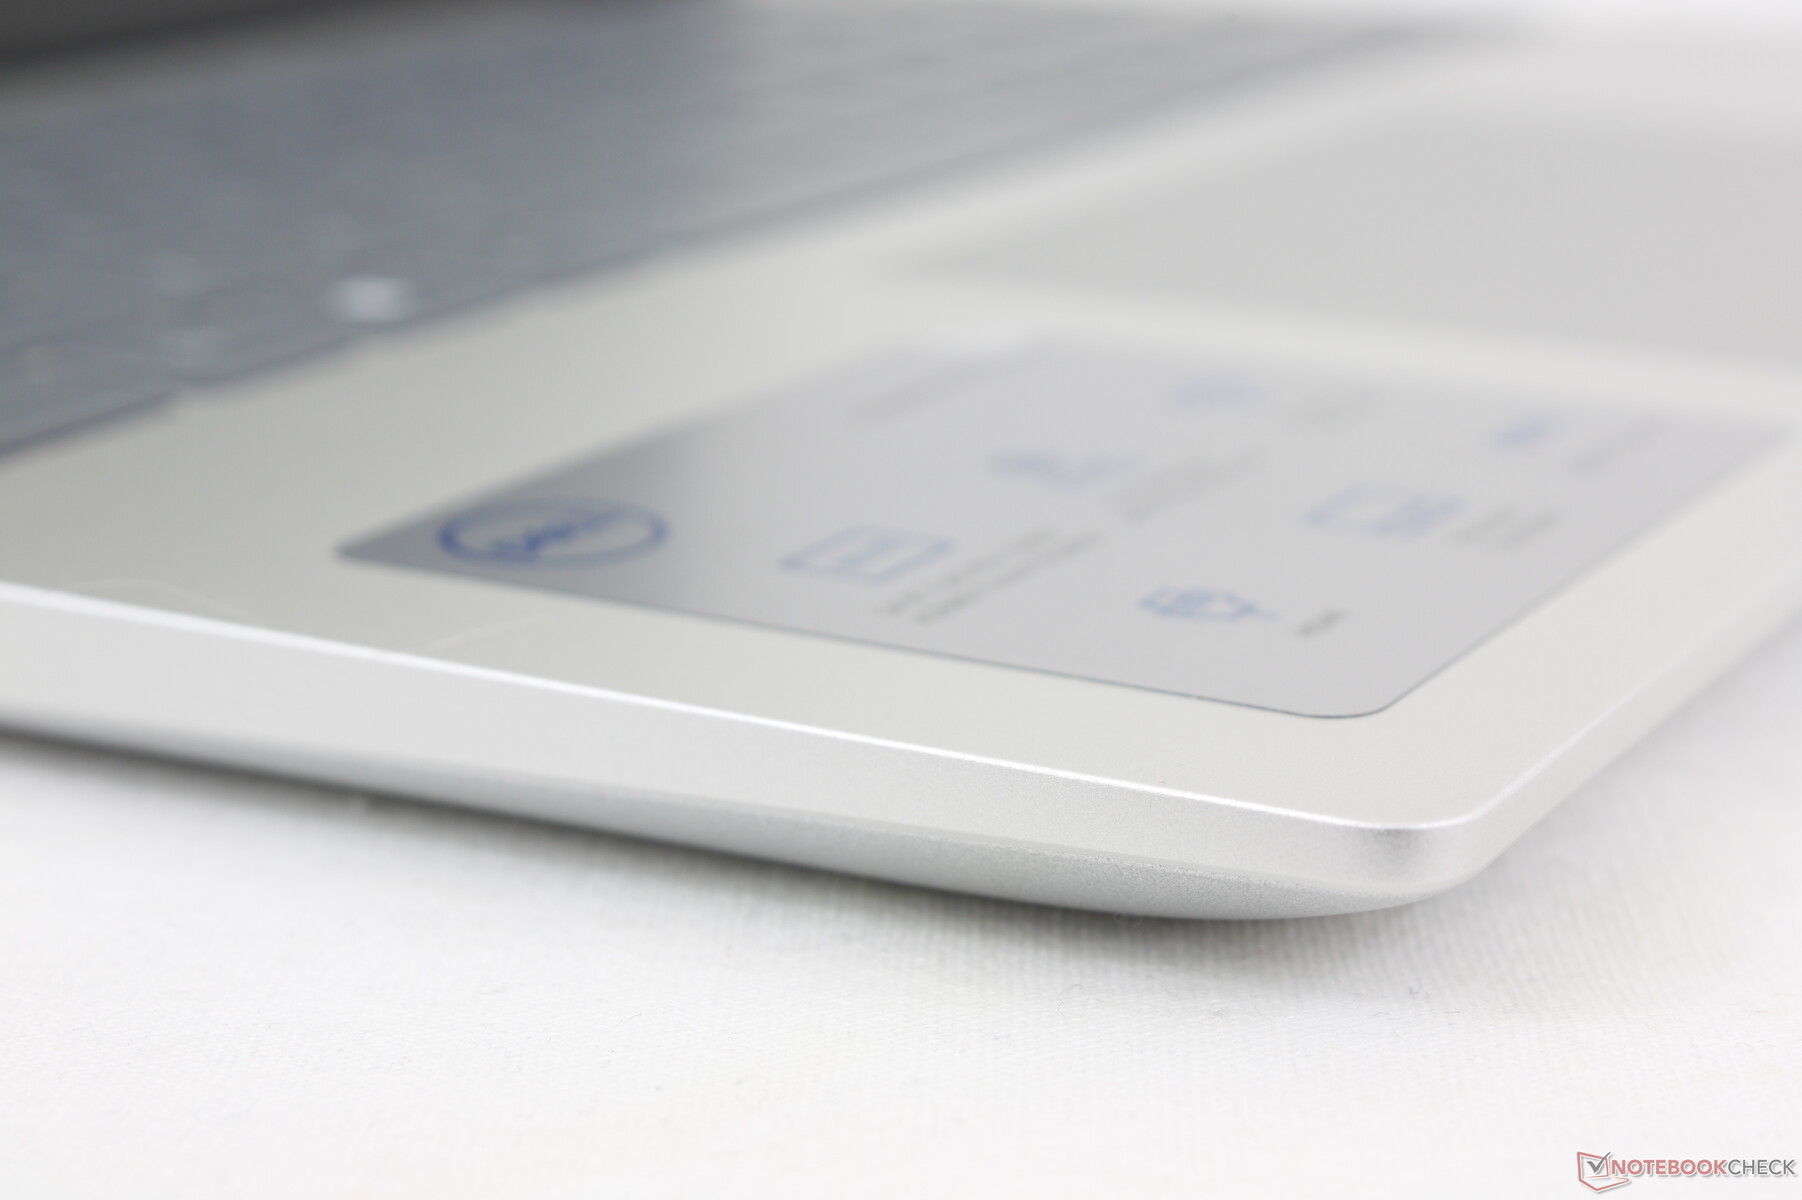
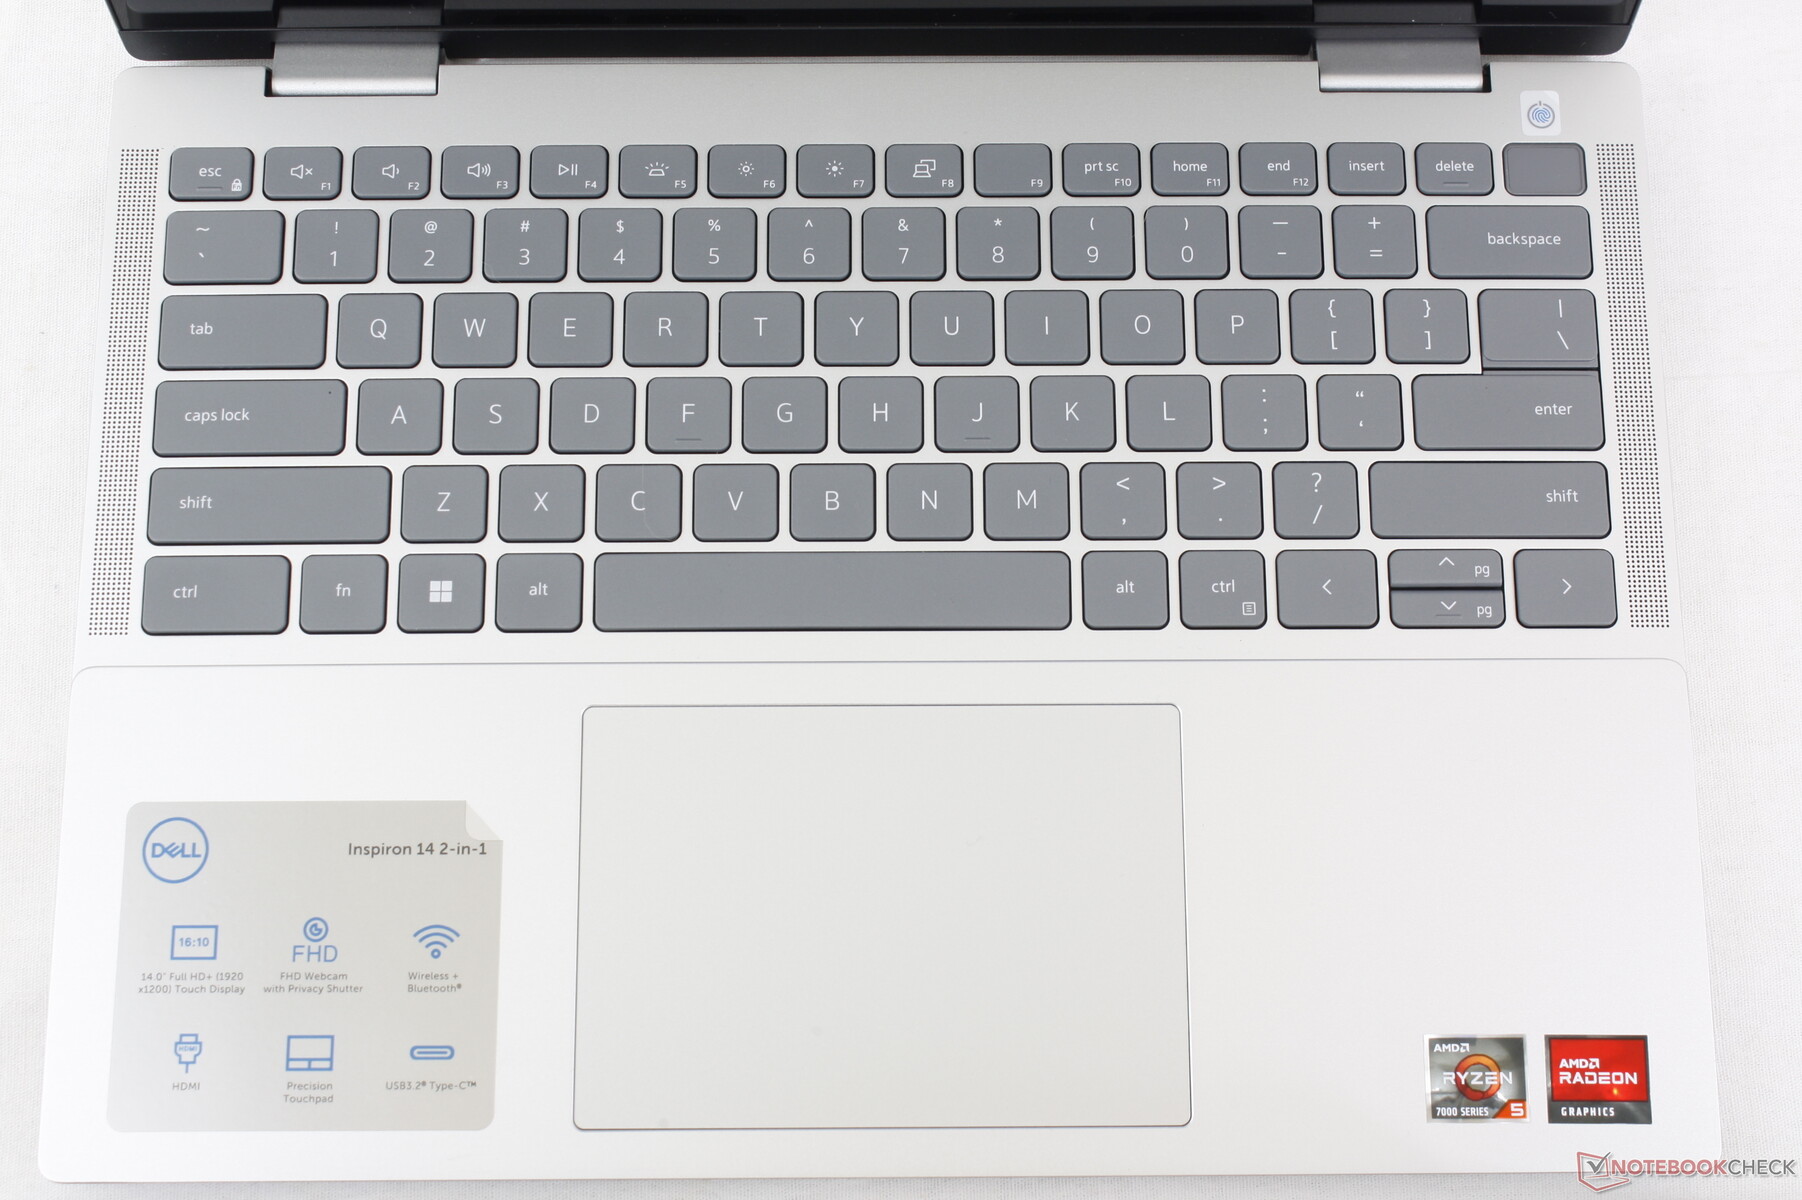
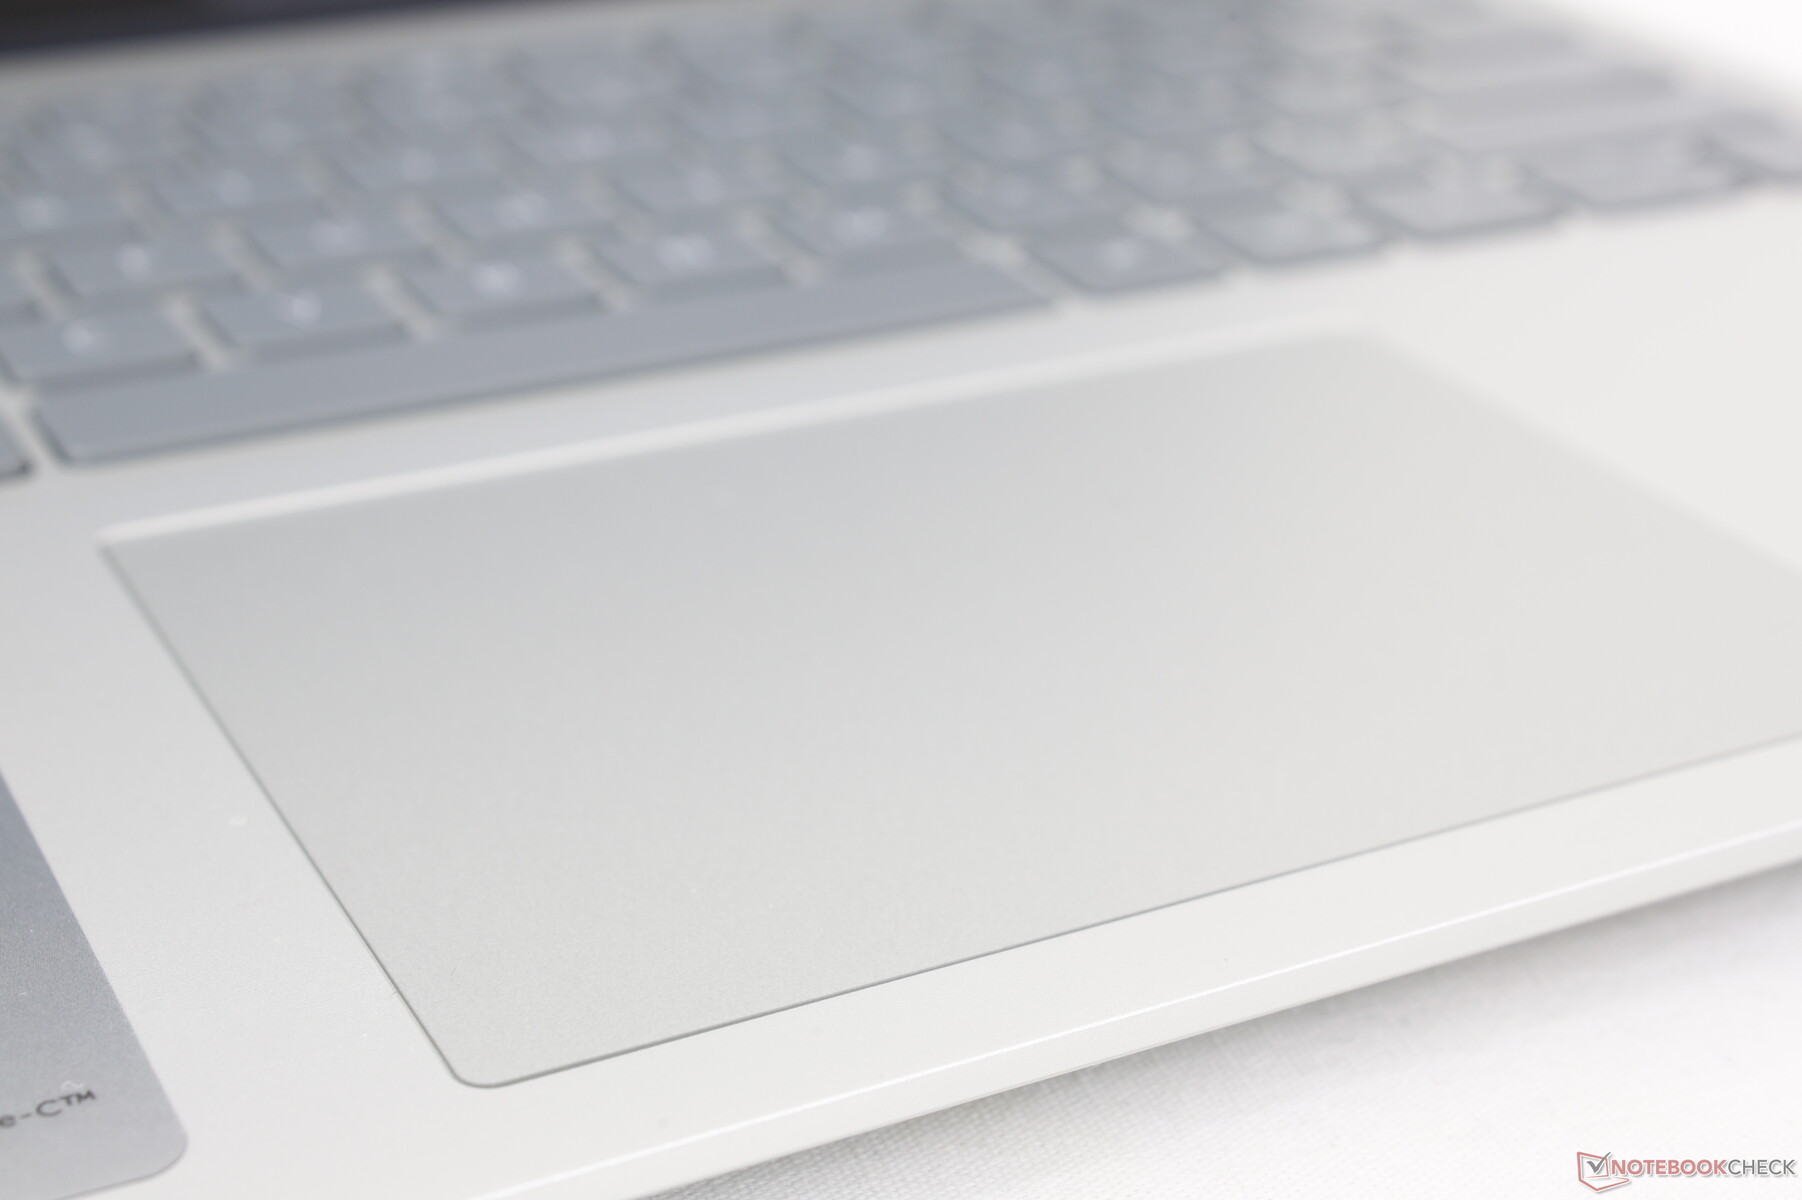
Dispositivos de entrada - Chega de Mylar
Teclado e touchpad
Embora a experiência de digitação no teclado permaneça a mesma do Inspiron 14 7420do ano passado, o design do clickpad foi alterado devido à remoção da camada Mylar. Ele agora tem uma aparência mais tradicional, mantendo a área de superfície original de 11,5 x 8 cm. Infelizmente, o feedback ao clicar não melhorou, pois ainda parece esponjoso e um pouco raso demais.

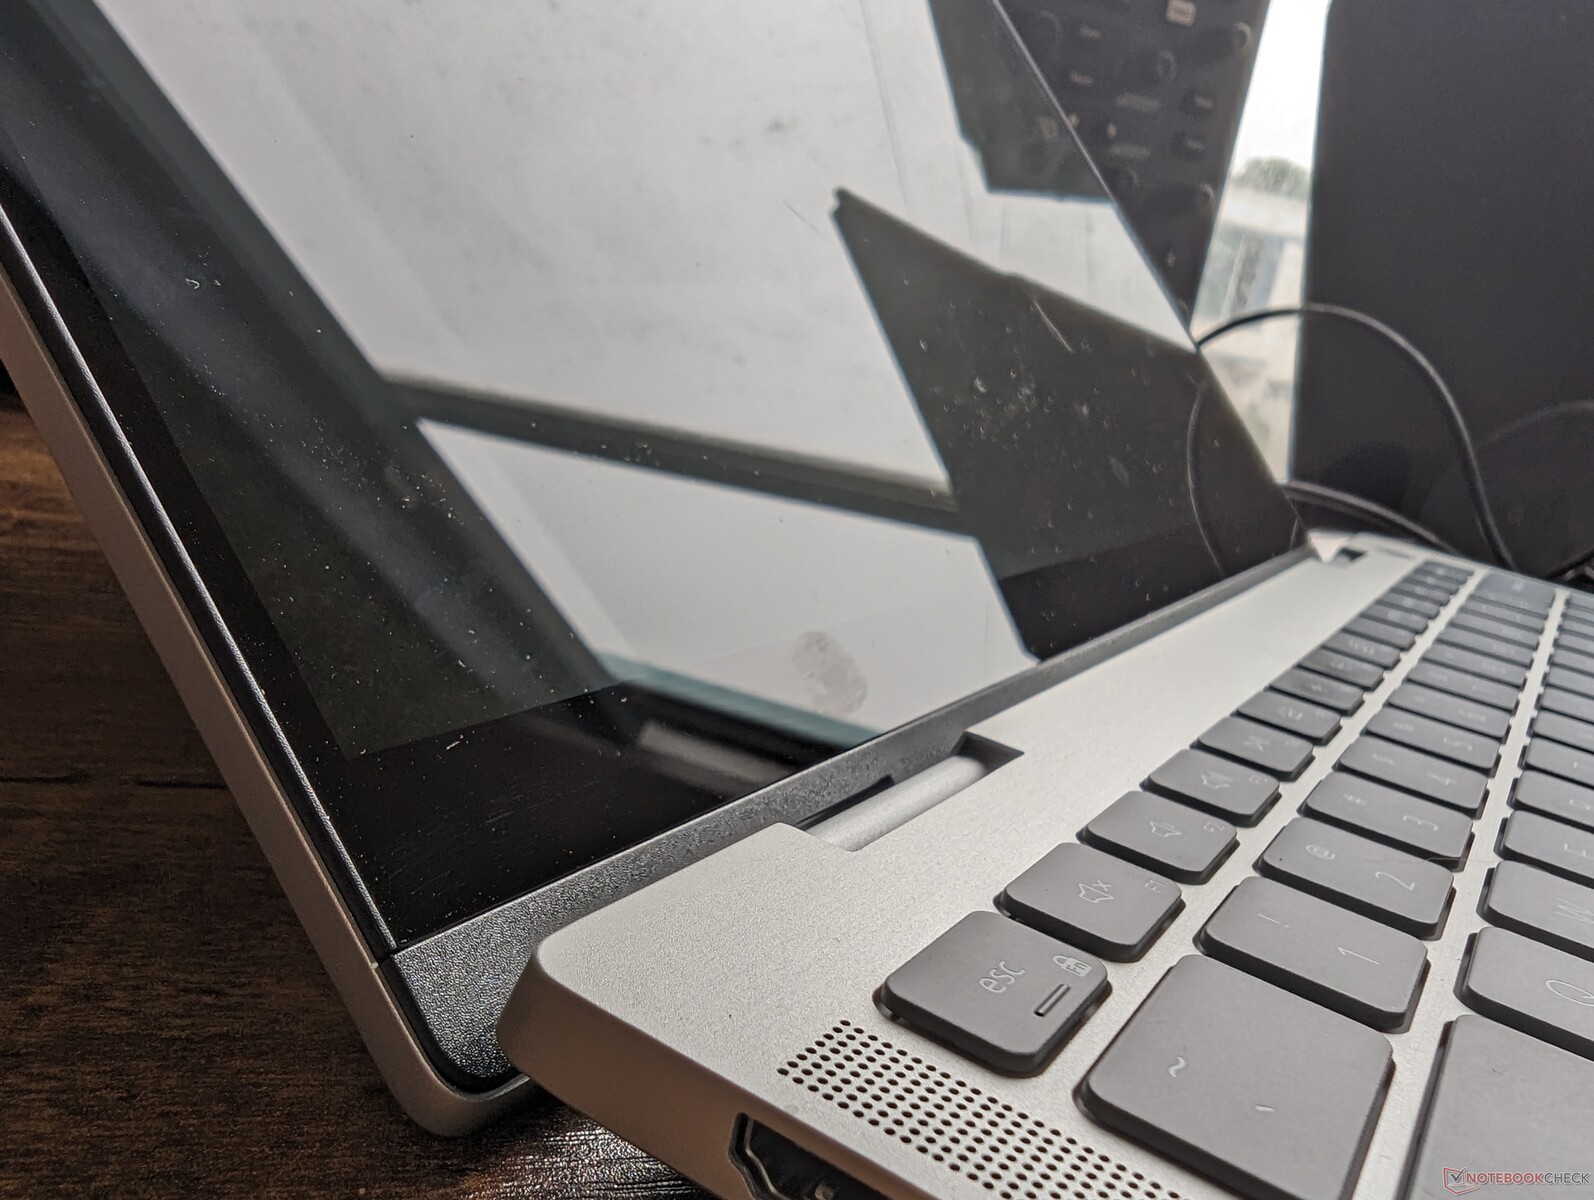
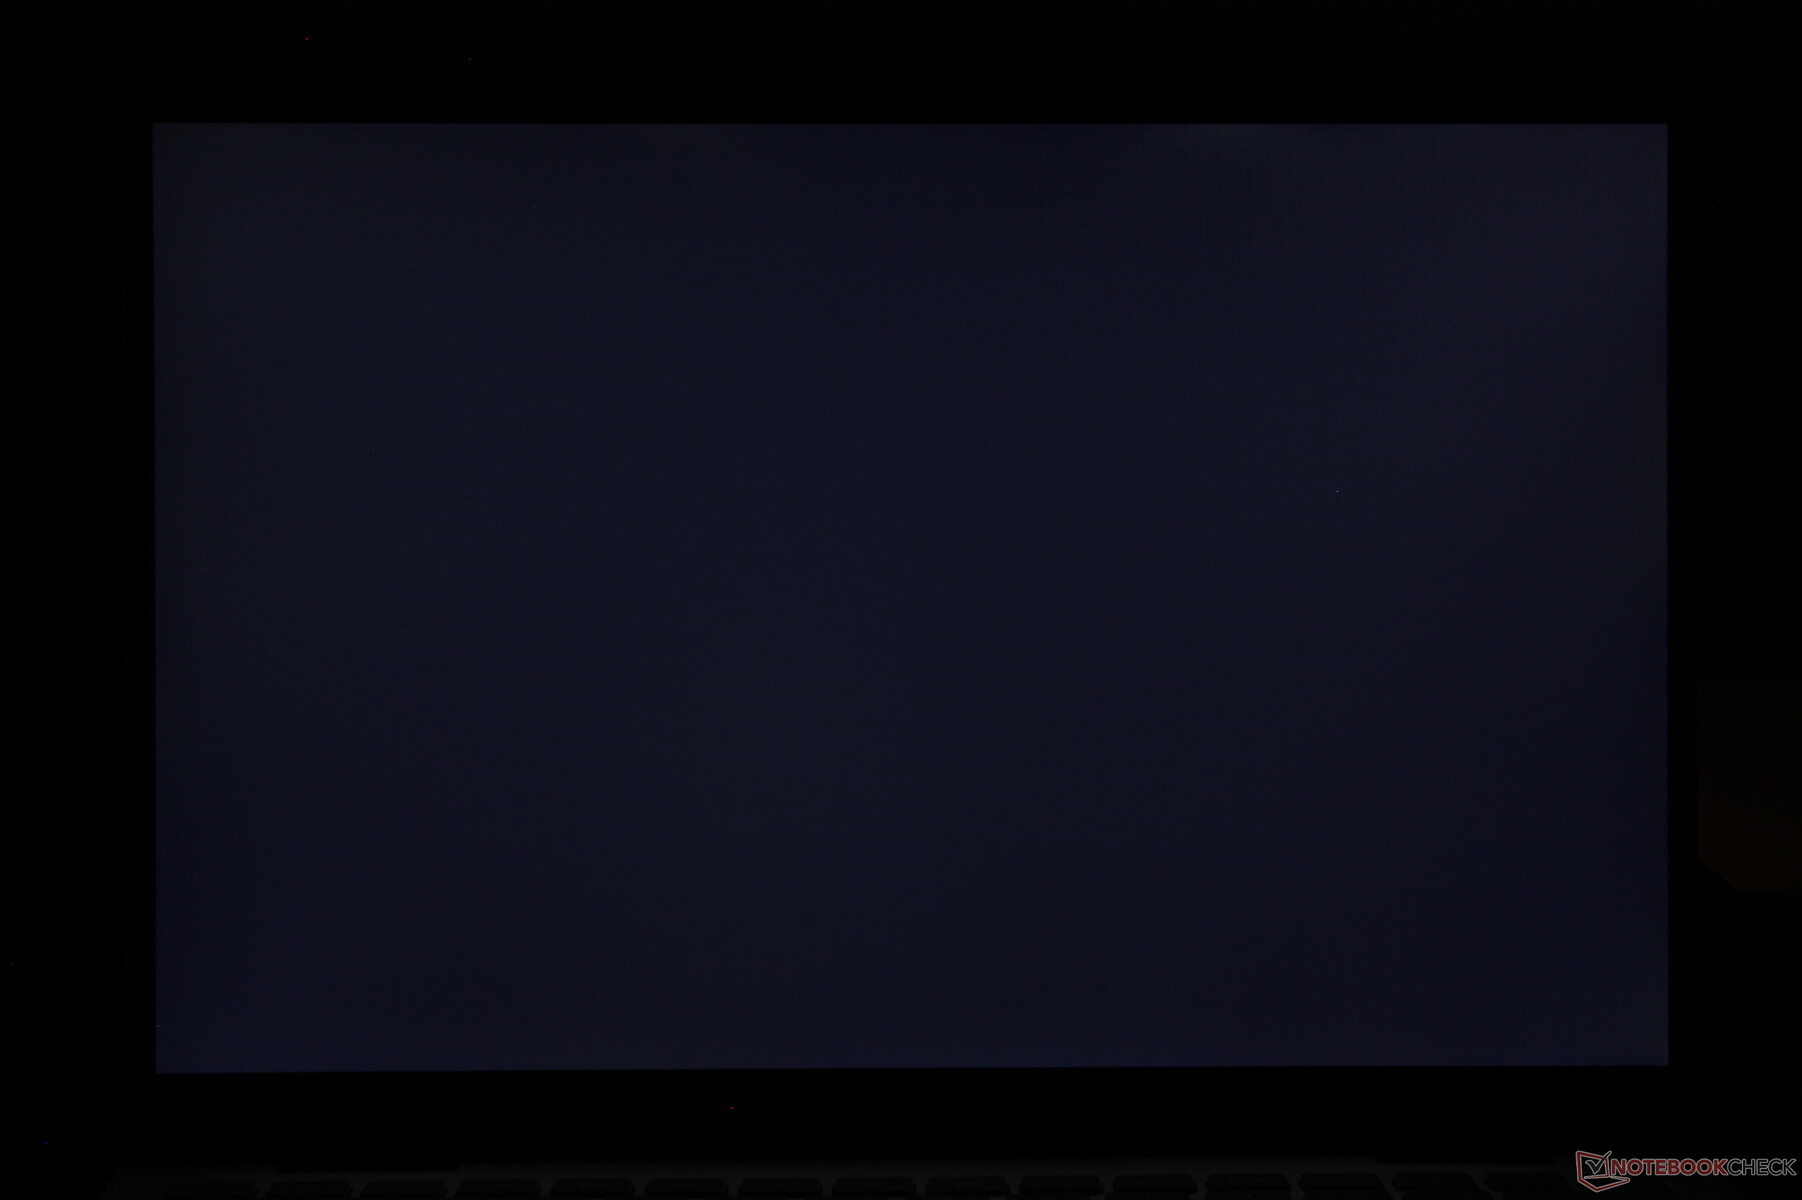
Tela - 60 Hz, 45% NTSC, 1200p, 16:10
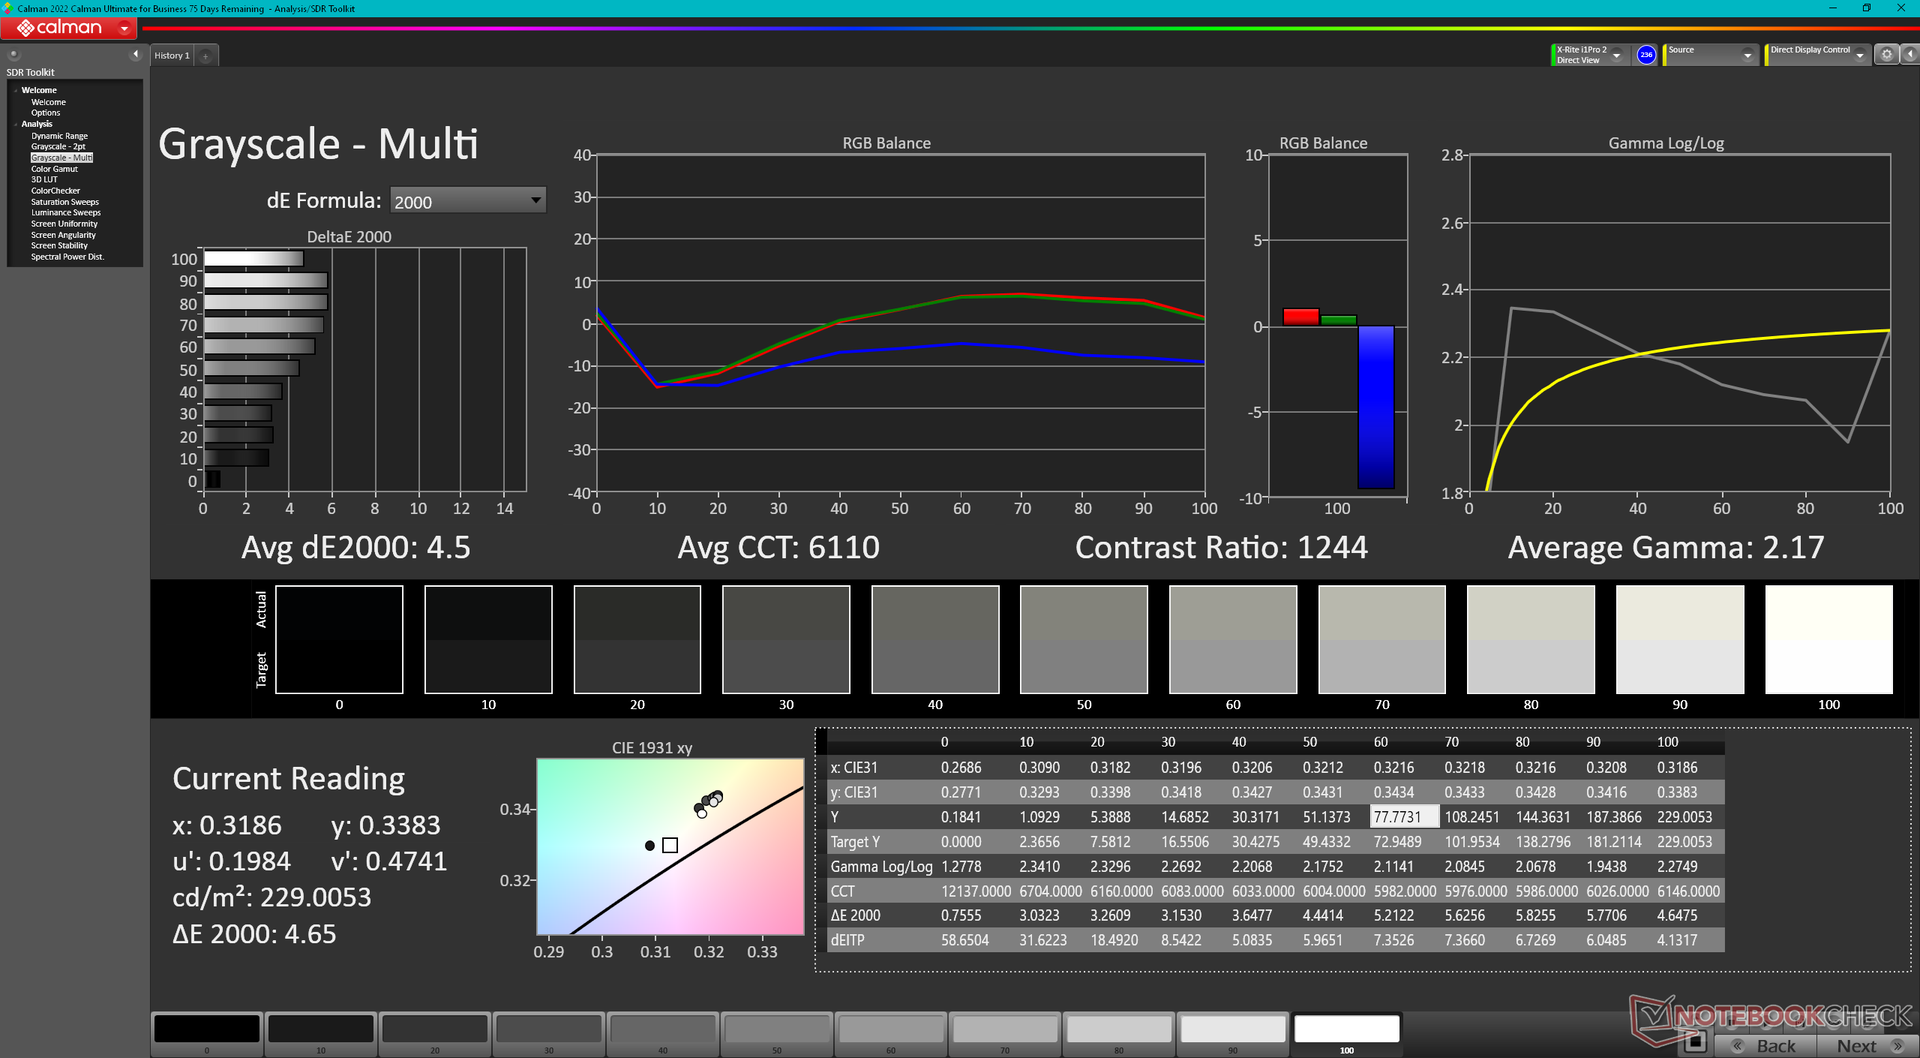
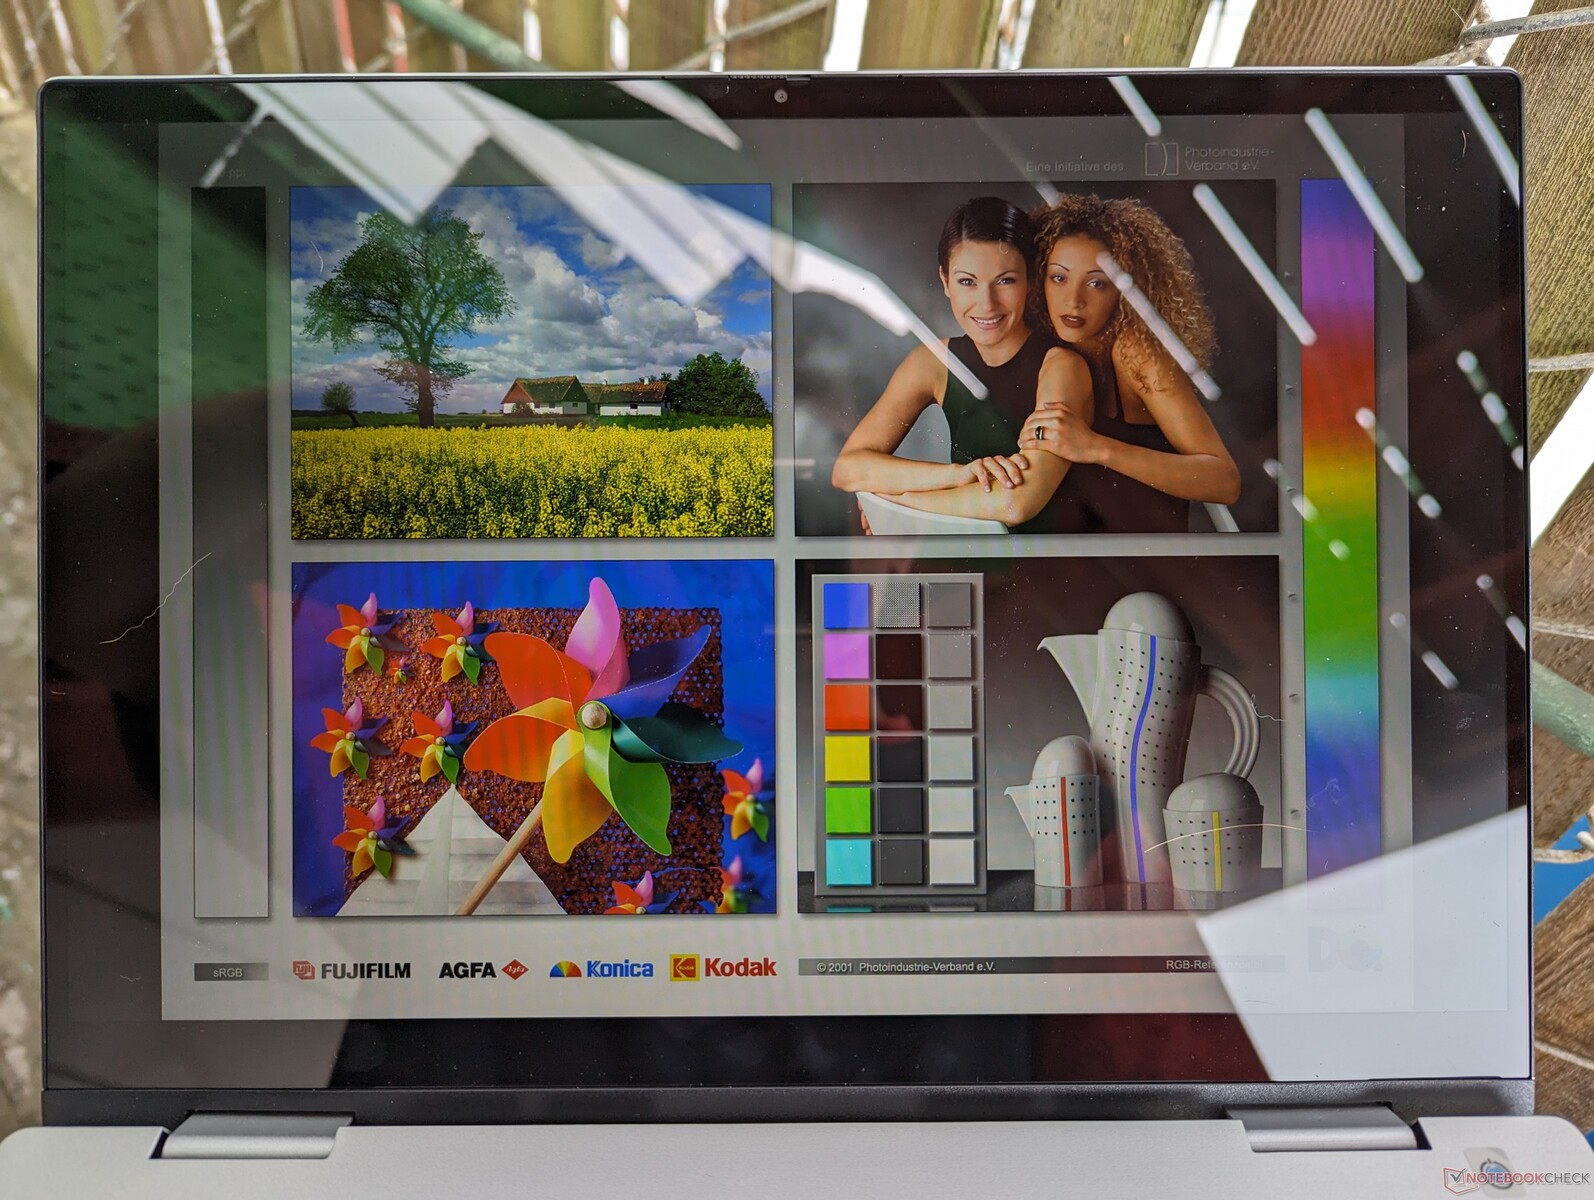
O modelo deste ano vem com o painel IPS LG Philips 140WU2 para substituir o painel BOE NV14N42 do Inspiron 14 9420 2 em 1 do ano passado. Os principais atributos são praticamente idênticos para uma experiência de visualização semelhante entre eles. A faixa de cores estreita, os tempos de resposta médios e a taxa de contraste medíocre são comuns nessa faixa de preço específica.
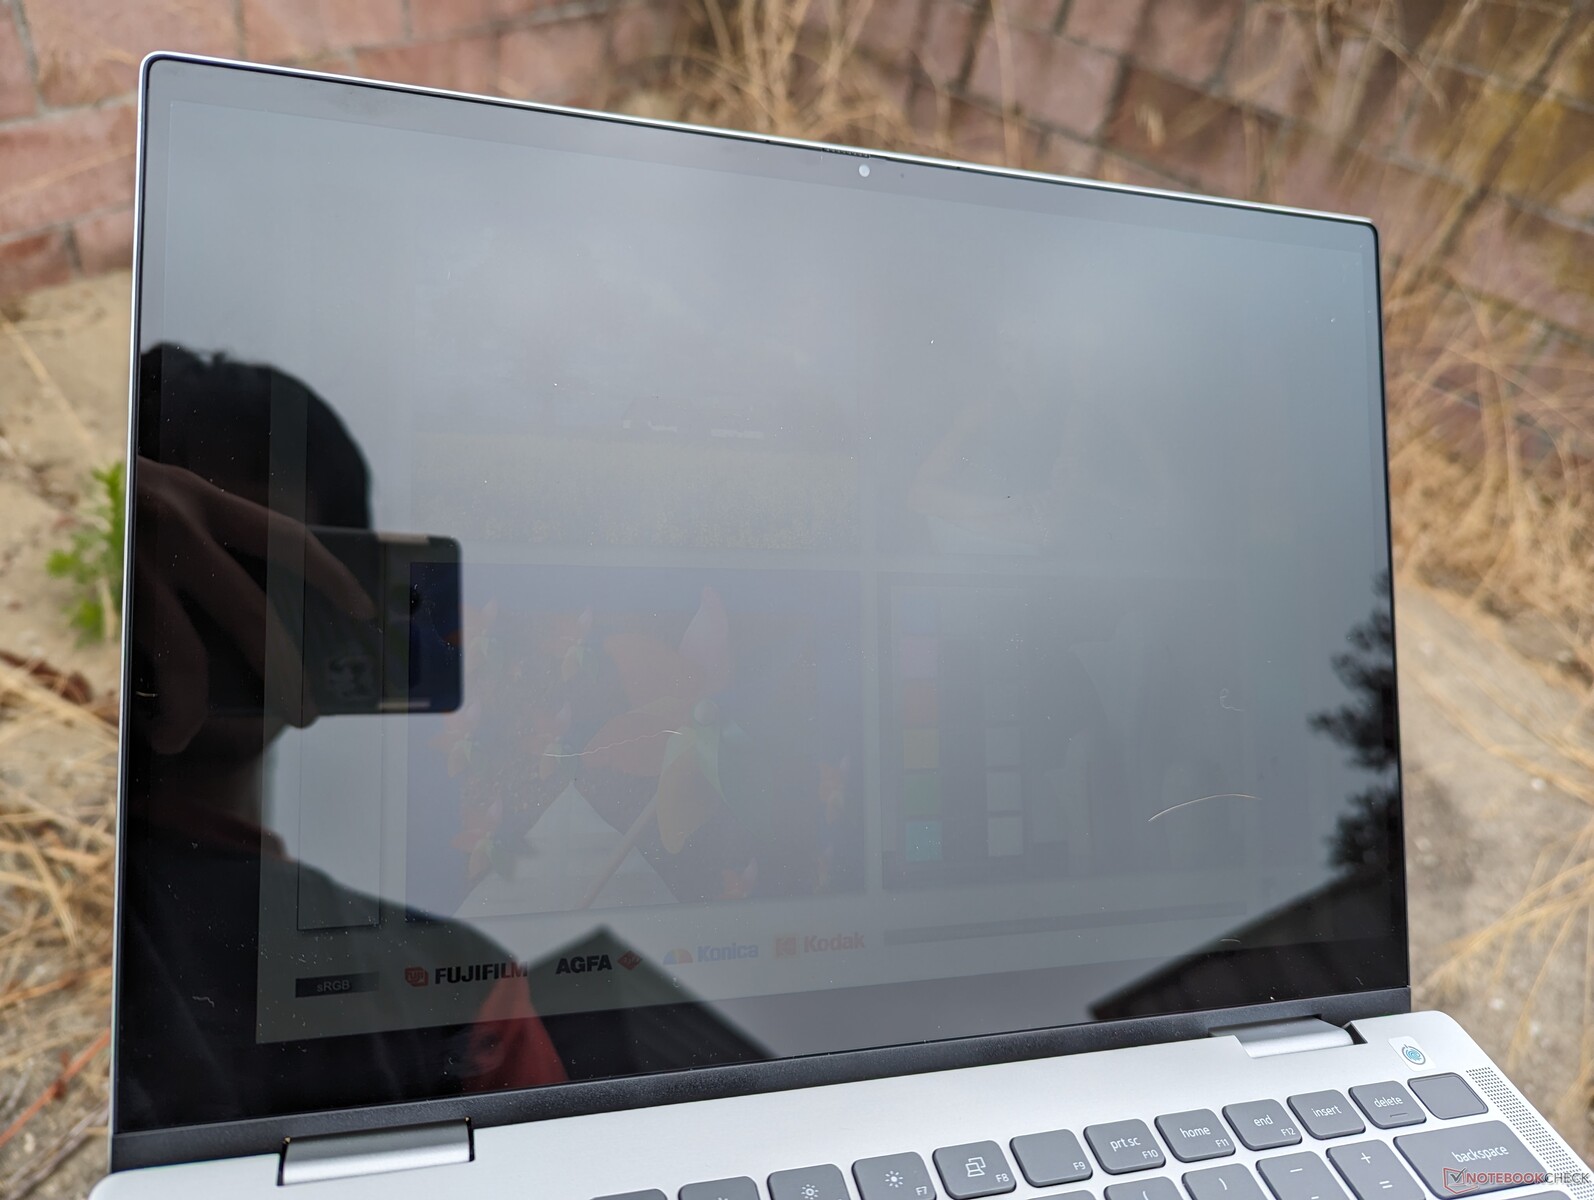
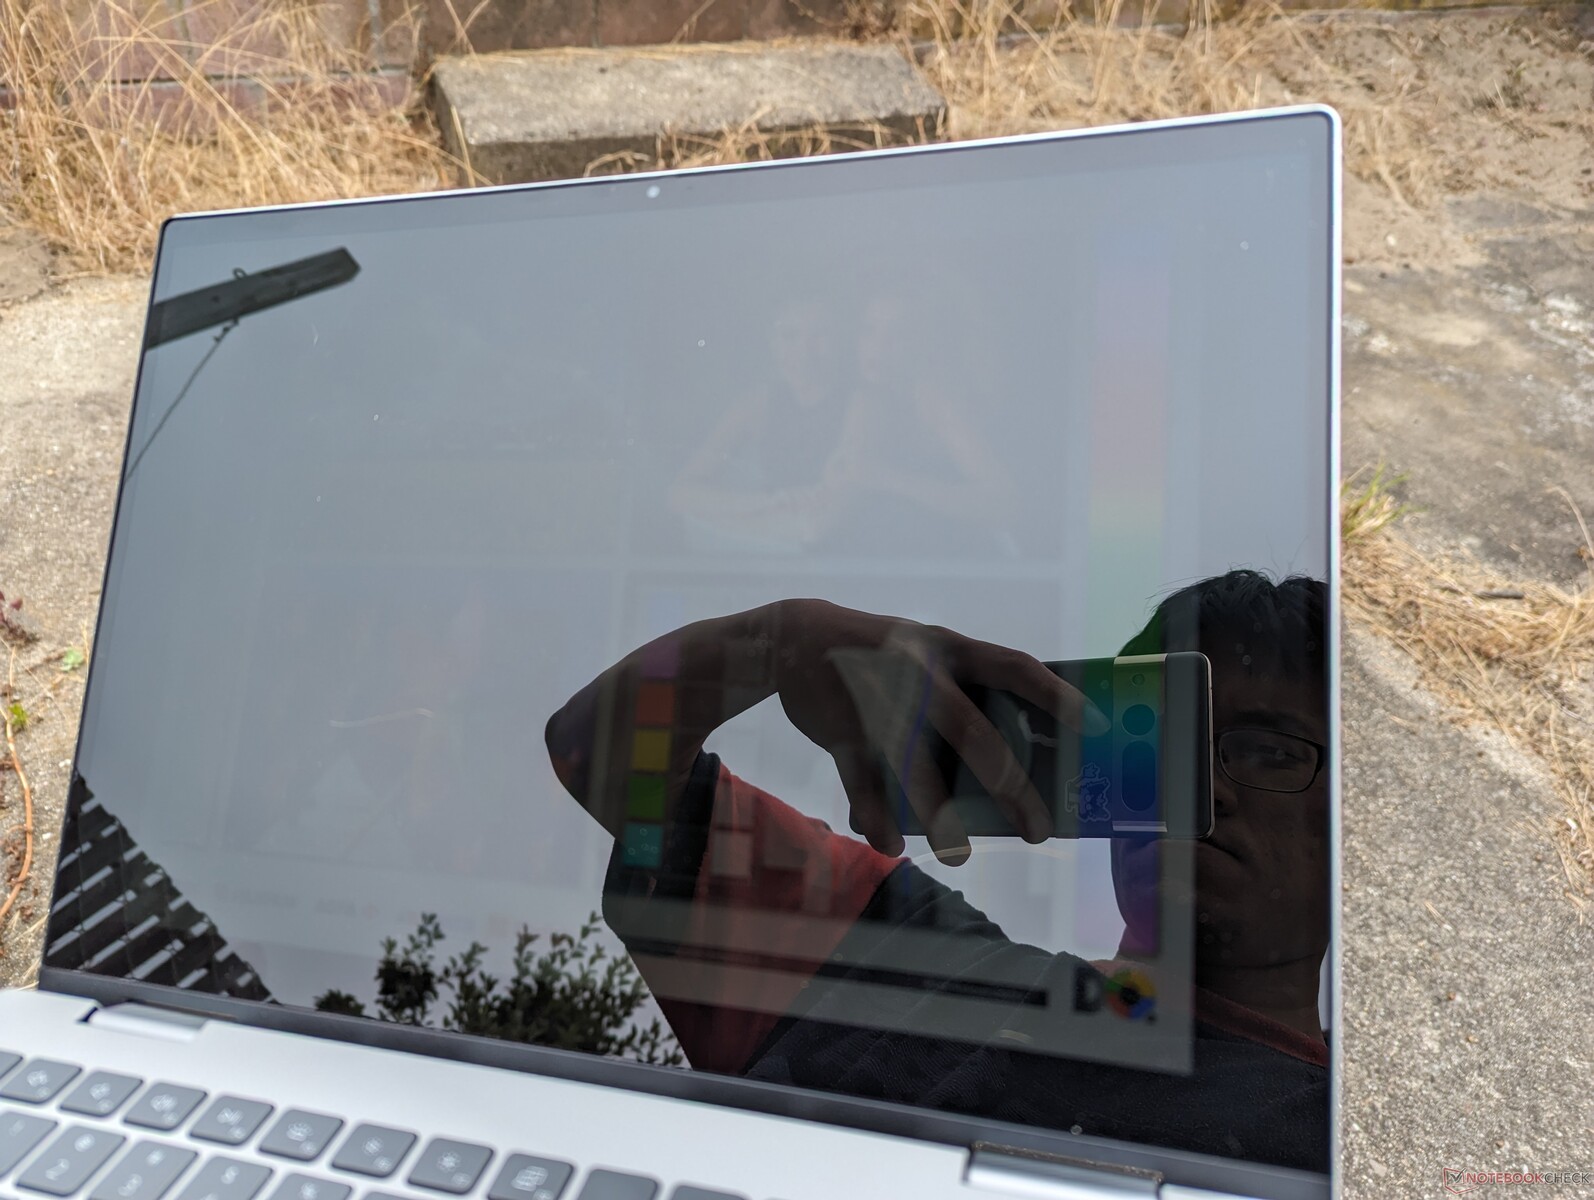
Um aspecto que merecia mais atenção diz respeito ao brilho fraco da tela sensível ao toque. A baixa faixa de 200 nits é suficiente para ambientes internos, mas nossas expectativas são maiores para os conversíveis, pois é mais provável que os proprietários os usem em viagens ou em condições externas mais claras. Se a visibilidade em ambientes externos for uma preocupação, os possíveis compradores devem considerar o mais caro XPS 13 9315 2 em 1 mais caro, que é 2x mais brilhante do que o nosso Inspiron.
| |||||||||||||||||||||||||
iluminação: 87 %
iluminação com acumulador: 231.8 cd/m²
Contraste: 859:1 (Preto: 0.27 cd/m²)
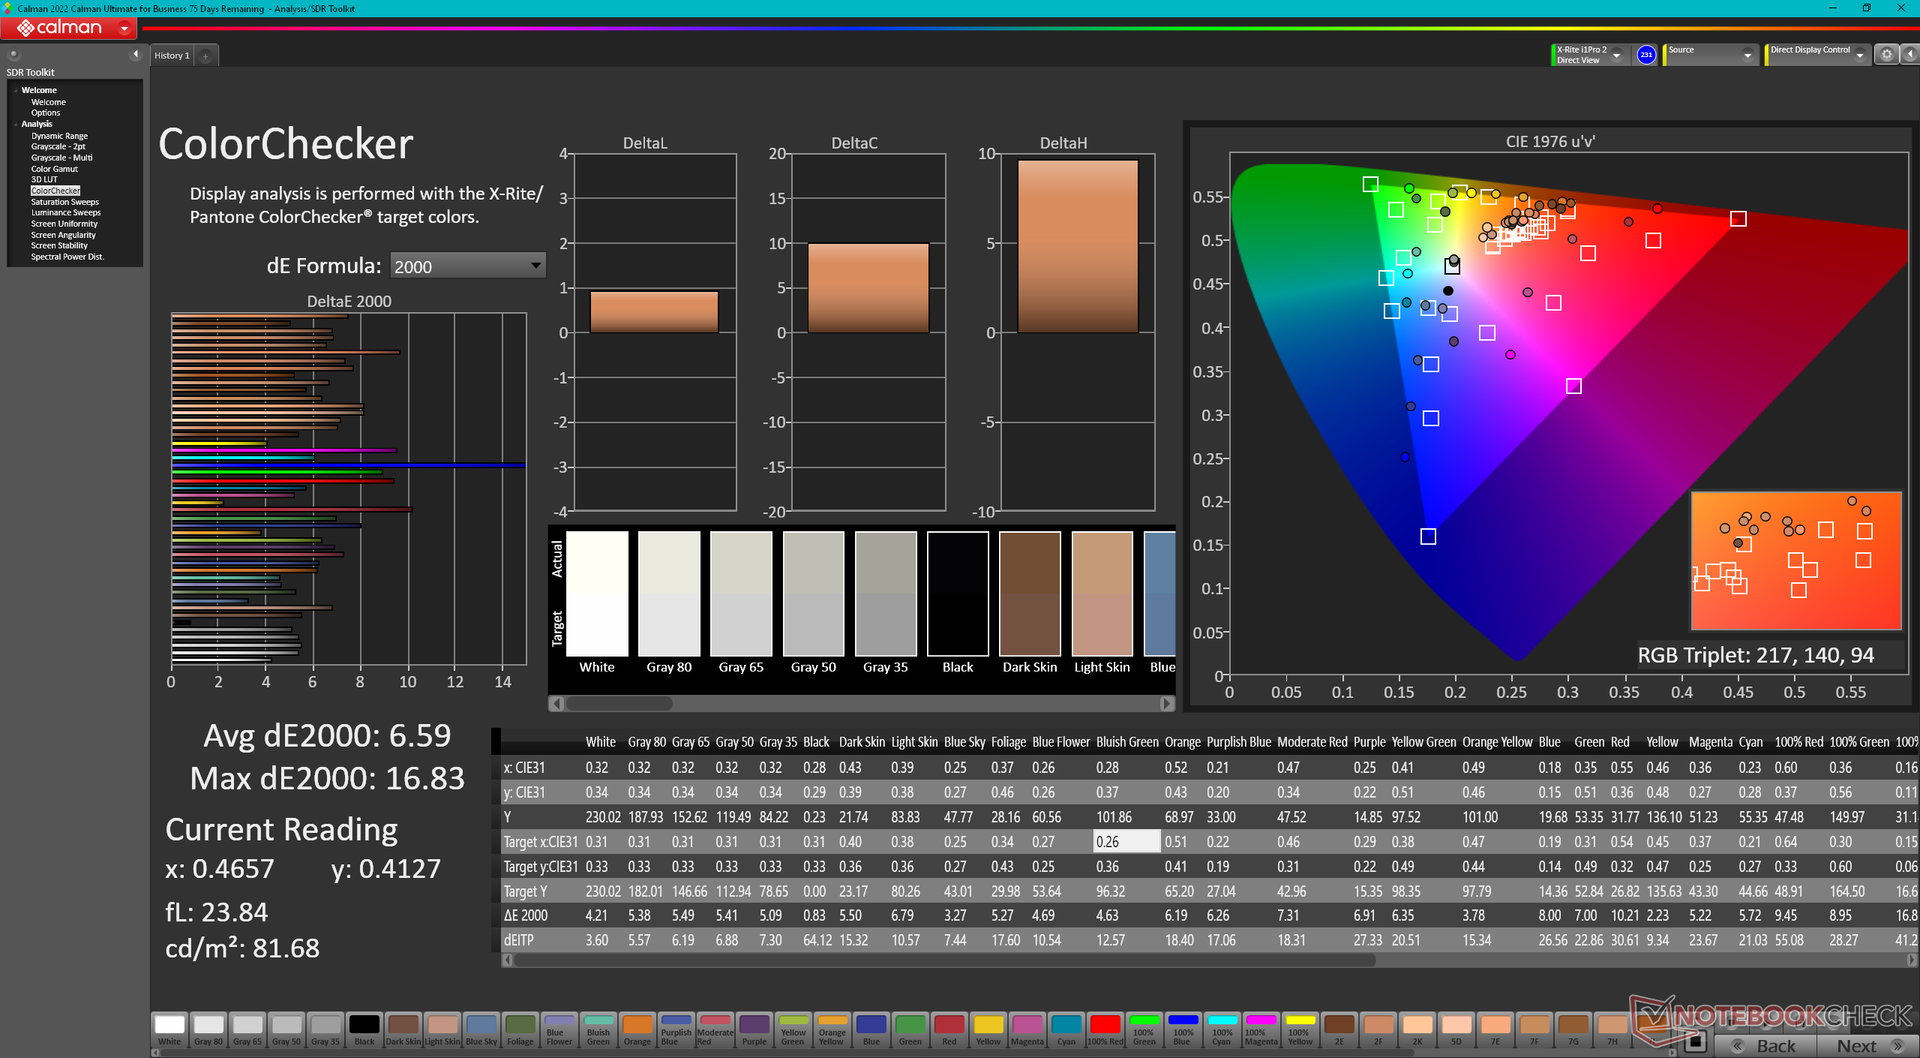
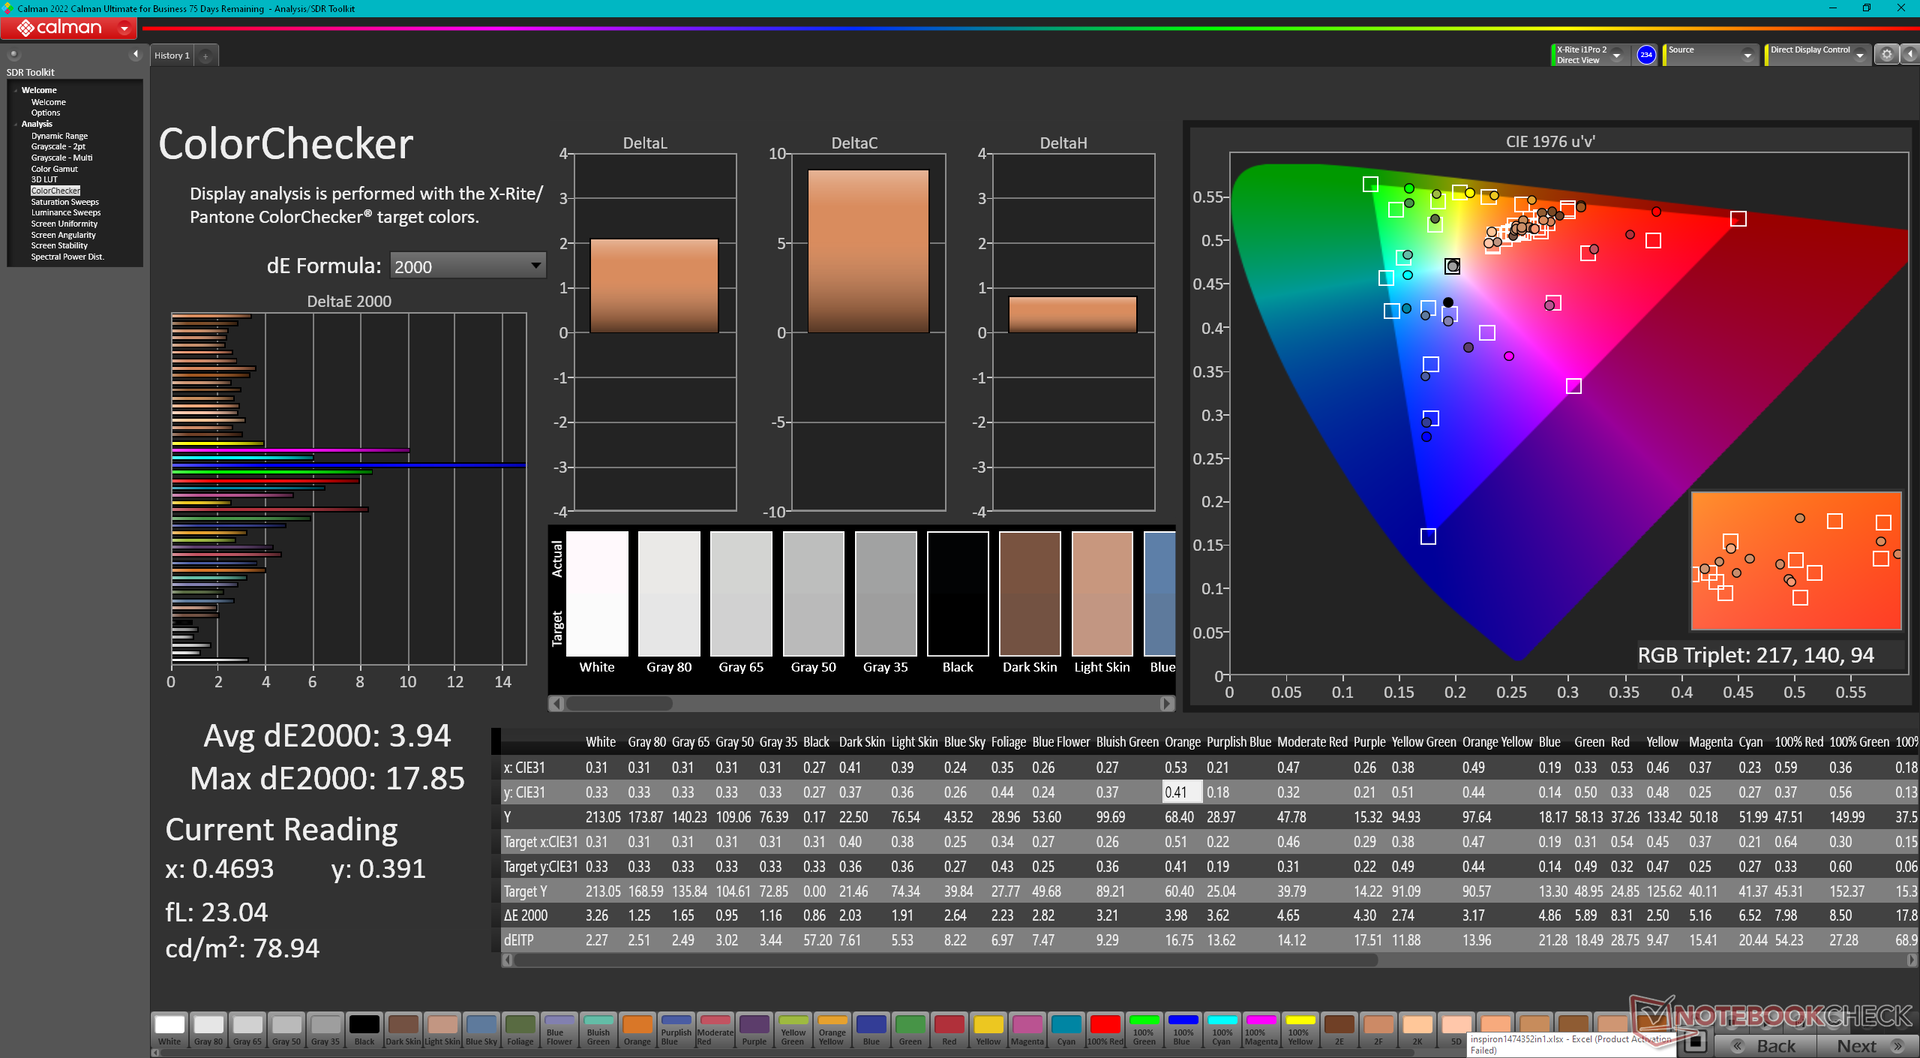
ΔE ColorChecker Calman: 6.59 | ∀{0.5-29.43 Ø4.71}
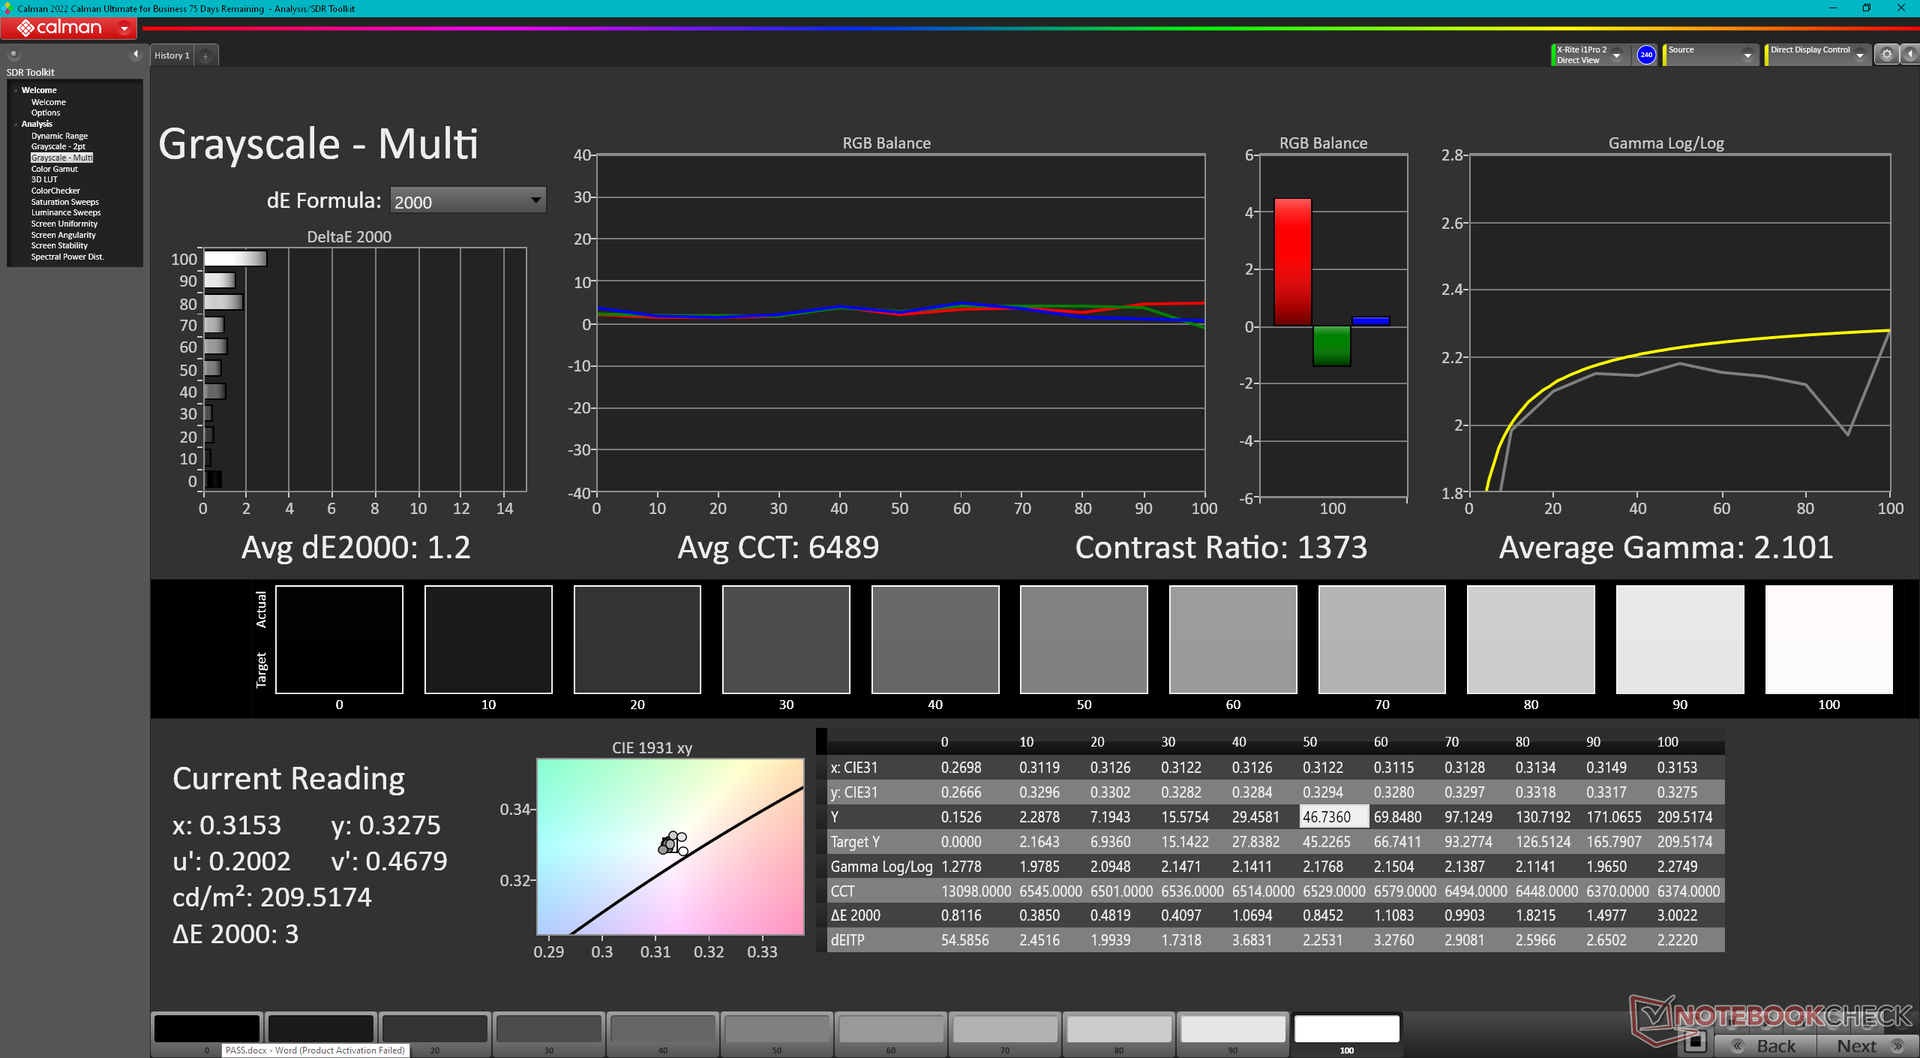
calibrated: 3.94
ΔE Greyscale Calman: 4.5 | ∀{0.09-98 Ø4.96}
45.8% AdobeRGB 1998 (Argyll 3D)
64.4% sRGB (Argyll 3D)
44.4% Display P3 (Argyll 3D)
Gamma: 2.17
CCT: 6110 K
| Dell Inspiron 14 7435 2-in-1 LG Philips 140WU2, IPS, 1920x1200, 14" | Dell Inspiron 14 7420 2-in-1 BOE NV14N42, IPS, 1920x1200, 14" | Lenovo IdeaPad Flex 7i 14IAU7 BOE CQ NV140DRM-162, IPS, 2240x1400, 14" | Acer Aspire 5 Spin 14 BOE CQ NV140WUM-N41, IPS, 1920x1200, 14" | LG Gram 14T90P LG Philips LP140WU1-SPA1, IPS, 1900x1200, 14" | HP Pavilion x360 14-dy0157ng Chi Mei N140HCA-E5B, IPS, 1920x1080, 14" | |
|---|---|---|---|---|---|---|
| Display | -13% | 56% | -12% | 89% | -3% | |
| Display P3 Coverage (%) | 44.4 | 38.6 -13% | 69.8 57% | 38.5 -13% | 98.8 123% | 42.7 -4% |
| sRGB Coverage (%) | 64.4 | 56.2 -13% | 98 52% | 57.3 -11% | 100 55% | 63.7 -1% |
| AdobeRGB 1998 Coverage (%) | 45.8 | 39.9 -13% | 72.2 58% | 39.8 -13% | 44.2 -3% | |
| Response Times | -24% | -101% | -23% | -90% | -39% | |
| Response Time Grey 50% / Grey 80% * (ms) | 19.6 ? | 27.2 ? -39% | 44.4 ? -127% | 29 ? -48% | 44 ? -124% | 32 ? -63% |
| Response Time Black / White * (ms) | 19.3 ? | 20.8 ? -8% | 33.6 ? -74% | 19 ? 2% | 30 ? -55% | 22 ? -14% |
| PWM Frequency (Hz) | ||||||
| Screen | -6% | 31% | 12% | 34% | 39% | |
| Brightness middle (cd/m²) | 231.8 | 269.4 16% | 317.3 37% | 249 7% | 305.5 32% | 269 16% |
| Brightness (cd/m²) | 216 | 260 20% | 301 39% | 235 9% | 289 34% | 241 12% |
| Brightness Distribution (%) | 87 | 89 2% | 90 3% | 85 -2% | 87 0% | 82 -6% |
| Black Level * (cd/m²) | 0.27 | 0.41 -52% | 0.22 19% | 0.27 -0% | 0.27 -0% | 0.11 59% |
| Contrast (:1) | 859 | 657 -24% | 1442 68% | 922 7% | 1131 32% | 2445 185% |
| Colorchecker dE 2000 * | 6.59 | 6.53 1% | 3.99 39% | 5 24% | 3.31 50% | 5.68 14% |
| Colorchecker dE 2000 max. * | 16.83 | 19.76 -17% | 9.34 45% | 8.32 51% | 6.12 64% | 9.61 43% |
| Colorchecker dE 2000 calibrated * | 3.94 | 3.13 21% | 0.6 85% | 5.06 -28% | ||
| Greyscale dE 2000 * | 4.5 | 5.4 -20% | 6.9 -53% | 2.86 36% | 1.9 58% | 4.95 -10% |
| Gamma | 2.17 101% | 2.05 107% | 2.19 100% | 2.19 100% | 2.04 108% | 2.17 101% |
| CCT | 6110 106% | 6007 108% | 6161 106% | 6419 101% | 6706 97% | 6628 98% |
| Color Space (Percent of AdobeRGB 1998) (%) | 44.2 | |||||
| Color Space (Percent of sRGB) (%) | 63.7 | |||||
| Média Total (Programa/Configurações) | -14% /
-10% | -5% /
18% | -8% /
2% | 11% /
22% | -1% /
18% |
* ... menor é melhor
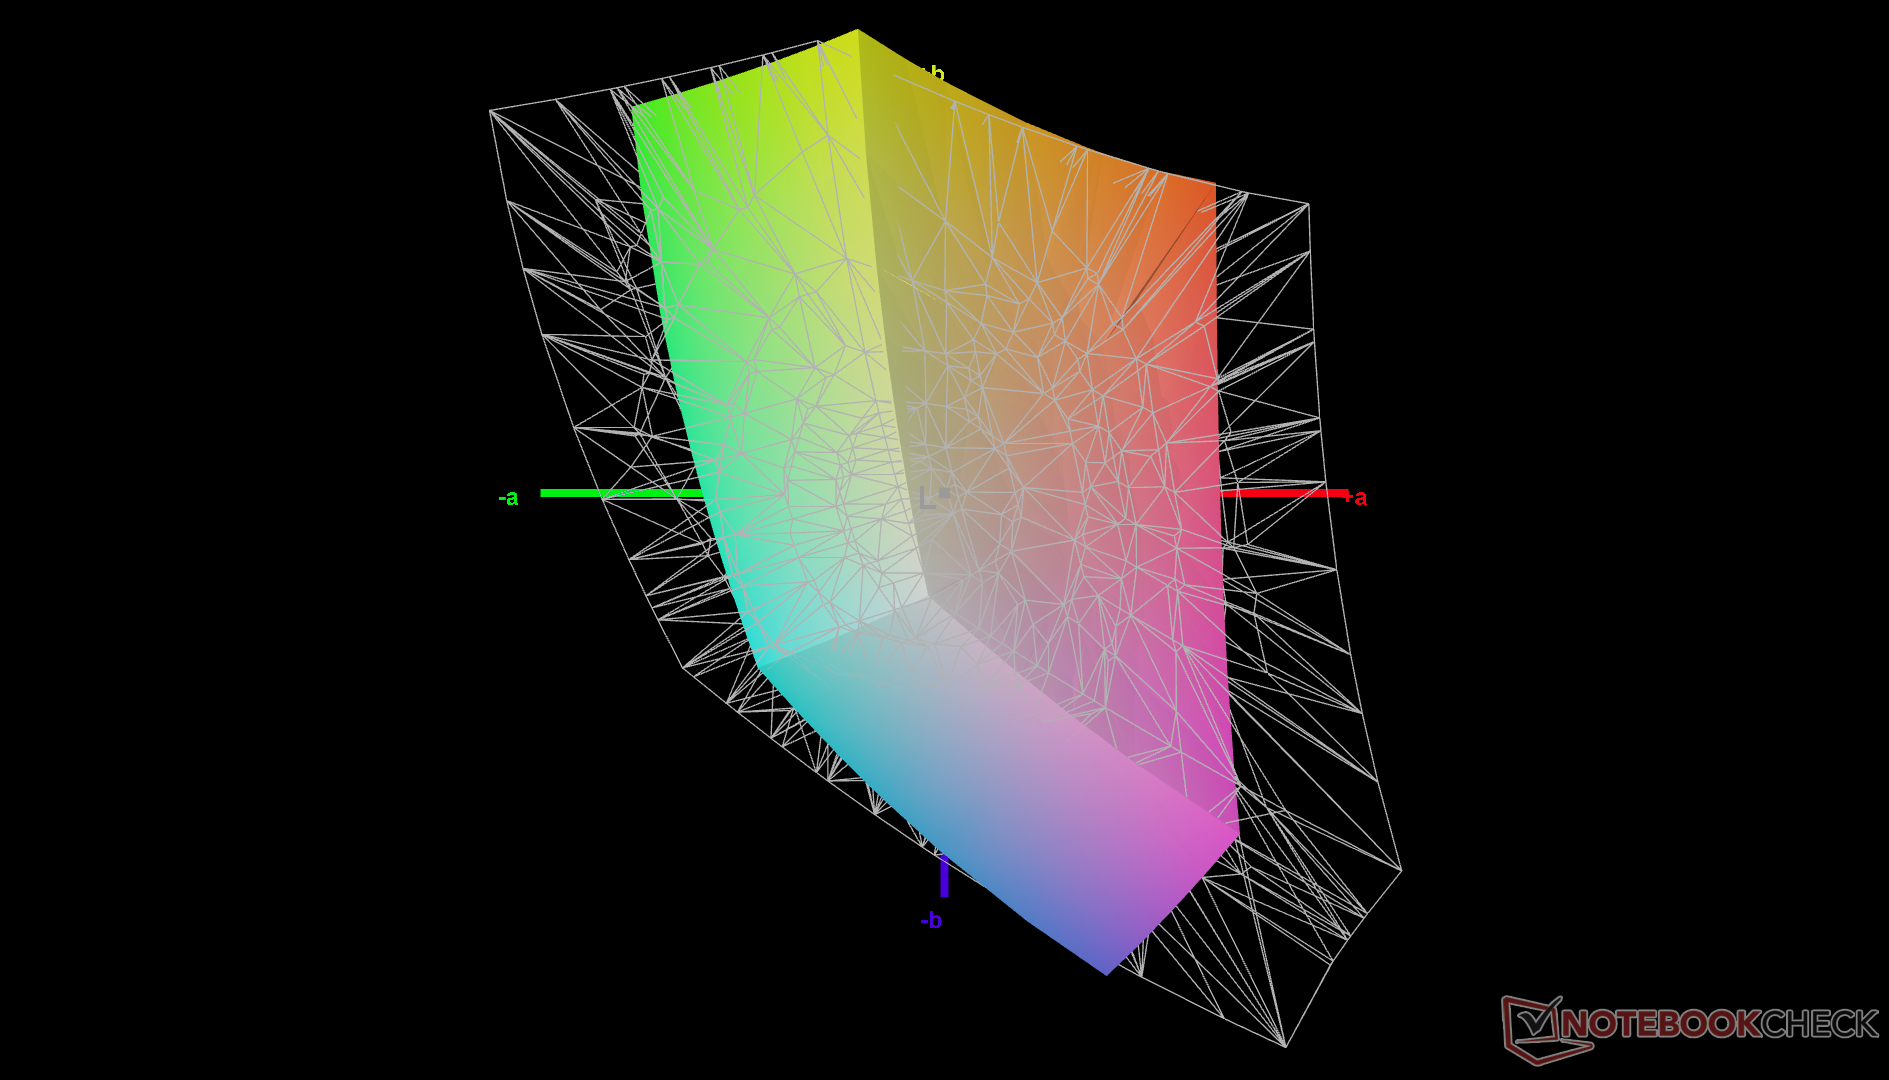
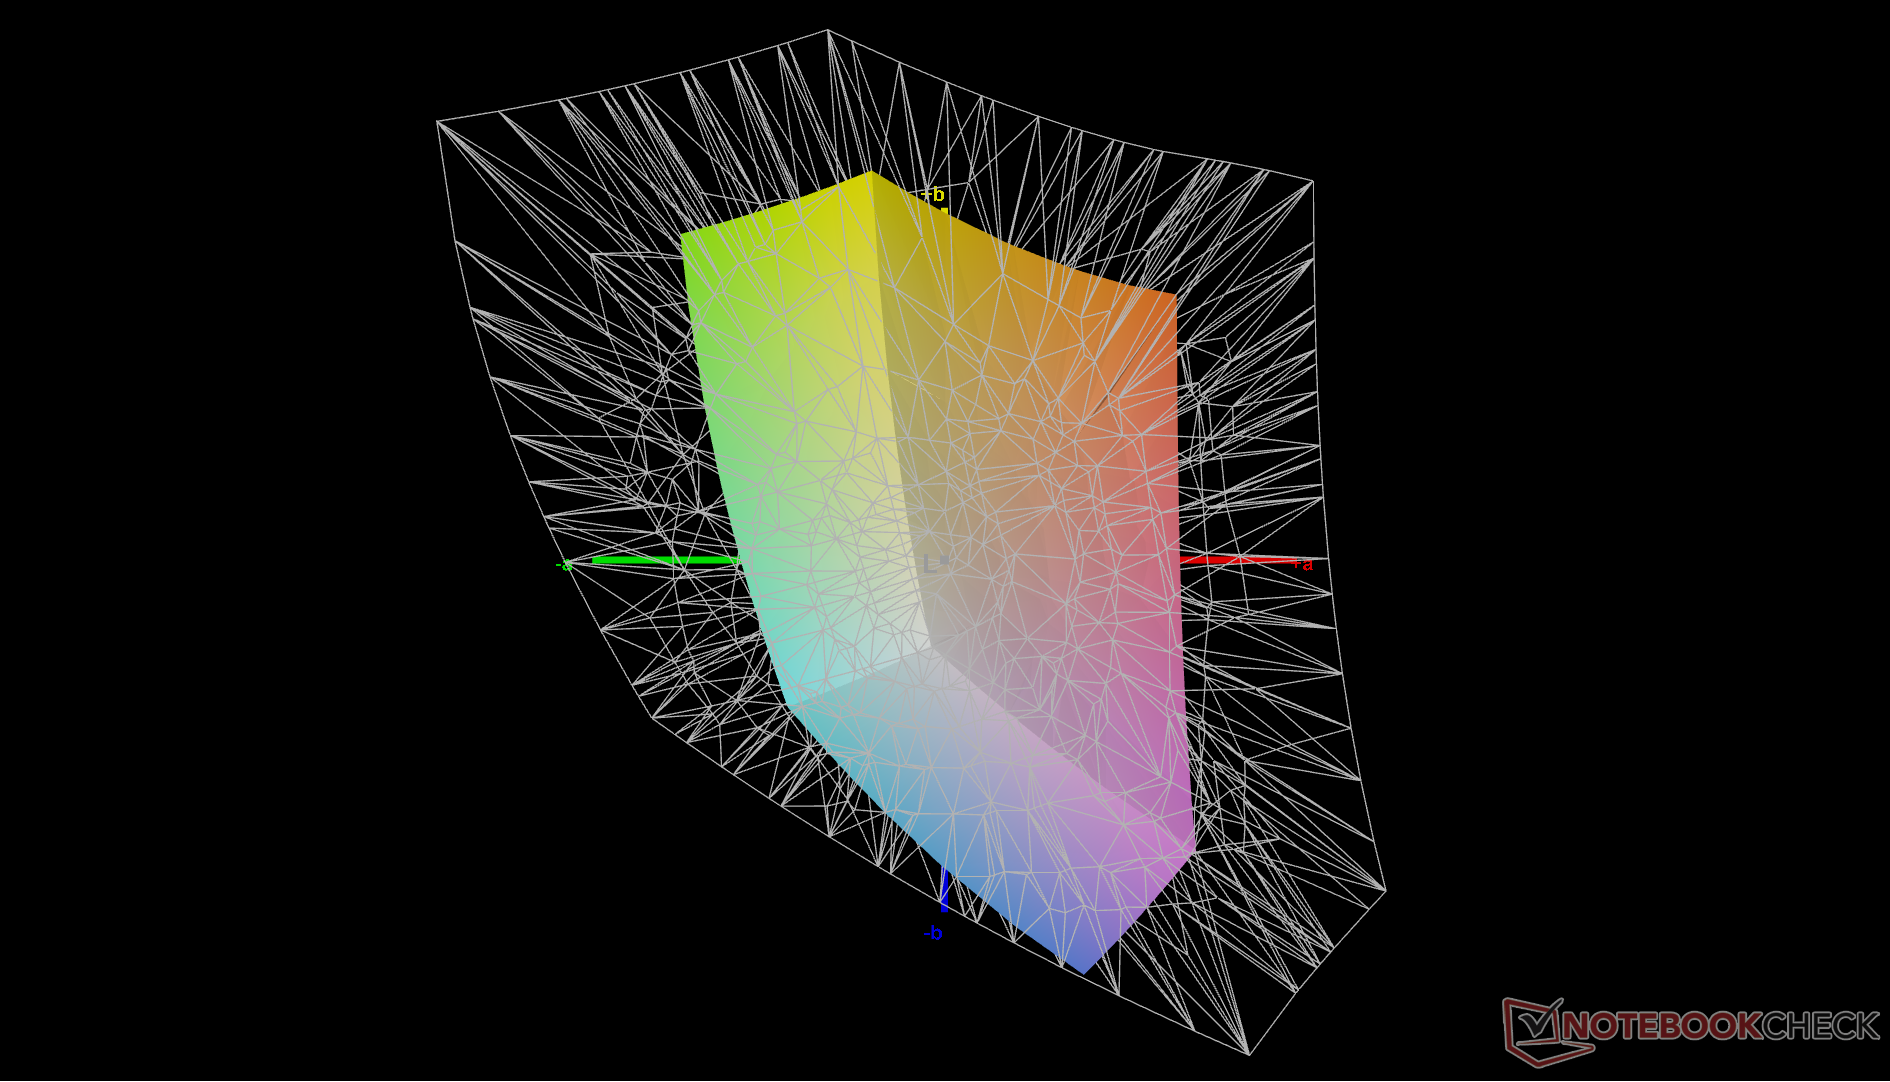
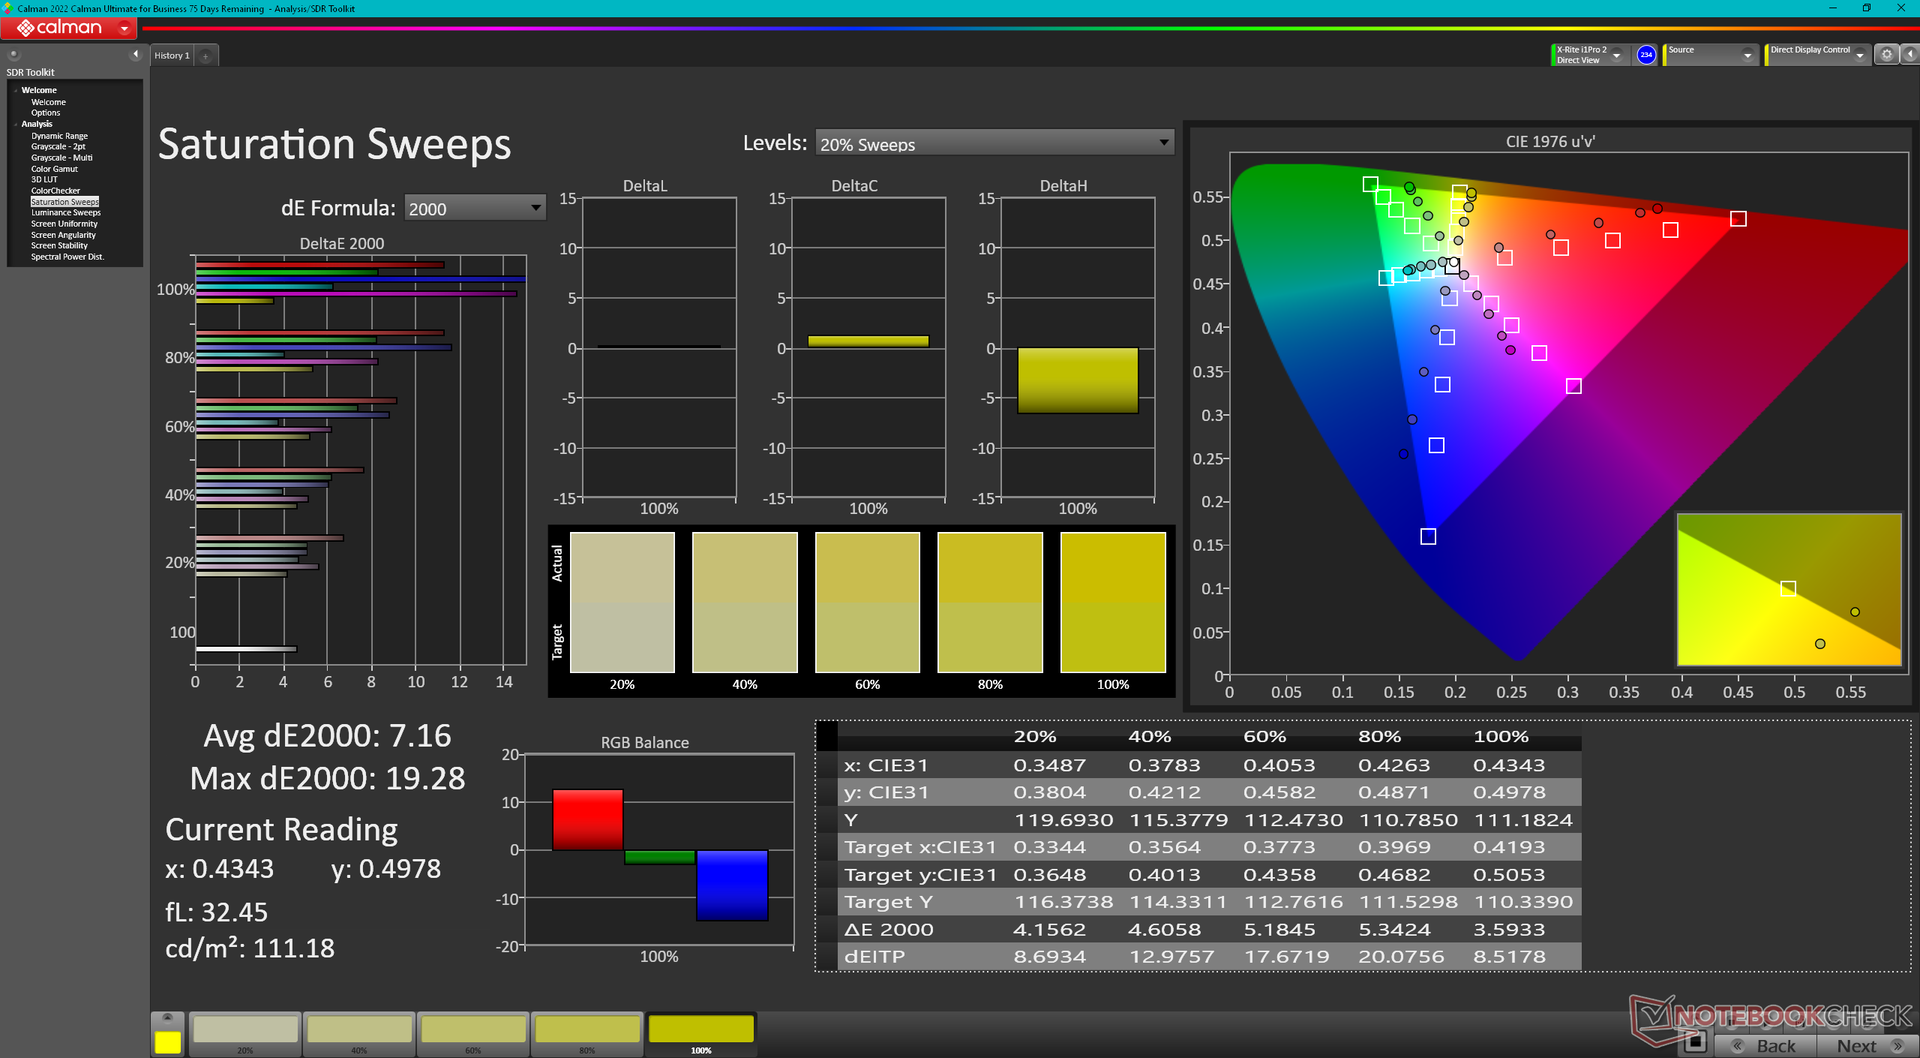
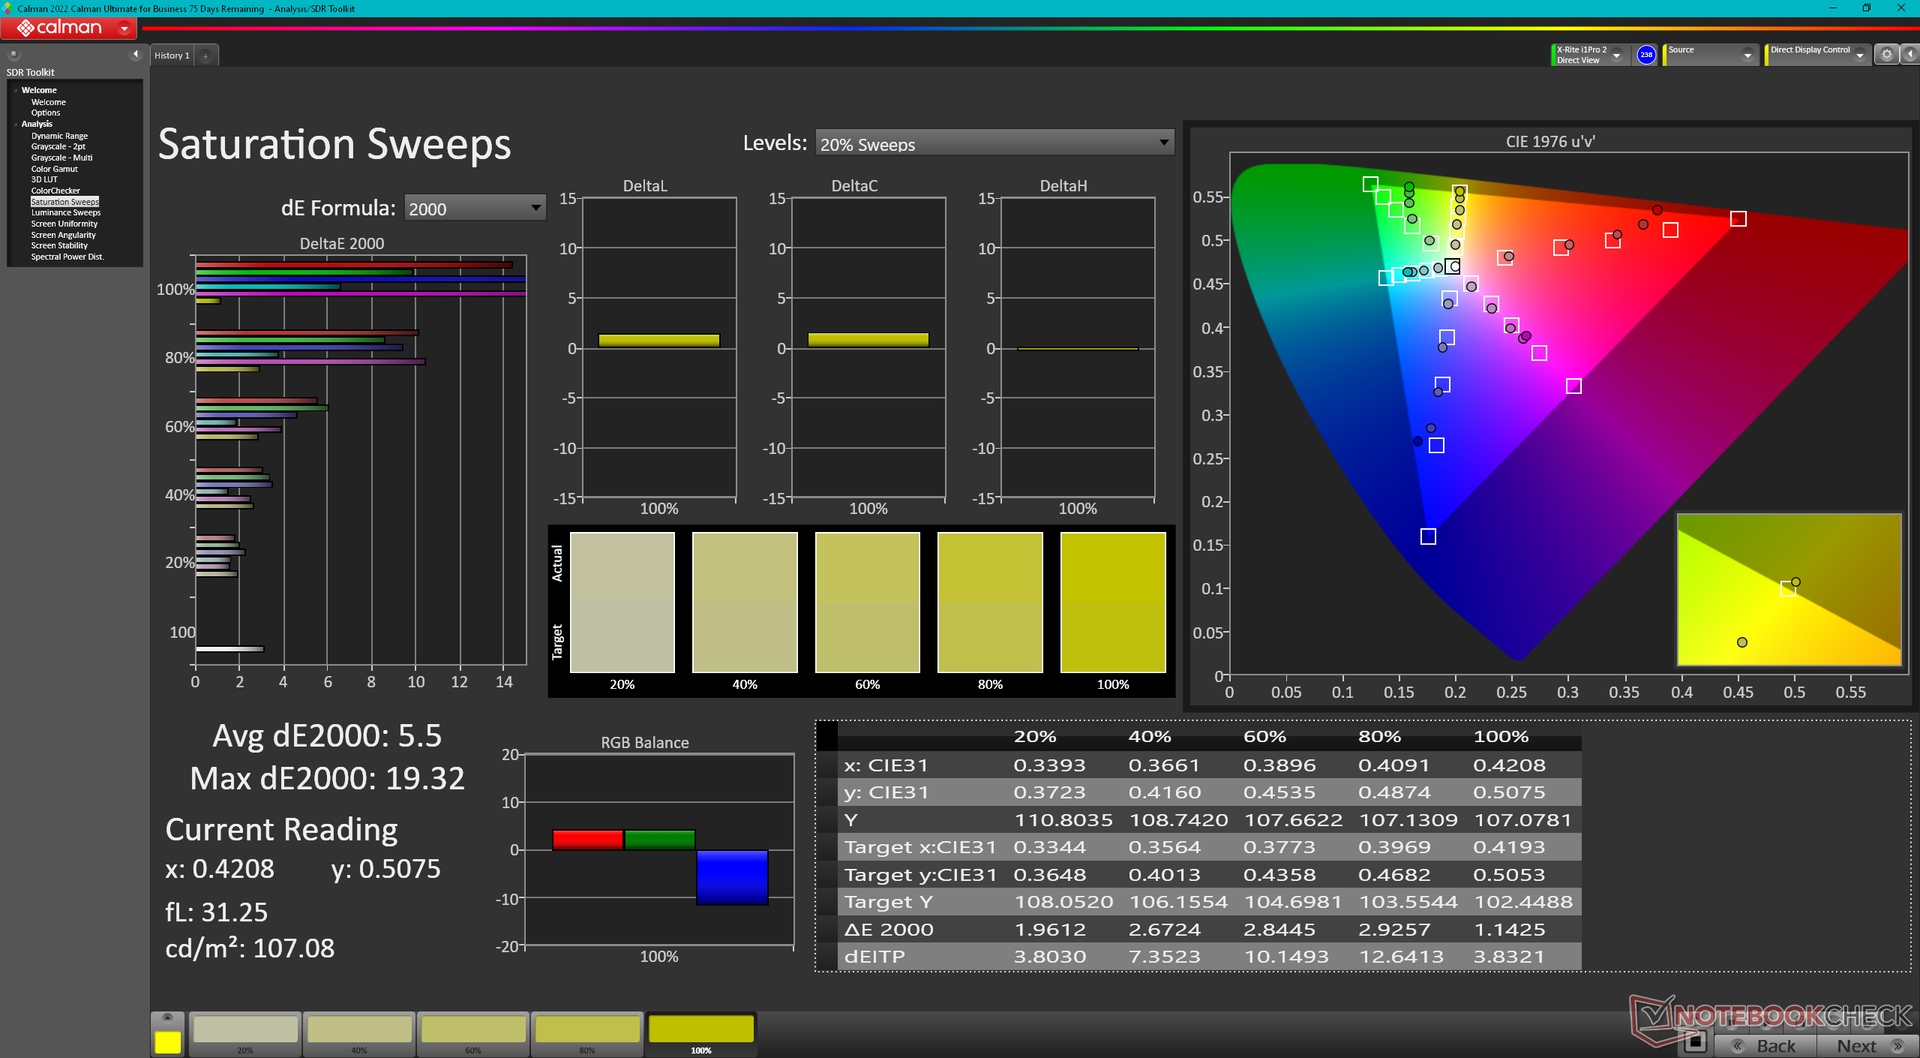
A temperatura da cor é ligeiramente quente demais quando sai da caixa. Uma calibração com nosso colorímetro X-Rite resolve esse problema para obter cores mais precisas em geral. Entretanto, observe que as cores ainda serão imprecisas em níveis de saturação mais altos devido à cobertura sRGB limitada mencionada acima.
Exibir tempos de resposta
| ↔ Tempo de resposta preto para branco | ||
|---|---|---|
| 19.3 ms ... ascensão ↗ e queda ↘ combinadas | ↗ 10.6 ms ascensão | 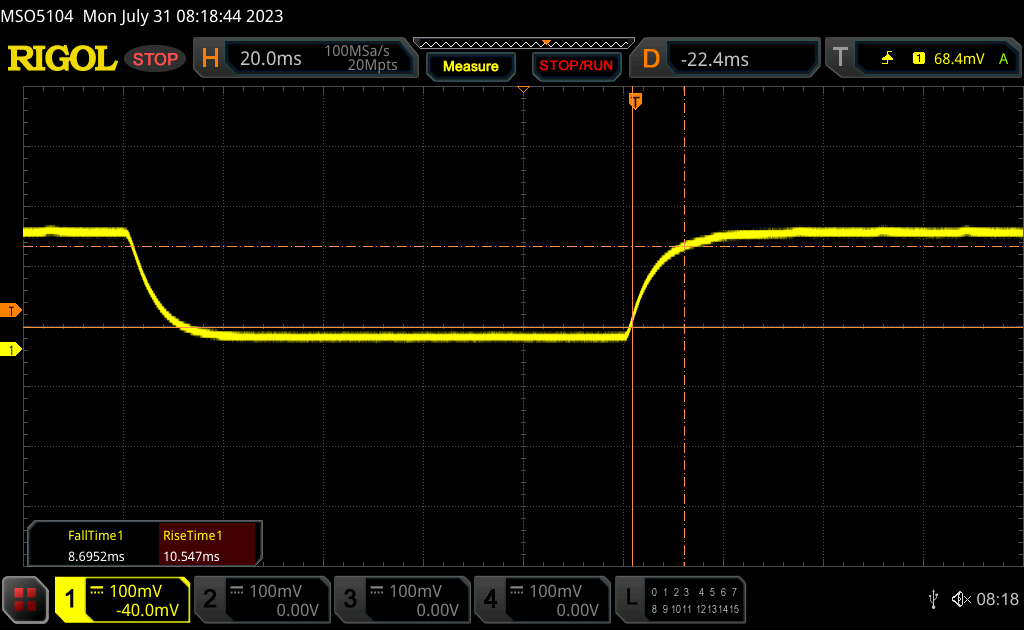 |
| ↘ 8.7 ms queda | ||
| A tela mostra boas taxas de resposta em nossos testes, mas pode ser muito lenta para jogadores competitivos. Em comparação, todos os dispositivos testados variam de 0.1 (mínimo) a 240 (máximo) ms. » 43 % de todos os dispositivos são melhores. Isso significa que o tempo de resposta medido é semelhante à média de todos os dispositivos testados (19.8 ms). | ||
| ↔ Tempo de resposta 50% cinza a 80% cinza | ||
| 19.6 ms ... ascensão ↗ e queda ↘ combinadas | ↗ 13.6 ms ascensão |  |
| ↘ 16 ms queda | ||
| A tela mostra boas taxas de resposta em nossos testes, mas pode ser muito lenta para jogadores competitivos. Em comparação, todos os dispositivos testados variam de 0.165 (mínimo) a 636 (máximo) ms. » 33 % de todos os dispositivos são melhores. Isso significa que o tempo de resposta medido é melhor que a média de todos os dispositivos testados (31 ms). | ||
Cintilação da tela / PWM (modulação por largura de pulso)
| Tela tremeluzindo / PWM não detectado | 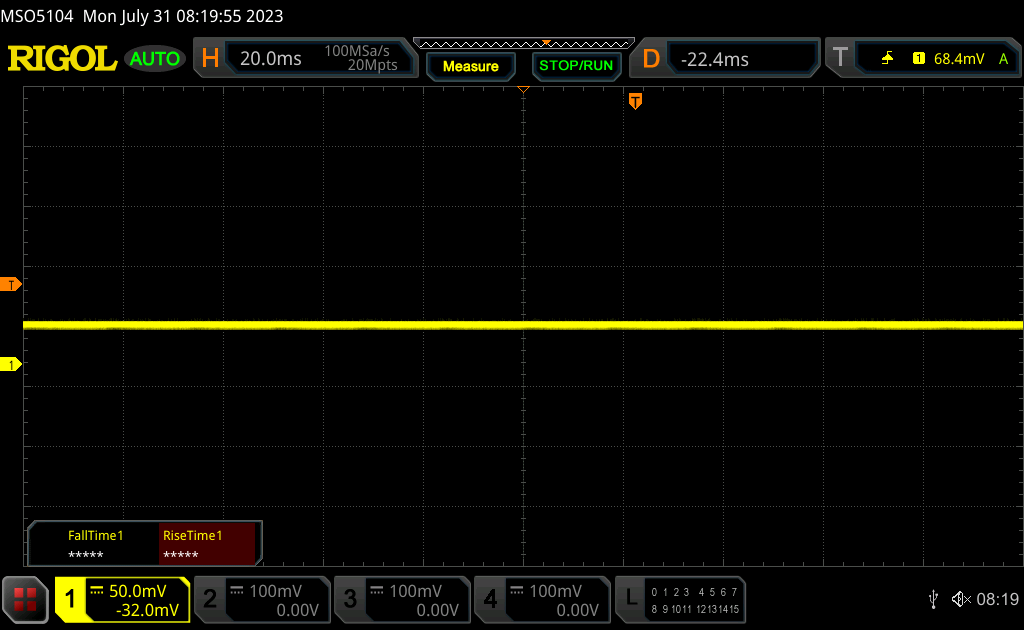 | ||
[pwm_comparison] Em comparação: 52 % de todos os dispositivos testados não usam PWM para escurecer a tela. Se PWM foi detectado, uma média de 7757 (mínimo: 5 - máximo: 343500) Hz foi medida. | |||
O brilho é perceptível mesmo quando se usa o laptop em ambientes internos ou sob a sombra. A luz de fundo fraca não é capaz de superar grande parte do brilho da sobreposição brilhante, o que afeta seriamente a visibilidade em condições externas.
Desempenho - AMD Zen 3 no coração
Condições de teste
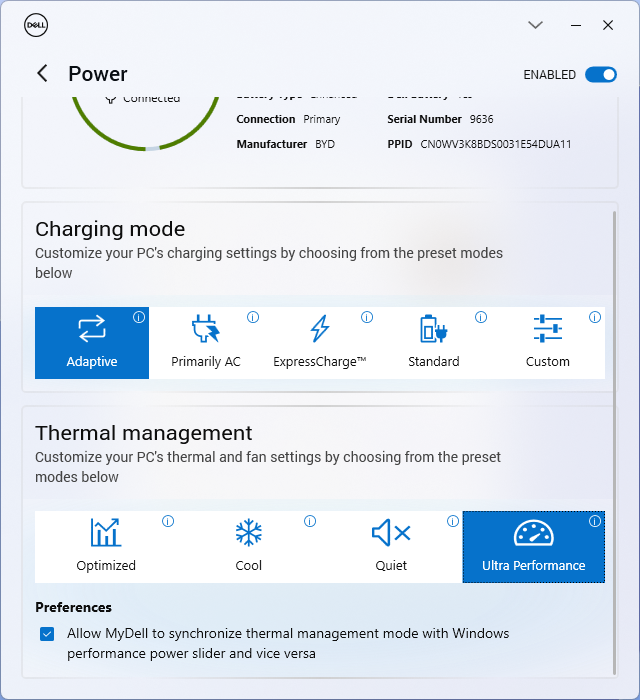
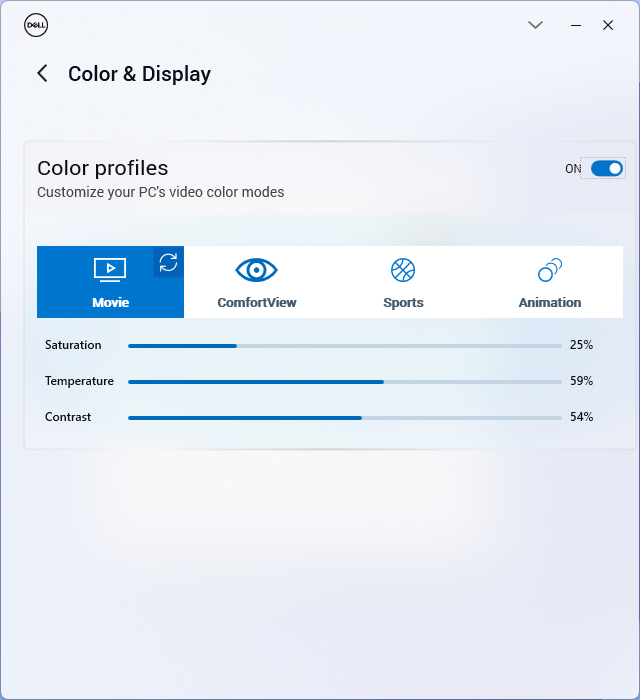
Definimos nossa unidade para o modo Desempenho por meio do software MyDell antes de executar os benchmarks abaixo. Convenientemente, os perfis de energia da MyDell são sincronizados com os perfis de energia do Windows, ao contrário da maioria dos outros modelos de fabricantes concorrentes.
Processador
O processador de 6 núcleos Ryzen 5 7530U tem desempenho quase idêntico ao doRyzen 5 6600U já que ambos são baseados na arquitetura Zen 3. O desempenho geral é comparável ao do processador de médio porte Core i5-1335U encontrado em modelos como oAcer Aspire 5 Spin 14 e está bem acima de qualquer solução móvel Core i3. A AMD ajustou essa CPU para ser competitiva em relação à série Core i5, tanto em termos de desempenho quanto de preço.
A atualização para o processador de 8 núcleos Ryzen 7 7730U de 8 núcleos deverá aumentar o desempenho multi-thread em cerca de 30 a 40%, com base em nosso tempo com o Asus Zenbook 14.
Cinebench R15 Multi Loop
Cinebench R23: Multi Core | Single Core
Cinebench R20: CPU (Multi Core) | CPU (Single Core)
Cinebench R15: CPU Multi 64Bit | CPU Single 64Bit
Blender: v2.79 BMW27 CPU
7-Zip 18.03: 7z b 4 | 7z b 4 -mmt1
Geekbench 5.5: Multi-Core | Single-Core
HWBOT x265 Benchmark v2.2: 4k Preset
LibreOffice : 20 Documents To PDF
R Benchmark 2.5: Overall mean
* ... menor é melhor
* ... menor é melhor
AIDA64: FP32 Ray-Trace | FPU Julia | CPU SHA3 | CPU Queen | FPU SinJulia | FPU Mandel | CPU AES | CPU ZLib | FP64 Ray-Trace | CPU PhotoWorxx
| Performance rating | |
| Média AMD Ryzen 5 7530U | |
| Dell Inspiron 14 7435 2-in-1 | |
| Lenovo IdeaPad Flex 7i 14IAU7 | |
| Acer Aspire 5 Spin 14 | |
| LG Gram 14T90P | |
| HP Pavilion x360 14-dy0157ng | |
| Dell Inspiron 14 7420 2-in-1 | |
| AIDA64 / FP32 Ray-Trace | |
| Dell Inspiron 14 7435 2-in-1 | |
| Média AMD Ryzen 5 7530U (7609 - 10970, n=9) | |
| Lenovo IdeaPad Flex 7i 14IAU7 | |
| Acer Aspire 5 Spin 14 | |
| LG Gram 14T90P | |
| HP Pavilion x360 14-dy0157ng | |
| Dell Inspiron 14 7420 2-in-1 | |
| AIDA64 / FPU Julia | |
| Dell Inspiron 14 7435 2-in-1 | |
| Média AMD Ryzen 5 7530U (48473 - 68384, n=9) | |
| Lenovo IdeaPad Flex 7i 14IAU7 | |
| Acer Aspire 5 Spin 14 | |
| LG Gram 14T90P | |
| HP Pavilion x360 14-dy0157ng | |
| Dell Inspiron 14 7420 2-in-1 | |
| AIDA64 / CPU SHA3 | |
| Média AMD Ryzen 5 7530U (1591 - 2323, n=9) | |
| Lenovo IdeaPad Flex 7i 14IAU7 | |
| Dell Inspiron 14 7435 2-in-1 | |
| LG Gram 14T90P | |
| Acer Aspire 5 Spin 14 | |
| HP Pavilion x360 14-dy0157ng | |
| Dell Inspiron 14 7420 2-in-1 | |
| AIDA64 / CPU Queen | |
| Dell Inspiron 14 7435 2-in-1 | |
| Média AMD Ryzen 5 7530U (66646 - 78105, n=8) | |
| Lenovo IdeaPad Flex 7i 14IAU7 | |
| Dell Inspiron 14 7420 2-in-1 | |
| Acer Aspire 5 Spin 14 | |
| LG Gram 14T90P | |
| HP Pavilion x360 14-dy0157ng | |
| AIDA64 / FPU SinJulia | |
| Dell Inspiron 14 7435 2-in-1 | |
| Média AMD Ryzen 5 7530U (7611 - 9248, n=9) | |
| Lenovo IdeaPad Flex 7i 14IAU7 | |
| Dell Inspiron 14 7420 2-in-1 | |
| LG Gram 14T90P | |
| Acer Aspire 5 Spin 14 | |
| HP Pavilion x360 14-dy0157ng | |
| AIDA64 / FPU Mandel | |
| Dell Inspiron 14 7435 2-in-1 | |
| Média AMD Ryzen 5 7530U (26912 - 37624, n=9) | |
| Lenovo IdeaPad Flex 7i 14IAU7 | |
| LG Gram 14T90P | |
| Acer Aspire 5 Spin 14 | |
| HP Pavilion x360 14-dy0157ng | |
| Dell Inspiron 14 7420 2-in-1 | |
| AIDA64 / CPU AES | |
| Acer Aspire 5 Spin 14 | |
| LG Gram 14T90P | |
| HP Pavilion x360 14-dy0157ng | |
| Média AMD Ryzen 5 7530U (33314 - 92360, n=9) | |
| Lenovo IdeaPad Flex 7i 14IAU7 | |
| Dell Inspiron 14 7435 2-in-1 | |
| Dell Inspiron 14 7420 2-in-1 | |
| AIDA64 / CPU ZLib | |
| Acer Aspire 5 Spin 14 | |
| Lenovo IdeaPad Flex 7i 14IAU7 | |
| Dell Inspiron 14 7420 2-in-1 | |
| Dell Inspiron 14 7435 2-in-1 | |
| Média AMD Ryzen 5 7530U (443 - 612, n=9) | |
| LG Gram 14T90P | |
| HP Pavilion x360 14-dy0157ng | |
| AIDA64 / FP64 Ray-Trace | |
| Dell Inspiron 14 7435 2-in-1 | |
| Média AMD Ryzen 5 7530U (4008 - 5738, n=9) | |
| Lenovo IdeaPad Flex 7i 14IAU7 | |
| LG Gram 14T90P | |
| Acer Aspire 5 Spin 14 | |
| HP Pavilion x360 14-dy0157ng | |
| Dell Inspiron 14 7420 2-in-1 | |
| AIDA64 / CPU PhotoWorxx | |
| Lenovo IdeaPad Flex 7i 14IAU7 | |
| LG Gram 14T90P | |
| Acer Aspire 5 Spin 14 | |
| HP Pavilion x360 14-dy0157ng | |
| Dell Inspiron 14 7420 2-in-1 | |
| Dell Inspiron 14 7435 2-in-1 | |
| Média AMD Ryzen 5 7530U (9832 - 19525, n=9) | |
Desempenho do sistema
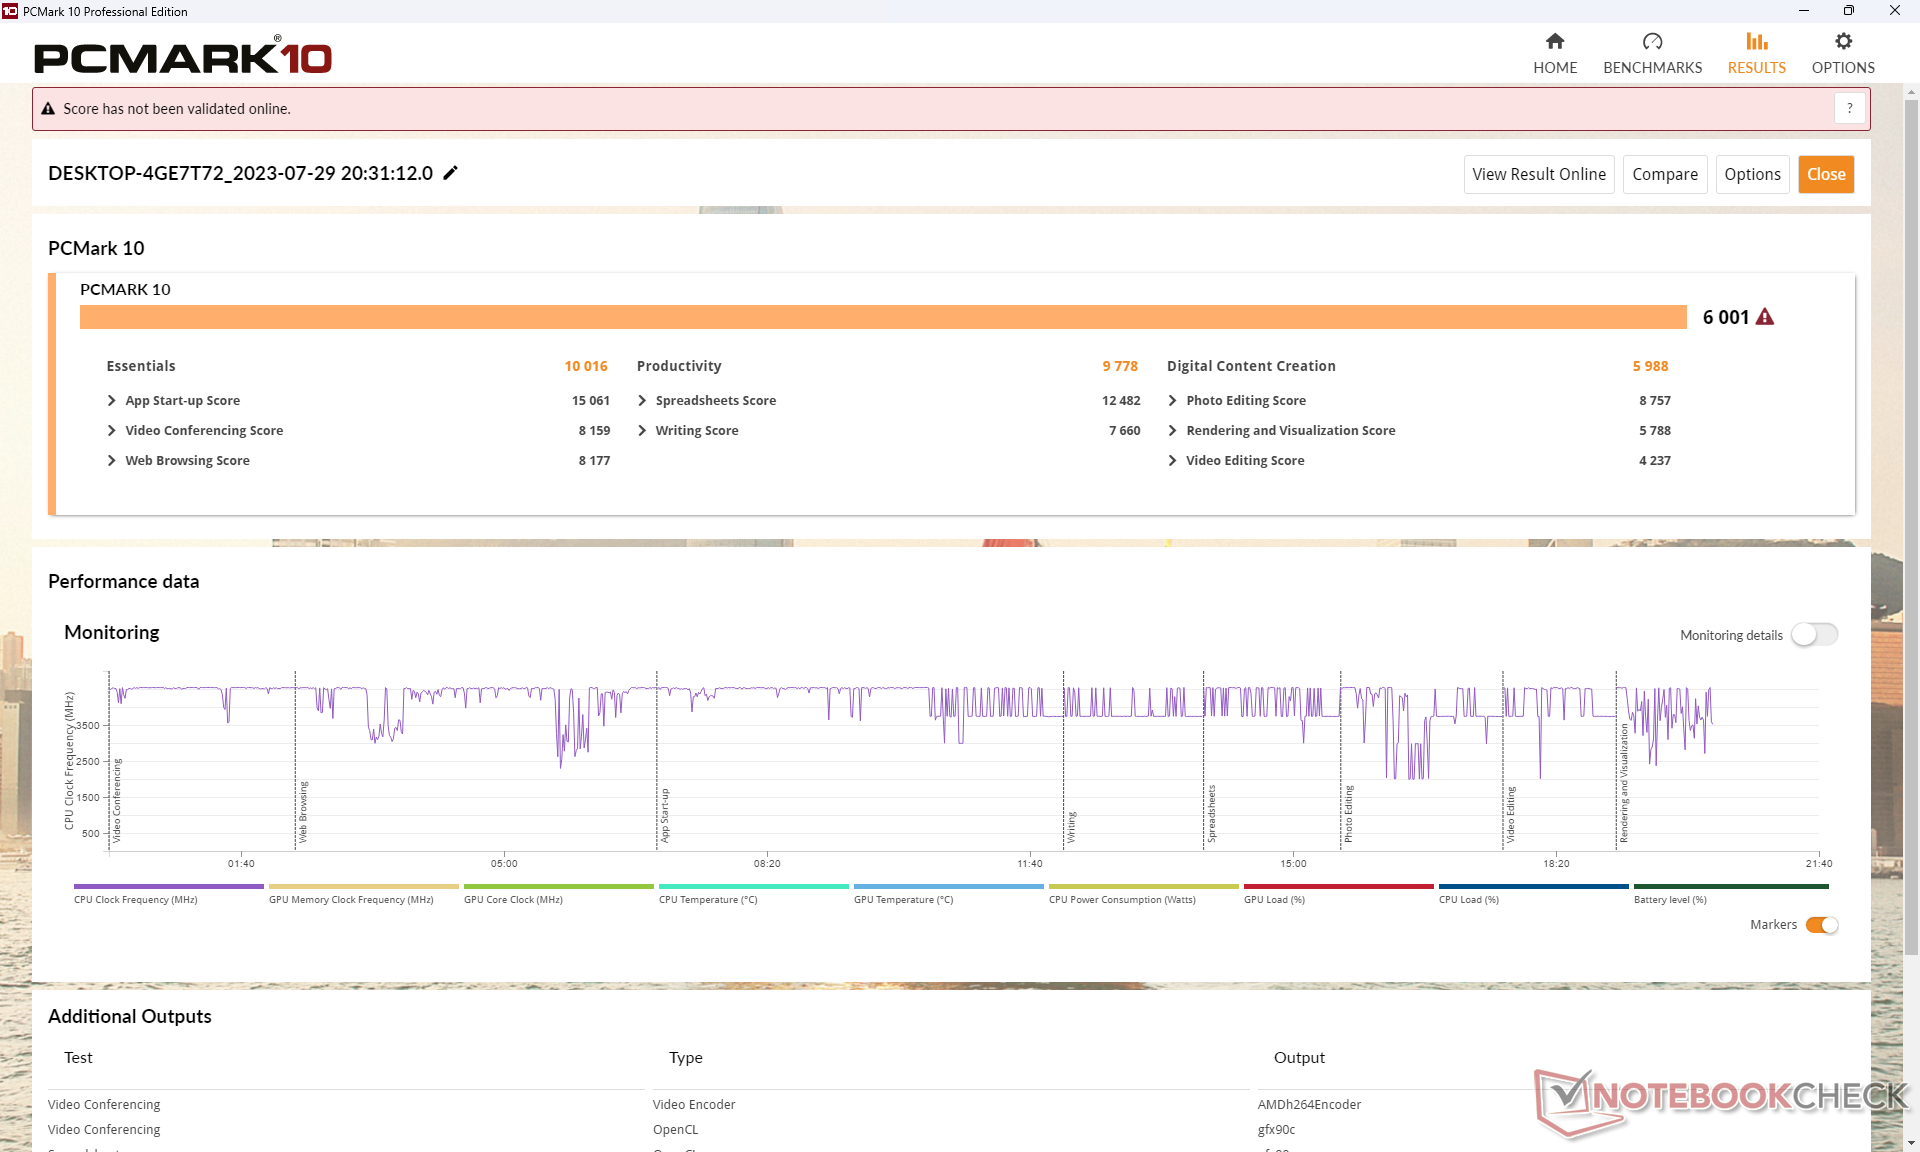
As pontuações do PCMark são mais altas do que na maioria dos outros subnotebooks de baixo custo, especialmente no subteste Produtividade. Suspeitamos que isso possa ser devido à configuração de 6 núcleos/12 threads do processador, que pode ter uma influência maior no benchmark do que as configurações P-core e E-Core das CPUs Intel.
CrossMark: Overall | Productivity | Creativity | Responsiveness
| PCMark 10 / Score | |
| Dell Inspiron 14 7435 2-in-1 | |
| Média AMD Ryzen 5 7530U, AMD Radeon RX Vega 7 (5686 - 6209, n=8) | |
| Lenovo IdeaPad Flex 7i 14IAU7 | |
| Dell Inspiron 14 7420 2-in-1 | |
| Acer Aspire 5 Spin 14 | |
| LG Gram 14T90P | |
| HP Pavilion x360 14-dy0157ng | |
| PCMark 10 / Essentials | |
| Lenovo IdeaPad Flex 7i 14IAU7 | |
| Média AMD Ryzen 5 7530U, AMD Radeon RX Vega 7 (9183 - 11242, n=8) | |
| Acer Aspire 5 Spin 14 | |
| Dell Inspiron 14 7420 2-in-1 | |
| Dell Inspiron 14 7435 2-in-1 | |
| LG Gram 14T90P | |
| HP Pavilion x360 14-dy0157ng | |
| PCMark 10 / Productivity | |
| Média AMD Ryzen 5 7530U, AMD Radeon RX Vega 7 (8983 - 14037, n=8) | |
| Dell Inspiron 14 7435 2-in-1 | |
| Lenovo IdeaPad Flex 7i 14IAU7 | |
| Acer Aspire 5 Spin 14 | |
| Dell Inspiron 14 7420 2-in-1 | |
| LG Gram 14T90P | |
| HP Pavilion x360 14-dy0157ng | |
| PCMark 10 / Digital Content Creation | |
| Dell Inspiron 14 7435 2-in-1 | |
| Dell Inspiron 14 7420 2-in-1 | |
| Lenovo IdeaPad Flex 7i 14IAU7 | |
| Acer Aspire 5 Spin 14 | |
| Média AMD Ryzen 5 7530U, AMD Radeon RX Vega 7 (4941 - 6093, n=8) | |
| HP Pavilion x360 14-dy0157ng | |
| LG Gram 14T90P | |
| CrossMark / Overall | |
| Acer Aspire 5 Spin 14 | |
| Lenovo IdeaPad Flex 7i 14IAU7 | |
| Dell Inspiron 14 7420 2-in-1 | |
| LG Gram 14T90P | |
| Média AMD Ryzen 5 7530U, AMD Radeon RX Vega 7 (1029 - 1336, n=7) | |
| Dell Inspiron 14 7435 2-in-1 | |
| CrossMark / Productivity | |
| Acer Aspire 5 Spin 14 | |
| Dell Inspiron 14 7420 2-in-1 | |
| Lenovo IdeaPad Flex 7i 14IAU7 | |
| LG Gram 14T90P | |
| Média AMD Ryzen 5 7530U, AMD Radeon RX Vega 7 (1115 - 1370, n=7) | |
| Dell Inspiron 14 7435 2-in-1 | |
| CrossMark / Creativity | |
| Lenovo IdeaPad Flex 7i 14IAU7 | |
| Dell Inspiron 14 7420 2-in-1 | |
| Acer Aspire 5 Spin 14 | |
| Média AMD Ryzen 5 7530U, AMD Radeon RX Vega 7 (992 - 1390, n=7) | |
| Dell Inspiron 14 7435 2-in-1 | |
| LG Gram 14T90P | |
| CrossMark / Responsiveness | |
| Acer Aspire 5 Spin 14 | |
| LG Gram 14T90P | |
| Dell Inspiron 14 7420 2-in-1 | |
| Lenovo IdeaPad Flex 7i 14IAU7 | |
| Dell Inspiron 14 7435 2-in-1 | |
| Média AMD Ryzen 5 7530U, AMD Radeon RX Vega 7 (900 - 1096, n=7) | |
| PCMark 10 Score | 6001 pontos | |
Ajuda | ||
| AIDA64 / Memory Copy | |
| LG Gram 14T90P | |
| Lenovo IdeaPad Flex 7i 14IAU7 | |
| Acer Aspire 5 Spin 14 | |
| HP Pavilion x360 14-dy0157ng | |
| Dell Inspiron 14 7420 2-in-1 | |
| Dell Inspiron 14 7435 2-in-1 | |
| Média AMD Ryzen 5 7530U (20155 - 42853, n=9) | |
| AIDA64 / Memory Read | |
| LG Gram 14T90P | |
| Lenovo IdeaPad Flex 7i 14IAU7 | |
| HP Pavilion x360 14-dy0157ng | |
| Acer Aspire 5 Spin 14 | |
| Dell Inspiron 14 7420 2-in-1 | |
| Dell Inspiron 14 7435 2-in-1 | |
| Média AMD Ryzen 5 7530U (23068 - 40270, n=9) | |
| AIDA64 / Memory Write | |
| Acer Aspire 5 Spin 14 | |
| LG Gram 14T90P | |
| Lenovo IdeaPad Flex 7i 14IAU7 | |
| HP Pavilion x360 14-dy0157ng | |
| Dell Inspiron 14 7420 2-in-1 | |
| Dell Inspiron 14 7435 2-in-1 | |
| Média AMD Ryzen 5 7530U (22954 - 41838, n=9) | |
| AIDA64 / Memory Latency | |
| Dell Inspiron 14 7435 2-in-1 | |
| Acer Aspire 5 Spin 14 | |
| Média AMD Ryzen 5 7530U (88.1 - 110.8, n=9) | |
| Lenovo IdeaPad Flex 7i 14IAU7 | |
| LG Gram 14T90P | |
| HP Pavilion x360 14-dy0157ng | |
| Dell Inspiron 14 7420 2-in-1 | |
* ... menor é melhor
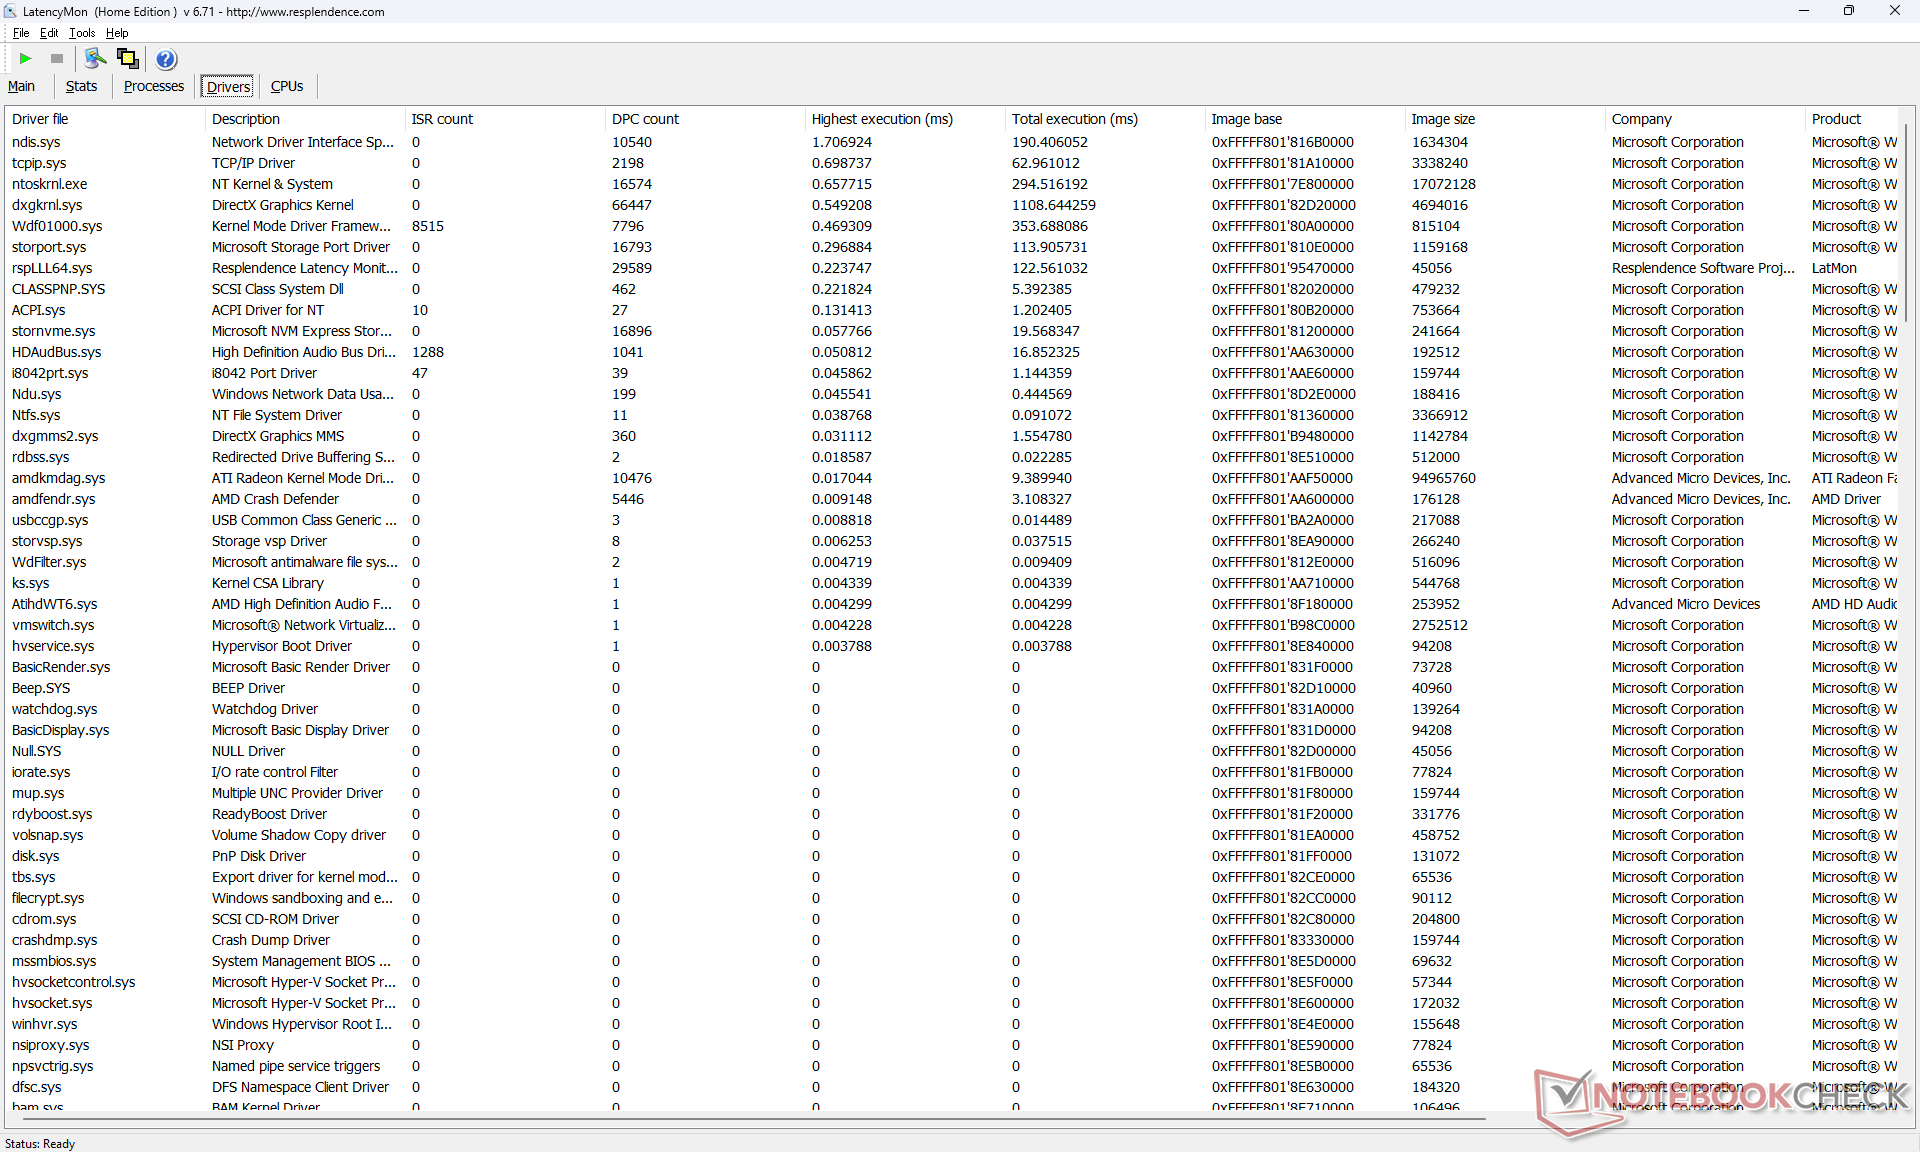
Latência DPC
O LatencyMon revela pequenos problemas de DPC ao abrir várias guias do navegador em nossa página inicial. a reprodução de vídeo 4K a 60 FPS é perfeita, sem registro de queda de quadros.

| DPC Latencies / LatencyMon - interrupt to process latency (max), Web, Youtube, Prime95 | |
| Acer Aspire 5 Spin 14 | |
| Dell Inspiron 14 7435 2-in-1 | |
| LG Gram 14T90P | |
| HP Pavilion x360 14-dy0157ng | |
| Lenovo IdeaPad Flex 7i 14IAU7 | |
| Dell Inspiron 14 7420 2-in-1 | |
* ... menor é melhor
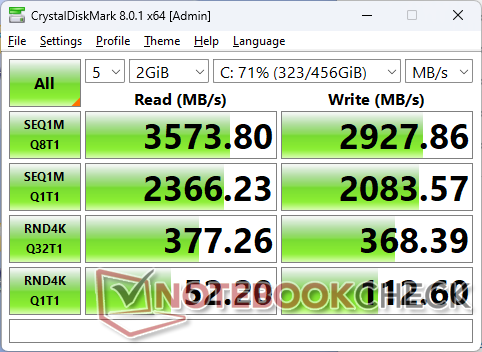
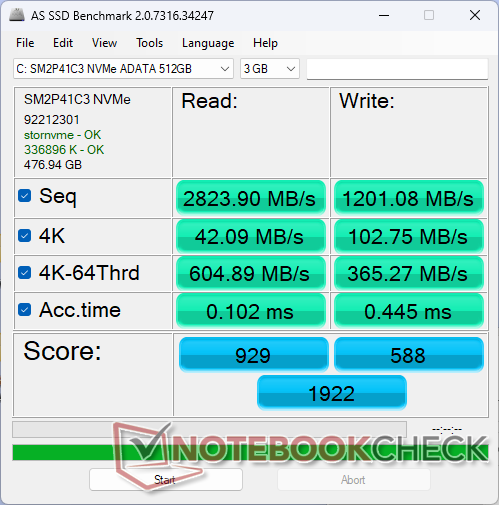
Dispositivos de armazenamento
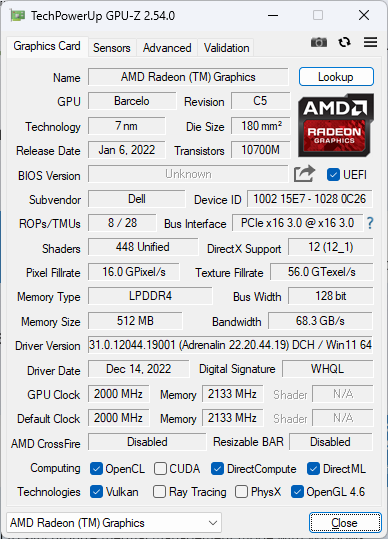
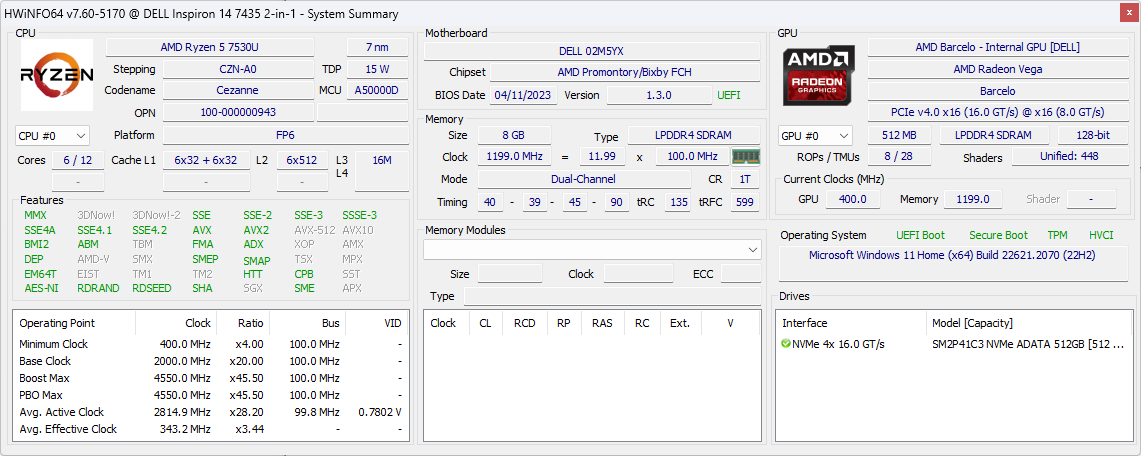
Nossa unidade de teste vem com um modelo econômico de 512 GB ADATA SM2P41C3 PCIe4 x4 NVMe de 512 GB, que oferece taxas de leitura e gravação de até 3600 MB/s e 3000 MB/s, respectivamente. Ele se equilibra bem com a CPU Ryzen 5, já que SSDs super-rápidos são de pouca utilidade para o público-alvo de usuários domésticos ou estudantes casuais.
Não há opções de SSD secundário interno, ao contrário do mais caroLG Gram 14T90P conversível.

| Drive Performance rating - Percent | |
| Acer Aspire 5 Spin 14 | |
| LG Gram 14T90P | |
| Lenovo IdeaPad Flex 7i 14IAU7 | |
| HP Pavilion x360 14-dy0157ng | |
| Dell Inspiron 14 7420 2-in-1 | |
| Dell Inspiron 14 7435 2-in-1 | |
* ... menor é melhor
Disk Throttling: DiskSpd Read Loop, Queue Depth 8
Desempenho da GPU - Radeon RX Vega mais antiga
O Ryzen 5 7530U e o Ryzen 7 7730U são executados em placas de vídeo integradas mais antigas Radeon RX Vega integrados mais antigos em vez da mais recente Radeon 680M ou 780M o que é uma pena, pois as soluções mais novas podem ser até 2x a 2,5x mais rápidas. Além de jogos pouco exigentes, como o Dota 2 Reborn, o sistema não consegue lidar com títulos modernos, especialmente quando se considera seus limitados 8 GB de RAM. O F1 22, por exemplo, só funcionava em configurações muito baixas, pois qualquer configuração mais alta travava.
As taxas de quadros caíam periodicamente para a casa dos 50, antes de voltarem para a casa dos 60, quando ocioso em Witcher 3. As quedas ocorriam em intervalos consistentes, conforme mostrado no gráfico de FPS abaixo, o que sugere uma manipulação inadequada dos aplicativos ativos em segundo plano.
O desempenho geral é reduzido em cerca de 10% quando executado no modo balanceado, conforme mostra a tabela do 3DMark 11 abaixo.
| Perfil de energia | Pontuação de gráficos | Pontuação de física | Pontuação combinada |
| Bateria | 5798 (-4%) | 11906 (-5%) | 4161 (-6%) |
| Equilibrada | 5472 (-9%) | 10908 (-13%) | 4195 (-5%) |
| Desempenho | 6024 | 12492 | 4419 |
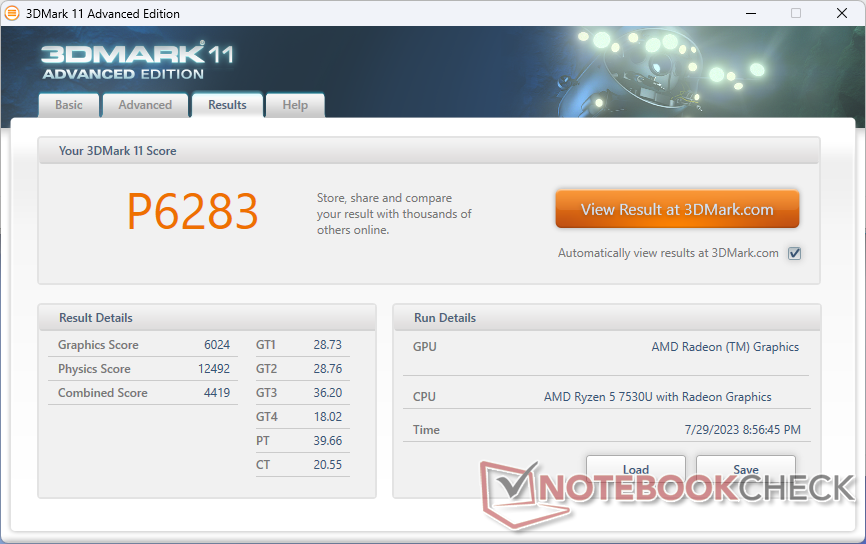
| 3DMark 11 Performance | 6283 pontos | |
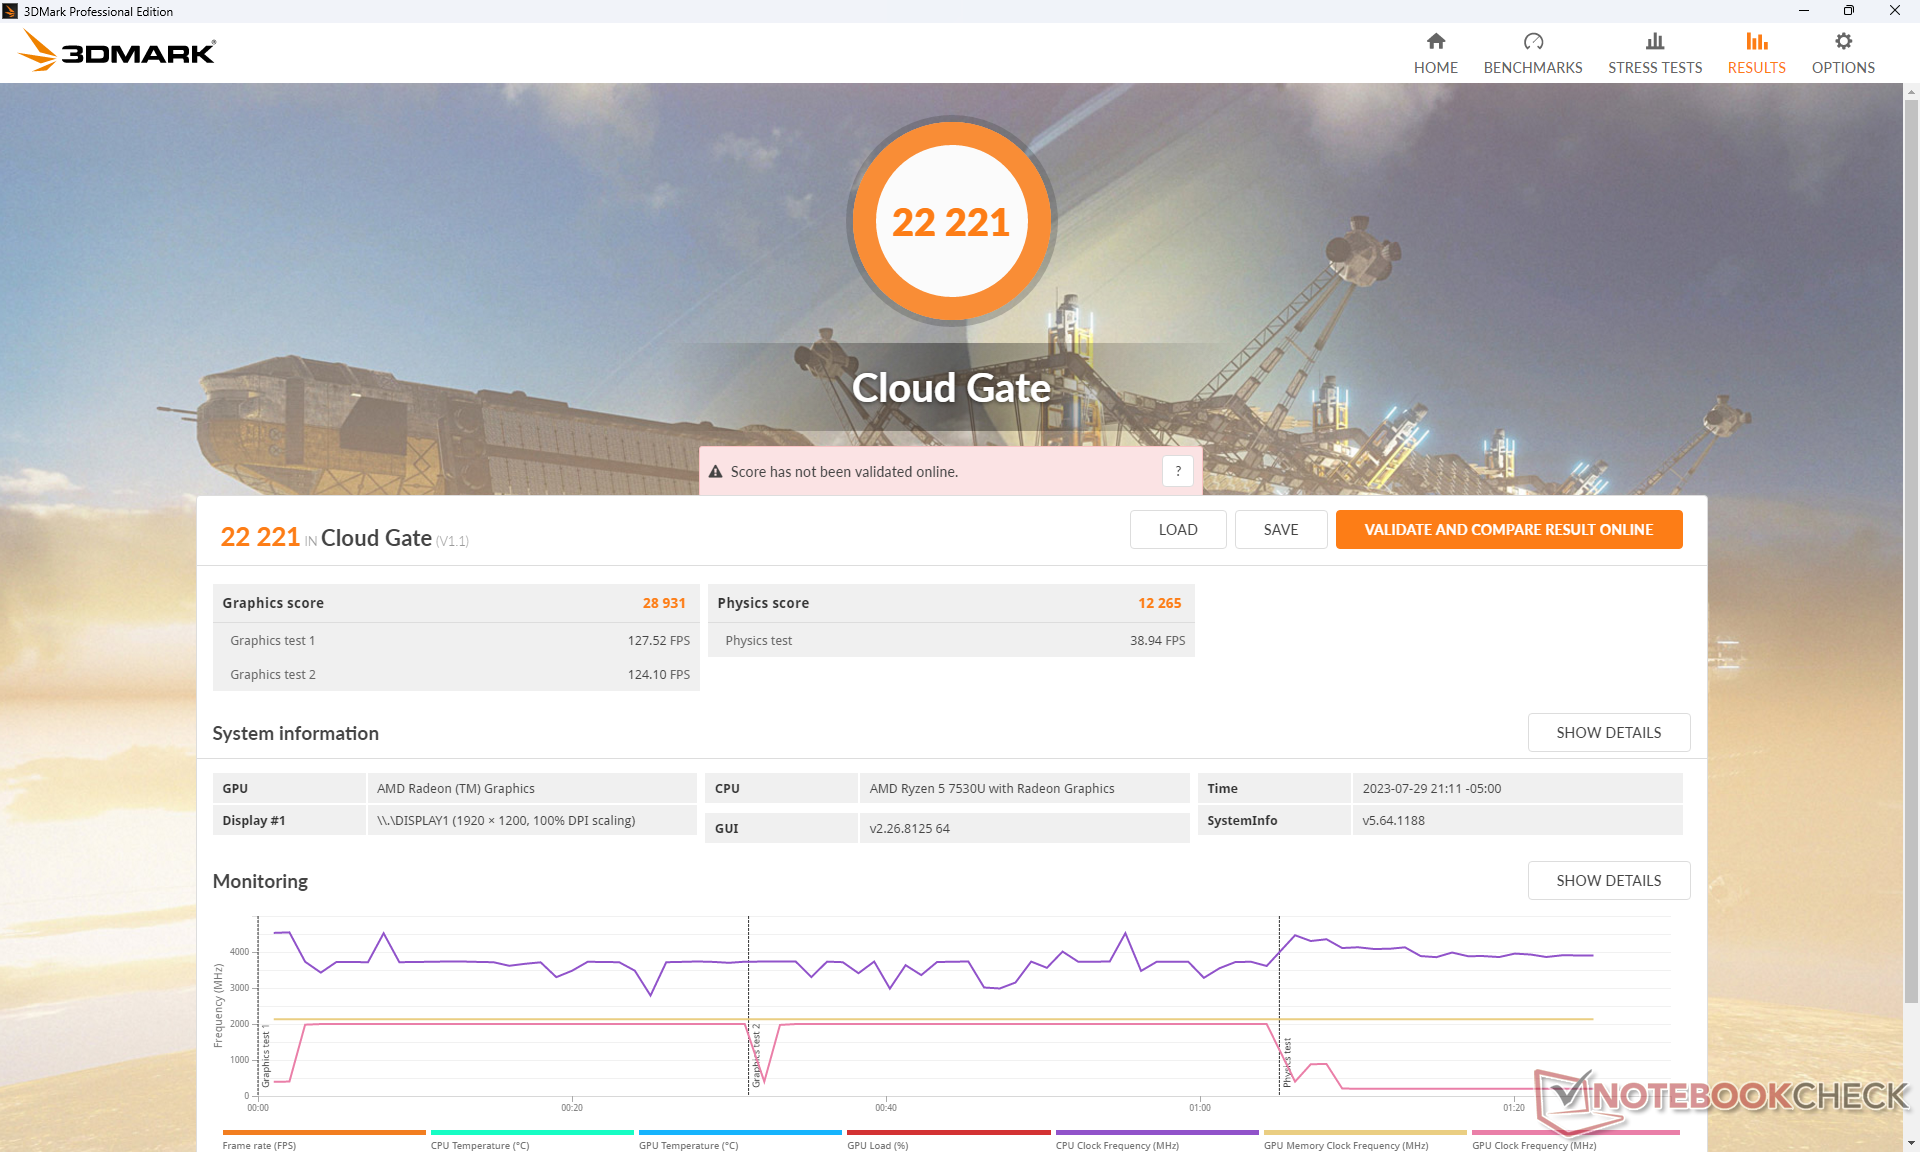
| 3DMark Cloud Gate Standard Score | 22221 pontos | |
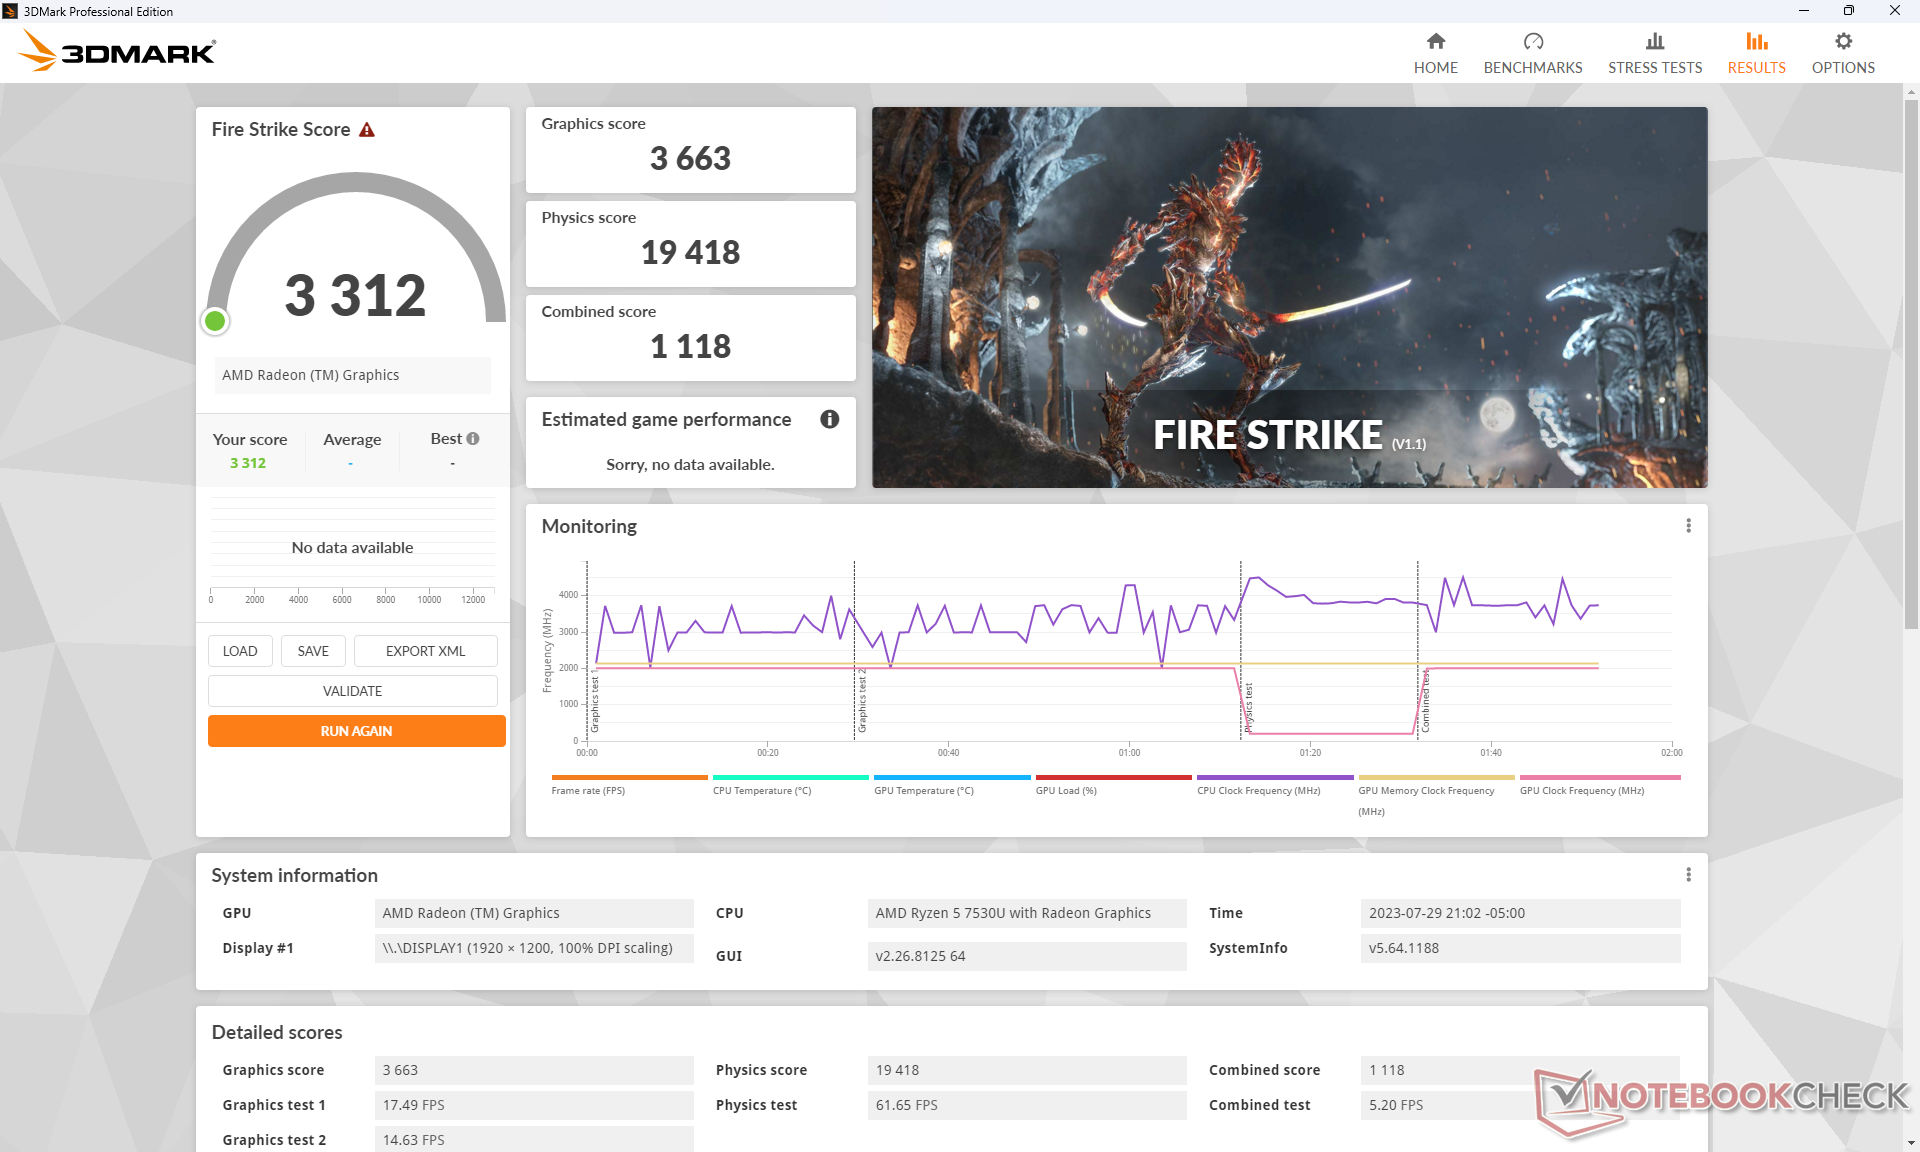
| 3DMark Fire Strike Score | 3312 pontos | |
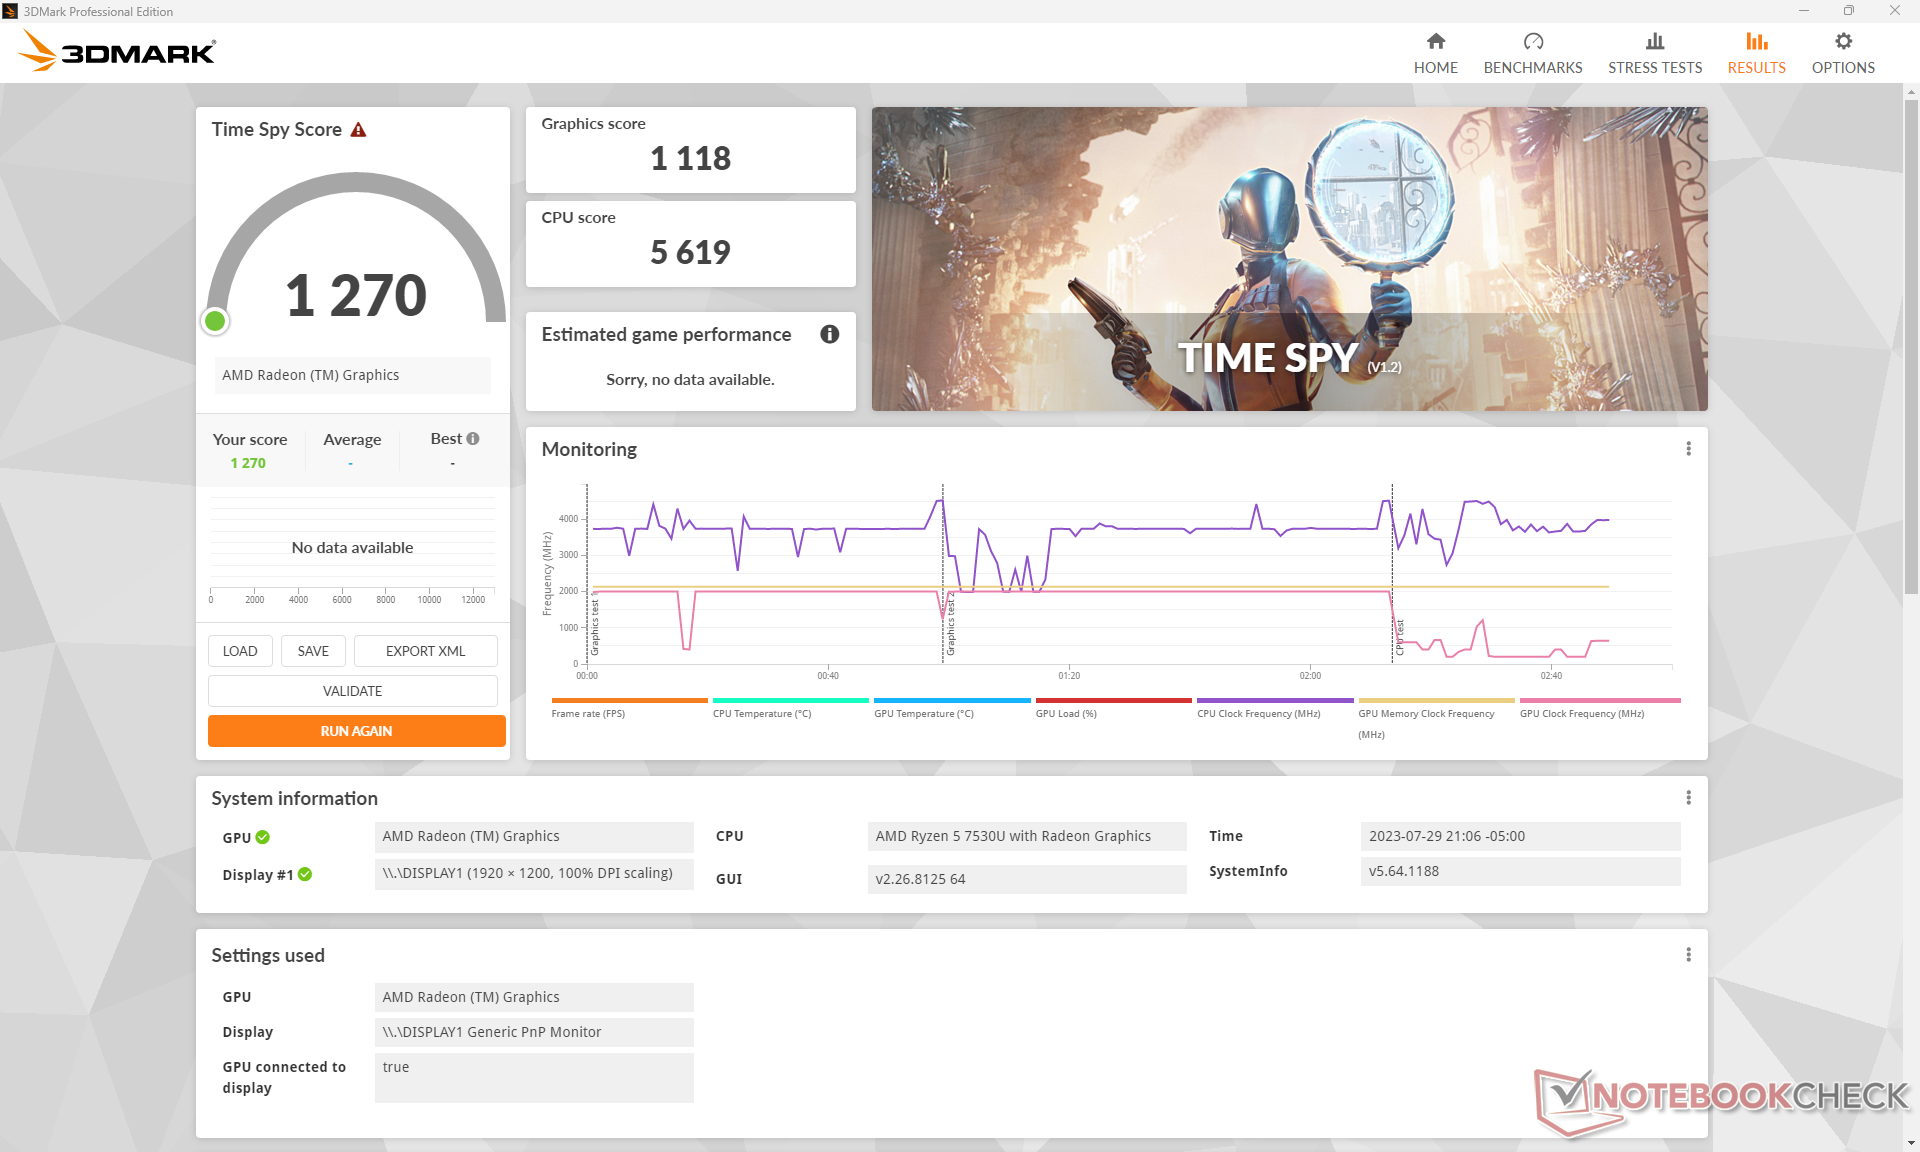
| 3DMark Time Spy Score | 1270 pontos | |
Ajuda | ||
| F1 22 - 1280x720 Ultra Low Preset AA:T AF:16x | |
| Dell Latitude 9440 2-in-1 | |
| Lenovo ThinkPad X1 Yoga G8 i7-1355U | |
| Média AMD Radeon RX Vega 7 (43.6 - 80.8, n=11) | |
| Dell Inspiron 14 7435 2-in-1 | |
| Tiny Tina's Wonderlands - 1280x720 Lowest Preset (DX12) | |
| Média AMD Radeon RX Vega 7 (49.7 - 70.4, n=7) | |
| Dell Inspiron 14 7435 2-in-1 | |
| Dell Latitude 9440 2-in-1 | |
| Lenovo ThinkPad X1 Yoga G8 i7-1355U | |
Witcher 3 FPS Chart
| baixo | média | alto | ultra | |
|---|---|---|---|---|
| GTA V (2015) | 107.7 | 25.7 | 10.2 | |
| The Witcher 3 (2015) | 76 | 21.5 | 14.5 | |
| Dota 2 Reborn (2015) | 107.4 | 87.3 | 49.9 | 47.1 |
| Final Fantasy XV Benchmark (2018) | 35.1 | 17.5 | 12.1 | |
| X-Plane 11.11 (2018) | 37.4 | 29.5 | 26.4 | |
| Strange Brigade (2018) | 79.5 | 31.4 | 25.6 | 22.3 |
| Cyberpunk 2077 1.6 (2022) | 16.3 | 12.8 | 8.9 | 6.7 |
| Tiny Tina's Wonderlands (2022) | 26.5 | |||
| F1 22 (2022) |
Emissões
Ruído do sistema
O ventilador interno tende a pulsar entre ocioso e 33,3 dB(A) ao navegar na Web ou fazer streaming de vídeo. Os aumentos no ruído do ventilador tendem a ser repentinos e acentuados, em vez de graduais, o que, infelizmente, torna o ruído mais perceptível.
Cargas altas e consistentes, como jogos, induziriam um ruído do ventilador de quase 41 dB(A) se estivessem no modo Performance. No modo Balanced, o ruído do ventilador cairia ligeiramente para 39,8 dB(A).
Percebemos um leve zumbido da bobina ou ruído eletrônico em nossa unidade de teste e, portanto, ela nunca é realmente silenciosa, mesmo quando a ventoinha está ociosa. A faixa baixa de 40 dB(A) é mais silenciosa que a do Acer Aspire 5 Spin 14, mas é mais alta que a doLG Gram 14T90P.
Barulho
| Ocioso |
| 23.2 / 23.2 / 23.2 dB |
| Carga |
| 33 / 41.3 dB |
 | ||
30 dB silencioso 40 dB(A) audível 50 dB(A) ruidosamente alto |
||
min: | ||
| Dell Inspiron 14 7435 2-in-1 Vega 7, R5 7530U | Dell Inspiron 14 7420 2-in-1 Iris Xe G7 96EUs, i7-1255U, WDC PC SN530 SDBPMPZ-512G | Lenovo IdeaPad Flex 7i 14IAU7 Iris Xe G7 96EUs, i7-1255U, Samsung PM9B1 512GB MZAL4512HBLU | Acer Aspire 5 Spin 14 Iris Xe G7 80EUs, i5-1335U, Micron 2450 512GB MTFDKBA512TFK | LG Gram 14T90P Iris Xe G7 80EUs, i5-1135G7, Samsung SSD PM981a MZVLB512HBJQ | HP Pavilion x360 14-dy0157ng Iris Xe G7 80EUs, i5-1135G7, Toshiba KBG40ZNV512G | |
|---|---|---|---|---|---|---|
| Noise | -3% | 1% | -22% | 0% | -10% | |
| desligado / ambiente * (dB) | 22.8 | 23.1 -1% | 23.3 -2% | 26 -14% | 25.4 -11% | 27 -18% |
| Idle Minimum * (dB) | 23.2 | 24.7 -6% | 23.3 -0% | 27.7 -19% | 25.5 -10% | 27 -16% |
| Idle Average * (dB) | 23.2 | 24.7 -6% | 23.3 -0% | 27.7 -19% | 25.5 -10% | 27 -16% |
| Idle Maximum * (dB) | 23.2 | 24.7 -6% | 23.3 -0% | 29.7 -28% | 25.5 -10% | 27 -16% |
| Load Average * (dB) | 33 | 27.7 16% | 34.3 -4% | 46.3 -40% | 28.3 14% | 38.3 -16% |
| Witcher 3 ultra * (dB) | 40.9 | 45.1 -10% | 37.8 8% | 35 14% | ||
| Load Maximum * (dB) | 41.3 | 45.1 -9% | 37.8 8% | 45.4 -10% | 35 15% | 33.2 20% |
* ... menor é melhor
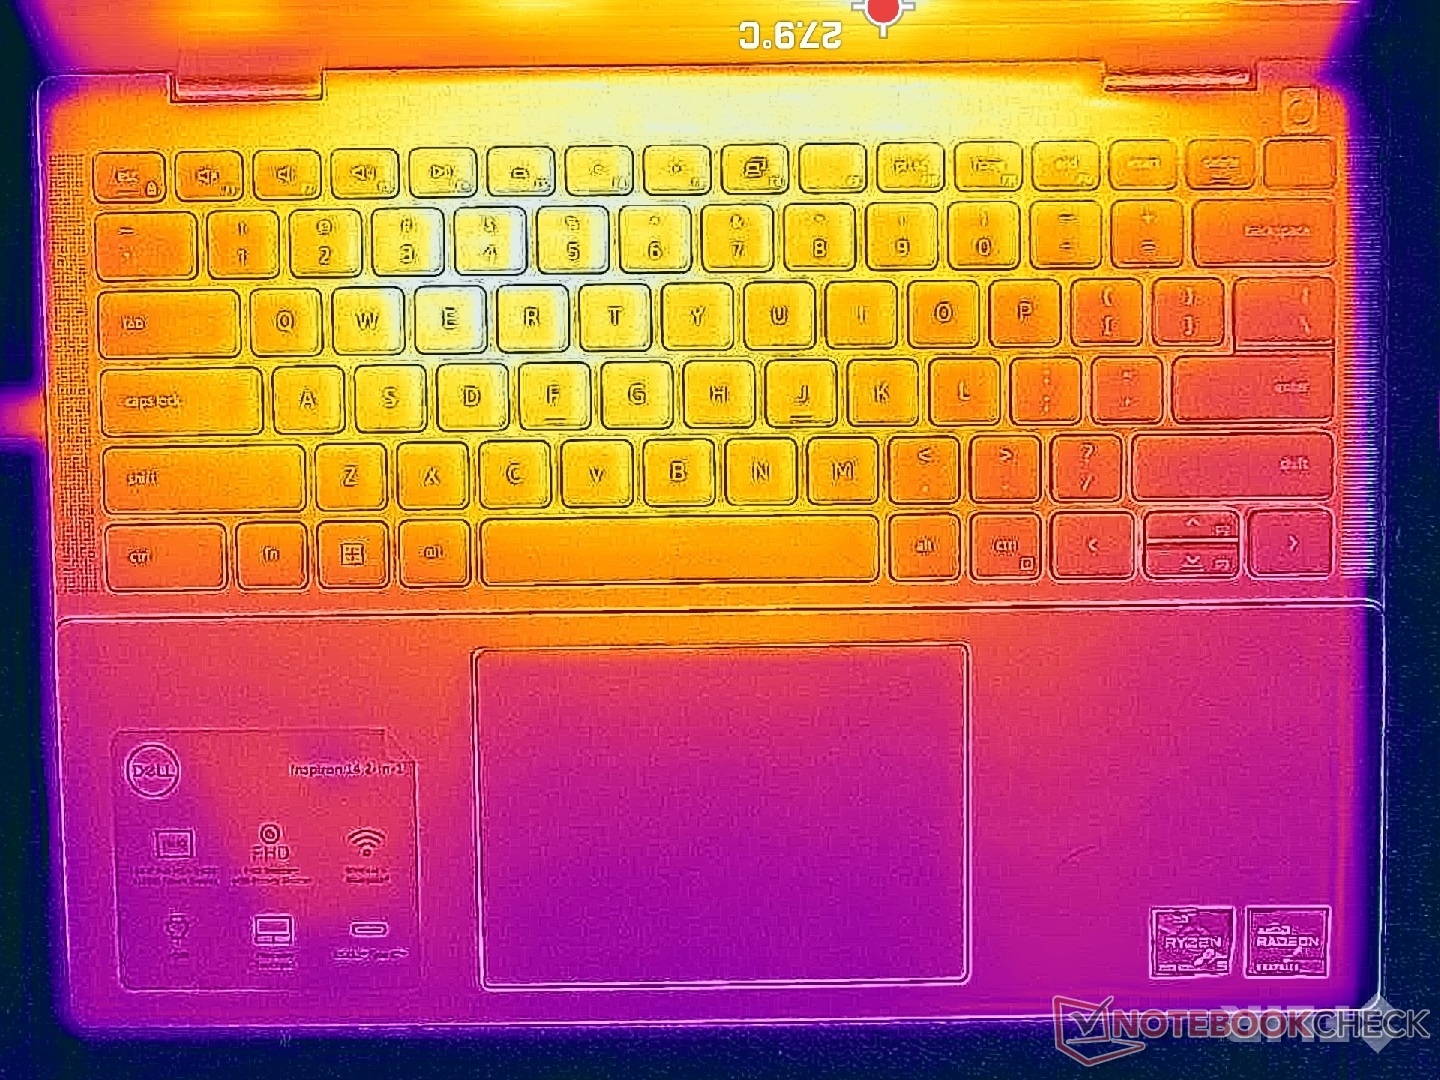
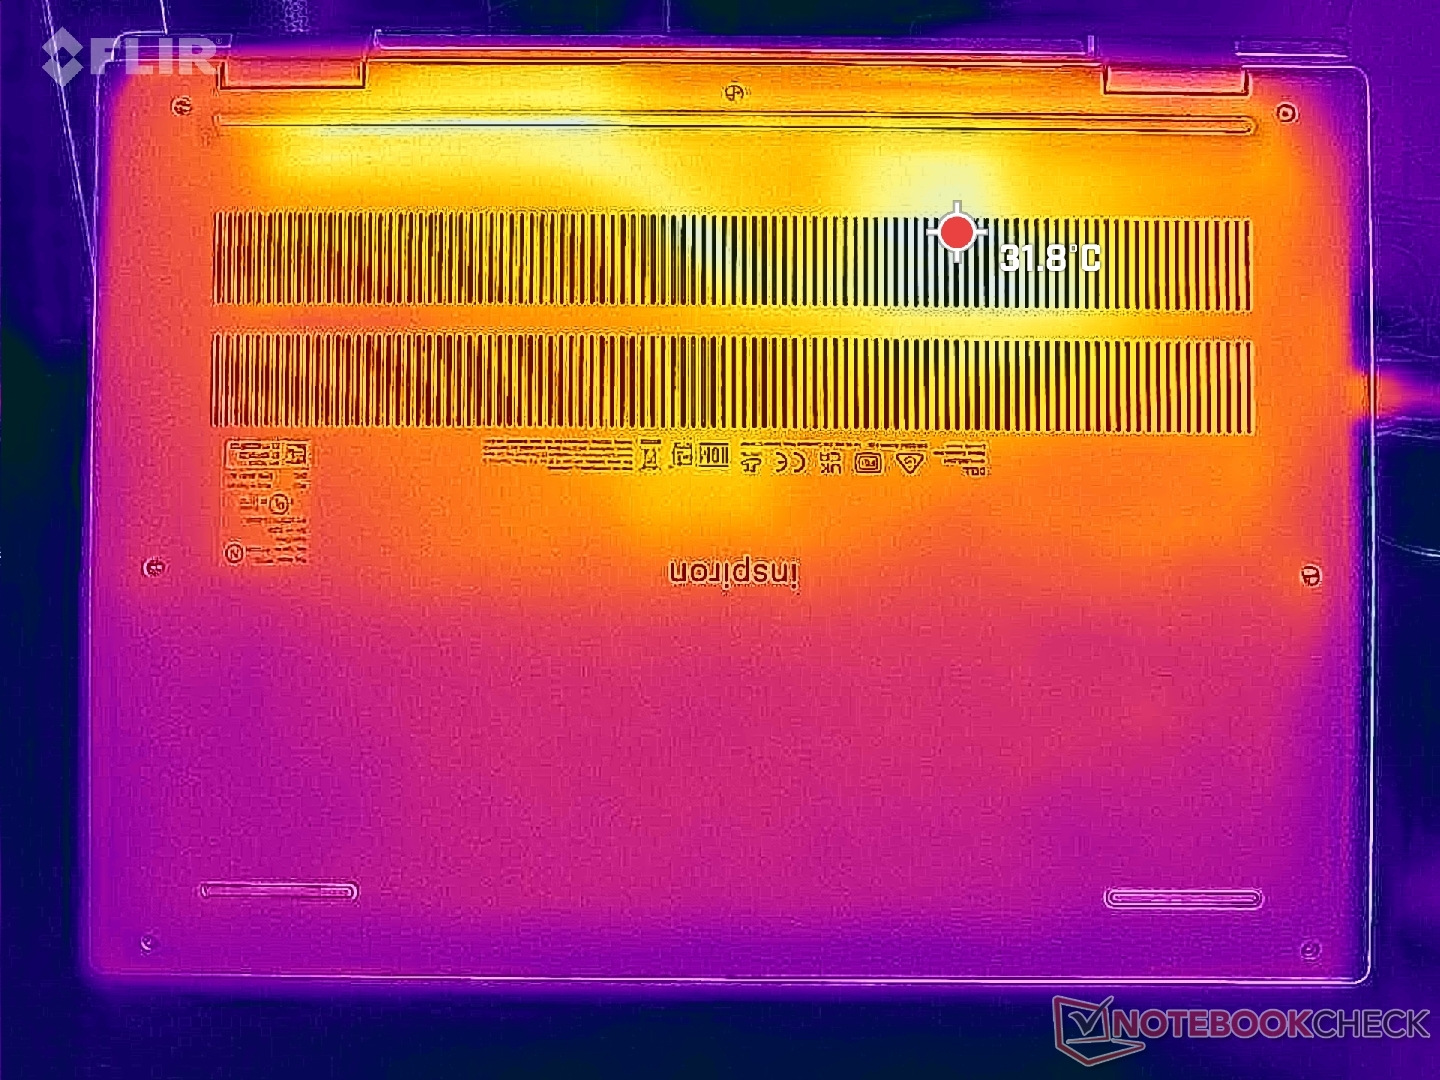
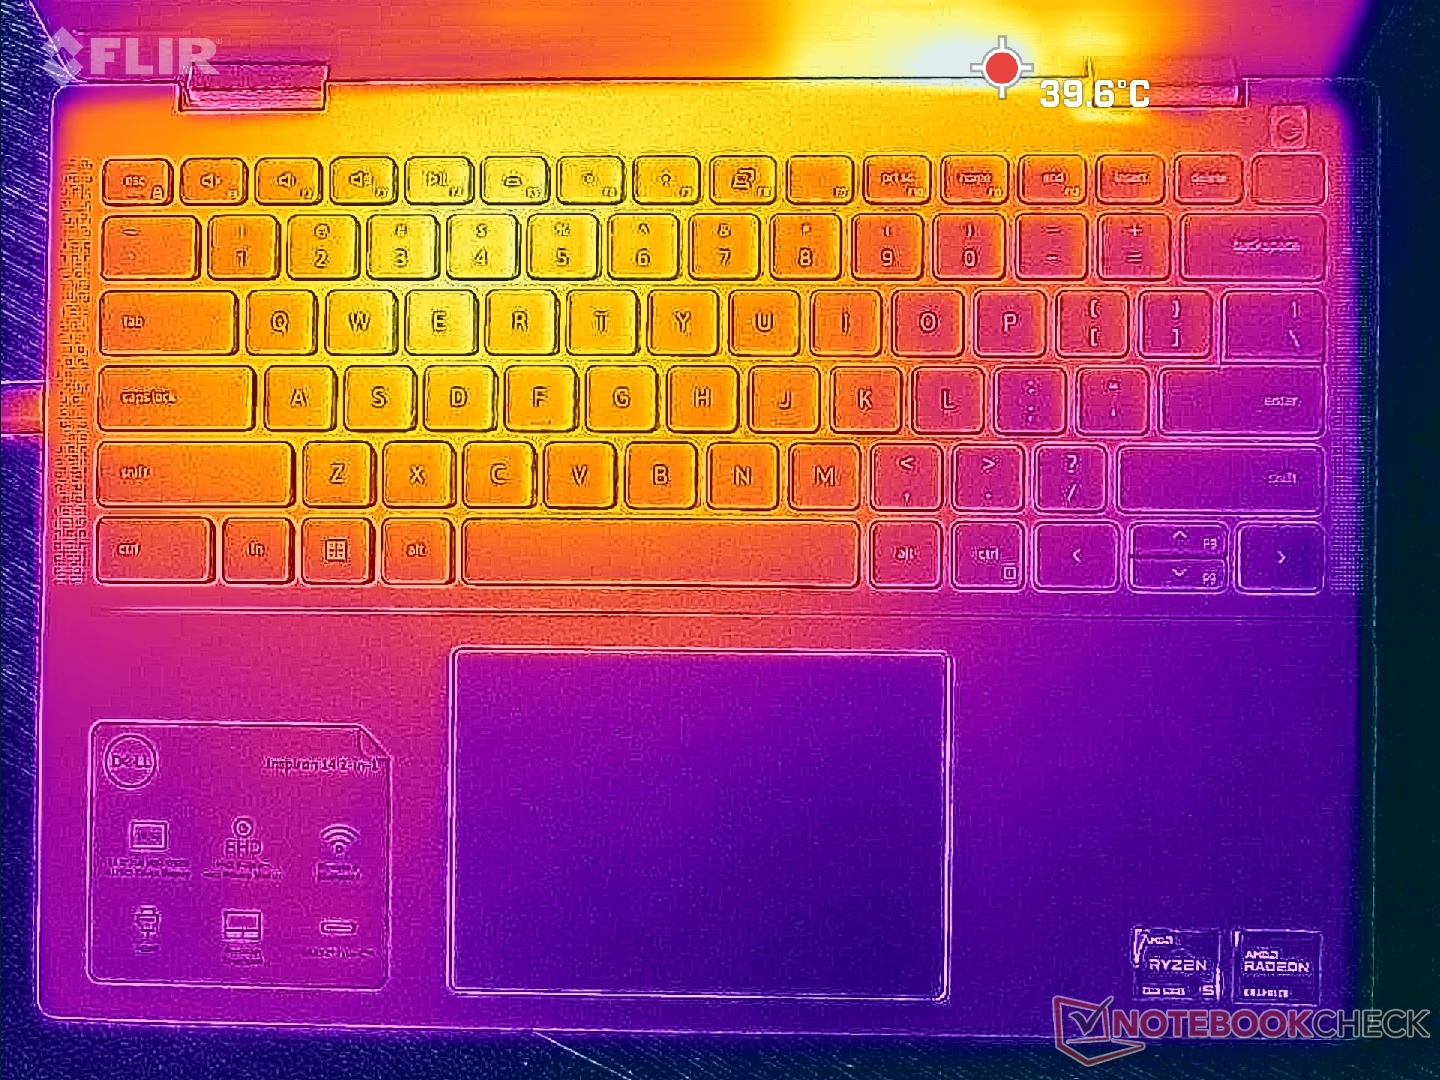
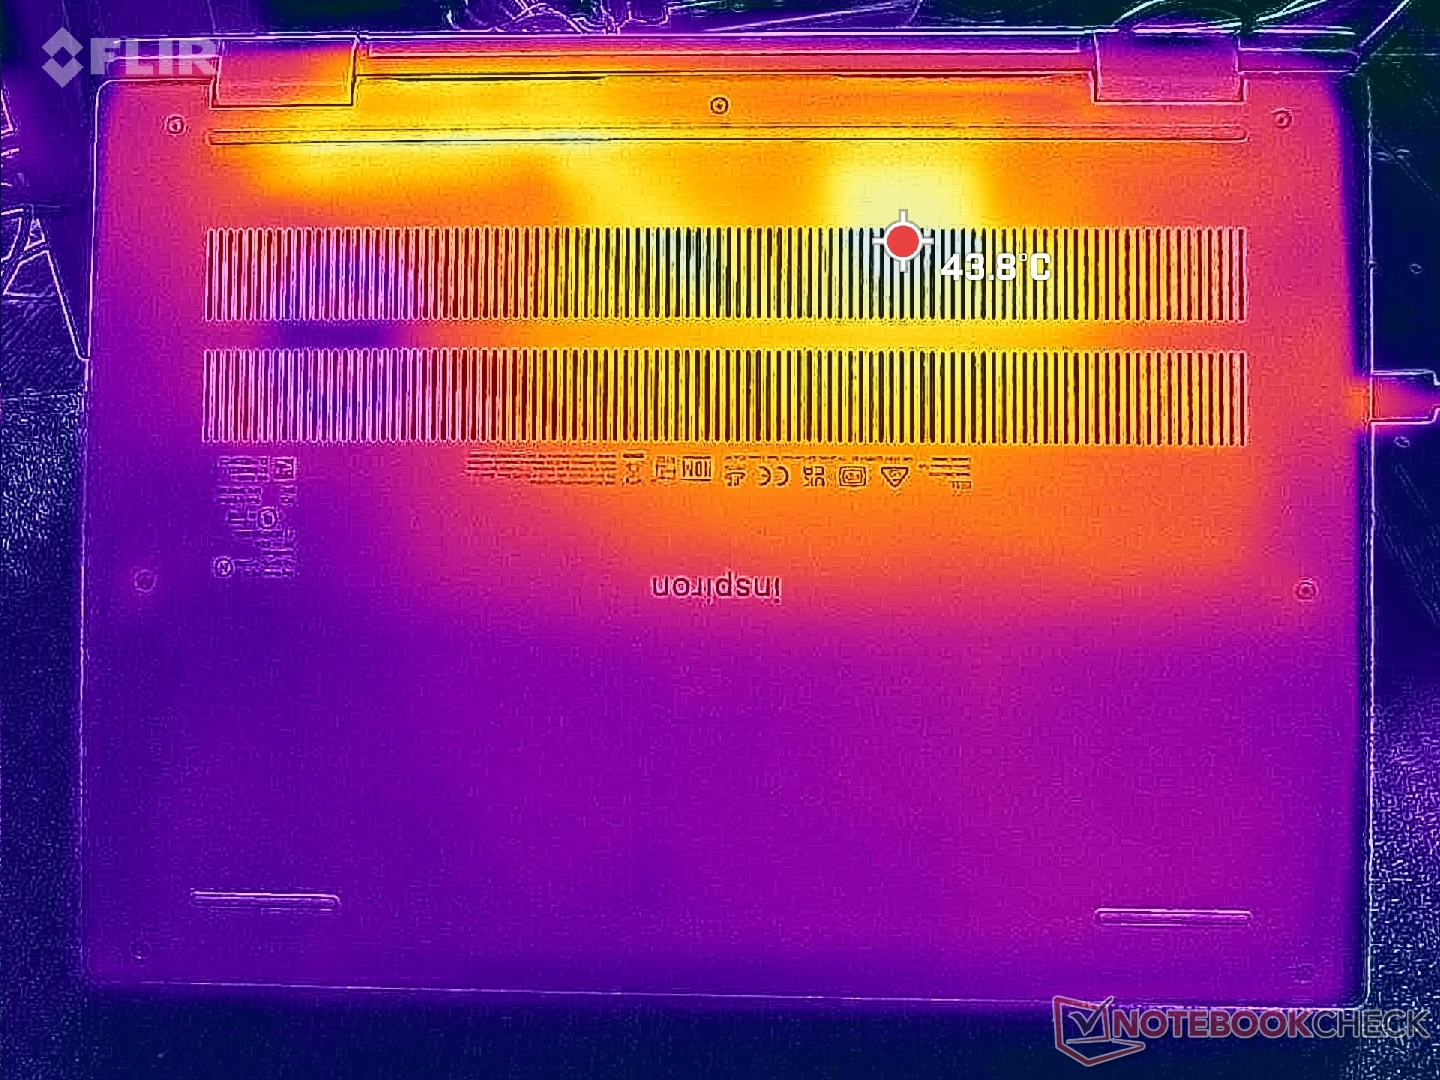
Temperatura
As temperaturas da superfície são mais baixas do que as registradas no Inspiron 14 7620 2 em 1 do ano passado. Quando sob carga, por exemplo, os pontos quentes na parte superior e inferior se aproximariam de apenas 36 °C e 39 °C, respectivamente, em comparação com 46 °C no modelo do ano passado. A faixa alta de 30 °C é comparável a modelos como o IdeaPad Flex 7i 14.
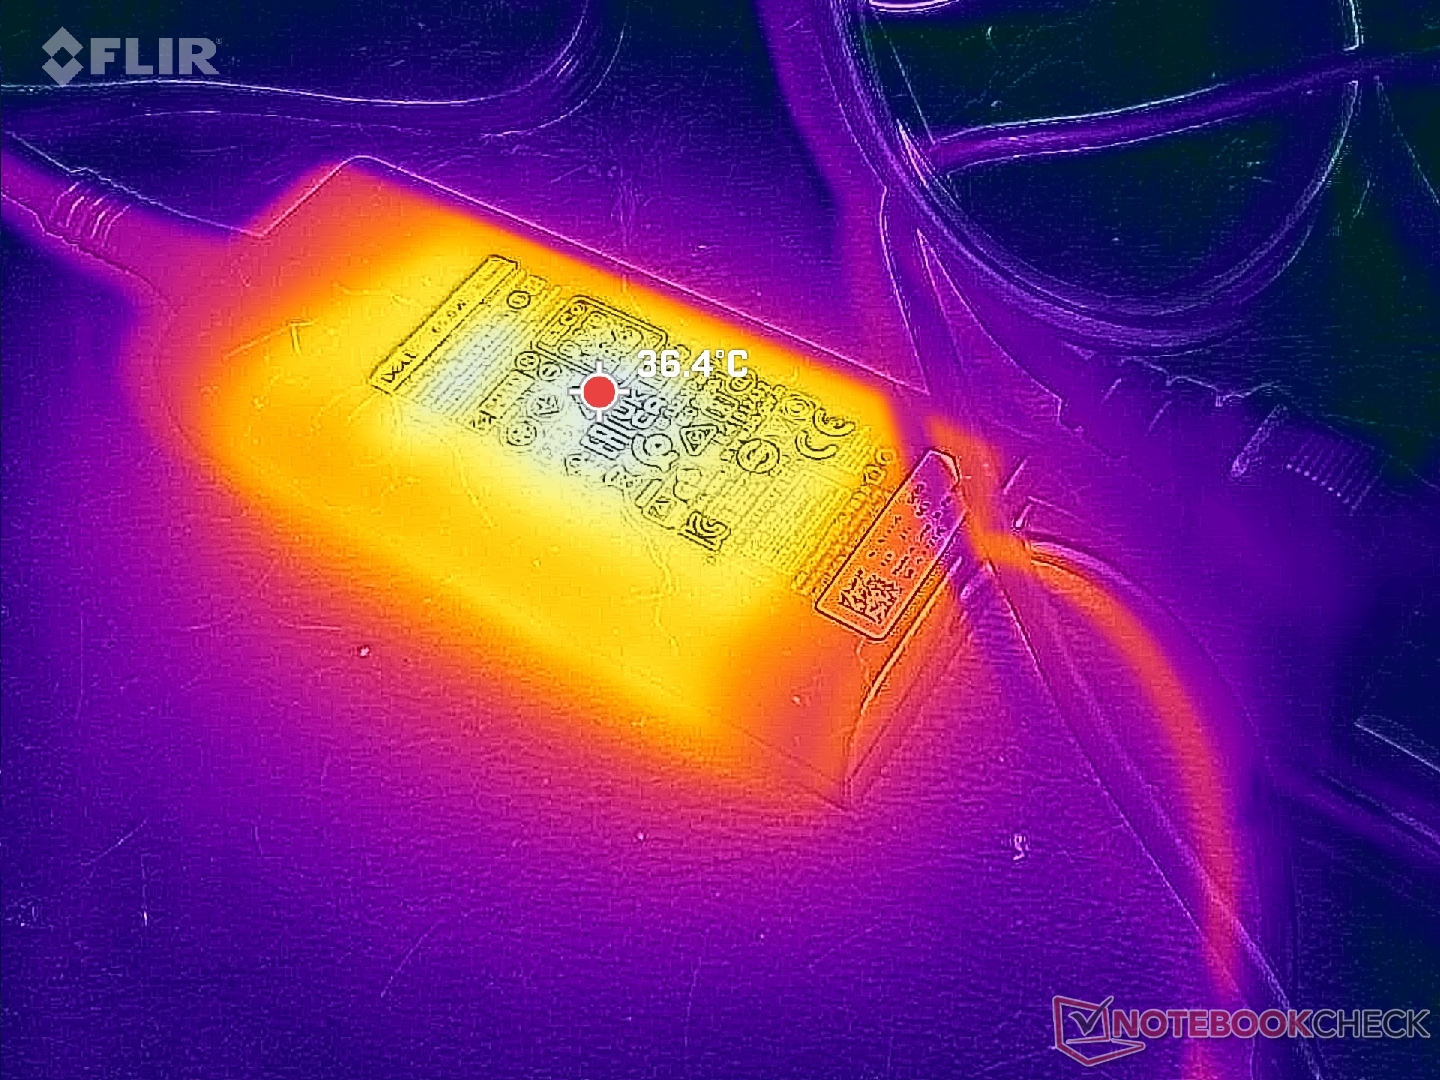
O adaptador CA também funcionaria mais frio, com cerca de 36 °C em vez de 46 °C.
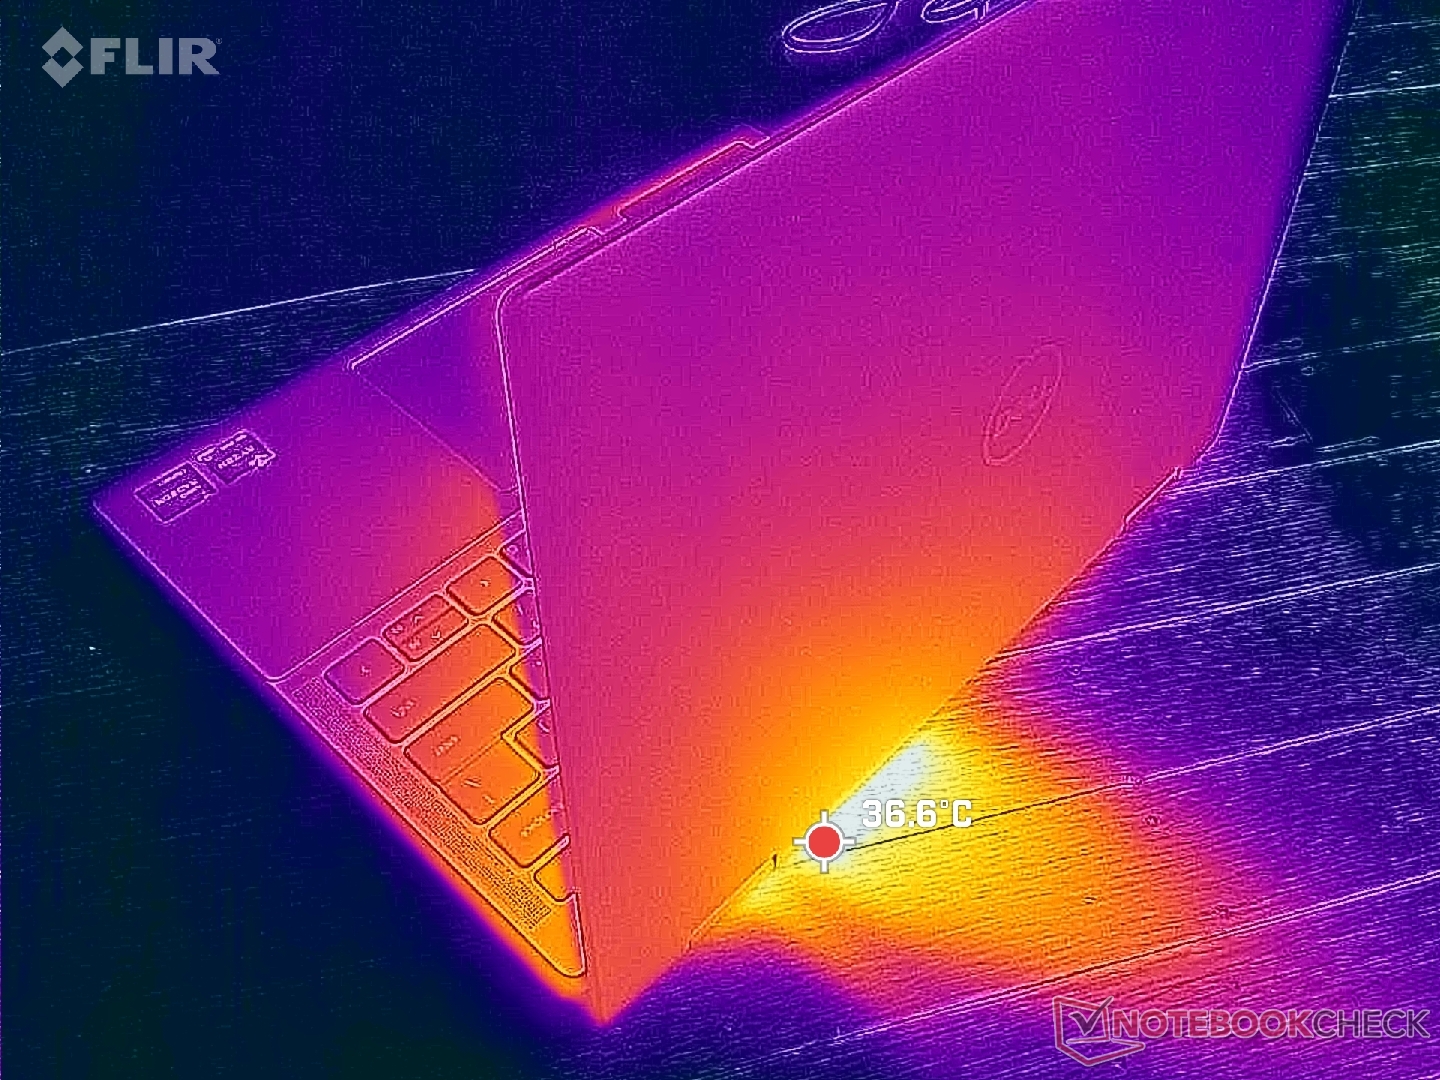
(+) A temperatura máxima no lado superior é 35.2 °C / 95 F, em comparação com a média de 35.4 °C / 96 F , variando de 19.6 a 60 °C para a classe Convertible.
(+) A parte inferior aquece até um máximo de 38.2 °C / 101 F, em comparação com a média de 36.9 °C / 98 F
(+) Em uso inativo, a temperatura média para o lado superior é 28.7 °C / 84 F, em comparação com a média do dispositivo de 30.3 °C / ### class_avg_f### F.
(+) Os apoios para as mãos e o touchpad são mais frios que a temperatura da pele, com um máximo de 26.6 °C / 79.9 F e, portanto, são frios ao toque.
(±) A temperatura média da área do apoio para as mãos de dispositivos semelhantes foi 28 °C / 82.4 F (+1.4 °C / 2.5 F).
| Dell Inspiron 14 7435 2-in-1 AMD Ryzen 5 7530U, AMD Radeon RX Vega 7 | Dell Inspiron 14 7420 2-in-1 Intel Core i7-1255U, Intel Iris Xe Graphics G7 96EUs | Lenovo IdeaPad Flex 7i 14IAU7 Intel Core i7-1255U, Intel Iris Xe Graphics G7 96EUs | Acer Aspire 5 Spin 14 Intel Core i5-1335U, Intel Iris Xe Graphics G7 80EUs | LG Gram 14T90P Intel Core i5-1135G7, Intel Iris Xe Graphics G7 80EUs | HP Pavilion x360 14-dy0157ng Intel Core i5-1135G7, Intel Iris Xe Graphics G7 80EUs | |
|---|---|---|---|---|---|---|
| Heat | -2% | 11% | -14% | 3% | -2% | |
| Maximum Upper Side * (°C) | 35.2 | 38.2 -9% | 35.4 -1% | 41.7 -18% | 41.6 -18% | 38.9 -11% |
| Maximum Bottom * (°C) | 38.2 | 45.6 -19% | 38.8 -2% | 54.4 -42% | 46.2 -21% | 40.3 -5% |
| Idle Upper Side * (°C) | 31.2 | 27.4 12% | 22.6 28% | 30.4 3% | 22.6 28% | 31.8 -2% |
| Idle Bottom * (°C) | 30.4 | 28.4 7% | 24.2 20% | 29.8 2% | 23.2 24% | 27.4 10% |
* ... menor é melhor
Teste de estresse
Ao executar o Prime95, a CPU aumentaria para 3,8 GHz e 34 W por apenas alguns segundos antes de cair e se estabilizar em 2,7 GHz e 20 W. A temperatura do núcleo permaneceria relativamente fria em 66 C, mesmo quando sob carga, o que é comparável ao Inspiron 14 7420 2 em 1 com tecnologia Intel em condições semelhantes. Suspeitamos que os SKUs Ryzen 7 ou Core i7 mais avançados funcionariam mais quentes do que o que registramos em nossa configuração básica do Ryzen 5.
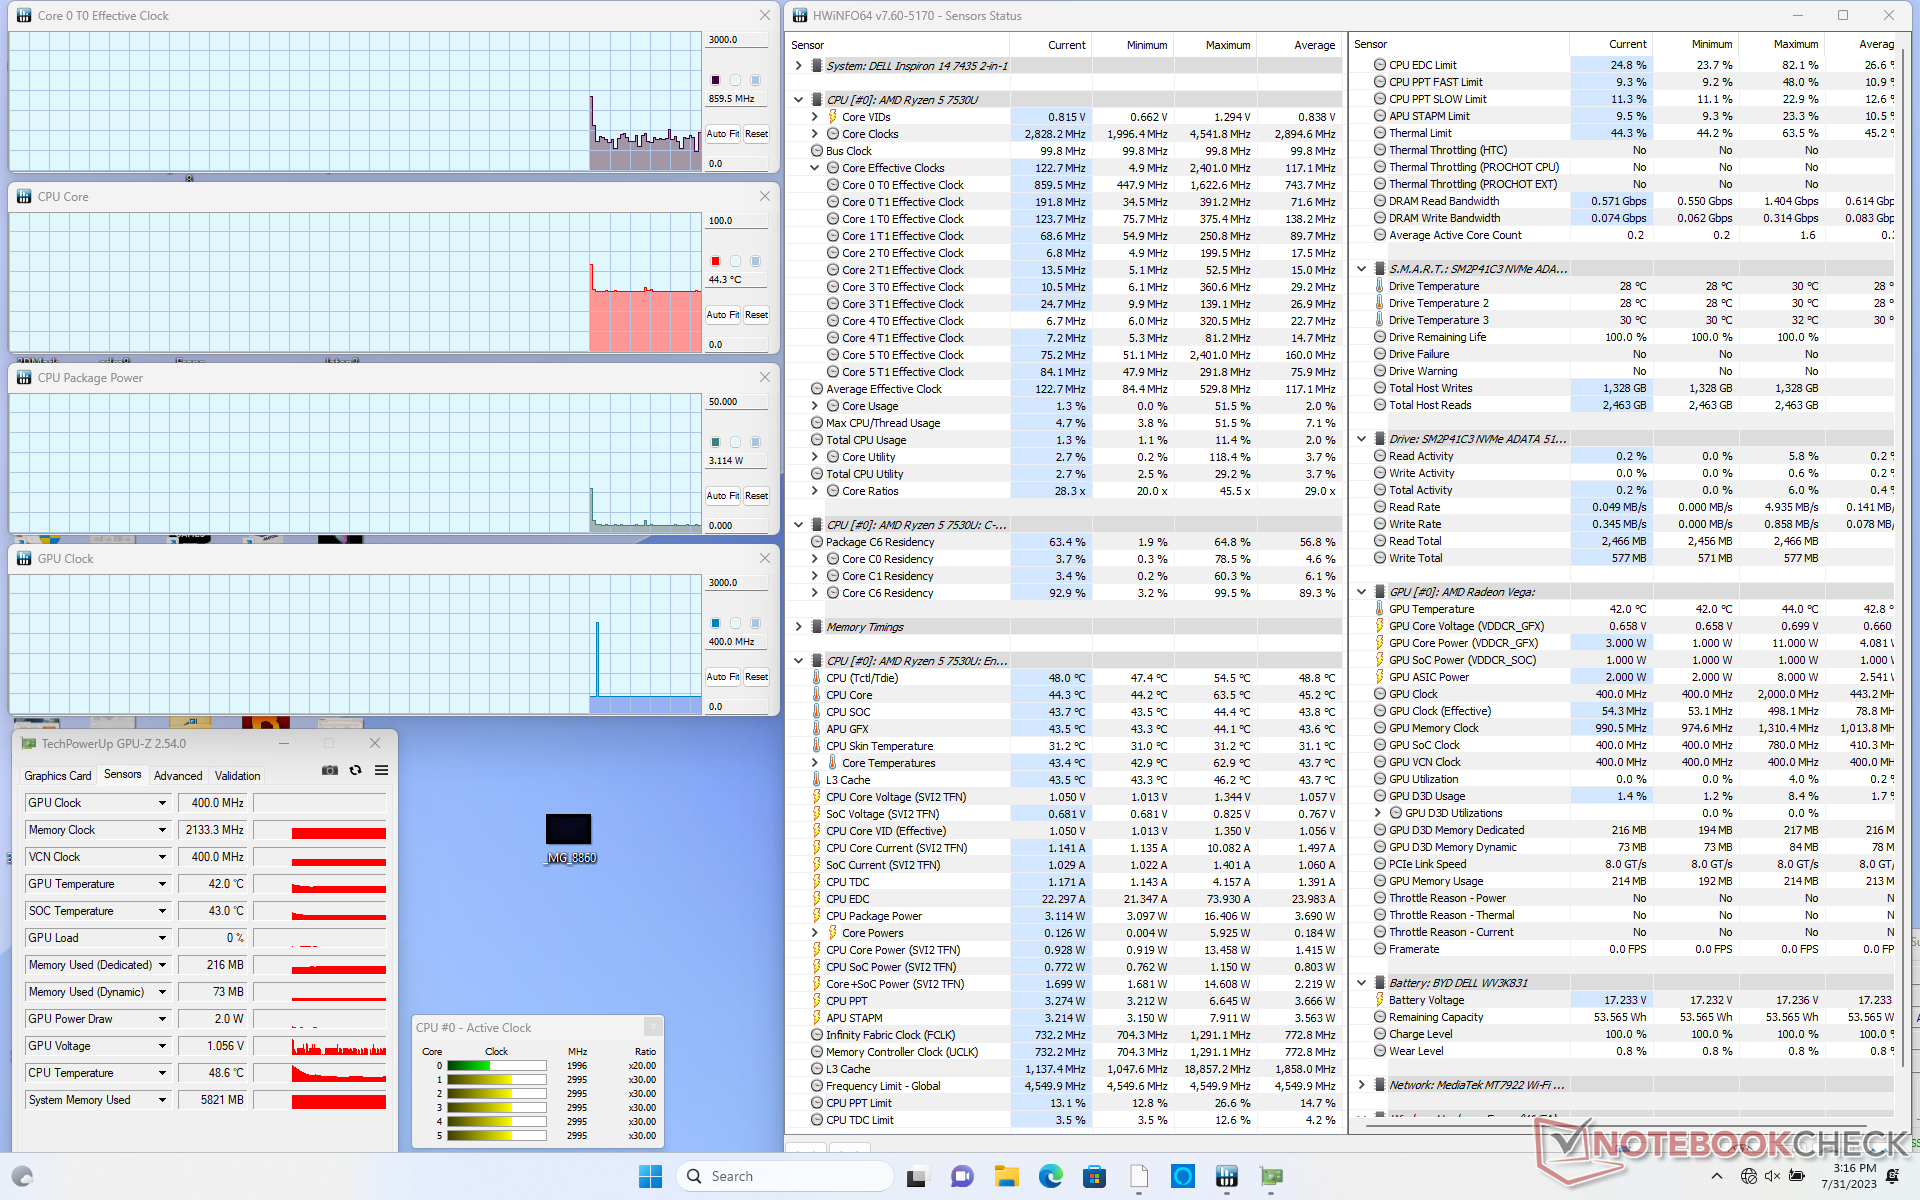
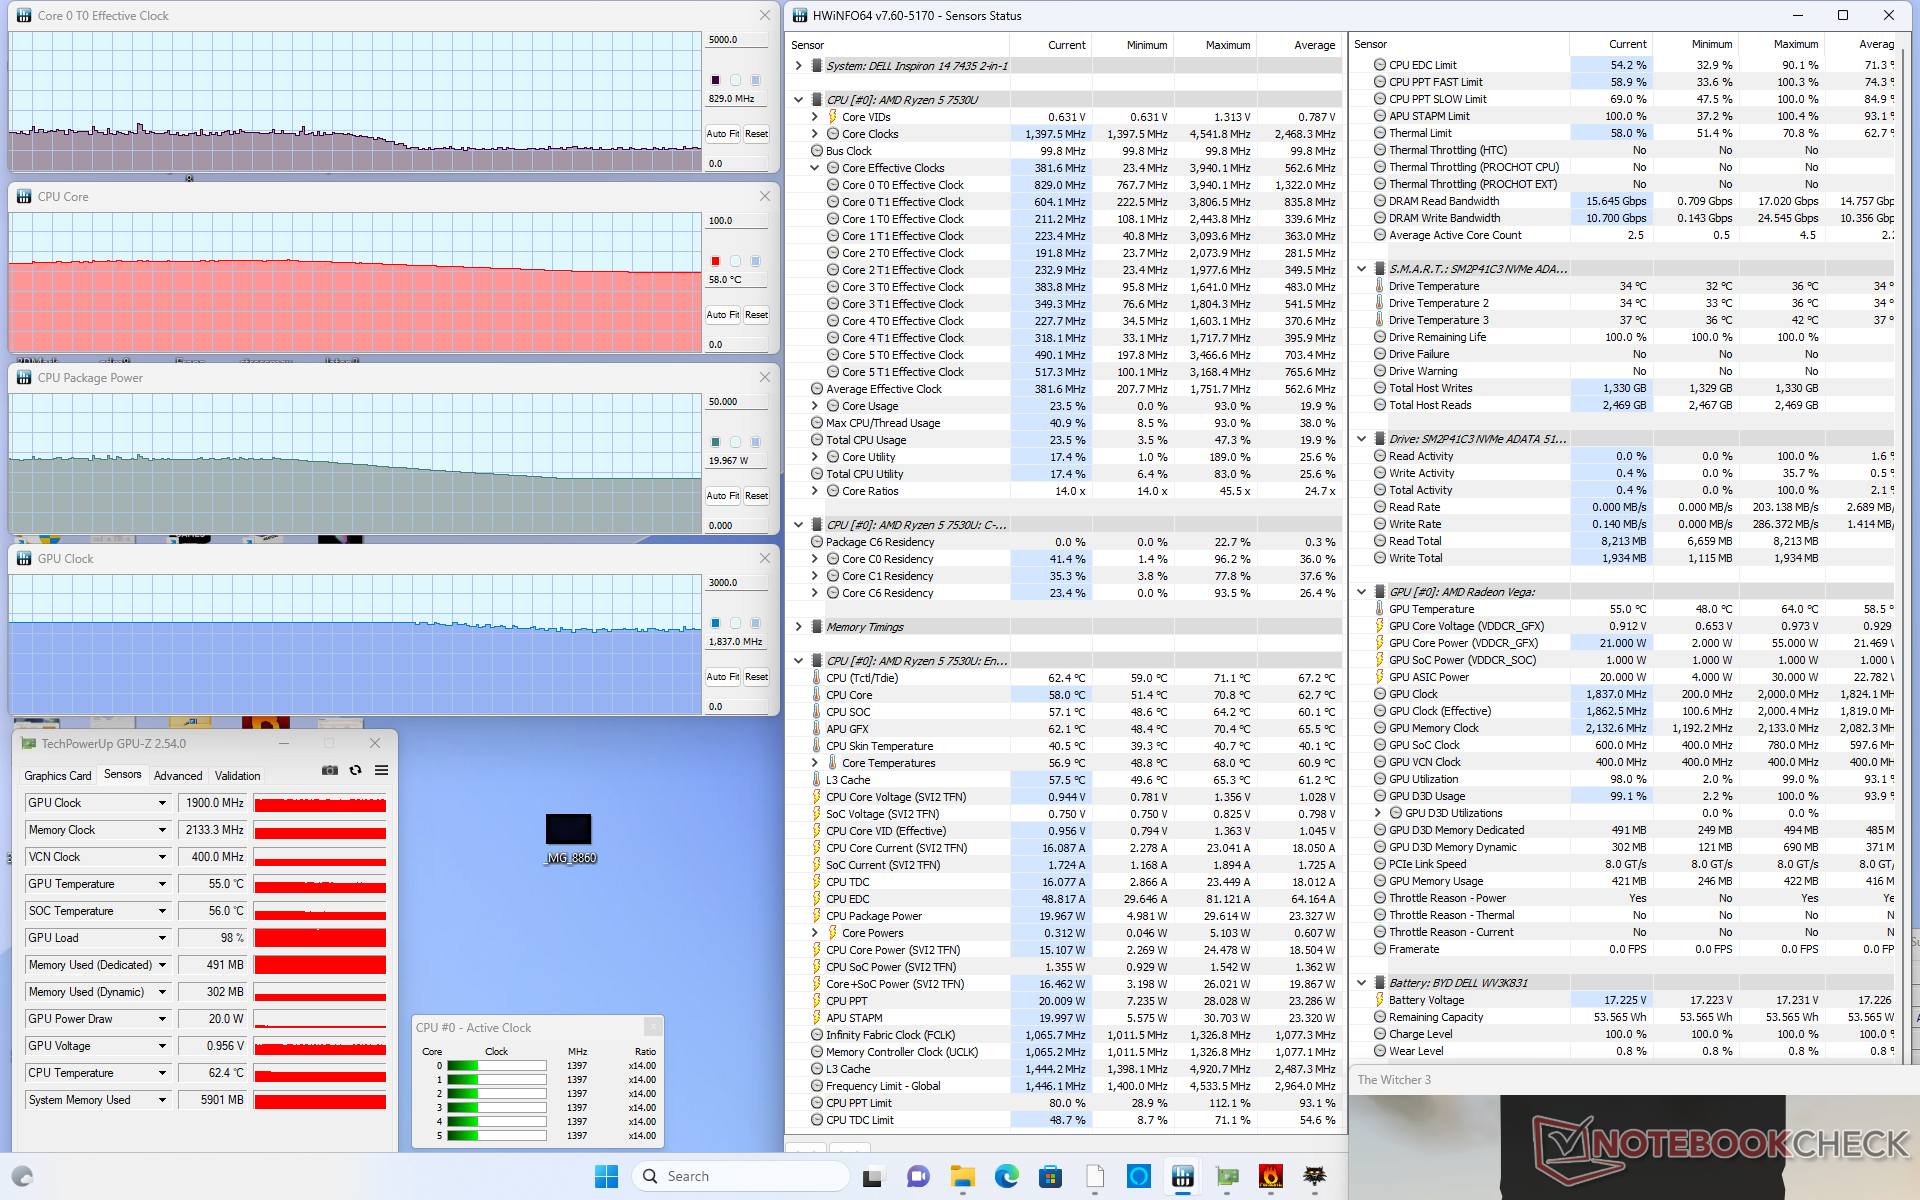
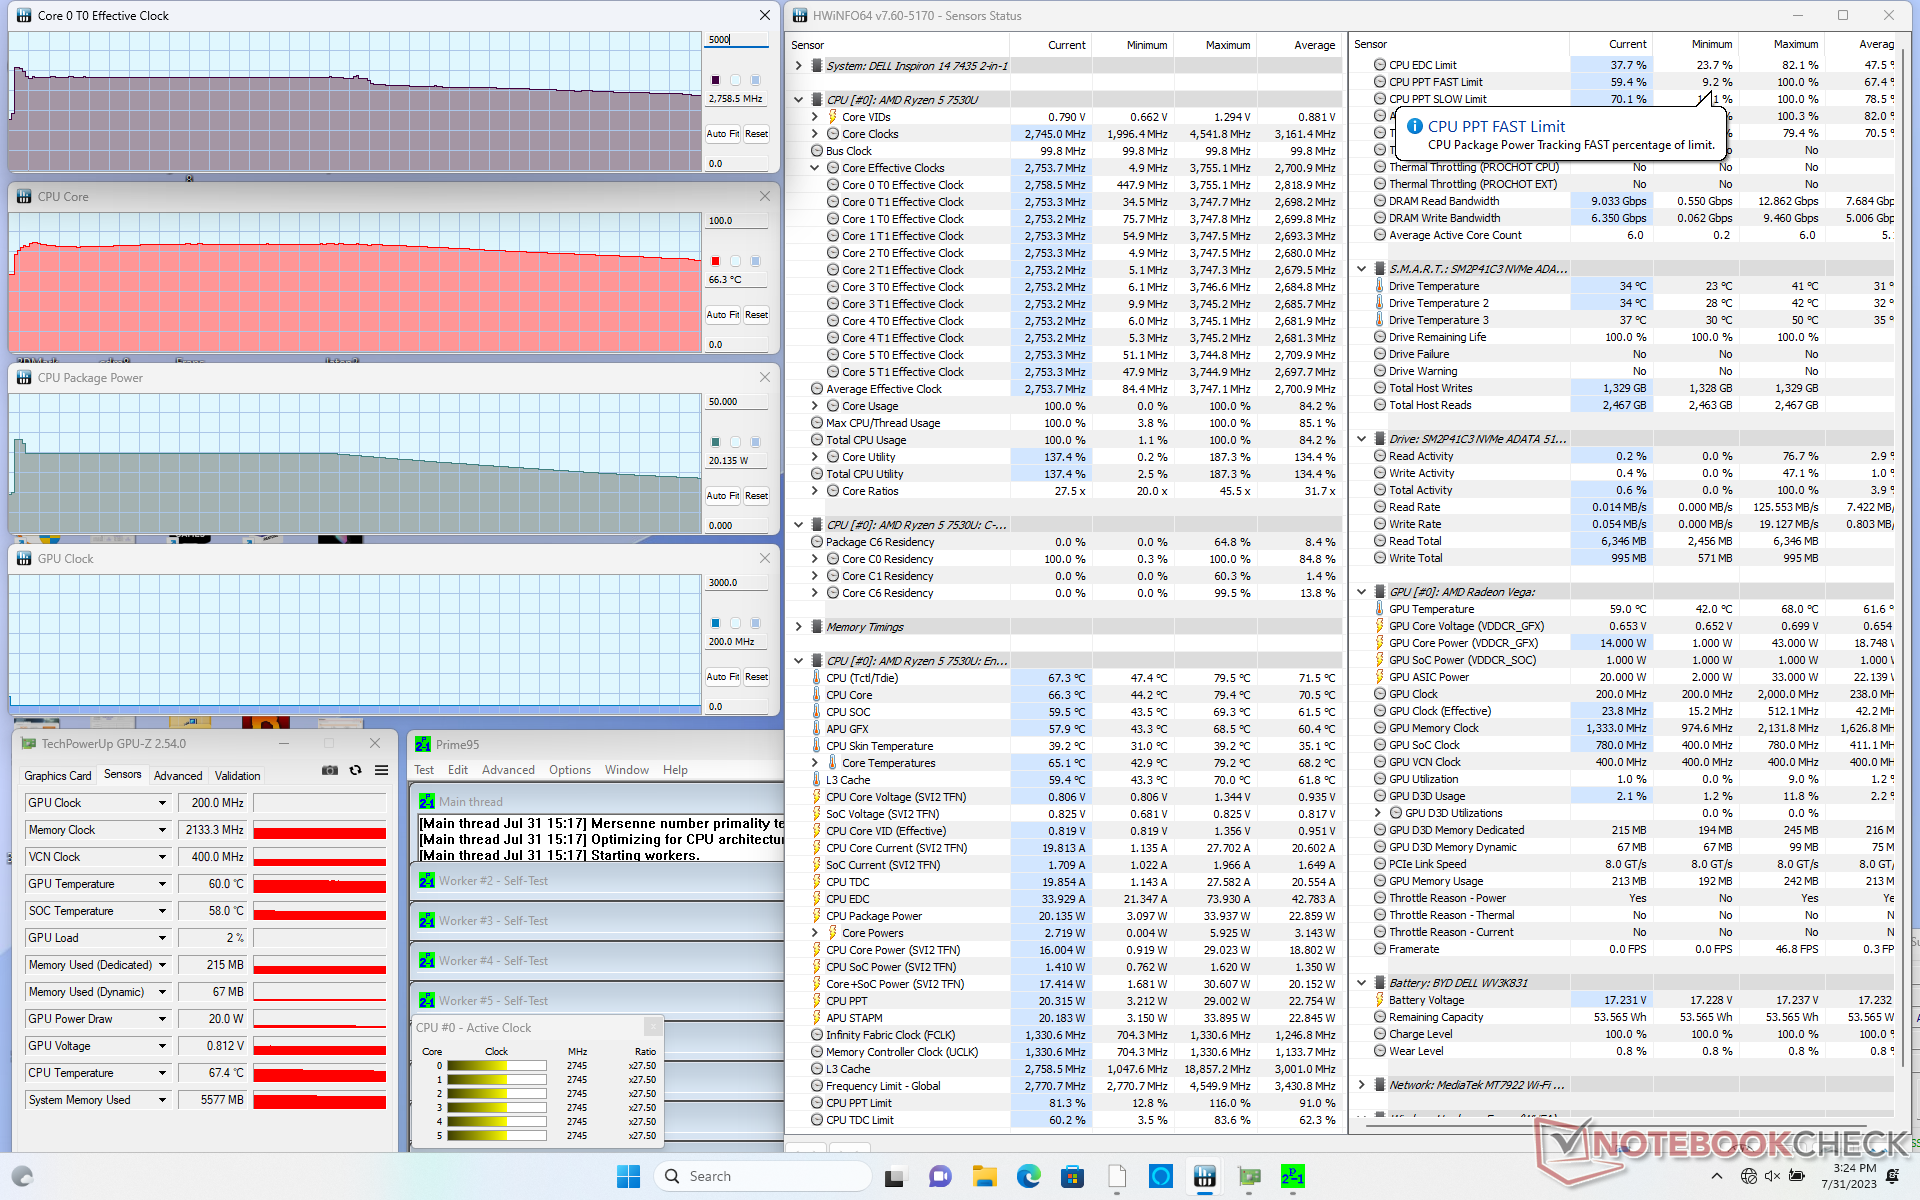
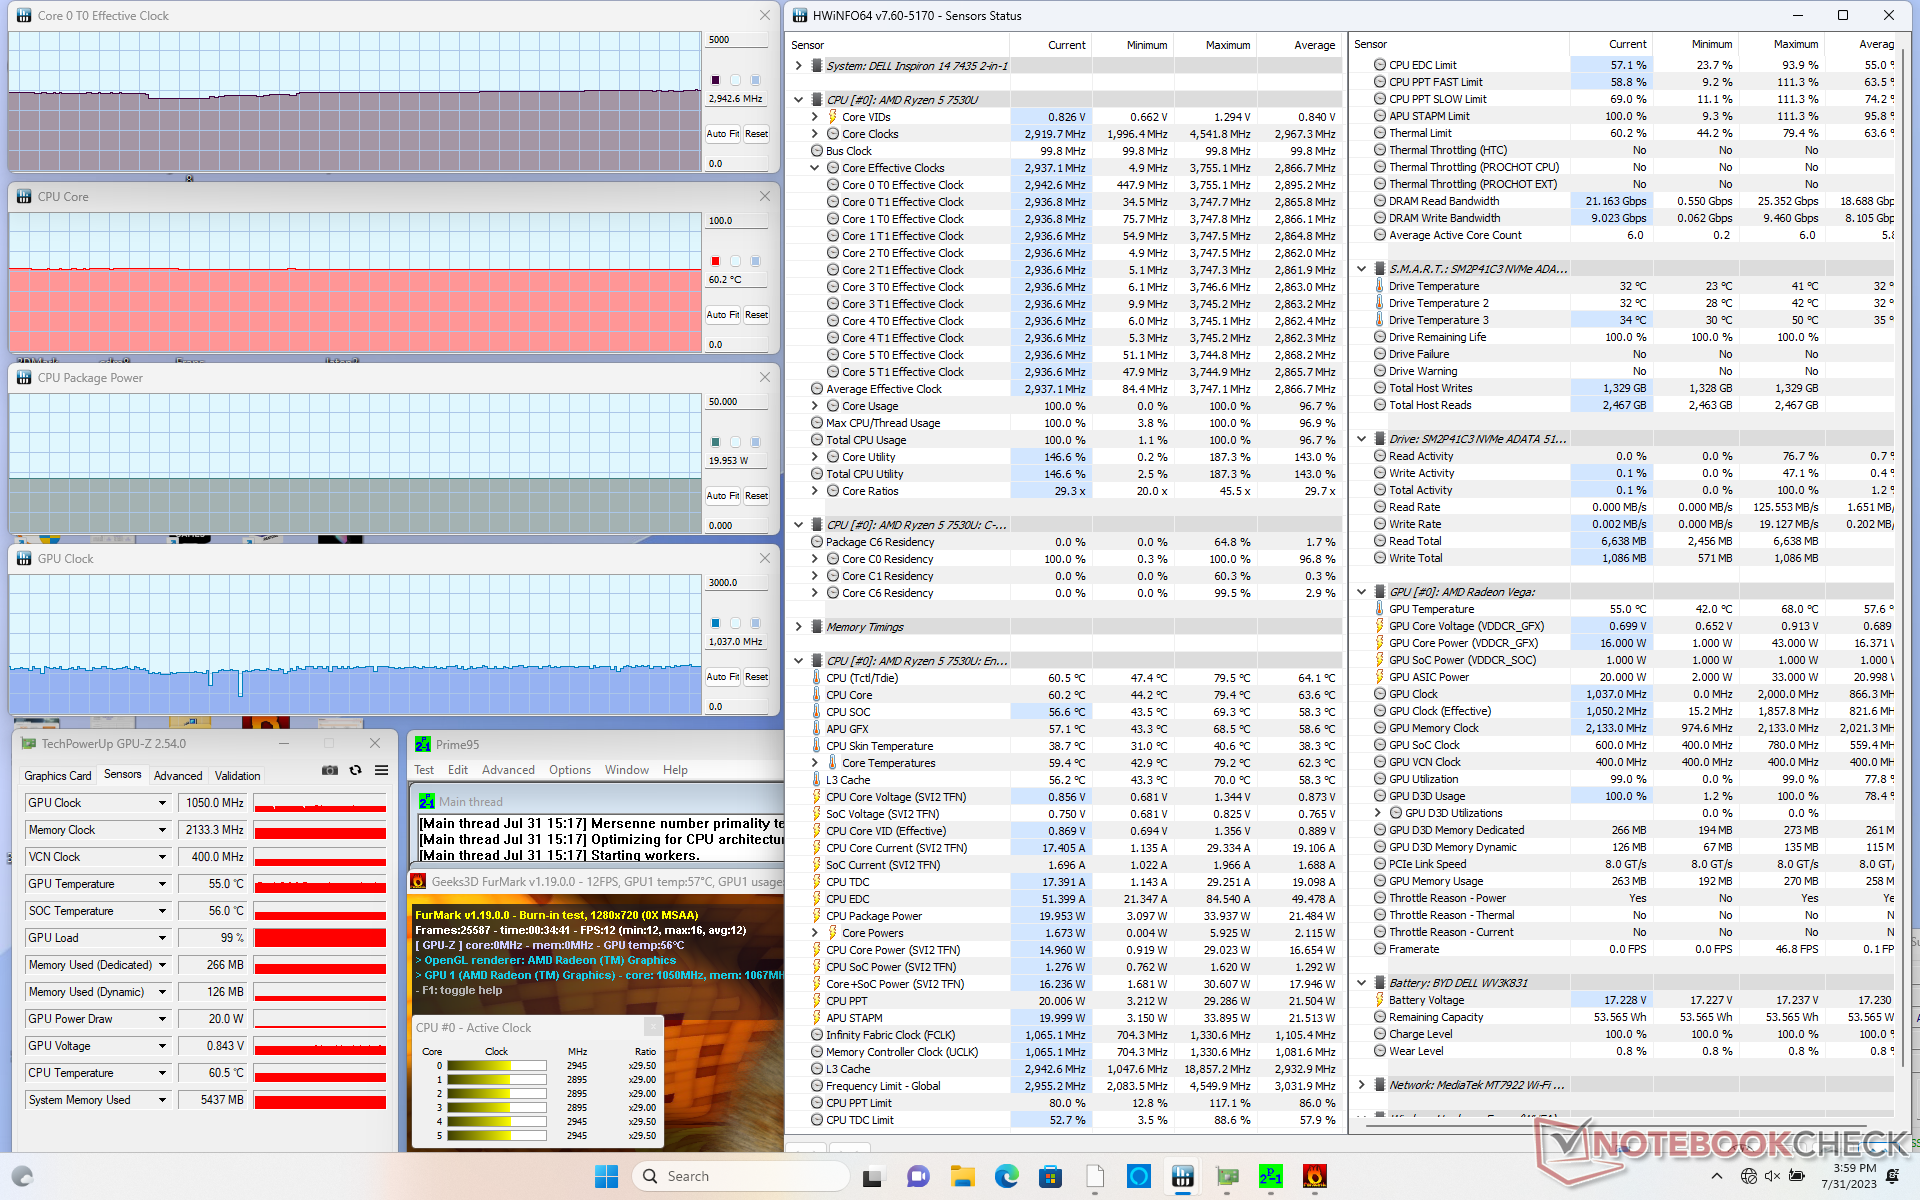
| Clock da CPU (GHz) | Clock da GPU (MHz) | Temperatura média da CPU (°C) | |
| Sistema ocioso | -- | -- | 44 |
| Estresse doPrime95 | 2.7 | -- | 66 |
| EstressePrime95 + FurMark | 2.9 | 1050 | 60 |
| Witcher 3 Estresse | 0,8 | 1900 | 58 |
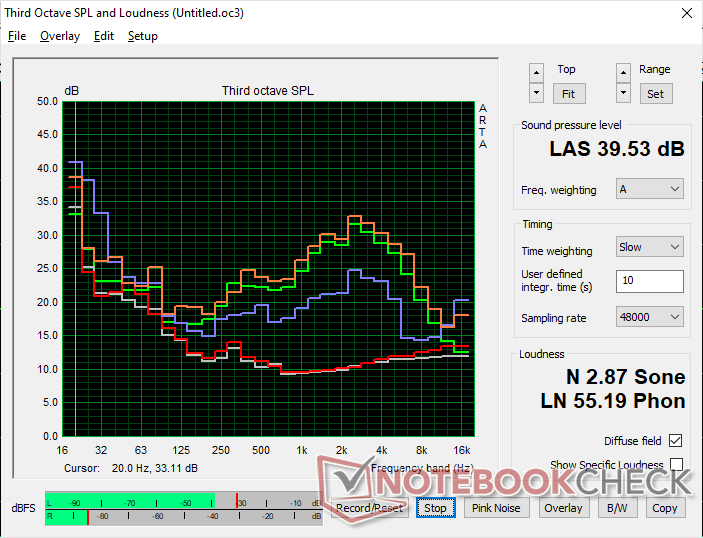
Alto-falantes
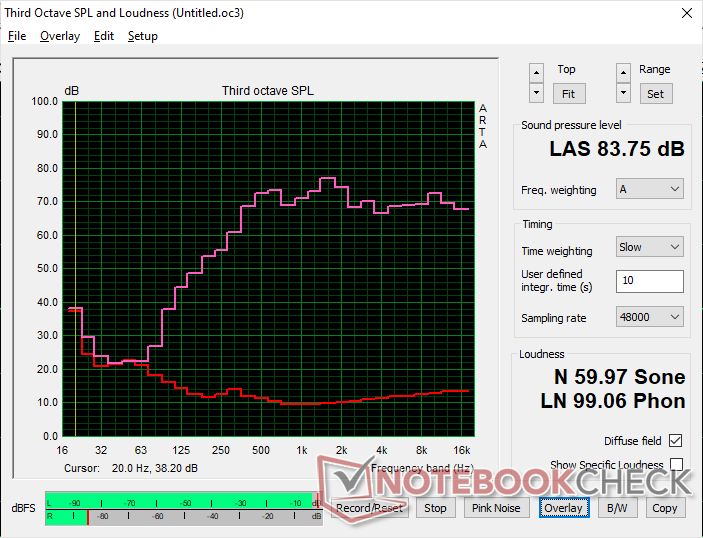
Dell Inspiron 14 7435 2-in-1 análise de áudio
(+) | os alto-falantes podem tocar relativamente alto (###valor### dB)
Graves 100 - 315Hz
(-) | quase nenhum baixo - em média 18.8% menor que a mediana
(±) | a linearidade dos graves é média (9.9% delta para a frequência anterior)
Médios 400 - 2.000 Hz
(+) | médios equilibrados - apenas 3.5% longe da mediana
(+) | médios são lineares (6.1% delta para frequência anterior)
Altos 2 - 16 kHz
(+) | agudos equilibrados - apenas 1.2% longe da mediana
(+) | os máximos são lineares (4.4% delta da frequência anterior)
Geral 100 - 16.000 Hz
(+) | o som geral é linear (12.3% diferença em relação à mediana)
Comparado com a mesma classe
» 14% de todos os dispositivos testados nesta classe foram melhores, 3% semelhantes, 83% piores
» O melhor teve um delta de 6%, a média foi 20%, o pior foi 57%
Comparado com todos os dispositivos testados
» 10% de todos os dispositivos testados foram melhores, 3% semelhantes, 87% piores
» O melhor teve um delta de 4%, a média foi 23%, o pior foi 134%
Apple MacBook Pro 16 2021 M1 Pro análise de áudio
(+) | os alto-falantes podem tocar relativamente alto (###valor### dB)
Graves 100 - 315Hz
(+) | bons graves - apenas 3.8% longe da mediana
(+) | o baixo é linear (5.2% delta para a frequência anterior)
Médios 400 - 2.000 Hz
(+) | médios equilibrados - apenas 1.3% longe da mediana
(+) | médios são lineares (2.1% delta para frequência anterior)
Altos 2 - 16 kHz
(+) | agudos equilibrados - apenas 1.9% longe da mediana
(+) | os máximos são lineares (2.7% delta da frequência anterior)
Geral 100 - 16.000 Hz
(+) | o som geral é linear (4.6% diferença em relação à mediana)
Comparado com a mesma classe
» 0% de todos os dispositivos testados nesta classe foram melhores, 0% semelhantes, 100% piores
» O melhor teve um delta de 5%, a média foi 17%, o pior foi 45%
Comparado com todos os dispositivos testados
» 0% de todos os dispositivos testados foram melhores, 0% semelhantes, 100% piores
» O melhor teve um delta de 4%, a média foi 23%, o pior foi 134%
Gerenciamento de energia
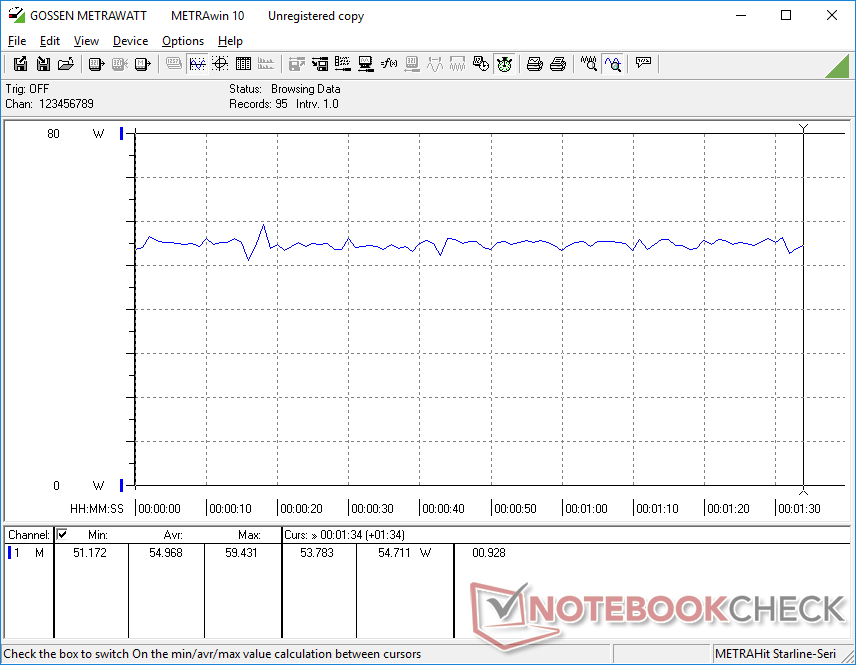
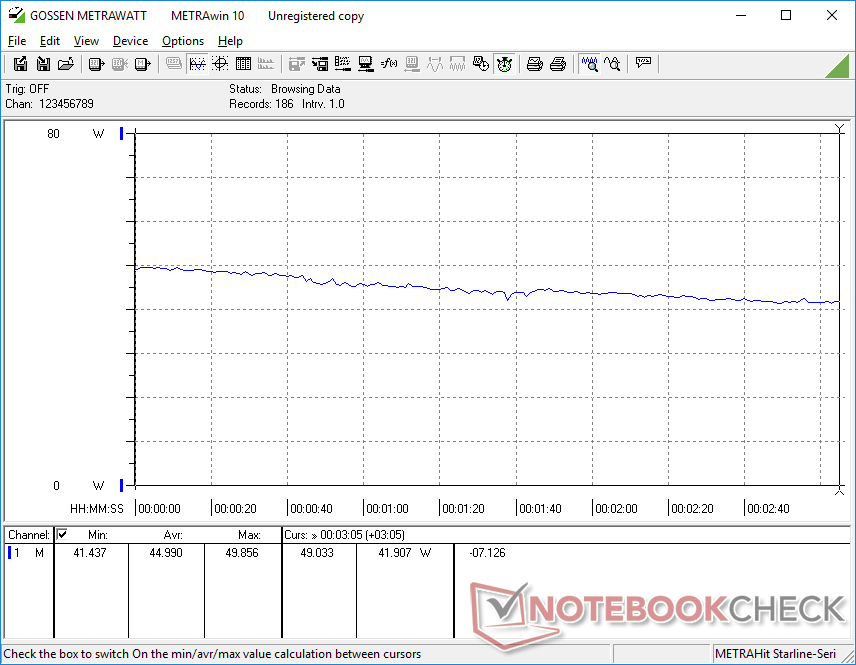
Consumo de energia
O consumo de energia é comparável ao do Inspiron 14 7420 com tecnologia Intel durante cargas pouco exigentes, mas é consistentemente mais alto ao executar cargas mais exigentes, como jogos. Isso sugere que a GPU integrada da AMD é um pouco menos eficiente em termos de energia do que as UEs Iris Xe 96 da concorrência, enquanto o desempenho da CPU por watt é mais semelhante.
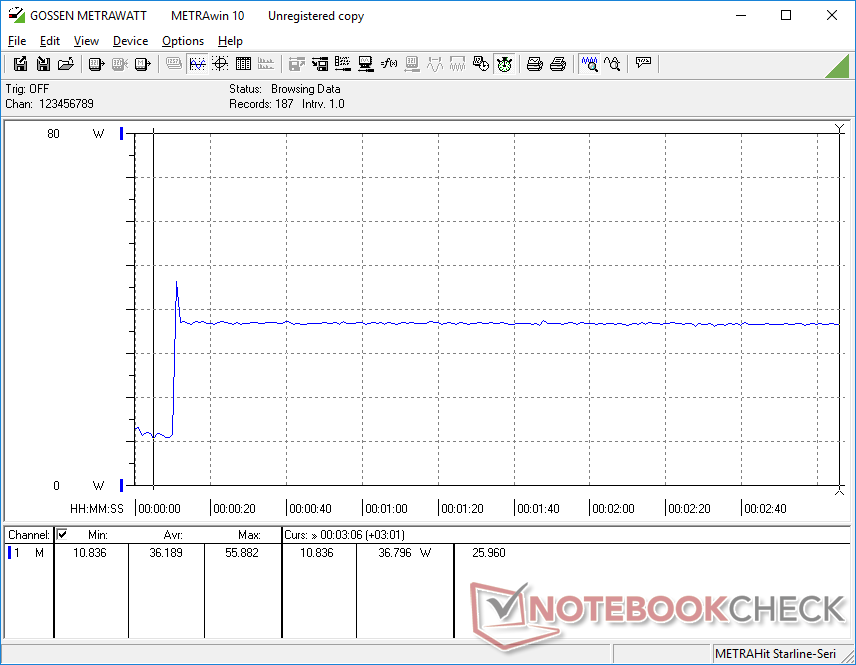
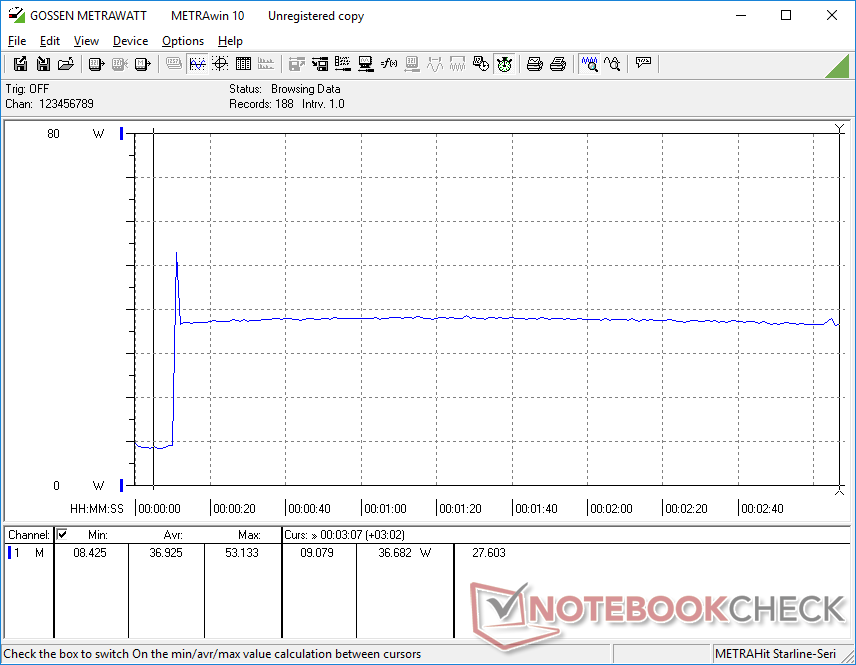
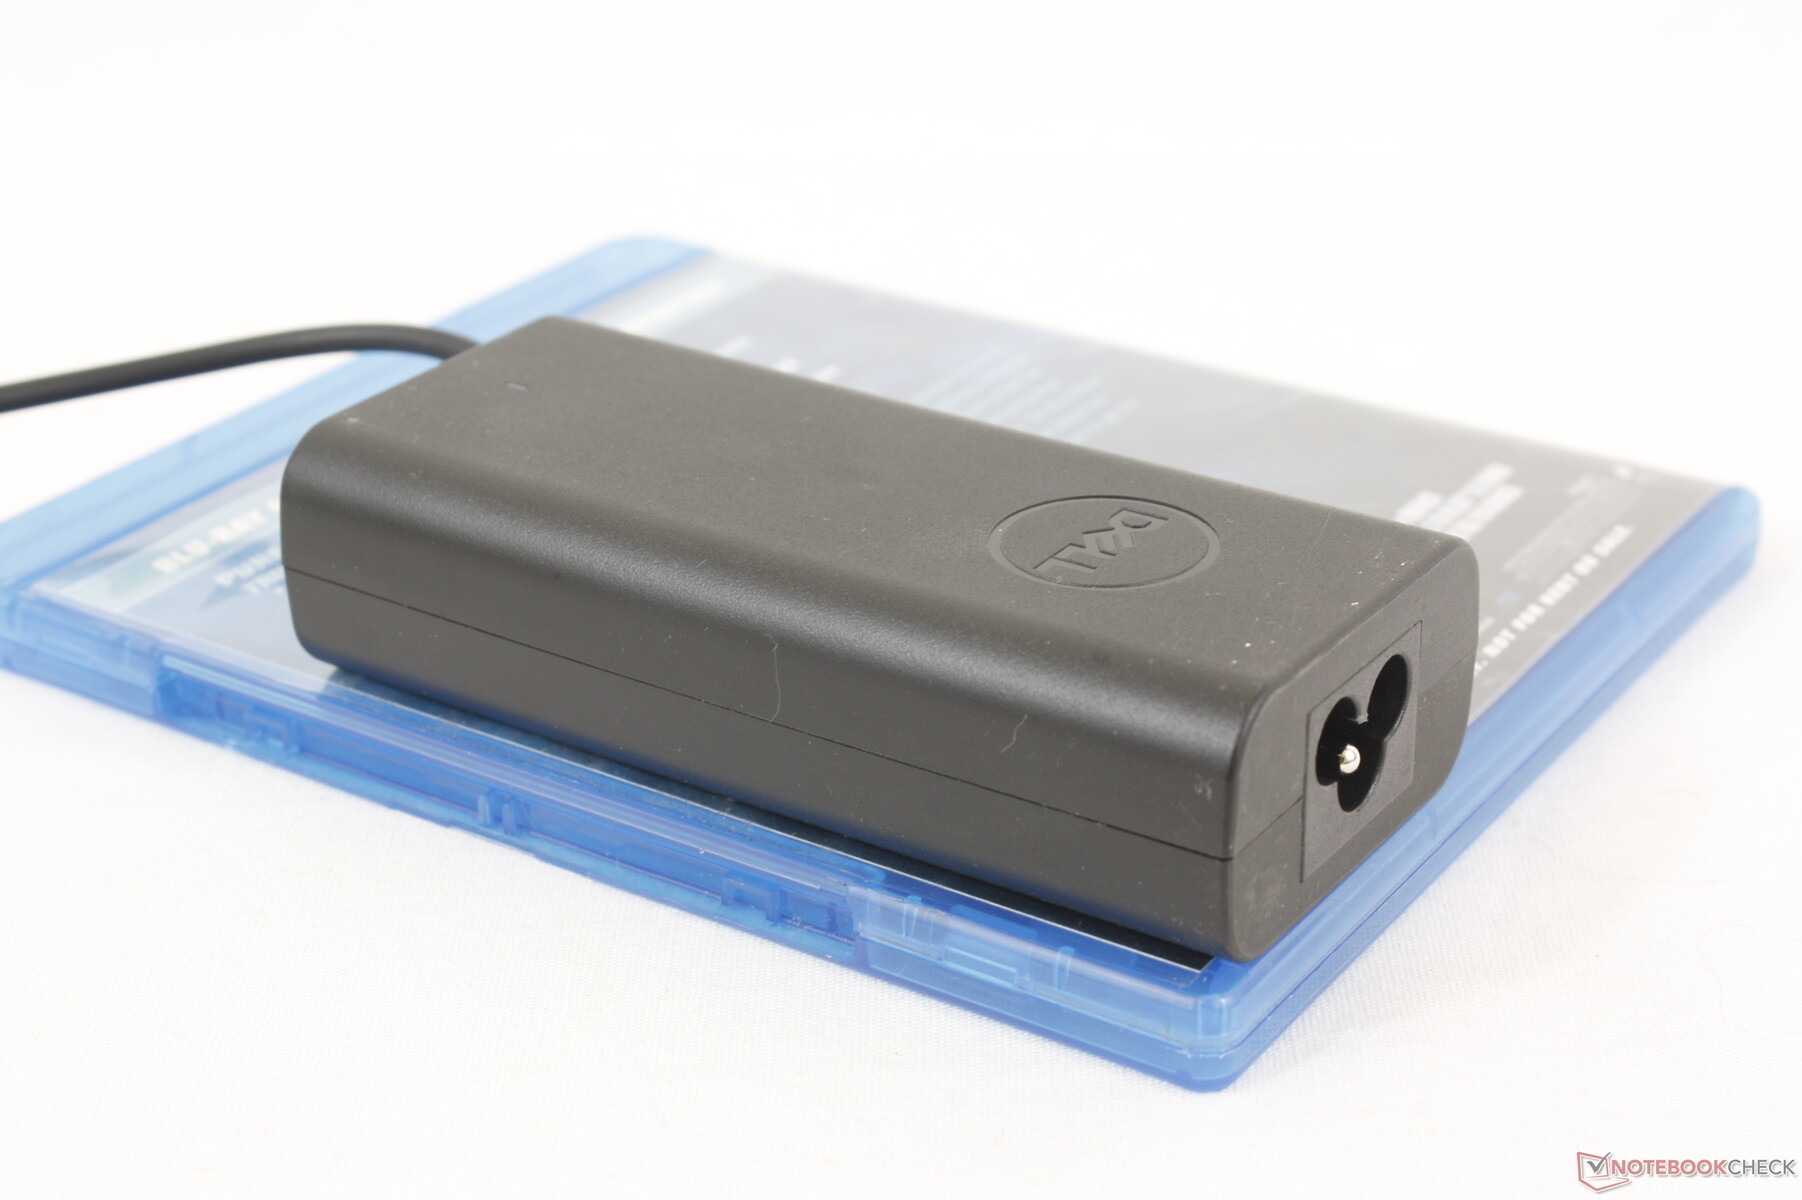
Conseguimos medir um consumo máximo de 56 W do pequeno adaptador USB-C de 65 W (11,1 x 5,1 x 2,8 cm) quando a CPU está com 100% de utilização. No entanto, essa taxa é muito curta, como mostram as capturas de tela abaixo, devido ao potencial limitado do Turbo Boost do sistema.
| desligado | |
| Ocioso | |
| Carga |
|
Key:
min: | |
| Dell Inspiron 14 7435 2-in-1 R5 7530U, Vega 7, , IPS, 1920x1200, 14" | Dell Inspiron 14 7420 2-in-1 i7-1255U, Iris Xe G7 96EUs, WDC PC SN530 SDBPMPZ-512G, IPS, 1920x1200, 14" | Lenovo IdeaPad Flex 7i 14IAU7 i7-1255U, Iris Xe G7 96EUs, Samsung PM9B1 512GB MZAL4512HBLU, IPS, 2240x1400, 14" | Acer Aspire 5 Spin 14 i5-1335U, Iris Xe G7 80EUs, Micron 2450 512GB MTFDKBA512TFK, IPS, 1920x1200, 14" | LG Gram 14T90P i5-1135G7, Iris Xe G7 80EUs, Samsung SSD PM981a MZVLB512HBJQ, IPS, 1900x1200, 14" | HP Pavilion x360 14-dy0157ng i5-1135G7, Iris Xe G7 80EUs, Toshiba KBG40ZNV512G, IPS, 1920x1080, 14" | |
|---|---|---|---|---|---|---|
| Power Consumption | 6% | -10% | 12% | 24% | 33% | |
| Idle Minimum * (Watt) | 5.3 | 5.2 2% | 7.1 -34% | 4.3 19% | 2.8 47% | 4 25% |
| Idle Average * (Watt) | 9.1 | 8.2 10% | 11 -21% | 5.8 36% | 5.5 40% | 6.7 26% |
| Idle Maximum * (Watt) | 9.4 | 9.9 -5% | 11.4 -21% | 8.8 6% | 6.4 32% | 8.2 13% |
| Load Average * (Watt) | 54.9 | 44.4 19% | 43.7 20% | 44 20% | 45.4 17% | 29.6 46% |
| Witcher 3 ultra * (Watt) | 45 | 35 22% | 35.1 22% | 41.5 8% | 34 24% | 29.6 34% |
| Load Maximum * (Watt) | 55.8 | 62.5 -12% | 71 -27% | 67 -20% | 65.9 -18% | 26.7 52% |
* ... menor é melhor
Power Consumption Witcher 3 / Stresstest
Power Consumption external Monitor
Duração da bateria
Os tempos de execução aumentaram visivelmente de um ano para o outro, apesar de não haver mudanças na capacidade da bateria. Conseguimos registrar 11 horas de navegação em WLAN no mundo real em nossa unidade com tecnologia AMD, em comparação com 7,5 horas no modelo do ano passado com tecnologia Intel. O Inspiron 14 7435 2 em 1 é, subsequentemente, mais duradouro do que muitos outros subnotebooks em sua faixa de preço.
O carregamento da capacidade vazia até a capacidade total leva aproximadamente duas horas.
| Dell Inspiron 14 7435 2-in-1 R5 7530U, Vega 7, 54 Wh | Dell Inspiron 14 7420 2-in-1 i7-1255U, Iris Xe G7 96EUs, 54 Wh | Lenovo IdeaPad Flex 7i 14IAU7 i7-1255U, Iris Xe G7 96EUs, 59 Wh | Acer Aspire 5 Spin 14 i5-1335U, Iris Xe G7 80EUs, 54.6 Wh | LG Gram 14T90P i5-1135G7, Iris Xe G7 80EUs, 72 Wh | HP Pavilion x360 14-dy0157ng i5-1135G7, Iris Xe G7 80EUs, 43 Wh | |
|---|---|---|---|---|---|---|
| Duração da bateria | -16% | -32% | 0% | 12% | -22% | |
| Reader / Idle (h) | 19.9 | 15.9 -20% | 17.7 -11% | |||
| WiFi v1.3 (h) | 11.1 | 7.6 -32% | 7.6 -32% | 11.1 0% | 12.1 9% | 7.1 -36% |
| Load (h) | 2 | 2.1 5% | 2.3 15% | 1.6 -20% | ||
| H.264 (h) | 8.9 |
Pro
Contra
Veredicto - Bom desempenho pelo preço, mas a tela poderia ser melhorada
Do ponto de vista do desempenho, nosso Inspiron 14 7435 2-em-1 Ryzen 5 de US$ 550 tem um desempenho tão bom quanto o Inspiron 14 7430 2-em-1 Core i5 de US$ 800, sem comprometer a duração da bateria, a qualidade da tela, os alto-falantes ou outros recursos físicos. Se o suporte a Thunderbolt não estiver no topo da sua lista, você poderá economizar quase US$ 200 optando pela AMD em vez da Intel para esse modelo específico.
A configuração do Ryzen 5 está perfeitamente ajustada para funcionar tão bem quanto a configuração do Core i5 por centenas de dólares a menos. No entanto, os caros upgrades de RAM e a tela sensível ao toque fraca derrubam um pouco o modelo.
A RAM soldada é uma grande desvantagem do modelo deste ano, pois uma simples atualização de 8 GB para 16 GB custa, no mínimo, US$ 150 a mais. Para o que se supõe ser um conversível econômico, a atualização cara pode ser um desestímulo para o público-alvo. Por outro lado, as alterações nos alto-falantes, no clickpad e nas dobradiças são melhorias bem-vindas.
Gostaríamos muito que as futuras revisões incorporassem opções de telas sensíveis ao toque mais brilhantes para melhor visibilidade em ambientes externos. A atual tela de 250 nits limita o modelo a ambientes internos, o que é lamentável, pois os compradores podem querer usar o conversível de 14 polegadas em qualquer lugar. Esse recurso daria ao Inspiron 14 7435 2 em 1 uma vantagem notável em relação a concorrentes como o Acer Aspire 5 Spin 14, Lenovo IdeaPad Flex 7iou o HP Pavilion x360 14.
Preço e disponibilidade
A Dell agora está enviando o Inspiron 14 7435 2 em 1 a partir de US$ 549 para a nossa configuração Ryzen 5 analisada até US$ 699 para a configuração Ryzen 7. Como alternativa, o Intel Inspiron 14 7430 2 em 1 custa a partir de US$ 799 para a configuração Core i5.
Dell Inspiron 14 7435 2-in-1
- 08/08/2023 v7 (old)
Allen Ngo
Transparência
A seleção dos dispositivos a serem analisados é feita pela nossa equipe editorial. A amostra de teste foi fornecida ao autor como empréstimo pelo fabricante ou varejista para fins desta revisão. O credor não teve influência nesta revisão, nem o fabricante recebeu uma cópia desta revisão antes da publicação. Não houve obrigação de publicar esta revisão. Como empresa de mídia independente, a Notebookcheck não está sujeita à autoridade de fabricantes, varejistas ou editores.
É assim que o Notebookcheck está testando
Todos os anos, o Notebookcheck analisa de forma independente centenas de laptops e smartphones usando procedimentos padronizados para garantir que todos os resultados sejam comparáveis. Desenvolvemos continuamente nossos métodos de teste há cerca de 20 anos e definimos padrões da indústria no processo. Em nossos laboratórios de teste, equipamentos de medição de alta qualidade são utilizados por técnicos e editores experientes. Esses testes envolvem um processo de validação em vários estágios. Nosso complexo sistema de classificação é baseado em centenas de medições e benchmarks bem fundamentados, o que mantém a objetividade.Price comparison

