Breve Análise do Conversível HP Pavilion x360 15 2019: Não compre esta configuração
Avaliação | Data | Modelo | Peso | Altura | Size | Resolução | Preço |
|---|---|---|---|---|---|---|---|
| 72 % v7 (old) | 02/2020 | HP Pavilion x360 15-dq0065cl i7-8565U, UHD Graphics 620 | 1.9 kg | 20.6 mm | 15.60" | 1366x768 | |
| 78.9 % v6 (old) | 07/2018 | Asus VivoBook Flip 15 TP510UA-E8073T i5-8250U, UHD Graphics 620 | 2.3 kg | 18 mm | 15.60" | 1920x1080 | |
| 82.6 % v7 (old) | 12/2019 | Lenovo Ideapad C340-15IWL-81N5004QGE i5-8265U, GeForce MX230 | 2 kg | 20.5 mm | 15.60" | 1920x1080 | |
| 80.1 % v6 (old) | 04/2018 | HP Envy x360 15-bq102ng R5 2500U, Vega 8 | 2.1 kg | 19.6 mm | 15.60" | 1920x1080 | |
| 77.6 % v6 (old) | 06/2019 | Dell Inspiron 15 3585 (2300U, Vega 6) R3 2300U, Vega 6 | 1.9 kg | 20 mm | 15.60" | 1920x1080 |

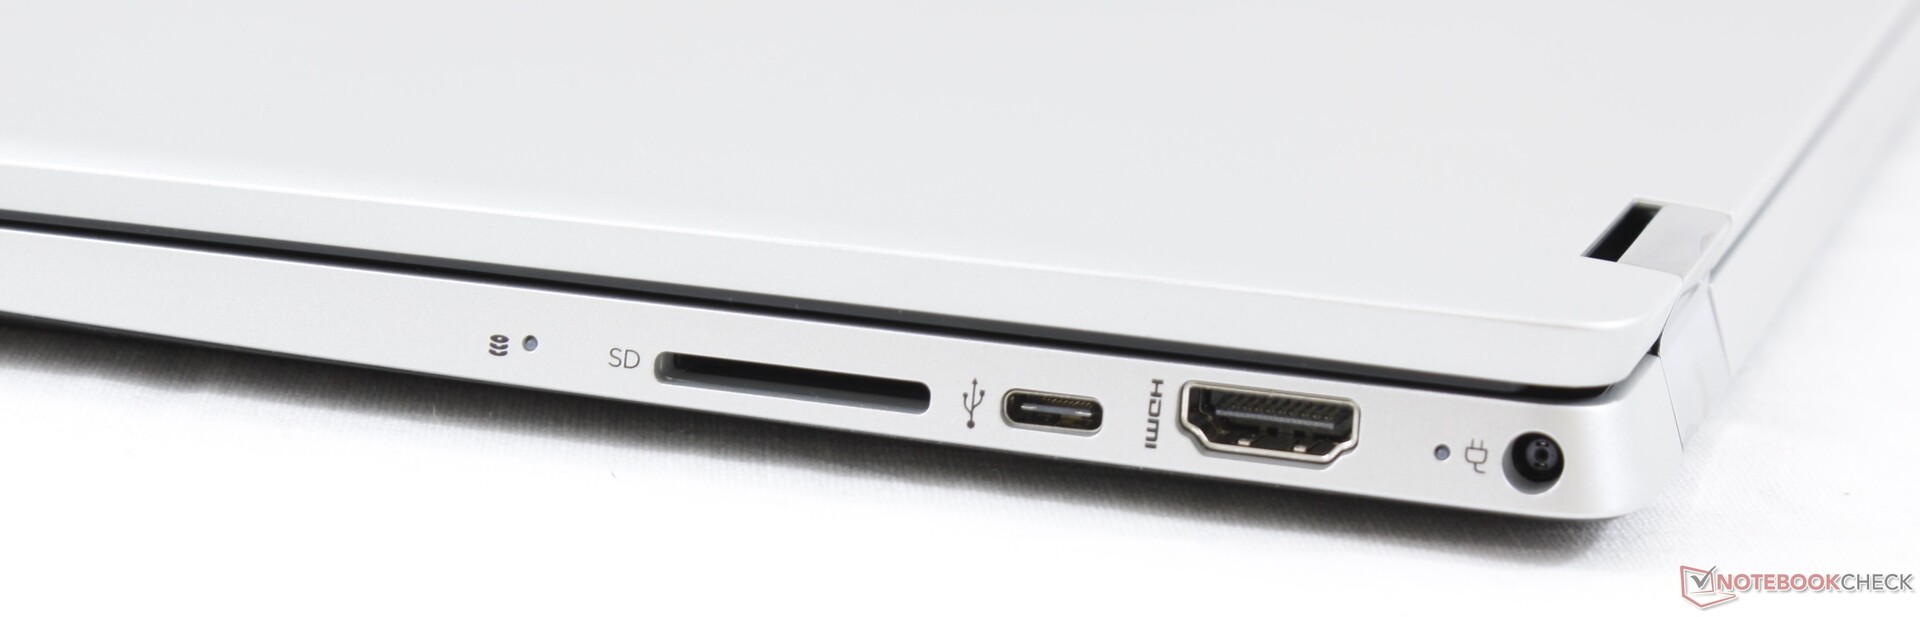
| SD Card Reader | |
| average JPG Copy Test (av. of 3 runs) | |
| Dell XPS 15 7590 i5 iGPU FHD (Toshiba Exceria Pro SDXC 64 GB UHS-II) | |
| HP Pavilion x360 15-dq0065cl (Toshiba Exceria Pro SDXC 64 GB UHS-II) | |
| Lenovo Ideapad C340-15IWL-81N5004QGE (Toshiba Exceria Pro SDXC 64 GB UHS-II) | |
| HP Envy x360 15-bq102ng (Toshiba Exceria Pro SDXC 64 GB UHS-II) | |
| Dell Inspiron 15 3585 (2300U, Vega 6) (Toshiba Exceria Pro SDXC 64 GB UHS-II) | |
| Asus VivoBook Flip 15 TP510UA-E8073T (Toshiba Exceria Pro SDXC 64 GB UHS-II) | |
| maximum AS SSD Seq Read Test (1GB) | |
| Dell XPS 15 7590 i5 iGPU FHD (Toshiba Exceria Pro SDXC 64 GB UHS-II) | |
| Lenovo Ideapad C340-15IWL-81N5004QGE (Toshiba Exceria Pro SDXC 64 GB UHS-II) | |
| HP Envy x360 15-bq102ng (Toshiba Exceria Pro SDXC 64 GB UHS-II) | |
| HP Pavilion x360 15-dq0065cl (Toshiba Exceria Pro SDXC 64 GB UHS-II) | |
| Dell Inspiron 15 3585 (2300U, Vega 6) (Toshiba Exceria Pro SDXC 64 GB UHS-II) | |
| Asus VivoBook Flip 15 TP510UA-E8073T (Toshiba Exceria Pro SDXC 64 GB UHS-II) | |
| |||||||||||||||||||||||||
iluminação: 88 %
iluminação com acumulador: 195.7 cd/m²
Contraste: 288:1 (Preto: 0.68 cd/m²)
ΔE ColorChecker Calman: 11.99 | ∀{0.5-29.43 Ø4.73}
calibrated: 4.63
ΔE Greyscale Calman: 12.8 | ∀{0.09-98 Ø4.97}
57.8% sRGB (Argyll 1.6.3 3D)
36.7% AdobeRGB 1998 (Argyll 1.6.3 3D)
39.93% AdobeRGB 1998 (Argyll 3D)
58.2% sRGB (Argyll 3D)
38.65% Display P3 (Argyll 3D)
Gamma: 2.15
CCT: 14252 K
| HP Pavilion x360 15-dq0065cl BOE076E, TN LED, 15.6", 1366x768 | Asus VivoBook Flip 15 TP510UA-E8073T AU Optronics B156HAN02.1, IPS, 15.6", 1920x1080 | Lenovo Ideapad C340-15IWL-81N5004QGE BOE CQ NV156FHM-N48, IPS, 15.6", 1920x1080 | HP Envy x360 15-bq102ng Chi Mei CM15E9, IPS, 15.6", 1920x1080 | Dell Inspiron 15 3585 (2300U, Vega 6) BOE0802, TN, 15.6", 1920x1080 | Dell XPS 15 7590 i5 iGPU FHD LQ156M1, IPS, 15.6", 1920x1080 | |
|---|---|---|---|---|---|---|
| Display | 1% | 0% | 7% | 1% | 70% | |
| Display P3 Coverage (%) | 38.65 | 39.19 1% | 39.05 1% | 41.36 7% | 39.22 1% | 66.5 72% |
| sRGB Coverage (%) | 58.2 | 58.9 1% | 57.3 -2% | 62.2 7% | 58.9 1% | 98 68% |
| AdobeRGB 1998 Coverage (%) | 39.93 | 40.49 1% | 40.35 1% | 42.74 7% | 40.52 1% | 68.4 71% |
| Response Times | -25% | -48% | -13% | 33% | -41% | |
| Response Time Grey 50% / Grey 80% * (ms) | 68.8 ? | 44 ? 36% | 57 ? 17% | 40 ? 42% | 39 ? 43% | 52.8 ? 23% |
| Response Time Black / White * (ms) | 15.6 ? | 29 ? -86% | 33 ? -112% | 26 ? -67% | 12 ? 23% | 32 ? -105% |
| PWM Frequency (Hz) | 1000 ? | 352 ? | 25000 ? | 250 ? | 1020 ? | |
| Screen | 71% | 64% | 81% | 13% | 118% | |
| Brightness middle (cd/m²) | 195.7 | 229 17% | 266 36% | 221 13% | 225 15% | 588 200% |
| Brightness (cd/m²) | 186 | 221 19% | 251 35% | 207 11% | 213 15% | 555 198% |
| Brightness Distribution (%) | 88 | 76 -14% | 81 -8% | 87 -1% | 88 0% | 89 1% |
| Black Level * (cd/m²) | 0.68 | 0.15 78% | 0.165 76% | 0.15 78% | 0.535 21% | 0.4 41% |
| Contrast (:1) | 288 | 1527 430% | 1612 460% | 1473 411% | 421 46% | 1470 410% |
| Colorchecker dE 2000 * | 11.99 | 5.03 58% | 6.33 47% | 4.35 64% | 10.37 14% | 2.5 79% |
| Colorchecker dE 2000 max. * | 21.31 | 8.89 58% | 21.03 1% | 8.98 58% | 19.75 7% | 6.3 70% |
| Colorchecker dE 2000 calibrated * | 4.63 | 5.23 -13% | 3.89 16% | 0.6 87% | ||
| Greyscale dE 2000 * | 12.8 | 5.56 57% | 3.81 70% | 3.09 76% | 12.09 6% | 4.5 65% |
| Gamma | 2.15 102% | 2.64 83% | 2.38 92% | 2.23 99% | 2.72 81% | 2.2 100% |
| CCT | 14252 46% | 7015 93% | 6057 107% | 6068 107% | 13335 49% | 6836 95% |
| Color Space (Percent of AdobeRGB 1998) (%) | 36.7 | 37 1% | 37 1% | 56 53% | 37 1% | 63.2 72% |
| Color Space (Percent of sRGB) (%) | 57.8 | 59 2% | 57 -1% | 86 49% | 59 2% | 98 70% |
| Média Total (Programa/Configurações) | 16% /
44% | 5% /
38% | 25% /
54% | 16% /
13% | 49% /
89% |
* ... menor é melhor
Exibir tempos de resposta
| ↔ Tempo de resposta preto para branco | ||
|---|---|---|
| 15.6 ms ... ascensão ↗ e queda ↘ combinadas | ↗ 9.2 ms ascensão | 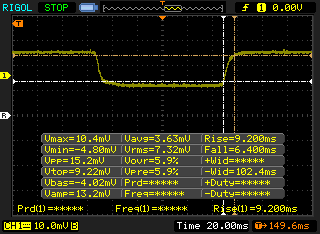 |
| ↘ 6.4 ms queda | ||
| A tela mostra boas taxas de resposta em nossos testes, mas pode ser muito lenta para jogadores competitivos. Em comparação, todos os dispositivos testados variam de 0.1 (mínimo) a 240 (máximo) ms. » 37 % de todos os dispositivos são melhores. Isso significa que o tempo de resposta medido é melhor que a média de todos os dispositivos testados (19.9 ms). | ||
| ↔ Tempo de resposta 50% cinza a 80% cinza | ||
| 68.8 ms ... ascensão ↗ e queda ↘ combinadas | ↗ 30 ms ascensão | 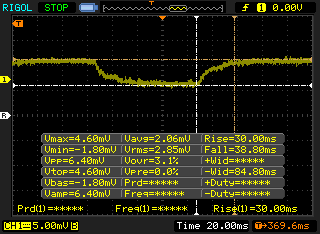 |
| ↘ 38.8 ms queda | ||
| A tela mostra taxas de resposta lentas em nossos testes e será insatisfatória para os jogadores. Em comparação, todos os dispositivos testados variam de 0.165 (mínimo) a 636 (máximo) ms. » 98 % de todos os dispositivos são melhores. Isso significa que o tempo de resposta medido é pior que a média de todos os dispositivos testados (31.1 ms). | ||
Cintilação da tela / PWM (modulação por largura de pulso)
| Tela tremeluzindo/PWM detectado | 1000 Hz | ≤ 99 % configuração de brilho | 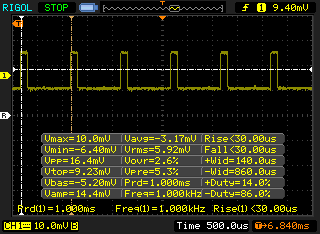 |
A luz de fundo da tela pisca em 1000 Hz (pior caso, por exemplo, utilizando PWM) Cintilação detectada em uma configuração de brilho de 99 % e abaixo. Não deve haver cintilação ou PWM acima desta configuração de brilho. A frequência de 1000 Hz é bastante alta, então a maioria dos usuários sensíveis ao PWM não deve notar nenhuma oscilação. [pwm_comparison] Em comparação: 52 % de todos os dispositivos testados não usam PWM para escurecer a tela. Se PWM foi detectado, uma média de 7798 (mínimo: 5 - máximo: 343500) Hz foi medida. | |||
| Cinebench R15 | |
| CPU Single 64Bit | |
| MSI Modern 15 A10RB | |
| Microsoft Surface Laptop 3 15 i7-1065G7 | |
| Dell XPS 13 7390 Core i7-10710U | |
| MSI GF63 Thin 9SC | |
| Média Intel Core i7-8565U (138.3 - 193, n=51) | |
| HP Pavilion x360 15-dq0065cl | |
| MSI Modern 14 A10RB-459US | |
| Dynabook Portege A30-E-174 | |
| Dell Latitude 14 5495 | |
| Lenovo Legion Y520-15IKBA-80WY001VGE | |
| Dell Latitude 13 3390 | |
| Dell Inspiron 15 5000 5585 | |
| CPU Multi 64Bit | |
| Dell XPS 13 7390 Core i7-10710U | |
| MSI Modern 15 A10RB | |
| MSI GF63 Thin 9SC | |
| Microsoft Surface Laptop 3 15 i7-1065G7 | |
| Dell Inspiron 15 5000 5585 | |
| Dell Latitude 14 5495 | |
| Média Intel Core i7-8565U (452 - 815, n=52) | |
| MSI Modern 14 A10RB-459US | |
| Dell Latitude 13 3390 | |
| Lenovo Legion Y520-15IKBA-80WY001VGE | |
| Dynabook Portege A30-E-174 | |
| HP Pavilion x360 15-dq0065cl | |
| Cinebench R10 | |
| Rendering Multiple CPUs 32Bit | |
| Dell XPS 13 7390 Core i7-10710U | |
| Média Intel Core i7-8565U (13806 - 23118, n=16) | |
| Dynabook Portege A30-E-174 | |
| Rendering Single 32Bit | |
| Dell XPS 13 7390 Core i7-10710U | |
| Média Intel Core i7-8565U (2682 - 8906, n=16) | |
| Dynabook Portege A30-E-174 | |
| wPrime 2.10 - 1024m | |
| Média Intel Core i7-8565U (263 - 420, n=7) | |
| Dell XPS 13 7390 Core i7-10710U | |
* ... menor é melhor
| PCMark 8 Home Score Accelerated v2 | 3335 pontos | |
| PCMark 8 Work Score Accelerated v2 | 5132 pontos | |
| PCMark 10 Score | 3787 pontos | |
Ajuda | ||
| HP Pavilion x360 15-dq0065cl Intel SSD 660p SSDPEKNW512G8 | Asus VivoBook Flip 15 TP510UA-E8073T SanDisk SD8SN8U128G1002 | Lenovo Ideapad C340-15IWL-81N5004QGE SK hynix BC501 HFM128GDJTNG-831 | HP Envy x360 15-bq102ng Samsung PM961 MZVLW256HEHP | Dell Inspiron 15 3585 (2300U, Vega 6) Toshiba BG3 KBG30ZMS256G | Dell XPS 15 7590 i5 iGPU FHD Toshiba XG6 KXG60ZNV512G | |
|---|---|---|---|---|---|---|
| AS SSD | -60% | -35% | 19% | -73% | 70% | |
| Seq Read (MB/s) | 1301 | 474.8 -64% | 1399 8% | 2465 89% | 1291 -1% | 2357 81% |
| Seq Write (MB/s) | 931 | 229.3 -75% | 369.8 -60% | 1318 42% | 688 -26% | 1235 33% |
| 4K Read (MB/s) | 52.8 | 26.42 -50% | 40 -24% | 42.97 -19% | 21.87 -59% | 43.29 -18% |
| 4K Write (MB/s) | 127.5 | 49.85 -61% | 109.2 -14% | 81.9 -36% | 35.62 -72% | 99.7 -22% |
| 4K-64 Read (MB/s) | 323.4 | 364.5 13% | 264.3 -18% | 1025 217% | 632 95% | 1020 215% |
| 4K-64 Write (MB/s) | 667 | 93.2 -86% | 181.9 -73% | 338.6 -49% | 221.2 -67% | 1502 125% |
| Access Time Read * (ms) | 0.048 | 0.13 -171% | 0.07 -46% | 0.077 -60% | 0.33 -588% | 0.07 -46% |
| Access Time Write * (ms) | 0.136 | 0.088 35% | 0.041 70% | 0.046 66% | 0.234 -72% | 0.039 71% |
| Score Read (Points) | 506 | 438 -13% | 444 -12% | 1314 160% | 783 55% | 1299 157% |
| Score Write (Points) | 887 | 166 -81% | 328 -63% | 552 -38% | 326 -63% | 1726 95% |
| Score Total (Points) | 1655 | 825 -50% | 963 -42% | 2488 50% | 1489 -10% | 3640 120% |
| Copy ISO MB/s (MB/s) | 905 | 317.8 -65% | 265.8 -71% | 700 -23% | 432.6 -52% | 2145 137% |
| Copy Program MB/s (MB/s) | 607 | 80.8 -87% | 158.7 -74% | 167.2 -72% | 95.6 -84% | 565 -7% |
| Copy Game MB/s (MB/s) | 911 | 127.1 -86% | 216.8 -76% | 370.4 -59% | 263.4 -71% | 1320 45% |
| CrystalDiskMark 5.2 / 6 | -39% | 4% | -39% | 32% | ||
| Write 4K (MB/s) | 179 | 105 -41% | 116 -35% | 87.3 -51% | 93.6 -48% | |
| Read 4K (MB/s) | 58.7 | 39.72 -32% | 42.73 -27% | 23.54 -60% | 41.87 -29% | |
| Write Seq (MB/s) | 974 | 326.9 -66% | 1222 25% | 824 -15% | 1698 74% | |
| Read Seq (MB/s) | 1614 | 1033 -36% | 1608 0% | 715 -56% | 1978 23% | |
| Write 4K Q32T1 (MB/s) | 445.4 | 269.1 -40% | 280.1 -37% | 147.8 -67% | 383.1 -14% | |
| Read 4K Q32T1 (MB/s) | 338.7 | 284.8 -16% | 333.6 -2% | 256.1 -24% | 326.9 -3% | |
| Write Seq Q32T1 (MB/s) | 986 | 321 -67% | 1291 31% | 733 -26% | 2778 182% | |
| Read Seq Q32T1 (MB/s) | 1824 | 1606 -12% | 3183 75% | 1525 -16% | 3119 71% | |
| Média Total (Programa/Configurações) | -60% /
-60% | -37% /
-37% | 12% /
14% | -56% /
-60% | 51% /
56% |
* ... menor é melhor

| 3DMark 11 Performance | 1933 pontos | |
| 3DMark Cloud Gate Standard Score | 7819 pontos | |
| 3DMark Fire Strike Score | 1008 pontos | |
| 3DMark Time Spy Score | 427 pontos | |
Ajuda | ||
| Shadow of the Tomb Raider - 1280x720 Lowest Preset | |
| MSI Modern 14 A10RB-459US | |
| Dell Inspiron 15 5000 5585 | |
| Microsoft Surface Laptop 3 15 i7-1065G7 | |
| Dell Inspiron 15 3585 (2300U, Vega 6) | |
| Dell XPS 13 7390 Core i7-10710U | |
| Média Intel UHD Graphics 620 (12 - 21.7, n=13) | |
| baixo | média | alto | ultra | |
|---|---|---|---|---|
| BioShock Infinite (2013) | 49.1 | 30.5 | 24.7 | |
| The Witcher 3 (2015) | 16.8 | 10.5 | ||
| Rocket League (2017) | 62.7 |
| HP Pavilion x360 15-dq0065cl UHD Graphics 620, i7-8565U, Intel SSD 660p SSDPEKNW512G8 | Asus VivoBook Flip 15 TP510UA-E8073T UHD Graphics 620, i5-8250U, SanDisk SD8SN8U128G1002 | Lenovo Ideapad C340-15IWL-81N5004QGE GeForce MX230, i5-8265U, SK hynix BC501 HFM128GDJTNG-831 | HP Envy x360 15-bq102ng Vega 8, R5 2500U, Samsung PM961 MZVLW256HEHP | Dell Inspiron 15 3585 (2300U, Vega 6) Vega 6, R3 2300U, Toshiba BG3 KBG30ZMS256G | Dell XPS 15 7590 i5 iGPU FHD UHD Graphics 630, i5-9300H, Toshiba XG6 KXG60ZNV512G | |
|---|---|---|---|---|---|---|
| Noise | -6% | -8% | -9% | -10% | -3% | |
| desligado / ambiente * (dB) | 28.4 | 30.2 -6% | 30.3 -7% | 30.13 -6% | 30.6 -8% | 29.3 -3% |
| Idle Minimum * (dB) | 28.4 | 30.9 -9% | 30.6 -8% | 30.13 -6% | 30.6 -8% | 29.3 -3% |
| Idle Average * (dB) | 28.4 | 30.9 -9% | 30.6 -8% | 30.13 -6% | 30.6 -8% | 29.3 -3% |
| Idle Maximum * (dB) | 28.4 | 30.9 -9% | 30.6 -8% | 30.13 -6% | 30.6 -8% | 29.8 -5% |
| Load Average * (dB) | 31.5 | 34.2 -9% | 36.4 -16% | 38.8 -23% | 36.7 -17% | 32.4 -3% |
| Load Maximum * (dB) | 37.4 | 34.2 9% | 36.8 2% | 38.8 -4% | 41.1 -10% | 37.2 1% |
* ... menor é melhor
Barulho
| Ocioso |
| 28.4 / 28.4 / 28.4 dB |
| Carga |
| 31.5 / 37.4 dB |
 | ||
30 dB silencioso 40 dB(A) audível 50 dB(A) ruidosamente alto |
||
min: | ||
(+) A temperatura máxima no lado superior é 31.6 °C / 89 F, em comparação com a média de 36.8 °C / 98 F , variando de 21 a 71 °C para a classe Multimedia.
(±) A parte inferior aquece até um máximo de 41.6 °C / 107 F, em comparação com a média de 39.1 °C / 102 F
(+) Em uso inativo, a temperatura média para o lado superior é 22.9 °C / 73 F, em comparação com a média do dispositivo de 31.3 °C / ### class_avg_f### F.
(+) Os apoios para as mãos e o touchpad são mais frios que a temperatura da pele, com um máximo de 29.8 °C / 85.6 F e, portanto, são frios ao toque.
(±) A temperatura média da área do apoio para as mãos de dispositivos semelhantes foi 28.7 °C / 83.7 F (-1.1 °C / -1.9 F).
HP Pavilion x360 15-dq0065cl análise de áudio
(±) | o volume do alto-falante é médio, mas bom (###valor### dB)
Graves 100 - 315Hz
(±) | graves reduzidos - em média 12.7% menor que a mediana
(-) | graves não são lineares (15.3% delta para frequência anterior)
Médios 400 - 2.000 Hz
(+) | médios equilibrados - apenas 3.6% longe da mediana
(±) | a linearidade dos médios é média (7% delta para frequência anterior)
Altos 2 - 16 kHz
(+) | agudos equilibrados - apenas 3.6% longe da mediana
(±) | a linearidade dos máximos é média (7% delta para frequência anterior)
Geral 100 - 16.000 Hz
(±) | a linearidade do som geral é média (20.1% diferença em relação à mediana)
Comparado com a mesma classe
» 67% de todos os dispositivos testados nesta classe foram melhores, 8% semelhantes, 25% piores
» O melhor teve um delta de 5%, a média foi 17%, o pior foi 45%
Comparado com todos os dispositivos testados
» 52% de todos os dispositivos testados foram melhores, 8% semelhantes, 40% piores
» O melhor teve um delta de 4%, a média foi 24%, o pior foi 134%
Apple MacBook 12 (Early 2016) 1.1 GHz análise de áudio
(+) | os alto-falantes podem tocar relativamente alto (###valor### dB)
Graves 100 - 315Hz
(±) | graves reduzidos - em média 11.3% menor que a mediana
(±) | a linearidade dos graves é média (14.2% delta para a frequência anterior)
Médios 400 - 2.000 Hz
(+) | médios equilibrados - apenas 2.4% longe da mediana
(+) | médios são lineares (5.5% delta para frequência anterior)
Altos 2 - 16 kHz
(+) | agudos equilibrados - apenas 2% longe da mediana
(+) | os máximos são lineares (4.5% delta da frequência anterior)
Geral 100 - 16.000 Hz
(+) | o som geral é linear (10.2% diferença em relação à mediana)
Comparado com a mesma classe
» 7% de todos os dispositivos testados nesta classe foram melhores, 2% semelhantes, 91% piores
» O melhor teve um delta de 5%, a média foi 18%, o pior foi 53%
Comparado com todos os dispositivos testados
» 5% de todos os dispositivos testados foram melhores, 1% semelhantes, 94% piores
» O melhor teve um delta de 4%, a média foi 24%, o pior foi 134%
| desligado | |
| Ocioso | |
| Carga |
|
Key:
min: | |
| HP Pavilion x360 15-dq0065cl i7-8565U, UHD Graphics 620, Intel SSD 660p SSDPEKNW512G8, TN LED, 1366x768, 15.6" | Asus VivoBook Flip 15 TP510UA-E8073T i5-8250U, UHD Graphics 620, SanDisk SD8SN8U128G1002, IPS, 1920x1080, 15.6" | Lenovo Ideapad C340-15IWL-81N5004QGE i5-8265U, GeForce MX230, SK hynix BC501 HFM128GDJTNG-831, IPS, 1920x1080, 15.6" | HP Envy x360 15-bq102ng R5 2500U, Vega 8, Samsung PM961 MZVLW256HEHP, IPS, 1920x1080, 15.6" | Dell Inspiron 15 3585 (2300U, Vega 6) R3 2300U, Vega 6, Toshiba BG3 KBG30ZMS256G, TN, 1920x1080, 15.6" | Dell XPS 15 7590 i5 iGPU FHD i5-9300H, UHD Graphics 630, Toshiba XG6 KXG60ZNV512G, IPS, 1920x1080, 15.6" | |
|---|---|---|---|---|---|---|
| Power Consumption | -28% | -48% | -43% | -59% | -96% | |
| Idle Minimum * (Watt) | 3.6 | 3.9 -8% | 3.23 10% | 4.8 -33% | 6.3 -75% | 3.79 -5% |
| Idle Average * (Watt) | 5.4 | 7.2 -33% | 6.3 -17% | 7 -30% | 9.2 -70% | 6.9 -28% |
| Idle Maximum * (Watt) | 6.5 | 9.5 -46% | 8 -23% | 9.5 -46% | 9.6 -48% | 9.2 -42% |
| Load Average * (Watt) | 26.7 | 36.8 -38% | 47 -76% | 40.8 -53% | 38 -42% | 62 -132% |
| Load Maximum * (Watt) | 28.8 | 33.1 -15% | 67.3 -134% | 44.3 -54% | 46 -60% | 108 -275% |
* ... menor é melhor
| HP Pavilion x360 15-dq0065cl i7-8565U, UHD Graphics 620, 41 Wh | Asus VivoBook Flip 15 TP510UA-E8073T i5-8250U, UHD Graphics 620, 42 Wh | Lenovo Ideapad C340-15IWL-81N5004QGE i5-8265U, GeForce MX230, 52.5 Wh | HP Envy x360 15-bq102ng R5 2500U, Vega 8, 55.8 Wh | Dell Inspiron 15 3585 (2300U, Vega 6) R3 2300U, Vega 6, 42 Wh | Dell XPS 15 7590 i5 iGPU FHD i5-9300H, UHD Graphics 630, 97 Wh | |
|---|---|---|---|---|---|---|
| Duração da bateria | 40% | 100% | 65% | 4% | 125% | |
| Reader / Idle (h) | 12.3 | 7.3 -41% | ||||
| WiFi v1.3 (h) | 4.3 | 6 40% | 8.6 100% | 7.1 65% | 5.3 23% | 14.1 228% |
| Load (h) | 1.4 | 1.8 29% | 1.7 21% |
Pro
Contra
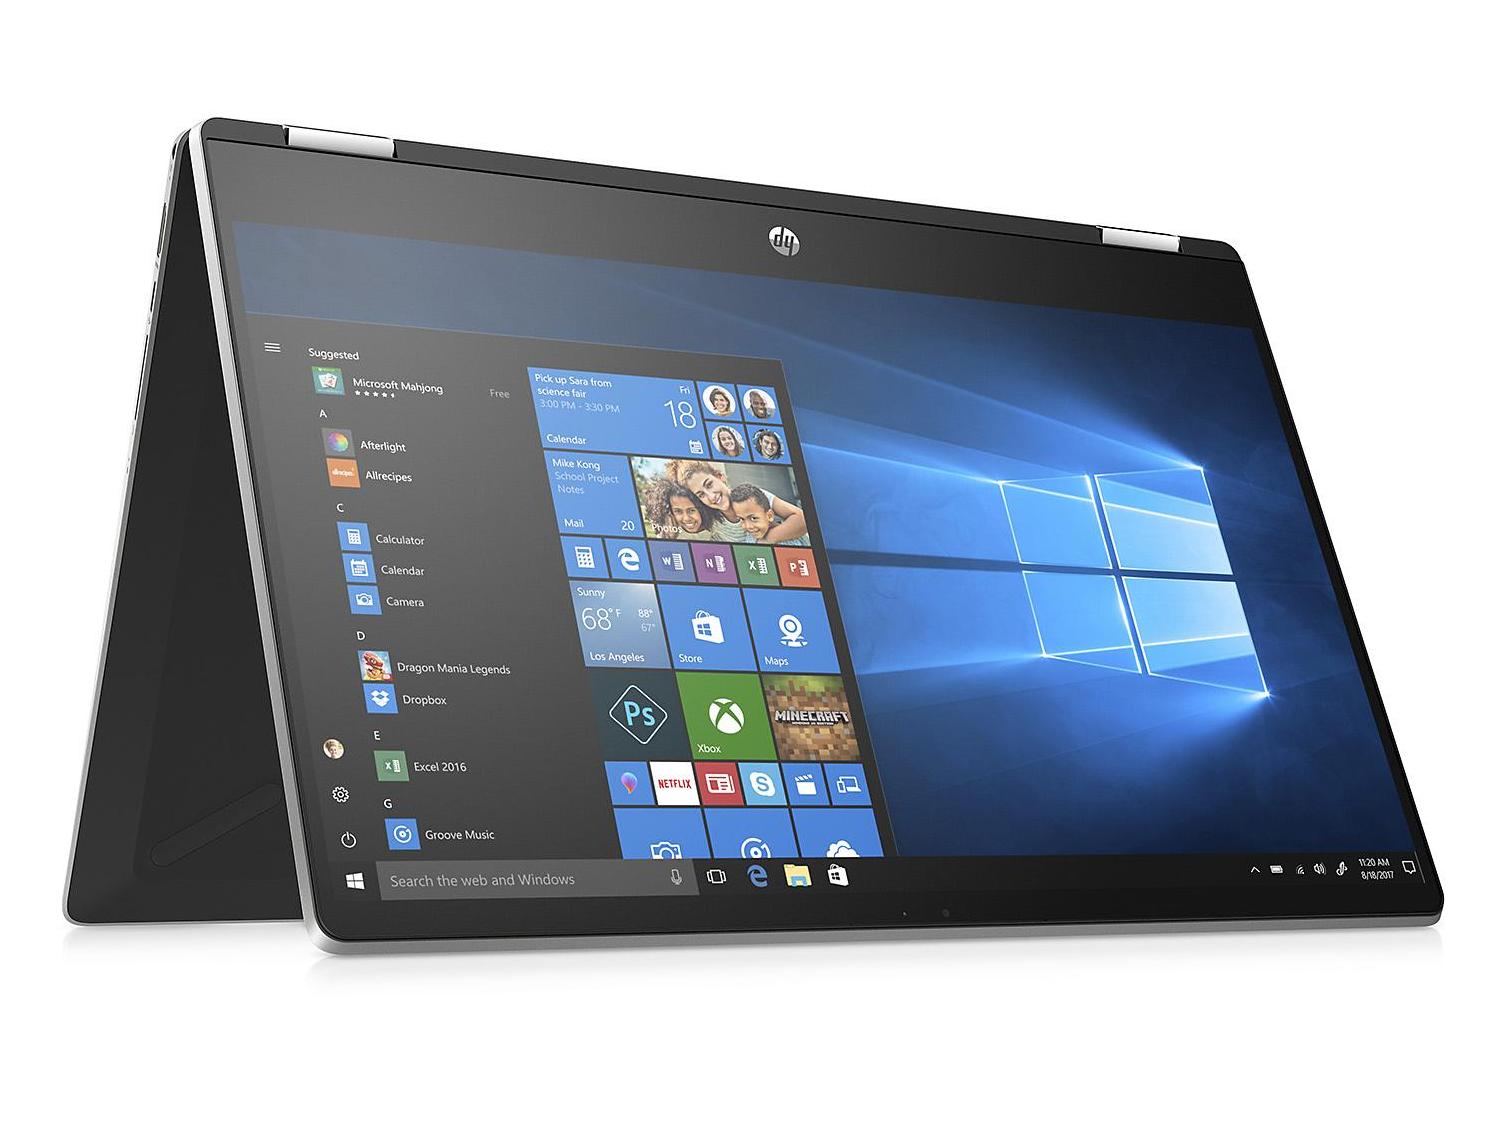
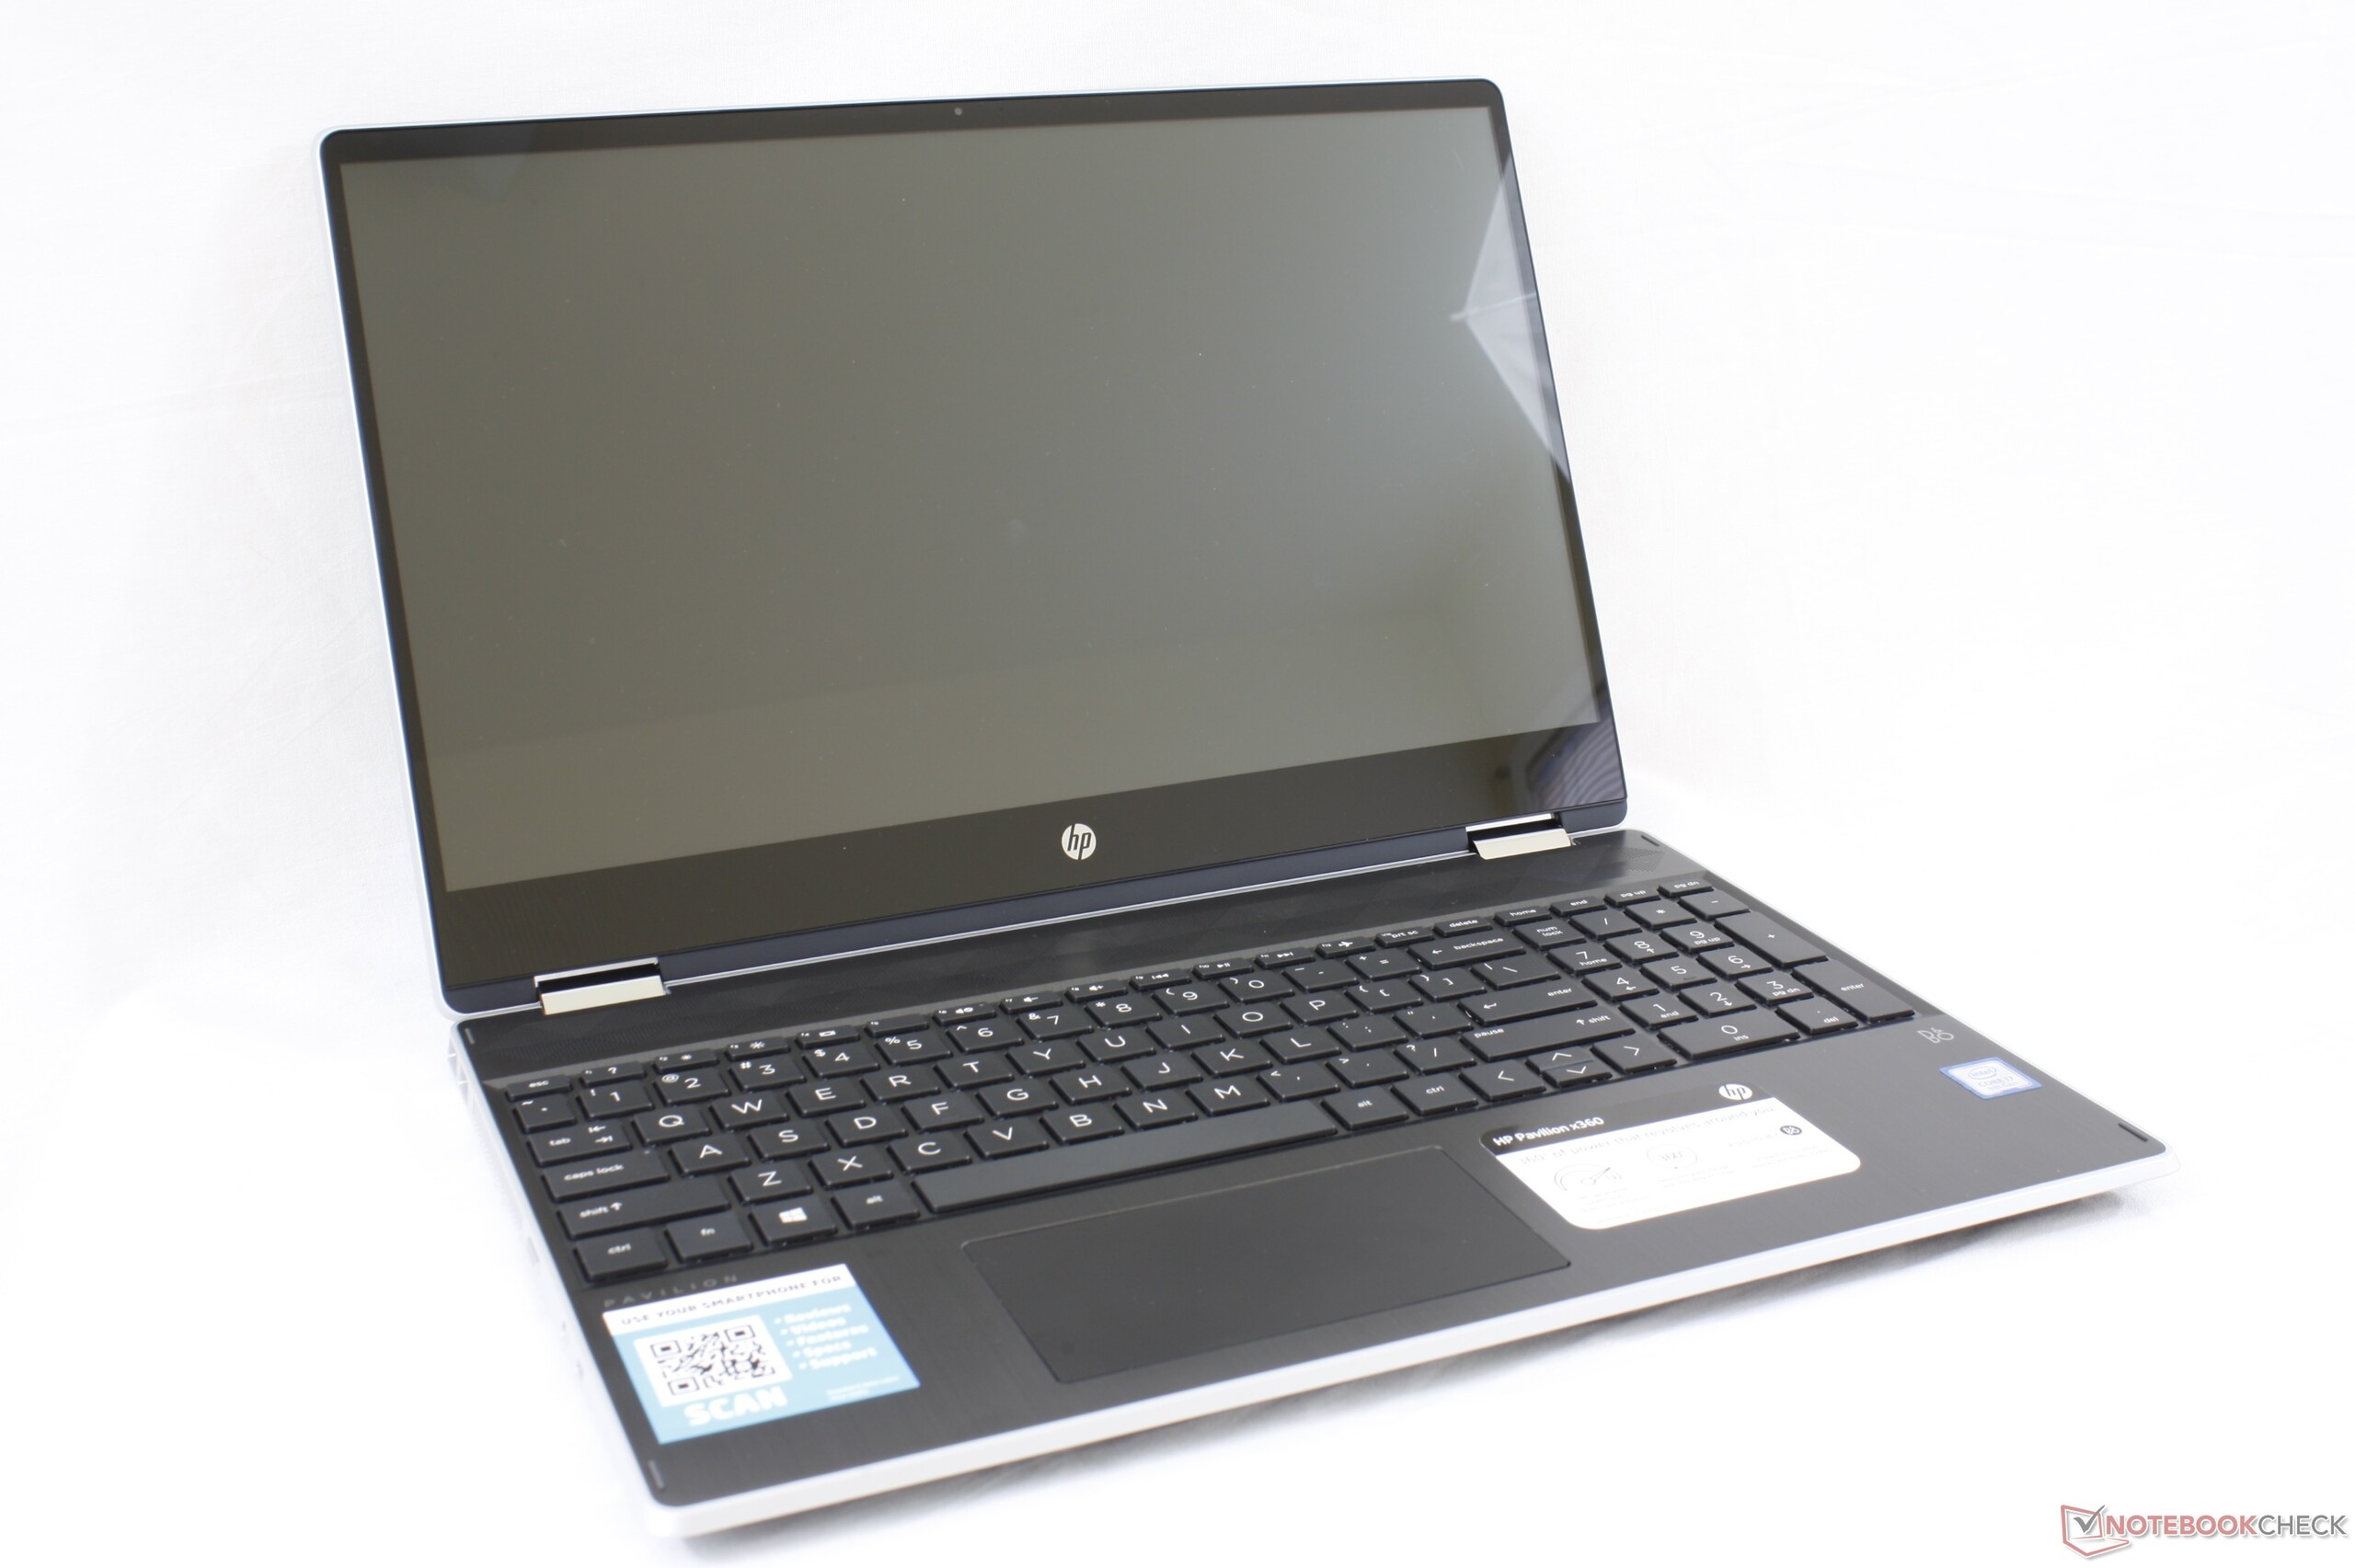
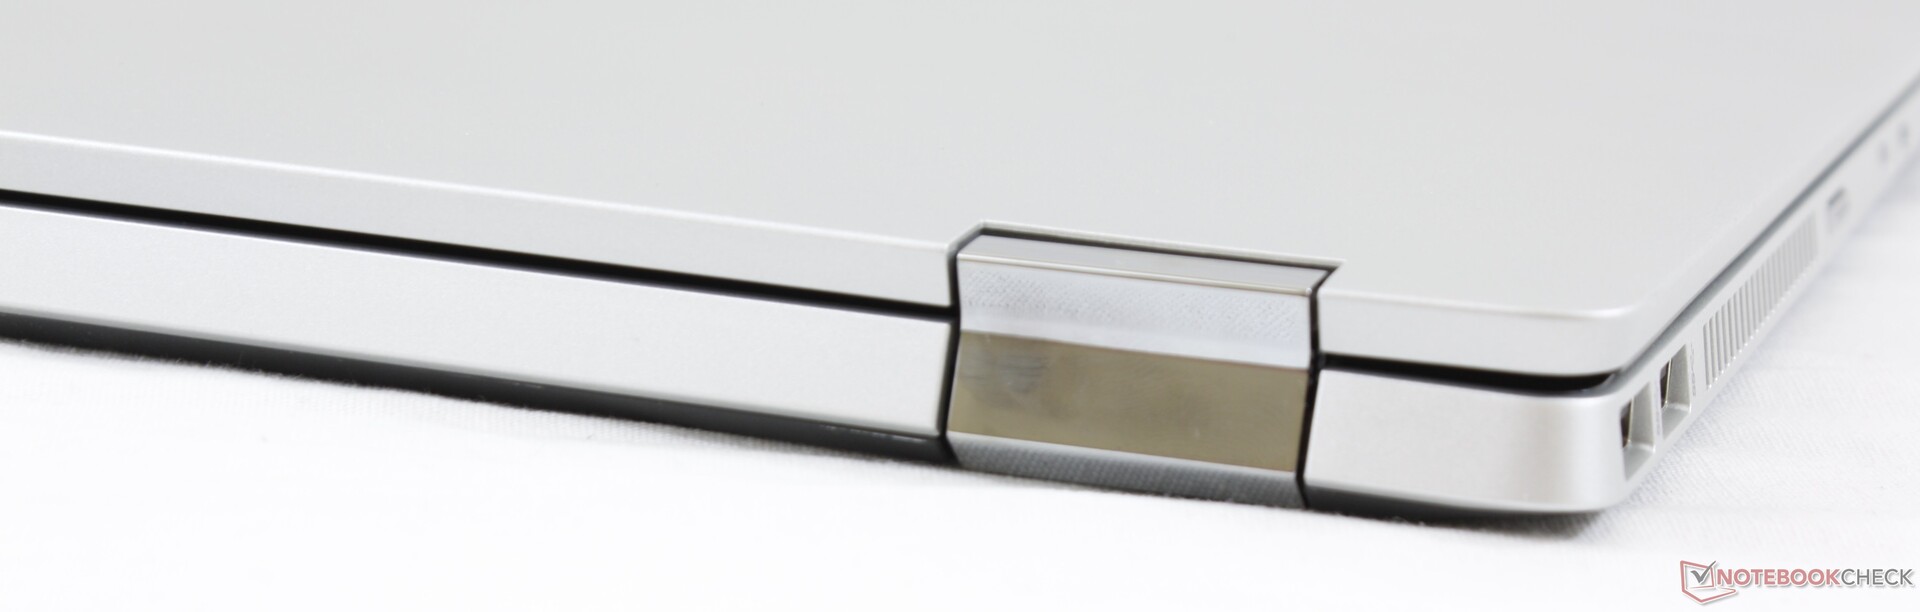
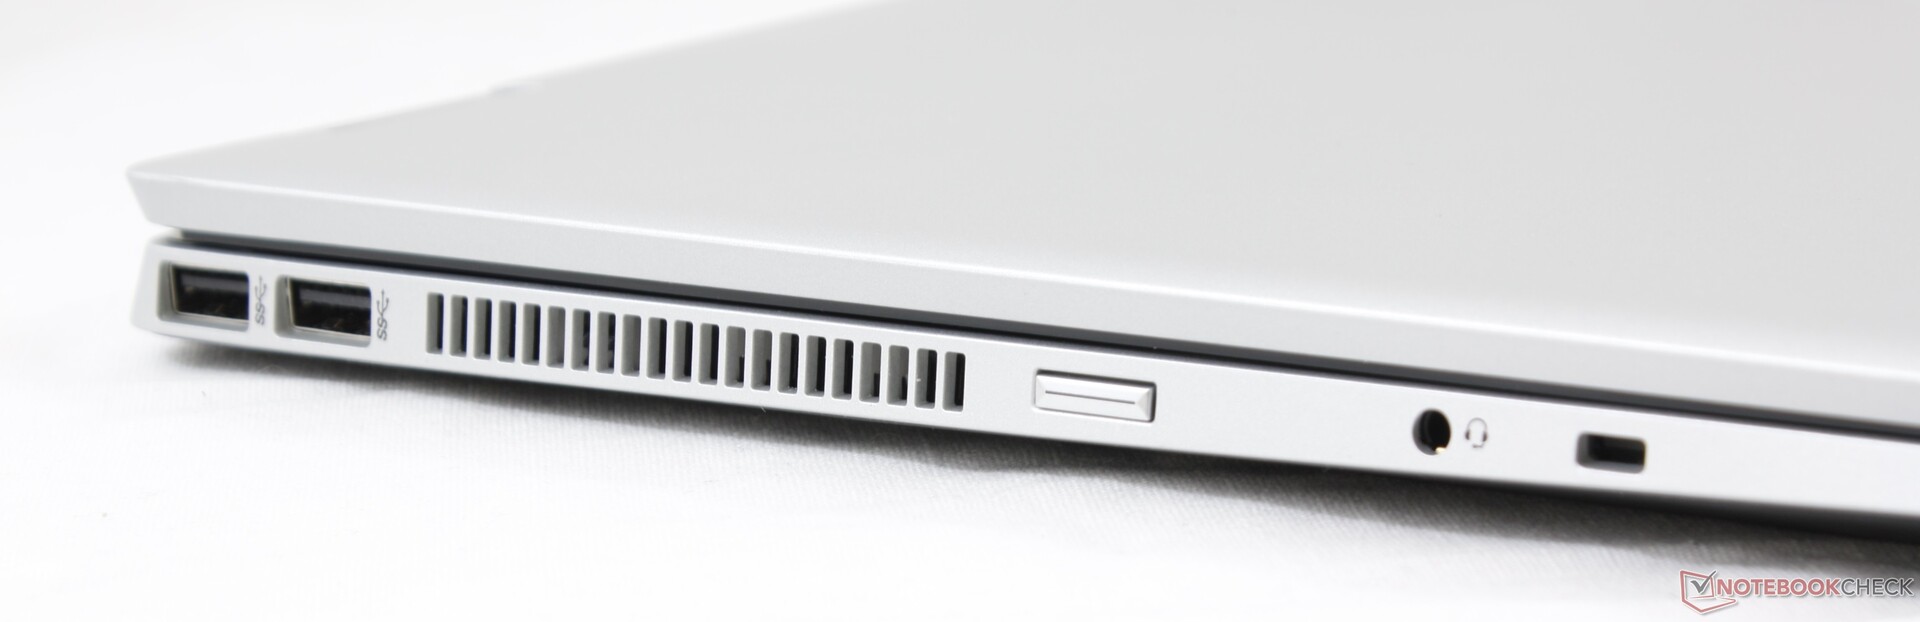
Os aspectos que resgatam o Pavilion x360 15 de 2019 são seus marcos estreitos, peso leve e pequenas dimensões em relação a outros conversíveis econômicos dessa categoria de tamanho. As opções de portas são respeitáveis e o ruído do ventilador é relativamente silencioso devido ao limitado Turbo Boost e às boas temperaturas do núcleo.
Infelizmente, quase todo o resto se desmorona. Por US$ 1.000, o Pavilion x360 15 oferece bateria de curta duração, um design fraco de chassi e uma das piores telas que você pode obter em um portátil com uma CPU Whiskey Lake-U. A tela é escura, o contraste é baixo, as cores são ruins e os ângulos de visão são estreitos por causa do painel TN, que nega quase completamente os benefícios de um formato 2 em 1. Uma configuração como essa nem deveria existir nessa faixa de preço.
Agora, o atual modelo Pavilion x360 15 não é ruim para um portátil econômico. As configurações de gama baixa custam cerca de US$ 500 para serem uma pílula mais fácil de engolir. No entanto, é altamente recomendável configurar qualquer SKU com o painel 1080p. Se o formato conversível não for um item obrigatório, então o Walmart Motile poderia ser uma alternativa que vale a pena.
Não vale o preço exorbitante de quatro dígitos do mercado. Se você estiver disposto a gastar US$ 1.000 em um portátil novo, considere o HP Envy ou o Spectre.
HP Pavilion x360 15-dq0065cl
- 02/09/2020 v7 (old)
Allen Ngo
Price comparison
