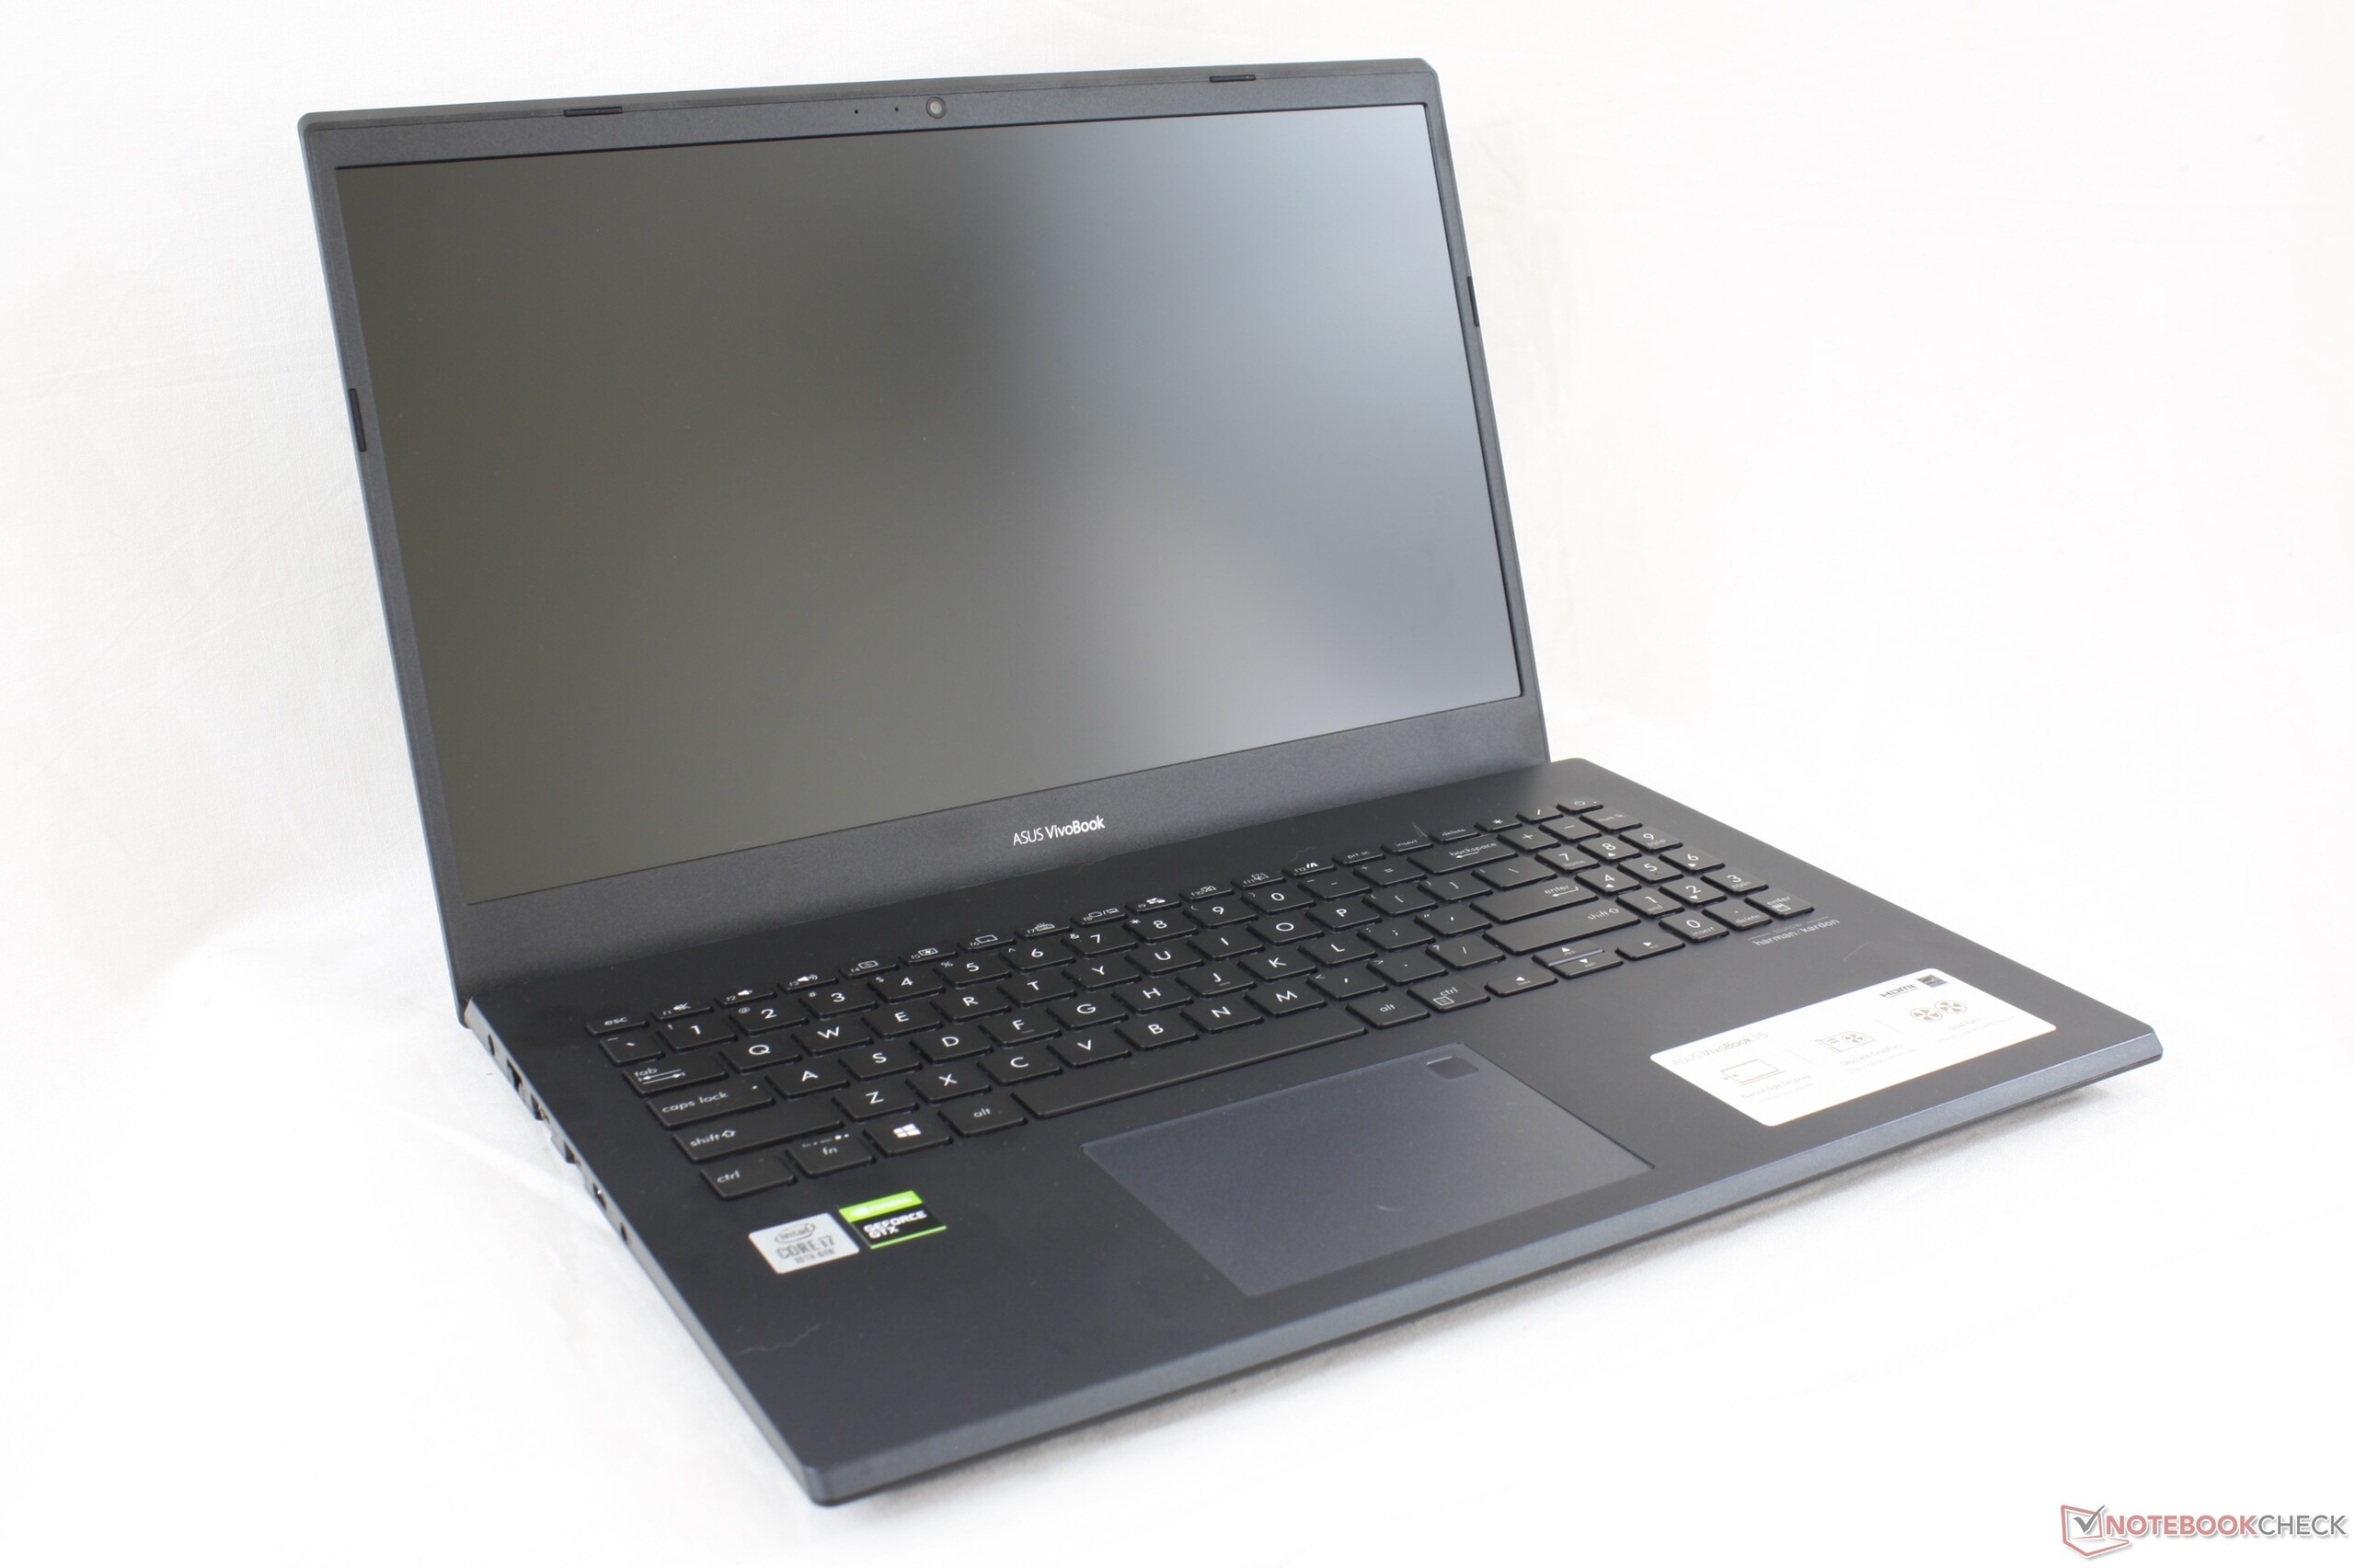
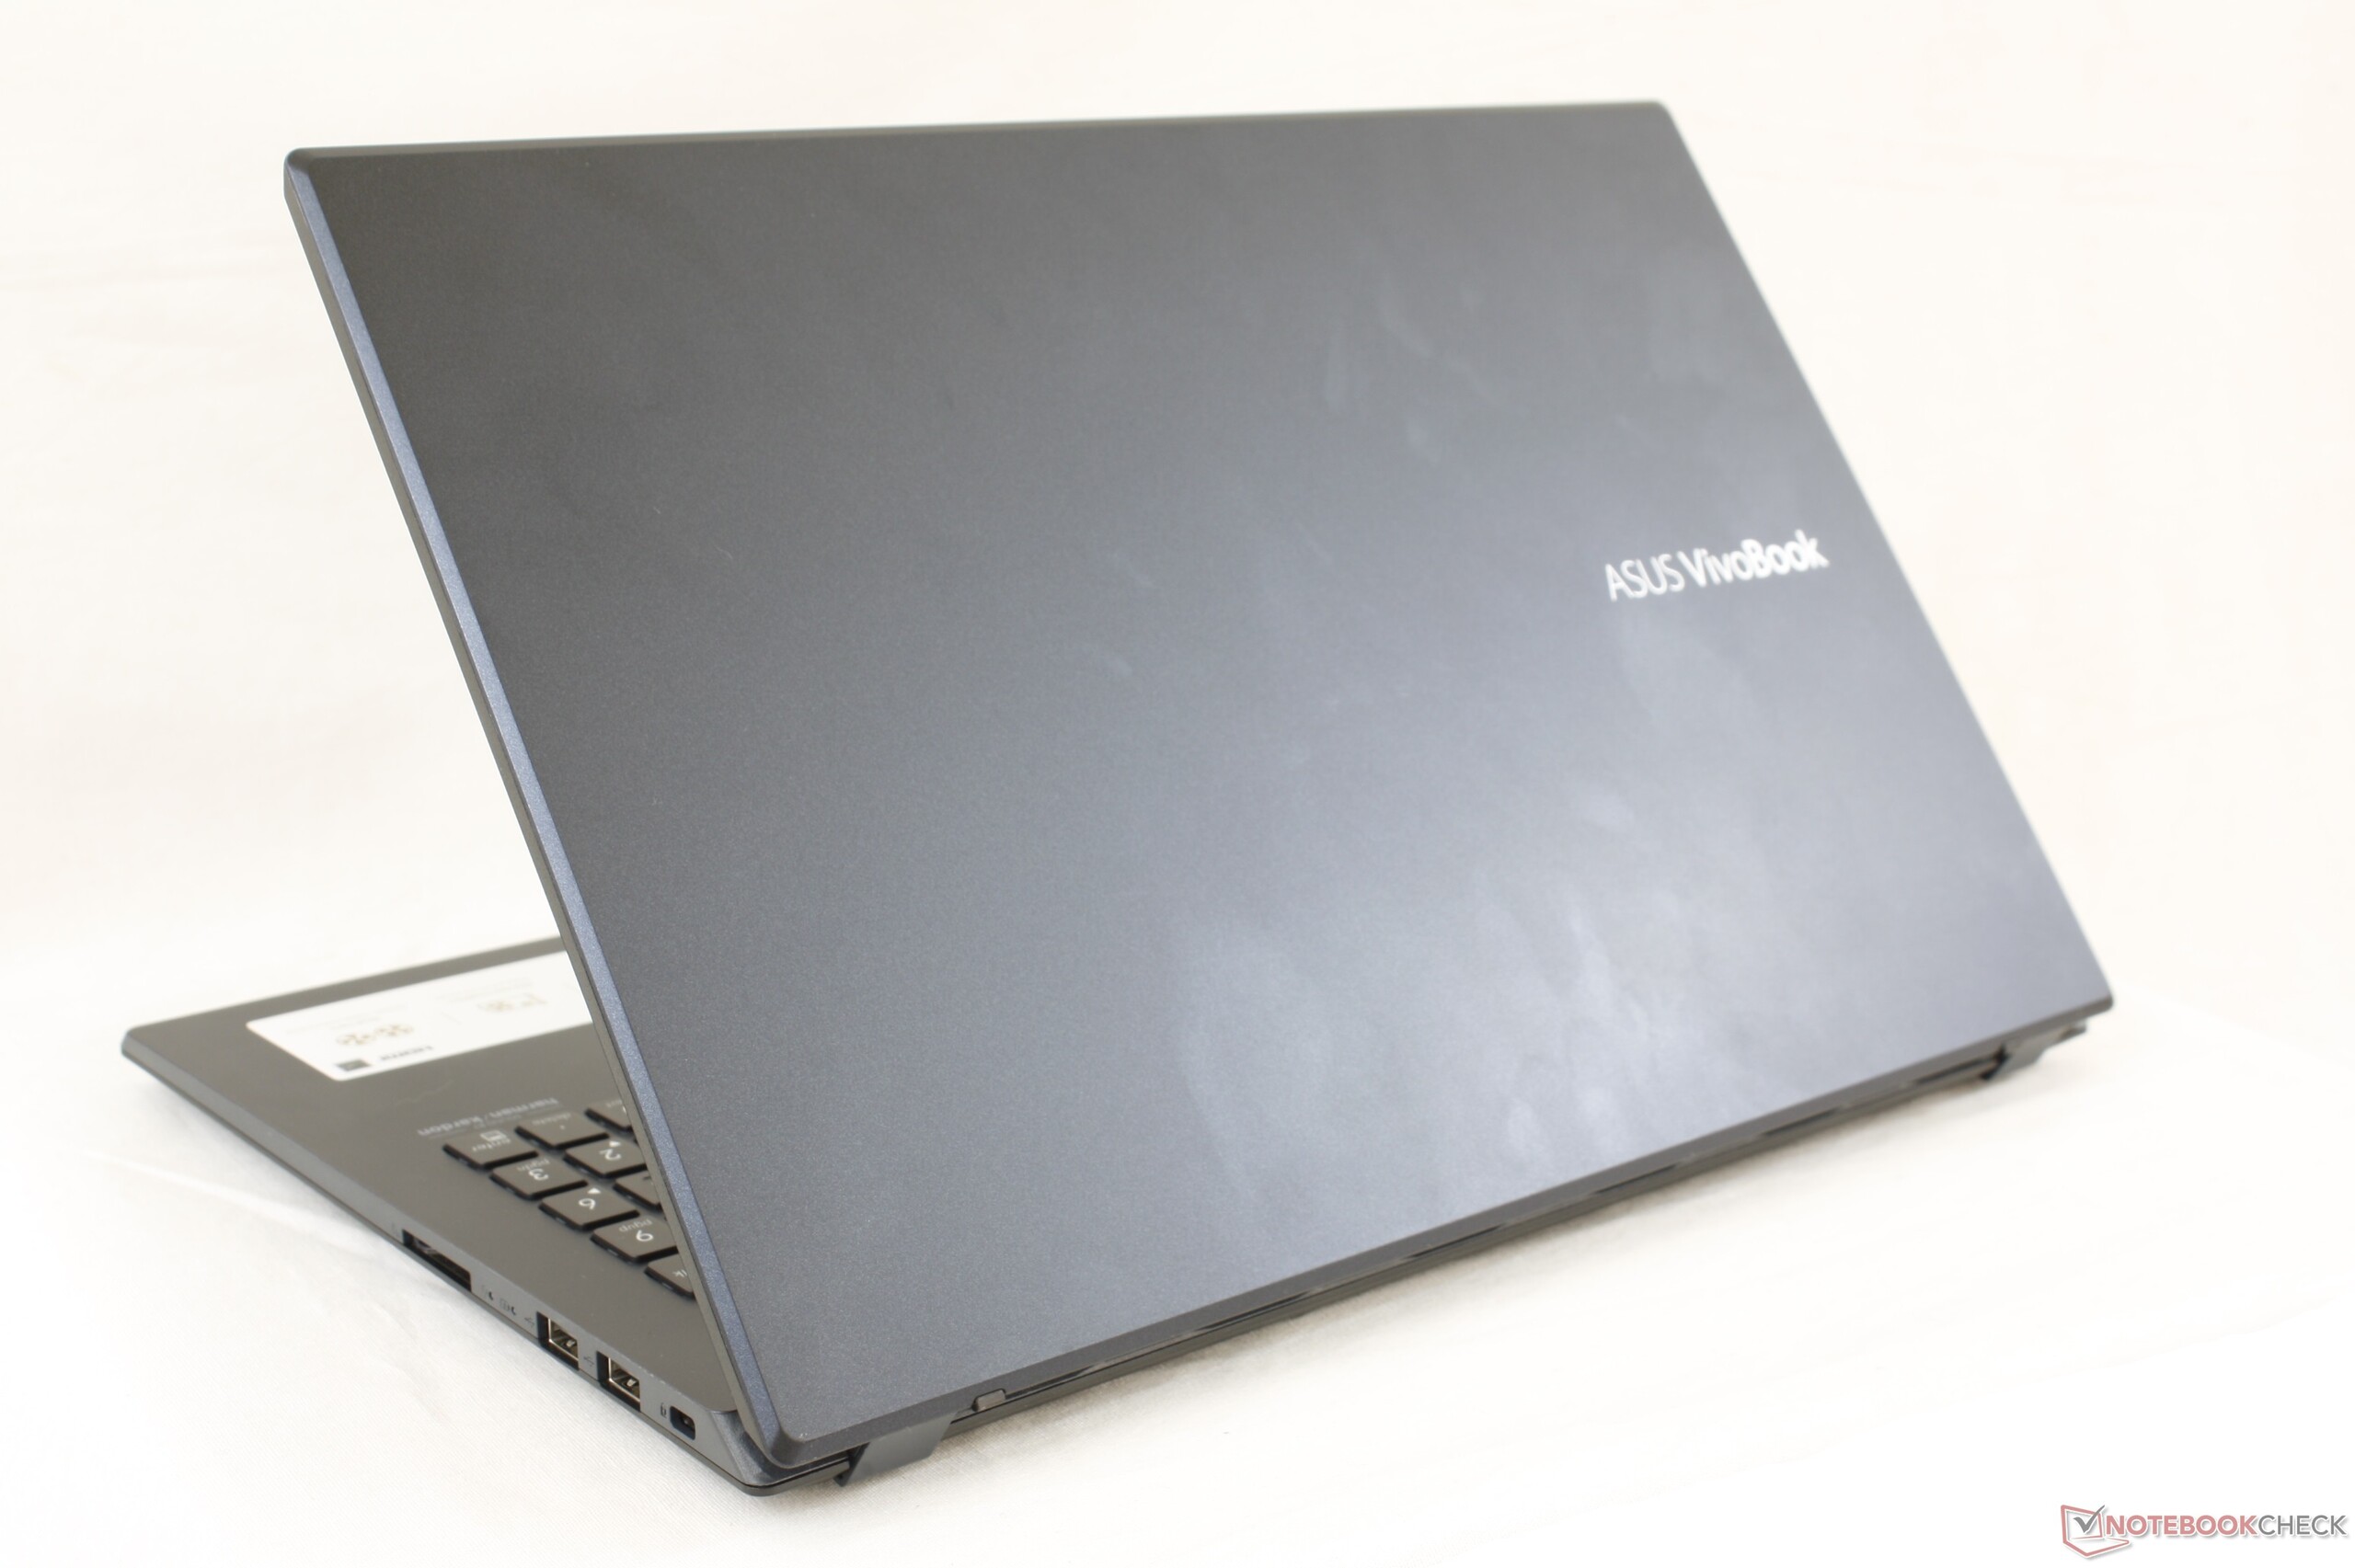
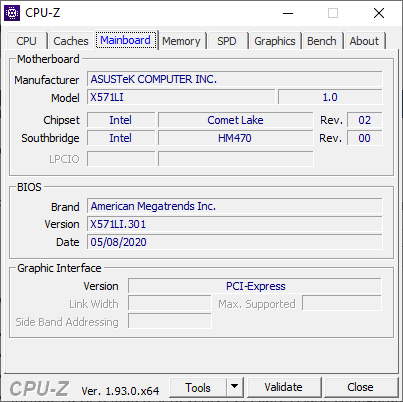
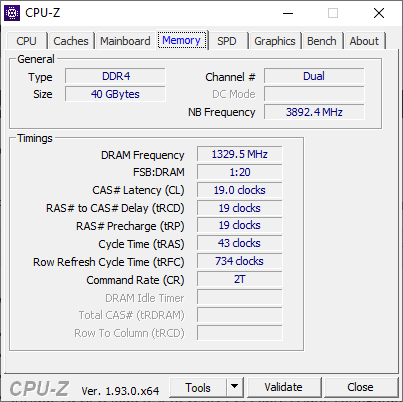
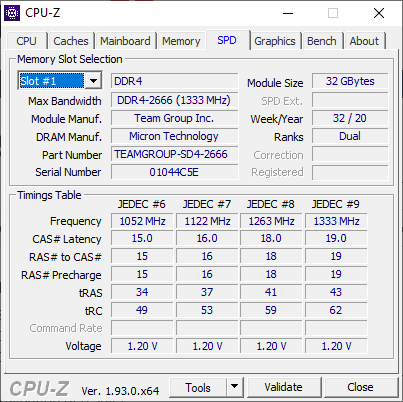
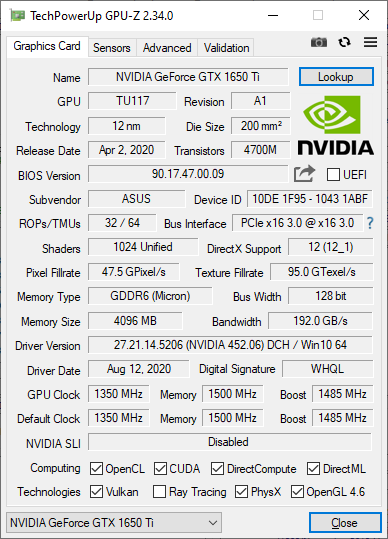
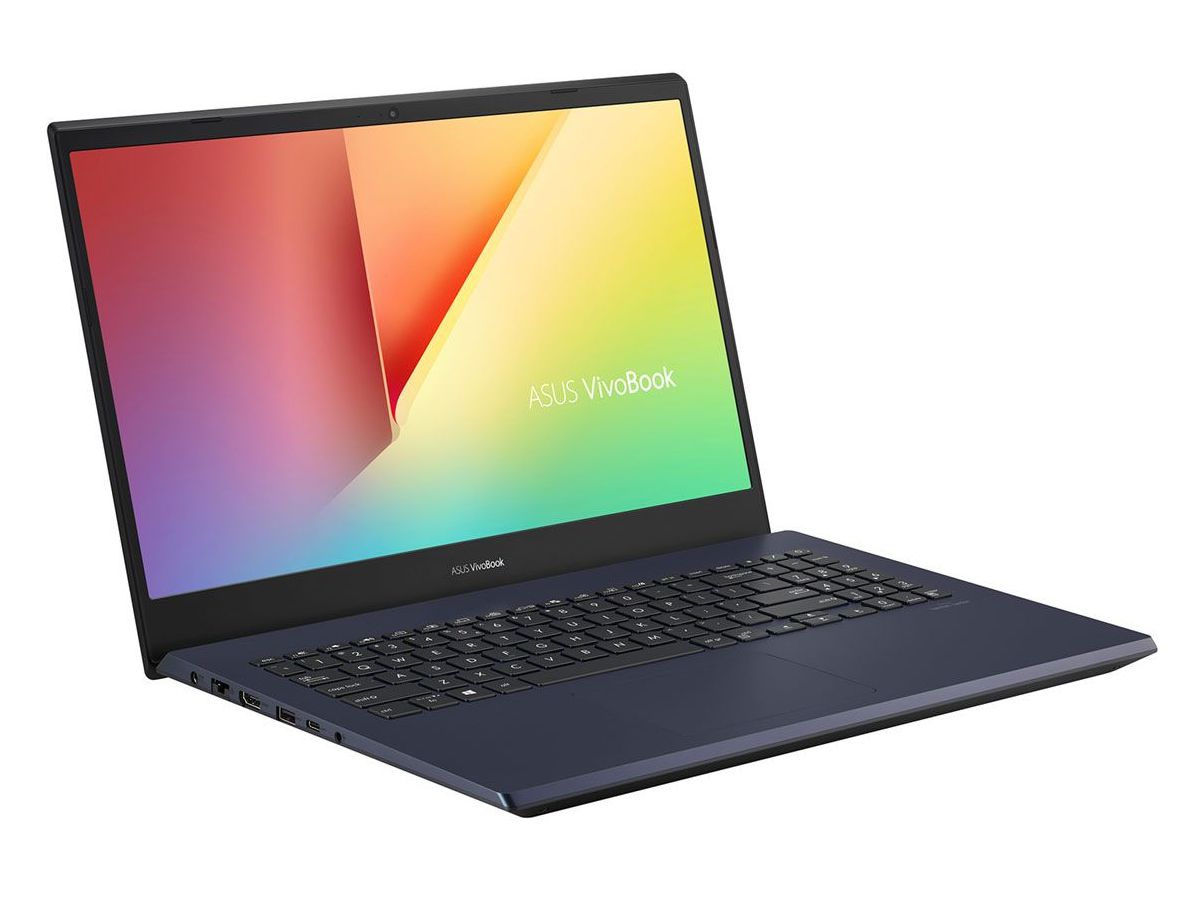
Breve Análise do Portátil Asus VivoBook 15 K571LI: Híbrido multimídia para jogos
Avaliação | Data | Modelo | Peso | Altura | Size | Resolução | Preço |
|---|---|---|---|---|---|---|---|
| 78.6 % v7 (old) | 09/2020 | Asus VivoBook 15 K571LI-PB71 i7-10750H, GeForce GTX 1650 Ti Mobile | 2.1 kg | 21.9 mm | 15.60" | 1920x1080 | |
| 83 % v7 (old) | 08/2020 | HP Envy 15-ep0098nr i7-10750H, GeForce RTX 2060 Max-Q | 2 kg | 19 mm | 15.60" | 3840x2160 | |
| 81.5 % v7 (old) | Acer Aspire 5 A515-54G i5-10210U, GeForce MX250 | 1.7 kg | 17.9 mm | 15.60" | 1920x1080 | ||
| 85.2 % v7 (old) | 03/2020 | Asus ZenBook 15 UX534FTC-A8190T i7-10510U, GeForce GTX 1650 Max-Q | 1.6 kg | 18.9 mm | 15.60" | 1920x1080 | |
| 81.4 % v7 (old) | 01/2020 | Lenovo Ideapad S540-15IML i5-10210U, GeForce MX250 | 1.9 kg | 17 mm | 15.60" | 1920x1080 | |
| 79.7 % v6 (old) | 08/2019 | Dell Inspiron 15 5000 5585 R7 3700U, Vega 10 | 1.8 kg | 19.5 mm | 15.60" | 1920x1080 |
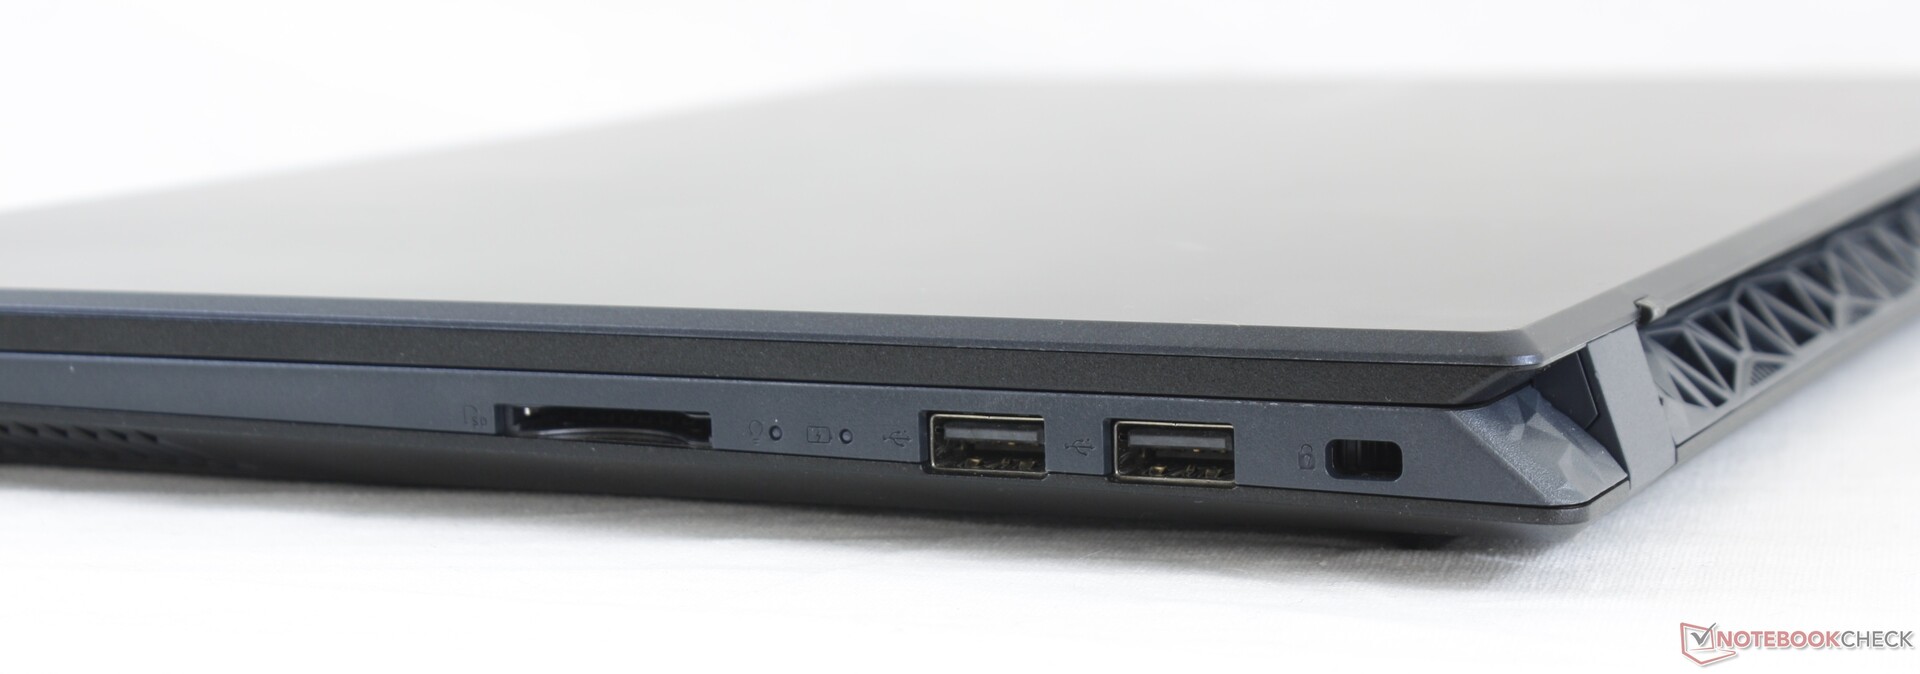
| SD Card Reader | |
| average JPG Copy Test (av. of 3 runs) | |
| Lenovo Ideapad S540-15IML (Toshiba Exceria Pro SDXC 64 GB UHS-II) | |
| HP Envy 15-ep0098nr (Toshiba Exceria Pro M501 UHS-II) | |
| Dell Inspiron 15 5000 5585 (Toshiba Exceria Pro SDXC 64 GB UHS-II) | |
| Asus VivoBook 15 K571LI-PB71 (Toshiba Exceria Pro SDXC 64 GB UHS-II) | |
| maximum AS SSD Seq Read Test (1GB) | |
| HP Envy 15-ep0098nr (Toshiba Exceria Pro M501 UHS-II) | |
| Lenovo Ideapad S540-15IML (Toshiba Exceria Pro SDXC 64 GB UHS-II) | |
| Dell Inspiron 15 5000 5585 (Toshiba Exceria Pro SDXC 64 GB UHS-II) | |
| Asus VivoBook 15 K571LI-PB71 (Toshiba Exceria Pro SDXC 64 GB UHS-II) | |
| Networking | |
| iperf3 transmit AX12 | |
| HP Envy 15-ep0098nr | |
| Asus VivoBook 15 K571LI-PB71 | |
| Acer Aspire 5 A515-54G | |
| Dell Inspiron 15 5000 5585 | |
| Lenovo Ideapad S540-15IML | |
| iperf3 receive AX12 | |
| Asus VivoBook 15 K571LI-PB71 | |
| HP Envy 15-ep0098nr | |
| Acer Aspire 5 A515-54G | |
| Dell Inspiron 15 5000 5585 | |
| Lenovo Ideapad S540-15IML | |


| |||||||||||||||||||||||||
iluminação: 87 %
iluminação com acumulador: 263.9 cd/m²
Contraste: 1015:1 (Preto: 0.26 cd/m²)
ΔE ColorChecker Calman: 5.56 | ∀{0.5-29.43 Ø4.71}
calibrated: 4.3
ΔE Greyscale Calman: 5.8 | ∀{0.09-98 Ø4.96}
60.1% sRGB (Argyll 1.6.3 3D)
38.2% AdobeRGB 1998 (Argyll 1.6.3 3D)
41.56% AdobeRGB 1998 (Argyll 3D)
60.4% sRGB (Argyll 3D)
40.2% Display P3 (Argyll 3D)
Gamma: 2.16
CCT: 7828 K
| Asus VivoBook 15 K571LI-PB71 Panda LM156LF-GL03, IPS, 15.6", 1920x1080 | HP Envy 15-ep0098nr Samsung SDC4145, AMOLED, 15.6", 3840x2160 | Acer Aspire 5 A515-54G LG Display LP156WFC SPD1, IPS, 15.6", 1920x1080 | Asus ZenBook 15 UX534FTC-A8190T BOE CQ NV156FHM-N63, IPS, 15.6", 1920x1080 | Lenovo Ideapad S540-15IML BOEhydis NV156FHM-N61 (BOE06FB), IPS, 15.6", 1920x1080 | Dell Inspiron 15 5000 5585 LG Philips 156WFC, IPS, 15.6", 1920x1080 | |
|---|---|---|---|---|---|---|
| Display | 109% | -16% | 52% | 54% | -7% | |
| Display P3 Coverage (%) | 40.2 | 88.5 120% | 33.78 -16% | 65 62% | 66.8 66% | 37.31 -7% |
| sRGB Coverage (%) | 60.4 | 100 66% | 50.8 -16% | 86.2 43% | 86.5 43% | 56.2 -7% |
| AdobeRGB 1998 Coverage (%) | 41.56 | 99.9 140% | 34.9 -16% | 62.9 51% | 63.2 52% | 38.55 -7% |
| Response Times | 93% | -16% | -46% | -60% | -7% | |
| Response Time Grey 50% / Grey 80% * (ms) | 28.4 ? | 0.8 ? 97% | 36 ? -27% | 45 ? -58% | 49.6 ? -75% | 28.4 ? -0% |
| Response Time Black / White * (ms) | 24 ? | 2.7 ? 89% | 25 ? -4% | 32 ? -33% | 34.8 ? -45% | 27.2 ? -13% |
| PWM Frequency (Hz) | 242.7 ? | 202 ? | ||||
| Screen | 45% | 6% | 28% | 25% | -1% | |
| Brightness middle (cd/m²) | 263.9 | 374.3 42% | 248 -6% | 299 13% | 299 13% | 253.6 -4% |
| Brightness (cd/m²) | 246 | 379 54% | 238 -3% | 280 14% | 278 13% | 227 -8% |
| Brightness Distribution (%) | 87 | 91 5% | 86 -1% | 89 2% | 87 0% | 84 -3% |
| Black Level * (cd/m²) | 0.26 | 0.23 12% | 0.21 19% | 0.25 4% | 0.27 -4% | |
| Contrast (:1) | 1015 | 1078 6% | 1424 40% | 1196 18% | 939 -7% | |
| Colorchecker dE 2000 * | 5.56 | 5.47 2% | 5.05 9% | 4.76 14% | 4.32 22% | 6.05 -9% |
| Colorchecker dE 2000 max. * | 16.11 | 8.22 49% | 14.34 11% | 9 44% | 9.3 42% | 14.03 13% |
| Colorchecker dE 2000 calibrated * | 4.3 | 4.61 -7% | 4.76 -11% | 2.58 40% | 4.97 -16% | |
| Greyscale dE 2000 * | 5.8 | 2.3 60% | 1.37 76% | 3.53 39% | 4.21 27% | 3.2 45% |
| Gamma | 2.16 102% | 2.09 105% | 2.4 92% | 2.3 96% | 2.39 92% | 2 110% |
| CCT | 7828 83% | 6340 103% | 6592 99% | 7228 90% | 6799 96% | 6820 95% |
| Color Space (Percent of AdobeRGB 1998) (%) | 38.2 | 87.8 130% | 32 -16% | 56 47% | 57 49% | 35.5 -7% |
| Color Space (Percent of sRGB) (%) | 60.1 | 100 66% | 51 -15% | 86 43% | 86 43% | 55.6 -7% |
| Média Total (Programa/Configurações) | 82% /
65% | -9% /
-1% | 11% /
23% | 6% /
20% | -5% /
-3% |
* ... menor é melhor
Exibir tempos de resposta
| ↔ Tempo de resposta preto para branco | ||
|---|---|---|
| 24 ms ... ascensão ↗ e queda ↘ combinadas | ↗ 13.2 ms ascensão | 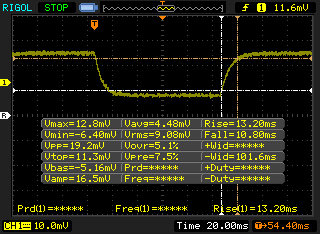 |
| ↘ 10.8 ms queda | ||
| A tela mostra boas taxas de resposta em nossos testes, mas pode ser muito lenta para jogadores competitivos. Em comparação, todos os dispositivos testados variam de 0.1 (mínimo) a 240 (máximo) ms. » 54 % de todos os dispositivos são melhores. Isso significa que o tempo de resposta medido é pior que a média de todos os dispositivos testados (19.8 ms). | ||
| ↔ Tempo de resposta 50% cinza a 80% cinza | ||
| 28.4 ms ... ascensão ↗ e queda ↘ combinadas | ↗ 16.8 ms ascensão | 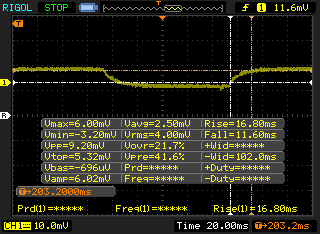 |
| ↘ 11.6 ms queda | ||
| A tela mostra taxas de resposta relativamente lentas em nossos testes e pode ser muito lenta para os jogadores. Em comparação, todos os dispositivos testados variam de 0.165 (mínimo) a 636 (máximo) ms. » 38 % de todos os dispositivos são melhores. Isso significa que o tempo de resposta medido é semelhante à média de todos os dispositivos testados (31 ms). | ||
Cintilação da tela / PWM (modulação por largura de pulso)
| Tela tremeluzindo / PWM não detectado | 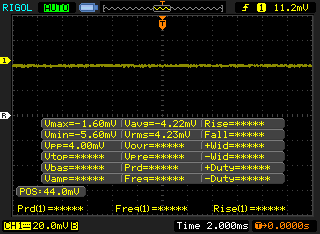 | ||
[pwm_comparison] Em comparação: 52 % de todos os dispositivos testados não usam PWM para escurecer a tela. Se PWM foi detectado, uma média de 7751 (mínimo: 5 - máximo: 343500) Hz foi medida. | |||
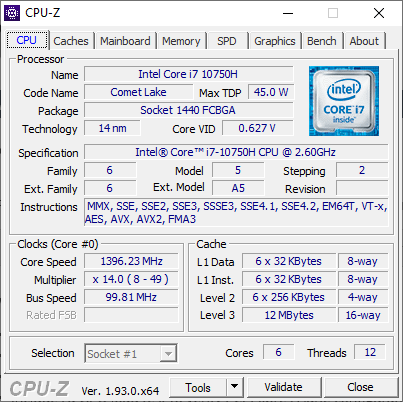
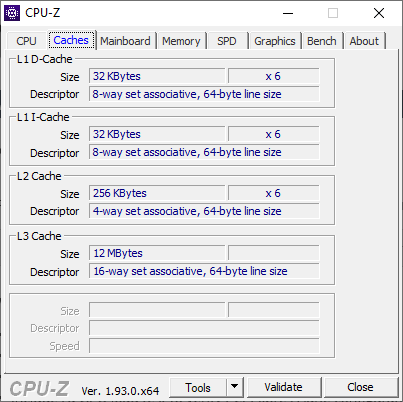
Cinebench R15: CPU Multi 64Bit | CPU Single 64Bit
Blender: v2.79 BMW27 CPU
7-Zip 18.03: 7z b 4 -mmt1 | 7z b 4
Geekbench 5.5: Single-Core | Multi-Core
HWBOT x265 Benchmark v2.2: 4k Preset
LibreOffice : 20 Documents To PDF
R Benchmark 2.5: Overall mean
| Blender / v2.79 BMW27 CPU | |
| Dell XPS 15 9500 Core i5 | |
| Asus VivoBook 15 K571LI-PB71 | |
| Média Intel Core i7-10750H (322 - 587, n=43) | |
| Dell XPS 15 9500 Core i7 4K UHD | |
| HP Pavilion Gaming 15-ec1206ng | |
| Asus ROG Strix Scar 15 G532LWS | |
| Dell G5 15 SE 5505 P89F | |
| 7-Zip 18.03 / 7z b 4 -mmt1 | |
| Asus ROG Strix Scar 15 G532LWS | |
| Dell XPS 15 9500 Core i7 4K UHD | |
| Asus VivoBook 15 K571LI-PB71 | |
| Média Intel Core i7-10750H (4504 - 5470, n=43) | |
| Dell XPS 15 9500 Core i5 | |
| Dell G5 15 SE 5505 P89F | |
| HP Pavilion Gaming 15-ec1206ng | |
| 7-Zip 18.03 / 7z b 4 | |
| Dell G5 15 SE 5505 P89F | |
| Asus ROG Strix Scar 15 G532LWS | |
| HP Pavilion Gaming 15-ec1206ng | |
| Dell XPS 15 9500 Core i7 4K UHD | |
| Média Intel Core i7-10750H (26040 - 37345, n=43) | |
| Asus VivoBook 15 K571LI-PB71 | |
| Dell XPS 15 9500 Core i5 | |
| Geekbench 5.5 / Single-Core | |
| Asus ROG Strix Scar 15 G532LWS | |
| Dell XPS 15 9500 Core i7 4K UHD | |
| Asus VivoBook 15 K571LI-PB71 | |
| Média Intel Core i7-10750H (1114 - 1333, n=43) | |
| Asus ZenBook 15 UX534FTC-A8190T | |
| Dell XPS 15 9500 Core i5 | |
| Dell G5 15 SE 5505 P89F | |
| HP Pavilion Gaming 15-ec1206ng | |
| Geekbench 5.5 / Multi-Core | |
| Asus ROG Strix Scar 15 G532LWS | |
| Dell XPS 15 9500 Core i7 4K UHD | |
| Dell G5 15 SE 5505 P89F | |
| Asus VivoBook 15 K571LI-PB71 | |
| Média Intel Core i7-10750H (4443 - 6674, n=43) | |
| HP Pavilion Gaming 15-ec1206ng | |
| Asus ZenBook 15 UX534FTC-A8190T | |
| Dell XPS 15 9500 Core i5 | |
| HWBOT x265 Benchmark v2.2 / 4k Preset | |
| Asus ROG Strix Scar 15 G532LWS | |
| Dell G5 15 SE 5505 P89F | |
| HP Pavilion Gaming 15-ec1206ng | |
| Dell XPS 15 9500 Core i7 4K UHD | |
| Média Intel Core i7-10750H (5.54 - 11.6, n=43) | |
| Asus VivoBook 15 K571LI-PB71 | |
| Dell XPS 15 9500 Core i5 | |
| LibreOffice / 20 Documents To PDF | |
| HP Pavilion Gaming 15-ec1206ng | |
| Dell G5 15 SE 5505 P89F | |
| Dell XPS 15 9500 Core i5 | |
| Média Intel Core i7-10750H (43.1 - 99.2, n=43) | |
| Dell XPS 15 9500 Core i7 4K UHD | |
| Asus ROG Strix Scar 15 G532LWS | |
| Asus VivoBook 15 K571LI-PB71 | |
| R Benchmark 2.5 / Overall mean | |
| Dell XPS 15 9500 Core i5 | |
| Média Intel Core i7-10750H (0.578 - 0.708, n=42) | |
| HP Pavilion Gaming 15-ec1206ng | |
| Asus VivoBook 15 K571LI-PB71 | |
| Dell XPS 15 9500 Core i7 4K UHD | |
| Dell G5 15 SE 5505 P89F | |
| Asus ROG Strix Scar 15 G532LWS | |
* ... menor é melhor
| PCMark 8 Home Score Accelerated v2 | 4090 pontos | |
| PCMark 8 Work Score Accelerated v2 | 5343 pontos | |
| PCMark 10 Score | 4837 pontos | |
Ajuda | ||
| DPC Latencies / LatencyMon - interrupt to process latency (max), Web, Youtube, Prime95 | |
| Dell XPS 15 9500 Core i7 4K UHD | |
| HP Envy 15-ep0098nr | |
| Dell G5 15 SE 5505 P89F | |
| Dell XPS 15 9500 Core i5 | |
| Asus ROG Strix Scar 15 G532LWS | |
| Asus ROG Strix G15 G512LI | |
| Asus VivoBook 15 K571LI-PB71 | |
| HP Pavilion Gaming 15-ec1206ng | |
| Acer Nitro 5 AN517-52-77DS | |
* ... menor é melhor
| Asus VivoBook 15 K571LI-PB71 Mushkin Helix-L 1TB MKNSSDHL1TB-08 | HP Envy 15-ep0098nr Intel Optane Memory H10 with Solid State Storage 32GB + 512GB HBRPEKNX0202A(L/H) | Acer Aspire 5 A515-54G Kingston RBUSNS8154P3512GJ1 | Asus ZenBook 15 UX534FTC-A8190T Samsung SSD PM981 MZVLB1T0HALR | Lenovo Ideapad S540-15IML Samsung SSD PM981a MZVLB512HBJQ | Dell Inspiron 15 5000 5585 WDC PC SN520 SDAPNUW-512G | |
|---|---|---|---|---|---|---|
| AS SSD | -5% | 31% | 63% | 119% | -0% | |
| Seq Read (MB/s) | 1323 | 1005 -24% | 1405 6% | 2643 100% | 2642 100% | 398.9 -70% |
| Seq Write (MB/s) | 1572 | 436.8 -72% | 953 -39% | 1533 -2% | 2433 55% | 884 -44% |
| 4K Read (MB/s) | 38.09 | 51.5 35% | 54 42% | 49.12 29% | 58 52% | 34.54 -9% |
| 4K Write (MB/s) | 127.4 | 88 -31% | 93 -27% | 134.7 6% | 145.3 14% | 82.1 -36% |
| 4K-64 Read (MB/s) | 812 | 517 -36% | 959 18% | 1028 27% | 1431 76% | 647 -20% |
| 4K-64 Write (MB/s) | 276 | 839 204% | 772 180% | 1353 390% | 1753 535% | 985 257% |
| Access Time Read * (ms) | 0.035 | 0.088 -151% | 0.051 -46% | 0.033 6% | 0.072 -106% | 0.072 -106% |
| Access Time Write * (ms) | 0.411 | 0.151 63% | 0.044 89% | 0.028 93% | 0.027 93% | 0.047 89% |
| Score Read (Points) | 983 | 669 -32% | 1153 17% | 1342 37% | 1753 78% | 721 -27% |
| Score Write (Points) | 561 | 970 73% | 961 71% | 1641 193% | 2142 282% | 1155 106% |
| Score Total (Points) | 2066 | 1972 -5% | 2695 30% | 3622 75% | 4790 132% | 2279 10% |
| Copy ISO MB/s (MB/s) | 2846 | 1173 -59% | 2226 -22% | 862 -70% | ||
| Copy Program MB/s (MB/s) | 728 | 769 6% | 506 -30% | 457 -37% | ||
| Copy Game MB/s (MB/s) | 1610 | 1045 -35% | 1230 -24% | 902 -44% | ||
| CrystalDiskMark 5.2 / 6 | -5% | -27% | 15% | 11% | -43% | |
| Write 4K (MB/s) | 169.7 | 100.2 -41% | 100.4 -41% | 138.1 -19% | 170.7 1% | 105.9 -38% |
| Read 4K (MB/s) | 53.2 | 112.8 112% | 47.16 -11% | 45.89 -14% | 49.51 -7% | 36.56 -31% |
| Write Seq (MB/s) | 1679 | 537 -68% | 993 -41% | 2147 28% | 1156 -31% | 1165 -31% |
| Read Seq (MB/s) | 1698 | 1270 -25% | 1176 -31% | 2188 29% | 1136 -33% | 423.2 -75% |
| Write 4K Q32T1 (MB/s) | 450.7 | 480.6 7% | 354.7 -21% | 427.8 -5% | 420.5 -7% | 332.1 -26% |
| Read 4K Q32T1 (MB/s) | 577 | 364.9 -37% | 473 -18% | 404 -30% | 527 -9% | 229.3 -60% |
| Write Seq Q32T1 (MB/s) | 1657 | 1224 -26% | 1034 -38% | 2396 45% | 2984 80% | 1460 -12% |
| Read Seq Q32T1 (MB/s) | 1851 | 2635 42% | 1635 -12% | 3454 87% | 3550 92% | 472.5 -74% |
| Média Total (Programa/Configurações) | -5% /
-5% | 2% /
7% | 39% /
45% | 65% /
74% | -22% /
-16% |
* ... menor é melhor

Disk Throttling: DiskSpd Read Loop, Queue Depth 8
| 3DMark 11 Performance | 12523 pontos | |
| 3DMark Cloud Gate Standard Score | 29531 pontos | |
| 3DMark Fire Strike Score | 8903 pontos | |
| 3DMark Time Spy Score | 3801 pontos | |
Ajuda | ||
| Final Fantasy XV Benchmark | |
| 1280x720 Lite Quality | |
| MSI RTX 2060 Gaming Z 6G | |
| HP Envy 15-ep0098nr | |
| Asus VivoBook 15 K571LI-PB71 | |
| MSI Alpha 15 A3DDK-034 | |
| 1920x1080 Standard Quality | |
| MSI RTX 2060 Gaming Z 6G | |
| HP Envy 15-ep0098nr | |
| MSI Alpha 15 A3DDK-034 | |
| Asus VivoBook 15 K571LI-PB71 | |
| 1920x1080 High Quality | |
| MSI RTX 2060 Gaming Z 6G | |
| HP Envy 15-ep0098nr | |
| Asus VivoBook 15 K571LI-PB71 | |
| MSI Alpha 15 A3DDK-034 | |
| baixo | média | alto | ultra | |
|---|---|---|---|---|
| The Witcher 3 (2015) | 199.3 | 126.6 | 74.5 | 38.8 |
| Dota 2 Reborn (2015) | 138 | 124 | 115 | 109 |
| Final Fantasy XV Benchmark (2018) | 104 | 54.9 | 39.3 | |
| X-Plane 11.11 (2018) | 95.6 | 80.5 | 71 |
| Asus VivoBook 15 K571LI-PB71 GeForce GTX 1650 Ti Mobile, i7-10750H, Mushkin Helix-L 1TB MKNSSDHL1TB-08 | HP Envy 15-ep0098nr GeForce RTX 2060 Max-Q, i7-10750H, Intel Optane Memory H10 with Solid State Storage 32GB + 512GB HBRPEKNX0202A(L/H) | Acer Aspire 5 A515-54G GeForce MX250, i5-10210U, Kingston RBUSNS8154P3512GJ1 | Asus ZenBook 15 UX534FTC-A8190T GeForce GTX 1650 Max-Q, i7-10510U, Samsung SSD PM981 MZVLB1T0HALR | Lenovo Ideapad S540-15IML GeForce MX250, i5-10210U, Samsung SSD PM981a MZVLB512HBJQ | Dell Inspiron 15 5000 5585 Vega 10, R7 3700U, WDC PC SN520 SDAPNUW-512G | |
|---|---|---|---|---|---|---|
| Noise | -8% | 7% | 9% | 1% | 11% | |
| desligado / ambiente * (dB) | 25.7 | 26.4 -3% | 29.8 -16% | 30.3 -18% | 30 -17% | 28.3 -10% |
| Idle Minimum * (dB) | 31.9 | 32.2 -1% | 29.8 7% | 30.3 5% | 30 6% | 28.3 11% |
| Idle Average * (dB) | 31.9 | 32.2 -1% | 29.8 7% | 30.3 5% | 32 -0% | 28.3 11% |
| Idle Maximum * (dB) | 31.9 | 32.2 -1% | 29.8 7% | 30.9 3% | 37 -16% | 28.3 11% |
| Load Average * (dB) | 44.2 | 48.3 -9% | 37.3 16% | 31.3 29% | 41 7% | 31.4 29% |
| Witcher 3 ultra * (dB) | 43.9 | 53.7 -22% | 38.1 13% | 39 11% | 41.4 6% | |
| Load Maximum * (dB) | 50.7 | 58.8 -16% | 40.1 21% | 38.2 25% | 42 17% | 41.4 18% |
* ... menor é melhor
Barulho
| Ocioso |
| 31.9 / 31.9 / 31.9 dB |
| Carga |
| 44.2 / 50.7 dB |
 | ||
30 dB silencioso 40 dB(A) audível 50 dB(A) ruidosamente alto |
||
min: | ||
(-) A temperatura máxima no lado superior é 53 °C / 127 F, em comparação com a média de 36.8 °C / 98 F , variando de 21 a 71 °C para a classe Multimedia.
(-) A parte inferior aquece até um máximo de 72 °C / 162 F, em comparação com a média de 39.1 °C / 102 F
(+) Em uso inativo, a temperatura média para o lado superior é 28.9 °C / 84 F, em comparação com a média do dispositivo de 31.3 °C / ### class_avg_f### F.
(±) Jogando The Witcher 3, a temperatura média para o lado superior é 34.7 °C / 94 F, em comparação com a média do dispositivo de 31.3 °C / ## #class_avg_f### F.
(+) Os apoios para as mãos e o touchpad são mais frios que a temperatura da pele, com um máximo de 30 °C / 86 F e, portanto, são frios ao toque.
(±) A temperatura média da área do apoio para as mãos de dispositivos semelhantes foi 28.7 °C / 83.7 F (-1.3 °C / -2.3 F).
Asus VivoBook 15 K571LI-PB71 análise de áudio
(±) | o volume do alto-falante é médio, mas bom (###valor### dB)
Graves 100 - 315Hz
(-) | quase nenhum baixo - em média 20.1% menor que a mediana
(±) | a linearidade dos graves é média (14.6% delta para a frequência anterior)
Médios 400 - 2.000 Hz
(±) | médios mais altos - em média 5% maior que a mediana
(+) | médios são lineares (3.9% delta para frequência anterior)
Altos 2 - 16 kHz
(+) | agudos equilibrados - apenas 1.1% longe da mediana
(+) | os máximos são lineares (3.4% delta da frequência anterior)
Geral 100 - 16.000 Hz
(±) | a linearidade do som geral é média (17.8% diferença em relação à mediana)
Comparado com a mesma classe
» 52% de todos os dispositivos testados nesta classe foram melhores, 7% semelhantes, 41% piores
» O melhor teve um delta de 5%, a média foi 17%, o pior foi 45%
Comparado com todos os dispositivos testados
» 36% de todos os dispositivos testados foram melhores, 8% semelhantes, 56% piores
» O melhor teve um delta de 4%, a média foi 23%, o pior foi 134%
Apple MacBook 12 (Early 2016) 1.1 GHz análise de áudio
(+) | os alto-falantes podem tocar relativamente alto (###valor### dB)
Graves 100 - 315Hz
(±) | graves reduzidos - em média 11.3% menor que a mediana
(±) | a linearidade dos graves é média (14.2% delta para a frequência anterior)
Médios 400 - 2.000 Hz
(+) | médios equilibrados - apenas 2.4% longe da mediana
(+) | médios são lineares (5.5% delta para frequência anterior)
Altos 2 - 16 kHz
(+) | agudos equilibrados - apenas 2% longe da mediana
(+) | os máximos são lineares (4.5% delta da frequência anterior)
Geral 100 - 16.000 Hz
(+) | o som geral é linear (10.2% diferença em relação à mediana)
Comparado com a mesma classe
» 7% de todos os dispositivos testados nesta classe foram melhores, 2% semelhantes, 90% piores
» O melhor teve um delta de 5%, a média foi 18%, o pior foi 53%
Comparado com todos os dispositivos testados
» 5% de todos os dispositivos testados foram melhores, 1% semelhantes, 94% piores
» O melhor teve um delta de 4%, a média foi 23%, o pior foi 134%
| desligado | |
| Ocioso | |
| Carga |
|
Key:
min: | |
| Asus VivoBook 15 K571LI-PB71 i7-10750H, GeForce GTX 1650 Ti Mobile, Mushkin Helix-L 1TB MKNSSDHL1TB-08, IPS, 1920x1080, 15.6" | HP Envy 15-ep0098nr i7-10750H, GeForce RTX 2060 Max-Q, Intel Optane Memory H10 with Solid State Storage 32GB + 512GB HBRPEKNX0202A(L/H), AMOLED, 3840x2160, 15.6" | Acer Aspire 5 A515-54G i5-10210U, GeForce MX250, Kingston RBUSNS8154P3512GJ1, IPS, 1920x1080, 15.6" | Asus ZenBook 15 UX534FTC-A8190T i7-10510U, GeForce GTX 1650 Max-Q, Samsung SSD PM981 MZVLB1T0HALR, IPS, 1920x1080, 15.6" | Lenovo Ideapad S540-15IML i5-10210U, GeForce MX250, Samsung SSD PM981a MZVLB512HBJQ, IPS, 1920x1080, 15.6" | Dell Inspiron 15 5000 5585 R7 3700U, Vega 10, WDC PC SN520 SDAPNUW-512G, IPS, 1920x1080, 15.6" | |
|---|---|---|---|---|---|---|
| Power Consumption | -23% | 52% | 40% | 42% | 55% | |
| Idle Minimum * (Watt) | 6.4 | 9.2 -44% | 3.4 47% | 2.8 56% | 5 22% | 4.2 34% |
| Idle Average * (Watt) | 10.6 | 14.5 -37% | 6.4 40% | 7.7 27% | 7 34% | 6.8 36% |
| Idle Maximum * (Watt) | 18.4 | 18 2% | 9.2 50% | 9.4 49% | 10 46% | 7 62% |
| Load Average * (Watt) | 103.7 | 110.9 -7% | 38 63% | 57 45% | 64 38% | 36.5 65% |
| Witcher 3 ultra * (Watt) | 99.1 | 125.5 -27% | 62 37% | 44 56% | 37.9 62% | |
| Load Maximum * (Watt) | 154.9 | 194.6 -26% | 59 62% | 116 25% | 67 57% | 44 72% |
* ... menor é melhor
| Asus VivoBook 15 K571LI-PB71 i7-10750H, GeForce GTX 1650 Ti Mobile, 42 Wh | HP Envy 15-ep0098nr i7-10750H, GeForce RTX 2060 Max-Q, 83 Wh | Acer Aspire 5 A515-54G i5-10210U, GeForce MX250, 48 Wh | Asus ZenBook 15 UX534FTC-A8190T i7-10510U, GeForce GTX 1650 Max-Q, 71 Wh | Lenovo Ideapad S540-15IML i5-10210U, GeForce MX250, 70 Wh | Dell Inspiron 15 5000 5585 R7 3700U, Vega 10, 42 Wh | |
|---|---|---|---|---|---|---|
| Duração da bateria | 62% | 141% | 190% | 160% | 62% | |
| Reader / Idle (h) | 10.2 | 15 47% | 27.2 167% | 30.2 196% | 14.3 40% | |
| WiFi v1.3 (h) | 3.7 | 6 62% | 8.9 141% | 12.4 235% | 12.1 227% | 7 89% |
| Load (h) | 0.9 | 1.6 78% | 2.4 167% | 1.4 56% | 1.4 56% |
Pro
Contra

O VivoBook 15 K571 é a melhor opção para estudantes que desejam um portátil acessível tanto para jogos quanto para trabalhos de aula e que também seja relativamente portátil. É poderoso para o tamanho e peso e como uma solução intermediária entre um Ultrabook tradicional e um portátil para jogos de nível de entrada. Muito poucos portáteis nesta faixa de preço também vêm com uma opção de painel de 120 Hz.
Se você não precisa de uma CPU Core da série H ou GPU GTX 1650 Ti, então um ZenBook seria a melhor opção. A duração da bateria, o ruído do ventilador e as temperaturas são apenas médias, no máximo, no VivoBook 15 devido aos exigentes processadores.
Recomendamos escolher a tela com cuidado. A Asus oferece três opções: 1080p120 45% NTSC, 1080p60 45% NTSC, ou 1080p60 72% NTSC. A opção 1080p120 45% NTSC será a melhor para jogos, mesmo depois de considerar os tempos médios de resposta em preto e branco. Para trabalhos de edição e de gráficos, a opção 1080p60 72% NTSC será melhor por suas cores mais profundas.
O Asus VivoBook 15 K571 não se destaca particularmente em um aspecto singular, mas consegue chegar a ser uma máquina multimídia e máquina de jogos bastante boa, por seu preço barato.
Asus VivoBook 15 K571LI-PB71
- 09/13/2020 v7 (old)
Allen Ngo
Price comparison
