Dell Latitude 15 9520 2 em 1 vs. Latitude 9510 2 em 1: Mais novo nem sempre é melhor
O Latitude 9520 2 em 1 troca a CPU Intel do 10º gênero no Latitude 9510 2 em 1 por opções mais novas do 11º gênero, mantendo o chassi idêntico. Assim, recomendamos verificar nosso revisão existente no site Latitude 9510 2 em 1 para saber mais sobre nossos pensamentos sobre o chassi, teclado e outras características físicas do sistema. Esta revisão se concentrará nas diferenças entre os dois modelos, incluindo o que os usuários podem esperar em termos de desempenho.
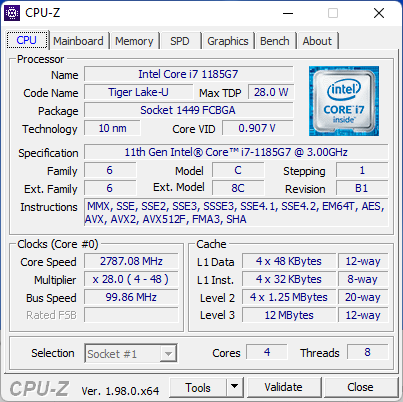
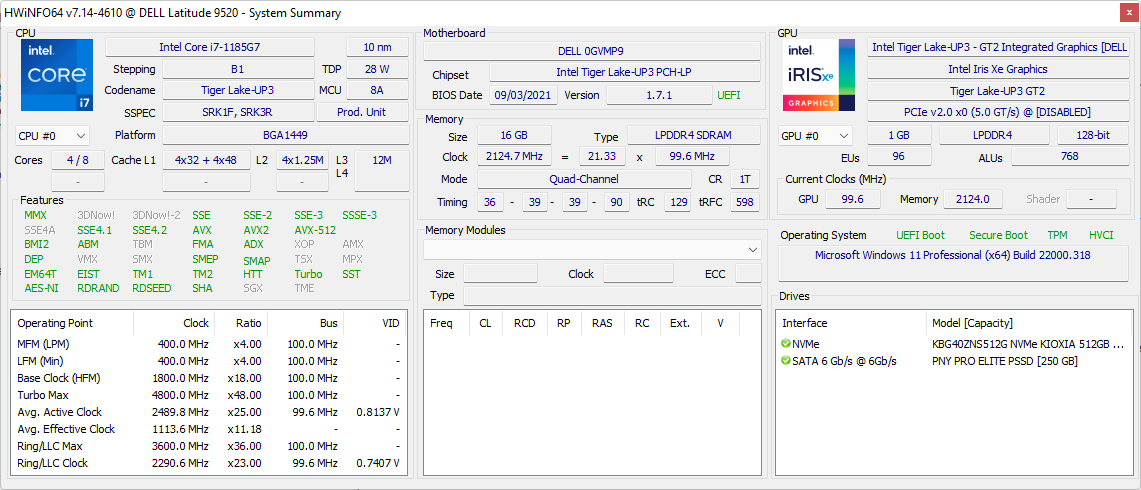
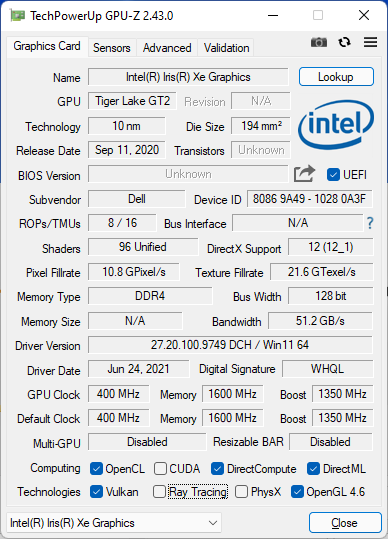
Nossa unidade de teste é uma configuração superior com o Core i7-1185G7 vPro habilitado, GPU Iris Xe 96 EUs, 16 GB de RAM e 512 GB NVMe SSD por aproximadamente US$2800. SKUs menores com a CPU Core i5-1145G7 e metade da capacidade de armazenamento estão disponíveis por cerca de US$2300. Note que todas as SKUs 2-em-1 vêm com o mesmo painel FHD de 15 polegadas com sensor de proximidade e obturador eletrônico. Alternativamente, os usuários também podem adquirir a clamshell Latitude 9520 se o fator de forma 2-em-1 for indesejável.
O Latitude 9520 2 em 1 concorre com outros produtos de alta qualidade como o MSI Summit E13 Flip, Microsoft Surface Book, HP EliteBook x360 1040 G7, ou o Lenovo ThinkPad x13 Yoga.
Mais críticas da Dell:
Potential Competitors in Comparison
Avaliação | Data | Modelo | Peso | Altura | Size | Resolução | Preço |
|---|---|---|---|---|---|---|---|
| 89.2 % v7 (old) | 11/2021 | Dell Latitude 15 9520 2-in-1 i7-1185G7, Iris Xe G7 96EUs | 1.7 kg | 13.99 mm | 15.00" | 1920x1080 | |
| 88.6 % v7 (old) | 07/2020 | Dell Latitude 9510 2-in-1 i7-10810U, UHD Graphics 620 | 1.7 kg | 13.99 mm | 15.00" | 1920x1080 | |
| 86.1 % v7 (old) | 08/2021 | HP EliteBook 850 G8 3C7Z8EA i7-1165G7, Iris Xe G7 96EUs | 1.8 kg | 19 mm | 15.60" | 1920x1080 | |
| 85.1 % v7 (old) | 07/2021 | Lenovo ThinkPad L15 G2 AMD R5 5600U, Vega 7 | 1.9 kg | 21 mm | 15.60" | 1920x1080 | |
| 81.2 % v7 (old) | 05/2021 | MSI Summit B15 A11M i7-1165G7, Iris Xe G7 96EUs | 1.5 kg | 16.9 mm | 15.60" | 1920x1080 | |
| 84.9 % v7 (old) | 04/2021 | Microsoft Surface Laptop 4 15 AMD TFF_00028 R7 4980U, Vega 8 | 1.6 kg | 14.7 mm | 15.00" | 2496x1664 |
Caso
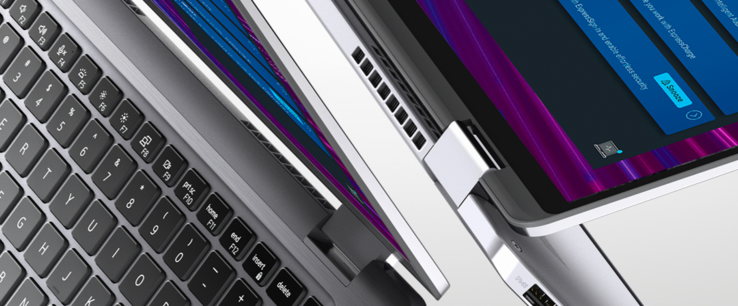
Embora o chassi seja idêntico ao modelo do ano passado, as dobradiças em nossa unidade de teste Latitude 9520 2 em 1 se sentiriam mais fracas em ângulos entre 60 e 90 graus. O ideal seria que a rigidez das dobradiças fosse uniforme em todos os ângulos. Recomendamos verificar as dobradiças após a compra para detectar qualquer anormalidade.

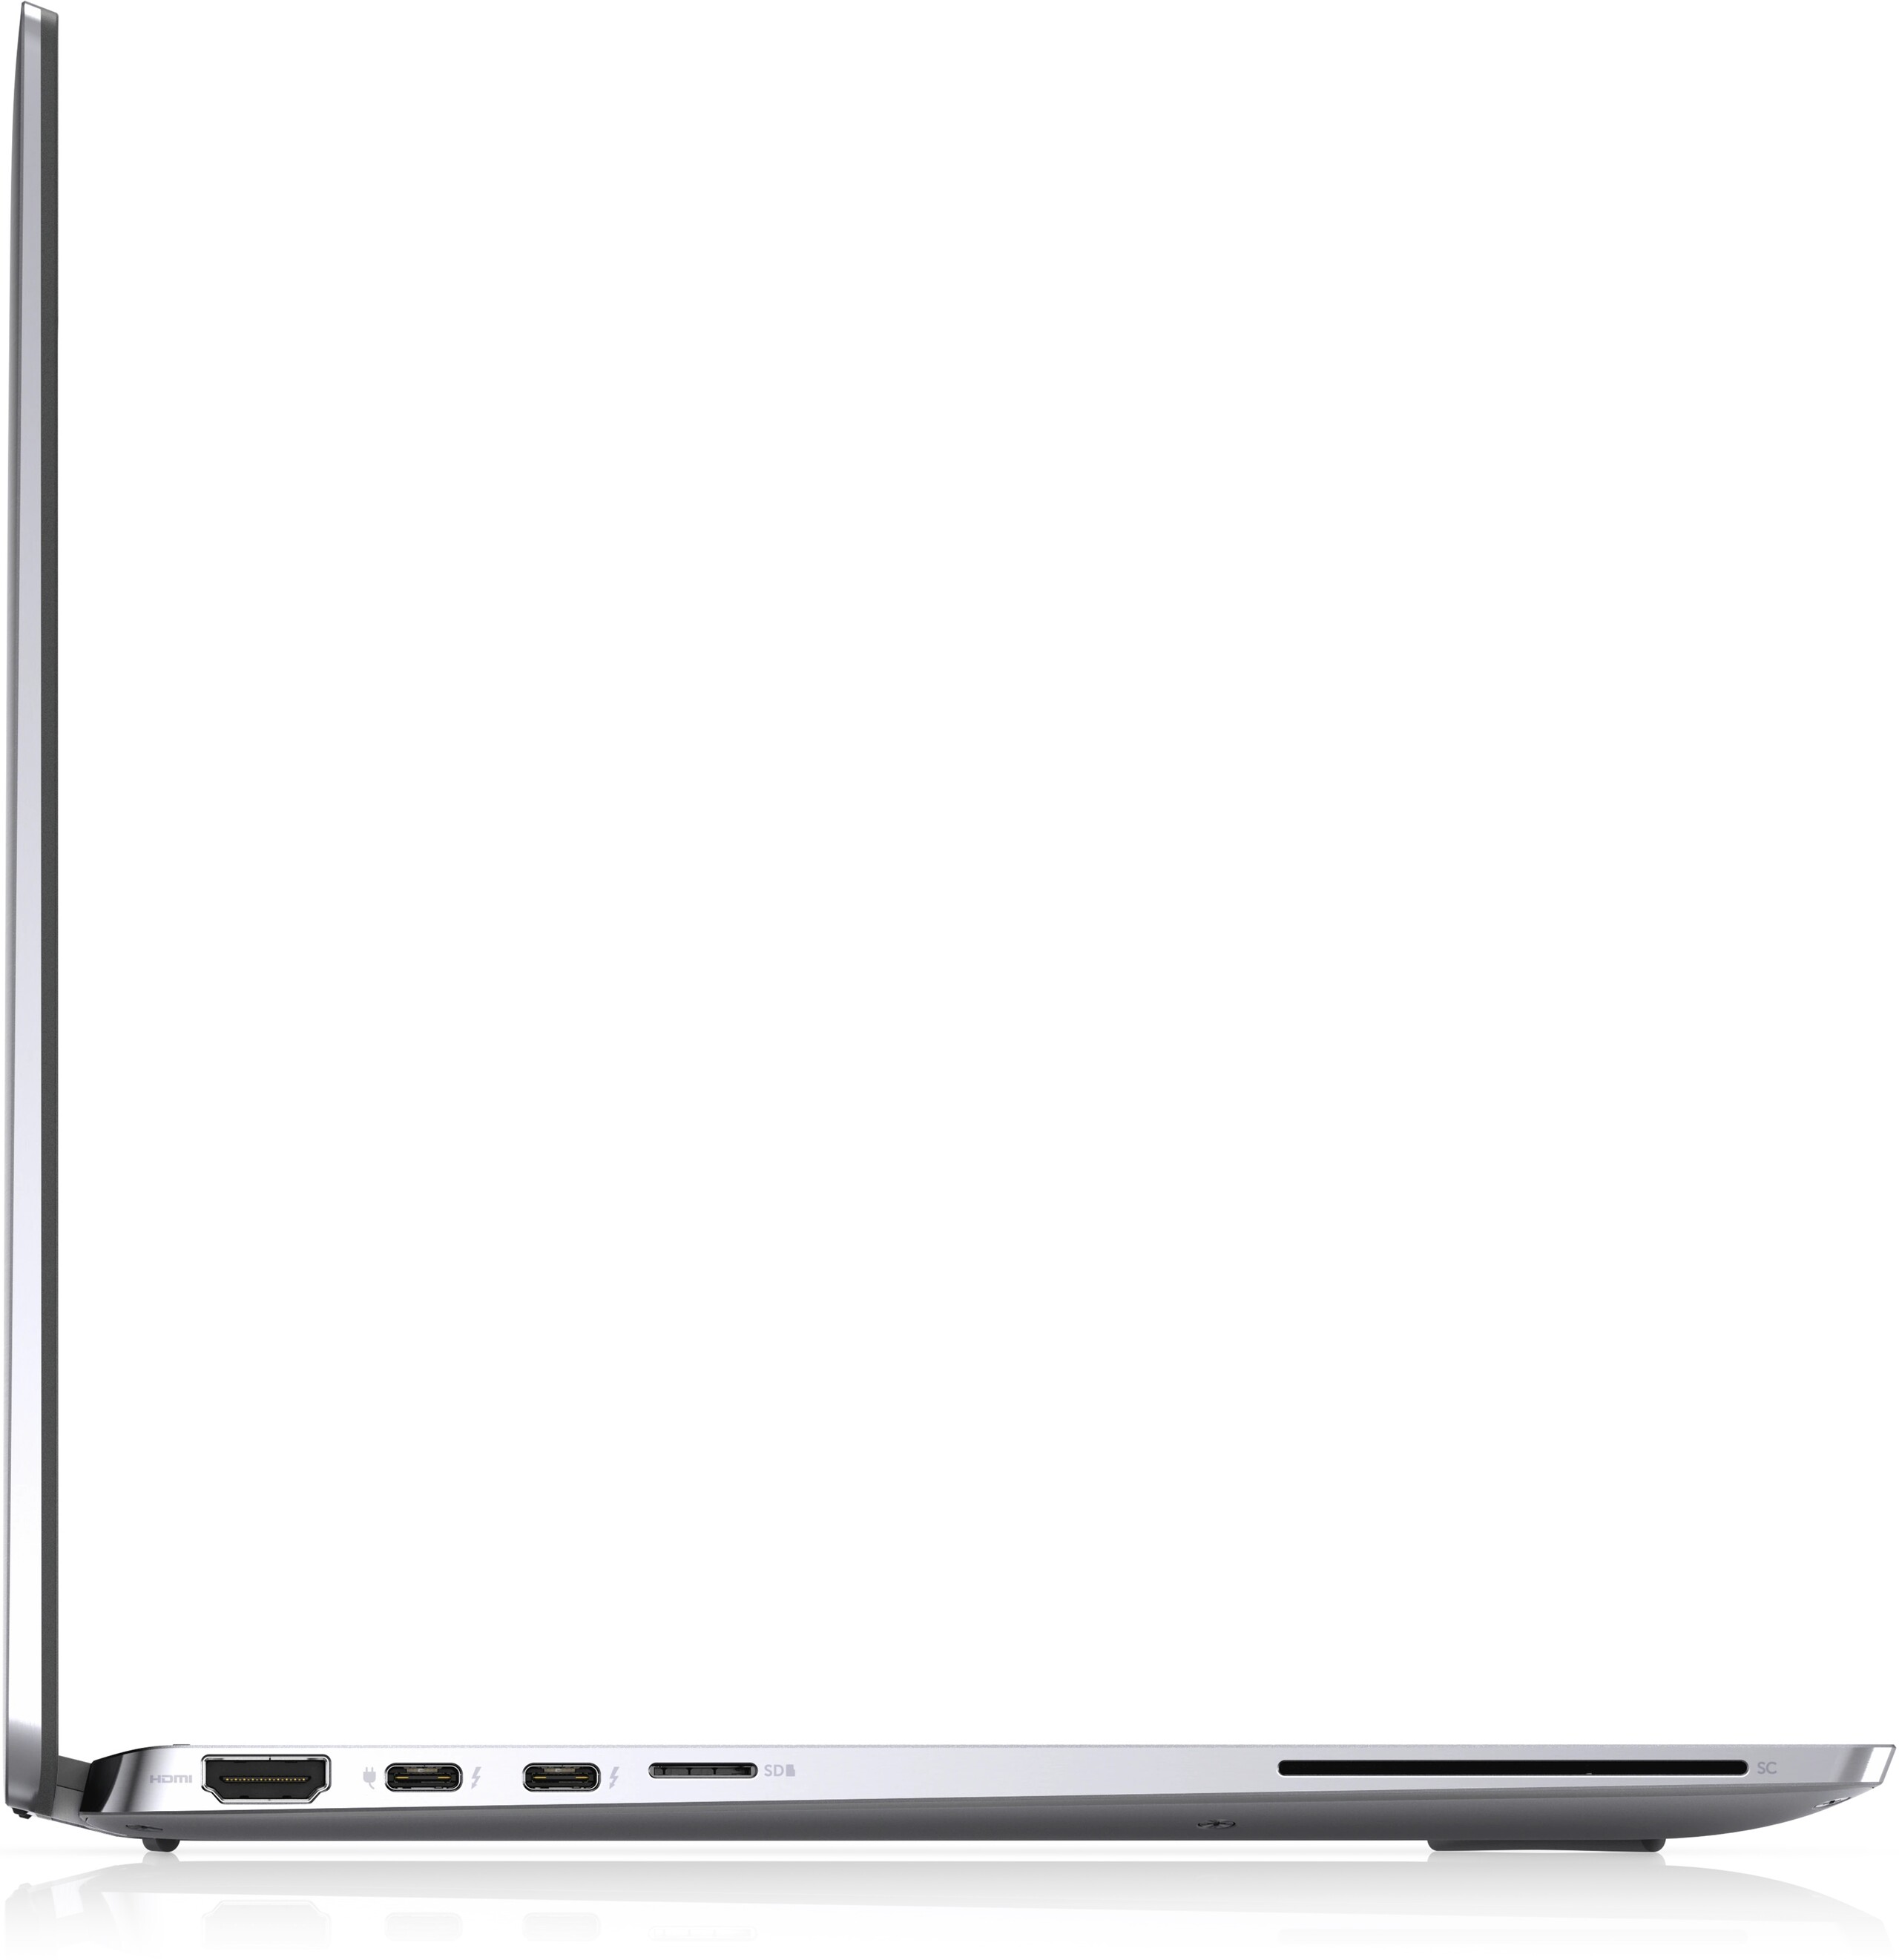
Conectividade
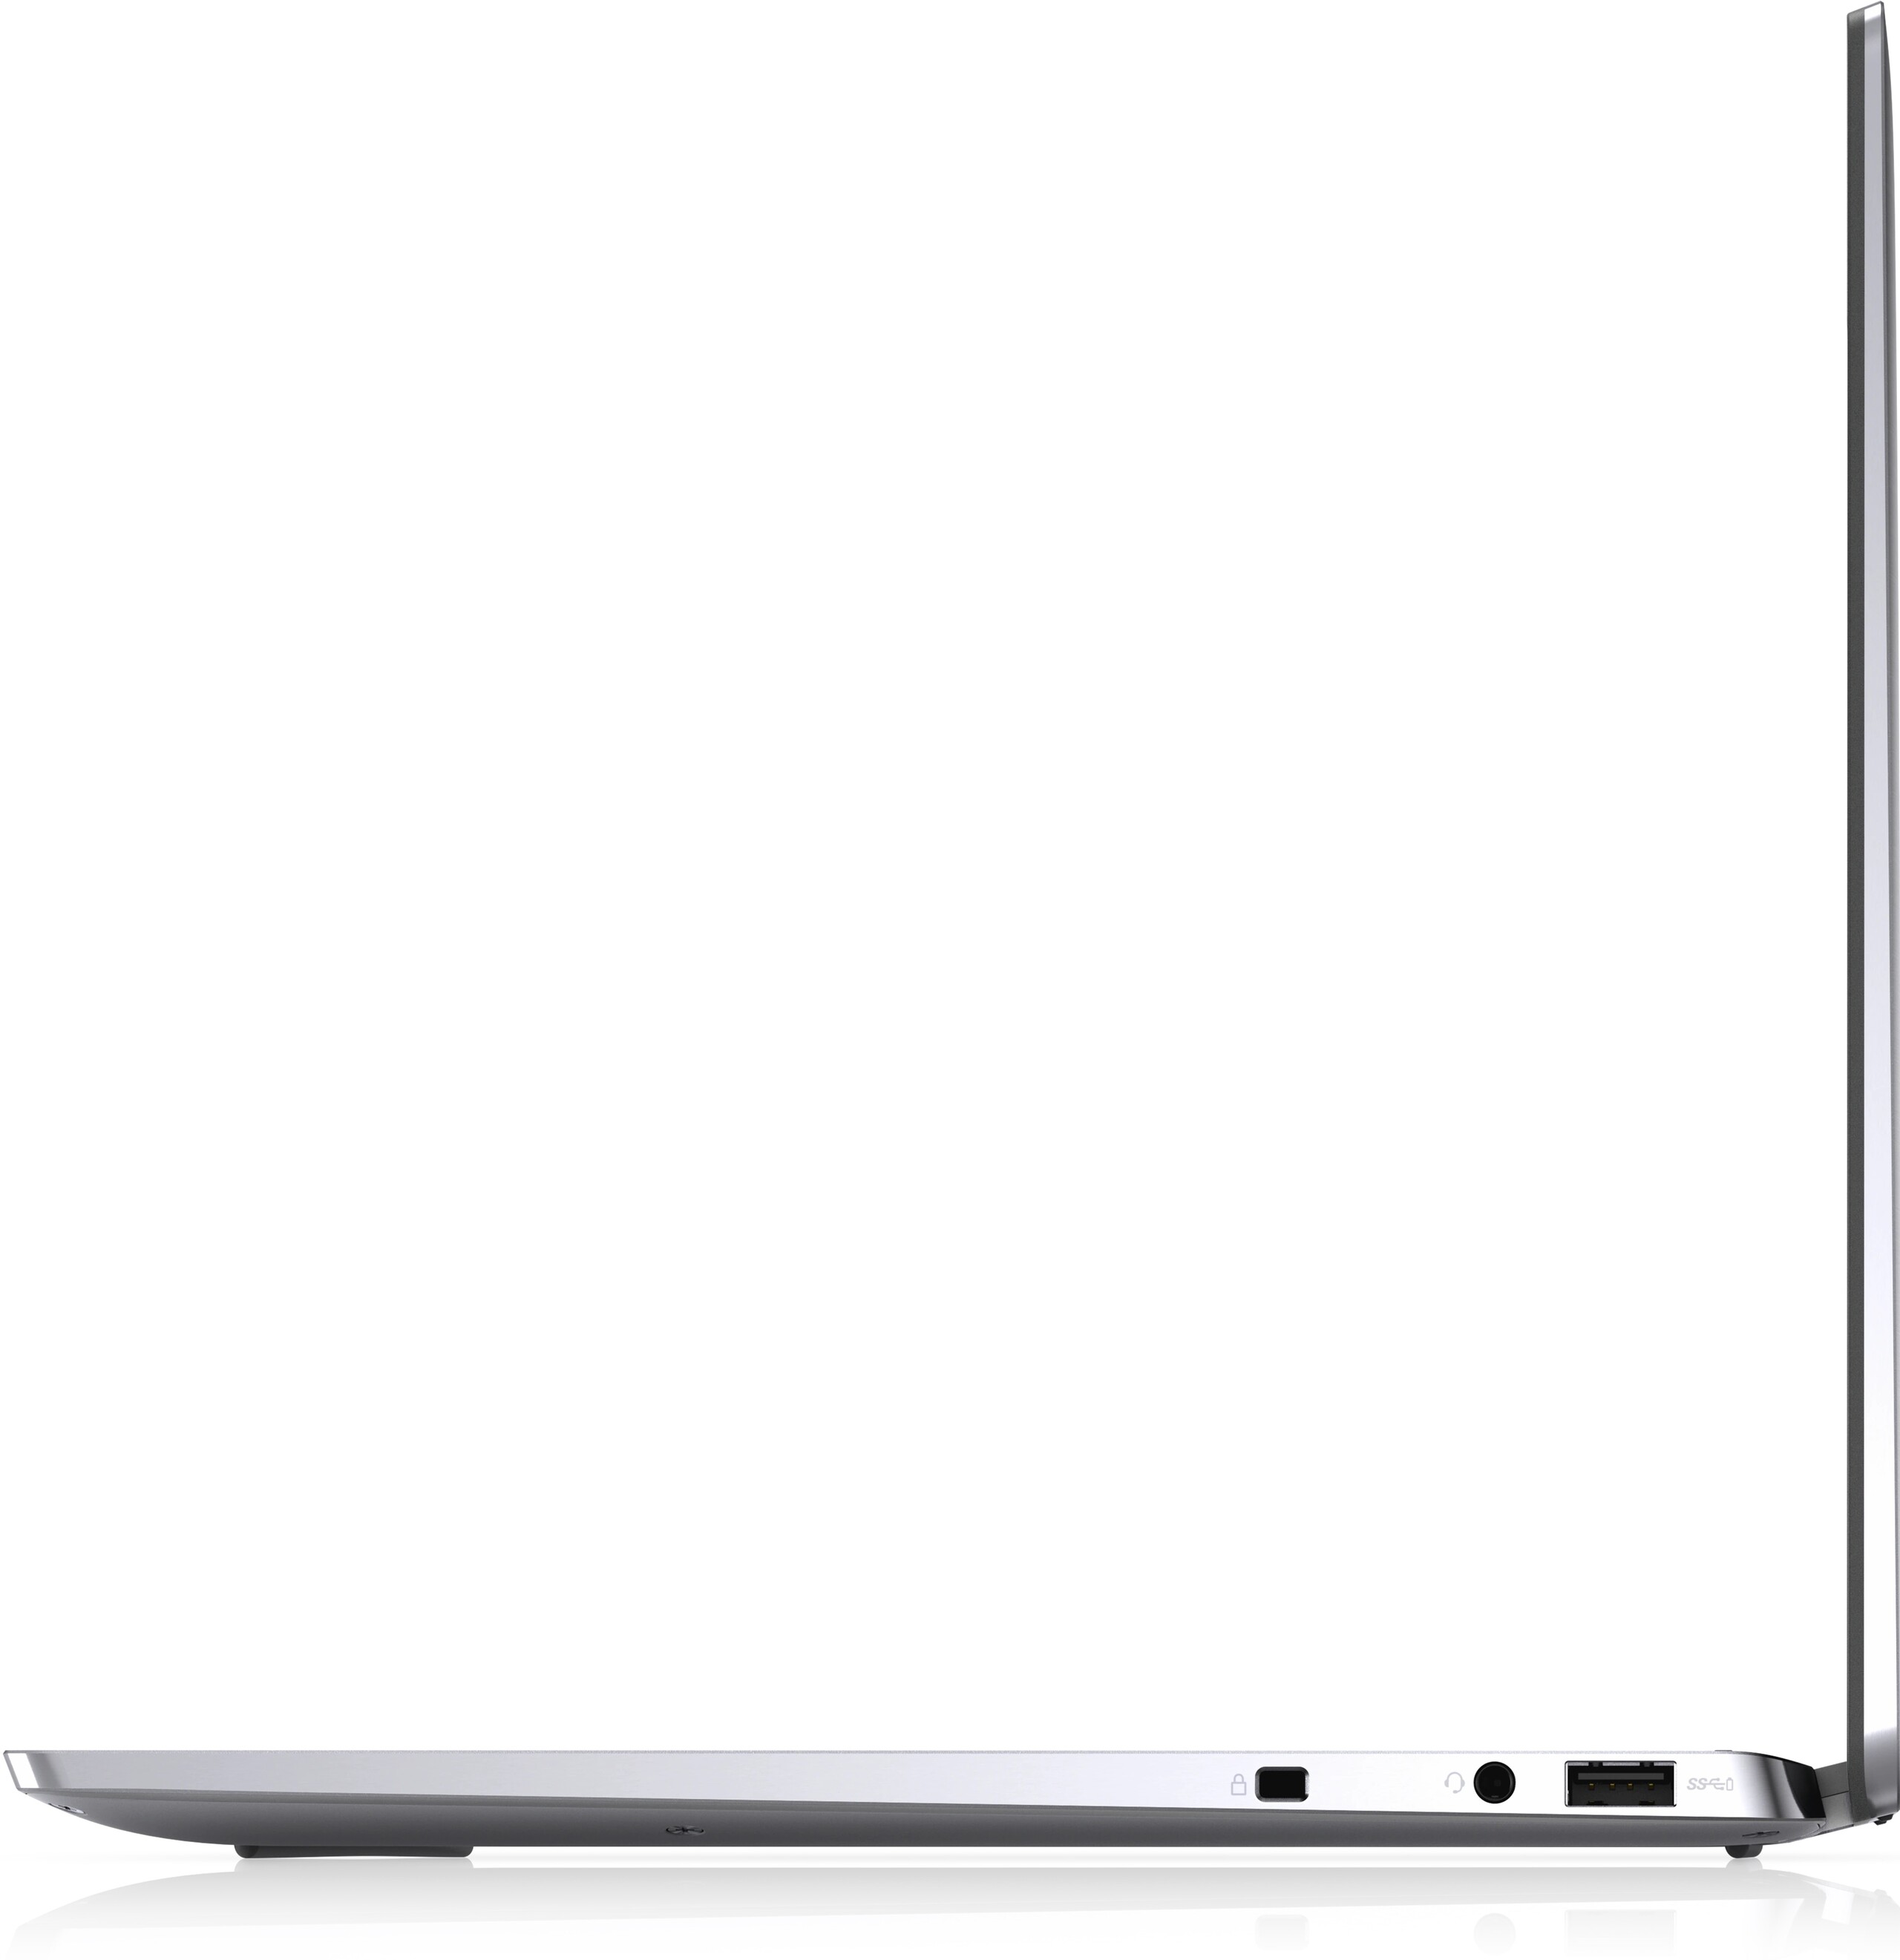
As portas Thunderbolt 3 no site Latitude 9510 foram atualizadas para Thunderbolt 4 em nosso Latitude 9520. Para a maioria dos usuários, no entanto, a atualização não terá essencialmente significado, a menos que você planeje usar GPUs externas. Todas as outras portas são de outra forma idênticas entre os dois modelos.
Leitor de cartões SD
| SD Card Reader | |
| average JPG Copy Test (av. of 3 runs) | |
| Dell Latitude 9510 2-in-1 (Toshiba Exceria Pro M501 64 GB UHS-II) | |
| Dell Latitude 15 9520 2-in-1 (AV Pro V60) | |
| MSI Summit B15 A11M (AV PRO microSD 128 GB V60) | |
| Lenovo ThinkPad L15 G2 AMD (AV Pro V60) | |
| maximum AS SSD Seq Read Test (1GB) | |
| MSI Summit B15 A11M (AV PRO microSD 128 GB V60) | |
| Dell Latitude 9510 2-in-1 (Toshiba Exceria Pro M501 64 GB UHS-II) | |
| Dell Latitude 15 9520 2-in-1 (AV Pro V60) | |
| Lenovo ThinkPad L15 G2 AMD (AV Pro V60) | |
Comunicação
Webcam


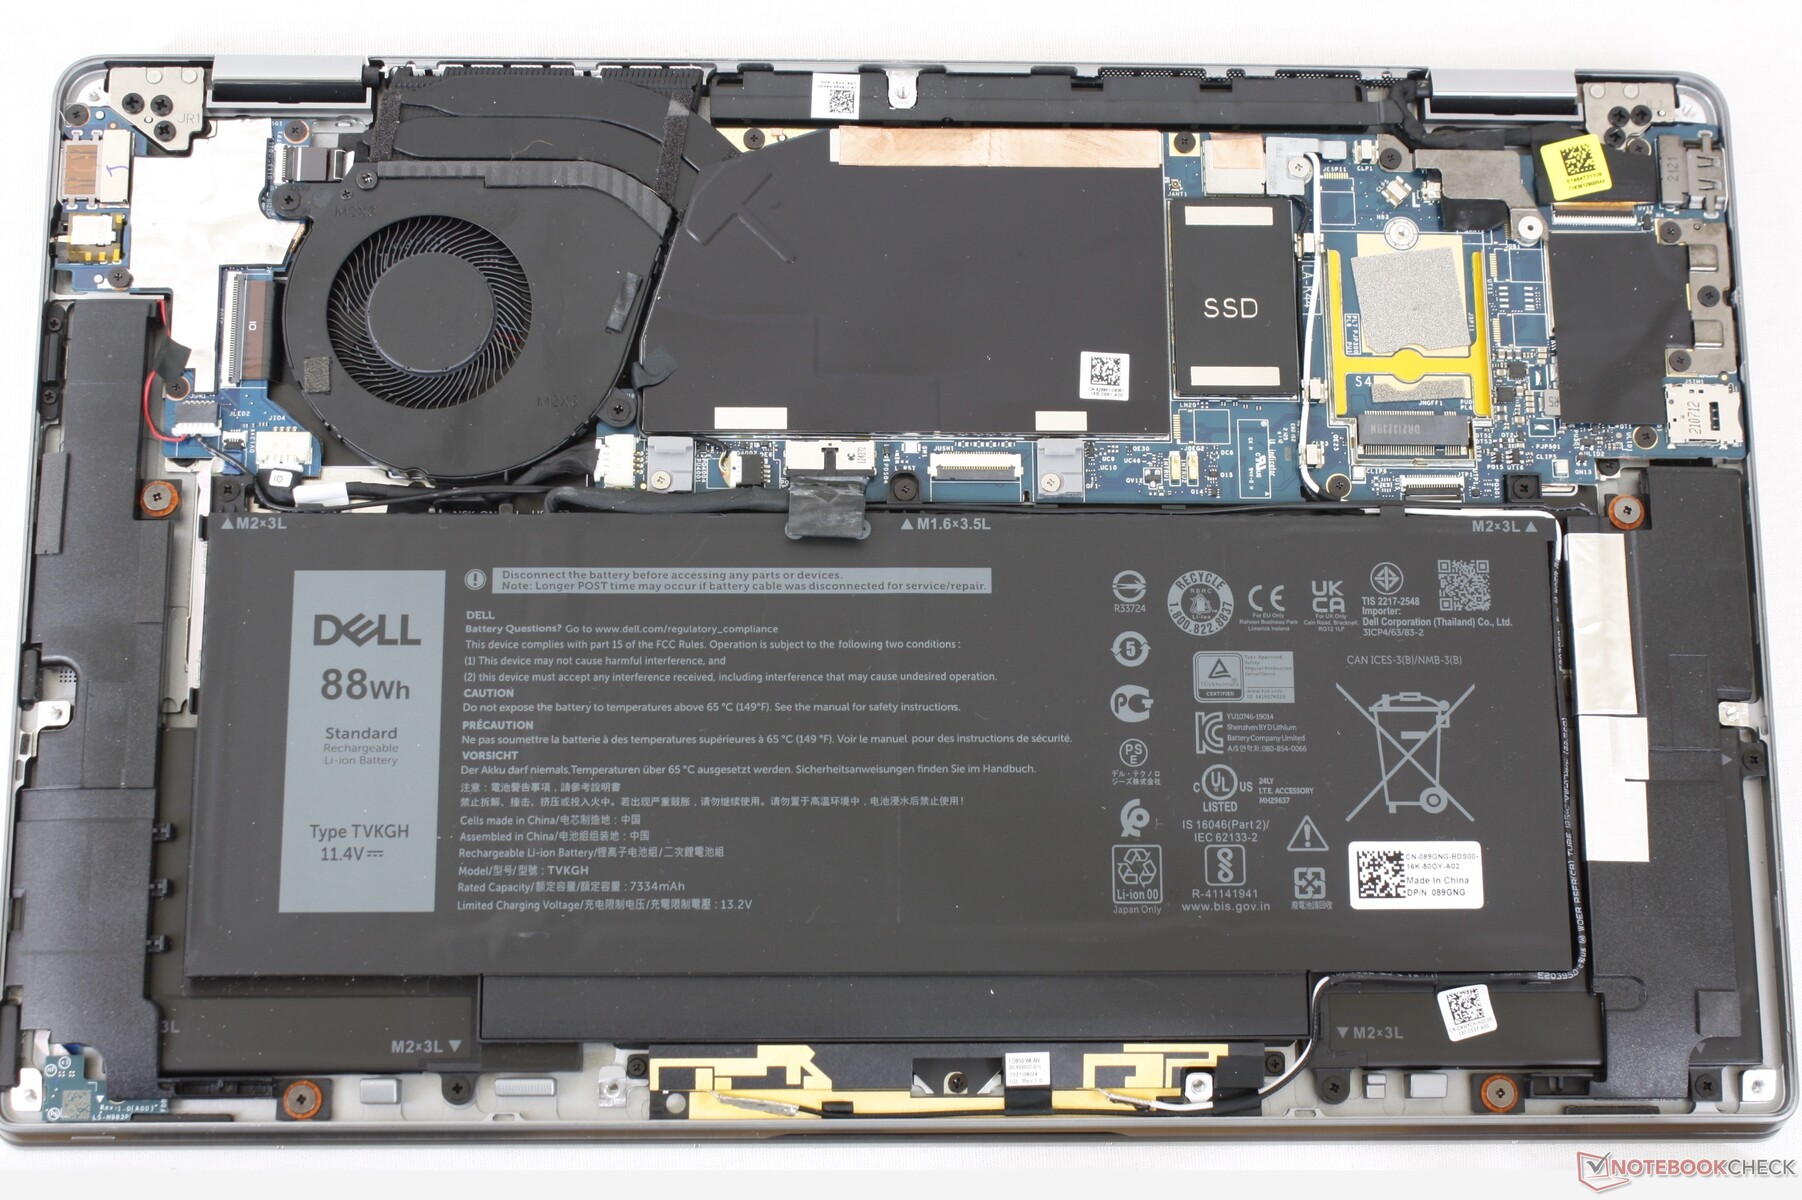
Manutenção
Mostrar
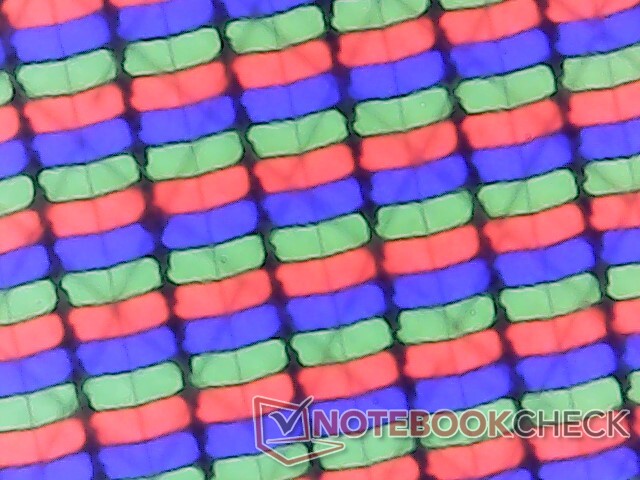
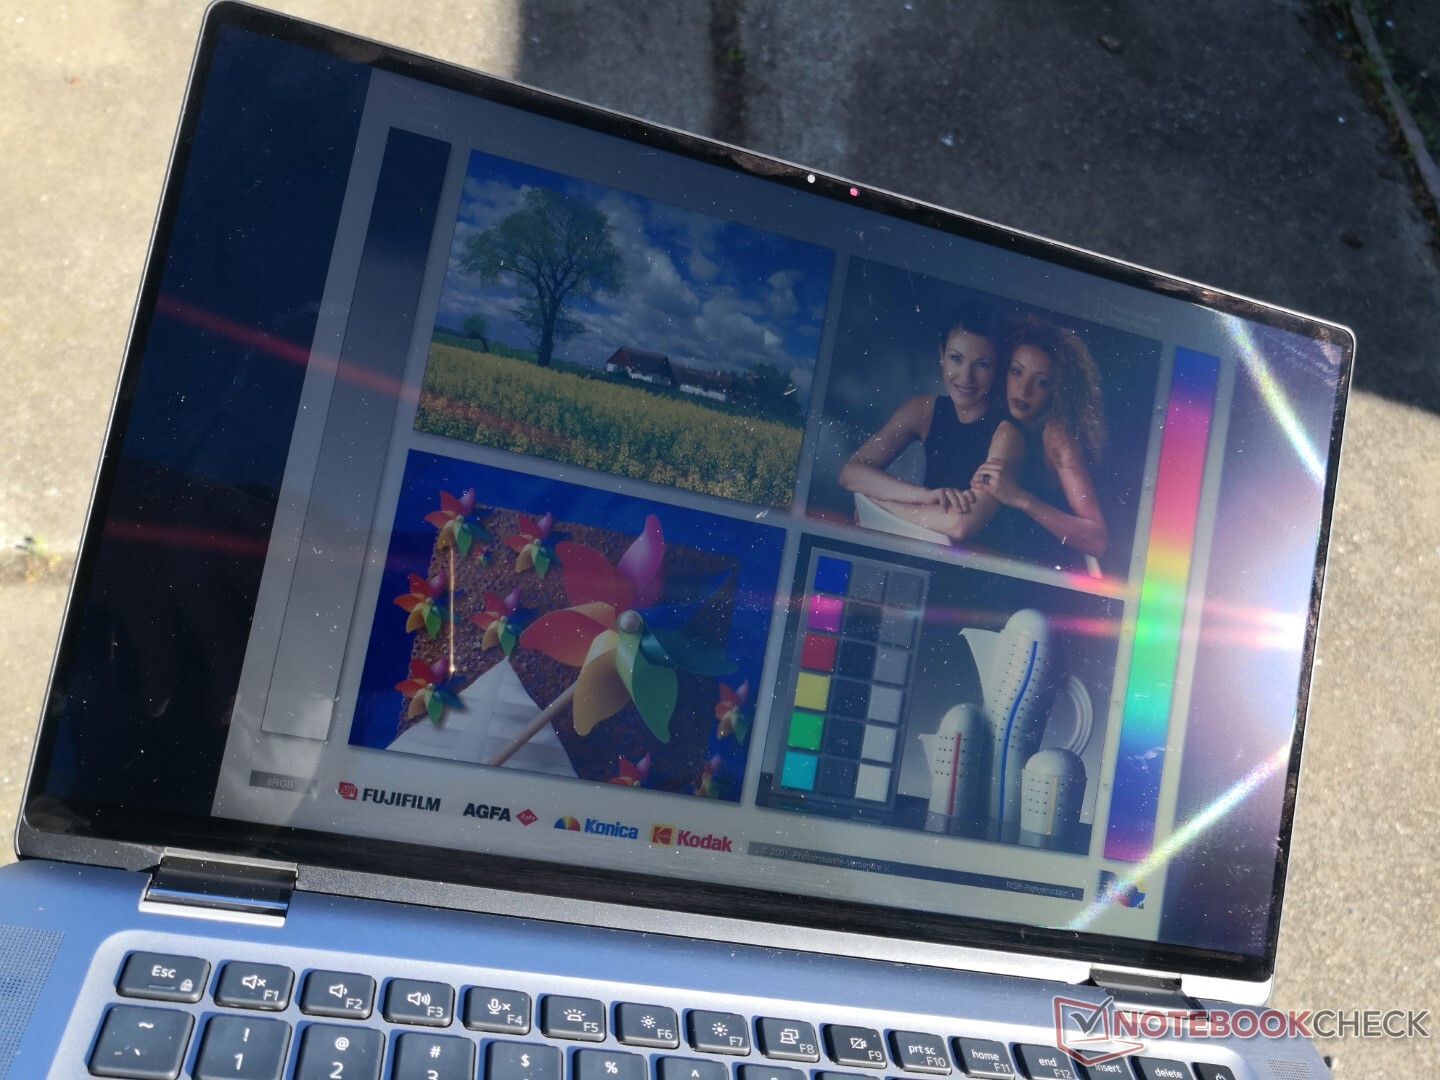
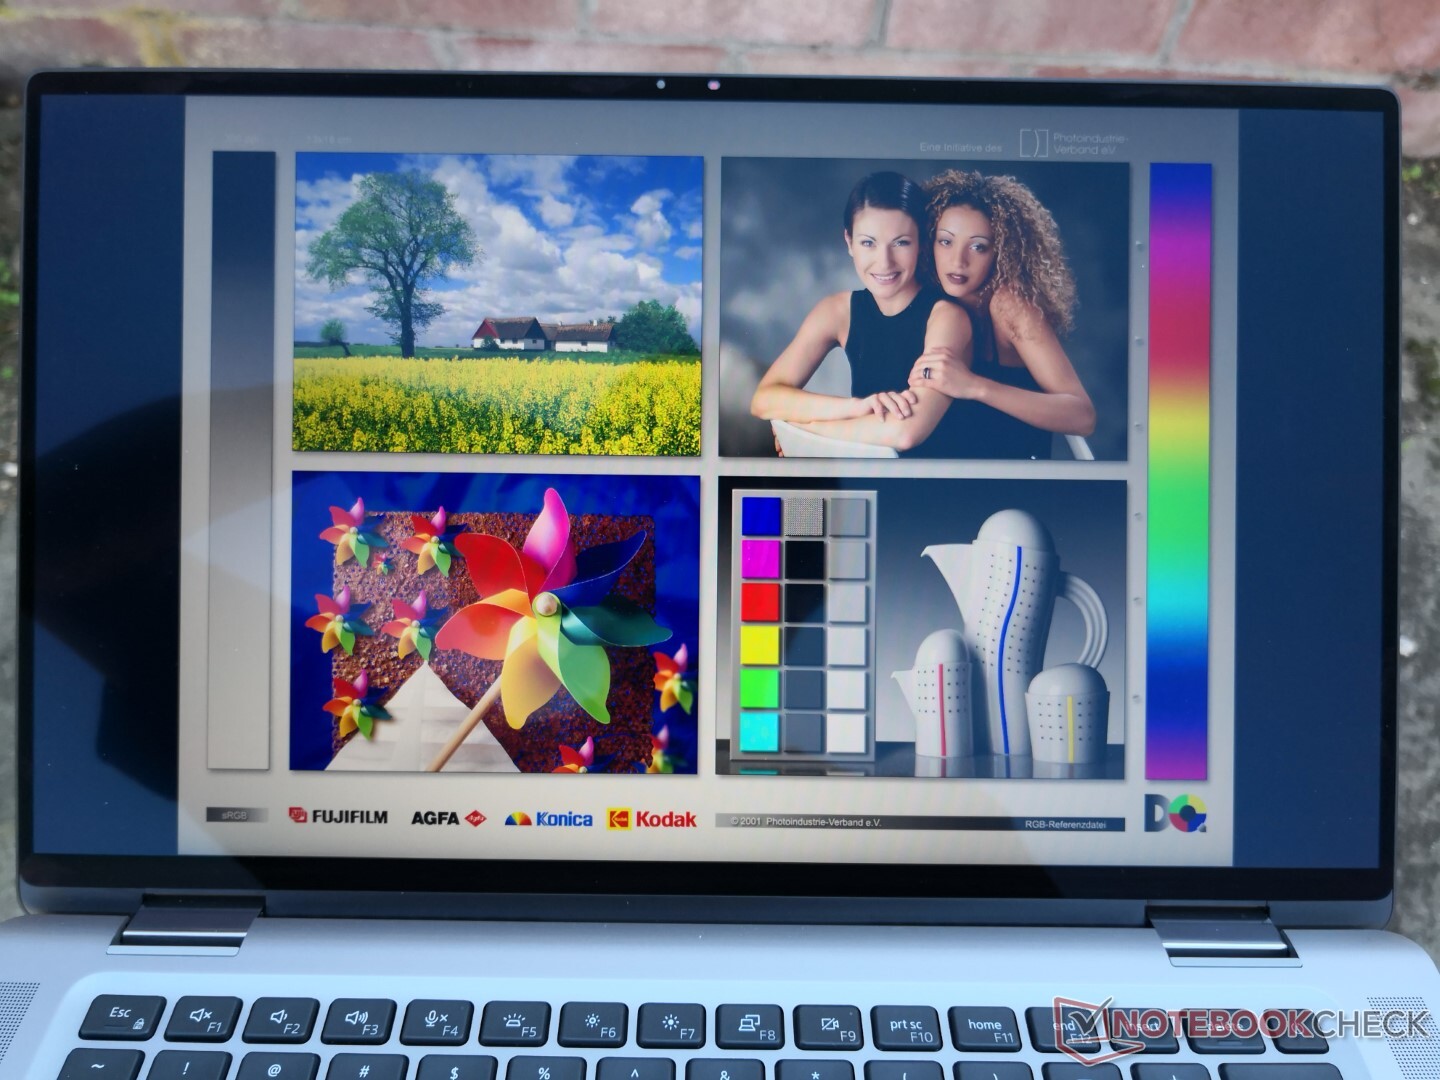
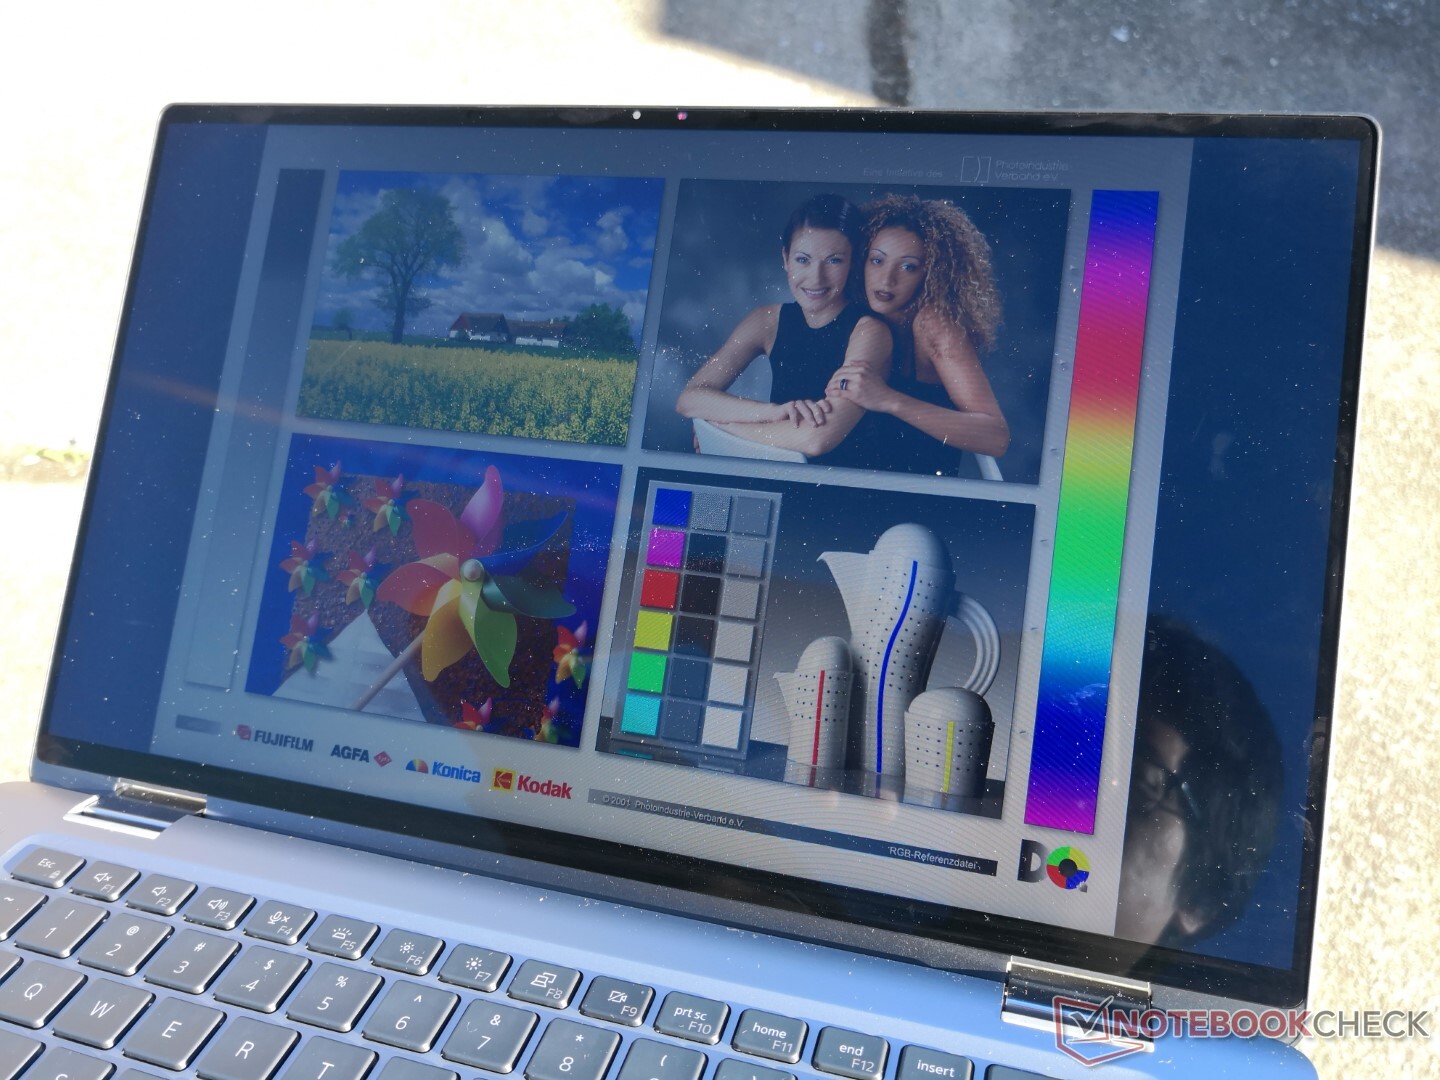
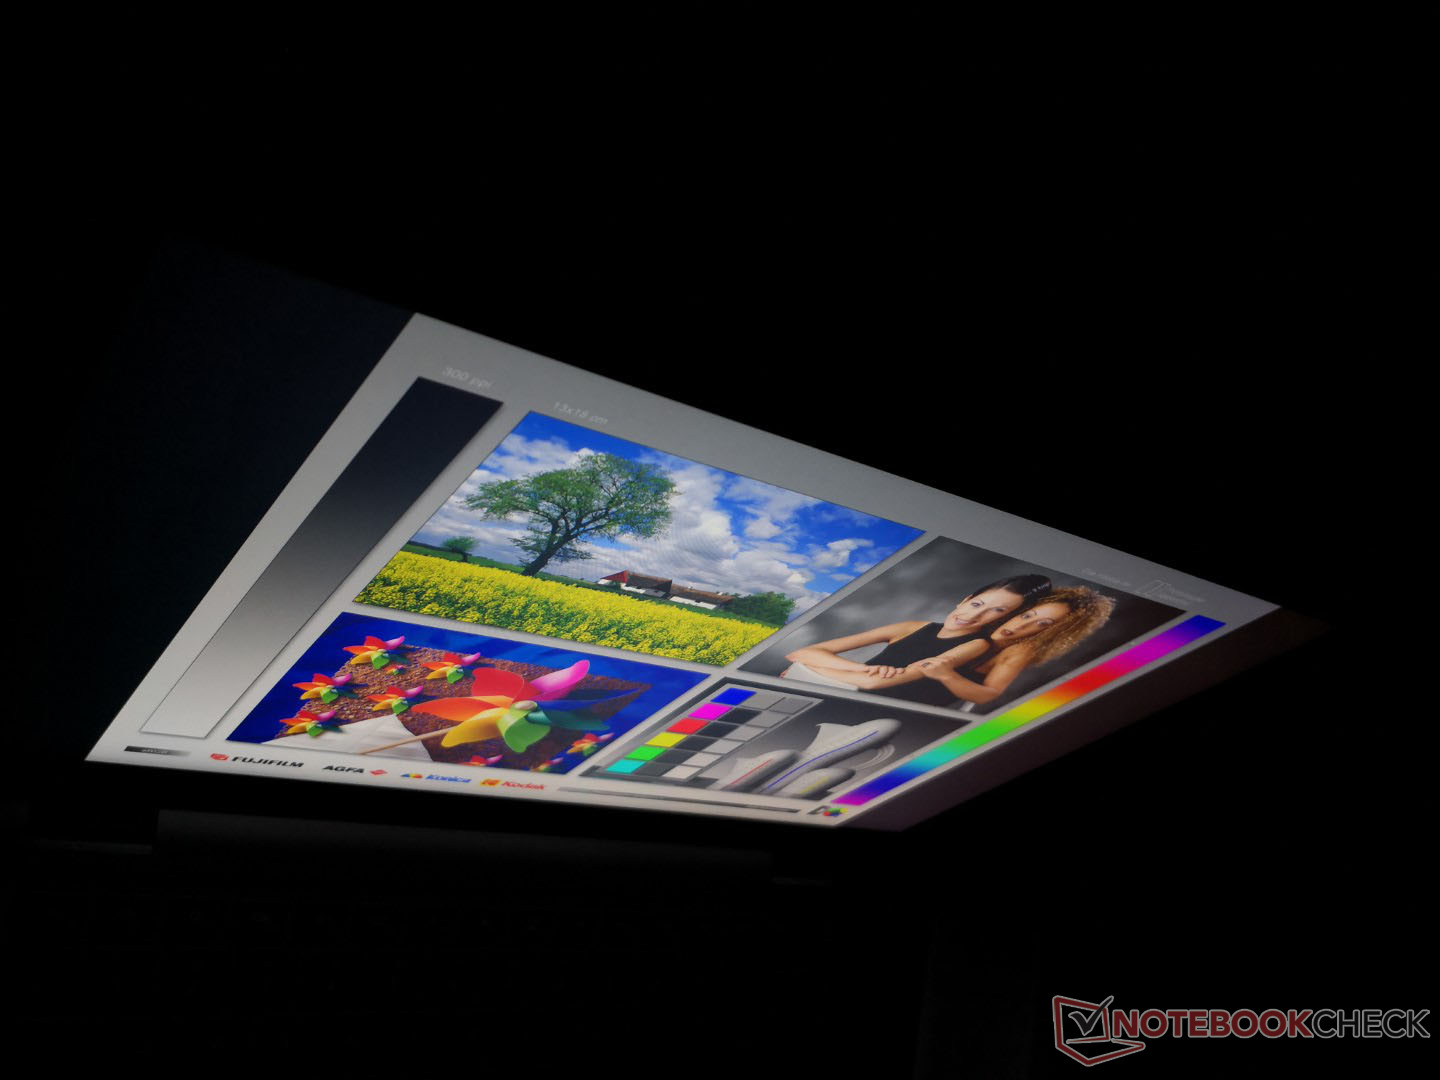
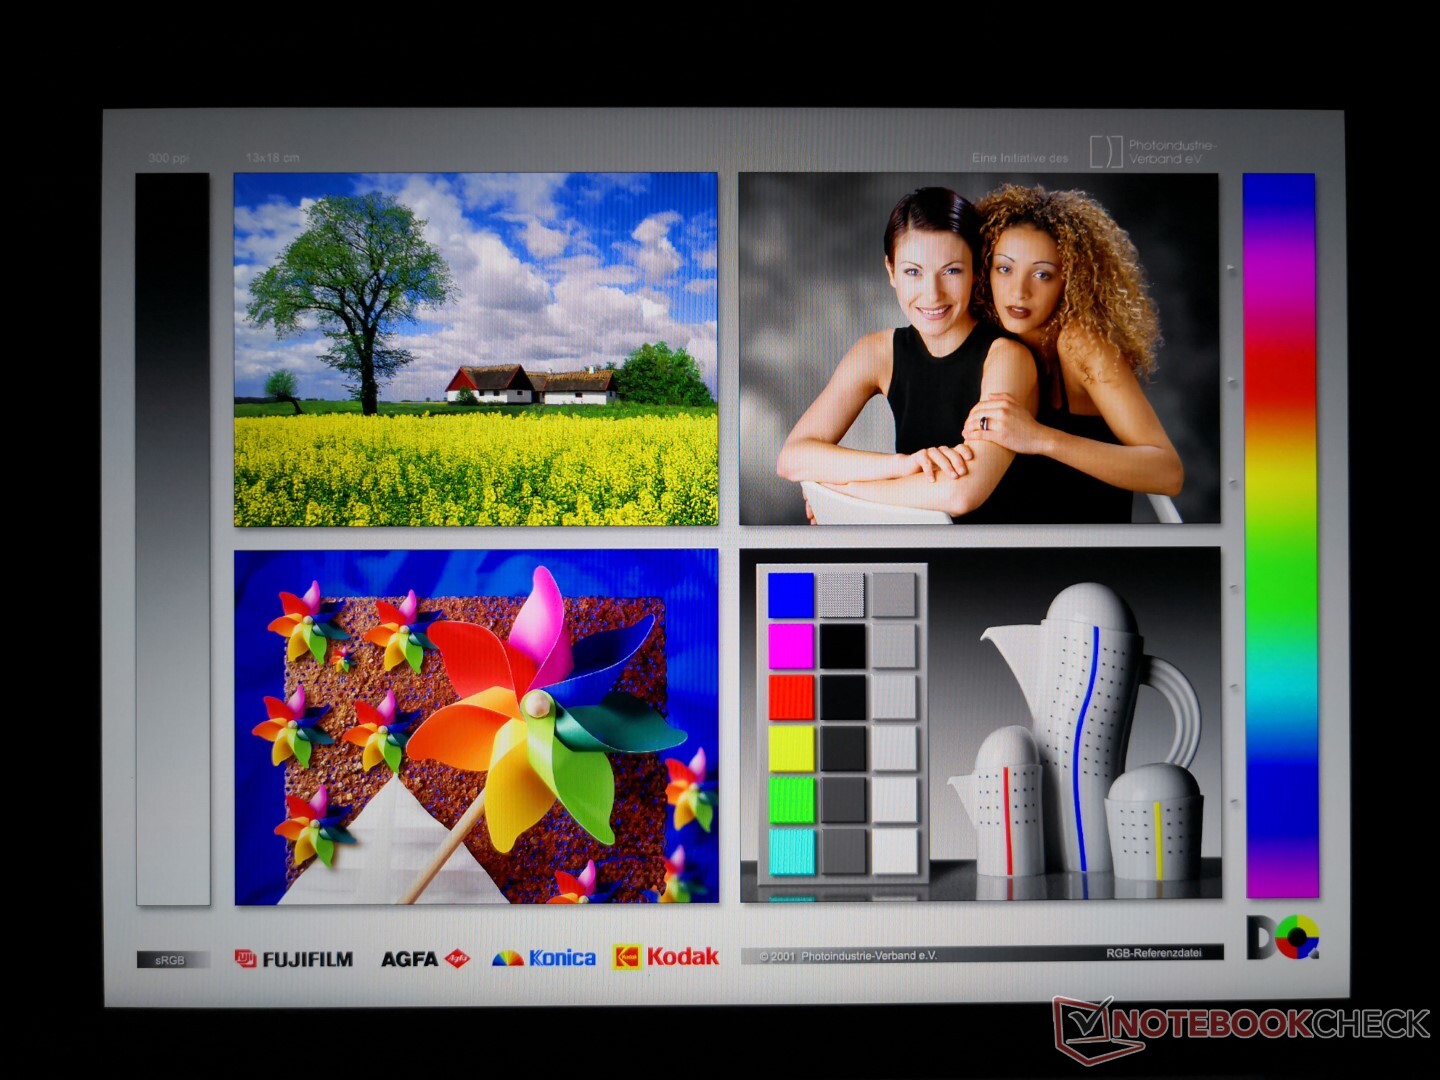
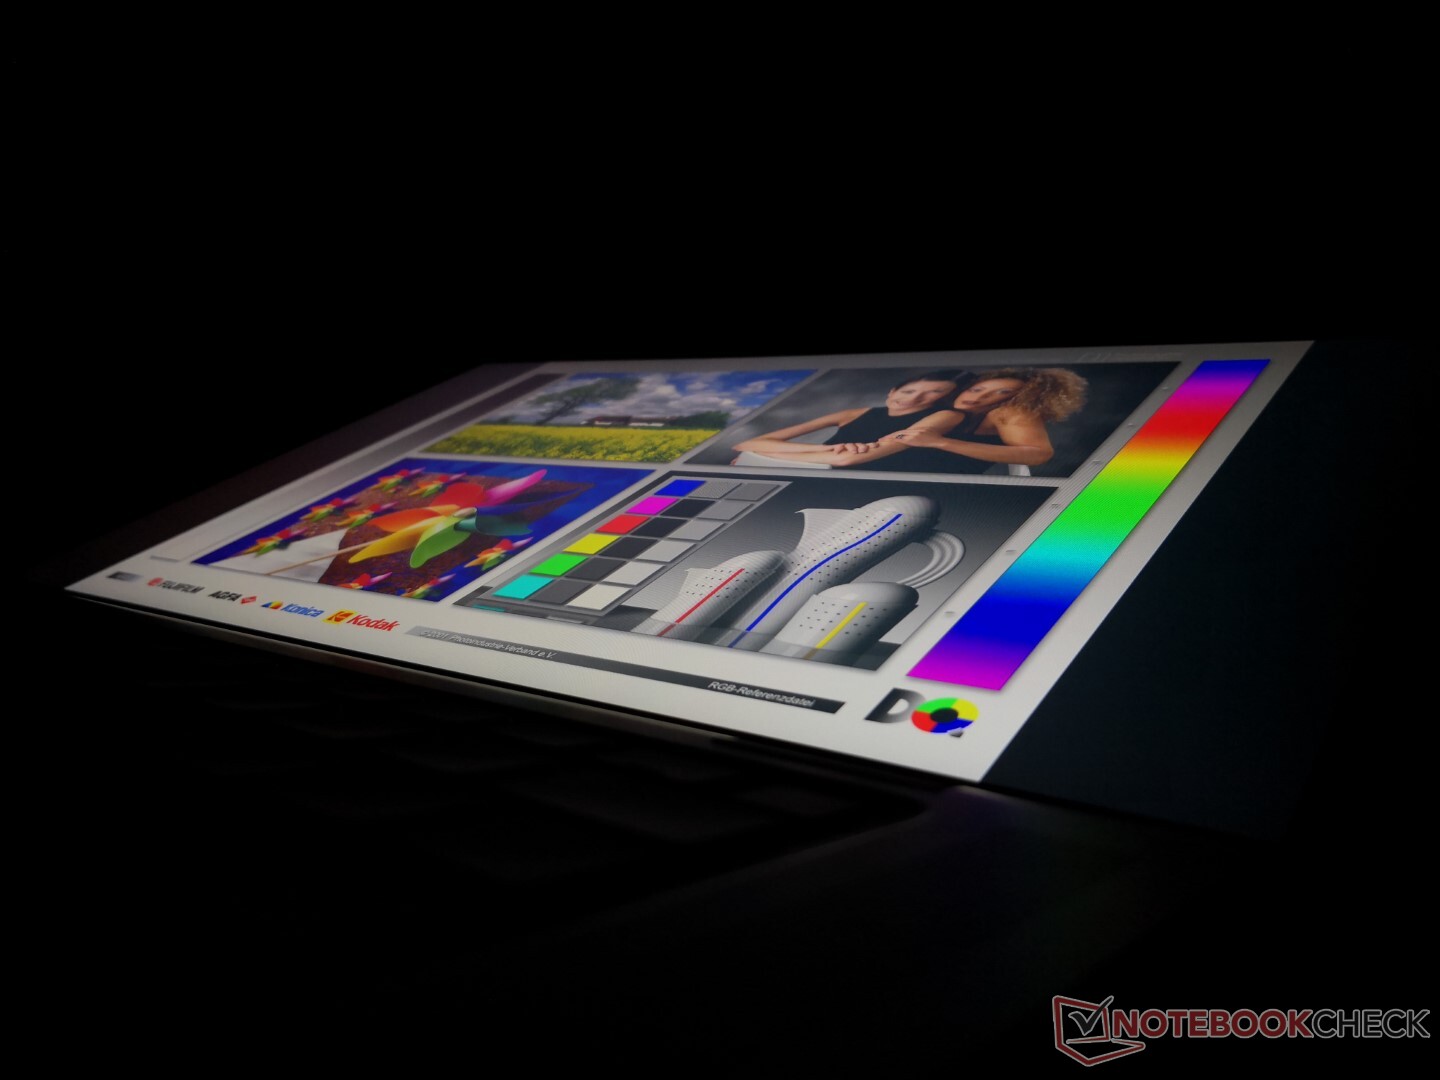
A Dell usa o mesmo painel IPS AU Optronics B150HAN entre ambos os painéis Latitude 9510 2 em 1 e 9520 2 em 1 para uma experiência visual semelhante entre eles. Infelizmente não há novas opções de painel para o 9520 2-em-1. As opções 4K ou OLED seriam ótimas de se ver em futuras revisões Latitude 2 em 1.
| |||||||||||||||||||||||||
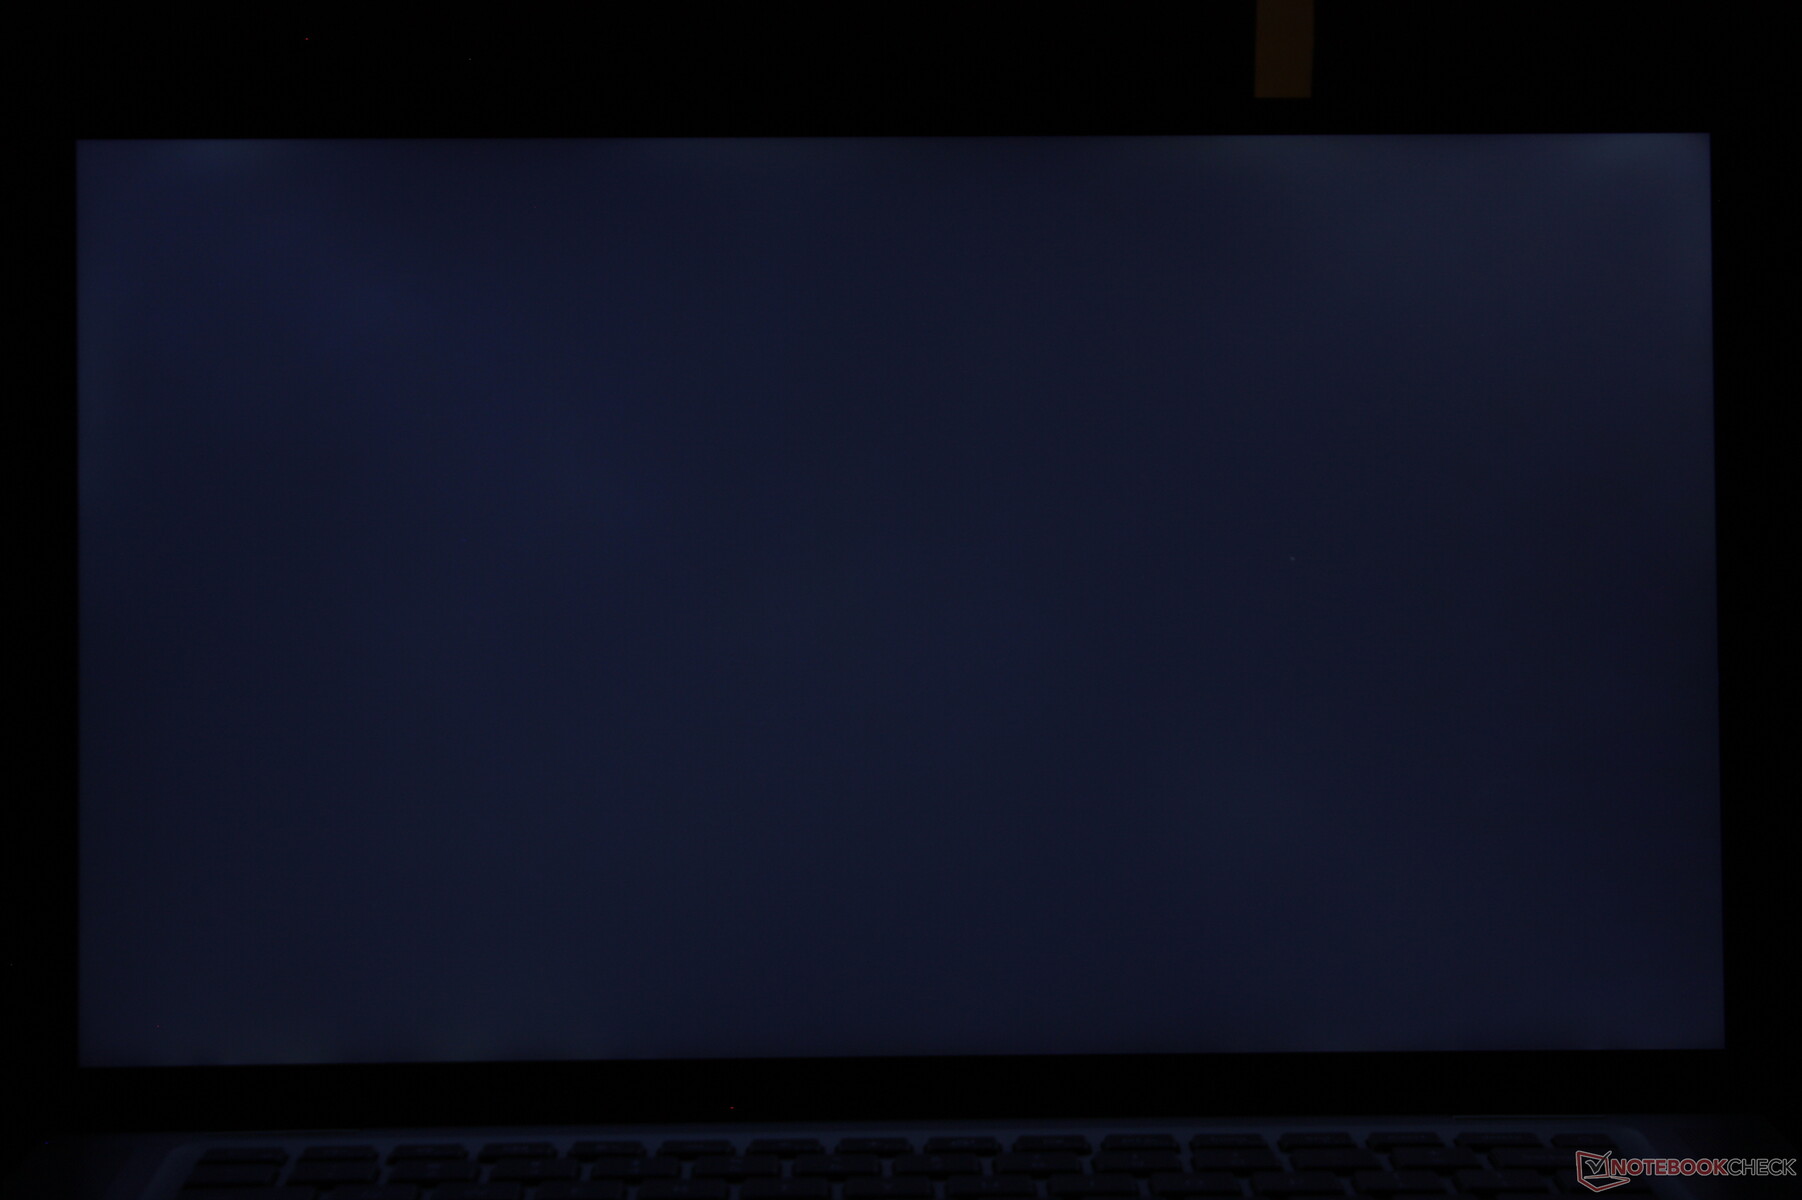
iluminação: 84 %
iluminação com acumulador: 403.6 cd/m²
Contraste: 1835:1 (Preto: 0.22 cd/m²)
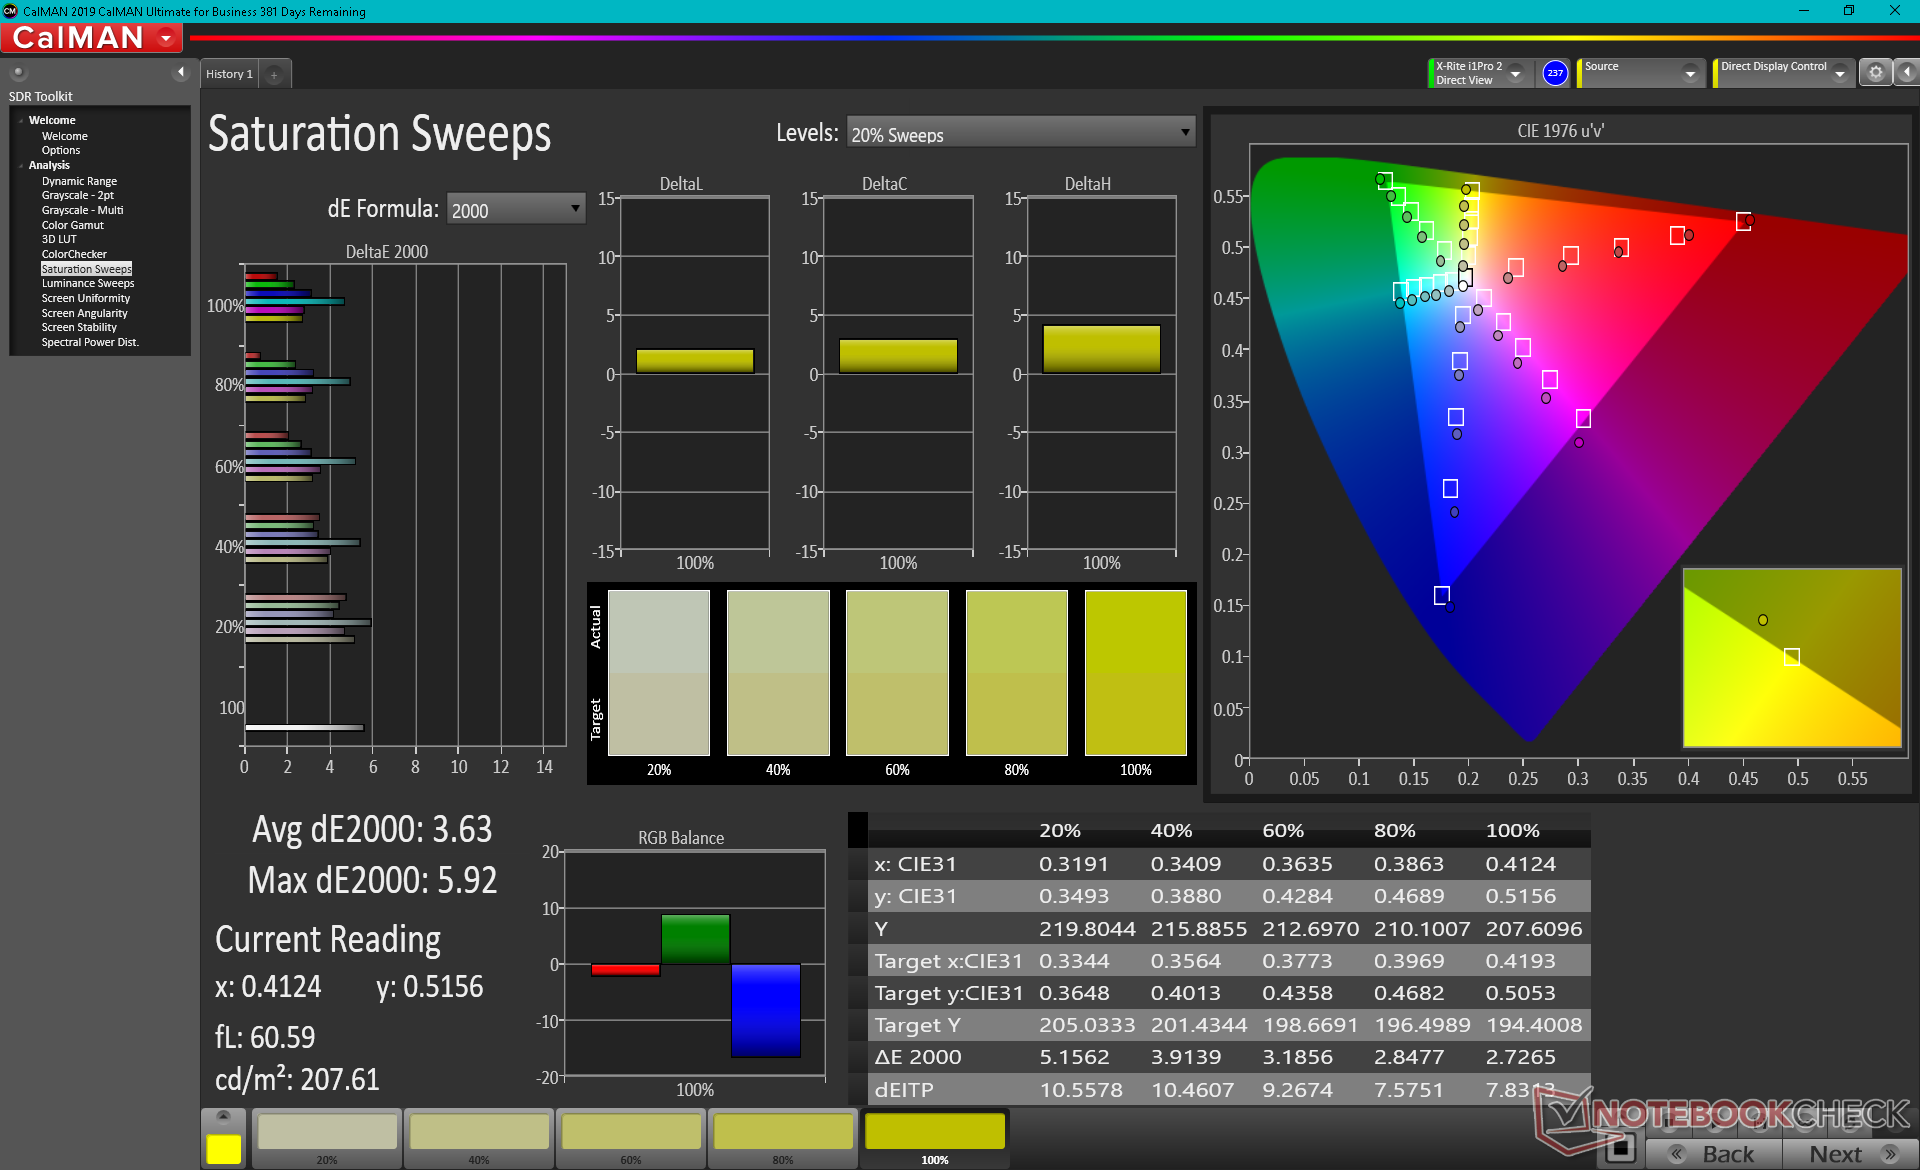
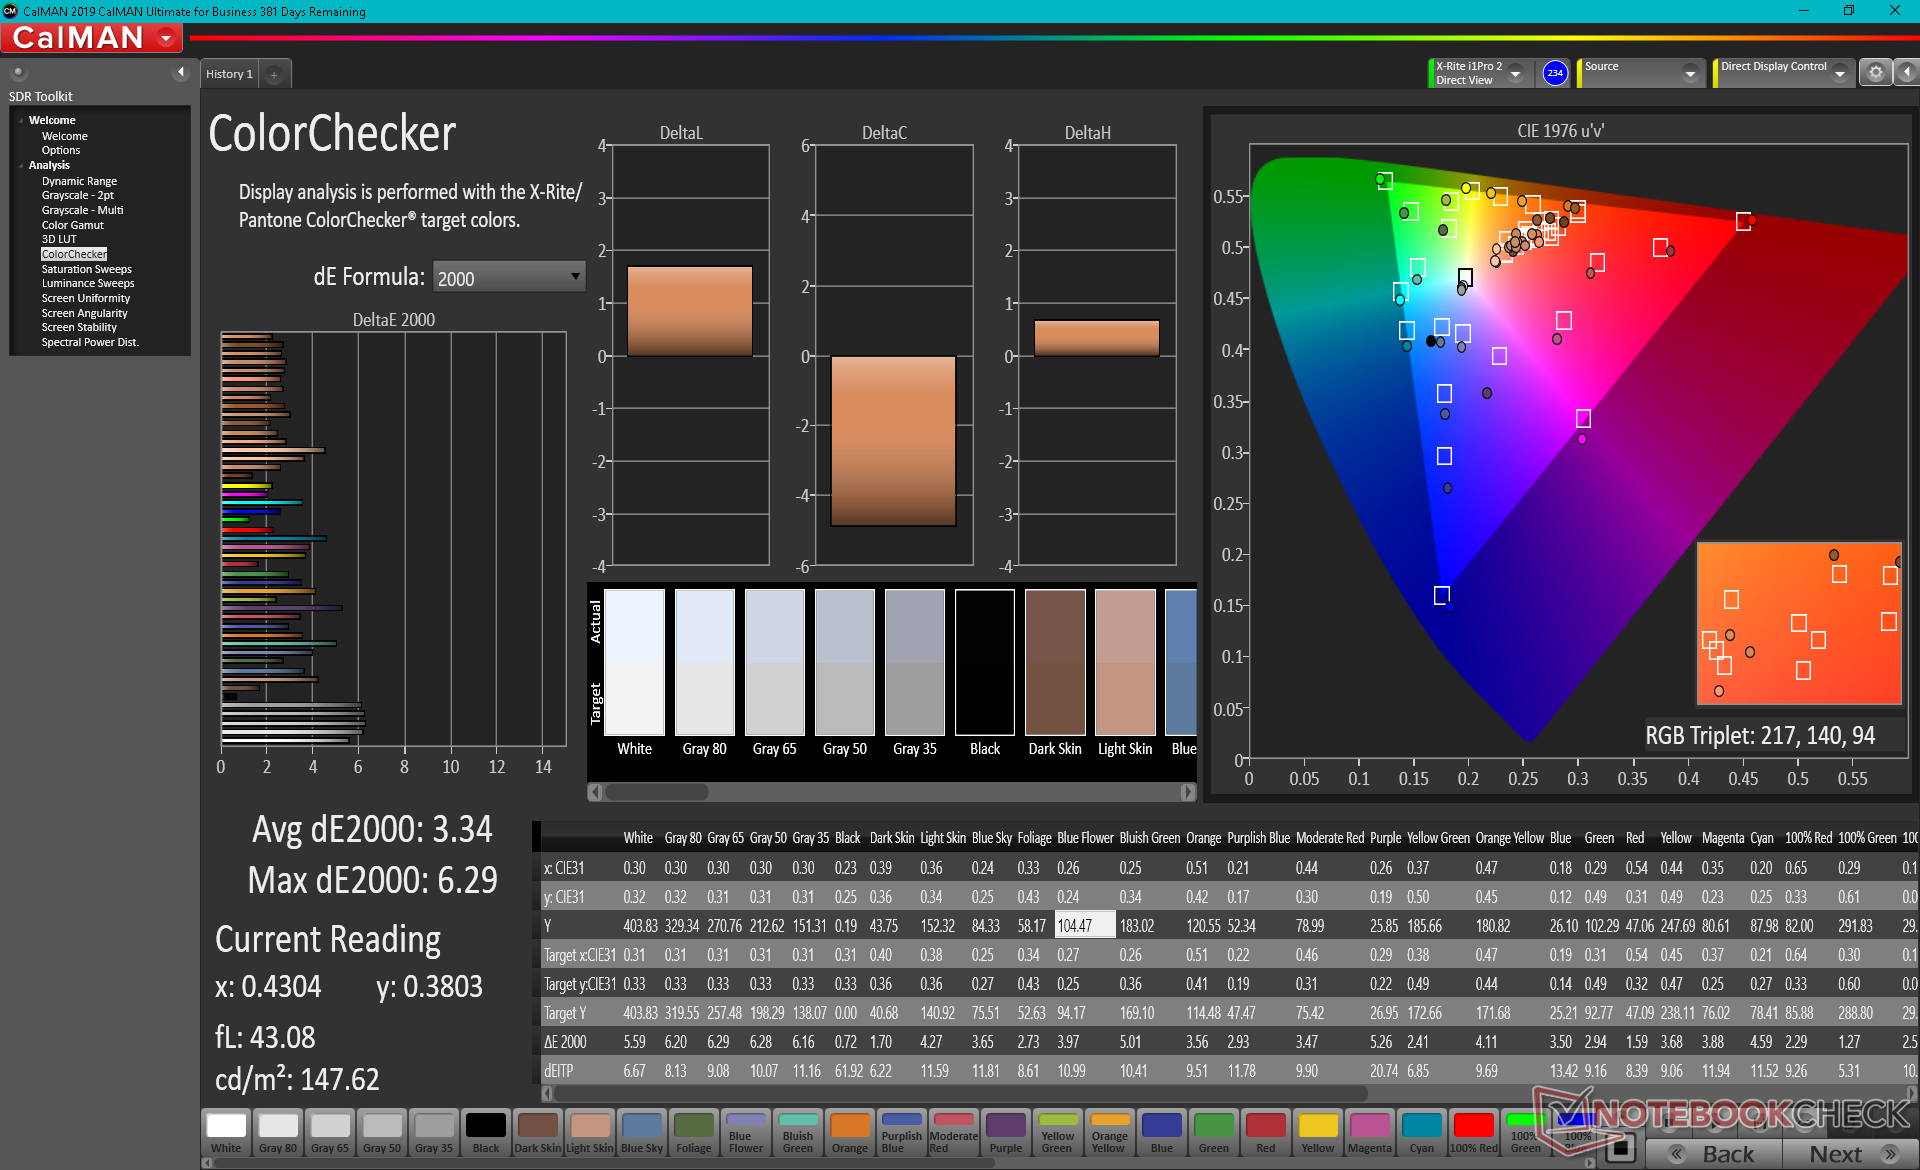
ΔE ColorChecker Calman: 3.34 | ∀{0.5-29.43 Ø4.71}
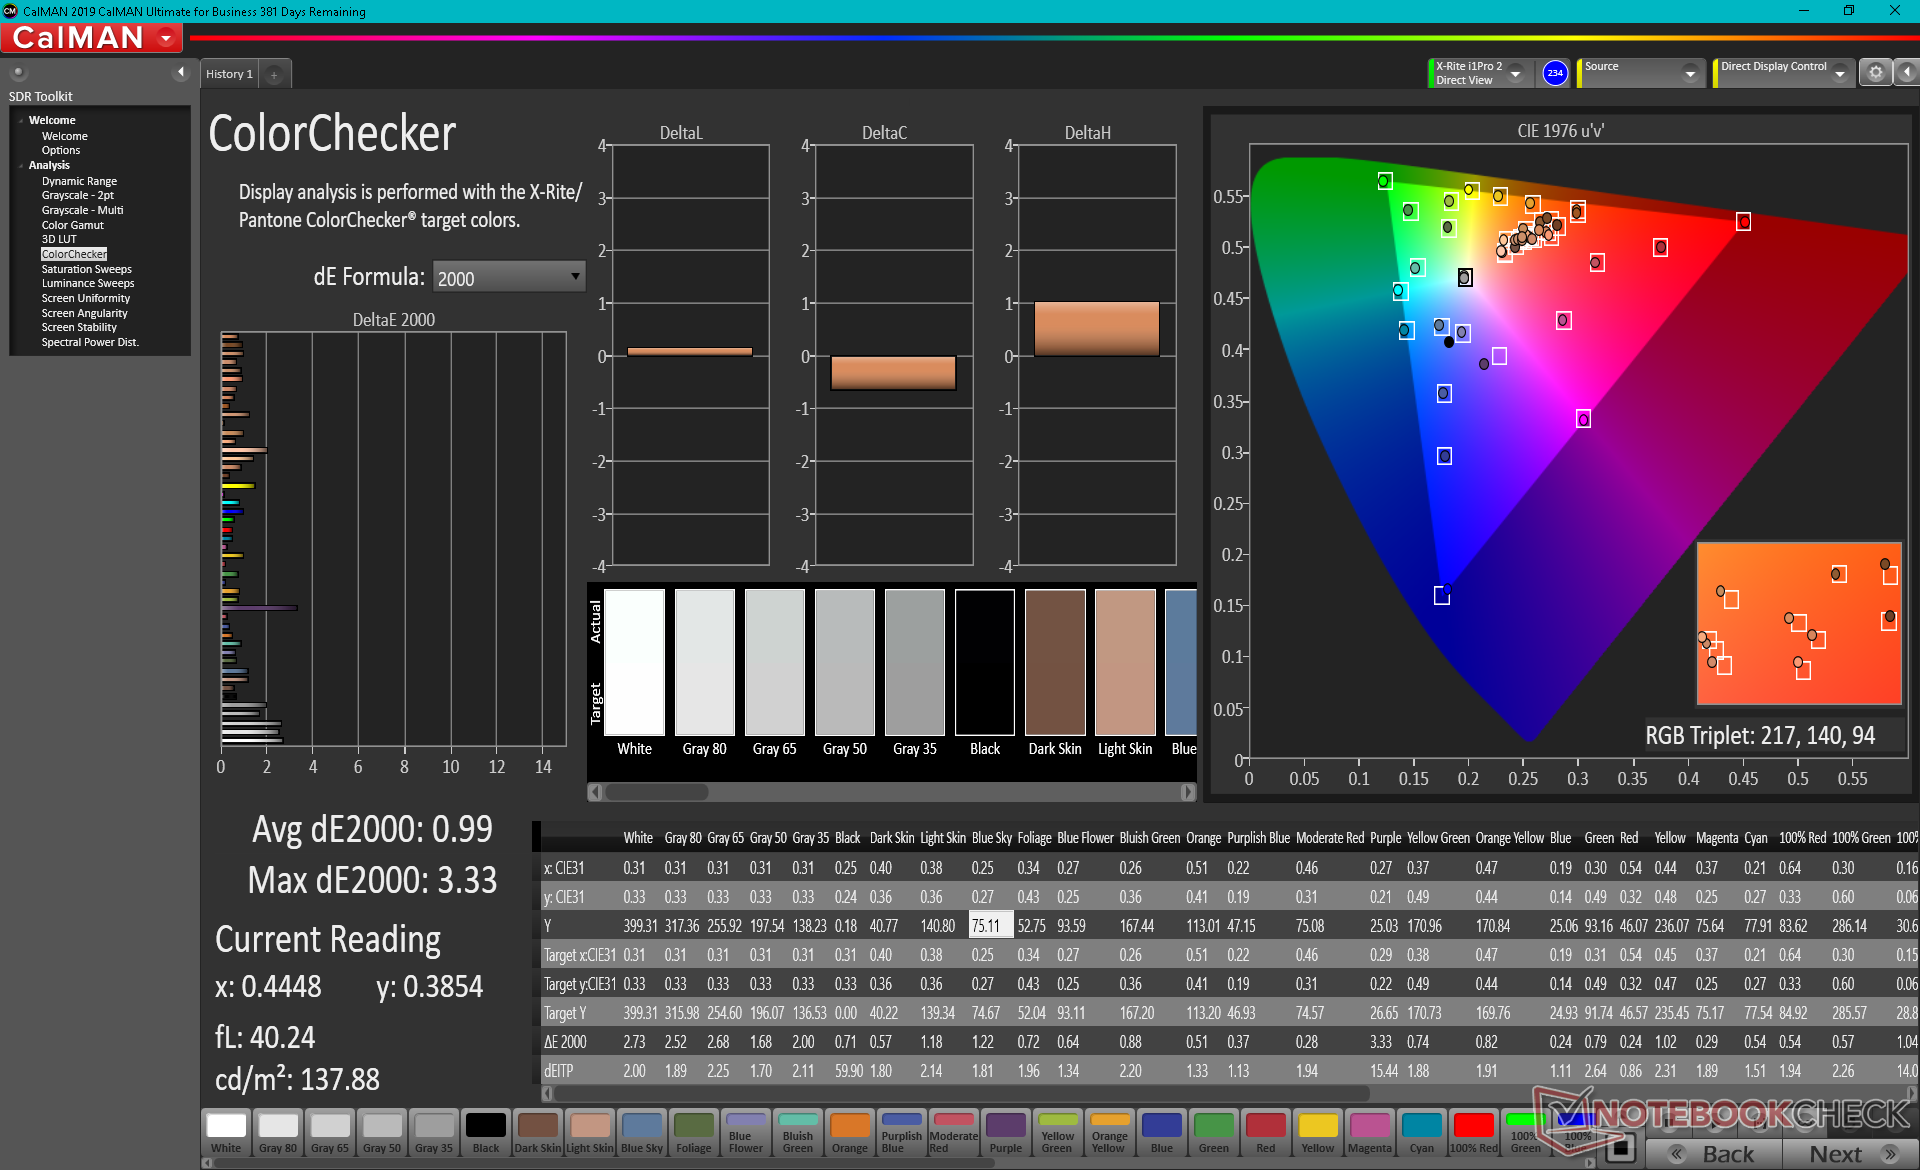
calibrated: 0.99
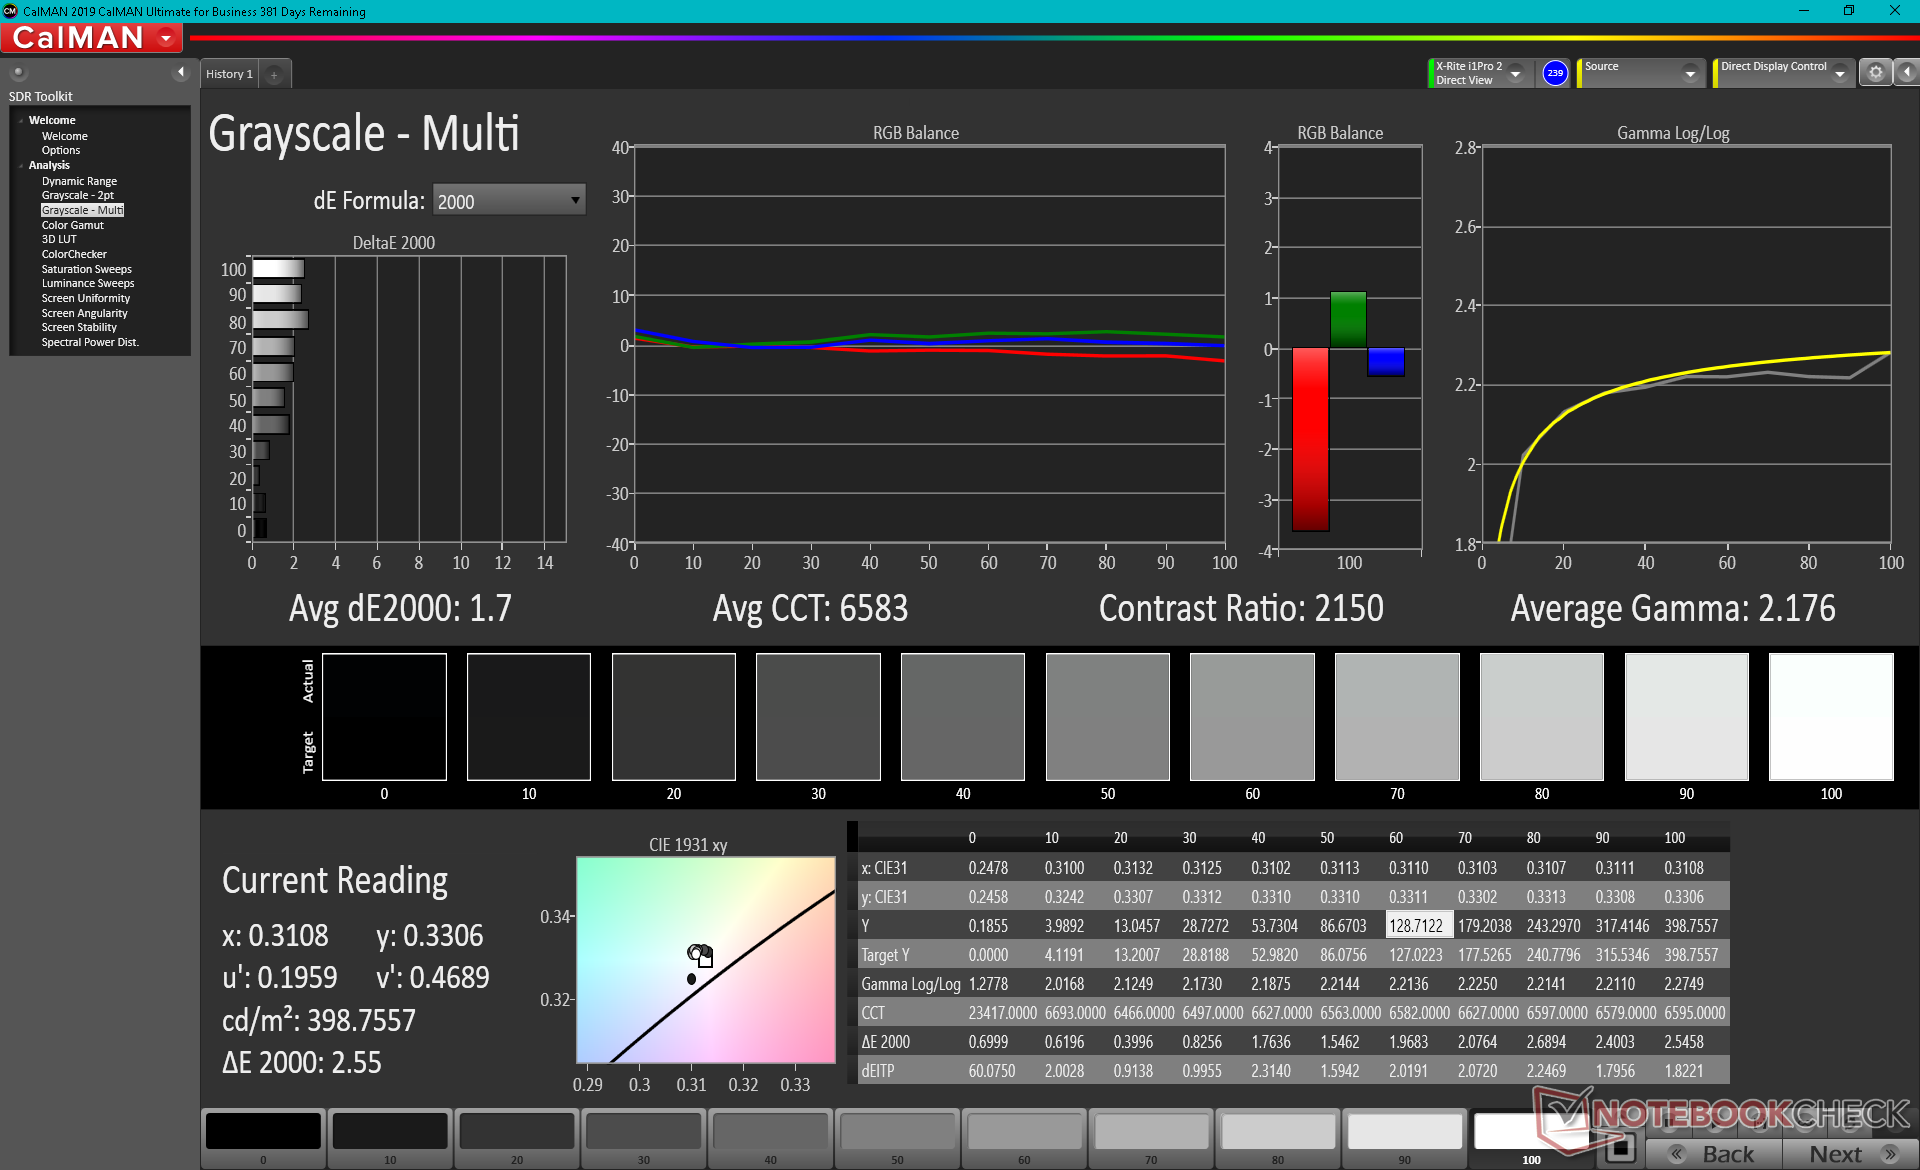
ΔE Greyscale Calman: 5.2 | ∀{0.09-98 Ø4.96}
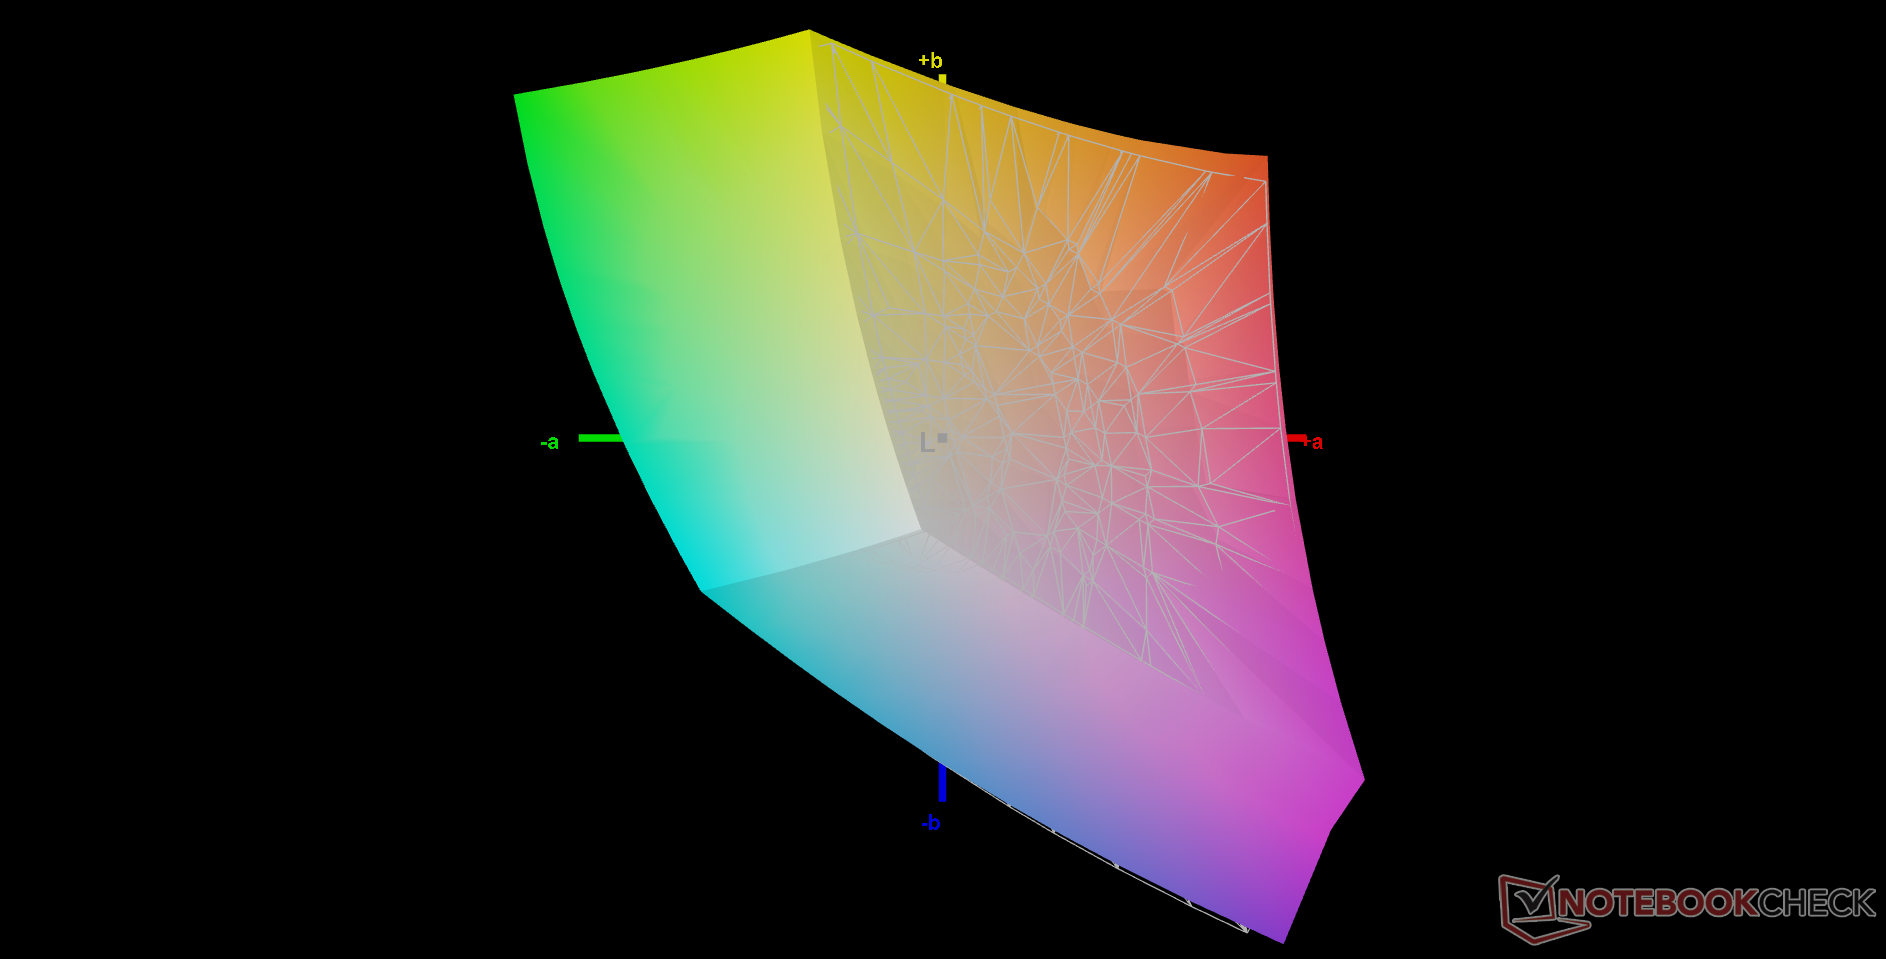
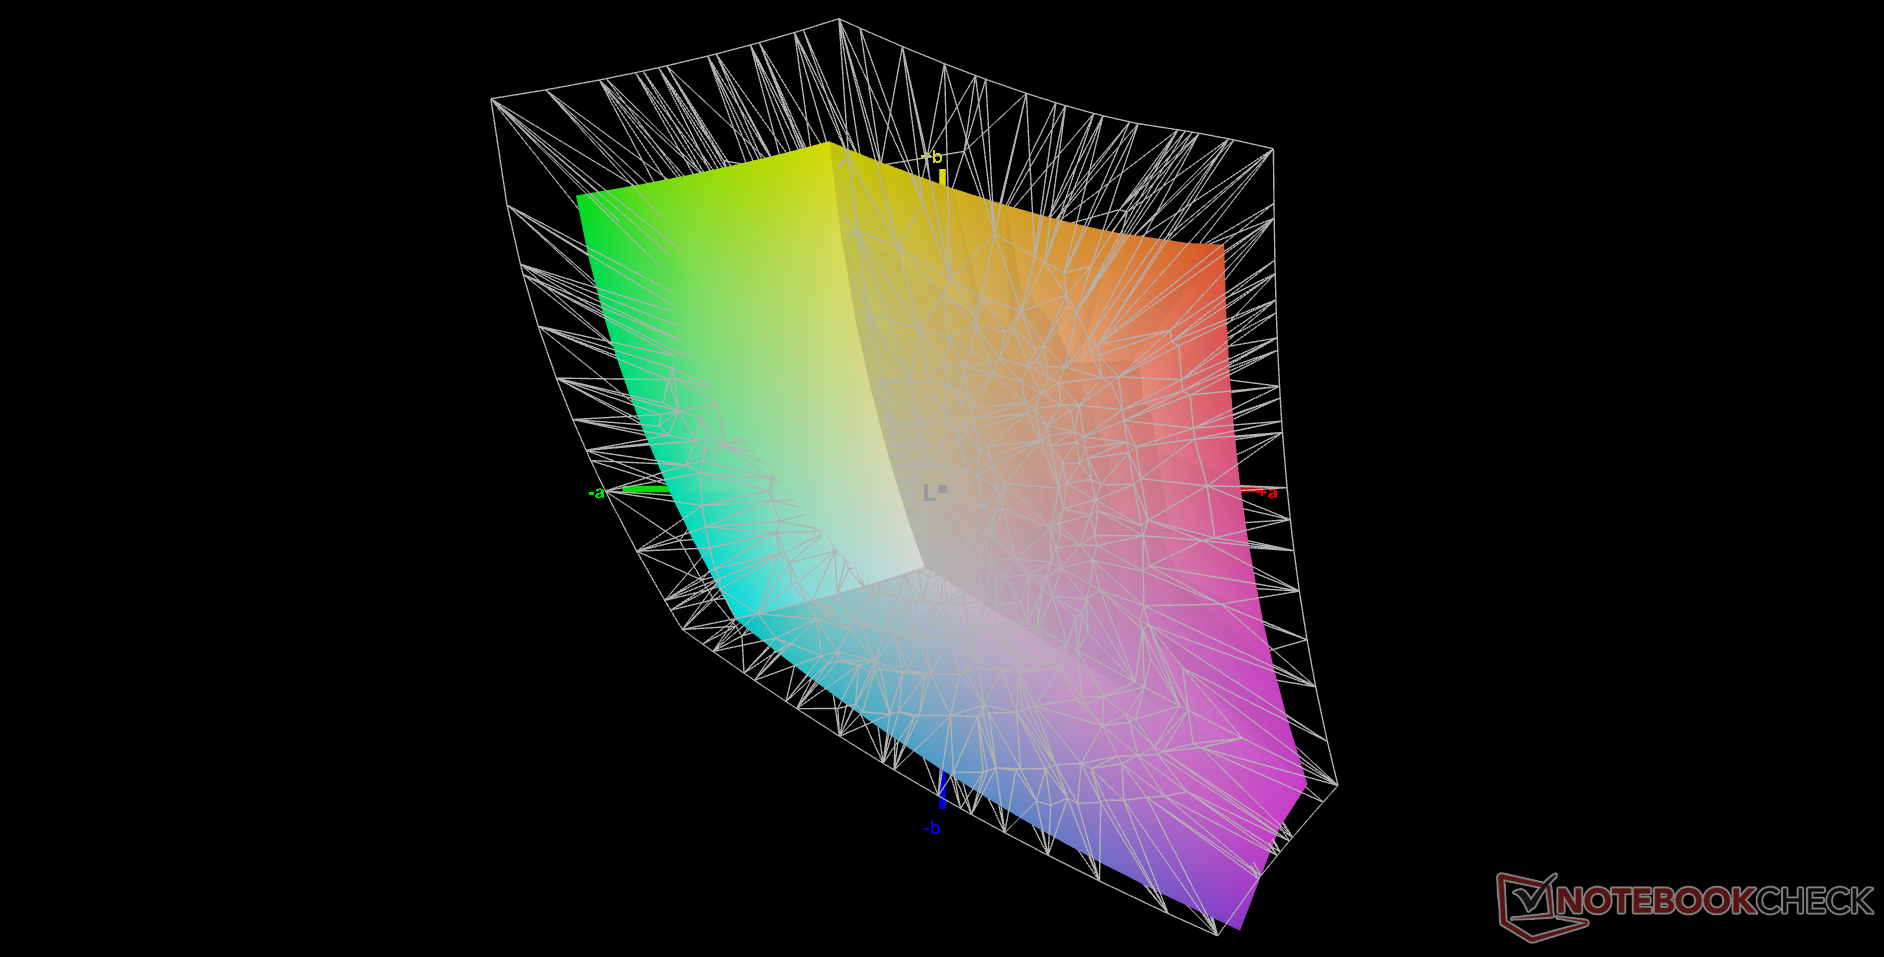
70.4% AdobeRGB 1998 (Argyll 3D)
98.7% sRGB (Argyll 3D)
69.9% Display P3 (Argyll 3D)
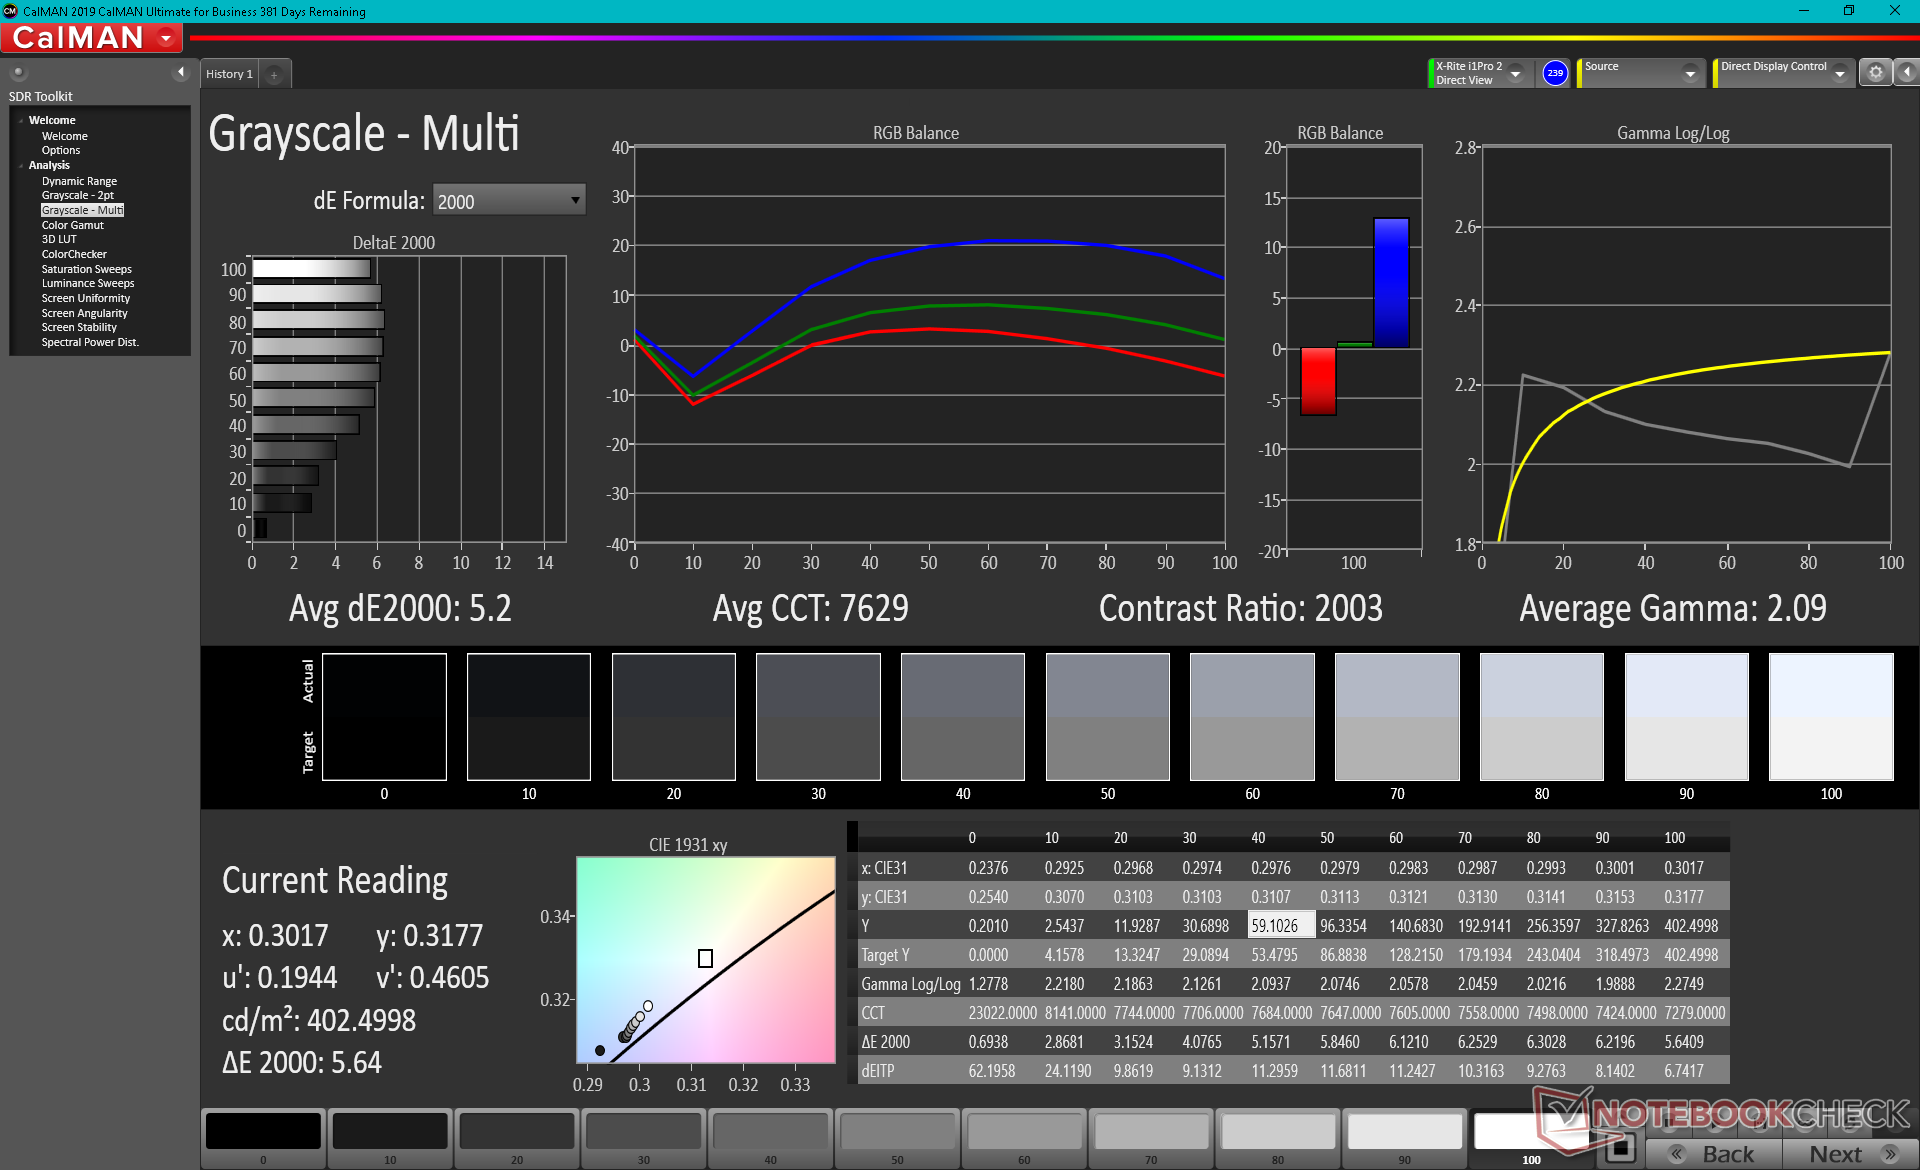
Gamma: 2.09
CCT: 7629 K
| Dell Latitude 15 9520 2-in-1 AU Optronics B150HAN, IPS, 1920x1080, 15" | Dell Latitude 9510 2-in-1 AU Optronics B150HAN, IPS, 1920x1080, 15" | HP EliteBook 850 G8 3C7Z8EA InfoVision X156NVF8 R1, I, 1920x1080, 15.6" | Lenovo ThinkPad L15 G2 AMD N156HCA-EAB, IPS LED, 1920x1080, 15.6" | MSI Summit B15 A11M Chi Mei N156HCE-EN1, IPS, 1920x1080, 15.6" | Microsoft Surface Laptop 4 15 AMD TFF_00028 SHP14B4, IPS, 2496x1664, 15" | |
|---|---|---|---|---|---|---|
| Display | 1% | -6% | -35% | -7% | -4% | |
| Display P3 Coverage (%) | 69.9 | 71.2 2% | 43.8 -37% | 65.7 -6% | 65.2 -7% | |
| sRGB Coverage (%) | 98.7 | 99.3 1% | 95 -4% | 65.7 -33% | 90.6 -8% | 97.7 -1% |
| AdobeRGB 1998 Coverage (%) | 70.4 | 71.3 1% | 65 -8% | 45.3 -36% | 66 -6% | 67.3 -4% |
| Response Times | -27% | -19% | -6% | -11% | -32% | |
| Response Time Grey 50% / Grey 80% * (ms) | 39.2 ? | 52.8 ? -35% | 47 ? -20% | 40 -2% | 40.4 ? -3% | 58.4 ? -49% |
| Response Time Black / White * (ms) | 27.2 ? | 32 ? -18% | 32 ? -18% | 30 -10% | 32.4 ? -19% | 31.2 ? -15% |
| PWM Frequency (Hz) | 312 ? | 25510 ? | 21550 ? | |||
| Screen | -27% | 7% | -49% | -71% | 6% | |
| Brightness middle (cd/m²) | 403.6 | 426.7 6% | 802 99% | 298 -26% | 341.3 -15% | 405 0% |
| Brightness (cd/m²) | 368 | 394 7% | 702 91% | 276 -25% | 310 -16% | 379 3% |
| Brightness Distribution (%) | 84 | 87 4% | 77 -8% | 86 2% | 81 -4% | 79 -6% |
| Black Level * (cd/m²) | 0.22 | 0.3 -36% | 0.245 -11% | 0.26 -18% | 0.45 -105% | 0.26 -18% |
| Contrast (:1) | 1835 | 1422 -23% | 3273 78% | 1146 -38% | 758 -59% | 1558 -15% |
| Colorchecker dE 2000 * | 3.34 | 4.28 -28% | 6.22 -86% | 3.7 -11% | 6.17 -85% | 2.6 22% |
| Colorchecker dE 2000 max. * | 6.29 | 10.43 -66% | 9.92 -58% | 15 -138% | 11.75 -87% | 6.6 -5% |
| Colorchecker dE 2000 calibrated * | 0.99 | 1.46 -47% | 3.5 -254% | 3.3 -233% | 0.9 9% | |
| Greyscale dE 2000 * | 5.2 | 8.1 -56% | 7.69 -48% | 1.7 67% | 7.1 -37% | 1.9 63% |
| Gamma | 2.09 105% | 2.26 97% | 2.75 80% | 2.21 100% | 2.2 100% | 2.11 104% |
| CCT | 7629 85% | 7993 81% | 6135 106% | 6588 99% | 6842 95% | 6825 95% |
| Color Space (Percent of AdobeRGB 1998) (%) | 65.2 | 65 | 58.7 | 62 | ||
| Color Space (Percent of sRGB) (%) | 99.2 | 95 | 90.1 | 97.7 | ||
| Média Total (Programa/Configurações) | -18% /
-21% | -6% /
1% | -30% /
-40% | -30% /
-49% | -10% /
-2% |
* ... menor é melhor
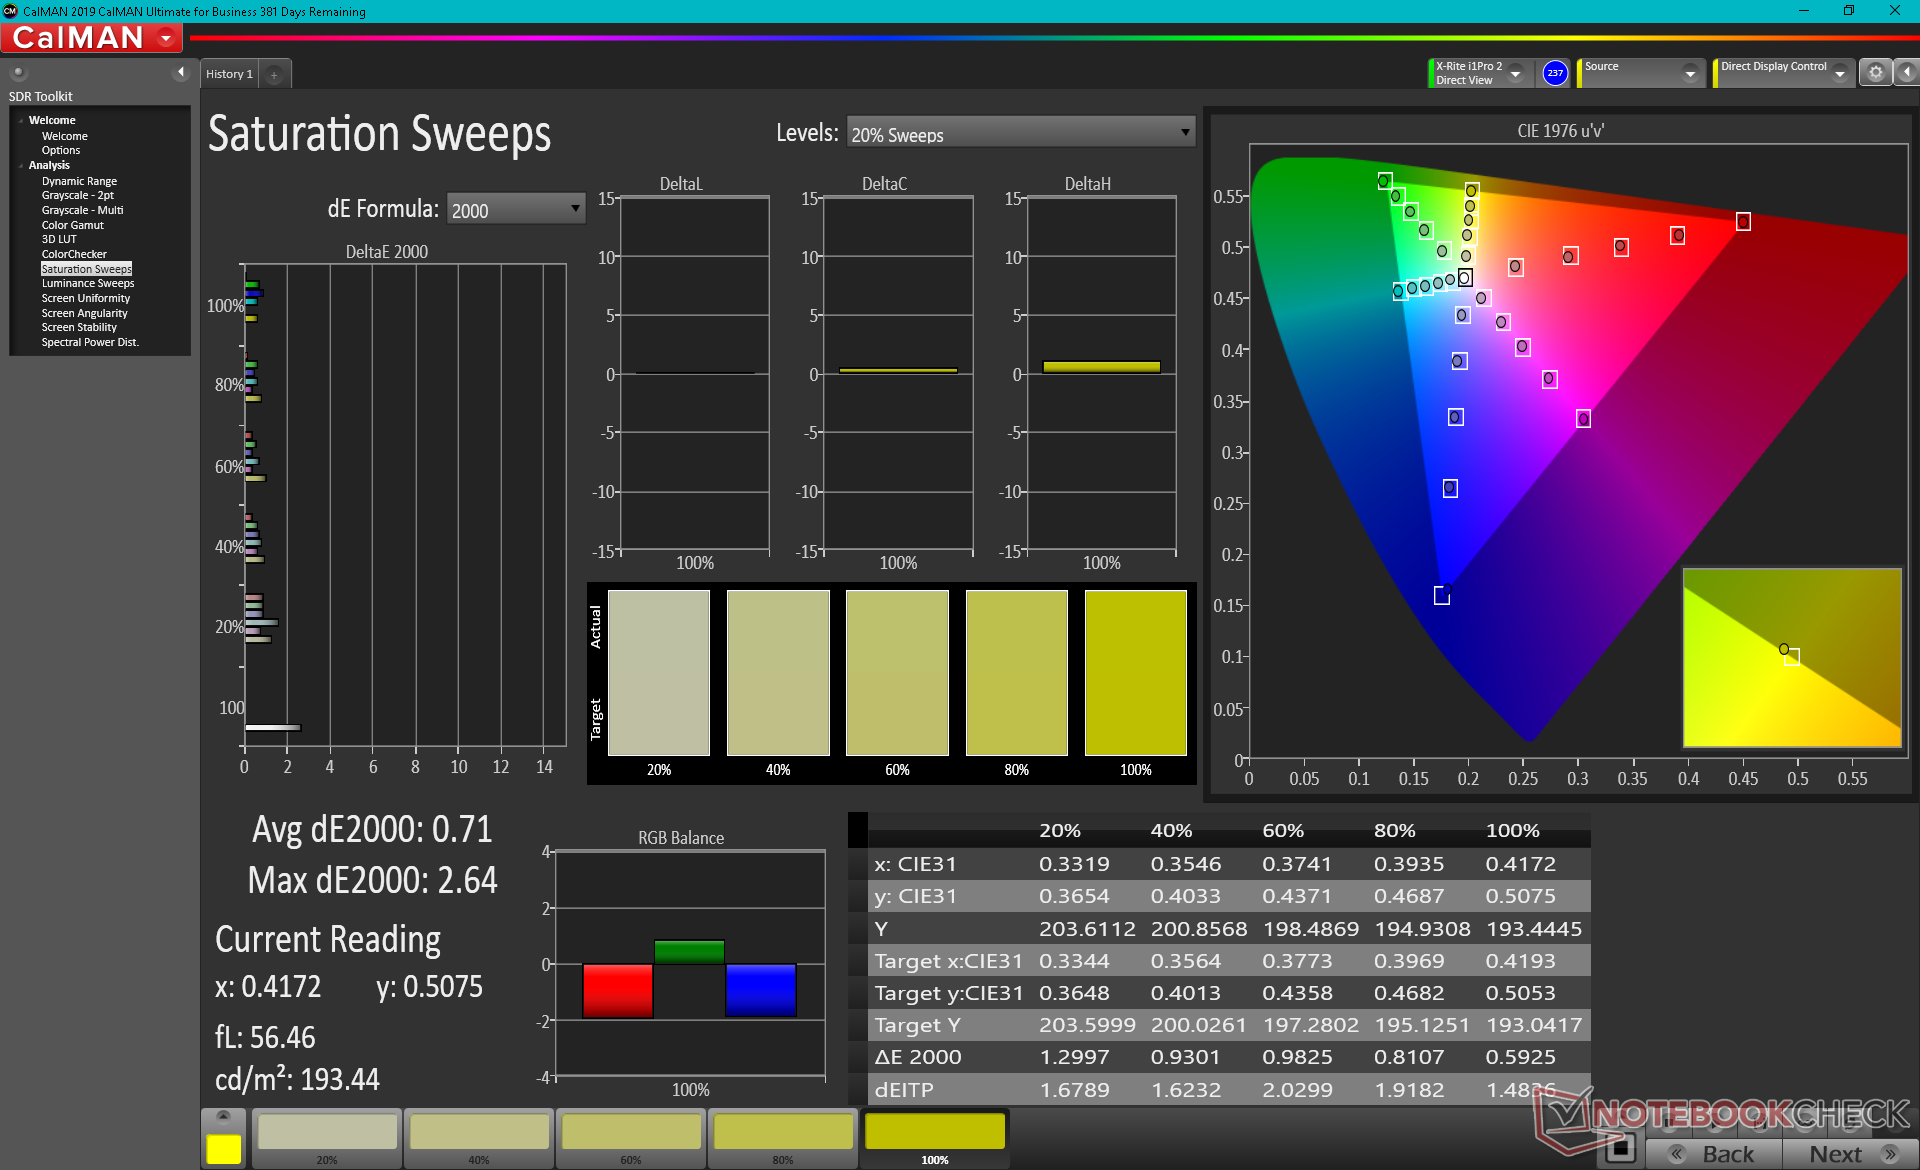
O display é decentemente calibrado fora da caixa com valores médios de escala de cinza e deltaE de cor de apenas 5,2 e 3,34, respectivamente. Uma calibração adequada do usuário final pode reduzir esses valores para menos de <2 cada um, como mostram nossas telas CalMAN abaixo.
Exibir tempos de resposta
| ↔ Tempo de resposta preto para branco | ||
|---|---|---|
| 27.2 ms ... ascensão ↗ e queda ↘ combinadas | ↗ 14 ms ascensão | 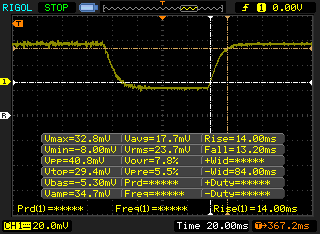 |
| ↘ 13.2 ms queda | ||
| A tela mostra taxas de resposta relativamente lentas em nossos testes e pode ser muito lenta para os jogadores. Em comparação, todos os dispositivos testados variam de 0.1 (mínimo) a 240 (máximo) ms. » 69 % de todos os dispositivos são melhores. Isso significa que o tempo de resposta medido é pior que a média de todos os dispositivos testados (19.8 ms). | ||
| ↔ Tempo de resposta 50% cinza a 80% cinza | ||
| 39.2 ms ... ascensão ↗ e queda ↘ combinadas | ↗ 19.2 ms ascensão | 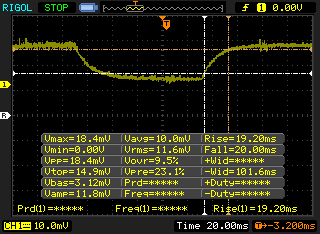 |
| ↘ 20 ms queda | ||
| A tela mostra taxas de resposta lentas em nossos testes e será insatisfatória para os jogadores. Em comparação, todos os dispositivos testados variam de 0.165 (mínimo) a 636 (máximo) ms. » 60 % de todos os dispositivos são melhores. Isso significa que o tempo de resposta medido é pior que a média de todos os dispositivos testados (30.9 ms). | ||
Cintilação da tela / PWM (modulação por largura de pulso)
| Tela tremeluzindo / PWM não detectado | 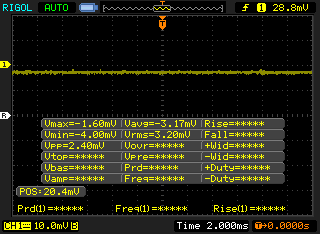 | ||
[pwm_comparison] Em comparação: 52 % de todos os dispositivos testados não usam PWM para escurecer a tela. Se PWM foi detectado, uma média de 7748 (mínimo: 5 - máximo: 343500) Hz foi medida. | |||
Desempenho
Condições de teste
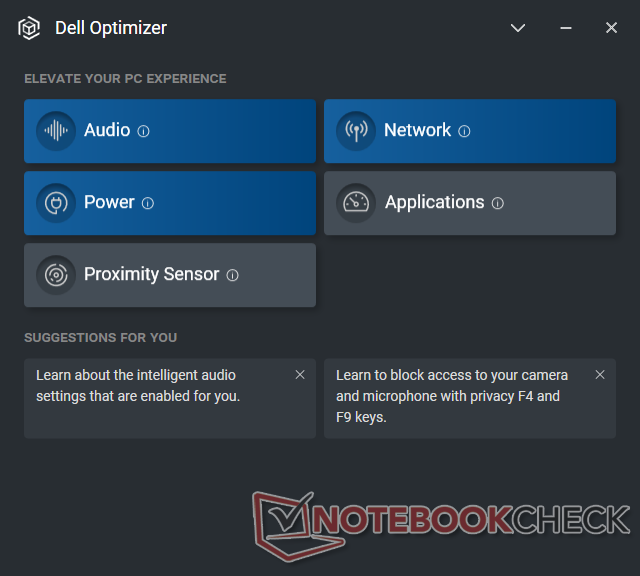
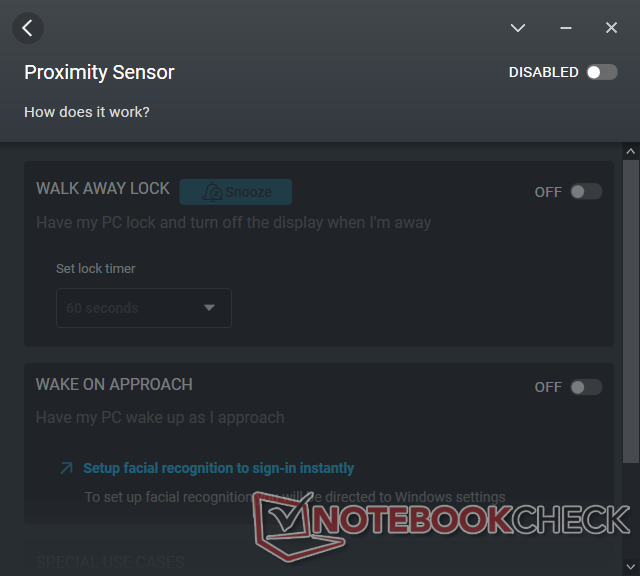
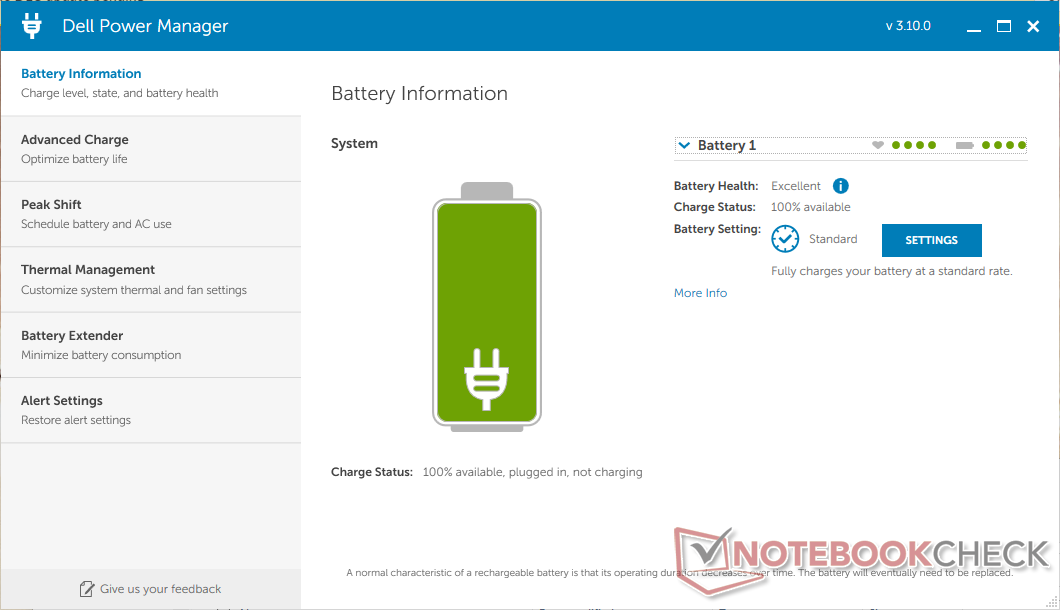
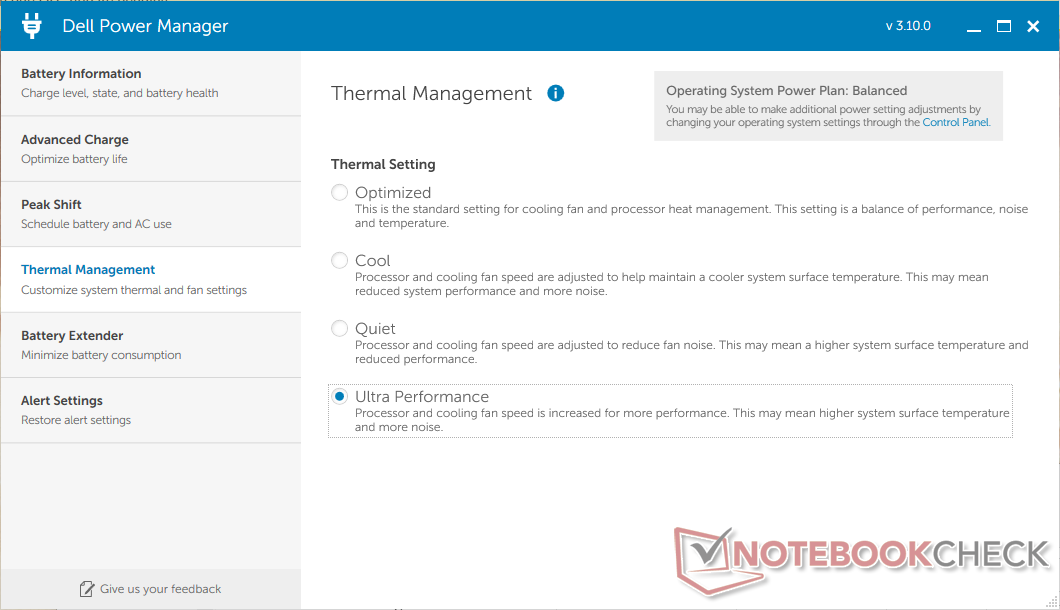
Nosso sistema foi ajustado para o modo 'Melhor Desempenho' do Windows e com o Dell Power Manager ajustado para Ultra Desempenho antes de executar quaisquer benchmarks abaixo para obter as melhores pontuações possíveis. Os usuários também devem se familiarizar com o software Dell Optimizer pré-instalado, que inclui configurações adicionais de áudio, rede e o sensor de proximidade para o login mãos-livres.
Processador
O desempenho da CPU de múltiplas roscas é um saco misto desde o Núcleo i7-1185G7 tem dois núcleos a menos do que nos do ano passado Núcleo i7-10810U para uma redução de aproximadamente 25 a 35 por cento. O delta é mais amplo do que o esperado uma vez que o i7-1185G7 em nosso Latitude 9520 2 em 1 está funcionando pelo menos 15 a 20 por cento mais lentamente do que a maioria dos outros laptops que usam exatamente a mesma CPU. A CPU Core i7-1185G7 na MSI Stealth 15MPor exemplo, pode oferecer até 50% mais rápido desempenho multi-linhas do que nossa Dell
Felizmente, o desempenho com uma única linha está onde deve ser relativo ao Core i7-1185G7 médio. Os usuários podem esperar um desempenho cerca de 30% mais rápido do que o Core i7-10810U a este respeito.
Cinebench R15 Multi Loop
Cinebench R23: Multi Core | Single Core
Cinebench R20: CPU (Multi Core) | CPU (Single Core)
Cinebench R15: CPU Multi 64Bit | CPU Single 64Bit
Blender: v2.79 BMW27 CPU
7-Zip 18.03: 7z b 4 | 7z b 4 -mmt1
Geekbench 5.5: Multi-Core | Single-Core
HWBOT x265 Benchmark v2.2: 4k Preset
LibreOffice : 20 Documents To PDF
R Benchmark 2.5: Overall mean
* ... menor é melhor
AIDA64: FP32 Ray-Trace | FPU Julia | CPU SHA3 | CPU Queen | FPU SinJulia | FPU Mandel | CPU AES | CPU ZLib | FP64 Ray-Trace | CPU PhotoWorxx
| Performance rating | |
| Microsoft Surface Laptop 4 15 AMD TFF_00028 | |
| Lenovo ThinkPad L15 G2 AMD | |
| MSI Summit B15 A11M | |
| Média Intel Core i7-1185G7 | |
| HP EliteBook 850 G8 3C7Z8EA | |
| Dell Latitude 15 9520 2-in-1 | |
| Dell Latitude 9510 2-in-1 | |
| AIDA64 / FP32 Ray-Trace | |
| Microsoft Surface Laptop 4 15 AMD TFF_00028 | |
| Lenovo ThinkPad L15 G2 AMD | |
| MSI Summit B15 A11M | |
| Média Intel Core i7-1185G7 (5621 - 7453, n=20) | |
| HP EliteBook 850 G8 3C7Z8EA | |
| Dell Latitude 15 9520 2-in-1 | |
| Dell Latitude 9510 2-in-1 | |
| AIDA64 / FPU Julia | |
| Microsoft Surface Laptop 4 15 AMD TFF_00028 | |
| Lenovo ThinkPad L15 G2 AMD | |
| Dell Latitude 9510 2-in-1 | |
| MSI Summit B15 A11M | |
| Média Intel Core i7-1185G7 (23248 - 32614, n=20) | |
| HP EliteBook 850 G8 3C7Z8EA | |
| Dell Latitude 15 9520 2-in-1 | |
| AIDA64 / CPU SHA3 | |
| Microsoft Surface Laptop 4 15 AMD TFF_00028 | |
| MSI Summit B15 A11M | |
| Lenovo ThinkPad L15 G2 AMD | |
| Média Intel Core i7-1185G7 (1530 - 2209, n=20) | |
| HP EliteBook 850 G8 3C7Z8EA | |
| Dell Latitude 15 9520 2-in-1 | |
| Dell Latitude 9510 2-in-1 | |
| AIDA64 / CPU Queen | |
| Microsoft Surface Laptop 4 15 AMD TFF_00028 | |
| Lenovo ThinkPad L15 G2 AMD | |
| Dell Latitude 9510 2-in-1 | |
| HP EliteBook 850 G8 3C7Z8EA | |
| Média Intel Core i7-1185G7 (44677 - 52815, n=20) | |
| Dell Latitude 15 9520 2-in-1 | |
| MSI Summit B15 A11M | |
| AIDA64 / FPU SinJulia | |
| Microsoft Surface Laptop 4 15 AMD TFF_00028 | |
| Lenovo ThinkPad L15 G2 AMD | |
| Dell Latitude 9510 2-in-1 | |
| MSI Summit B15 A11M | |
| Média Intel Core i7-1185G7 (3870 - 5027, n=20) | |
| HP EliteBook 850 G8 3C7Z8EA | |
| Dell Latitude 15 9520 2-in-1 | |
| AIDA64 / FPU Mandel | |
| Microsoft Surface Laptop 4 15 AMD TFF_00028 | |
| Lenovo ThinkPad L15 G2 AMD | |
| MSI Summit B15 A11M | |
| Média Intel Core i7-1185G7 (14584 - 19594, n=20) | |
| HP EliteBook 850 G8 3C7Z8EA | |
| Dell Latitude 15 9520 2-in-1 | |
| Dell Latitude 9510 2-in-1 | |
| AIDA64 / CPU ZLib | |
| Microsoft Surface Laptop 4 15 AMD TFF_00028 | |
| Lenovo ThinkPad L15 G2 AMD | |
| Dell Latitude 9510 2-in-1 | |
| MSI Summit B15 A11M | |
| HP EliteBook 850 G8 3C7Z8EA | |
| Média Intel Core i7-1185G7 (258 - 412, n=22) | |
| Dell Latitude 15 9520 2-in-1 | |
| AIDA64 / FP64 Ray-Trace | |
| Microsoft Surface Laptop 4 15 AMD TFF_00028 | |
| Lenovo ThinkPad L15 G2 AMD | |
| MSI Summit B15 A11M | |
| Média Intel Core i7-1185G7 (2821 - 4094, n=20) | |
| HP EliteBook 850 G8 3C7Z8EA | |
| Dell Latitude 15 9520 2-in-1 | |
| Dell Latitude 9510 2-in-1 | |
| AIDA64 / CPU PhotoWorxx | |
| Dell Latitude 15 9520 2-in-1 | |
| Média Intel Core i7-1185G7 (22349 - 43701, n=20) | |
| MSI Summit B15 A11M | |
| HP EliteBook 850 G8 3C7Z8EA | |
| Microsoft Surface Laptop 4 15 AMD TFF_00028 | |
| Dell Latitude 9510 2-in-1 | |
| Lenovo ThinkPad L15 G2 AMD | |
Desempenho do sistema
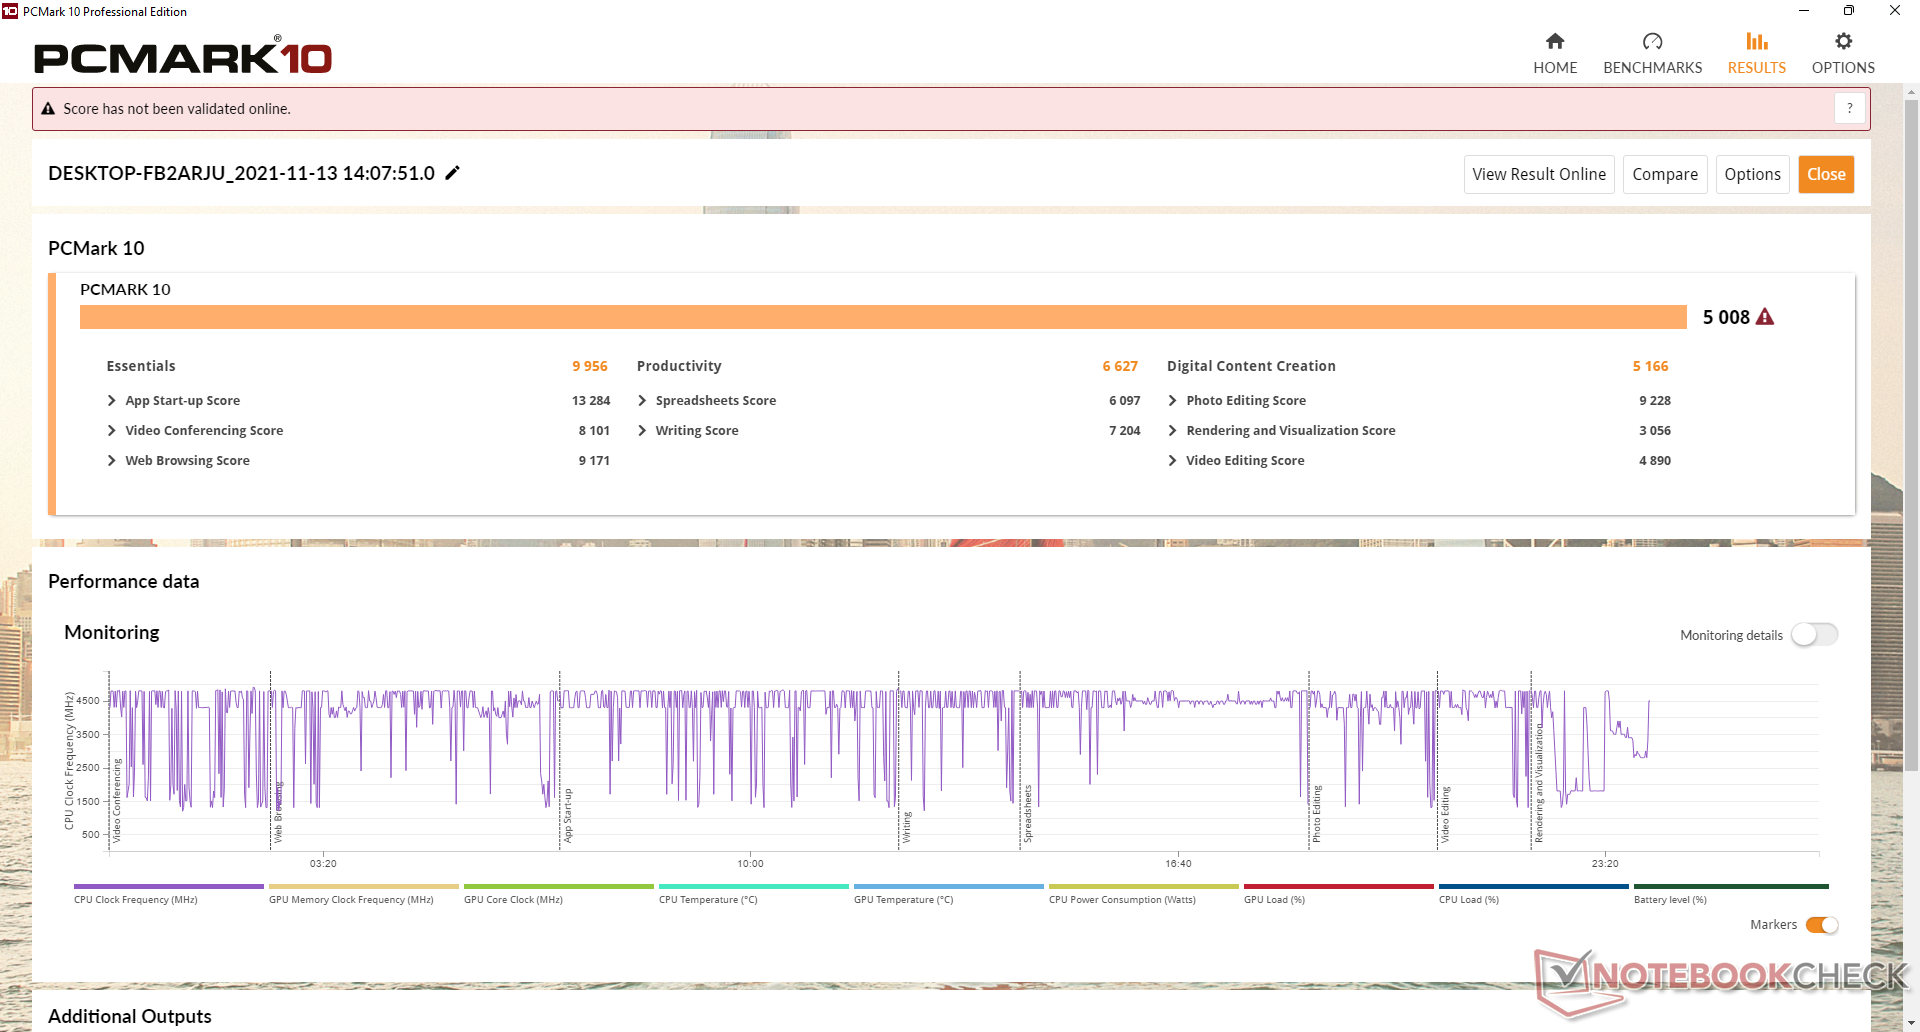
As pontuações PCMark 10 são geralmente mais altas do que as que registramos no site Latitude 9510 2 em 1, especialmente na Criação de Conteúdo Digital, onde os gráficos são mais importantes. O modelo mais antigo tem uma pontuação de Produtividade mais alta provavelmente devido a seu desempenho multi-tarefa superior.
| PCMark 10 / Score | |
| Lenovo ThinkPad L15 G2 AMD | |
| Microsoft Surface Laptop 4 15 AMD TFF_00028 | |
| Dell Latitude 15 9520 2-in-1 | |
| Média Intel Core i7-1185G7, Intel Iris Xe Graphics G7 96EUs (4746 - 5561, n=20) | |
| HP EliteBook 850 G8 3C7Z8EA | |
| MSI Summit B15 A11M | |
| Dell Latitude 9510 2-in-1 | |
| PCMark 10 / Essentials | |
| Lenovo ThinkPad L15 G2 AMD | |
| Dell Latitude 15 9520 2-in-1 | |
| Média Intel Core i7-1185G7, Intel Iris Xe Graphics G7 96EUs (8279 - 10664, n=20) | |
| Dell Latitude 9510 2-in-1 | |
| MSI Summit B15 A11M | |
| HP EliteBook 850 G8 3C7Z8EA | |
| Microsoft Surface Laptop 4 15 AMD TFF_00028 | |
| PCMark 10 / Productivity | |
| Lenovo ThinkPad L15 G2 AMD | |
| Microsoft Surface Laptop 4 15 AMD TFF_00028 | |
| Dell Latitude 9510 2-in-1 | |
| HP EliteBook 850 G8 3C7Z8EA | |
| Média Intel Core i7-1185G7, Intel Iris Xe Graphics G7 96EUs (5799 - 8770, n=20) | |
| Dell Latitude 15 9520 2-in-1 | |
| MSI Summit B15 A11M | |
| PCMark 10 / Digital Content Creation | |
| Microsoft Surface Laptop 4 15 AMD TFF_00028 | |
| Dell Latitude 15 9520 2-in-1 | |
| Média Intel Core i7-1185G7, Intel Iris Xe Graphics G7 96EUs (4424 - 5684, n=20) | |
| HP EliteBook 850 G8 3C7Z8EA | |
| Lenovo ThinkPad L15 G2 AMD | |
| MSI Summit B15 A11M | |
| Dell Latitude 9510 2-in-1 | |
| PCMark 10 Score | 5008 pontos | |
Ajuda | ||
| AIDA64 / Memory Copy | |
| Dell Latitude 15 9520 2-in-1 | |
| Média Intel Core i7-1185G7 (36515 - 68450, n=20) | |
| HP EliteBook 850 G8 3C7Z8EA | |
| Microsoft Surface Laptop 4 15 AMD TFF_00028 | |
| MSI Summit B15 A11M | |
| Dell Latitude 9510 2-in-1 | |
| Lenovo ThinkPad L15 G2 AMD | |
| AIDA64 / Memory Read | |
| Dell Latitude 15 9520 2-in-1 | |
| Média Intel Core i7-1185G7 (38394 - 64291, n=20) | |
| HP EliteBook 850 G8 3C7Z8EA | |
| Microsoft Surface Laptop 4 15 AMD TFF_00028 | |
| MSI Summit B15 A11M | |
| Dell Latitude 9510 2-in-1 | |
| Lenovo ThinkPad L15 G2 AMD | |
| AIDA64 / Memory Write | |
| Dell Latitude 15 9520 2-in-1 | |
| Média Intel Core i7-1185G7 (37684 - 66873, n=20) | |
| HP EliteBook 850 G8 3C7Z8EA | |
| MSI Summit B15 A11M | |
| Microsoft Surface Laptop 4 15 AMD TFF_00028 | |
| Dell Latitude 9510 2-in-1 | |
| Lenovo ThinkPad L15 G2 AMD | |
| AIDA64 / Memory Latency | |
| Microsoft Surface Laptop 4 15 AMD TFF_00028 | |
| Dell Latitude 15 9520 2-in-1 | |
| Dell Latitude 9510 2-in-1 | |
| Lenovo ThinkPad L15 G2 AMD | |
| Média Intel Core i7-1185G7 (78.3 - 117, n=22) | |
| MSI Summit B15 A11M | |
| HP EliteBook 850 G8 3C7Z8EA | |
* ... menor é melhor
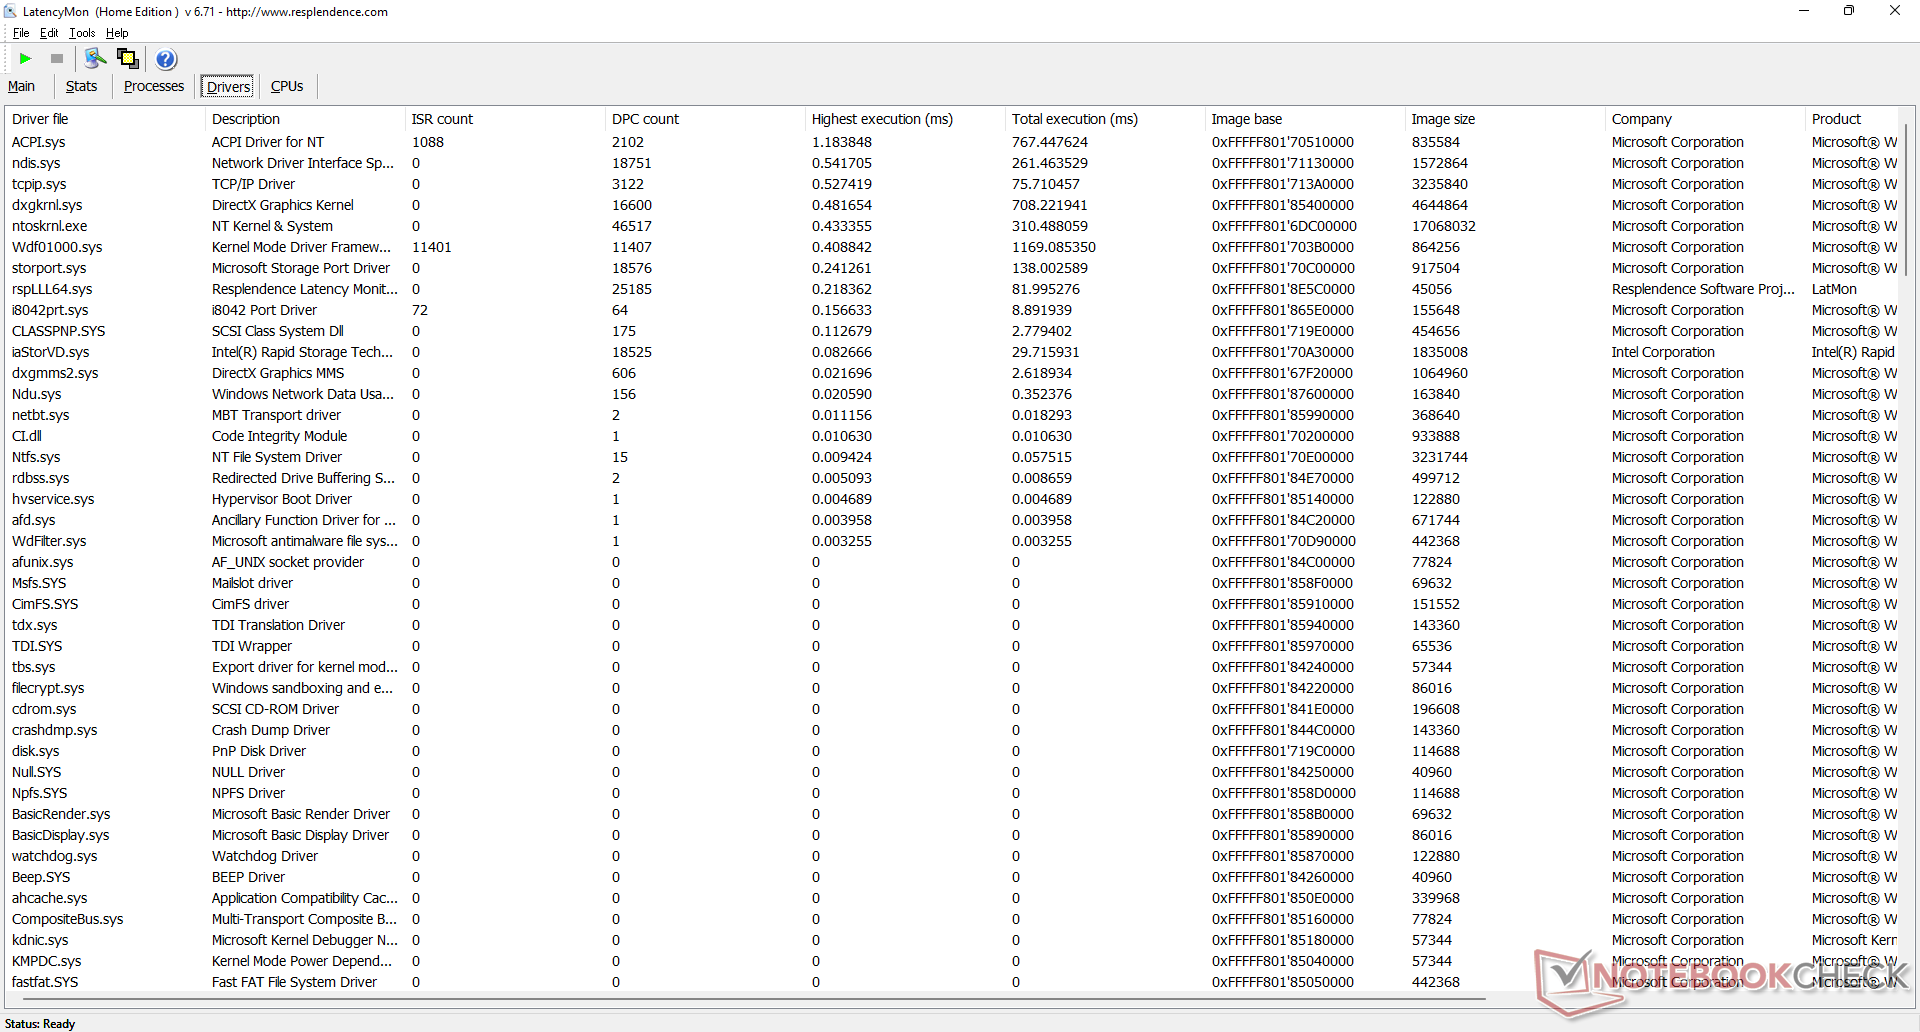
Latência do DPC
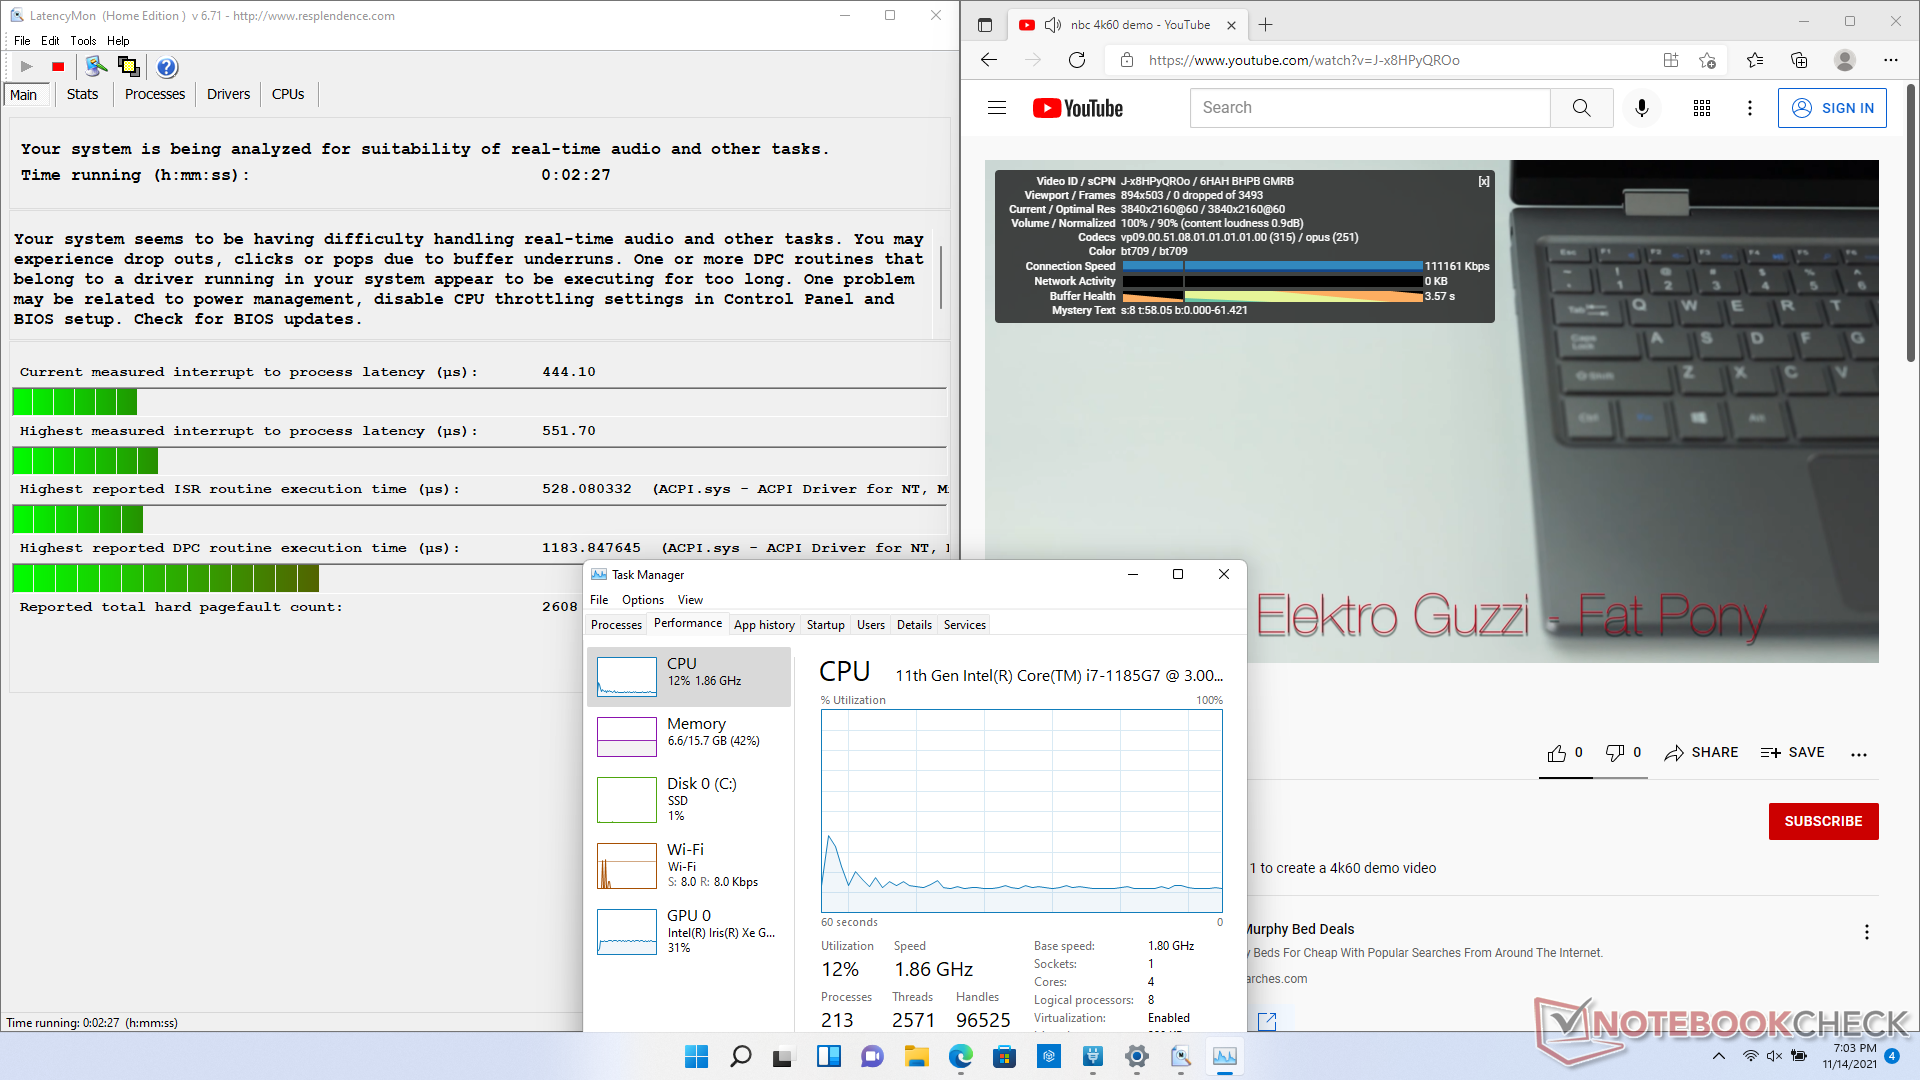
LatencyMon mostra pequenos problemas de latência DPC relacionados ao ACPI.sys ao abrir várias abas do navegador em nossa página inicial. No entanto, ainda é uma melhoria em comparação com o que observamos no modelo do ano passado
A reprodução de vídeo de 4K a 60 FPS continua perfeita, sem queda de quadros e com uma utilização mais eficiente da GPU do que com o UHD Graphics 620.
| DPC Latencies / LatencyMon - interrupt to process latency (max), Web, Youtube, Prime95 | |
| Dell Latitude 9510 2-in-1 | |
| Lenovo ThinkPad L15 G2 AMD | |
| HP EliteBook 850 G8 3C7Z8EA | |
| MSI Summit B15 A11M | |
| Microsoft Surface Laptop 4 15 AMD TFF_00028 | |
| Dell Latitude 15 9520 2-in-1 | |
* ... menor é melhor
Dispositivos de armazenamento
Nossa unidade de teste utiliza o mesmo PCIe3 x4 Toshiba KBG40ZNS512G NVMe M.2 2230 SSD como encontrado no site Latitude 9510 2 em 1. Atualmente a Dell não oferece opções PCIe4, embora o chipset Intel teoricamente deva ser capaz de suportar tais SSDs. A falta de um espalhador de calor, entretanto, significará que qualquer SSD PCIe4 provavelmente aceleraria após um curto período, de qualquer forma.

* ... menor é melhor
Disk Throttling: DiskSpd Read Loop, Queue Depth 8
Desempenho da GPU
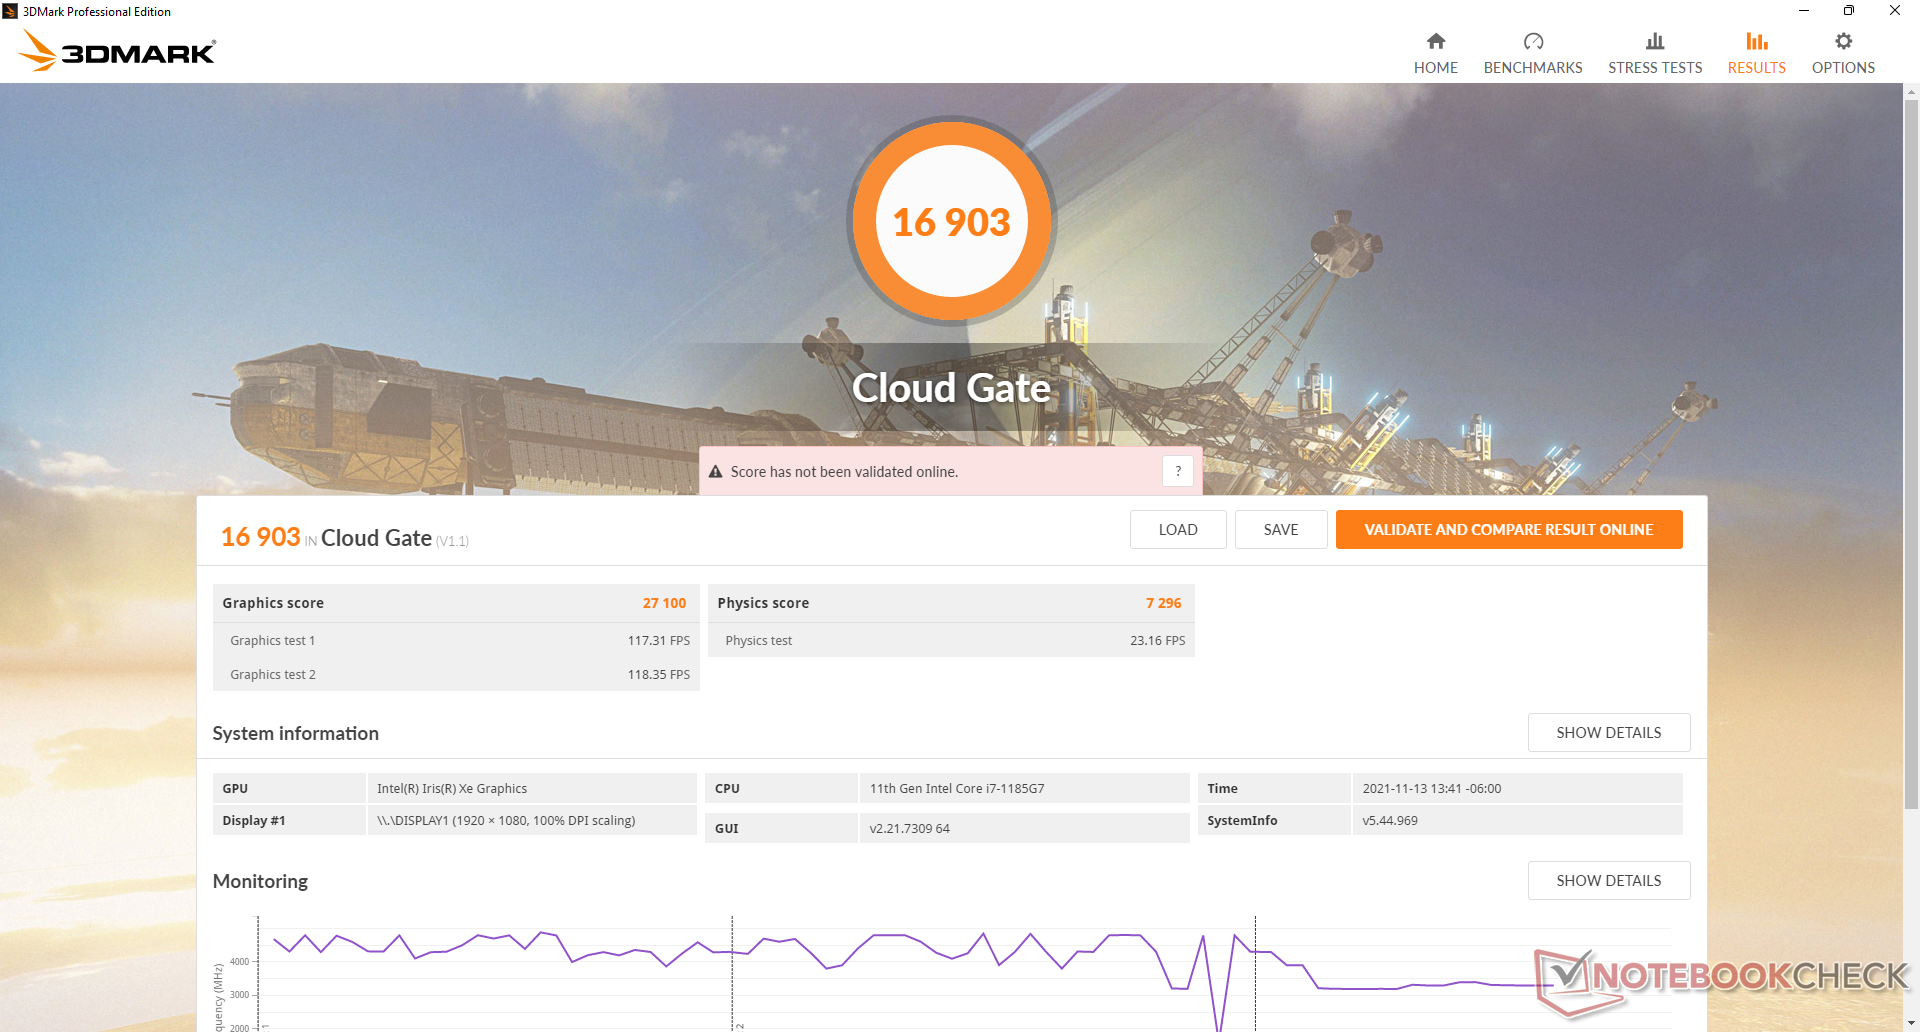
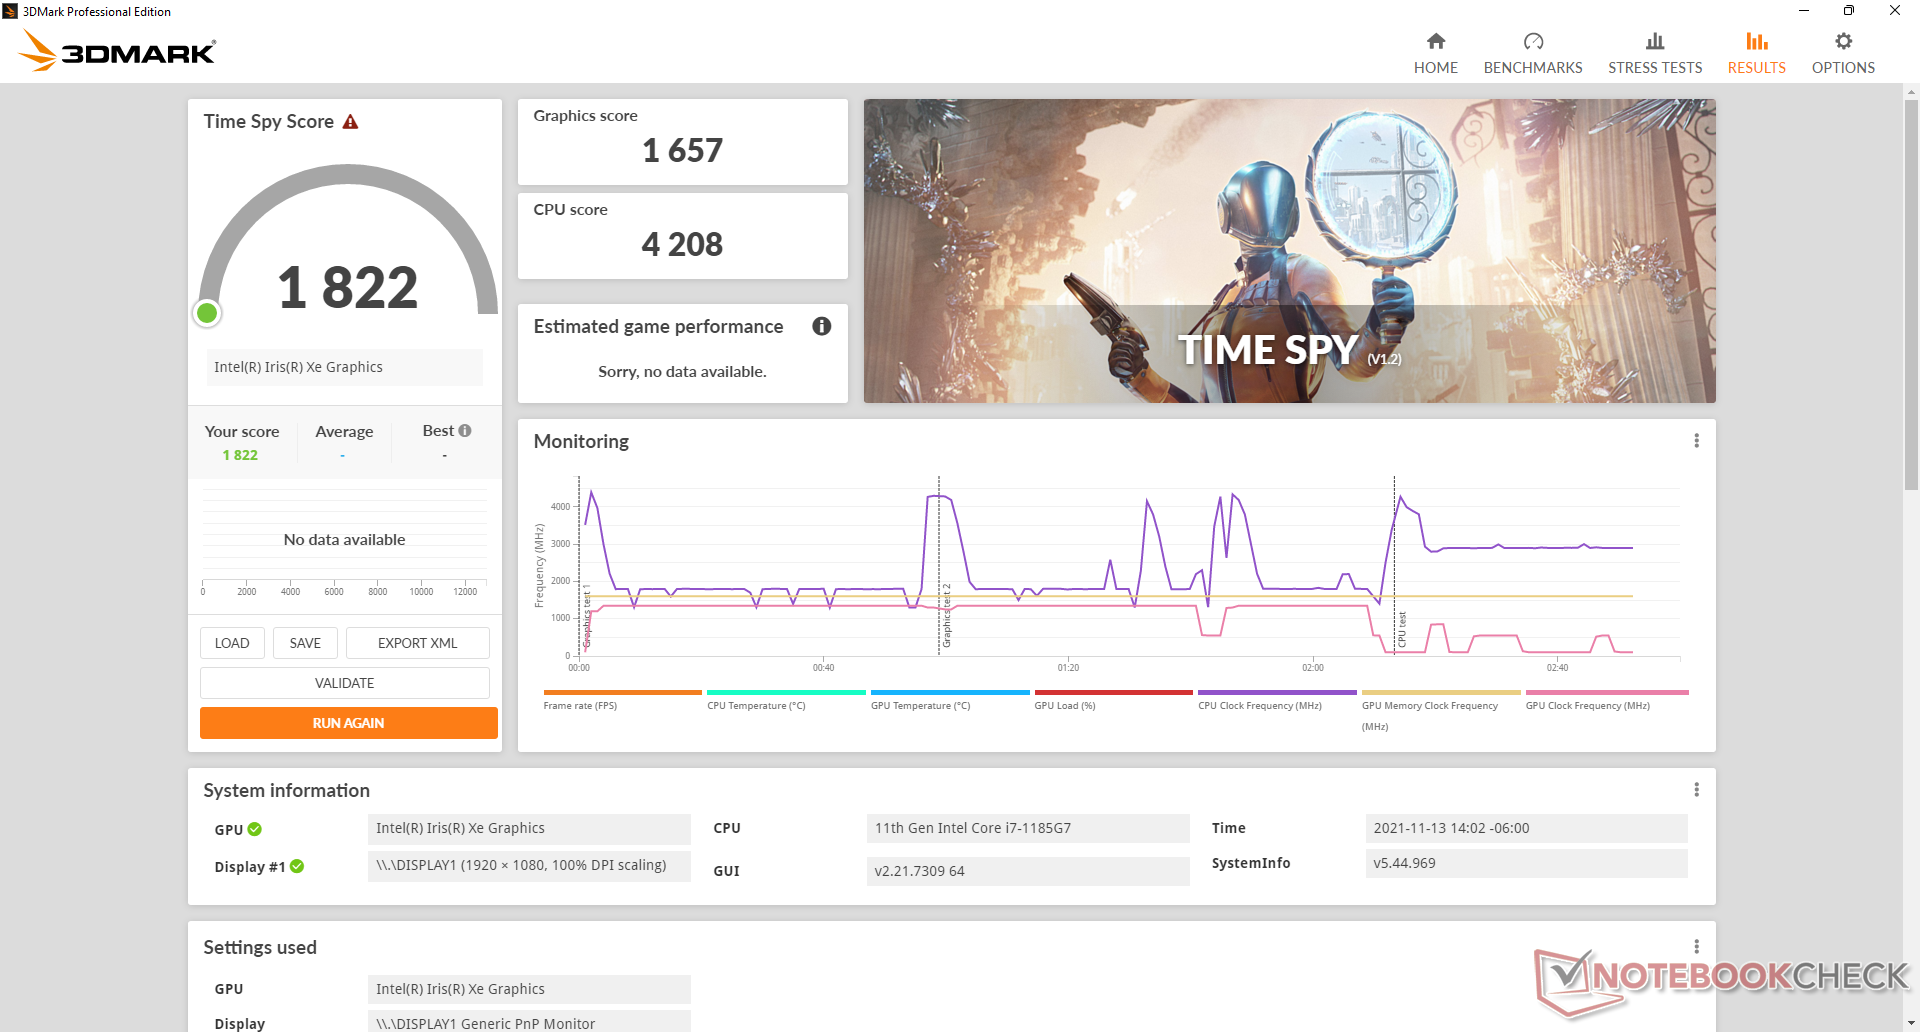
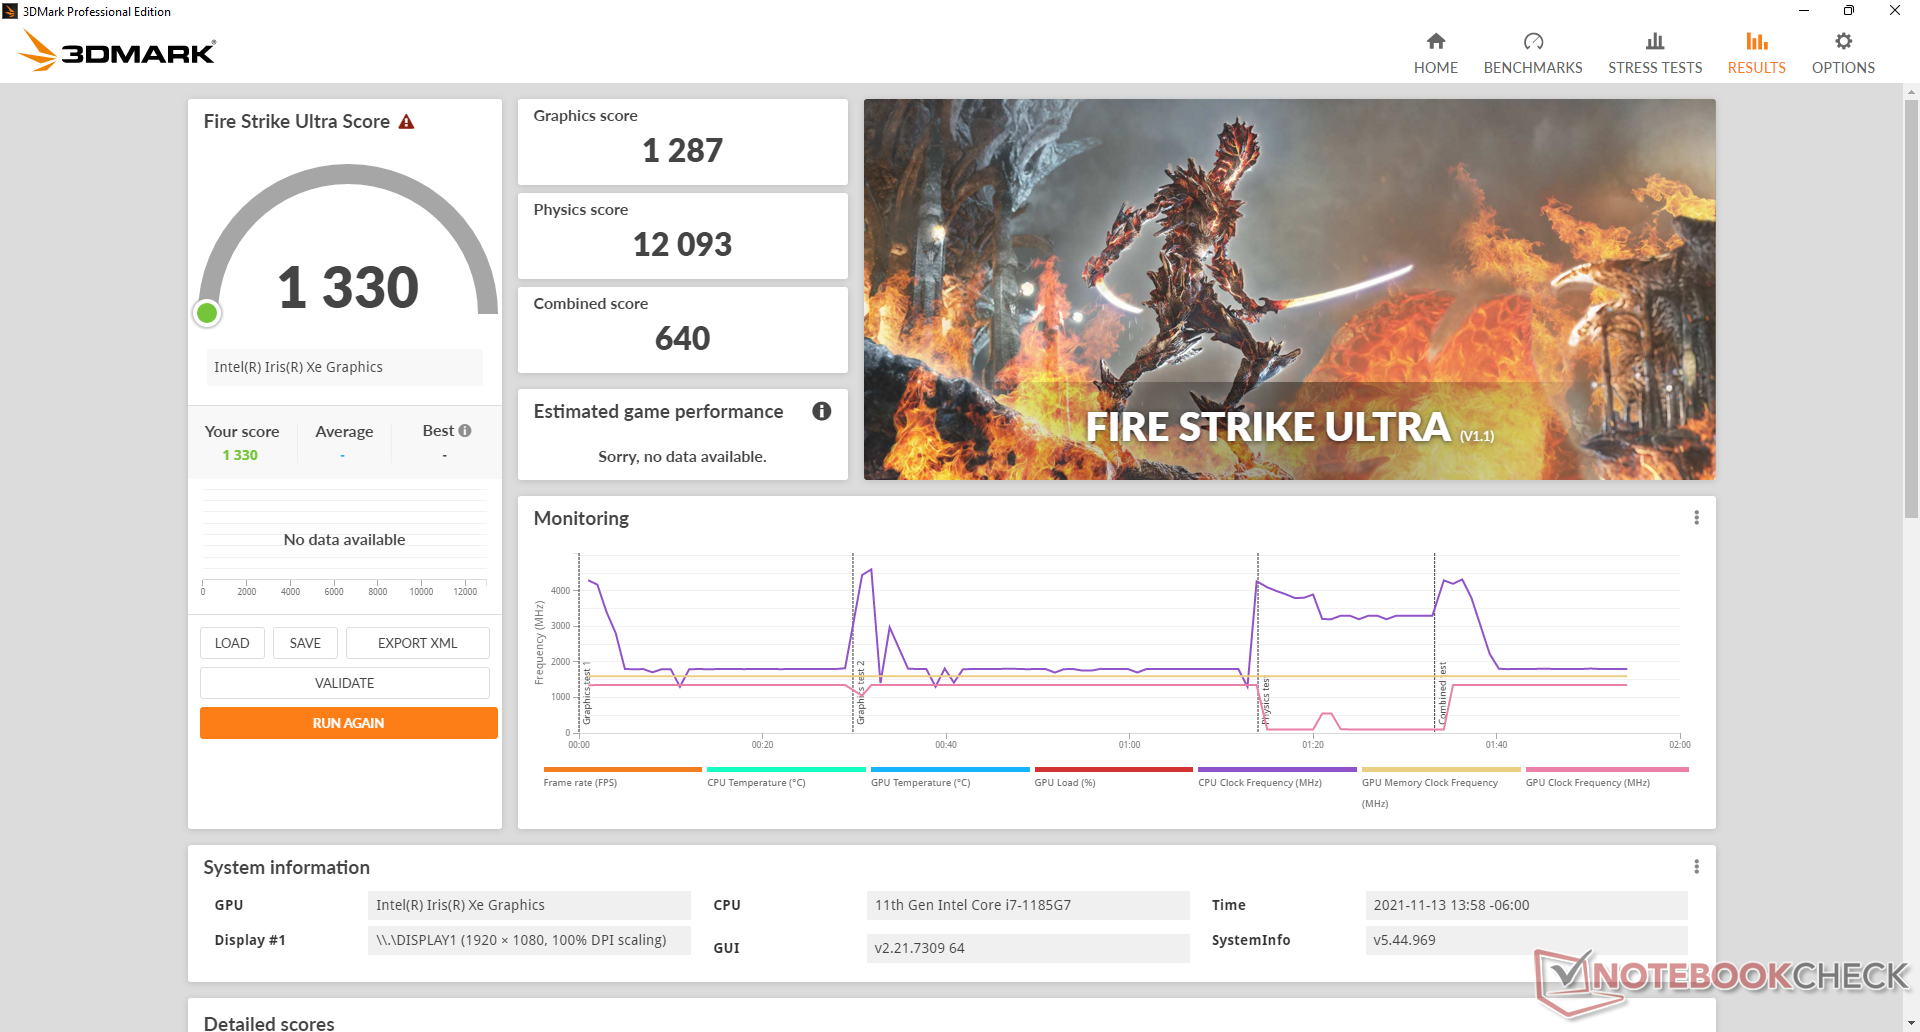
3DMark mostram as pontuações Iris Xe 96 EUs em nosso Latitude 9520 2 em 1 com bom desempenho em relação a outros laptops Iris Xe em nosso banco de dados. O diabo está nos detalhes, no entanto, pois o desempenho dos jogos no mundo real é ruim devido às taxas de quadros excepcionalmente amplas e flutuantes. Por exemplo, as taxas de quadros saltariam constantemente entre 40 FPS e 90 FPS quando simplesmente ociosos Witcher 3 em seus ajustes mais baixos, enquanto o Iris Xe-powered Cúpula MSI B15 funcionaria de forma muito mais estável sem nenhuma das quedas bruscas do FPS. Assim, enquanto nosso Latitude 9520 2 em 1 Iris Xe é indubitavelmente mais rápido do que o UHD Graphics 620 no ano passado Latitude 9510 2 em 1, poderia ter sido definitivamente mais estável em termos de desempenho ao longo do tempo.
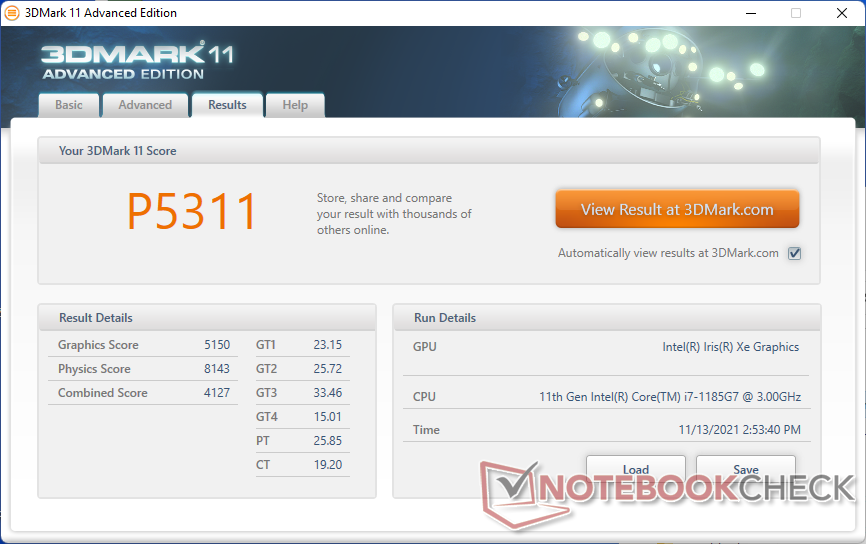
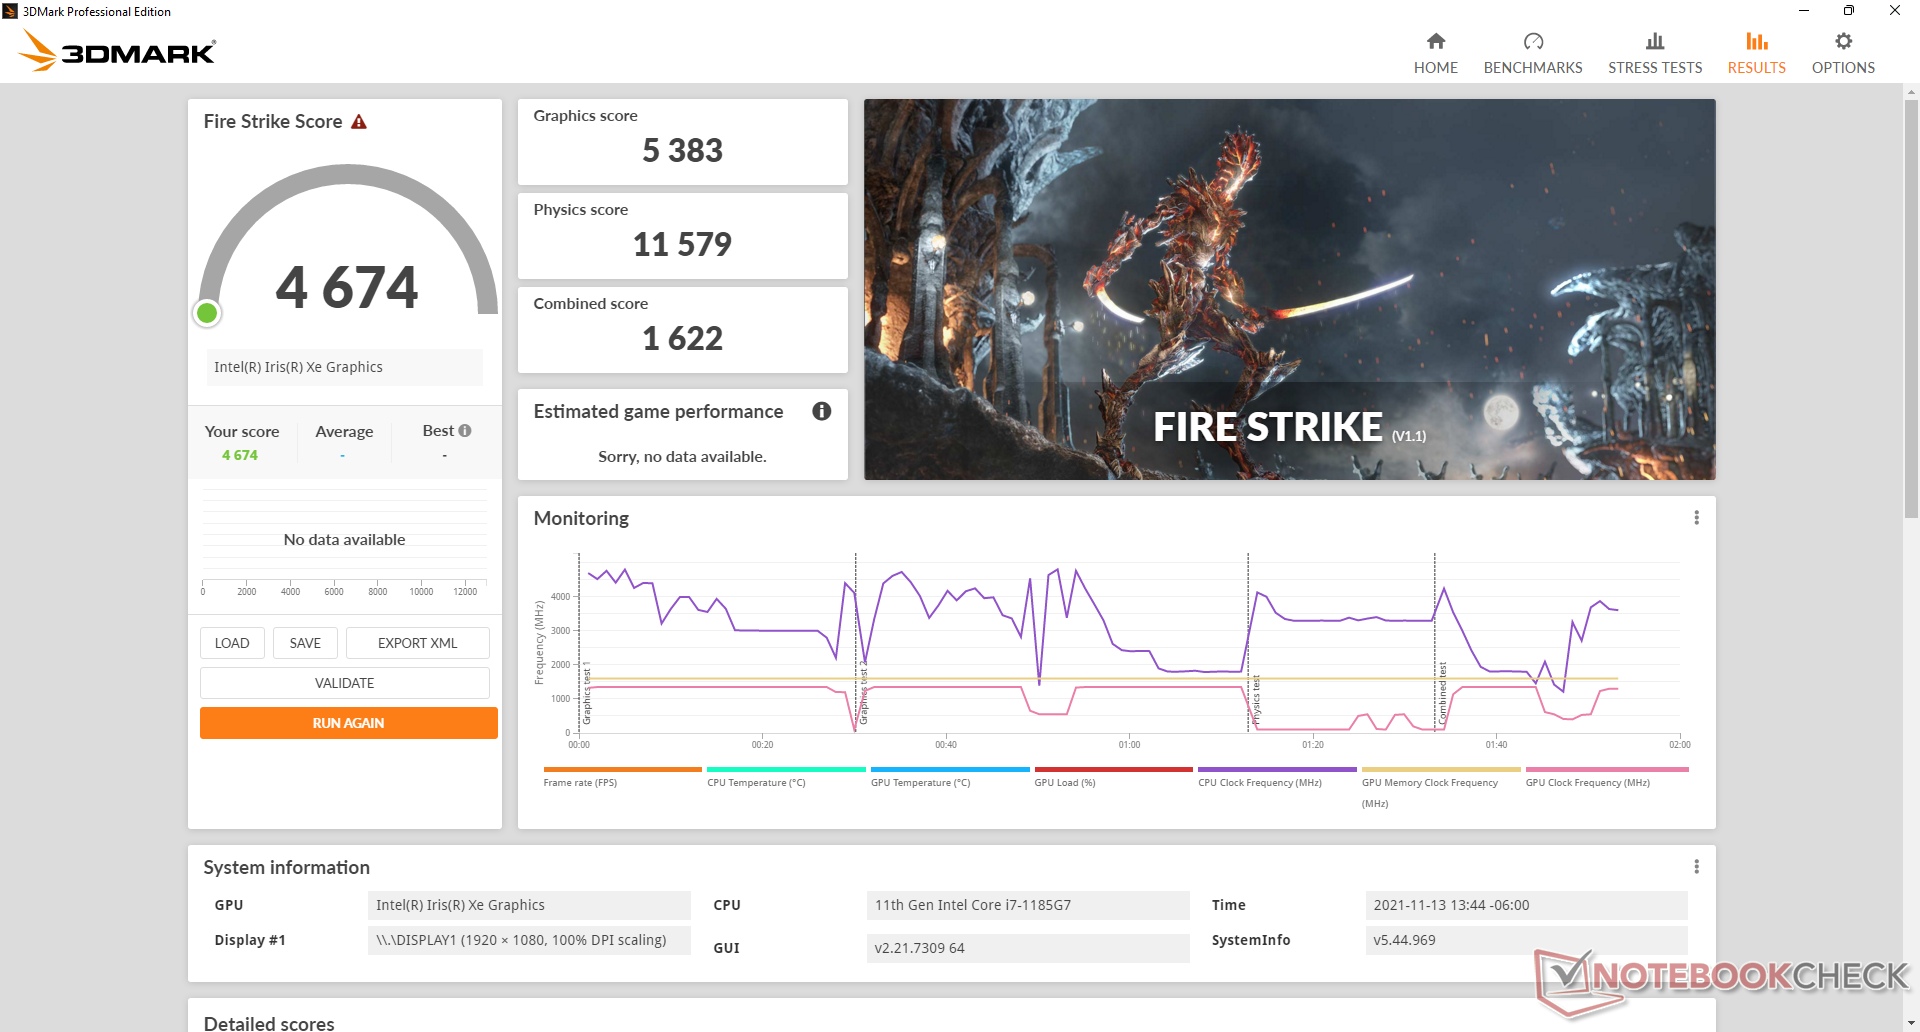
| 3DMark 11 Performance | 5311 pontos | |
| 3DMark Cloud Gate Standard Score | 16903 pontos | |
| 3DMark Fire Strike Score | 4674 pontos | |
| 3DMark Time Spy Score | 1822 pontos | |
Ajuda | ||
Witcher 3 FPS Chart
| baixo | média | alto | ultra | |
|---|---|---|---|---|
| GTA V (2015) | 81 | 70.5 | 27.2 | 10.6 |
| The Witcher 3 (2015) | 86.8 | 59.4 | 33.5 | 14.3 |
| Dota 2 Reborn (2015) | 103 | 61.7 | 39.8 | 39.8 |
| Final Fantasy XV Benchmark (2018) | 35 | 20 | 14.6 | |
| X-Plane 11.11 (2018) | 36 | 34.4 | 27.5 | |
| Strange Brigade (2018) | 82.8 | 32.7 | 26.3 | 23.2 |
Emissões
Ruído do sistema
O ventilador interno é silencioso a 24,1 dN(A) quando ocioso ou navegando na web no modo Equilibrado ou Otimizado ou inferior. Ele pode ocasionalmente pular para 25,8 dB(A), mas isto será imperceptível na maioria dos ambientes. Os usuários podem alcançar o ruído máximo do ventilador de pouco menos de 40 dB(A) quando executam cargas mais altas como jogos.
O ruído do ventilador pulsará com mais freqüência se estiver configurado para o modo High Performance durante a navegação ou o fluxo de vídeo. Portanto, certifique-se de definir o perfil de potência adequadamente se o ruído do ventilador for uma preocupação.
Barulho
| Ocioso |
| 24.1 / 24.1 / 25.8 dB |
| Carga |
| 34.2 / 39.6 dB |
 | ||
30 dB silencioso 40 dB(A) audível 50 dB(A) ruidosamente alto |
||
min: | ||
| Dell Latitude 15 9520 2-in-1 Iris Xe G7 96EUs, i7-1185G7, Toshiba KBG40ZNS512G NVMe | Dell Latitude 9510 2-in-1 UHD Graphics 620, i7-10810U, Toshiba KBG40ZNS512G NVMe | HP EliteBook 850 G8 3C7Z8EA Iris Xe G7 96EUs, i7-1165G7, Samsung PM981a MZVLB1T0HBLR | Lenovo ThinkPad L15 G2 AMD Vega 7, R5 5600U, SK Hynix HFS512 GDE9X081N | MSI Summit B15 A11M Iris Xe G7 96EUs, i7-1165G7, Kingston OM8PCP31024F | Microsoft Surface Laptop 4 15 AMD TFF_00028 Vega 8, R7 4980U, SK Hynix BC511 HFM512GDJTNI | |
|---|---|---|---|---|---|---|
| Noise | -7% | 0% | 6% | -1% | -2% | |
| desligado / ambiente * (dB) | 24 | 27.2 -13% | 26 -8% | 24.22 -1% | 25.2 -5% | 24.2 -1% |
| Idle Minimum * (dB) | 24.1 | 27.2 -13% | 26 -8% | 24.22 -0% | 26.4 -10% | 24.2 -0% |
| Idle Average * (dB) | 24.1 | 27.2 -13% | 26 -8% | 24.22 -0% | 26.4 -10% | 24.2 -0% |
| Idle Maximum * (dB) | 25.8 | 27.2 -5% | 26.2 -2% | 24.22 6% | 26.4 -2% | 24.2 6% |
| Load Average * (dB) | 34.2 | 33.4 2% | 29.5 14% | 25.84 24% | 26.8 22% | 39.9 -17% |
| Witcher 3 ultra * (dB) | 39.6 | 28 29% | 39.9 -1% | |||
| Load Maximum * (dB) | 39.6 | 39.5 -0% | 34 14% | 36.02 9% | 52.6 -33% | 39.9 -1% |
* ... menor é melhor
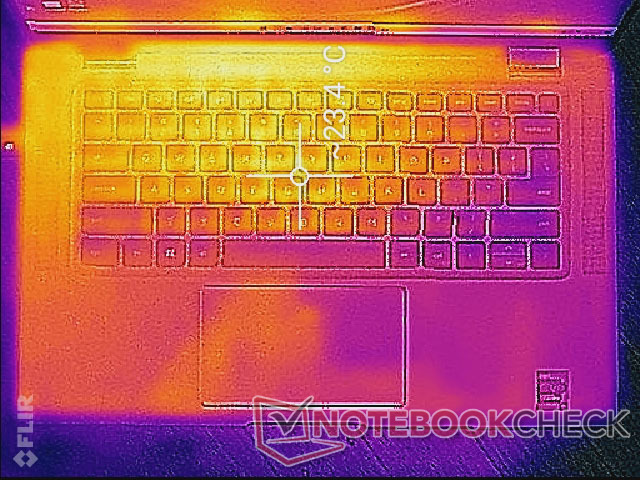
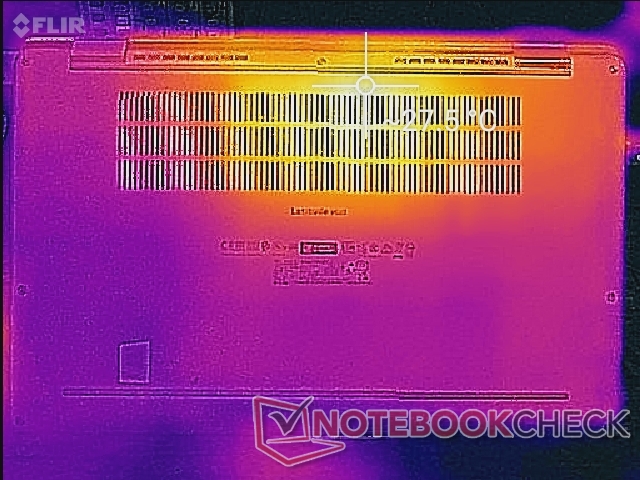
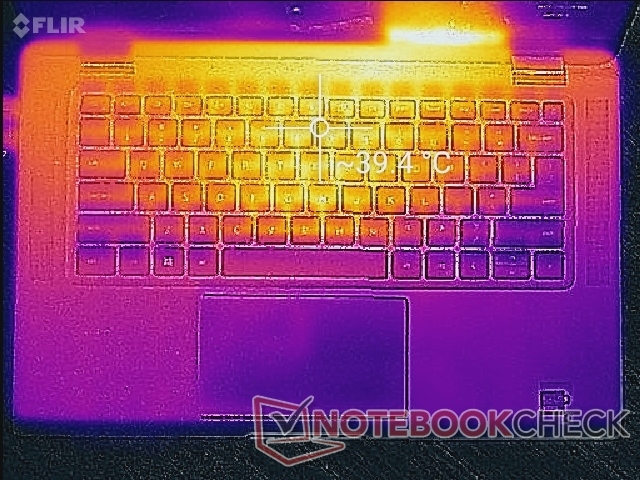
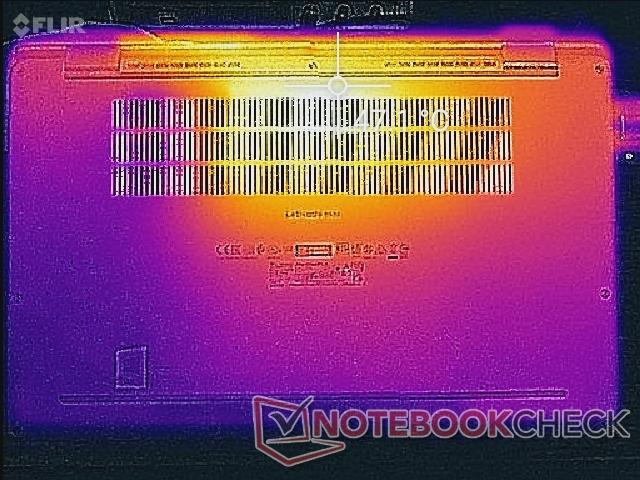
Temperatura
As temperaturas de superfície são similares às do Latitude 9510 2 em 1 quando a carga é baixa a média. No entanto, se a execução de cargas mais altas gosta de jogos, o ponto quente inferior do modelo Latitude 9520 2 em 1 pode estar alguns graus mais quente do que no modelo mais antigo.
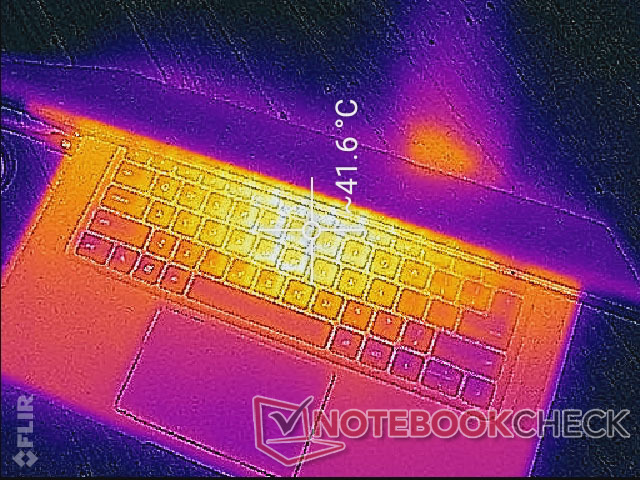
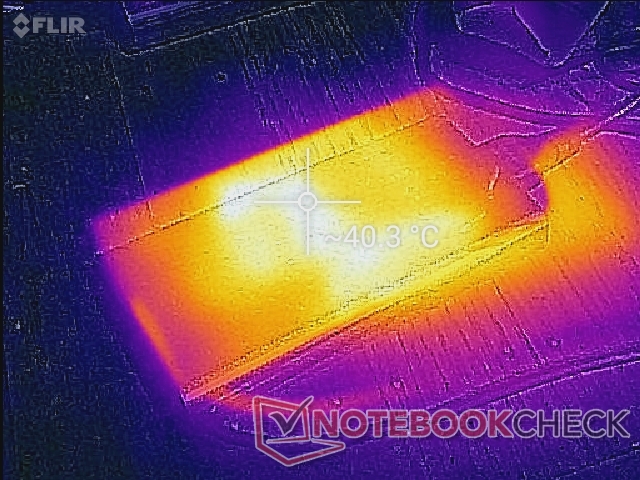
(±) A temperatura máxima no lado superior é 40 °C / 104 F, em comparação com a média de 34.3 °C / 94 F , variando de 21.2 a 62.5 °C para a classe Office.
(-) A parte inferior aquece até um máximo de 47.2 °C / 117 F, em comparação com a média de 36.8 °C / 98 F
(+) Em uso inativo, a temperatura média para o lado superior é 22.5 °C / 73 F, em comparação com a média do dispositivo de 29.5 °C / ### class_avg_f### F.
(+) Os apoios para as mãos e o touchpad são mais frios que a temperatura da pele, com um máximo de 28.6 °C / 83.5 F e, portanto, são frios ao toque.
(±) A temperatura média da área do apoio para as mãos de dispositivos semelhantes foi 27.5 °C / 81.5 F (-1.1 °C / -2 F).
| Dell Latitude 15 9520 2-in-1 Intel Core i7-1185G7, Intel Iris Xe Graphics G7 96EUs | Dell Latitude 9510 2-in-1 Intel Core i7-10810U, Intel UHD Graphics 620 | HP EliteBook 850 G8 3C7Z8EA Intel Core i7-1165G7, Intel Iris Xe Graphics G7 96EUs | Lenovo ThinkPad L15 G2 AMD AMD Ryzen 5 5600U, AMD Radeon RX Vega 7 | MSI Summit B15 A11M Intel Core i7-1165G7, Intel Iris Xe Graphics G7 96EUs | Microsoft Surface Laptop 4 15 AMD TFF_00028 AMD Ryzen 7 4980U, AMD Radeon RX Vega 8 (Ryzen 4000/5000) | |
|---|---|---|---|---|---|---|
| Heat | -9% | -3% | -8% | -8% | 4% | |
| Maximum Upper Side * (°C) | 40 | 42.8 -7% | 37.9 5% | 42.8 -7% | 42.8 -7% | 41.8 -5% |
| Maximum Bottom * (°C) | 47.2 | 41.8 11% | 39 17% | 46 3% | 52.2 -11% | 44.8 5% |
| Idle Upper Side * (°C) | 23.4 | 29.2 -25% | 31 -32% | 26.9 -15% | 26 -11% | 23 2% |
| Idle Bottom * (°C) | 27.4 | 31 -13% | 27.8 -1% | 31.1 -14% | 28.2 -3% | 23.6 14% |
* ... menor é melhor
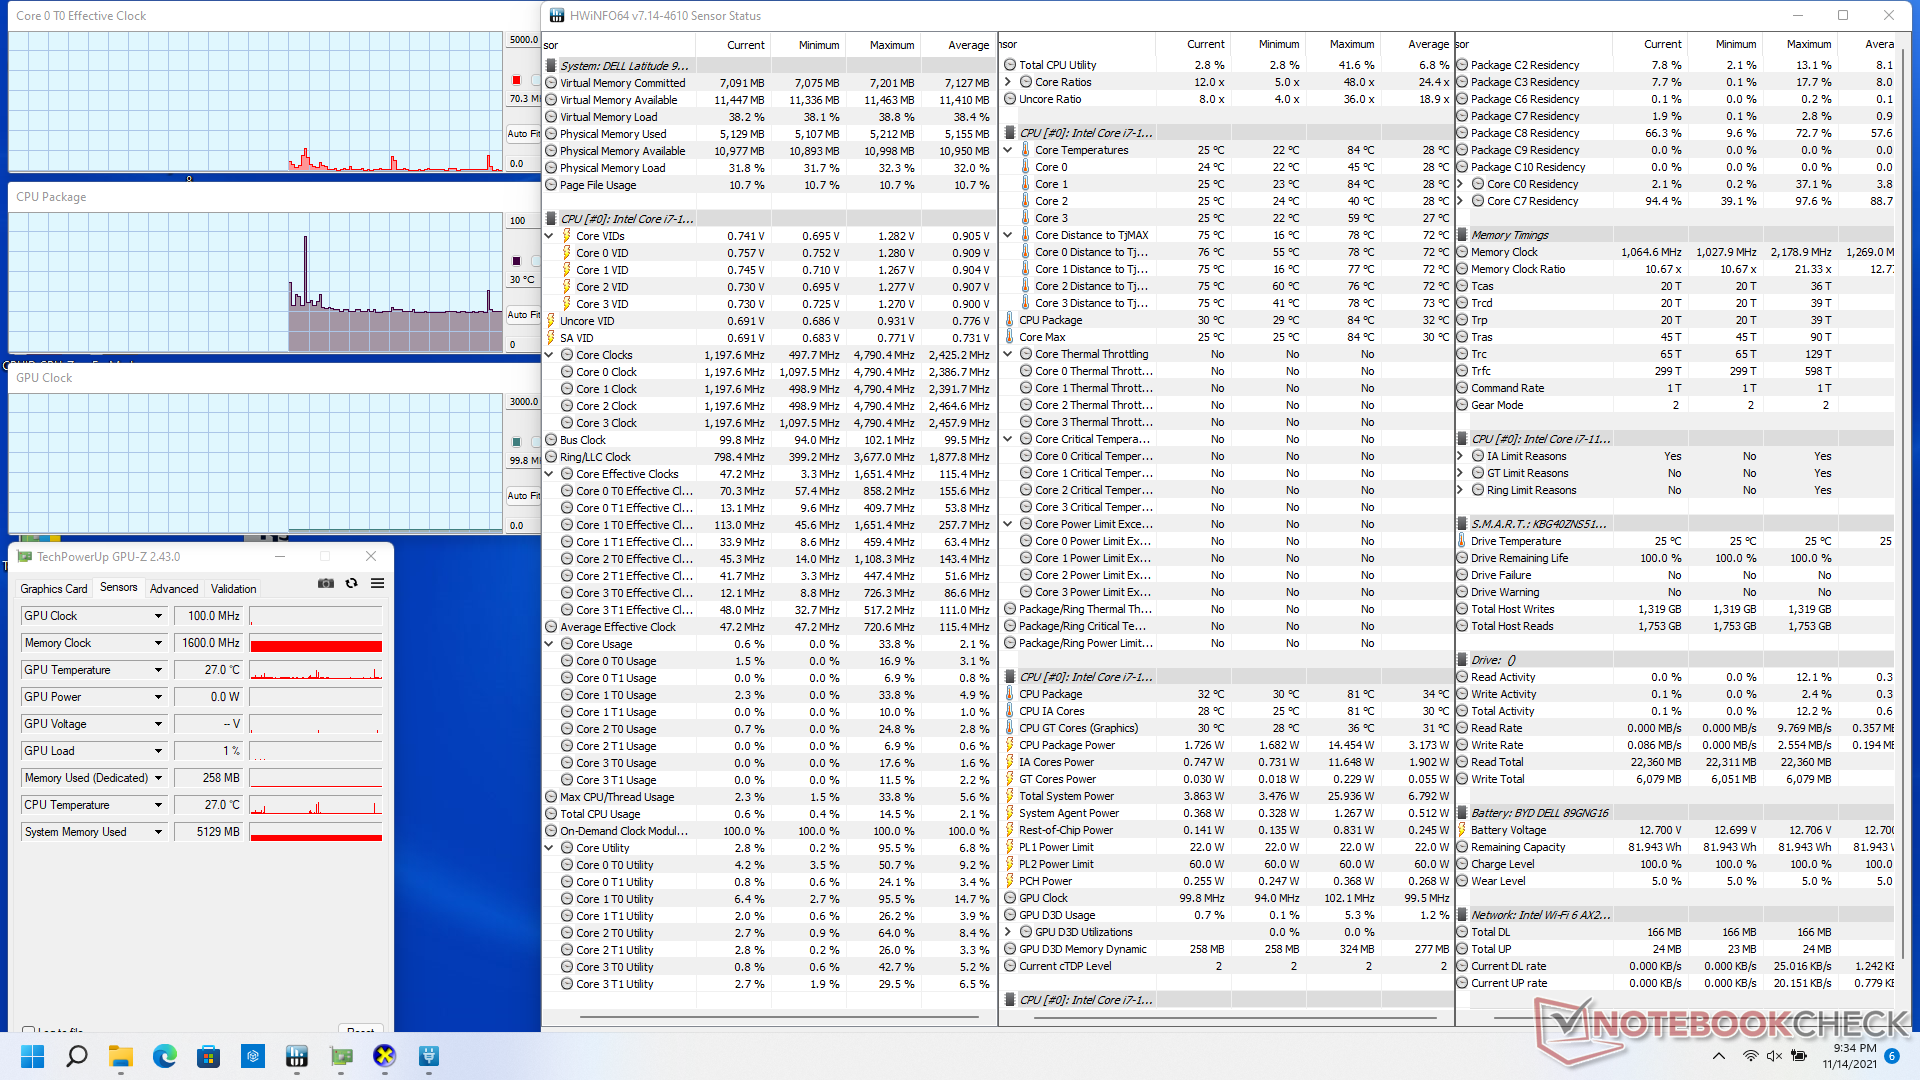
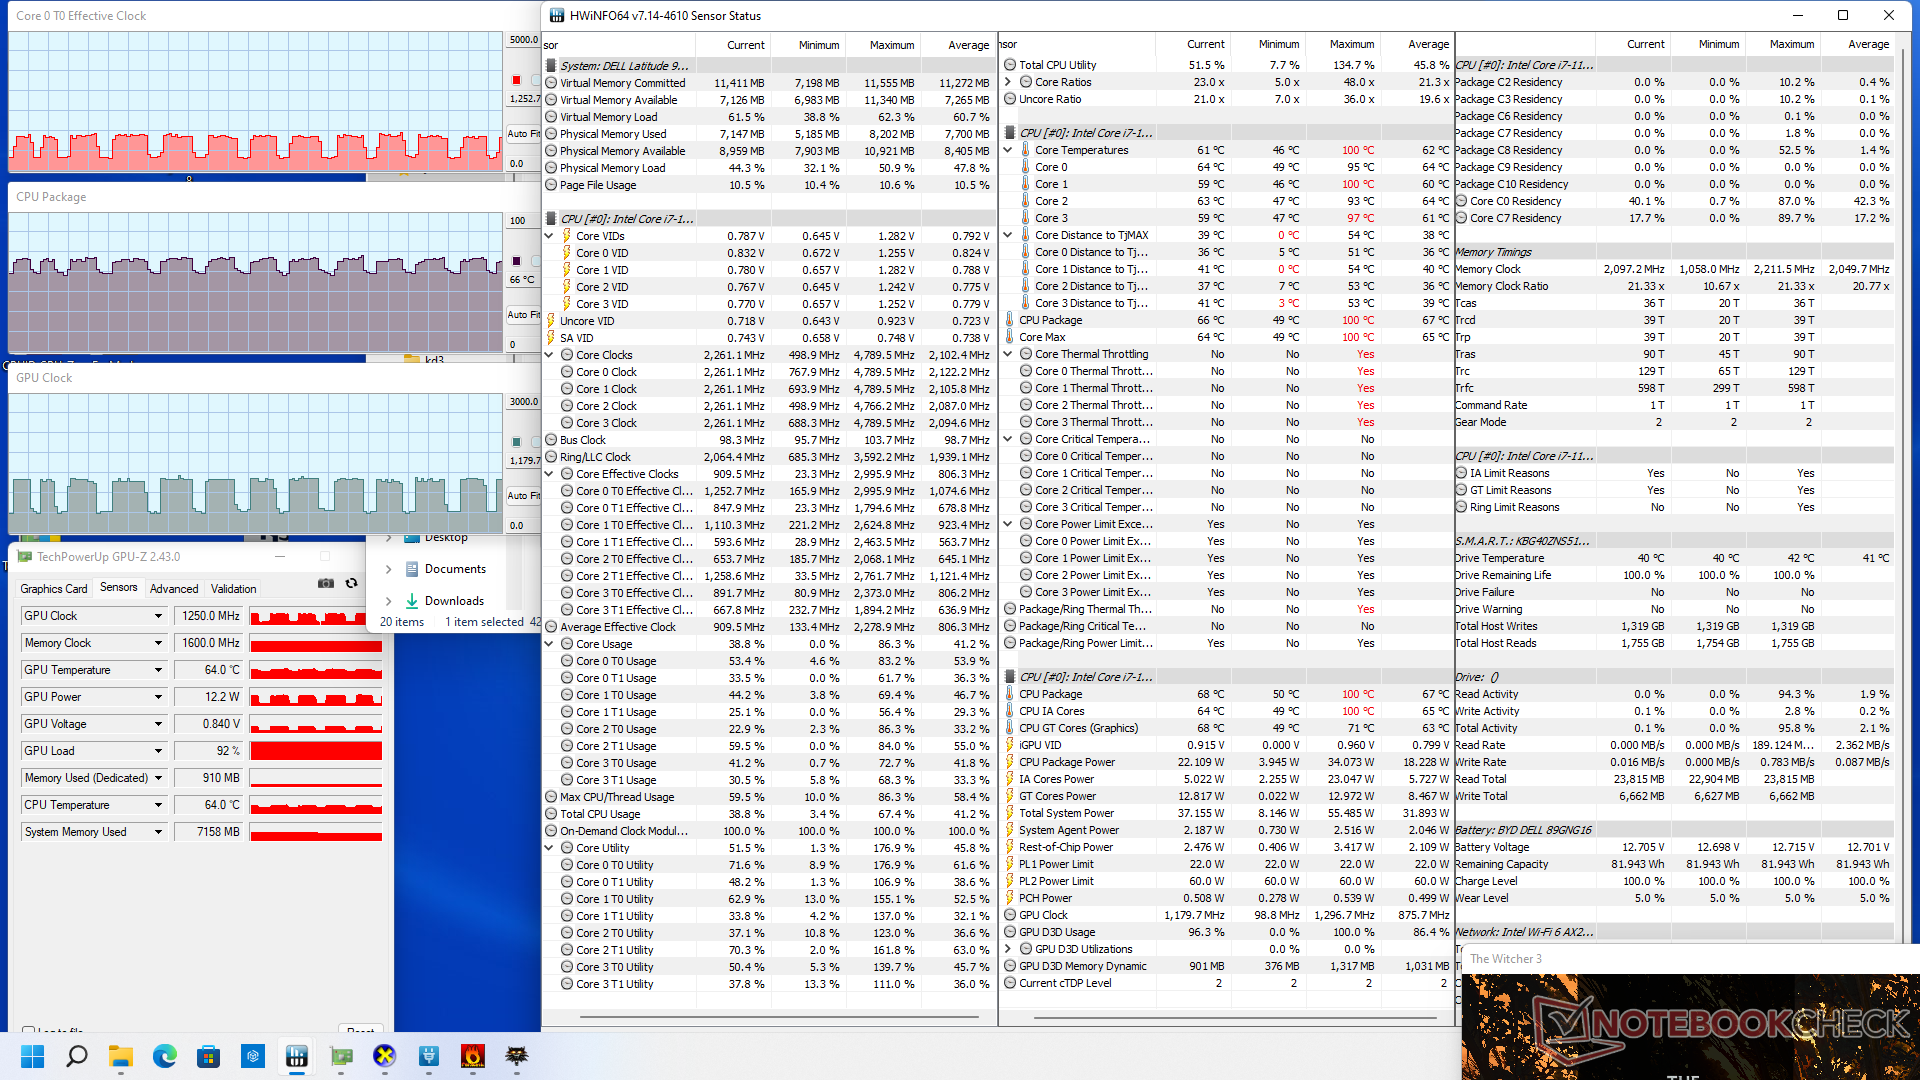
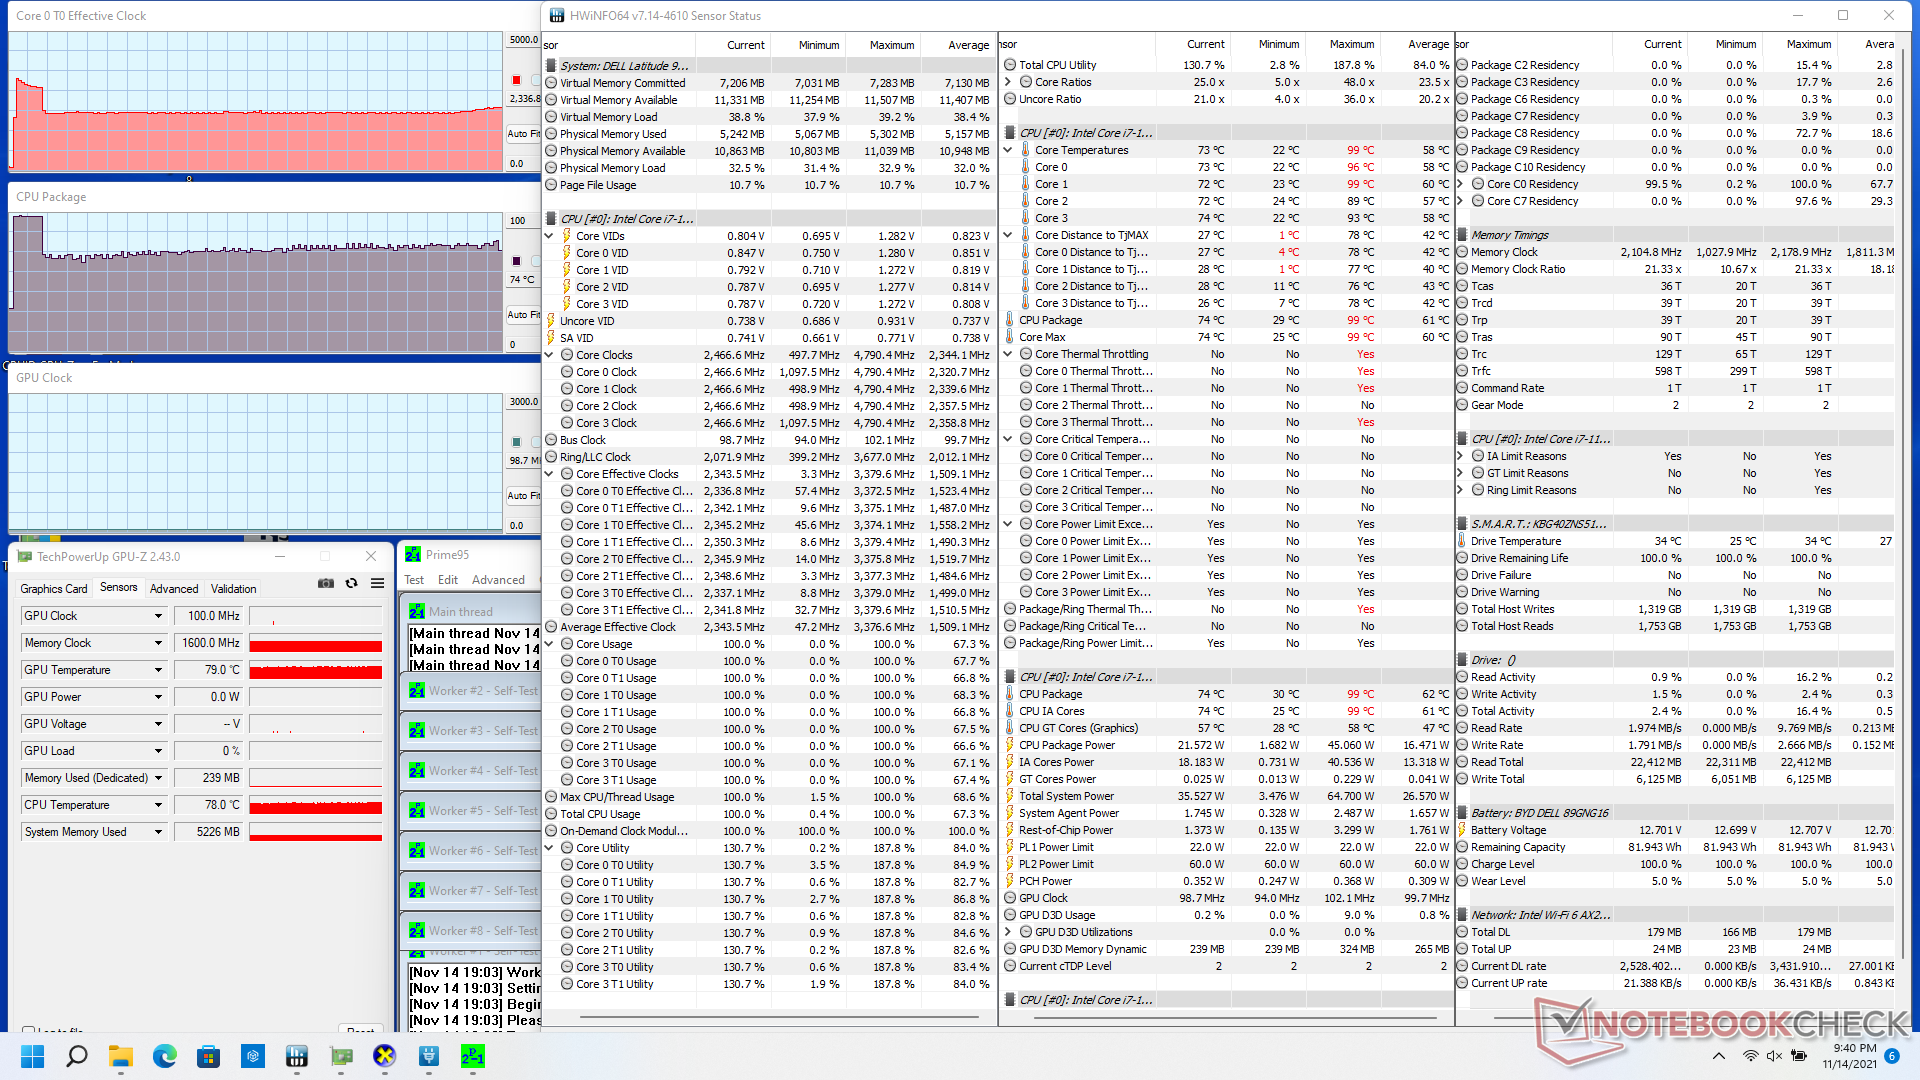
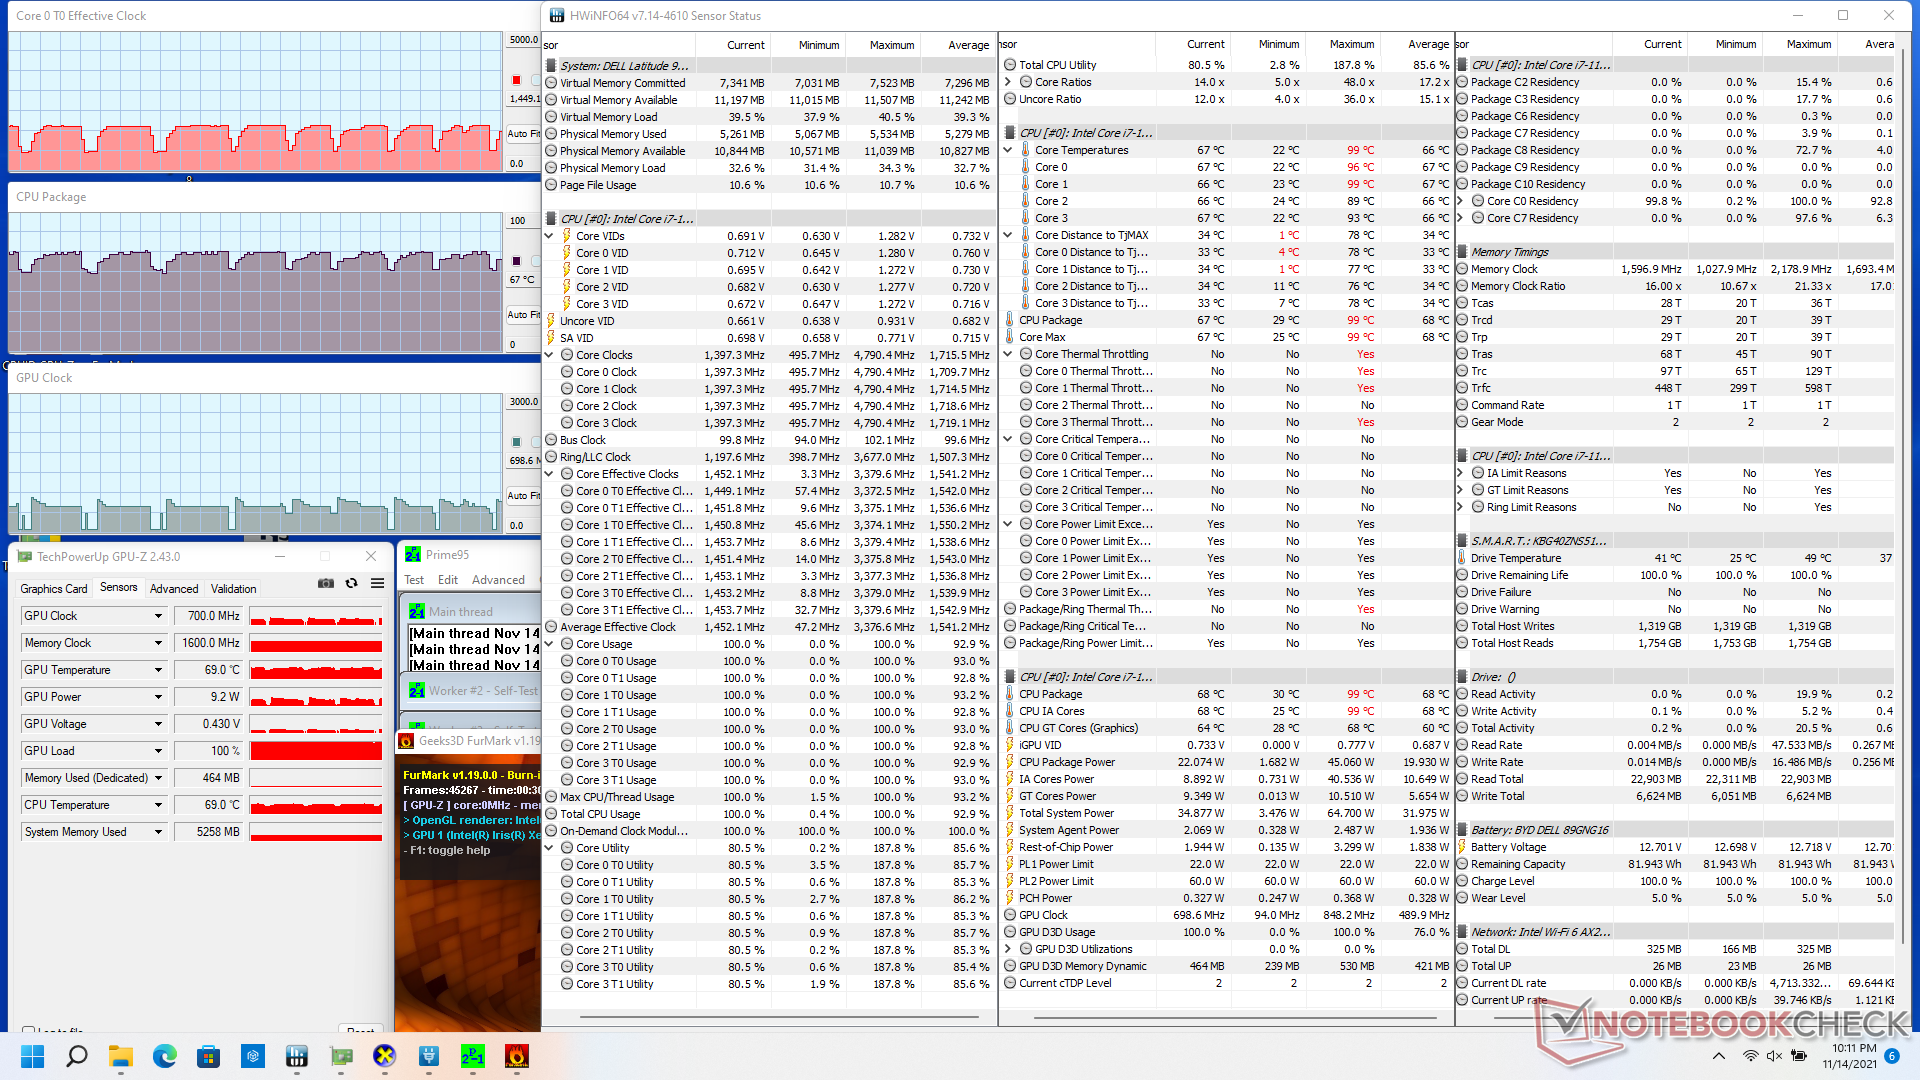
Teste de estresse
O desempenho instável quando em funcionamento Witcher 3 como mencionado acima pode ser atribuído às taxas de relógio instáveis quando a CPU e a GPU estão sob carga simultânea. As taxas de relógio da GPU oscilariam entre 500 MHz e 1200 MHz ao rodar o jogo, enquanto a maioria dos outros laptops Iris Xe permaneceriam estáveis a taxas de relógio fixas para um desempenho mais estável. O Cúpula MSI B15Por exemplo, teria uma taxa de relógio GPU estável de 1300 MHz quando sob as mesmas condições de jogo que nossa Dell. Este comportamento indesejável do GPU torna o Latitude 9520 2 em 1 uma escolha comparativamente mais pobre para tarefas gráficas intensivas.
Se enfatizando apenas a CPU via Prime95, as taxas de relógio aumentariam para 3,2 GHz durante apenas os primeiros segundos a uma temperatura central de 98 C. Depois disso, as taxas de relógio cairiam para a faixa baixa de 2 GHz a fim de manter uma temperatura central mais fria de cerca de 75 C. Os limites de potência PL1 e PL2 de curto prazo com múltiplas roscas se situam em 22 W e 45 W, respectivamente, quando o sistema está no modo de alto desempenho.
O funcionamento com energia de bateria não limitará o desempenho, pois as pontuações 3DMark 11 são quase idênticas entre a rede elétrica e as baterias.
| RelógioCPU (GHz) | RelógioGPU (MHz) | Temperaturamédiada CPU (°C) | |
| System Idle | -- | -- | 30 |
| Prime95 Stress | 2.2 | ---75 | |
| Prime95 + FurMark Stress | 0.6 - 1.7 | 100 - 800 | 58 - 73 |
| Witcher 3 Stress | 0.5 - 1.3 | 500 - 1200 | 57 - 66 |
Oradores
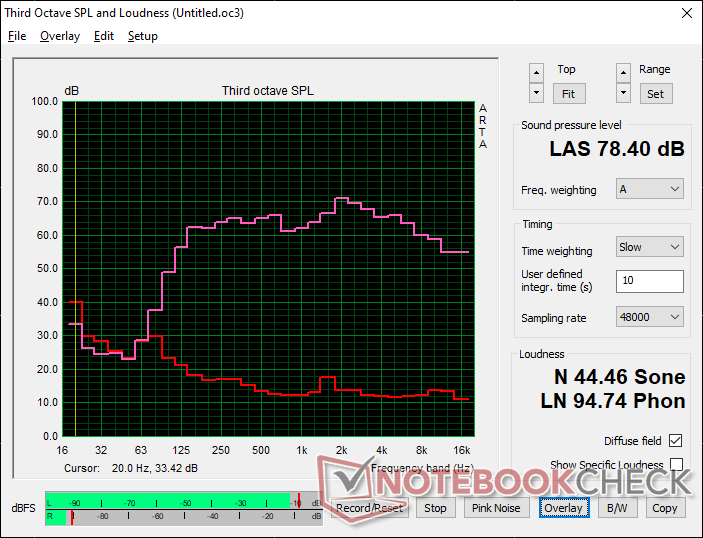
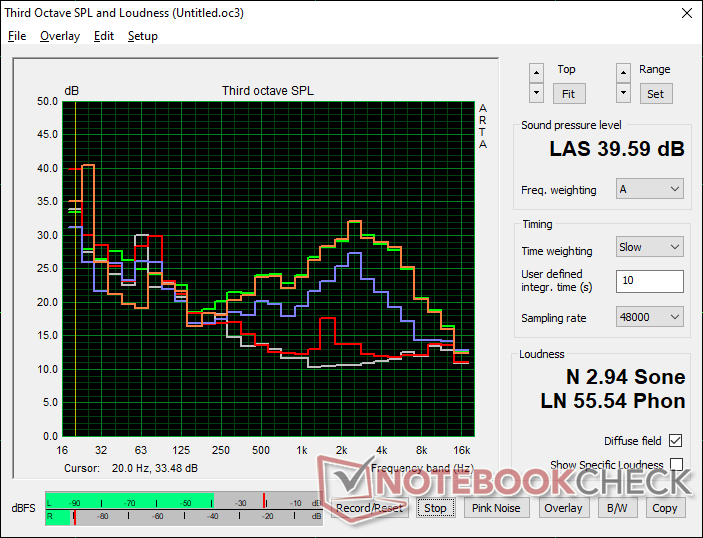
Dell Latitude 15 9520 2-in-1 análise de áudio
(±) | o volume do alto-falante é médio, mas bom (###valor### dB)
Graves 100 - 315Hz
(+) | bons graves - apenas 4.4% longe da mediana
(±) | a linearidade dos graves é média (9.4% delta para a frequência anterior)
Médios 400 - 2.000 Hz
(+) | médios equilibrados - apenas 2.3% longe da mediana
(+) | médios são lineares (4.5% delta para frequência anterior)
Altos 2 - 16 kHz
(+) | agudos equilibrados - apenas 3.3% longe da mediana
(+) | os máximos são lineares (3.9% delta da frequência anterior)
Geral 100 - 16.000 Hz
(+) | o som geral é linear (9.5% diferença em relação à mediana)
Comparado com a mesma classe
» 1% de todos os dispositivos testados nesta classe foram melhores, 0% semelhantes, 99% piores
» O melhor teve um delta de 7%, a média foi 21%, o pior foi 53%
Comparado com todos os dispositivos testados
» 4% de todos os dispositivos testados foram melhores, 1% semelhantes, 95% piores
» O melhor teve um delta de 4%, a média foi 23%, o pior foi 134%
Apple MacBook 12 (Early 2016) 1.1 GHz análise de áudio
(+) | os alto-falantes podem tocar relativamente alto (###valor### dB)
Graves 100 - 315Hz
(±) | graves reduzidos - em média 11.3% menor que a mediana
(±) | a linearidade dos graves é média (14.2% delta para a frequência anterior)
Médios 400 - 2.000 Hz
(+) | médios equilibrados - apenas 2.4% longe da mediana
(+) | médios são lineares (5.5% delta para frequência anterior)
Altos 2 - 16 kHz
(+) | agudos equilibrados - apenas 2% longe da mediana
(+) | os máximos são lineares (4.5% delta da frequência anterior)
Geral 100 - 16.000 Hz
(+) | o som geral é linear (10.2% diferença em relação à mediana)
Comparado com a mesma classe
» 7% de todos os dispositivos testados nesta classe foram melhores, 2% semelhantes, 90% piores
» O melhor teve um delta de 5%, a média foi 18%, o pior foi 53%
Comparado com todos os dispositivos testados
» 5% de todos os dispositivos testados foram melhores, 1% semelhantes, 94% piores
» O melhor teve um delta de 4%, a média foi 23%, o pior foi 134%
Gestão de energia
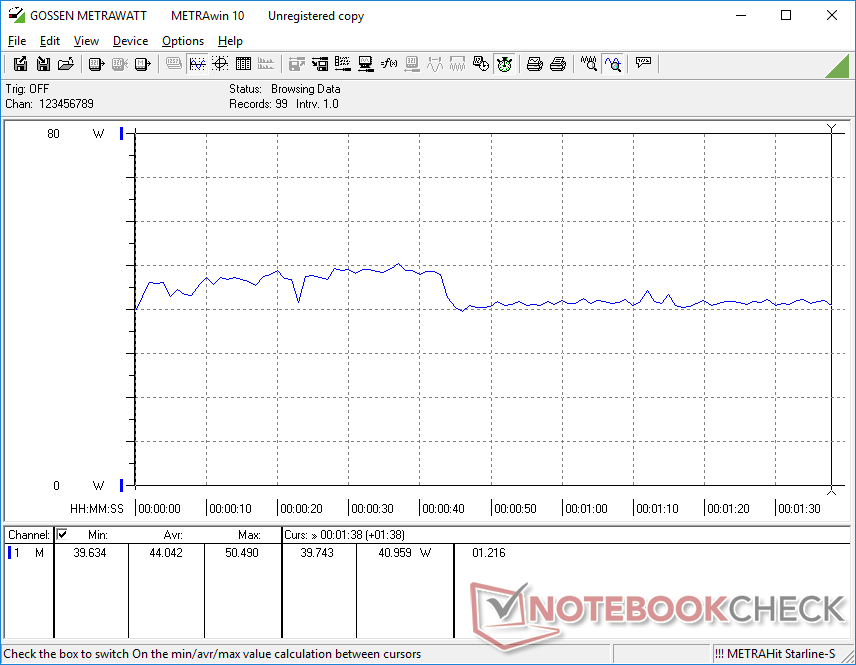
Consumo de energia
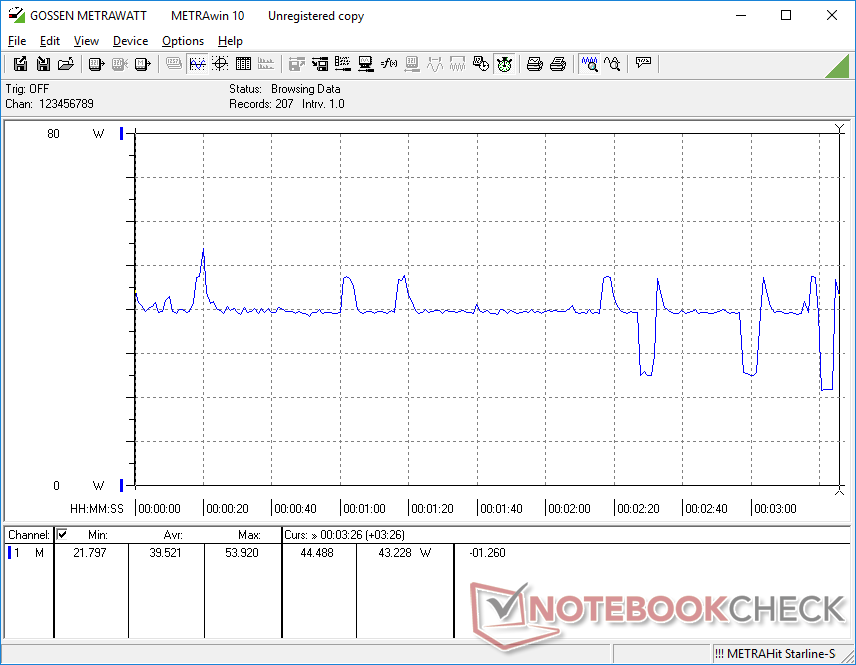
A execução do 3DMark 06 consumiria apenas 44 W em nosso Latitude 9520 2 em 1 em comparação com 46 W no Latitude 9510 2 em 1 apesar do aumento maciço do desempenho gráfico no modelo mais recente. Assim, os proprietários estão obtendo um aumento médio de 3x no desempenho da GPU sob o mesmo envelope de potência. O aumento anual do desempenho por watt não pode ser subestimado.
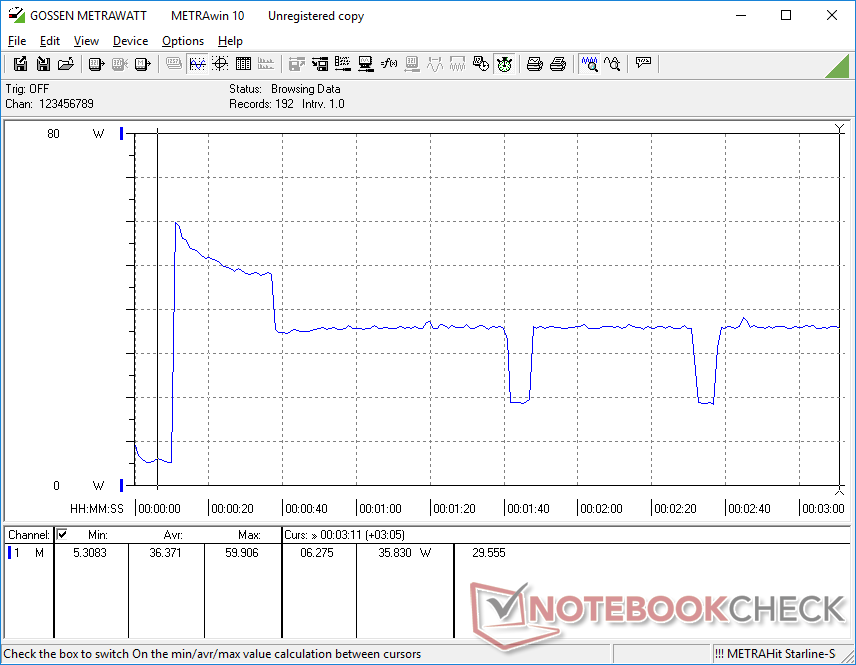
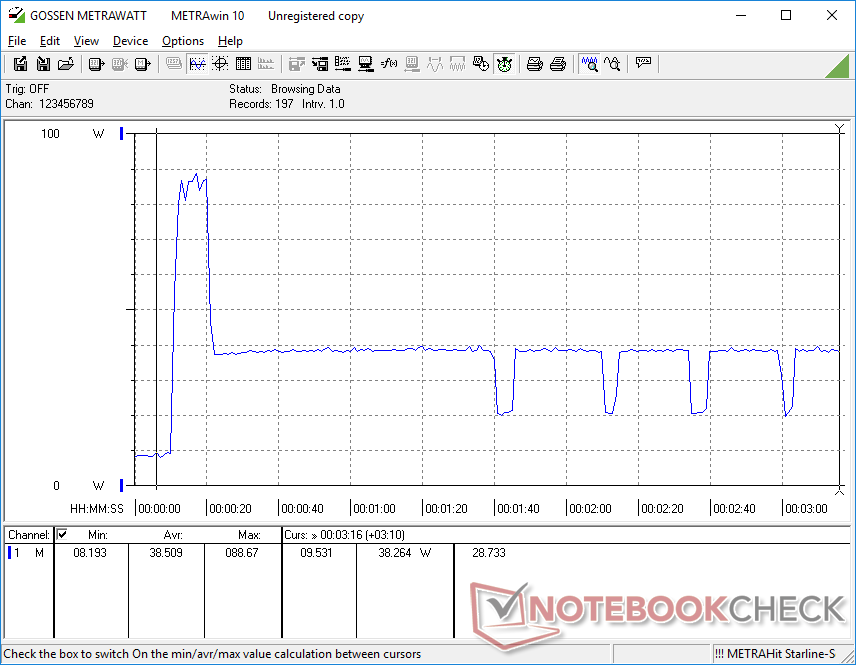
Infelizmente, o desempenho instável da GPU mencionado acima é refletido pelas taxas de consumo instável de energia como mostrado por nossos gráficos abaixo. Ao rodar Witcher 3 para representar cargas de jogo, o consumo variaria entre 21 W a 40 W, enquanto que se manteria estável em apenas 34 W no HP EliteBook 850 G8 equipado com a CPU similar Core i7-1165G7.
Somos capazes de registrar um consumo máximo de 88,7 W do pequeno (~13 x 6,6 x 2,3 cm) adaptador AC de 90 W. O sistema é incapaz de manter esta taxa por mais do que apenas alguns segundos devido a limitações térmicas.
| desligado | |
| Ocioso | |
| Carga |
|
Key:
min: | |
| Dell Latitude 15 9520 2-in-1 i7-1185G7, Iris Xe G7 96EUs, Toshiba KBG40ZNS512G NVMe, IPS, 1920x1080, 15" | Dell Latitude 9510 2-in-1 i7-10810U, UHD Graphics 620, Toshiba KBG40ZNS512G NVMe, IPS, 1920x1080, 15" | HP EliteBook 850 G8 3C7Z8EA i7-1165G7, Iris Xe G7 96EUs, Samsung PM981a MZVLB1T0HBLR, I, 1920x1080, 15.6" | Lenovo ThinkPad L15 G2 AMD R5 5600U, Vega 7, SK Hynix HFS512 GDE9X081N, IPS LED, 1920x1080, 15.6" | MSI Summit B15 A11M i7-1165G7, Iris Xe G7 96EUs, Kingston OM8PCP31024F, IPS, 1920x1080, 15.6" | Microsoft Surface Laptop 4 15 AMD TFF_00028 R7 4980U, Vega 8, SK Hynix BC511 HFM512GDJTNI, IPS, 2496x1664, 15" | |
|---|---|---|---|---|---|---|
| Power Consumption | 8% | -27% | -14% | -15% | -14% | |
| Idle Minimum * (Watt) | 2.6 | 2.1 19% | 5.8 -123% | 4.57 -76% | 4.2 -62% | 3.6 -38% |
| Idle Average * (Watt) | 5 | 4.6 8% | 8.4 -68% | 8.2 -64% | 7.7 -54% | 6.5 -30% |
| Idle Maximum * (Watt) | 7.1 | 5.3 25% | 9.9 -39% | 9.3 -31% | 8.4 -18% | 8.9 -25% |
| Load Average * (Watt) | 44 | 45.8 -4% | 33 25% | 31.9 27% | 37.8 14% | 46.5 -6% |
| Witcher 3 ultra * (Watt) | 39.5 | 34.3 13% | 34.5 13% | 36.6 7% | 43.4 -10% | |
| Load Maximum * (Watt) | 88.7 | 96.3 -9% | 60 32% | 47.4 47% | 67.5 24% | 64.9 27% |
* ... menor é melhor
Power Consumption Witcher 3 / Stresstest
Vida útil da bateria
Os tempos de funcionamento são algumas horas mais curtos do que o que registramos no modelo do ano passado, apesar das baterias idênticas de 88 Wh entre elas. Mesmo assim, 14+ horas de uso de WLAN no mundo real ainda não é nada para zombar e bem acima da média para a categoria de tamanho
A Dell oferece SKUs com baterias menores de 46 Wh para usuários que não se importam de sacrificar a vida útil da bateria por uma unidade mais leve
| Dell Latitude 15 9520 2-in-1 i7-1185G7, Iris Xe G7 96EUs, 88 Wh | Dell Latitude 9510 2-in-1 i7-10810U, UHD Graphics 620, 88 Wh | HP EliteBook 850 G8 3C7Z8EA i7-1165G7, Iris Xe G7 96EUs, 56 Wh | Lenovo ThinkPad L15 G2 AMD R5 5600U, Vega 7, 45 Wh | MSI Summit B15 A11M i7-1165G7, Iris Xe G7 96EUs, 52 Wh | Microsoft Surface Laptop 4 15 AMD TFF_00028 R7 4980U, Vega 8, 47.4 Wh | |
|---|---|---|---|---|---|---|
| Duração da bateria | 26% | -43% | -47% | -55% | -30% | |
| WiFi v1.3 (h) | 14.8 | 18.7 26% | 8.5 -43% | 7.8 -47% | 6.6 -55% | 10.4 -30% |
| Reader / Idle (h) | 59 | 18.4 | ||||
| Load (h) | 4 | 2.3 | 1 | 2.5 | ||
| H.264 (h) | 6.6 | 14.8 |
Pro
Contra
Veredicto
O Latitude 9520 2 em 1 oferece vantagens significativas de desempenho sobre o Latitude 9510 2 em 1 em papel. O antigo UHD Graphics 620 foi tornado obsoleto agora que Iris Xe está se tornando mais comum. Na prática, no entanto, há advertências que os potenciais compradores não devem ignorar.
Primeiramente, a GPU Iris Xe no novo Latitude funciona com taxas de relógio de ciclismo, resultando em taxas de quadros de ciclismo quando jogando ou desempenho instável quando executando tarefas intensivas de GPU. As taxas de quadros cicláveis seriam tão extremas que algumas aplicações onde as taxas de quadros estáveis são vitais se tornariam quase inutilizáveis. Recomendamos consultar outros Tiger Lake-U laptops como o MSI Summit E13 Flip ouHP EliteBook 840 Aero G8 se for desejável um desempenho mais estável e confiável da GPU.
O principal ponto de venda do Latitude 9520 2 em 1 sobre o 9510 2 em 1 é sua performance gráfica integrada significativamente mais rápida. No entanto, a performance gráfica anormalmente instável no modelo mais novo pode ser um fator de desligamento para muitos compradores interessados.
Em segundo lugar, o desempenho da CPU multi-thread de nossa CPU Core i7-1185G7 é mais lento quando comparado com a antiga Core i7-10810U no Latitude 9510 2 em 1. Embora esta desvantagem não seja exclusiva dos PCs Dell, a i7-1185G7 no Latitude 9520 2 em 1 está funcionando mais lentamente do que em muitos outros laptops com o mesmo processador. Assim, o déficit de desempenho multi-tarefa é amplificado na Dell.
As razões para escolher o Latitude 9520 2 em 1 sobre o 9510 2 em 1 são menores do que gostaríamos, especialmente porque o modelo mais novo não oferece nada de novo em termos de qualidade de exibição, qualidade de webcam ou duração da bateria. Esperamos que o desempenho desigual da GPU possa ser abordado com uma atualização futura.
Preço e Disponibilidade
A maioria dos grandes varejistas como Amazônia, Walmart, e Newegg têm o Latitude 9520 2 em 1 em estoque em várias configurações. Os usuários também podem adquirir diretamente da Dell a partir de $2800 USD para a versão Core i5.
Dell Latitude 15 9520 2-in-1
- 11/22/2021 v7 (old)
Allen Ngo
Price comparison

