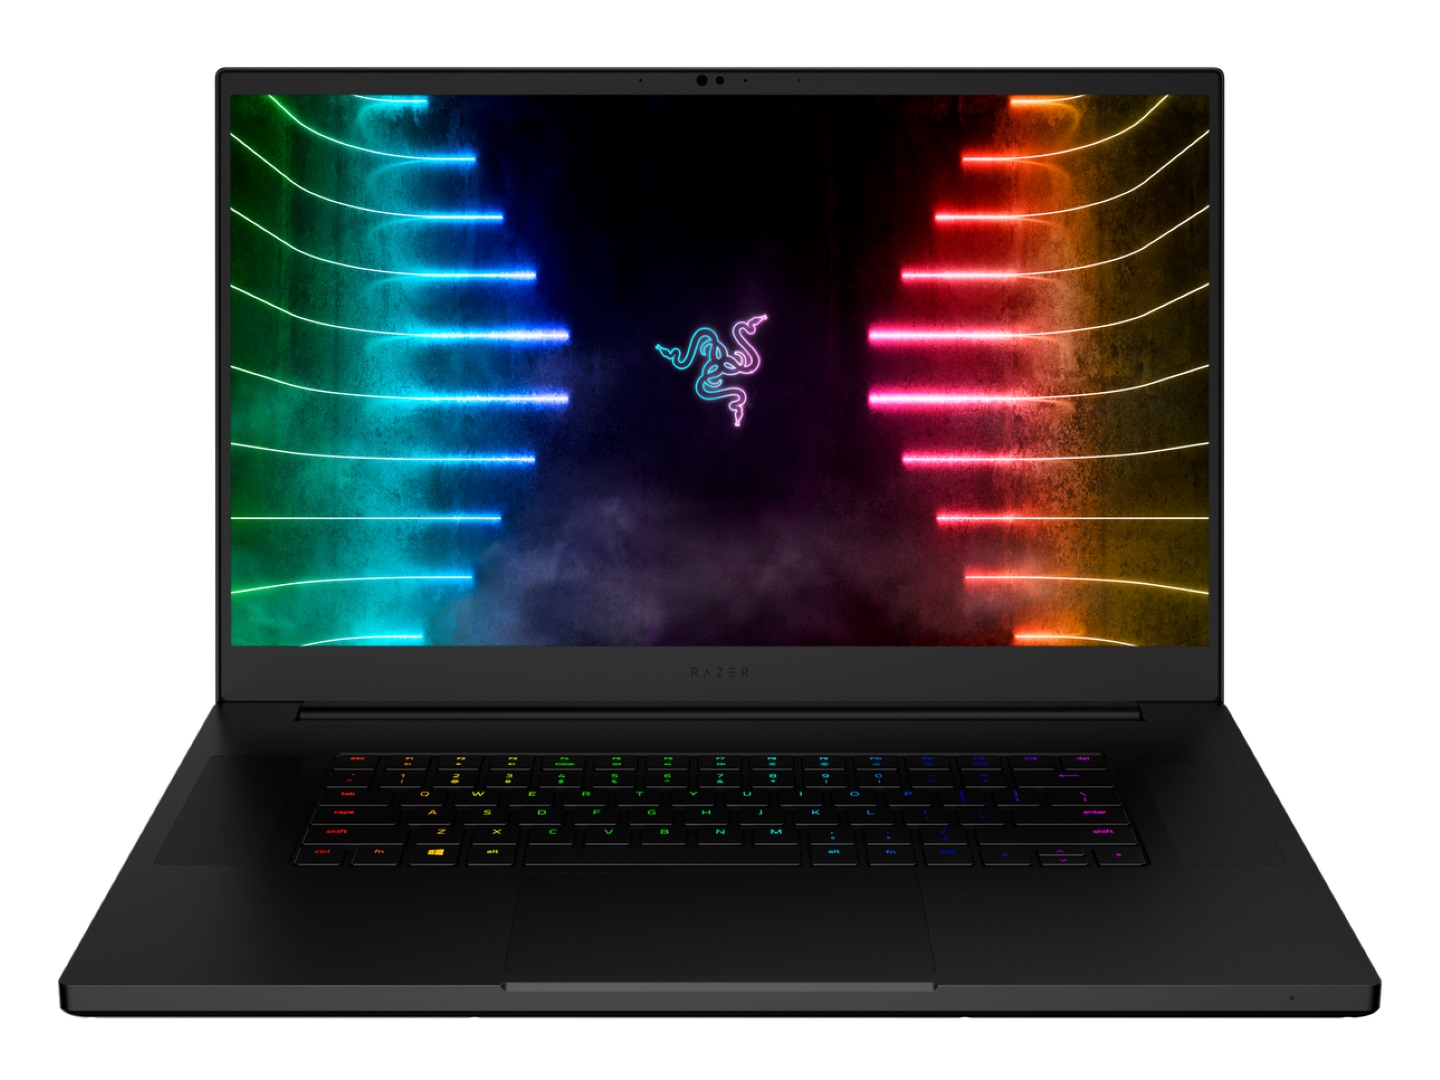
Revisão do laptop Razer Blade 17: Agora com 130 W TGP GeForce RTX gráficos
A Razer sempre foi rápida a pular para novas CPUs e GPUs sempre que elas se tornam disponíveis. Os resultados são muitas vezes excelentes com ganhos apreciáveis de gen para gen, enquanto que outras vezes eles podem cair por terra. O Ice Lake Blade Stealthpor exemplo, provou ser pior do que o mais barato Versão Whiskey Lake-U que deveria substituir. Felizmente, este último modelo de lâmina de 17,3 polegadas não tem tais problemas.
O Blade 17 de 2021 sucede o Blade Pro 17 deixando de lado o "Pro" e adicionando no novo processador Intel 11th gen Tiger Lake-H à mistura. A GPU e a tela também recebem atualizações de 100 W TGP e 300 Hz para 130 W TGP e 360 Hz, respectivamente. O design do chassi e as características físicas são idênticos ao modelo original de 2019 que foi lançado com CPUs Coffee Lake-H da 9ª geração e GPUs Turing.
As alternativas para o Blade 17 incluem outros laptops ultramodernos de alta qualidade como o MSI GS76, Asus Zephyrus S17, Acer Predator Tritonou o Gigabyte Aero ou Aorus série. Nossa configuração exata é atualmente enviada por $2799 USD.
Mais revisões da Razer:
potential competitors in comparison
Avaliação | Data | Modelo | Peso | Altura | Size | Resolução | Preço |
|---|---|---|---|---|---|---|---|
| 89.4 % v7 (old) | 09/2021 | Razer Blade 17 RTX 3070 i7-11800H, GeForce RTX 3070 Laptop GPU | 2.8 kg | 19.9 mm | 17.30" | 1920x1080 | |
| 90.1 % v7 (old) | 07/2021 | Asus ROG Zephyrus S17 GX703HSD i9-11900H, GeForce RTX 3080 Laptop GPU | 2.8 kg | 19.9 mm | 17.30" | 2560x1440 | |
| 86.2 % v7 (old) | 09/2021 | MSI GS76 Stealth 11UH i9-11900H, GeForce RTX 3080 Laptop GPU | 2.4 kg | 20 mm | 17.30" | 3840x2160 | |
| 82 % v7 (old) | 08/2021 | Acer Nitro 5 AN517-41-R9S5 R7 5800H, GeForce RTX 3080 Laptop GPU | 2.7 kg | 24.9 mm | 17.30" | 1920x1080 | |
| 88 % v7 (old) | 05/2021 | Gigabyte Aero 17 HDR YD i9-11980HK, GeForce RTX 3080 Laptop GPU | 2.8 kg | 22 mm | 17.30" | 3840x2160 | |
| 87.8 % v7 (old) | 09/2021 | Maingear Vector Pro MG-VCP17 i7-11800H, GeForce RTX 3080 Laptop GPU | 2.3 kg | 19.81 mm | 17.30" | 2560x1440 |
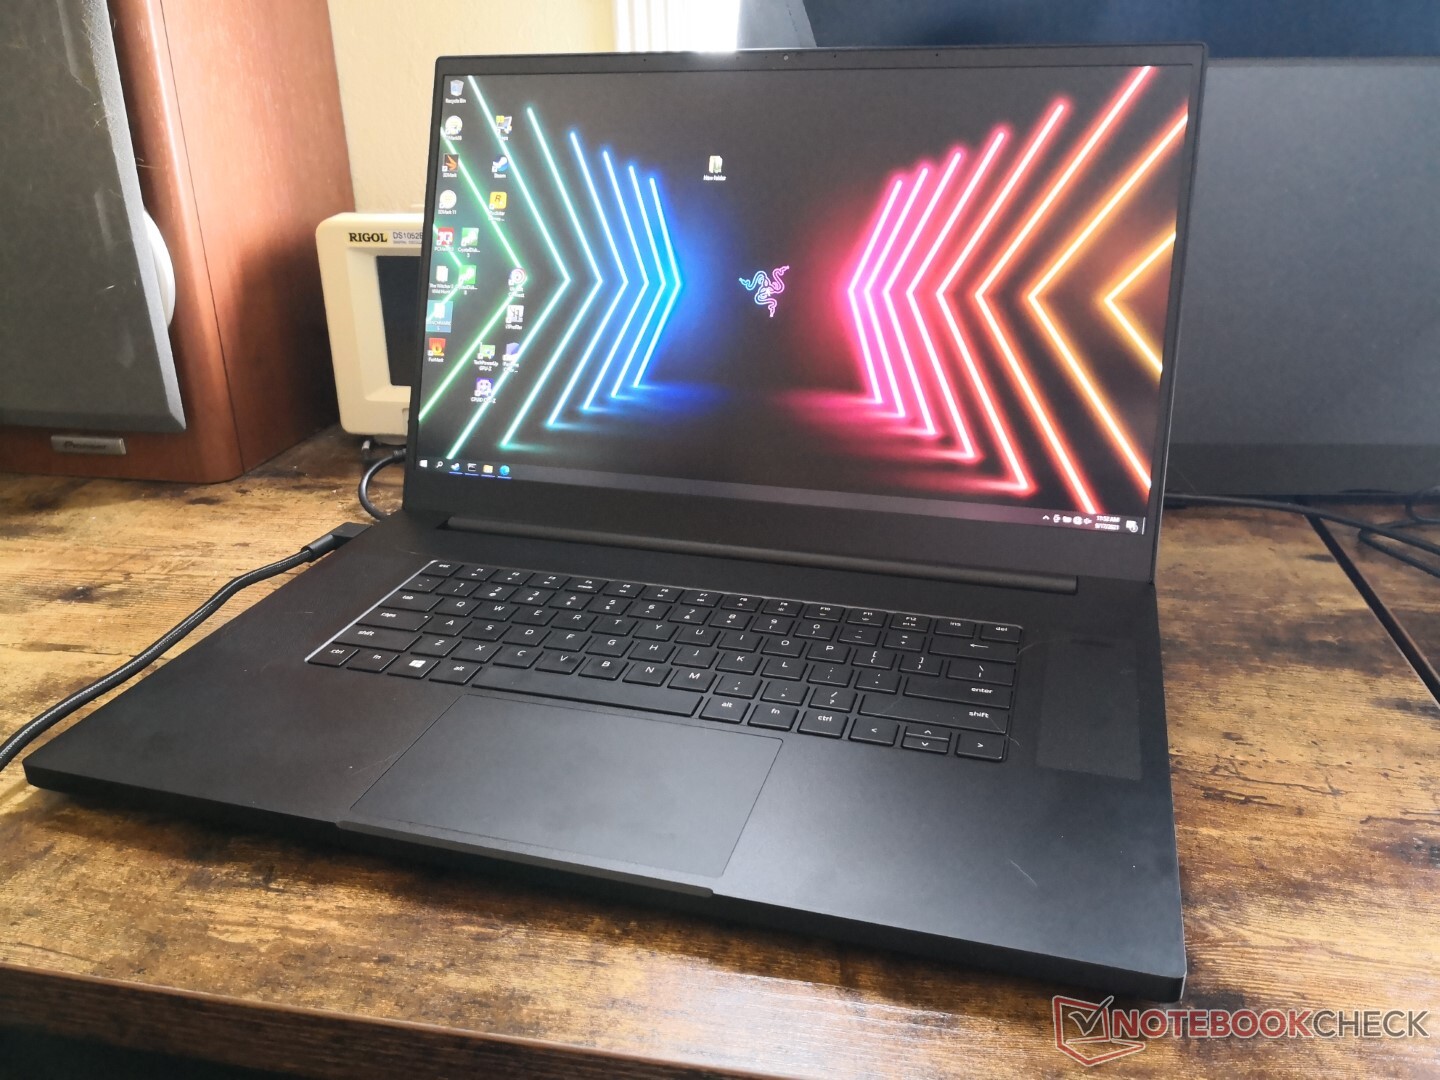
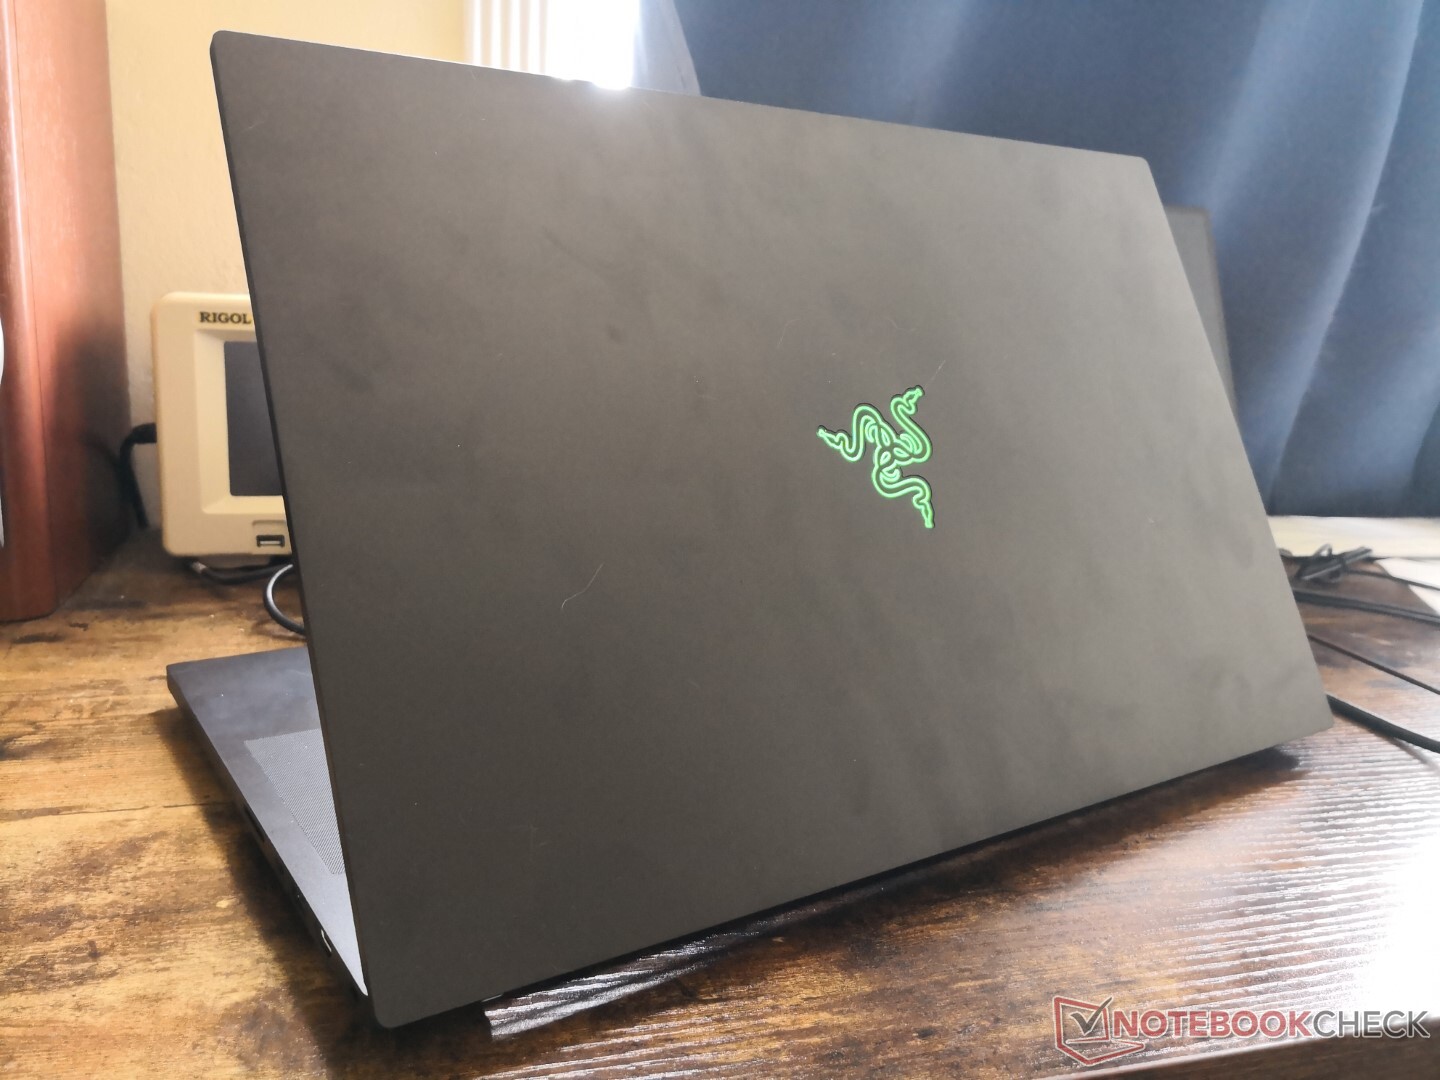
Caso - Mudanças internas
As atualizações de ano para ano são todas internas, já que não há mudanças no esqueleto externo. As principais atualizações incluem:
- 11ª geração Intel Tiger Lake-H CPUs (até Core i9) para substituir a 10ª geração Comet Lake-H do ano passado
- 130 W TGP GeForce RTX GPUs para substituir as opções de 100 W do ano passado
- 1080p (2,1 MP) webcam contra 720p (1 MP) no modelo do ano passado
- Compatibilidade Thunderbolt 4 em vez de apenas Thunderbolt 3
- Suporte para duas SSDs PCIe4 NVMe em vez de apenas PCIe3
- Novas opções de exibição, incluindo taxa de atualização 360 Hz em vez de 300 Hz
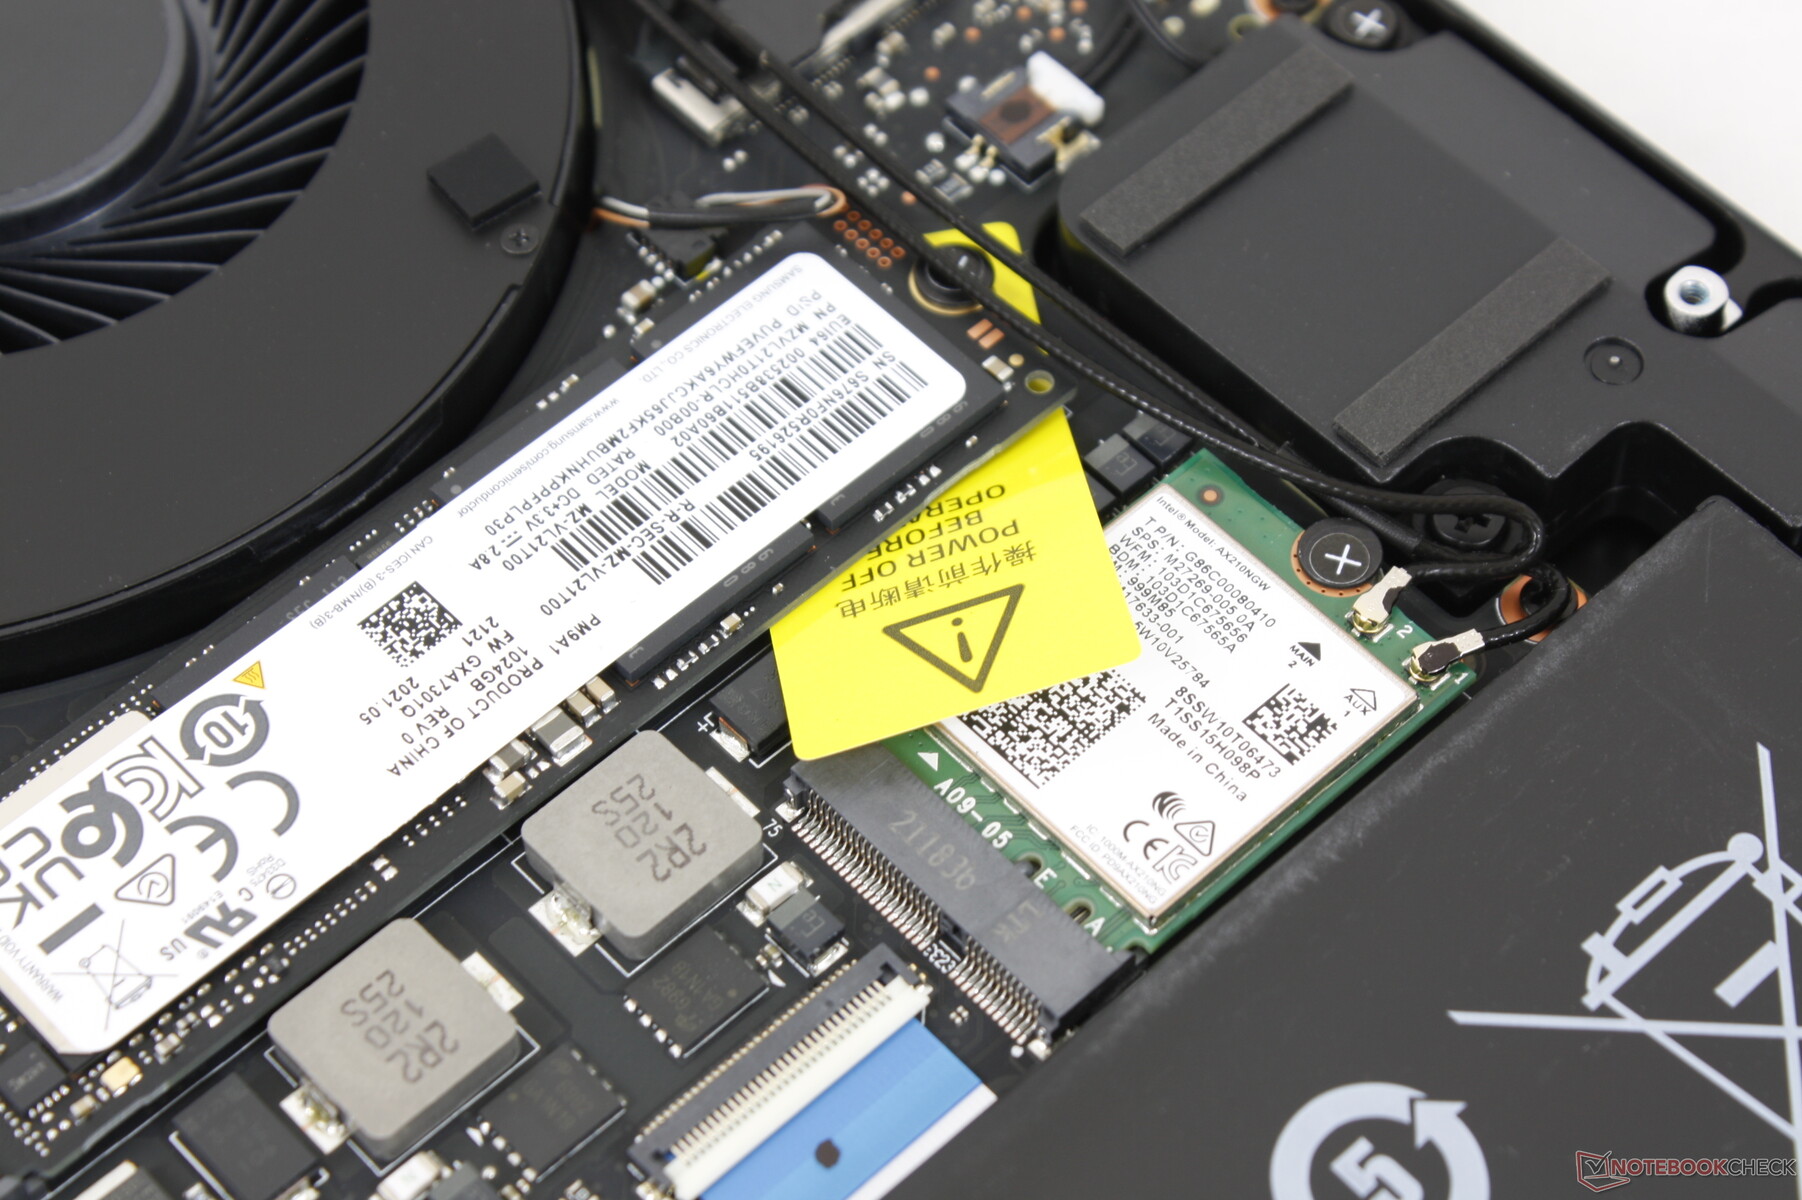
- Intel AX210 para suporte a Wi-Fi 6E para substituir o AX200/201 do ano passado
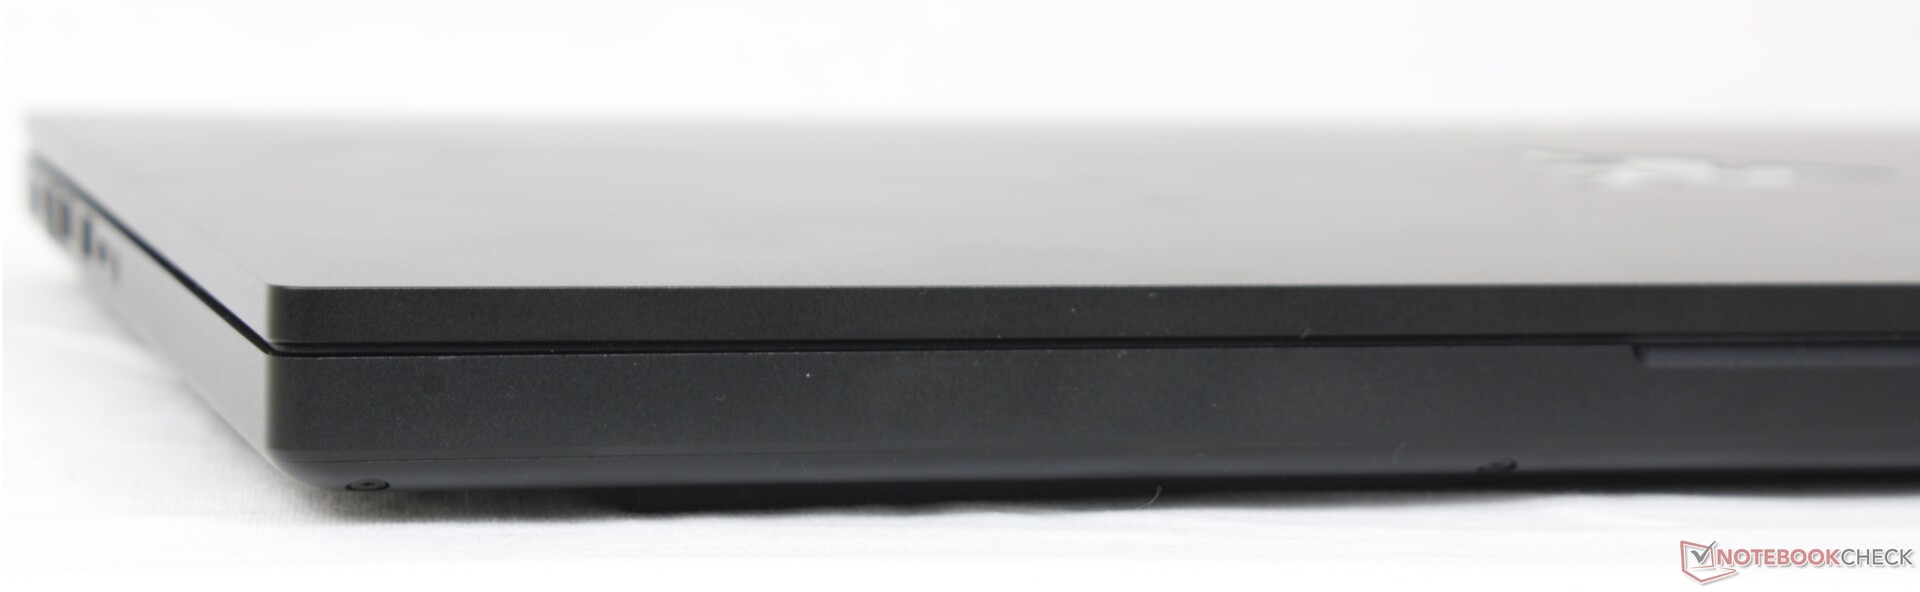
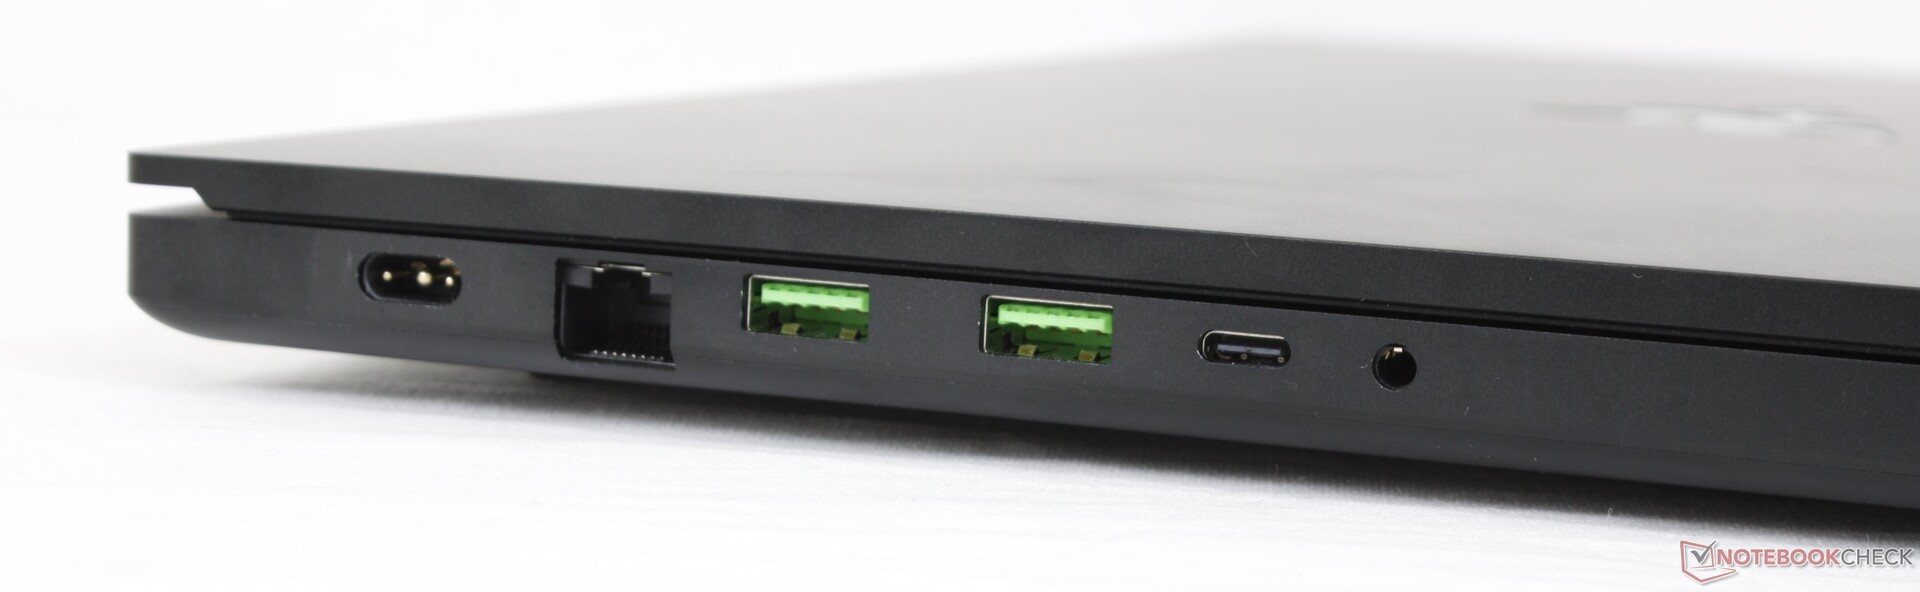
Conectividade - Agora com Thunderbolt 4
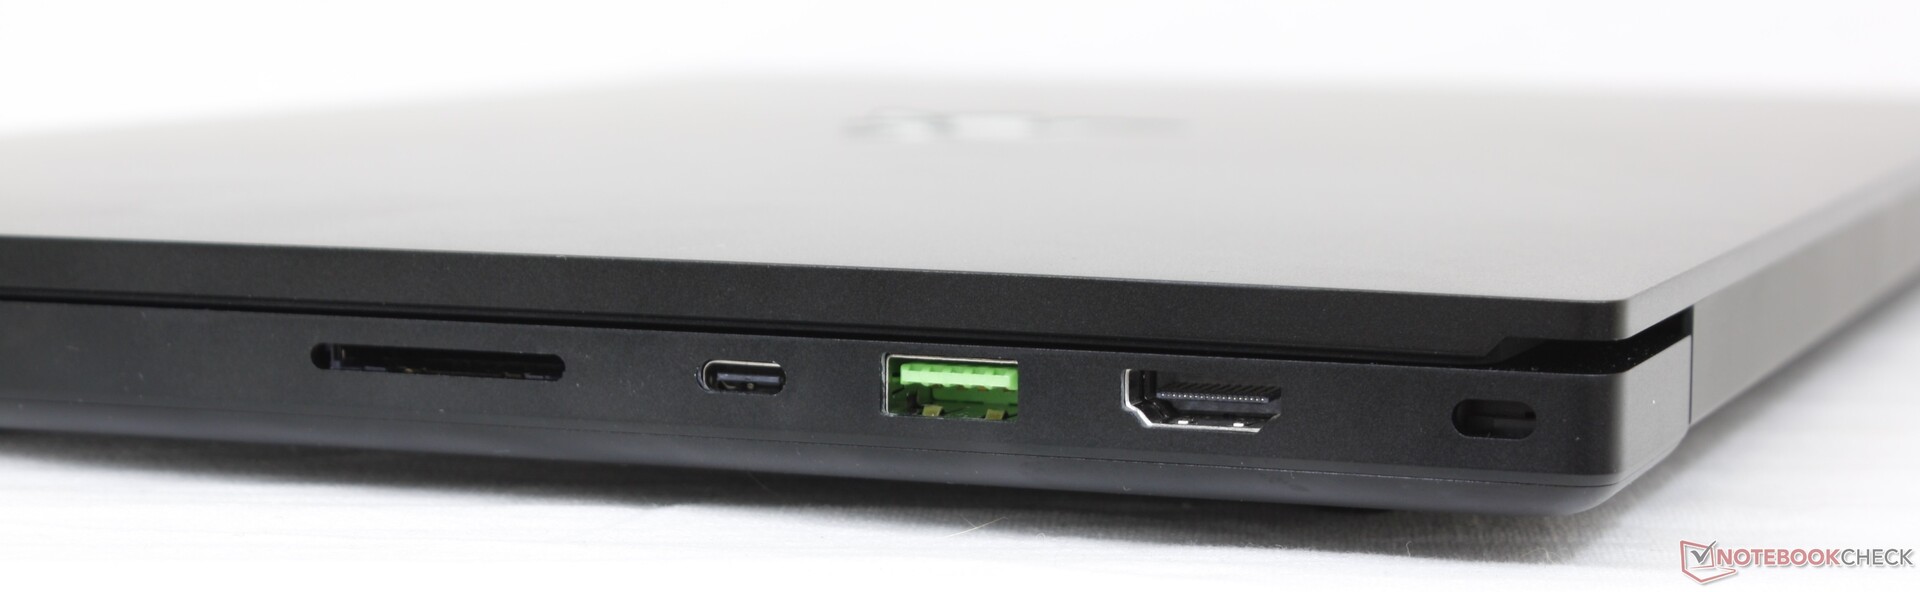
Leitor de cartões SD
| SD Card Reader | |
| average JPG Copy Test (av. of 3 runs) | |
| Razer Blade 17 RTX 3070 (AV Pro V60) | |
| MSI GS76 Stealth 11UH (AV PRO microSD 128 GB V60) | |
| Gigabyte Aero 17 HDR YD (AV PRO microSD 128 GB V60) | |
| Asus ROG Zephyrus S17 GX703HSD | |
| Maingear Vector Pro MG-VCP17 (AV Pro V60) | |
| maximum AS SSD Seq Read Test (1GB) | |
| Asus ROG Zephyrus S17 GX703HSD | |
| MSI GS76 Stealth 11UH (AV PRO microSD 128 GB V60) | |
| Razer Blade 17 RTX 3070 (AV Pro V60) | |
| Gigabyte Aero 17 HDR YD (AV PRO microSD 128 GB V60) | |
| Maingear Vector Pro MG-VCP17 (AV Pro V60) | |
Comunicação - Wi-Fi 6E agora Standard
Para a maioria dos usuários, o Wi-Fi 6E terá o mesmo desempenho que os laptops Wi-Fi 6E existentes, pois os usuários precisarão de um roteador Wi-Fi 6E para explorar todos os seus benefícios. As taxas de transferência permanecem estáveis e em sua maioria inalteradas em relação ao modelo Wi-Fi 6 do ano passado, quando emparelhado com nosso roteador de teste Netgear RAX200.
Webcam - 1080p Em vez de 720p
A câmera é de fato mais nítida desta vez, como mostram nossas imagens de comparação abaixo. A precisão das cores, no entanto, não parece ser melhor ou pior. Um obturador de webcam continua faltando.

 GeForce RTX 3080 Laptop GPU, i7-10875H, Samsung PM981a MZVLB1T0HBLR")
 GeForce RTX 3080 Laptop GPU, i7-10875H, Samsung PM981a MZVLB1T0HBLR")


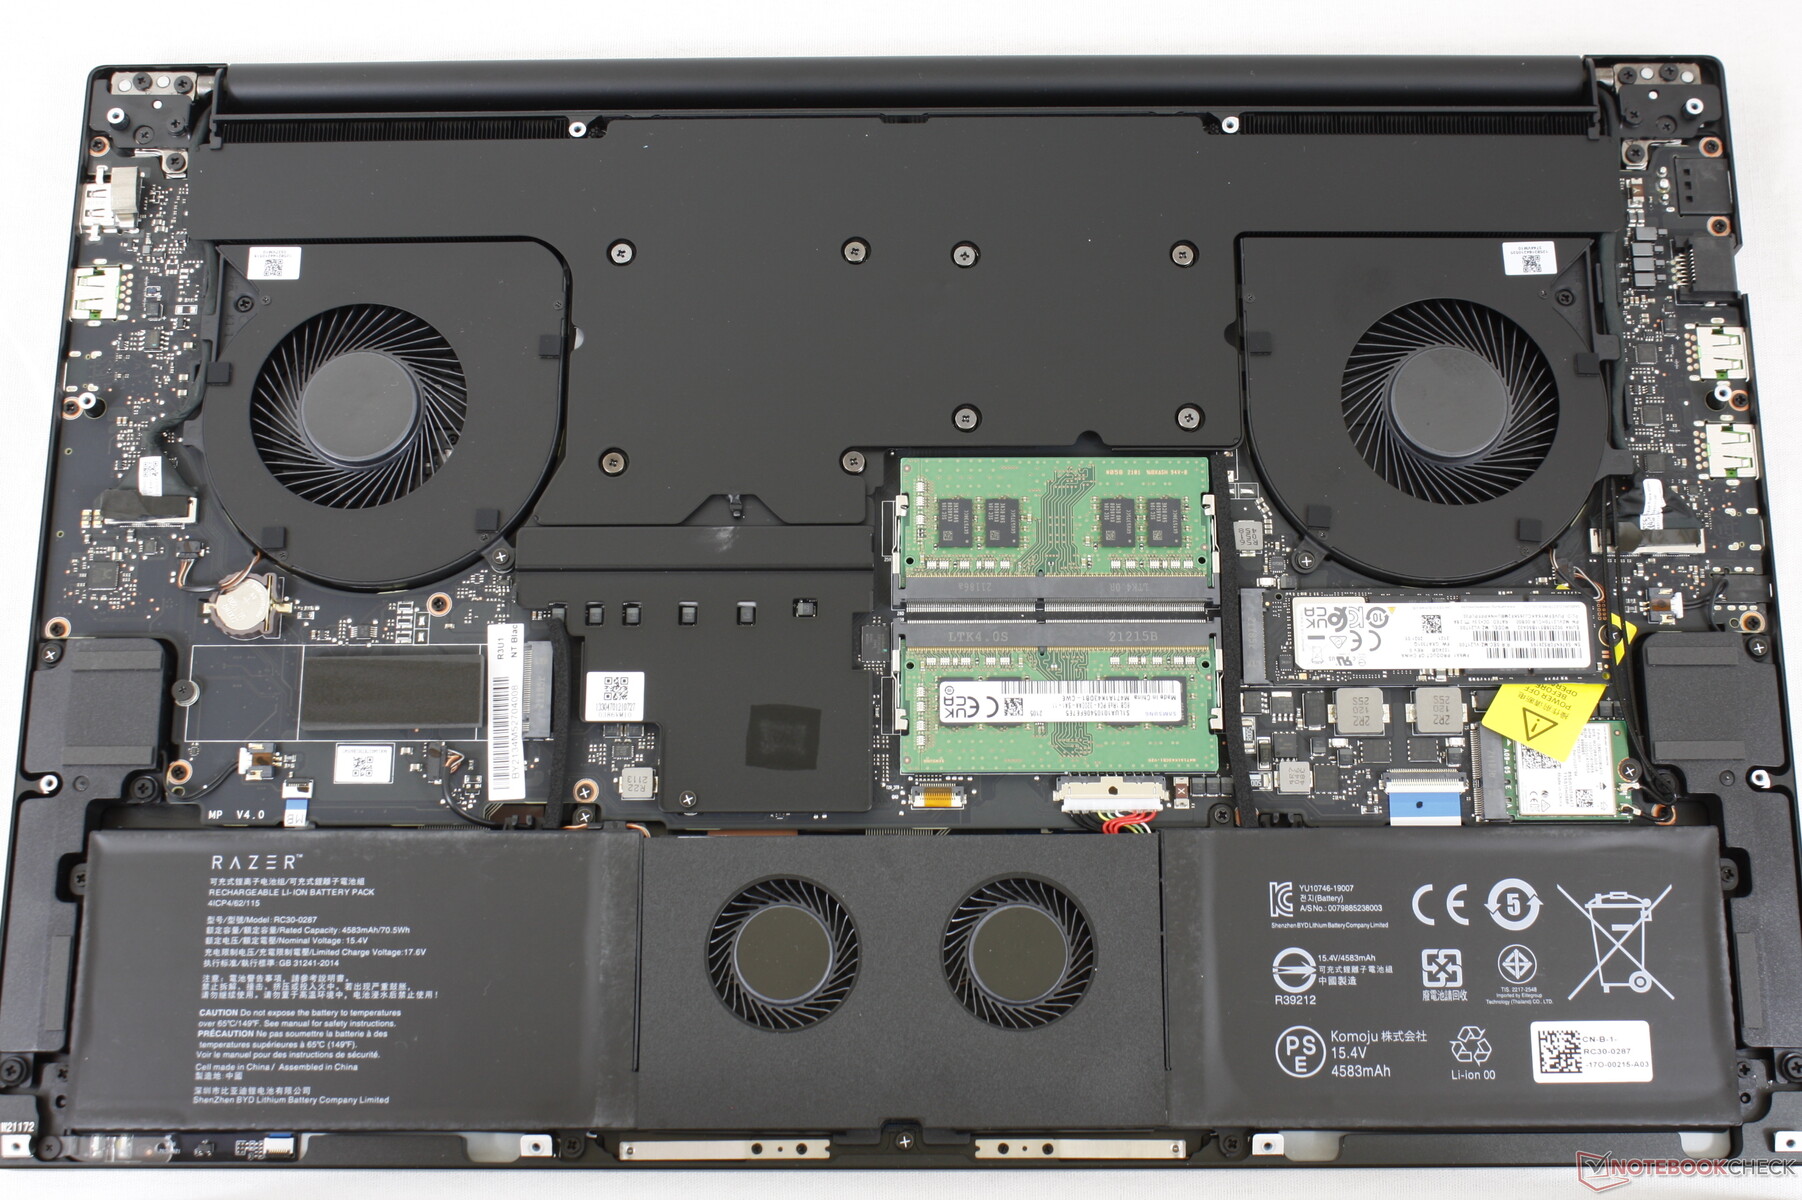
Manutenção
Há algumas pequenas mudanças no posicionamento dos parafusos na Lâmina 17 quando comparados ao Blade Pro. Caso contrário, a maioria de tudo mais parece ser idêntico.
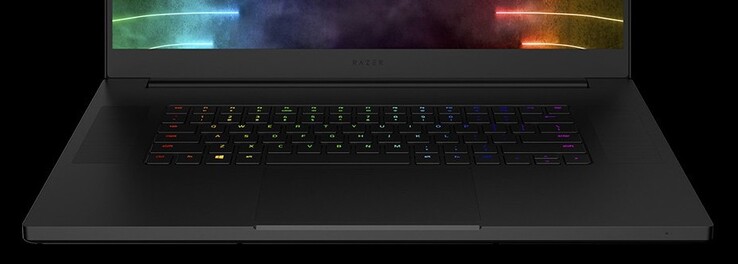
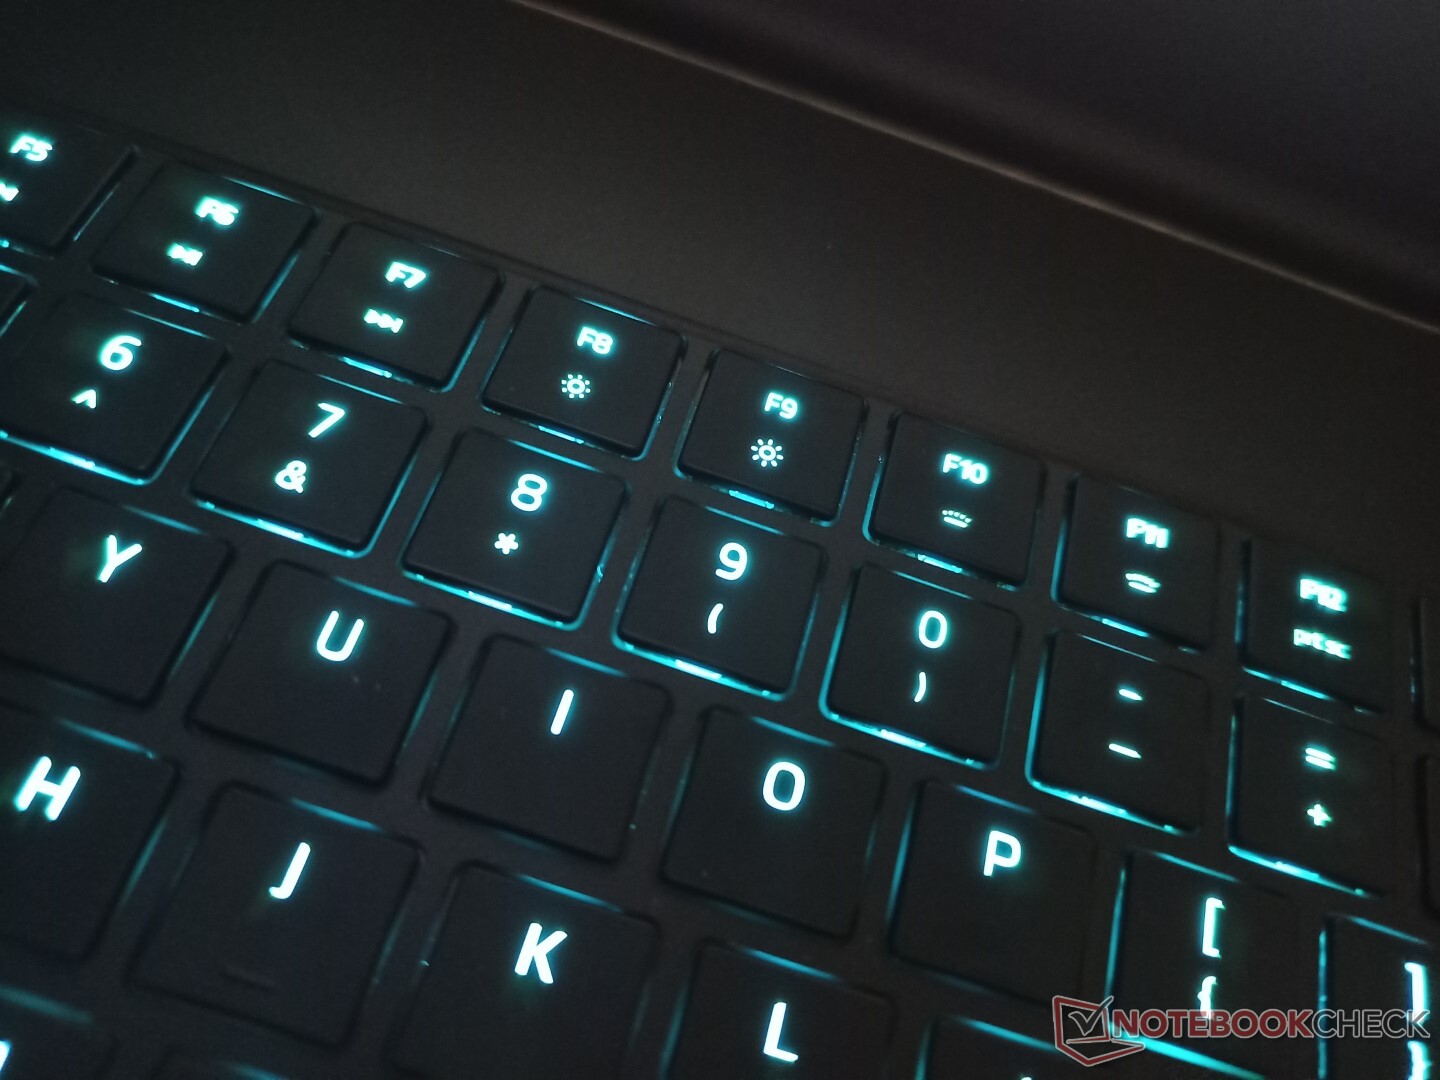
Dispositivos de entrada
Todas as teclas e símbolos de teclado estão acesos em nossa unidade americana. Suspeitamos que alguns símbolos podem não estar acesos novamente para modelos no exterior, uma vez que a Razer não fez nenhuma alteração externa no chassi.
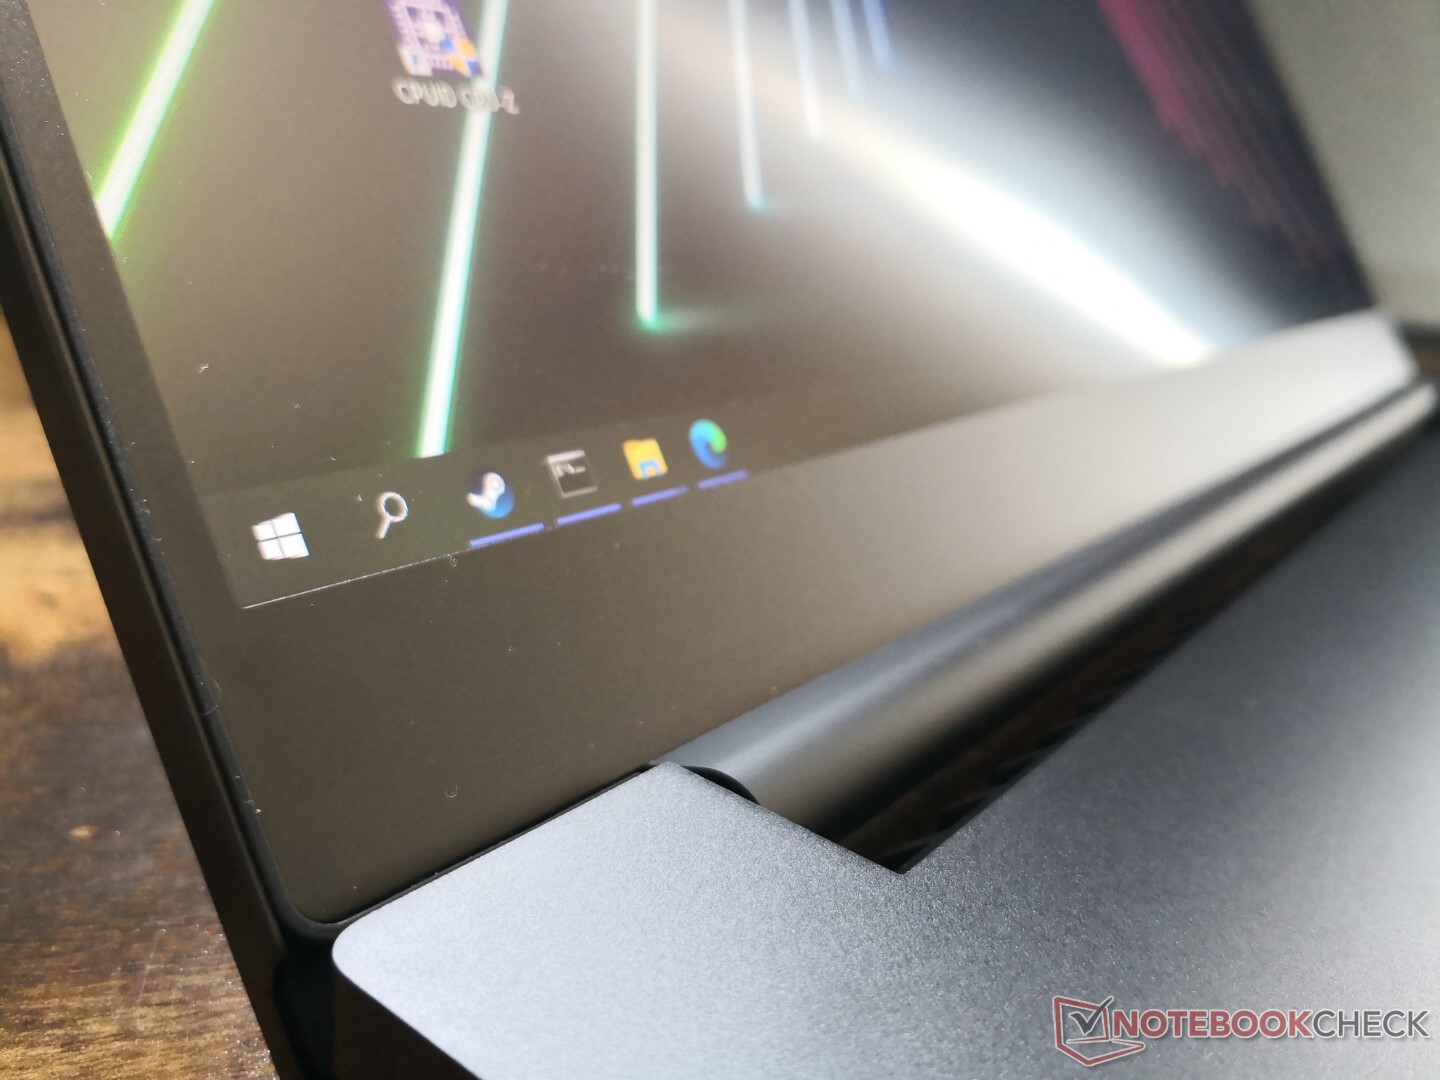
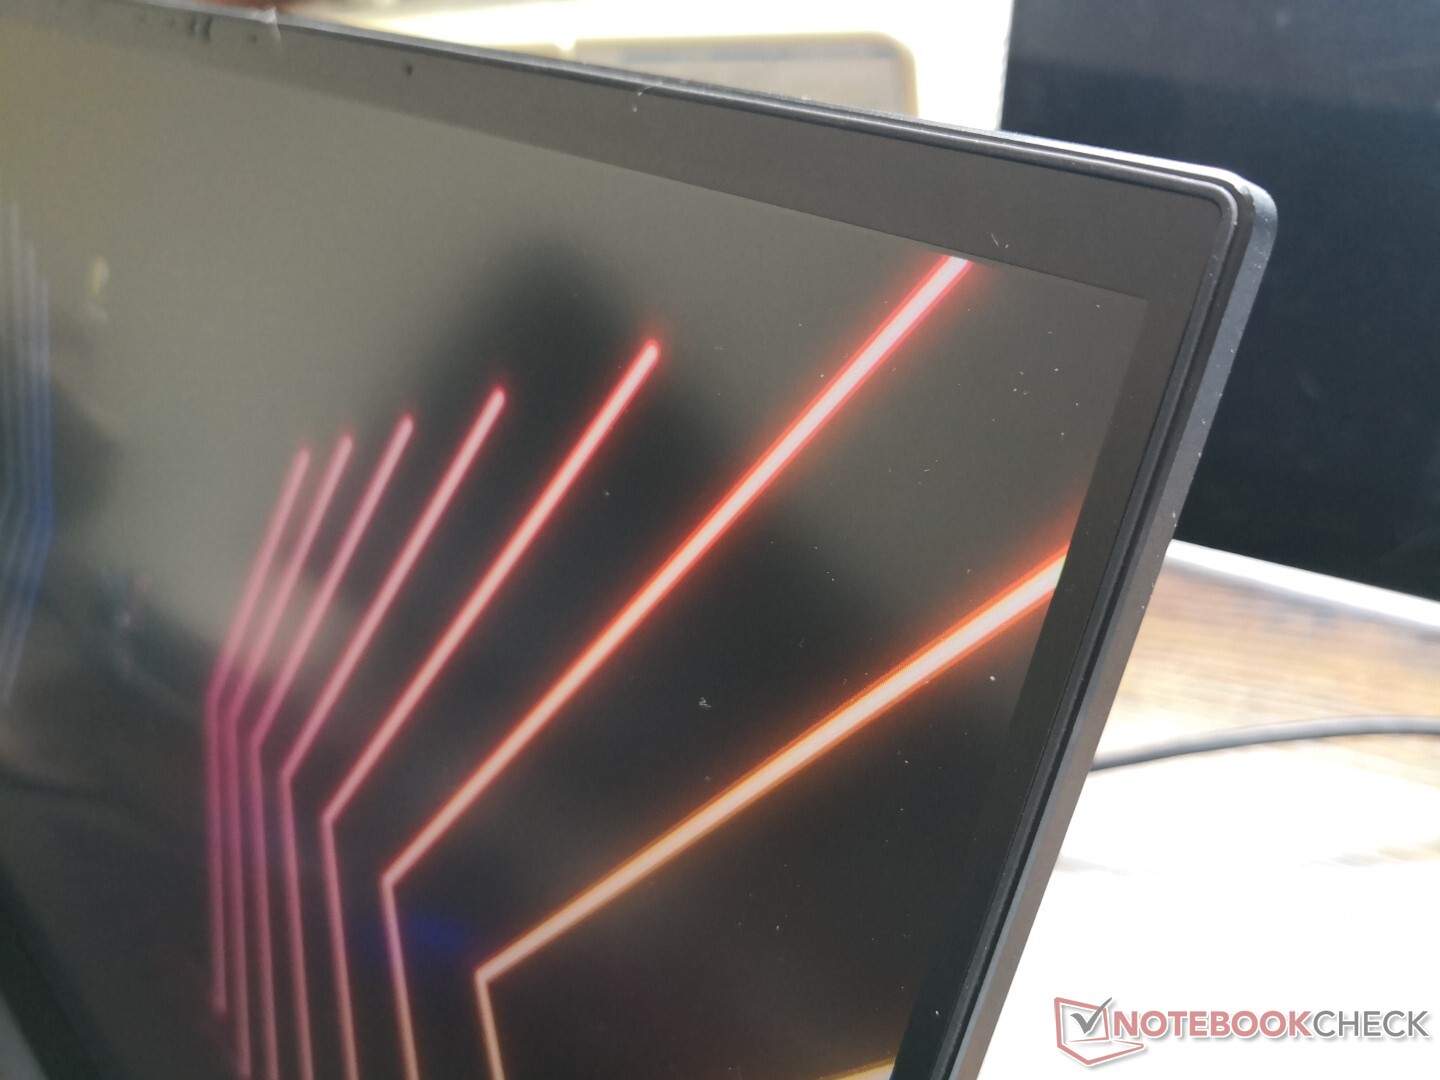
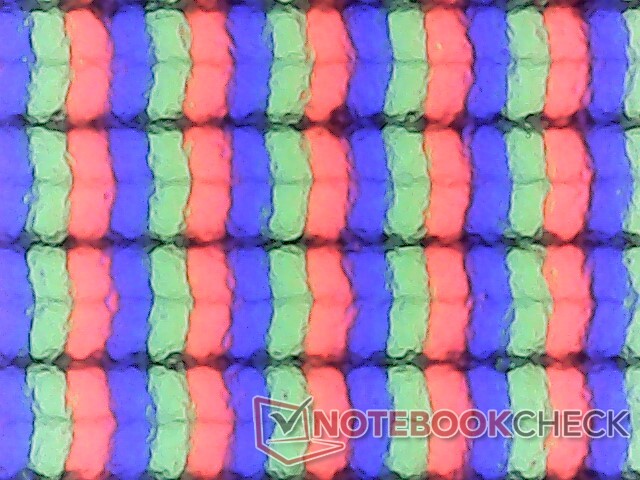
Display - Ultra-Suave 360 Hz
A Razer está usando o mesmo painel IPS 1080p 360 Hz AU Optronics B173HAN05.4 para sua Lâmina 17 que a Asus está usando para seuStrix Scar 17 G733QS. Assim, a experiência de visualização entre esses dois laptops é muito semelhante. Este painel específico oferece cobertura completa de sRGB com tempos de resposta muito rápidos e uma relação de contraste respeitável de quase 1000:1 para ser bom tanto para edição quanto para jogos. Seus atributos são quase os mesmos do painel Sharp de 300 Hz no Blade Pro do ano passado, o que significa que os usuários estão realmente pagando apenas por essa taxa de atualização um pouco mais rápida.
Outras opções de exibição incluem 165 Hz 1440p (QHD) com cobertura total de sRGB e uma tela táctil brilhante de 4K com cobertura total de AdobeRGB. Espera-se também que esta última seja mais brilhante que nossa opção de 360 Hz (~400 lêndeas vs. ~300 lêndeas).
| |||||||||||||||||||||||||
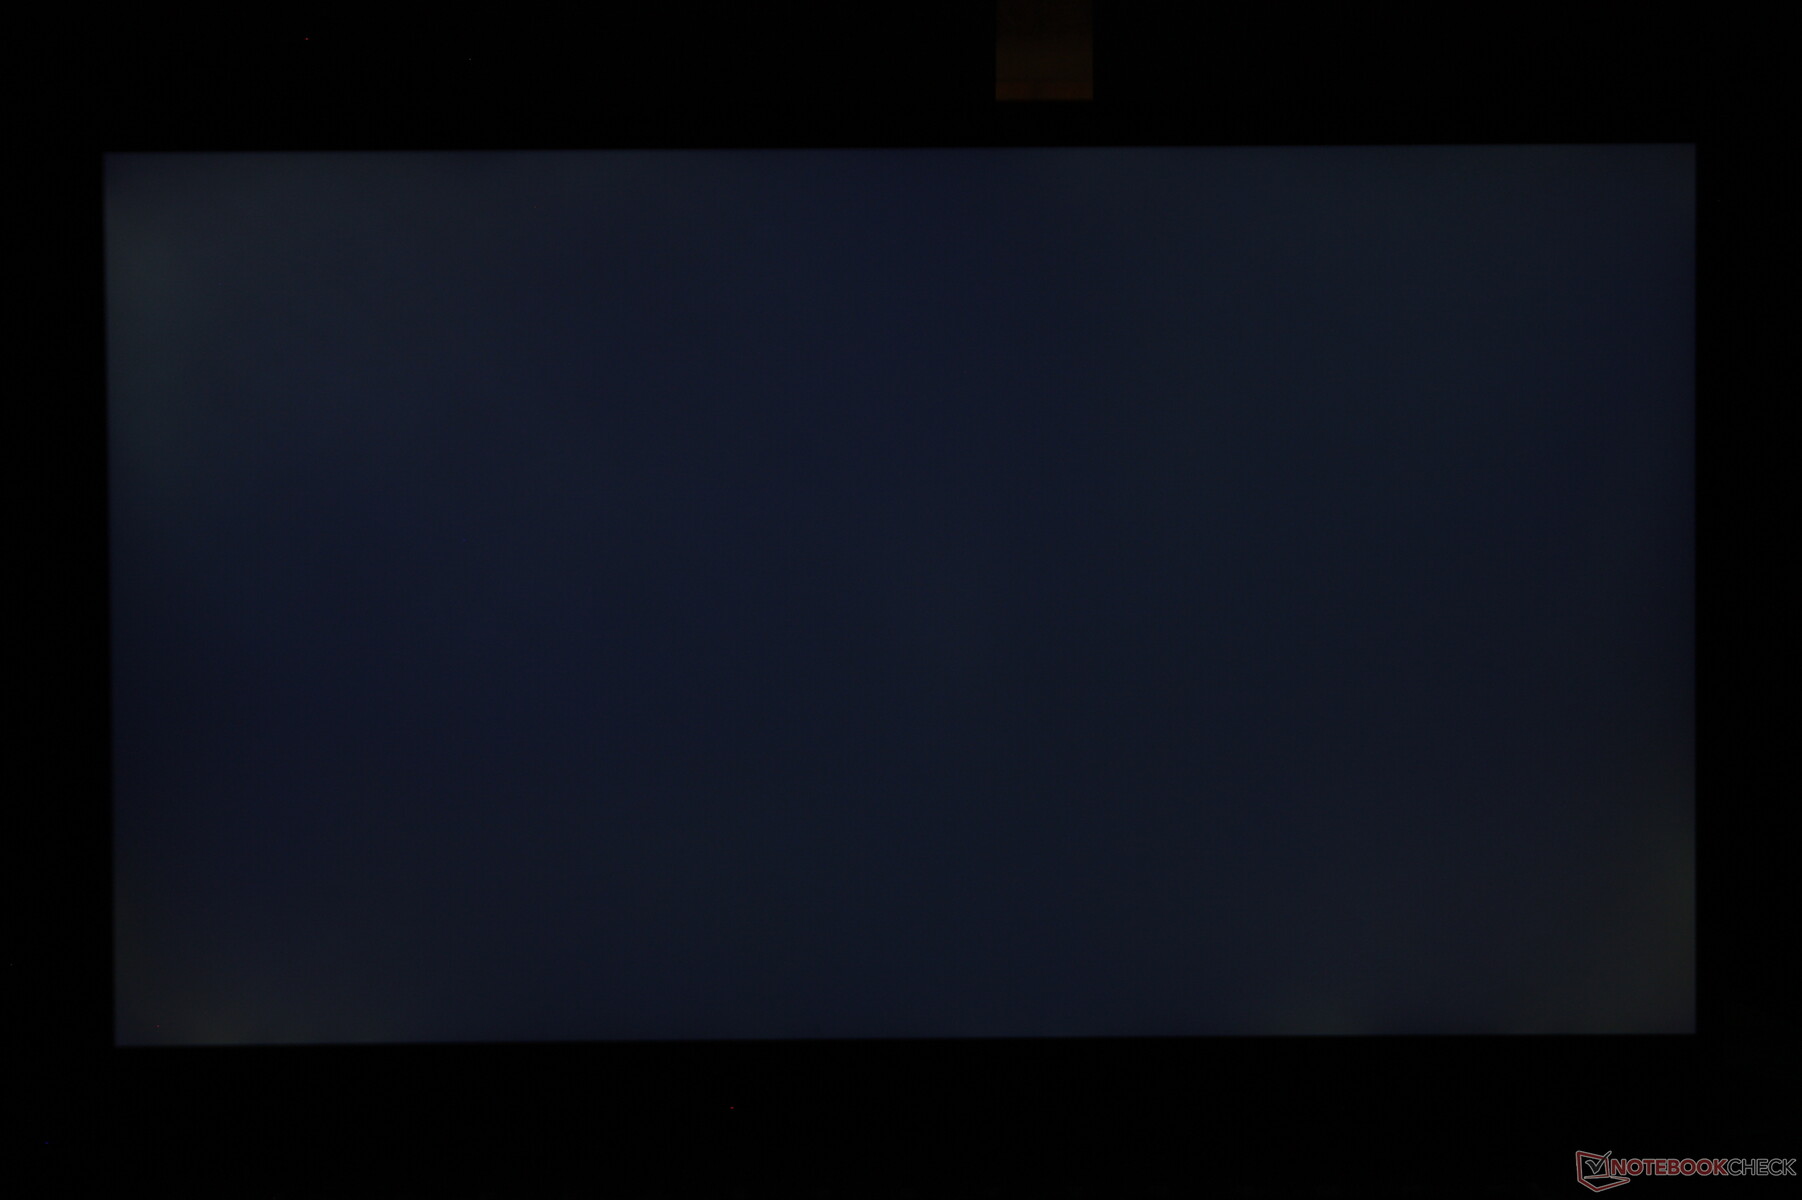
iluminação: 91 %
iluminação com acumulador: 323.3 cd/m²
Contraste: 980:1 (Preto: 0.33 cd/m²)
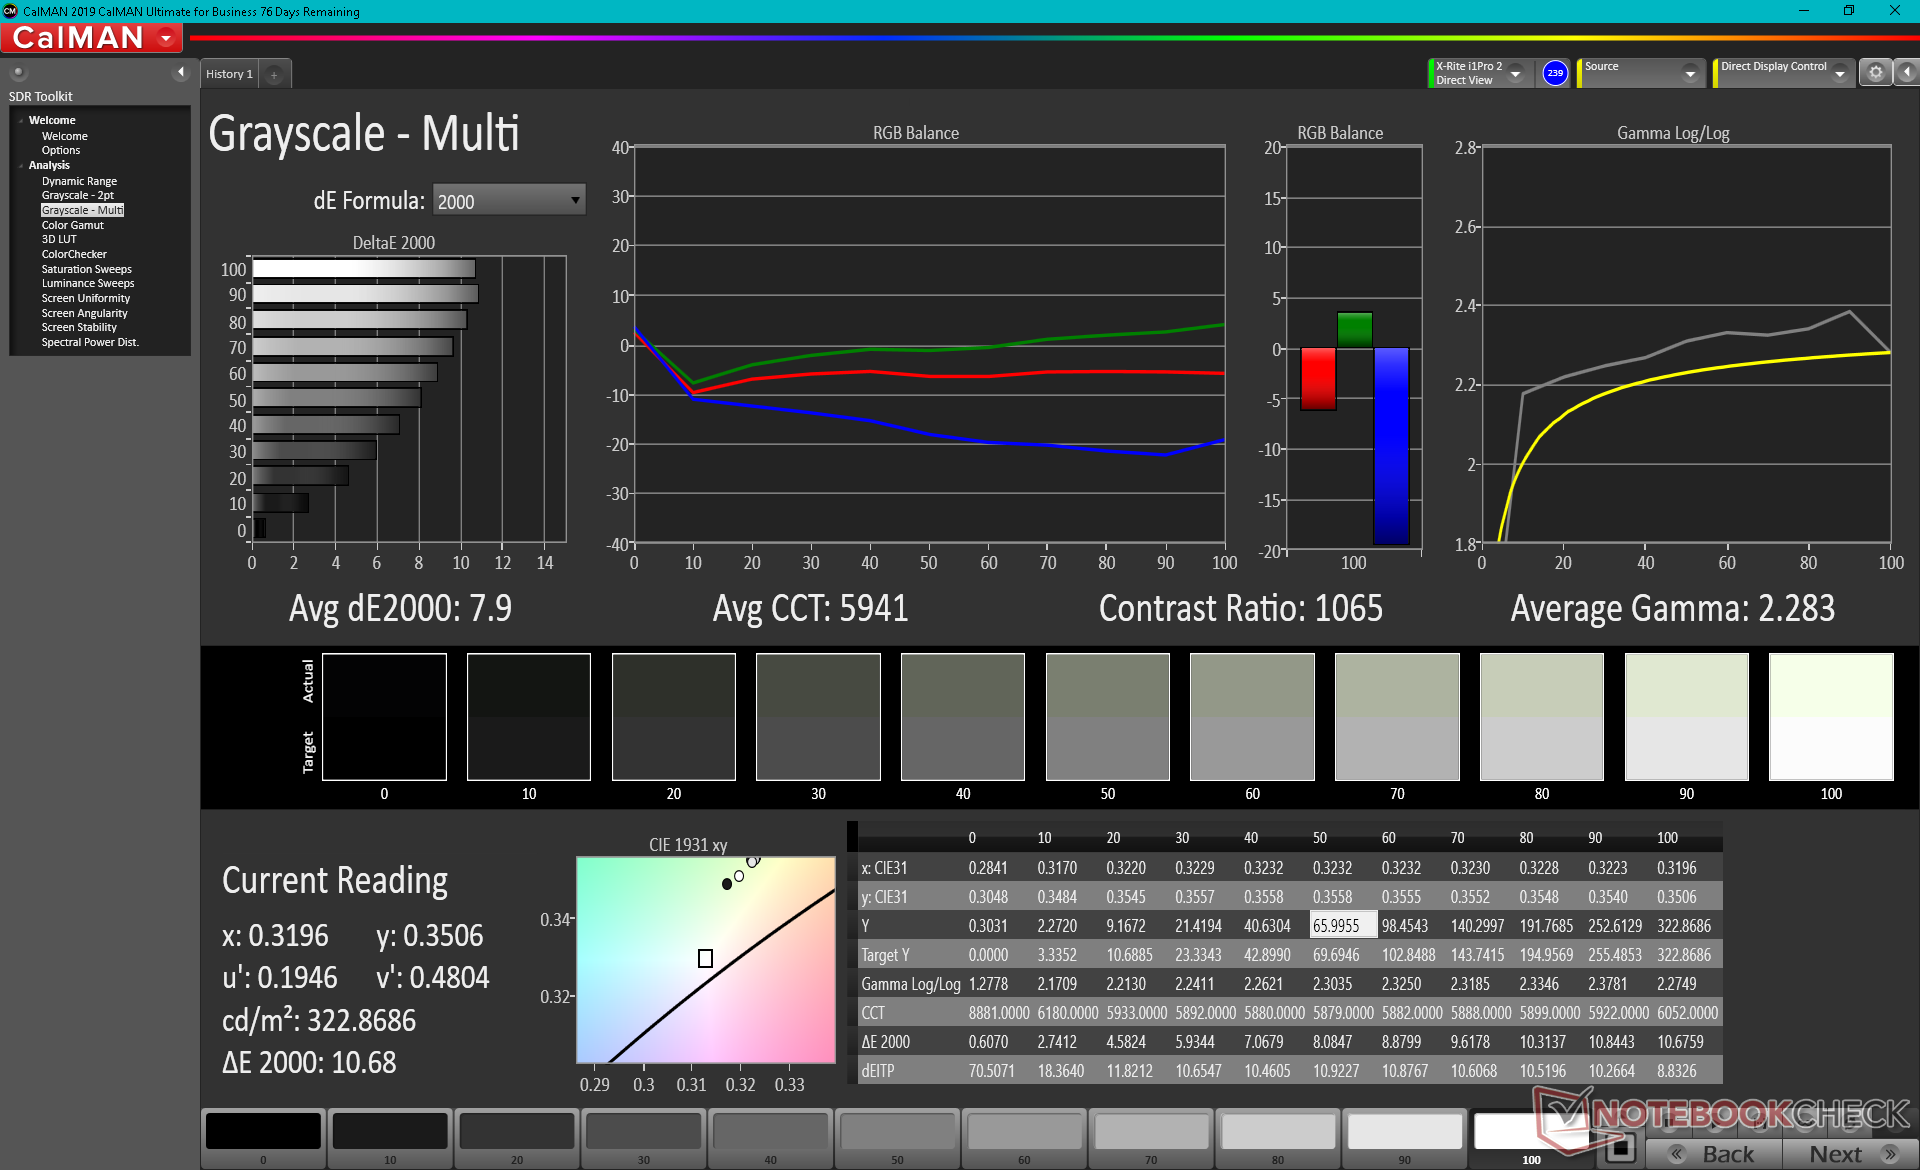
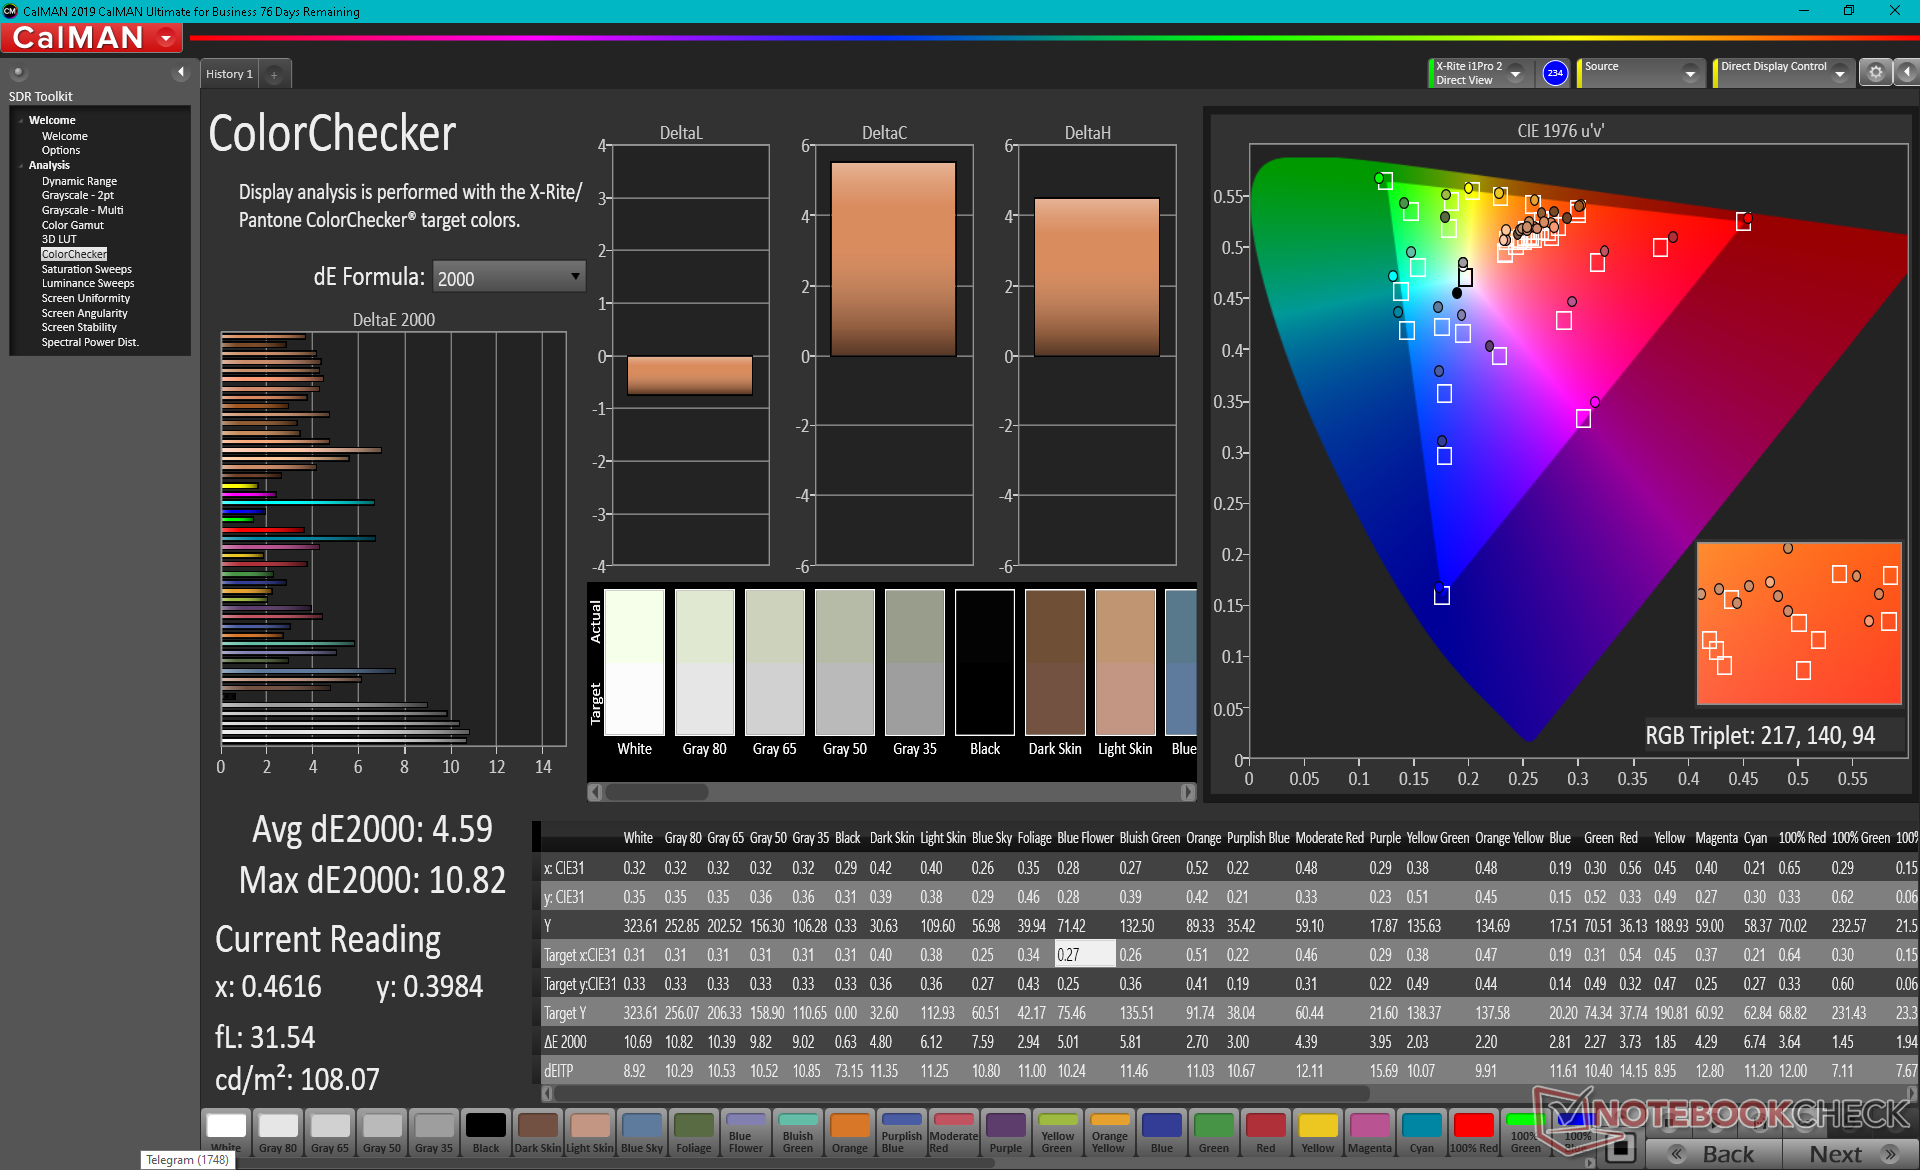
ΔE ColorChecker Calman: 4.59 | ∀{0.5-29.43 Ø4.71}
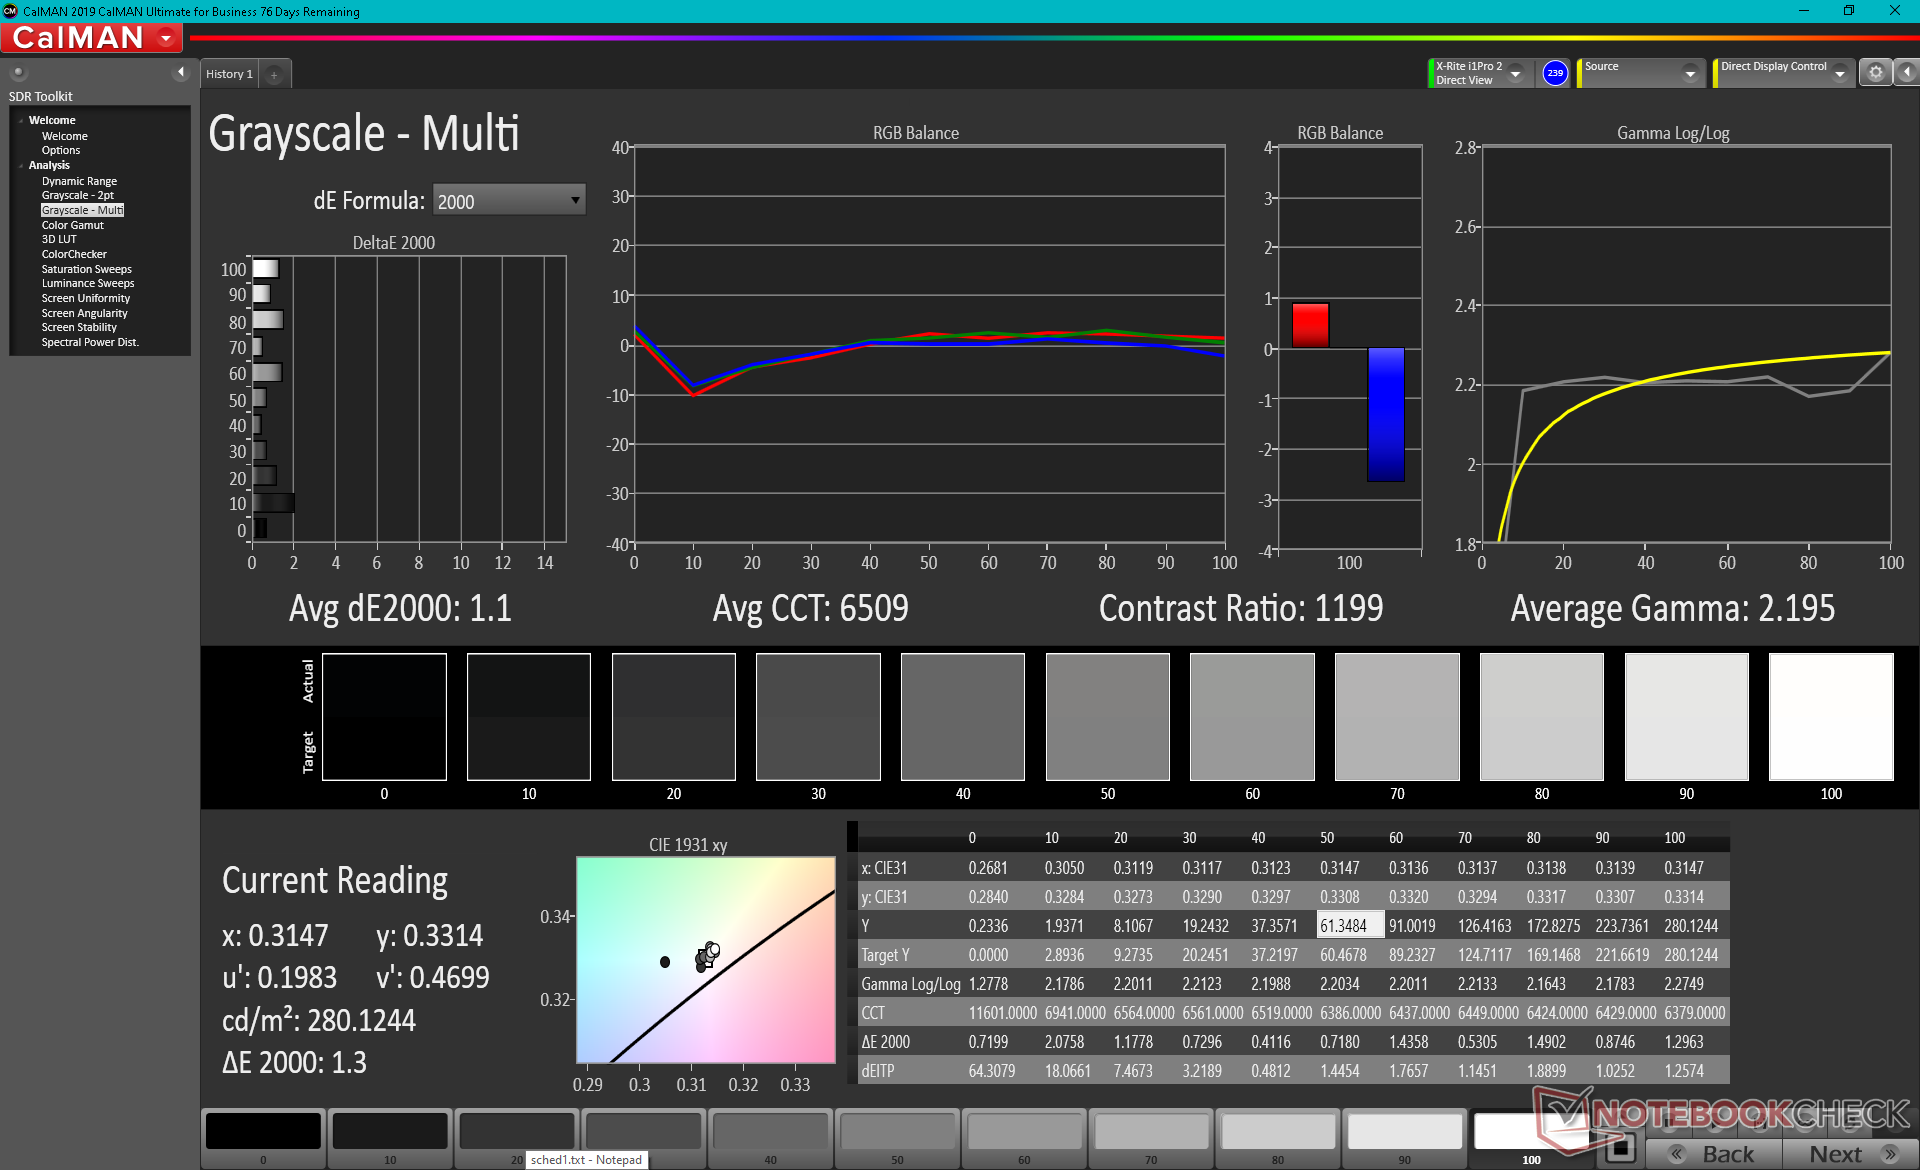
calibrated: 1.4
ΔE Greyscale Calman: 7.9 | ∀{0.09-98 Ø4.96}
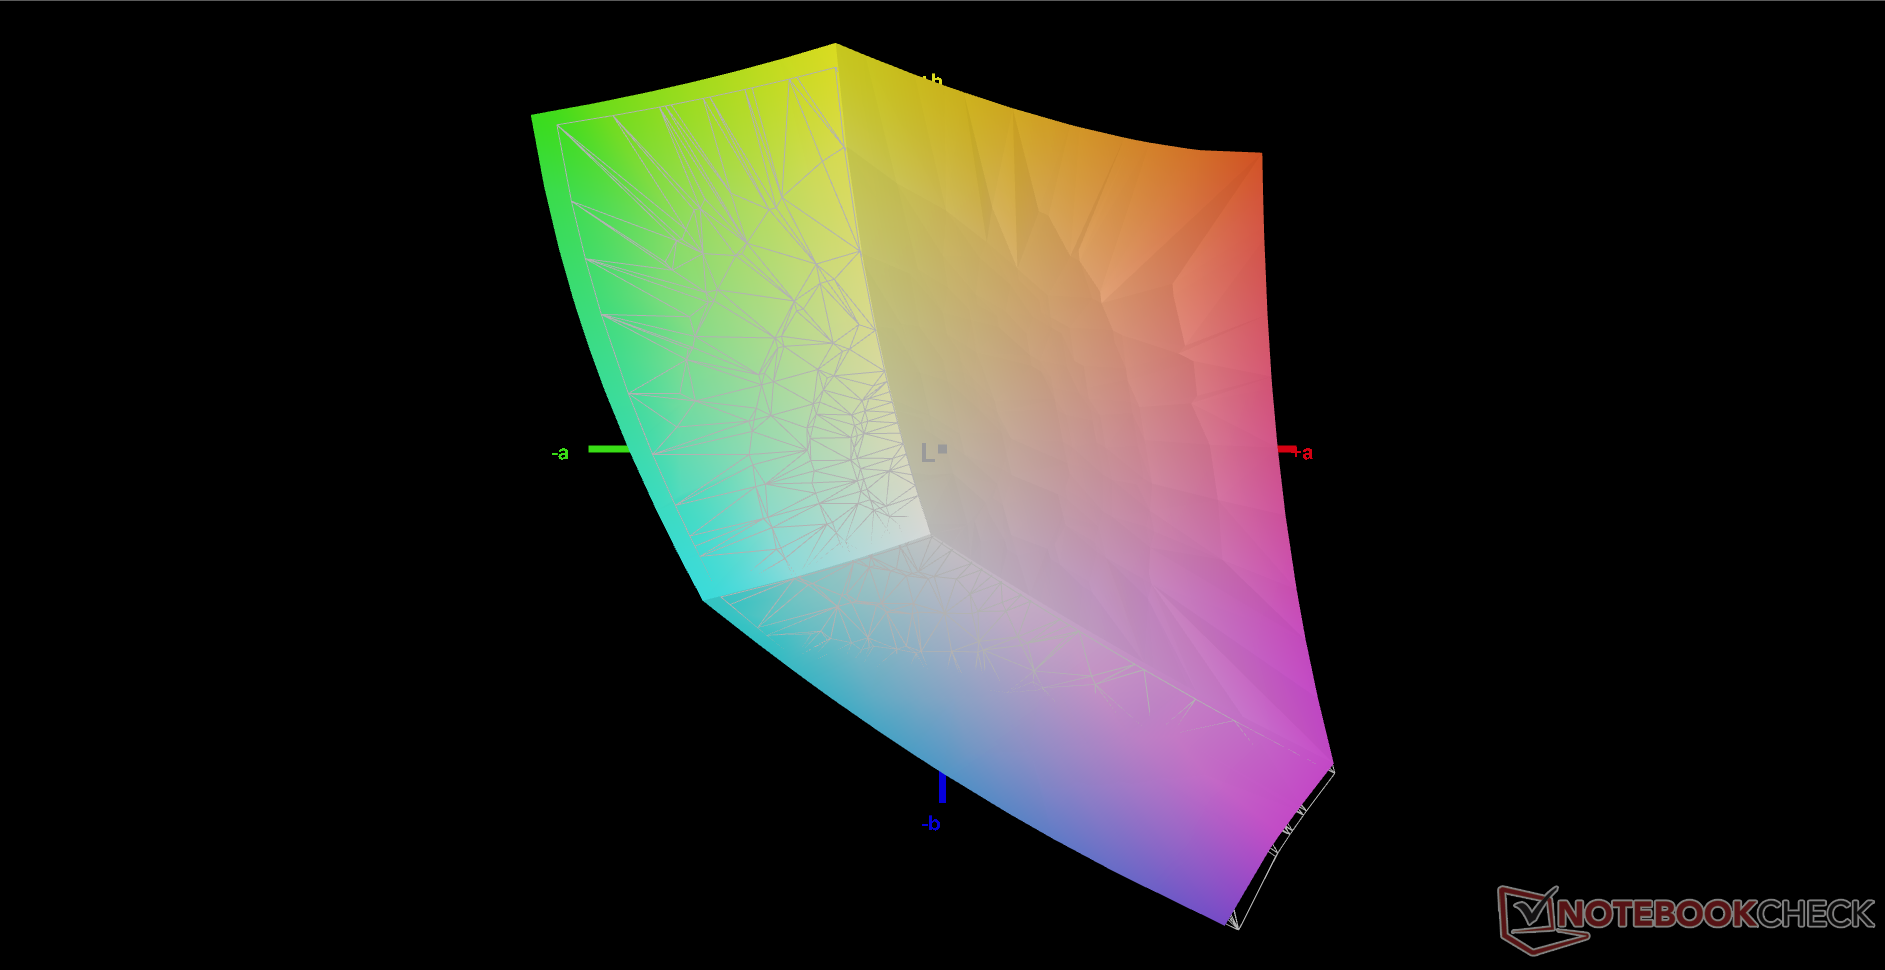
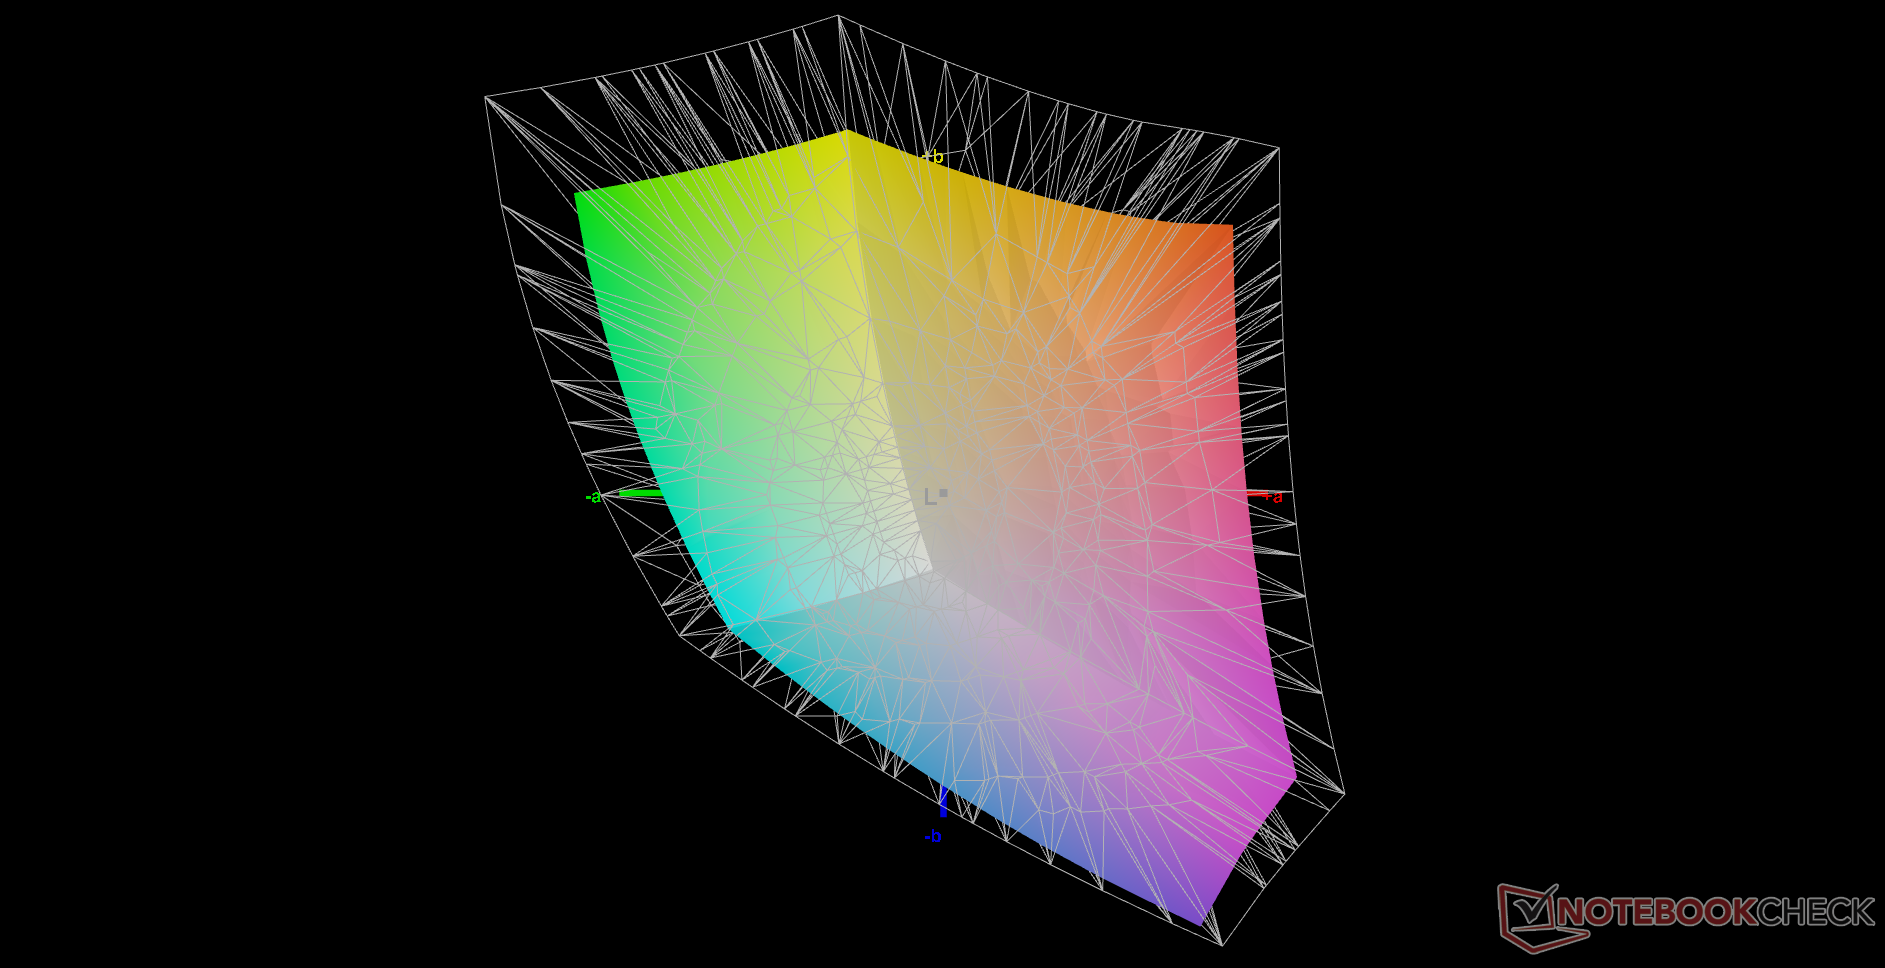
73.6% AdobeRGB 1998 (Argyll 3D)
98.8% sRGB (Argyll 3D)
71.7% Display P3 (Argyll 3D)
Gamma: 2.28
CCT: 5941 K
| Razer Blade 17 RTX 3070 AU Optronics B173HAN05.4, IPS, 17.3", 1920x1080 | Asus ROG Zephyrus S17 GX703HSD BOE099D (BOE CQ NE173QHM-NY3), IPS, 17.3", 2560x1440 | MSI GS76 Stealth 11UH AUO B173ZAN06.1 (AUODE95), IPS, 17.3", 3840x2160 | Acer Nitro 5 AN517-41-R9S5 BOE NV173FHM-NX4, IPS, 17.3", 1920x1080 | Gigabyte Aero 17 HDR YD AU Optronics AUO329B, IPS, 17.3", 3840x2160 | Maingear Vector Pro MG-VCP17 BOE NE173QHM-NY2, IPS, 17.3", 2560x1440 | |
|---|---|---|---|---|---|---|
| Display | 15% | -9% | -47% | 19% | -1% | |
| Display P3 Coverage (%) | 71.7 | 94.2 31% | 63 -12% | 36.7 -49% | 86.9 21% | 70.7 -1% |
| sRGB Coverage (%) | 98.8 | 98.7 0% | 94.8 -4% | 55.3 -44% | 100 1% | 99.4 1% |
| AdobeRGB 1998 Coverage (%) | 73.6 | 84.4 15% | 65 -12% | 37.9 -49% | 99.6 35% | 71.7 -3% |
| Response Times | -3% | -42% | -194% | -667% | -154% | |
| Response Time Grey 50% / Grey 80% * (ms) | 4.2 ? | 4.8 -14% | 8.8 ? -110% | 18 ? -329% | 52 ? -1138% | 15.6 ? -271% |
| Response Time Black / White * (ms) | 8.8 ? | 8 9% | 6.4 ? 27% | 14 ? -59% | 26 ? -195% | 12 ? -36% |
| PWM Frequency (Hz) | ||||||
| Screen | 11% | 30% | -0% | 46% | 16% | |
| Brightness middle (cd/m²) | 323.3 | 322 0% | 474 47% | 307 -5% | 488 51% | 389.7 21% |
| Brightness (cd/m²) | 315 | 288 -9% | 454 44% | 264 -16% | 467 48% | 363 15% |
| Brightness Distribution (%) | 91 | 72 -21% | 88 -3% | 76 -16% | 86 -5% | 84 -8% |
| Black Level * (cd/m²) | 0.33 | 0.3 9% | 0.46 -39% | 0.24 27% | 0.33 -0% | 0.47 -42% |
| Contrast (:1) | 980 | 1073 9% | 1030 5% | 1279 31% | 1479 51% | 829 -15% |
| Colorchecker dE 2000 * | 4.59 | 3.05 34% | 1.5 67% | 5.61 -22% | 1.23 73% | 1.93 58% |
| Colorchecker dE 2000 max. * | 10.82 | 5.23 52% | 5.59 48% | 18.29 -69% | 2.94 73% | 6.84 37% |
| Colorchecker dE 2000 calibrated * | 1.4 | 1.92 -37% | 0.86 39% | 0.77 45% | 1.31 6% | |
| Greyscale dE 2000 * | 7.9 | 3.11 61% | 2.8 65% | 2.63 67% | 1.5 81% | 2.4 70% |
| Gamma | 2.28 96% | 2.13 103% | 2.158 102% | 2.37 93% | 2.169 101% | 2.12 104% |
| CCT | 5941 109% | 6553 99% | 6597 99% | 6852 95% | 6614 98% | 6658 98% |
| Color Space (Percent of AdobeRGB 1998) (%) | 84 | 35 | 99 | |||
| Color Space (Percent of sRGB) (%) | 99 | 55 | 99 | |||
| Média Total (Programa/Configurações) | 8% /
10% | -7% /
12% | -80% /
-41% | -201% /
-61% | -46% /
-12% |
* ... menor é melhor
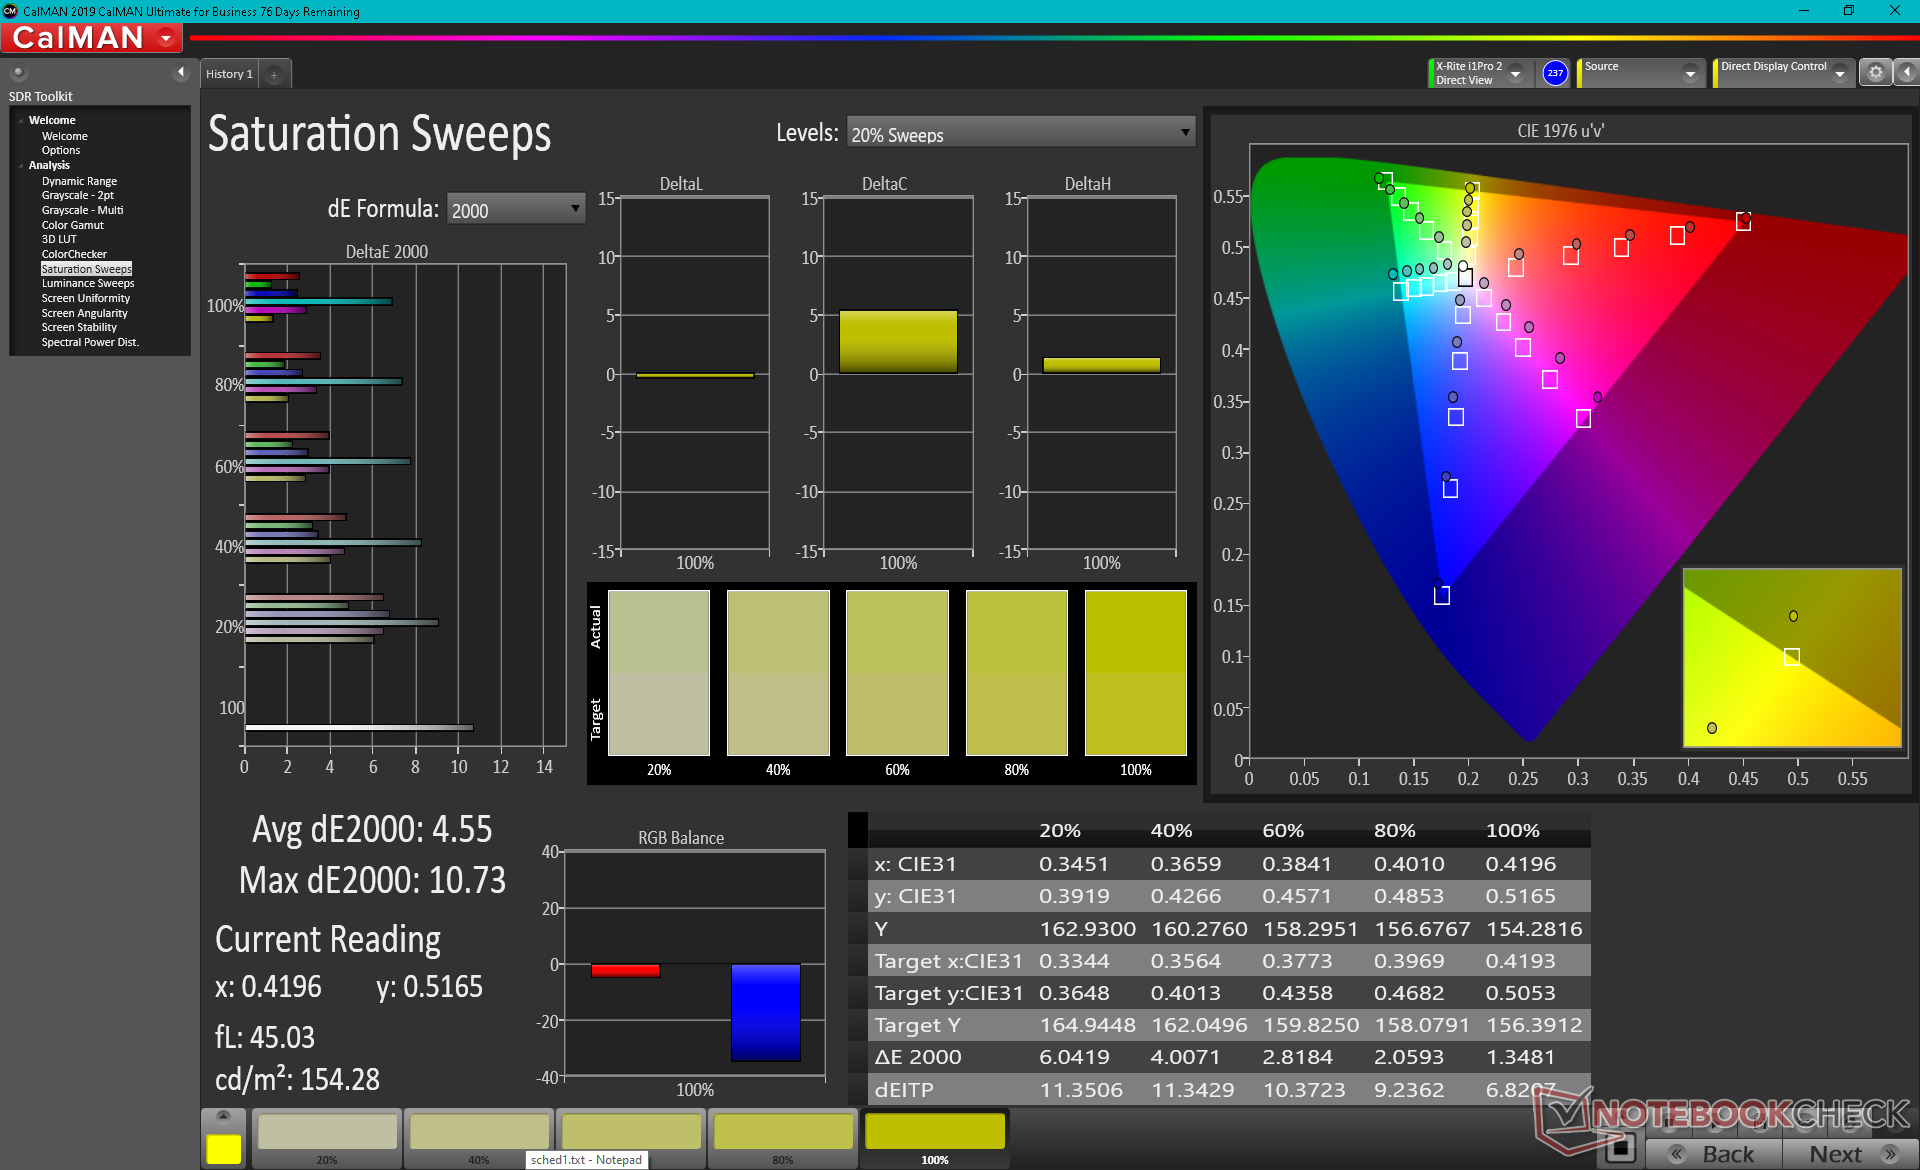
O espaço de cores cobre 100% do sRGB, tal como anunciado pelo fabricante. Para uma cobertura completa do AdobeRGB, entretanto, os usuários terão que considerar a opção 4K em seu lugar.
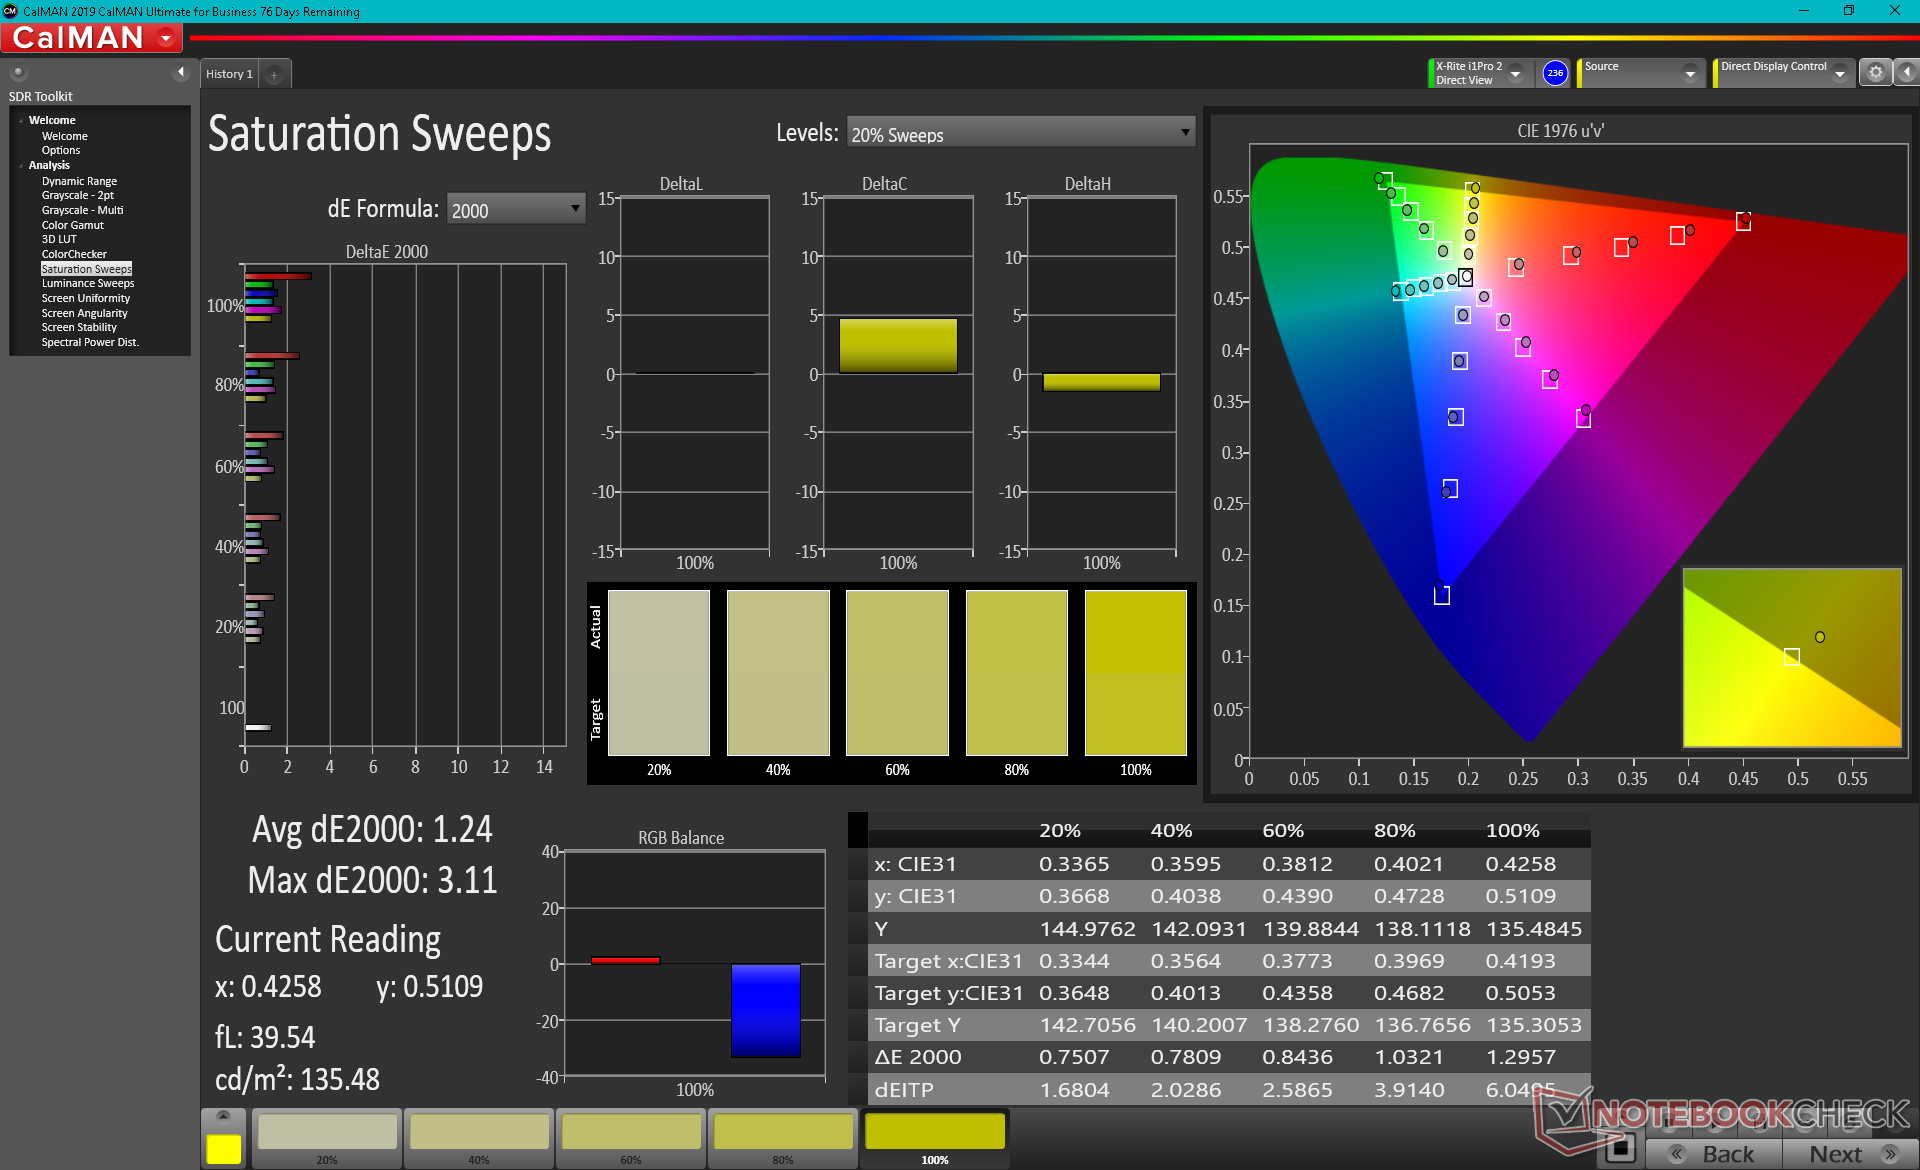
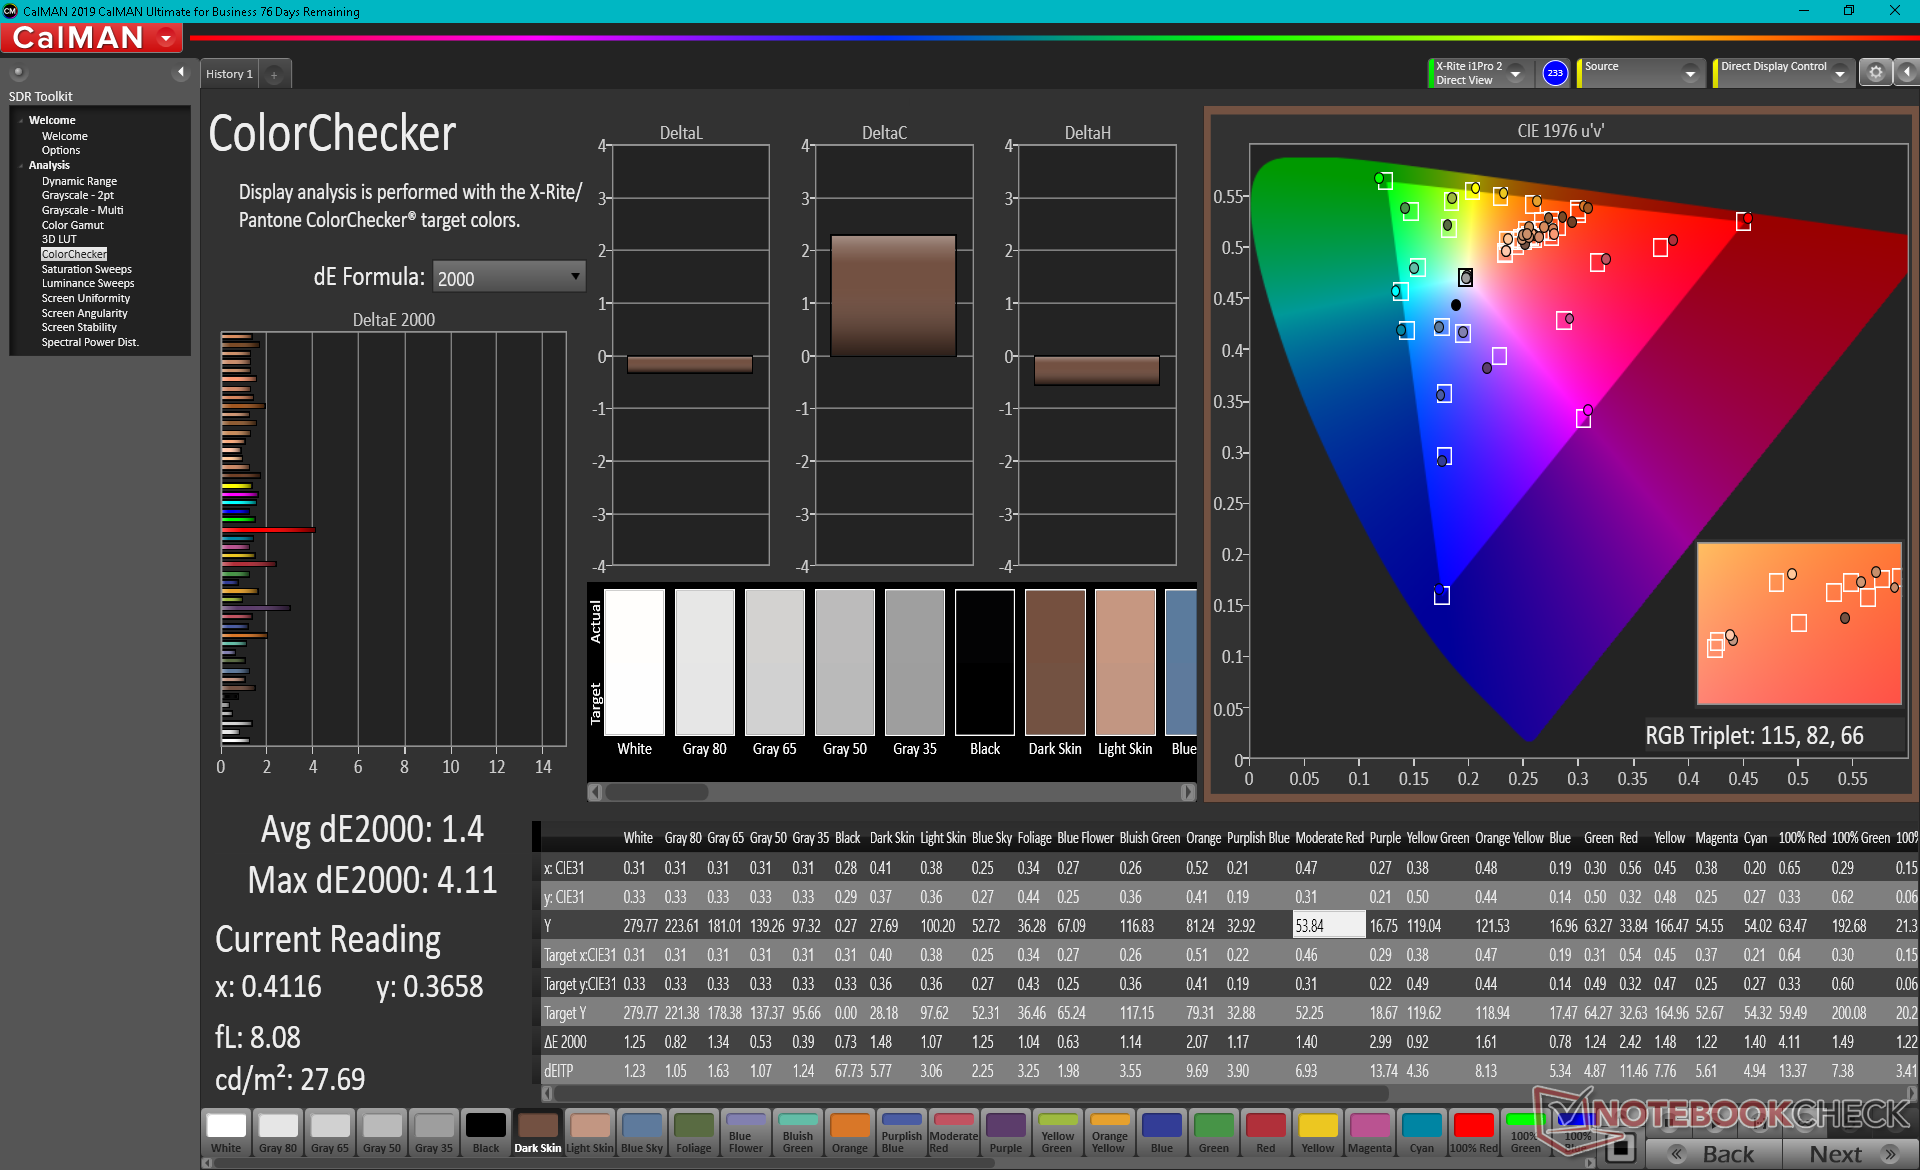
A tela precisa ser calibrada fora da caixa. A temperatura de cor é muito quente para valores médios de tons de cinza e deltaE de cor de 7,9 e 4,59, respectivamente. Apesar de nada terrível, definitivamente esperávamos mais de um varejo de laptops de alta qualidade por quase US$ 3.000. A escala de cinza e as cores melhorariam significativamente para valores médios de deltaE de menos de 2 cada, uma vez que nós mesmos calibrássemos o painel, como mostram os resultados do nosso Calman abaixo.
Exibir tempos de resposta
| ↔ Tempo de resposta preto para branco | ||
|---|---|---|
| 8.8 ms ... ascensão ↗ e queda ↘ combinadas | ↗ 4.4 ms ascensão | 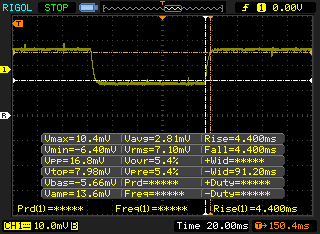 |
| ↘ 4.4 ms queda | ||
| A tela mostra taxas de resposta rápidas em nossos testes e deve ser adequada para jogos. Em comparação, todos os dispositivos testados variam de 0.1 (mínimo) a 240 (máximo) ms. » 25 % de todos os dispositivos são melhores. Isso significa que o tempo de resposta medido é melhor que a média de todos os dispositivos testados (19.8 ms). | ||
| ↔ Tempo de resposta 50% cinza a 80% cinza | ||
| 4.2 ms ... ascensão ↗ e queda ↘ combinadas | ↗ 1.6 ms ascensão | 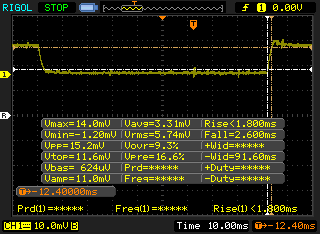 |
| ↘ 2.6 ms queda | ||
| A tela mostra taxas de resposta muito rápidas em nossos testes e deve ser muito adequada para jogos em ritmo acelerado. Em comparação, todos os dispositivos testados variam de 0.165 (mínimo) a 636 (máximo) ms. » 16 % de todos os dispositivos são melhores. Isso significa que o tempo de resposta medido é melhor que a média de todos os dispositivos testados (31 ms). | ||
Cintilação da tela / PWM (modulação por largura de pulso)
| Tela tremeluzindo / PWM não detectado | 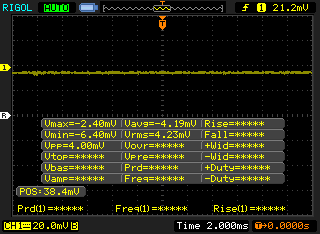 | ||
[pwm_comparison] Em comparação: 52 % de todos os dispositivos testados não usam PWM para escurecer a tela. Se PWM foi detectado, uma média de 7754 (mínimo: 5 - máximo: 343500) Hz foi medida. | |||
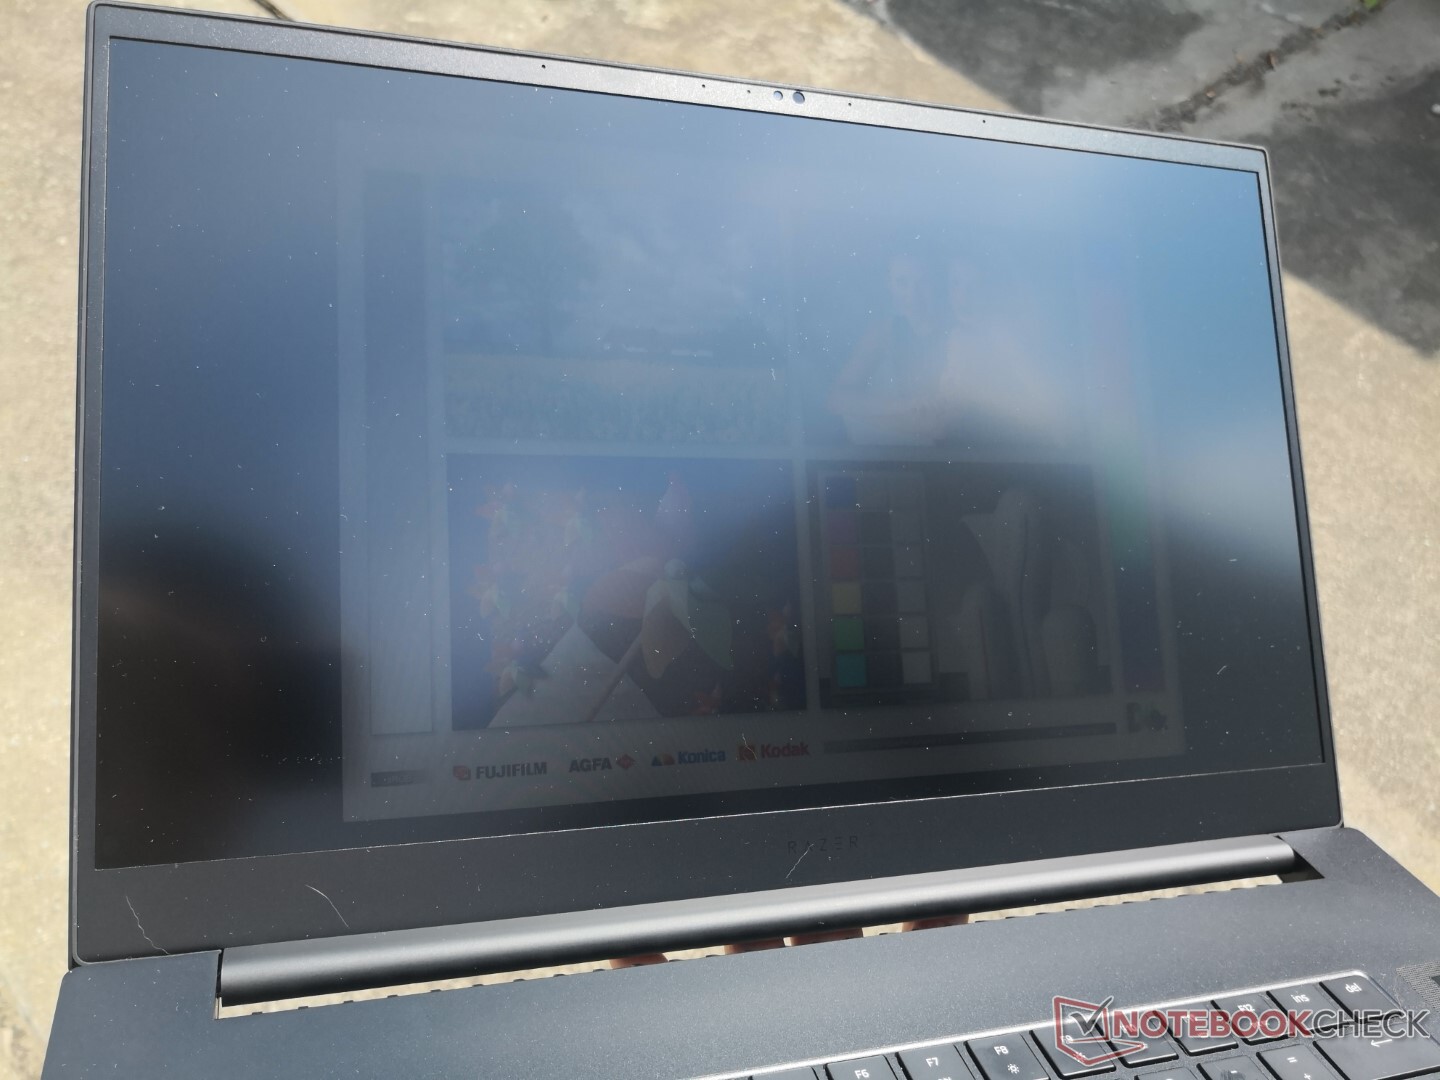
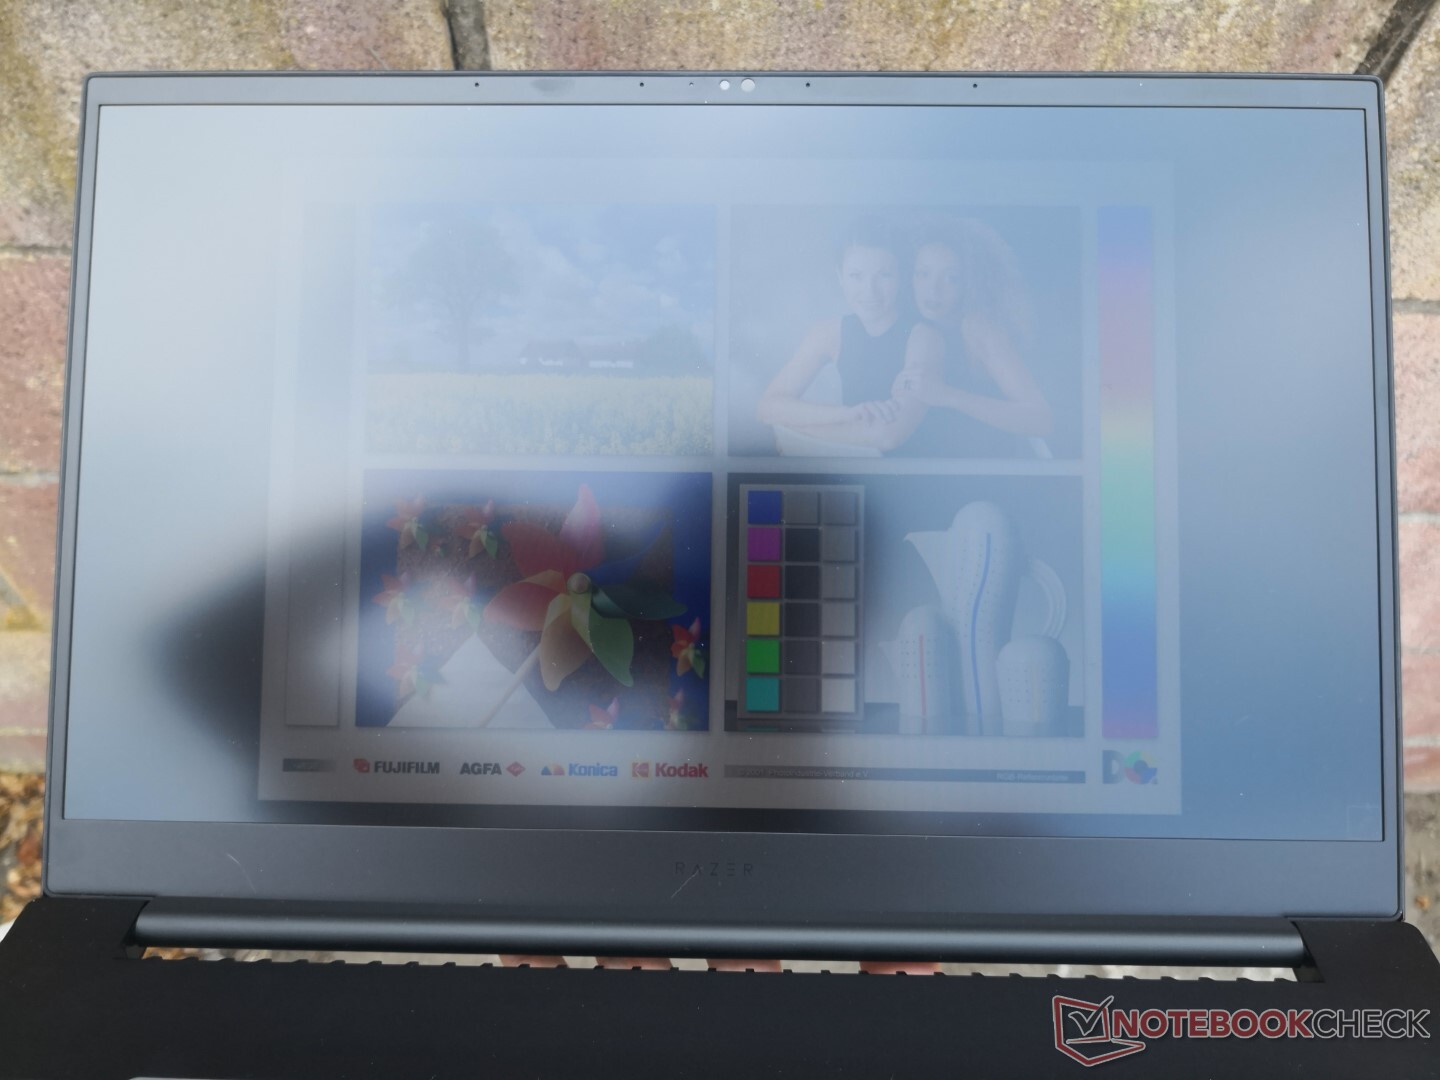
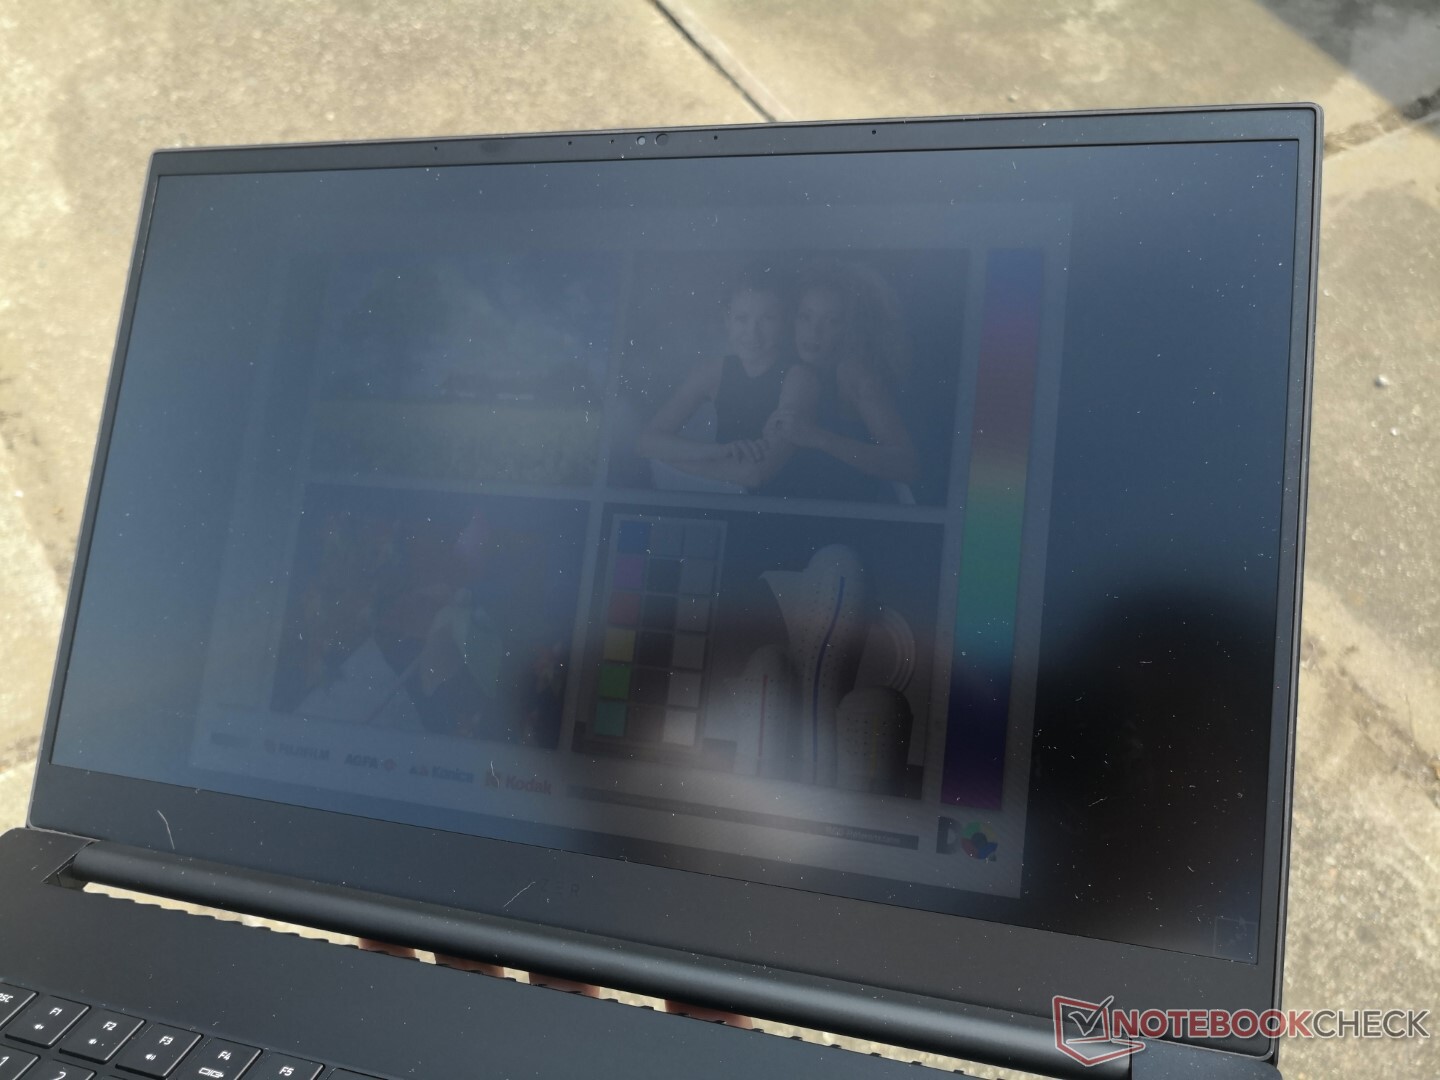
A visibilidade externa não mudou em relação ao modelo do ano passado desde o contraste e a luminosidade máxima continua quase a mesma. A opção de tela tátil 4K pode ser mais brilhante, mas os usuários terão que levar em conta o aumento do brilho de sua cobertura brilhante também.

Desempenho - 130 W TGP GeForce RTX Graphics
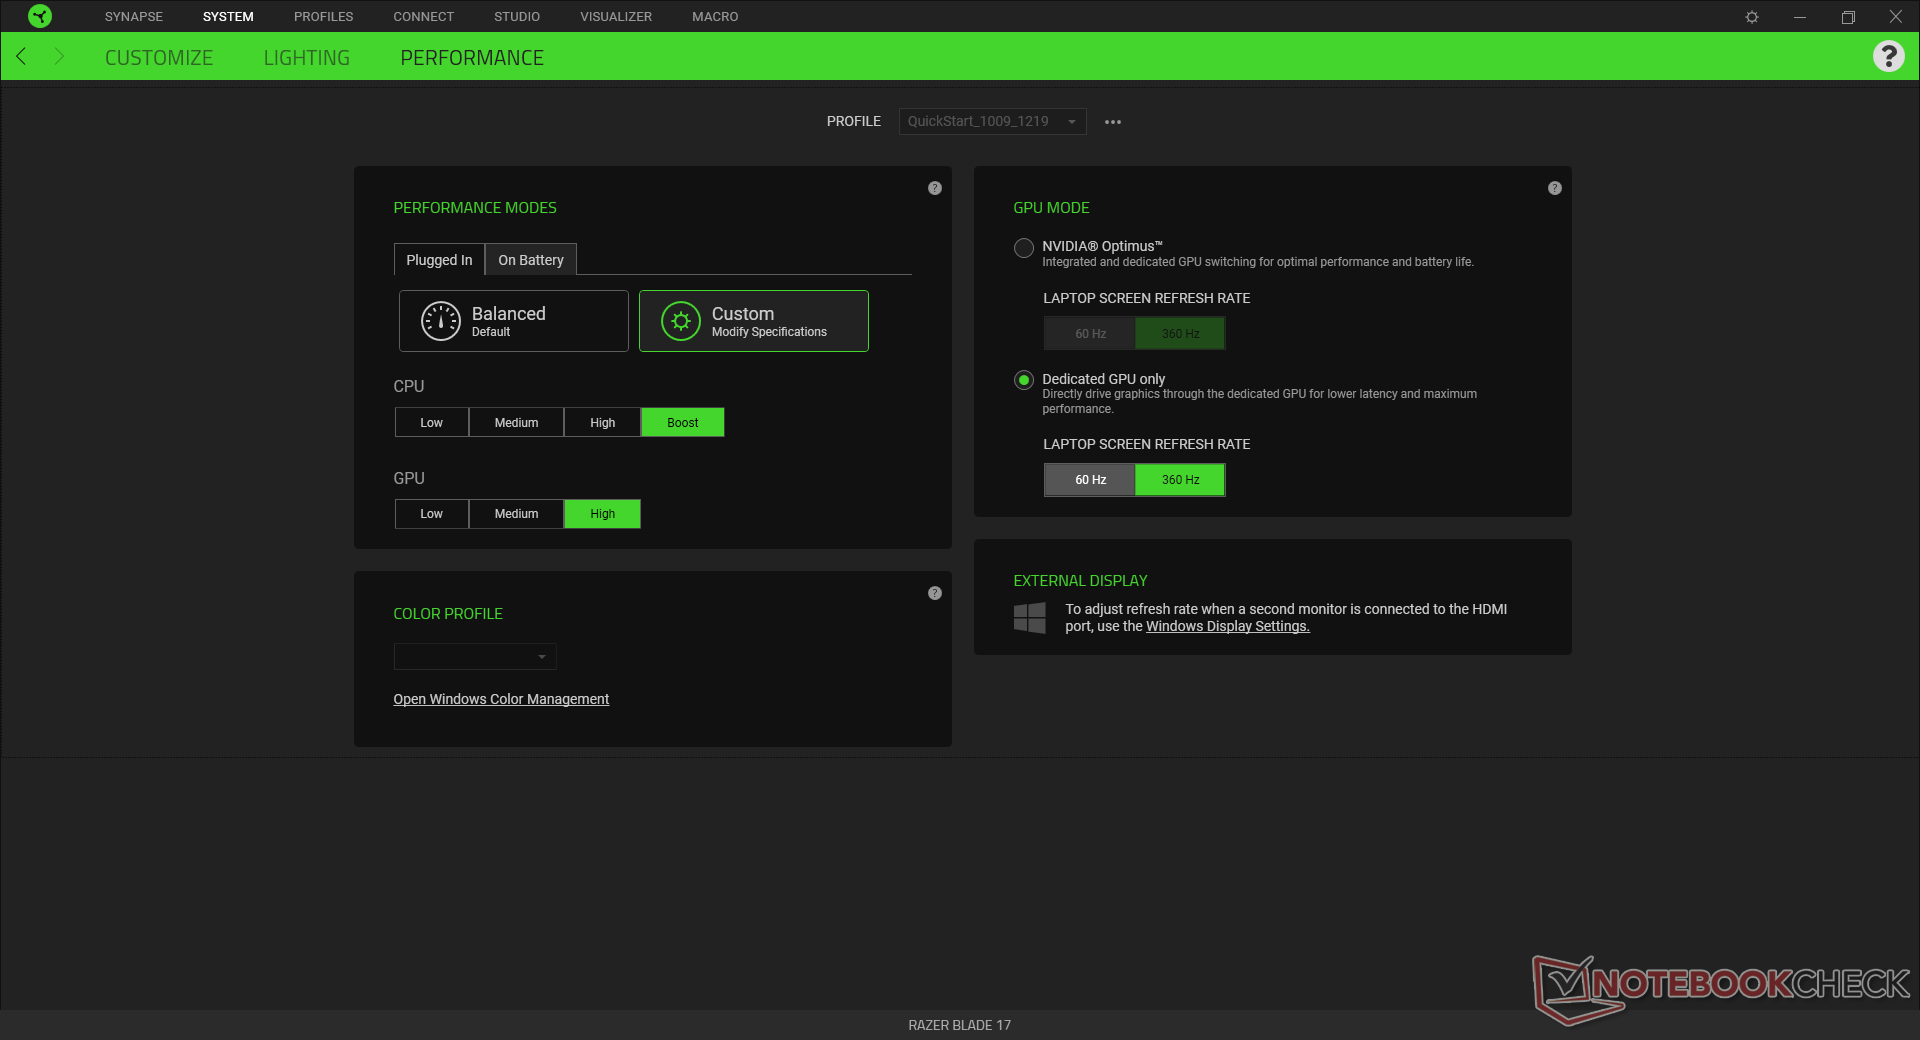
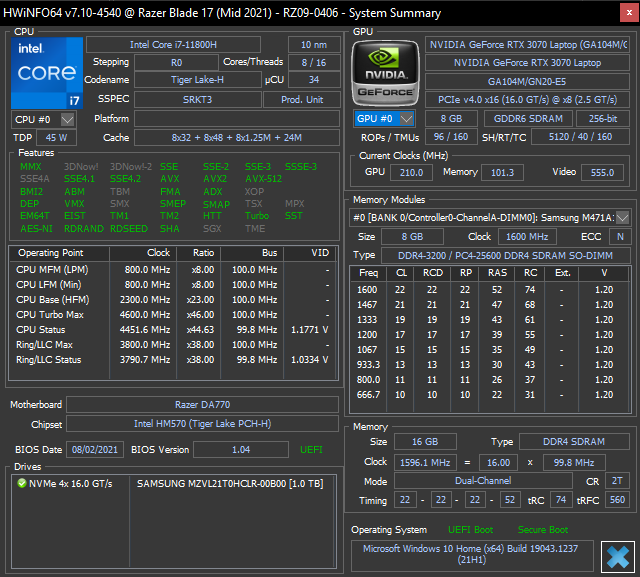
Os usuários podem agora escolher entre a 11ª geração Tiger Lake-H Núcleo i7-11800H ou Núcleo i9-11900H para substituir as opções Comet Lake-H do 10º gênero do ano passado. Além do óbvio aumento de desempenho, as novas CPUs também suportam nativamente a conectividade PCIe4 e Thunderbolt 4. Barra redimensionável, Dynamic Boost 2.0 e WhisperMode 2.0 são todas suportadas.
O Advanced Optimus (ou Optimus 2.0) não é suportado, o que significa que os usuários ainda terão que alternar e reiniciar manualmente entre o dGPU e o iGPU através do software Razer. Espere um pequeno acerto no desempenho se estiver rodando no modo Optimus. Recomendamos aos usuários que se familiarizem com o Razer Central, pois importantes personalizações e opções de desempenho são encontradas aqui.
Processador - Sem AMD... Ainda
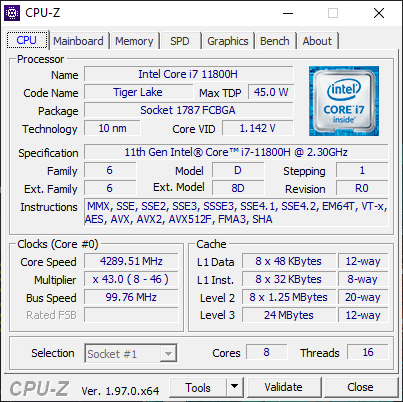
Nosso Core i7-11800H é um excelente passo acima do Núcleo i7-10875H como encontrado no Blade Pro do ano passado. O desempenho multi-linhas em particular é 25 a 40 por cento mais rápido para finalmente estar no mesmo nível das CPUs Zen 2 ou Zen 3 concorrentes, como as Ryzen 7 5800H. A atualização para o Core i9-10900H deve trazer apenas um aumento de 5% a 10% no desempenho bruto com base em nossa experiência com outros laptops Core i9-11900H, como o MSI GS76 Stealth.
Vale a pena notar que o Ryzen 9 5900HX no Lâmina 14 é do pescoço ao pescoço com nossa i7-11800H em desempenho de múltiplas roscas, enquanto está atrasada em desempenho de rosca única em cerca de 15 a 20 por cento.
Cinebench R15 Multi Loop
Cinebench R23: Multi Core | Single Core
Cinebench R15: CPU Multi 64Bit | CPU Single 64Bit
Blender: v2.79 BMW27 CPU
7-Zip 18.03: 7z b 4 -mmt1 | 7z b 4
Geekbench 5.5: Single-Core | Multi-Core
HWBOT x265 Benchmark v2.2: 4k Preset
LibreOffice : 20 Documents To PDF
R Benchmark 2.5: Overall mean
| Cinebench R23 / Multi Core | |
| MSI GS76 Stealth 11UH | |
| Asus ROG Strix G17 G713QE-RB74 | |
| Razer Blade 14 Ryzen 9 RTX 3070 | |
| Razer Blade 17 RTX 3070 | |
| Média Intel Core i7-11800H (6508 - 14088, n=48) | |
| Alienware m17 R4 | |
| MSI GE76 Raider 10UH | |
| Cinebench R23 / Single Core | |
| MSI GS76 Stealth 11UH | |
| Razer Blade 17 RTX 3070 | |
| Média Intel Core i7-11800H (1386 - 1522, n=45) | |
| Asus ROG Strix G17 G713QE-RB74 | |
| Alienware m17 R4 | |
| Razer Blade 14 Ryzen 9 RTX 3070 | |
| MSI GE76 Raider 10UH | |
| Geekbench 5.5 / Single-Core | |
| MSI GS76 Stealth 11UH | |
| Gigabyte Aero 17 HDR YD | |
| Média Intel Core i7-11800H (1429 - 1625, n=40) | |
| Alienware m17 R4 | |
| Razer Blade Pro 17 RTX 2070 Max-Q 300 Hz | |
| MSI GE76 Raider 10UH | |
| MSI Alpha 17 A4DEK | |
| Geekbench 5.5 / Multi-Core | |
| Gigabyte Aero 17 HDR YD | |
| MSI GS76 Stealth 11UH | |
| Média Intel Core i7-11800H (4655 - 9851, n=40) | |
| Alienware m17 R4 | |
| MSI Alpha 17 A4DEK | |
| MSI GE76 Raider 10UH | |
| Razer Blade Pro 17 RTX 2070 Max-Q 300 Hz | |
| HWBOT x265 Benchmark v2.2 / 4k Preset | |
| Gigabyte Aero 17 HDR YD | |
| Razer Blade 14 Ryzen 9 RTX 3070 | |
| Razer Blade 17 RTX 3070 | |
| MSI GS76 Stealth 11UH | |
| Asus ROG Strix G17 G713QE-RB74 | |
| Alienware m17 R4 | |
| Média Intel Core i7-11800H (7.38 - 17.4, n=46) | |
| MSI GE76 Raider 10UH | |
| MSI Alpha 17 A4DEK | |
| MSI GE75 9SG | |
| LibreOffice / 20 Documents To PDF | |
| MSI Alpha 17 A4DEK | |
| Razer Blade 14 Ryzen 9 RTX 3070 | |
| Razer Blade Pro 17 RTX 2070 Max-Q 300 Hz | |
| Asus ROG Strix G17 G713QE-RB74 | |
| Alienware m17 R4 | |
| MSI GS76 Stealth 11UH | |
| MSI GE76 Raider 10UH | |
| Média Intel Core i7-11800H (38.6 - 59.9, n=45) | |
| Razer Blade 17 RTX 3070 | |
| Gigabyte Aero 17 HDR YD | |
| R Benchmark 2.5 / Overall mean | |
| Razer Blade 14 Ryzen 9 RTX 3070 | |
| MSI GE76 Raider 10UH | |
| MSI Alpha 17 A4DEK | |
| Alienware m17 R4 | |
| Média Intel Core i7-11800H (0.548 - 0.615, n=46) | |
| Razer Blade 17 RTX 3070 | |
| Gigabyte Aero 17 HDR YD | |
| MSI GS76 Stealth 11UH | |
| Asus ROG Strix G17 G713QE-RB74 | |
* ... menor é melhor
Desempenho do sistema
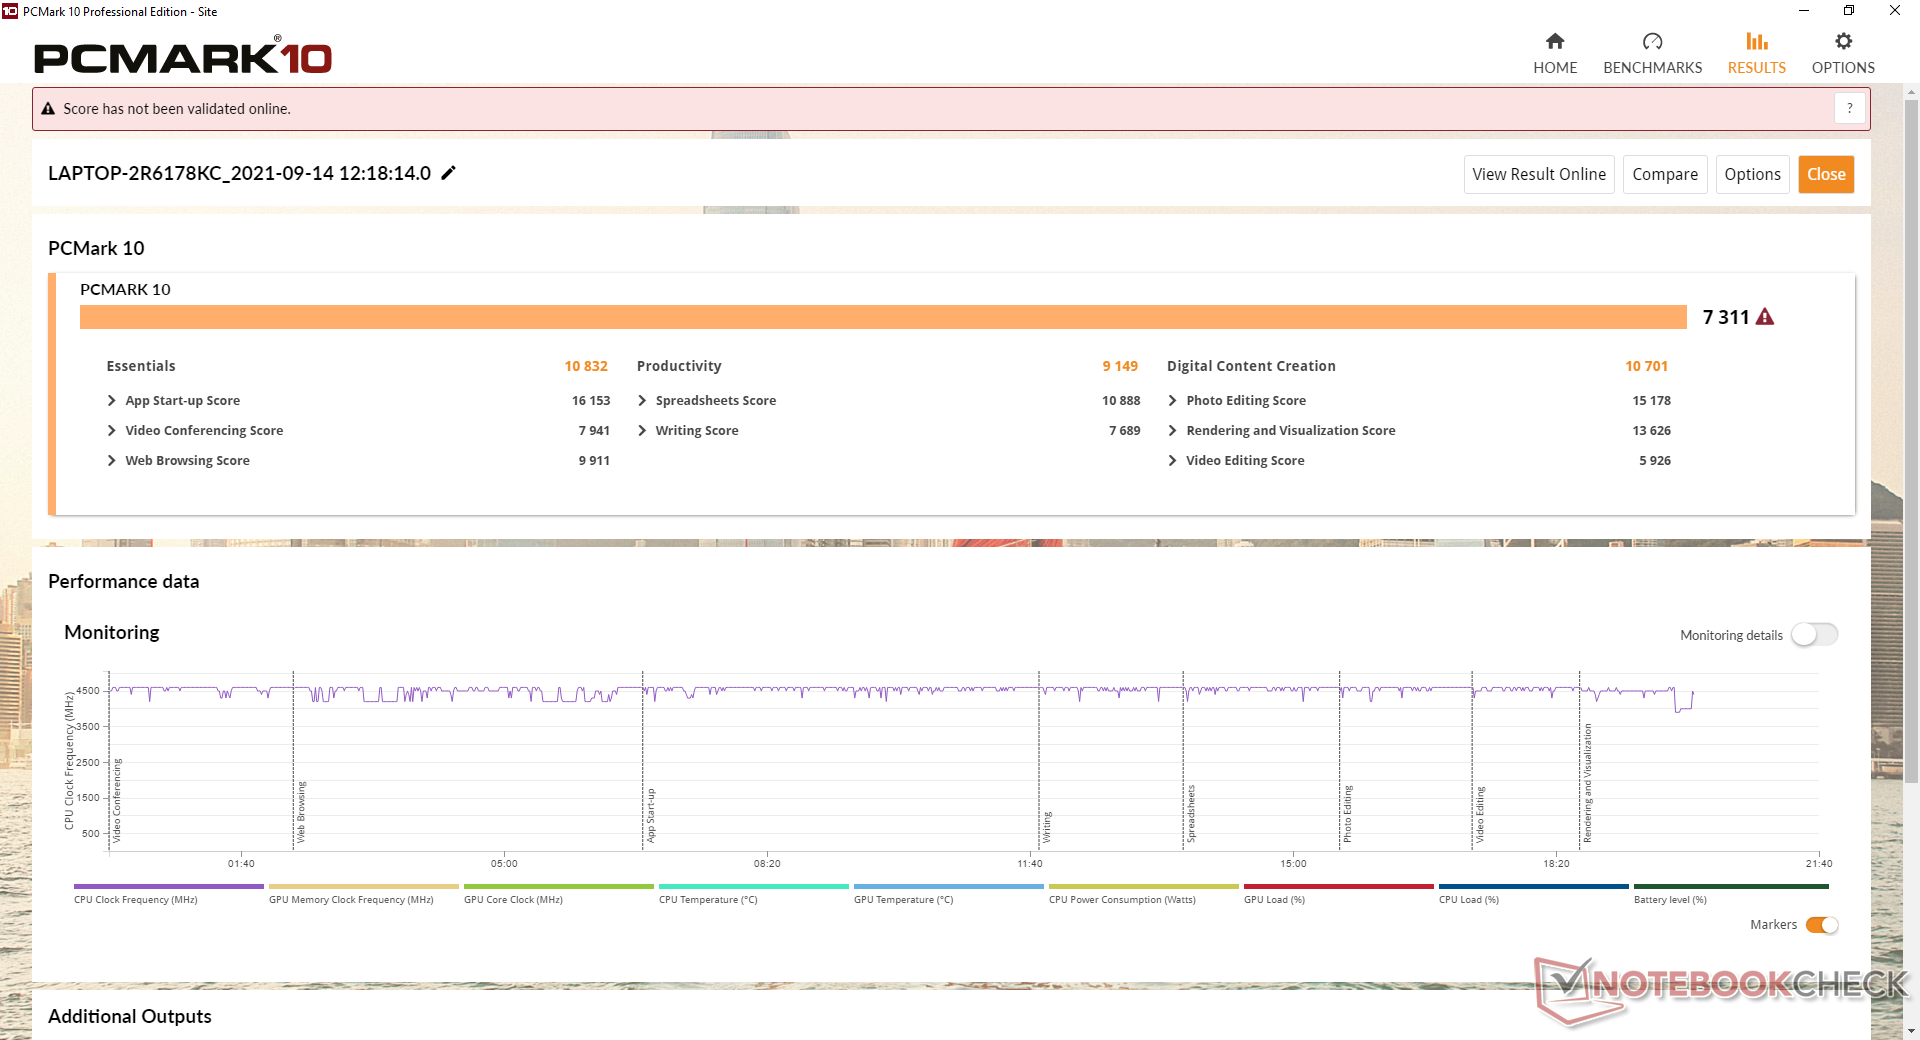
As pontuações do PCMark 10 são notavelmente mais altas do que qualquer laptop Blade Pro que tenhamos testado no passado. O salto pode ser parcialmente atribuído ao SSD PCIe4 NVMe que Tiger Lake-H chipsets suportam nativamente e o impulso no desempenho de CPU multi-thread.
| PCMark 10 / Score | |
| Razer Blade 17 RTX 3070 | |
| Média Intel Core i7-11800H, NVIDIA GeForce RTX 3070 Laptop GPU (6126 - 7311, n=11) | |
| Razer Blade Pro 17 2021 (QHD Touch) | |
| Razer Blade Pro 17 RTX 2070 Max-Q 300 Hz | |
| Razer Blade Pro 17 4K UHD 120 Hz | |
| Razer Blade Pro 17 RTX 2080 Max-Q | |
| Razer Blade Pro 17 RTX 2060 | |
| PCMark 10 / Essentials | |
| Razer Blade 17 RTX 3070 | |
| Média Intel Core i7-11800H, NVIDIA GeForce RTX 3070 Laptop GPU (9248 - 10832, n=11) | |
| Razer Blade Pro 17 4K UHD 120 Hz | |
| Razer Blade Pro 17 2021 (QHD Touch) | |
| Razer Blade Pro 17 RTX 2070 Max-Q 300 Hz | |
| Razer Blade Pro 17 RTX 2080 Max-Q | |
| Razer Blade Pro 17 RTX 2060 | |
| PCMark 10 / Productivity | |
| Razer Blade 17 RTX 3070 | |
| Média Intel Core i7-11800H, NVIDIA GeForce RTX 3070 Laptop GPU (8571 - 9669, n=11) | |
| Razer Blade Pro 17 2021 (QHD Touch) | |
| Razer Blade Pro 17 RTX 2070 Max-Q 300 Hz | |
| Razer Blade Pro 17 RTX 2060 | |
| Razer Blade Pro 17 RTX 2080 Max-Q | |
| Razer Blade Pro 17 4K UHD 120 Hz | |
| PCMark 10 / Digital Content Creation | |
| Razer Blade 17 RTX 3070 | |
| Média Intel Core i7-11800H, NVIDIA GeForce RTX 3070 Laptop GPU (7627 - 10851, n=11) | |
| Razer Blade Pro 17 2021 (QHD Touch) | |
| Razer Blade Pro 17 4K UHD 120 Hz | |
| Razer Blade Pro 17 RTX 2070 Max-Q 300 Hz | |
| Razer Blade Pro 17 RTX 2080 Max-Q | |
| Razer Blade Pro 17 RTX 2060 | |
| PCMark 10 Score | 7311 pontos | |
Ajuda | ||
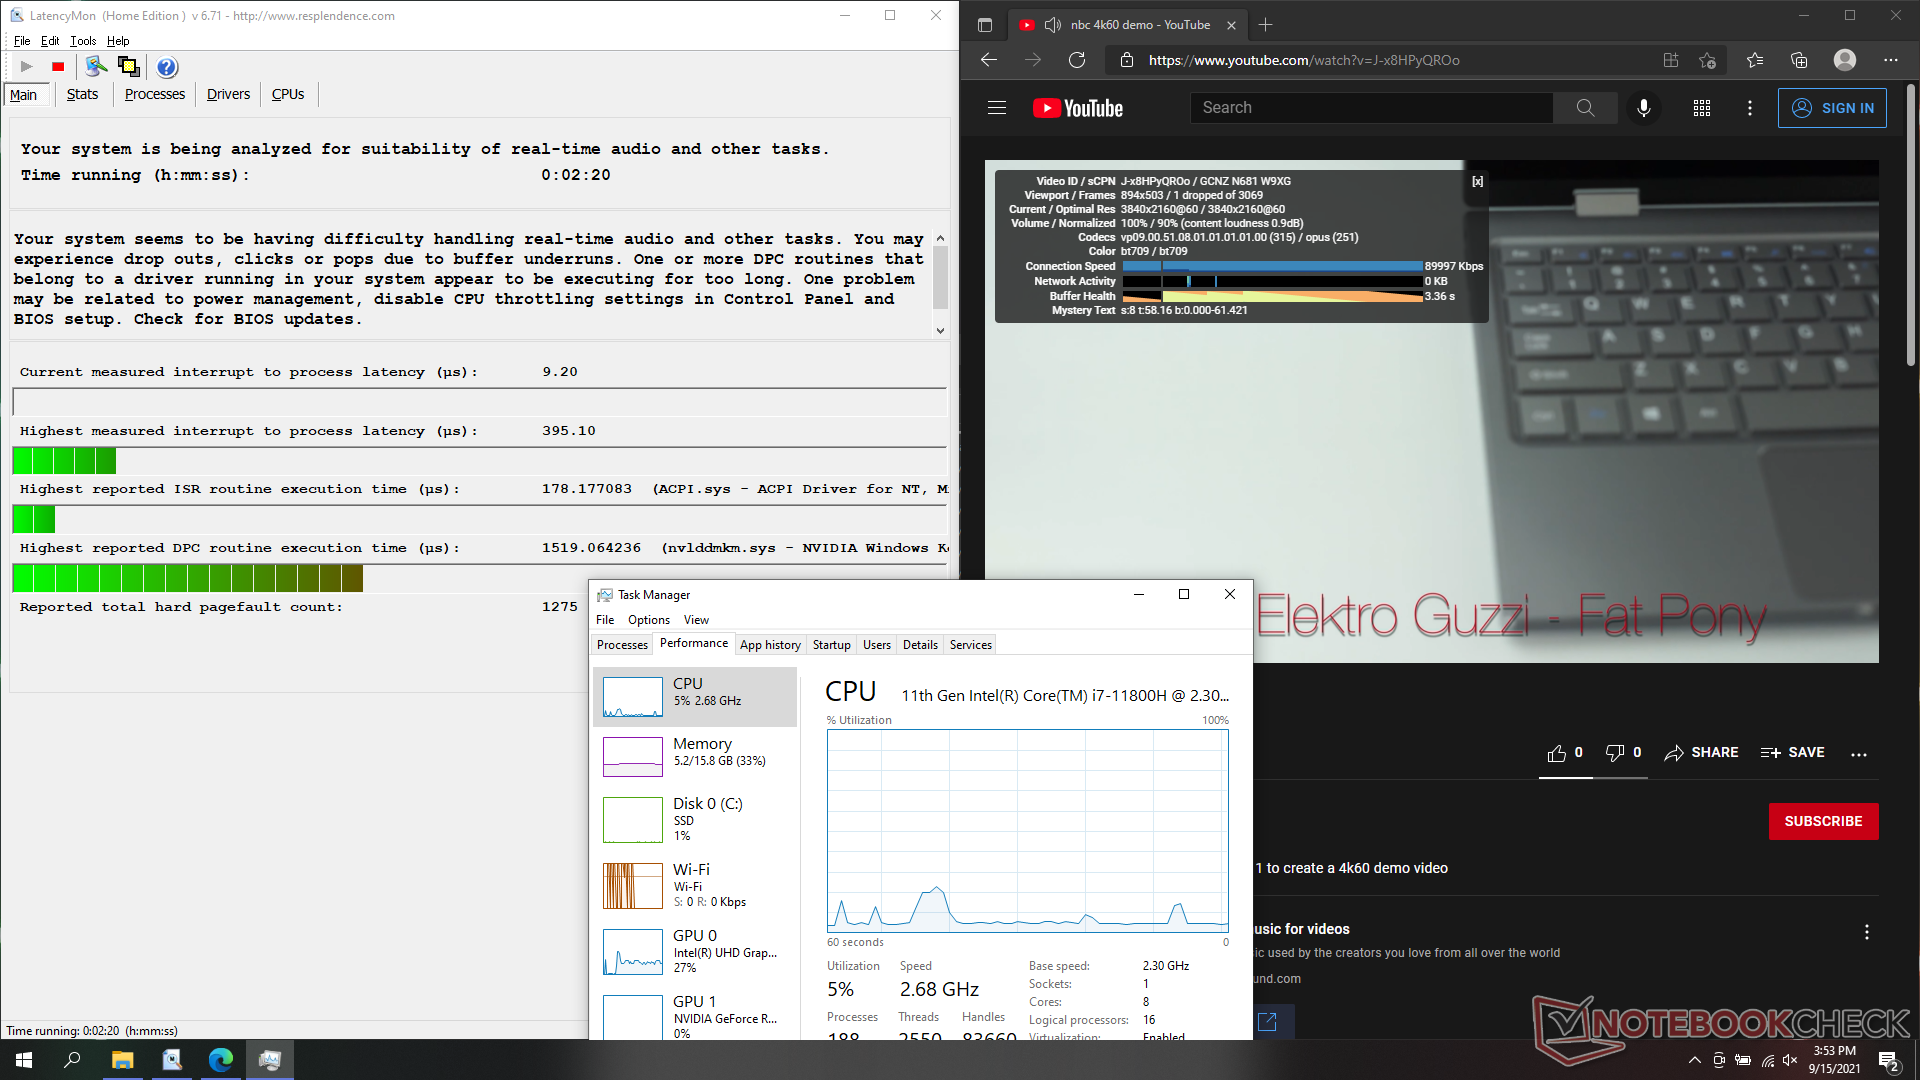
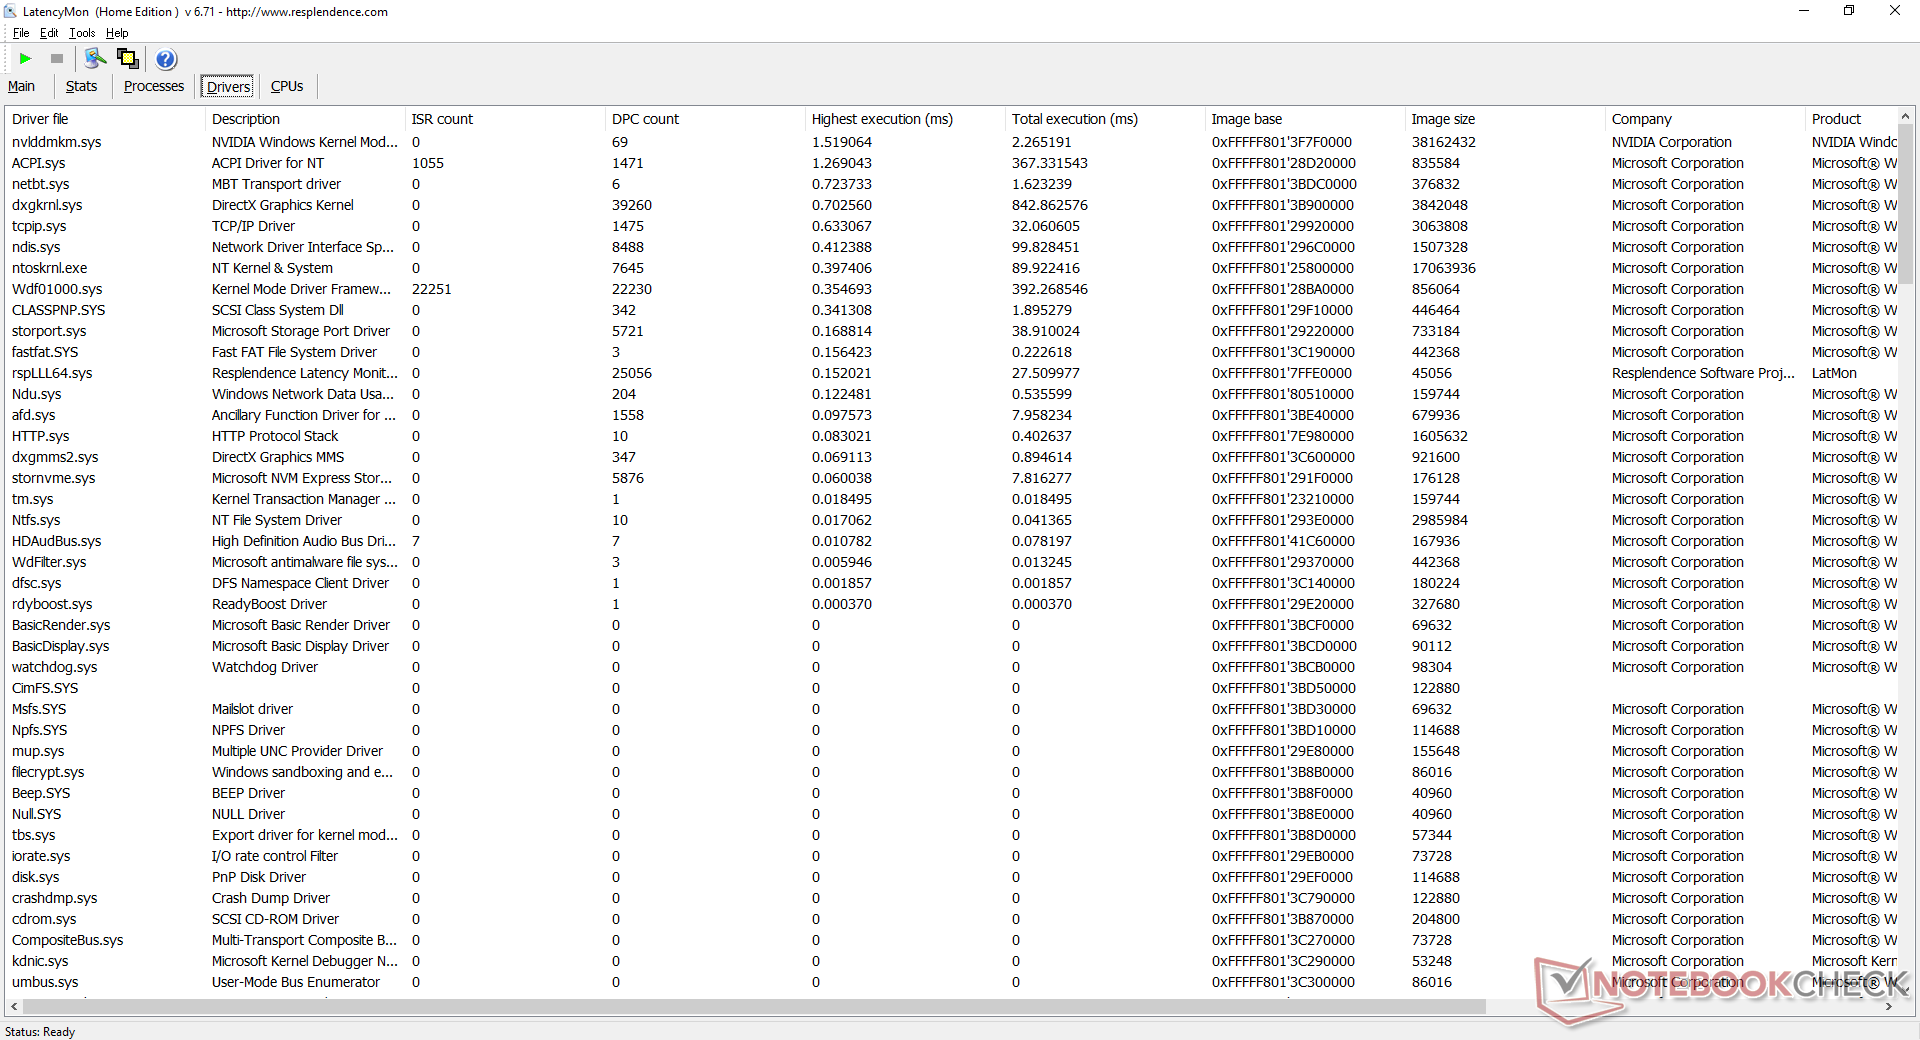
Latência do DPC
LatencyMon mostra pequenos problemas de latência DPC ao abrir várias abas do navegador em nossa página inicial ou ao executar Prime95 stress. A reprodução do vídeo de 4K a 60 FPS é de outra forma suave e com apenas um frame caído durante nossa sessão de teste.
| DPC Latencies / LatencyMon - interrupt to process latency (max), Web, Youtube, Prime95 | |
| Gigabyte Aero 17 HDR YD | |
| Asus ROG Zephyrus S17 GX703HSD | |
| MSI GS76 Stealth 11UH | |
| Acer Nitro 5 AN517-41-R9S5 | |
| Maingear Vector Pro MG-VCP17 | |
| Razer Blade 17 RTX 3070 | |
* ... menor é melhor
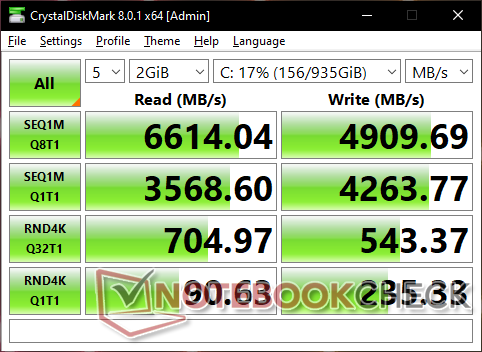
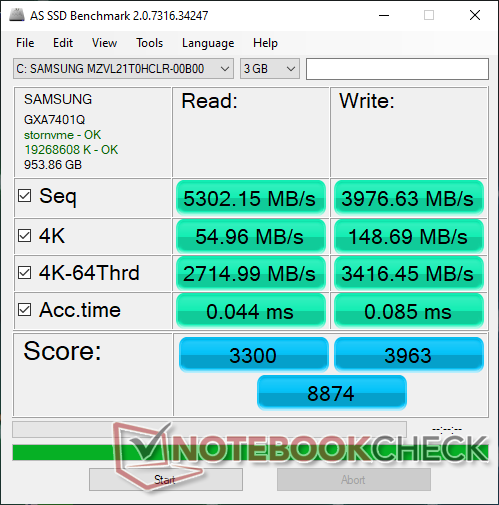
Dispositivos de armazenamento - Suporte PCIe4
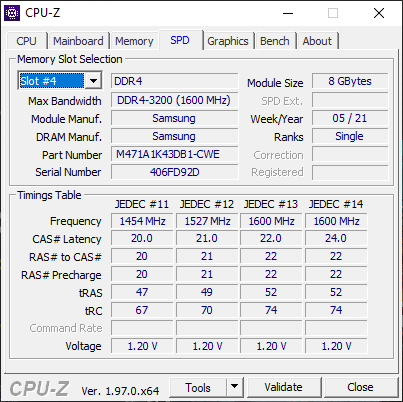
A Razer está mais uma vez aderindo à Samsung por suas necessidades de SSD PCIe4 NVMe. O 1 TB PM9A1 é significativamente mais rápido que o PM981a no modelo do ano passado, em praticamente todos os aspectos. Os usuários podem instalar até dois inversores como antes.
| Razer Blade 17 RTX 3070 Samsung PM9A1 MZVL21T0HCLR | Razer Blade Pro 17 2021 (QHD Touch) Samsung PM981a MZVLB1T0HBLR | Asus ROG Zephyrus S17 GX703HSD Samsung PM9A1 MZVL22T0HBLB | MSI GS76 Stealth 11UH Samsung PM9A1 MZVL22T0HBLB | Acer Nitro 5 AN517-41-R9S5 SK Hynix BC711 1TB HFM001TD3JX016N | Gigabyte Aero 17 HDR YD Samsung PM9A1 MZVL2512HCJQ | |
|---|---|---|---|---|---|---|
| AS SSD | -35% | 14% | 5% | -21% | 4% | |
| Seq Read (MB/s) | 5302 | 2068 -61% | 5085 -4% | 5408 2% | 2974 -44% | 5438 3% |
| Seq Write (MB/s) | 3977 | 2047 -49% | 4434 11% | 3863 -3% | 2733 -31% | 3904 -2% |
| 4K Read (MB/s) | 55 | 47.85 -13% | 80.3 46% | 52.7 -4% | 55.7 1% | 56.2 2% |
| 4K Write (MB/s) | 148.7 | 87.4 -41% | 214.7 44% | 153.1 3% | 134 -10% | 165.8 11% |
| 4K-64 Read (MB/s) | 2715 | 1932 -29% | 2573 -5% | 2692 -1% | 1854 -32% | 2489 -8% |
| 4K-64 Write (MB/s) | 3416 | 2017 -41% | 2972 -13% | 3414 0% | 2165 -37% | 3480 2% |
| Access Time Read * (ms) | 0.044 | 0.055 -25% | 0.018 59% | 0.046 -5% | 0.054 -23% | |
| Access Time Write * (ms) | 0.085 | 0.128 -51% | 0.02 76% | 0.027 68% | 0.028 67% | 0.026 69% |
| Score Read (Points) | 3300 | 2187 -34% | 3161 -4% | 3285 0% | 2207 -33% | 3089 -6% |
| Score Write (Points) | 3963 | 2309 -42% | 3631 -8% | 3953 0% | 2573 -35% | 4036 2% |
| Score Total (Points) | 8874 | 5612 -37% | 8380 -6% | 8830 0% | 5899 -34% | 8620 -3% |
| Copy ISO MB/s (MB/s) | 2710 | 2400 -11% | 3239 20% | 2260 -17% | ||
| Copy Program MB/s (MB/s) | 1114 | 684 -39% | 899 -19% | 677 -39% | ||
| Copy Game MB/s (MB/s) | 2095 | 1629 -22% | 2171 4% | 1493 -29% | ||
| CrystalDiskMark 5.2 / 6 | -43% | 3% | 1% | -36% | 3% | |
| Write 4K (MB/s) | 233.5 | 123.5 -47% | 244.2 5% | 230.7 -1% | 133.4 -43% | 230.4 -1% |
| Read 4K (MB/s) | 90.1 | 45.96 -49% | 89.8 0% | 87.9 -2% | 64.7 -28% | 91.6 2% |
| Write Seq (MB/s) | 4263 | 1861 -56% | 4300 1% | 2934 -31% | 4216 -1% | |
| Read Seq (MB/s) | 4468 | 1584 -65% | 4392 -2% | 2364 -47% | 4543 2% | |
| Write 4K Q32T1 (MB/s) | 538 | 466.4 -13% | 607 13% | 582 8% | 438.4 -19% | 667 24% |
| Read 4K Q32T1 (MB/s) | 703 | 566 -19% | 658 -6% | 730 4% | 516 -27% | 728 4% |
| Write Seq Q32T1 (MB/s) | 5097 | 2981 -42% | 5270 3% | 5152 1% | 3083 -40% | 5043 -1% |
| Read Seq Q32T1 (MB/s) | 7065 | 3260 -54% | 7091 0% | 7094 0% | 3584 -49% | 6821 -3% |
| Write 4K Q8T8 (MB/s) | 2270 | |||||
| Read 4K Q8T8 (MB/s) | 2490 | |||||
| Média Total (Programa/Configurações) | -39% /
-38% | 9% /
11% | 3% /
4% | -29% /
-27% | 4% /
4% |
* ... menor é melhor

Disk Throttling: DiskSpd Read Loop, Queue Depth 8
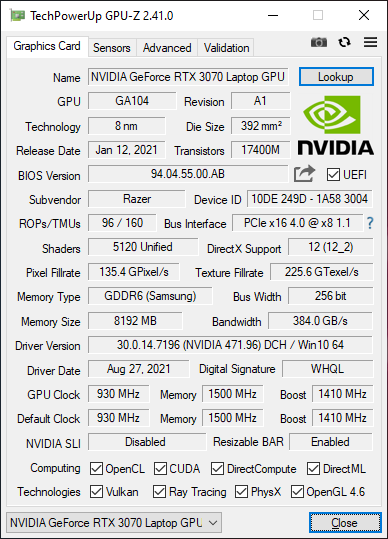
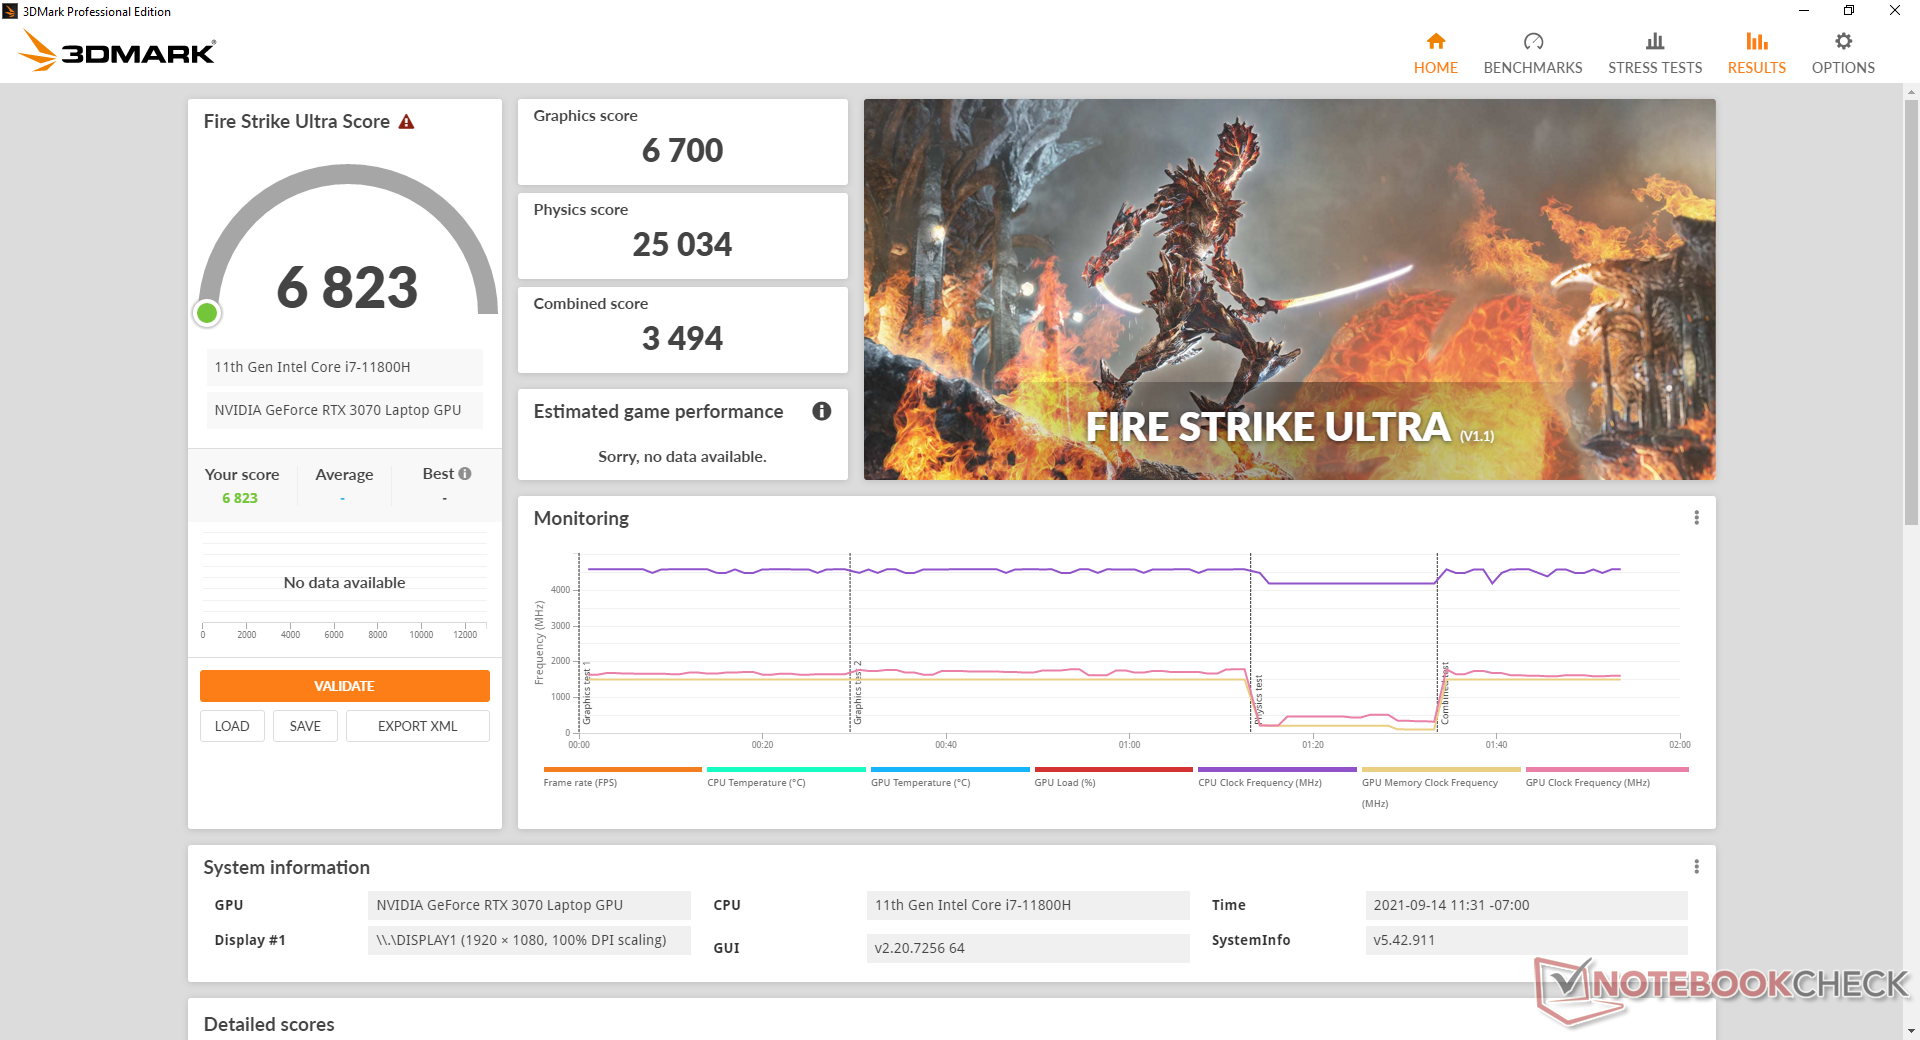
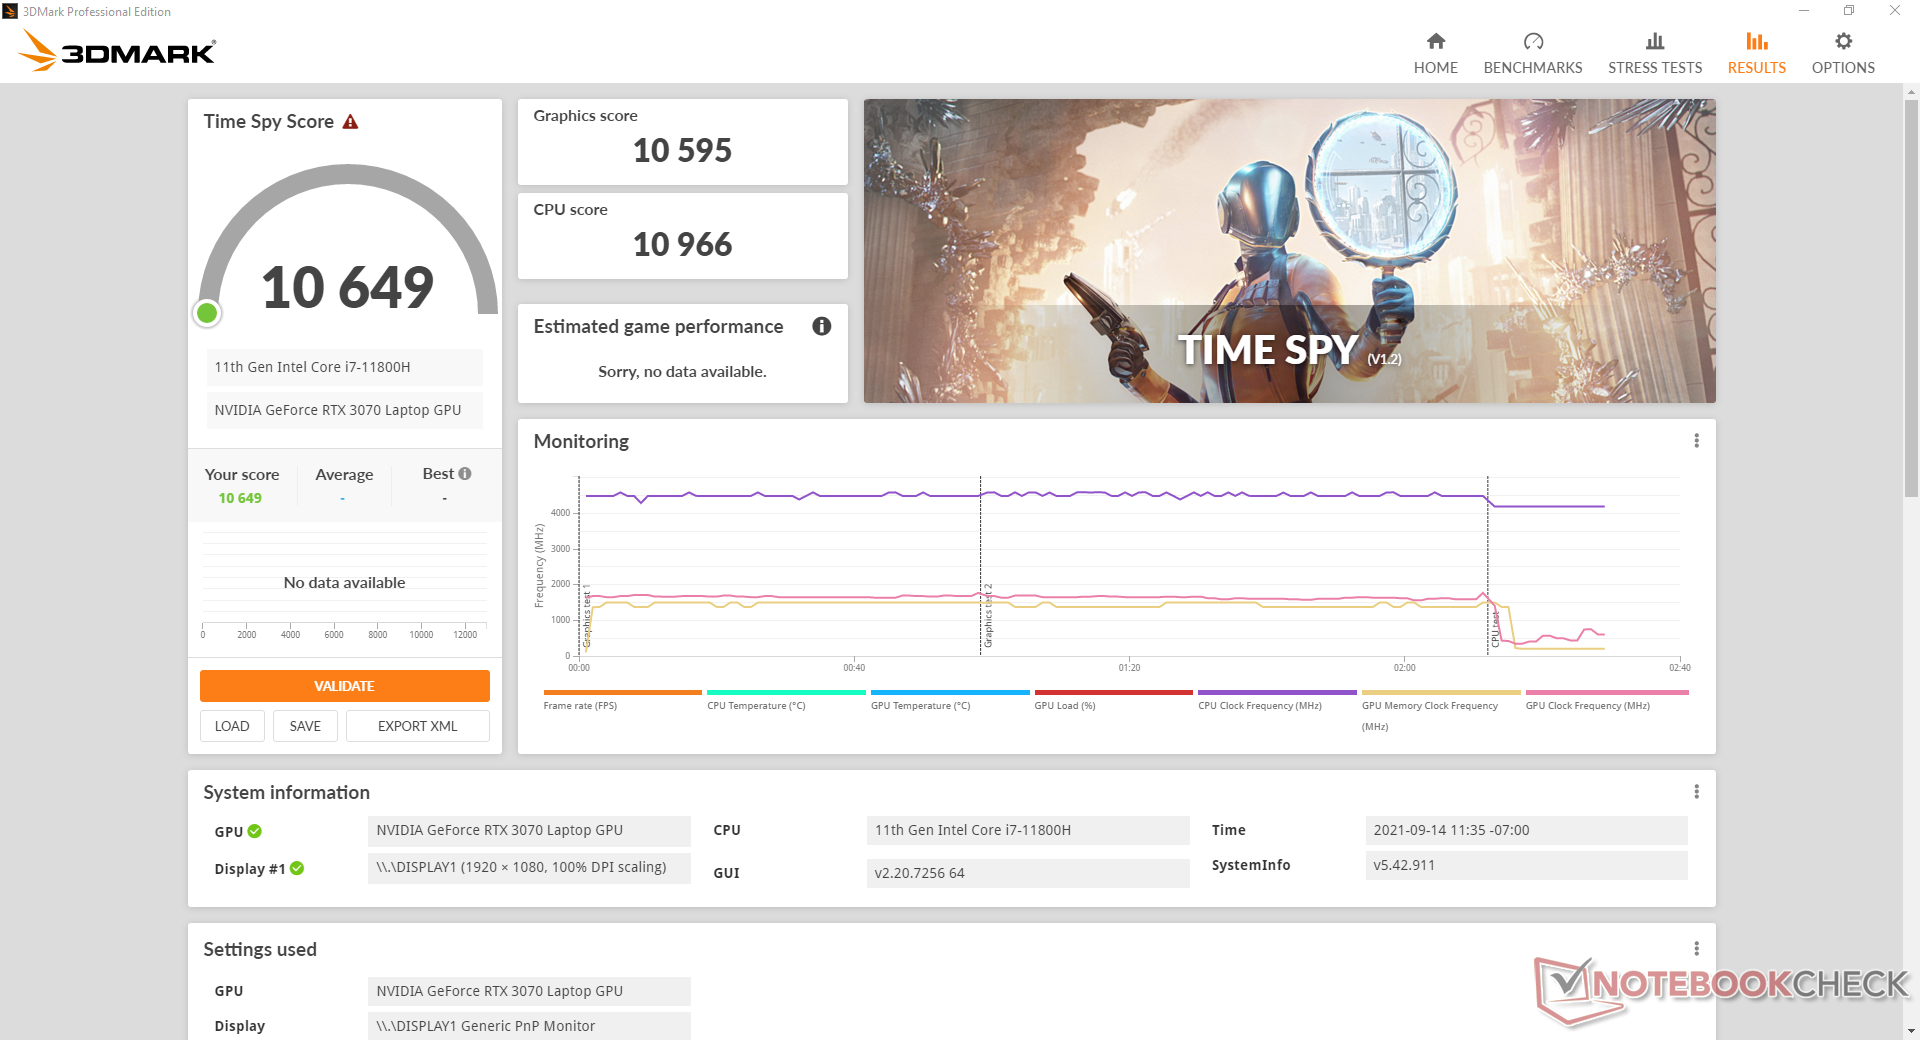
Desempenho da GPU - Um pouco mais rápido que um 100 W GeForce RTX 3080
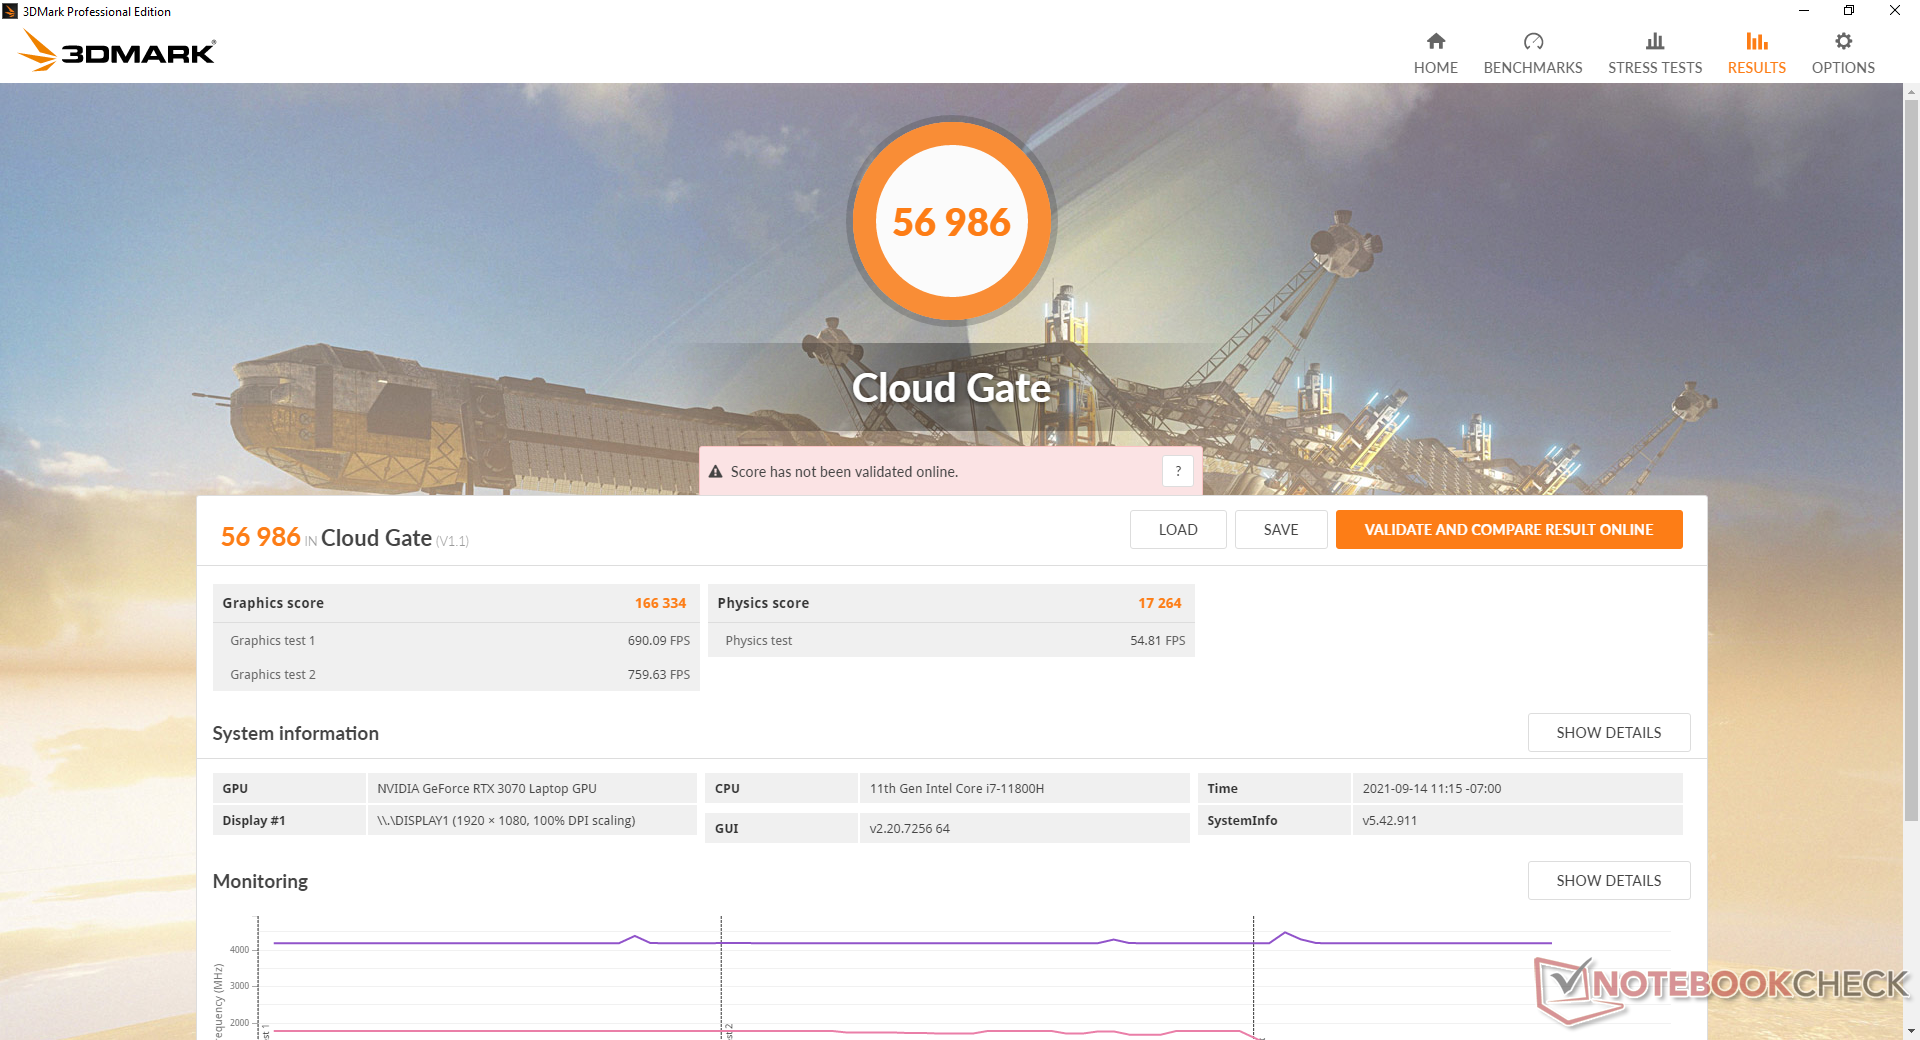
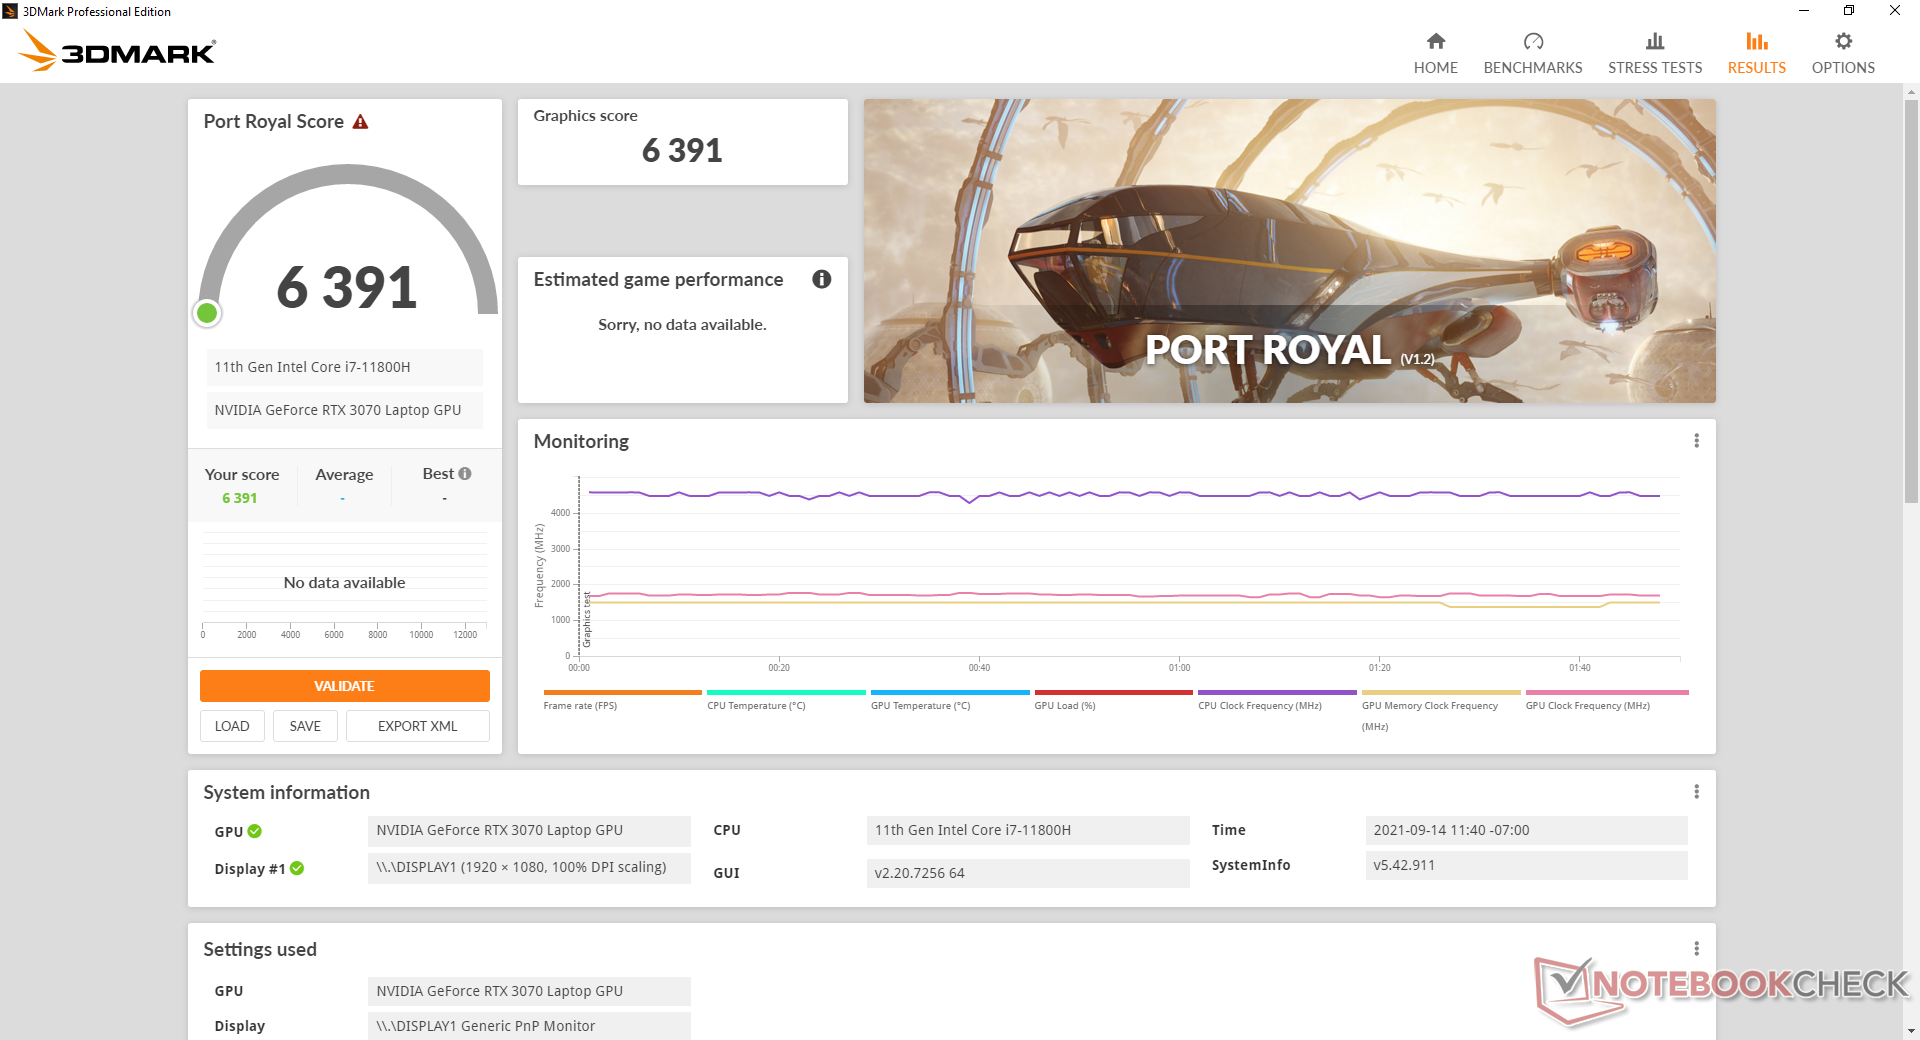
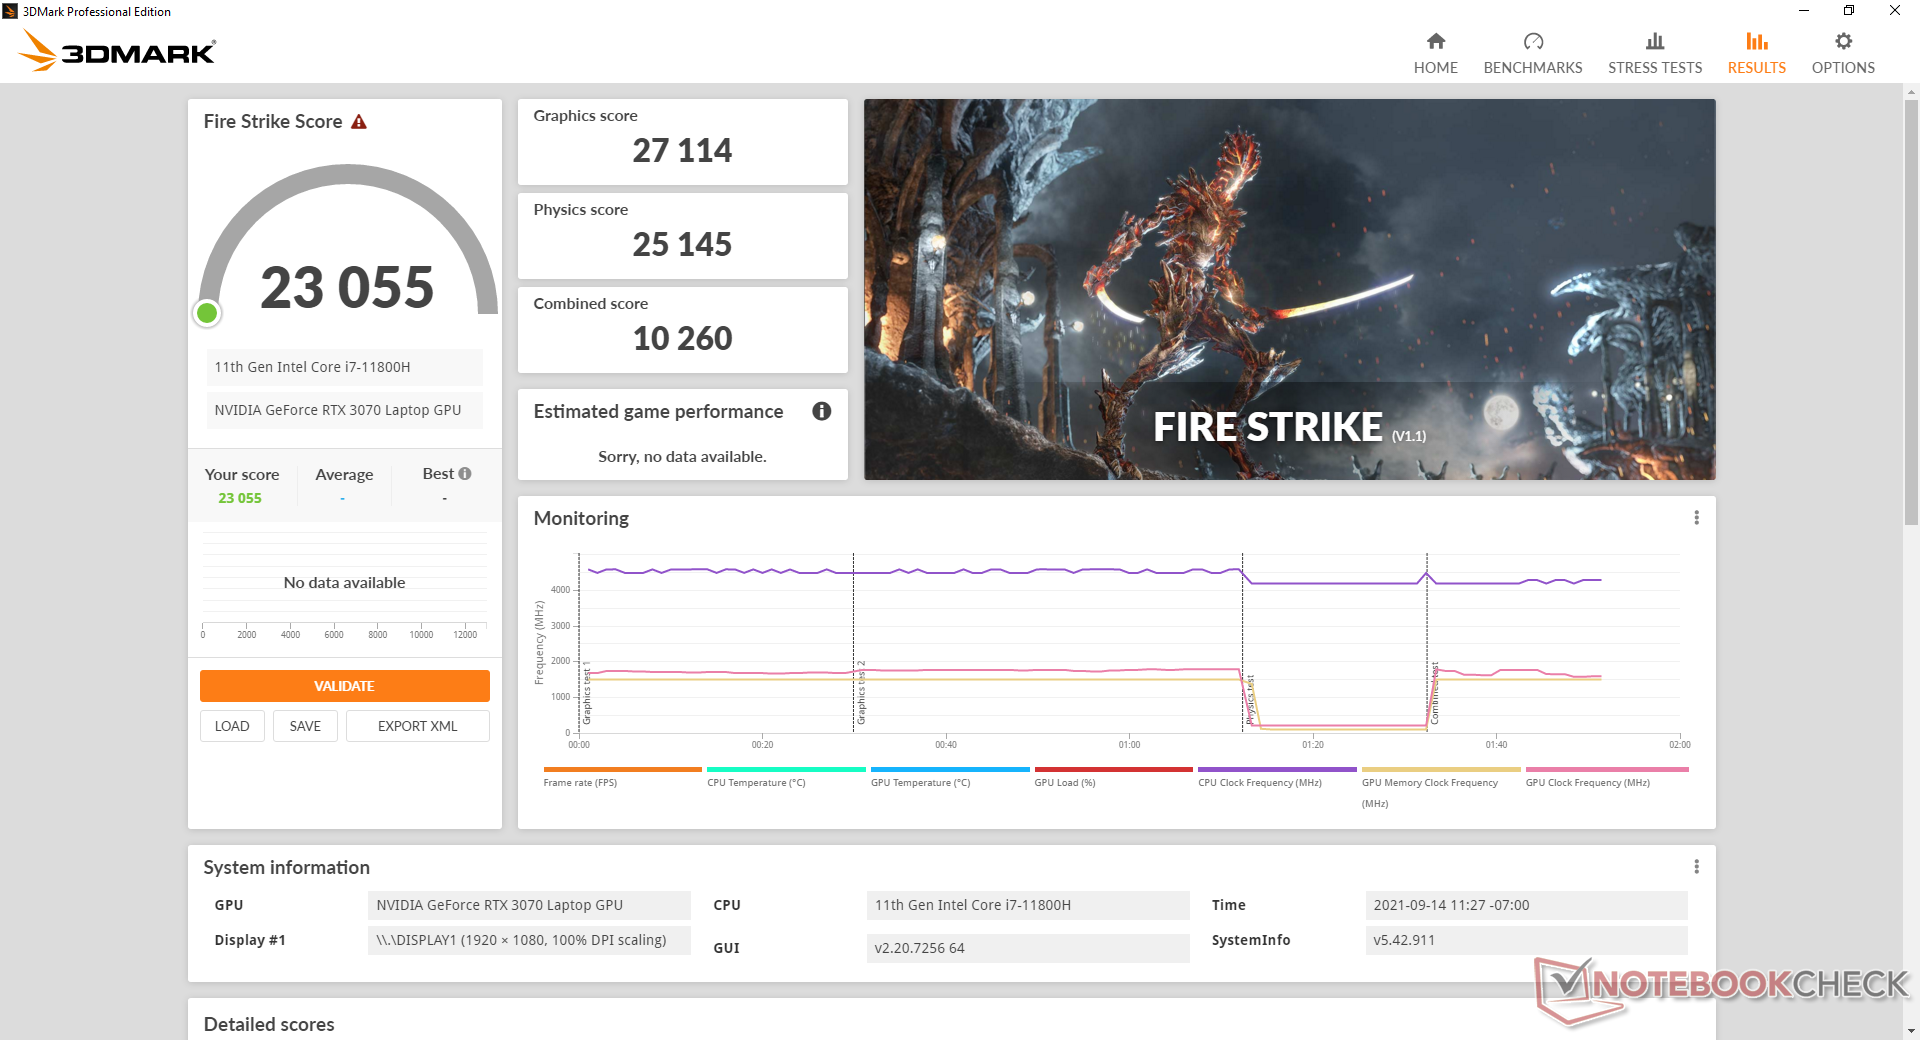
O desempenho gráfico é excelente com resultados 3DMark que são 10 a 15% mais rápidos do que a média do laptop em nosso banco de dados equipado com o mesmo RTX 3070 GPU. Na verdade, o desempenho bruto é essencialmente igual ao do ano passado Lâmina Pro RTX 3080 SKU. Ainda é significativamente mais lento que um "próprio" RTX 3080 de mesa, no entanto, que é mais Nvidia do que uma coisa de Razer.
A atualização para o Blade 17 RTX 3080 SKU trará provavelmente benefícios de desempenho muito menores em relação ao nosso RTX 3070 SKU, de apenas alguns pontos percentuais com base em nossa experiência com . Pelo menos uma dúzia de outros laptops RTX 3080 até agora. O usuário também deve ter em mente que não precisa necessariamente atingir 360 FPS para explorar os benefícios de uma tela de 360 Hz
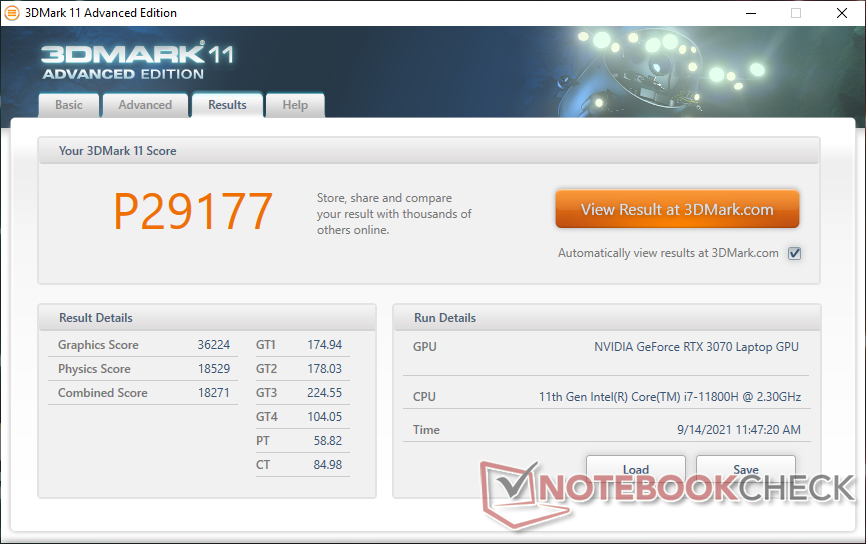
| 3DMark 11 Performance | 29177 pontos | |
| 3DMark Cloud Gate Standard Score | 56986 pontos | |
| 3DMark Fire Strike Score | 23055 pontos | |
| 3DMark Time Spy Score | 10649 pontos | |
Ajuda | ||
Witcher 3 FPS Chart
| baixo | média | alto | ultra | |
|---|---|---|---|---|
| GTA V (2015) | 185 | 180 | 173 | 108 |
| The Witcher 3 (2015) | 460.9 | 312.7 | 204.8 | 100.6 |
| Dota 2 Reborn (2015) | 171 | 155 | 149 | 140 |
| Final Fantasy XV Benchmark (2018) | 195 | 136 | 103 | |
| X-Plane 11.11 (2018) | 142 | 125 | 98.4 | |
| Far Cry 5 (2018) | 149 | 138 | 131 | 122 |
| Strange Brigade (2018) | 522 | 261 | 212 | 186 |
Emissions — Still Loud when Gaming
Ruído do sistema
O ruído dos ventiladores é mais silencioso do que o esperado de um laptop com quatro ventiladores individuais, uma vez que os ventiladores tendem a ficar ociosos o máximo possível quando navegando ou navegando na web. Ao jogar no modo Turbo manual, entretanto, o ruído dos ventiladores pode chegar a 56 dB(A) para ser mais alto do que a maioria dos outros laptops para jogos. Os ventiladores menores embaixo do clickpad também são mais altos que a maioria dos outros ventiladores, o que os torna difíceis de ignorar.
Os jogos no modo balanceado padrão ao invés do modo Turbo manual verão o barulho dos ventiladores atingir somente 43,5 dB(A) quando estiverem jogando. É claro, os usuários estarão sacrificando o desempenho por esse ruído muito menor do ventilador.
Há algum ruído eletrônico muito leve ou lamúria da bobina em nossa unidade que só se torna perceptível quando se coloca um ouvido perto das teclas do teclado.
| Razer Blade 17 RTX 3070 GeForce RTX 3070 Laptop GPU, i7-11800H, Samsung PM9A1 MZVL21T0HCLR | Asus ROG Zephyrus S17 GX703HSD GeForce RTX 3080 Laptop GPU, i9-11900H, Samsung PM9A1 MZVL22T0HBLB | MSI GS76 Stealth 11UH GeForce RTX 3080 Laptop GPU, i9-11900H, Samsung PM9A1 MZVL22T0HBLB | Acer Nitro 5 AN517-41-R9S5 GeForce RTX 3080 Laptop GPU, R7 5800H, SK Hynix BC711 1TB HFM001TD3JX016N | Gigabyte Aero 17 HDR YD GeForce RTX 3080 Laptop GPU, i9-11980HK, Samsung PM9A1 MZVL2512HCJQ | Maingear Vector Pro MG-VCP17 GeForce RTX 3080 Laptop GPU, i7-11800H, Samsung PM9A1 MZVL21T0HCLR | |
|---|---|---|---|---|---|---|
| Noise | 6% | -8% | -4% | -19% | 1% | |
| desligado / ambiente * (dB) | 24.2 | 23 5% | 24 1% | 26 -7% | 25 -3% | 23.8 2% |
| Idle Minimum * (dB) | 24.7 | 23 7% | 24 3% | 26 -5% | 30 -21% | 23.9 3% |
| Idle Average * (dB) | 24.7 | 23 7% | 25 -1% | 28 -13% | 32 -30% | 23.9 3% |
| Idle Maximum * (dB) | 24.7 | 23 7% | 42 -70% | 41 -66% | 23.9 3% | |
| Load Average * (dB) | 44.3 | 41 7% | 46 -4% | 41.6 6% | 43 3% | 38 14% |
| Witcher 3 ultra * (dB) | 56.3 | 45 20% | 48 15% | 51 9% | 55.9 1% | |
| Load Maximum * (dB) | 47.7 | 52 -9% | 48 -1% | 48.6 -2% | 59 -24% | 55.9 -17% |
* ... menor é melhor
Barulho
| Ocioso |
| 24.7 / 24.7 / 24.7 dB |
| Carga |
| 44.3 / 47.7 dB |
 | ||
30 dB silencioso 40 dB(A) audível 50 dB(A) ruidosamente alto |
||
min: | ||
Temperatura
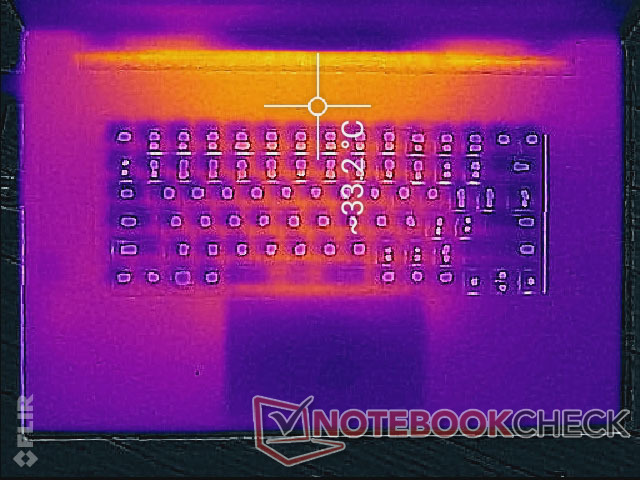
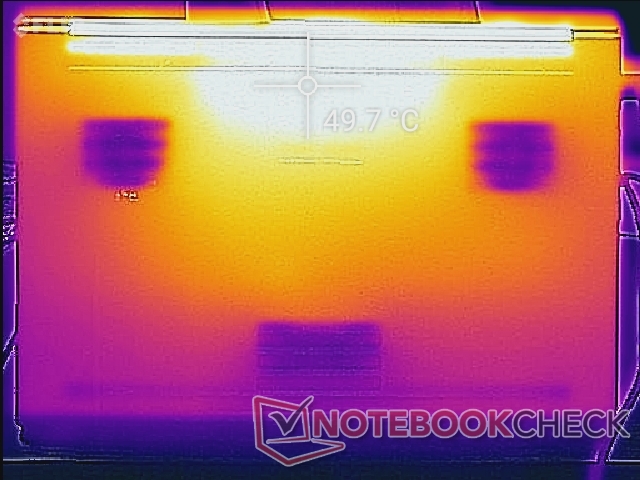
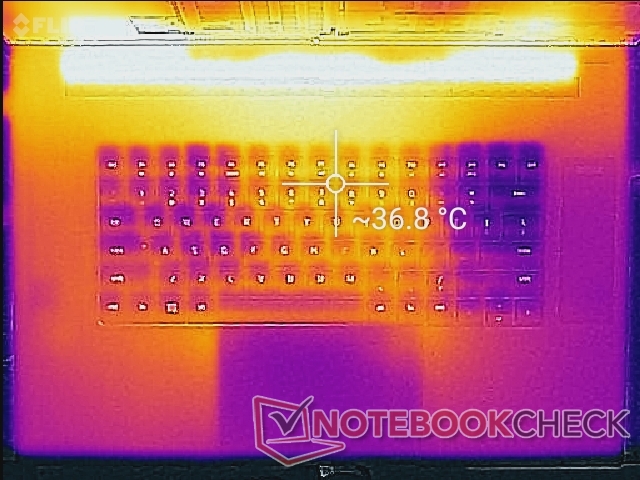
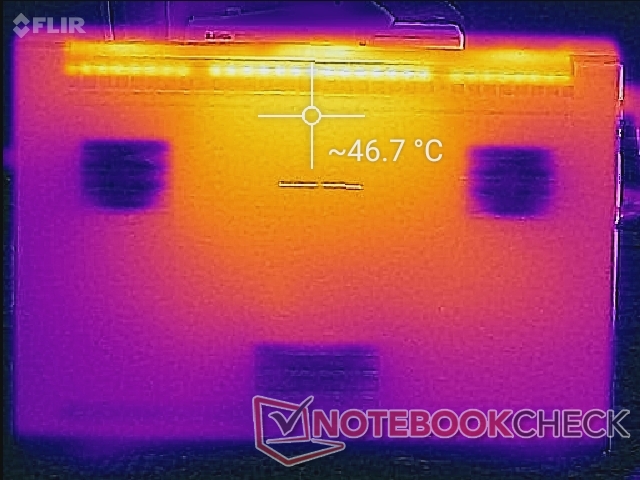
As temperaturas de superfície são razoáveis na lâmina 17 devido em parte a seus quatro ventiladores individuais, em comparação com apenas dois na maioria dos outros laptops. Os pontos quentes podem alcançar mais de 41 C e 49 C na parte superior e inferior, respectivamente, em comparação com 59 C ou 53 C na parte inferior do Asus Zephyrus S17. Os descansos de palma também não ficam tão quentes mesmo quando comparados com o Lâmina 15
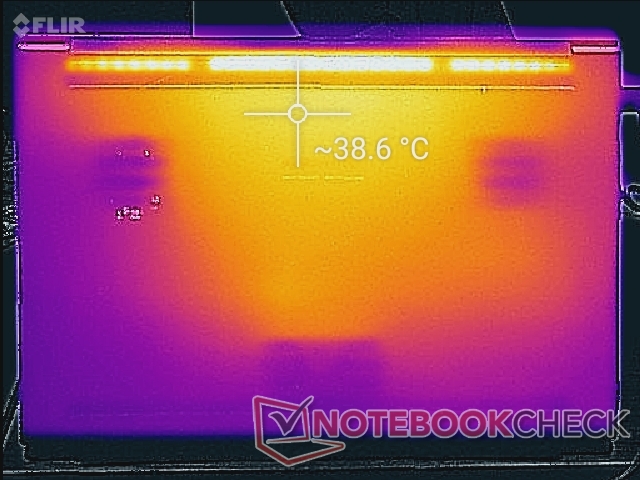
As temperaturas superficiais quando ociosas ainda estão no lado quente, já que os ventiladores tendem a ficar ociosos quando as cargas de trabalho são baixas. O ponto quente inferior pode ser tão quente quanto 39 C em comparação com 35 C no Asus acima mencionado.
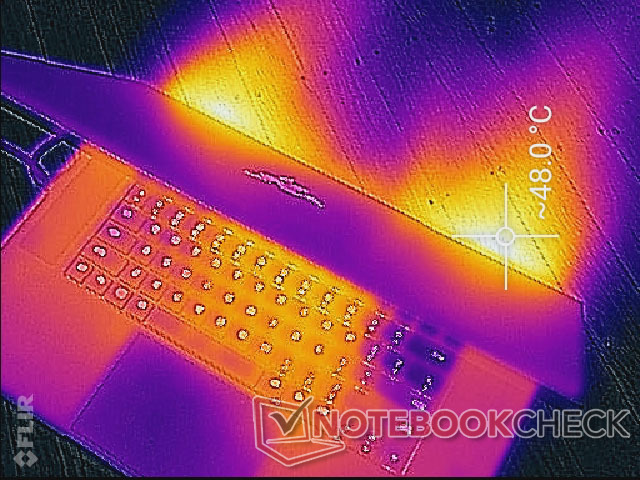
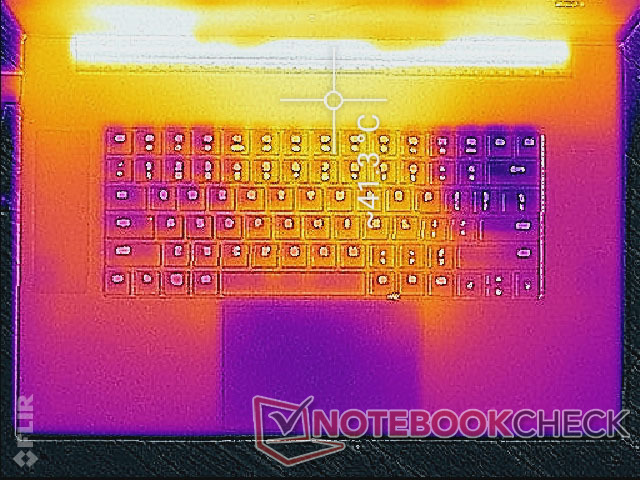
(±) A temperatura máxima no lado superior é 41 °C / 106 F, em comparação com a média de 40.4 °C / 105 F , variando de 21.2 a 68.8 °C para a classe Gaming.
(-) A parte inferior aquece até um máximo de 47.2 °C / 117 F, em comparação com a média de 43.2 °C / 110 F
(+) Em uso inativo, a temperatura média para o lado superior é 29.9 °C / 86 F, em comparação com a média do dispositivo de 33.9 °C / ### class_avg_f### F.
(±) Jogando The Witcher 3, a temperatura média para o lado superior é 33.2 °C / 92 F, em comparação com a média do dispositivo de 33.9 °C / ## #class_avg_f### F.
(+) Os apoios para as mãos e o touchpad estão atingindo a temperatura máxima da pele (33 °C / 91.4 F) e, portanto, não estão quentes.
(-) A temperatura média da área do apoio para as mãos de dispositivos semelhantes foi 28.8 °C / 83.8 F (-4.2 °C / -7.6 F).
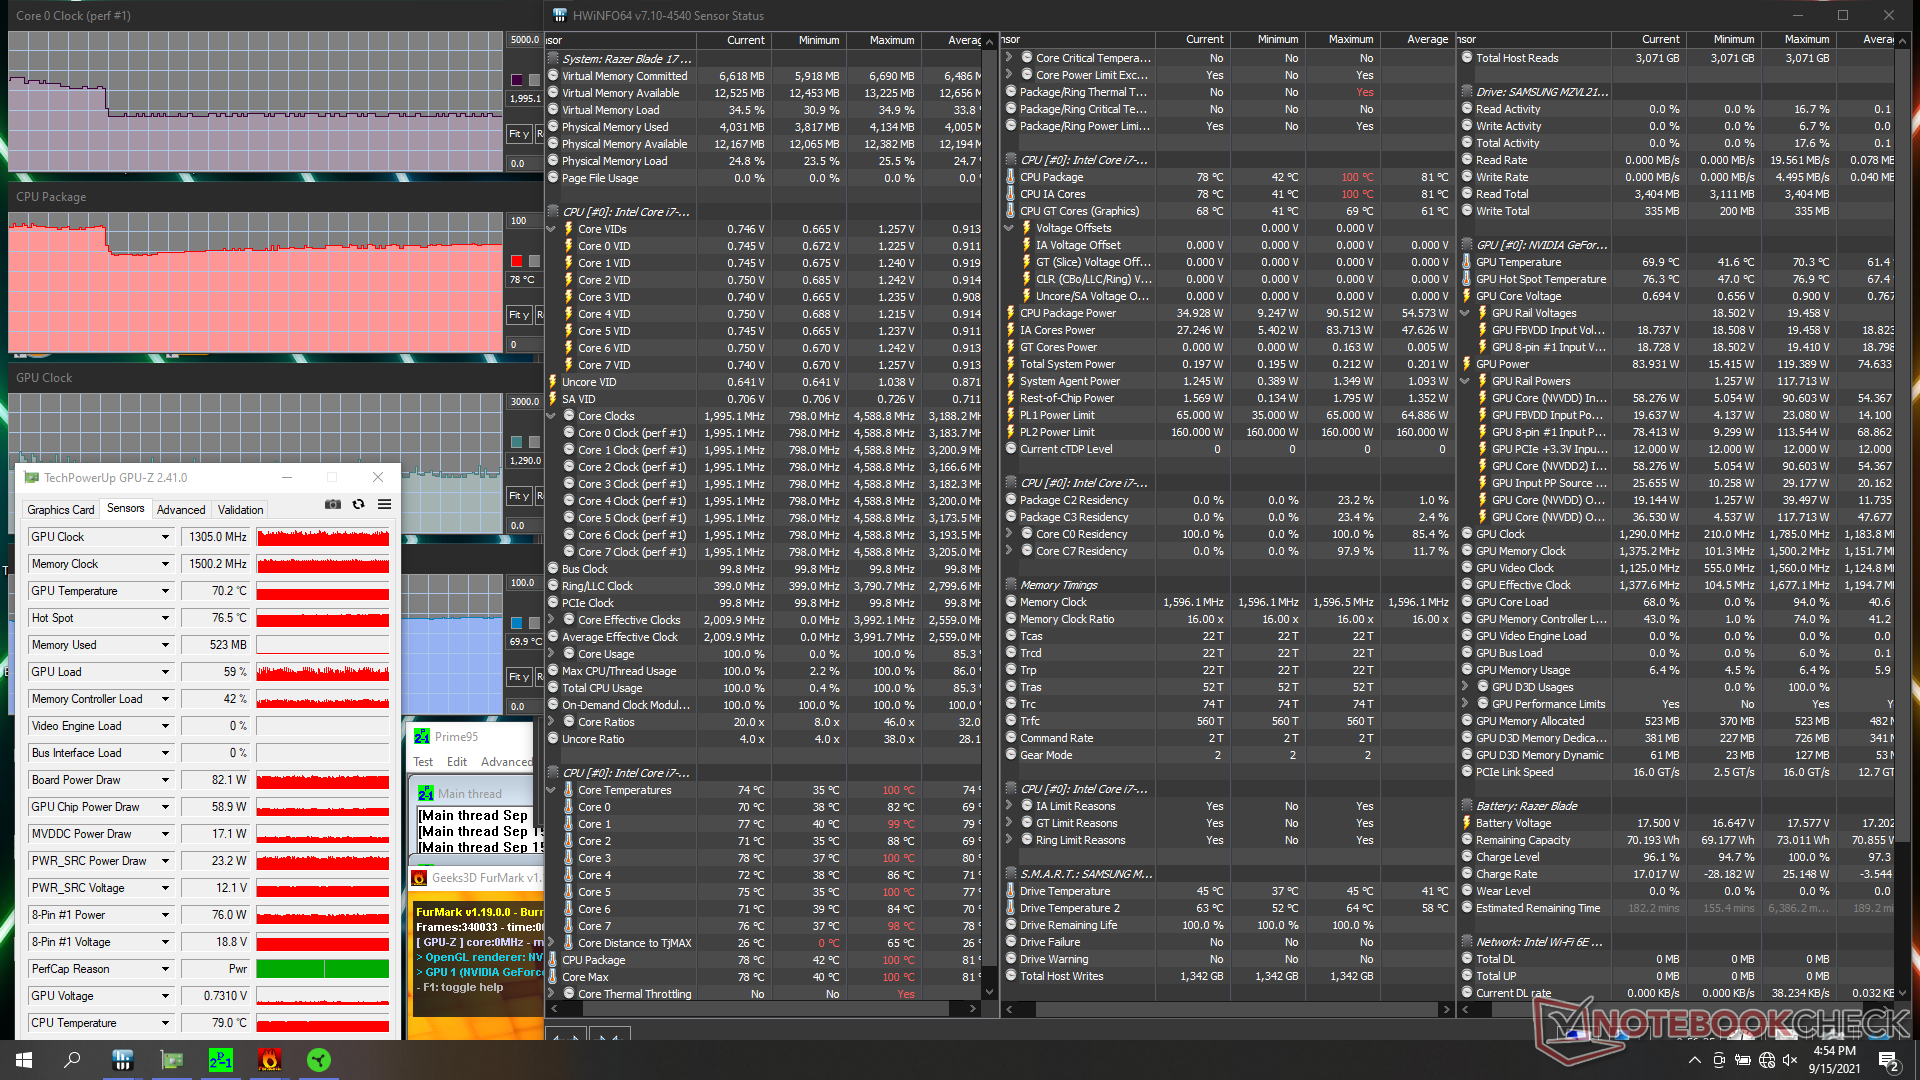
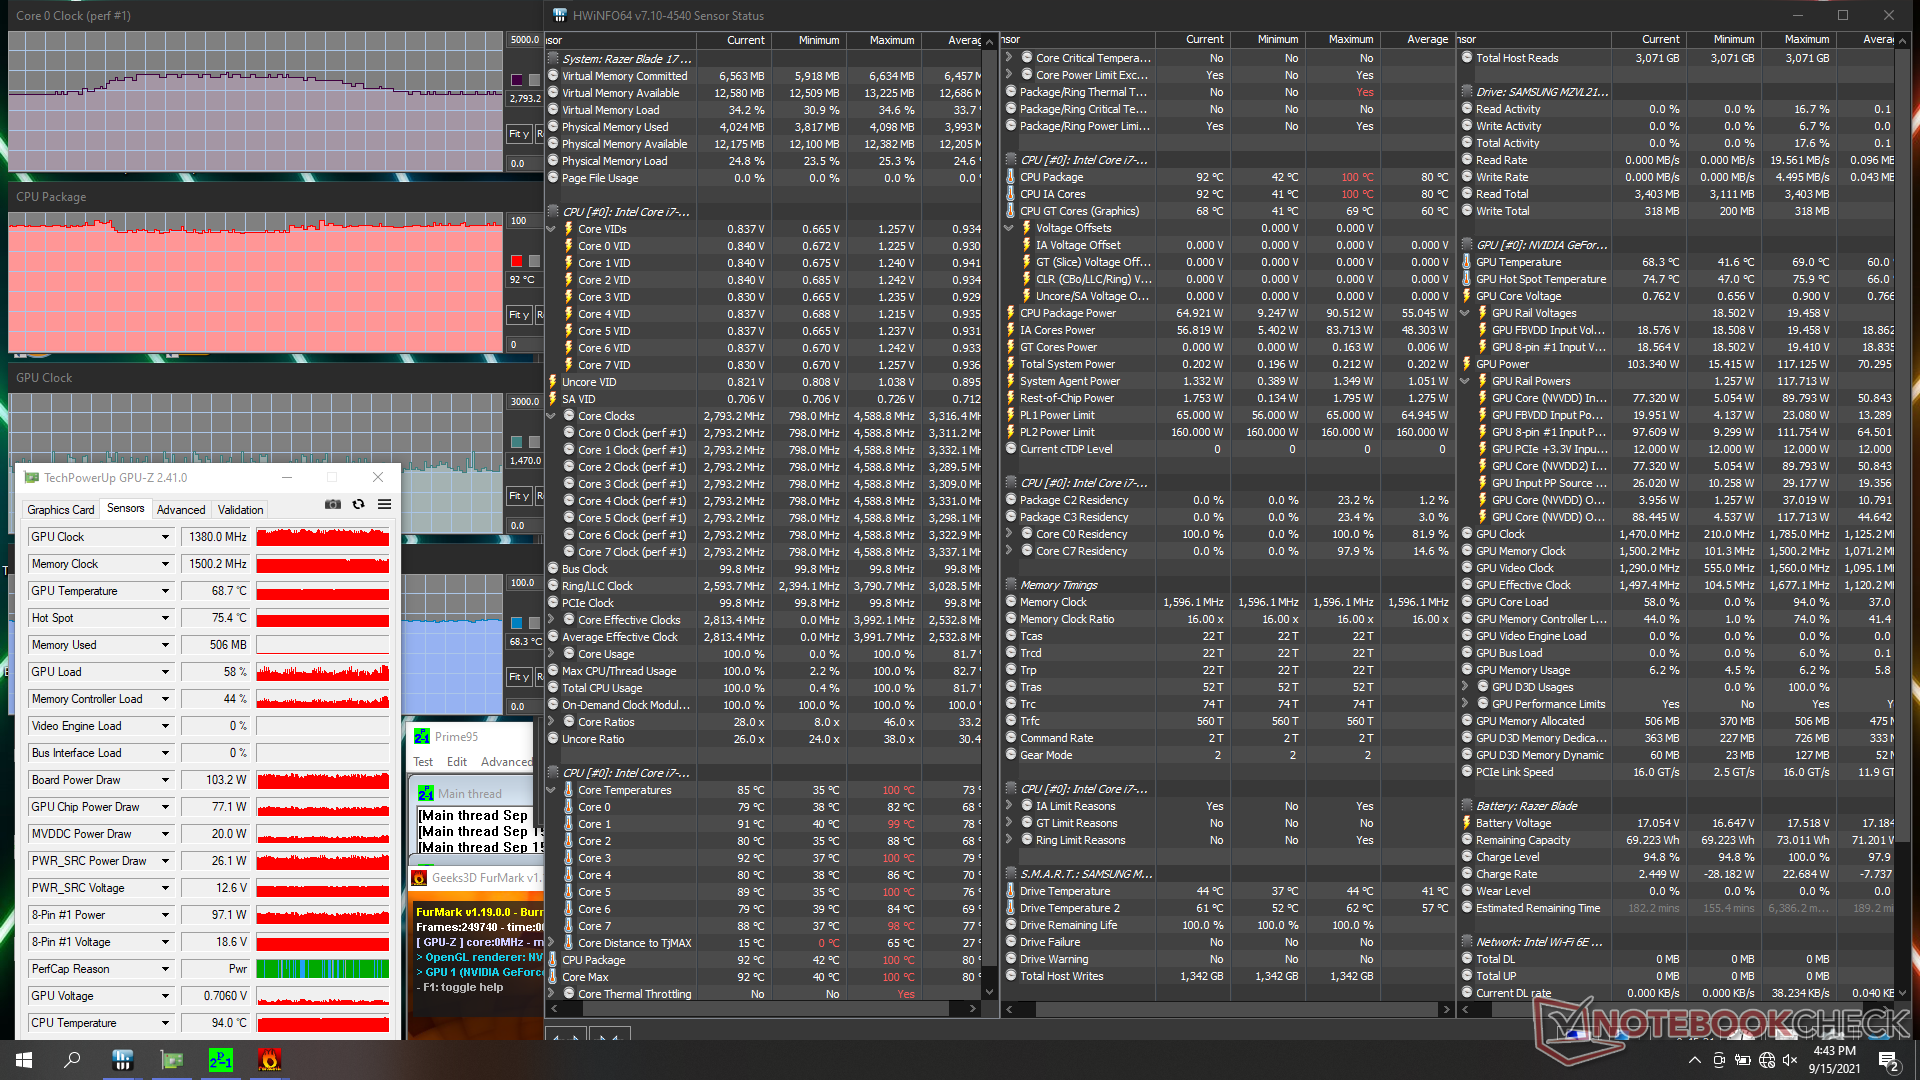
Teste de estresse
Quando estressada sob Prime95 no modo Turbo, a CPU aumentaria para 3,9 GHz por cerca de 20 segundos antes de cair para 3,5 GHz e depois eventualmente 2,9 GHz para manter uma temperatura central de 78 C. Embora não seja terrível, é uma pena que o processador não consiga manter taxas de relógio mais rápidas por períodos muito longos quando a 100% de utilização
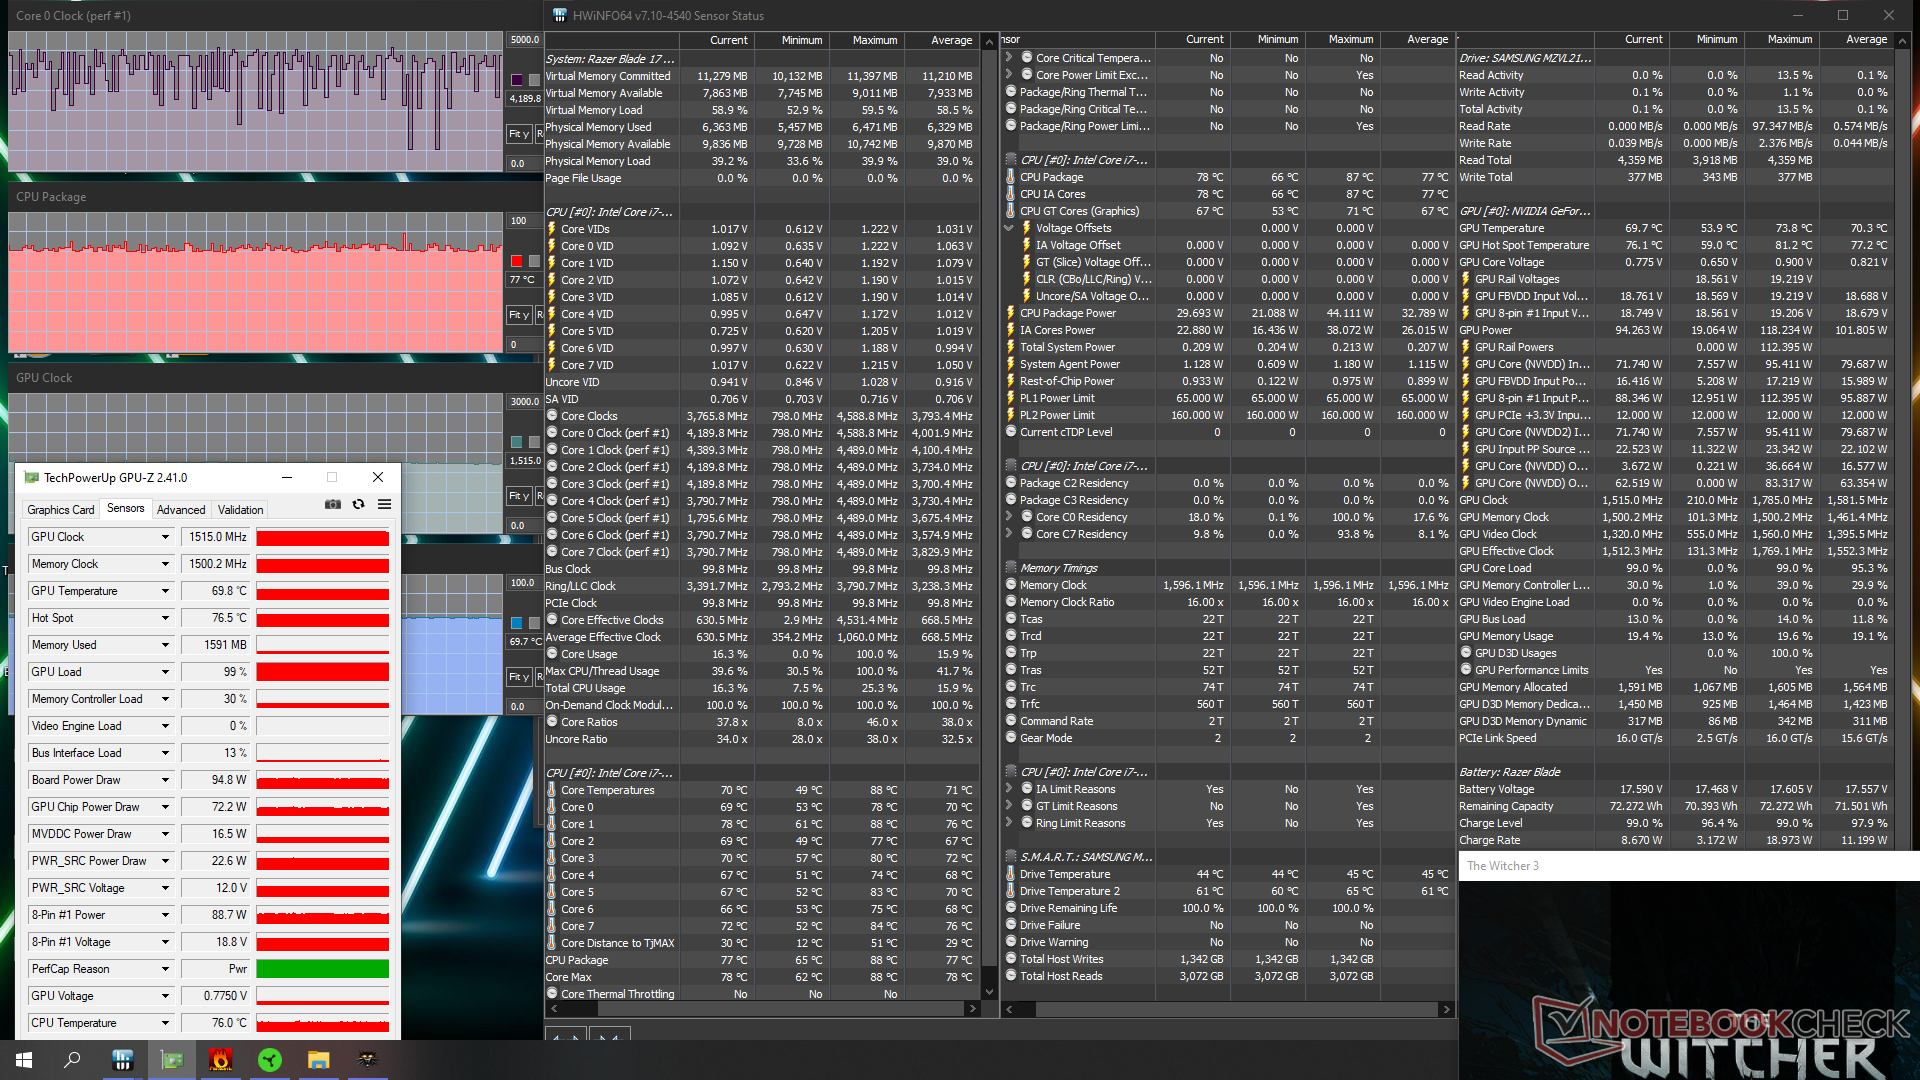
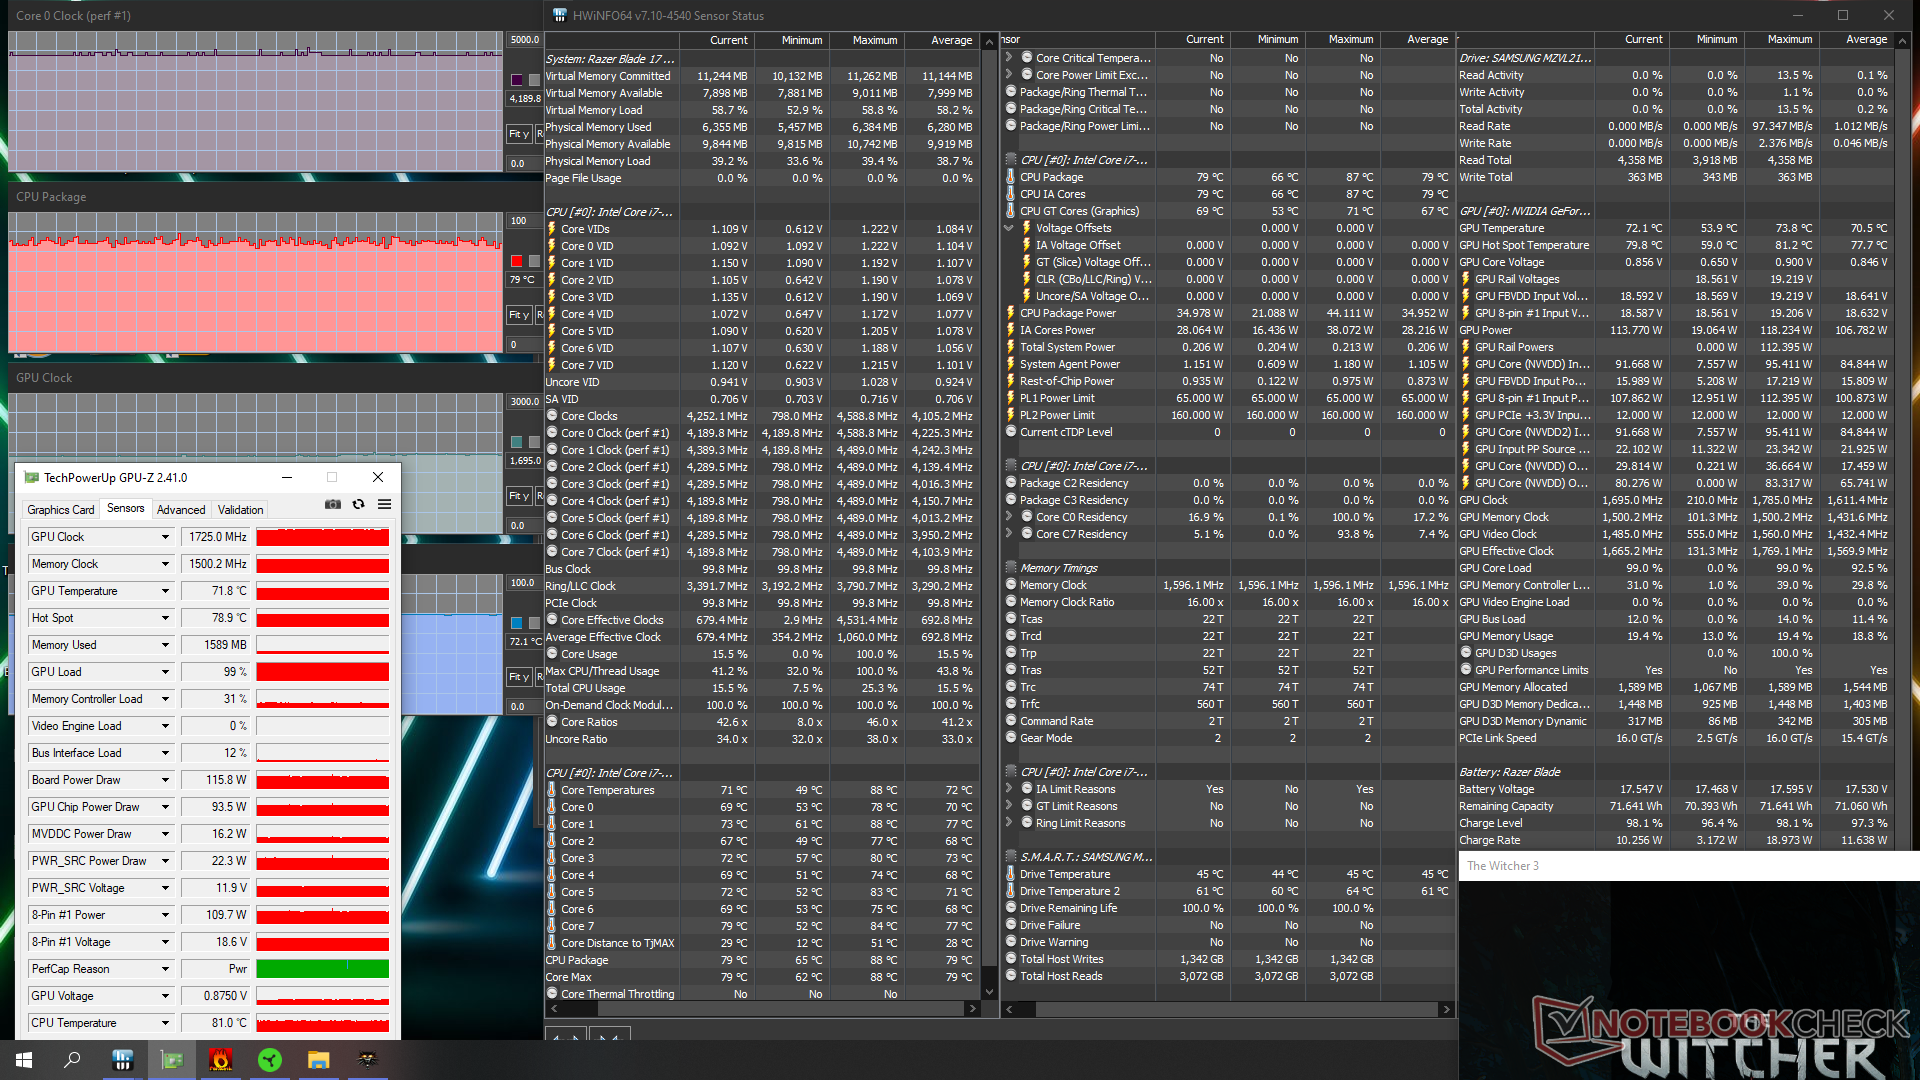
Rodando Witcher 3 no modo Turbo mostra uma taxa de relógio GPU estável de 1725 MHz e um consumo de energia da placa de 116 W contra apenas 1515 MHz e 95 W se não no modo Turbo. Entretanto, o relógio de memória e a temperatura da GPU permaneceriam mais ou menos os mesmos, enquanto que um consumo total de 130 W parece ser inalcançável sem mais ajustes. Os usuários devem, portanto, ativar o modo Turbo manual através do software Razer Central a fim de espremer mais desempenho gráfico para fora do laptop
Curiosamente, as temperaturas da CPU e GPU são mais quentes no Blade 17 quando comparadas com o antigo Blade Pro RTX 3080. Rodando Witcher 3 resultaria em temperaturas estáveis de CPU e GPU de 79 C e 72 C, respectivamente, enquanto o Blade Pro mais antigo seria mais frio a 65 C e 64 C. Suspeitamos que isto poderia ser devido às metas mais altas de CPU PL2 (160 W vs. 120 W) e TGP (130 W vs. 100 W) para o mais novo Blade 17
O funcionamento com bateria limita o desempenho porque o modo Turbo fica indisponível. Um teste 3DMark 11 com baterias retornaria pontuações de Física e Gráficos de 6377 e 11738 pontos, respectivamente, em comparação com 18529 e 36224 pontos quando em rede elétrica.
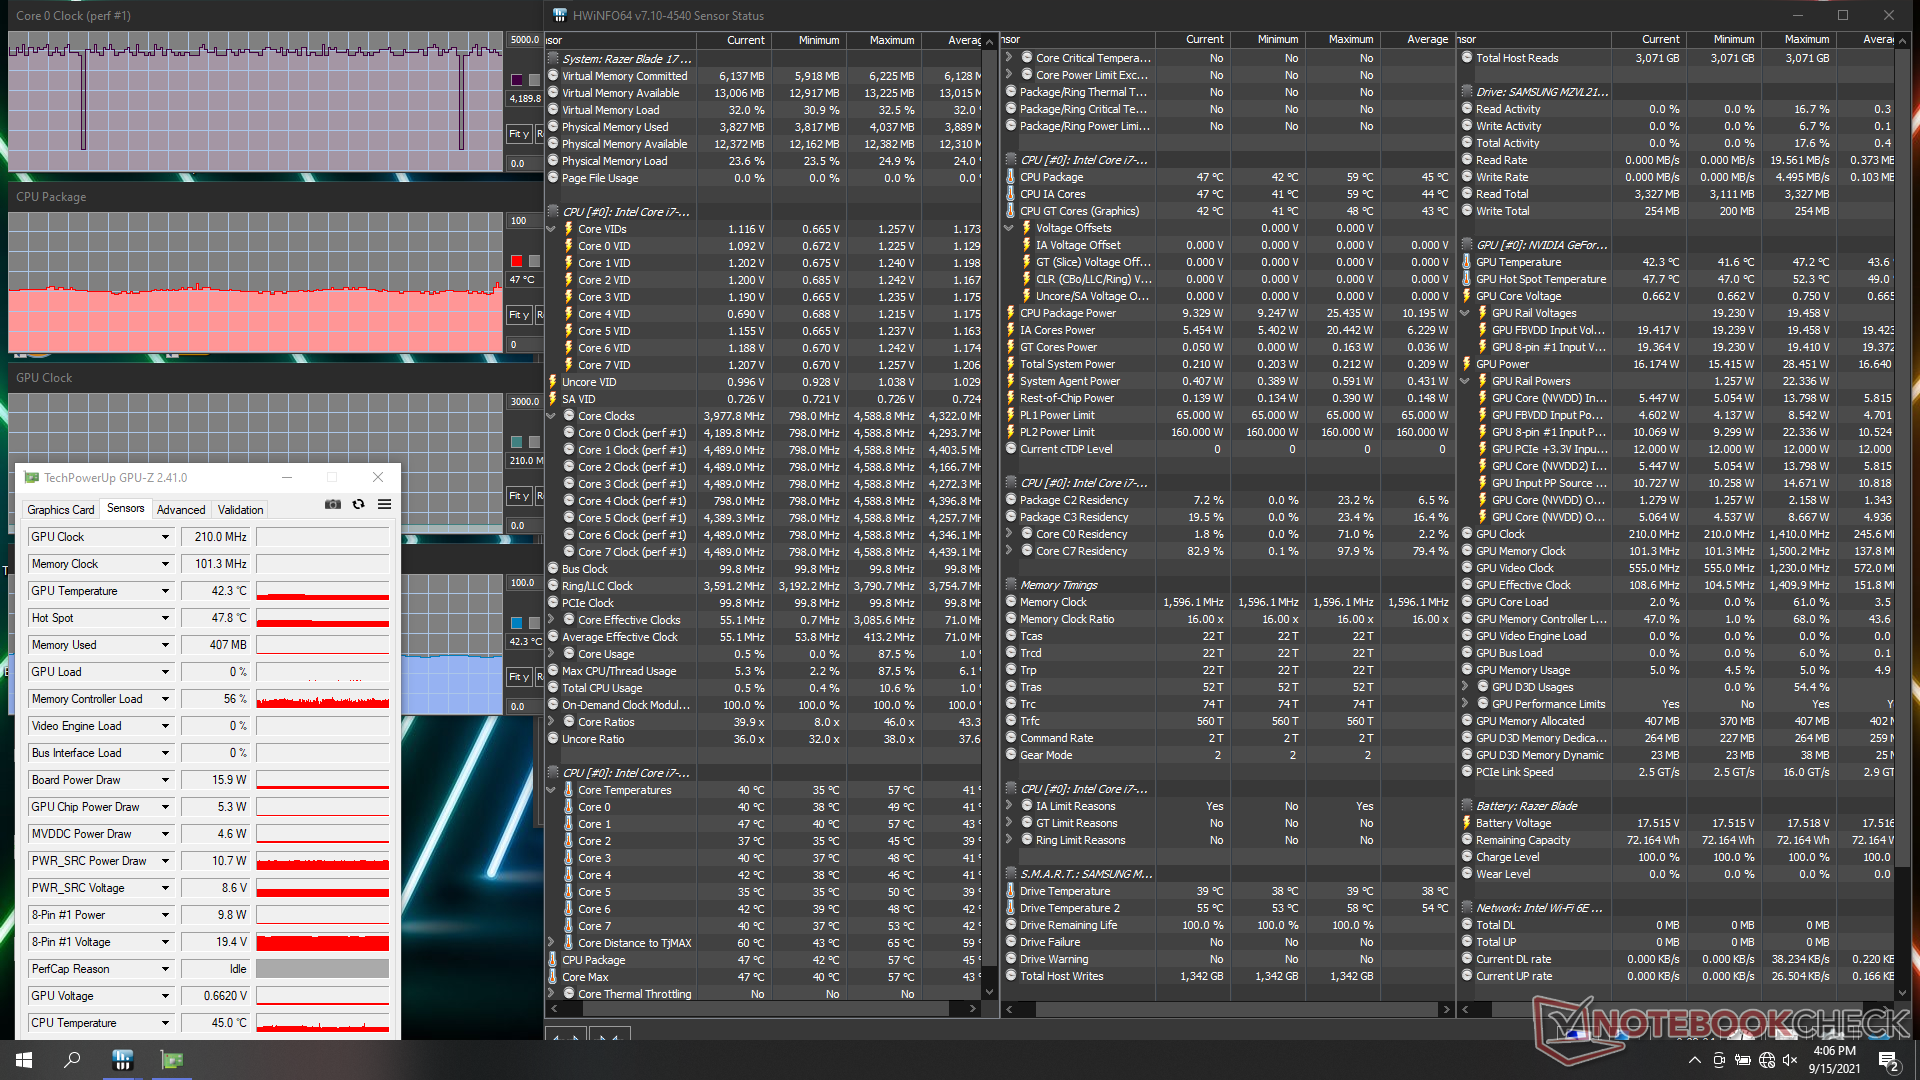
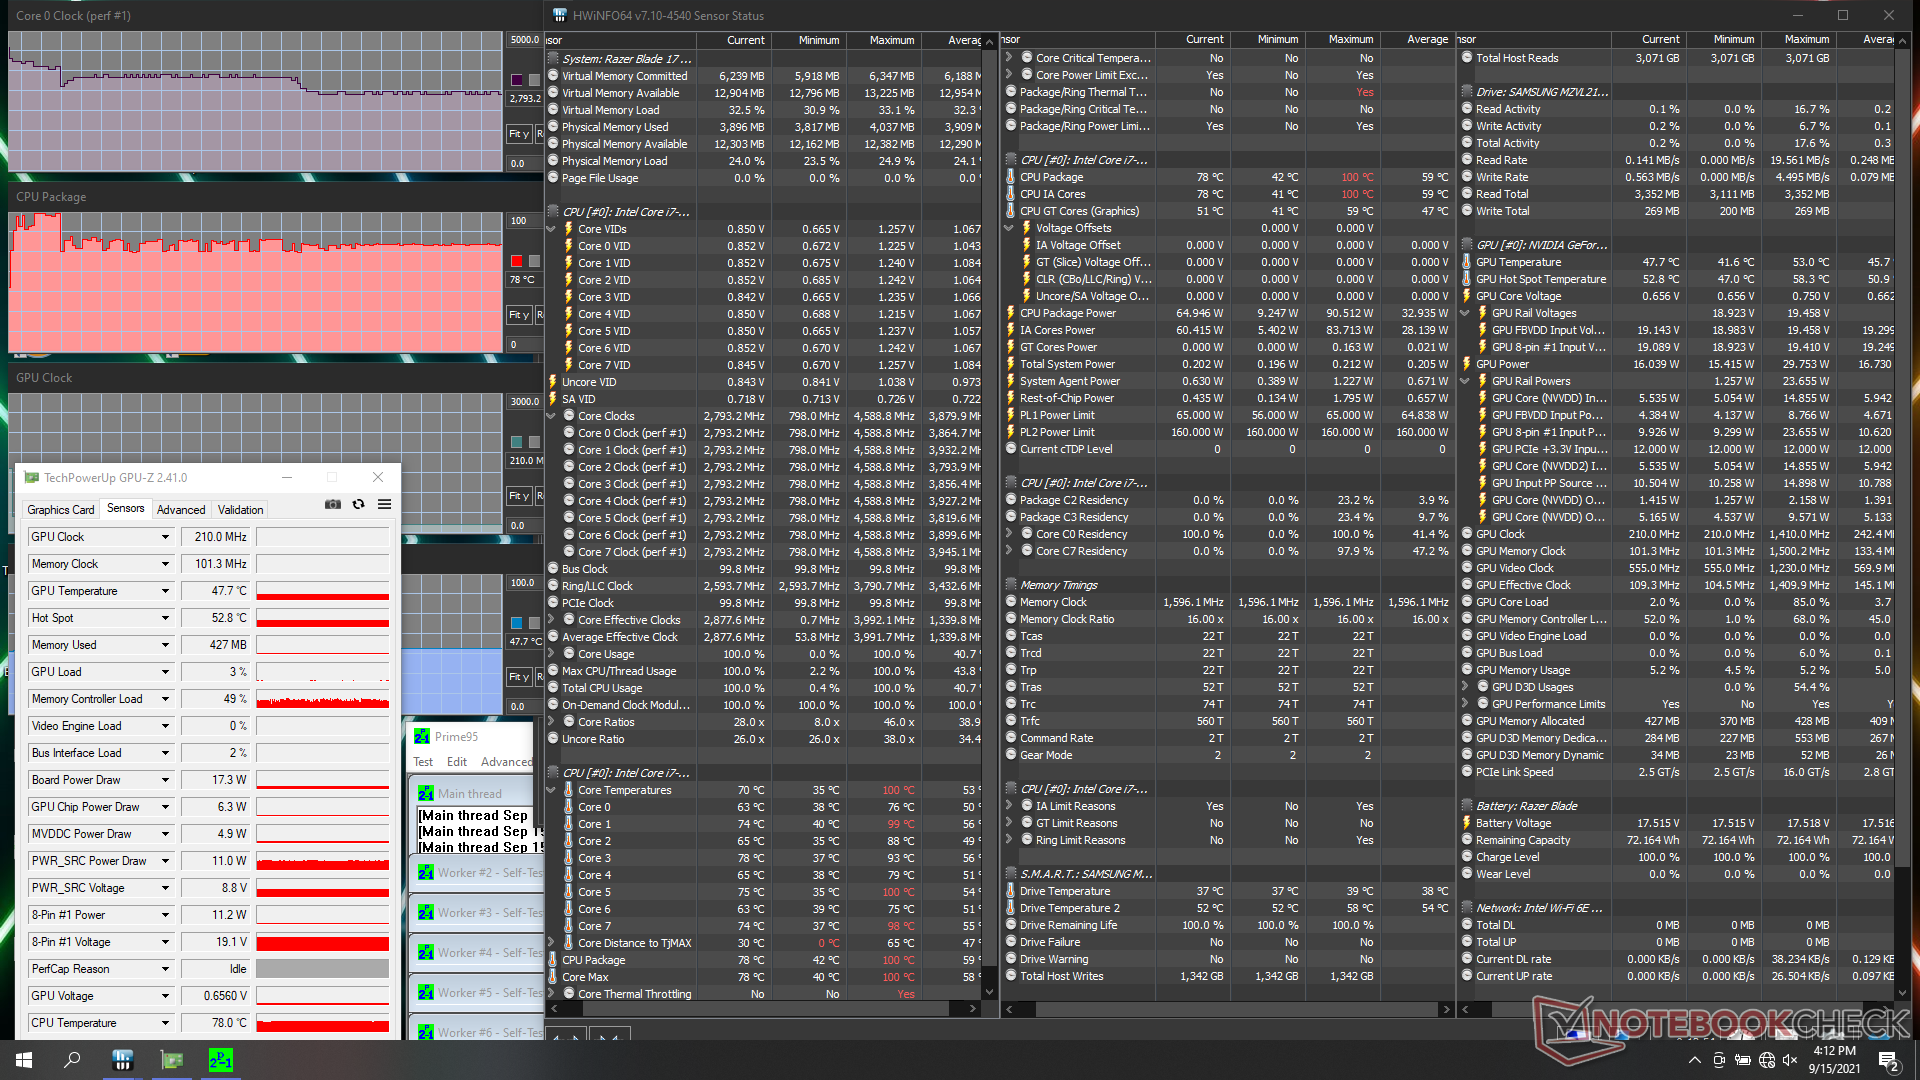
| RelógioCPU (GHz) | RelógioGPU (MHz) | Temperaturamédiada CPU (°C) | Temperaturamédiada GPU (°C) | |
| System Idle | -- | --46 | 42 | |
| Prime95 Stress (Turbo on) | 2.8 | --78 | 48 | |
| Prime95 + FurMark Stress (Turbo off) | 2.0 | 1305 | 78 | 70 |
| Prime95 + FurMark Stress (Turbo on) | 2.8 - 3.4 | 1380 | 92 | 69 |
| Witcher 3 Stress (Turbo off) | ~1.8 - 4.2 | 1515 | 77 | 70 |
| Witcher 3 Stress (Turbo on) | 4.2 | 1725 | 79 | 72 |
Oradores

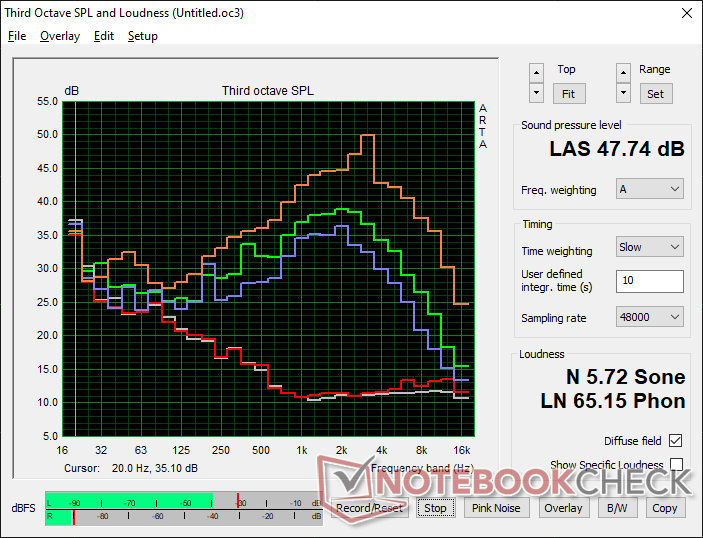
Razer Blade 17 RTX 3070 análise de áudio
(+) | os alto-falantes podem tocar relativamente alto (###valor### dB)
Graves 100 - 315Hz
(-) | quase nenhum baixo - em média 23.4% menor que a mediana
(±) | a linearidade dos graves é média (11.6% delta para a frequência anterior)
Médios 400 - 2.000 Hz
(+) | médios equilibrados - apenas 2.4% longe da mediana
(+) | médios são lineares (2.1% delta para frequência anterior)
Altos 2 - 16 kHz
(+) | agudos equilibrados - apenas 2.7% longe da mediana
(+) | os máximos são lineares (5.1% delta da frequência anterior)
Geral 100 - 16.000 Hz
(+) | o som geral é linear (13.6% diferença em relação à mediana)
Comparado com a mesma classe
» 20% de todos os dispositivos testados nesta classe foram melhores, 7% semelhantes, 73% piores
» O melhor teve um delta de 6%, a média foi 18%, o pior foi 132%
Comparado com todos os dispositivos testados
» 15% de todos os dispositivos testados foram melhores, 4% semelhantes, 82% piores
» O melhor teve um delta de 4%, a média foi 23%, o pior foi 134%
Apple MacBook 12 (Early 2016) 1.1 GHz análise de áudio
(+) | os alto-falantes podem tocar relativamente alto (###valor### dB)
Graves 100 - 315Hz
(±) | graves reduzidos - em média 11.3% menor que a mediana
(±) | a linearidade dos graves é média (14.2% delta para a frequência anterior)
Médios 400 - 2.000 Hz
(+) | médios equilibrados - apenas 2.4% longe da mediana
(+) | médios são lineares (5.5% delta para frequência anterior)
Altos 2 - 16 kHz
(+) | agudos equilibrados - apenas 2% longe da mediana
(+) | os máximos são lineares (4.5% delta da frequência anterior)
Geral 100 - 16.000 Hz
(+) | o som geral é linear (10.2% diferença em relação à mediana)
Comparado com a mesma classe
» 7% de todos os dispositivos testados nesta classe foram melhores, 2% semelhantes, 90% piores
» O melhor teve um delta de 5%, a média foi 18%, o pior foi 53%
Comparado com todos os dispositivos testados
» 5% de todos os dispositivos testados foram melhores, 1% semelhantes, 94% piores
» O melhor teve um delta de 4%, a média foi 23%, o pior foi 134%
Energy Management
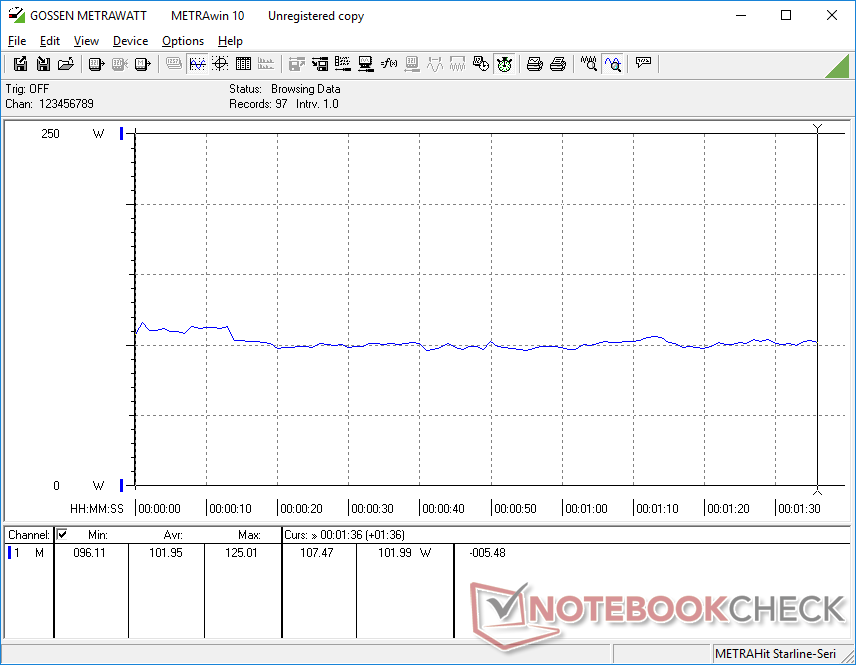
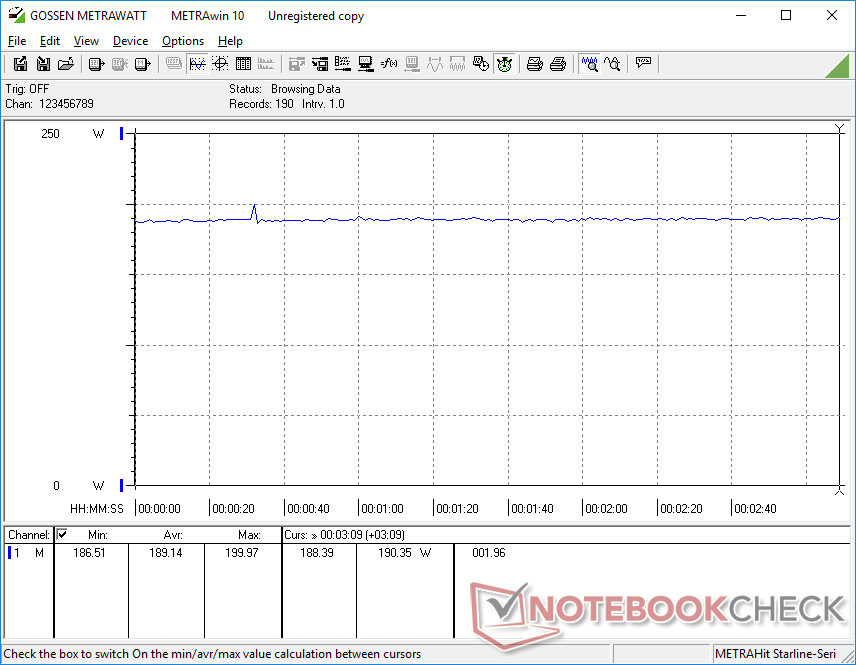
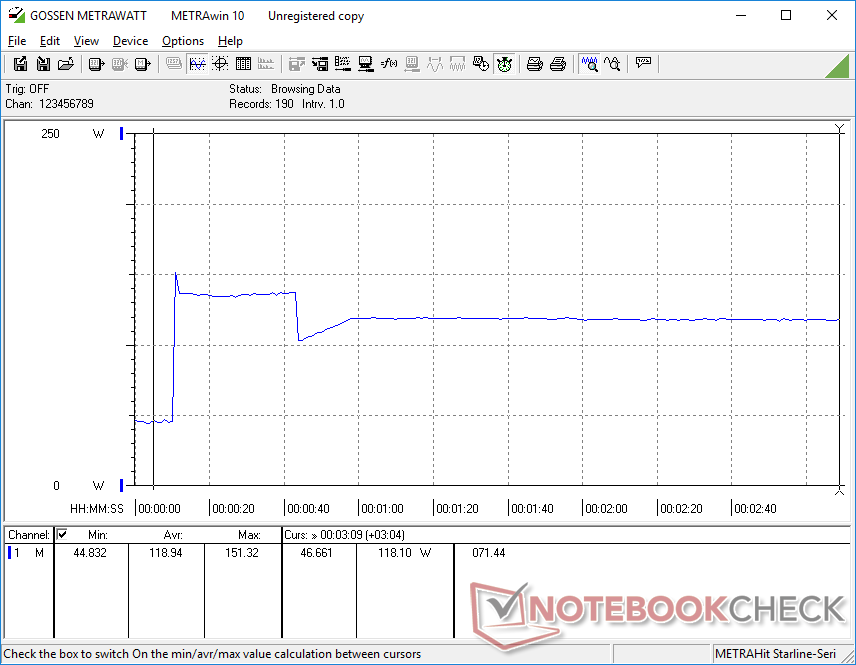
Consumo de energia
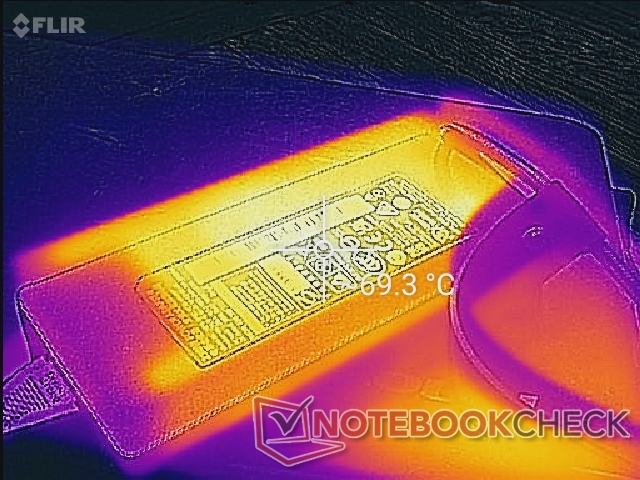
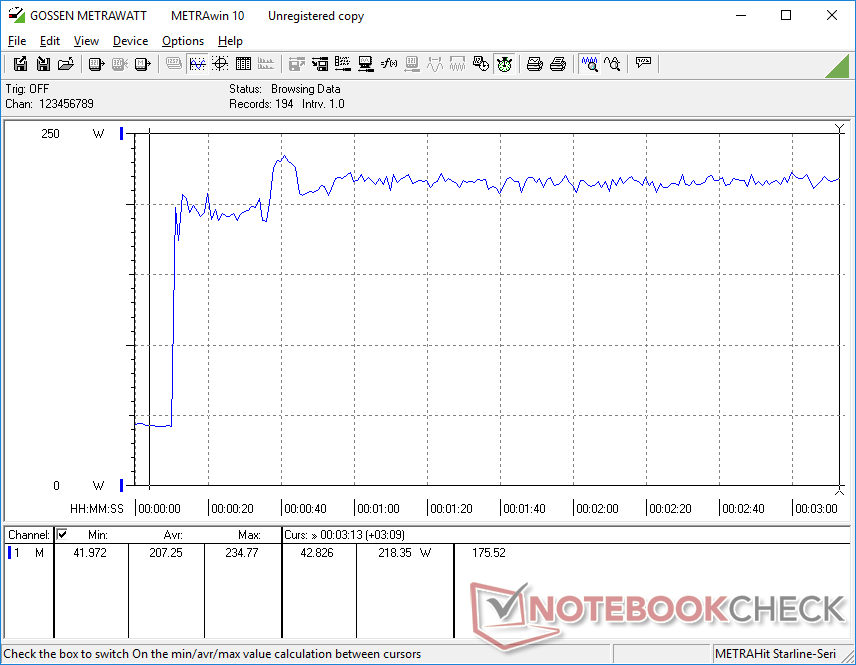
O Blade 17 é geralmente mais ávido de energia do que os modelos Blade Pro mais antigos, incluindo até mesmo o Blade Pro RTX 3080 com visor de 4K. Rodando Witcher 3Por exemplo, consome 189 W em nossa lâmina 17 em comparação com 158 W no Blade Pro RTX 3080 ou Blade Pro RTX 2070. Talvez não coincidentemente, esta diferença é quase igual à diferença nos níveis alvos TGP; os modelos mais antigos Blade Pro teriam como alvo 100 W TGP enquanto o mais novo Blade 17 teria como alvo 130 W. Infelizmente, o aumento de 20% no consumo de energia não significa necessariamente um aumento de 20% no desempenho gráfico entre o mais antigo Blade Pro do início de 2021 e o mais novo Blade 17.
Somos capazes de registrar um consumo máximo de 235 W a partir do adaptador AC de 230 W (~17 x 7 x 2,5 cm) de tamanho médio. A taxa de carga irá diminuir significativamente quando se trabalha com cargas estressantes como resultado.
| desligado | |
| Ocioso | |
| Carga |
|
Key:
min: | |
| Razer Blade 17 RTX 3070 i7-11800H, GeForce RTX 3070 Laptop GPU, Samsung PM9A1 MZVL21T0HCLR, IPS, 1920x1080, 17.3" | Razer Blade Pro 17 2021 (QHD Touch) i7-10875H, GeForce RTX 3080 Laptop GPU, Samsung PM981a MZVLB1T0HBLR, IPS, 3840x2160, 17.3" | Razer Blade Pro 17 RTX 2070 Max-Q 300 Hz i7-10875H, GeForce RTX 2070 Max-Q, Lite-On CA5-8D512, IPS, 1920x1080, 17.3" | Razer Blade Pro 17 4K UHD 120 Hz i7-9750H, GeForce RTX 2080 Max-Q, Samsung SSD PM981 MZVLB1T0HALR, IPS, 3840x2160, 17.3" | Razer Blade Pro 17 RTX 2060 i7-9750H, GeForce RTX 2060 Mobile, Samsung SSD PM981 MZVLB512HAJQ, IPS, 1920x1080, 17.3" | Razer Blade Pro 17 RTX 2080 Max-Q i7-9750H, GeForce RTX 2080 Max-Q, Samsung SSD PM981 MZVLB512HAJQ, IPS, 1920x1080, 17.3" | |
|---|---|---|---|---|---|---|
| Power Consumption | 12% | 8% | -20% | 16% | 17% | |
| Idle Minimum * (Watt) | 20.9 | 15.2 27% | 19.6 6% | 34.2 -64% | 16 23% | 16.2 22% |
| Idle Average * (Watt) | 25.1 | 20.3 19% | 21.7 14% | 37.2 -48% | 21.7 14% | 20.4 19% |
| Idle Maximum * (Watt) | 45 | 37.3 17% | 36.1 20% | 50 -11% | 26.1 42% | 26.1 42% |
| Load Average * (Watt) | 102 | 114.9 -13% | 115.6 -13% | 106.1 -4% | 105.6 -4% | 96.5 5% |
| Witcher 3 ultra * (Watt) | 189 | 158.4 16% | 157 17% | 178.7 5% | 161.8 14% | 182.9 3% |
| Load Maximum * (Watt) | 234.8 | 223.7 5% | 219.9 6% | 223.6 5% | 225.3 4% | 214.3 9% |
* ... menor é melhor
Power Consumption Witcher 3 / Stresstest
Vida útil da bateria - Nada mal para uma máquina de jogo de 17,3 polegadas
A capacidade da bateria permanece a mesma que na Blade Pro e, portanto, os tempos de funcionamento também são, em sua maioria, inalterados, apesar da maior taxa de atualização nativa. Somos capazes de espremer pouco mais de 5 horas de uso da WLAN no perfil Balanceado com Optimus ativo.
O carregamento do vazio ao cheio leva cerca de 1,5 horas com o adaptador AC incluído. Carregamento via USB-C como com o adaptador AC incluído Carregador Razer USB-C GaN levará mais tempo.
| Razer Blade 17 RTX 3070 i7-11800H, GeForce RTX 3070 Laptop GPU, 70 Wh | Asus ROG Zephyrus S17 GX703HSD i9-11900H, GeForce RTX 3080 Laptop GPU, 90 Wh | MSI GS76 Stealth 11UH i9-11900H, GeForce RTX 3080 Laptop GPU, 99.9 Wh | Acer Nitro 5 AN517-41-R9S5 R7 5800H, GeForce RTX 3080 Laptop GPU, 57.5 Wh | Gigabyte Aero 17 HDR YD i9-11980HK, GeForce RTX 3080 Laptop GPU, 99 Wh | Maingear Vector Pro MG-VCP17 i7-11800H, GeForce RTX 3080 Laptop GPU, 91 Wh | |
|---|---|---|---|---|---|---|
| Duração da bateria | 62% | 19% | 10% | -6% | 33% | |
| Reader / Idle (h) | 6.7 | 9.9 48% | ||||
| WiFi v1.3 (h) | 5.2 | 7.5 44% | 6.4 23% | 5.7 10% | 5.6 8% | 6.9 33% |
| Load (h) | 1.5 | 2.7 80% | 1.3 -13% | 1.2 -20% | ||
| Witcher 3 ultra (h) | 1 |
Pro
Contra
Veredicto - Grande aumento da CPU com pequenos ganhos da GPU
Embora a atualização para gráficos de 130 W possa parecer um enorme aumento de mais de 100 W no papel, os níveis de desempenho no mundo real são apenas marginalmente melhores, uma vez que ainda estamos trabalhando dentro da mesma família Ampere de GPUs Nvidia. Neste caso, nosso RTX 3070 de 130 W está essencialmente no mesmo nível que o RTX 3080 de 100 W no Comet Lake-H Blade Pro. Somos capazes de espremer uma placa constante de ~115 W GPU em modo Turbo manual contra apenas ~95 W quando no modo balanceado padrão, o que significa que os usuários devem se lembrar de ativar o modo Turbo e suportar o máximo ruído do ventilador se quiserem explorar ao máximo o sistema
O maior ganho está no desempenho do processador, onde o salto do 10º para o 11º gen Intel é muito mais impressionante, especialmente porque o Core i7-10875H no 2020 Blade Pro teve um desempenho ligeiramente inferior. A atualização da CPU naturalmente traz suporte PCIe4 e Thunderbolt 4, o que torna o sistema ainda mais resistente ao futuro
Após dois anos de atualizações contínuas, o Blade de 17,3 polegadas agora se sente mais refinado do que nunca para ser uma recomendação mais fácil do que seu lançamento inicial em 2019.
Por mais elegante que o chassi de 2019 possa ser, ele poderia usar algumas atualizações físicas reais além do simples desempenho. A Dell acaba de lançar o Alienware x17 com chaves mecânicas Cherry que fazem a Lâmina 17 se sentir econômica em comparação. A falta de um obturador de webcam está se tornando mais difícil de ignorar também e os dois ventiladores de alta rotação sob o clickpad devem ser abordados sem afetar o fluxo de ar
Preço e disponibilidade
SKUs Múltiplas Lâminas 17 SKUs estão disponíveis emagora na Best Buy por $2499 USDe para cima. Outros varejistas como a Amazon ainda não os disponibilizaram no momento da redação. Tenha em mente que o último modelo é simplesmente "Blade 17" e não "Blade Pro 17", que seria o nome do modelo mais antigo.
Razer Blade 17 RTX 3070
- 09/21/2021 v7 (old)
Allen Ngo
Price comparison

