Notebookcheck Logo

XMG SECTOR PC desktop de alta qualidade com Intel Core i9-13900K e Nvidia GeForce RTX 4090 revisado

Jogo sem concessões! XMG SECTOR é o nome dado a este computador de última geração para jogos. Nesta revisão, analisaremos de perto e examinaremos o desempenho de uma configuração de ponta com um Intel Core i9-13900K e um Nvidia GeForce RTX 4090.
XMG SECTOR Intel com um Core i9-13900K e um MSI GeForce RTX 4090 VENTUS 3X

Muitas pessoas associam Schenker a laptops potentes. A adição da marca "XMG" indica dispositivos de jogos de alto nível, que entretanto também incluem PCs desktop. Nesta revisão, vamos nos concentrar no XMG SECTOR XMG baseado em Intel. A configuração base tem um preço de 1.239 euros (US$ 1.306) e é fornecida com um Intel Core i5-12400F, 16 GB de RAM e um Nvidia GeForce RTX 3060. Nossa unidade de revisão é um modelo high-end com um Núcleo i9-13900K e um GeForce RTX 4090mas também tem um preço muito alto de cerca de 4.700 euros (US$ 4.956). Entretanto, graças às muitas opções oferecidas pela loja XMGvocê pode equipar o PC com vários componentes de hardware e montar um sistema adaptado especificamente às suas necessidades.

XMG SECTOR, i9 13900K, RTX 4090
Processador
Intel Core i9-13900K 24 x 3 - 5.8 GHz, 253 W PL2 / Short Burst, 125 W PL1 / Sustained, Raptor Lake
Placa gráfica
NVIDIA GeForce RTX 4090 - 24 GB VRAM, Análises do: 2550 MHz, Memoría: 1313 MHz, 450 W TDP, GDDR6X, Nvidia 528.49
Memória
32 GB 
, DDR5-5600, 2 of 4 slots occupied, max 128 GB
placa mãe
Intel Z690 (Alder Lake-S PCH)
Disco rígido
Samsung SSD 980 Pro 2TB MZ-V8P2T0, 2048 GB 
, 1750 GB livre
Placa de Som
Intel Alder Lake-S PCH - cAVS (Audio, Voice, Speech)
Conexões
2 USB 2.0, 10 USB 3.2 Gen 2x2 20Gbps, 2 HDMI, 4 DisplayPort, Conexões Audio: ALC4080 ROG SupremeFX 7.1 Surround Sound High Definition Audio CODEC ALC4080
Funcionamento em rede
Intel Ethernet Controller I225-V (10/100/1000/2500MBit/s), Intel Wi-Fi 6E AX211 (a/b/g/h/n = Wi-Fi 4/ac = Wi-Fi 5/ax = Wi-Fi 6/ Wi-Fi 6E 6 GHz), Bluetooth 5.2
Tamanho
altura x largura x profundidade (em mm): 466 x 230 x 453
Sistema Operativo
Microsoft Windows 11 Pro
Características adicionais
Asus Amoury Crate, Corsair iCUE, 36 Meses Garantia
Preço
4620 EUR
Note: The manufacturer may use components from different suppliers including display panels, drives or memory sticks with similar specifications.


XMG SECTOR Intel
XMG SECTOR Intel
XMG SECTOR Intel
XMG SECTOR Intel
XMG SECTOR Intel
XMG SECTOR Intel
XMG SECTOR Intel
XMG SECTOR Intel
XMG SECTOR Intel
XMG SECTOR Intel
XMG SECTOR Intel
XMG SECTOR Intel
XMG SECTOR Intel
XMG SECTOR Intel
XMG SECTOR Intel
XMG SECTOR Intel (gerenciamento de cabos)

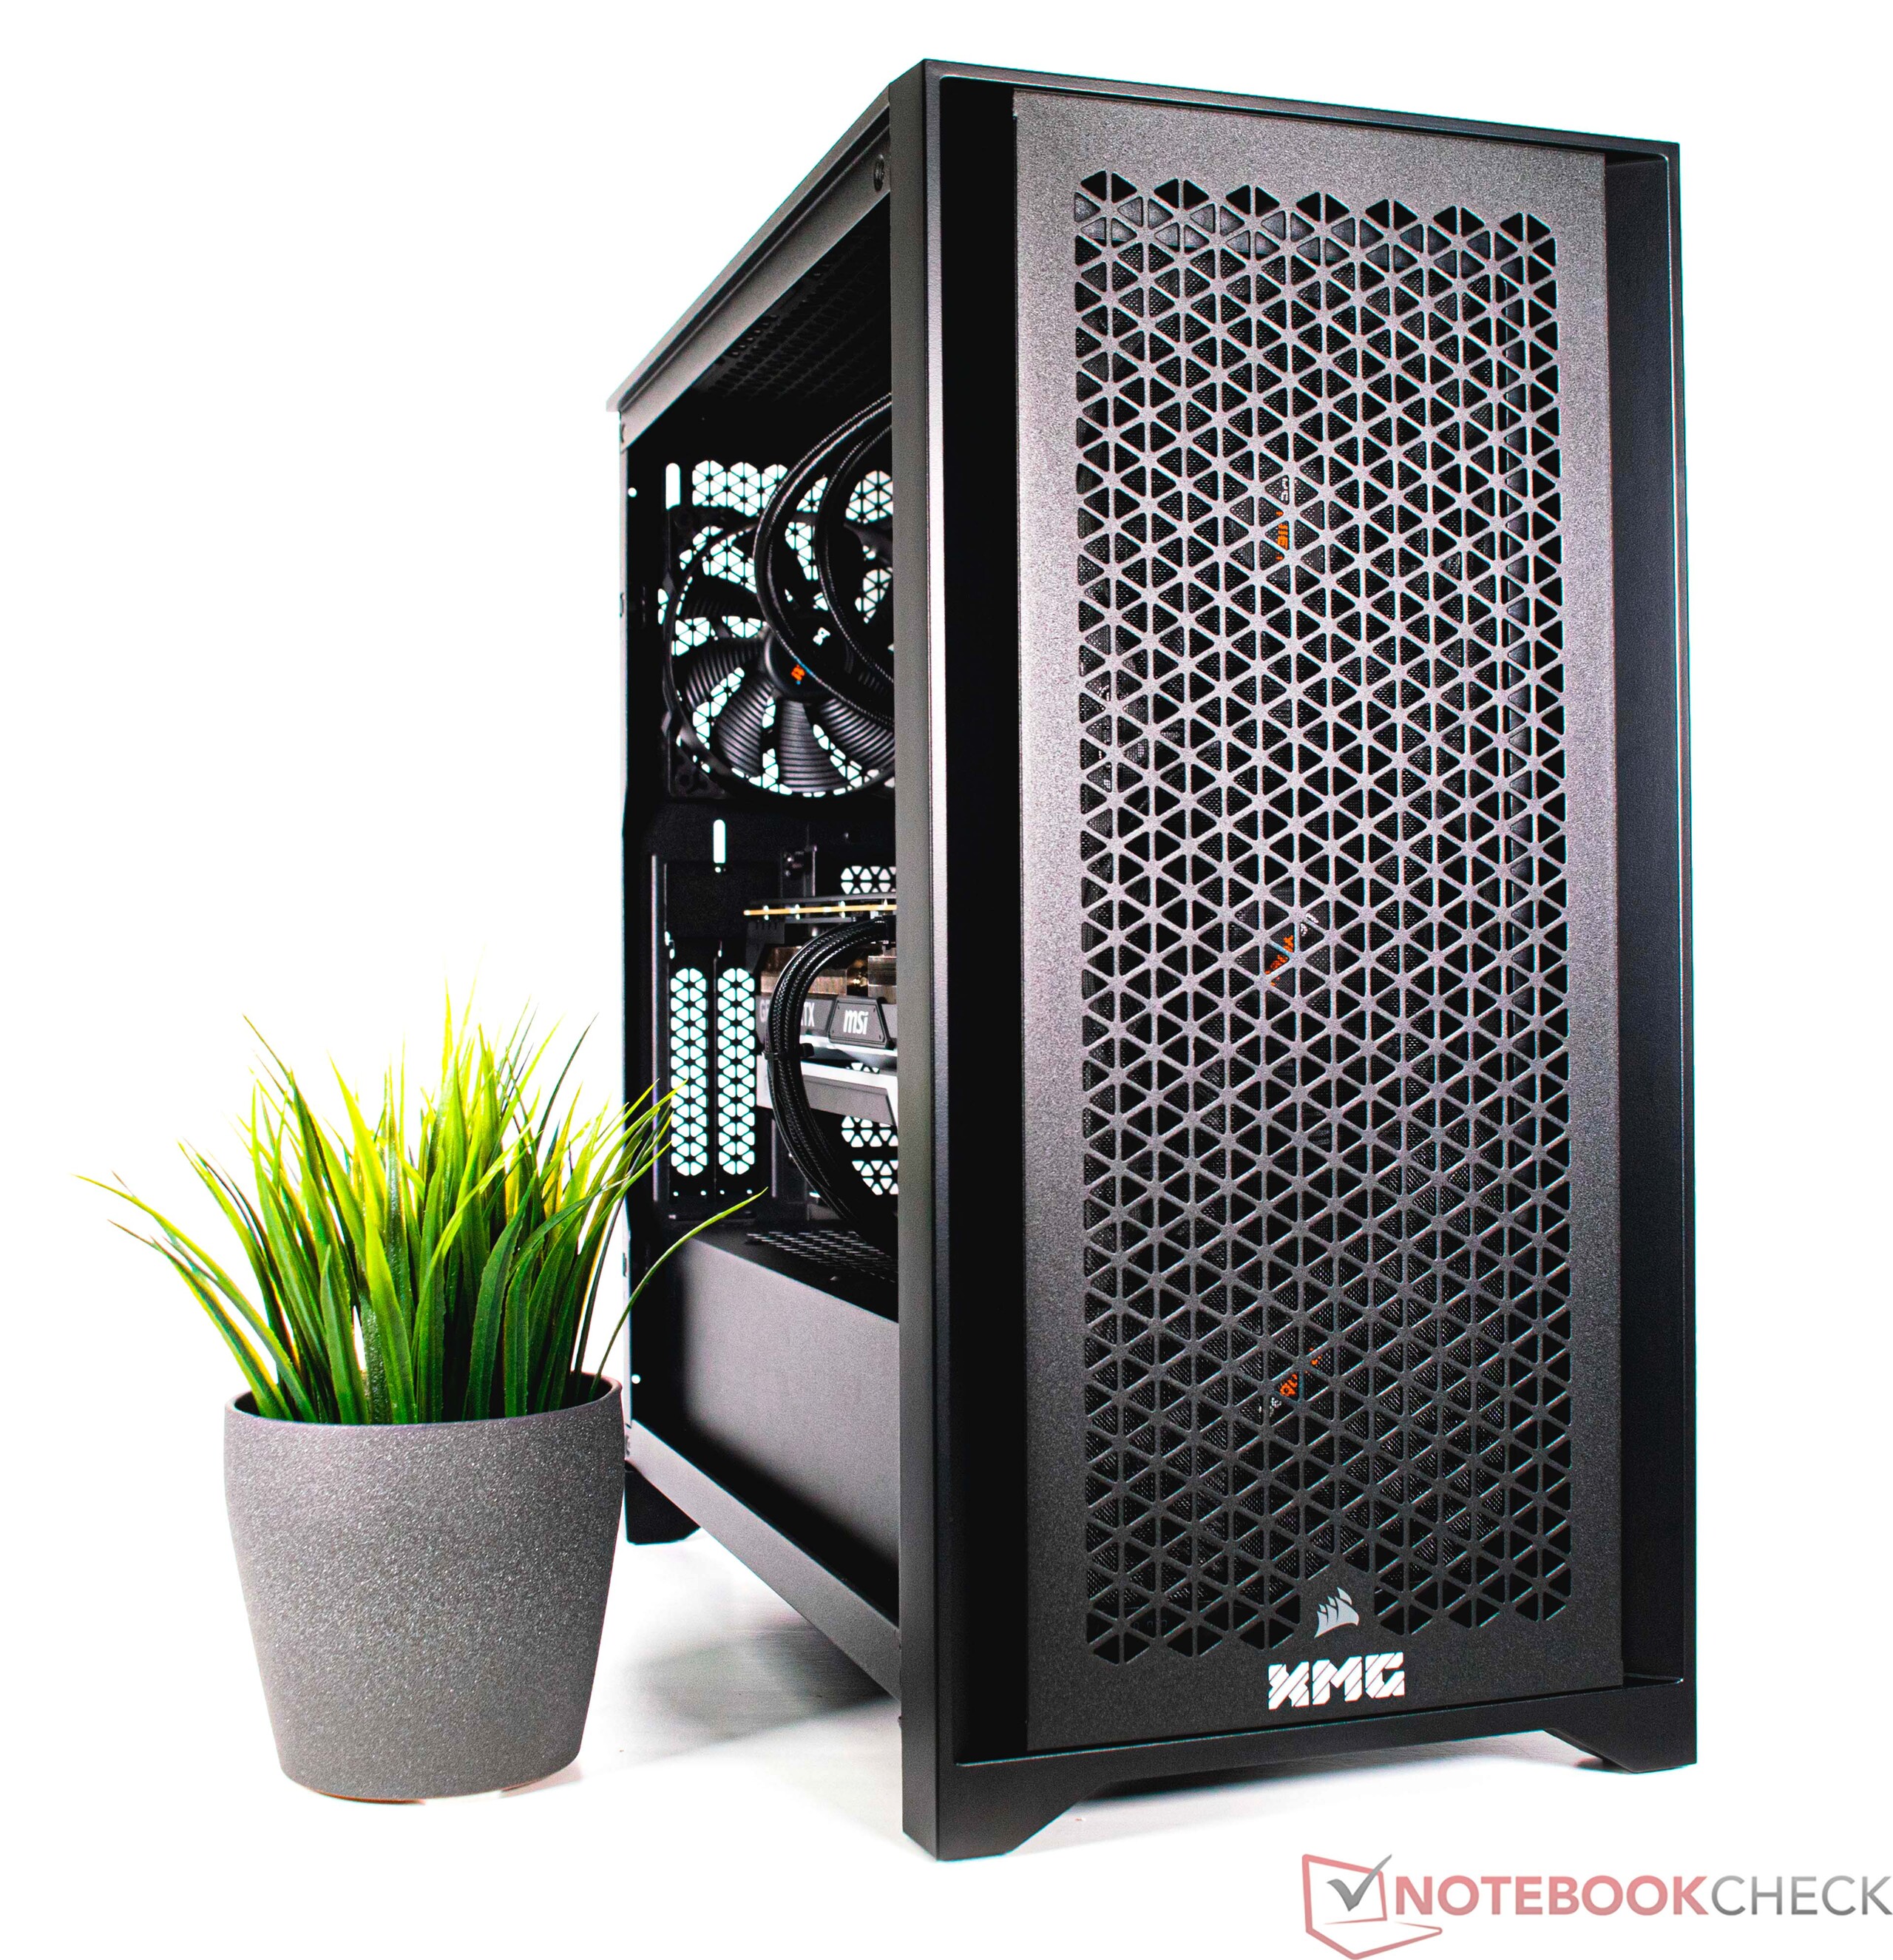
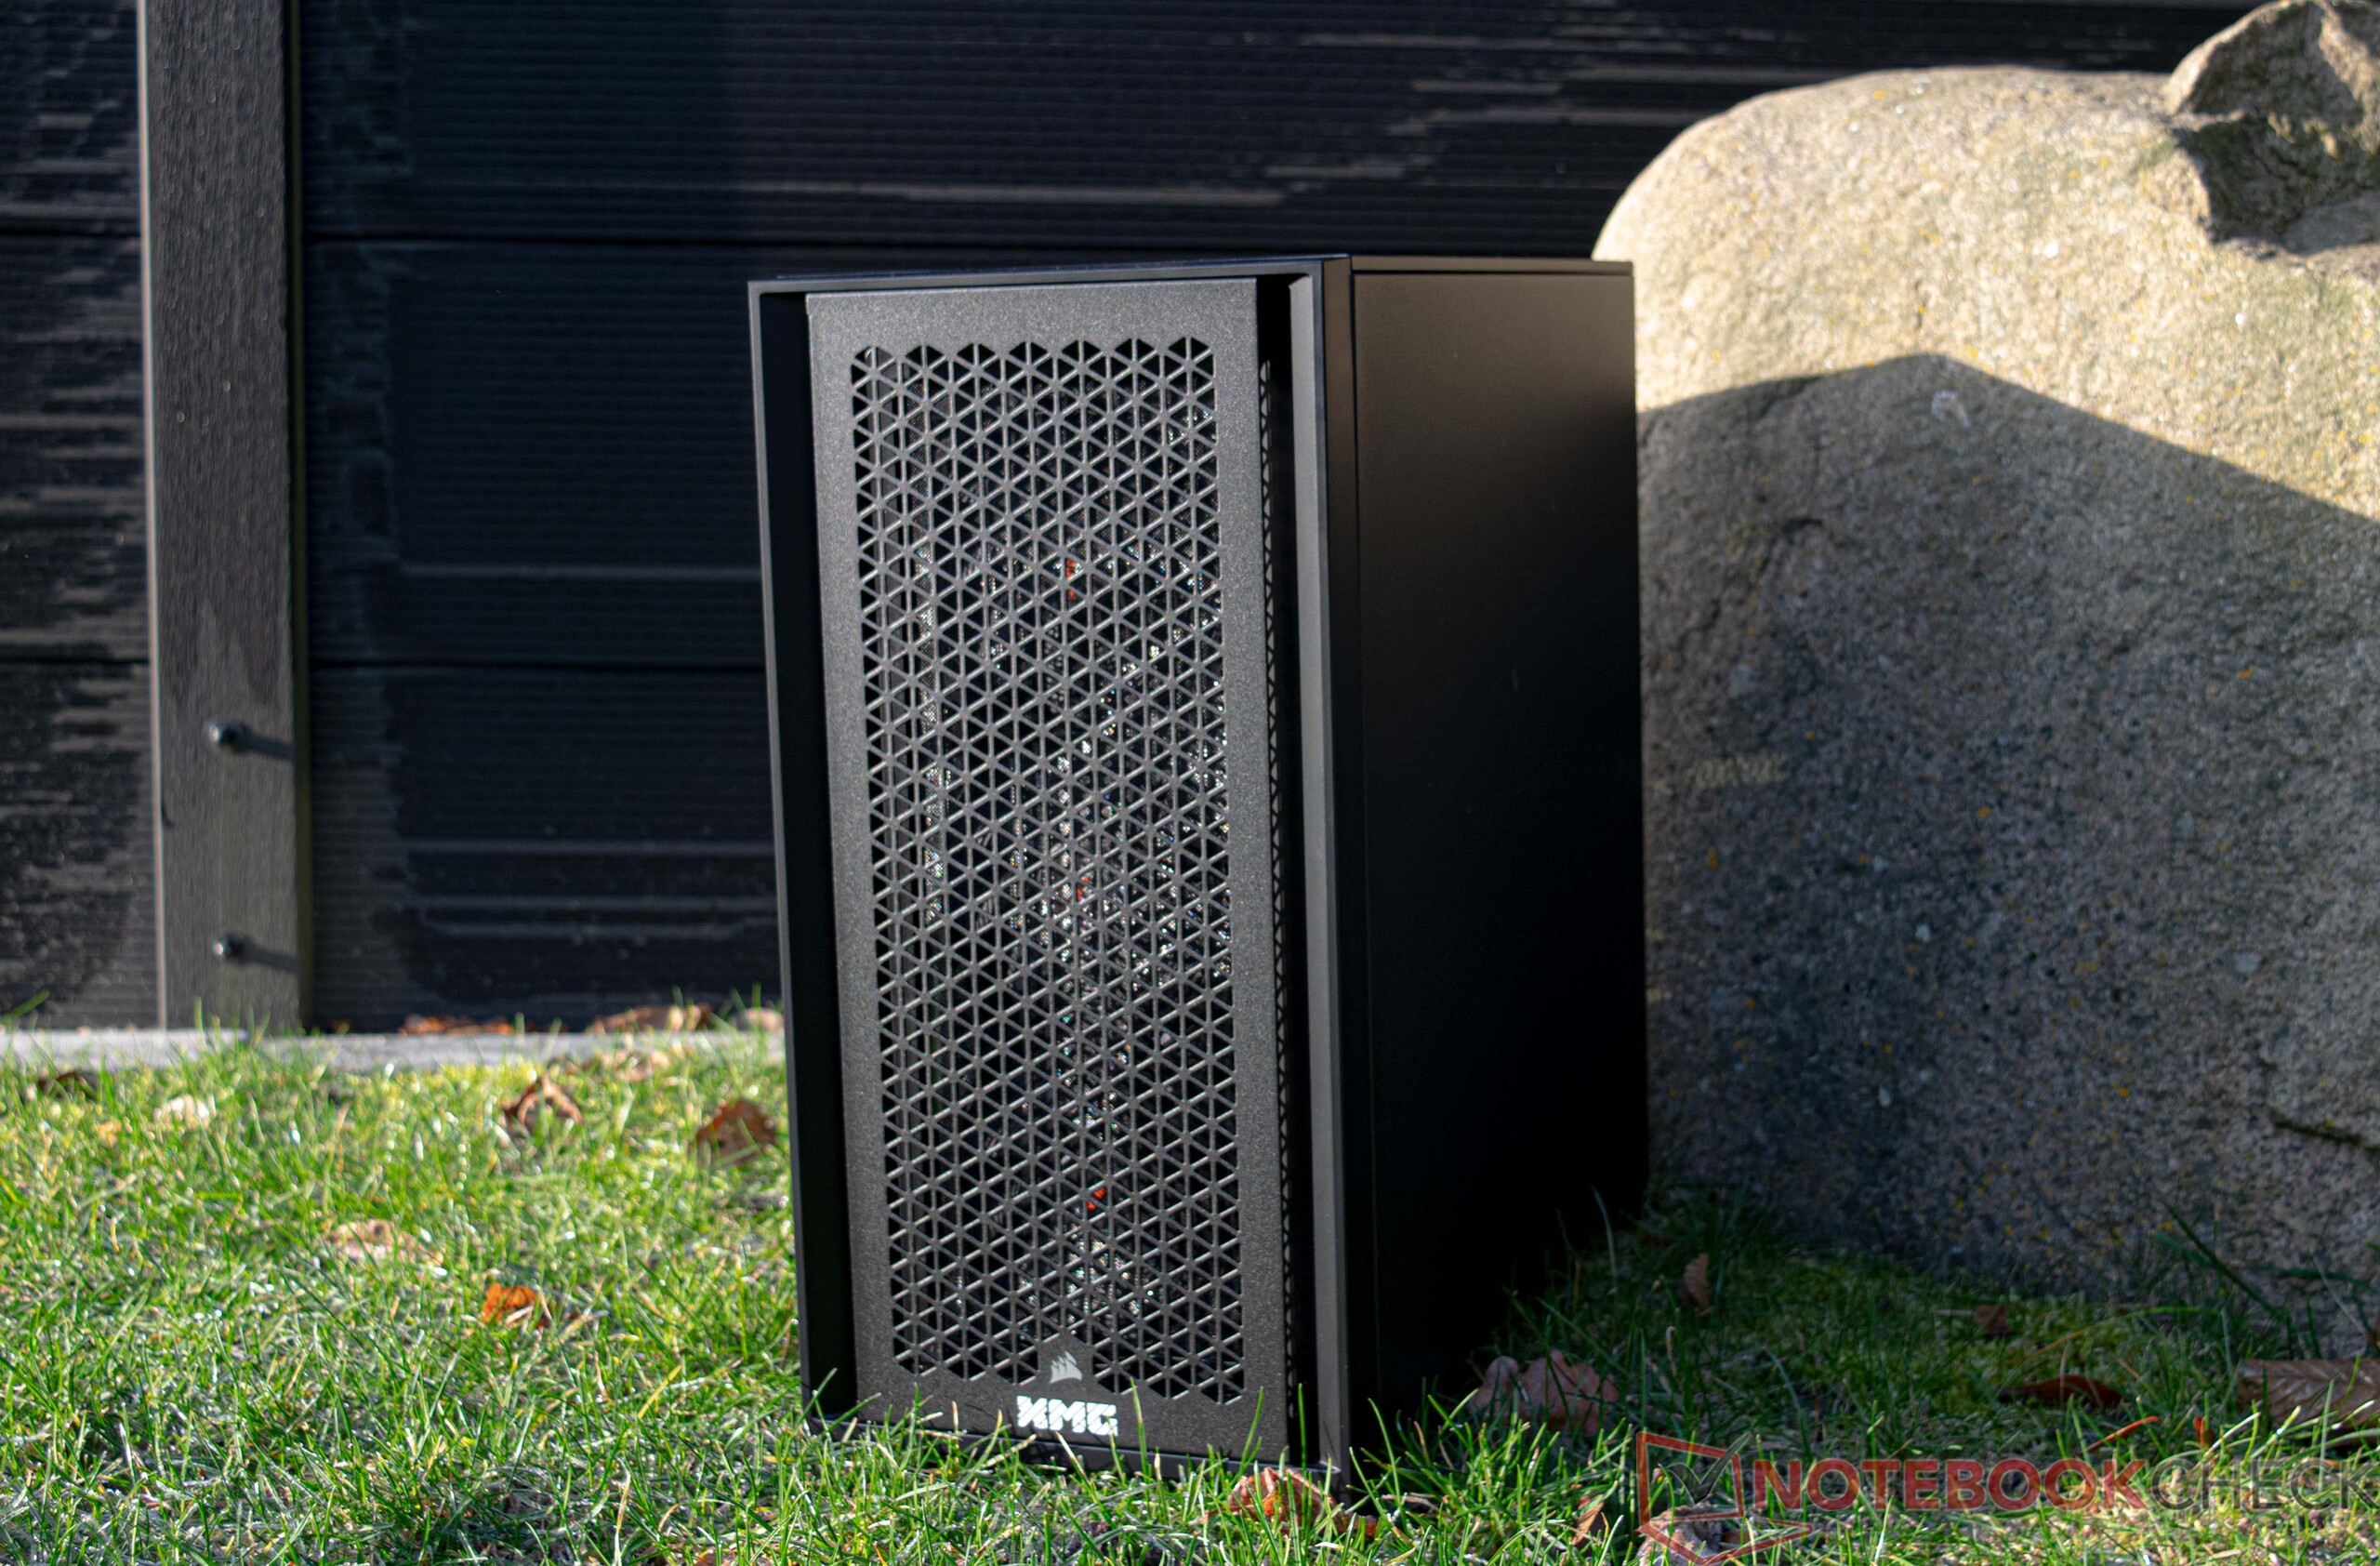
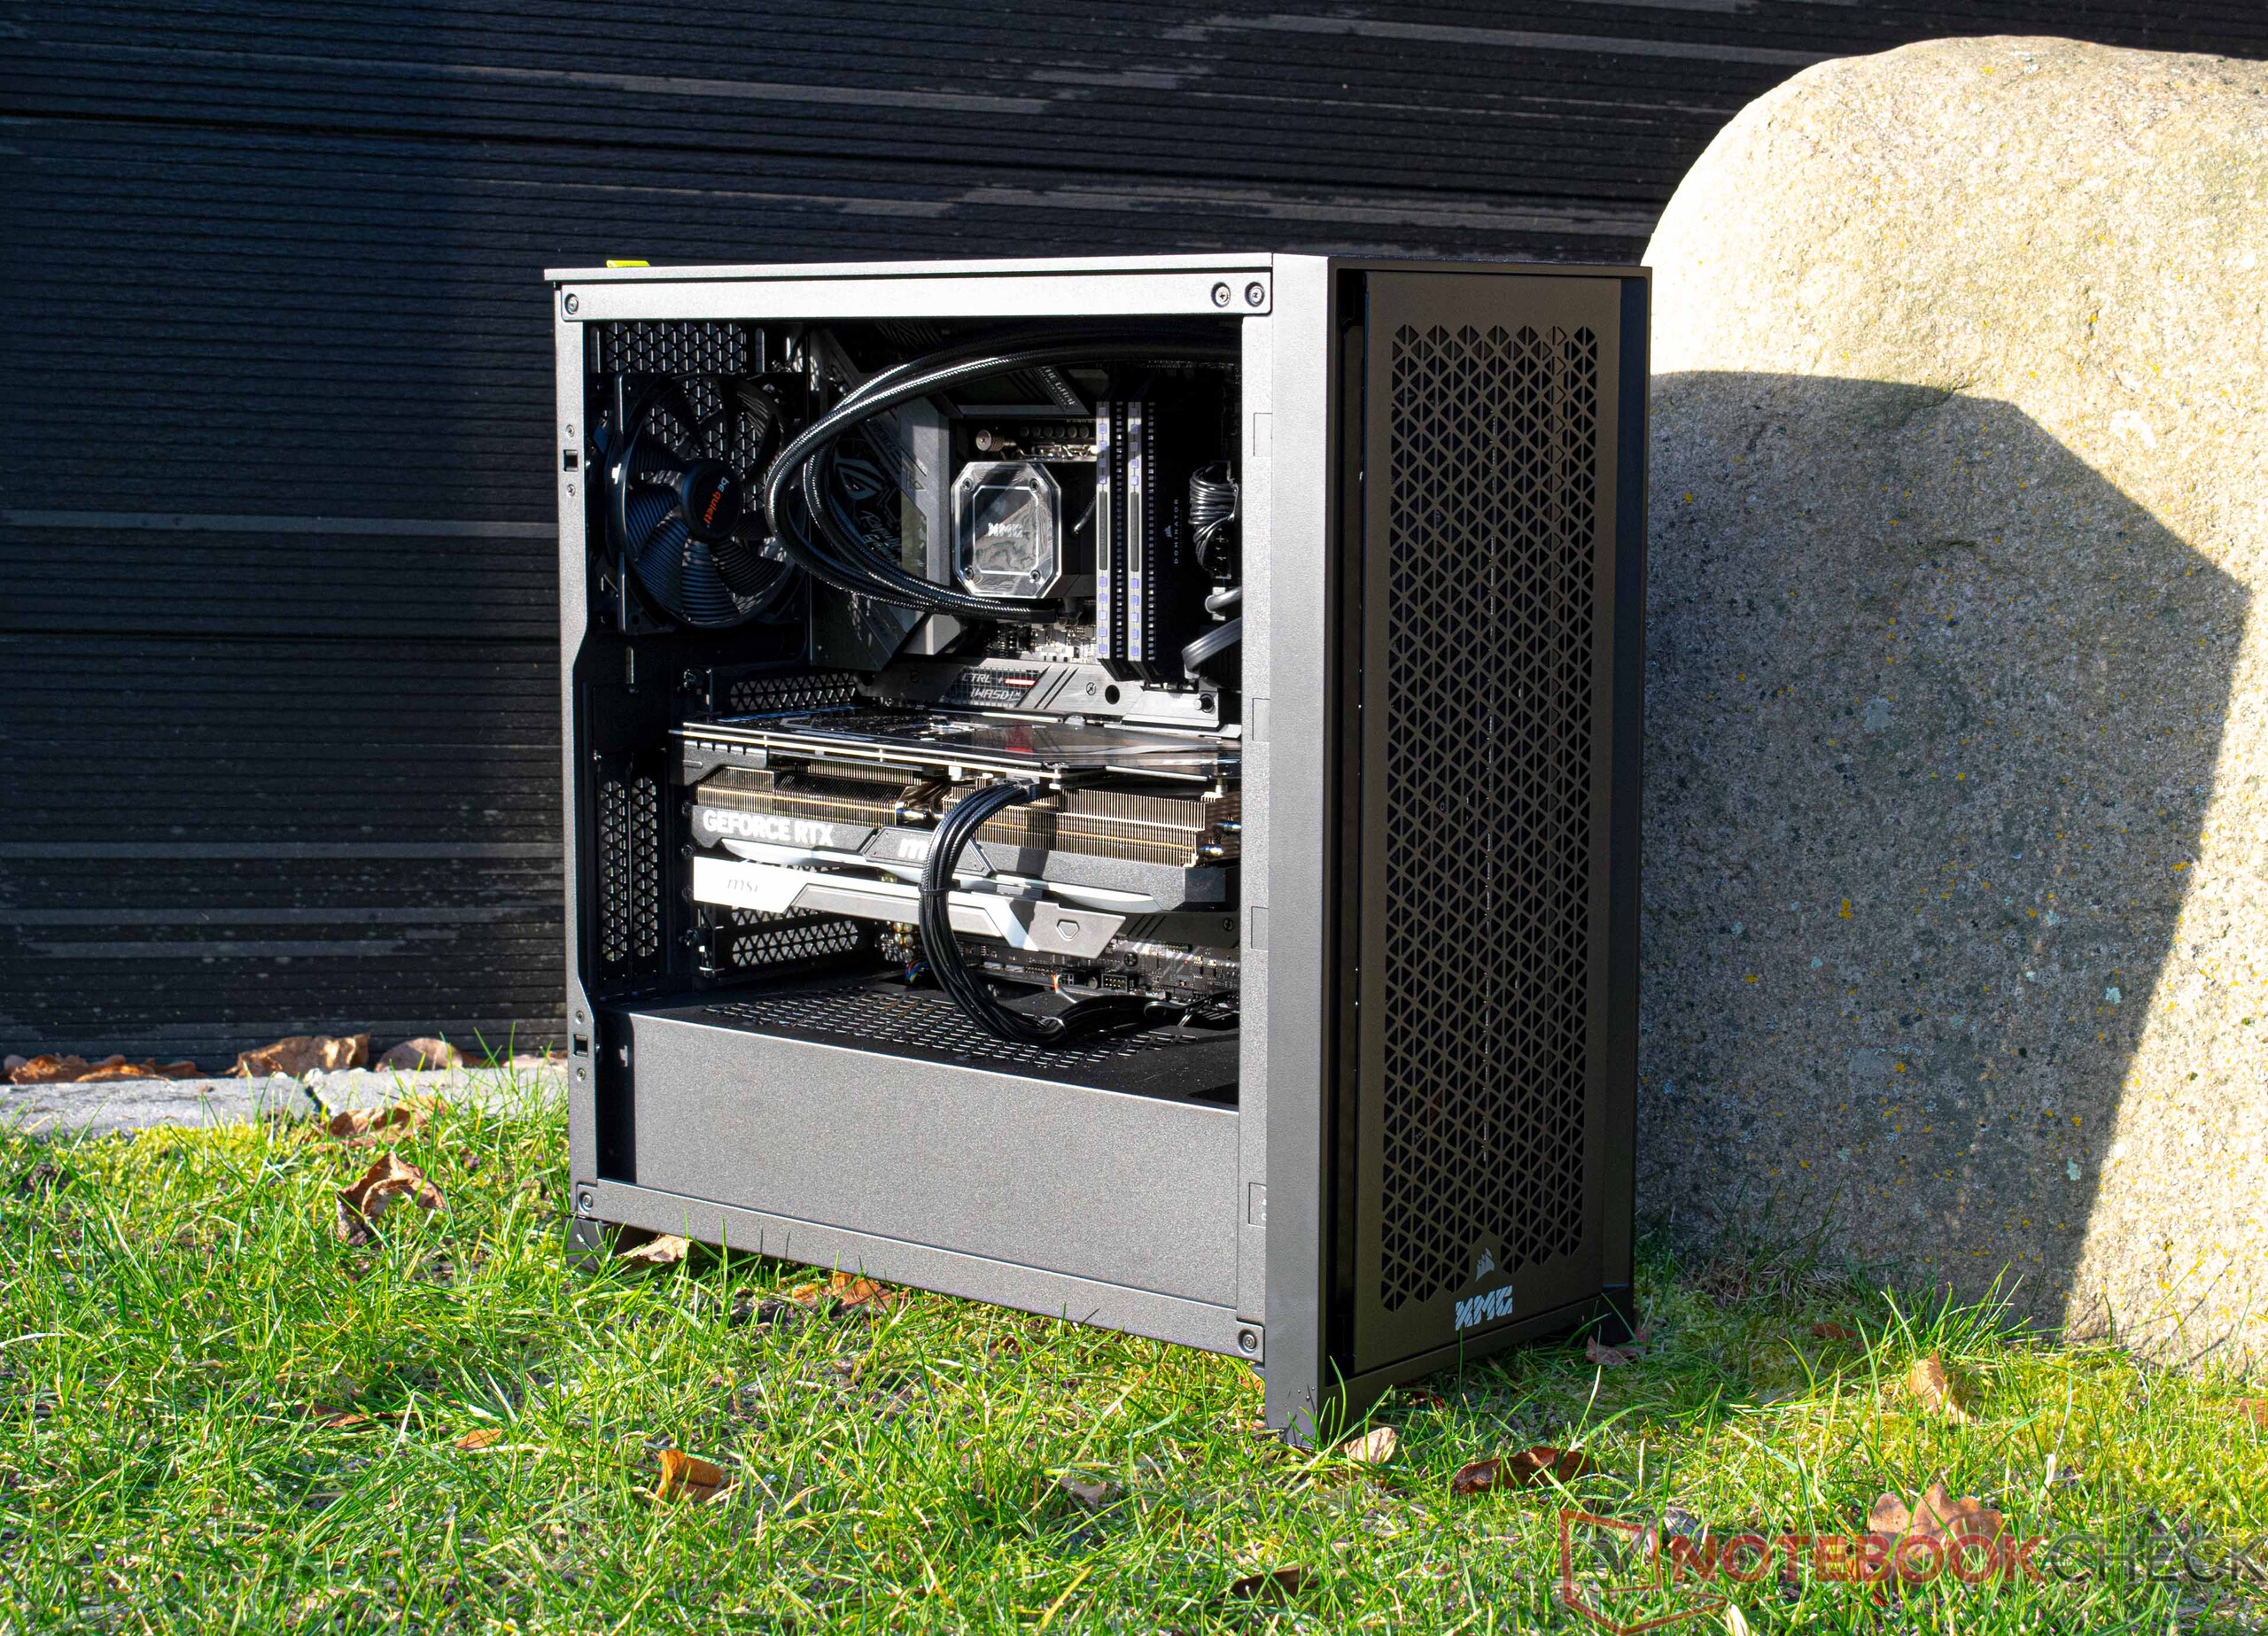
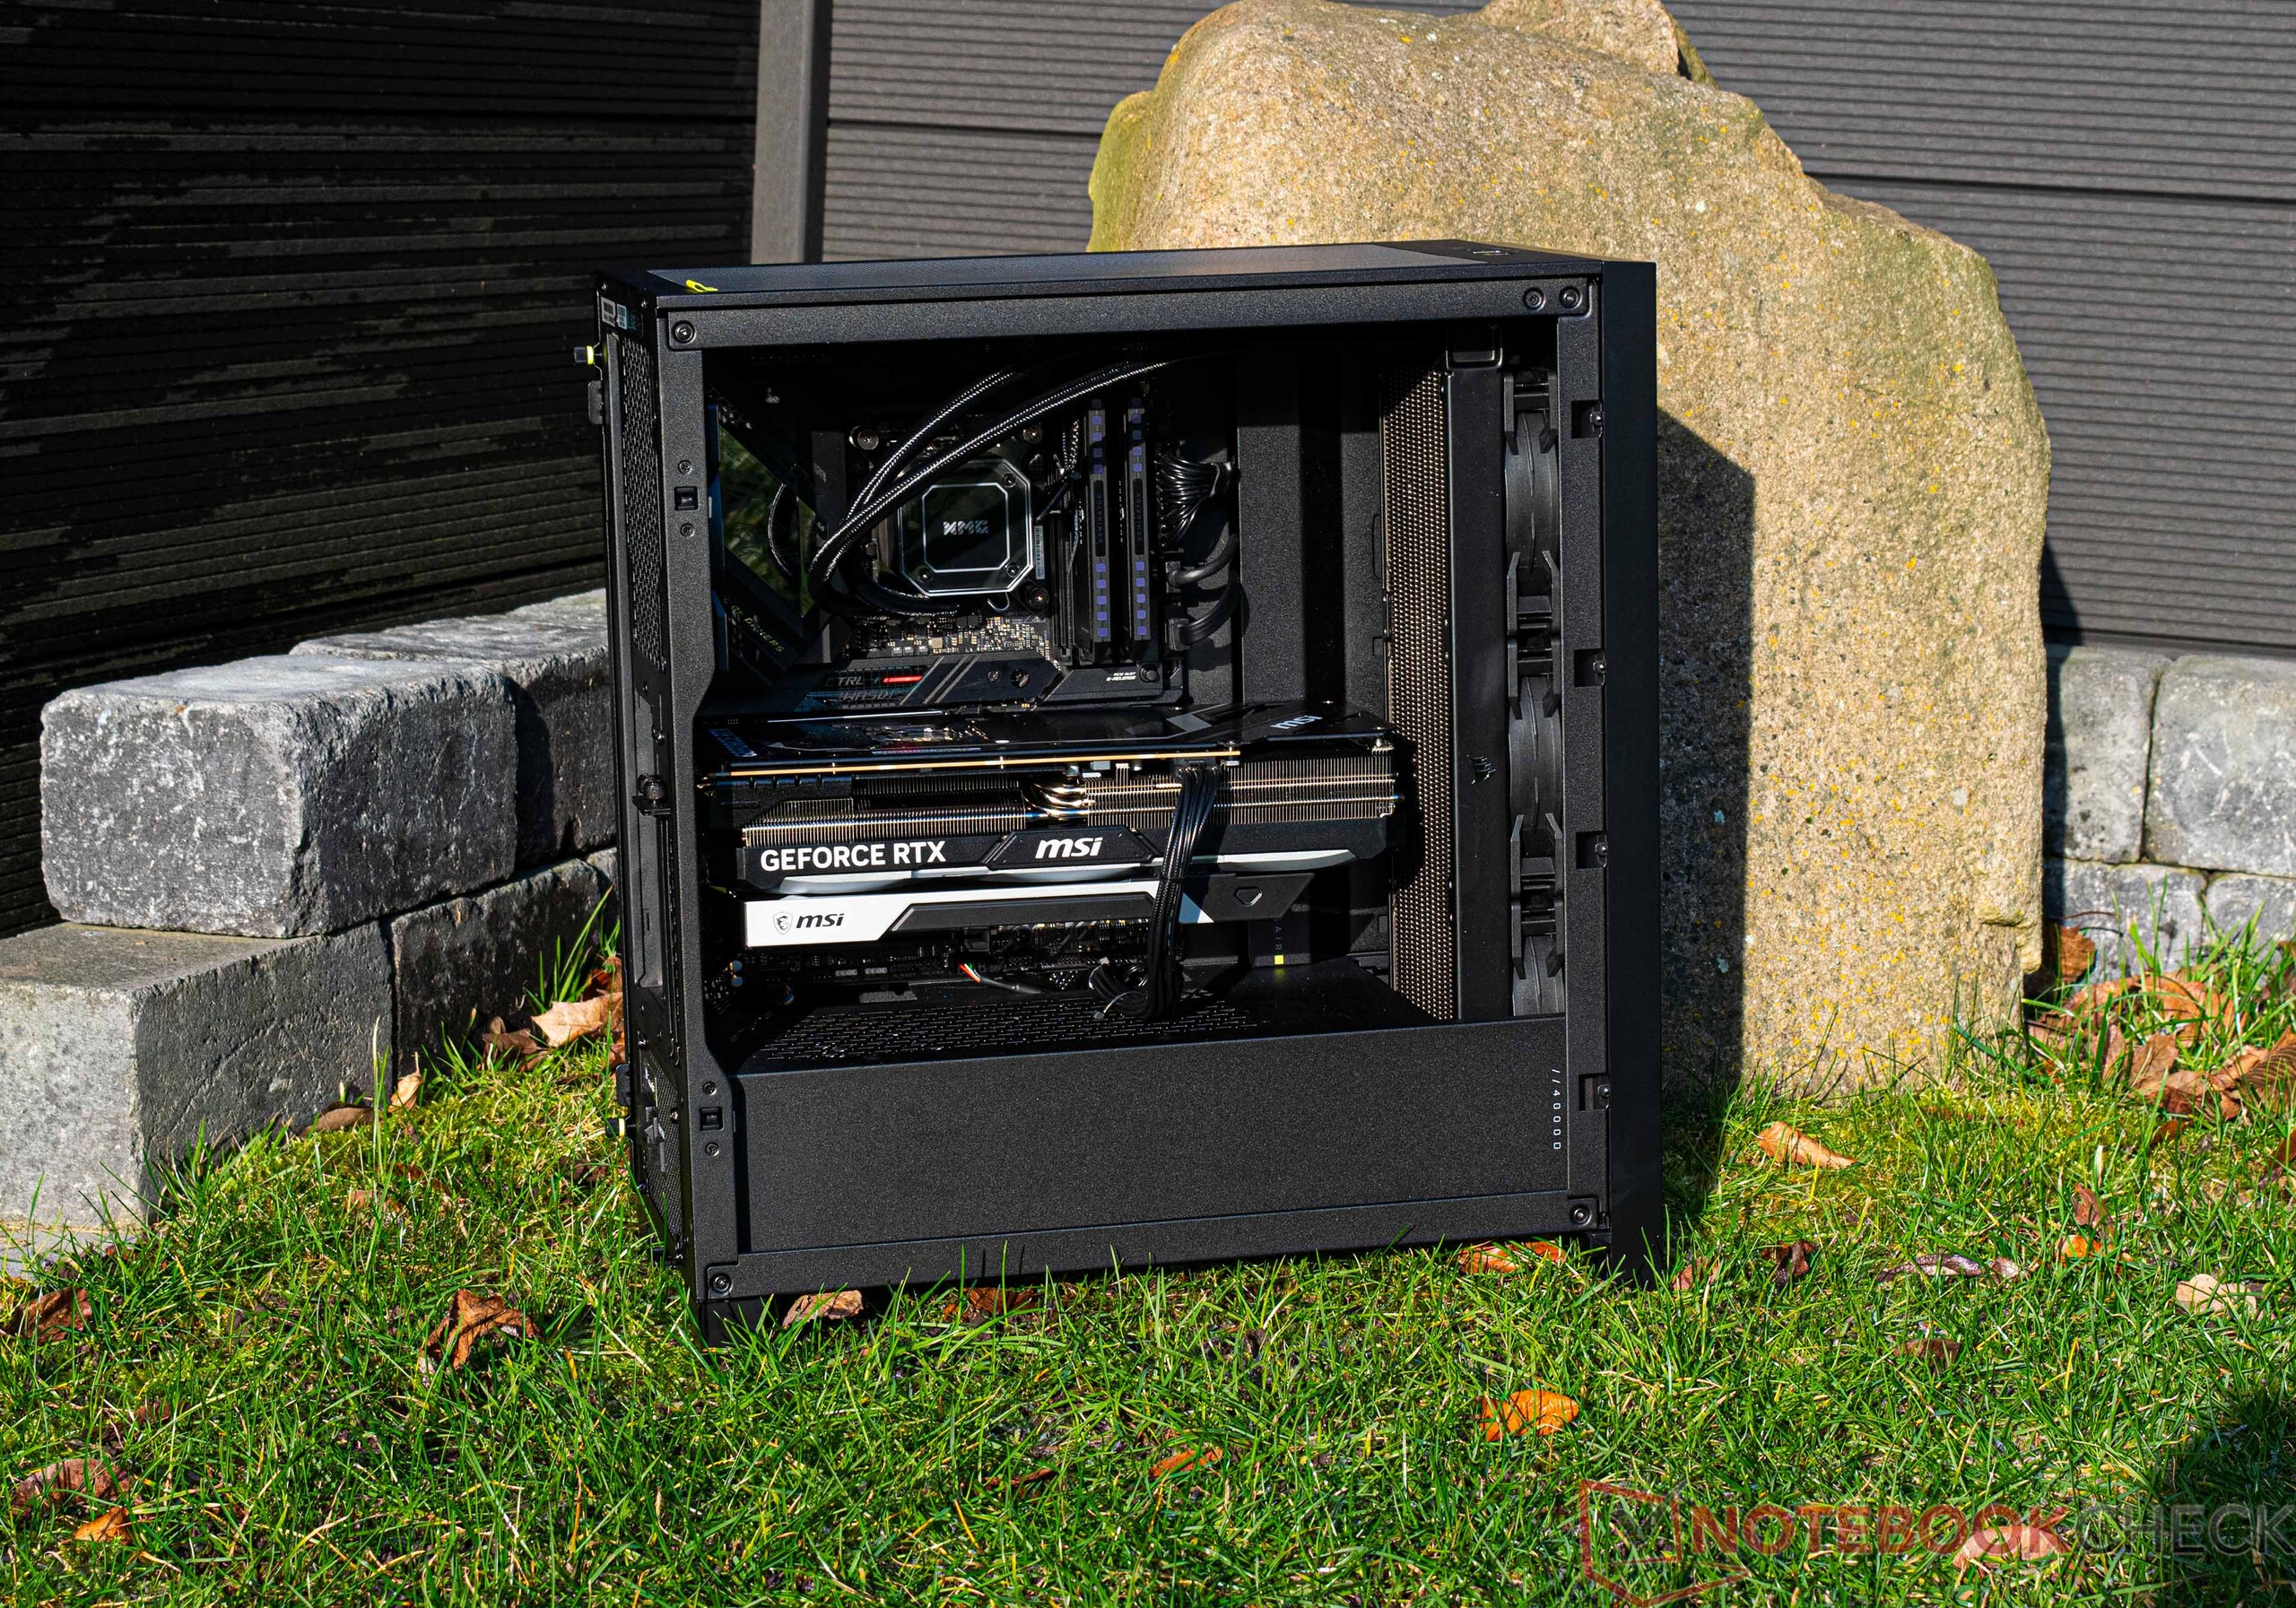
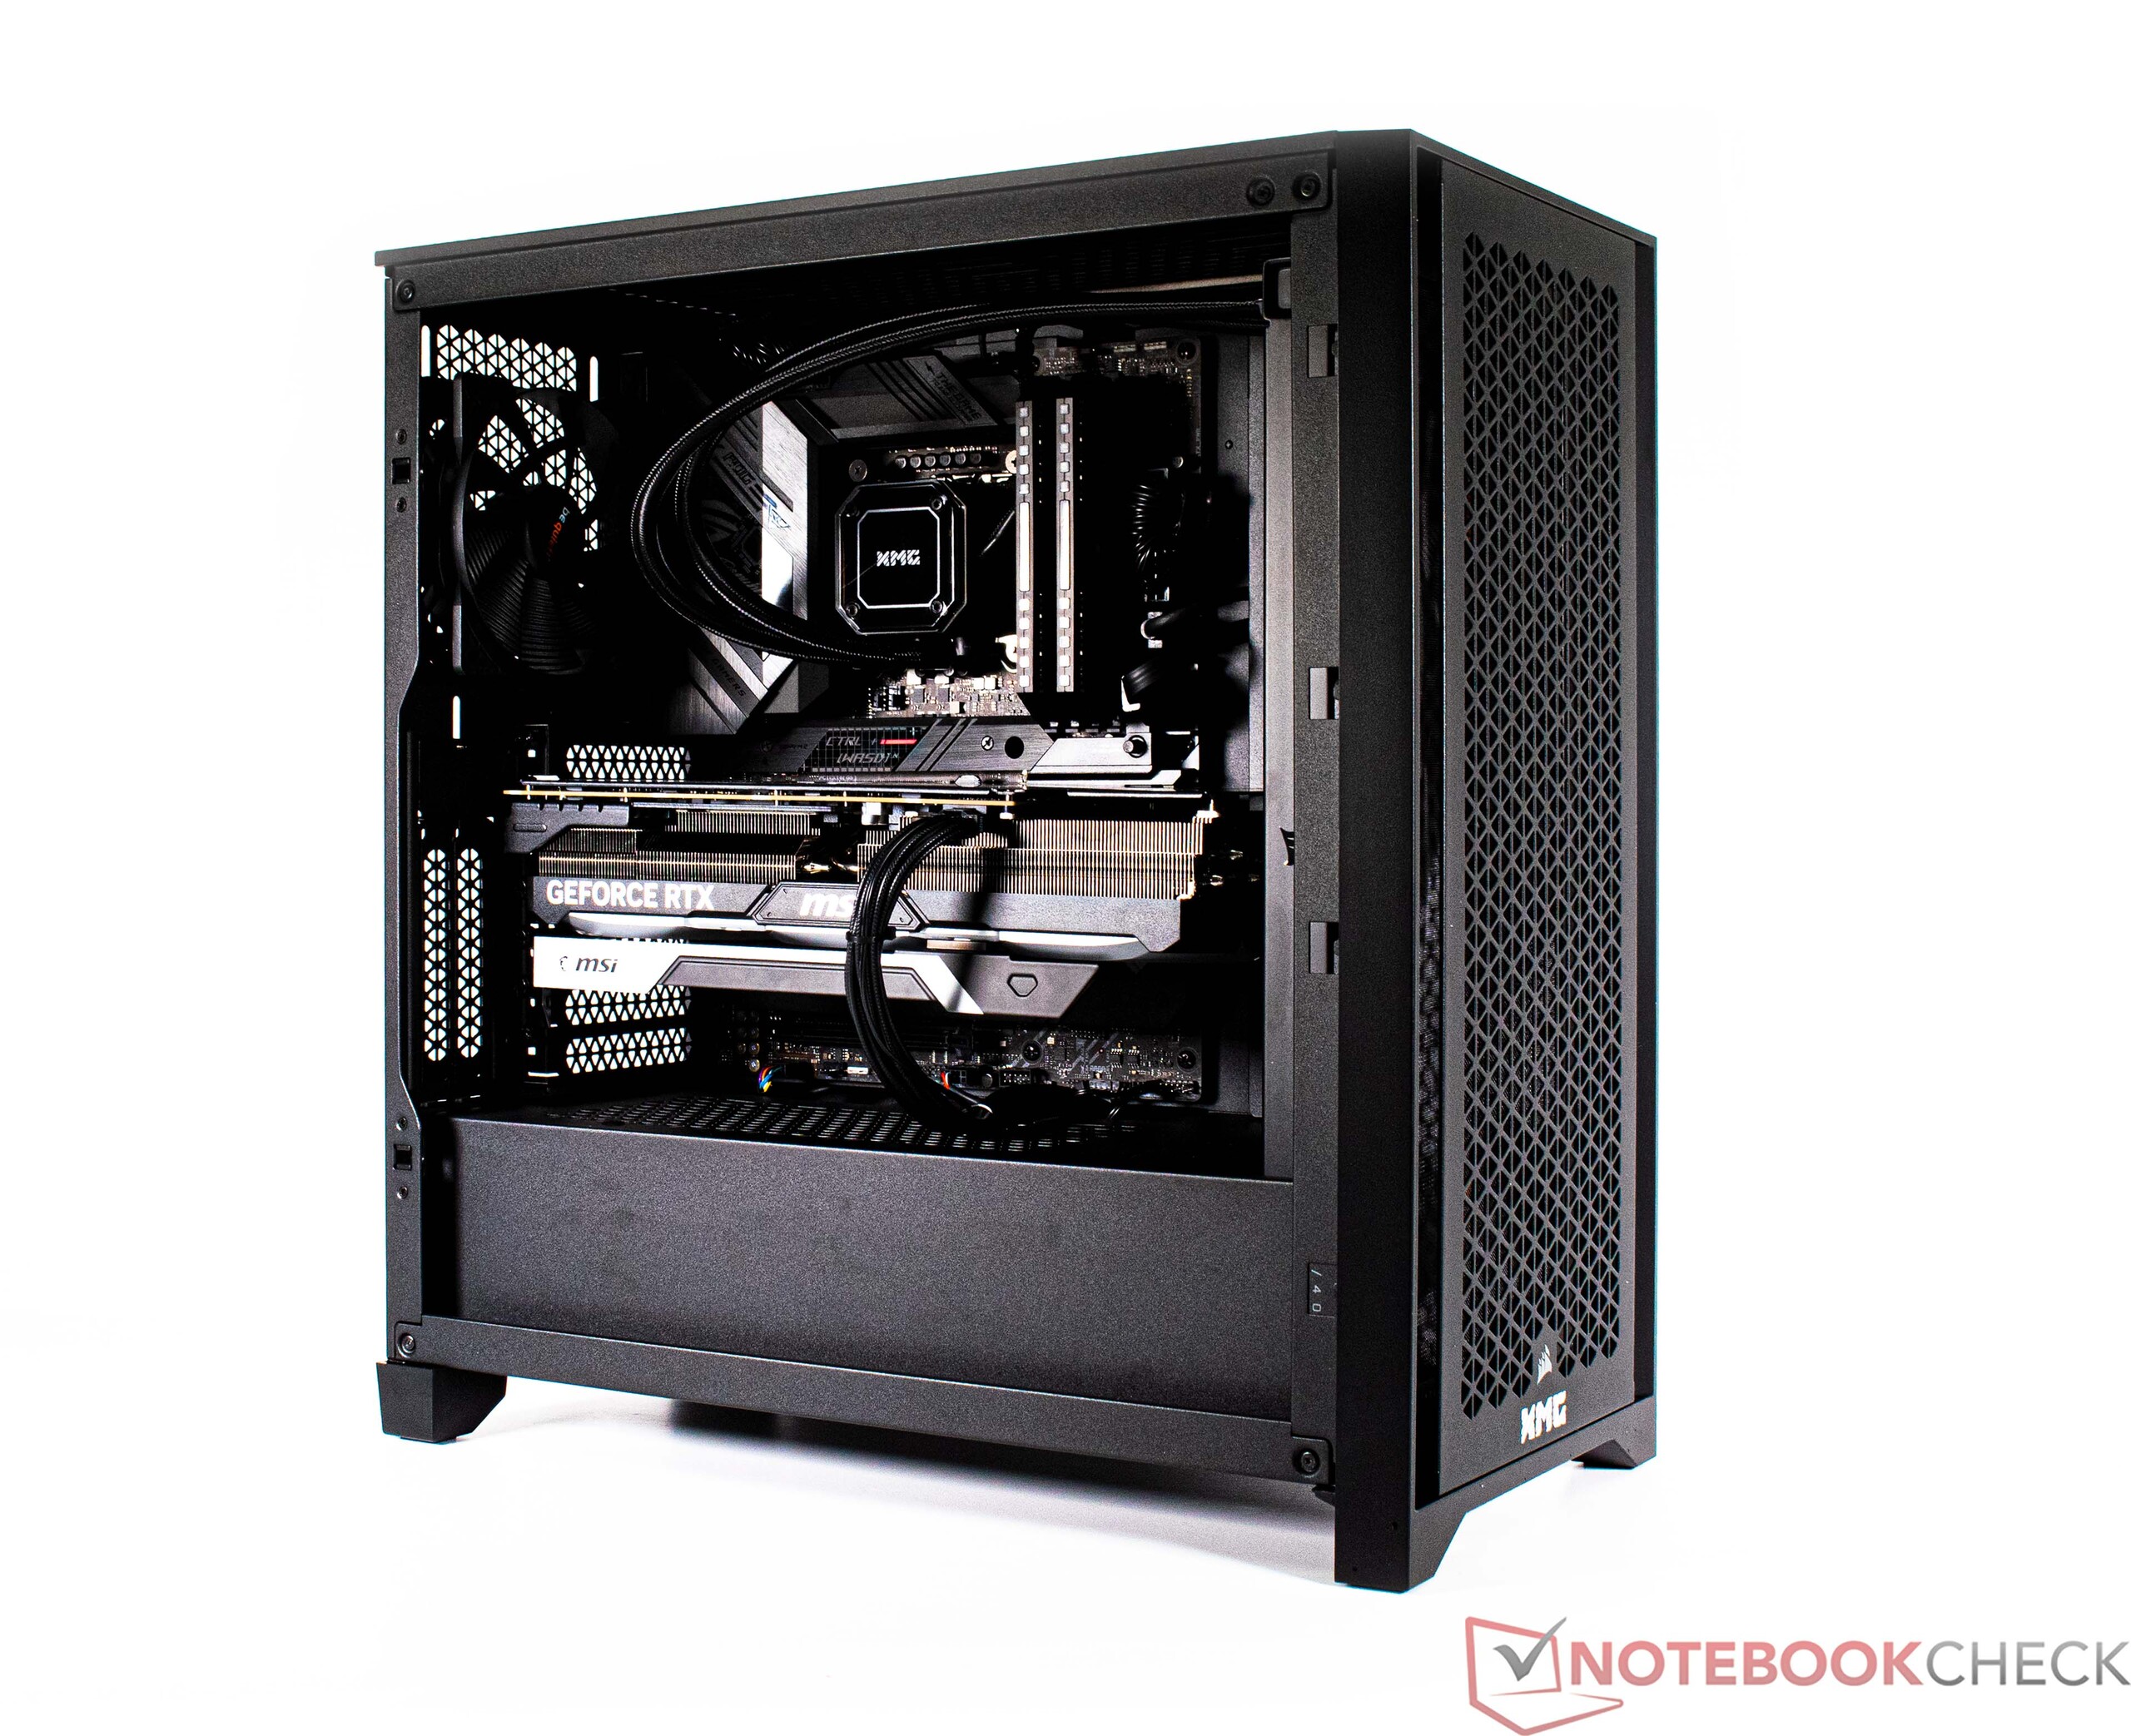
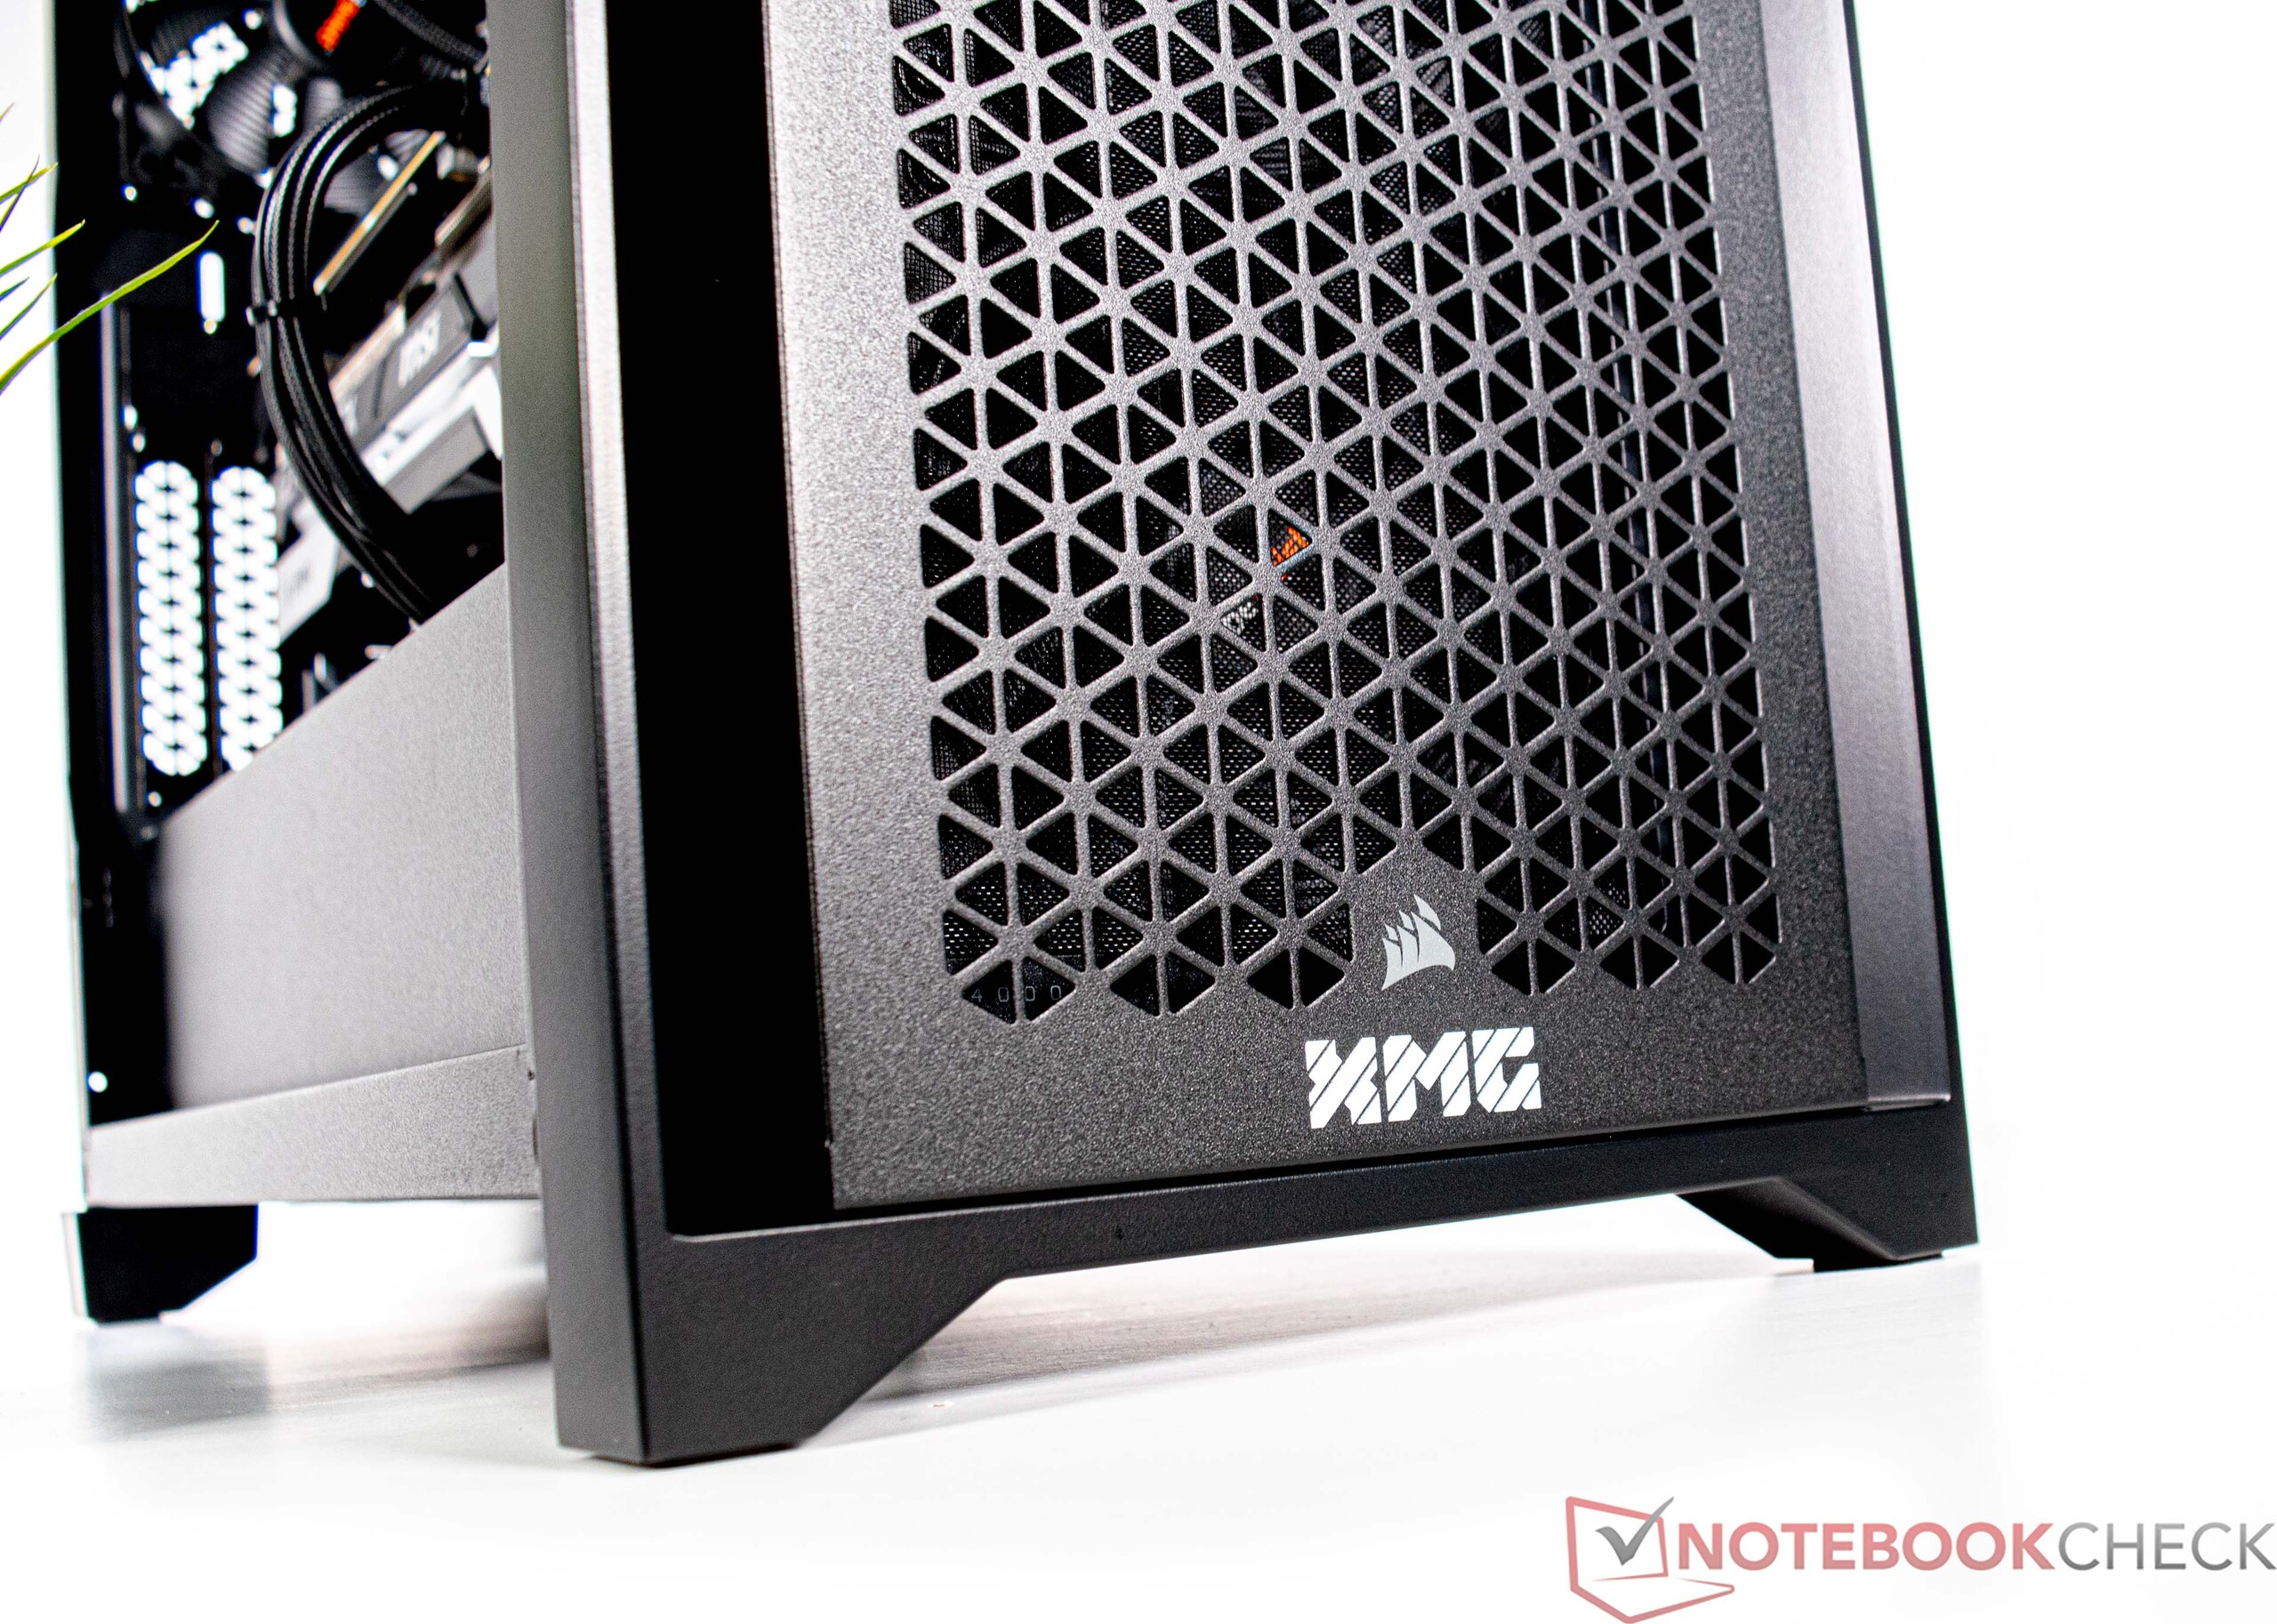
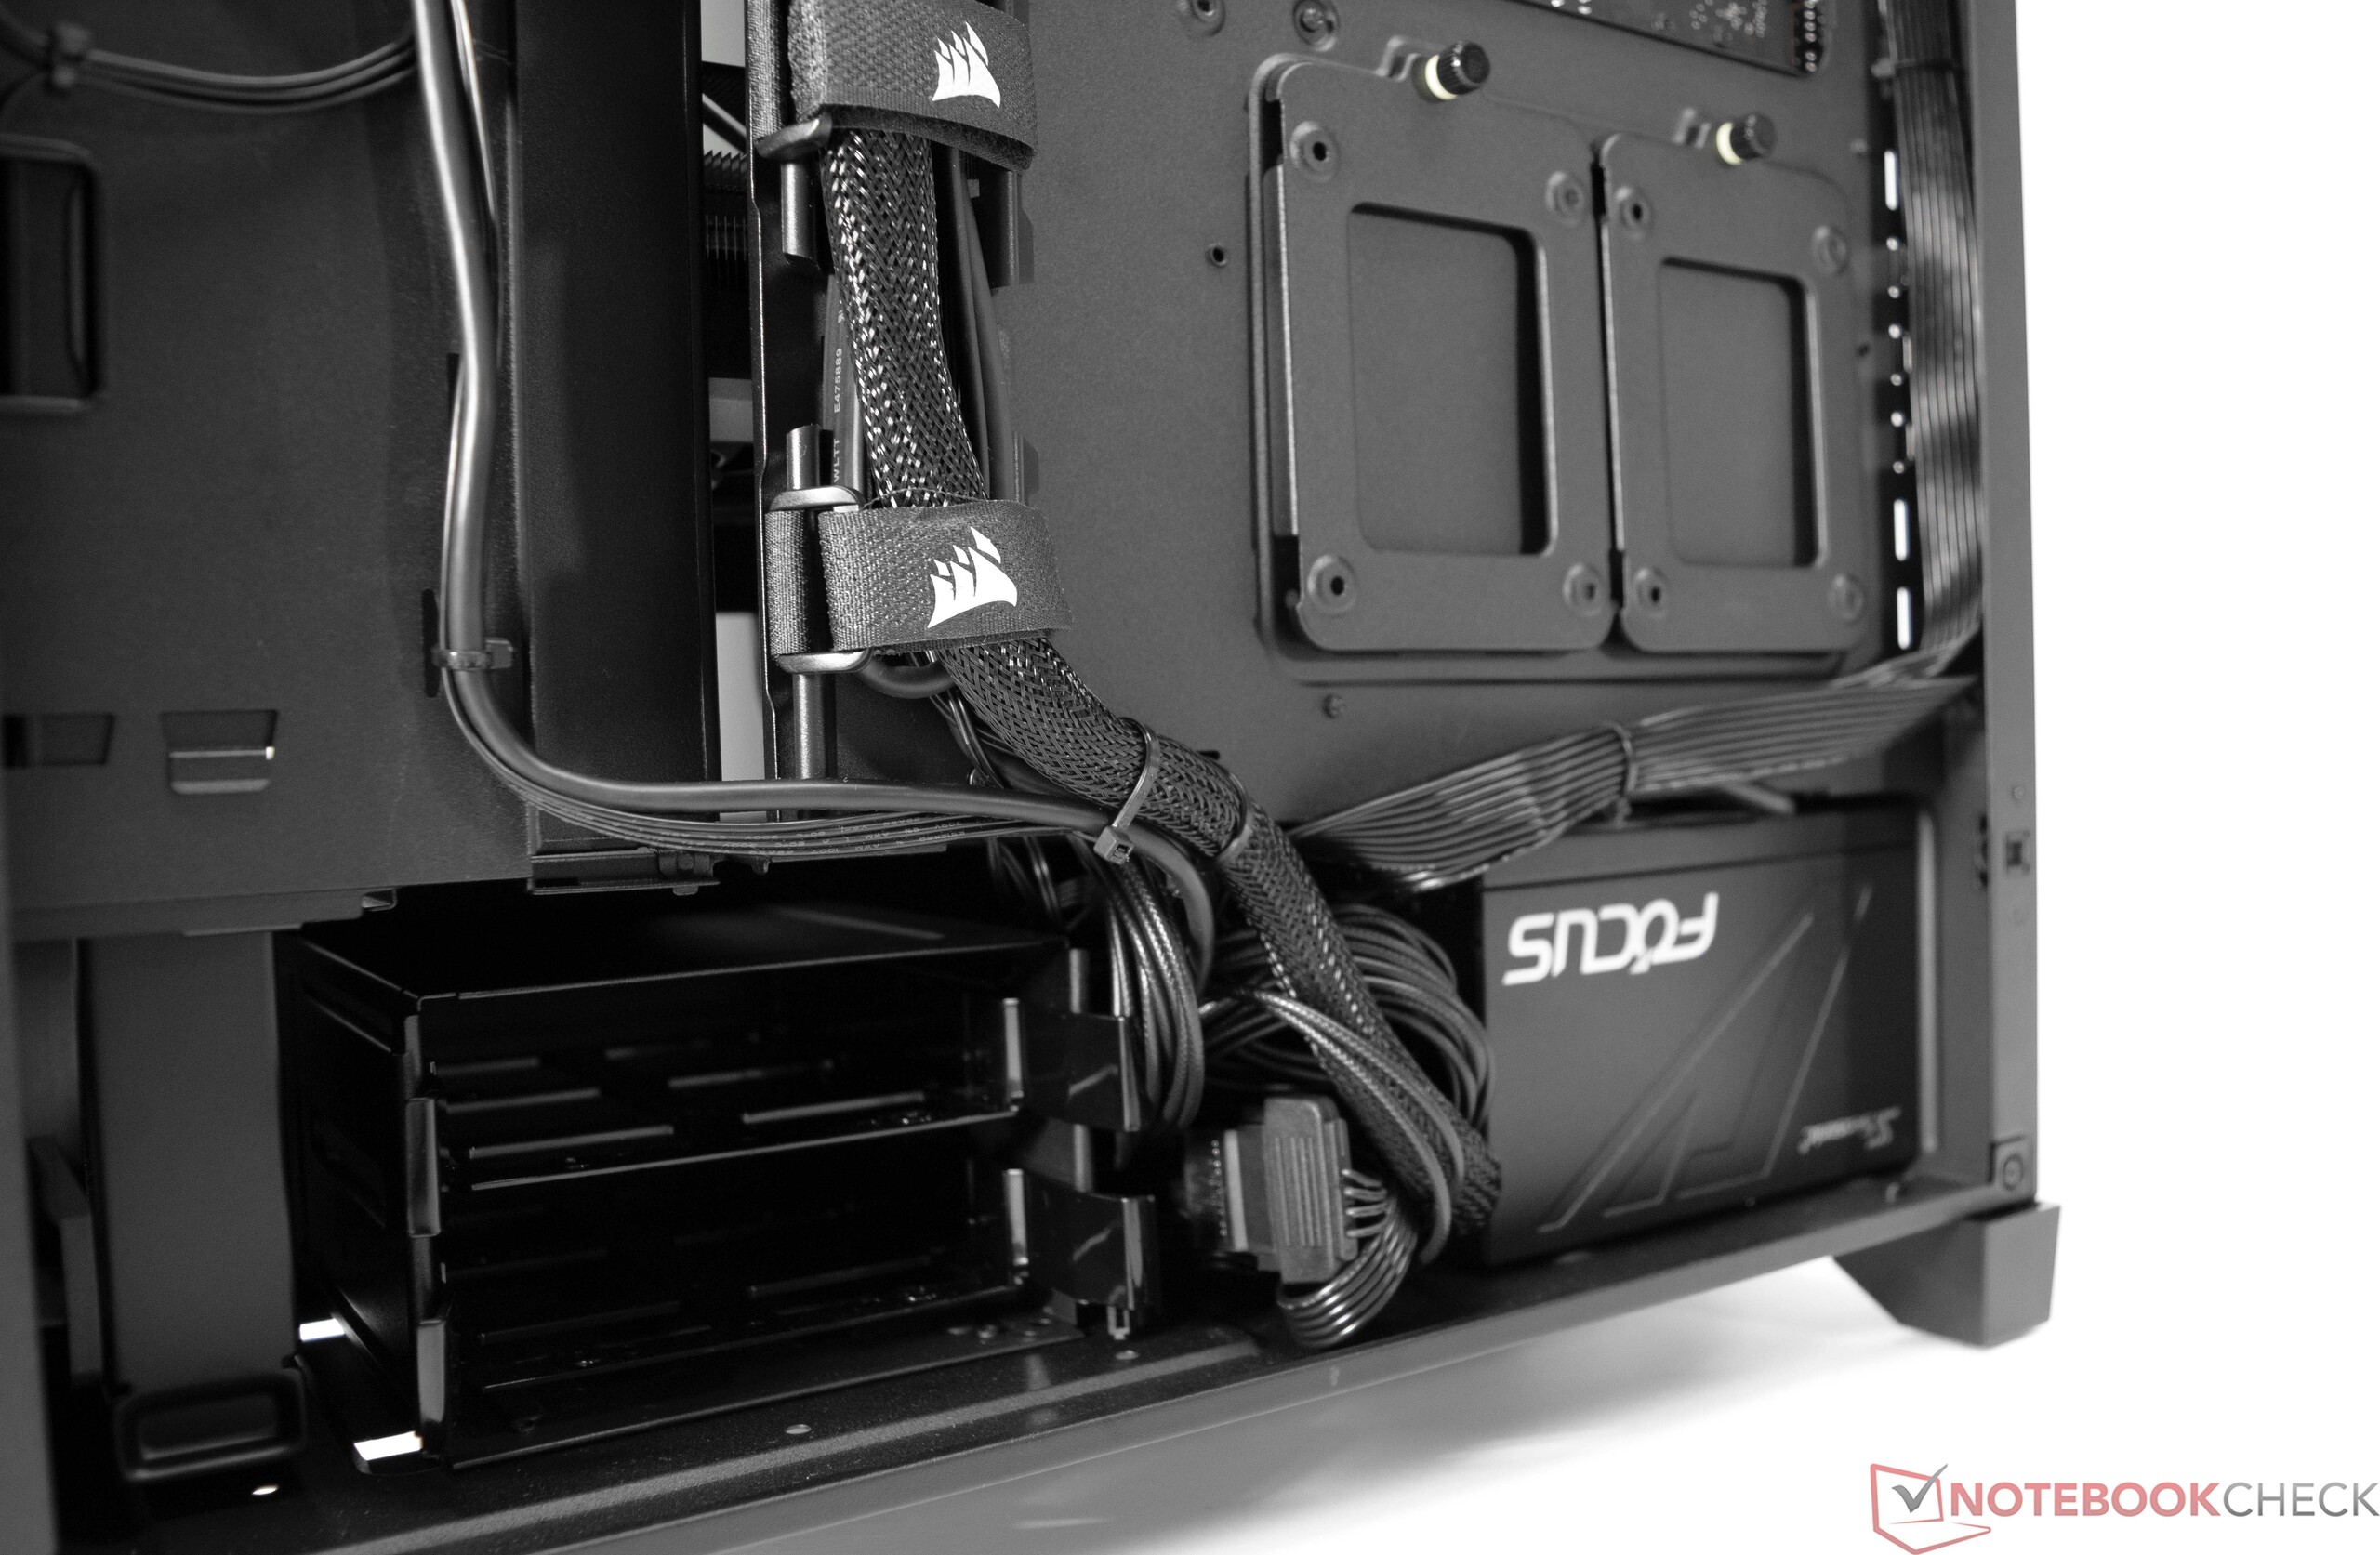
Estojo - Corsair 4000D Airflow

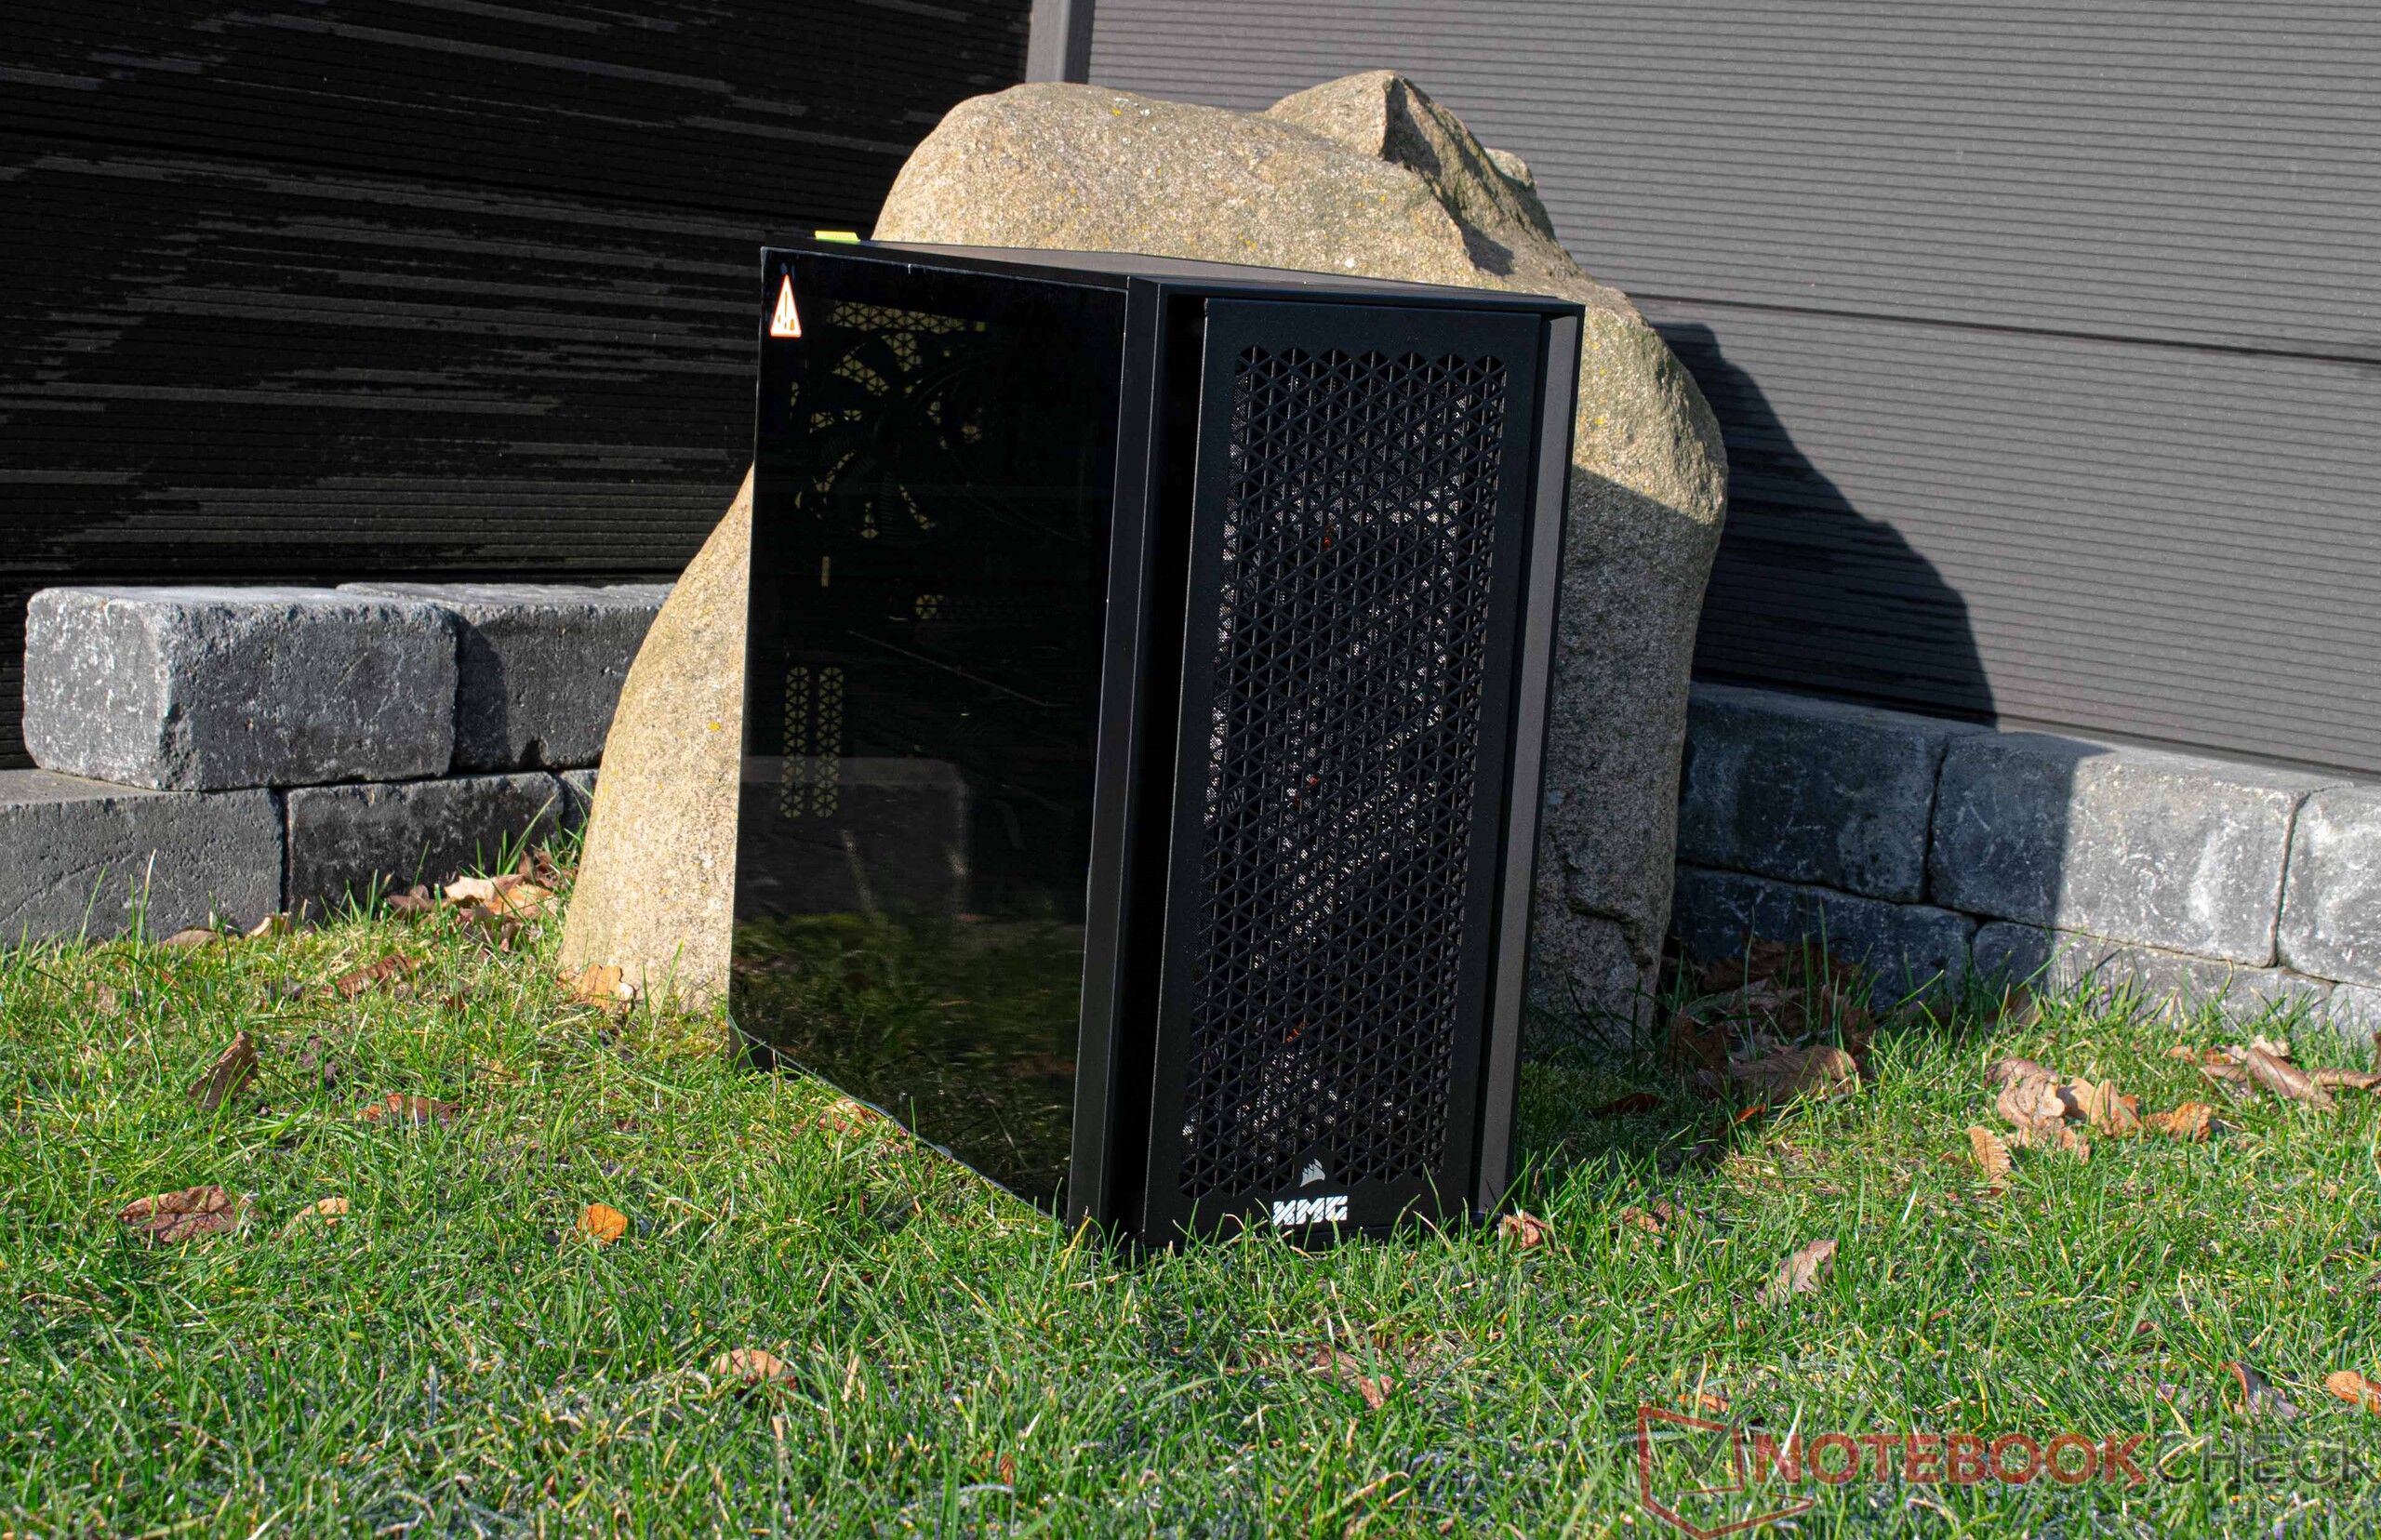
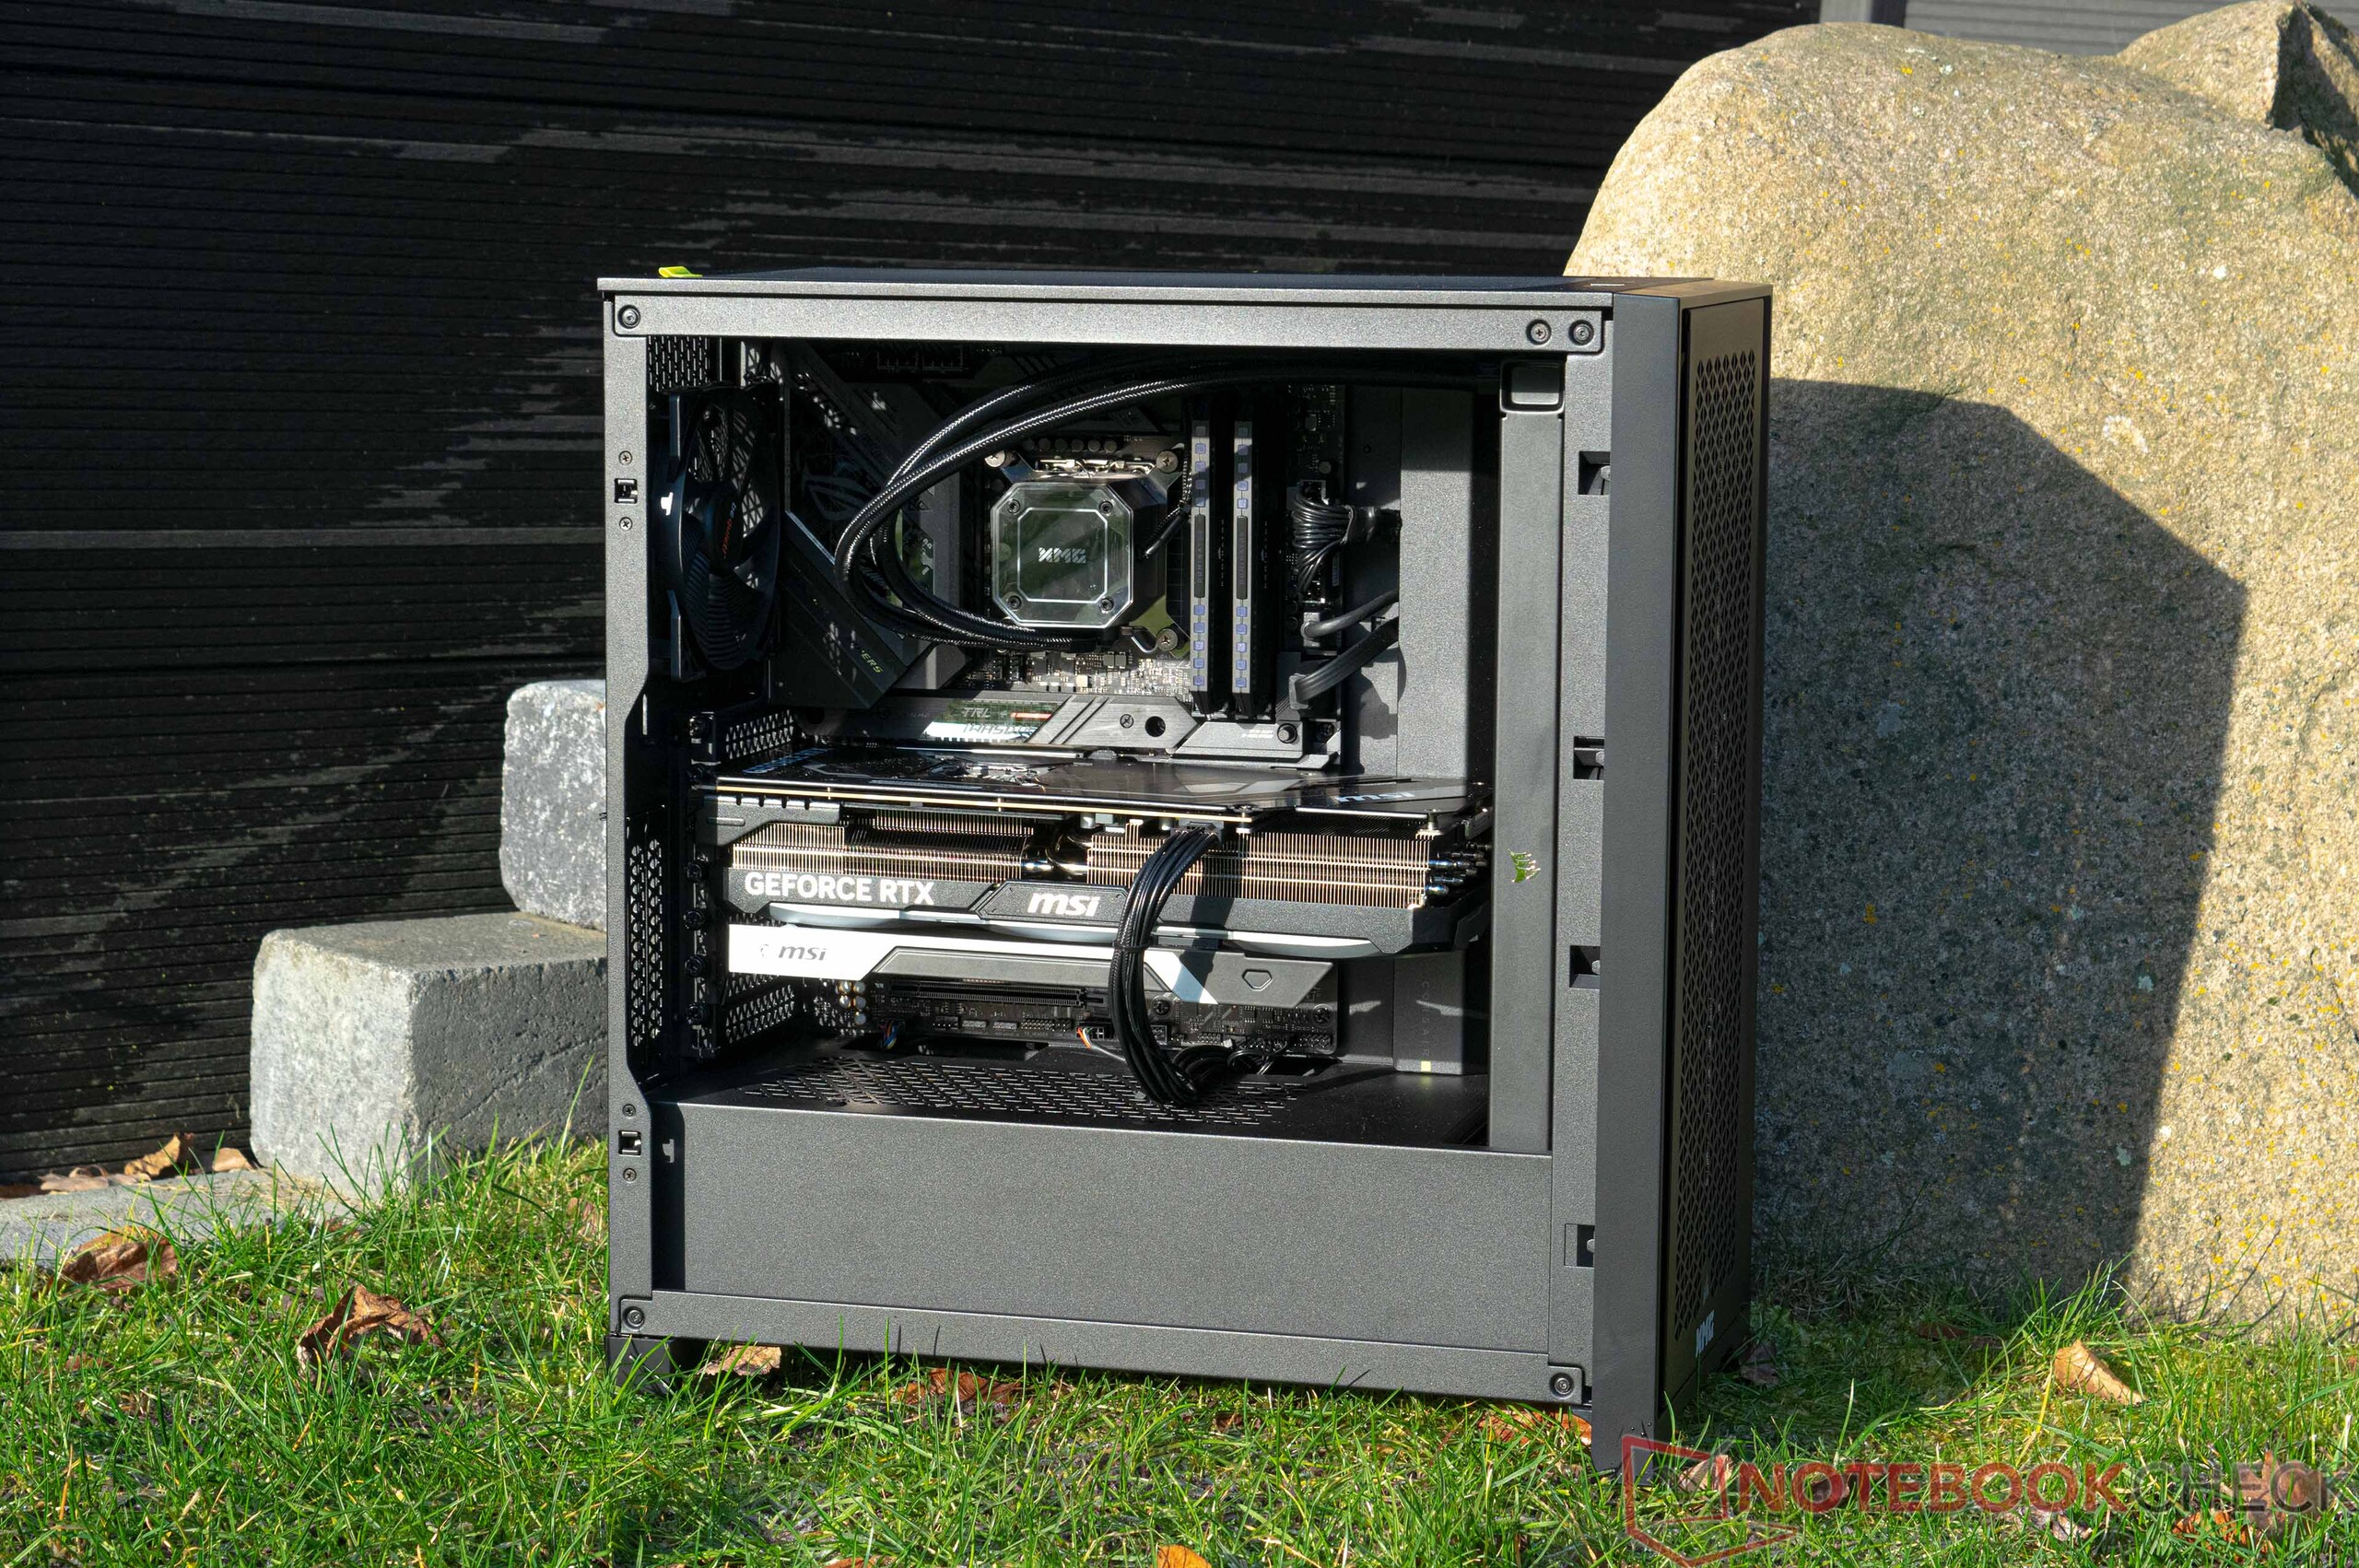
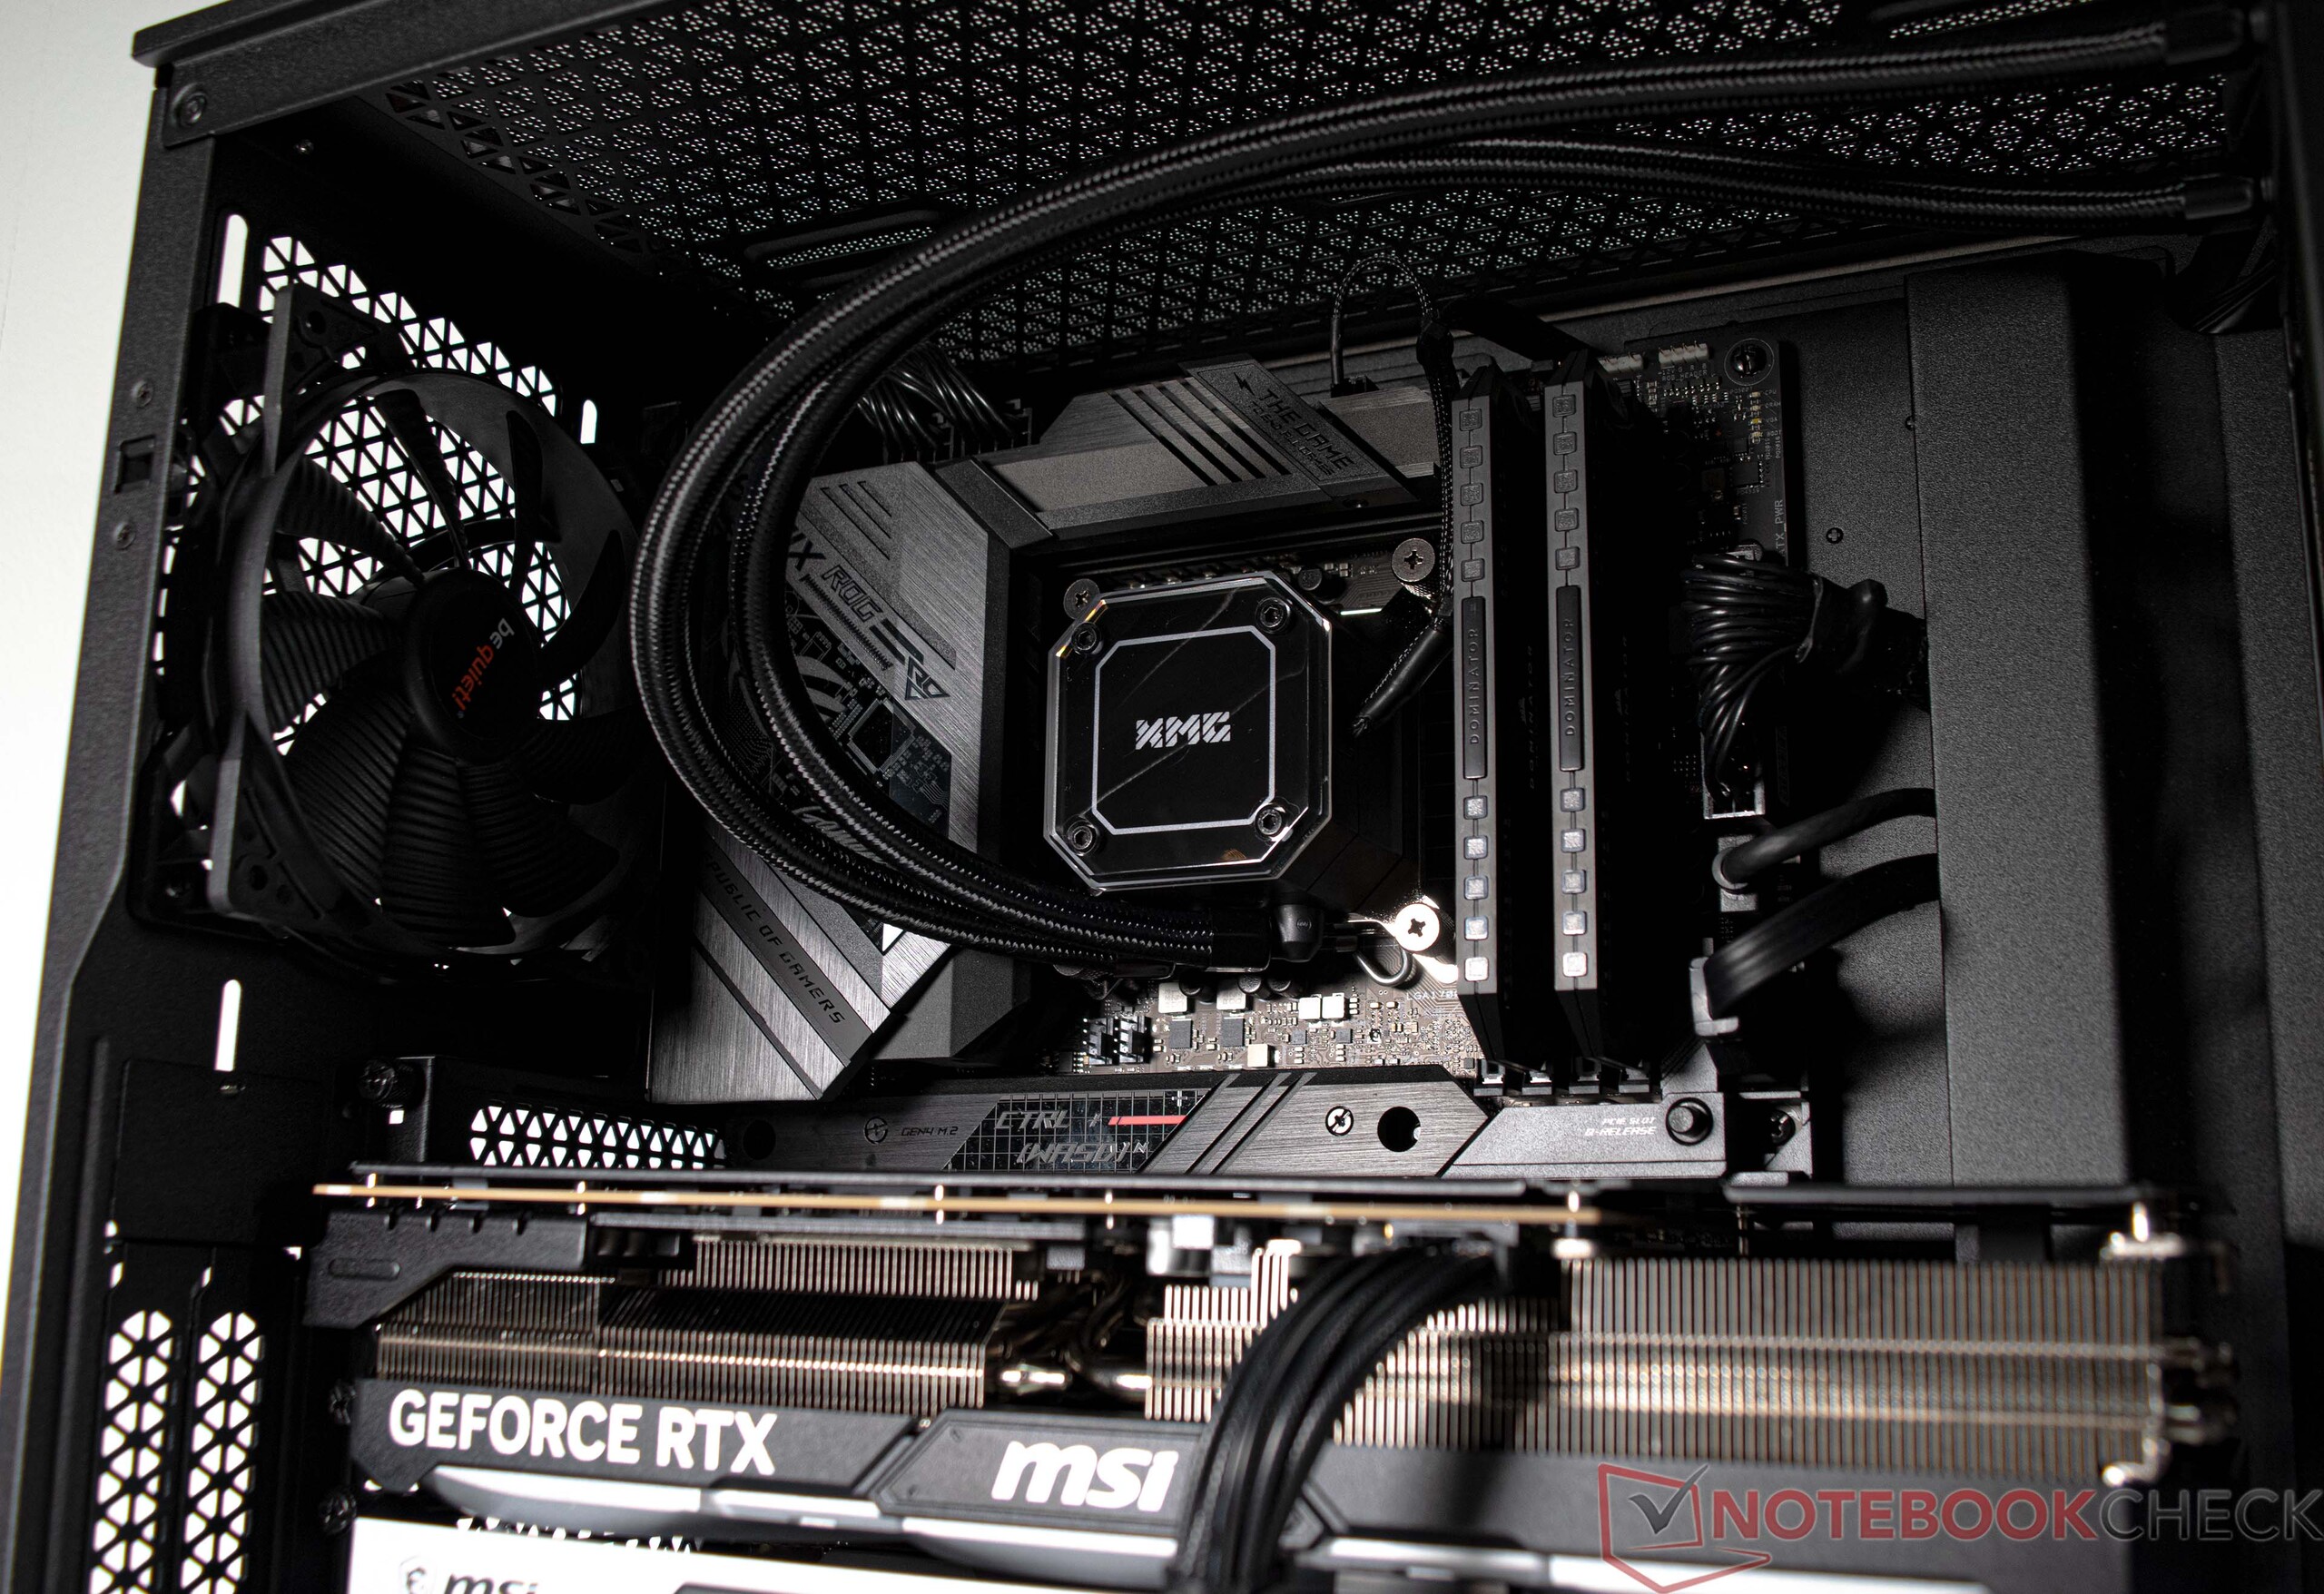
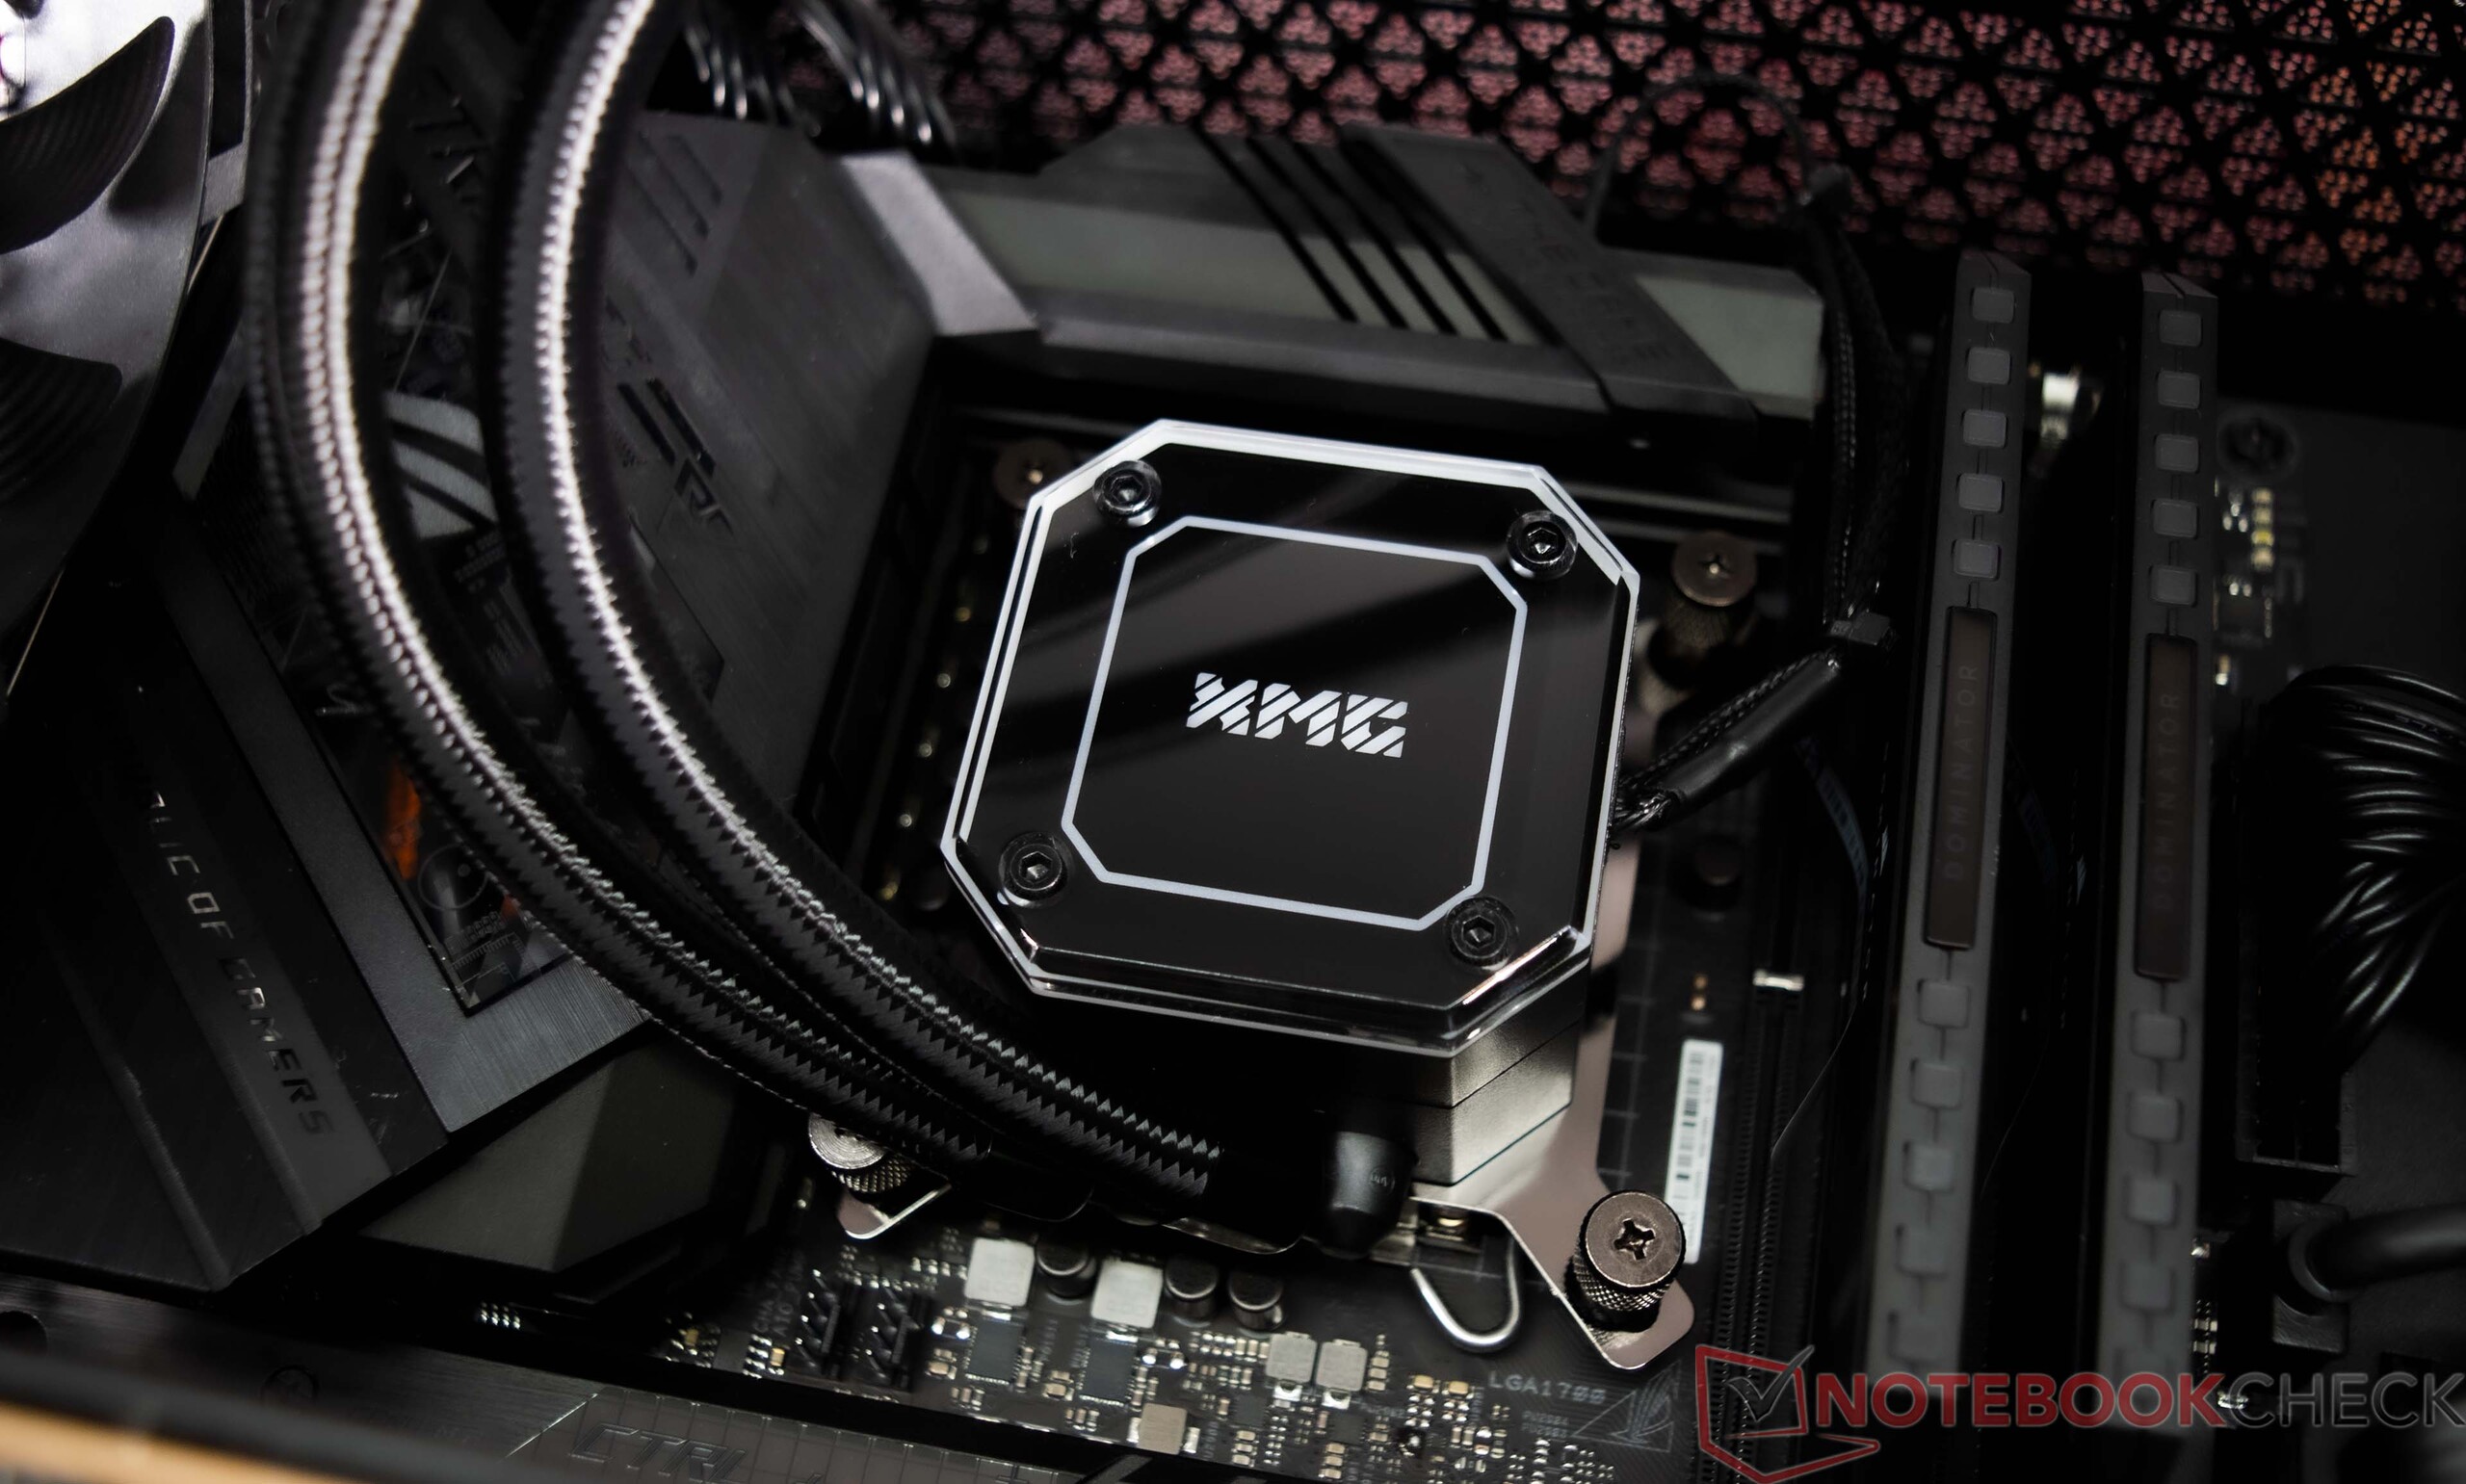
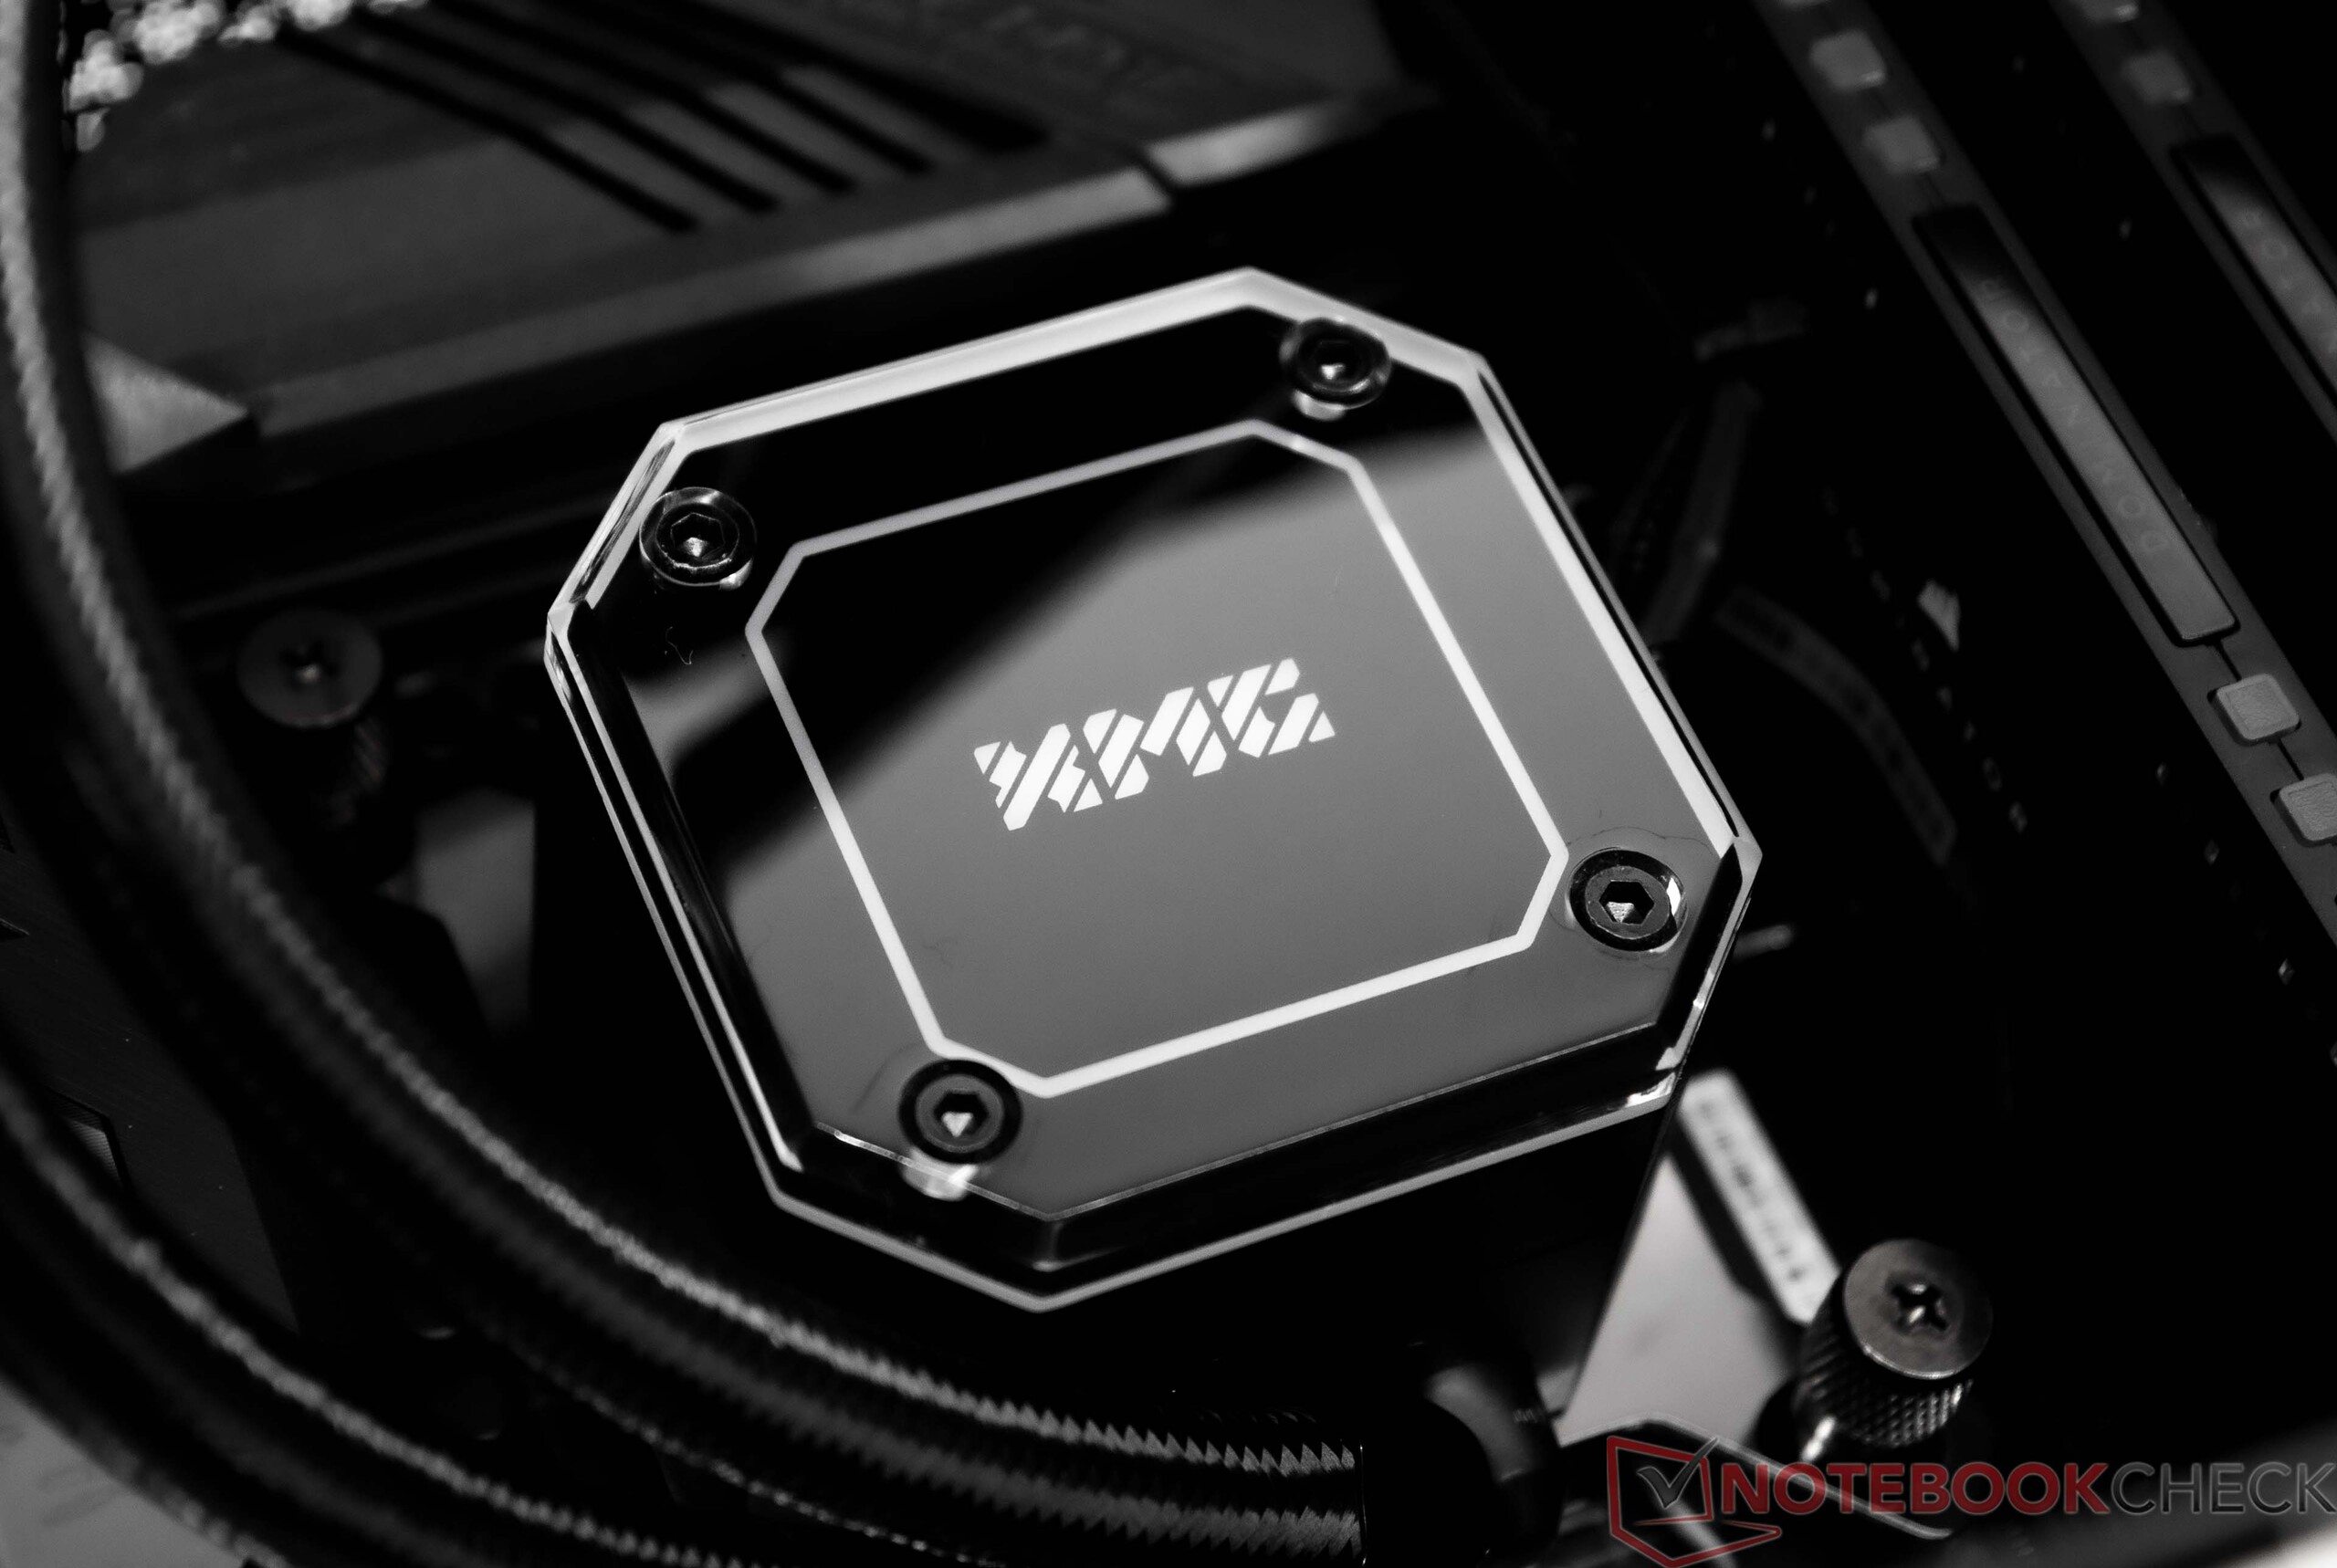
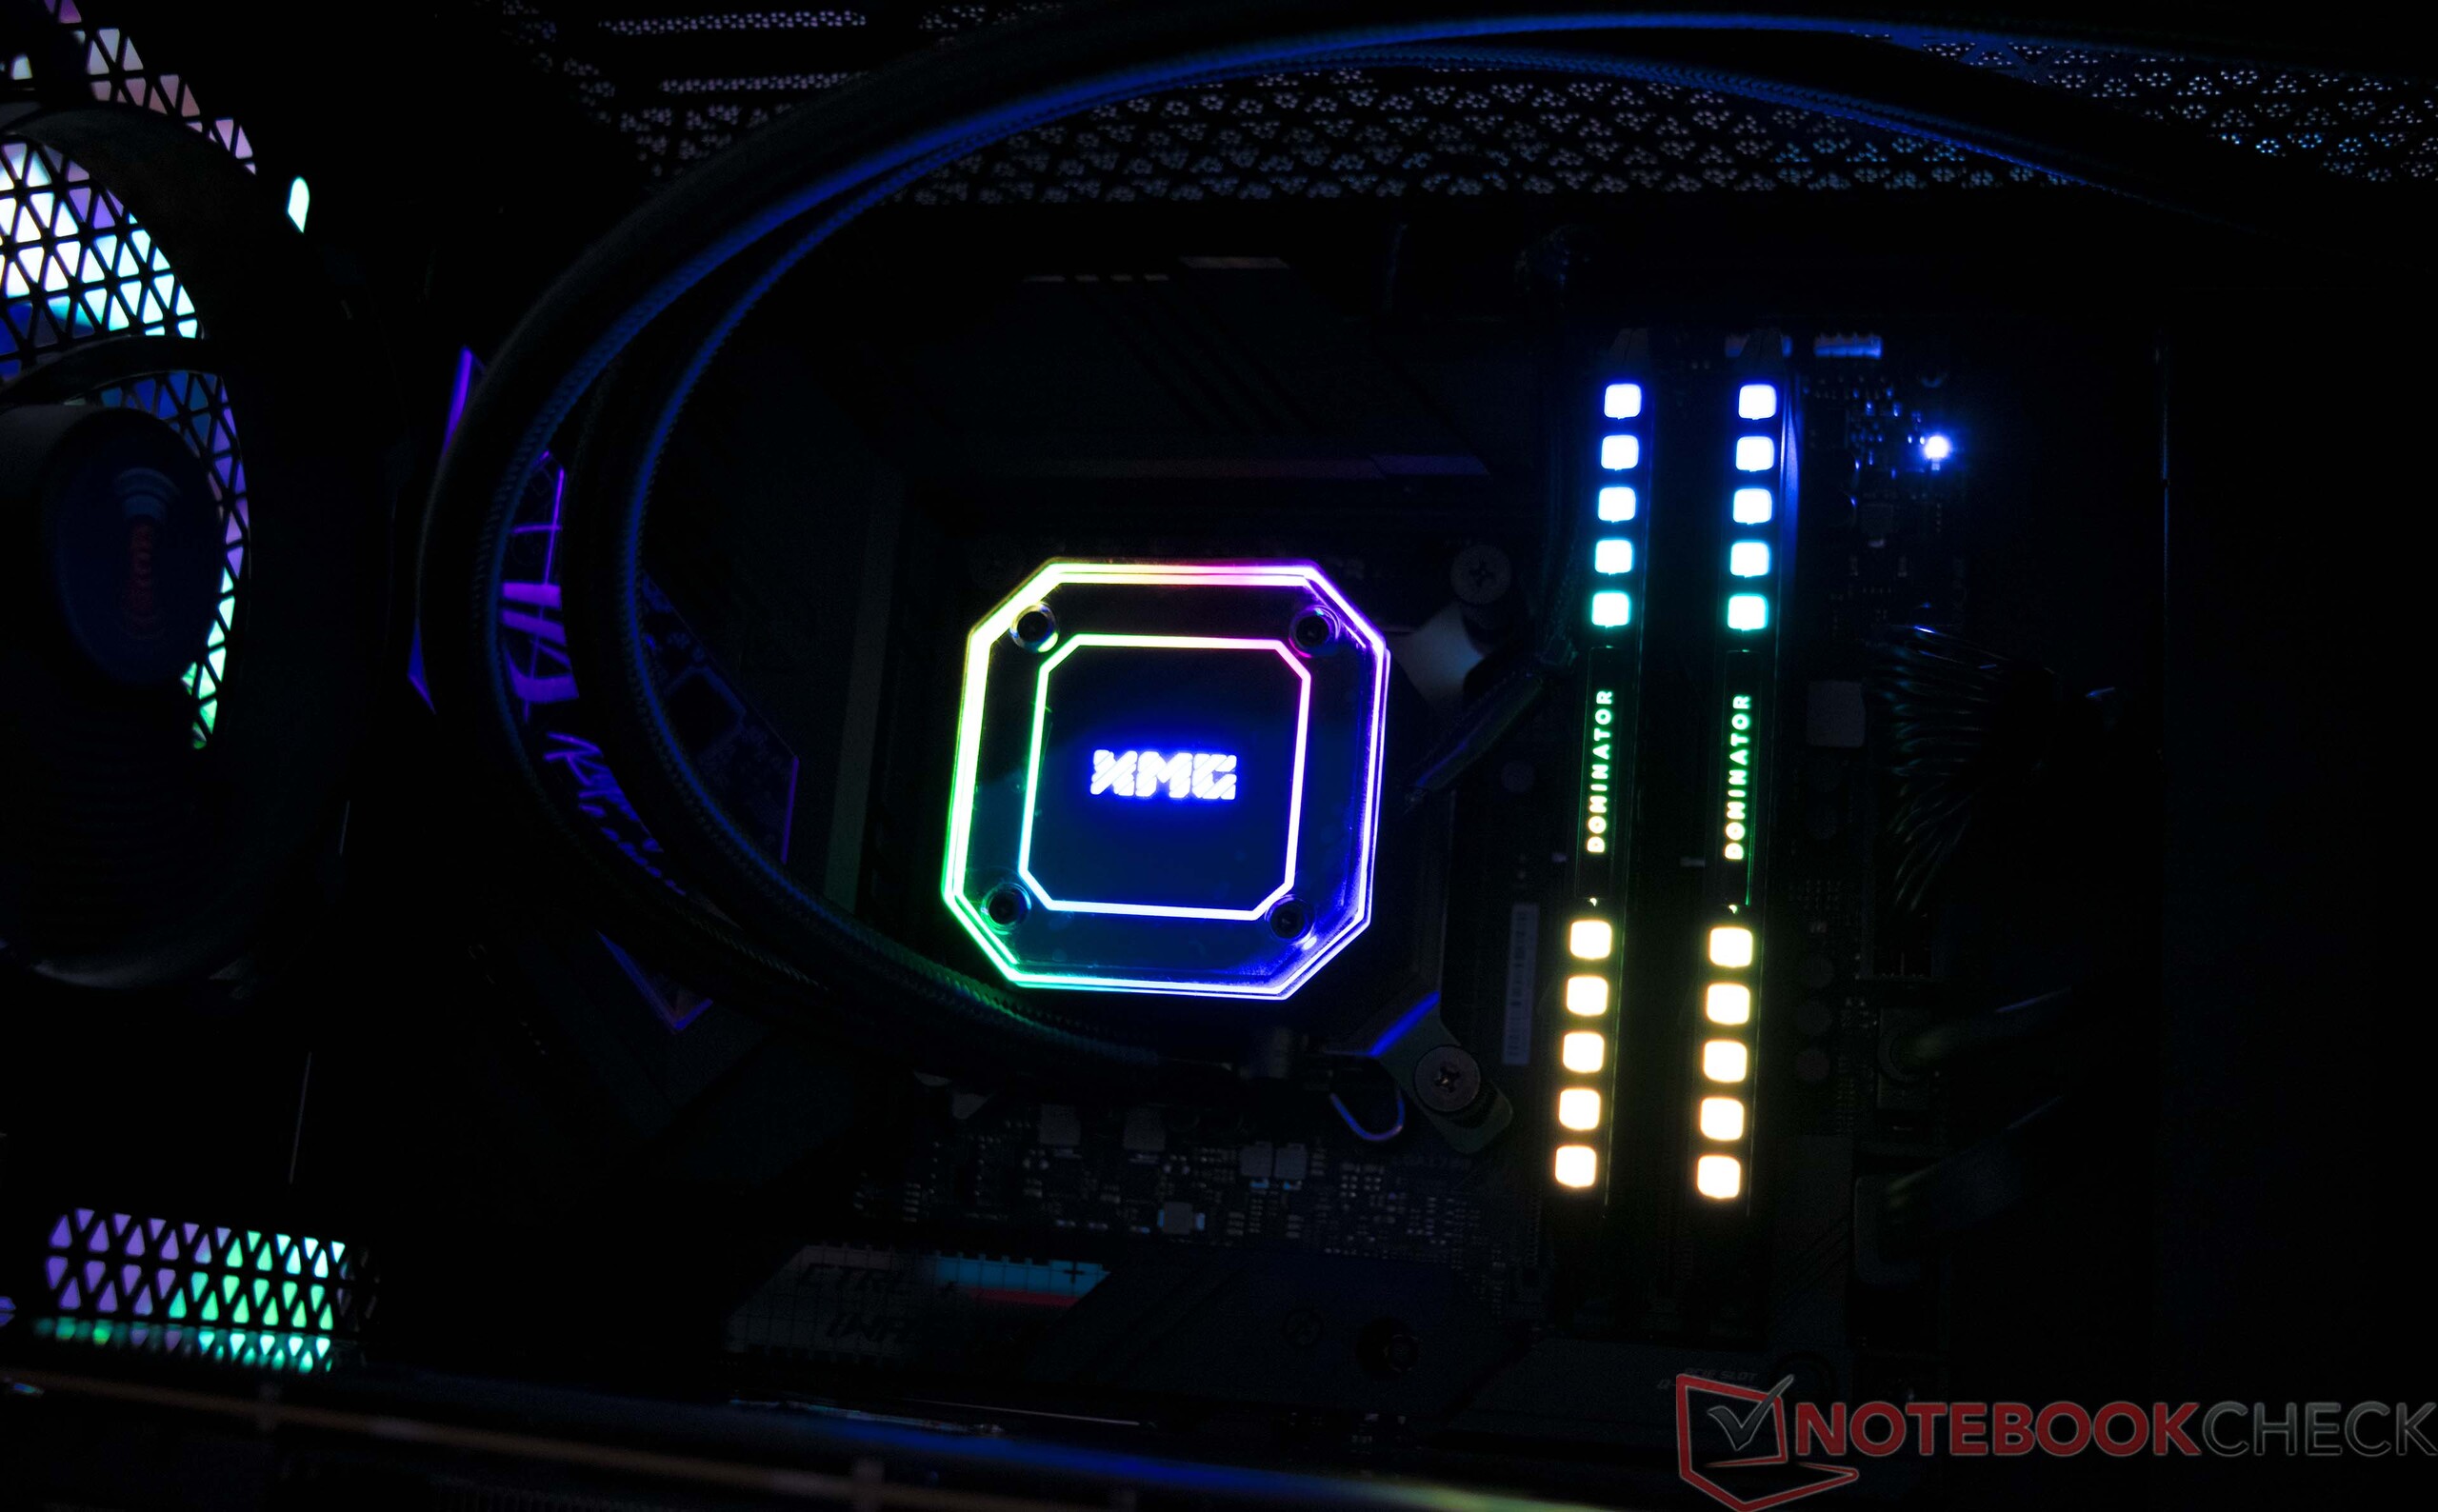
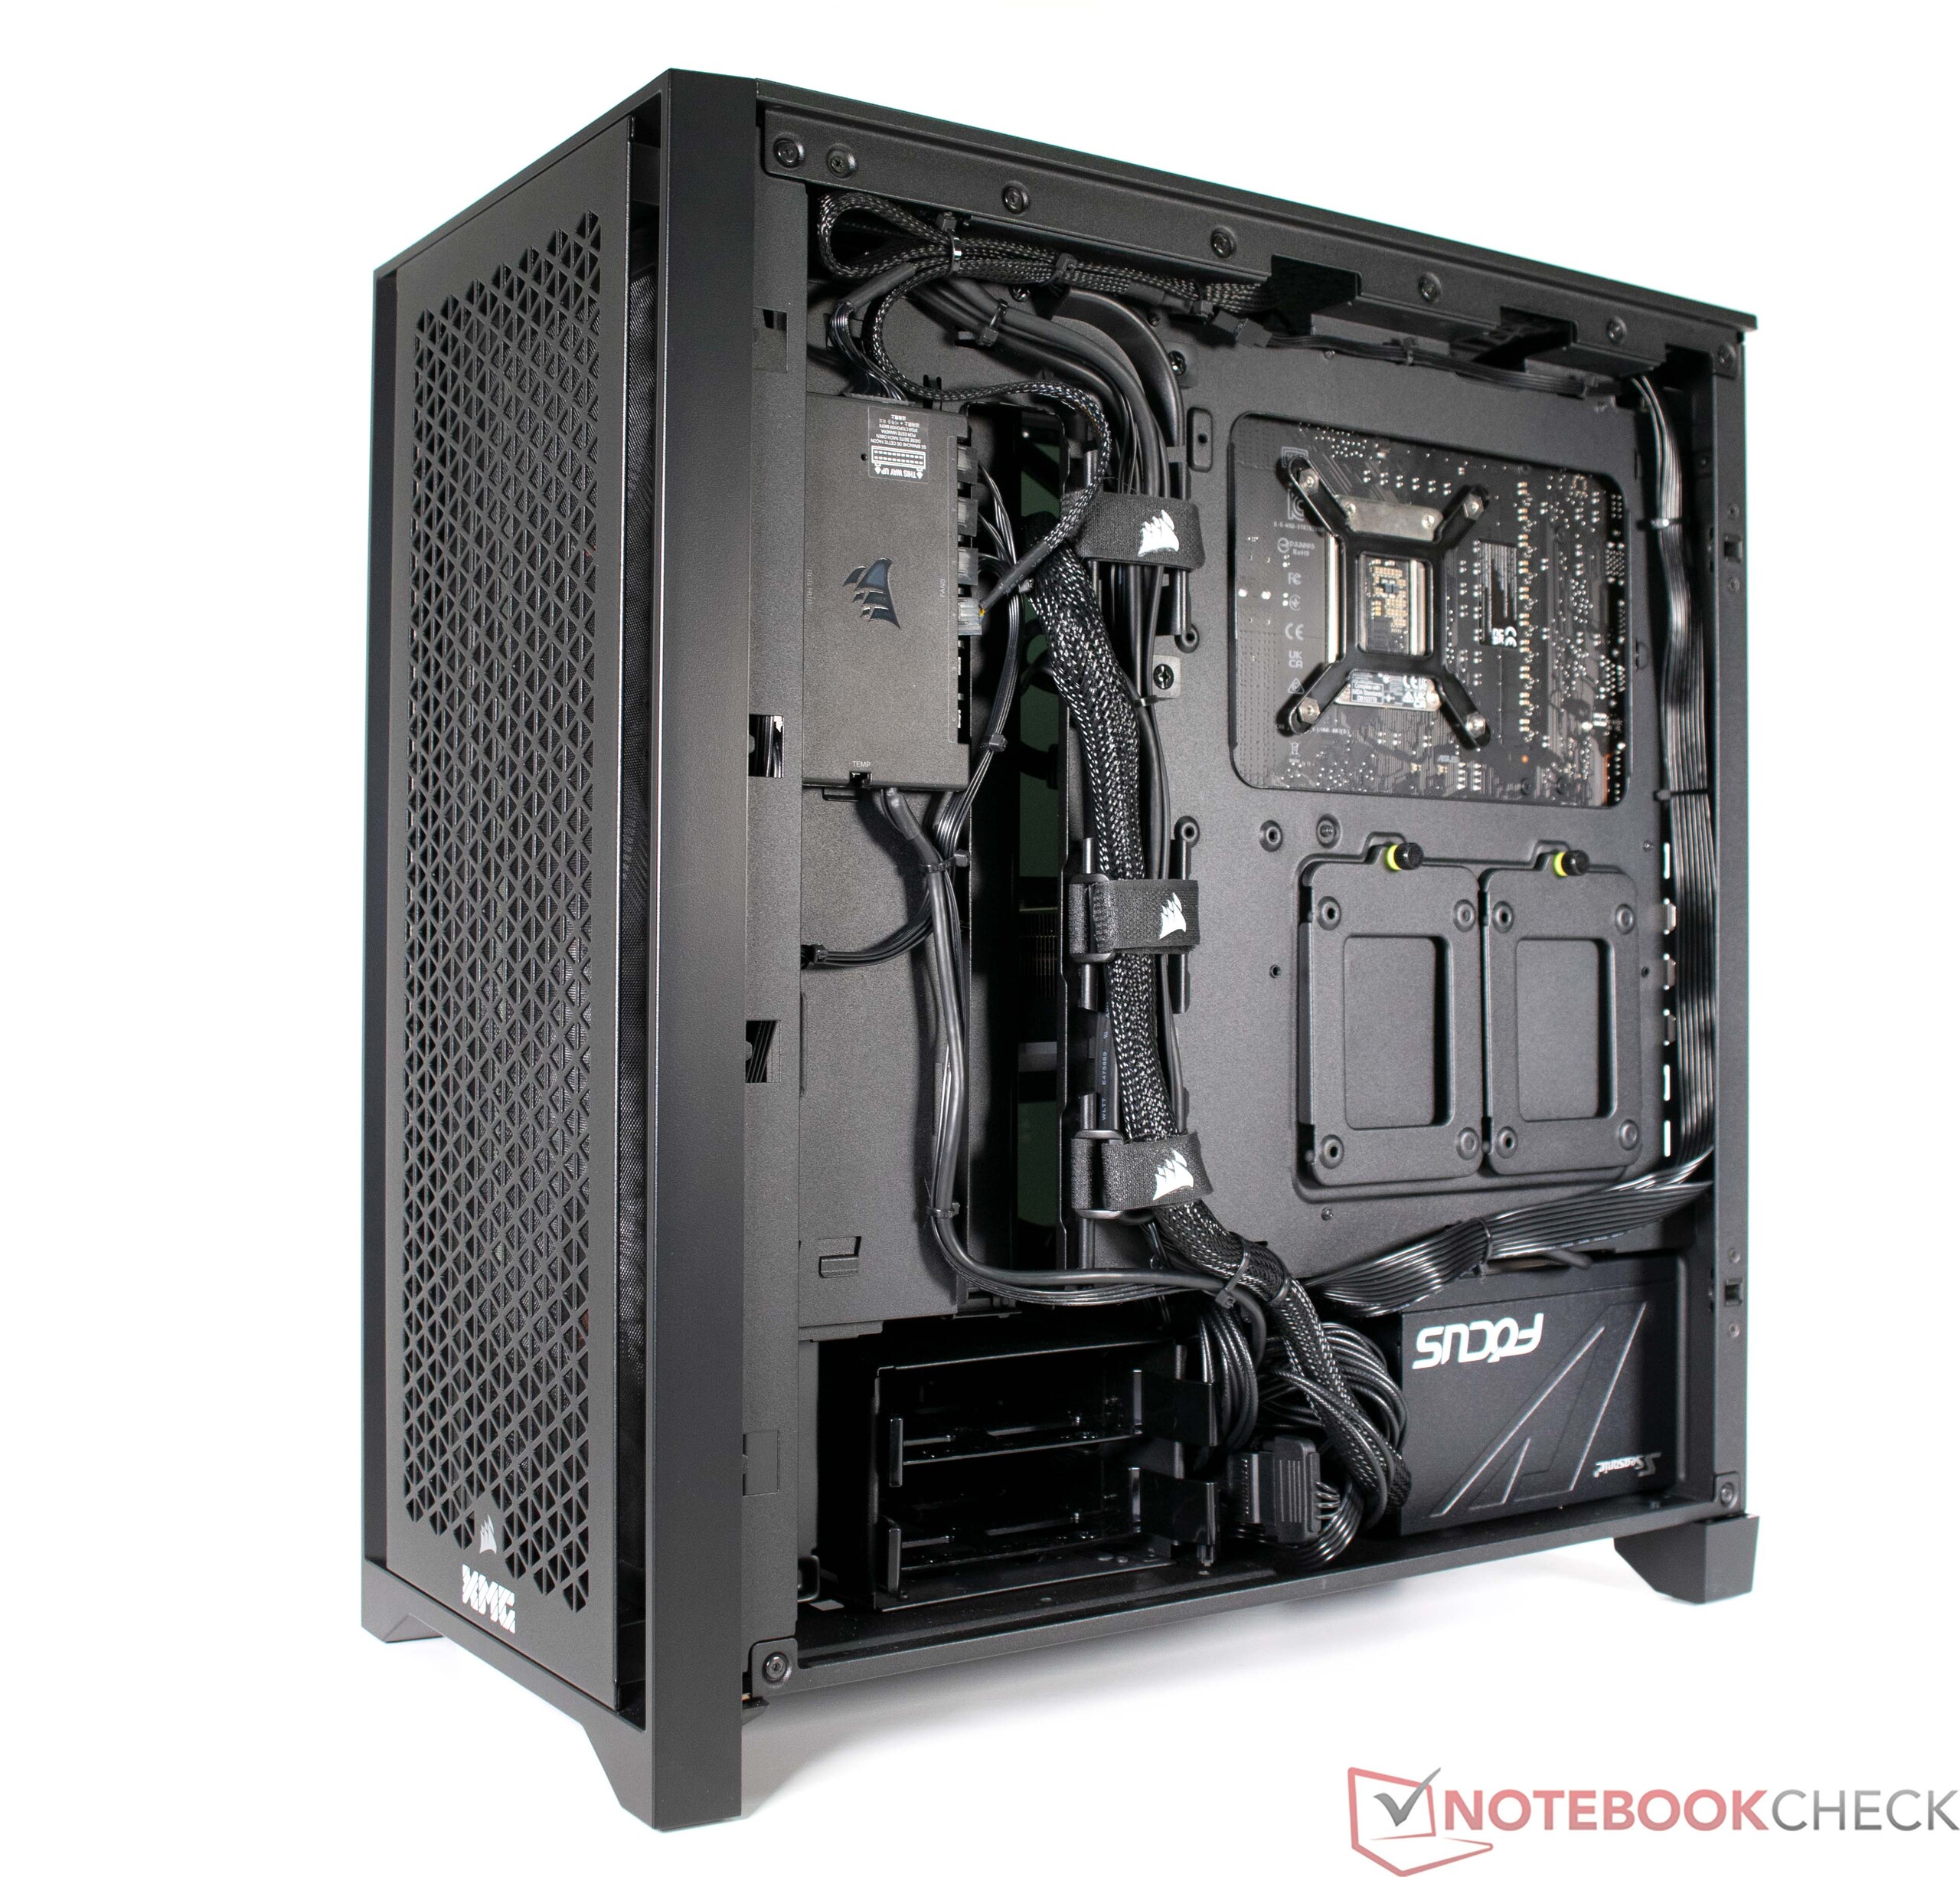
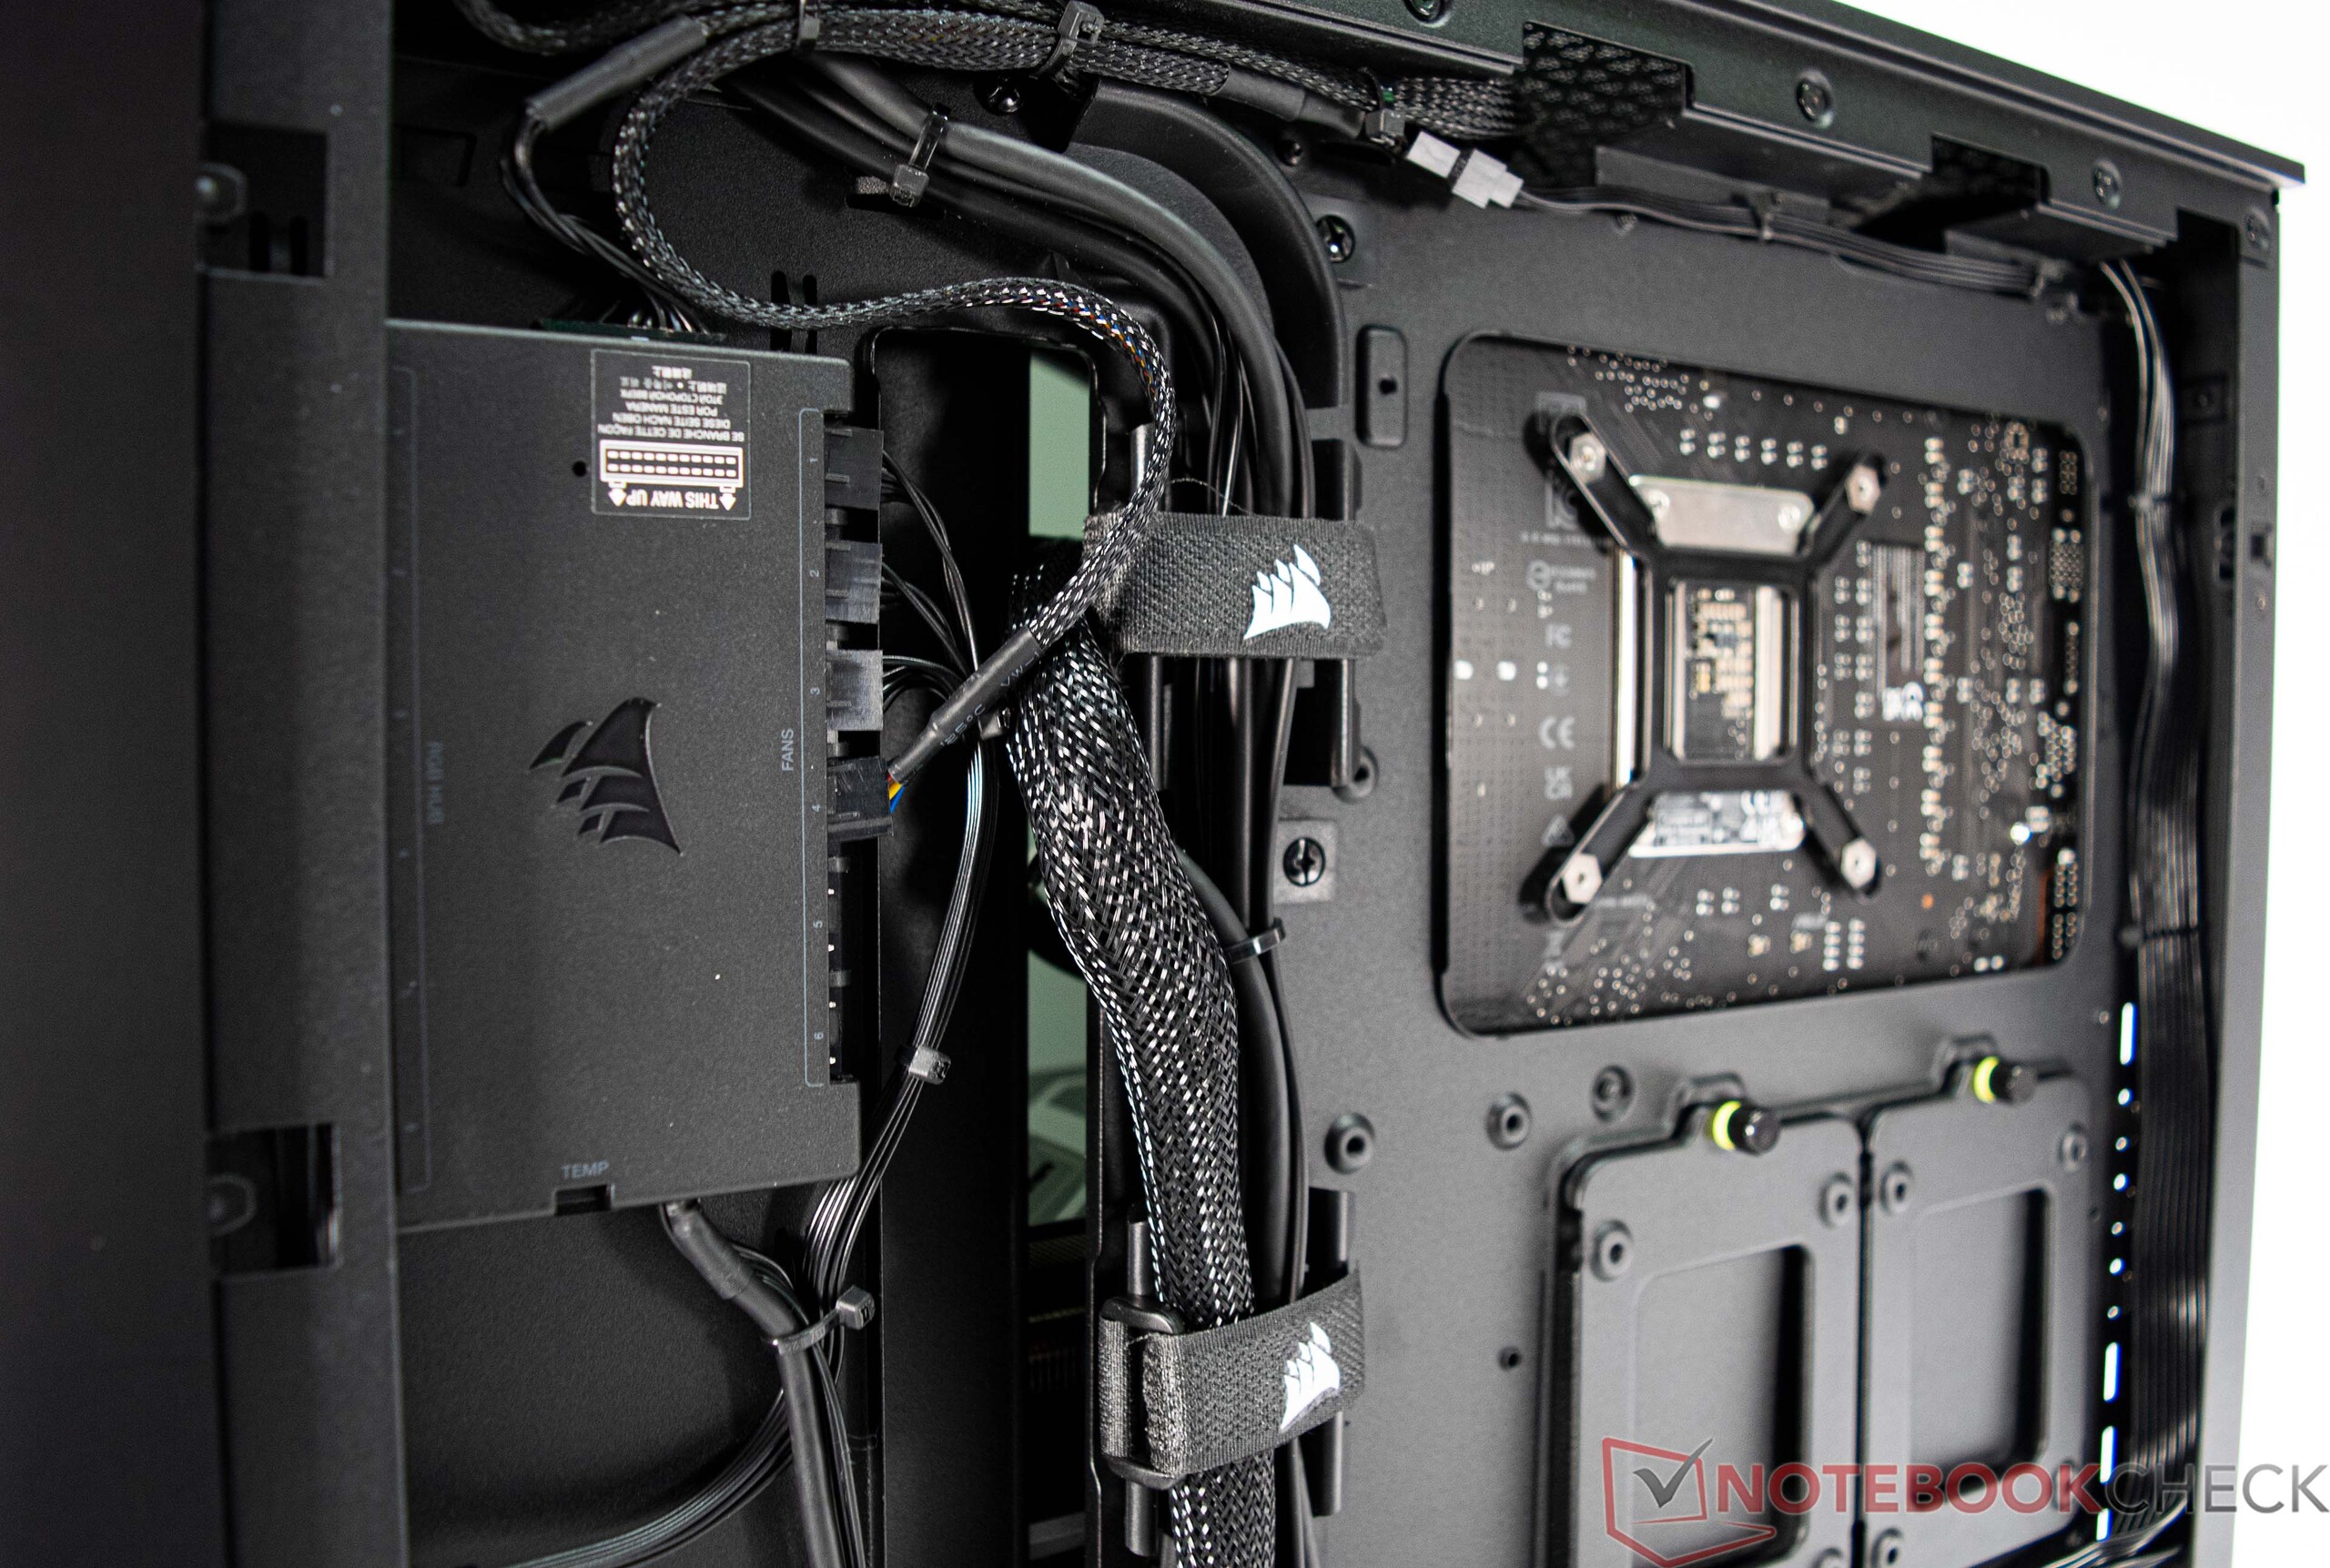
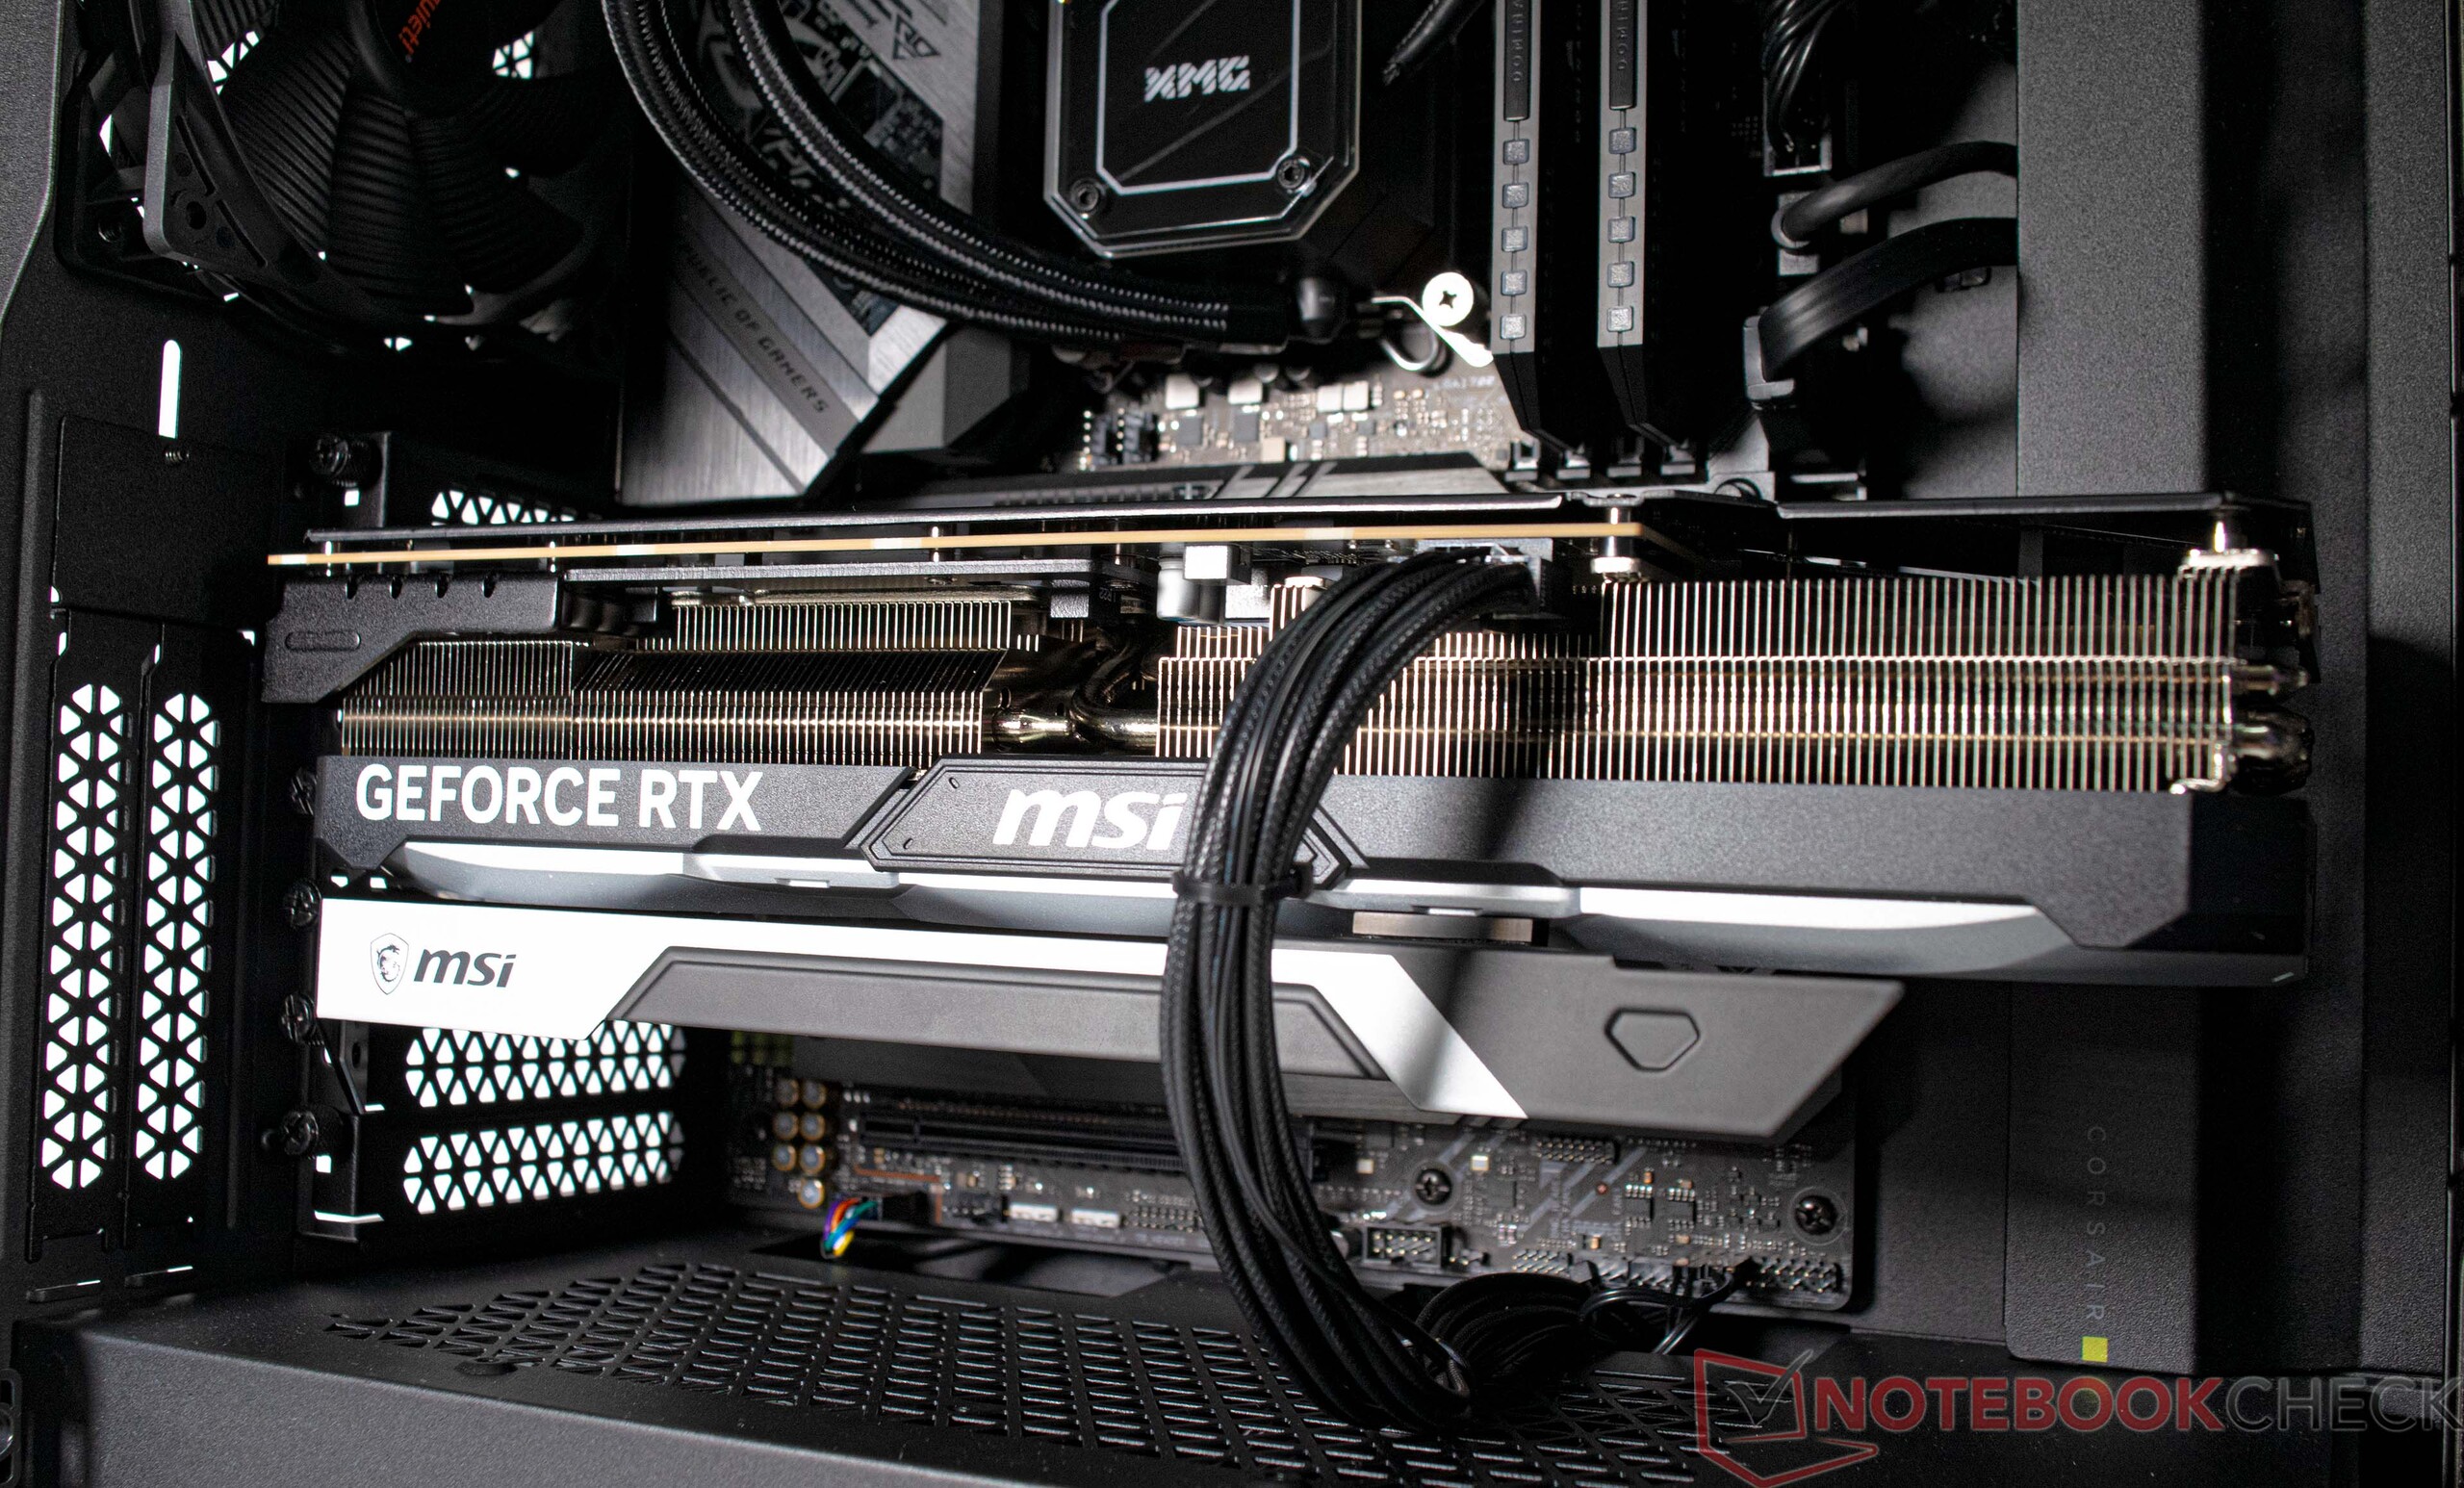
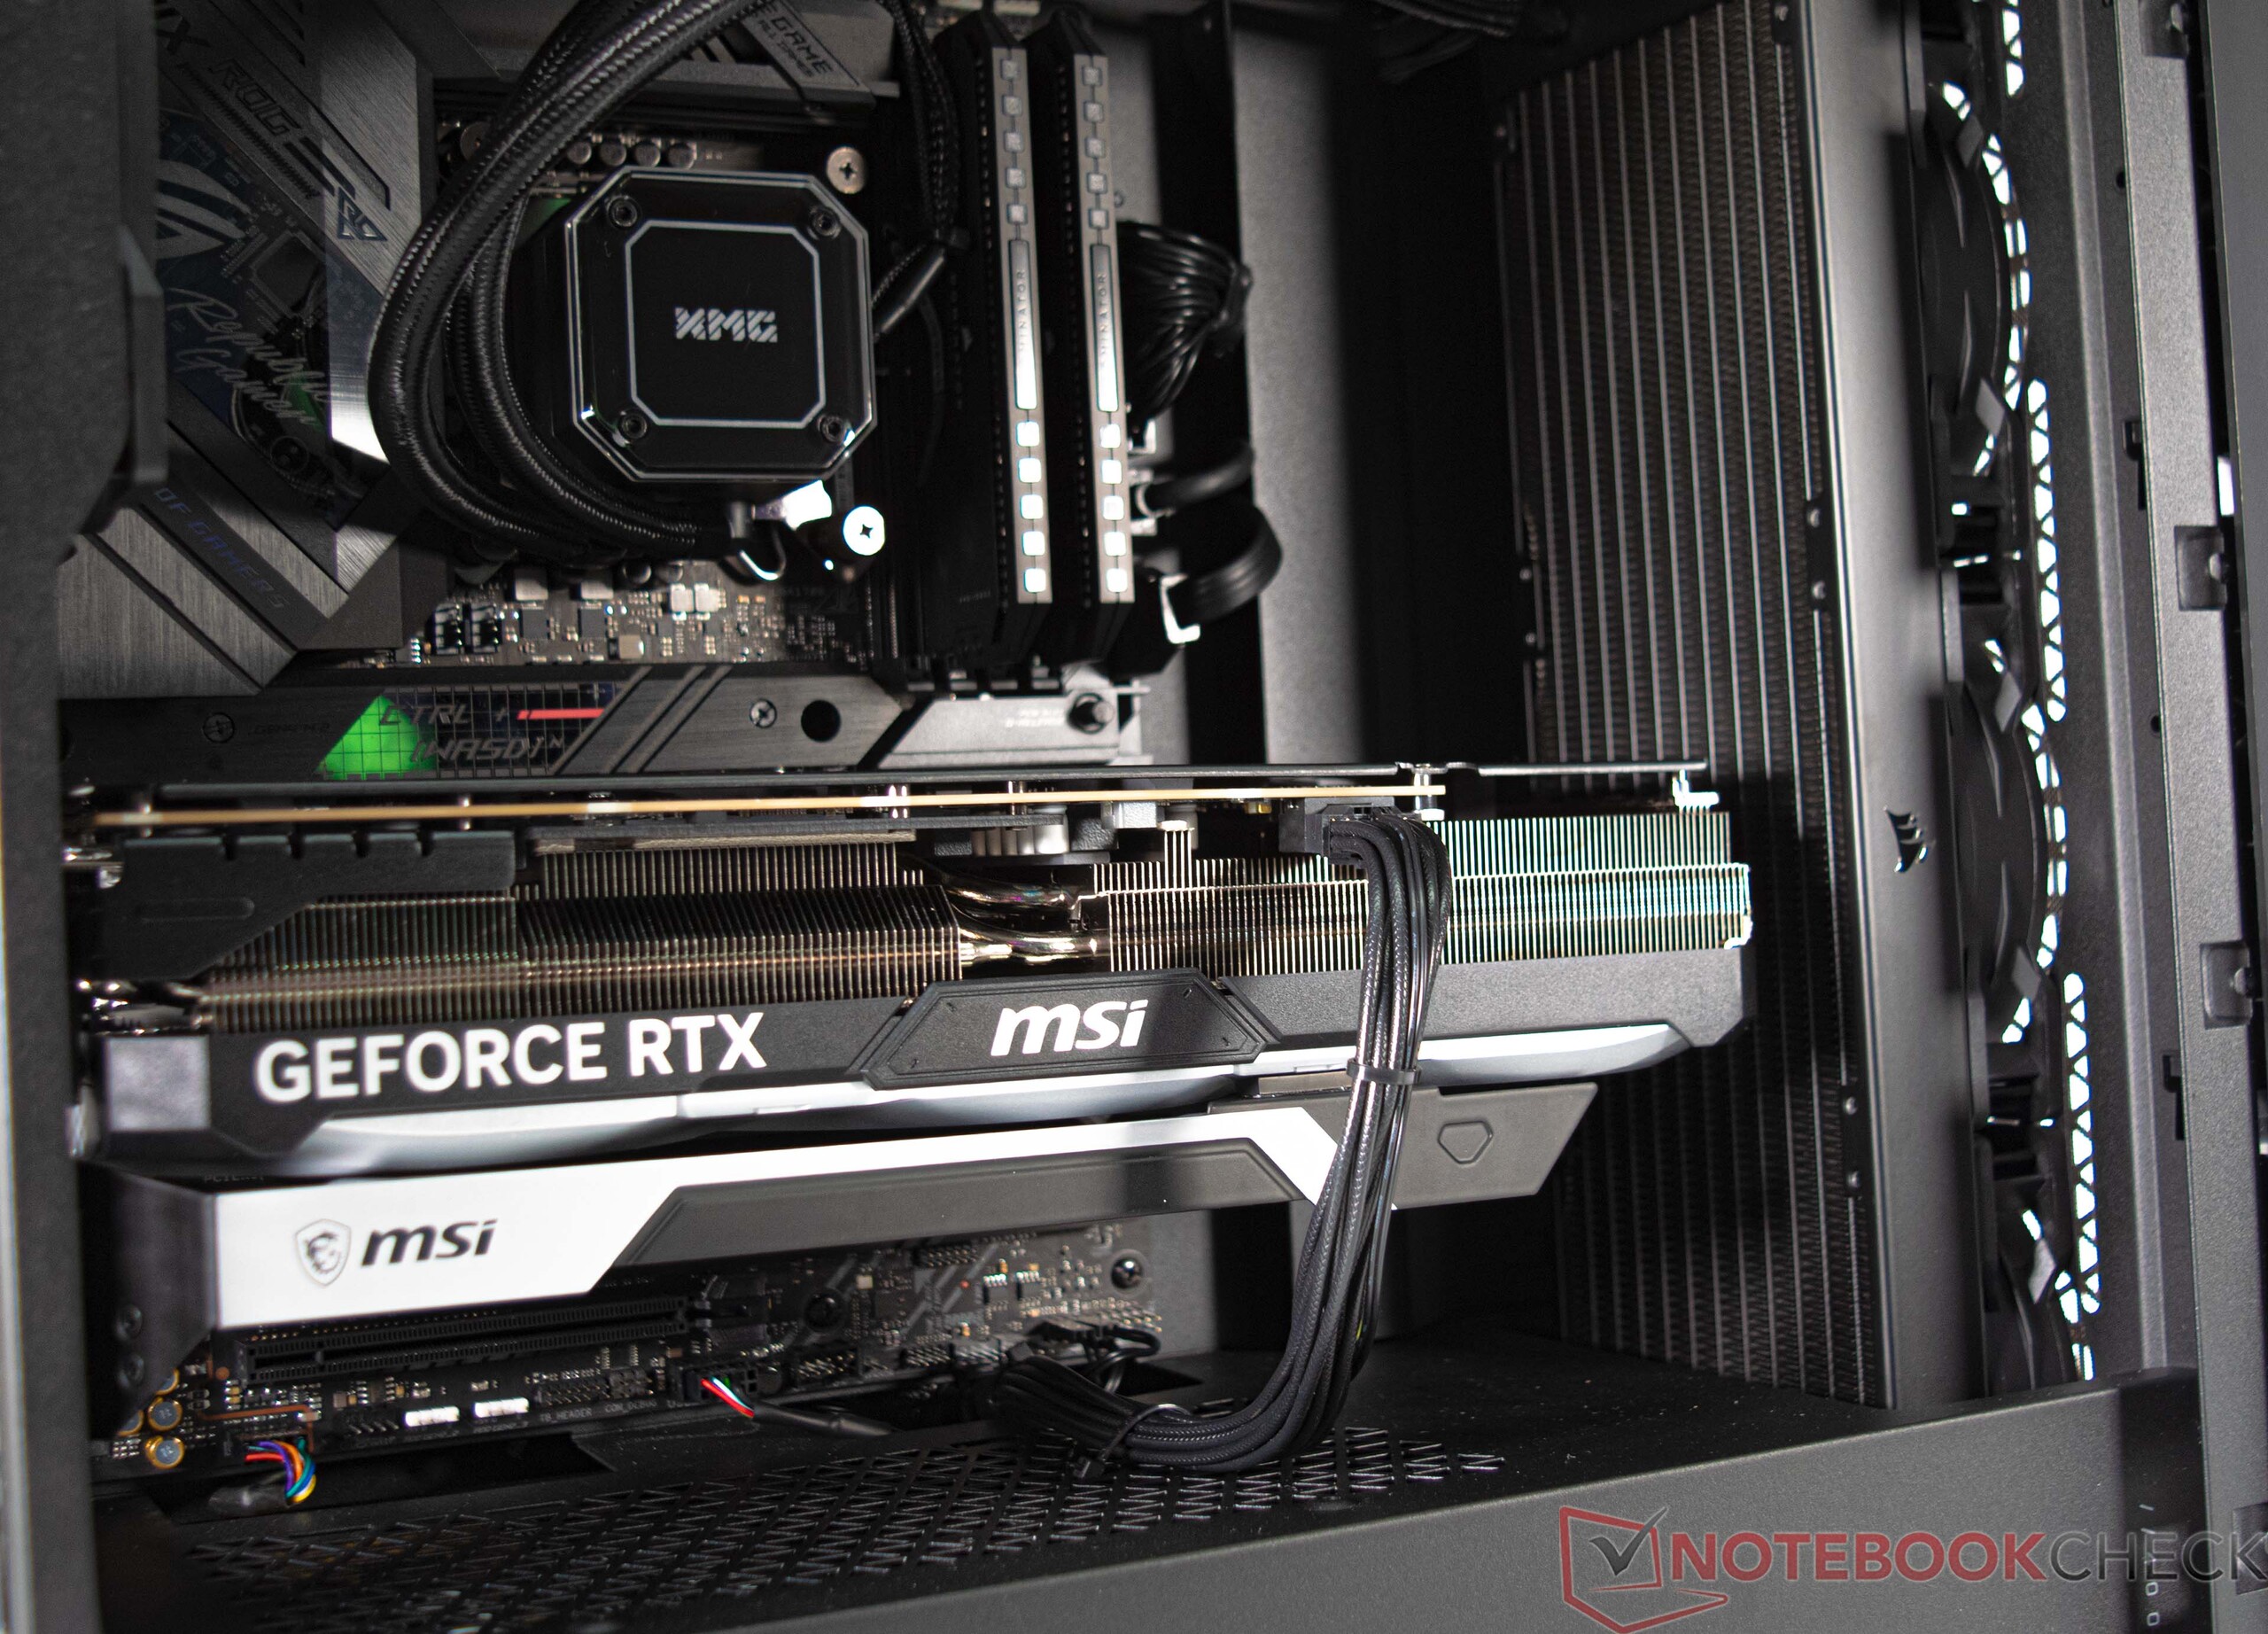
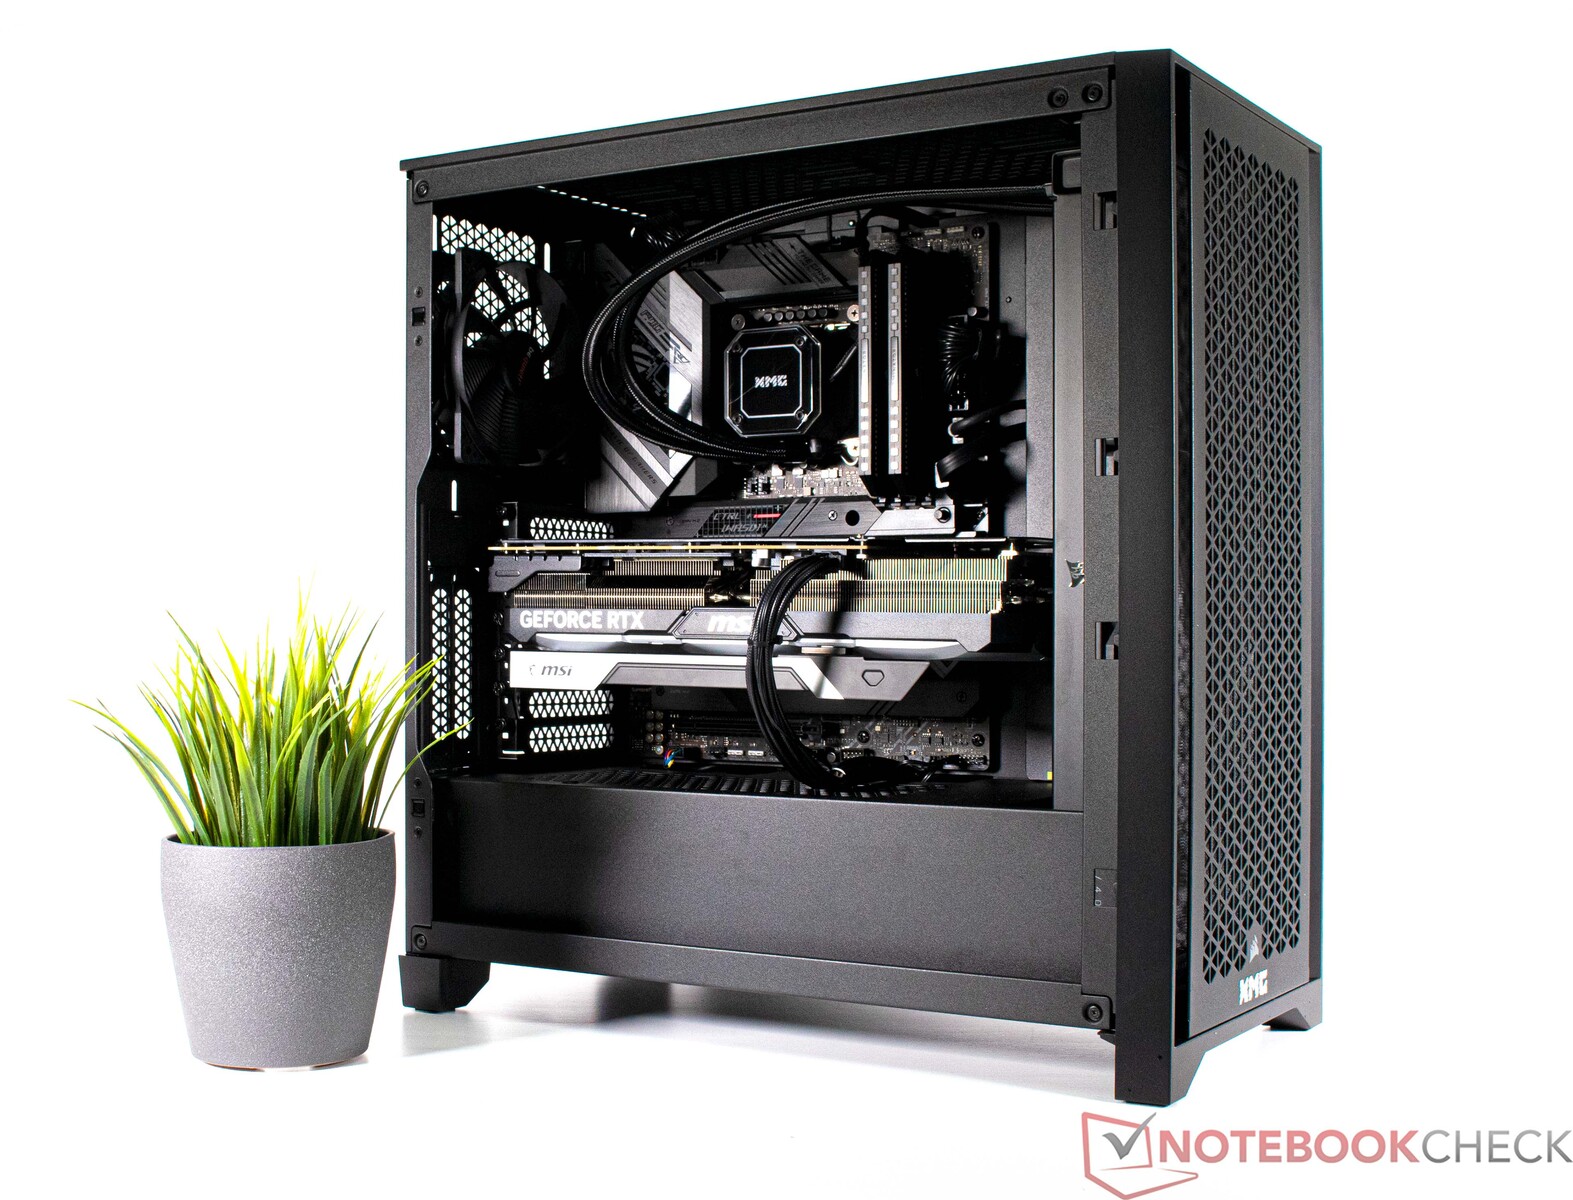
A Schenker instalou o hardware do XMG SECTOR Intel em um Corsair 4000D Airflow preto. A caixa tem uma janela de vidro escuro para mostrar os componentes internos com efeitos de iluminação. Entretanto, o refrigerador AIO incluído e os módulos de memória RGB Corsair Dominator são as únicas fontes de iluminação em nossa configuração de revisão.

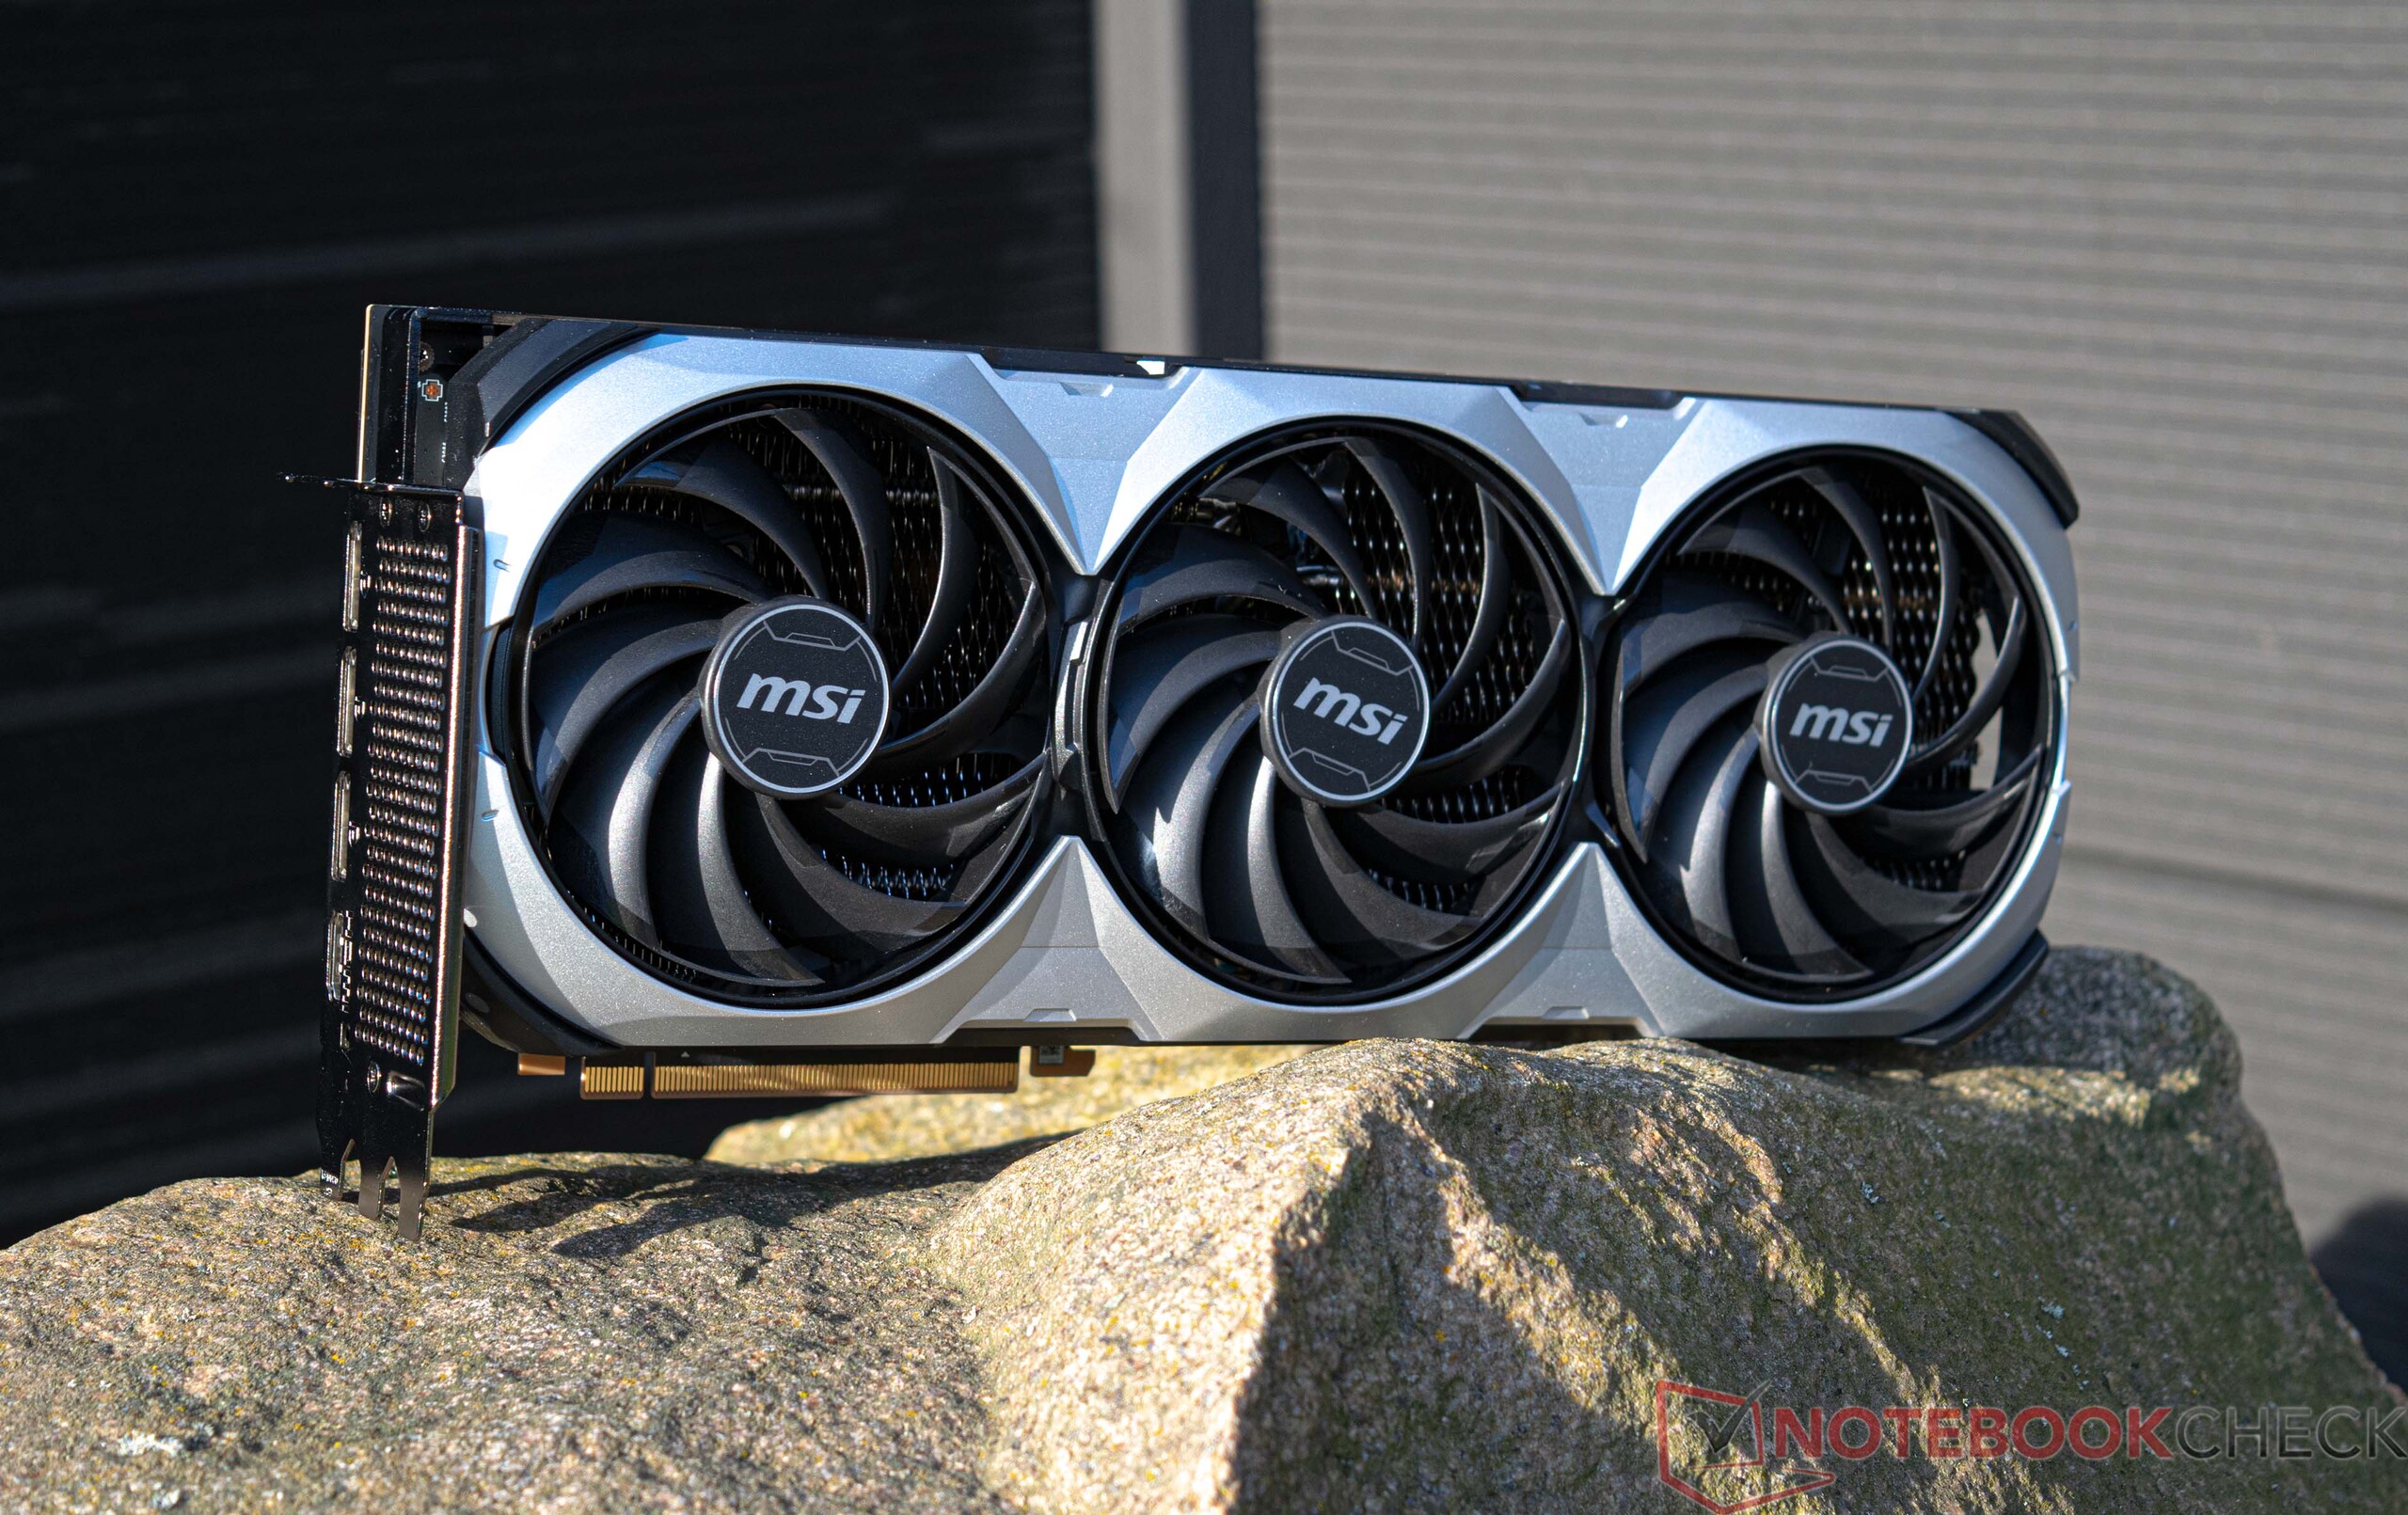
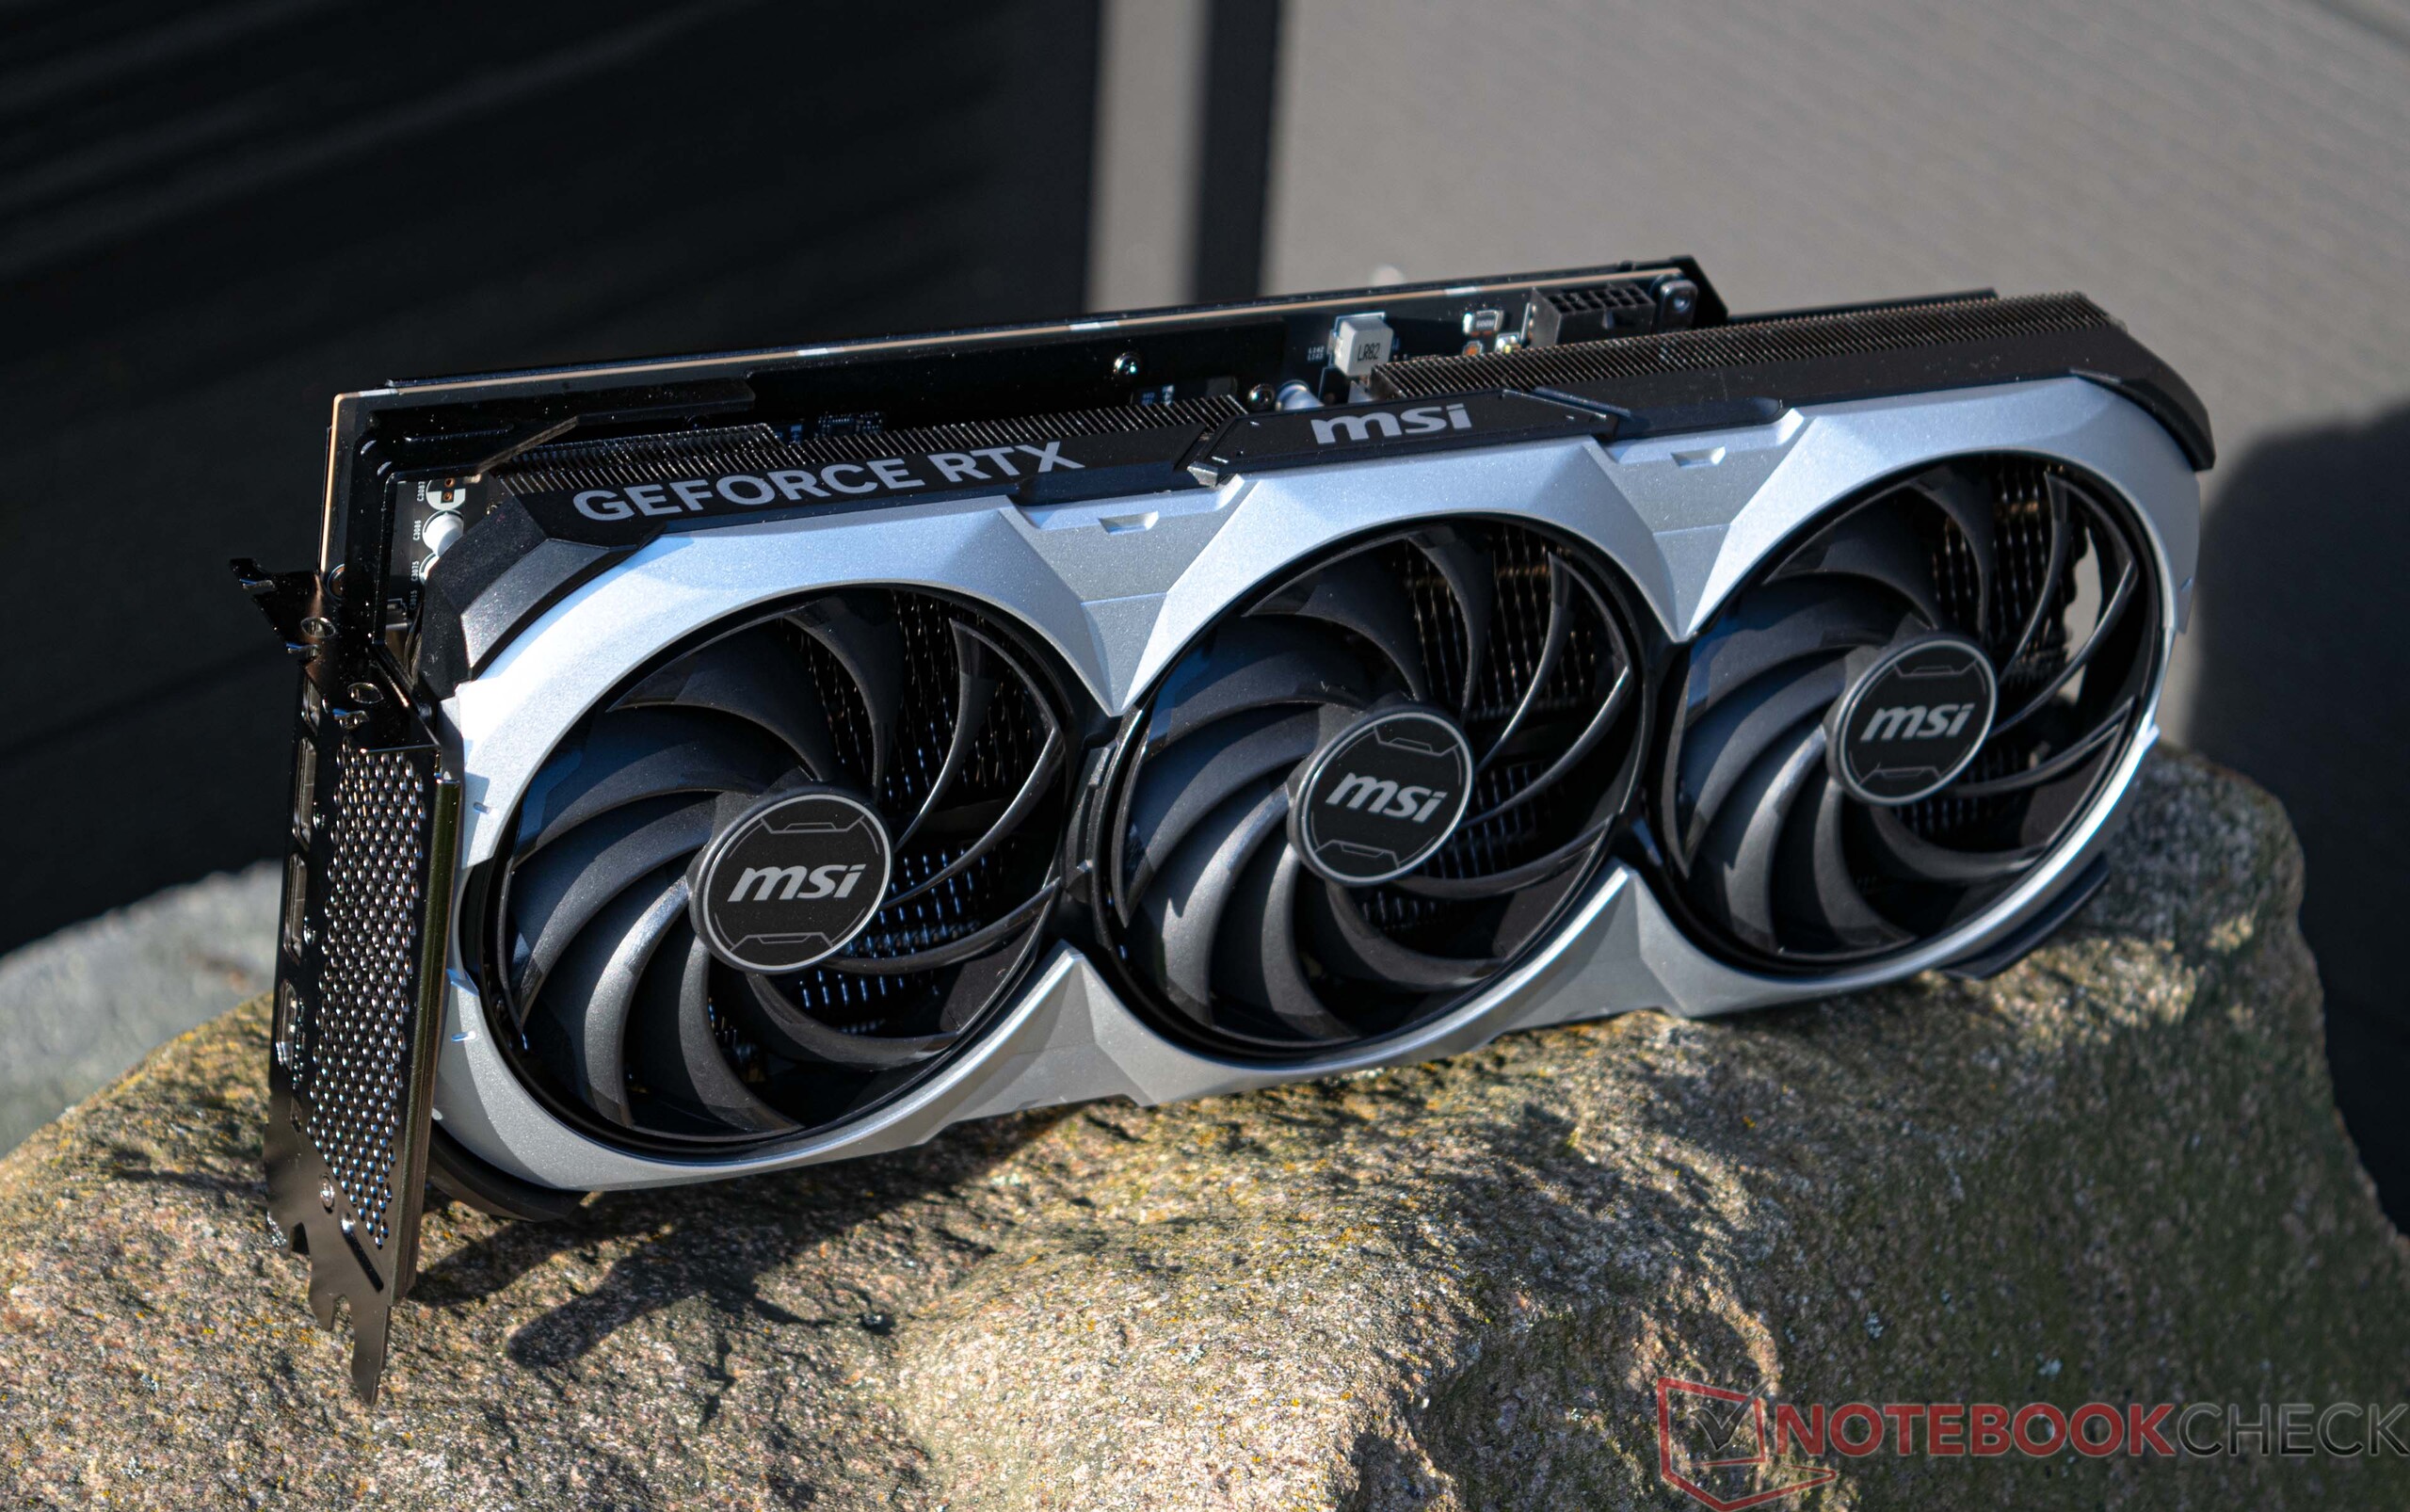
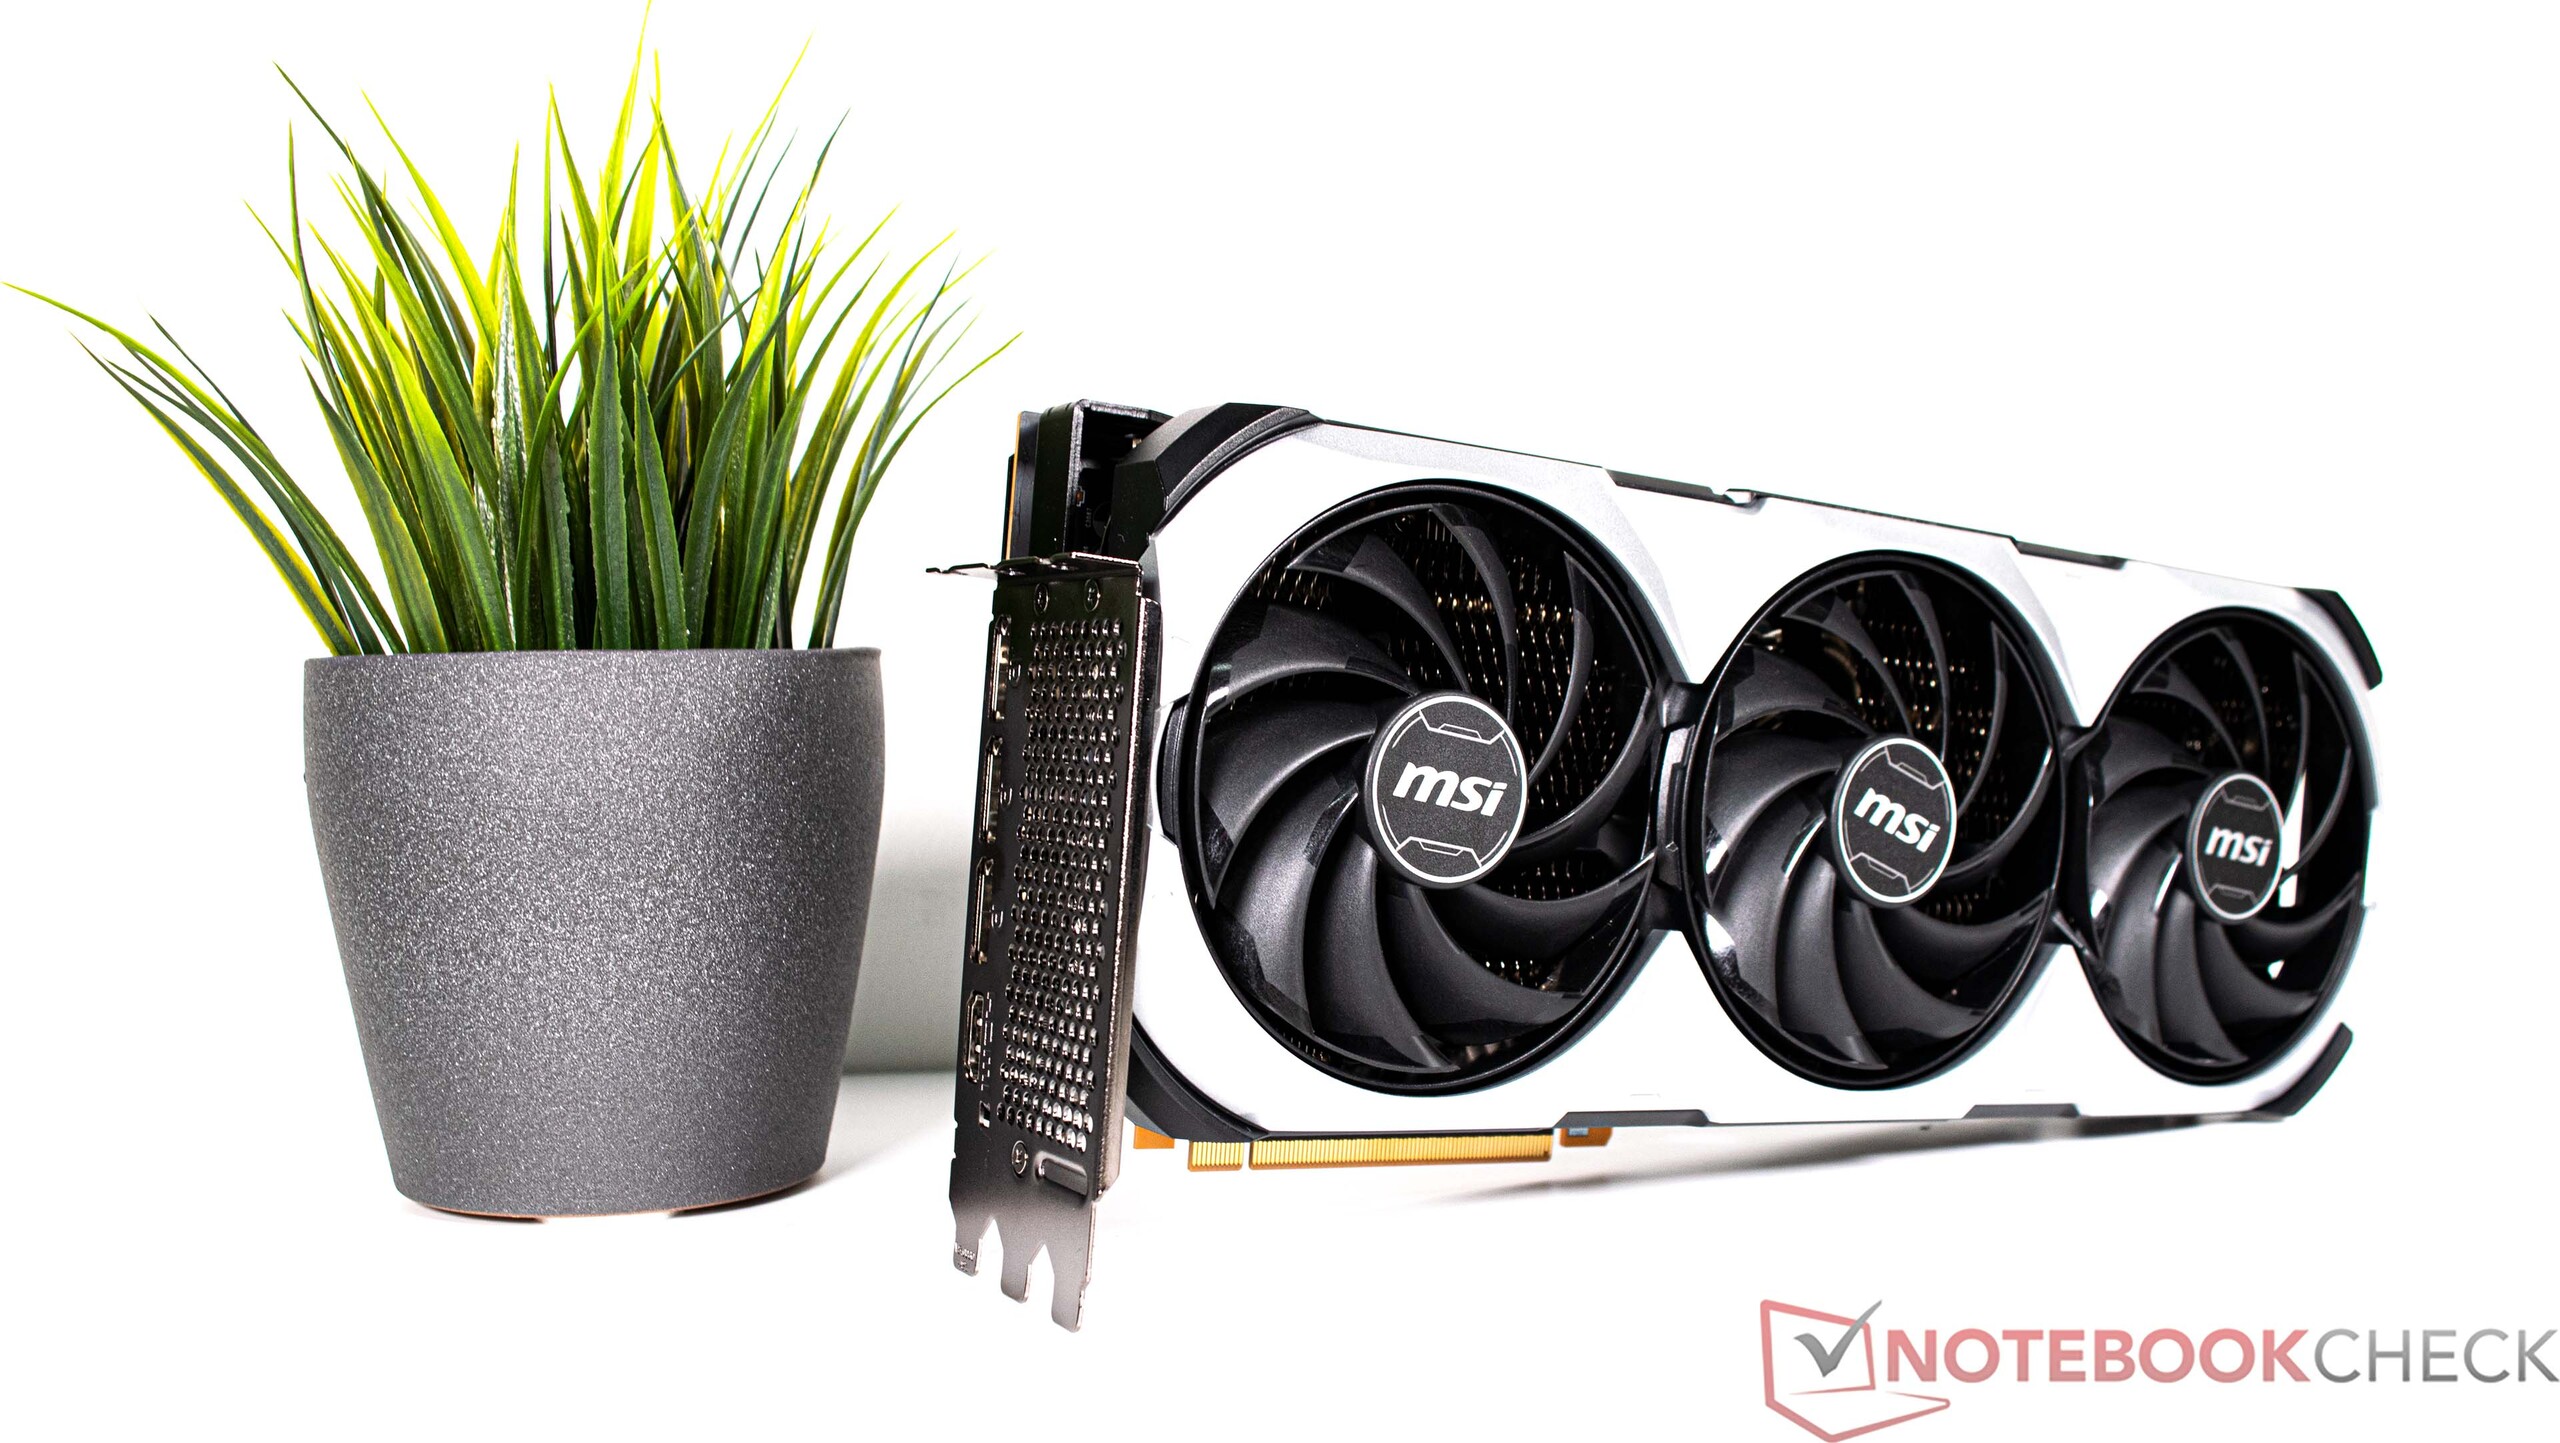
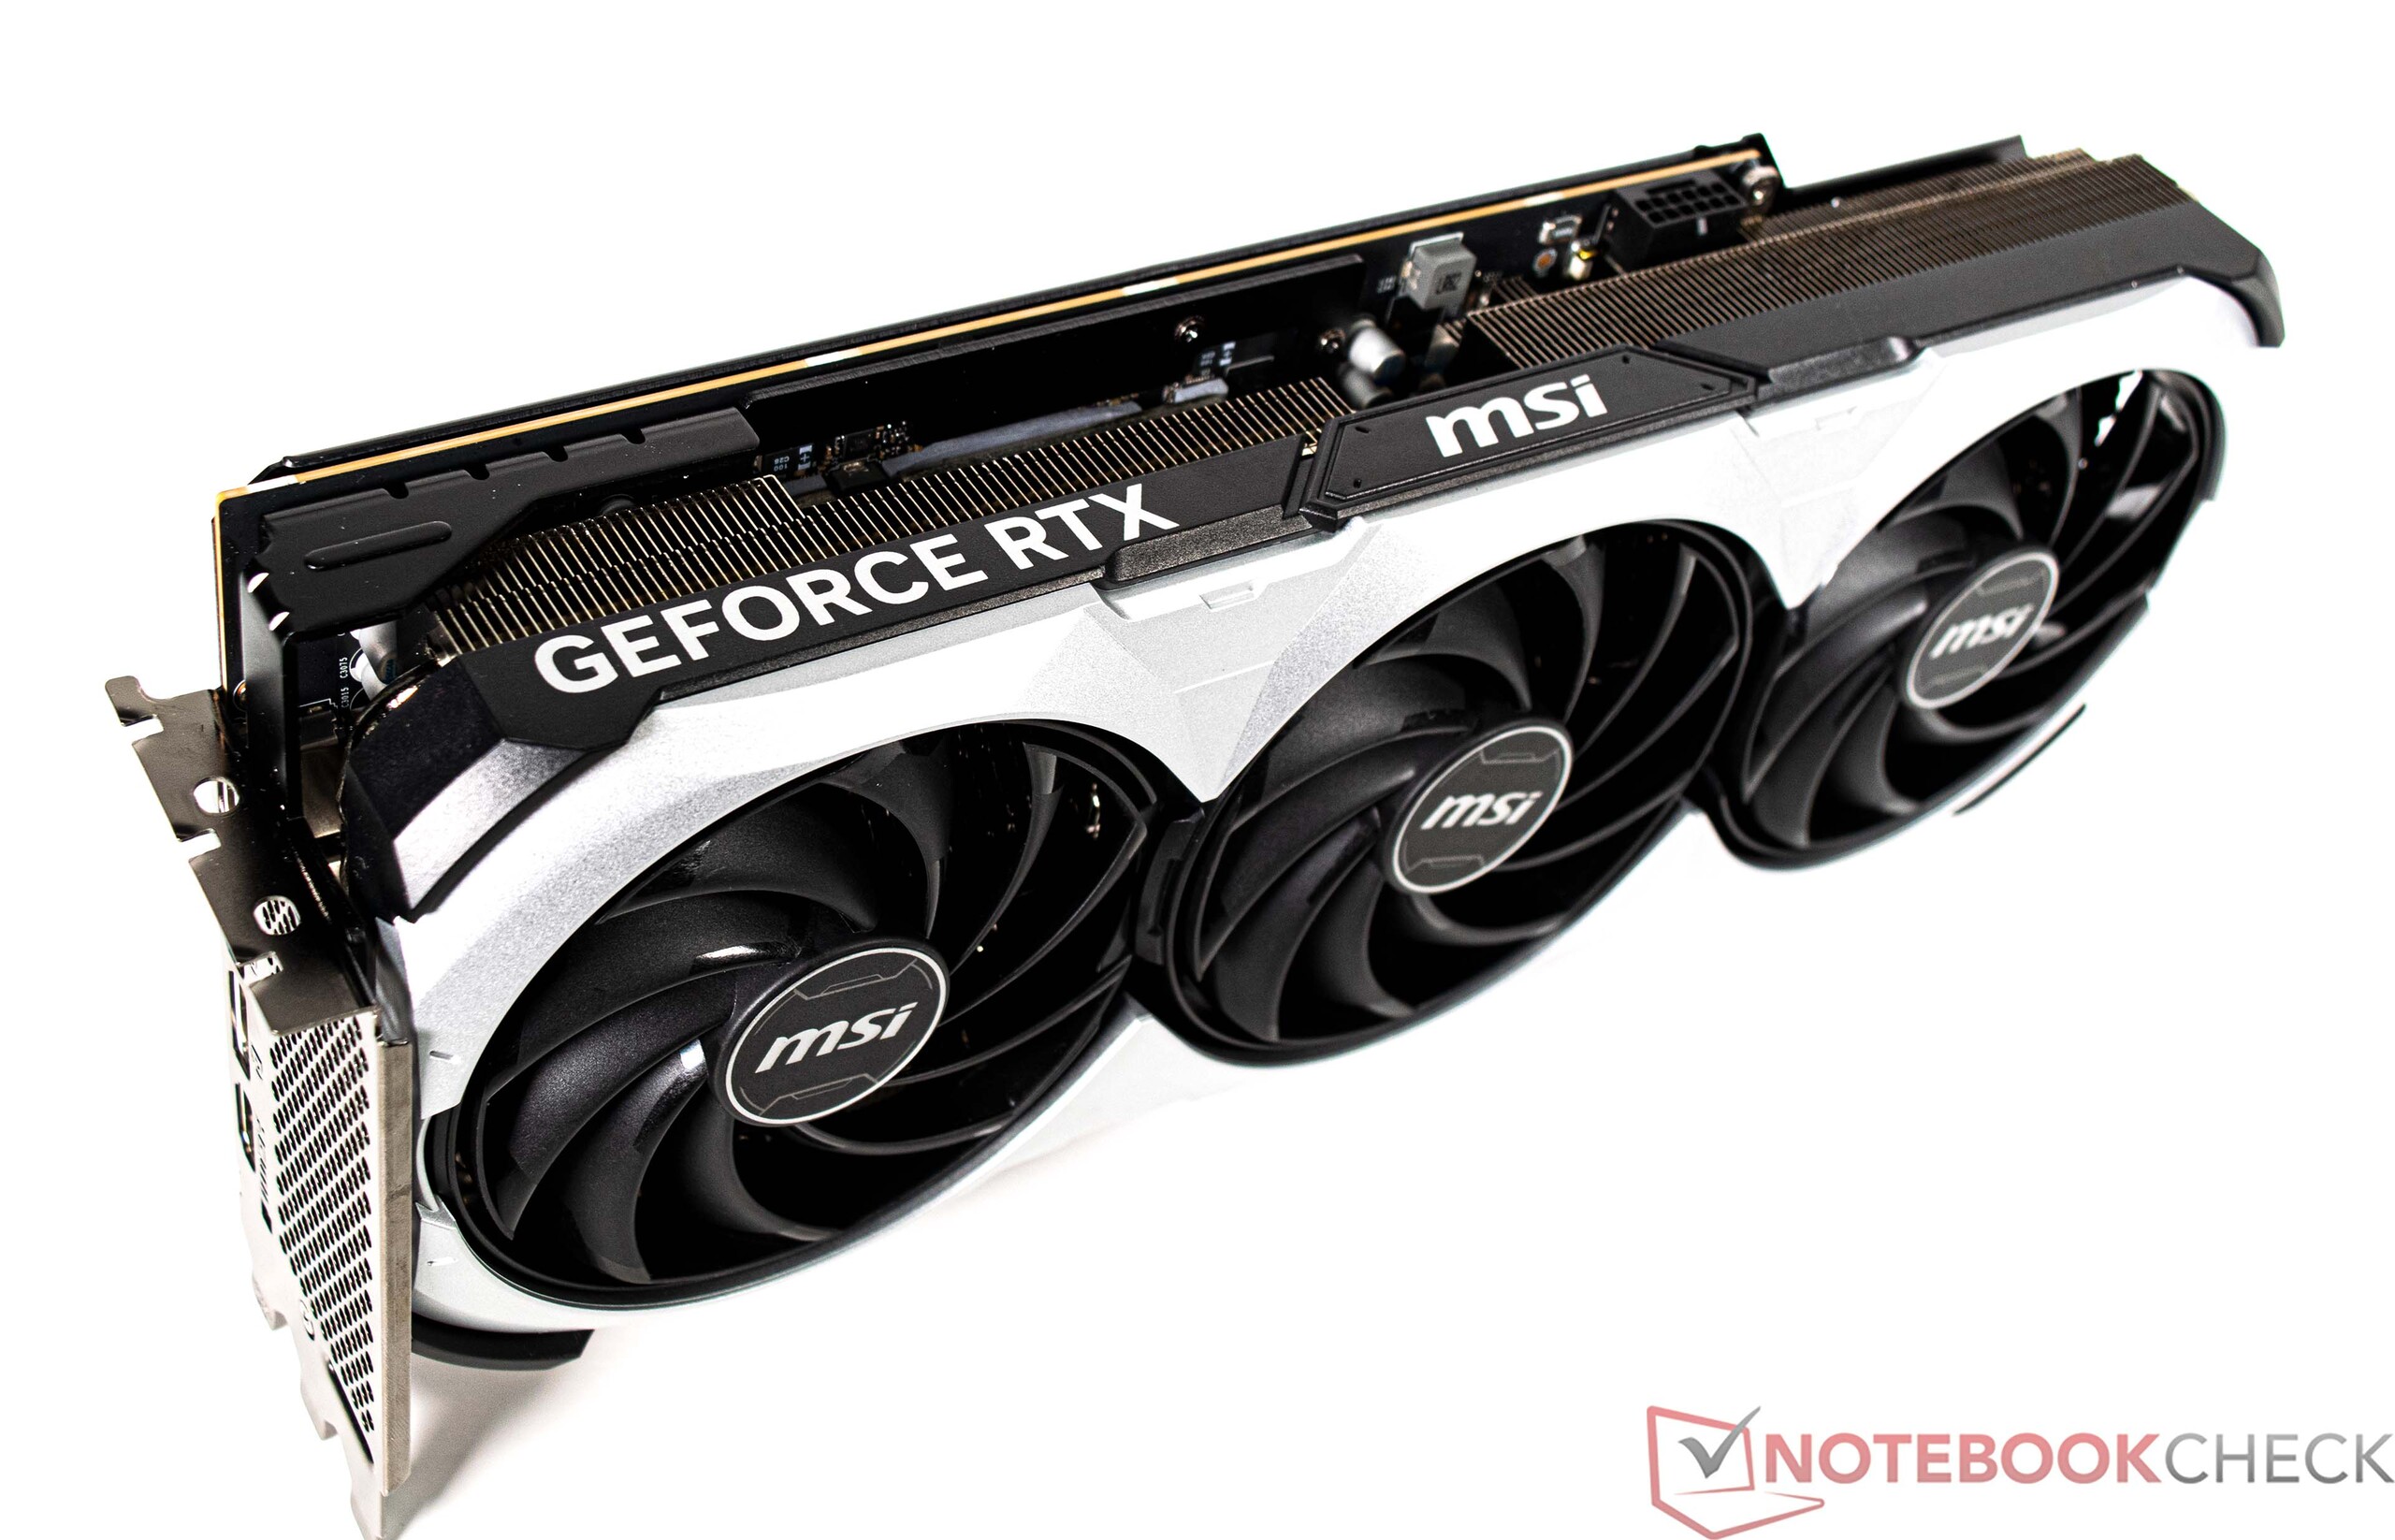
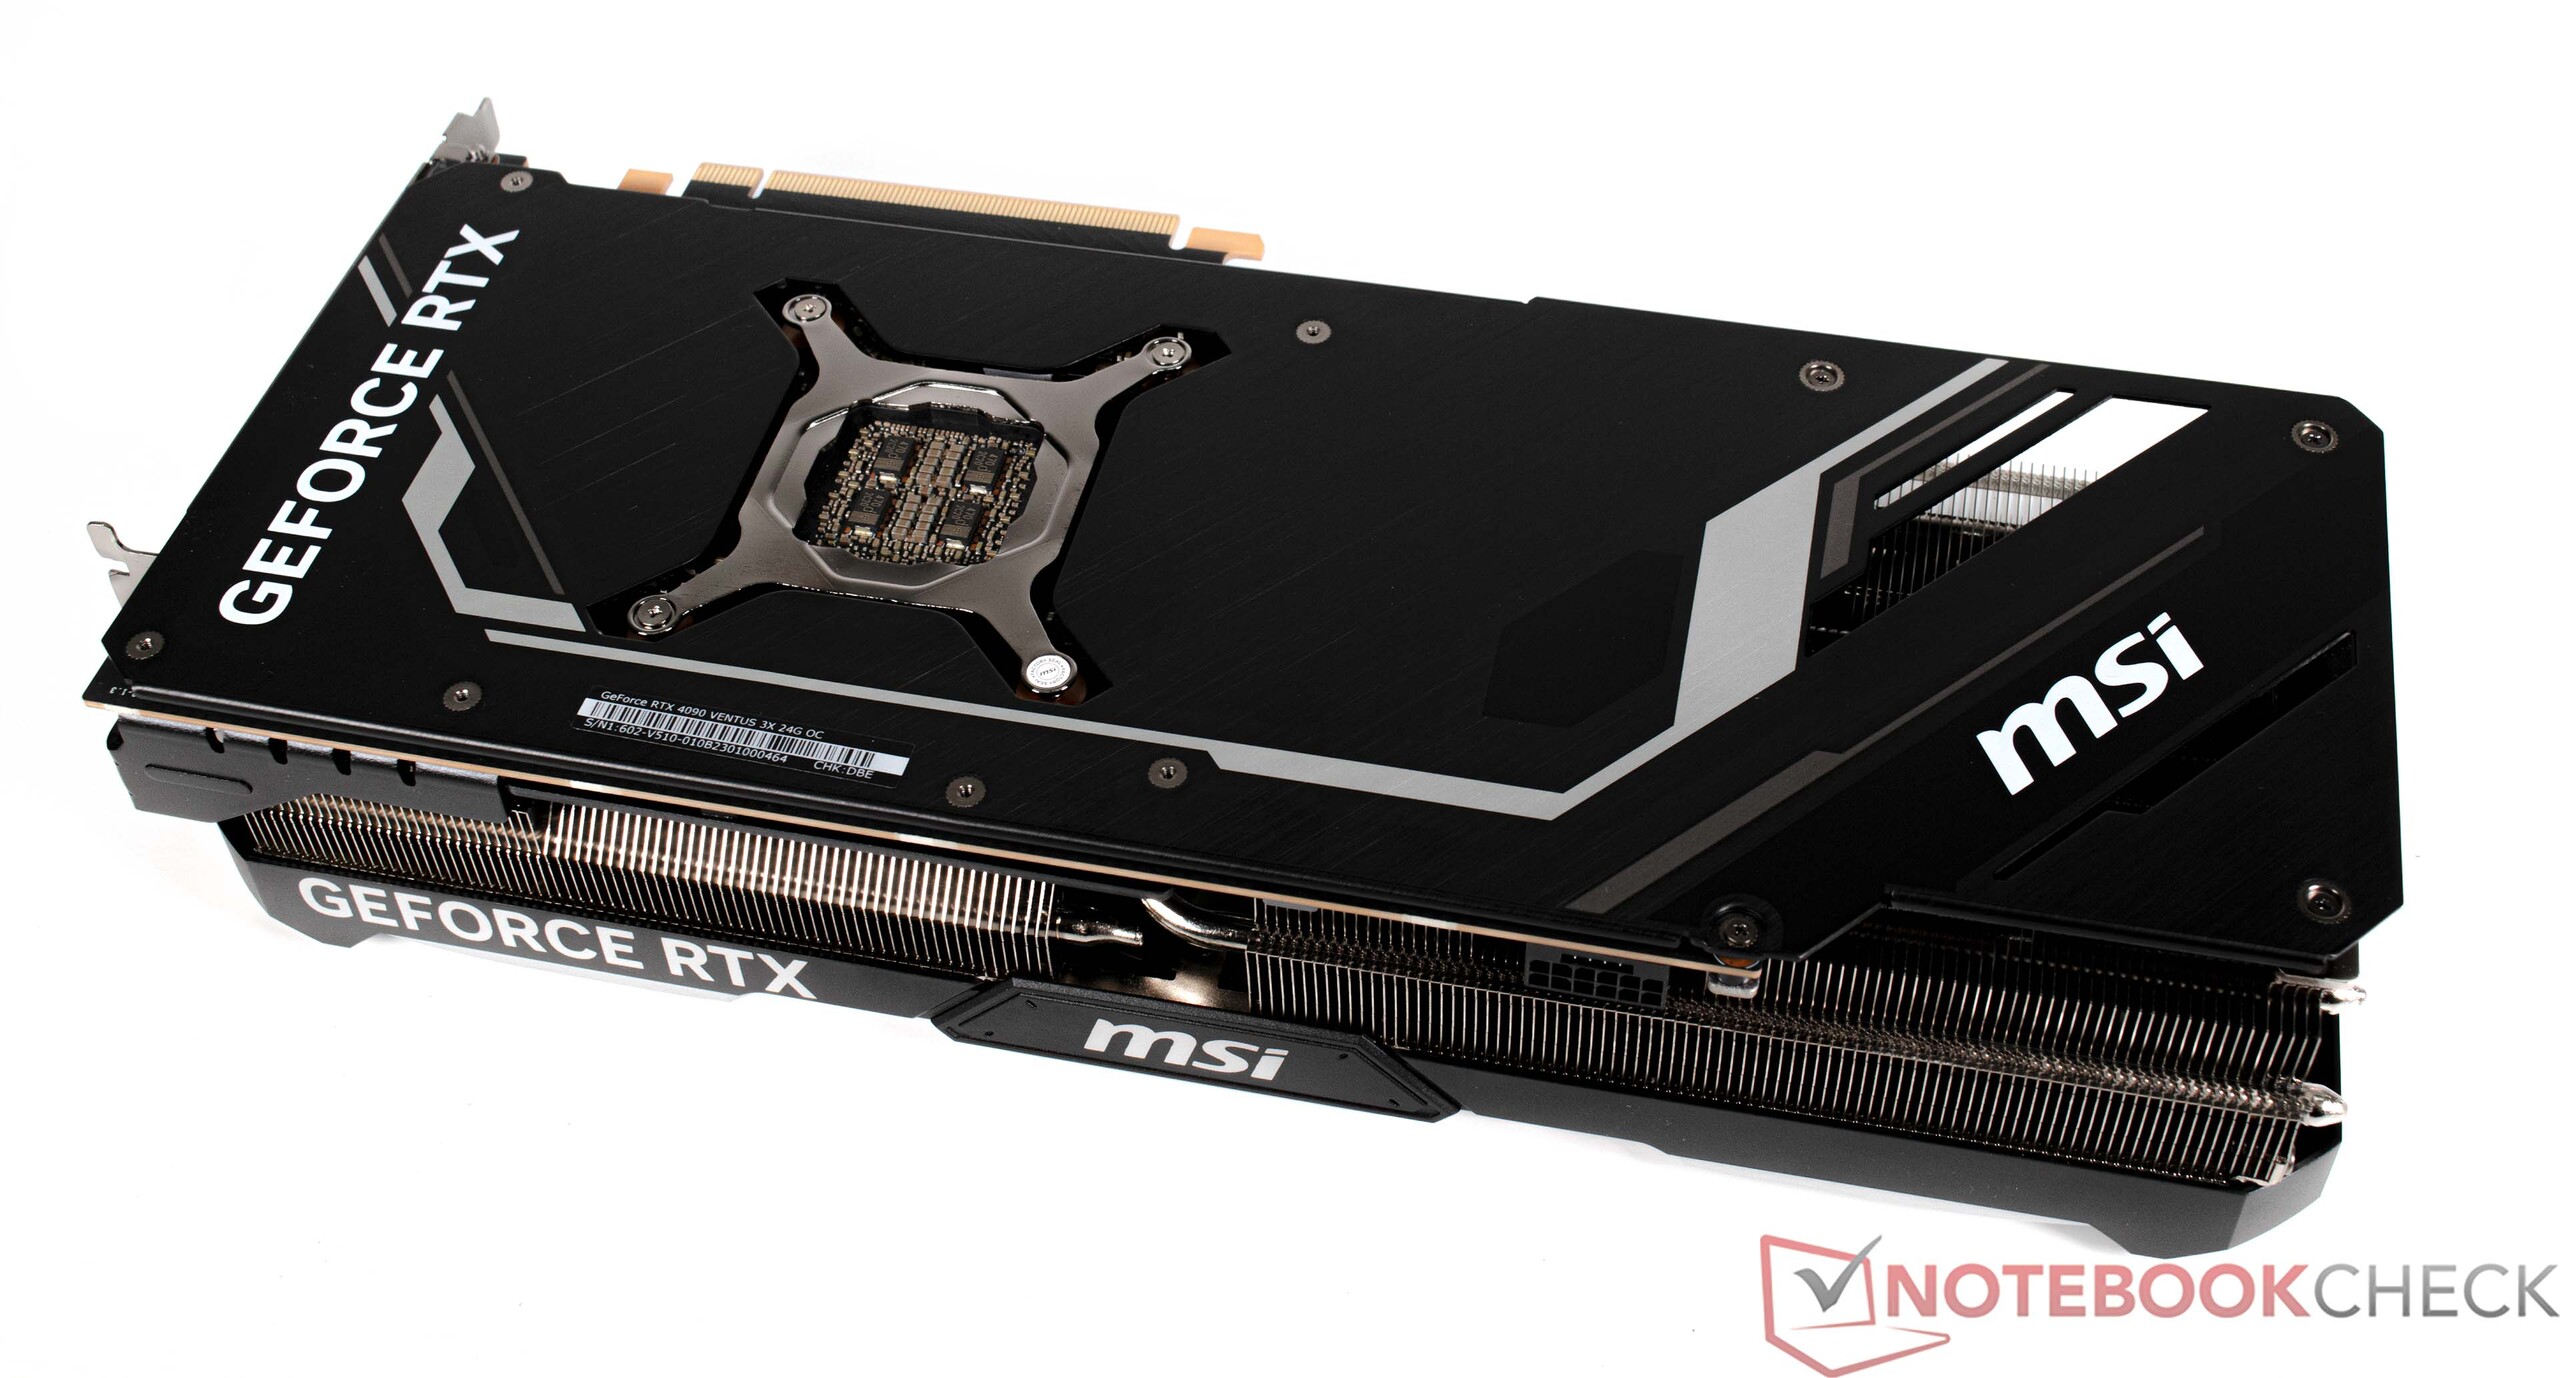
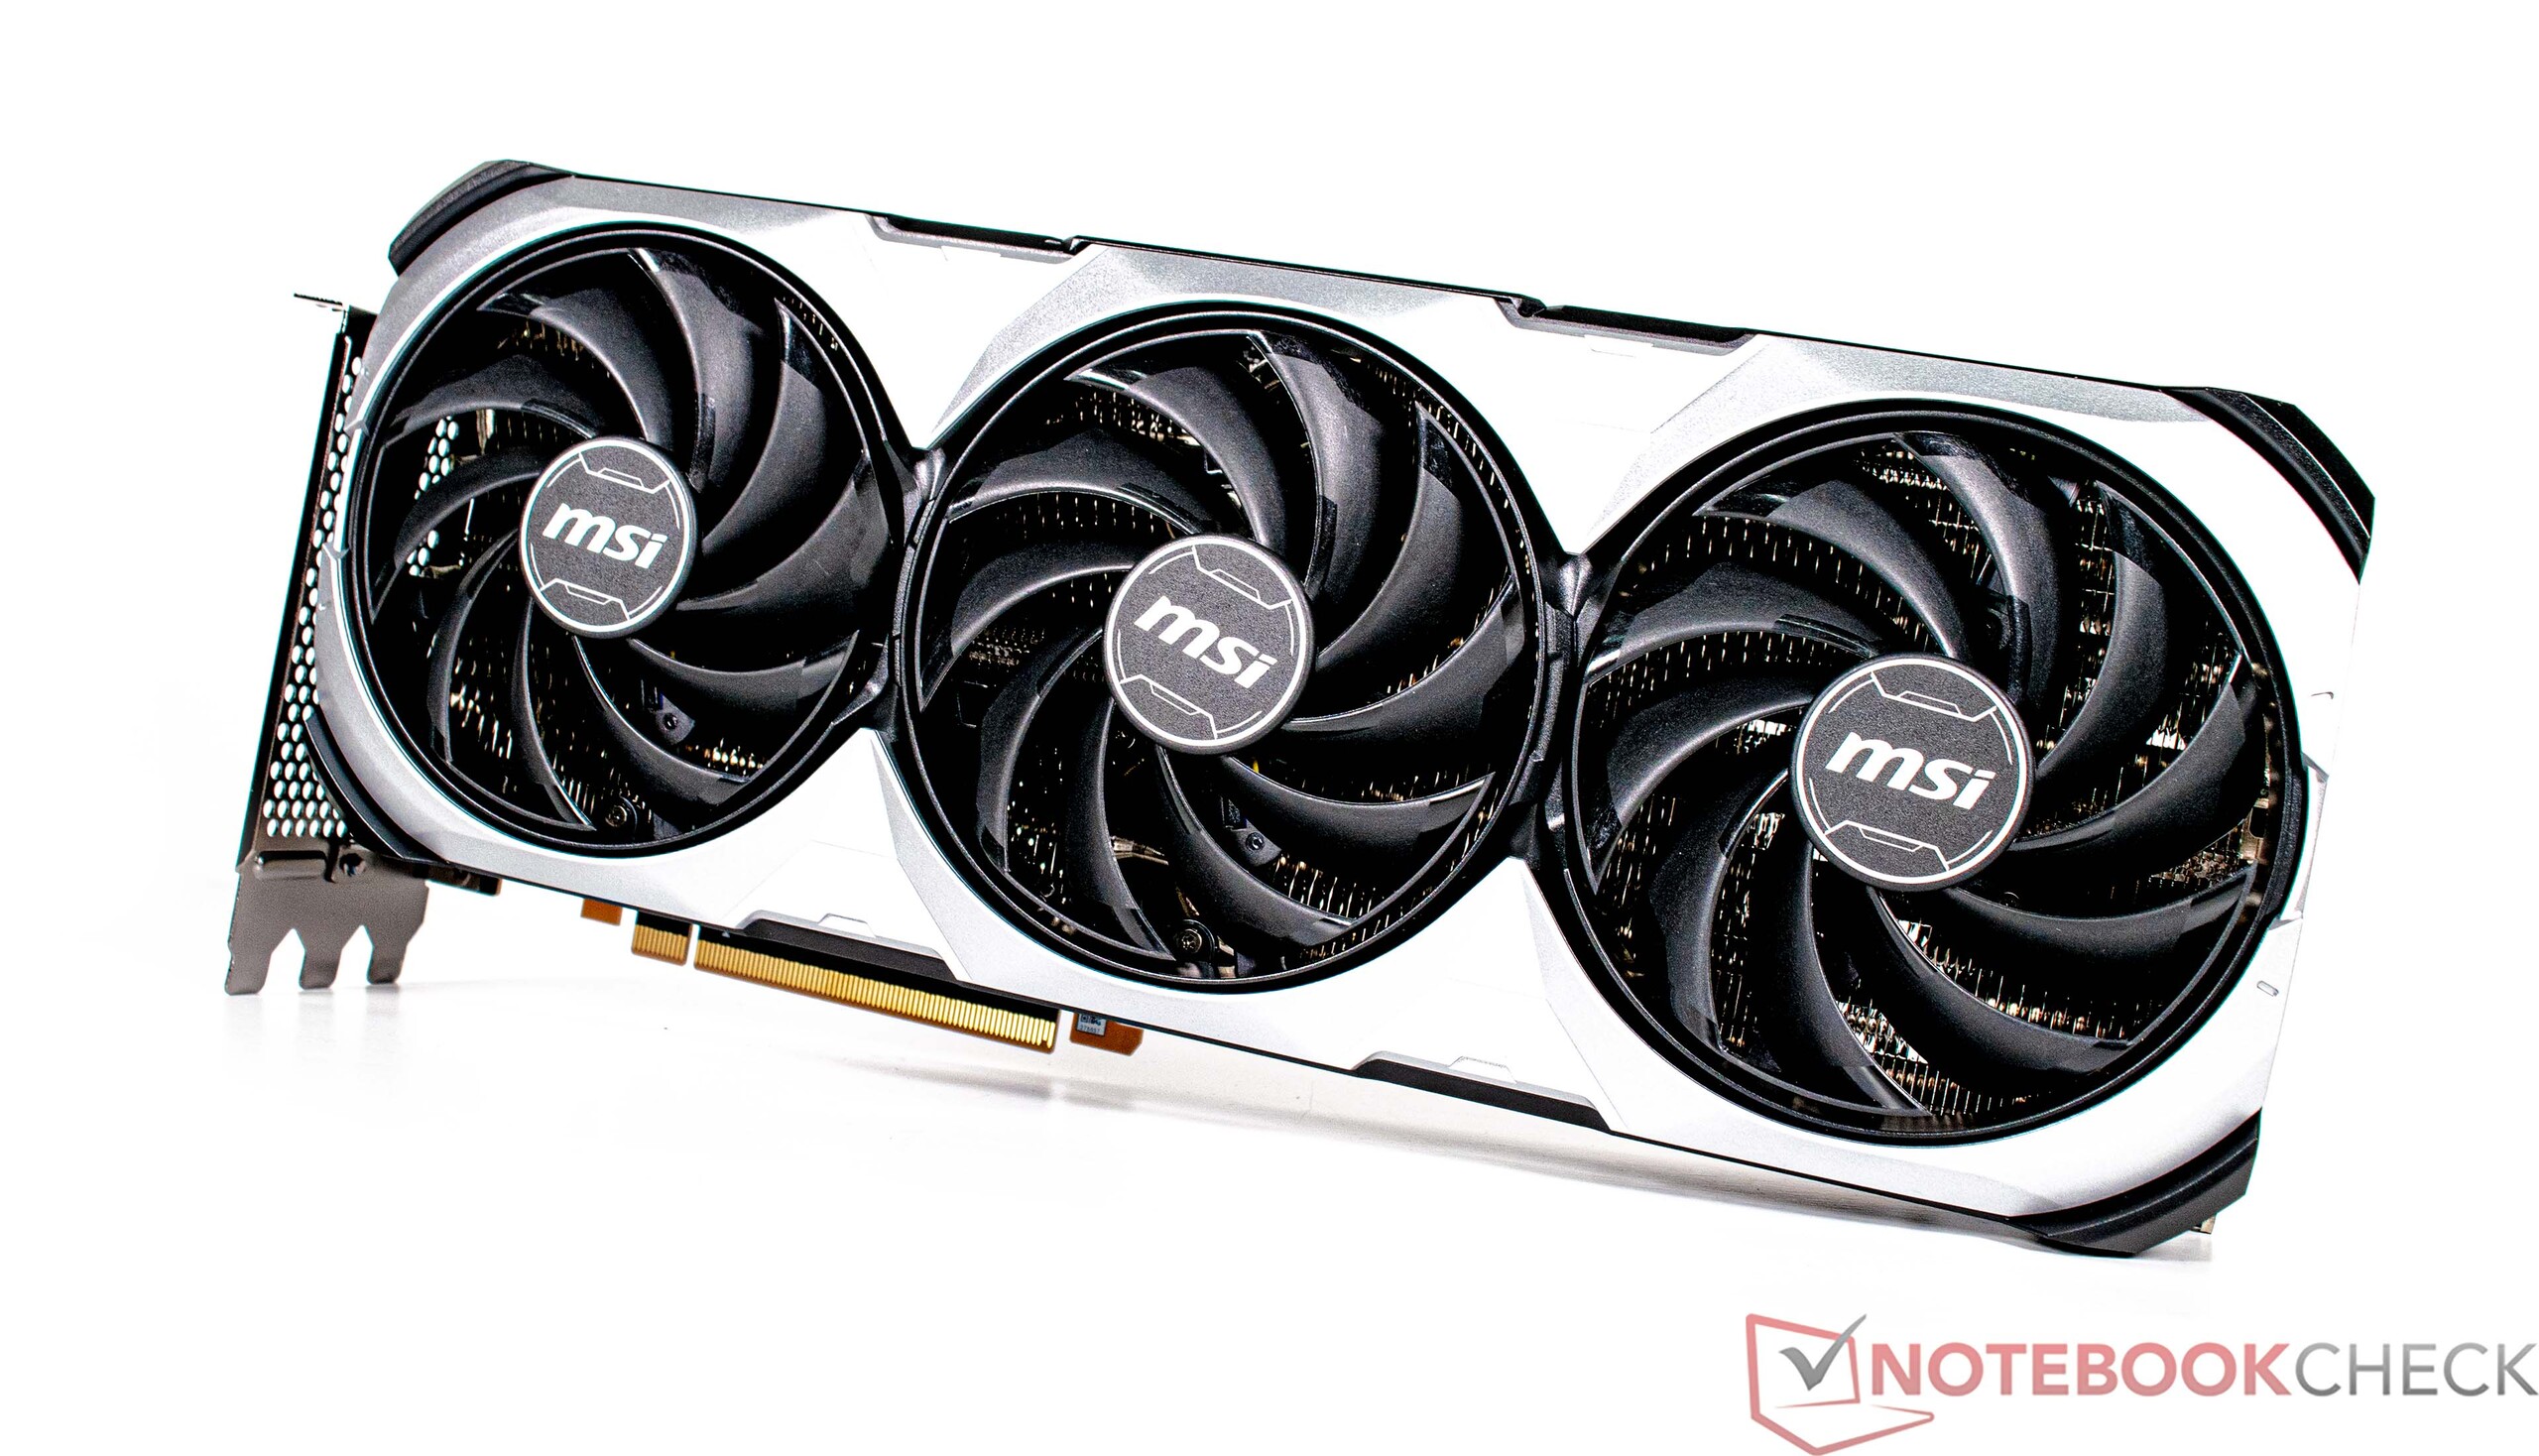
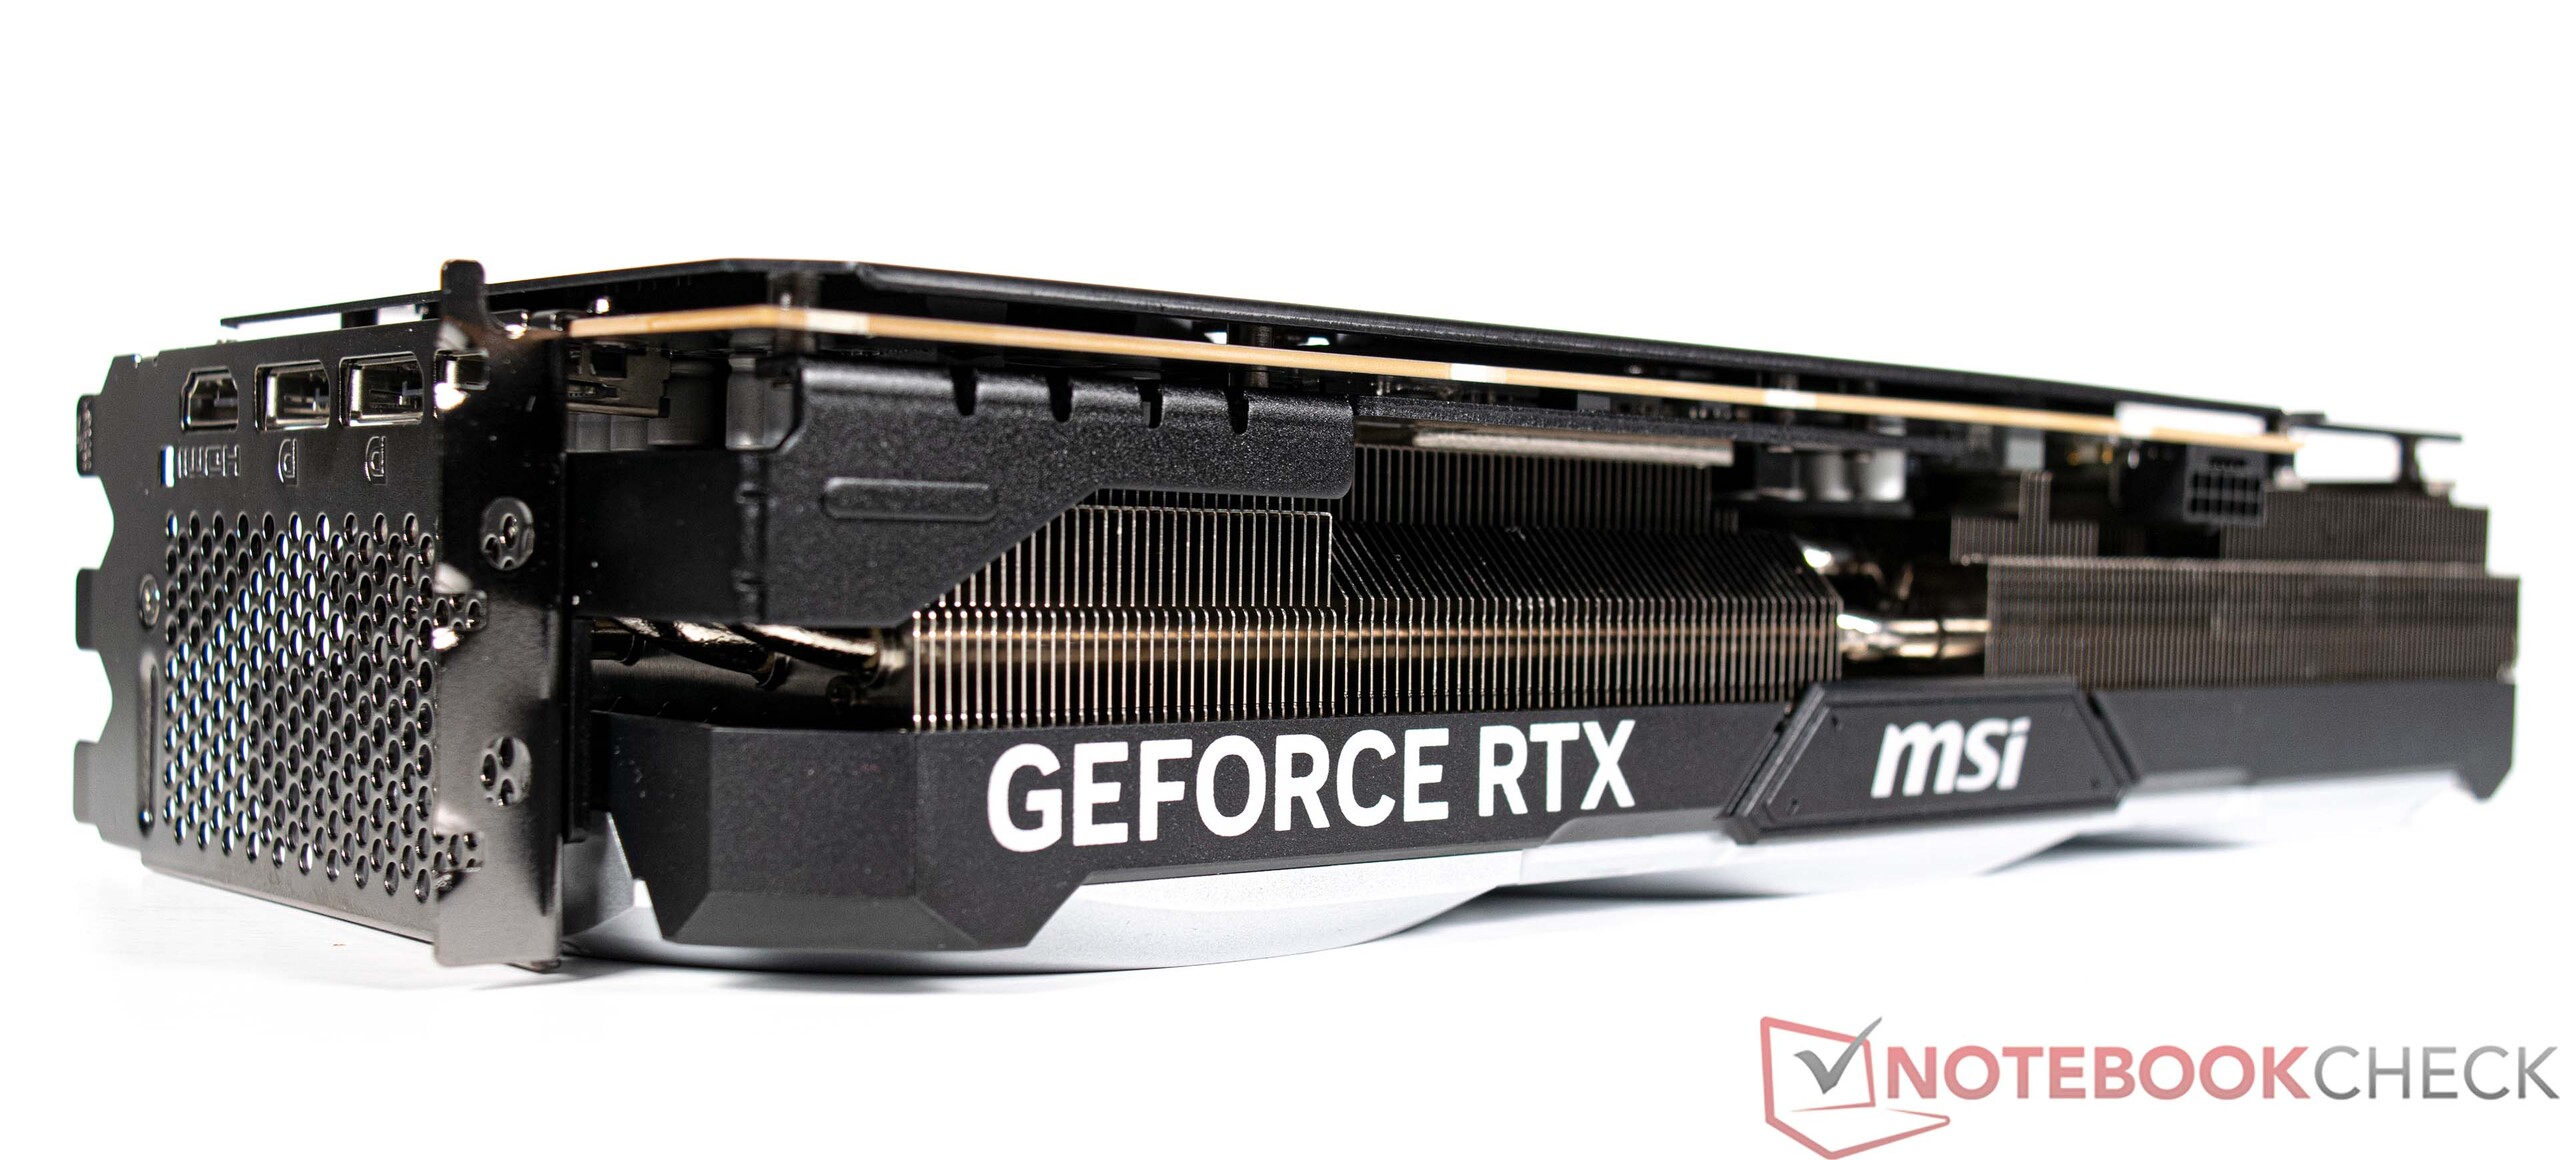
O Corsair 4000D Airflow é fundamentalmente um estojo muito superior com espaço suficiente para abrigar inúmeros componentes. Mesmo o enorme MSI GeForce RTX 4090 VENTUS 3X pode caber facilmente no estojo.

Especificações

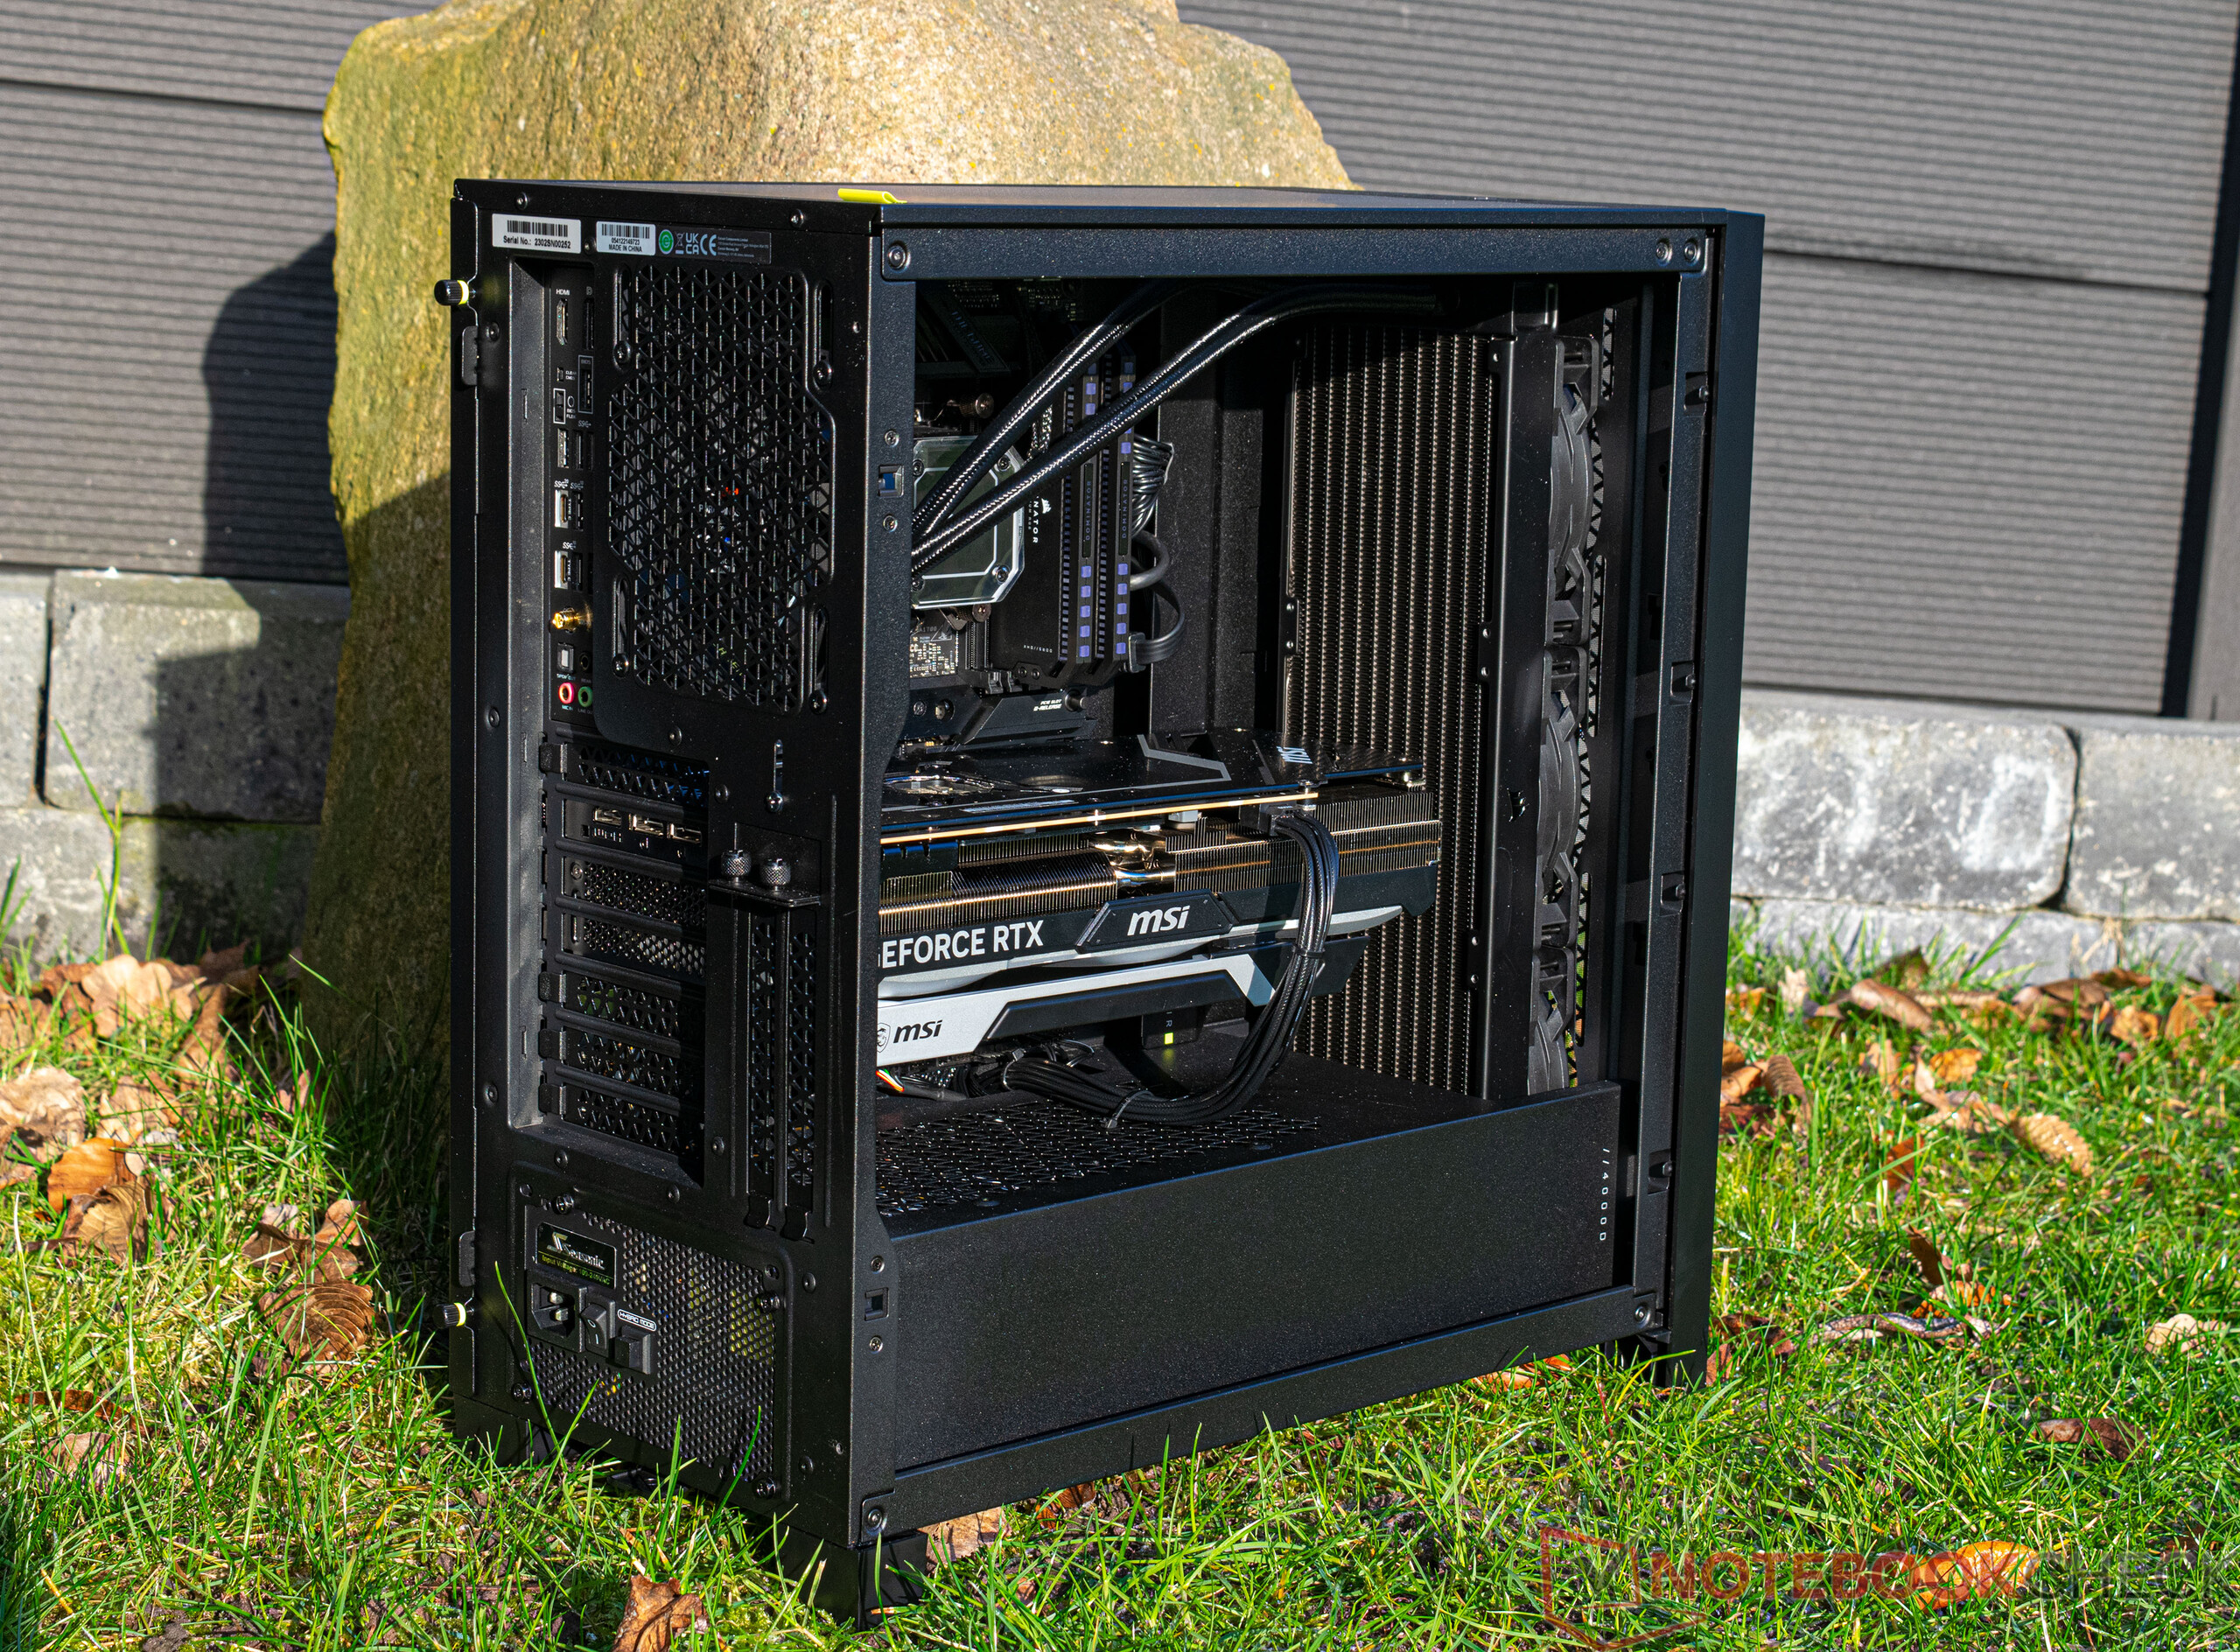
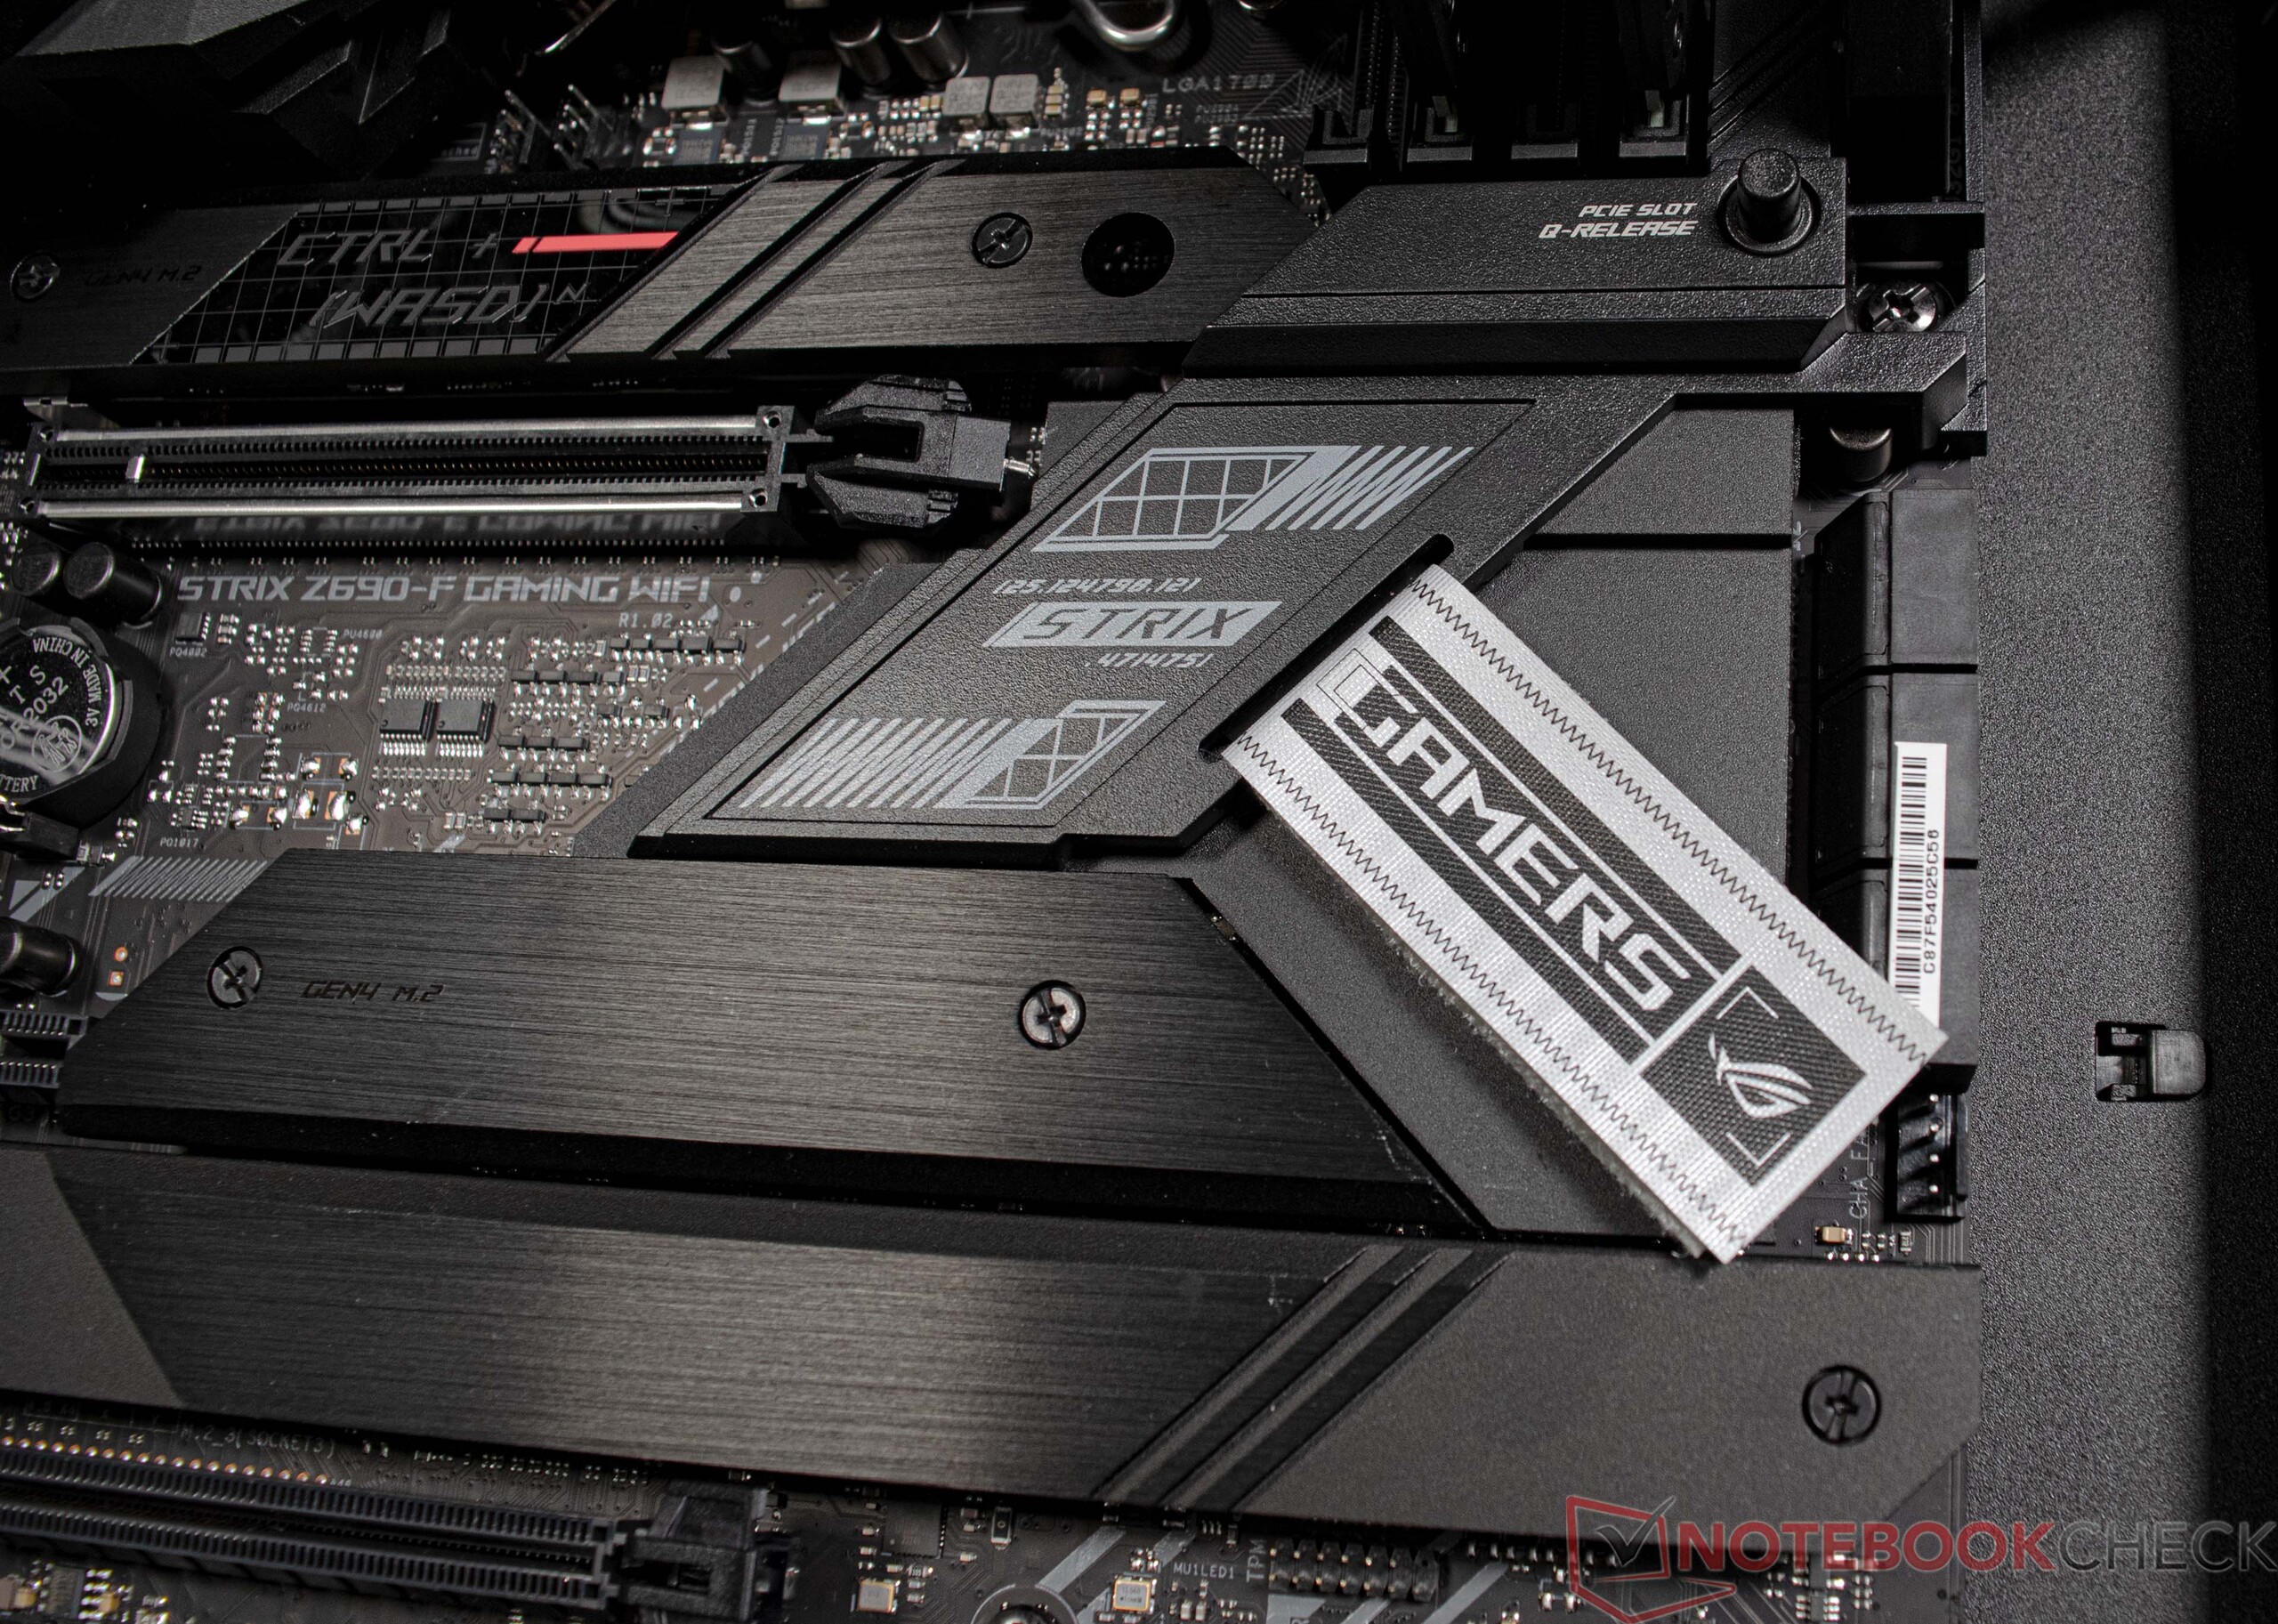
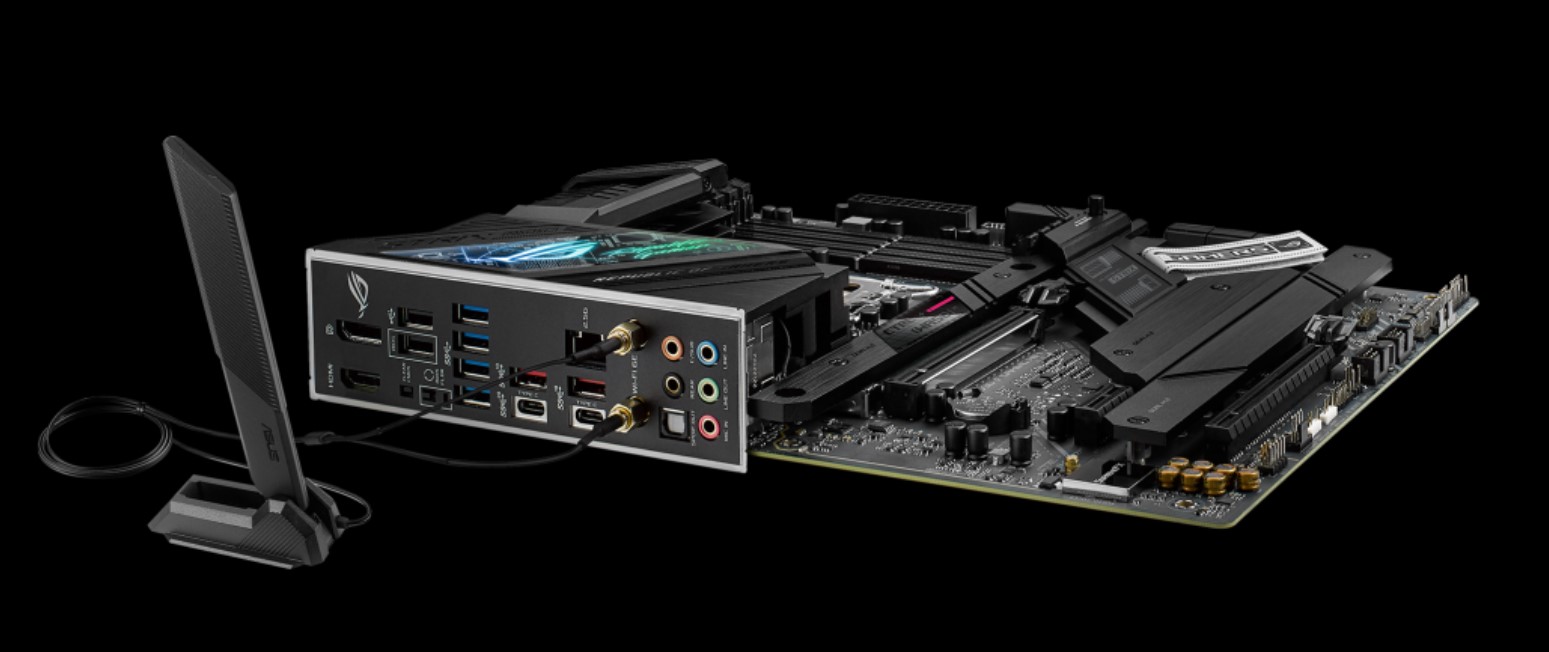
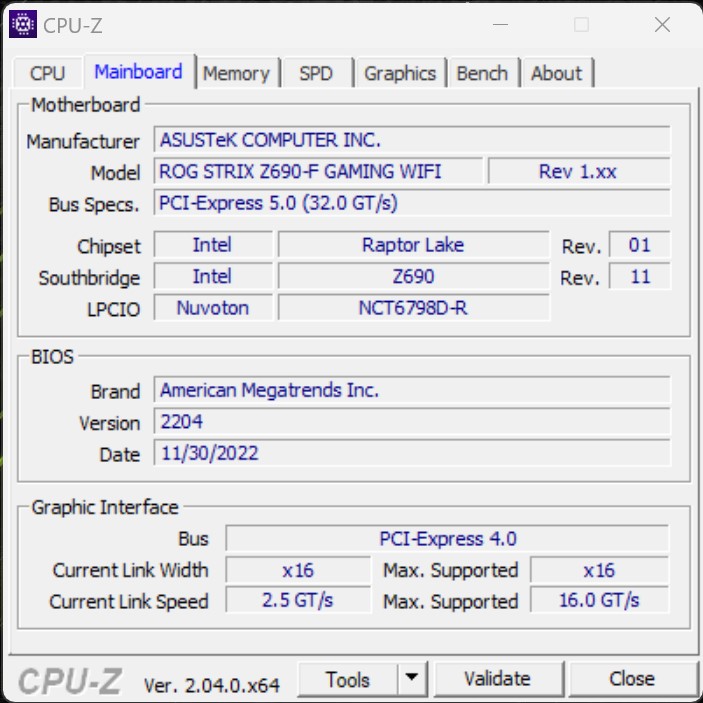
Praticamente nenhum compromisso foi feito em termos de portos de E/S. Por exemplo, a placa-mãe incluída (Asus ROG Strix Z690-F Gaming) oferece uma miríade de interfaces USB e portas modernas para redes. Além disso, ela pode acomodar até quatro SSDs M.2 e 128 GB de RAM DDR5 e vem com 6x conectores SATA 6Gb/s. Os usuários têm acesso direto a uma porta USB-A e uma USB-C no painel frontal do Corsair 4000D Airflow. As saídas do display disponíveis dependem da placa gráfica do sistema. Nossa unidade de revisão tem três DisplayPorts e uma saída HDMI. Se seu sistema não estiver equipado com uma CPU não-F, você pode usar a GPU integrada do processador para saída de vídeo como uma alternativa à placa gráfica dedicada. Há também várias maneiras de dirigir os monitores a partir da placa-mãe.

Asus ROG Strix Z690-F Gaming (fonte: Asus)

Conectividade

Um módulo sem fio Intel Wi-Fi 6E AX211 está instalado no Asus ROG Strix Z690-F Gaming. Não ficamos totalmente impressionados com o desempenho do módulo ao testá-lo com nosso roteador de referência, o Asus ROG Rapture GT-AXE11000. As taxas de transferência registradas estavam abaixo de nossas expectativas quando o sistema foi conectado à rede 5G. Depois de mudar para uma conexão 6G, as taxas de transferência melhoraram substancialmente. Como alternativa, a placa-mãe em nossa unidade de revisão também tem uma interface RJ45 que suporta velocidades de até 2,5 Gbit/s.

Networking
iperf3 receive AXE11000
Average Intel Wi-Fi 6E AX211
  (582 - 1890, n=173)
1393 MBit/s +65%
Minisforum Neptune Series NAD9
Intel Wi-Fi 6E AX210
1318 (663min - 1363max) MBit/s +56%
Intel NUC13 Raptor Canyon
Killer Wi-Fi 6E AX1690i 160MHz
917 (844min - 932max) MBit/s +8%
Minipc Union Ace Magician AMR5
MediaTek RZ608
903 MBit/s +7%
SCHENKER XMG SECTOR, i9 13900K, RTX 4090
Intel Wi-Fi 6E AX211
846 (428min - 891max) MBit/s
Average of class Desktop
  (322 - 1478, n=10, last 2 years)
803 MBit/s -5%
Minisforum EliteMini B550
MediaTek RZ608
430 MBit/s -49%
iperf3 transmit AXE11000
Intel NUC13 Raptor Canyon
Killer Wi-Fi 6E AX1690i 160MHz
1618 (1563min - 1670max) MBit/s +157%
Minisforum Neptune Series NAD9
Intel Wi-Fi 6E AX210
1320 (1165min - 1353max) MBit/s +110%
Average Intel Wi-Fi 6E AX211
  (464 - 1861, n=173)
1248 MBit/s +98%
Minipc Union Ace Magician AMR5
MediaTek RZ608
967 MBit/s +54%
Average of class Desktop
  (188.4 - 1618, n=9, last 2 years)
734 MBit/s +17%
SCHENKER XMG SECTOR, i9 13900K, RTX 4090
Intel Wi-Fi 6E AX211
629 (537min - 692max) MBit/s
Minisforum EliteMini B550
MediaTek RZ608
572 MBit/s -9%
iperf3 transmit AXE11000 6GHz
SCHENKER XMG SECTOR, i9 13900K, RTX 4090
Intel Wi-Fi 6E AX211
1513 (773min - 1554max) MBit/s
Average of class Desktop
  (572 - 1745, n=10, last 2 years)
1409 MBit/s -7%
Average Intel Wi-Fi 6E AX211
  (632 - 1851, n=167)
1379 MBit/s -9%
Minipc Union Ace Magician AMR5
MediaTek RZ608
967 (486min - 993max) MBit/s -36%
Minisforum EliteMini B550
MediaTek RZ608
572 (532min - 680max) MBit/s -62%
iperf3 receive AXE11000 6GHz
SCHENKER XMG SECTOR, i9 13900K, RTX 4090
Intel Wi-Fi 6E AX211
1751 (882min - 1765max) MBit/s
Average Intel Wi-Fi 6E AX211
  (883 - 1857, n=166)
1492 MBit/s -15%
Average of class Desktop
  (430 - 1827, n=9, last 2 years)
1265 MBit/s -28%
Minipc Union Ace Magician AMR5
MediaTek RZ608
903 (450min - 913max) MBit/s -48%
Minisforum EliteMini B550
MediaTek RZ608
430 (379min - 451max) MBit/s -75%
0501001502002503003504004505005506006507007508008509009501000105011001150120012501300135014001450150015501600165017001750Tooltip
SCHENKER XMG SECTOR, i9 13900K, RTX 4090; iperf3 transmit AXE11000 6GHz; iperf 3.1.3: Ø1487 (773-1554)
SCHENKER XMG SECTOR, i9 13900K, RTX 4090; iperf3 receive AXE11000 6GHz; iperf 3.1.3: Ø1721 (882-1765)
SCHENKER XMG SECTOR, i9 13900K, RTX 4090; iperf3 receive AXE11000; iperf 3.1.3: Ø832 (428-891)
SCHENKER XMG SECTOR, i9 13900K, RTX 4090; iperf3 transmit AXE11000; iperf 3.1.3: Ø629 (537-692)

Acessórios

Na caixa, além do próprio computador, você encontrará vários acessórios da placa-mãe, como cabos e antenas Wi-Fi, assim como cabos não utilizados pertencentes à fonte de alimentação, que é totalmente modular.

Manutenção

Manter o XMG SECTOR Intel é uma brisa. Os painéis laterais do Corsair 4000D Airflow podem ser facilmente removidos, permitindo a limpeza rápida e conveniente de qualquer poeira nos ventiladores. O Corsair iCUE H150i Elite Capellix incluído é uma solução de resfriamento AIO de alto desempenho que não requer muita manutenção.

Garantia

A Schenker fornece uma garantia básica de 36 meses com serviço de coleta e devolução em cada XMG SECTOR Intel. Não há, entretanto, opção de estender o período de garantia durante o processo de pedido.

Desempenho - a segunda CPU Intel mais rápida encontra a GPU mais rápida

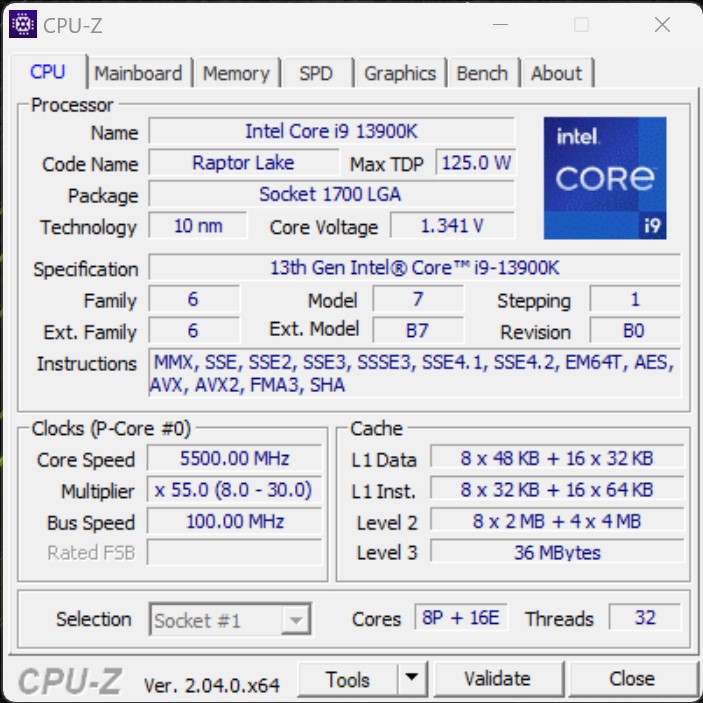
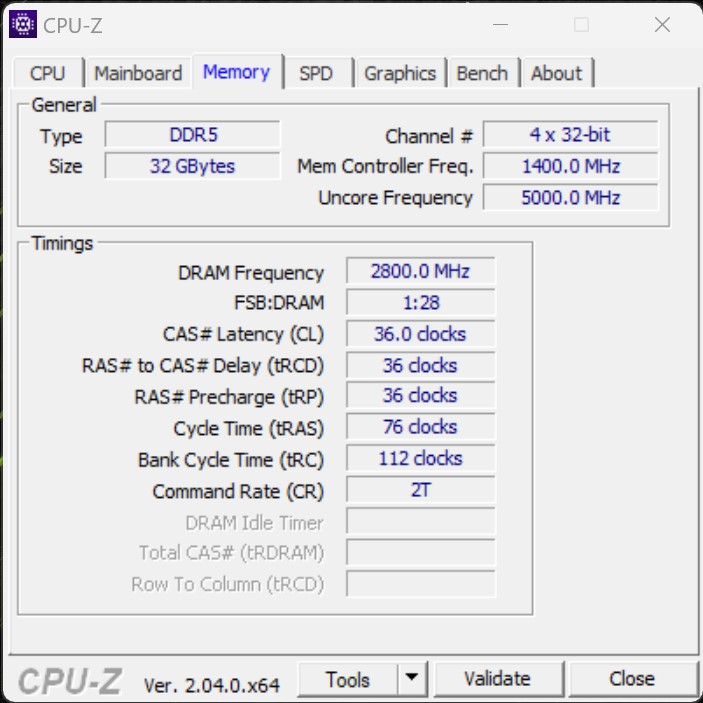
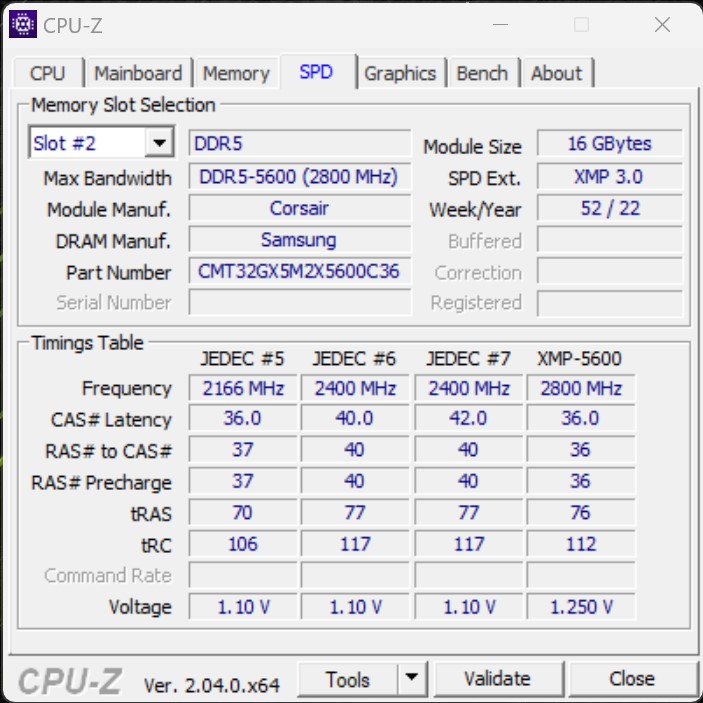
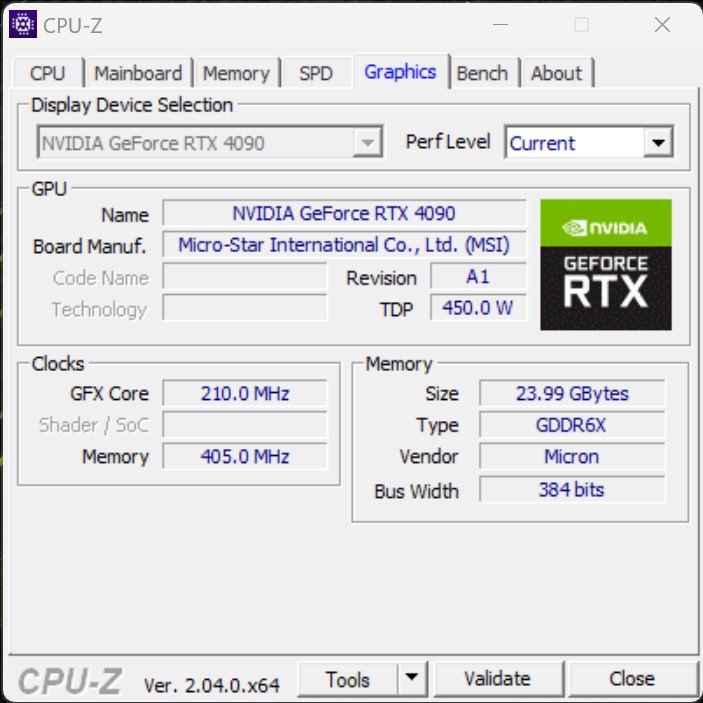
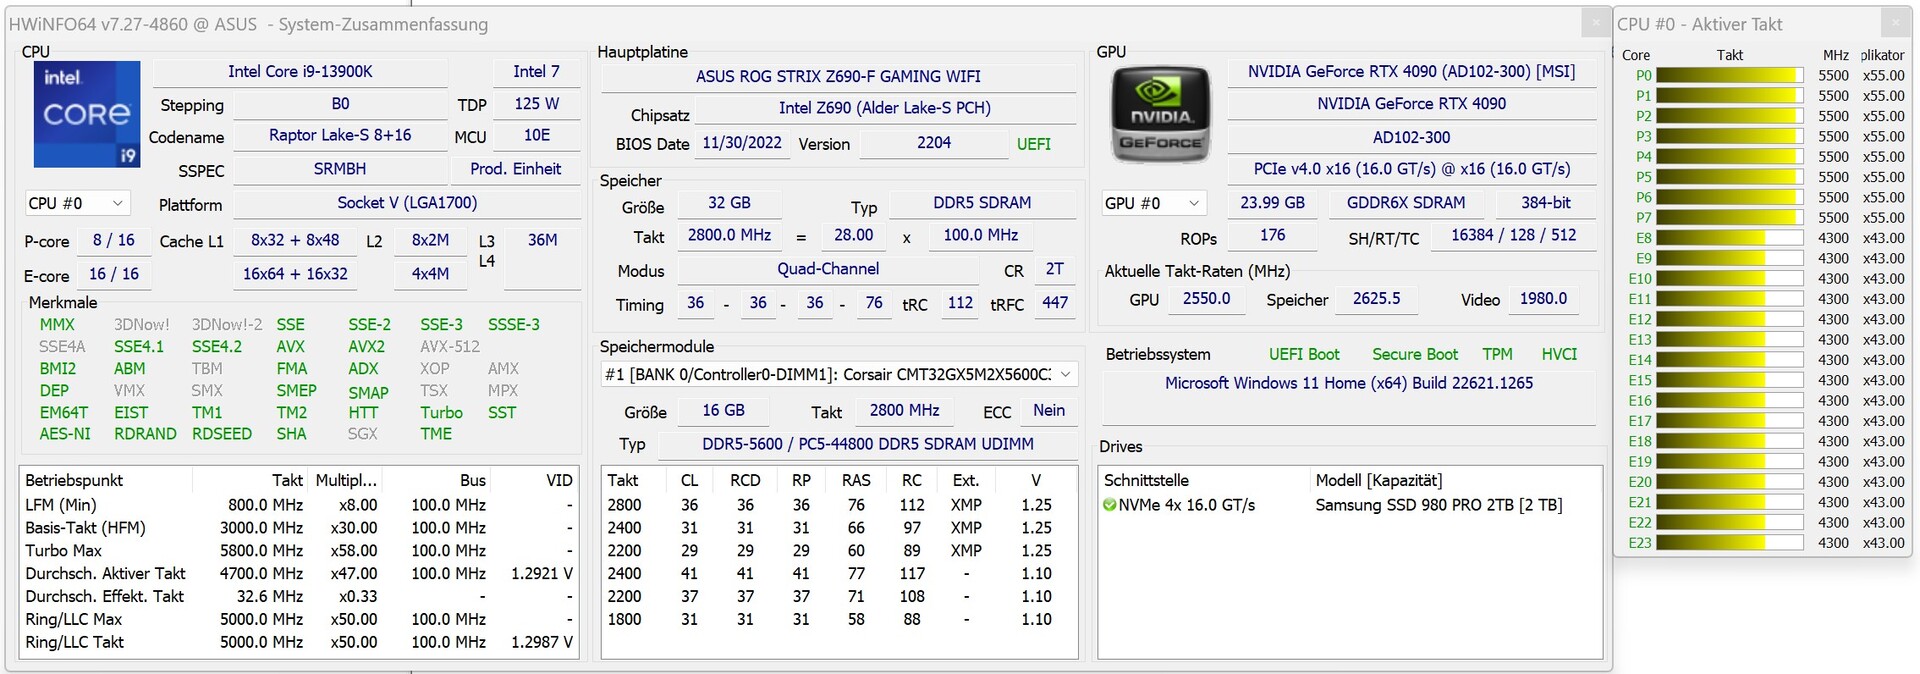
A Intel XMG SECTOR nesta revisão está equipada com a segunda CPU de jogos Intel mais rápida - a Núcleo i9-13900K. O processador é flanqueado por 32 GB de memória e um SSD com uma enorme capacidade de 2 TB, o que significa que o sistema tem armazenamento suficiente para acomodar jogos de PC com grande tamanho de instalação. A placa gráfica incluída é uma MSI GeForce RTX 4090 VENTUS 3X, que é a GPU mais rápida para o mercado consumidor no momento.

CPU-Z
CPU-Z
CPU-Z
CPU-Z
CPU-Z
CPU-Z
GPU-Z
GPU-Z
GPU-Z
HWiNFO

Condições de teste

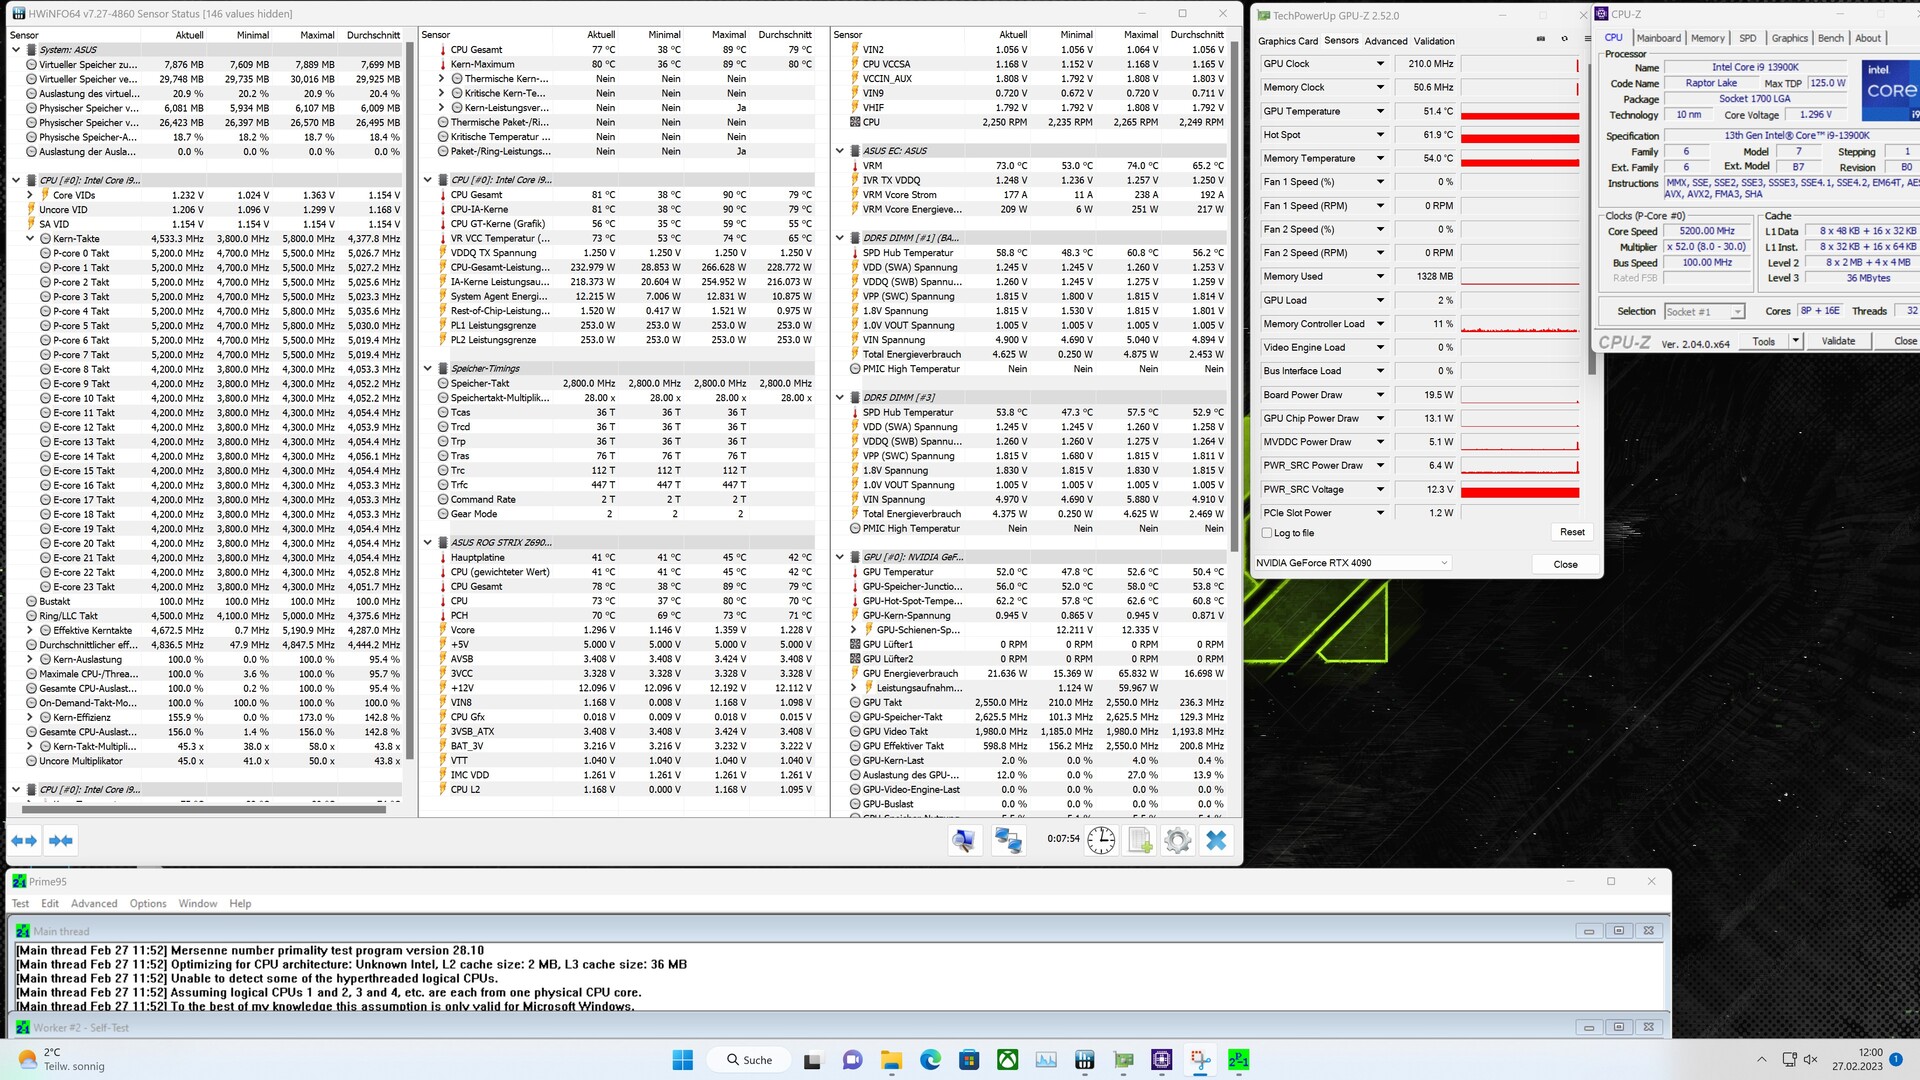
Todos os testes relacionados ao desempenho foram realizados com o perfil de potência definido para "Alto desempenho", para que possamos obter os melhores resultados possíveis. Além disso, o fabricante já desativou todas as restrições ao uso de energia da CPU na BIOS. Como resultado, o Núcleo i9-13900K não estava limitado a uma potência máxima de 253 watts (o PL2 da CPU). Só mudamos para um plano de potência diferente ao medir o consumo de energia e os níveis de ruído. Consulte nesta página para saber mais sobre nossos critérios de teste.

Processador

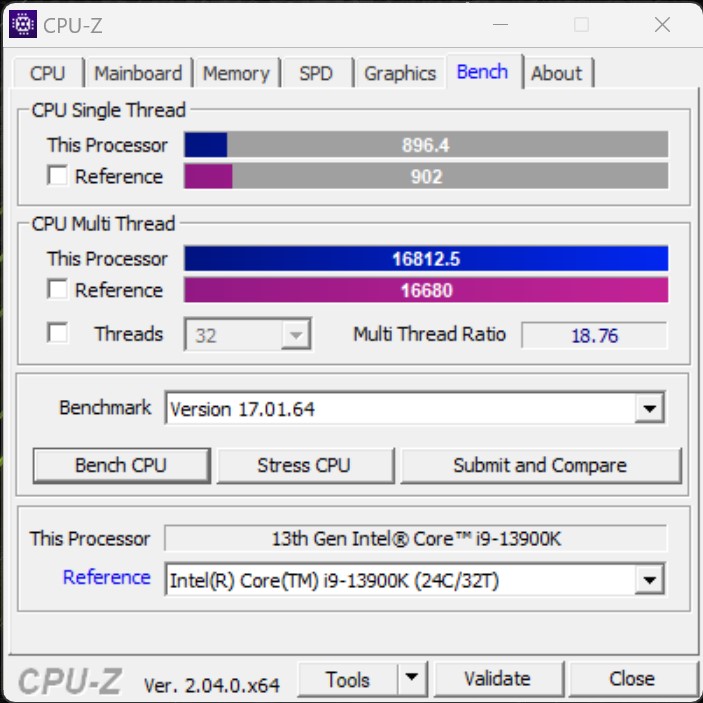
Nossa Intel XMG SECTOR é alimentada por um Núcleo i9-13900Kque é a segunda CPU de jogos mais rápida da Intel no momento. Os resultados produzidos pela unidade de revisão são tão bons quanto se poderia esperar. É o pescoço e pescoço com os outros dispositivos em nossa comparação. Quando se trata de classificação de desempenho, a diferença entre o XMG SECTOR e o sistema de teste com especificações semelhantes é extremamente pequena em apenas 2% e quase pode ser atribuída a tolerâncias de medição.

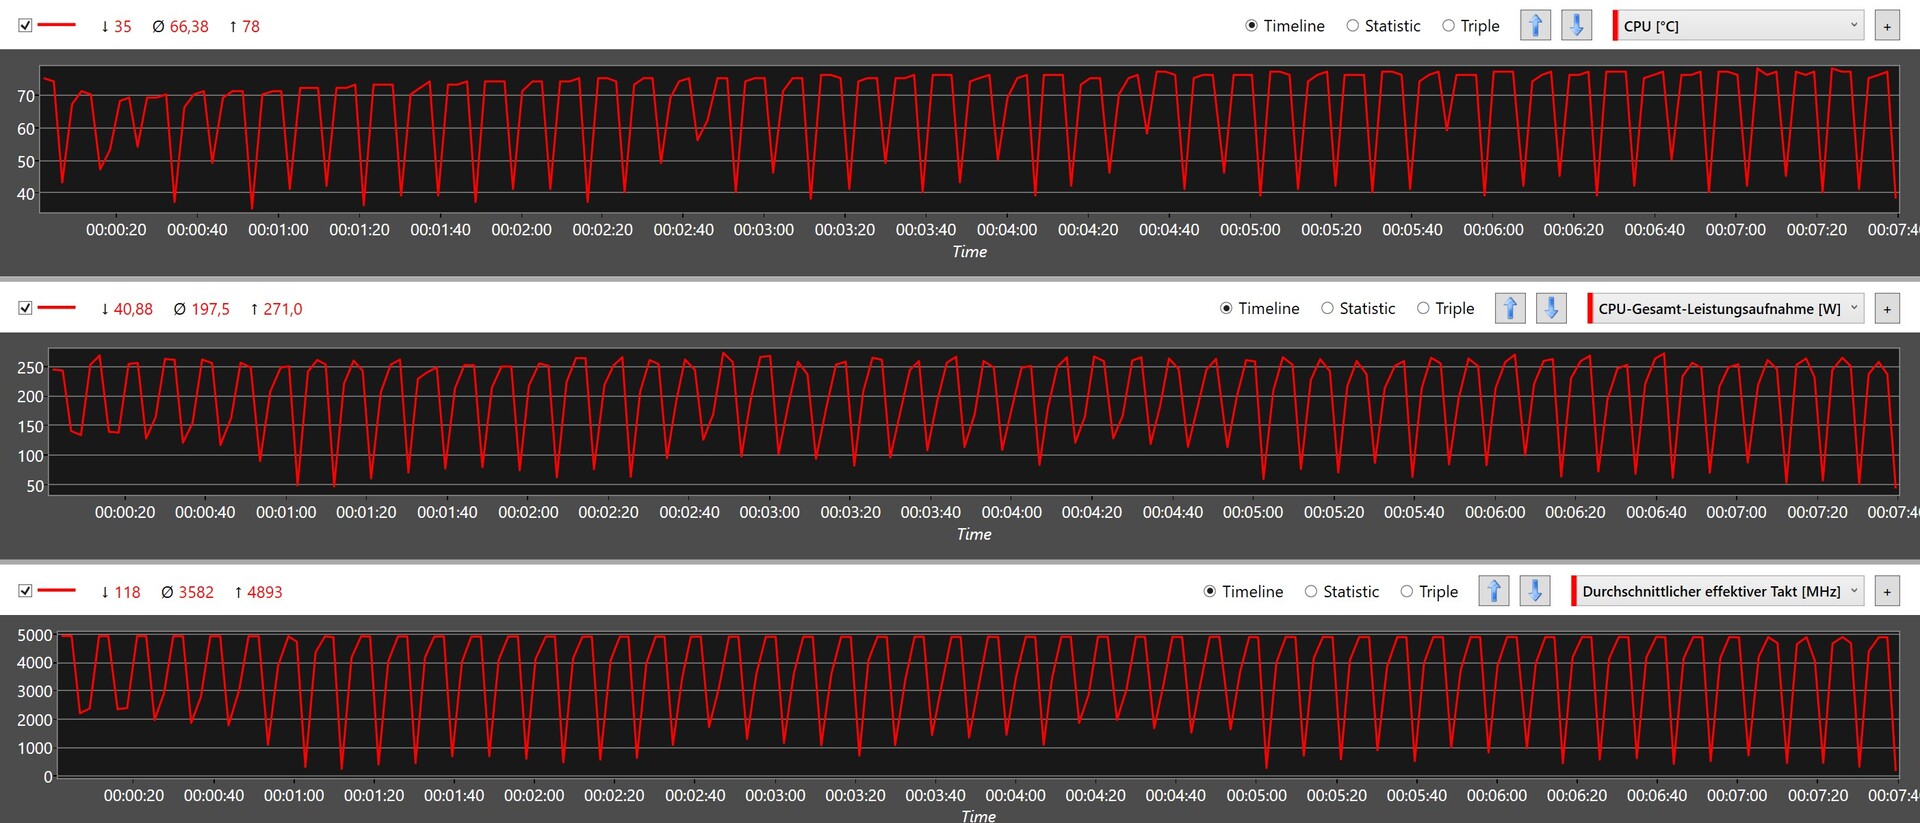
O processador não está sujeito a nenhum limite de potência porque todas as restrições foram levantadas. Conseqüentemente, o desempenho da CPU é limitado pela temperatura, que anda de mãos dadas com o resfriador AIO instalado.

Você pode encontrar mais referências de processadores em nesta página.

Cinebench R15
Cinebench R15
Cinebench R20
Cinebench R20
Cinebench R23
Cinebench R23
Performance Rating - Percent
Intel Core i9-13900K, Intel Core i9-13900K
i9-13900K, 3000 MHz
74.1 pt
SCHENKER XMG SECTOR, i9 13900K, RTX 4090, Intel Core i9-13900K
i9-13900K, 3000 MHz
72.9 pt
NVIDIA GeForce RTX 3090 Founders Edition, AMD Ryzen 9 7950X
R9 7950X, 4500 MHz
72.7 pt
Intel NUC13 Raptor Canyon, Intel Core i9-13900K
i9-13900K, 3000 MHz
69.4 pt
AMD Ryzen 9 7900X, AMD Ryzen 9 7900X
R9 7900X, 4700 MHz
67.7 pt
Corsair One i300, Intel Core i9-12900K
i9-12900K, 3200 MHz
63 pt
Intel Core i9-12900K, Intel Core i9-12900K
i9-12900K, 3200 MHz
62.9 pt
Intel Core i5-13600K, Intel Core i5-13600K
i5-13600K, 3500 MHz
61.8 pt
Intel Dragon Canyon NUC - RTX 3060, Intel Core i9-12900
i9-12900, 2400 MHz
53.9 pt
Minisforum Neptune Series NAD9, Intel Core i9-12900H
i9-12900H, 1800 MHz
49 pt
Cinebench R15
CPU Single 64Bit
NVIDIA GeForce RTX 3090 Founders Edition, AMD Ryzen 9 7950X
R9 7950X, 4500 MHz
328 Points +3%
Intel Core i9-13900K, Intel Core i9-13900K
i9-13900K, 3000 MHz
327 Points +3%
AMD Ryzen 9 7900X, AMD Ryzen 9 7900X
R9 7900X, 4700 MHz
324 Points +2%
Intel NUC13 Raptor Canyon, Intel Core i9-13900K
i9-13900K, 3000 MHz
319 Points +1%
SCHENKER XMG SECTOR, i9 13900K, RTX 4090, Intel Core i9-13900K
i9-13900K, 3000 MHz
317 Points
Corsair One i300, Intel Core i9-12900K
i9-12900K, 3200 MHz
292 Points -8%
Intel Core i5-13600K, Intel Core i5-13600K
i5-13600K, 3500 MHz
289 Points -9%
Intel Core i9-12900K, Intel Core i9-12900K
i9-12900K, 3200 MHz
286 Points -10%
Intel Dragon Canyon NUC - RTX 3060, Intel Core i9-12900
i9-12900, 2400 MHz
262 Points -17%
Minisforum Neptune Series NAD9, Intel Core i9-12900H
i9-12900H, 1800 MHz
247 Points -22%
CPU Multi 64Bit
NVIDIA GeForce RTX 3090 Founders Edition, AMD Ryzen 9 7950X
R9 7950X, 4500 MHz
6209 Points +4%
Intel Core i9-13900K, Intel Core i9-13900K
i9-13900K, 3000 MHz
6191 Points +4%
SCHENKER XMG SECTOR, i9 13900K, RTX 4090, Intel Core i9-13900K
i9-13900K, 3000 MHz
5975 Points
Intel NUC13 Raptor Canyon, Intel Core i9-13900K
i9-13900K, 3000 MHz
5321 Points -11%
AMD Ryzen 9 7900X, AMD Ryzen 9 7900X
R9 7900X, 4700 MHz
4856 Points -19%
Intel Core i9-12900K, Intel Core i9-12900K
i9-12900K, 3200 MHz
4057 Points -32%
Intel Core i5-13600K, Intel Core i5-13600K
i5-13600K, 3500 MHz
3643 Points -39%
Corsair One i300, Intel Core i9-12900K
i9-12900K, 3200 MHz
3473 Points -42%
Intel Dragon Canyon NUC - RTX 3060, Intel Core i9-12900
i9-12900, 2400 MHz
3299 Points -45%
Minisforum Neptune Series NAD9, Intel Core i9-12900H
i9-12900H, 1800 MHz
2067 Points -65%
Cinebench R20
CPU (Single Core)
Intel NUC13 Raptor Canyon, Intel Core i9-13900K
i9-13900K, 3000 MHz
853 Points +1%
SCHENKER XMG SECTOR, i9 13900K, RTX 4090, Intel Core i9-13900K
i9-13900K, 3000 MHz
846 Points
Intel Core i9-13900K, Intel Core i9-13900K
i9-13900K, 3000 MHz
828 Points -2%
NVIDIA GeForce RTX 3090 Founders Edition, AMD Ryzen 9 7950X
R9 7950X, 4500 MHz
795 Points -6%
AMD Ryzen 9 7900X, AMD Ryzen 9 7900X
R9 7900X, 4700 MHz
786 Points -7%
Corsair One i300, Intel Core i9-12900K
i9-12900K, 3200 MHz
777 Points -8%
Intel Core i5-13600K, Intel Core i5-13600K
i5-13600K, 3500 MHz
775 Points -8%
Intel Core i9-12900K, Intel Core i9-12900K
i9-12900K, 3200 MHz
766 Points -9%
Intel Dragon Canyon NUC - RTX 3060, Intel Core i9-12900
i9-12900, 2400 MHz
703 Points -17%
Minisforum Neptune Series NAD9, Intel Core i9-12900H
i9-12900H, 1800 MHz
682 Points -19%
CPU (Multi Core)
Intel Core i9-13900K, Intel Core i9-13900K
i9-13900K, 3000 MHz
15181 Points +3%
NVIDIA GeForce RTX 3090 Founders Edition, AMD Ryzen 9 7950X
R9 7950X, 4500 MHz
14786 Points 0%
SCHENKER XMG SECTOR, i9 13900K, RTX 4090, Intel Core i9-13900K
i9-13900K, 3000 MHz
14739 Points
Intel NUC13 Raptor Canyon, Intel Core i9-13900K
i9-13900K, 3000 MHz
13415 Points -9%
AMD Ryzen 9 7900X, AMD Ryzen 9 7900X
R9 7900X, 4700 MHz
11563 Points -22%
Intel Core i9-12900K, Intel Core i9-12900K
i9-12900K, 3200 MHz
10240 Points -31%
Corsair One i300, Intel Core i9-12900K
i9-12900K, 3200 MHz
9630 Points -35%
Intel Core i5-13600K, Intel Core i5-13600K
i5-13600K, 3500 MHz
9265 Points -37%
Intel Dragon Canyon NUC - RTX 3060, Intel Core i9-12900
i9-12900, 2400 MHz
7179 Points -51%
Minisforum Neptune Series NAD9, Intel Core i9-12900H
i9-12900H, 1800 MHz
4941 Points -66%
Cinebench R23
Single Core
Intel Core i9-13900K, Intel Core i9-13900K
i9-13900K, 3000 MHz
2267 Points +3%
SCHENKER XMG SECTOR, i9 13900K, RTX 4090, Intel Core i9-13900K
i9-13900K, 3000 MHz
2210 Points
Intel NUC13 Raptor Canyon, Intel Core i9-13900K
i9-13900K, 3000 MHz
2203 Points 0%
NVIDIA GeForce RTX 3090 Founders Edition, AMD Ryzen 9 7950X
R9 7950X, 4500 MHz
2045 Points -7%
AMD Ryzen 9 7900X, AMD Ryzen 9 7900X
R9 7900X, 4700 MHz
2039 Points -8%
Corsair One i300, Intel Core i9-12900K
i9-12900K, 3200 MHz
2011 Points -9%
Intel Core i5-13600K, Intel Core i5-13600K
i5-13600K, 3500 MHz
2010 Points -9%
Intel Core i9-12900K, Intel Core i9-12900K
i9-12900K, 3200 MHz
1998 Points -10%
Intel Dragon Canyon NUC - RTX 3060, Intel Core i9-12900
i9-12900, 2400 MHz
1825 Points -17%
Minisforum Neptune Series NAD9, Intel Core i9-12900H
i9-12900H, 1800 MHz
1743 Points -21%
Multi Core
Intel Core i9-13900K, Intel Core i9-13900K
i9-13900K, 3000 MHz
40103 Points +5%
SCHENKER XMG SECTOR, i9 13900K, RTX 4090, Intel Core i9-13900K
i9-13900K, 3000 MHz
38314 Points
NVIDIA GeForce RTX 3090 Founders Edition, AMD Ryzen 9 7950X
R9 7950X, 4500 MHz
37792 Points -1%
Intel NUC13 Raptor Canyon, Intel Core i9-13900K
i9-13900K, 3000 MHz
32592 Points -15%
AMD Ryzen 9 7900X, AMD Ryzen 9 7900X
R9 7900X, 4700 MHz
29480 Points -23%
Intel Core i9-12900K, Intel Core i9-12900K
i9-12900K, 3200 MHz
27005 Points -30%
Corsair One i300, Intel Core i9-12900K
i9-12900K, 3200 MHz
25245 Points -34%
Intel Core i5-13600K, Intel Core i5-13600K
i5-13600K, 3500 MHz
24268 Points -37%
Intel Dragon Canyon NUC - RTX 3060, Intel Core i9-12900
i9-12900, 2400 MHz
18628 Points -51%
Minisforum Neptune Series NAD9, Intel Core i9-12900H
i9-12900H, 1800 MHz
13320 Points -65%
Cinebench R11.5
CPU Single 64Bit
Intel Core i9-13900K, Intel Core i9-13900K
i9-13900K, 3000 MHz
3.92 Points +3%
NVIDIA GeForce RTX 3090 Founders Edition, AMD Ryzen 9 7950X
R9 7950X, 4500 MHz
3.86 Points +1%
AMD Ryzen 9 7900X, AMD Ryzen 9 7900X
R9 7900X, 4700 MHz
3.83 Points +1%
SCHENKER XMG SECTOR, i9 13900K, RTX 4090, Intel Core i9-13900K
i9-13900K, 3000 MHz
3.81 Points
Intel NUC13 Raptor Canyon, Intel Core i9-13900K
i9-13900K, 3000 MHz
3.8 Points 0%
Corsair One i300, Intel Core i9-12900K
i9-12900K, 3200 MHz
3.5 Points -8%
Intel Core i9-12900K, Intel Core i9-12900K
i9-12900K, 3200 MHz
3.49 Points -8%
Intel Core i5-13600K, Intel Core i5-13600K
i5-13600K, 3500 MHz
3.48 Points -9%
Intel Dragon Canyon NUC - RTX 3060, Intel Core i9-12900
i9-12900, 2400 MHz
3.16 Points -17%
Minisforum Neptune Series NAD9, Intel Core i9-12900H
i9-12900H, 1800 MHz
2.86 Points -25%
CPU Multi 64Bit
Intel Core i9-13900K, Intel Core i9-13900K
i9-13900K, 3000 MHz
70.78 Points +5%
NVIDIA GeForce RTX 3090 Founders Edition, AMD Ryzen 9 7950X
R9 7950X, 4500 MHz
68.61 Points +2%
SCHENKER XMG SECTOR, i9 13900K, RTX 4090, Intel Core i9-13900K
i9-13900K, 3000 MHz
67.42 Points
Intel NUC13 Raptor Canyon, Intel Core i9-13900K
i9-13900K, 3000 MHz
62.2 Points -8%
AMD Ryzen 9 7900X, AMD Ryzen 9 7900X
R9 7900X, 4700 MHz
54.51 Points -19%
Intel Core i9-12900K, Intel Core i9-12900K
i9-12900K, 3200 MHz
47.06 Points -30%
Corsair One i300, Intel Core i9-12900K
i9-12900K, 3200 MHz
44.18 Points -34%
Intel Core i5-13600K, Intel Core i5-13600K
i5-13600K, 3500 MHz
42.38 Points -37%
Intel Dragon Canyon NUC - RTX 3060, Intel Core i9-12900
i9-12900, 2400 MHz
38.96 Points -42%
Minisforum Neptune Series NAD9, Intel Core i9-12900H
i9-12900H, 1800 MHz
25.96 Points -61%
Cinebench R10
Rendering Single CPUs 64Bit
Intel Core i9-13900K, Intel Core i9-13900K
i9-13900K, 3000 MHz
18236 Points +5%
Intel NUC13 Raptor Canyon, Intel Core i9-13900K
i9-13900K, 3000 MHz
17761 Points +2%
SCHENKER XMG SECTOR, i9 13900K, RTX 4090, Intel Core i9-13900K
i9-13900K, 3000 MHz
17418 Points
Corsair One i300, Intel Core i9-12900K
i9-12900K, 3200 MHz
16397 Points -6%
AMD Ryzen 9 7900X, AMD Ryzen 9 7900X
R9 7900X, 4700 MHz
16338 Points -6%
NVIDIA GeForce RTX 3090 Founders Edition, AMD Ryzen 9 7950X
R9 7950X, 4500 MHz
16260 Points -7%
Intel Core i5-13600K, Intel Core i5-13600K
i5-13600K, 3500 MHz
16235 Points -7%
Intel Core i9-12900K, Intel Core i9-12900K
i9-12900K, 3200 MHz
16144 Points -7%
Intel Dragon Canyon NUC - RTX 3060, Intel Core i9-12900
i9-12900, 2400 MHz
14610 Points -16%
Minisforum Neptune Series NAD9, Intel Core i9-12900H
i9-12900H, 1800 MHz
12846 Points -26%
Rendering Multiple CPUs 64Bit
Intel NUC13 Raptor Canyon, Intel Core i9-13900K
i9-13900K, 3000 MHz
138969 Points +3%
SCHENKER XMG SECTOR, i9 13900K, RTX 4090, Intel Core i9-13900K
i9-13900K, 3000 MHz
134838 Points
Intel Core i9-13900K, Intel Core i9-13900K
i9-13900K, 3000 MHz
132000 Points -2%
NVIDIA GeForce RTX 3090 Founders Edition, AMD Ryzen 9 7950X
R9 7950X, 4500 MHz
130289 Points -3%
AMD Ryzen 9 7900X, AMD Ryzen 9 7900X
R9 7900X, 4700 MHz
121250 Points -10%
Corsair One i300, Intel Core i9-12900K
i9-12900K, 3200 MHz
112893 Points -16%
Intel Core i9-12900K, Intel Core i9-12900K
i9-12900K, 3200 MHz
112749 Points -16%
Intel Core i5-13600K, Intel Core i5-13600K
i5-13600K, 3500 MHz
110412 Points -18%
Intel Dragon Canyon NUC - RTX 3060, Intel Core i9-12900
i9-12900, 2400 MHz
107565 Points -20%
Minisforum Neptune Series NAD9, Intel Core i9-12900H
i9-12900H, 1800 MHz
77409 Points -43%
Blender - v2.79 BMW27 CPU
Minisforum Neptune Series NAD9, Intel Core i9-12900H
i9-12900H, 1800 MHz
273 Seconds * -225%
Intel Dragon Canyon NUC - RTX 3060, Intel Core i9-12900
i9-12900, 2400 MHz
262.7 Seconds * -213%
Intel Core i5-13600K, Intel Core i5-13600K
i5-13600K, 3500 MHz
135 Seconds * -61%
Corsair One i300, Intel Core i9-12900K
i9-12900K, 3200 MHz
128.3 Seconds * -53%
Intel Core i9-12900K, Intel Core i9-12900K
i9-12900K, 3200 MHz
121.1 Seconds * -44%
AMD Ryzen 9 7900X, AMD Ryzen 9 7900X
R9 7900X, 4700 MHz
106 Seconds * -26%
Intel NUC13 Raptor Canyon, Intel Core i9-13900K
i9-13900K, 3000 MHz
101 Seconds * -20%
NVIDIA GeForce RTX 3090 Founders Edition, AMD Ryzen 9 7950X
R9 7950X, 4500 MHz
85 Seconds * -1%
SCHENKER XMG SECTOR, i9 13900K, RTX 4090, Intel Core i9-13900K
i9-13900K, 3000 MHz
84 Seconds *
Intel Core i9-13900K, Intel Core i9-13900K
i9-13900K, 3000 MHz
80 Seconds * +5%
wPrime 2.10
32m
Intel Core i9-12900K, Intel Core i9-12900K
i9-12900K, 3200 MHz
4.924 s * -114%
Minisforum Neptune Series NAD9, Intel Core i9-12900H
i9-12900H, 1800 MHz
3.421 s * -48%
Intel Dragon Canyon NUC - RTX 3060, Intel Core i9-12900
i9-12900, 2400 MHz
2.67 s * -16%
Intel Core i5-13600K, Intel Core i5-13600K
i5-13600K, 3500 MHz
2.527 s * -10%
Corsair One i300, Intel Core i9-12900K
i9-12900K, 3200 MHz
2.398 s * -4%
SCHENKER XMG SECTOR, i9 13900K, RTX 4090, Intel Core i9-13900K
i9-13900K, 3000 MHz
2.305 s *
Intel NUC13 Raptor Canyon, Intel Core i9-13900K
i9-13900K, 3000 MHz
1.97 s * +15%
Intel Core i9-13900K, Intel Core i9-13900K
i9-13900K, 3000 MHz
1.818 s * +21%
AMD Ryzen 9 7900X, AMD Ryzen 9 7900X
R9 7900X, 4700 MHz
1.781 s * +23%
NVIDIA GeForce RTX 3090 Founders Edition, AMD Ryzen 9 7950X
R9 7950X, 4500 MHz
1.669 s * +28%
1024m
Intel Dragon Canyon NUC - RTX 3060, Intel Core i9-12900
i9-12900, 2400 MHz
211.8 s * -143%
Corsair One i300, Intel Core i9-12900K
i9-12900K, 3200 MHz
195 s * -124%
Intel Core i9-12900K, Intel Core i9-12900K
i9-12900K, 3200 MHz
190.6 s * -119%
Minisforum Neptune Series NAD9, Intel Core i9-12900H
i9-12900H, 1800 MHz
189.07 s * -117%
Intel Core i5-13600K, Intel Core i5-13600K
i5-13600K, 3500 MHz
177.592 s * -104%
Intel NUC13 Raptor Canyon, Intel Core i9-13900K
i9-13900K, 3000 MHz
90.13 s * -3%
SCHENKER XMG SECTOR, i9 13900K, RTX 4090, Intel Core i9-13900K
i9-13900K, 3000 MHz
87.11 s *
Intel Core i9-13900K, Intel Core i9-13900K
i9-13900K, 3000 MHz
79.738 s * +8%
AMD Ryzen 9 7900X, AMD Ryzen 9 7900X
R9 7900X, 4700 MHz
39.954 s * +54%
NVIDIA GeForce RTX 3090 Founders Edition, AMD Ryzen 9 7950X
R9 7950X, 4500 MHz
30.811 s * +65%
X264 HD Benchmark 4.0
Pass 1
SCHENKER XMG SECTOR, i9 13900K, RTX 4090, Intel Core i9-13900K
i9-13900K, 3000 MHz
422 (420min - 424max) fps
Intel NUC13 Raptor Canyon, Intel Core i9-13900K
i9-13900K, 3000 MHz
416.5 (414min - 417max) fps -1%
Intel Core i9-13900K, Intel Core i9-13900K
i9-13900K, 3000 MHz
412 (410min - 417max) fps -2%
Intel Core i5-13600K, Intel Core i5-13600K
i5-13600K, 3500 MHz
388 (386min - 388max) fps -8%
NVIDIA GeForce RTX 3090 Founders Edition, AMD Ryzen 9 7950X
R9 7950X, 4500 MHz
379.5 (378min - 385max) fps -10%
AMD Ryzen 9 7900X, AMD Ryzen 9 7900X
R9 7900X, 4700 MHz
376 (369min - 378max) fps -11%
Intel Core i9-12900K, Intel Core i9-12900K
i9-12900K, 3200 MHz
368.5 (366min - 369max) fps -13%
Corsair One i300, Intel Core i9-12900K
i9-12900K, 3200 MHz
365 (342min - 367max) fps -14%
Intel Dragon Canyon NUC - RTX 3060, Intel Core i9-12900
i9-12900, 2400 MHz
310 (303min - 324max) fps -27%
Minisforum Neptune Series NAD9, Intel Core i9-12900H
i9-12900H, 1800 MHz
245 (239min - 261max) fps -42%
Pass 2
SCHENKER XMG SECTOR, i9 13900K, RTX 4090, Intel Core i9-13900K
i9-13900K, 3000 MHz
269 (268min - 270max) fps
Intel Core i9-13900K, Intel Core i9-13900K
i9-13900K, 3000 MHz
267 (266min - 271max) fps -1%
NVIDIA GeForce RTX 3090 Founders Edition, AMD Ryzen 9 7950X
R9 7950X, 4500 MHz
266.5 (263min - 267max) fps -1%
Intel NUC13 Raptor Canyon, Intel Core i9-13900K
i9-13900K, 3000 MHz
247.5 (238min - 251max) fps -8%
AMD Ryzen 9 7900X, AMD Ryzen 9 7900X
R9 7900X, 4700 MHz
241 (240min - 242max) fps -10%
Intel Core i9-12900K, Intel Core i9-12900K
i9-12900K, 3200 MHz
206 (206min - 206max) fps -23%
Intel Core i5-13600K, Intel Core i5-13600K
i5-13600K, 3500 MHz
199 (198.5min - 199.4max) fps -26%
Corsair One i300, Intel Core i9-12900K
i9-12900K, 3200 MHz
196 (194min - 197max) fps -27%
Intel Dragon Canyon NUC - RTX 3060, Intel Core i9-12900
i9-12900, 2400 MHz
147.5 (134min - 173max) fps -45%
Minisforum Neptune Series NAD9, Intel Core i9-12900H
i9-12900H, 1800 MHz
125.25 (105.2min - 130max) fps -53%
WinRAR - Result
AMD Ryzen 9 7900X, AMD Ryzen 9 7900X
R9 7900X, 4700 MHz
17225 KB/s +26%
NVIDIA GeForce RTX 3090 Founders Edition, AMD Ryzen 9 7950X
R9 7950X, 4500 MHz
16351 KB/s +19%
Intel Core i9-13900K, Intel Core i9-13900K
i9-13900K, 3000 MHz
14836 KB/s +8%
SCHENKER XMG SECTOR, i9 13900K, RTX 4090, Intel Core i9-13900K
i9-13900K, 3000 MHz
13706 KB/s
Intel NUC13 Raptor Canyon, Intel Core i9-13900K
i9-13900K, 3000 MHz
13210 KB/s -4%
Corsair One i300, Intel Core i9-12900K
i9-12900K, 3200 MHz
12876 KB/s -6%
Intel Core i5-13600K, Intel Core i5-13600K
i5-13600K, 3500 MHz
10937 KB/s -20%
Intel Core i9-12900K, Intel Core i9-12900K
i9-12900K, 3200 MHz
10792 KB/s -21%
Intel Dragon Canyon NUC - RTX 3060, Intel Core i9-12900
i9-12900, 2400 MHz
10739 KB/s -22%
Minisforum Neptune Series NAD9, Intel Core i9-12900H
i9-12900H, 1800 MHz
7937 KB/s -42%
TrueCrypt
AES Mean 100MB
NVIDIA GeForce RTX 3090 Founders Edition, AMD Ryzen 9 7950X
R9 7950X, 4500 MHz
30.7 GB/s +25%
Intel Core i9-13900K, Intel Core i9-13900K
i9-13900K, 3000 MHz
27 GB/s +10%
SCHENKER XMG SECTOR, i9 13900K, RTX 4090, Intel Core i9-13900K
i9-13900K, 3000 MHz
24.6 GB/s
Intel NUC13 Raptor Canyon, Intel Core i9-13900K
i9-13900K, 3000 MHz
20.5 GB/s -17%
Corsair One i300, Intel Core i9-12900K
i9-12900K, 3200 MHz
20 GB/s -19%
Intel Core i5-13600K, Intel Core i5-13600K
i5-13600K, 3500 MHz
18.8 GB/s -24%
Intel Core i9-12900K, Intel Core i9-12900K
i9-12900K, 3200 MHz
18.5 GB/s -25%
Intel Dragon Canyon NUC - RTX 3060, Intel Core i9-12900
i9-12900, 2400 MHz
17.2 GB/s -30%
AMD Ryzen 9 7900X, AMD Ryzen 9 7900X
R9 7900X, 4700 MHz
14.8 GB/s -40%
Minisforum Neptune Series NAD9, Intel Core i9-12900H
i9-12900H, 1800 MHz
8.6 GB/s -65%
Twofish Mean 100MB
Intel Core i9-13900K, Intel Core i9-13900K
i9-13900K, 3000 MHz
5.4 GB/s 0%
SCHENKER XMG SECTOR, i9 13900K, RTX 4090, Intel Core i9-13900K
i9-13900K, 3000 MHz
5.4 GB/s
Intel NUC13 Raptor Canyon, Intel Core i9-13900K
i9-13900K, 3000 MHz
5.2 GB/s -4%
NVIDIA GeForce RTX 3090 Founders Edition, AMD Ryzen 9 7950X
R9 7950X, 4500 MHz
4.5 GB/s -17%
Intel Core i9-12900K, Intel Core i9-12900K
i9-12900K, 3200 MHz
3.7 GB/s -31%
Corsair One i300, Intel Core i9-12900K
i9-12900K, 3200 MHz
3.5 GB/s -35%
Intel Dragon Canyon NUC - RTX 3060, Intel Core i9-12900
i9-12900, 2400 MHz
3.4 GB/s -37%
Intel Core i5-13600K, Intel Core i5-13600K
i5-13600K, 3500 MHz
3.1 GB/s -43%
AMD Ryzen 9 7900X, AMD Ryzen 9 7900X
R9 7900X, 4700 MHz
2.8 GB/s -48%
Minisforum Neptune Series NAD9, Intel Core i9-12900H
i9-12900H, 1800 MHz
2 GB/s -63%
Serpent Mean 100MB
Intel Core i9-13900K, Intel Core i9-13900K
i9-13900K, 3000 MHz
3 GB/s +3%
SCHENKER XMG SECTOR, i9 13900K, RTX 4090, Intel Core i9-13900K
i9-13900K, 3000 MHz
2.9 GB/s
NVIDIA GeForce RTX 3090 Founders Edition, AMD Ryzen 9 7950X
R9 7950X, 4500 MHz
2.8 GB/s -3%
Intel NUC13 Raptor Canyon, Intel Core i9-13900K
i9-13900K, 3000 MHz
2.6 GB/s -10%
Corsair One i300, Intel Core i9-12900K
i9-12900K, 3200 MHz
2 GB/s -31%
Intel Core i9-12900K, Intel Core i9-12900K
i9-12900K, 3200 MHz
1.9 GB/s -34%
Intel Dragon Canyon NUC - RTX 3060, Intel Core i9-12900
i9-12900, 2400 MHz
1.9 GB/s -34%
Intel Core i5-13600K, Intel Core i5-13600K
i5-13600K, 3500 MHz
1.7 GB/s -41%
AMD Ryzen 9 7900X, AMD Ryzen 9 7900X
R9 7900X, 4700 MHz
1.5 GB/s -48%
Minisforum Neptune Series NAD9, Intel Core i9-12900H
i9-12900H, 1800 MHz
0.974 GB/s -66%
Geekbench 5.5
Multi-Core
NVIDIA GeForce RTX 3090 Founders Edition, AMD Ryzen 9 7950X
R9 7950X, 4500 MHz
24625 Points +2%
Intel Core i9-13900K, Intel Core i9-13900K
i9-13900K, 3000 MHz
24157 Points +1%
SCHENKER XMG SECTOR, i9 13900K, RTX 4090, Intel Core i9-13900K
i9-13900K, 3000 MHz
24033 Points
Intel NUC13 Raptor Canyon, Intel Core i9-13900K
i9-13900K, 3000 MHz
22448 Points -7%
AMD Ryzen 9 7900X, AMD Ryzen 9 7900X
R9 7900X, 4700 MHz
19987 Points -17%
Intel Core i9-12900K, Intel Core i9-12900K
i9-12900K, 3200 MHz
17854 Points -26%
Corsair One i300, Intel Core i9-12900K
i9-12900K, 3200 MHz
17698 Points -26%
Intel Core i5-13600K, Intel Core i5-13600K
i5-13600K, 3500 MHz
16651 Points -31%
Minisforum Neptune Series NAD9, Intel Core i9-12900H
i9-12900H, 1800 MHz
9695 Points -60%
Intel Dragon Canyon NUC - RTX 3060, Intel Core i9-12900
i9-12900, 2400 MHz
8924 Points -63%
Single-Core
NVIDIA GeForce RTX 3090 Founders Edition, AMD Ryzen 9 7950X
R9 7950X, 4500 MHz
2311 Points +4%
Intel Core i9-13900K, Intel Core i9-13900K
i9-13900K, 3000 MHz
2290 Points +3%
AMD Ryzen 9 7900X, AMD Ryzen 9 7900X
R9 7900X, 4700 MHz
2274 Points +3%
SCHENKER XMG SECTOR, i9 13900K, RTX 4090, Intel Core i9-13900K
i9-13900K, 3000 MHz
2218 Points
Intel NUC13 Raptor Canyon, Intel Core i9-13900K
i9-13900K, 3000 MHz
2106 Points -5%
Intel Core i9-12900K, Intel Core i9-12900K
i9-12900K, 3200 MHz
2042 Points -8%
Corsair One i300, Intel Core i9-12900K
i9-12900K, 3200 MHz
1969 Points -11%
Intel Core i5-13600K, Intel Core i5-13600K
i5-13600K, 3500 MHz
1967 Points -11%
Minisforum Neptune Series NAD9, Intel Core i9-12900H
i9-12900H, 1800 MHz
1861 Points -16%
Intel Dragon Canyon NUC - RTX 3060, Intel Core i9-12900
i9-12900, 2400 MHz
1656 Points -25%
Geekbench 5.0
5.0 Multi-Core
NVIDIA GeForce RTX 3090 Founders Edition, AMD Ryzen 9 7950X
R9 7950X, 4500 MHz
24479 Points +3%
Intel Core i9-13900K, Intel Core i9-13900K
i9-13900K, 3000 MHz
24021 Points +2%
SCHENKER XMG SECTOR, i9 13900K, RTX 4090, Intel Core i9-13900K
i9-13900K, 3000 MHz
23664 Points
Intel NUC13 Raptor Canyon, Intel Core i9-13900K
i9-13900K, 3000 MHz
22024 Points -7%
AMD Ryzen 9 7900X, AMD Ryzen 9 7900X
R9 7900X, 4700 MHz
19975 Points -16%
Intel Core i9-12900K, Intel Core i9-12900K
i9-12900K, 3200 MHz
17959 Points -24%
Corsair One i300, Intel Core i9-12900K
i9-12900K, 3200 MHz
17697 Points -25%
Intel Core i5-13600K, Intel Core i5-13600K
i5-13600K, 3500 MHz
16635 Points -30%
Minisforum Neptune Series NAD9, Intel Core i9-12900H
i9-12900H, 1800 MHz
9663 Points -59%
Intel Dragon Canyon NUC - RTX 3060, Intel Core i9-12900
i9-12900, 2400 MHz
8845 Points -63%
5.0 Single-Core
NVIDIA GeForce RTX 3090 Founders Edition, AMD Ryzen 9 7950X
R9 7950X, 4500 MHz
2222 Points +3%
Intel Core i9-13900K, Intel Core i9-13900K
i9-13900K, 3000 MHz
2214 Points +3%
AMD Ryzen 9 7900X, AMD Ryzen 9 7900X
R9 7900X, 4700 MHz
2194 Points +2%
SCHENKER XMG SECTOR, i9 13900K, RTX 4090, Intel Core i9-13900K
i9-13900K, 3000 MHz
2151 Points
Intel NUC13 Raptor Canyon, Intel Core i9-13900K
i9-13900K, 3000 MHz
2148 Points 0%
Intel Core i9-12900K, Intel Core i9-12900K
i9-12900K, 3200 MHz
1968 Points -9%
Intel Core i5-13600K, Intel Core i5-13600K
i5-13600K, 3500 MHz
1931 Points -10%
Corsair One i300, Intel Core i9-12900K
i9-12900K, 3200 MHz
1927 Points -10%
Minisforum Neptune Series NAD9, Intel Core i9-12900H
i9-12900H, 1800 MHz
1838 Points -15%
Intel Dragon Canyon NUC - RTX 3060, Intel Core i9-12900
i9-12900, 2400 MHz
1638 Points -24%
Geekbench 4.4
64 Bit Single-Core Score
Intel Core i9-13900K, Intel Core i9-13900K
i9-13900K, 3000 MHz
9598 Points 0%
SCHENKER XMG SECTOR, i9 13900K, RTX 4090, Intel Core i9-13900K
i9-13900K, 3000 MHz
9583 Points
NVIDIA GeForce RTX 3090 Founders Edition, AMD Ryzen 9 7950X
R9 7950X, 4500 MHz
9322 Points -3%
Intel NUC13 Raptor Canyon, Intel Core i9-13900K
i9-13900K, 3000 MHz
9218 Points -4%
AMD Ryzen 9 7900X, AMD Ryzen 9 7900X
R9 7900X, 4700 MHz
9193 Points -4%
Intel Core i9-12900K, Intel Core i9-12900K
i9-12900K, 3200 MHz
8665 Points -10%
Intel Core i5-13600K, Intel Core i5-13600K
i5-13600K, 3500 MHz
8618 Points -10%
Corsair One i300, Intel Core i9-12900K
i9-12900K, 3200 MHz
8593 Points -10%
Minisforum Neptune Series NAD9, Intel Core i9-12900H
i9-12900H, 1800 MHz
8015 Points -16%
Intel Dragon Canyon NUC - RTX 3060, Intel Core i9-12900
i9-12900, 2400 MHz
6991 Points -27%
64 Bit Multi-Core Score
NVIDIA GeForce RTX 3090 Founders Edition, AMD Ryzen 9 7950X
R9 7950X, 4500 MHz
89678 Points +6%
Intel Core i9-13900K, Intel Core i9-13900K
i9-13900K, 3000 MHz
86695 Points +2%
SCHENKER XMG SECTOR, i9 13900K, RTX 4090, Intel Core i9-13900K
i9-13900K, 3000 MHz
84916 Points
Intel NUC13 Raptor Canyon, Intel Core i9-13900K
i9-13900K, 3000 MHz
77347 Points -9%
AMD Ryzen 9 7900X, AMD Ryzen 9 7900X
R9 7900X, 4700 MHz
74731 Points -12%
Corsair One i300, Intel Core i9-12900K
i9-12900K, 3200 MHz
64238 Points -24%
Intel Core i9-12900K, Intel Core i9-12900K
i9-12900K, 3200 MHz
63583 Points -25%
Intel Core i5-13600K, Intel Core i5-13600K
i5-13600K, 3500 MHz
60407 Points -29%
Minisforum Neptune Series NAD9, Intel Core i9-12900H
i9-12900H, 1800 MHz
36692 Points -57%
Intel Dragon Canyon NUC - RTX 3060, Intel Core i9-12900
i9-12900, 2400 MHz
36310 Points -57%
3DMark 11 - 1280x720 Performance Physics
Intel Core i9-13900K, Intel Core i9-13900K
i9-13900K, 3000 MHz
32273 Points +5%
SCHENKER XMG SECTOR, i9 13900K, RTX 4090, Intel Core i9-13900K
i9-13900K, 3000 MHz
30809 Points
Intel Core i5-13600K, Intel Core i5-13600K
i5-13600K, 3500 MHz
30480 Points -1%
Intel NUC13 Raptor Canyon, Intel Core i9-13900K
i9-13900K, 3000 MHz
29023 Points -6%
Corsair One i300, Intel Core i9-12900K
i9-12900K, 3200 MHz
28789 Points -7%
AMD Ryzen 9 7900X, AMD Ryzen 9 7900X
R9 7900X, 4700 MHz
28618 Points -7%
NVIDIA GeForce RTX 3090 Founders Edition, AMD Ryzen 9 7950X
R9 7950X, 4500 MHz
28618 Points -7%
Intel Core i9-12900K, Intel Core i9-12900K
i9-12900K, 3200 MHz
28211 Points -8%
Intel Dragon Canyon NUC - RTX 3060, Intel Core i9-12900
i9-12900, 2400 MHz
24314 Points -21%
Minisforum Neptune Series NAD9, Intel Core i9-12900H
i9-12900H, 1800 MHz
18382 Points -40%
7-Zip 18.03
7z b 4
NVIDIA GeForce RTX 3090 Founders Edition, AMD Ryzen 9 7950X
R9 7950X, 4500 MHz
161724 MIPS +9%
SCHENKER XMG SECTOR, i9 13900K, RTX 4090, Intel Core i9-13900K
i9-13900K, 3000 MHz
148053 MIPS
Intel Core i9-13900K, Intel Core i9-13900K
i9-13900K, 3000 MHz
147068 MIPS -1%
Intel NUC13 Raptor Canyon, Intel Core i9-13900K
i9-13900K, 3000 MHz
127201 MIPS -14%
AMD Ryzen 9 7900X, AMD Ryzen 9 7900X
R9 7900X, 4700 MHz
124975 MIPS -16%
Intel Core i9-12900K, Intel Core i9-12900K
i9-12900K, 3200 MHz
97671 MIPS -34%
Corsair One i300, Intel Core i9-12900K
i9-12900K, 3200 MHz
96960 MIPS -35%
Intel Core i5-13600K, Intel Core i5-13600K
i5-13600K, 3500 MHz
89647 MIPS -39%
Minisforum Neptune Series NAD9, Intel Core i9-12900H
i9-12900H, 1800 MHz
51151 MIPS -65%
Intel Dragon Canyon NUC - RTX 3060, Intel Core i9-12900
i9-12900, 2400 MHz
50152 MIPS -66%
7z b 4 -mmt1
NVIDIA GeForce RTX 3090 Founders Edition, AMD Ryzen 9 7950X
R9 7950X, 4500 MHz
8365 MIPS +17%
AMD Ryzen 9 7900X, AMD Ryzen 9 7900X
R9 7900X, 4700 MHz
8282 MIPS +15%
Intel Core i9-13900K, Intel Core i9-13900K
i9-13900K, 3000 MHz
7272 MIPS +1%
Intel NUC13 Raptor Canyon, Intel Core i9-13900K
i9-13900K, 3000 MHz
7255 MIPS +1%
SCHENKER XMG SECTOR, i9 13900K, RTX 4090, Intel Core i9-13900K
i9-13900K, 3000 MHz
7176 MIPS
Corsair One i300, Intel Core i9-12900K
i9-12900K, 3200 MHz
6580 MIPS -8%
Intel Core i9-12900K, Intel Core i9-12900K
i9-12900K, 3200 MHz
6571 MIPS -8%
Intel Core i5-13600K, Intel Core i5-13600K
i5-13600K, 3500 MHz
6502 MIPS -9%
Minisforum Neptune Series NAD9, Intel Core i9-12900H
i9-12900H, 1800 MHz
6019 MIPS -16%
Intel Dragon Canyon NUC - RTX 3060, Intel Core i9-12900
i9-12900, 2400 MHz
5979 MIPS -17%
HWBOT x265 Benchmark v2.2 - 4k Preset
NVIDIA GeForce RTX 3090 Founders Edition, AMD Ryzen 9 7950X
R9 7950X, 4500 MHz
44.4 fps +9%
Intel Core i9-13900K, Intel Core i9-13900K
i9-13900K, 3000 MHz
42.6 fps +5%
SCHENKER XMG SECTOR, i9 13900K, RTX 4090, Intel Core i9-13900K
i9-13900K, 3000 MHz
40.7 fps
AMD Ryzen 9 7900X, AMD Ryzen 9 7900X
R9 7900X, 4700 MHz
36.2 fps -11%
Intel NUC13 Raptor Canyon, Intel Core i9-13900K
i9-13900K, 3000 MHz
34.5 fps -15%
Intel Core i9-12900K, Intel Core i9-12900K
i9-12900K, 3200 MHz
30 fps -26%
Corsair One i300, Intel Core i9-12900K
i9-12900K, 3200 MHz
29 fps -29%
Intel Core i5-13600K, Intel Core i5-13600K
i5-13600K, 3500 MHz
27.6 fps -32%
Intel Dragon Canyon NUC - RTX 3060, Intel Core i9-12900
i9-12900, 2400 MHz
14.4 fps -65%
Minisforum Neptune Series NAD9, Intel Core i9-12900H
i9-12900H, 1800 MHz
14.1 fps -65%
R Benchmark 2.5 - Overall mean
Intel Dragon Canyon NUC - RTX 3060, Intel Core i9-12900
i9-12900, 2400 MHz
0.535 sec * -50%
Minisforum Neptune Series NAD9, Intel Core i9-12900H
i9-12900H, 1800 MHz
0.4641 sec * -30%
Intel Core i9-12900K, Intel Core i9-12900K
i9-12900K, 3200 MHz
0.4216 sec * -18%
Intel Core i5-13600K, Intel Core i5-13600K
i5-13600K, 3500 MHz
0.405 sec * -14%
Corsair One i300, Intel Core i9-12900K
i9-12900K, 3200 MHz
0.3946 sec * -11%
Intel NUC13 Raptor Canyon, Intel Core i9-13900K
i9-13900K, 3000 MHz
0.3911 sec * -10%
AMD Ryzen 9 7900X, AMD Ryzen 9 7900X
R9 7900X, 4700 MHz
0.3736 sec * -5%
NVIDIA GeForce RTX 3090 Founders Edition, AMD Ryzen 9 7950X
R9 7950X, 4500 MHz
0.3682 sec * -3%
SCHENKER XMG SECTOR, i9 13900K, RTX 4090, Intel Core i9-13900K
i9-13900K, 3000 MHz
0.356 sec *
Intel Core i9-13900K, Intel Core i9-13900K
i9-13900K, 3000 MHz
0.3539 sec * +1%
LibreOffice - 20 Documents To PDF
Intel Dragon Canyon NUC - RTX 3060, Intel Core i9-12900
i9-12900, 2400 MHz
44.9 s * -22%
Intel NUC13 Raptor Canyon, Intel Core i9-13900K
i9-13900K, 3000 MHz
41.6 s * -13%
Intel Core i9-12900K, Intel Core i9-12900K
i9-12900K, 3200 MHz
40.6 s * -11%
Corsair One i300, Intel Core i9-12900K
i9-12900K, 3200 MHz
38.1 s * -4%
Minisforum Neptune Series NAD9, Intel Core i9-12900H
i9-12900H, 1800 MHz
38 s * -4%
SCHENKER XMG SECTOR, i9 13900K, RTX 4090, Intel Core i9-13900K
i9-13900K, 3000 MHz
36.7 s *
Intel Core i9-13900K, Intel Core i9-13900K
i9-13900K, 3000 MHz
36.6 s * -0%
NVIDIA GeForce RTX 3090 Founders Edition, AMD Ryzen 9 7950X
R9 7950X, 4500 MHz
35.5 s * +3%
Intel Core i5-13600K, Intel Core i5-13600K
i5-13600K, 3500 MHz
35 s * +5%
AMD Ryzen 9 7900X, AMD Ryzen 9 7900X
R9 7900X, 4700 MHz
34.9 s * +5%
WebXPRT 3 - Overall
SCHENKER XMG SECTOR, i9 13900K, RTX 4090, Intel Core i9-13900K
i9-13900K, 3000 MHz
382 Points
AMD Ryzen 9 7900X, AMD Ryzen 9 7900X
R9 7900X, 4700 MHz
371 Points -3%
NVIDIA GeForce RTX 3090 Founders Edition, AMD Ryzen 9 7950X
R9 7950X, 4500 MHz
366 Points -4%
Intel Core i9-13900K, Intel Core i9-13900K
i9-13900K, 3000 MHz
361 Points -5%
Intel NUC13 Raptor Canyon, Intel Core i9-13900K
i9-13900K, 3000 MHz
338 Points -12%
Intel Core i5-13600K, Intel Core i5-13600K
i5-13600K, 3500 MHz
333 Points -13%
Corsair One i300, Intel Core i9-12900K
i9-12900K, 3200 MHz
330 Points -14%
Intel Core i9-12900K, Intel Core i9-12900K
i9-12900K, 3200 MHz
320 Points -16%
Minisforum Neptune Series NAD9, Intel Core i9-12900H
i9-12900H, 1800 MHz
311 Points -19%
Intel Dragon Canyon NUC - RTX 3060, Intel Core i9-12900
i9-12900, 2400 MHz
269 Points -30%
Mozilla Kraken 1.1 - Total
Intel Dragon Canyon NUC - RTX 3060, Intel Core i9-12900
i9-12900, 2400 MHz
602 ms * -42%
Minisforum Neptune Series NAD9, Intel Core i9-12900H
i9-12900H, 1800 MHz
577 ms * -36%
Intel Core i9-12900K, Intel Core i9-12900K
i9-12900K, 3200 MHz
481 ms * -14%
Corsair One i300, Intel Core i9-12900K
i9-12900K, 3200 MHz
475 ms * -12%
Intel Core i5-13600K, Intel Core i5-13600K
i5-13600K, 3500 MHz
469 ms * -11%
Intel NUC13 Raptor Canyon, Intel Core i9-13900K
i9-13900K, 3000 MHz
438 ms * -4%
NVIDIA GeForce RTX 3090 Founders Edition, AMD Ryzen 9 7950X
R9 7950X, 4500 MHz
433 ms * -2%
Intel Core i9-13900K, Intel Core i9-13900K
i9-13900K, 3000 MHz
432 ms * -2%
AMD Ryzen 9 7900X, AMD Ryzen 9 7900X
R9 7900X, 4700 MHz
431 ms * -2%
SCHENKER XMG SECTOR, i9 13900K, RTX 4090, Intel Core i9-13900K
i9-13900K, 3000 MHz
423 ms *
3DMark
3840x2160 Fire Strike Ultra Physics
Intel Core i9-13900K, Intel Core i9-13900K
i9-13900K, 3000 MHz
54036 Points +9%
SCHENKER XMG SECTOR, i9 13900K, RTX 4090, Intel Core i9-13900K
i9-13900K, 3000 MHz
49729 Points
Intel NUC13 Raptor Canyon, Intel Core i9-13900K
i9-13900K, 3000 MHz
46030 Points -7%
AMD Ryzen 9 7900X, AMD Ryzen 9 7900X
R9 7900X, 4700 MHz
42399 Points -15%
NVIDIA GeForce RTX 3090 Founders Edition, AMD Ryzen 9 7950X
R9 7950X, 4500 MHz
42399 Points -15%
Corsair One i300, Intel Core i9-12900K
i9-12900K, 3200 MHz
41303 Points -17%
Intel Core i9-12900K, Intel Core i9-12900K
i9-12900K, 3200 MHz
39462 Points -21%
Intel Dragon Canyon NUC - RTX 3060, Intel Core i9-12900
i9-12900, 2400 MHz
37967 Points -24%
Intel Core i5-13600K, Intel Core i5-13600K
i5-13600K, 3500 MHz
36774 Points -26%
Minisforum Neptune Series NAD9, Intel Core i9-12900H
i9-12900H, 1800 MHz
21422 Points -57%
1920x1080 Fire Strike Physics
Intel Core i9-13900K, Intel Core i9-13900K
i9-13900K, 3000 MHz
53853 Points +8%
SCHENKER XMG SECTOR, i9 13900K, RTX 4090, Intel Core i9-13900K
i9-13900K, 3000 MHz
50014 Points
Intel NUC13 Raptor Canyon, Intel Core i9-13900K
i9-13900K, 3000 MHz
46013 Points -8%
AMD Ryzen 9 7900X, AMD Ryzen 9 7900X
R9 7900X, 4700 MHz
42682 Points -15%
NVIDIA GeForce RTX 3090 Founders Edition, AMD Ryzen 9 7950X
R9 7950X, 4500 MHz
42682 Points -15%
Corsair One i300, Intel Core i9-12900K
i9-12900K, 3200 MHz
40694 Points -19%
Intel Core i9-12900K, Intel Core i9-12900K
i9-12900K, 3200 MHz
39112 Points -22%
Intel Core i5-13600K, Intel Core i5-13600K
i5-13600K, 3500 MHz
35386 Points -29%
Intel Dragon Canyon NUC - RTX 3060, Intel Core i9-12900
i9-12900, 2400 MHz
35153 Points -30%
Minisforum Neptune Series NAD9, Intel Core i9-12900H
i9-12900H, 1800 MHz
22244 Points -56%
2560x1440 Time Spy CPU
SCHENKER XMG SECTOR, i9 13900K, RTX 4090, Intel Core i9-13900K
i9-13900K, 3000 MHz
19799 Points
Intel Core i9-13900K, Intel Core i9-13900K
i9-13900K, 3000 MHz
19392 Points -2%
Corsair One i300, Intel Core i9-12900K
i9-12900K, 3200 MHz
18680 Points -6%
Intel Core i9-12900K, Intel Core i9-12900K
i9-12900K, 3200 MHz
18431 Points -7%
Intel Core i5-13600K, Intel Core i5-13600K
i5-13600K, 3500 MHz
17124 Points -14%
AMD Ryzen 9 7900X, AMD Ryzen 9 7900X
R9 7900X, 4700 MHz
16616 Points -16%
NVIDIA GeForce RTX 3090 Founders Edition, AMD Ryzen 9 7950X
R9 7950X, 4500 MHz
16616 Points -16%
Intel NUC13 Raptor Canyon, Intel Core i9-13900K
i9-13900K, 3000 MHz
16236 Points -18%
Intel Dragon Canyon NUC - RTX 3060, Intel Core i9-12900
i9-12900, 2400 MHz
15095 Points -24%
Minisforum Neptune Series NAD9, Intel Core i9-12900H
i9-12900H, 1800 MHz
10539 Points -47%

* ... smaller is better

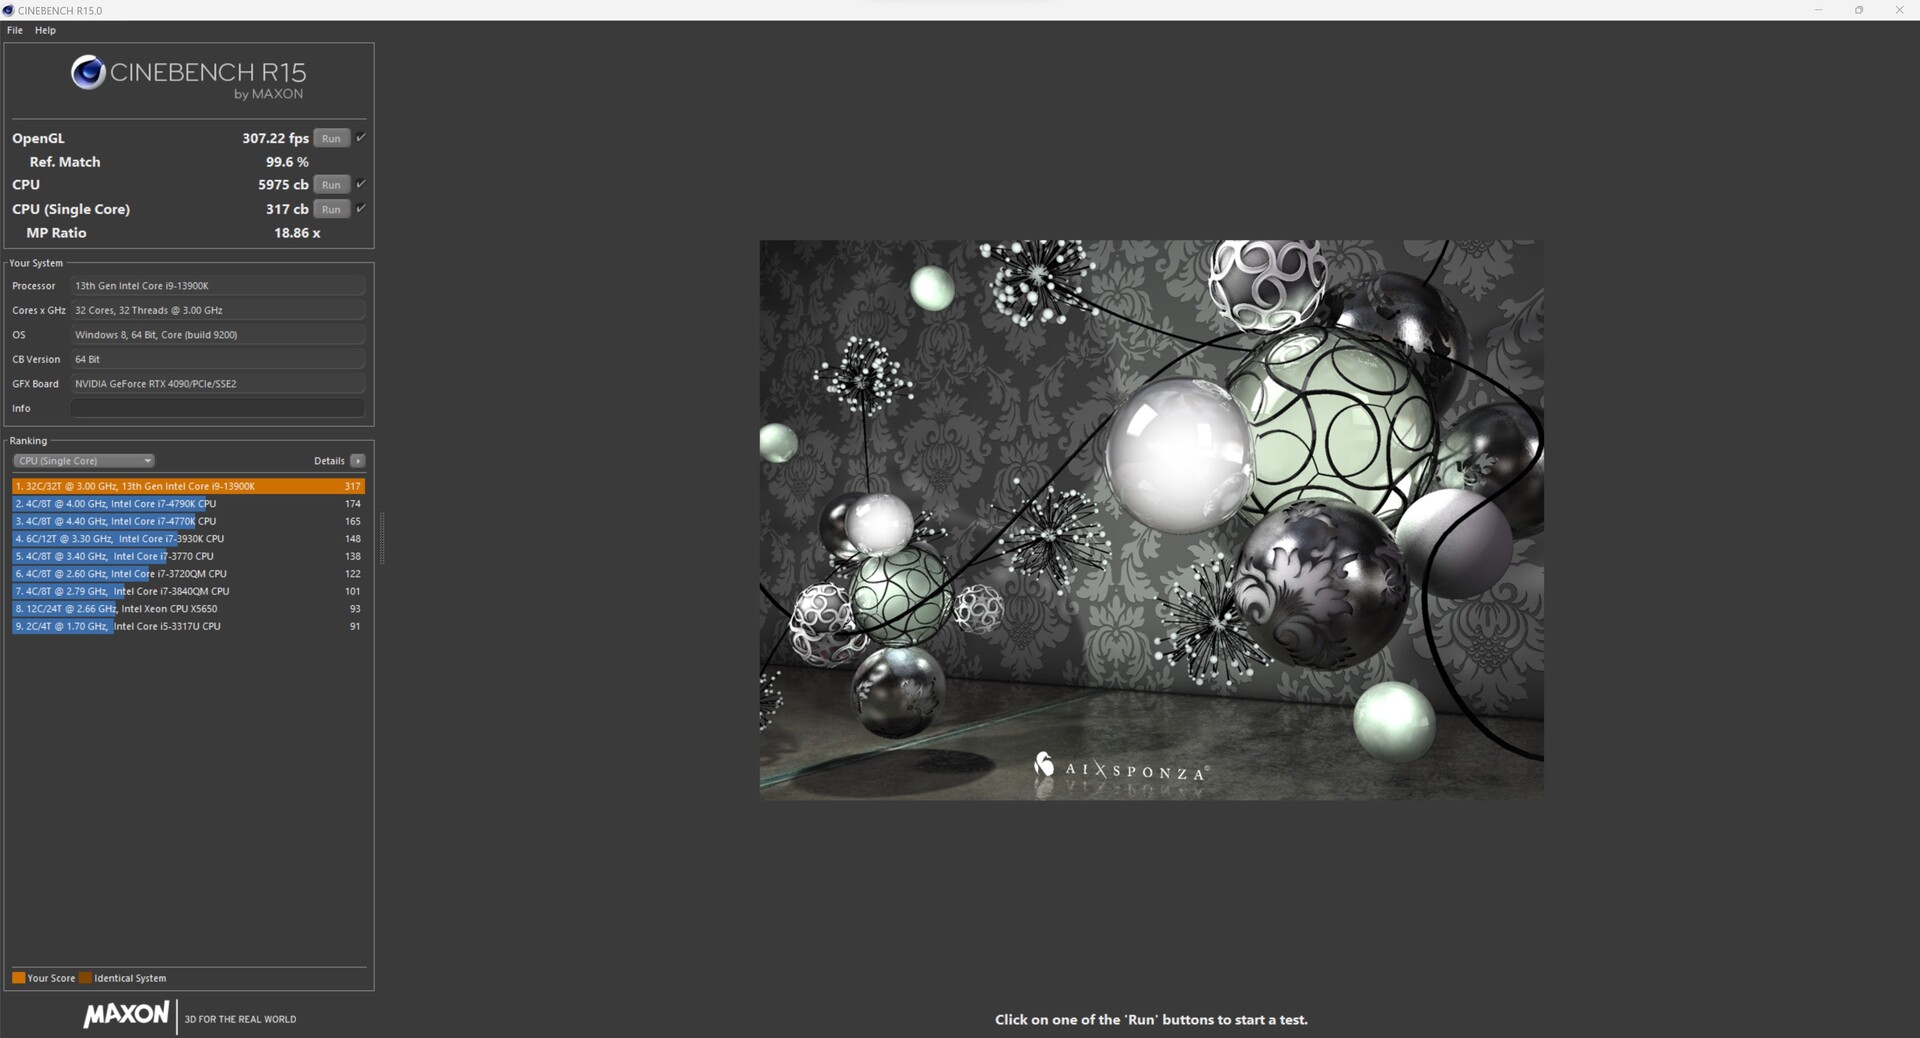
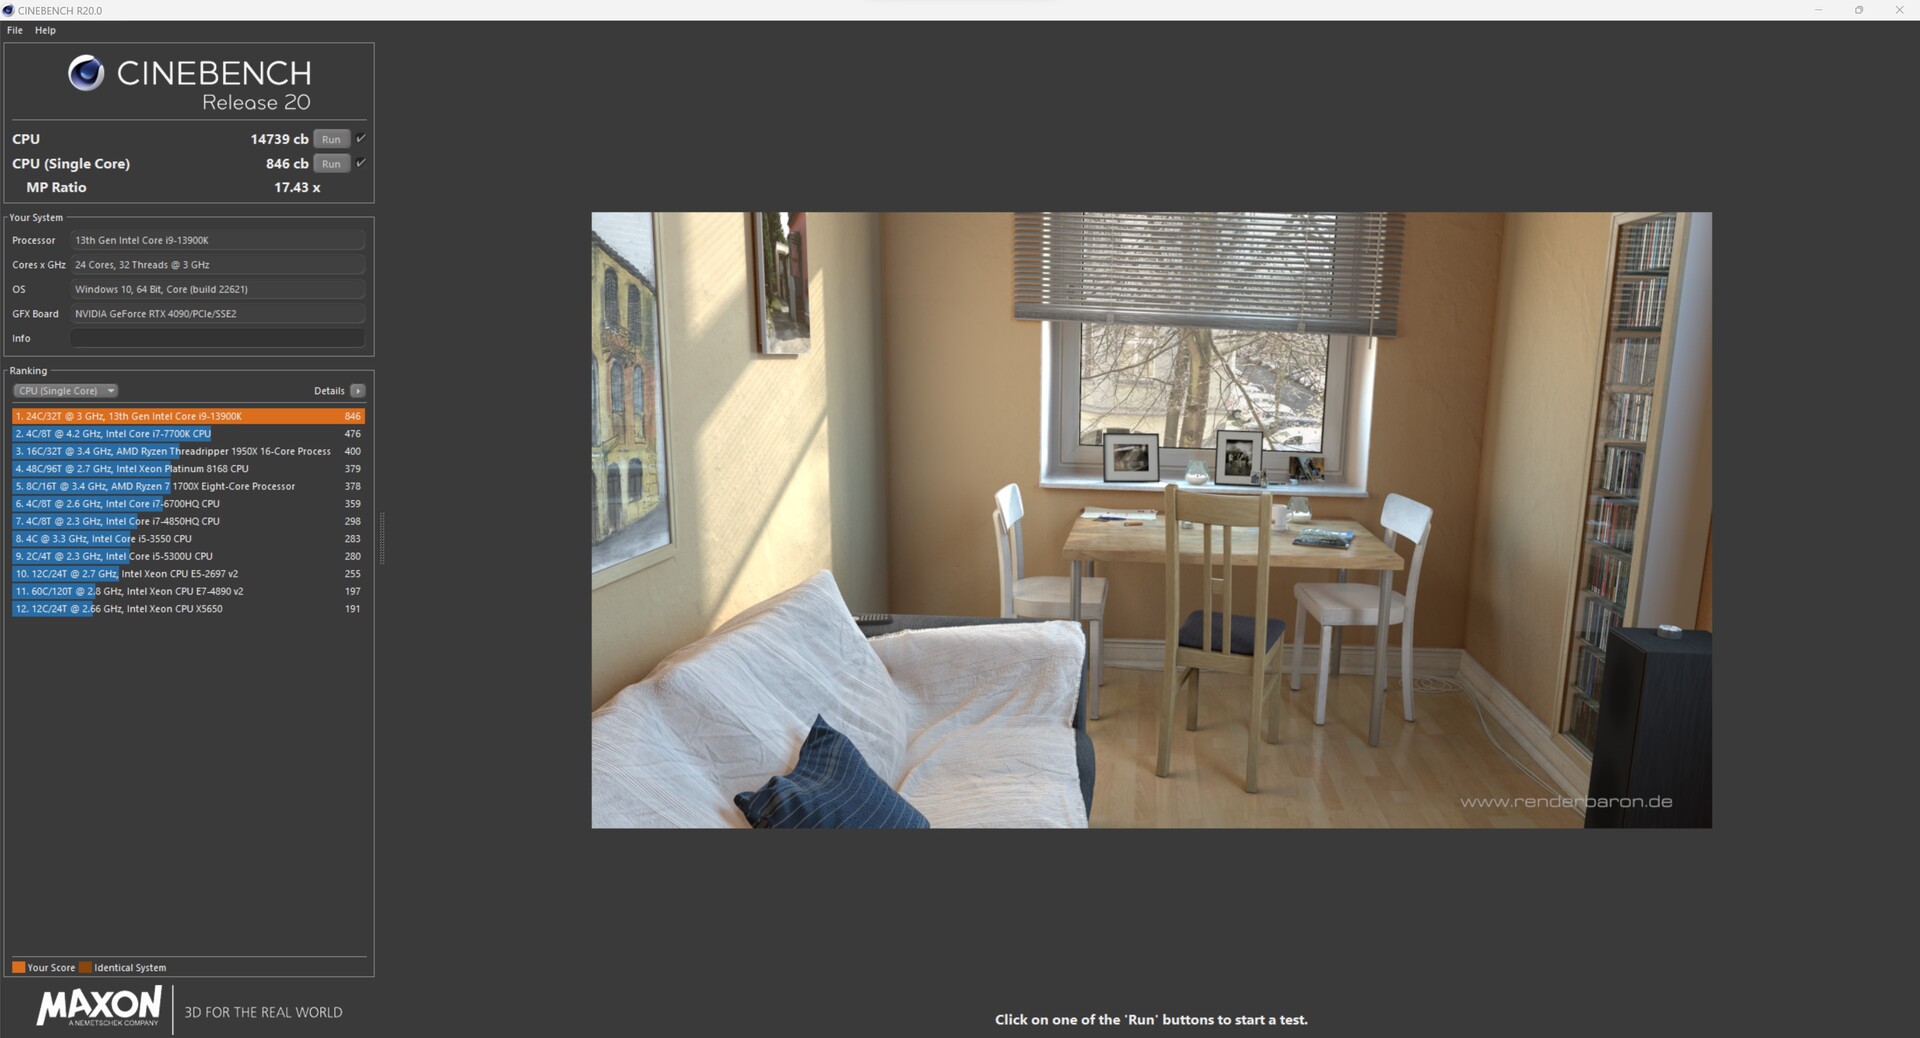
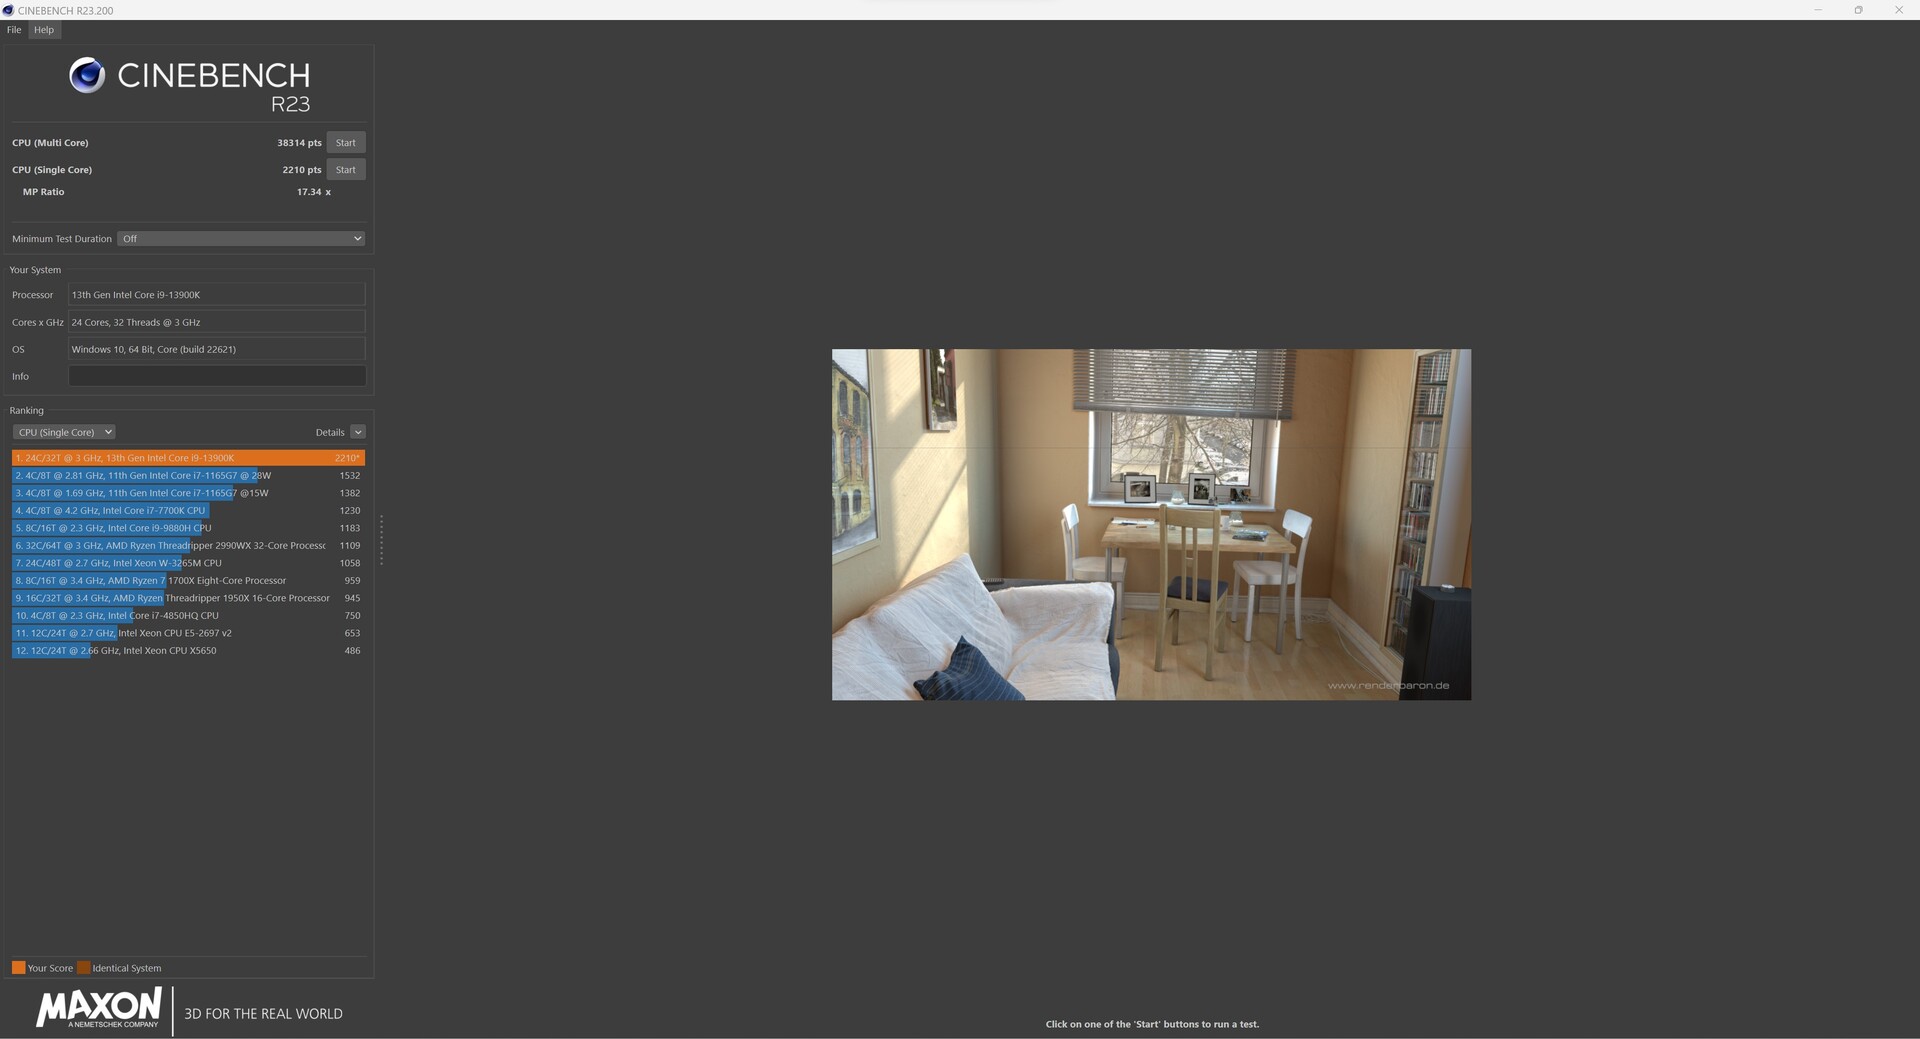
XMG SECTOR Intel em Cinebench R15 Multi loop

A execução do Cinebench R15 em loop nos deu um primeiro olhar sobre a eficiência da solução de resfriamento no PC. Não houve nenhuma queda perceptível no desempenho após as primeiras corridas. O XMG SECTOR Intel teve um desempenho muito bom, recebendo uma pontuação média de 5.917.

Métricas de CPU durante o loop Cinebench R15
03156309451260157518902205252028353150346537804095441047255040535556705985Tooltip
SCHENKER XMG SECTOR, i9 13900K, RTX 4090 Intel Core i9-13900K, Intel Core i9-13900K: Ø5917 (5893.62-5963.03)
Intel Core i9-12900K Intel Core i9-12900K, Intel Core i9-12900K: Ø3987 (3920.42-4037.55)
AMD Ryzen 9 7900X AMD Ryzen 9 7900X, AMD Ryzen 9 7900X: Ø4785 (4739.9-4829.17)
NVIDIA GeForce RTX 3090 Founders Edition AMD Ryzen 9 7950X, AMD Ryzen 9 7950X: Ø6154 (6136.85-6189.08)
Intel Core i9-13900K Intel Core i9-13900K, Intel Core i9-13900K: Ø6182 (6045.95-6213.11)
Minisforum Neptune Series NAD9 Intel Core i9-12900H, Intel Core i9-12900H: Ø1703 (1657.14-2261.04)
Corsair One i300 Intel Core i9-12900K, Intel Core i9-12900K: Ø3491 (3392.13-3530.45)
Intel NUC13 Raptor Canyon Intel Core i9-13900K, Intel Core i9-13900K: Ø4779 (4708.1-5265.93)
Intel Dragon Canyon NUC - RTX 3060 Intel Core i9-12900, Intel Core i9-12900: Ø2592 (2433.39-3346.44)

Desempenho do sistema

A Intel XMG SECTOR foi extremamente rápida nos benchmarks sintéticos, colocando-se assim no mesmo nível dos concorrentes. Além disso, nossa unidade de revisão apresentou excelente desempenho nos testes de memória AIDA64 e conseguiu garantir o primeiro lugar graças à sua memória rápida (DDR5-5600) e baixas latências. Durante nosso tempo com a XMG SECTOR Intel, ela funcionou consistentemente muito rápido sem nenhuma latência significativa.

Performance Rating - Percent
AMD Ryzen 9 7900X
AMD Ryzen 9 7900X, NVIDIA GeForce RTX 3090,
99 pt
NVIDIA GeForce RTX 3090 Founders Edition
AMD Ryzen 9 7950X, NVIDIA GeForce RTX 3090, Corsair MP600
99 pt
Intel Core i9-13900K
Intel Core i9-13900K, NVIDIA GeForce RTX 3090, Corsair MP600
97.8 pt
SCHENKER XMG SECTOR, i9 13900K, RTX 4090
Intel Core i9-13900K, NVIDIA GeForce RTX 4090, Samsung SSD 980 Pro 2TB MZ-V8P2T0
96.6 pt
Intel Core i5-13600K
Intel Core i5-13600K, NVIDIA GeForce RTX 3090, Corsair MP600
95.7 pt
Intel NUC13 Raptor Canyon
Intel Core i9-13900K, NVIDIA GeForce RTX 3080 Ti, Kingston Fury Renegade SFYRS1000G
91.2 pt
Corsair One i300
Intel Core i9-12900K, NVIDIA GeForce RTX 3080 Ti, Samsung PM9A1 MZVL22T0HBLB
89.2 pt
Intel Core i9-12900K
Intel Core i9-12900K, NVIDIA Titan RTX, Intel Optane 905P 480GB 2.5
87.4 pt
Intel Dragon Canyon NUC - RTX 3060
Intel Core i9-12900, NVIDIA GeForce RTX 3060, Transcend M.2 SSD 2200S TS512GMTE220S
84.5 pt
Minisforum Neptune Series NAD9
Intel Core i9-12900H, Intel Iris Xe Graphics G7 96EUs, Kingston OM8PGP4512Q-A0
71.2 pt
PCMark 10
Score
SCHENKER XMG SECTOR, i9 13900K, RTX 4090
Intel Core i9-13900K, NVIDIA GeForce RTX 4090, Samsung SSD 980 Pro 2TB MZ-V8P2T0
10043 Points
AMD Ryzen 9 7900X
AMD Ryzen 9 7900X, NVIDIA GeForce RTX 3090,
9911 Points -1%
NVIDIA GeForce RTX 3090 Founders Edition
AMD Ryzen 9 7950X, NVIDIA GeForce RTX 3090, Corsair MP600
9911 Points -1%
Intel Core i9-13900K
Intel Core i9-13900K, NVIDIA GeForce RTX 3090, Corsair MP600
9788 Points -3%
Intel Core i5-13600K
Intel Core i5-13600K, NVIDIA GeForce RTX 3090, Corsair MP600
9362 Points -7%
Intel NUC13 Raptor Canyon
Intel Core i9-13900K, NVIDIA GeForce RTX 3080 Ti, Kingston Fury Renegade SFYRS1000G
9118 Points -9%
Corsair One i300
Intel Core i9-12900K, NVIDIA GeForce RTX 3080 Ti, Samsung PM9A1 MZVL22T0HBLB
8897 Points -11%
Intel Core i9-12900K
Intel Core i9-12900K, NVIDIA Titan RTX, Intel Optane 905P 480GB 2.5
8604 Points -14%
Intel Dragon Canyon NUC - RTX 3060
Intel Core i9-12900, NVIDIA GeForce RTX 3060, Transcend M.2 SSD 2200S TS512GMTE220S
8083 Points -20%
Minisforum Neptune Series NAD9
Intel Core i9-12900H, Intel Iris Xe Graphics G7 96EUs, Kingston OM8PGP4512Q-A0
6187 Points -38%
Essentials
Intel Core i9-13900K
Intel Core i9-13900K, NVIDIA GeForce RTX 3090, Corsair MP600
12868 Points +6%
AMD Ryzen 9 7900X
AMD Ryzen 9 7900X, NVIDIA GeForce RTX 3090,
12651 Points +4%
NVIDIA GeForce RTX 3090 Founders Edition
AMD Ryzen 9 7950X, NVIDIA GeForce RTX 3090, Corsair MP600
12651 Points +4%
Intel Core i5-13600K
Intel Core i5-13600K, NVIDIA GeForce RTX 3090, Corsair MP600
12306 Points +1%
SCHENKER XMG SECTOR, i9 13900K, RTX 4090
Intel Core i9-13900K, NVIDIA GeForce RTX 4090, Samsung SSD 980 Pro 2TB MZ-V8P2T0
12194 Points
Corsair One i300
Intel Core i9-12900K, NVIDIA GeForce RTX 3080 Ti, Samsung PM9A1 MZVL22T0HBLB
11660 Points -4%
Intel NUC13 Raptor Canyon
Intel Core i9-13900K, NVIDIA GeForce RTX 3080 Ti, Kingston Fury Renegade SFYRS1000G
11598 Points -5%
Minisforum Neptune Series NAD9
Intel Core i9-12900H, Intel Iris Xe Graphics G7 96EUs, Kingston OM8PGP4512Q-A0
11217 Points -8%
Intel Dragon Canyon NUC - RTX 3060
Intel Core i9-12900, NVIDIA GeForce RTX 3060, Transcend M.2 SSD 2200S TS512GMTE220S
11171 Points -8%
Intel Core i9-12900K
Intel Core i9-12900K, NVIDIA Titan RTX, Intel Optane 905P 480GB 2.5
11086 Points -9%
Productivity
AMD Ryzen 9 7900X
AMD Ryzen 9 7900X, NVIDIA GeForce RTX 3090,
11853 Points +5%
NVIDIA GeForce RTX 3090 Founders Edition
AMD Ryzen 9 7950X, NVIDIA GeForce RTX 3090, Corsair MP600
11853 Points +5%
Intel Core i5-13600K
Intel Core i5-13600K, NVIDIA GeForce RTX 3090, Corsair MP600
11630 Points +3%
Intel Core i9-13900K
Intel Core i9-13900K, NVIDIA GeForce RTX 3090, Corsair MP600
11370 Points +1%
SCHENKER XMG SECTOR, i9 13900K, RTX 4090
Intel Core i9-13900K, NVIDIA GeForce RTX 4090, Samsung SSD 980 Pro 2TB MZ-V8P2T0
11268 Points
Intel NUC13 Raptor Canyon
Intel Core i9-13900K, NVIDIA GeForce RTX 3080 Ti, Kingston Fury Renegade SFYRS1000G
10988 Points -2%
Intel Core i9-12900K
Intel Core i9-12900K, NVIDIA Titan RTX, Intel Optane 905P 480GB 2.5
10699 Points -5%
Corsair One i300
Intel Core i9-12900K, NVIDIA GeForce RTX 3080 Ti, Samsung PM9A1 MZVL22T0HBLB
10470 Points -7%
Intel Dragon Canyon NUC - RTX 3060
Intel Core i9-12900, NVIDIA GeForce RTX 3060, Transcend M.2 SSD 2200S TS512GMTE220S
10205 Points -9%
Minisforum Neptune Series NAD9
Intel Core i9-12900H, Intel Iris Xe Graphics G7 96EUs, Kingston OM8PGP4512Q-A0
7673 Points -32%
CrossMark / Overall
Intel Core i9-13900K, Intel Core i9-13900K
NVIDIA GeForce RTX 3090, Corsair MP600
2589 Points +5%
NVIDIA GeForce RTX 3090 Founders Edition, AMD Ryzen 9 7950X
NVIDIA GeForce RTX 3090, Corsair MP600
2512 Points +2%
SCHENKER XMG SECTOR, i9 13900K, RTX 4090, Intel Core i9-13900K
NVIDIA GeForce RTX 4090, Samsung SSD 980 Pro 2TB MZ-V8P2T0
2464 Points
AMD Ryzen 9 7900X, AMD Ryzen 9 7900X
NVIDIA GeForce RTX 3090,
2405 Points -2%
Corsair One i300, Intel Core i9-12900K
NVIDIA GeForce RTX 3080 Ti, Samsung PM9A1 MZVL22T0HBLB
2308 Points -6%
Intel Core i5-13600K, Intel Core i5-13600K
NVIDIA GeForce RTX 3090, Corsair MP600
2271 Points -8%
Intel NUC13 Raptor Canyon, Intel Core i9-13900K
NVIDIA GeForce RTX 3080 Ti, Kingston Fury Renegade SFYRS1000G
2263 Points -8%
Minisforum Neptune Series NAD9, Intel Core i9-12900H
Intel Iris Xe Graphics G7 96EUs, Kingston OM8PGP4512Q-A0
1894 Points -23%
Intel Dragon Canyon NUC - RTX 3060, Intel Core i9-12900
NVIDIA GeForce RTX 3060, Transcend M.2 SSD 2200S TS512GMTE220S
1785 Points -28%
CrossMark / Productivity
Intel Core i9-13900K, Intel Core i9-13900K
NVIDIA GeForce RTX 3090, Corsair MP600
2388 Points +6%
NVIDIA GeForce RTX 3090 Founders Edition, AMD Ryzen 9 7950X
NVIDIA GeForce RTX 3090, Corsair MP600
2336 Points +3%
SCHENKER XMG SECTOR, i9 13900K, RTX 4090, Intel Core i9-13900K
NVIDIA GeForce RTX 4090, Samsung SSD 980 Pro 2TB MZ-V8P2T0
2263 Points
AMD Ryzen 9 7900X, AMD Ryzen 9 7900X
NVIDIA GeForce RTX 3090,
2211 Points -2%
Corsair One i300, Intel Core i9-12900K
NVIDIA GeForce RTX 3080 Ti, Samsung PM9A1 MZVL22T0HBLB
2169 Points -4%
Intel Core i5-13600K, Intel Core i5-13600K
NVIDIA GeForce RTX 3090, Corsair MP600
2115 Points -7%
Intel NUC13 Raptor Canyon, Intel Core i9-13900K
NVIDIA GeForce RTX 3080 Ti, Kingston Fury Renegade SFYRS1000G
2059 Points -9%
Minisforum Neptune Series NAD9, Intel Core i9-12900H
Intel Iris Xe Graphics G7 96EUs, Kingston OM8PGP4512Q-A0
1921 Points -15%
Intel Dragon Canyon NUC - RTX 3060, Intel Core i9-12900
NVIDIA GeForce RTX 3060, Transcend M.2 SSD 2200S TS512GMTE220S
1816 Points -20%
CrossMark / Creativity
NVIDIA GeForce RTX 3090 Founders Edition, AMD Ryzen 9 7950X
NVIDIA GeForce RTX 3090, Corsair MP600
2786 Points +1%
Intel Core i9-13900K, Intel Core i9-13900K
NVIDIA GeForce RTX 3090, Corsair MP600
2784 Points +1%
SCHENKER XMG SECTOR, i9 13900K, RTX 4090, Intel Core i9-13900K
NVIDIA GeForce RTX 4090, Samsung SSD 980 Pro 2TB MZ-V8P2T0
2765 Points
AMD Ryzen 9 7900X, AMD Ryzen 9 7900X
NVIDIA GeForce RTX 3090,
2673 Points -3%
Intel NUC13 Raptor Canyon, Intel Core i9-13900K
NVIDIA GeForce RTX 3080 Ti, Kingston Fury Renegade SFYRS1000G
2625 Points -5%
Corsair One i300, Intel Core i9-12900K
NVIDIA GeForce RTX 3080 Ti, Samsung PM9A1 MZVL22T0HBLB
2495 Points -10%
Intel Core i5-13600K, Intel Core i5-13600K
NVIDIA GeForce RTX 3090, Corsair MP600
2412 Points -13%
Minisforum Neptune Series NAD9, Intel Core i9-12900H
Intel Iris Xe Graphics G7 96EUs, Kingston OM8PGP4512Q-A0
1800 Points -35%
Intel Dragon Canyon NUC - RTX 3060, Intel Core i9-12900
NVIDIA GeForce RTX 3060, Transcend M.2 SSD 2200S TS512GMTE220S
1724 Points -38%
CrossMark / Responsiveness
Intel Core i9-13900K, Intel Core i9-13900K
NVIDIA GeForce RTX 3090, Corsair MP600
2653 Points +18%
Intel Core i5-13600K, Intel Core i5-13600K
NVIDIA GeForce RTX 3090, Corsair MP600
2350 Points +4%
NVIDIA GeForce RTX 3090 Founders Edition, AMD Ryzen 9 7950X
NVIDIA GeForce RTX 3090, Corsair MP600
2288 Points +2%
AMD Ryzen 9 7900X, AMD Ryzen 9 7900X
NVIDIA GeForce RTX 3090,
2251 Points 0%
SCHENKER XMG SECTOR, i9 13900K, RTX 4090, Intel Core i9-13900K
NVIDIA GeForce RTX 4090, Samsung SSD 980 Pro 2TB MZ-V8P2T0
2251 Points
Corsair One i300, Intel Core i9-12900K
NVIDIA GeForce RTX 3080 Ti, Samsung PM9A1 MZVL22T0HBLB
2203 Points -2%
Minisforum Neptune Series NAD9, Intel Core i9-12900H
Intel Iris Xe Graphics G7 96EUs, Kingston OM8PGP4512Q-A0
2116 Points -6%
Intel NUC13 Raptor Canyon, Intel Core i9-13900K
NVIDIA GeForce RTX 3080 Ti, Kingston Fury Renegade SFYRS1000G
1929 Points -14%
Intel Dragon Canyon NUC - RTX 3060, Intel Core i9-12900
NVIDIA GeForce RTX 3060, Transcend M.2 SSD 2200S TS512GMTE220S
1885 Points -16%
AIDA64 / Memory Copy
SCHENKER XMG SECTOR, i9 13900K, RTX 4090
Intel Core i9-13900K, NVIDIA GeForce RTX 4090
80203 MB/s
Intel Core i9-13900K
Intel Core i9-13900K, NVIDIA GeForce RTX 3090
74937 MB/s -7%
Average Intel Core i9-13900K
  (68722 - 80203, n=4)
74763 MB/s -7%
Corsair One i300
Intel Core i9-12900K, NVIDIA GeForce RTX 3080 Ti
73501 MB/s -8%
Intel Core i9-12900K
Intel Core i9-12900K, NVIDIA Titan RTX
73146 MB/s -9%
NVIDIA GeForce RTX 3090 Founders Edition
AMD Ryzen 9 7950X, NVIDIA GeForce RTX 3090
73104 MB/s -9%
Intel Core i5-13600K
Intel Core i5-13600K, NVIDIA GeForce RTX 3090
71725 MB/s -11%
AMD Ryzen 9 7900X
AMD Ryzen 9 7900X, NVIDIA GeForce RTX 3090
69140 MB/s -14%
Intel NUC13 Raptor Canyon
Intel Core i9-13900K, NVIDIA GeForce RTX 3080 Ti
68722 MB/s -14%
Minisforum Neptune Series NAD9
Intel Core i9-12900H, Iris Xe G7 96EUs
45941 MB/s -43%
Average of class Desktop
  (15737 - 85092, n=27, last 2 years)
45069 MB/s -44%
Intel Dragon Canyon NUC - RTX 3060
Intel Core i9-12900, NVIDIA GeForce RTX 3060
44474 MB/s -45%
AIDA64 / Memory Read
SCHENKER XMG SECTOR, i9 13900K, RTX 4090
Intel Core i9-13900K, NVIDIA GeForce RTX 4090
88780 MB/s
Intel Core i9-13900K
Intel Core i9-13900K, NVIDIA GeForce RTX 3090
83883 MB/s -6%
Average Intel Core i9-13900K
  (73392 - 88780, n=4)
82310 MB/s -7%
Intel Core i9-12900K
Intel Core i9-12900K, NVIDIA Titan RTX
81059 MB/s -9%
NVIDIA GeForce RTX 3090 Founders Edition
AMD Ryzen 9 7950X, NVIDIA GeForce RTX 3090
78282 MB/s -12%
Intel Core i5-13600K
Intel Core i5-13600K, NVIDIA GeForce RTX 3090
75757 MB/s -15%
AMD Ryzen 9 7900X
AMD Ryzen 9 7900X, NVIDIA GeForce RTX 3090
75338 MB/s -15%
Corsair One i300
Intel Core i9-12900K, NVIDIA GeForce RTX 3080 Ti
74809 MB/s -16%
Intel NUC13 Raptor Canyon
Intel Core i9-13900K, NVIDIA GeForce RTX 3080 Ti
73392 MB/s -17%
Intel Dragon Canyon NUC - RTX 3060
Intel Core i9-12900, NVIDIA GeForce RTX 3060
49616 MB/s -44%
Minisforum Neptune Series NAD9
Intel Core i9-12900H, Iris Xe G7 96EUs
49559 MB/s -44%
Average of class Desktop
  (10311 - 94830, n=27, last 2 years)
47458 MB/s -47%
AIDA64 / Memory Write
NVIDIA GeForce RTX 3090 Founders Edition
AMD Ryzen 9 7950X, NVIDIA GeForce RTX 3090
79843 MB/s +1%
SCHENKER XMG SECTOR, i9 13900K, RTX 4090
Intel Core i9-13900K, NVIDIA GeForce RTX 4090
78678 MB/s
AMD Ryzen 9 7900X
AMD Ryzen 9 7900X, NVIDIA GeForce RTX 3090
76967 MB/s -2%
Intel Core i9-13900K
Intel Core i9-13900K, NVIDIA GeForce RTX 3090
74140 MB/s -6%
Average Intel Core i9-13900K
  (68948 - 78678, n=4)
73938 MB/s -6%
Intel Core i9-12900K
Intel Core i9-12900K, NVIDIA Titan RTX
73707 MB/s -6%
Intel Core i5-13600K
Intel Core i5-13600K, NVIDIA GeForce RTX 3090
73484 MB/s -7%
Corsair One i300
Intel Core i9-12900K, NVIDIA GeForce RTX 3080 Ti
72243 MB/s -8%
Intel NUC13 Raptor Canyon
Intel Core i9-13900K, NVIDIA GeForce RTX 3080 Ti
68948 MB/s -12%
Average of class Desktop
  (17031 - 82856, n=27, last 2 years)
48328 MB/s -39%
Minisforum Neptune Series NAD9
Intel Core i9-12900H, Iris Xe G7 96EUs
46815 MB/s -40%
Intel Dragon Canyon NUC - RTX 3060
Intel Core i9-12900, NVIDIA GeForce RTX 3060
45577 MB/s -42%
AIDA64 / Memory Latency
Minisforum Neptune Series NAD9
Intel Core i9-12900H, Iris Xe G7 96EUs
100 ns * -38%
Intel NUC13 Raptor Canyon
Intel Core i9-13900K, NVIDIA GeForce RTX 3080 Ti
93.4 ns * -29%
Intel Dragon Canyon NUC - RTX 3060
Intel Core i9-12900, NVIDIA GeForce RTX 3060
87.4 ns * -20%
Corsair One i300
Intel Core i9-12900K, NVIDIA GeForce RTX 3080 Ti
82.9 ns * -14%
Intel Core i5-13600K
Intel Core i5-13600K, NVIDIA GeForce RTX 3090
81.1 ns * -12%
Average Intel Core i9-13900K
  (72.6 - 93.4, n=4)
79.9 ns * -10%
Intel Core i9-13900K
Intel Core i9-13900K, NVIDIA GeForce RTX 3090
76.5 ns * -5%
Average of class Desktop
  (56 - 97.7, n=27, last 2 years)
74.9 ns * -3%
SCHENKER XMG SECTOR, i9 13900K, RTX 4090
Intel Core i9-13900K, NVIDIA GeForce RTX 4090
72.6 ns *
AMD Ryzen 9 7900X
AMD Ryzen 9 7900X, NVIDIA GeForce RTX 3090
63.3 ns * +13%
NVIDIA GeForce RTX 3090 Founders Edition
AMD Ryzen 9 7950X, NVIDIA GeForce RTX 3090
61.7 ns * +15%

* ... smaller is better

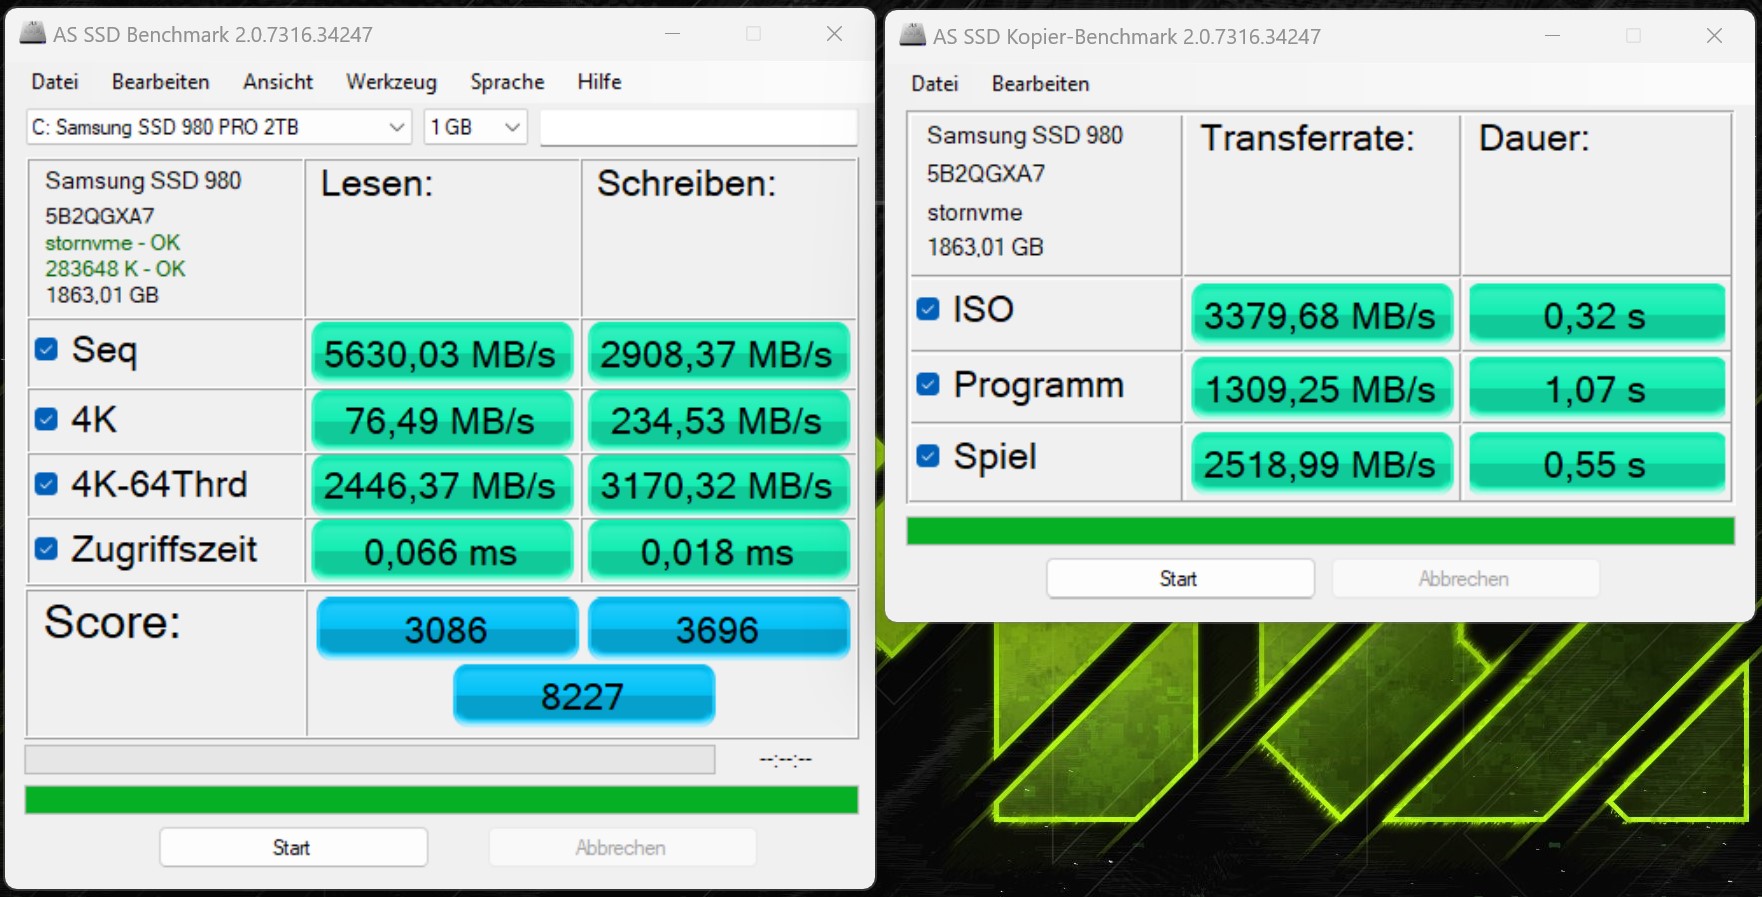
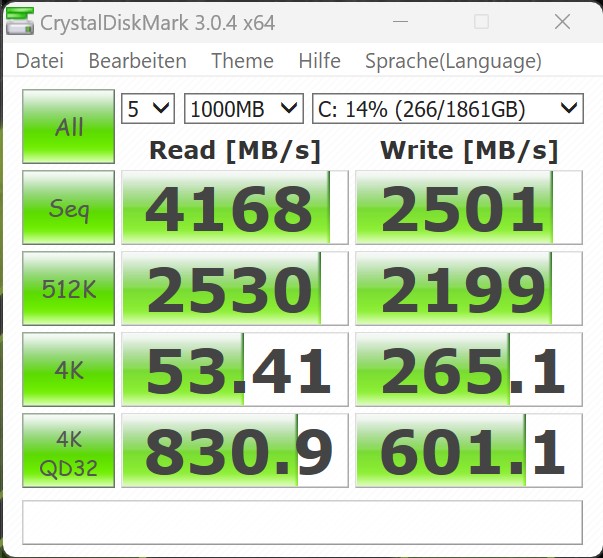
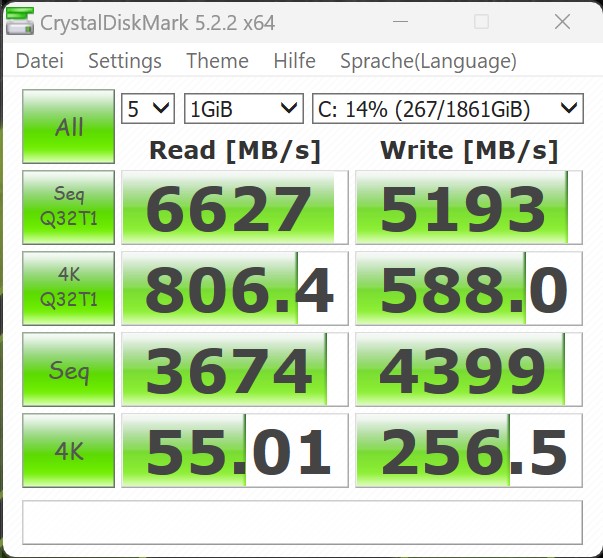
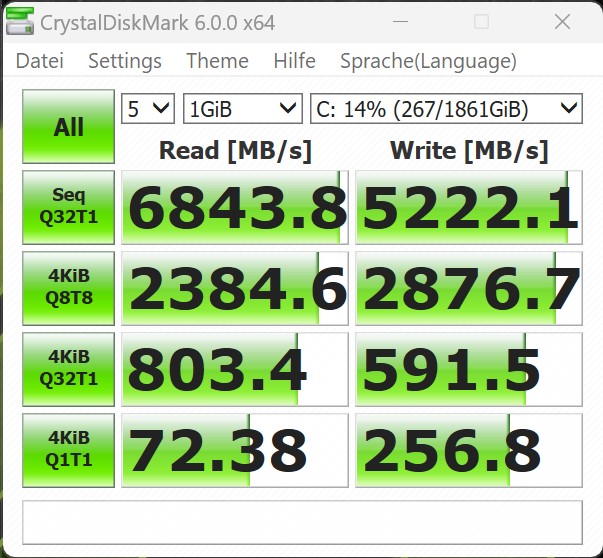
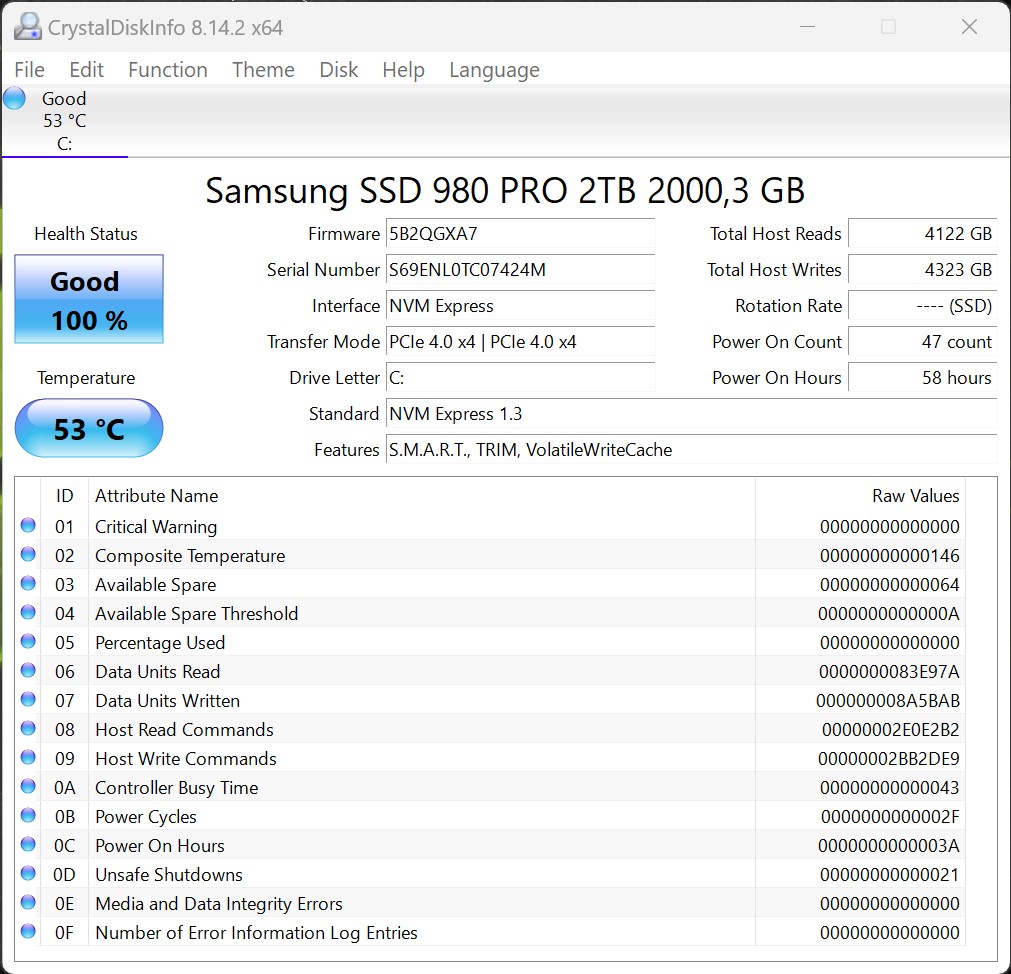
Armazenamento em massa

Samsung 980 Pro com uma capacidade de 2 TB

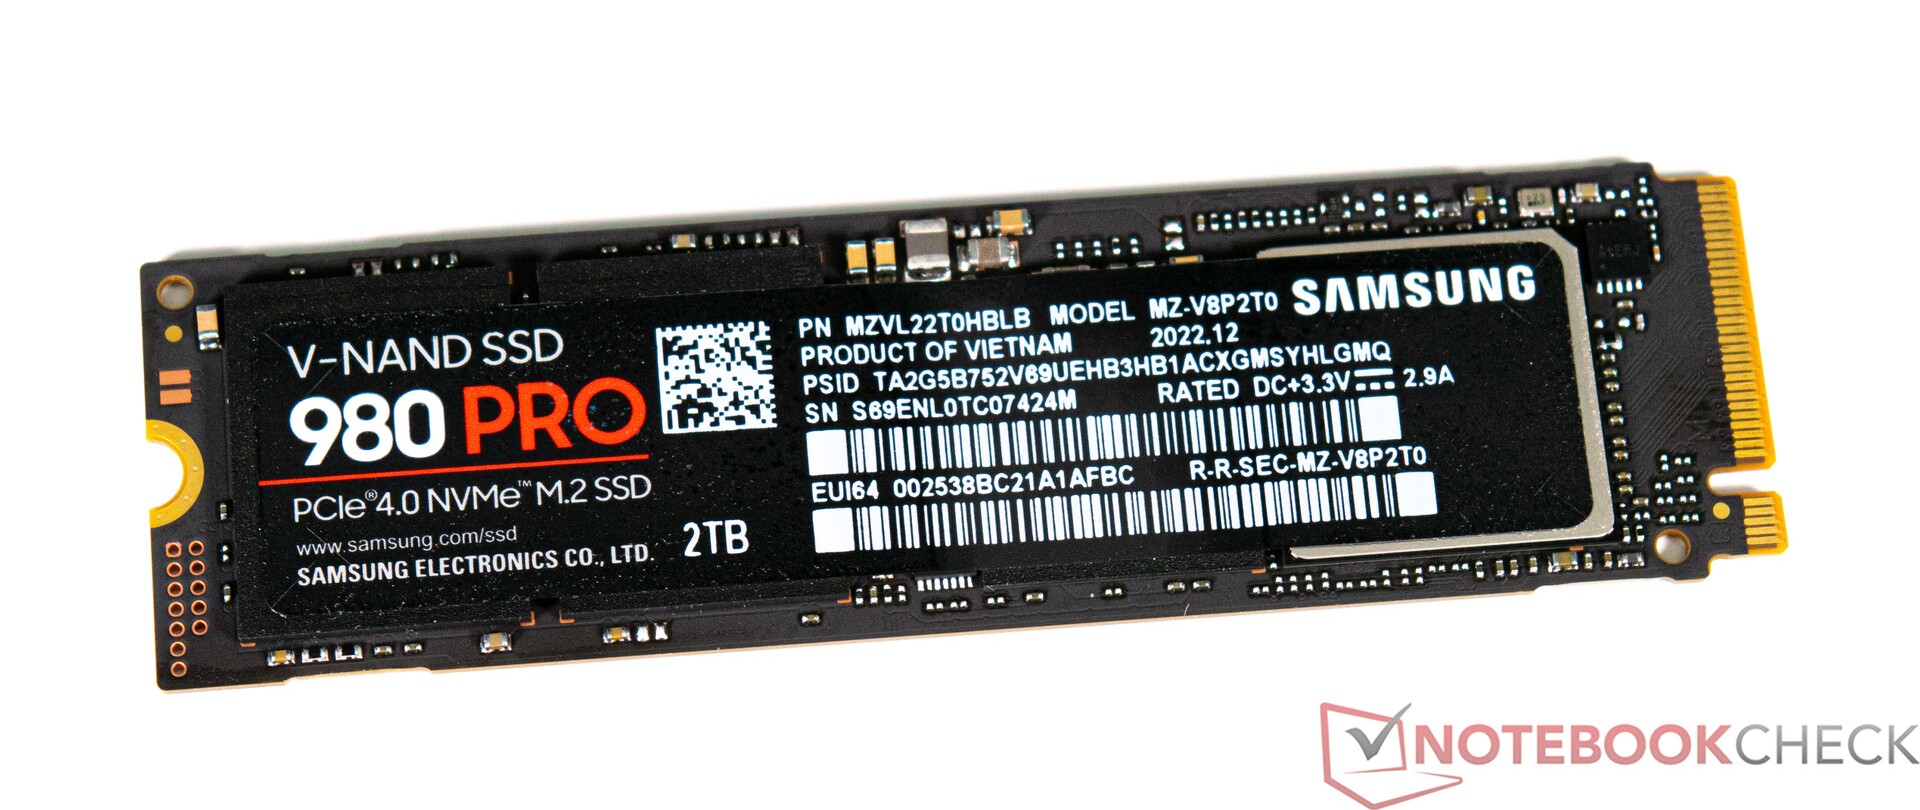
Nossa unidade de revisão está equipada com um SSD NVMe Samsung super rápido. O Samsung 980 Pro é um dos mais rápidos SSDs de grau de consumo. Isto é algo que também podemos ver em benchmarks: a unidade superou quase consistentemente as soluções de armazenamento em dispositivos concorrentes. Somente o Kingston Fury Renegade no Intel NUC13 Raptor Canyon foi capaz de superar o desempenho do Samsung 980 Pro no AS-SSD Benchmark. Dito isto, isto é suficiente para o SSD da Samsung ficar em primeiro lugar na classificação geral. Mesmo durante o teste de estresse, o drive conseguiu manter uma alta velocidade de leitura durante um período prolongado, indicando que o resfriamento do SSD é altamente eficaz.

Você pode instalar até mais três M.2 SSDs no Asus ROG Strix Z690-F Gaming. Há também a opção de conectar ainda mais unidades de armazenamento via SATA.

Consulte nossa tabela de comparação de dispositivos de armazenamento https://www.notebookcheck.net/Laptop-harddisks-HDD-SSD-benchmarks.22089.0.html para mais informações e benchmarks.

AS SSD
AS SSD
MDL 3
MDL 3
MDL 5
MDL 5
MDL 6
MDL 6
CDI
CDI
Samsung SSD 980 Pro 2TB MZ-V8P2T0
Sequential Read: 4168 MB/s
Sequential Write: 2501 MB/s
512K Read: 2530 MB/s
512K Write: 2199 MB/s
4K Read: 53.41 MB/s
4K Write: 265.1 MB/s
4K QD32 Read: 830.9 MB/s
4K QD32 Write: 601.1 MB/s
Drive Performance Rating - Percent
SCHENKER XMG SECTOR, i9 13900K, RTX 4090
Samsung SSD 980 Pro 2TB MZ-V8P2T0
78.4 pt
Corsair One i300
Samsung PM9A1 MZVL22T0HBLB
73.1 pt
NVIDIA GeForce RTX 3090 Founders Edition
Corsair MP600
70.1 pt
Intel NUC13 Raptor Canyon
Kingston Fury Renegade SFYRS1000G
67.6 pt
Minisforum Neptune Series NAD9
Kingston OM8PGP4512Q-A0
66.1 pt
Intel Core i5-13600K
Corsair MP600
65.9 pt
Intel Core i9-13900K
Corsair MP600
64.1 pt
Intel Core i9-12900K -11!
Intel Optane 905P 480GB 2.5
48.8 pt
Intel Dragon Canyon NUC - RTX 3060 -11!
Transcend M.2 SSD 2200S TS512GMTE220S
41.7 pt
Average of class Desktop
 
29.3 pt
DiskSpd
seq read
SCHENKER XMG SECTOR, i9 13900K, RTX 4090
Samsung SSD 980 Pro 2TB MZ-V8P2T0
4240 (4214.4min - 4240.14max) MB/s
Intel NUC13 Raptor Canyon
Kingston Fury Renegade SFYRS1000G
3912 (3515.15min - 3912.09max) MB/s -8%
Corsair One i300
Samsung PM9A1 MZVL22T0HBLB
3903 (3884.75min - 3902.54max) MB/s -8%
NVIDIA GeForce RTX 3090 Founders Edition
Corsair MP600
2844 (2808.51min - 2843.5max) MB/s -33%
Minisforum Neptune Series NAD9
Kingston OM8PGP4512Q-A0
2815 (2802.79min - 2814.97max) MB/s -34%
Intel Core i9-13900K
Corsair MP600
2559 (2552.58min - 2558.53max) MB/s -40%
Intel Core i5-13600K
Corsair MP600
2540 (2489.74min - 2539.65max) MB/s -40%
Intel Core i9-12900K
Intel Optane 905P 480GB 2.5
2399 (2391.55min - 2399.35max) MB/s -43%
Intel Dragon Canyon NUC - RTX 3060
Transcend M.2 SSD 2200S TS512GMTE220S
1936 (1755.26min - 1936.41max) MB/s -54%
Average of class Desktop
  (229 - 4276, n=23, last 2 years)
1823 MB/s -57%
seq write
SCHENKER XMG SECTOR, i9 13900K, RTX 4090
Samsung SSD 980 Pro 2TB MZ-V8P2T0
4415 (4407.16min - 4415.11max) MB/s
Intel NUC13 Raptor Canyon
Kingston Fury Renegade SFYRS1000G
4256 (3822.69min - 4255.75max) MB/s -4%
NVIDIA GeForce RTX 3090 Founders Edition
Corsair MP600
4249 (4220.68min - 4248.83max) MB/s -4%
Corsair One i300
Samsung PM9A1 MZVL22T0HBLB
3926 (3865.92min - 3925.78max) MB/s -11%
Minisforum Neptune Series NAD9
Kingston OM8PGP4512Q-A0
3402 (3372.67min - 3402.21max) MB/s -23%
Intel Core i9-13900K
Corsair MP600
2312 (2306.66min - 2312.32max) MB/s -48%
Intel Core i5-13600K
Corsair MP600
2298 (2289.29min - 2297.64max) MB/s -48%
Intel Core i9-12900K
Intel Optane 905P 480GB 2.5
2031 (2015.57min - 2031.3max) MB/s -54%
Average of class Desktop
  (105.7 - 6288, n=23, last 2 years)
1954 MB/s -56%
Intel Dragon Canyon NUC - RTX 3060
Transcend M.2 SSD 2200S TS512GMTE220S
1744 (525.75min - 1743.78max) MB/s -60%
seq q8 t1 read
Intel NUC13 Raptor Canyon
Kingston Fury Renegade SFYRS1000G
7116 (6584.47min - 7116.06max) MB/s +3%
SCHENKER XMG SECTOR, i9 13900K, RTX 4090
Samsung SSD 980 Pro 2TB MZ-V8P2T0
6887 (5840.78min - 6886.7max) MB/s
Corsair One i300
Samsung PM9A1 MZVL22T0HBLB
6756 (5986.3min - 6756.18max) MB/s -2%
Intel Dragon Canyon NUC - RTX 3060
Transcend M.2 SSD 2200S TS512GMTE220S
4996 (4330.97min - 4996.25max) MB/s -27%
NVIDIA GeForce RTX 3090 Founders Edition
Corsair MP600
4957 (2740.32min - 4956.62max) MB/s -28%
Minisforum Neptune Series NAD9
Kingston OM8PGP4512Q-A0
4801 (4506.78min - 4800.59max) MB/s -30%
Average of class Desktop
  (254 - 7219, n=23, last 2 years)
2949 MB/s -57%
Intel Core i5-13600K
Corsair MP600
2763 (2551.6min - 2763max) MB/s -60%
Intel Core i9-13900K
Corsair MP600
2754 (2536.92min - 2754.19max) MB/s -60%
Intel Core i9-12900K
Intel Optane 905P 480GB 2.5
2609 (2459.44min - 2609.28max) MB/s -62%
seq q8 t1 write
Intel NUC13 Raptor Canyon
Kingston Fury Renegade SFYRS1000G
6135 (6096.84min - 6134.8max) MB/s +22%
SCHENKER XMG SECTOR, i9 13900K, RTX 4090
Samsung SSD 980 Pro 2TB MZ-V8P2T0
5013 (5000.1min - 5013.07max) MB/s
Corsair One i300
Samsung PM9A1 MZVL22T0HBLB
4979 (4960.54min - 4978.96max) MB/s -1%
NVIDIA GeForce RTX 3090 Founders Edition
Corsair MP600
4245 (4146.91min - 4245.26max) MB/s -15%
Minisforum Neptune Series NAD9
Kingston OM8PGP4512Q-A0
3402 (3374.28min - 3401.67max) MB/s -32%
Intel Dragon Canyon NUC - RTX 3060
Transcend M.2 SSD 2200S TS512GMTE220S
2524 (535.17min - 2524.36max) MB/s -50%
Intel Core i5-13600K
Corsair MP600
2460 (2453.46min - 2459.54max) MB/s -51%
Intel Core i9-13900K
Corsair MP600
2456 (2454.84min - 2455.97max) MB/s -51%
Average of class Desktop
  (100.9 - 6920, n=23, last 2 years)
2404 MB/s -52%
Intel Core i9-12900K
Intel Optane 905P 480GB 2.5
2196 (2180.83min - 2195.51max) MB/s -56%
4k q1 t1 read
Intel Core i9-13900K
Corsair MP600
345 (343.41min - 344.76max) MB/s +275%
Intel Core i5-13600K
Corsair MP600
325 (323.73min - 325.16max) MB/s +254%
Intel Core i9-12900K
Intel Optane 905P 480GB 2.5
285 (284min - 285.36max) MB/s +210%
SCHENKER XMG SECTOR, i9 13900K, RTX 4090
Samsung SSD 980 Pro 2TB MZ-V8P2T0
91.9 (91.15min - 91.85max) MB/s
Corsair One i300
Samsung PM9A1 MZVL22T0HBLB
87.2 (87.01min - 87.2max) MB/s -5%
Intel NUC13 Raptor Canyon
Kingston Fury Renegade SFYRS1000G
86.5 (82.21min - 86.46max) MB/s -6%
Minisforum Neptune Series NAD9
Kingston OM8PGP4512Q-A0
82.1 (81.4min - 82.09max) MB/s -11%
NVIDIA GeForce RTX 3090 Founders Edition
Corsair MP600
62.3 (58.37min - 62.31max) MB/s -32%
Average of class Desktop
  (13.7 - 91.9, n=23, last 2 years)
51.7 MB/s -44%
Intel Dragon Canyon NUC - RTX 3060
Transcend M.2 SSD 2200S TS512GMTE220S
45.7 (45.38min - 45.71max) MB/s -50%
4k q1 t1 write
Minisforum Neptune Series NAD9
Kingston OM8PGP4512Q-A0
425 (415.92min - 425.01max) MB/s +57%
NVIDIA GeForce RTX 3090 Founders Edition
Corsair MP600
351 (297.15min - 350.84max) MB/s +30%
Intel Dragon Canyon NUC - RTX 3060
Transcend M.2 SSD 2200S TS512GMTE220S
320 (298.75min - 319.53max) MB/s +18%
Intel Core i9-13900K
Corsair MP600
310 (308.09min - 309.59max) MB/s +14%
Corsair One i300
Samsung PM9A1 MZVL22T0HBLB
295 (288.34min - 294.77max) MB/s +9%
Intel Core i5-13600K
Corsair MP600
294 (291.43min - 294.03max) MB/s +8%
SCHENKER XMG SECTOR, i9 13900K, RTX 4090
Samsung SSD 980 Pro 2TB MZ-V8P2T0
271 (264.25min - 270.78max) MB/s
Intel Core i9-12900K
Intel Optane 905P 480GB 2.5
246 (244.38min - 245.84max) MB/s -9%
Intel NUC13 Raptor Canyon
Kingston Fury Renegade SFYRS1000G
192 (183.56min - 191.99max) MB/s -29%
Average of class Desktop
  (13.8 - 364, n=23, last 2 years)
181.6 MB/s -33%
4k q32 t16 read
SCHENKER XMG SECTOR, i9 13900K, RTX 4090
Samsung SSD 980 Pro 2TB MZ-V8P2T0
4319 (4295.11min - 4319max) MB/s
Corsair One i300
Samsung PM9A1 MZVL22T0HBLB
4073 (4068.14min - 4073.28max) MB/s -6%
NVIDIA GeForce RTX 3090 Founders Edition
Corsair MP600
3104 (3072.88min - 3104.25max) MB/s -28%
Intel Core i5-13600K
Corsair MP600
2431 (2427.76min - 2431.49max) MB/s -44%
Intel Core i9-13900K
Corsair MP600
2430 (2426.93min - 2430.36max) MB/s -44%
Intel Core i9-12900K
Intel Optane 905P 480GB 2.5
2297 (2286.24min - 2297max) MB/s -47%
Minisforum Neptune Series NAD9
Kingston OM8PGP4512Q-A0
1944 (1936.89min - 1943.53max) MB/s -55%
Intel NUC13 Raptor Canyon
Kingston Fury Renegade SFYRS1000G
1176 (1157.2min - 1176.4max) MB/s -73%
Average of class Desktop
  (26 - 4319, n=23, last 2 years)
1091 MB/s -75%
Intel Dragon Canyon NUC - RTX 3060
Transcend M.2 SSD 2200S TS512GMTE220S
970 (966.45min - 970.29max) MB/s -78%
4k q32 t16 write
SCHENKER XMG SECTOR, i9 13900K, RTX 4090
Samsung SSD 980 Pro 2TB MZ-V8P2T0
4245 (4217.75min - 4244.71max) MB/s
NVIDIA GeForce RTX 3090 Founders Edition
Corsair MP600
3746 (3719.98min - 3746.14max) MB/s -12%
Corsair One i300
Samsung PM9A1 MZVL22T0HBLB
3528 (3508.87min - 3527.71max) MB/s -17%
Intel Core i5-13600K
Corsair MP600
2471 (2463.07min - 2471.47max) MB/s -42%
Intel Core i9-13900K
Corsair MP600
2464 (2459.08min - 2464.27max) MB/s -42%
Minisforum Neptune Series NAD9
Kingston OM8PGP4512Q-A0
2396 (2376.28min - 2396.46max) MB/s -44%
Average of class Desktop
  (13.1 - 5015, n=23, last 2 years)
1168 MB/s -72%
Intel Dragon Canyon NUC - RTX 3060
Transcend M.2 SSD 2200S TS512GMTE220S
1119 (483.18min - 1119.3max) MB/s -74%
Intel Core i9-12900K
Intel Optane 905P 480GB 2.5
919 (908.14min - 919.3max) MB/s -78%
Intel NUC13 Raptor Canyon
Kingston Fury Renegade SFYRS1000G
538 (527.91min - 538.21max) MB/s -87%
AS SSD
Score Total
Intel NUC13 Raptor Canyon
Kingston Fury Renegade SFYRS1000G
8263 Points 0%
SCHENKER XMG SECTOR, i9 13900K, RTX 4090
Samsung SSD 980 Pro 2TB MZ-V8P2T0
8227 Points
NVIDIA GeForce RTX 3090 Founders Edition
Corsair MP600
8017 Points -3%
Minisforum Neptune Series NAD9
Kingston OM8PGP4512Q-A0
7134 Points -13%
Intel Core i5-13600K
Corsair MP600
6769 Points -18%
Corsair One i300
Samsung PM9A1 MZVL22T0HBLB
6693 Points -19%
Average of class Desktop
  (136 - 8347, n=19, last 2 years)
2905 Points -65%
Intel Core i9-13900K
Corsair MP600
509.99 Points -94%
Score Read
SCHENKER XMG SECTOR, i9 13900K, RTX 4090
Samsung SSD 980 Pro 2TB MZ-V8P2T0
3086 Points
Intel Core i9-13900K
Corsair MP600
2877 Points -7%
Corsair One i300
Samsung PM9A1 MZVL22T0HBLB
2777 Points -10%
Intel Core i5-13600K
Corsair MP600
2748 Points -11%
NVIDIA GeForce RTX 3090 Founders Edition
Corsair MP600
2590 Points -16%
Minisforum Neptune Series NAD9
Kingston OM8PGP4512Q-A0
2391 Points -23%
Intel NUC13 Raptor Canyon
Kingston Fury Renegade SFYRS1000G
1792 Points -42%
Average of class Desktop
  (65 - 3253, n=19, last 2 years)
1041 Points -66%
Score Write
Intel NUC13 Raptor Canyon
Kingston Fury Renegade SFYRS1000G
5665 Points +53%
NVIDIA GeForce RTX 3090 Founders Edition
Corsair MP600
4109 Points +11%
SCHENKER XMG SECTOR, i9 13900K, RTX 4090
Samsung SSD 980 Pro 2TB MZ-V8P2T0
3696 Points
Minisforum Neptune Series NAD9
Kingston OM8PGP4512Q-A0
3538 Points -4%
Intel Core i9-13900K
Corsair MP600
2700 Points -27%
Corsair One i300
Samsung PM9A1 MZVL22T0HBLB
2556 Points -31%
Intel Core i5-13600K
Corsair MP600
2515 Points -32%
Average of class Desktop
  (39 - 5665, n=19, last 2 years)
1451 Points -61%
Seq Read
Intel NUC13 Raptor Canyon
Kingston Fury Renegade SFYRS1000G
5664 MB/s +1%
SCHENKER XMG SECTOR, i9 13900K, RTX 4090
Samsung SSD 980 Pro 2TB MZ-V8P2T0
5630 MB/s
Corsair One i300
Samsung PM9A1 MZVL22T0HBLB
5397 MB/s -4%
NVIDIA GeForce RTX 3090 Founders Edition
Corsair MP600
4220.6 MB/s -25%
Minisforum Neptune Series NAD9
Kingston OM8PGP4512Q-A0
4147 MB/s -26%
Intel Core i9-13900K
Corsair MP600
2533 MB/s -55%
Intel Core i5-13600K
Corsair MP600
2402 MB/s -57%
Average of class Desktop
  (265 - 6331, n=19, last 2 years)
2188 MB/s -61%
Seq Write
Corsair One i300
Samsung PM9A1 MZVL22T0HBLB
4006 MB/s +38%
NVIDIA GeForce RTX 3090 Founders Edition
Corsair MP600
4005.1 MB/s +38%
Minisforum Neptune Series NAD9
Kingston OM8PGP4512Q-A0
3292 MB/s +13%
Intel NUC13 Raptor Canyon
Kingston Fury Renegade SFYRS1000G
3081 MB/s +6%
SCHENKER XMG SECTOR, i9 13900K, RTX 4090
Samsung SSD 980 Pro 2TB MZ-V8P2T0
2908 MB/s
Intel Core i9-13900K
Corsair MP600
2169 MB/s -25%
Intel Core i5-13600K
Corsair MP600
2070 MB/s -29%
Average of class Desktop
  (117 - 5326, n=19, last 2 years)
1507 MB/s -48%
4K Read
Intel Core i9-13900K
Corsair MP600
314.36 MB/s +311%
Intel Core i5-13600K
Corsair MP600
295.51 MB/s +286%
Minisforum Neptune Series NAD9
Kingston OM8PGP4512Q-A0
103.66 MB/s +36%
Corsair One i300
Samsung PM9A1 MZVL22T0HBLB
83 MB/s +8%
Intel NUC13 Raptor Canyon
Kingston Fury Renegade SFYRS1000G
77.71 MB/s +2%
SCHENKER XMG SECTOR, i9 13900K, RTX 4090
Samsung SSD 980 Pro 2TB MZ-V8P2T0
76.5 MB/s
NVIDIA GeForce RTX 3090 Founders Edition
Corsair MP600
68.86 MB/s -10%
Average of class Desktop
  (13.2 - 83.7, n=19, last 2 years)
48.7 MB/s -36%
4K Write
Minisforum Neptune Series NAD9
Kingston OM8PGP4512Q-A0
365.87 MB/s +56%
Intel Core i9-13900K
Corsair MP600
277.34 MB/s +18%
Intel NUC13 Raptor Canyon
Kingston Fury Renegade SFYRS1000G
272.11 MB/s +16%
Intel Core i5-13600K
Corsair MP600
262.68 MB/s +12%
Corsair One i300
Samsung PM9A1 MZVL22T0HBLB
236.7 MB/s +1%
SCHENKER XMG SECTOR, i9 13900K, RTX 4090
Samsung SSD 980 Pro 2TB MZ-V8P2T0
235 MB/s
NVIDIA GeForce RTX 3090 Founders Edition
Corsair MP600
233.83 MB/s 0%
Average of class Desktop
  (13.5 - 272, n=19, last 2 years)
137.9 MB/s -41%
4K-64 Read
SCHENKER XMG SECTOR, i9 13900K, RTX 4090
Samsung SSD 980 Pro 2TB MZ-V8P2T0
2446 MB/s
Intel Core i9-13900K
Corsair MP600
2308.94 MB/s -6%
Intel Core i5-13600K
Corsair MP600
2212.67 MB/s -10%
Corsair One i300
Samsung PM9A1 MZVL22T0HBLB
2154 MB/s -12%
NVIDIA GeForce RTX 3090 Founders Edition
Corsair MP600
2098.67 MB/s -14%
Minisforum Neptune Series NAD9
Kingston OM8PGP4512Q-A0
1872.82 MB/s -23%
Intel NUC13 Raptor Canyon
Kingston Fury Renegade SFYRS1000G
1148.16 MB/s -53%
Average of class Desktop
  (25.7 - 2536, n=19, last 2 years)
774 MB/s -68%
4K-64 Write
Intel NUC13 Raptor Canyon
Kingston Fury Renegade SFYRS1000G
5085.1 MB/s +60%
NVIDIA GeForce RTX 3090 Founders Edition
Corsair MP600
3474.92 MB/s +10%
SCHENKER XMG SECTOR, i9 13900K, RTX 4090
Samsung SSD 980 Pro 2TB MZ-V8P2T0
3170 MB/s
Minisforum Neptune Series NAD9
Kingston OM8PGP4512Q-A0
2842.9 MB/s -10%
Intel Core i9-13900K
Corsair MP600
2205.84 MB/s -30%
Intel Core i5-13600K
Corsair MP600
2045.48 MB/s -35%
Corsair One i300
Samsung PM9A1 MZVL22T0HBLB
1918 MB/s -39%
Average of class Desktop
  (13.7 - 5085, n=19, last 2 years)
1163 MB/s -63%
Access Time Read
Average of class Desktop
  (0.031 - 0.311, n=19, last 2 years)
0.1203 ms * -82%
NVIDIA GeForce RTX 3090 Founders Edition
Corsair MP600
0.108 ms * -64%
Intel NUC13 Raptor Canyon
Kingston Fury Renegade SFYRS1000G
0.104 ms * -58%
Minisforum Neptune Series NAD9
Kingston OM8PGP4512Q-A0
0.074 ms * -12%
Corsair One i300
Samsung PM9A1 MZVL22T0HBLB
0.068 ms * -3%
SCHENKER XMG SECTOR, i9 13900K, RTX 4090
Samsung SSD 980 Pro 2TB MZ-V8P2T0
0.066 ms *
Intel Core i5-13600K
Corsair MP600
0.012 ms * +82%
Intel Core i9-13900K
Corsair MP600
0.011 ms * +83%
Access Time Write
Average of class Desktop
  (0.013 - 0.942, n=19, last 2 years)
0.1395 ms * -675%
Minisforum Neptune Series NAD9
Kingston OM8PGP4512Q-A0
0.031 ms * -72%
SCHENKER XMG SECTOR, i9 13900K, RTX 4090
Samsung SSD 980 Pro 2TB MZ-V8P2T0
0.018 ms *
Corsair One i300
Samsung PM9A1 MZVL22T0HBLB
0.017 ms * +6%
Intel Core i5-13600K
Corsair MP600
0.017 ms * +6%
Intel Core i9-13900K
Corsair MP600
0.016 ms * +11%
NVIDIA GeForce RTX 3090 Founders Edition
Corsair MP600
0.013 ms * +28%
Intel NUC13 Raptor Canyon
Kingston Fury Renegade SFYRS1000G
0.013 ms * +28%

* ... smaller is better

Sustained Read: DiskSpd Read Loop, Queue Depth 8

034569010351380172520702415276031053450379541404485483051755520586562106555Tooltip
SCHENKER XMG SECTOR, i9 13900K, RTX 4090 Samsung SSD 980 Pro 2TB MZ-V8P2T0: Ø6854 (6193.52-6882.3)
Morefine S500+ ADATA XPG Gammix S11L 1024GB: Ø2165 (2034.95-2173.28)
Minisforum EliteMini B550 Kingston OM8PDP3512B-AI1: Ø2353 (2170.7-2362.34)
Minisforum EliteMini TH50 Kingston OM8PDP3512B-AI1: Ø1905 (1097.76-2359.4)
Minipc Union Ace Magician TK11-A0 Future Path FPE220M8SSD512G: Ø2219 (1791.18-2464.68)

Placa gráfica - Sem compromisso com a GeForce RTX 4090

MSI GeForce RTX 4090 VENTUS 3X

Padrões de referência sintéticos

Opções de GPU (fonte: Schenker)

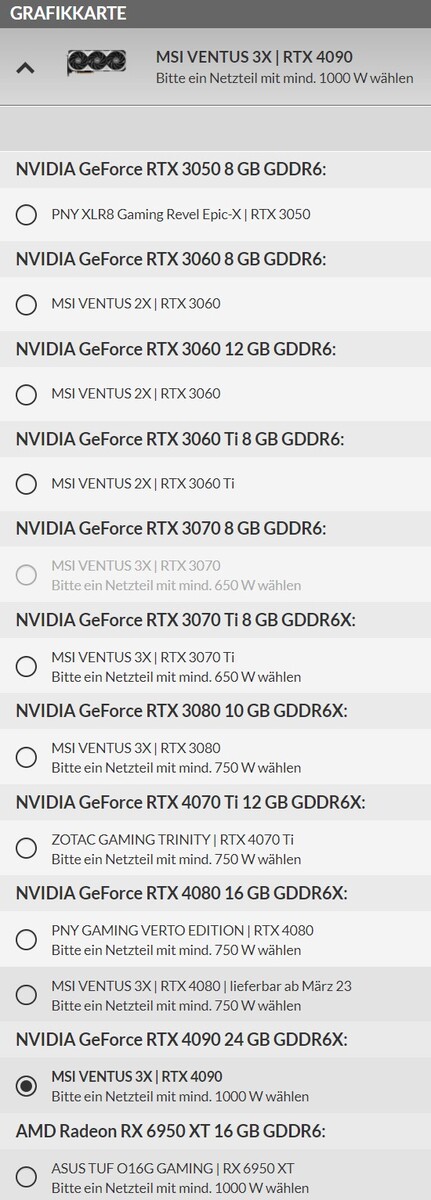
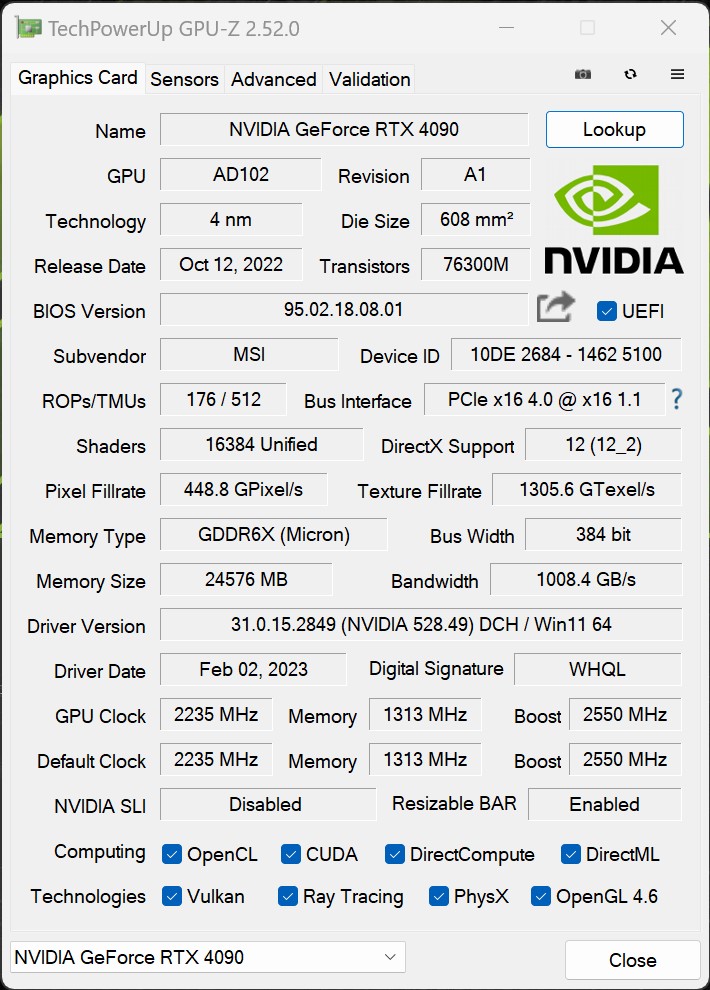
Nossa amostra de revisão está equipada com a placa gráfica de consumo mais rápida no momento - a Nvidia GeForce RTX 4090. A GPU proporcionou um desempenho imensamente alto em todos os nossos testes sintéticos, o que está muito de acordo com nossas expectativas. Em conjunto com a Núcleo i9-13900Ka unidade de revisão desembarcou em segundo lugar na classificação 3DMark. O primeiro lugar foi reivindicado por outroGeForce RTX 4090, desta vez um modelo da KFA2. No entanto, o MSI GeForce RTX 4090 VENTUS 3X pode se segurar muito bem contra o cartão KFA2. O modelo MSI ocupa um grande espaço no XMG SECTOR Intel. Entretanto, a MSI decidiu não dar à placa nenhum efeito de iluminação extravagante. A principal GPU Nvidia tem uma vantagem considerável sobre as placas gráficas AMD de alta qualidade. O configurador permite que você escolha entre uma ampla gama de placas gráficas das séries Nvidia 30 e 40. Se você quer absolutamente uma placa AMD em seu sistema, sua única opção aqui é uma Radeon RX 6950 XT. Os cartões da série 7000 da AMD não estão atualmente disponíveis para seleção.

Vá direto para esta página para mais informações técnicas sobre a Nvidia GeForce RTX 4090.

Visite nossa tabela de comparação de GPU https://www.notebookcheck.net/Mobile-Graphics-Cards-Benchmark-List.844.0.html para mais informações e resultados de referência.

3DMark Performance Rating - Percent
KFA2 GeForce RTX 4090 SG
NVIDIA GeForce RTX 4090, AMD Ryzen 9 7950X
100 pt
SCHENKER XMG SECTOR, i9 13900K, RTX 4090
NVIDIA GeForce RTX 4090, Intel Core i9-13900K
94.5 pt
AMD Radeon RX 7900 XTX
AMD Radeon RX 7900 XTX, AMD Ryzen 9 7950X
85 pt
KFA2 GeForce RTX 4080 SG
NVIDIA GeForce RTX 4080, AMD Ryzen 9 7950X
81.1 pt
AMD Radeon RX 7900 XT
AMD Radeon RX 7900 XT, AMD Ryzen 9 7950X
76.7 pt
MSI Radeon RX 6950 XT Gaming X Trio
AMD Radeon RX 6950 XT, AMD Ryzen 9 7950X
70.1 pt
KFA2 GeForce RTX 4070 Ti SG
NVIDIA GeForce RTX 4070 Ti, AMD Ryzen 9 7950X
66.2 pt
AMD Ryzen 9 7950X -1!
NVIDIA GeForce RTX 3090, AMD Ryzen 9 7950X
57.3 pt
Intel NUC13 Raptor Canyon
NVIDIA GeForce RTX 3080 Ti, Intel Core i9-13900K
56.4 pt
3DMark 11 - 1280x720 Performance GPU
KFA2 GeForce RTX 4090 SG
NVIDIA GeForce RTX 4090, AMD Ryzen 9 7950X
106709 Points +6%
SCHENKER XMG SECTOR, i9 13900K, RTX 4090
NVIDIA GeForce RTX 4090, Intel Core i9-13900K
100321 Points
KFA2 GeForce RTX 4080 SG
NVIDIA GeForce RTX 4080, AMD Ryzen 9 7950X
88359 Points -12%
AMD Radeon RX 7900 XTX
AMD Radeon RX 7900 XTX, AMD Ryzen 9 7950X
83322 Points -17%
AMD Radeon RX 7900 XT
AMD Radeon RX 7900 XT, AMD Ryzen 9 7950X
77784 Points -22%
KFA2 GeForce RTX 4070 Ti SG
NVIDIA GeForce RTX 4070 Ti, AMD Ryzen 9 7950X
75231 Points -25%
MSI Radeon RX 6950 XT Gaming X Trio
AMD Radeon RX 6950 XT, AMD Ryzen 9 7950X
73975 Points -26%
Intel NUC13 Raptor Canyon
NVIDIA GeForce RTX 3080 Ti, Intel Core i9-13900K
59799 Points -40%
AMD Ryzen 9 7950X
NVIDIA GeForce RTX 3090, AMD Ryzen 9 7950X
59280 Points -41%
3DMark
1920x1080 Fire Strike Graphics
KFA2 GeForce RTX 4090 SG
NVIDIA GeForce RTX 4090, AMD Ryzen 9 7950X
72165 Points +15%
AMD Radeon RX 7900 XTX
AMD Radeon RX 7900 XTX, AMD Ryzen 9 7950X
66967 Points +7%
KFA2 GeForce RTX 4080 SG
NVIDIA GeForce RTX 4080, AMD Ryzen 9 7950X
65190 Points +4%
AMD Radeon RX 7900 XT
AMD Radeon RX 7900 XT, AMD Ryzen 9 7950X
63712 Points +1%
SCHENKER XMG SECTOR, i9 13900K, RTX 4090
NVIDIA GeForce RTX 4090, Intel Core i9-13900K
62815 Points
MSI Radeon RX 6950 XT Gaming X Trio
AMD Radeon RX 6950 XT, AMD Ryzen 9 7950X
59672 Points -5%
KFA2 GeForce RTX 4070 Ti SG
NVIDIA GeForce RTX 4070 Ti, AMD Ryzen 9 7950X
53360 Points -15%
AMD Ryzen 9 7950X
NVIDIA GeForce RTX 3090, AMD Ryzen 9 7950X
46534 Points -26%
Intel NUC13 Raptor Canyon
NVIDIA GeForce RTX 3080 Ti, Intel Core i9-13900K
46469 Points -26%
2560x1440 Time Spy Graphics
KFA2 GeForce RTX 4090 SG
NVIDIA GeForce RTX 4090, AMD Ryzen 9 7950X
36252 Points +1%
SCHENKER XMG SECTOR, i9 13900K, RTX 4090
NVIDIA GeForce RTX 4090, Intel Core i9-13900K
35941 Points
AMD Radeon RX 7900 XTX
AMD Radeon RX 7900 XTX, AMD Ryzen 9 7950X
29699 Points -17%
KFA2 GeForce RTX 4080 SG
NVIDIA GeForce RTX 4080, AMD Ryzen 9 7950X
27791 Points -23%
AMD Radeon RX 7900 XT
AMD Radeon RX 7900 XT, AMD Ryzen 9 7950X
25874 Points -28%
KFA2 GeForce RTX 4070 Ti SG
NVIDIA GeForce RTX 4070 Ti, AMD Ryzen 9 7950X
22584 Points -37%
MSI Radeon RX 6950 XT Gaming X Trio
AMD Radeon RX 6950 XT, AMD Ryzen 9 7950X
22289 Points -38%
Intel NUC13 Raptor Canyon
NVIDIA GeForce RTX 3080 Ti, Intel Core i9-13900K
19367 Points -46%
AMD Ryzen 9 7950X
NVIDIA GeForce RTX 3090, AMD Ryzen 9 7950X
18786 Points -48%
Fire Strike Extreme Graphics
KFA2 GeForce RTX 4090 SG
NVIDIA GeForce RTX 4090, AMD Ryzen 9 7950X
45470 Points +2%
SCHENKER XMG SECTOR, i9 13900K, RTX 4090
NVIDIA GeForce RTX 4090, Intel Core i9-13900K
44549 Points
AMD Radeon RX 7900 XTX
AMD Radeon RX 7900 XTX, AMD Ryzen 9 7950X
39570 Points -11%
KFA2 GeForce RTX 4080 SG
NVIDIA GeForce RTX 4080, AMD Ryzen 9 7950X
33912 Points -24%
AMD Radeon RX 7900 XT
AMD Radeon RX 7900 XT, AMD Ryzen 9 7950X
33747 Points -24%
MSI Radeon RX 6950 XT Gaming X Trio
AMD Radeon RX 6950 XT, AMD Ryzen 9 7950X
30406 Points -32%
KFA2 GeForce RTX 4070 Ti SG
NVIDIA GeForce RTX 4070 Ti, AMD Ryzen 9 7950X
26470 Points -41%
Intel NUC13 Raptor Canyon
NVIDIA GeForce RTX 3080 Ti, Intel Core i9-13900K
23460 Points -47%
Performance Rating - Percent
SCHENKER XMG SECTOR, i9 13900K, RTX 4090
NVIDIA GeForce RTX 4090, i9-13900K, Samsung SSD 980 Pro 2TB MZ-V8P2T0
99.6 pt
KFA2 GeForce RTX 4090 SG
NVIDIA GeForce RTX 4090, R9 7950X, Corsair MP600 GS
97.9 pt
AMD Radeon RX 7900 XTX
Radeon RX 7900 XTX, R9 7950X
78.2 pt
KFA2 GeForce RTX 4080 SG
NVIDIA GeForce RTX 4080, R9 7950X, Corsair MP600
77.5 pt
AMD Radeon RX 7900 XT
Radeon RX 7900 XT, R9 7950X
68.5 pt
KFA2 GeForce RTX 4070 Ti SG
NVIDIA GeForce RTX 4070 Ti, R9 7950X, Corsair MP600
62.7 pt
Intel NUC13 Raptor Canyon
NVIDIA GeForce RTX 3080 Ti, i9-13900K, Kingston Fury Renegade SFYRS1000G
61 pt
MSI Radeon RX 6950 XT Gaming X Trio
Radeon RX 6950 XT, R9 7950X
60.2 pt
Unigine Heaven 4.0
Extreme Preset OpenGL
SCHENKER XMG SECTOR, i9 13900K, RTX 4090
NVIDIA GeForce RTX 4090, i9-13900K, Samsung SSD 980 Pro 2TB MZ-V8P2T0
449.8 fps
KFA2 GeForce RTX 4090 SG
NVIDIA GeForce RTX 4090, R9 7950X, Corsair MP600 GS
447.1 fps -1%
KFA2 GeForce RTX 4080 SG
NVIDIA GeForce RTX 4080, R9 7950X, Corsair MP600
371.1 fps -17%
AMD Radeon RX 7900 XTX
Radeon RX 7900 XTX, R9 7950X
370.2 fps -18%
AMD Radeon RX 7900 XT
Radeon RX 7900 XT, R9 7950X
330.2 fps -27%
KFA2 GeForce RTX 4070 Ti SG
NVIDIA GeForce RTX 4070 Ti, R9 7950X, Corsair MP600
297.2 fps -34%
Intel NUC13 Raptor Canyon
NVIDIA GeForce RTX 3080 Ti, i9-13900K, Kingston Fury Renegade SFYRS1000G
279.3 fps -38%
MSI Radeon RX 6950 XT Gaming X Trio
Radeon RX 6950 XT, R9 7950X
251.9 fps -44%
Extreme Preset DX11
KFA2 GeForce RTX 4090 SG
NVIDIA GeForce RTX 4090, R9 7950X, Corsair MP600 GS
486.9 fps +3%
SCHENKER XMG SECTOR, i9 13900K, RTX 4090
NVIDIA GeForce RTX 4090, i9-13900K, Samsung SSD 980 Pro 2TB MZ-V8P2T0
471.6 fps
KFA2 GeForce RTX 4080 SG
NVIDIA GeForce RTX 4080, R9 7950X, Corsair MP600
399.9 fps -15%
AMD Radeon RX 7900 XTX
Radeon RX 7900 XTX, R9 7950X
357.6 fps -24%
AMD Radeon RX 7900 XT
Radeon RX 7900 XT, R9 7950X
319.7 fps -32%
KFA2 GeForce RTX 4070 Ti SG
NVIDIA GeForce RTX 4070 Ti, R9 7950X, Corsair MP600
318.6 fps -32%
MSI Radeon RX 6950 XT Gaming X Trio
Radeon RX 6950 XT, R9 7950X
317.8 fps -33%
Intel NUC13 Raptor Canyon
NVIDIA GeForce RTX 3080 Ti, i9-13900K, Kingston Fury Renegade SFYRS1000G
302.6 fps -36%
Unigine Valley 1.0
1920x1080 Extreme HD DirectX AA:x8
SCHENKER XMG SECTOR, i9 13900K, RTX 4090
NVIDIA GeForce RTX 4090, i9-13900K, Samsung SSD 980 Pro 2TB MZ-V8P2T0
291.9 fps
KFA2 GeForce RTX 4090 SG
NVIDIA GeForce RTX 4090, R9 7950X, Corsair MP600 GS
276 fps -5%
AMD Radeon RX 7900 XTX
Radeon RX 7900 XTX, R9 7950X
264.5 fps -9%
KFA2 GeForce RTX 4080 SG
NVIDIA GeForce RTX 4080, R9 7950X, Corsair MP600
257 fps -12%
AMD Radeon RX 7900 XT
Radeon RX 7900 XT, R9 7950X
243.3 fps -17%
Intel NUC13 Raptor Canyon
NVIDIA GeForce RTX 3080 Ti, i9-13900K, Kingston Fury Renegade SFYRS1000G
240.4 fps -18%
MSI Radeon RX 6950 XT Gaming X Trio
Radeon RX 6950 XT, R9 7950X
239.4 fps -18%
KFA2 GeForce RTX 4070 Ti SG
NVIDIA GeForce RTX 4070 Ti, R9 7950X, Corsair MP600
216.3 fps -26%
1920x1080 Extreme HD Preset OpenGL AA:x8
SCHENKER XMG SECTOR, i9 13900K, RTX 4090
NVIDIA GeForce RTX 4090, i9-13900K, Samsung SSD 980 Pro 2TB MZ-V8P2T0
309.2 fps
KFA2 GeForce RTX 4090 SG
NVIDIA GeForce RTX 4090, R9 7950X, Corsair MP600 GS
288 fps -7%
AMD Radeon RX 7900 XTX
Radeon RX 7900 XTX, R9 7950X
254.2 fps -18%
KFA2 GeForce RTX 4080 SG
NVIDIA GeForce RTX 4080, R9 7950X, Corsair MP600
231.8 fps -25%
AMD Radeon RX 7900 XT
Radeon RX 7900 XT, R9 7950X
225.9 fps -27%
Intel NUC13 Raptor Canyon
NVIDIA GeForce RTX 3080 Ti, i9-13900K, Kingston Fury Renegade SFYRS1000G
209.8 fps -32%
KFA2 GeForce RTX 4070 Ti SG
NVIDIA GeForce RTX 4070 Ti, R9 7950X, Corsair MP600
197.4 fps -36%
MSI Radeon RX 6950 XT Gaming X Trio
Radeon RX 6950 XT, R9 7950X
186.5 fps -40%
Unigine Superposition
1920x1080 1080p High
SCHENKER XMG SECTOR, i9 13900K, RTX 4090
NVIDIA GeForce RTX 4090, i9-13900K, Samsung SSD 980 Pro 2TB MZ-V8P2T0
47072 Points
KFA2 GeForce RTX 4090 SG
NVIDIA GeForce RTX 4090, R9 7950X, Corsair MP600 GS
45619 Points -3%
KFA2 GeForce RTX 4080 SG
NVIDIA GeForce RTX 4080, R9 7950X, Corsair MP600
36824 Points -22%
AMD Radeon RX 7900 XTX
Radeon RX 7900 XTX, R9 7950X
36536 Points -22%
AMD Radeon RX 7900 XT
Radeon RX 7900 XT, R9 7950X
31426 Points -33%
KFA2 GeForce RTX 4070 Ti SG
NVIDIA GeForce RTX 4070 Ti, R9 7950X, Corsair MP600
29566 Points -37%
MSI Radeon RX 6950 XT Gaming X Trio
Radeon RX 6950 XT, R9 7950X
28797 Points -39%
Intel NUC13 Raptor Canyon
NVIDIA GeForce RTX 3080 Ti, i9-13900K, Kingston Fury Renegade SFYRS1000G
26131 Points -44%
1920x1080 1080p Extreme
SCHENKER XMG SECTOR, i9 13900K, RTX 4090
NVIDIA GeForce RTX 4090, i9-13900K, Samsung SSD 980 Pro 2TB MZ-V8P2T0
21332 Points
KFA2 GeForce RTX 4090 SG
NVIDIA GeForce RTX 4090, R9 7950X, Corsair MP600 GS
21288 Points 0%
AMD Radeon RX 7900 XTX
Radeon RX 7900 XTX, R9 7950X
17264 Points -19%
KFA2 GeForce RTX 4080 SG
NVIDIA GeForce RTX 4080, R9 7950X, Corsair MP600
16635 Points -22%
AMD Radeon RX 7900 XT
Radeon RX 7900 XT, R9 7950X
14181 Points -34%
KFA2 GeForce RTX 4070 Ti SG
NVIDIA GeForce RTX 4070 Ti, R9 7950X, Corsair MP600
13120 Points -38%
Intel NUC13 Raptor Canyon
NVIDIA GeForce RTX 3080 Ti, i9-13900K, Kingston Fury Renegade SFYRS1000G
12071 Points -43%
MSI Radeon RX 6950 XT Gaming X Trio
Radeon RX 6950 XT, R9 7950X
12048 Points -44%
3840x2160 4k Optimized
KFA2 GeForce RTX 4090 SG
NVIDIA GeForce RTX 4090, R9 7950X, Corsair MP600 GS
33581 Points 0%
SCHENKER XMG SECTOR, i9 13900K, RTX 4090
NVIDIA GeForce RTX 4090, i9-13900K, Samsung SSD 980 Pro 2TB MZ-V8P2T0
33488 Points
AMD Radeon RX 7900 XTX
Radeon RX 7900 XTX, R9 7950X
23174 Points -31%
KFA2 GeForce RTX 4080 SG
NVIDIA GeForce RTX 4080, R9 7950X, Corsair MP600
22482 Points -33%
AMD Radeon RX 7900 XT
Radeon RX 7900 XT, R9 7950X
18806 Points -44%
KFA2 GeForce RTX 4070 Ti SG
NVIDIA GeForce RTX 4070 Ti, R9 7950X, Corsair MP600
17109 Points -49%
MSI Radeon RX 6950 XT Gaming X Trio
Radeon RX 6950 XT, R9 7950X
16993 Points -49%
Intel NUC13 Raptor Canyon
NVIDIA GeForce RTX 3080 Ti, i9-13900K, Kingston Fury Renegade SFYRS1000G
16108 Points -52%
ComputeMark v2.1 - 1024x600 Normal, Score
SCHENKER XMG SECTOR, i9 13900K, RTX 4090
NVIDIA GeForce RTX 4090, i9-13900K, Samsung SSD 980 Pro 2TB MZ-V8P2T0
90920 Points
KFA2 GeForce RTX 4090 SG
NVIDIA GeForce RTX 4090, R9 7950X, Corsair MP600 GS
90016 Points -1%
AMD Radeon RX 7900 XTX
Radeon RX 7900 XTX, R9 7950X
62963 Points -31%
KFA2 GeForce RTX 4080 SG
NVIDIA GeForce RTX 4080, R9 7950X, Corsair MP600
62753 Points -31%
AMD Radeon RX 7900 XT
Radeon RX 7900 XT, R9 7950X
57570 Points -37%
KFA2 GeForce RTX 4070 Ti SG
NVIDIA GeForce RTX 4070 Ti, R9 7950X, Corsair MP600
51835 Points -43%
Intel NUC13 Raptor Canyon
NVIDIA GeForce RTX 3080 Ti, i9-13900K, Kingston Fury Renegade SFYRS1000G
48749 Points -46%
MSI Radeon RX 6950 XT Gaming X Trio
Radeon RX 6950 XT, R9 7950X
45552 Points -50%

Compute benchmarks and professional applications

LuxMark v2.0 64Bit
Sala GPUs-only
SCHENKER XMG SECTOR, i9 13900K, RTX 4090
NVIDIA GeForce RTX 4090, i9-13900K, Samsung SSD 980 Pro 2TB MZ-V8P2T0
26994 Samples/s
KFA2 GeForce RTX 4090 SG
NVIDIA GeForce RTX 4090, R9 7950X, Corsair MP600 GS
26576 Samples/s -2%
KFA2 GeForce RTX 4080 SG
NVIDIA GeForce RTX 4080, R9 7950X, Corsair MP600
23809 Samples/s -12%
KFA2 GeForce RTX 4070 Ti SG
NVIDIA GeForce RTX 4070 Ti, R9 7950X, Corsair MP600
18407 Samples/s -32%
Intel NUC13 Raptor Canyon
NVIDIA GeForce RTX 3080 Ti, i9-13900K, Kingston Fury Renegade SFYRS1000G
16438 Samples/s -39%
AMD Radeon RX 7900 XTX
Radeon RX 7900 XTX, R9 7950X
15019 Samples/s -44%
AMD Radeon RX 7900 XT
Radeon RX 7900 XT, R9 7950X
13489 Samples/s -50%
MSI Radeon RX 6950 XT Gaming X Trio
Radeon RX 6950 XT, R9 7950X
12057 Samples/s -55%
Room GPUs-only
SCHENKER XMG SECTOR, i9 13900K, RTX 4090
NVIDIA GeForce RTX 4090, i9-13900K, Samsung SSD 980 Pro 2TB MZ-V8P2T0
12290 Samples/s
KFA2 GeForce RTX 4090 SG
NVIDIA GeForce RTX 4090, R9 7950X, Corsair MP600 GS
12190 Samples/s -1%
KFA2 GeForce RTX 4080 SG
NVIDIA GeForce RTX 4080, R9 7950X, Corsair MP600
9757 Samples/s -21%
KFA2 GeForce RTX 4070 Ti SG
NVIDIA GeForce RTX 4070 Ti, R9 7950X, Corsair MP600
7785 Samples/s -37%
Intel NUC13 Raptor Canyon
NVIDIA GeForce RTX 3080 Ti, i9-13900K, Kingston Fury Renegade SFYRS1000G
6460 Samples/s -47%
AMD Radeon RX 7900 XTX
Radeon RX 7900 XTX, R9 7950X
5161 Samples/s -58%
AMD Radeon RX 7900 XT
Radeon RX 7900 XT, R9 7950X
4451 Samples/s -64%
MSI Radeon RX 6950 XT Gaming X Trio
Radeon RX 6950 XT, R9 7950X
4173 Samples/s -66%
ComputeMark v2.1
1024x600 Normal, QJuliaRayTrace
SCHENKER XMG SECTOR, i9 13900K, RTX 4090
NVIDIA GeForce RTX 4090, i9-13900K, Samsung SSD 980 Pro 2TB MZ-V8P2T0
33698 Points
KFA2 GeForce RTX 4090 SG
NVIDIA GeForce RTX 4090, R9 7950X, Corsair MP600 GS
33298 Points -1%
KFA2 GeForce RTX 4080 SG
NVIDIA GeForce RTX 4080, R9 7950X, Corsair MP600
24631 Points -27%
KFA2 GeForce RTX 4070 Ti SG
NVIDIA GeForce RTX 4070 Ti, R9 7950X, Corsair MP600
21330 Points -37%
AMD Radeon RX 7900 XTX
Radeon RX 7900 XTX, R9 7950X
17915 Points -47%
Intel NUC13 Raptor Canyon
NVIDIA GeForce RTX 3080 Ti, i9-13900K, Kingston Fury Renegade SFYRS1000G
17695 Points -47%
AMD Radeon RX 7900 XT
Radeon RX 7900 XT, R9 7950X
16990 Points -50%
MSI Radeon RX 6950 XT Gaming X Trio
Radeon RX 6950 XT, R9 7950X
13672 Points -59%
1024x600 Normal, Mandel Scalar
SCHENKER XMG SECTOR, i9 13900K, RTX 4090
NVIDIA GeForce RTX 4090, i9-13900K, Samsung SSD 980 Pro 2TB MZ-V8P2T0
22731 Points
KFA2 GeForce RTX 4090 SG
NVIDIA GeForce RTX 4090, R9 7950X, Corsair MP600 GS
22402 Points -1%
AMD Radeon RX 7900 XTX
Radeon RX 7900 XTX, R9 7950X
15458 Points -32%
KFA2 GeForce RTX 4080 SG
NVIDIA GeForce RTX 4080, R9 7950X, Corsair MP600
14810 Points -35%
AMD Radeon RX 7900 XT
Radeon RX 7900 XT, R9 7950X
13989 Points -38%
KFA2 GeForce RTX 4070 Ti SG
NVIDIA GeForce RTX 4070 Ti, R9 7950X, Corsair MP600
12313 Points -46%
MSI Radeon RX 6950 XT Gaming X Trio
Radeon RX 6950 XT, R9 7950X
12020 Points -47%
Intel NUC13 Raptor Canyon
NVIDIA GeForce RTX 3080 Ti, i9-13900K, Kingston Fury Renegade SFYRS1000G
11277 Points -50%
1024x600 Normal, Mandel Vector
SCHENKER XMG SECTOR, i9 13900K, RTX 4090
NVIDIA GeForce RTX 4090, i9-13900K, Samsung SSD 980 Pro 2TB MZ-V8P2T0
16942 Points
KFA2 GeForce RTX 4090 SG
NVIDIA GeForce RTX 4090, R9 7950X, Corsair MP600 GS
16935 Points 0%
AMD Radeon RX 7900 XTX
Radeon RX 7900 XTX, R9 7950X
13737 Points -19%
AMD Radeon RX 7900 XT
Radeon RX 7900 XT, R9 7950X
13022 Points -23%
KFA2 GeForce RTX 4080 SG
NVIDIA GeForce RTX 4080, R9 7950X, Corsair MP600
11220 Points -34%
KFA2 GeForce RTX 4070 Ti SG
NVIDIA GeForce RTX 4070 Ti, R9 7950X, Corsair MP600
10711 Points -37%
MSI Radeon RX 6950 XT Gaming X Trio
Radeon RX 6950 XT, R9 7950X
9933 Points -41%
Intel NUC13 Raptor Canyon
NVIDIA GeForce RTX 3080 Ti, i9-13900K, Kingston Fury Renegade SFYRS1000G
9816 Points -42%
1024x600 Normal, Fluid 2DTexArr
AMD Radeon RX 7900 XTX
Radeon RX 7900 XTX, R9 7950X
7315 Points +8%
SCHENKER XMG SECTOR, i9 13900K, RTX 4090
NVIDIA GeForce RTX 4090, i9-13900K, Samsung SSD 980 Pro 2TB MZ-V8P2T0
6800 Points
KFA2 GeForce RTX 4090 SG
NVIDIA GeForce RTX 4090, R9 7950X, Corsair MP600 GS
6792 Points 0%
AMD Radeon RX 7900 XT
Radeon RX 7900 XT, R9 7950X
6460 Points -5%
KFA2 GeForce RTX 4080 SG
NVIDIA GeForce RTX 4080, R9 7950X, Corsair MP600
5605 Points -18%
Intel NUC13 Raptor Canyon
NVIDIA GeForce RTX 3080 Ti, i9-13900K, Kingston Fury Renegade SFYRS1000G
4538 Points -33%
MSI Radeon RX 6950 XT Gaming X Trio
Radeon RX 6950 XT, R9 7950X
4349 Points -36%
KFA2 GeForce RTX 4070 Ti SG
NVIDIA GeForce RTX 4070 Ti, R9 7950X, Corsair MP600
3706 Points -45%
1024x600 Normal, Fluid 3DTex
SCHENKER XMG SECTOR, i9 13900K, RTX 4090
NVIDIA GeForce RTX 4090, i9-13900K, Samsung SSD 980 Pro 2TB MZ-V8P2T0
10749 Points
KFA2 GeForce RTX 4090 SG
NVIDIA GeForce RTX 4090, R9 7950X, Corsair MP600 GS
10589 Points -1%
AMD Radeon RX 7900 XTX
Radeon RX 7900 XTX, R9 7950X
8537 Points -21%
AMD Radeon RX 7900 XT
Radeon RX 7900 XT, R9 7950X
7109 Points -34%
KFA2 GeForce RTX 4080 SG
NVIDIA GeForce RTX 4080, R9 7950X, Corsair MP600
6484 Points -40%
MSI Radeon RX 6950 XT Gaming X Trio
Radeon RX 6950 XT, R9 7950X
5577 Points -48%
Intel NUC13 Raptor Canyon
NVIDIA GeForce RTX 3080 Ti, i9-13900K, Kingston Fury Renegade SFYRS1000G
5422 Points -50%
KFA2 GeForce RTX 4070 Ti SG
NVIDIA GeForce RTX 4070 Ti, R9 7950X, Corsair MP600
3774 Points -65%
1024x600 Normal, Score
SCHENKER XMG SECTOR, i9 13900K, RTX 4090
NVIDIA GeForce RTX 4090, i9-13900K, Samsung SSD 980 Pro 2TB MZ-V8P2T0
90920 Points
KFA2 GeForce RTX 4090 SG
NVIDIA GeForce RTX 4090, R9 7950X, Corsair MP600 GS
90016 Points -1%
AMD Radeon RX 7900 XTX
Radeon RX 7900 XTX, R9 7950X
62963 Points -31%
KFA2 GeForce RTX 4080 SG
NVIDIA GeForce RTX 4080, R9 7950X, Corsair MP600
62753 Points -31%
AMD Radeon RX 7900 XT
Radeon RX 7900 XT, R9 7950X
57570 Points -37%
KFA2 GeForce RTX 4070 Ti SG
NVIDIA GeForce RTX 4070 Ti, R9 7950X, Corsair MP600
51835 Points -43%
Intel NUC13 Raptor Canyon
NVIDIA GeForce RTX 3080 Ti, i9-13900K, Kingston Fury Renegade SFYRS1000G
48749 Points -46%
MSI Radeon RX 6950 XT Gaming X Trio
Radeon RX 6950 XT, R9 7950X
45552 Points -50%
SPECviewperf 2020
3840x2160 3ds Max (3dsmax-07)
KFA2 GeForce RTX 4090 SG
NVIDIA GeForce RTX 4090, R9 7950X, Corsair MP600 GS
231 fps +2%
SCHENKER XMG SECTOR, i9 13900K, RTX 4090
NVIDIA GeForce RTX 4090, i9-13900K, Samsung SSD 980 Pro 2TB MZ-V8P2T0
226 fps
KFA2 GeForce RTX 4080 SG
NVIDIA GeForce RTX 4080, R9 7950X, Corsair MP600
179 fps -21%
AMD Radeon RX 7900 XTX
Radeon RX 7900 XTX, R9 7950X
167 fps -26%
KFA2 GeForce RTX 4070 Ti SG
NVIDIA GeForce RTX 4070 Ti, R9 7950X, Corsair MP600
148 fps -35%
AMD Radeon RX 7900 XT
Radeon RX 7900 XT, R9 7950X
143 fps -37%
Intel NUC13 Raptor Canyon
NVIDIA GeForce RTX 3080 Ti, i9-13900K, Kingston Fury Renegade SFYRS1000G
140 fps -38%
MSI Radeon RX 6950 XT Gaming X Trio
Radeon RX 6950 XT, R9 7950X
140 fps -38%
3840x2160 CATIA (catia-06)
AMD Radeon RX 7900 XTX
Radeon RX 7900 XTX, R9 7950X
127 fps +29%
AMD Radeon RX 7900 XT
Radeon RX 7900 XT, R9 7950X
113 fps +15%
SCHENKER XMG SECTOR, i9 13900K, RTX 4090
NVIDIA GeForce RTX 4090, i9-13900K, Samsung SSD 980 Pro 2TB MZ-V8P2T0
98.6 fps
KFA2 GeForce RTX 4090 SG
NVIDIA GeForce RTX 4090, R9 7950X, Corsair MP600 GS
94.7 fps -4%
KFA2 GeForce RTX 4080 SG
NVIDIA GeForce RTX 4080, R9 7950X, Corsair MP600
75.5 fps -23%
KFA2 GeForce RTX 4070 Ti SG
NVIDIA GeForce RTX 4070 Ti, R9 7950X, Corsair MP600
62 fps -37%
Intel NUC13 Raptor Canyon
NVIDIA GeForce RTX 3080 Ti, i9-13900K, Kingston Fury Renegade SFYRS1000G
60.4 fps -39%
MSI Radeon RX 6950 XT Gaming X Trio
Radeon RX 6950 XT, R9 7950X
59.7 fps -39%
3840x2160 Creo (creo-03)
AMD Radeon RX 7900 XTX
Radeon RX 7900 XTX, R9 7950X
187 fps +31%
AMD Radeon RX 7900 XT
Radeon RX 7900 XT, R9 7950X
173 fps +21%
SCHENKER XMG SECTOR, i9 13900K, RTX 4090
NVIDIA GeForce RTX 4090, i9-13900K, Samsung SSD 980 Pro 2TB MZ-V8P2T0
143 fps
KFA2 GeForce RTX 4090 SG
NVIDIA GeForce RTX 4090, R9 7950X, Corsair MP600 GS
133 fps -7%
KFA2 GeForce RTX 4080 SG
NVIDIA GeForce RTX 4080, R9 7950X, Corsair MP600
128 fps -10%
KFA2 GeForce RTX 4070 Ti SG
NVIDIA GeForce RTX 4070 Ti, R9 7950X, Corsair MP600
120 fps -16%
Intel NUC13 Raptor Canyon
NVIDIA GeForce RTX 3080 Ti, i9-13900K, Kingston Fury Renegade SFYRS1000G
117 fps -18%
MSI Radeon RX 6950 XT Gaming X Trio
Radeon RX 6950 XT, R9 7950X
92.4 fps -35%
3840x2160 Energy (energy-03)
SCHENKER XMG SECTOR, i9 13900K, RTX 4090
NVIDIA GeForce RTX 4090, i9-13900K, Samsung SSD 980 Pro 2TB MZ-V8P2T0
225 fps
KFA2 GeForce RTX 4090 SG
NVIDIA GeForce RTX 4090, R9 7950X, Corsair MP600 GS
137 fps -39%
AMD Radeon RX 7900 XTX
Radeon RX 7900 XTX, R9 7950X
129 fps -43%
KFA2 GeForce RTX 4070 Ti SG
NVIDIA GeForce RTX 4070 Ti, R9 7950X, Corsair MP600
126 fps -44%
AMD Radeon RX 7900 XT
Radeon RX 7900 XT, R9 7950X
99.6 fps -56%
KFA2 GeForce RTX 4080 SG
NVIDIA GeForce RTX 4080, R9 7950X, Corsair MP600
90.4 fps -60%
MSI Radeon RX 6950 XT Gaming X Trio
Radeon RX 6950 XT, R9 7950X
69.3 fps -69%
Intel NUC13 Raptor Canyon
NVIDIA GeForce RTX 3080 Ti, i9-13900K, Kingston Fury Renegade SFYRS1000G
38.9 fps -83%
3840x2160 Maya (maya-06)
SCHENKER XMG SECTOR, i9 13900K, RTX 4090
NVIDIA GeForce RTX 4090, i9-13900K, Samsung SSD 980 Pro 2TB MZ-V8P2T0
542 fps
KFA2 GeForce RTX 4090 SG
NVIDIA GeForce RTX 4090, R9 7950X, Corsair MP600 GS
525 fps -3%
AMD Radeon RX 7900 XTX
Radeon RX 7900 XTX, R9 7950X
481 fps -11%
KFA2 GeForce RTX 4080 SG
NVIDIA GeForce RTX 4080, R9 7950X, Corsair MP600
447 fps -18%
AMD Radeon RX 7900 XT
Radeon RX 7900 XT, R9 7950X
401 fps -26%
KFA2 GeForce RTX 4070 Ti SG
NVIDIA GeForce RTX 4070 Ti, R9 7950X, Corsair MP600
375 fps -31%
Intel NUC13 Raptor Canyon
NVIDIA GeForce RTX 3080 Ti, i9-13900K, Kingston Fury Renegade SFYRS1000G
352 fps -35%
MSI Radeon RX 6950 XT Gaming X Trio
Radeon RX 6950 XT, R9 7950X
315 fps -42%
3840x2160 Medical (medical-03)
AMD Radeon RX 7900 XTX
Radeon RX 7900 XTX, R9 7950X
62.3 fps +49%
AMD Radeon RX 7900 XT
Radeon RX 7900 XT, R9 7950X
53.9 fps +29%
KFA2 GeForce RTX 4090 SG
NVIDIA GeForce RTX 4090, R9 7950X, Corsair MP600 GS
44.8 fps +7%
SCHENKER XMG SECTOR, i9 13900K, RTX 4090
NVIDIA GeForce RTX 4090, i9-13900K, Samsung SSD 980 Pro 2TB MZ-V8P2T0
41.9 fps
MSI Radeon RX 6950 XT Gaming X Trio
Radeon RX 6950 XT, R9 7950X
35 fps -16%
KFA2 GeForce RTX 4080 SG
NVIDIA GeForce RTX 4080, R9 7950X, Corsair MP600
32.2 fps -23%
KFA2 GeForce RTX 4070 Ti SG
NVIDIA GeForce RTX 4070 Ti, R9 7950X, Corsair MP600
27.5 fps -34%
Intel NUC13 Raptor Canyon
NVIDIA GeForce RTX 3080 Ti, i9-13900K, Kingston Fury Renegade SFYRS1000G
22.7 fps -46%
3840x2160 Siemens NX (snx-04)
AMD Radeon RX 7900 XTX
Radeon RX 7900 XTX, R9 7950X
514 fps +1047%
AMD Radeon RX 7900 XT
Radeon RX 7900 XT, R9 7950X
476 fps +963%
MSI Radeon RX 6950 XT Gaming X Trio
Radeon RX 6950 XT, R9 7950X
98.4 fps +120%
SCHENKER XMG SECTOR, i9 13900K, RTX 4090
NVIDIA GeForce RTX 4090, i9-13900K, Samsung SSD 980 Pro 2TB MZ-V8P2T0
44.8 fps
KFA2 GeForce RTX 4090 SG
NVIDIA GeForce RTX 4090, R9 7950X, Corsair MP600 GS
41.1 fps -8%
KFA2 GeForce RTX 4080 SG
NVIDIA GeForce RTX 4080, R9 7950X, Corsair MP600
31.9 fps -29%
KFA2 GeForce RTX 4070 Ti SG
NVIDIA GeForce RTX 4070 Ti, R9 7950X, Corsair MP600
27.6 fps -38%
Intel NUC13 Raptor Canyon
NVIDIA GeForce RTX 3080 Ti, i9-13900K, Kingston Fury Renegade SFYRS1000G
25.9 fps -42%
3840x2160 Solidworks (solidworks-05)
SCHENKER XMG SECTOR, i9 13900K, RTX 4090
NVIDIA GeForce RTX 4090, i9-13900K, Samsung SSD 980 Pro 2TB MZ-V8P2T0
323 fps
SPECviewperf 13
Solidworks (sw-04)
AMD Radeon RX 7900 XTX
Radeon RX 7900 XTX, R9 7950X
323 fps +71%
AMD Radeon RX 7900 XT
Radeon RX 7900 XT, R9 7950X
307 fps +62%
MSI Radeon RX 6950 XT Gaming X Trio
Radeon RX 6950 XT, R9 7950X
254 fps +34%
SCHENKER XMG SECTOR, i9 13900K, RTX 4090
NVIDIA GeForce RTX 4090, i9-13900K, Samsung SSD 980 Pro 2TB MZ-V8P2T0
189 fps
KFA2 GeForce RTX 4090 SG
NVIDIA GeForce RTX 4090, R9 7950X, Corsair MP600 GS
182 fps -4%
KFA2 GeForce RTX 4080 SG
NVIDIA GeForce RTX 4080, R9 7950X, Corsair MP600
179 fps -5%
KFA2 GeForce RTX 4070 Ti SG
NVIDIA GeForce RTX 4070 Ti, R9 7950X, Corsair MP600
168 fps -11%
Intel NUC13 Raptor Canyon
NVIDIA GeForce RTX 3080 Ti, i9-13900K, Kingston Fury Renegade SFYRS1000G
153 fps -19%
Siemens NX (snx-03)
AMD Radeon RX 7900 XTX
Radeon RX 7900 XTX, R9 7950X
725 fps +1286%
AMD Radeon RX 7900 XT
Radeon RX 7900 XT, R9 7950X
675 fps +1191%
MSI Radeon RX 6950 XT Gaming X Trio
Radeon RX 6950 XT, R9 7950X
101 fps +93%
SCHENKER XMG SECTOR, i9 13900K, RTX 4090
NVIDIA GeForce RTX 4090, i9-13900K, Samsung SSD 980 Pro 2TB MZ-V8P2T0
52.3 fps
KFA2 GeForce RTX 4090 SG
NVIDIA GeForce RTX 4090, R9 7950X, Corsair MP600 GS
47.9 fps -8%
KFA2 GeForce RTX 4080 SG
NVIDIA GeForce RTX 4080, R9 7950X, Corsair MP600
39 fps -25%
KFA2 GeForce RTX 4070 Ti SG
NVIDIA GeForce RTX 4070 Ti, R9 7950X, Corsair MP600
34.2 fps -35%
Intel NUC13 Raptor Canyon
NVIDIA GeForce RTX 3080 Ti, i9-13900K, Kingston Fury Renegade SFYRS1000G
30.8 fps -41%
Showcase (showcase-02)
SCHENKER XMG SECTOR, i9 13900K, RTX 4090
NVIDIA GeForce RTX 4090, i9-13900K, Samsung SSD 980 Pro 2TB MZ-V8P2T0
451 fps
KFA2 GeForce RTX 4090 SG
NVIDIA GeForce RTX 4090, R9 7950X, Corsair MP600 GS
448 fps -1%
KFA2 GeForce RTX 4080 SG
NVIDIA GeForce RTX 4080, R9 7950X, Corsair MP600
334 fps -26%
AMD Radeon RX 7900 XTX
Radeon RX 7900 XTX, R9 7950X
323 fps -28%
AMD Radeon RX 7900 XT
Radeon RX 7900 XT, R9 7950X
279 fps -38%
Intel NUC13 Raptor Canyon
NVIDIA GeForce RTX 3080 Ti, i9-13900K, Kingston Fury Renegade SFYRS1000G
264 fps -41%
MSI Radeon RX 6950 XT Gaming X Trio
Radeon RX 6950 XT, R9 7950X
264 fps -41%
KFA2 GeForce RTX 4070 Ti SG
NVIDIA GeForce RTX 4070 Ti, R9 7950X, Corsair MP600
246 fps -45%
Medical (medical-02)
AMD Radeon RX 7900 XTX
Radeon RX 7900 XTX, R9 7950X
263 fps +40%
AMD Radeon RX 7900 XT
Radeon RX 7900 XT, R9 7950X
237 fps +26%
SCHENKER XMG SECTOR, i9 13900K, RTX 4090
NVIDIA GeForce RTX 4090, i9-13900K, Samsung SSD 980 Pro 2TB MZ-V8P2T0
188 fps
KFA2 GeForce RTX 4090 SG
NVIDIA GeForce RTX 4090, R9 7950X, Corsair MP600 GS
182 fps -3%
KFA2 GeForce RTX 4080 SG
NVIDIA GeForce RTX 4080, R9 7950X, Corsair MP600
150 fps -20%
KFA2 GeForce RTX 4070 Ti SG
NVIDIA GeForce RTX 4070 Ti, R9 7950X, Corsair MP600
134 fps -29%
Intel NUC13 Raptor Canyon
NVIDIA GeForce RTX 3080 Ti, i9-13900K, Kingston Fury Renegade SFYRS1000G
106 fps -44%
Maya (maya-05)
SCHENKER XMG SECTOR, i9 13900K, RTX 4090
NVIDIA GeForce RTX 4090, i9-13900K, Samsung SSD 980 Pro 2TB MZ-V8P2T0
830 fps
AMD Radeon RX 7900 XTX
Radeon RX 7900 XTX, R9 7950X
735 fps -11%
KFA2 GeForce RTX 4090 SG
NVIDIA GeForce RTX 4090, R9 7950X, Corsair MP600 GS
715 fps -14%
KFA2 GeForce RTX 4080 SG
NVIDIA GeForce RTX 4080, R9 7950X, Corsair MP600
678 fps -18%
AMD Radeon RX 7900 XT
Radeon RX 7900 XT, R9 7950X
670 fps -19%
KFA2 GeForce RTX 4070 Ti SG
NVIDIA GeForce RTX 4070 Ti, R9 7950X, Corsair MP600
596 fps -28%
Intel NUC13 Raptor Canyon
NVIDIA GeForce RTX 3080 Ti, i9-13900K, Kingston Fury Renegade SFYRS1000G
586 fps -29%
MSI Radeon RX 6950 XT Gaming X Trio
Radeon RX 6950 XT, R9 7950X
460 fps -45%
Energy (energy-02)
AMD Radeon RX 7900 XTX
Radeon RX 7900 XTX, R9 7950X
187 fps +51%
AMD Radeon RX 7900 XT
Radeon RX 7900 XT, R9 7950X
147 fps +19%
SCHENKER XMG SECTOR, i9 13900K, RTX 4090
NVIDIA GeForce RTX 4090, i9-13900K, Samsung SSD 980 Pro 2TB MZ-V8P2T0
124 fps
KFA2 GeForce RTX 4090 SG
NVIDIA GeForce RTX 4090, R9 7950X, Corsair MP600 GS
123 fps -1%
KFA2 GeForce RTX 4080 SG
NVIDIA GeForce RTX 4080, R9 7950X, Corsair MP600
92.6 fps -25%
KFA2 GeForce RTX 4070 Ti SG
NVIDIA GeForce RTX 4070 Ti, R9 7950X, Corsair MP600
74.3 fps -40%
MSI Radeon RX 6950 XT Gaming X Trio
Radeon RX 6950 XT, R9 7950X
60.8 fps -51%
Intel NUC13 Raptor Canyon
NVIDIA GeForce RTX 3080 Ti, i9-13900K, Kingston Fury Renegade SFYRS1000G
44.2 fps -64%
Creo (creo-02)
AMD Radeon RX 7900 XTX
Radeon RX 7900 XTX, R9 7950X
613 fps +3%
SCHENKER XMG SECTOR, i9 13900K, RTX 4090
NVIDIA GeForce RTX 4090, i9-13900K, Samsung SSD 980 Pro 2TB MZ-V8P2T0
595 fps
AMD Radeon RX 7900 XT
Radeon RX 7900 XT, R9 7950X
567 fps -5%
KFA2 GeForce RTX 4090 SG
NVIDIA GeForce RTX 4090, R9 7950X, Corsair MP600 GS
544 fps -9%
KFA2 GeForce RTX 4080 SG
NVIDIA GeForce RTX 4080, R9 7950X, Corsair MP600
529 fps -11%
KFA2 GeForce RTX 4070 Ti SG
NVIDIA GeForce RTX 4070 Ti, R9 7950X, Corsair MP600
461 fps -23%
Intel NUC13 Raptor Canyon
NVIDIA GeForce RTX 3080 Ti, i9-13900K, Kingston Fury Renegade SFYRS1000G
403 fps -32%
MSI Radeon RX 6950 XT Gaming X Trio
Radeon RX 6950 XT, R9 7950X
374 fps -37%
Catia (catia-05)
AMD Radeon RX 7900 XTX
Radeon RX 7900 XTX, R9 7950X
825 fps +100%
AMD Radeon RX 7900 XT
Radeon RX 7900 XT, R9 7950X
728 fps +77%
MSI Radeon RX 6950 XT Gaming X Trio
Radeon RX 6950 XT, R9 7950X
588 fps +43%
SCHENKER XMG SECTOR, i9 13900K, RTX 4090
NVIDIA GeForce RTX 4090, i9-13900K, Samsung SSD 980 Pro 2TB MZ-V8P2T0
412 fps
KFA2 GeForce RTX 4090 SG
NVIDIA GeForce RTX 4090, R9 7950X, Corsair MP600 GS
396 fps -4%
KFA2 GeForce RTX 4080 SG
NVIDIA GeForce RTX 4080, R9 7950X, Corsair MP600
340 fps -17%
KFA2 GeForce RTX 4070 Ti SG
NVIDIA GeForce RTX 4070 Ti, R9 7950X, Corsair MP600
292 fps -29%
Intel NUC13 Raptor Canyon
NVIDIA GeForce RTX 3080 Ti, i9-13900K, Kingston Fury Renegade SFYRS1000G
255 fps -38%
3ds Max (3dsmax-06)
AMD Radeon RX 7900 XTX
Radeon RX 7900 XTX, R9 7950X
564 fps +6%
KFA2 GeForce RTX 4090 SG
NVIDIA GeForce RTX 4090, R9 7950X, Corsair MP600 GS
558 fps +5%
SCHENKER XMG SECTOR, i9 13900K, RTX 4090
NVIDIA GeForce RTX 4090, i9-13900K, Samsung SSD 980 Pro 2TB MZ-V8P2T0
531 fps
AMD Radeon RX 7900 XT
Radeon RX 7900 XT, R9 7950X
506 fps -5%
KFA2 GeForce RTX 4080 SG
NVIDIA GeForce RTX 4080, R9 7950X, Corsair MP600
497 fps -6%
KFA2 GeForce RTX 4070 Ti SG
NVIDIA GeForce RTX 4070 Ti, R9 7950X, Corsair MP600
437 fps -18%
MSI Radeon RX 6950 XT Gaming X Trio
Radeon RX 6950 XT, R9 7950X
416 fps -22%
Intel NUC13 Raptor Canyon
NVIDIA GeForce RTX 3080 Ti, i9-13900K, Kingston Fury Renegade SFYRS1000G
371 fps -30%
SPECviewperf 12
1900x1060 Solidworks (sw-03)
AMD Radeon RX 7900 XTX
Radeon RX 7900 XTX, R9 7950X
360 fps +171%
AMD Radeon RX 7900 XT
Radeon RX 7900 XT, R9 7950X
342 fps +157%
MSI Radeon RX 6950 XT Gaming X Trio
Radeon RX 6950 XT, R9 7950X
218 fps +64%
SCHENKER XMG SECTOR, i9 13900K, RTX 4090
NVIDIA GeForce RTX 4090, i9-13900K, Samsung SSD 980 Pro 2TB MZ-V8P2T0
133 fps
KFA2 GeForce RTX 4090 SG
NVIDIA GeForce RTX 4090, R9 7950X, Corsair MP600 GS
127 fps -5%
KFA2 GeForce RTX 4070 Ti SG
NVIDIA GeForce RTX 4070 Ti, R9 7950X, Corsair MP600
119 fps -11%
KFA2 GeForce RTX 4080 SG
NVIDIA GeForce RTX 4080, R9 7950X, Corsair MP600
113 fps -15%
Intel NUC13 Raptor Canyon
NVIDIA GeForce RTX 3080 Ti, i9-13900K, Kingston Fury Renegade SFYRS1000G
105 fps -21%
1900x1060 Siemens NX (snx-02)
AMD Radeon RX 7900 XTX
Radeon RX 7900 XTX, R9 7950X
400 fps +1284%
AMD Radeon RX 7900 XT
Radeon RX 7900 XT, R9 7950X
373 fps +1191%
MSI Radeon RX 6950 XT Gaming X Trio
Radeon RX 6950 XT, R9 7950X
56.4 fps +95%
SCHENKER XMG SECTOR, i9 13900K, RTX 4090
NVIDIA GeForce RTX 4090, i9-13900K, Samsung SSD 980 Pro 2TB MZ-V8P2T0
28.9 fps
KFA2 GeForce RTX 4090 SG
NVIDIA GeForce RTX 4090, R9 7950X, Corsair MP600 GS
26.4 fps -9%
KFA2 GeForce RTX 4080 SG
NVIDIA GeForce RTX 4080, R9 7950X, Corsair MP600
21.6 fps -25%
KFA2 GeForce RTX 4070 Ti SG
NVIDIA GeForce RTX 4070 Ti, R9 7950X, Corsair MP600
19.1 fps -34%
Intel NUC13 Raptor Canyon
NVIDIA GeForce RTX 3080 Ti, i9-13900K, Kingston Fury Renegade SFYRS1000G
17.1 fps -41%
1900x1060 Showcase (showcase-01)
SCHENKER XMG SECTOR, i9 13900K, RTX 4090
NVIDIA GeForce RTX 4090, i9-13900K, Samsung SSD 980 Pro 2TB MZ-V8P2T0
450 fps
KFA2 GeForce RTX 4090 SG
NVIDIA GeForce RTX 4090, R9 7950X, Corsair MP600 GS
448 fps 0%
KFA2 GeForce RTX 4080 SG
NVIDIA GeForce RTX 4080, R9 7950X, Corsair MP600
333 fps -26%
AMD Radeon RX 7900 XTX
Radeon RX 7900 XTX, R9 7950X
322 fps -28%
AMD Radeon RX 7900 XT
Radeon RX 7900 XT, R9 7950X
278 fps -38%
Intel NUC13 Raptor Canyon
NVIDIA GeForce RTX 3080 Ti, i9-13900K, Kingston Fury Renegade SFYRS1000G
264 fps -41%
MSI Radeon RX 6950 XT Gaming X Trio
Radeon RX 6950 XT, R9 7950X
264 fps -41%
KFA2 GeForce RTX 4070 Ti SG
NVIDIA GeForce RTX 4070 Ti, R9 7950X, Corsair MP600
245 fps -46%
1900x1060 Medical (medical-01)
AMD Radeon RX 7900 XTX
Radeon RX 7900 XTX, R9 7950X
347 fps +25%
AMD Radeon RX 7900 XT
Radeon RX 7900 XT, R9 7950X
288 fps +4%
SCHENKER XMG SECTOR, i9 13900K, RTX 4090
NVIDIA GeForce RTX 4090, i9-13900K, Samsung SSD 980 Pro 2TB MZ-V8P2T0
277 fps
KFA2 GeForce RTX 4080 SG
NVIDIA GeForce RTX 4080, R9 7950X, Corsair MP600
171 fps -38%
KFA2 GeForce RTX 4070 Ti SG
NVIDIA GeForce RTX 4070 Ti, R9 7950X, Corsair MP600
150 fps -46%
Intel NUC13 Raptor Canyon
NVIDIA GeForce RTX 3080 Ti, i9-13900K, Kingston Fury Renegade SFYRS1000G
143 fps -48%
KFA2 GeForce RTX 4090 SG
NVIDIA GeForce RTX 4090, R9 7950X, Corsair MP600 GS
118 fps -57%
MSI Radeon RX 6950 XT Gaming X Trio
Radeon RX 6950 XT, R9 7950X
95.2 fps -66%
1900x1060 Maya (maya-04)
AMD Radeon RX 7900 XTX
Radeon RX 7900 XTX, R9 7950X
367 fps +17%
AMD Radeon RX 7900 XT
Radeon RX 7900 XT, R9 7950X
347 fps +11%
KFA2 GeForce RTX 4090 SG
NVIDIA GeForce RTX 4090, R9 7950X, Corsair MP600 GS
316 fps +1%
SCHENKER XMG SECTOR, i9 13900K, RTX 4090
NVIDIA GeForce RTX 4090, i9-13900K, Samsung SSD 980 Pro 2TB MZ-V8P2T0
314 fps
KFA2 GeForce RTX 4080 SG
NVIDIA GeForce RTX 4080, R9 7950X, Corsair MP600
309 fps -2%
Intel NUC13 Raptor Canyon
NVIDIA GeForce RTX 3080 Ti, i9-13900K, Kingston Fury Renegade SFYRS1000G
297 fps -5%
KFA2 GeForce RTX 4070 Ti SG
NVIDIA GeForce RTX 4070 Ti, R9 7950X, Corsair MP600
295 fps -6%
MSI Radeon RX 6950 XT Gaming X Trio
Radeon RX 6950 XT, R9 7950X
195 fps -38%
1900x1060 Energy (energy-01)
AMD Radeon RX 7900 XTX
Radeon RX 7900 XTX, R9 7950X
85.2 fps +4%
SCHENKER XMG SECTOR, i9 13900K, RTX 4090
NVIDIA GeForce RTX 4090, i9-13900K, Samsung SSD 980 Pro 2TB MZ-V8P2T0
81.8 fps
AMD Radeon RX 7900 XT
Radeon RX 7900 XT, R9 7950X
72.4 fps -11%
KFA2 GeForce RTX 4080 SG
NVIDIA GeForce RTX 4080, R9 7950X, Corsair MP600
58.8 fps -28%
KFA2 GeForce RTX 4090 SG
NVIDIA GeForce RTX 4090, R9 7950X, Corsair MP600 GS
54.2 fps -34%
KFA2 GeForce RTX 4070 Ti SG
NVIDIA GeForce RTX 4070 Ti, R9 7950X, Corsair MP600
48.6 fps -41%
MSI Radeon RX 6950 XT Gaming X Trio
Radeon RX 6950 XT, R9 7950X
34.3 fps -58%
Intel NUC13 Raptor Canyon
NVIDIA GeForce RTX 3080 Ti, i9-13900K, Kingston Fury Renegade SFYRS1000G
27.5 fps -66%
1900x1060 Creo (creo-01)
AMD Radeon RX 7900 XTX
Radeon RX 7900 XTX, R9 7950X
187 fps +51%
AMD Radeon RX 7900 XT
Radeon RX 7900 XT, R9 7950X
176 fps +42%
MSI Radeon RX 6950 XT Gaming X Trio
Radeon RX 6950 XT, R9 7950X
163 fps +31%
SCHENKER XMG SECTOR, i9 13900K, RTX 4090
NVIDIA GeForce RTX 4090, i9-13900K, Samsung SSD 980 Pro 2TB MZ-V8P2T0
124 fps
KFA2 GeForce RTX 4090 SG
NVIDIA GeForce RTX 4090, R9 7950X, Corsair MP600 GS
114 fps -8%
KFA2 GeForce RTX 4080 SG
NVIDIA GeForce RTX 4080, R9 7950X, Corsair MP600
110 fps -11%
Intel NUC13 Raptor Canyon
NVIDIA GeForce RTX 3080 Ti, i9-13900K, Kingston Fury Renegade SFYRS1000G
100 fps -19%
KFA2 GeForce RTX 4070 Ti SG
NVIDIA GeForce RTX 4070 Ti, R9 7950X, Corsair MP600
97.5 fps -21%
1900x1060 Catia (catia-04)
AMD Radeon RX 7900 XTX
Radeon RX 7900 XTX, R9 7950X
536 fps +94%
AMD Radeon RX 7900 XT
Radeon RX 7900 XT, R9 7950X
481 fps +74%
MSI Radeon RX 6950 XT Gaming X Trio
Radeon RX 6950 XT, R9 7950X
368 fps +33%
SCHENKER XMG SECTOR, i9 13900K, RTX 4090
NVIDIA GeForce RTX 4090, i9-13900K, Samsung SSD 980 Pro 2TB MZ-V8P2T0
276 fps
KFA2 GeForce RTX 4090 SG
NVIDIA GeForce RTX 4090, R9 7950X, Corsair MP600 GS
254 fps -8%
KFA2 GeForce RTX 4080 SG
NVIDIA GeForce RTX 4080, R9 7950X, Corsair MP600
221 fps -20%
KFA2 GeForce RTX 4070 Ti SG
NVIDIA GeForce RTX 4070 Ti, R9 7950X, Corsair MP600
193 fps -30%
Intel NUC13 Raptor Canyon
NVIDIA GeForce RTX 3080 Ti, i9-13900K, Kingston Fury Renegade SFYRS1000G
178 fps -36%
1900x1060 3ds Max (3dsmax-05)
KFA2 GeForce RTX 4090 SG
NVIDIA GeForce RTX 4090, R9 7950X, Corsair MP600 GS
561 fps +6%
AMD Radeon RX 7900 XTX
Radeon RX 7900 XTX, R9 7950X
553 fps +4%
SCHENKER XMG SECTOR, i9 13900K, RTX 4090
NVIDIA GeForce RTX 4090, i9-13900K, Samsung SSD 980 Pro 2TB MZ-V8P2T0
531 fps
KFA2 GeForce RTX 4080 SG
NVIDIA GeForce RTX 4080, R9 7950X, Corsair MP600
502 fps -5%
AMD Radeon RX 7900 XT
Radeon RX 7900 XT, R9 7950X
502 fps -5%
KFA2 GeForce RTX 4070 Ti SG
NVIDIA GeForce RTX 4070 Ti, R9 7950X, Corsair MP600
439 fps -17%
MSI Radeon RX 6950 XT Gaming X Trio
Radeon RX 6950 XT, R9 7950X
418 fps -21%
Intel NUC13 Raptor Canyon
NVIDIA GeForce RTX 3080 Ti, i9-13900K, Kingston Fury Renegade SFYRS1000G
372 fps -30%
Geekbench 5.5
OpenCL Score
KFA2 GeForce RTX 4090 SG
NVIDIA GeForce RTX 4090, R9 7950X, Corsair MP600 GS
351918 Points 0%
SCHENKER XMG SECTOR, i9 13900K, RTX 4090
NVIDIA GeForce RTX 4090, i9-13900K, Samsung SSD 980 Pro 2TB MZ-V8P2T0
350353 Points
KFA2 GeForce RTX 4080 SG
NVIDIA GeForce RTX 4080, R9 7950X, Corsair MP600
267859 Points -24%
AMD Ryzen 9 7950X
NVIDIA GeForce RTX 3090, R9 7950X
217416 Points -38%
Intel NUC13 Raptor Canyon
NVIDIA GeForce RTX 3080 Ti, i9-13900K, Kingston Fury Renegade SFYRS1000G
204749 Points -42%
KFA2 GeForce RTX 4070 Ti SG
NVIDIA GeForce RTX 4070 Ti, R9 7950X, Corsair MP600
202831 Points -42%
Vulkan Score
Intel NUC13 Raptor Canyon
NVIDIA GeForce RTX 3080 Ti, i9-13900K, Kingston Fury Renegade SFYRS1000G
140312 Points +59%
KFA2 GeForce RTX 4090 SG
NVIDIA GeForce RTX 4090, R9 7950X, Corsair MP600 GS
112022 Points +27%
AMD Ryzen 9 7950X
NVIDIA GeForce RTX 3090, R9 7950X
106766 Points +21%
KFA2 GeForce RTX 4070 Ti SG
NVIDIA GeForce RTX 4070 Ti, R9 7950X, Corsair MP600
96442 Points +9%
SCHENKER XMG SECTOR, i9 13900K, RTX 4090
NVIDIA GeForce RTX 4090, i9-13900K, Samsung SSD 980 Pro 2TB MZ-V8P2T0
88235 Points
V-Ray 5 Benchmark
GPU CUDA
KFA2 GeForce RTX 4090 SG
NVIDIA GeForce RTX 4090, R9 7950X, Corsair MP600 GS
4332 mpaths +1%
SCHENKER XMG SECTOR, i9 13900K, RTX 4090
NVIDIA GeForce RTX 4090, i9-13900K, Samsung SSD 980 Pro 2TB MZ-V8P2T0
4309 mpaths
KFA2 GeForce RTX 4080 SG
NVIDIA GeForce RTX 4080, R9 7950X, Corsair MP600
3089 mpaths -28%
KFA2 GeForce RTX 4070 Ti SG
NVIDIA GeForce RTX 4070 Ti, R9 7950X, Corsair MP600
2302 mpaths -47%
Intel NUC13 Raptor Canyon
NVIDIA GeForce RTX 3080 Ti, i9-13900K, Kingston Fury Renegade SFYRS1000G
2055 mpaths -52%
AMD Ryzen 9 7950X
NVIDIA GeForce RTX 3090, R9 7950X
2015 mpaths -53%
GPU RTX
KFA2 GeForce RTX 4090 SG
NVIDIA GeForce RTX 4090, R9 7950X, Corsair MP600 GS
6010 mpaths +4%
SCHENKER XMG SECTOR, i9 13900K, RTX 4090
NVIDIA GeForce RTX 4090, i9-13900K, Samsung SSD 980 Pro 2TB MZ-V8P2T0
5777 mpaths
KFA2 GeForce RTX 4080 SG
NVIDIA GeForce RTX 4080, R9 7950X, Corsair MP600
4209 mpaths -27%
KFA2 GeForce RTX 4070 Ti SG
NVIDIA GeForce RTX 4070 Ti, R9 7950X, Corsair MP600
3150 mpaths -45%
AMD Ryzen 9 7950X
NVIDIA GeForce RTX 3090, R9 7950X
2859 mpaths -51%
Intel NUC13 Raptor Canyon
NVIDIA GeForce RTX 3080 Ti, i9-13900K, Kingston Fury Renegade SFYRS1000G
2741 mpaths -53%
3DMark 05 Standard
68661 pontos
3DMark 06 Standard Score
70557 pontos
3DMark Vantage P Result
133759 pontos
3DMark 11 Performance
62922 pontos
3DMark Ice Storm Standard Score
257615 pontos
3DMark Cloud Gate Standard Score
85474 pontos
3DMark Fire Strike Score
45450 pontos
3DMark Fire Strike Extreme Score
37831 pontos
3DMark Time Spy Score
32024 pontos
Ajuda

Desempenho nos jogos

Os grandes resultados vistos nos benchmarks sintéticos são reforçados pelo excelente desempenho em jogos da XMG SECTOR Intel. Escusado será dizer que o GeForce RTX 4090 desempenha um papel crucial neste contexto. Mas você também precisará de uma CPU extremamente rápida a fim de efetivamente aproveitar a potência da GPU mais rápida da Nvidia. Da mesma forma, recomendamos jogar jogos principalmente a 2160p e configurações máximas para que você possa tirar proveito do desempenho da placa gráfica em primeiro lugar. Aqueles que só jogam a 1080p podem simplesmente ir por um RTX 4070 Ti e economizar muito dinheiro.

Características especiais da RTX, tais como DLSS 3.0 e geração de quadros (FG) são atualmente exclusivas das placas da Série RTX 40. Isto significa que se você quiser desfrutar destas novas características, não tem outra escolha a não ser obter uma GPU RTX Série 40. A Intel XMG SECTOR é capaz de executar todos os jogos testados sem problemas a 2160p e configurações máximas. Além disso, aqueles que querem habilitar o traçado de raio podem usar o recurso em sua maioria sem nenhuma limitação. Mas alguns jogos, como o Cyberpunk 2077, podem trazer até mesmo um equipamento de alta qualidade como o XMG SECTOR a seus joelhos. A habilitação do DLSS ajudará o PC a executar estes jogos sem problemas novamente a 2160p. De sua parte, a AMD oferece uma característica semelhante na forma de FSR. Em última instância, cabe aos desenvolvedores de jogos implementar estas características. Você pode visitar nesta página para encontrar uma lista de jogos que já suportam DLSS 3.0 ou que o farão no futuro.

GTA V
1920x1080 Highest Settings possible AA:4xMSAA + FX AF:16x
AMD Radeon RX 6950 XT, AMD Ryzen 9 7950X
MSI Radeon RX 6950 XT Gaming X Trio
177.2 (2.02min, 111.1P1 - 444max) fps +7%
NVIDIA GeForce RTX 4090, Intel Core i9-13900K
SCHENKER XMG SECTOR, i9 13900K, RTX 4090
165.9 (13.4min, 125P1 - 295max) fps
NVIDIA GeForce RTX 4080, AMD Ryzen 9 7950X
KFA2 GeForce RTX 4080 SG
164.3 (6.85min, 111.1P1 - 372max) fps -1%
NVIDIA GeForce RTX 4090, AMD Ryzen 9 7950X
KFA2 GeForce RTX 4090 SG
163.3 (13min, 125P1 - 398max) fps -2%
NVIDIA GeForce RTX 4070 Ti, AMD Ryzen 9 7950X
KFA2 GeForce RTX 4070 Ti SG
163.3 (3.8min, 111.1P1 - 346max) fps -2%
NVIDIA GeForce RTX 3080 Ti, Intel Core i9-13900K
Intel NUC13 Raptor Canyon
161.5 (2.84min, 125P1 - 280max) fps -3%
AMD Radeon RX 7900 XT, AMD Ryzen 9 7950X
AMD Radeon RX 7900 XT
159.9 (3.47min, 100P1 - 308max) fps -4%
AMD Radeon RX 7900 XTX, AMD Ryzen 9 7950X
AMD Radeon RX 7900 XTX
159.4 (5.55min, 100P1 - 347max) fps -4%
3840x2160 High/On (Advanced Graphics Off) AA:FX AF:8x
NVIDIA GeForce RTX 4090, AMD Ryzen 9 7950X
KFA2 GeForce RTX 4090 SG
187.8 (4.41min, 200P1 - 611max) fps 0%
NVIDIA GeForce RTX 4090, Intel Core i9-13900K
SCHENKER XMG SECTOR, i9 13900K, RTX 4090
187.5 fps
AMD Radeon RX 7900 XTX, AMD Ryzen 9 7950X
AMD Radeon RX 7900 XTX
184.8 (5.75min, 142.9P1 - 559max) fps -1%
NVIDIA GeForce RTX 4080, AMD Ryzen 9 7950X
KFA2 GeForce RTX 4080 SG
183.9 (5.11min, 142.9P1 - 570max) fps -2%
NVIDIA GeForce RTX 3080 Ti, Intel Core i9-13900K
Intel NUC13 Raptor Canyon
182 (1.762min, 125P1 - 491max) fps -3%
AMD Radeon RX 6950 XT, AMD Ryzen 9 7950X
MSI Radeon RX 6950 XT Gaming X Trio
175.5 (4.99min, 125P1 - 618max) fps -6%
AMD Radeon RX 7900 XT, AMD Ryzen 9 7950X
AMD Radeon RX 7900 XT
175.1 (5.09min, 125P1 - 687max) fps -7%
NVIDIA GeForce RTX 4070 Ti, AMD Ryzen 9 7950X
KFA2 GeForce RTX 4070 Ti SG
171.7 (4.23min, 111.1P1 - 527max) fps -8%
The Witcher 3
1920x1080 Ultra Graphics & Postprocessing (HBAO+)
NVIDIA GeForce RTX 4090, Intel Core i9-13900K
SCHENKER XMG SECTOR, i9 13900K, RTX 4090
314.1 fps
NVIDIA GeForce RTX 4090, AMD Ryzen 9 7950X
KFA2 GeForce RTX 4090 SG
306 (93.3min, 156.1P0.1, 239P1 - 567max) fps -3%
AMD Radeon RX 7900 XTX, AMD Ryzen 9 7950X
AMD Radeon RX 7900 XTX
297 (41.3min, 167.7P0.1, 245P1 - 507max) fps -5%
NVIDIA GeForce RTX 4080, AMD Ryzen 9 7950X
KFA2 GeForce RTX 4080 SG
268 (91.3min, 148.4P0.1, 218P1 - 552max) fps -15%
AMD Radeon RX 7900 XT, AMD Ryzen 9 7950X
AMD Radeon RX 7900 XT
265 (104.1min, 151.5P0.1, 214P1 - 491max) fps -16%
AMD Radeon RX 6950 XT, AMD Ryzen 9 7950X
MSI Radeon RX 6950 XT Gaming X Trio
226 (104.3min, 134P0.1, 181P1 - 463max) fps -28%
NVIDIA GeForce RTX 4070 Ti, AMD Ryzen 9 7950X
KFA2 GeForce RTX 4070 Ti SG
224 (32.7min, 123.6P0.1, 183.9P1 - 580max) fps -29%
NVIDIA GeForce RTX 3080 Ti, Intel Core i9-13900K
Intel NUC13 Raptor Canyon
179.1 (88.3min, 112.8P0.1, 149.4P1 - 475max) fps -43%
3840x2160 High Graphics & Postprocessing (Nvidia HairWorks Off)
NVIDIA GeForce RTX 4090, AMD Ryzen 9 7950X
KFA2 GeForce RTX 4090 SG
286 (92.1min, 181.2P0.1, 243P1 - 863max) fps +1%
NVIDIA GeForce RTX 4090, Intel Core i9-13900K
SCHENKER XMG SECTOR, i9 13900K, RTX 4090
282 fps
NVIDIA GeForce RTX 4080, AMD Ryzen 9 7950X
KFA2 GeForce RTX 4080 SG
202 (77.2min, 112.7P0.1, 171.7P1 - 783max) fps -28%
AMD Radeon RX 7900 XTX, AMD Ryzen 9 7950X
AMD Radeon RX 7900 XTX
163.8 (49.6min, 112P0.1, 134.1P1 - 463max) fps -42%
AMD Radeon RX 7900 XT, AMD Ryzen 9 7950X
AMD Radeon RX 7900 XT
158.5 (83.2min, 111.2P0.1, 122.8P1 - 408max) fps -44%
NVIDIA GeForce RTX 3080 Ti, Intel Core i9-13900K
Intel NUC13 Raptor Canyon
156.8 (29.3min, 110.6P0.1, 134.2P1 - 617max) fps -44%
NVIDIA GeForce RTX 4070 Ti, AMD Ryzen 9 7950X
KFA2 GeForce RTX 4070 Ti SG
149.3 (71min, 104.6P0.1, 129.1P1 - 717max) fps -47%
AMD Radeon RX 6950 XT, AMD Ryzen 9 7950X
MSI Radeon RX 6950 XT Gaming X Trio
148.3 (41.6min, 103P0.1, 117.2P1 - 530max) fps -47%
Final Fantasy XV Benchmark
3840x2160 High Quality
NVIDIA GeForce RTX 4090, AMD Ryzen 9 7950X
KFA2 GeForce RTX 4090 SG
156.7 fps +1%
NVIDIA GeForce RTX 4090, Intel Core i9-13900K
SCHENKER XMG SECTOR, i9 13900K, RTX 4090
155.7 fps
NVIDIA GeForce RTX 4080, AMD Ryzen 9 7950X
KFA2 GeForce RTX 4080 SG
116.9 fps -25%
AMD Radeon RX 7900 XTX, AMD Ryzen 9 7950X
AMD Radeon RX 7900 XTX
101.6 fps -35%
NVIDIA GeForce RTX 4070 Ti, AMD Ryzen 9 7950X
KFA2 GeForce RTX 4070 Ti SG
87.1 fps -44%
AMD Radeon RX 6950 XT, AMD Ryzen 9 7950X
MSI Radeon RX 6950 XT Gaming X Trio
85.6 fps -45%
AMD Radeon RX 7900 XT, AMD Ryzen 9 7950X
AMD Radeon RX 7900 XT
84.9 fps -45%
NVIDIA GeForce RTX 3080 Ti, Intel Core i9-13900K
Intel NUC13 Raptor Canyon
84.2 fps -46%
1920x1080 High Quality
NVIDIA GeForce RTX 4090, Intel Core i9-13900K
SCHENKER XMG SECTOR, i9 13900K, RTX 4090
227 fps
NVIDIA GeForce RTX 4090, AMD Ryzen 9 7950X
KFA2 GeForce RTX 4090 SG
226 fps 0%
NVIDIA GeForce RTX 4080, AMD Ryzen 9 7950X
KFA2 GeForce RTX 4080 SG
225 fps -1%
AMD Radeon RX 7900 XTX, AMD Ryzen 9 7950X
AMD Radeon RX 7900 XTX
216 fps -5%
NVIDIA GeForce RTX 4070 Ti, AMD Ryzen 9 7950X
KFA2 GeForce RTX 4070 Ti SG
207 fps -9%
AMD Radeon RX 7900 XT, AMD Ryzen 9 7950X
AMD Radeon RX 7900 XT
197.2 fps -13%
AMD Radeon RX 6950 XT, AMD Ryzen 9 7950X
MSI Radeon RX 6950 XT Gaming X Trio
196.8 fps -13%
NVIDIA GeForce RTX 3080 Ti, Intel Core i9-13900K
Intel NUC13 Raptor Canyon
180.6 fps -20%
X-Plane 11.11
3840x2160 high (fps_test=3)
NVIDIA GeForce RTX 4090, Intel Core i9-13900K
SCHENKER XMG SECTOR, i9 13900K, RTX 4090
139.3 fps
NVIDIA GeForce RTX 3080 Ti, Intel Core i9-13900K
Intel NUC13 Raptor Canyon
127.3 fps -9%
NVIDIA GeForce RTX 4090, AMD Ryzen 9 7950X
KFA2 GeForce RTX 4090 SG
126 fps -10%
NVIDIA GeForce RTX 4080, AMD Ryzen 9 7950X
KFA2 GeForce RTX 4080 SG
124.9 fps -10%
AMD Radeon RX 6950 XT, AMD Ryzen 9 7950X
MSI Radeon RX 6950 XT Gaming X Trio
99.5 fps -29%
AMD Radeon RX 7900 XTX, AMD Ryzen 9 7950X
AMD Radeon RX 7900 XTX
88 fps -37%
AMD Radeon RX 7900 XT, AMD Ryzen 9 7950X
AMD Radeon RX 7900 XT
81.4 fps -42%
1920x1080 high (fps_test=3)
NVIDIA GeForce RTX 4090, Intel Core i9-13900K
SCHENKER XMG SECTOR, i9 13900K, RTX 4090
160.6 fps
NVIDIA GeForce RTX 4080, AMD Ryzen 9 7950X
KFA2 GeForce RTX 4080 SG
149.4 fps -7%
NVIDIA GeForce RTX 3080 Ti, Intel Core i9-13900K
Intel NUC13 Raptor Canyon
148.8 fps -7%
NVIDIA GeForce RTX 4090, AMD Ryzen 9 7950X
KFA2 GeForce RTX 4090 SG
145.1 fps -10%
AMD Radeon RX 6950 XT, AMD Ryzen 9 7950X
MSI Radeon RX 6950 XT Gaming X Trio
124.9 fps -22%
AMD Radeon RX 7900 XTX, AMD Ryzen 9 7950X
AMD Radeon RX 7900 XTX
117.1 fps -27%
AMD Radeon RX 7900 XT, AMD Ryzen 9 7950X
AMD Radeon RX 7900 XT
109.8 fps -32%
Far Cry 5
1920x1080 Ultra Preset AA:T
NVIDIA GeForce RTX 4090, AMD Ryzen 9 7950X
KFA2 GeForce RTX 4090 SG
191 (141min - 271max) fps +2%
NVIDIA GeForce RTX 4070 Ti, AMD Ryzen 9 7950X
KFA2 GeForce RTX 4070 Ti SG
189 (139min - 268max) fps +1%
NVIDIA GeForce RTX 4080, AMD Ryzen 9 7950X
KFA2 GeForce RTX 4080 SG
188 (138min - 261max) fps +1%
NVIDIA GeForce RTX 4090, Intel Core i9-13900K
SCHENKER XMG SECTOR, i9 13900K, RTX 4090
187 (138min - 253max) fps
NVIDIA GeForce RTX 3080 Ti, Intel Core i9-13900K
Intel NUC13 Raptor Canyon
186 (141min - 254max) fps -1%
AMD Radeon RX 7900 XTX, AMD Ryzen 9 7950X
AMD Radeon RX 7900 XTX
175 (129min - 241max) fps -6%
AMD Radeon RX 6950 XT, AMD Ryzen 9 7950X
MSI Radeon RX 6950 XT Gaming X Trio
174 (131min - 235max) fps -7%
AMD Radeon RX 7900 XT, AMD Ryzen 9 7950X
AMD Radeon RX 7900 XT
173 (129min - 230max) fps -7%
3840x2160 Ultra Preset AA:T
NVIDIA GeForce RTX 4090, AMD Ryzen 9 7950X
KFA2 GeForce RTX 4090 SG
175 (135min - 211max) fps +1%
NVIDIA GeForce RTX 4090, Intel Core i9-13900K
SCHENKER XMG SECTOR, i9 13900K, RTX 4090
173 (144min - 205max) fps
AMD Radeon RX 7900 XTX, AMD Ryzen 9 7950X
AMD Radeon RX 7900 XTX
155 (134min - 180max) fps -10%
NVIDIA GeForce RTX 4080, AMD Ryzen 9 7950X
KFA2 GeForce RTX 4080 SG
139 (125min - 163max) fps -20%
AMD Radeon RX 7900 XT, AMD Ryzen 9 7950X
AMD Radeon RX 7900 XT
132 (116min - 162max) fps -24%
AMD Radeon RX 6950 XT, AMD Ryzen 9 7950X
MSI Radeon RX 6950 XT Gaming X Trio
126 (109min - 157max) fps -27%
NVIDIA GeForce RTX 4070 Ti, AMD Ryzen 9 7950X
KFA2 GeForce RTX 4070 Ti SG
111 (99min - 131max) fps -36%
NVIDIA GeForce RTX 3080 Ti, Intel Core i9-13900K
Intel NUC13 Raptor Canyon
109 (98min - 129max) fps -37%
Far Cry New Dawn
1920x1080 Ultra Preset
NVIDIA GeForce RTX 4090, Intel Core i9-13900K
SCHENKER XMG SECTOR, i9 13900K, RTX 4090
161 (112min - 256max) fps
NVIDIA GeForce RTX 4090, AMD Ryzen 9 7950X
KFA2 GeForce RTX 4090 SG
153 (105min - 263max) fps -5%
NVIDIA GeForce RTX 4080, AMD Ryzen 9 7950X
KFA2 GeForce RTX 4080 SG
150 (102min - 247max) fps -7%
NVIDIA GeForce RTX 3080 Ti, Intel Core i9-13900K
Intel NUC13 Raptor Canyon
150 (106min - 242max) fps -7%
NVIDIA GeForce RTX 4070 Ti, AMD Ryzen 9 7950X
KFA2 GeForce RTX 4070 Ti SG
150 (102min - 253max) fps -7%
AMD Radeon RX 7900 XTX, AMD Ryzen 9 7950X
AMD Radeon RX 7900 XTX
143 (99min - 244max) fps -11%
AMD Radeon RX 7900 XT, AMD Ryzen 9 7950X
AMD Radeon RX 7900 XT
142 (98min - 234max) fps -12%
AMD Radeon RX 6950 XT, AMD Ryzen 9 7950X
MSI Radeon RX 6950 XT Gaming X Trio
142 (97min - 230max) fps -12%
3840x2160 Ultra Preset
NVIDIA GeForce RTX 4090, Intel Core i9-13900K
SCHENKER XMG SECTOR, i9 13900K, RTX 4090
152 (113min - 216max) fps
NVIDIA GeForce RTX 4090, AMD Ryzen 9 7950X
KFA2 GeForce RTX 4090 SG
145 (105min - 214max) fps -5%
AMD Radeon RX 7900 XTX, AMD Ryzen 9 7950X
AMD Radeon RX 7900 XTX
138 (98min - 216max) fps -9%
NVIDIA GeForce RTX 4080, AMD Ryzen 9 7950X
KFA2 GeForce RTX 4080 SG
130 (102min - 169max) fps -14%
AMD Radeon RX 7900 XT, AMD Ryzen 9 7950X
AMD Radeon RX 7900 XT
129 (97min - 184max) fps -15%
AMD Radeon RX 6950 XT, AMD Ryzen 9 7950X
MSI Radeon RX 6950 XT Gaming X Trio
125 (96min - 174max) fps -18%
NVIDIA GeForce RTX 4070 Ti, AMD Ryzen 9 7950X
KFA2 GeForce RTX 4070 Ti SG
112 (91min - 137max) fps -26%
NVIDIA GeForce RTX 3080 Ti, Intel Core i9-13900K
Intel NUC13 Raptor Canyon
109 (93min - 130max) fps -28%
Far Cry 6
1920x1080 Ultra Graphics Quality + HD Textures AA:T
AMD Radeon RX 7900 XTX, AMD Ryzen 9 7950X
AMD Radeon RX 7900 XTX
183.6 (130min - 256max) fps +10%
AMD Radeon RX 7900 XT, AMD Ryzen 9 7950X
AMD Radeon RX 7900 XT
181.9 (129min - 263max) fps +9%
NVIDIA GeForce RTX 4090, AMD Ryzen 9 7950X
KFA2 GeForce RTX 4090 SG
168.6 (127min - 250max) fps +1%
NVIDIA GeForce RTX 4090, Intel Core i9-13900K
SCHENKER XMG SECTOR, i9 13900K, RTX 4090
166.8 (131min - 216max) fps
AMD Radeon RX 6950 XT, AMD Ryzen 9 7950X
MSI Radeon RX 6950 XT Gaming X Trio
161.2 (116min - 220max) fps -3%
NVIDIA GeForce RTX 4070 Ti, AMD Ryzen 9 7950X
KFA2 GeForce RTX 4070 Ti SG
159.7 (119min - 214max) fps -4%
NVIDIA GeForce RTX 4080, AMD Ryzen 9 7950X
KFA2 GeForce RTX 4080 SG
155 (118min - 218max) fps -7%
NVIDIA GeForce RTX 3080 Ti, Intel Core i9-13900K
Intel NUC13 Raptor Canyon
120.7 (100min - 164max) fps -28%
3840x2160 Ultra Graphics Quality + HD Textures AA:T
NVIDIA GeForce RTX 4090, AMD Ryzen 9 7950X
KFA2 GeForce RTX 4090 SG
134.9 (118min - 147max) fps +1%
NVIDIA GeForce RTX 4090, Intel Core i9-13900K
SCHENKER XMG SECTOR, i9 13900K, RTX 4090
133.4 (119min - 144max) fps
AMD Radeon RX 7900 XTX, AMD Ryzen 9 7950X
AMD Radeon RX 7900 XTX
124 (113min - 136max) fps -7%
NVIDIA GeForce RTX 4080, AMD Ryzen 9 7950X
KFA2 GeForce RTX 4080 SG
107 (98min - 116max) fps -20%
AMD Radeon RX 7900 XT, AMD Ryzen 9 7950X
AMD Radeon RX 7900 XT
104.1 (95min - 114max) fps -22%
AMD Radeon RX 6950 XT, AMD Ryzen 9 7950X
MSI Radeon RX 6950 XT Gaming X Trio
94.7 (87min - 103max) fps -29%
NVIDIA GeForce RTX 4070 Ti, AMD Ryzen 9 7950X
KFA2 GeForce RTX 4070 Ti SG
88.3 (80min - 96max) fps -34%
NVIDIA GeForce RTX 3080 Ti, Intel Core i9-13900K
Intel NUC13 Raptor Canyon
86 (77min - 93max) fps -36%
Metro Exodus
1920x1080 Ultra Quality AF:16x
NVIDIA GeForce RTX 4090, AMD Ryzen 9 7950X
KFA2 GeForce RTX 4090 SG
195.3 (107.41min - 299.22max) fps +10%
AMD Radeon RX 7900 XTX, AMD Ryzen 9 7950X
AMD Radeon RX 7900 XTX
183.5 (102.51min - 295.07max) fps +3%
NVIDIA GeForce RTX 4080, AMD Ryzen 9 7950X
KFA2 GeForce RTX 4080 SG
177.7 (81.95min - 283.37max) fps 0%
NVIDIA GeForce RTX 4090, Intel Core i9-13900K
SCHENKER XMG SECTOR, i9 13900K, RTX 4090
177.3 (82.92min - 288.02max) fps
AMD Radeon RX 7900 XT, AMD Ryzen 9 7950X
AMD Radeon RX 7900 XT
164.6 (92.11min - 256.61max) fps -7%
NVIDIA GeForce RTX 4070 Ti, AMD Ryzen 9 7950X
KFA2 GeForce RTX 4070 Ti SG
156.9 (75.17min - 274.12max) fps -12%
AMD Radeon RX 6950 XT, AMD Ryzen 9 7950X
MSI Radeon RX 6950 XT Gaming X Trio
151.3 (85.77min - 229.46max) fps -15%
NVIDIA GeForce RTX 3080 Ti, Intel Core i9-13900K
Intel NUC13 Raptor Canyon
134 (62.23min - 264.55max) fps -24%
3840x2160 Ultra Quality AF:16x
NVIDIA GeForce RTX 4090, AMD Ryzen 9 7950X
KFA2 GeForce RTX 4090 SG
138.5 (77.47min - 228.36max) fps +2%
NVIDIA GeForce RTX 4090, Intel Core i9-13900K
SCHENKER XMG SECTOR, i9 13900K, RTX 4090
136.3 (72.34min - 241.96max) fps
NVIDIA GeForce RTX 4080, AMD Ryzen 9 7950X
KFA2 GeForce RTX 4080 SG
103.9 (62.73min - 167.39max) fps -24%
AMD Radeon RX 7900 XTX, AMD Ryzen 9 7950X
AMD Radeon RX 7900 XTX
103.5 (66.43min - 144.4max) fps -24%
AMD Radeon RX 7900 XT, AMD Ryzen 9 7950X
AMD Radeon RX 7900 XT
86.9 (56.86min - 117.84max) fps -36%
NVIDIA GeForce RTX 4070 Ti, AMD Ryzen 9 7950X
KFA2 GeForce RTX 4070 Ti SG
82.8 (51min - 141.28max) fps -39%
AMD Radeon RX 6950 XT, AMD Ryzen 9 7950X
MSI Radeon RX 6950 XT Gaming X Trio
79.3 (52.59min - 103.86max) fps -42%
NVIDIA GeForce RTX 3080 Ti, Intel Core i9-13900K
Intel NUC13 Raptor Canyon
76.5 (48.81min - 120.82max) fps -44%
Borderlands 3
3840x2160 Badass Overall Quality (DX11)
NVIDIA GeForce RTX 4090, AMD Ryzen 9 7950X
KFA2 GeForce RTX 4090 SG
134.1 fps +1%
NVIDIA GeForce RTX 4090, Intel Core i9-13900K
SCHENKER XMG SECTOR, i9 13900K, RTX 4090
132.9 fps
NVIDIA GeForce RTX 4080, AMD Ryzen 9 7950X
KFA2 GeForce RTX 4080 SG
95.2 fps -28%
AMD Radeon RX 7900 XTX, AMD Ryzen 9 7950X
AMD Radeon RX 7900 XTX
88.4 fps -33%
AMD Radeon RX 7900 XT, AMD Ryzen 9 7950X
AMD Radeon RX 7900 XT
74.6 fps -44%
NVIDIA GeForce RTX 3080 Ti, Intel Core i9-13900K
Intel NUC13 Raptor Canyon
74 fps -44%
NVIDIA GeForce RTX 4070 Ti, AMD Ryzen 9 7950X
KFA2 GeForce RTX 4070 Ti SG
72.5 fps -45%
AMD Radeon RX 6950 XT, AMD Ryzen 9 7950X
MSI Radeon RX 6950 XT Gaming X Trio
70.9 fps -47%
1920x1080 Badass Overall Quality (DX11)
NVIDIA GeForce RTX 4090, AMD Ryzen 9 7950X
KFA2 GeForce RTX 4090 SG
189.4 fps +4%
NVIDIA GeForce RTX 4080, AMD Ryzen 9 7950X
KFA2 GeForce RTX 4080 SG
187.2 fps +2%
NVIDIA GeForce RTX 4090, Intel Core i9-13900K
SCHENKER XMG SECTOR, i9 13900K, RTX 4090
182.9 fps
AMD Radeon RX 7900 XTX, AMD Ryzen 9 7950X
AMD Radeon RX 7900 XTX
180.2 fps -1%
NVIDIA GeForce RTX 4070 Ti, AMD Ryzen 9 7950X
KFA2 GeForce RTX 4070 Ti SG
171.9 fps -6%
AMD Radeon RX 7900 XT, AMD Ryzen 9 7950X
AMD Radeon RX 7900 XT
169.4 fps -7%
AMD Radeon RX 6950 XT, AMD Ryzen 9 7950X
MSI Radeon RX 6950 XT Gaming X Trio
169.1 fps -8%
NVIDIA GeForce RTX 3080 Ti, Intel Core i9-13900K
Intel NUC13 Raptor Canyon
160 fps -13%
F1 2020
1920x1080 Ultra High Preset AA:T AF:16x
NVIDIA GeForce RTX 4090, AMD Ryzen 9 7950X
KFA2 GeForce RTX 4090 SG
423 (327min - 501max) fps +7%
NVIDIA GeForce RTX 4080, AMD Ryzen 9 7950X
KFA2 GeForce RTX 4080 SG
396 (325min - 462max) fps 0%
AMD Radeon RX 7900 XTX, AMD Ryzen 9 7950X
AMD Radeon RX 7900 XTX
395 (299min - 491max) fps 0%
NVIDIA GeForce RTX 4090, Intel Core i9-13900K
SCHENKER XMG SECTOR, i9 13900K, RTX 4090
395 (325min - 478max) fps
NVIDIA GeForce RTX 4070 Ti, AMD Ryzen 9 7950X
KFA2 GeForce RTX 4070 Ti SG
353 (282min - 422max) fps -11%
AMD Radeon RX 7900 XT, AMD Ryzen 9 7950X
AMD Radeon RX 7900 XT
350 (267min - 429max) fps -11%
AMD Radeon RX 6950 XT, AMD Ryzen 9 7950X
MSI Radeon RX 6950 XT Gaming X Trio
331 (242min - 410max) fps -16%
NVIDIA GeForce RTX 3080 Ti, Intel Core i9-13900K
Intel NUC13 Raptor Canyon
310 (246min - 379max) fps -22%
3840x2160 Ultra High Preset AA:T AF:16x
NVIDIA GeForce RTX 4090, AMD Ryzen 9 7950X
KFA2 GeForce RTX 4090 SG
285 (240min - 333max) fps +1%
NVIDIA GeForce RTX 4090, Intel Core i9-13900K
SCHENKER XMG SECTOR, i9 13900K, RTX 4090
282 (194min - 330max) fps
NVIDIA GeForce RTX 4080, AMD Ryzen 9 7950X
KFA2 GeForce RTX 4080 SG
201 (172min - 235max) fps -29%
AMD Radeon RX 7900 XTX, AMD Ryzen 9 7950X
AMD Radeon RX 7900 XTX
199.6 (160min - 242max) fps -29%
AMD Radeon RX 7900 XT, AMD Ryzen 9 7950X
AMD Radeon RX 7900 XT
165.5 (136min - 199max) fps -41%
NVIDIA GeForce RTX 4070 Ti, AMD Ryzen 9 7950X
KFA2 GeForce RTX 4070 Ti SG
160.6 (135min - 188max) fps -43%
AMD Radeon RX 6950 XT, AMD Ryzen 9 7950X
MSI Radeon RX 6950 XT Gaming X Trio
158.1 (126min - 189max) fps -44%
NVIDIA GeForce RTX 3080 Ti, Intel Core i9-13900K
Intel NUC13 Raptor Canyon
145.2 (122min - 172max) fps -49%
F1 2021
1920x1080 Ultra High Preset + Raytracing AA:T AF:16x
NVIDIA GeForce RTX 4090, Intel Core i9-13900K
SCHENKER XMG SECTOR, i9 13900K, RTX 4090
277 (237min, 209P1 - 294max) fps
NVIDIA GeForce RTX 4090, AMD Ryzen 9 7950X
KFA2 GeForce RTX 4090 SG
274 (221min, 212P1 - 300max) fps -1%
AMD Radeon RX 7900 XTX, AMD Ryzen 9 7950X
AMD Radeon RX 7900 XTX
262 (192min, 192P1 - 286max) fps -5%
NVIDIA GeForce RTX 4080, AMD Ryzen 9 7950X
KFA2 GeForce RTX 4080 SG
256 (207min, 197P1 - 278max) fps -8%
AMD Radeon RX 7900 XT, AMD Ryzen 9 7950X
AMD Radeon RX 7900 XT
248 (199min, 195P1 - 273max) fps -10%
NVIDIA GeForce RTX 4070 Ti, AMD Ryzen 9 7950X
KFA2 GeForce RTX 4070 Ti SG
247 (198min, 174P1 - 267max) fps -11%
AMD Radeon RX 6950 XT, AMD Ryzen 9 7950X
MSI Radeon RX 6950 XT Gaming X Trio
237 (196min, 195P1 - 266max) fps -14%
NVIDIA GeForce RTX 3080 Ti, Intel Core i9-13900K
Intel NUC13 Raptor Canyon
225 (181min, 182P1 - 249max) fps -19%
3840x2160 Ultra High Preset + Raytracing AA:T AF:16x
NVIDIA GeForce RTX 4090, Intel Core i9-13900K
SCHENKER XMG SECTOR, i9 13900K, RTX 4090
196.6 (167min, 156P1 - 219max) fps
NVIDIA GeForce RTX 4090, AMD Ryzen 9 7950X
KFA2 GeForce RTX 4090 SG
195.1 (165min, 163P1 - 220max) fps -1%
NVIDIA GeForce RTX 4080, AMD Ryzen 9 7950X
KFA2 GeForce RTX 4080 SG
144.3 (123min, 122P1 - 162max) fps -27%
AMD Radeon RX 7900 XTX, AMD Ryzen 9 7950X
AMD Radeon RX 7900 XTX
133.6 (114min, 113P1 - 154max) fps -32%
NVIDIA GeForce RTX 4070 Ti, AMD Ryzen 9 7950X
KFA2 GeForce RTX 4070 Ti SG
114.7 (99min, 98P1 - 129max) fps -42%
AMD Radeon RX 7900 XT, AMD Ryzen 9 7950X
AMD Radeon RX 7900 XT
112.3 (95min, 95P1 - 129max) fps -43%
NVIDIA GeForce RTX 3080 Ti, Intel Core i9-13900K
Intel NUC13 Raptor Canyon
103.2 (89min, 89P1 - 115max) fps -48%
AMD Radeon RX 6950 XT, AMD Ryzen 9 7950X
MSI Radeon RX 6950 XT Gaming X Trio
102.1 (86min, 86P1 - 116max) fps -48%
Forza Horizon 5
1920x1080 Extreme Preset
NVIDIA GeForce RTX 4090, AMD Ryzen 9 7950X
KFA2 GeForce RTX 4090 SG
194 fps +4%
NVIDIA GeForce RTX 4090, Intel Core i9-13900K
SCHENKER XMG SECTOR, i9 13900K, RTX 4090
187 fps
NVIDIA GeForce RTX 4080, AMD Ryzen 9 7950X
KFA2 GeForce RTX 4080 SG
177 fps -5%
NVIDIA GeForce RTX 4070 Ti, AMD Ryzen 9 7950X
KFA2 GeForce RTX 4070 Ti SG
167 fps -11%
AMD Radeon RX 7900 XTX, AMD Ryzen 9 7950X
AMD Radeon RX 7900 XTX
166 fps -11%
AMD Radeon RX 6950 XT, AMD Ryzen 9 7950X
MSI Radeon RX 6950 XT Gaming X Trio
166 fps -11%
AMD Radeon RX 7900 XT, AMD Ryzen 9 7950X
AMD Radeon RX 7900 XT
154 fps -18%
NVIDIA GeForce RTX 3080 Ti, Intel Core i9-13900K
Intel NUC13 Raptor Canyon
129 fps -31%
3840x2160 Extreme Preset
NVIDIA GeForce RTX 4090, AMD Ryzen 9 7950X
KFA2 GeForce RTX 4090 SG
159 fps +7%
NVIDIA GeForce RTX 4090, Intel Core i9-13900K
SCHENKER XMG SECTOR, i9 13900K, RTX 4090
148 fps
NVIDIA GeForce RTX 4080, AMD Ryzen 9 7950X
KFA2 GeForce RTX 4080 SG
124 fps -16%
AMD Radeon RX 7900 XTX, AMD Ryzen 9 7950X
AMD Radeon RX 7900 XTX
118 fps -20%
AMD Radeon RX 7900 XT, AMD Ryzen 9 7950X
AMD Radeon RX 7900 XT
104 fps -30%
AMD Radeon RX 6950 XT, AMD Ryzen 9 7950X
MSI Radeon RX 6950 XT Gaming X Trio
104 fps -30%
NVIDIA GeForce RTX 4070 Ti, AMD Ryzen 9 7950X
KFA2 GeForce RTX 4070 Ti SG
102 fps -31%
NVIDIA GeForce RTX 3080 Ti, Intel Core i9-13900K
Intel NUC13 Raptor Canyon
87 fps -41%
F1 22
1920x1080 Ultra High Preset AA:T AF:16x
NVIDIA GeForce RTX 4090, AMD Ryzen 9 7950X
KFA2 GeForce RTX 4090 SG
207 (167min, 133P1 - 229max) fps +6%
NVIDIA GeForce RTX 4090, Intel Core i9-13900K
SCHENKER XMG SECTOR, i9 13900K, RTX 4090
195.4 (165min, 131P1 - 218max) fps
NVIDIA GeForce RTX 4080, AMD Ryzen 9 7950X
KFA2 GeForce RTX 4080 SG
172.8 (145min, 123P1 - 197max) fps -12%
AMD Radeon RX 7900 XTX, AMD Ryzen 9 7950X
AMD Radeon RX 7900 XTX
148.5 (112min, 104P1 - 179max) fps -24%
NVIDIA GeForce RTX 4070 Ti, AMD Ryzen 9 7950X
KFA2 GeForce RTX 4070 Ti SG
142.5 (123min, 105P1 - 166max) fps -27%
AMD Radeon RX 7900 XT, AMD Ryzen 9 7950X
AMD Radeon RX 7900 XT
129.8 (99min, 96P1 - 156max) fps -34%
NVIDIA GeForce RTX 3080 Ti, Intel Core i9-13900K
Intel NUC13 Raptor Canyon
128.8 (111min, 99P1 - 148max) fps -34%
AMD Radeon RX 6950 XT, AMD Ryzen 9 7950X
MSI Radeon RX 6950 XT Gaming X Trio
115.7 (91min, 88P1 - 141max) fps -41%
3840x2160 Ultra High Preset AA:T AF:16x
NVIDIA GeForce RTX 4090, AMD Ryzen 9 7950X
KFA2 GeForce RTX 4090 SG
82.5 (70min, 71P1 - 95max) fps +2%
NVIDIA GeForce RTX 4090, Intel Core i9-13900K
SCHENKER XMG SECTOR, i9 13900K, RTX 4090
81.1 (71min, 70P1 - 93max) fps
NVIDIA GeForce RTX 4080, AMD Ryzen 9 7950X
KFA2 GeForce RTX 4080 SG
57.9 (50min, 49P1 - 67max) fps -29%
AMD Radeon RX 7900 XTX, AMD Ryzen 9 7950X
AMD Radeon RX 7900 XTX
52.4 (37min, 38P1 - 64max) fps -35%
NVIDIA GeForce RTX 4070 Ti, AMD Ryzen 9 7950X
KFA2 GeForce RTX 4070 Ti SG
46.6 (40min, 39P1 - 53max) fps -43%
AMD Radeon RX 7900 XT, AMD Ryzen 9 7950X
AMD Radeon RX 7900 XT
44.9 (32min, 32P1 - 57max) fps -45%
NVIDIA GeForce RTX 3080 Ti, Intel Core i9-13900K
Intel NUC13 Raptor Canyon
43 (36min, 36P1 - 51max) fps -47%
AMD Radeon RX 6950 XT, AMD Ryzen 9 7950X
MSI Radeon RX 6950 XT Gaming X Trio
36.5 (27min, 27P1 - 47max) fps -55%
God of War
1920x1080 Ultra Preset
NVIDIA GeForce RTX 4090, AMD Ryzen 9 7950X
KFA2 GeForce RTX 4090 SG
204 (116.8min, 140.1P0.1, 164.8P1 - 384max) fps 0%
NVIDIA GeForce RTX 4090, Intel Core i9-13900K
SCHENKER XMG SECTOR, i9 13900K, RTX 4090
203 (75.7min, 138.3P0.1, 162.2P1 - 428max) fps
AMD Radeon RX 7900 XTX, AMD Ryzen 9 7950X
AMD Radeon RX 7900 XTX
185.3 (65.2min, 124P0.1, 138.6P1 - 347max) fps -9%
AMD Radeon RX 7900 XT, AMD Ryzen 9 7950X
AMD Radeon RX 7900 XT
165 (56.4min, 131P0.1, 136.9P1 - 372max) fps -19%
NVIDIA GeForce RTX 4080, AMD Ryzen 9 7950X
KFA2 GeForce RTX 4080 SG
164.9 (17.5min, 86.4P0.1, 134.3P1 - 410max) fps -19%
AMD Radeon RX 6950 XT, AMD Ryzen 9 7950X
MSI Radeon RX 6950 XT Gaming X Trio
135.7 (103.2min, 110.3P0.1, 113.8P1 - 166.6max) fps -33%
NVIDIA GeForce RTX 4070 Ti, AMD Ryzen 9 7950X
KFA2 GeForce RTX 4070 Ti SG
132.5 (66.1min, 90.4P0.1, 110.2P1 - 454max) fps -35%
NVIDIA GeForce RTX 3080 Ti, Intel Core i9-13900K
Intel NUC13 Raptor Canyon
119.6 (72.6min, 95.3P0.1, 102.9P1 - 185max) fps -41%
3840x2160 Ultra Preset
NVIDIA GeForce RTX 4090, Intel Core i9-13900K
SCHENKER XMG SECTOR, i9 13900K, RTX 4090
125.1 (51.8min, 101.4P0.1, 108.1P1 - 185max) fps
NVIDIA GeForce RTX 4090, AMD Ryzen 9 7950X
KFA2 GeForce RTX 4090 SG
125 (27.4min, 96.3P0.1, 107.9P1 - 289max) fps 0%
AMD Radeon RX 7900 XTX, AMD Ryzen 9 7950X
AMD Radeon RX 7900 XTX
102.1 (84.5min, 85.9P0.1, 90.1P1 - 118.9max) fps -18%
NVIDIA GeForce RTX 4080, AMD Ryzen 9 7950X
KFA2 GeForce RTX 4080 SG
95.3 (53min, 65.4P0.1, 82.4P1 - 306max) fps -24%
AMD Radeon RX 7900 XT, AMD Ryzen 9 7950X
AMD Radeon RX 7900 XT
88.1 (74.7min, 76.3P0.1, 78.3P1 - 108.8max) fps -30%
NVIDIA GeForce RTX 4070 Ti, AMD Ryzen 9 7950X
KFA2 GeForce RTX 4070 Ti SG
78.1 (49min, 66.4P0.1, 69.3P1 - 192.6max) fps -38%
NVIDIA GeForce RTX 3080 Ti, Intel Core i9-13900K
Intel NUC13 Raptor Canyon
77.5 (66.7min, 67.7P0.1, 69.6P1 - 95max) fps -38%
AMD Radeon RX 6950 XT, AMD Ryzen 9 7950X
MSI Radeon RX 6950 XT Gaming X Trio
74.3 (66min, 66.2P0.1, 67.6P1 - 84.9max) fps -41%
Tiny Tina's Wonderlands
1920x1080 Badass Preset (DX12)
NVIDIA GeForce RTX 4090, AMD Ryzen 9 7950X
KFA2 GeForce RTX 4090 SG
285 fps +2%
NVIDIA GeForce RTX 4090, Intel Core i9-13900K
SCHENKER XMG SECTOR, i9 13900K, RTX 4090
280 fps
NVIDIA GeForce RTX 4080, AMD Ryzen 9 7950X
KFA2 GeForce RTX 4080 SG
226 fps -19%
AMD Radeon RX 7900 XTX, AMD Ryzen 9 7950X
AMD Radeon RX 7900 XTX
226 fps -19%
AMD Radeon RX 6950 XT, AMD Ryzen 9 7950X
MSI Radeon RX 6950 XT Gaming X Trio
202 fps -28%
AMD Radeon RX 7900 XT, AMD Ryzen 9 7950X
AMD Radeon RX 7900 XT
194.2 fps -31%
NVIDIA GeForce RTX 4070 Ti, AMD Ryzen 9 7950X
KFA2 GeForce RTX 4070 Ti SG
189.5 fps -32%
NVIDIA GeForce RTX 3080 Ti, Intel Core i9-13900K
Intel NUC13 Raptor Canyon
168.5 fps -40%
3840x2160 Badass Preset (DX12)
NVIDIA GeForce RTX 4090, AMD Ryzen 9 7950X
KFA2 GeForce RTX 4090 SG
129.5 fps +1%
NVIDIA GeForce RTX 4090, Intel Core i9-13900K
SCHENKER XMG SECTOR, i9 13900K, RTX 4090
128.4 fps
NVIDIA GeForce RTX 4080, AMD Ryzen 9 7950X
KFA2 GeForce RTX 4080 SG
89 fps -31%
AMD Radeon RX 7900 XTX, AMD Ryzen 9 7950X
AMD Radeon RX 7900 XTX
85.6 fps -33%
AMD Radeon RX 6950 XT, AMD Ryzen 9 7950X
MSI Radeon RX 6950 XT Gaming X Trio
77.4 fps -40%
AMD Radeon RX 7900 XT, AMD Ryzen 9 7950X
AMD Radeon RX 7900 XT
71.3 fps -44%
NVIDIA GeForce RTX 3080 Ti, Intel Core i9-13900K
Intel NUC13 Raptor Canyon
70 fps -45%
NVIDIA GeForce RTX 4070 Ti, AMD Ryzen 9 7950X
KFA2 GeForce RTX 4070 Ti SG
69.4 fps -46%
The Callisto Protocol
1920x1080 Ultra Preset (without FSR Upscaling)
NVIDIA GeForce RTX 4090, Intel Core i9-13900K
SCHENKER XMG SECTOR, i9 13900K, RTX 4090
203.8 fps
NVIDIA GeForce RTX 4080, AMD Ryzen 9 7950X
KFA2 GeForce RTX 4080 SG
171 fps -16%
AMD Radeon RX 7900 XTX, AMD Ryzen 9 7950X
AMD Radeon RX 7900 XTX
158 fps -22%
NVIDIA GeForce RTX 4070 Ti, AMD Ryzen 9 7950X
KFA2 GeForce RTX 4070 Ti SG
149.3 fps -27%
AMD Radeon RX 7900 XT, AMD Ryzen 9 7950X
AMD Radeon RX 7900 XT
145 fps -29%
AMD Radeon RX 6950 XT, AMD Ryzen 9 7950X
MSI Radeon RX 6950 XT Gaming X Trio
137 fps -33%
3840x2160 Ultra Preset (without FSR Upscaling)
NVIDIA GeForce RTX 4090, Intel Core i9-13900K
SCHENKER XMG SECTOR, i9 13900K, RTX 4090
124.9 fps
NVIDIA GeForce RTX 4080, AMD Ryzen 9 7950X
KFA2 GeForce RTX 4080 SG
85 fps -32%
AMD Radeon RX 7900 XTX, AMD Ryzen 9 7950X
AMD Radeon RX 7900 XTX
77 fps -38%
NVIDIA GeForce RTX 4070 Ti, AMD Ryzen 9 7950X
KFA2 GeForce RTX 4070 Ti SG
67.9 fps -46%
AMD Radeon RX 7900 XT, AMD Ryzen 9 7950X
AMD Radeon RX 7900 XT
67 fps -46%
AMD Radeon RX 6950 XT, AMD Ryzen 9 7950X
MSI Radeon RX 6950 XT Gaming X Trio
66 fps -47%
Spider-Man Miles Morales
1920x1080 Very High Preset AA:T
NVIDIA GeForce RTX 4090, AMD Ryzen 9 7950X
KFA2 GeForce RTX 4090 SG
176.8 (65.9min, 87.4P0.1, 134.6P1 - 260max) fps +18%
NVIDIA GeForce RTX 4070 Ti, AMD Ryzen 9 7950X
KFA2 GeForce RTX 4070 Ti SG
171.2 (78.2min, 86.6P0.1, 126.6P1 - 245max) fps +15%
AMD Radeon RX 7900 XTX, AMD Ryzen 9 7950X
AMD Radeon RX 7900 XTX
162.8 (76.5min, 84P0.1, 125.2P1 - 252max) fps +9%
NVIDIA GeForce RTX 4080, AMD Ryzen 9 7950X
KFA2 GeForce RTX 4080 SG
157.3 (69.1min, 89.3P0.1, 120.5P1 - 252max) fps +5%
AMD Radeon RX 7900 XT, AMD Ryzen 9 7950X
AMD Radeon RX 7900 XT
156.2 (81.9min, 86.6P0.1, 116P1 - 248max) fps +5%
NVIDIA GeForce RTX 4090, Intel Core i9-13900K
SCHENKER XMG SECTOR, i9 13900K, RTX 4090
149.3 (73.3min, 83.6P0.1, 111.1P1 - 207max) fps
AMD Radeon RX 6950 XT, AMD Ryzen 9 7950X
MSI Radeon RX 6950 XT Gaming X Trio
143 (79.3min, 82.8P0.1, 110.5P1 - 249max) fps -4%
3840x2160 Very High Preset AA:T
NVIDIA GeForce RTX 4090, Intel Core i9-13900K
SCHENKER XMG SECTOR, i9 13900K, RTX 4090
126.8 (59.7min, 72.8P0.1, 95P1 - 178.8max) fps
NVIDIA GeForce RTX 4090, AMD Ryzen 9 7950X
KFA2 GeForce RTX 4090 SG
126.2 (67.7min, 78.3P0.1, 100.2P1 - 221max) fps 0%
NVIDIA GeForce RTX 4080, AMD Ryzen 9 7950X
KFA2 GeForce RTX 4080 SG
103.9 (24.9min, 74.5P0.1, 85.9P1 - 213max) fps -18%
AMD Radeon RX 7900 XTX, AMD Ryzen 9 7950X
AMD Radeon RX 7900 XTX
97.9 (73.8min, 75.2P0.1, 81.4P1 - 213max) fps -23%
NVIDIA GeForce RTX 4070 Ti, AMD Ryzen 9 7950X
KFA2 GeForce RTX 4070 Ti SG
89.1 (74min, 74.2P0.1, 76.7P1 - 187.8max) fps -30%
AMD Radeon RX 7900 XT, AMD Ryzen 9 7950X
AMD Radeon RX 7900 XT
83.9 (66.5min, 67.5P0.1, 69.7P1 - 191.8max) fps -34%
AMD Radeon RX 6950 XT, AMD Ryzen 9 7950X
MSI Radeon RX 6950 XT Gaming X Trio
74 (60.8min, 61.2P0.1, 63.4P1 - 175.4max) fps -42%
Metro Exodus - 1920x1080 Ultra Quality DXR AF:16x
NVIDIA GeForce RTX 4090
AMD Ryzen 9 7950X, NVIDIA GeForce RTX 4090
157.3 (96.47min - 223.46max) fps +21%
AMD Radeon RX 7900 XTX
AMD Ryzen 9 7950X, AMD Radeon RX 7900 XTX
141.2 (89.03min - 194.63max) fps +9%
NVIDIA GeForce RTX 4080
Intel Core i9-13900K, NVIDIA GeForce RTX 4080
137.2 (68.42min - 213.17max) fps +6%
NVIDIA GeForce RTX 4090
Intel Core i9-13900K, NVIDIA GeForce RTX 4090
129.6 (73.7min - 202.63max) fps
AMD Radeon RX 7900 XT
AMD Ryzen 9 7950X, AMD Radeon RX 7900 XT
124.3 (78.88min - 166max) fps -4%
NVIDIA GeForce RTX 3080 Ti
AMD Ryzen 9 7950X, NVIDIA GeForce RTX 3080 Ti
121.2 (66.05min - 193.46max) fps -6%
NVIDIA GeForce RTX 3090
AMD Ryzen 9 7950X, NVIDIA GeForce RTX 3090
115.4 (65.7min - 181.59max) fps -11%
Far Cry 6 - 1920x1080 Ultra Graphics Quality + HD Textures + DXR AA:T
NVIDIA GeForce RTX 4080
Intel Core i9-13900K, NVIDIA GeForce RTX 4080
154 (125min - 209max) fps +17%
AMD Radeon RX 7900 XTX
AMD Ryzen 9 7950X, AMD Radeon RX 7900 XTX
152.1 (75min - 229max) fps +16%
AMD Radeon RX 7900 XT
AMD Ryzen 9 7950X, AMD Radeon RX 7900 XT
143.6 (46min - 227max) fps +9%
NVIDIA GeForce RTX 4090
AMD Ryzen 9 7950X, NVIDIA GeForce RTX 4090
133.4 (108min - 196max) fps +2%
NVIDIA GeForce RTX 4090
Intel Core i9-13900K, NVIDIA GeForce RTX 4090
131.2 (111min - 190max) fps
NVIDIA GeForce RTX 3080 Ti
AMD Ryzen 9 7950X, NVIDIA GeForce RTX 3080 Ti
128.6 (109min - 170max) fps -2%
NVIDIA GeForce RTX 3090
AMD Ryzen 9 7950X, NVIDIA GeForce RTX 3090
123 (106min - 155max) fps -6%
AMD Radeon RX 6800
AMD Ryzen 9 7950X, AMD Radeon RX 6800
112.6 (63min - 152max) fps -14%
AMD Radeon RX 6950 XT
AMD Ryzen 9 5900X, AMD Radeon RX 6950 XT
101.6 (24min - 161max) fps -23%
Cyberpunk 2077 1.6
3840x2160 Ray Tracing Ultra Preset (DLSS off)
NVIDIA GeForce RTX 4090
Intel Core i9-13900K, NVIDIA GeForce RTX 4090
43.8 fps
NVIDIA GeForce RTX 4090
AMD Ryzen 9 7950X, NVIDIA GeForce RTX 4090 (1.6)
42.5 (31.9min - 56.3max) fps -3%
NVIDIA GeForce RTX 4080
Intel Core i9-13900K, NVIDIA GeForce RTX 4080 (1.6)
30.7 (23.5min - 40.6max) fps -30%
NVIDIA GeForce RTX 3090
AMD Ryzen 9 7950X, NVIDIA GeForce RTX 3090 (1.6)
20.8 (14.2min - 28.9max) fps -53%
AMD Radeon RX 7900 XTX
AMD Ryzen 9 7950X, AMD Radeon RX 7900 XTX (1.61)
20.7 (14.4min - 28.9max) fps -53%
NVIDIA GeForce RTX 3080 Ti
AMD Ryzen 9 7950X, NVIDIA GeForce RTX 3080 Ti (1.61)
18.6 (9.13min - 27.1max) fps -58%
AMD Radeon RX 7900 XT
AMD Ryzen 9 7950X, AMD Radeon RX 7900 XT (1.61)
17.6 (12min - 25max) fps -60%
AMD Radeon RX 6800
AMD Ryzen 9 7950X, AMD Radeon RX 6800 (1.61)
9.47 (6.59min - 14.7max) fps -78%
1920x1080 Ray Tracing Ultra Preset (DLSS off)
NVIDIA GeForce RTX 4090
Intel Core i9-13900K, NVIDIA GeForce RTX 4090
130.1 fps
NVIDIA GeForce RTX 4090
AMD Ryzen 9 7950X, NVIDIA GeForce RTX 4090 (1.6)
118.6 (69.3min - 161.9max) fps -9%
NVIDIA GeForce RTX 4080
Intel Core i9-13900K, NVIDIA GeForce RTX 4080 (1.6)
100.1 (77.6min - 133.3max) fps -23%
NVIDIA GeForce RTX 3080 Ti
AMD Ryzen 9 7950X, NVIDIA GeForce RTX 3080 Ti (1.61)
69.1 (53.3min - 89.8max) fps -47%
NVIDIA GeForce RTX 3090
AMD Ryzen 9 7950X, NVIDIA GeForce RTX 3090 (1.6)
65.7 (51min - 85.4max) fps -50%
AMD Radeon RX 7900 XTX
AMD Ryzen 9 7950X, AMD Radeon RX 7900 XTX (1.61)
64.6 (49.1min - 85.9max) fps -50%
AMD Radeon RX 7900 XT
AMD Ryzen 9 7950X, AMD Radeon RX 7900 XT (1.61)
57.1 (41.7min - 77.1max) fps -56%
AMD Radeon RX 6800
AMD Ryzen 9 7950X, AMD Radeon RX 6800 (1.61)
33.7 (23.1min - 47.4max) fps -74%
Control - 1920x1080 High Quality Preset & High Ray Tracing Preset (DX12)
NVIDIA GeForce RTX 4090
AMD Ryzen 9 7950X, NVIDIA GeForce RTX 4090
189.9 (19.4min, 126.6P0.1, 139.6P1 - 292max) fps +41%
NVIDIA GeForce RTX 4080
Intel Core i9-13900K, NVIDIA GeForce RTX 4080
162.8 (28.9min, 60.8P0.1, 129.4P1 - 273max) fps +21%
NVIDIA GeForce RTX 4090
Intel Core i9-13900K, NVIDIA GeForce RTX 4090
134.7 (19.2min, 99.4P0.1, 105.7P1 - 237max) fps
AMD Radeon RX 7900 XTX
AMD Ryzen 9 7950X, AMD Radeon RX 7900 XTX
133.7 (23.2min, 92.6P0.1, 104.6P1 - 239max) fps -1%
NVIDIA GeForce RTX 3080 Ti
AMD Ryzen 9 7950X, NVIDIA GeForce RTX 3080 Ti
120.6 (6.57min, 82.4P0.1, 100.1P1 - 224max) fps -10%
AMD Radeon RX 7900 XT
AMD Ryzen 9 7950X, AMD Radeon RX 7900 XT
116.1 (8.47min, 62.1P0.1, 91.4P1 - 219max) fps -14%
AMD Radeon RX 6950 XT
AMD Ryzen 9 5900X, AMD Radeon RX 6950 XT
97.7 (7.66min, 62.8P0.1, 73.5P1 - 198.6max) fps -27%
Ghostwire Tokyo - 1920x1080 Highest Settings + Maximum Ray Tracing
NVIDIA GeForce RTX 4090
AMD Ryzen 9 7950X, NVIDIA GeForce RTX 4090
183.2 (43min, 94.2P0.1, 137.8P1 - 221max) fps +4%
NVIDIA GeForce RTX 4090
Intel Core i9-13900K, NVIDIA GeForce RTX 4090
176.9 (38.6min, 93.7P0.1, 146P1 - 208max) fps
NVIDIA GeForce RTX 4080
Intel Core i9-13900K, NVIDIA GeForce RTX 4080
166.2 (30.4min, 60P0.1, 115.2P1 - 248max) fps -6%
AMD Radeon RX 7900 XTX
AMD Ryzen 9 7950X, AMD Radeon RX 7900 XTX
136.3 (39.1min, 76.4P0.1, 95.8P1 - 243max) fps -23%
NVIDIA GeForce RTX 3080 Ti
AMD Ryzen 9 7950X, NVIDIA GeForce RTX 3080 Ti
119.9 (39.2min, 61.9P0.1, 80.9P1 - 230max) fps -32%
AMD Radeon RX 7900 XT
AMD Ryzen 9 7950X, AMD Radeon RX 7900 XT
116.5 (30.3min, 71.6P0.1, 78.1P1 - 246max) fps -34%
Guardians of the Galaxy - 1920x1080 Ultra Preset + Ultra Ray-Tracing
NVIDIA GeForce RTX 4090
Intel Core i9-13900K, NVIDIA GeForce RTX 4090
189 fps
AMD Radeon RX 7900 XTX
AMD Ryzen 9 7950X, AMD Radeon RX 7900 XTX
137 fps -28%
AMD Radeon RX 7900 XT
AMD Ryzen 9 7950X, AMD Radeon RX 7900 XT
122 fps -35%
The Callisto Protocol - 1920x1080 Ultra Preset (without FSR Upscaling) + Full Ray-Tracing
AMD Radeon RX 7900 XTX
AMD Ryzen 9 7950X, AMD Radeon RX 7900 XTX
98 fps +5%
NVIDIA GeForce RTX 4090
Intel Core i9-13900K, NVIDIA GeForce RTX 4090
92.9 fps
NVIDIA GeForce RTX 4090
AMD Ryzen 9 7950X, NVIDIA GeForce RTX 4090
92 fps -1%
AMD Radeon RX 7900 XT
AMD Ryzen 9 7950X, AMD Radeon RX 7900 XT
89 fps -4%
NVIDIA GeForce RTX 3080 Ti
AMD Ryzen 9 7950X, NVIDIA GeForce RTX 3080 Ti
76 fps -18%
AMD Radeon RX 6800
AMD Ryzen 9 7950X, AMD Radeon RX 6800
66 fps -29%
baixo média alto ultraQHD4K DLSS4K
GTA V (2015) 187.6 187.6 187 165.9 166.3 187.5
The Witcher 3 (2015) 731.4 664.6 613.4 314.1 282
Dota 2 Reborn (2015) 287.9 258.5 256.3 219.7 226.8
Final Fantasy XV Benchmark (2018) 234 232 227 224 155.7
X-Plane 11.11 (2018) 237 209 160.6 139.3
Far Cry 5 (2018) 240 208 201 187 187 173
Strange Brigade (2018) 627 506 506 506 488 281
Shadow of the Tomb Raider (2018) 300 288 285 282 269 186
Far Cry New Dawn (2019) 206 188 180 161 164 152
Metro Exodus (2019) 260 235 191.9 177.3 165 136.3
Control (2019) 233 233 233 232 114.4
Borderlands 3 (2019) 243 213 197.3 182.9 182.5 132.9
F1 2020 (2020) 521 445 431 395 386 282
F1 2021 (2021) 632 585 501 277 267 196.6
Far Cry 6 (2021) 213 187.4 168.7 166.8 163.8 133.4
Guardians of the Galaxy (2021) 220 220 219 216 215 214
Forza Horizon 5 (2021) 285 245 244 187 178 148
God of War (2022) 263 263 255 203 173.4 125.1
GRID Legends (2022) 311 286 258 248 242 191.4
Cyberpunk 2077 1.6 (2022) 195 185 182 181 167 80
Ghostwire Tokyo (2022) 278 275 273 272 266 174.7
Tiny Tina's Wonderlands (2022) 413 355 309 280 224 128.4
F1 22 (2022) 415 377 364 195.4 149.7 81.1
A Plague Tale Requiem (2022) 188.6 175.4 158.5 147.8 104.6 193.6 74.7
Uncharted Legacy of Thieves Collection (2022) 139.5 138.1 137.1 136.6 134.9 99.1
Call of Duty Modern Warfare 2 2022 (2022) 248 247 232 230 187 215 128
Spider-Man Miles Morales (2022) 169.9 163.3 150.9 149.3 127.4 126.8
The Callisto Protocol (2022) 234.8 224 204.9 203.8 184.8 124.9
The Witcher 3 v4.00 (2023) 304 271 218 198.8 154.1 199.7

Emissões

Emissões sonoras

Com base em nossas medidas, o sistema é relativamente silencioso ao ocioso e produz apenas 32 dB(A) de ruído. Sob uma carga média, o computador é audível, mas ainda silencioso porque a placa gráfica ainda pode ser resfriada passivamente. Os ventiladores da caixa e os três ventiladores da GPU só rodam quando o sistema está sob carga pesada. Nosso medidor de nível sonoro mediu um nível de ruído de pico de 40,6 dB(A) durante o teste de estresse.

Barulho

Ocioso
32 / 32.1 / 32.3 dB
Carga
32.4 / 40.6 dB
  red to green bar
 
 
30 dB
silencioso
40 dB(A)
audível
50 dB(A)
ruidosamente alto
 
min: dark, med: mid, max: light   Earthworks M23R, Arta (15 cm de distância)   environment noise: 30.4 dB(A)
dB(A) 0102030405060708090Deep BassMiddle BassHigh BassLower RangeMidsHigher MidsLower HighsMid HighsUpper HighsSuper Highs2034.23331.235.935.42934.22536.637.433.436.937.229.536.63133.733.83534.734.730.733.74027.629.829.628.628.326.927.65026.727.126.226.92827.226.76327.925.826.428.127.926.927.98028.425.224.826.927.826.728.410032.127.727.129.527.925.832.112535.92424.827.226.622.635.916034.923.623.325.125.221.134.920034.721.722.823.323.519.734.725035.621.521.821.521.619.335.631537.925.825.826.126.118.737.94003621.221.323.322.718.63650033.319.519.420.720.418.733.363032.920.320.421.821.217.432.980031.618.919.419.719.517.531.6100031.118.719.319.719.618.531.1125028.518.819.219.419.417.928.5160027.218.818.918.919.217.127.2200024.819.219.718.618.717.224.8250023.521.721.118.618.517.323.5315021.72019.618.918.717.621.7400021.321.420.319.119.11821.3500021.320.119.619.419.518.621.3630021.2202019.819.818.921.2800020.920.220.320.420.219.620.91000020.820.520.720.520.42020.81250021.120.921.221.120.920.421.11600021.821.821.921.721.721.321.8SPL40.632.432.332.13230.440.6N3.71.71.71.71.71.43.7median 28.5median 20.5median 20.4median 20.5median 20.4median 18.7median 28.5Delta6.711.421.71.46.734.435.23434.234.431.534.434.631.531.532.634.134.330.532.630.13131.92930.130.231.831.831.130.229.1303126.529.130.53029.727.530.533.430302733.430.227.929.525.330.230.826.728.124.730.8282625.723.12828.424.622.422.428.428.523.72321.428.53124.824.420.23130.123.521.820.530.131.323.522.319.431.329.723.52118.729.730.924.121.718.330.929.822.520.41829.827.420.919.117.827.427.321.11917.627.326.120.518.417.426.122.218.618.317.222.220.718.618.217.520.720.518.918.317.620.519.518.618.417.919.518.618.418.41818.618.718.518.618.318.718.918.918.918.718.919.319.319.419.119.33933.432.130.4393.121.81.43.1median 28median 22.5median 20.4median 18.7median 284.93.12.62.24.9hearing rangehide median Fan NoiseSCHENKER XMG SECTOR, i9 13900K, RTX 4090Intel NUC13 Raptor Canyon

Temperatura

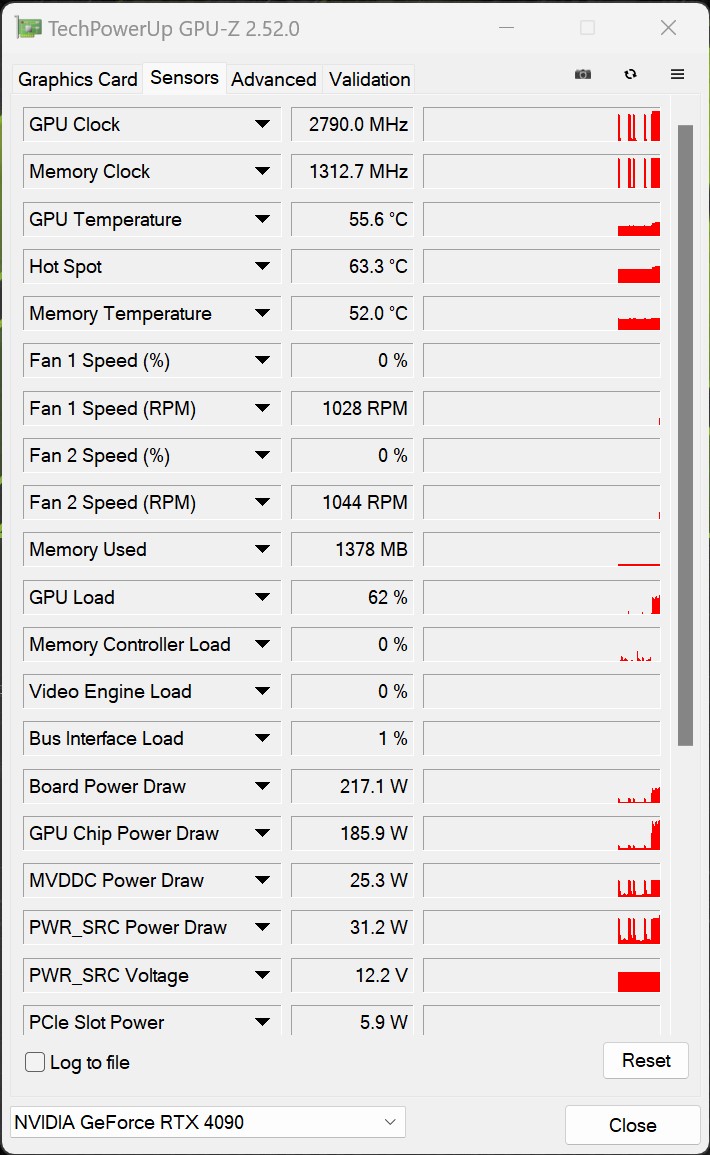
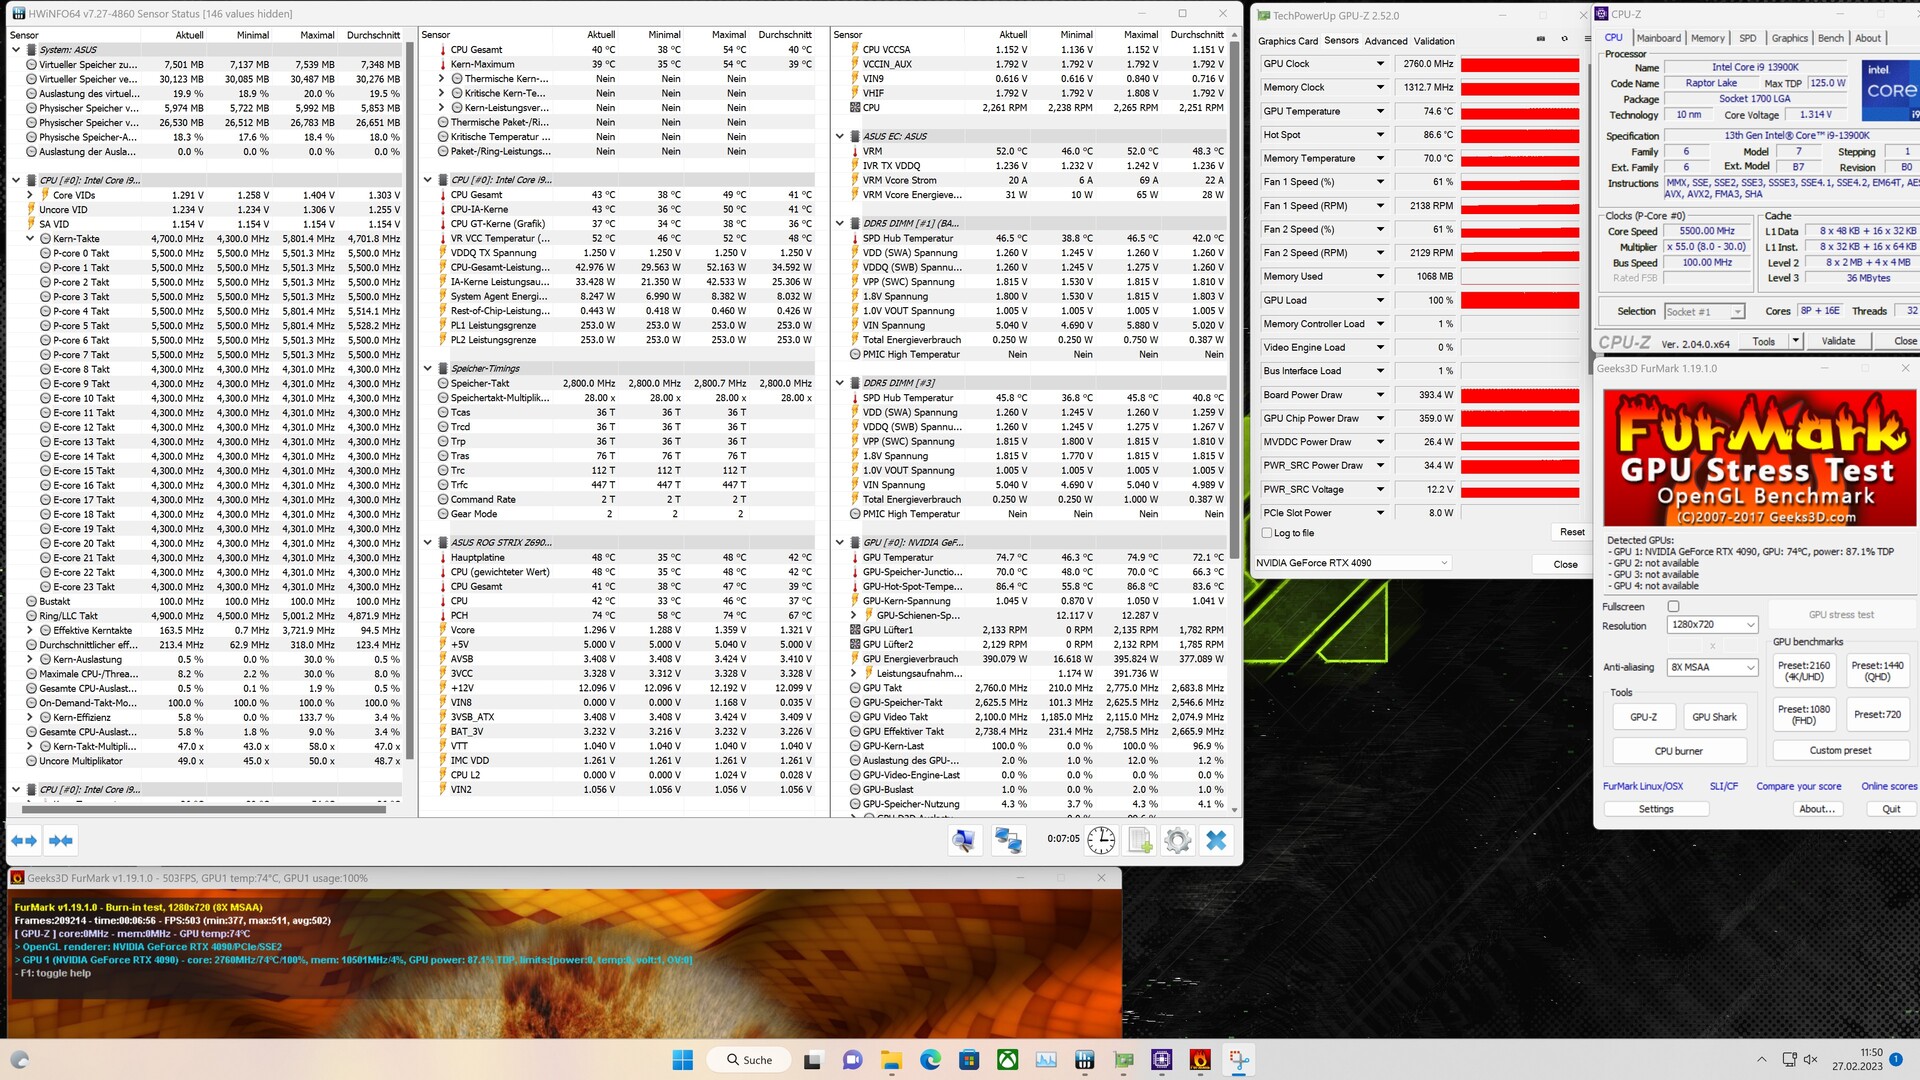
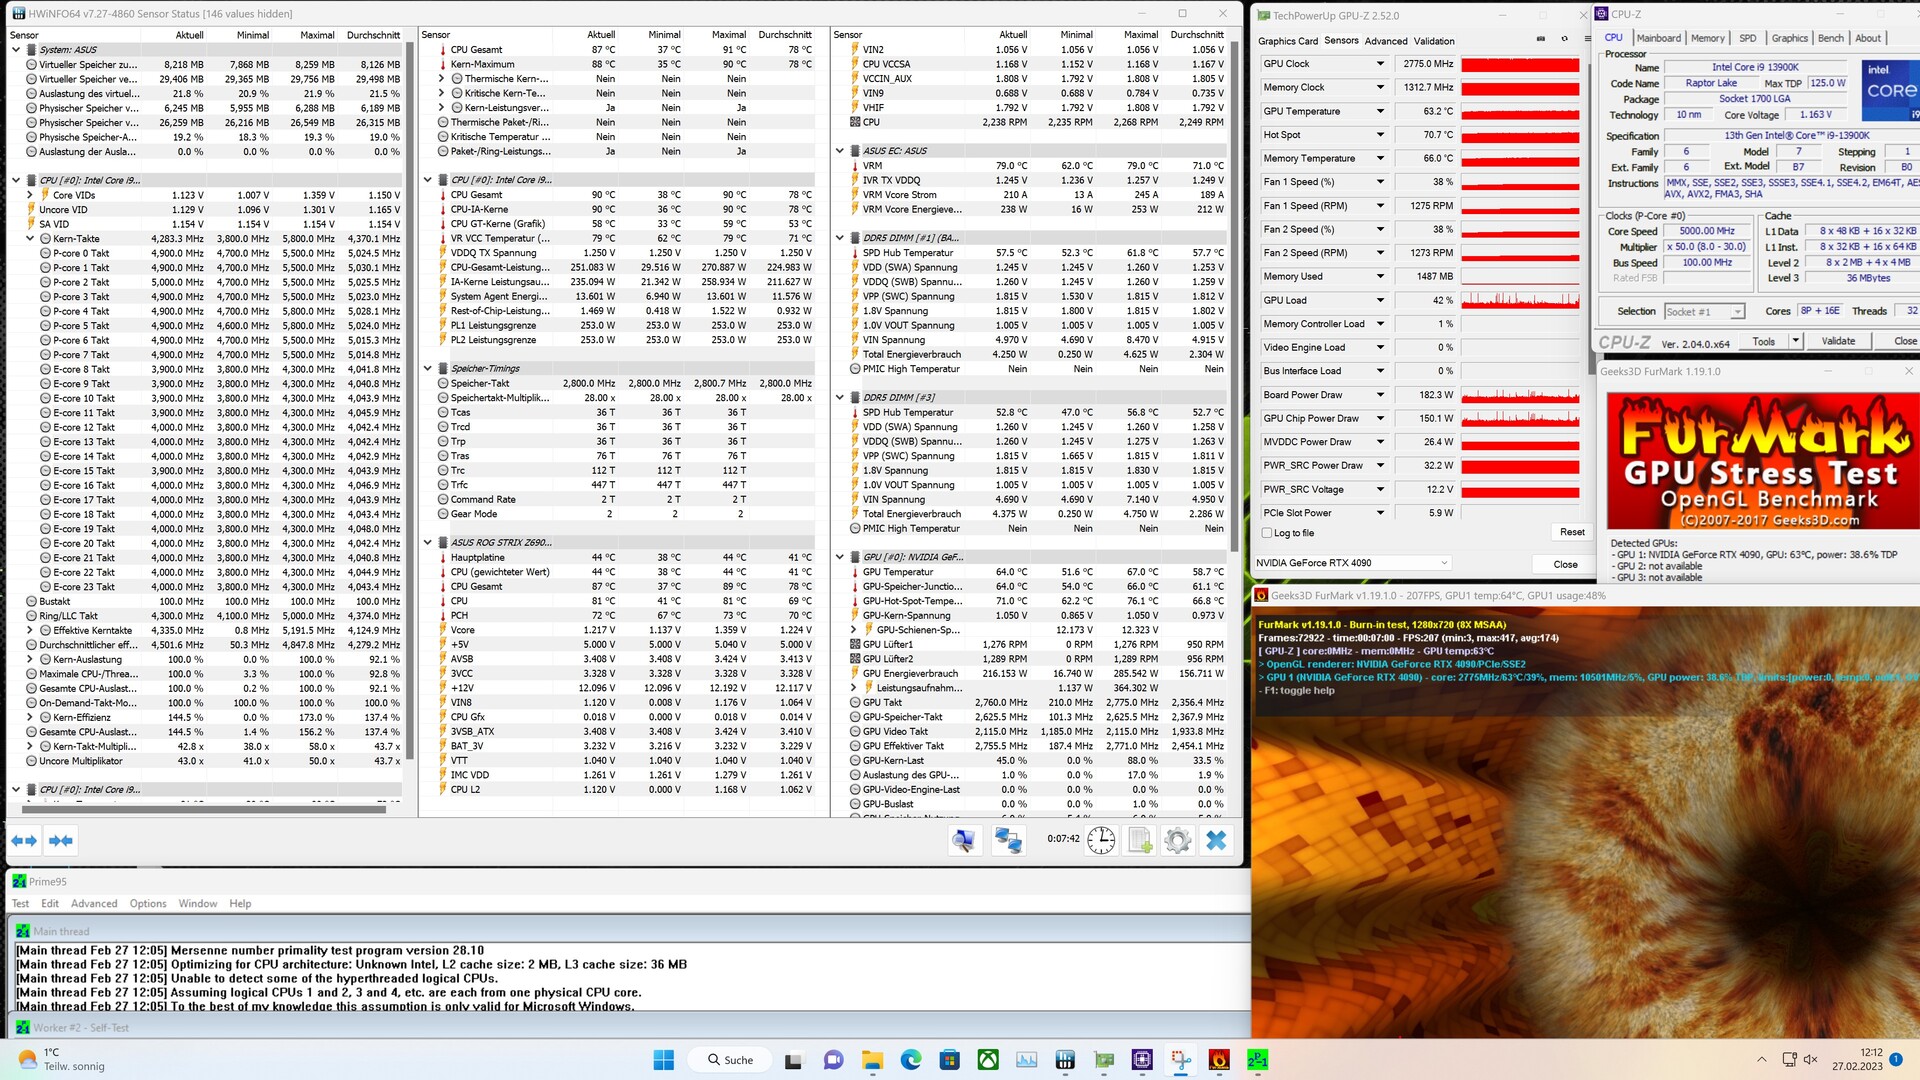
O XMG SECTOR Intel é projetado para extrair ar frio da frente e direcionar o ar quente para fora da caixa na parte superior e traseira. Mas o sistema usa apenas um ventilador para retirar o ar quente da caixa. Não há ventiladores instalados na parte superior. Entretanto, o Corsair 4000D Airflow faz uso de três ventiladores de admissão para criar uma pressão positiva para que o ar quente possa ser empurrado para fora da caixa. O radiador de 360 mm do refrigerador AIO é montado logo atrás do painel frontal para garantir o resfriamento ideal do processador. No teste de estresse, vimos a CPU atingir até 90°C (195°F) com um consumo médio de energia de 228 watts, enquanto as temperaturas da GPU atingiram quase 75°C (167°F), o que é completamente seguro.

Teste de estresse Prime95, solo
Teste de estresse FurMark, solo
Teste de estresse Prime95 + FurMark

Consumo de energia

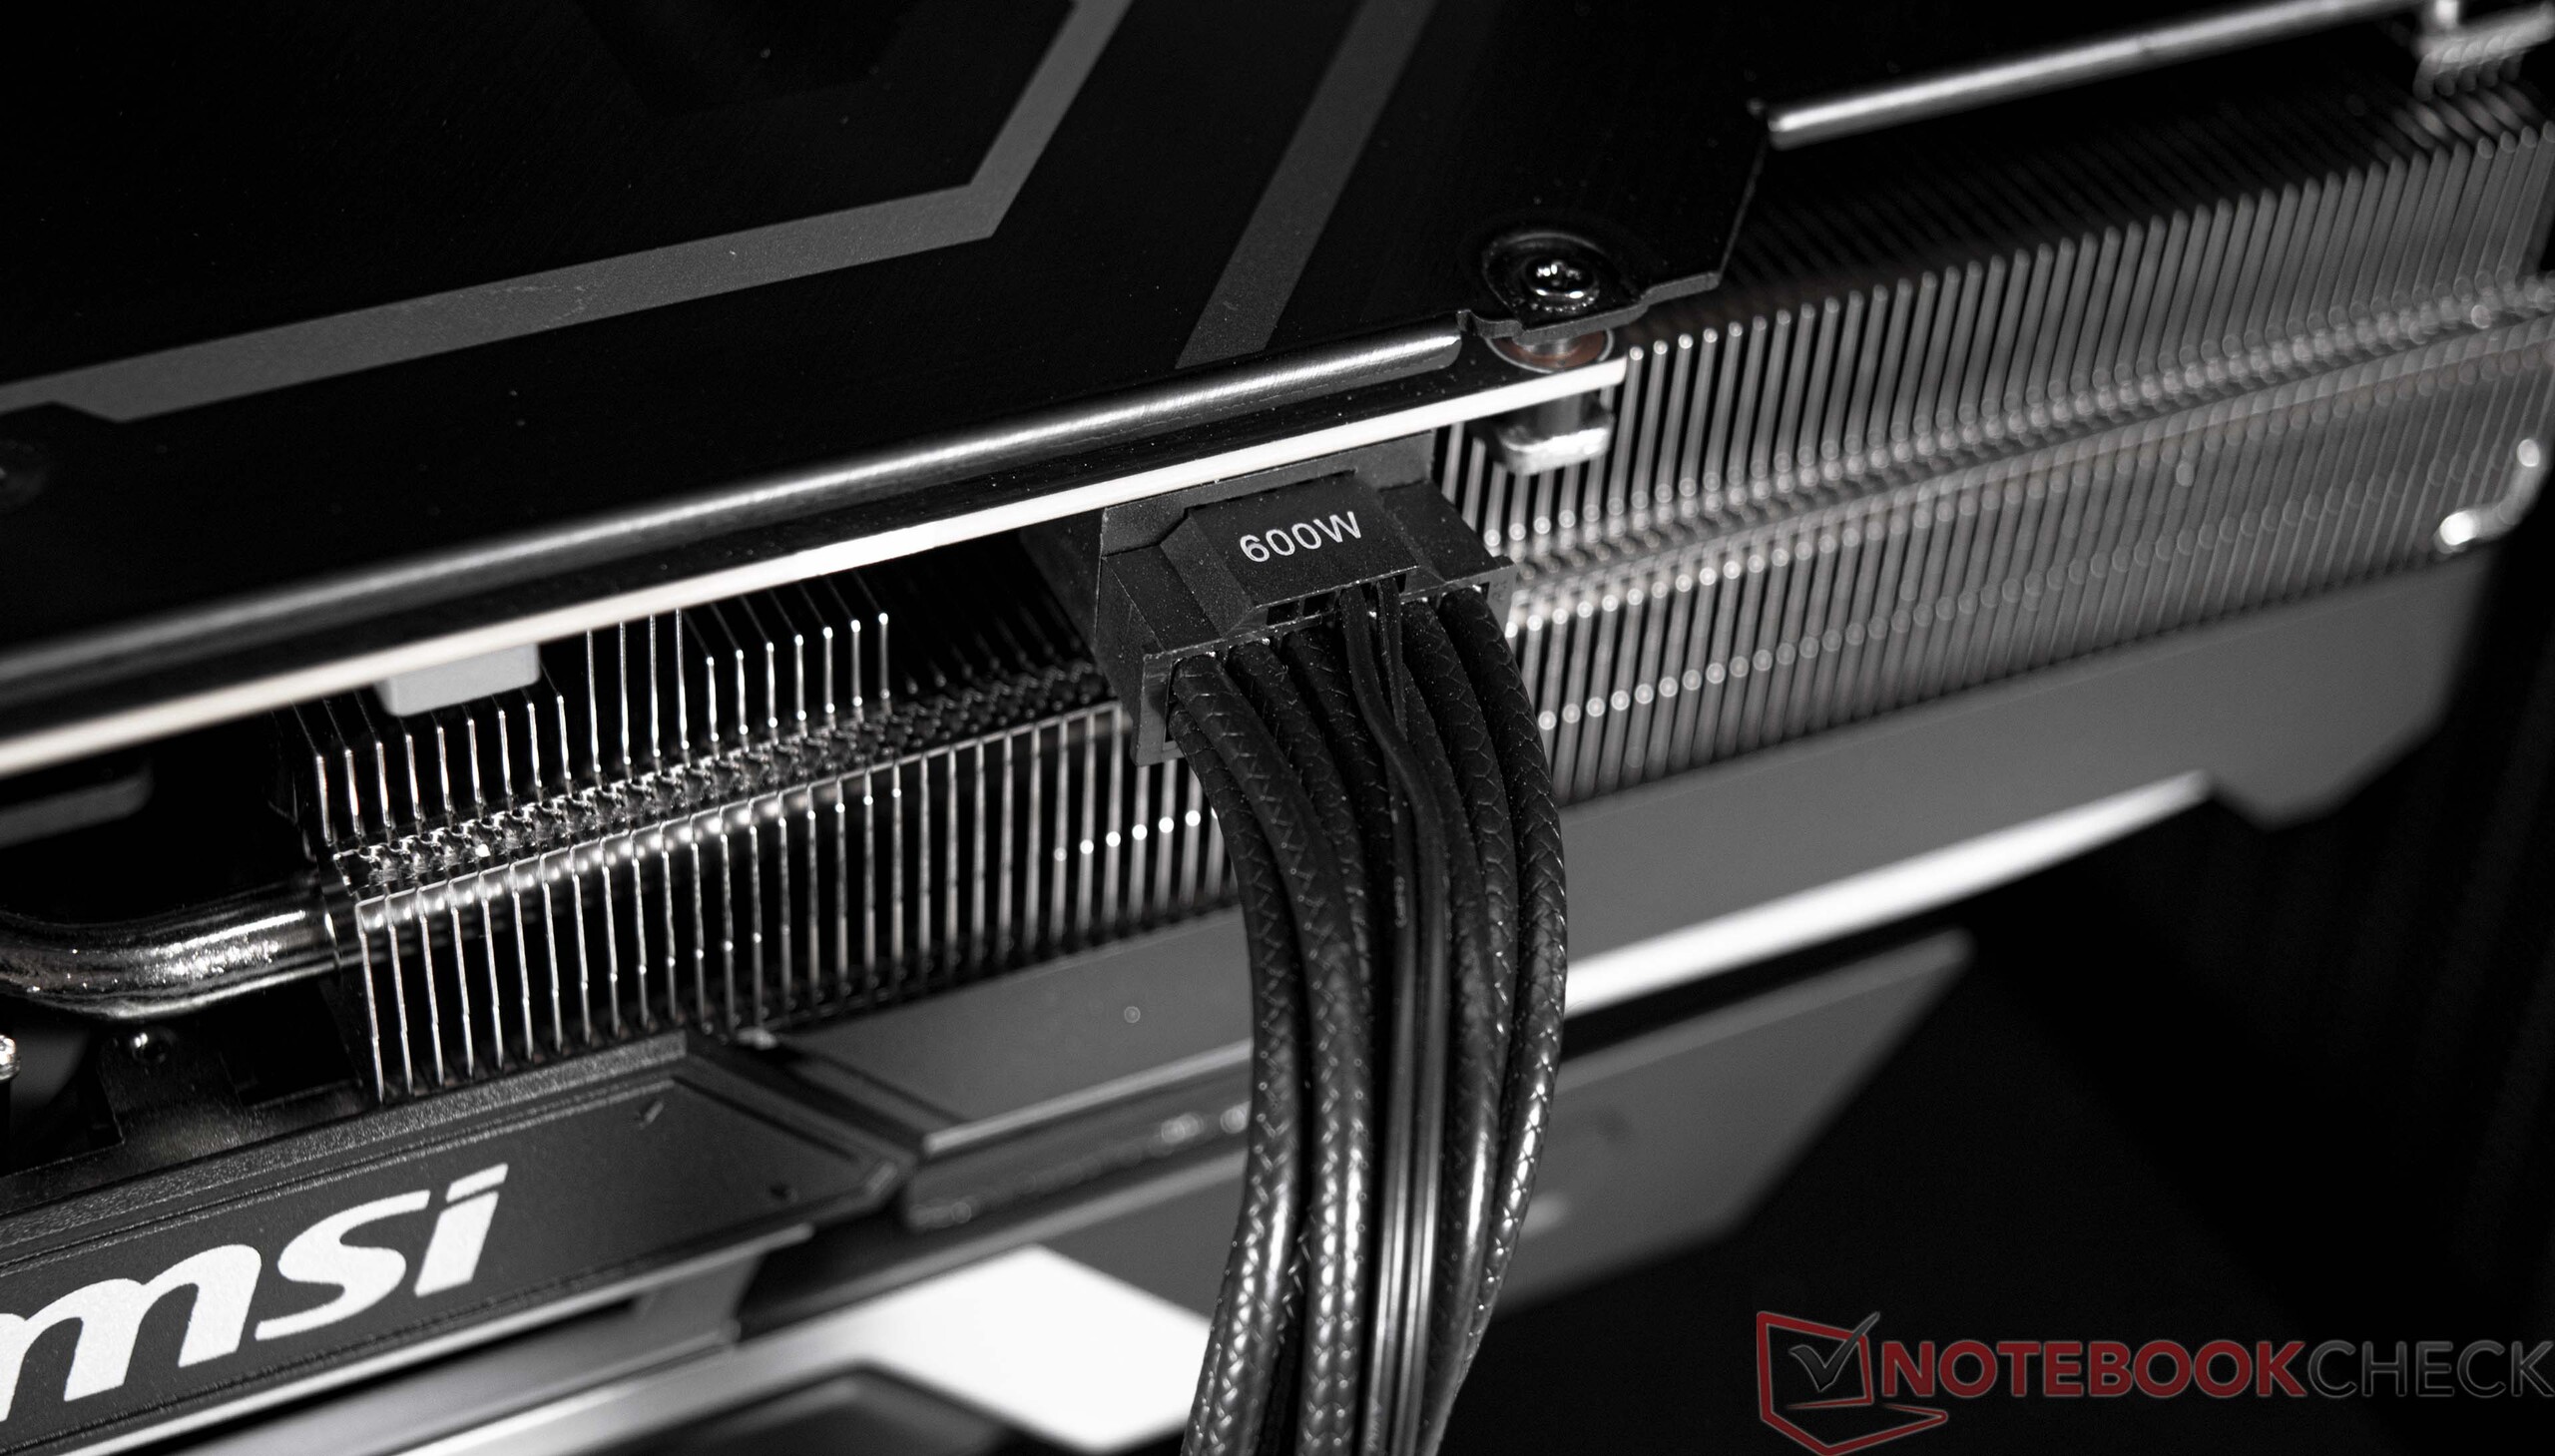
Todo o sistema é alimentado por uma PSU Seasonic classificada em 1000 watts. Durante nossos testes, a fonte de alimentação não teve problemas em fornecer energia suficiente aos componentes, mesmo sob carga total. Dados todos os componentes high-end no interior, é óbvio que o sistema não vai ser leve no uso de energia. O consumo de energia estava em torno de 78 a 96 watts ao ralenti, o que ainda é aceitável. Em contraste, a fonte de energia de 1000 watts teve que fornecer uma média de 511 watts durante os jogos. Notamos alguns picos de consumo ocasionais, mas mesmo os picos de consumo de até 778 watts não levaram a PSU aos seus limites. Na comparação, a unidade de revisão está apenas ligeiramente atrás de nosso sistema de teste de GPU com uma placa gráfica semelhante.

Power Consumption / The Witcher 3 ultra (external Monitor)
AMD Radeon RX 6950 XT
Sapphire AMD Radeon RX 6950 XT Nitro+ Pure, AMD Ryzen 9 5900X
589 (583min, 584P1 - 598max) Watt * -15%
NVIDIA GeForce RTX 3090 Ti
AMD Ryzen 7 5800X3D, AMD Ryzen 7 5800X3D (Idle: 102 W)
561 (533min, 542P1 - 582max) Watt * -10%
NVIDIA GeForce RTX 3090
NVIDIA GeForce RTX 3090 Founders Edition, AMD Ryzen 9 7950X
538 (532min, 532P1 - 570max) Watt * -5%
NVIDIA GeForce RTX 4090
Palit GeForce RTX 4090 GameRock OC, AMD Ryzen 9 7950X
531.8 (520min - 571max) Watt * -4%
NVIDIA GeForce RTX 3080 12 GB
KFA2 GeForce RTX 3080 SG, AMD Ryzen 9 5900X
518 (509min, 510P1 - 539max) Watt * -1%
NVIDIA GeForce RTX 4090
XMG Schenker - Intel
511 (466min, 491P1 - 596max) Watt *
AMD Radeon RX 6900 XT
AMD Radeon RX 6900 XT, AMD Ryzen 9 5950X (Idle: 99.15 W)
488.3 (459.99min - 512.79max) Watt * +4%
Power Consumption / FurMark 1.19 GPU Stress Test (external Monitor)
NVIDIA GeForce RTX 4090
Palit GeForce RTX 4090 GameRock OC, AMD Ryzen 9 7950X
611 (597.78min - 648.9max) Watt * -251%
AMD Radeon RX 6950 XT
Sapphire AMD Radeon RX 6950 XT Nitro+ Pure, AMD Ryzen 9 5900X
564 (525min, 551P1 - 601max) Watt * -224%
NVIDIA GeForce RTX 3090
NVIDIA GeForce RTX 3090 Founders Edition, AMD Ryzen 9 7950X
516 (512min, 514P1 - 541max) Watt * -196%
NVIDIA GeForce RTX 3080 12 GB
KFA2 GeForce RTX 3080 SG, AMD Ryzen 9 5900X
487 (475min, 477P1 - 501max) Watt * -180%
AMD Radeon RX 6900 XT
AMD Radeon RX 6900 XT, AMD Ryzen 9 5950X (Idle: 99.15 W)
456.8 (378.13min - 484.67max) Watt * -162%
NVIDIA GeForce RTX 4090
XMG Schenker - Intel
174.2 (172.7min, 173.2P1 - 175.8max) Watt *

* ... smaller is better

Consumo de energia
desligadodarklight 0.8 / 3.8 Watt
Ociosodarkmidlight 78.5 / 80.1 / 96.7 Watt
Carga midlight 160.2 / 778 Watt
 color bar
Key: min: dark, med: mid, max: light        Metrahit Energy
Currently we use the Metrahit Energy, a professional single phase power quality and energy measurement digital multimeter, for our measurements. Find out more about it here. All of our test methods can be found here.

Power consumption with external monitor

0306090120150180210240270300330360390420450480510540570Tooltip
SCHENKER XMG SECTOR, i9 13900K, RTX 4090; 1280x720 FurMark 1.19 GPU Stress Test (external Monitor): Ø174.2 (172.7-175.8)
SCHENKER XMG SECTOR, i9 13900K, RTX 4090; 1920x1080 The Witcher 3 ultra (external Monitor): Ø511 (466-596)
SCHENKER XMG SECTOR, i9 13900K, RTX 4090; Idle 1min (external Monitor): Ø96.7 (93.6-102.9)
SCHENKER XMG SECTOR, i9 13900K, RTX 4090; Cinebench R15 Multi (external Monitor): Ø386 (377-426)
SCHENKER XMG SECTOR, i9 13900K, RTX 4090; Prime95 V2810 Stress (external Monitor): Ø363 (338-401)

Pro

+ chassi robusto e de alta qualidade
+ Intel Core i9-13900K rodando com desempenho total
+ muito alto desempenho do sistema
+ Nvidia GeForce RTX 4090
+ desempenho extremamente bom em jogos
+ suporte para traçado de raio e DLSS 3.0
+ sSD de 2 TB com desempenho excepcional
+ Wi-Fi 6E
+ altamente atualizável
+ sem iluminação RGB garrida
+ garantia de 3 anos
+ muitas opções de configuração na loja

Contra

- alta utilização de energia sob carga
- muito audível durante os jogos
- seleção limitada de marcas na escolha dos componentes

Veredicto - PC de jogo extremamente rápido

A Intel XMG SECTOR foi gentilmente cedida pela Schenker para esta revisão

Apresentando um Intel Core i9-13900K e um Nvidia GeForce RTX 4090a nossa configuração de revisão do XMG SECTOR Intel é um dos PCs para jogos mais rápidos que você pode montar neste momento. O sistema também se baseia em uma base bastante moderna, embora sua placa-mãe "somente" tenha o chipset Z690. Apesar disso, o sistema utiliza a memória DDR5. Além disso, sua unidade de armazenamento oferece um desempenho sólido e, com uma capacidade de 2 TB, oferece até mesmo espaço suficiente para a realização de muitos jogos.

Baseado em um Intel Core i9-13900K, o XMG SECTOR Intel oferece excelente desempenho para toda uma série de casos de uso. Em conjunto com o GeForce RTX 4090, o sistema é atualmente um dos mais rápidos PCs para jogos disponíveis no mercado.

Nossa unidade de análise tem um desempenho tão imensamente alto à sua disposição que pode rodar todos os jogos modernos sem problemas a 2160p. O sistema certamente não é um roubo em torno de 4.600 euros (US$ 4.851). No entanto, a configuração faz sentido se você quiser jogar os últimos jogos sem nenhum compromisso. Um sistema AMD com especificações semelhantes com um Ryzen 9 7950X (também disponível na loja como XMG SECTOR AMD) custa cerca de 300 euros (US$316) a mais

.

Preço e disponibilidade

O XMG SECTOR Intel está disponível na loja online da Schenker bestware.com e custa cerca de 4.600 euros (US$ 4.851). Você também pode selecionar componentes com base em suas necessidades específicas, utilizando o configurador abrangente.

SCHENKER XMG SECTOR, i9 13900K, RTX 4090 - 03/04/2023 v7
Sebastian Bade

Acabamento
90 / 98 → 92%
Conectividade
66 / 81 → 81%
Peso
0%
Desempenho do jogos
100%
Desempenho da aplicação
98%
Ruído
82%
Médio
88%
92%
Desktop - Médio equilibrado

Transparency

The present review sample was made available to the author as a loan by the manufacturer or a shop for the purposes of review. The lender had no influence on this review, nor did the manufacturer receive a copy of this review before publication. There was no obligation to publish this review.

Please share our article, every link counts!
> Análises e revisões de portáteis e celulares > Análises > Análises > XMG SECTOR PC desktop de alta qualidade com Intel Core i9-13900K e Nvidia GeForce RTX 4090 revisado
Sebastian Bade, 2023-03-10 (Update: 2023-03-10)