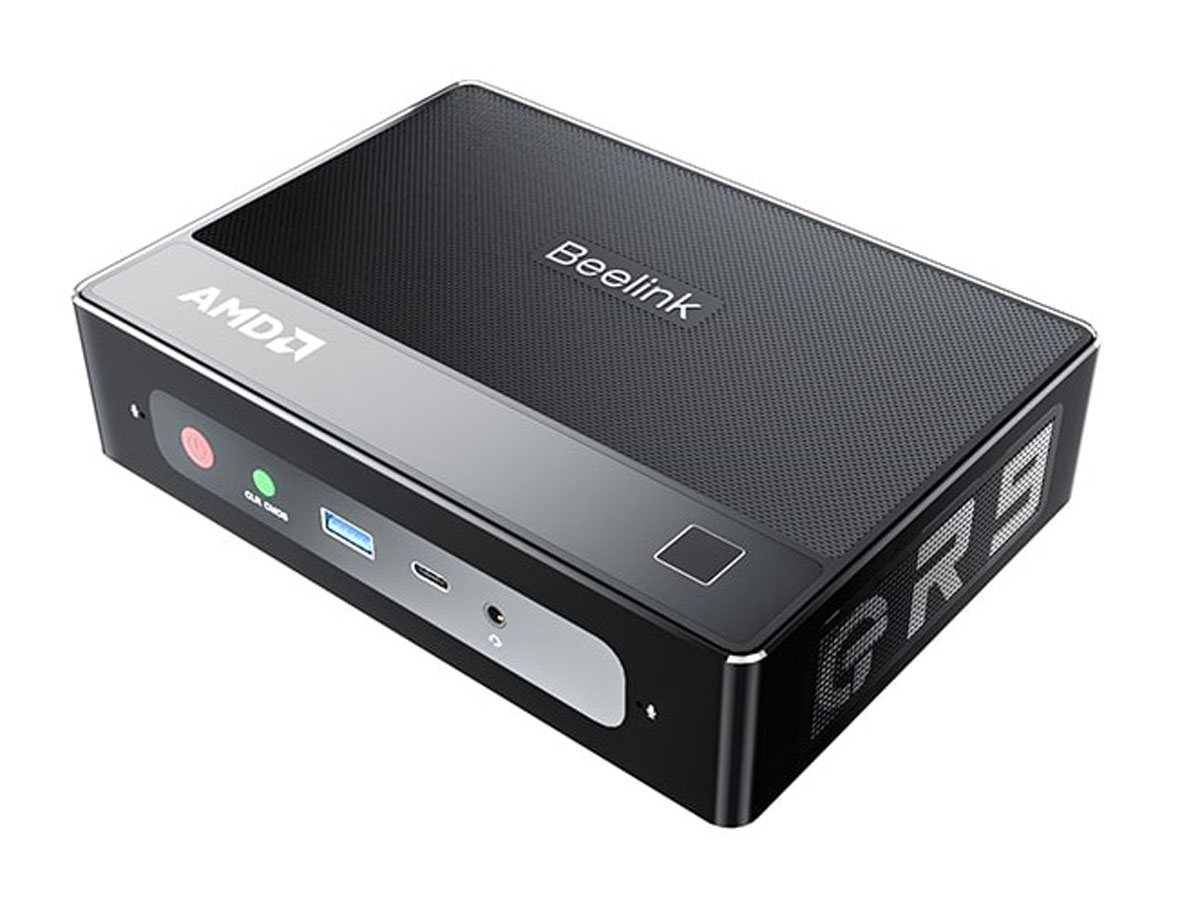
2022 Beelink GTR5 mini revisão PC: Um Intel NUC com AMD Ryzen 9

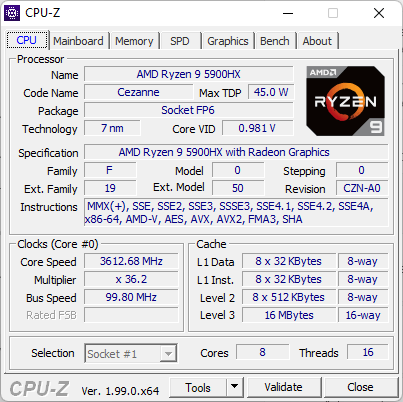
Nos primeiros tempos dos mini PCs do tamanho da NUC, tais produtos eram tipicamente vistos como alternativas de ultra baixa potência para o típico desktop ou laptop. Atualmente, os mini PCs têm evoluído para incluir especificações de nível de jogo e outras características poderosas. O Beelink GTR5 é o mais recente mini PC de alto desempenho do fabricante equipado com um processador AMD Zen 3 Ryzen 9 5900HX que é normalmente reservado para laptops potentes para jogos como o Asus ROG Zephyrus Duo 15 SE, Lenovo Legion 7 16ou o Gigabyte A7 X1. Para ver tal opção para um PC com fator de forma 0,8 L deve automaticamente tornar o GTR5 um dos mais rápidos em sua categoria, caso tudo corra conforme anunciado.
O GTR5 é atualmente em Indiegogo variando de $620 USD para um kit de barebones até $950, se totalmente configurado. Todos os SKUs vêm com o mesmo processador Ryzen 9 5900HX. O GTR5 não deve ser confundido com o GTR7, que na verdade é um modelo Beelink mais antigo rodando no Ryzen 7 3750H, muito mais lento.
Mais revisões do Beelink:
Potenciais Concorrentes em Comparação
Caso
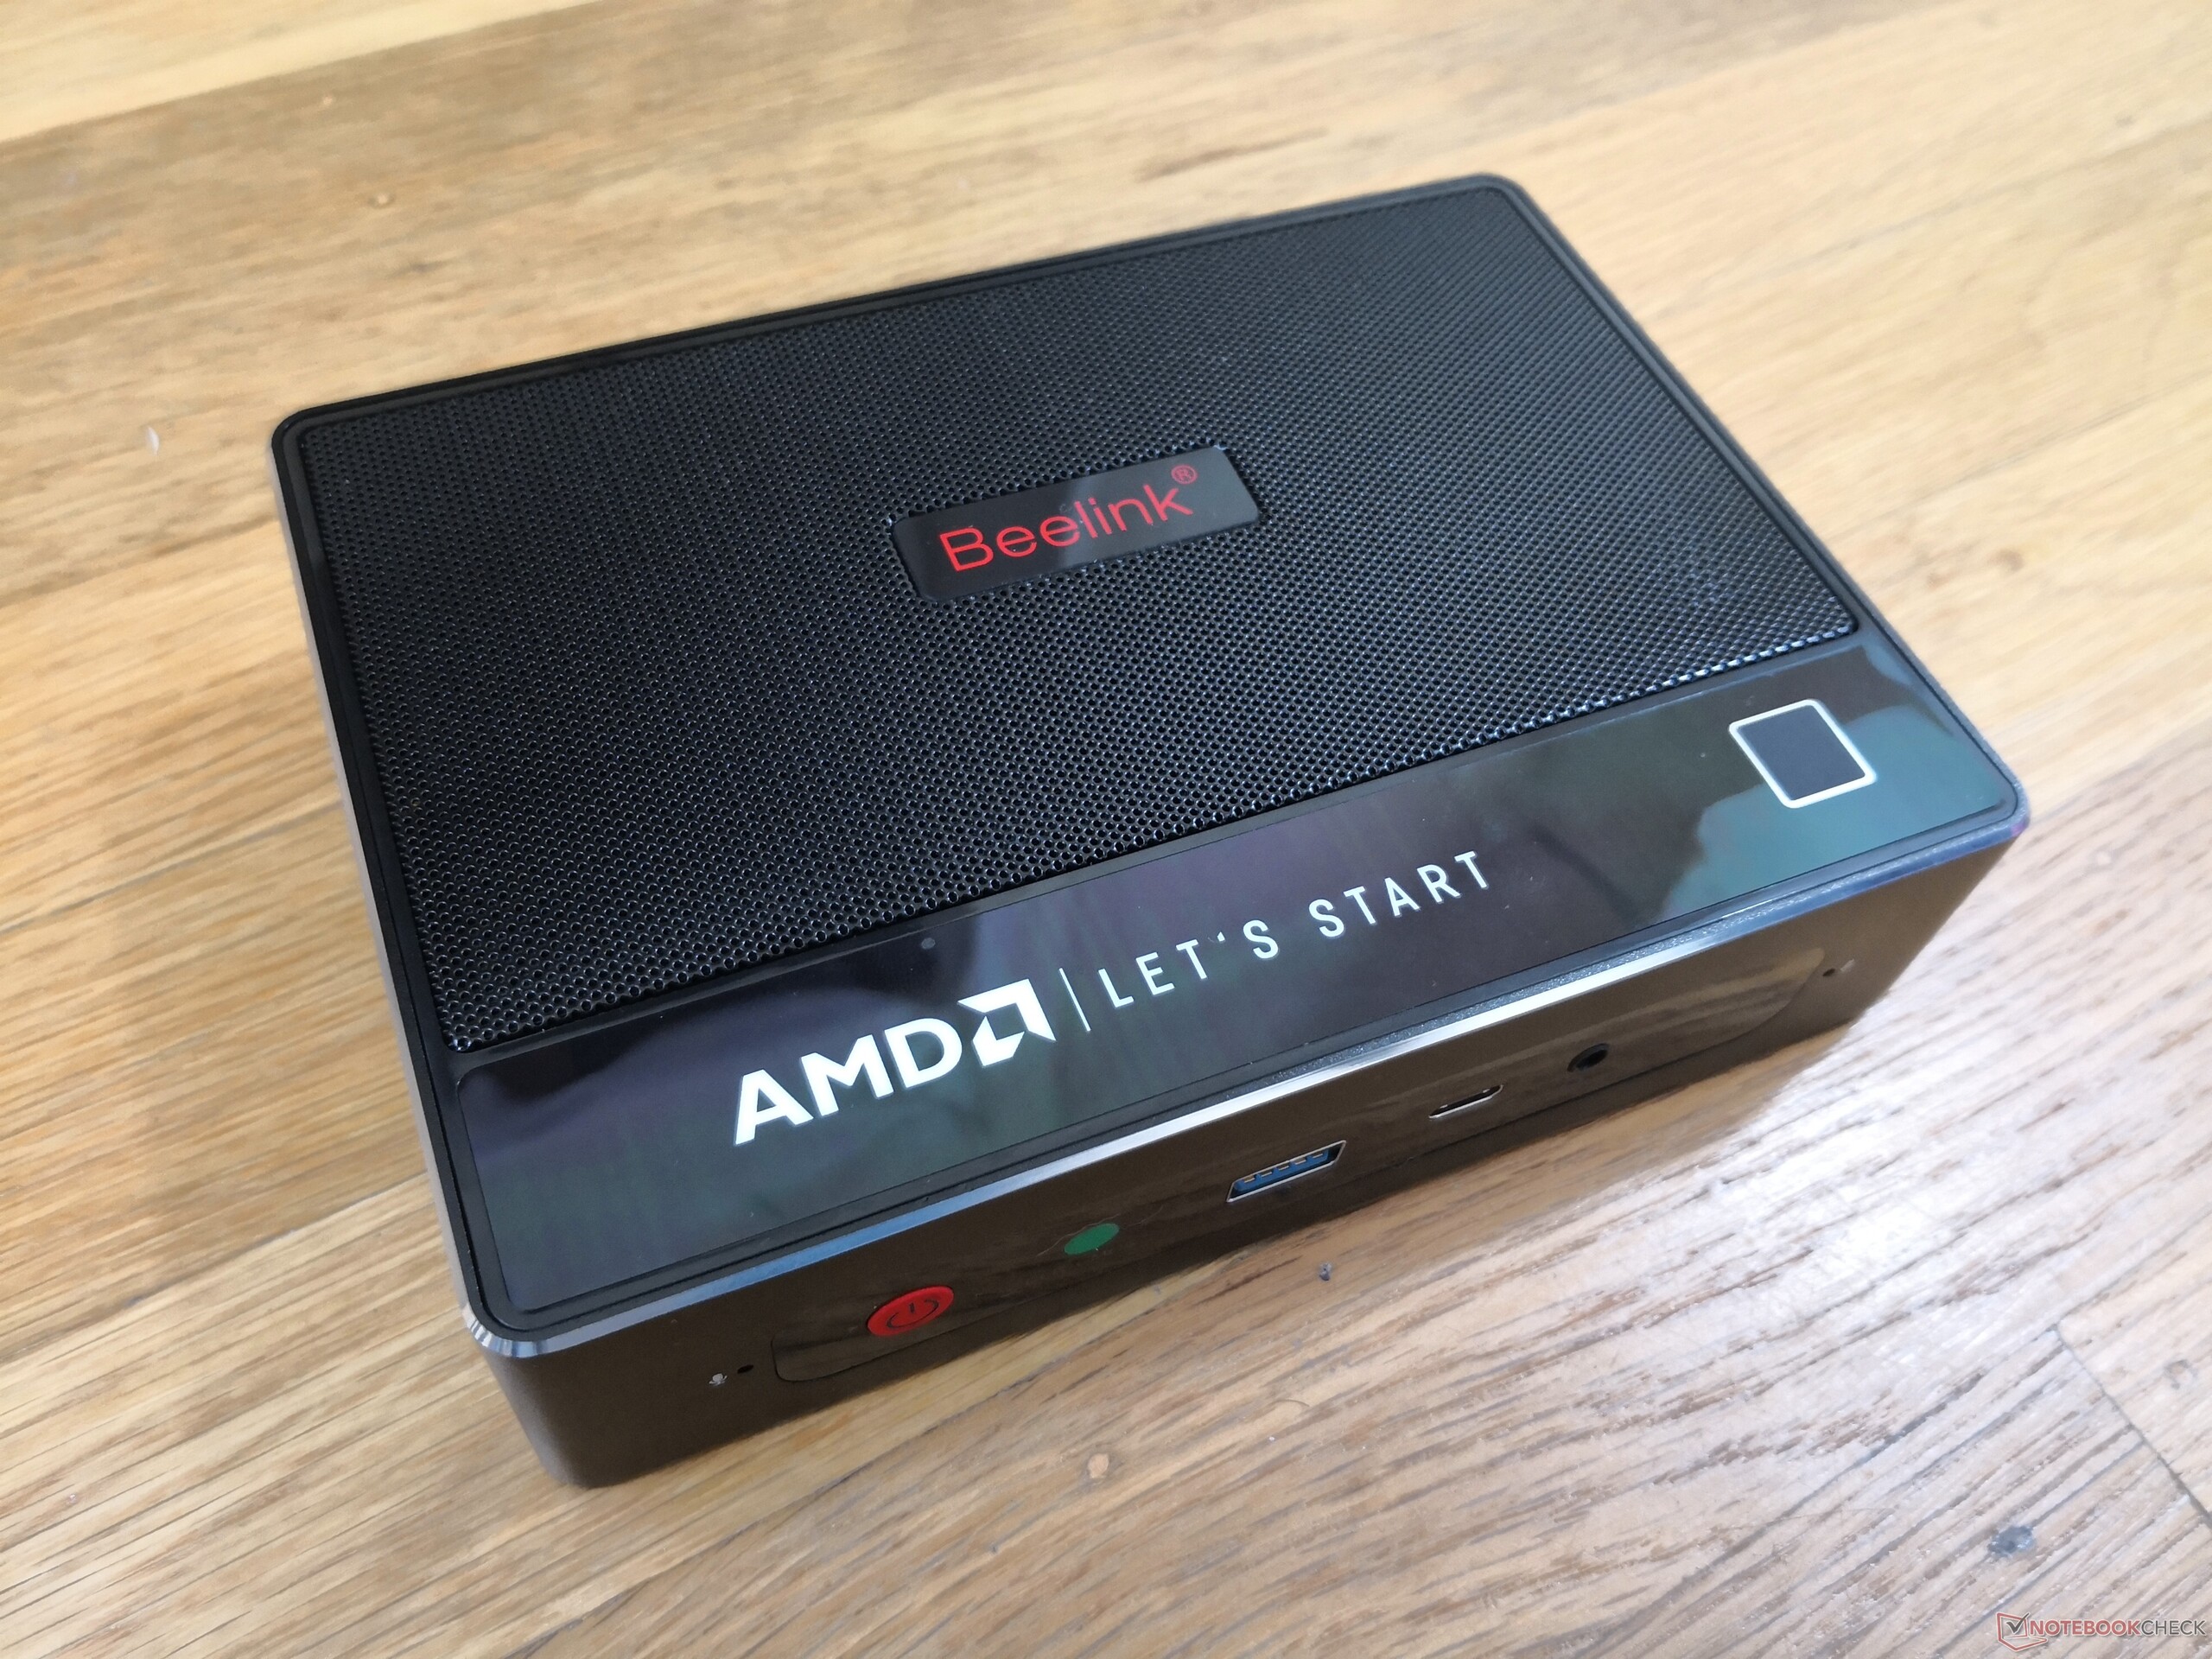
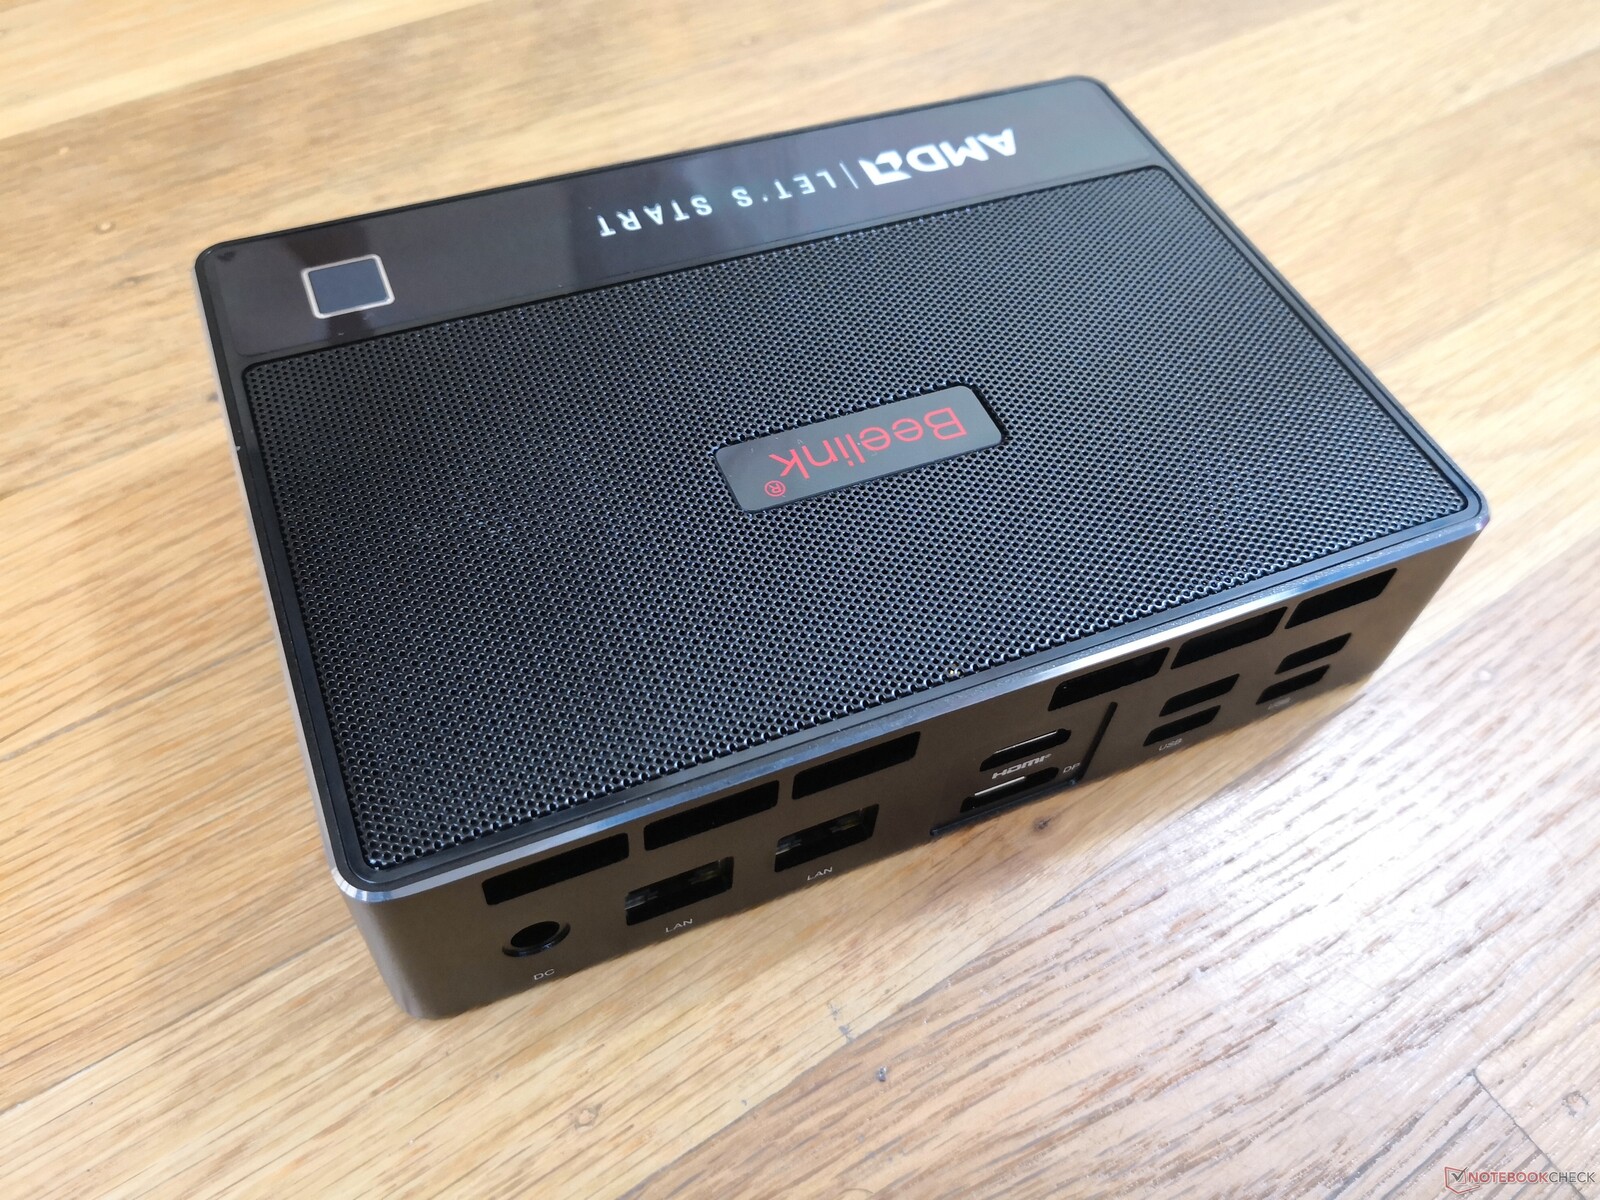
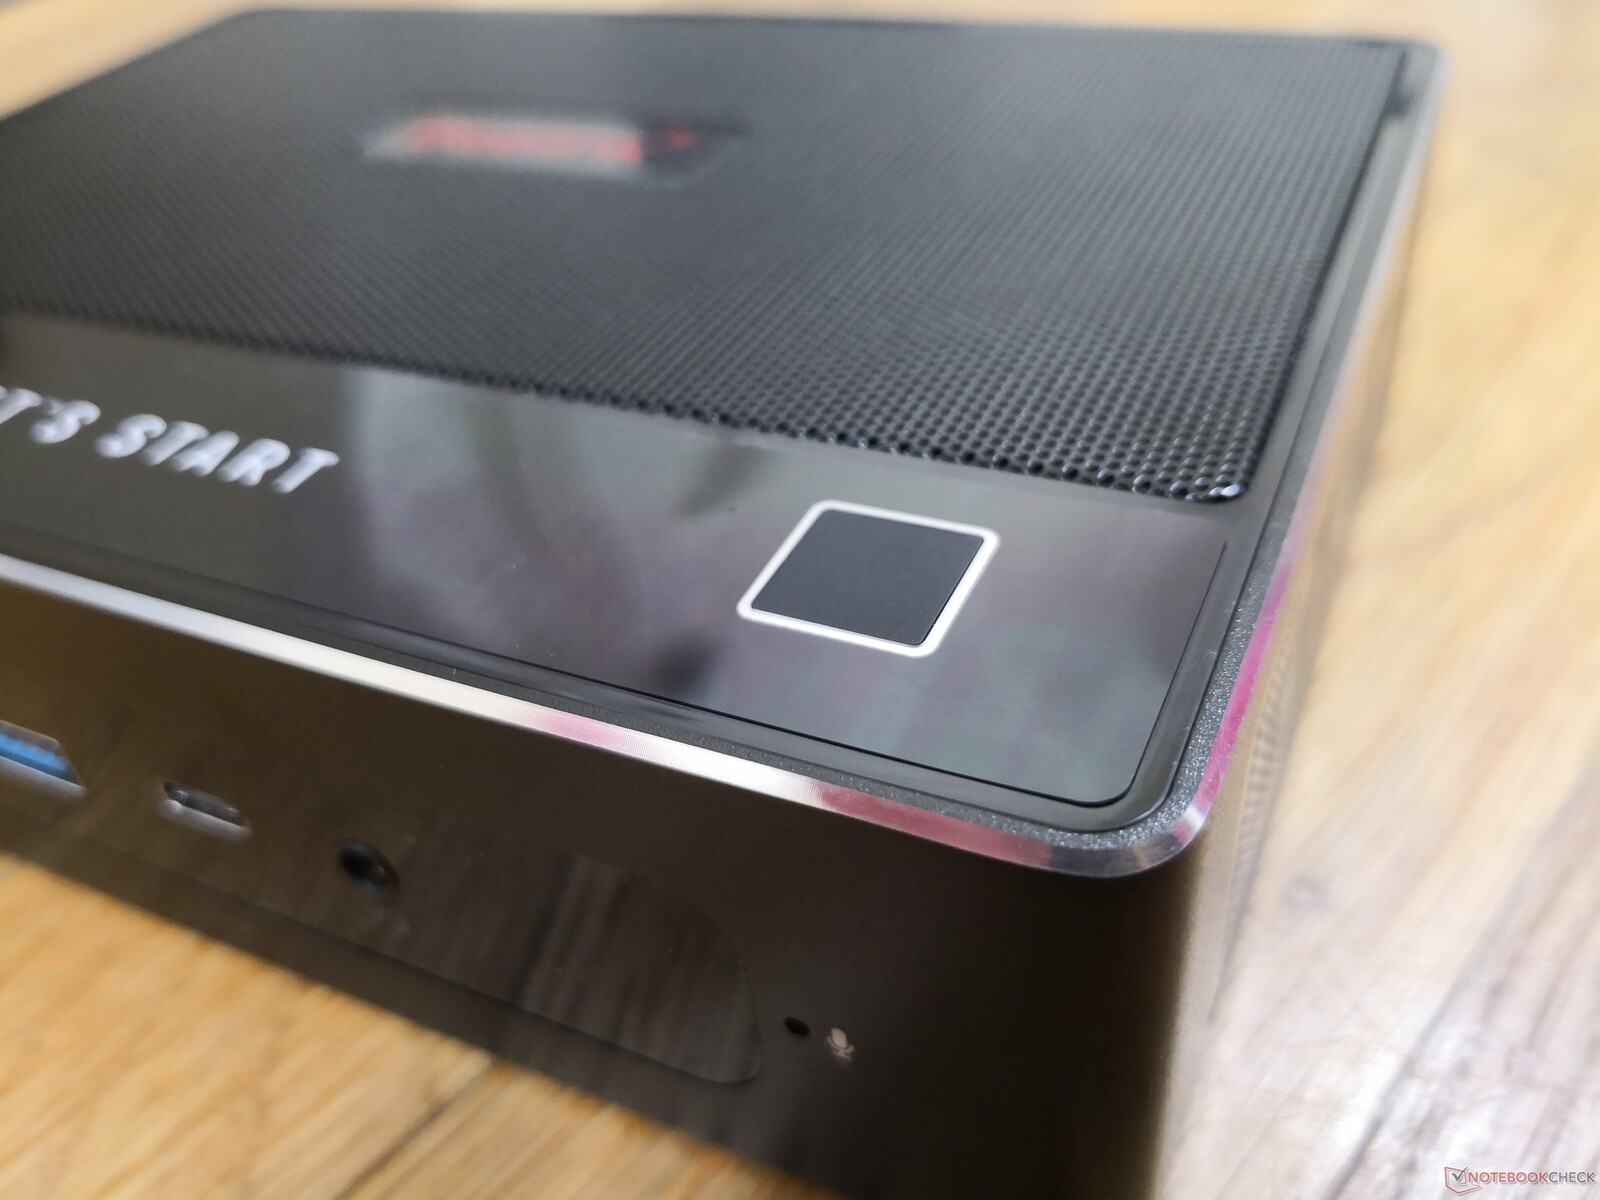
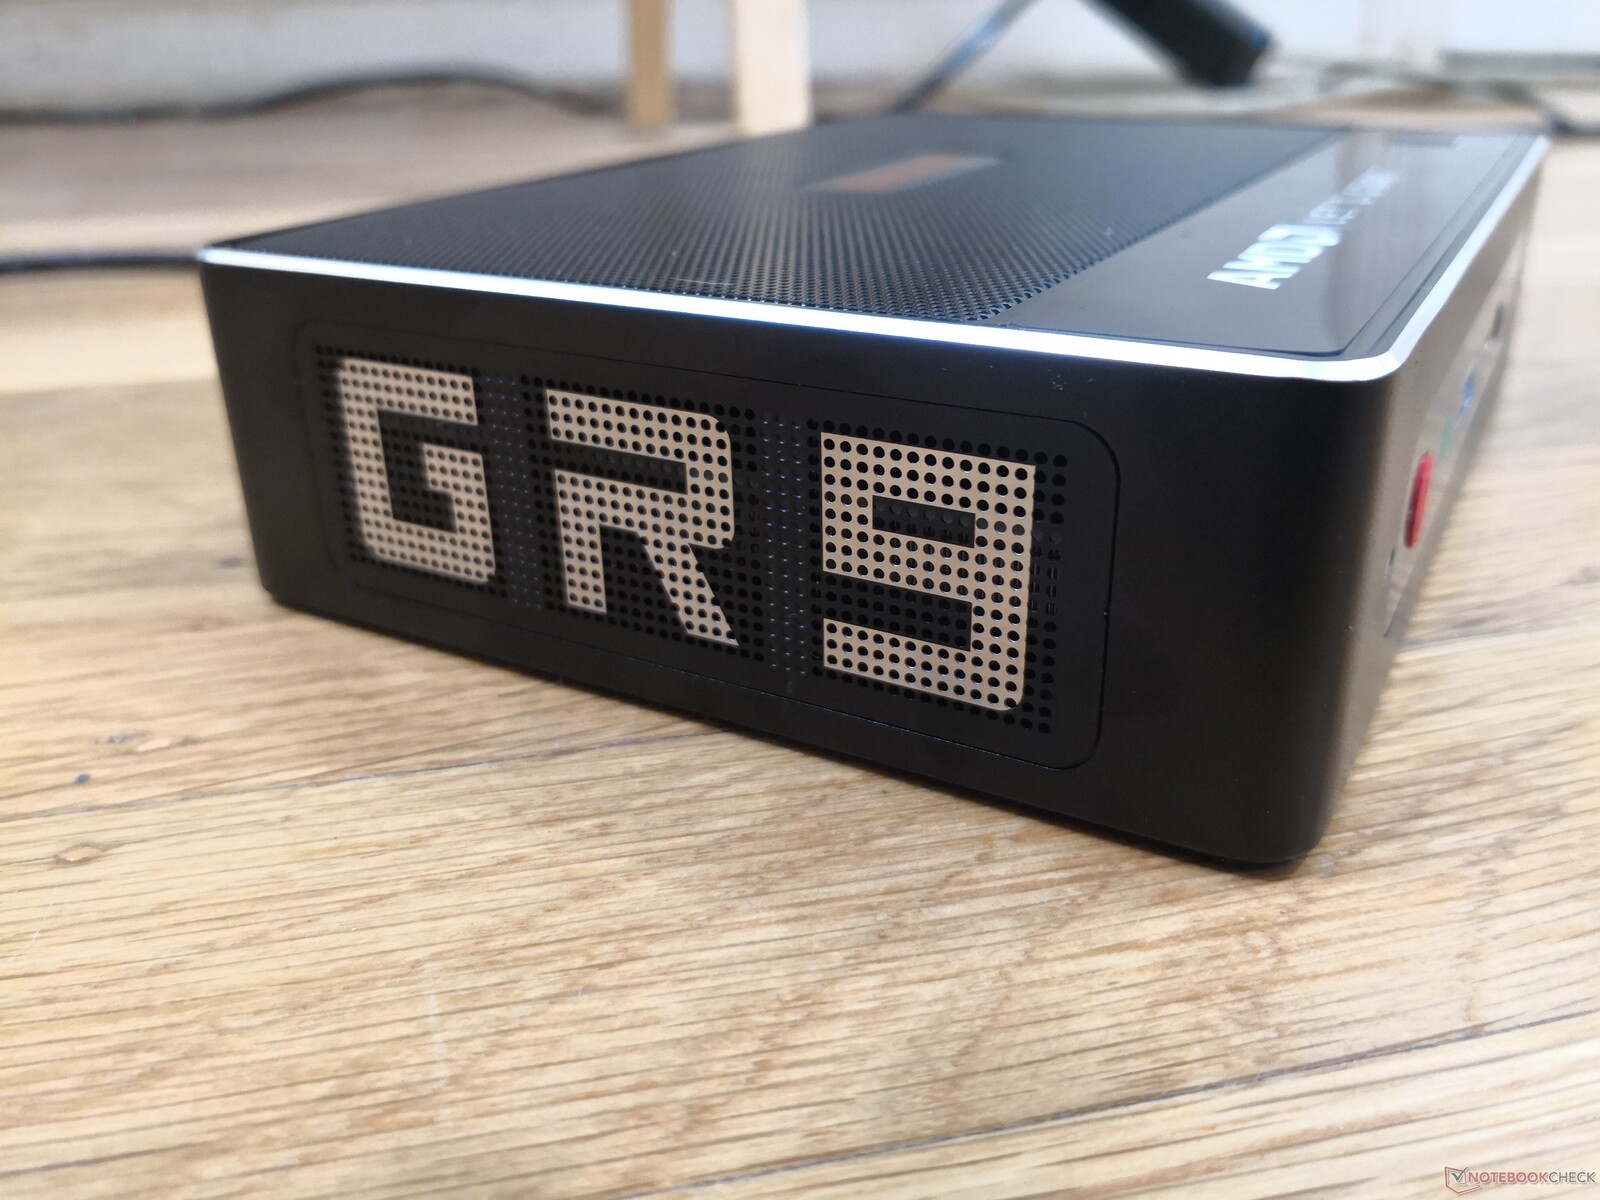
A Beelink reestruturou seu chassi Intel GTI11 para o AMD GTR5, pois as dimensões e a construção geral do GTR5 são essencialmente idênticas à sua contraparte Intel. A mudança mais notável é no topo da unidade para melhor acomodar o processador AMD da série H, mais exigente. Esta superfície é agora perfurada em vez de plástico liso e brilhante para um melhor fluxo de ar.
Comparação de tamanhos
Conectividade
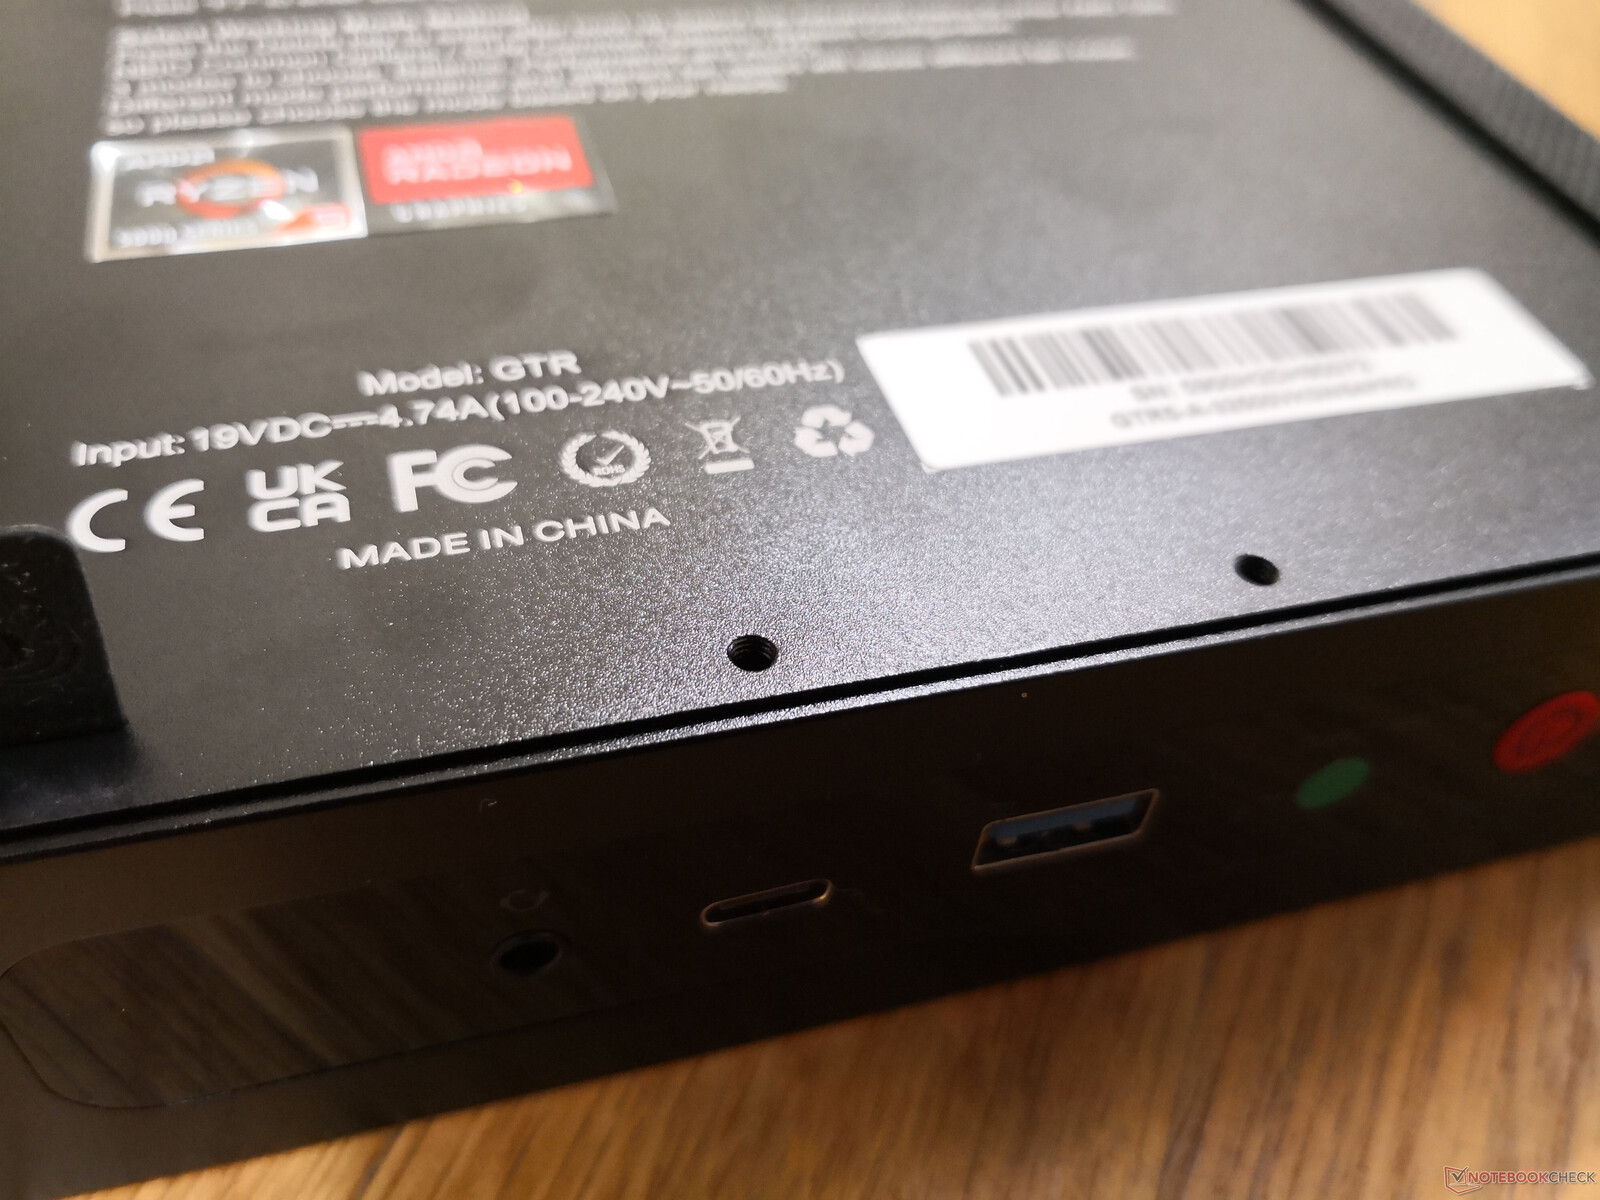
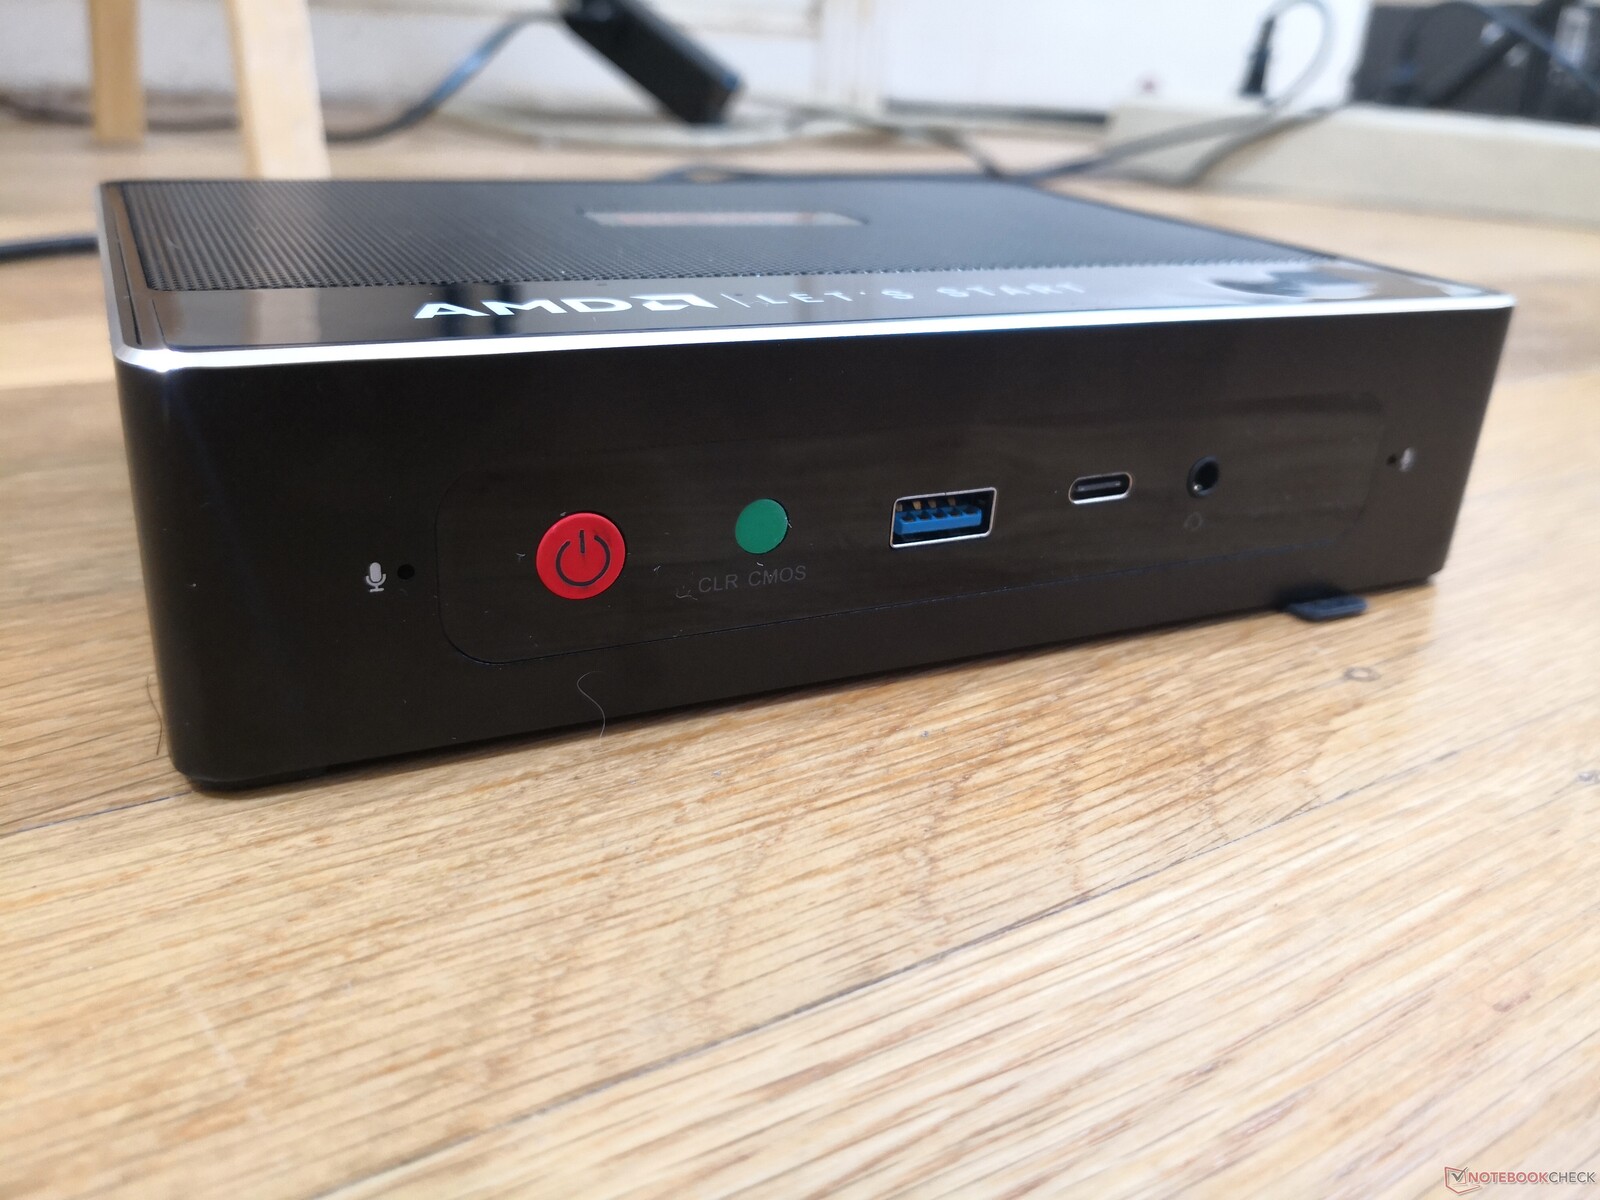
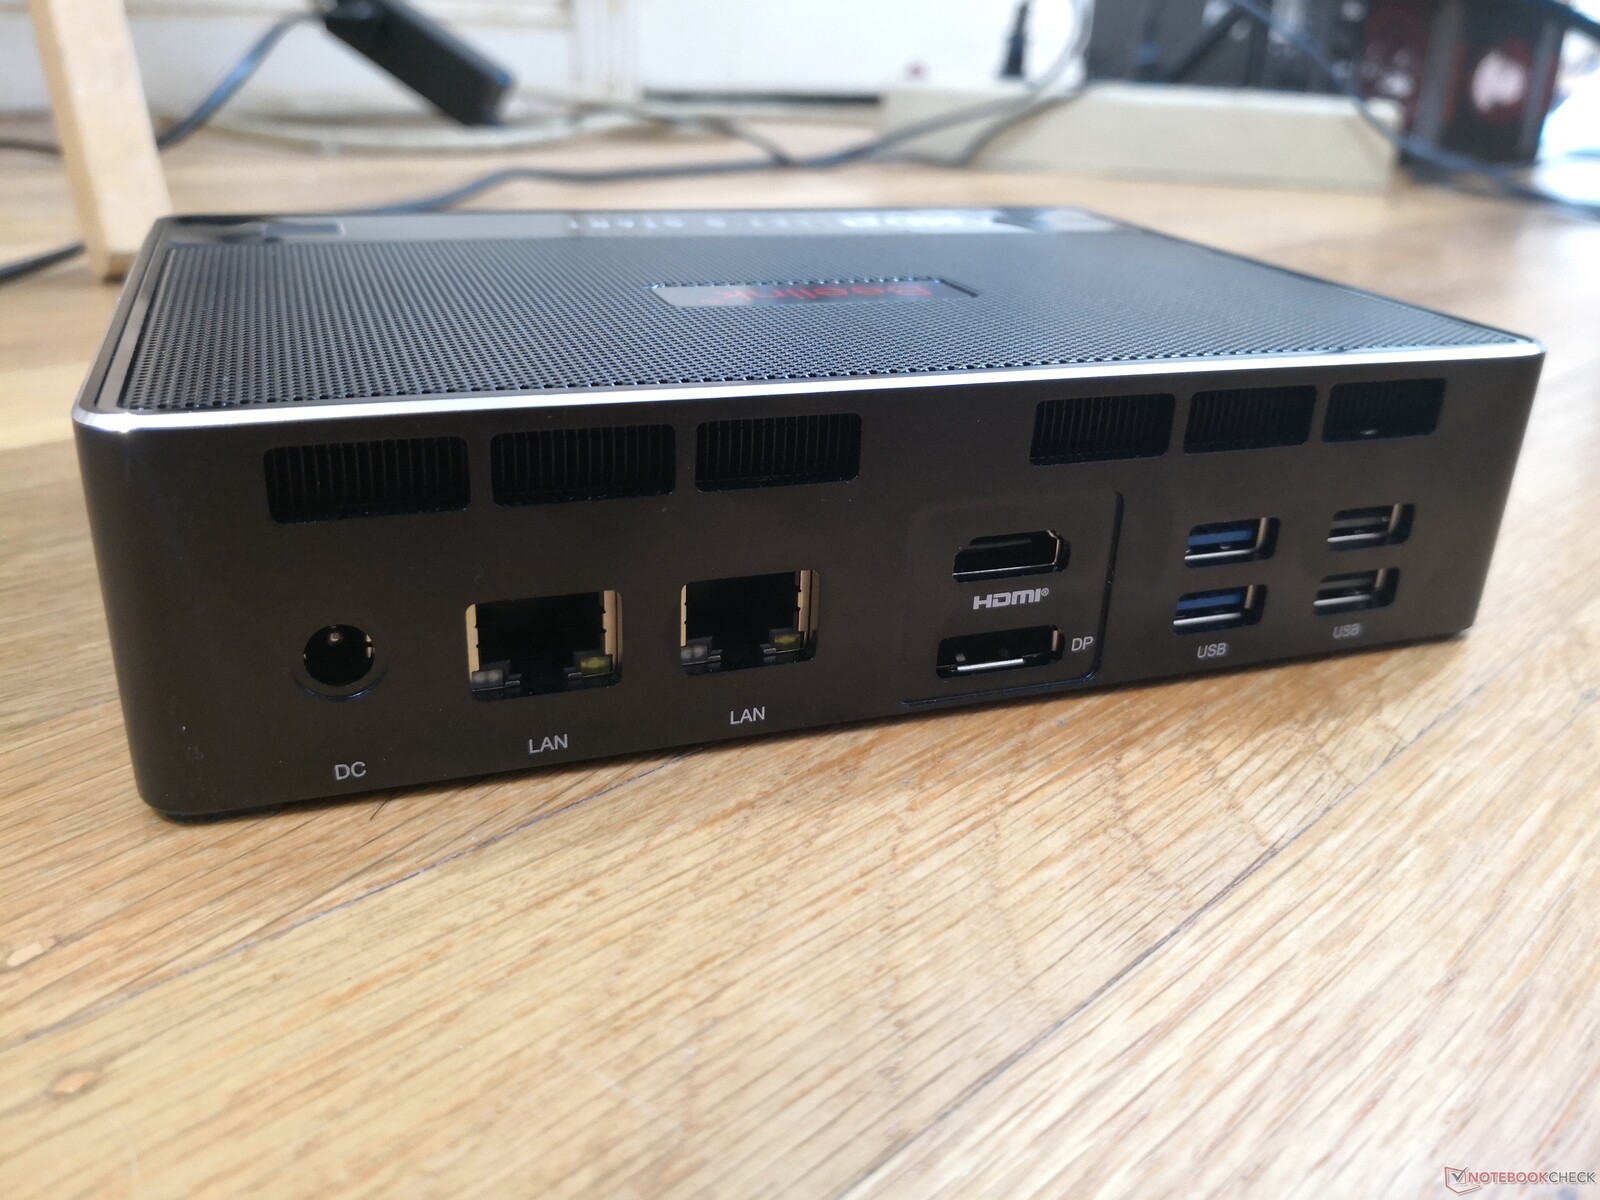
As opções de porta são idênticas ao Beelink GTI 11, exceto por duas distinções importantes: nosso GTR5 acionado por AMD não tem suporte Thunderbolt e uma porta USB-A extra. Teríamos preferido mais portas USB-C como no Intel Phantom Canyon NUC11PHKi7C ou pelo menos um leitor de cartões SD integrado
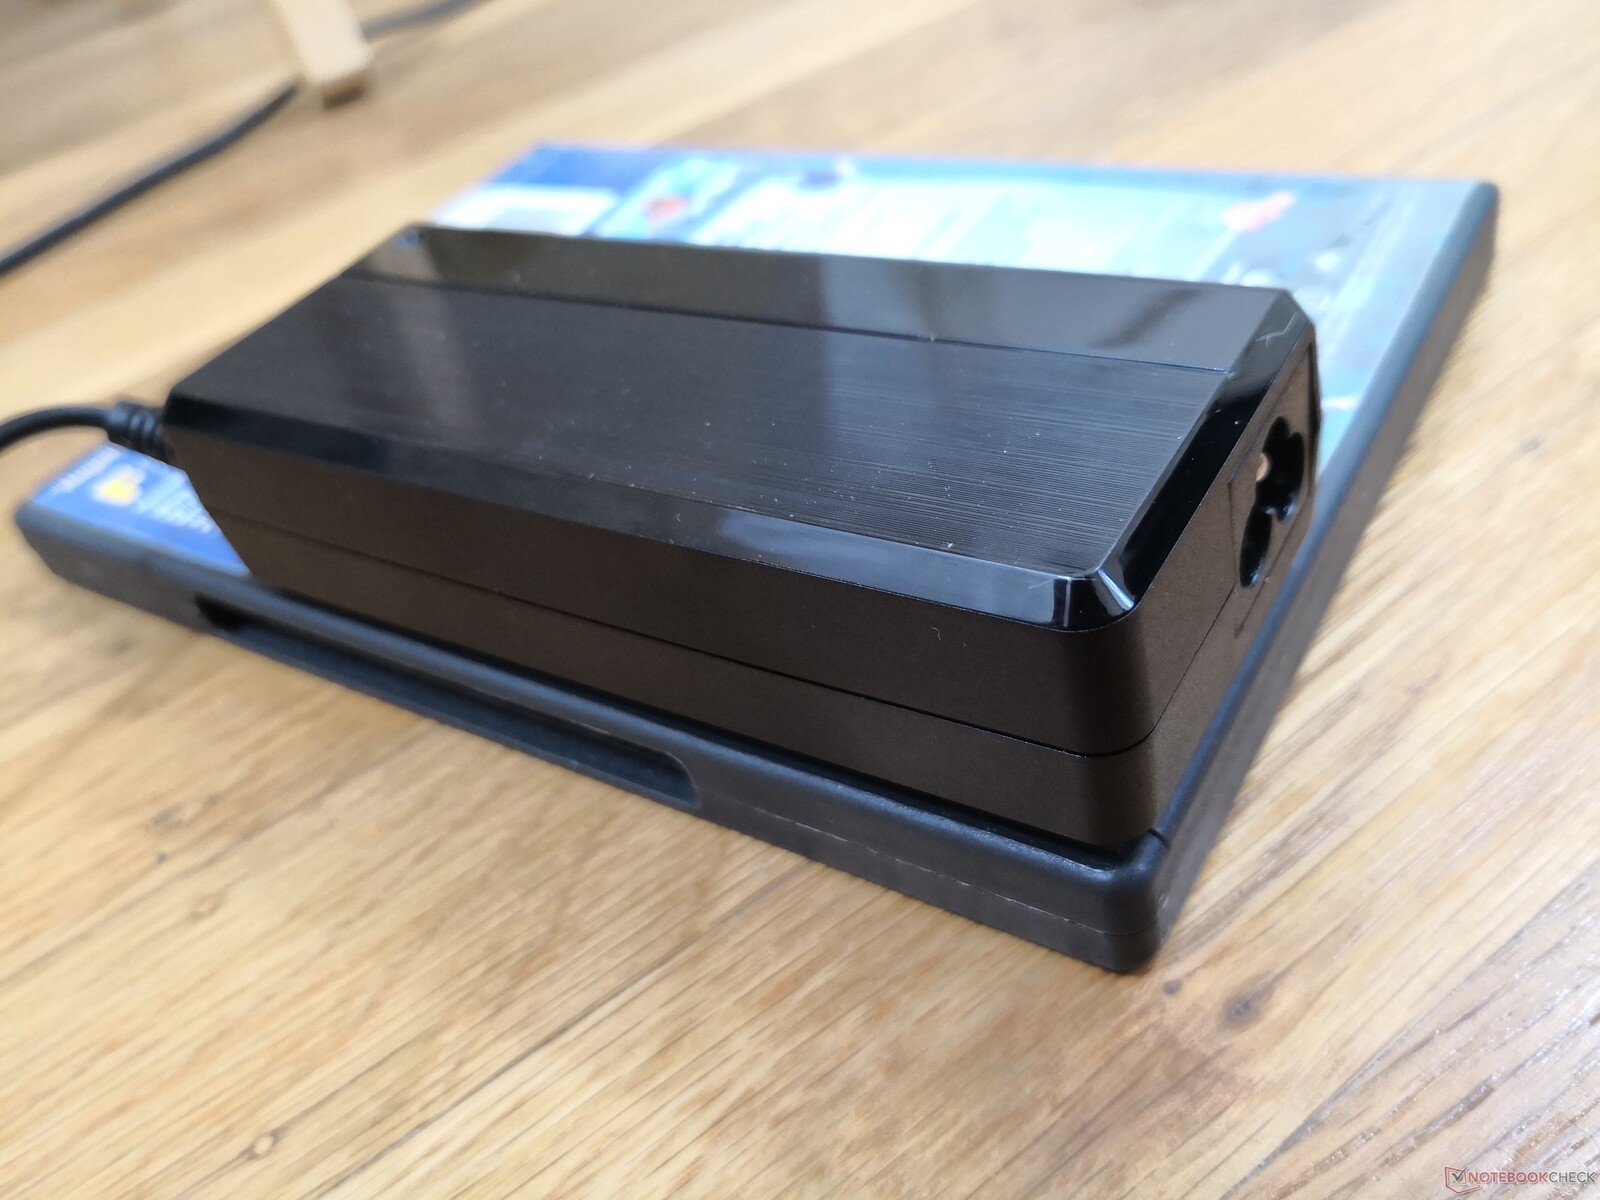
Curiosamente, o sistema pode ser alimentado por USB-C caso você venha a perder o adaptador proprietário de 90 W AC. Nós conectamos nosso Dell XPS 15 9575 adaptador USB-C de 130 W para o GTR5 e ligado sem nenhum problema. No entanto, recomendamos o uso do adaptador proprietário de 90 W AC sempre que possível, uma vez que a maioria dos adaptadores USB-C de terceiros têm saídas de energia muito menores.
Comunicação
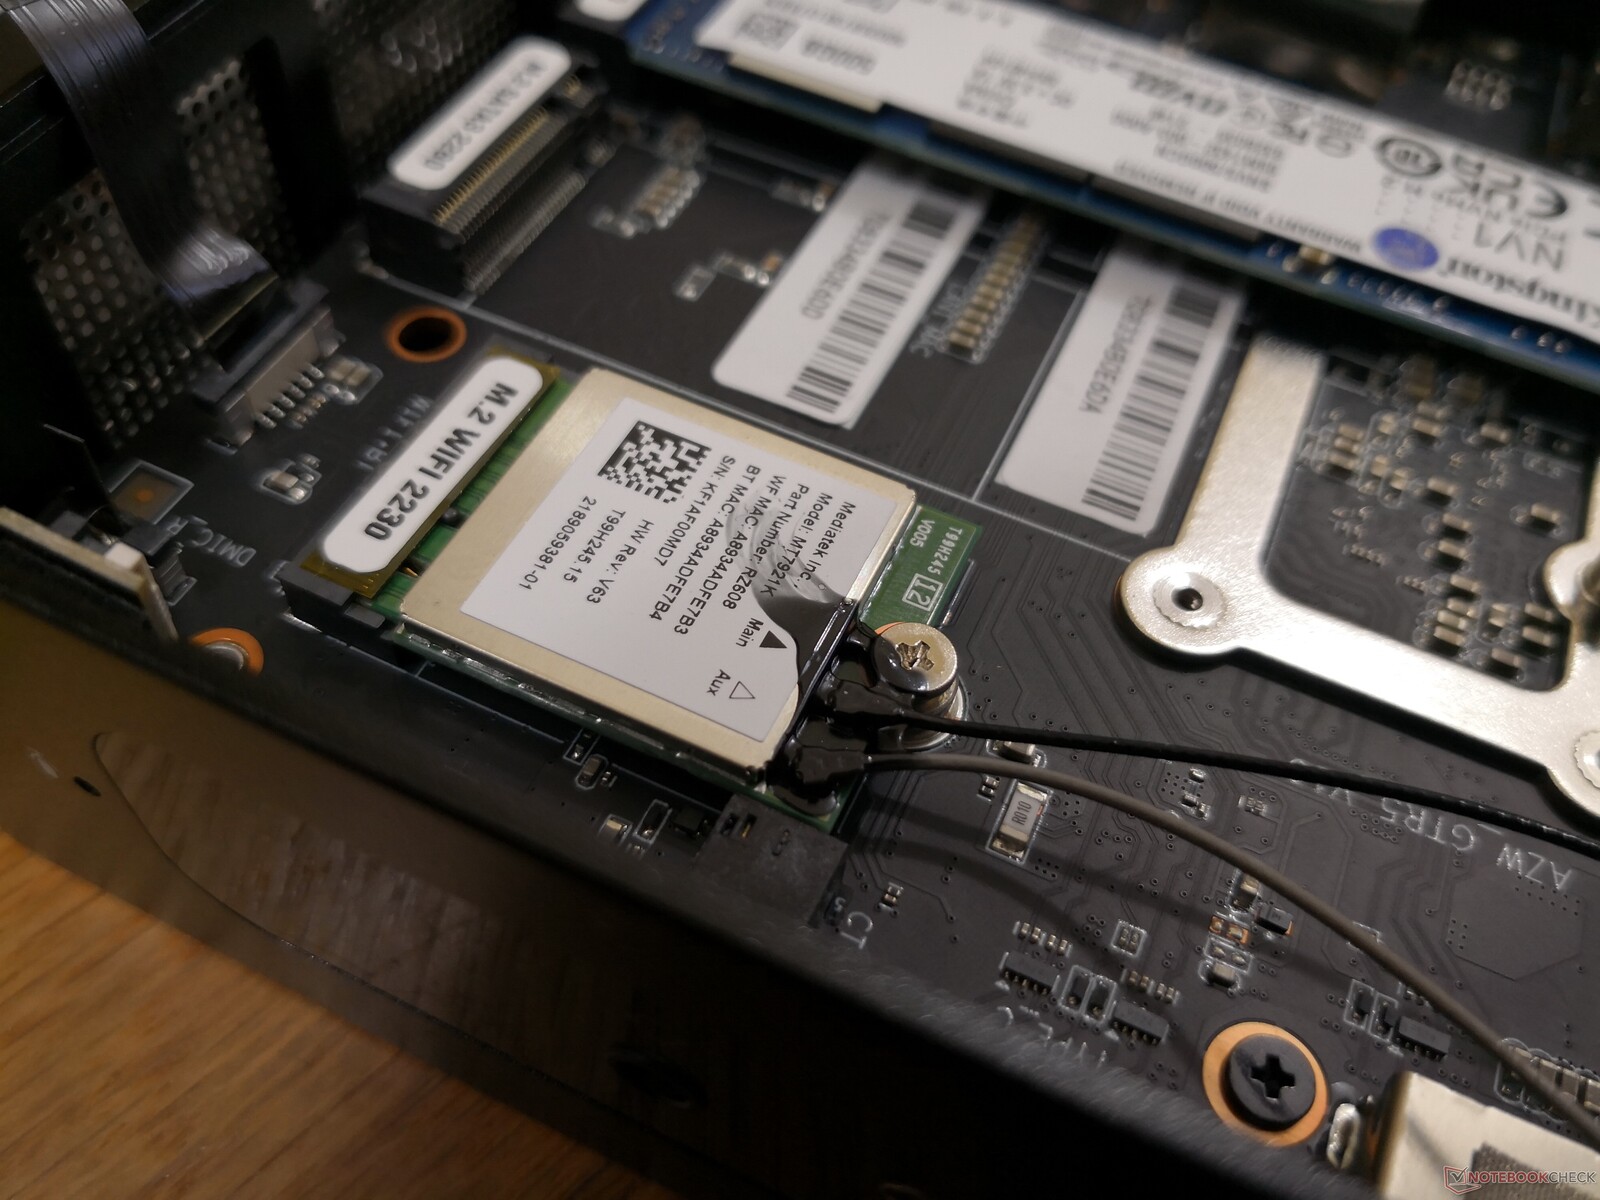
O GTR5 é um dos primeiros mini PCs a utilizar o MediaTek RZ608 em vez dos mais típicos da série Intel AX200 ou Qualcomm Atheros. O módulo é capaz de velocidades Wi-Fi 6E, mas por enquanto estamos limitados ao nosso Wi-Fi 6 Netgear RAX200. As taxas de transferência são, no entanto, confiáveis.
| Networking | |
| iperf3 transmit AX12 | |
| Beelink GTI 11 | |
| Intel NUC11PHKi7C | |
| Beelink GTR5 | |
| Intel NUC11PAQi7 | |
| GMK NucBox 2 | |
| Beelink GK Mini | |
| iperf3 receive AX12 | |
| Beelink GTI 11 | |
| Intel NUC11PHKi7C | |
| Intel NUC11PAQi7 | |
| Beelink GTR5 | |
| GMK NucBox 2 | |
| Beelink GK Mini | |
Manutenção
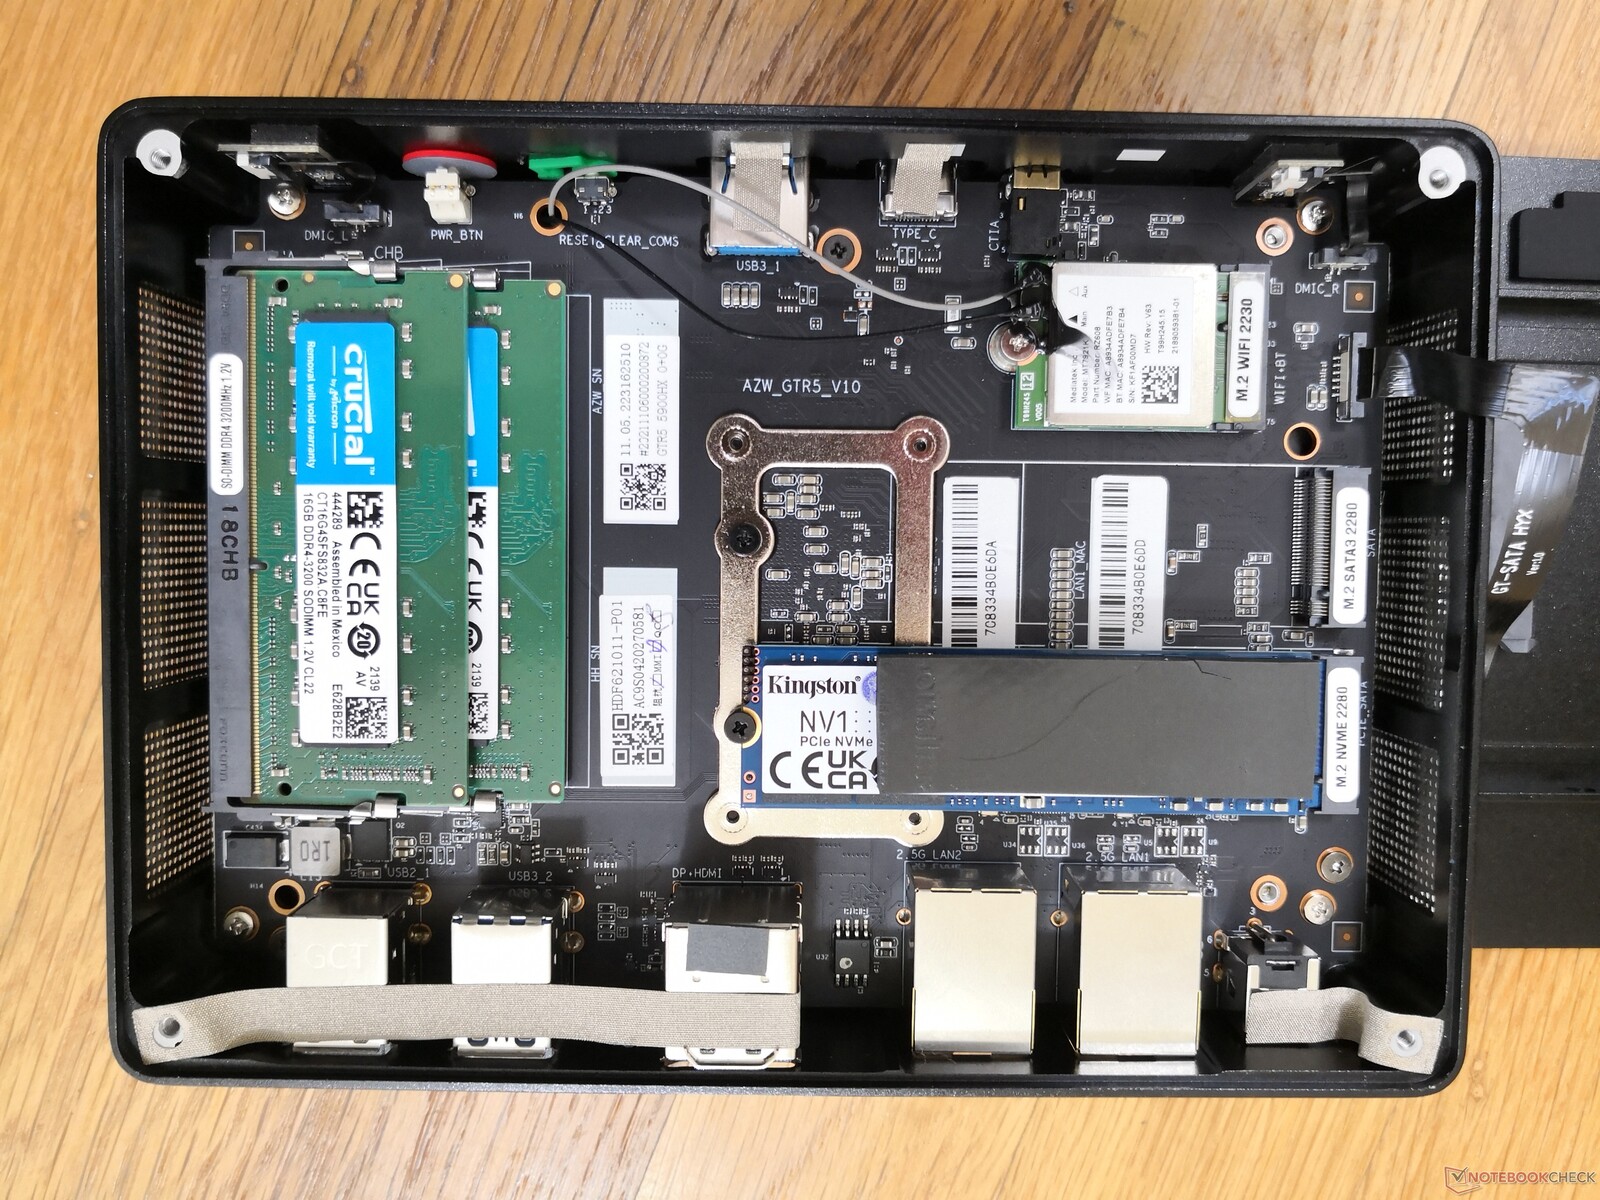
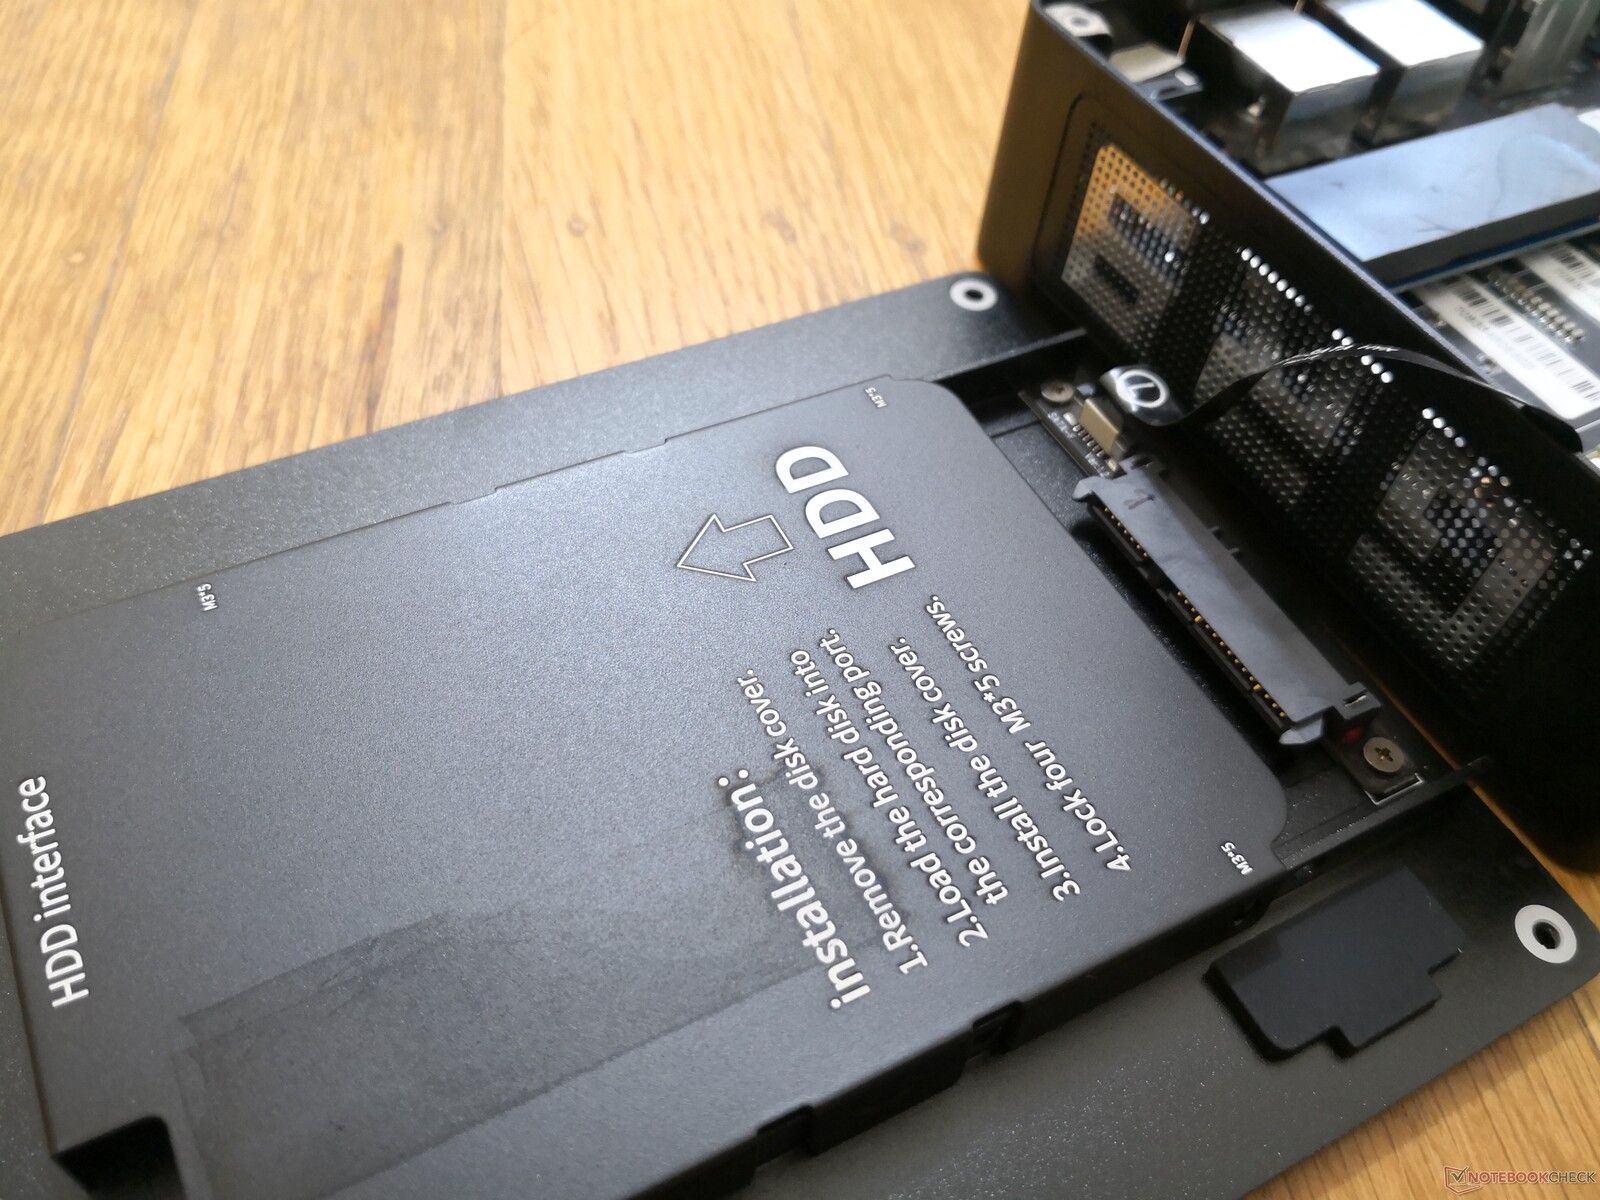
O painel inferior é fixado por apenas quatro parafusos Philips para facilitar a manutenção. Ao contrário dos parafusos de polegar em um NUC da Intel, porém, os parafusos aqui são muito menores e precisarão de uma chave de fenda para serem removidos. Uma vez dentro, os usuários terão acesso direto a 2x SODIMM, 3x compartimentos de armazenamento, e depois ao módulo WLAN. A desmontagem adicional é infelizmente necessária se você quiser limpar os ventiladores duplos que estão do outro lado da placa-mãe.
Acessórios e Garantia
A caixa de varejo inclui o adaptador AC, papelaria, um cabo HDMI e um suporte de montagem VESA com parafusos. Aplica-se a garantia padrão limitada de um ano do fabricante
Desempenho
Condições de teste
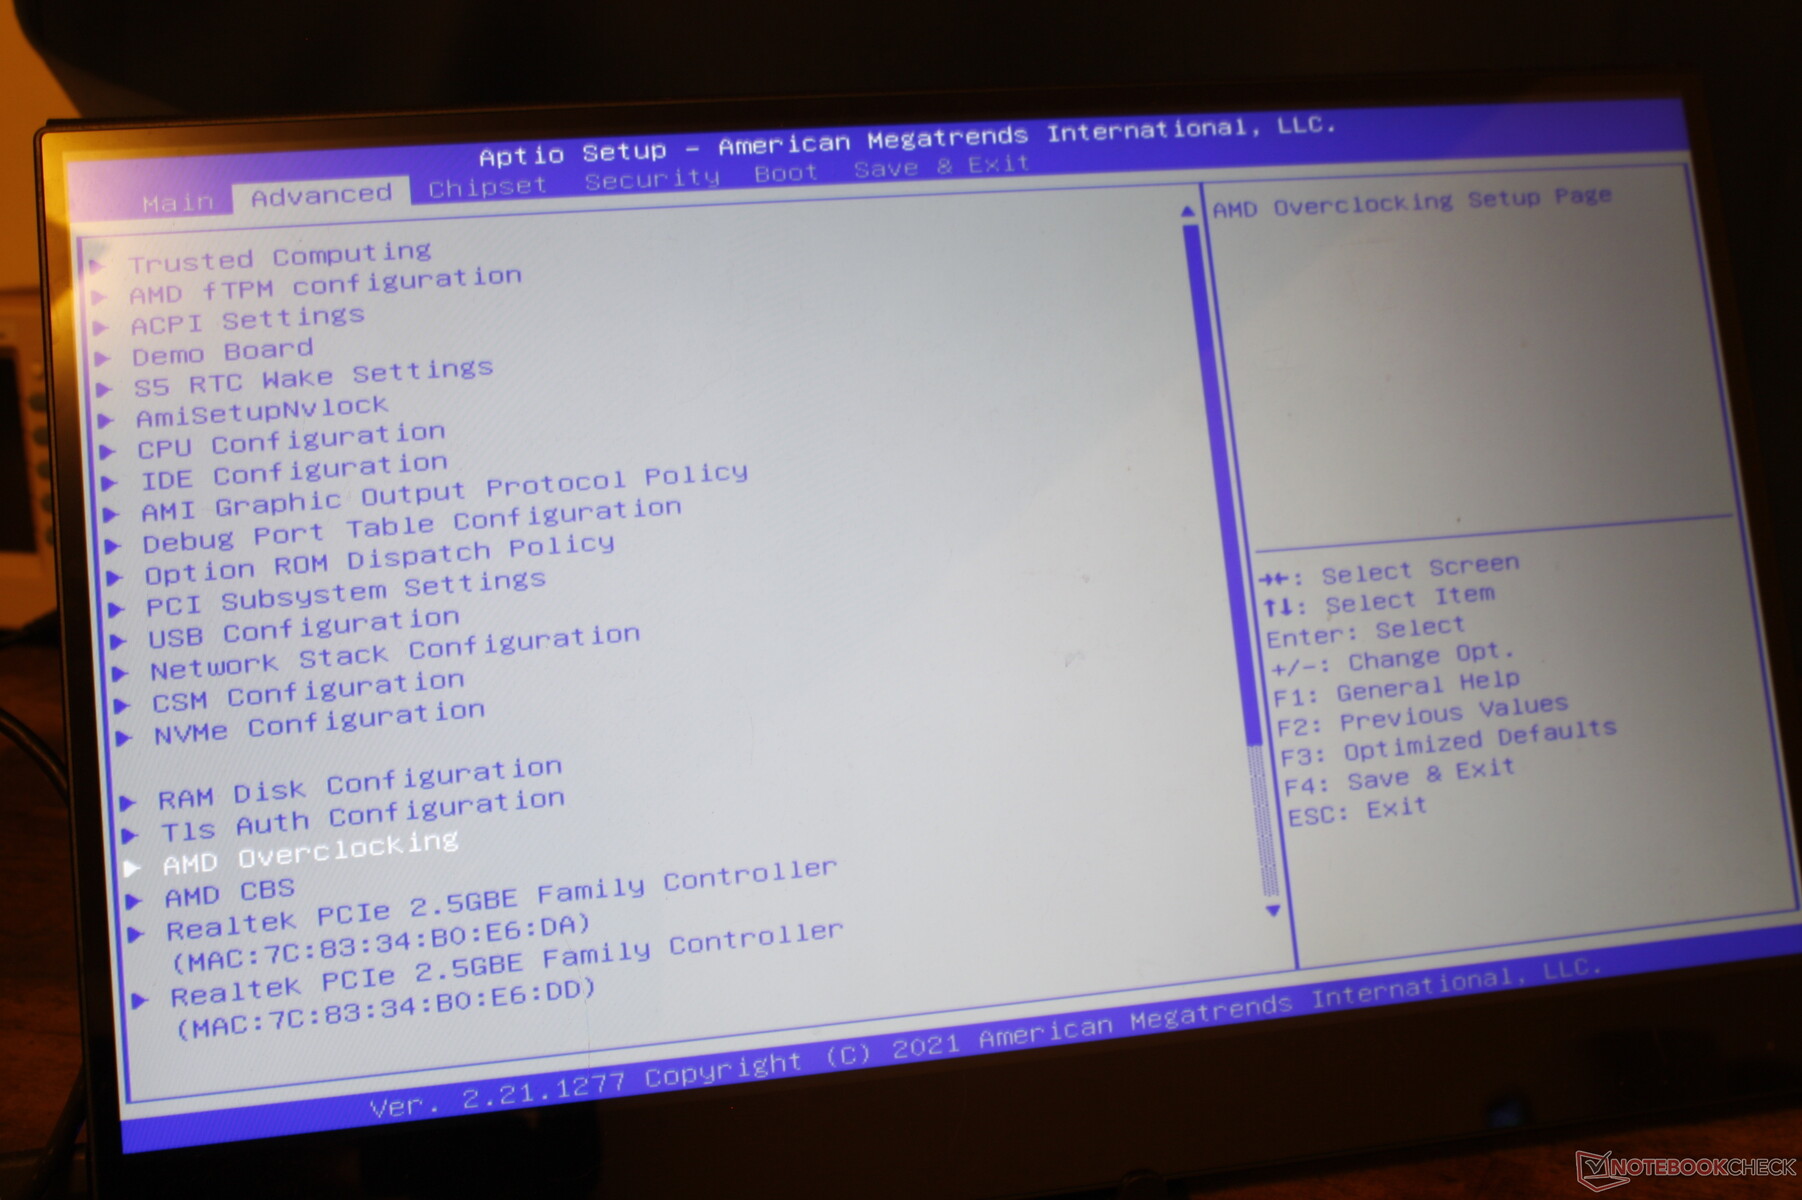
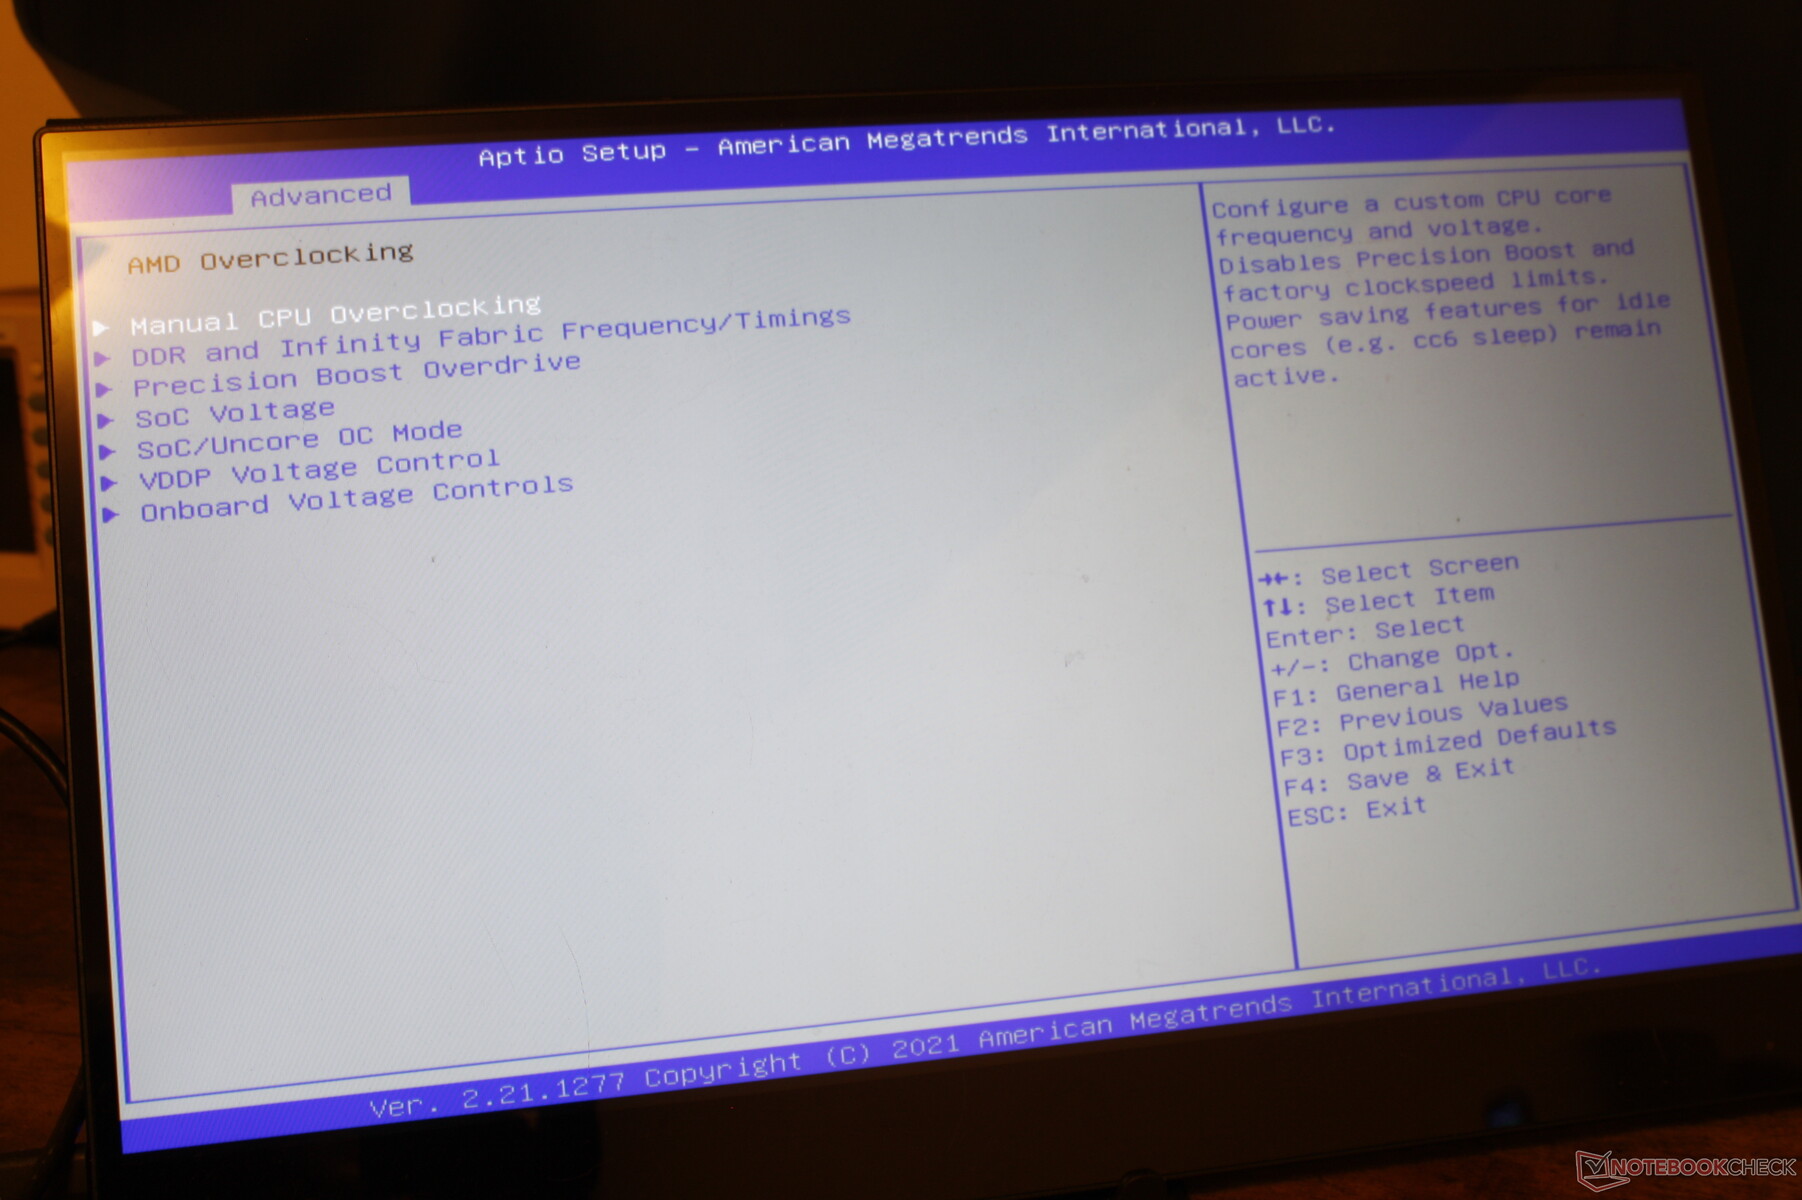
Usamos as configurações de BIOS de estoque e o perfil de potência do Windows Performance antes de executar qualquer um de nossos benchmarks abaixo. Opcionalmente, os usuários podem fazer overclock da CPU através da BIOS para obter mais desempenho, se desejado.
Processador
O desempenho bruto da CPU multi-thread é mais rápido do que na maioria dos laptops de jogos rodando em CPUs Core i7 do 11º gênero, ao mesmo tempo em que é comparável com as CPUs Core i9 do 11º gênero. Quando comparado a outros laptops com o mesmo Ryzen 9 5900HXno entanto, nosso Beelink fica com cerca de 5% a menos. O desempenho é, no entanto, muito próximo do Ryzen 9 5900X como encontrado no Eurocom Nightsky ARX15 mesmo antes de qualquer overclocking.
Cinebench R15 Multi Loop
Cinebench R20: CPU (Multi Core) | CPU (Single Core)
Cinebench R15: CPU Multi 64Bit | CPU Single 64Bit
Blender: v2.79 BMW27 CPU
7-Zip 18.03: 7z b 4 | 7z b 4 -mmt1
Geekbench 5.5: Multi-Core | Single-Core
HWBOT x265 Benchmark v2.2: 4k Preset
LibreOffice : 20 Documents To PDF
R Benchmark 2.5: Overall mean
| Cinebench R23 / Multi Core | |
| MSI GE76 Raider | |
| Intel Core i9-10900K | |
| MSI GS76 Stealth 11UH | |
| Média AMD Ryzen 9 5900HX (6622 - 14363, n=30) | |
| Minisforum HM90 | |
| Beelink GTR5 | |
| Huawei MateBook 16 R7 5800H | |
| Lenovo Legion C7 15IMH05 82EH0030GE | |
| Acer Aspire 5 A515-45-R4R1 | |
| Intel NUC11PAQi7 | |
| Asus Vivobook 15 K513EQ | |
| Beelink GTI 11 | |
| Lenovo IdeaPad 3 15ALC6 | |
| Beelink SER3 | |
| GMK NucBox 2 | |
| Beelink GK Mini | |
| Cinebench R23 / Single Core | |
| MSI GE76 Raider | |
| MSI GS76 Stealth 11UH | |
| Beelink GTR5 | |
| Asus Vivobook 15 K513EQ | |
| Média AMD Ryzen 9 5900HX (1218 - 1499, n=29) | |
| Intel Core i9-10900K | |
| Beelink GTI 11 | |
| Huawei MateBook 16 R7 5800H | |
| Minisforum HM90 | |
| Acer Aspire 5 A515-45-R4R1 | |
| Lenovo Legion C7 15IMH05 82EH0030GE | |
| Lenovo IdeaPad 3 15ALC6 | |
| GMK NucBox 2 | |
| Beelink SER3 | |
| Beelink GK Mini | |
| Cinebench R20 / CPU (Multi Core) | |
| MSI GE76 Raider | |
| Intel Core i9-10900K | |
| MSI GS76 Stealth 11UH | |
| Média AMD Ryzen 9 5900HX (2242 - 5476, n=30) | |
| Beelink GTR5 | |
| Minisforum HM90 | |
| Huawei MateBook 16 R7 5800H | |
| Lenovo Legion C7 15IMH05 82EH0030GE | |
| Acer Aspire 5 A515-45-R4R1 | |
| Intel NUC11PAQi7 | |
| Asus Vivobook 15 K513EQ | |
| Beelink GTI 11 | |
| Lenovo IdeaPad 3 15ALC6 | |
| Intel Hades Canyon NUC8i7HVK | |
| Beelink SER3 | |
| GMK NucBox 2 | |
| Beelink GK Mini | |
| Cinebench R20 / CPU (Single Core) | |
| MSI GE76 Raider | |
| MSI GS76 Stealth 11UH | |
| Intel NUC11PAQi7 | |
| Beelink GTR5 | |
| Média AMD Ryzen 9 5900HX (471 - 584, n=29) | |
| Asus Vivobook 15 K513EQ | |
| Intel Core i9-10900K | |
| Beelink GTI 11 | |
| Huawei MateBook 16 R7 5800H | |
| Minisforum HM90 | |
| Acer Aspire 5 A515-45-R4R1 | |
| Lenovo Legion C7 15IMH05 82EH0030GE | |
| Lenovo IdeaPad 3 15ALC6 | |
| Intel Hades Canyon NUC8i7HVK | |
| GMK NucBox 2 | |
| Beelink SER3 | |
| Beelink GK Mini | |
| Cinebench R15 / CPU Multi 64Bit | |
| MSI GE76 Raider | |
| Intel Core i9-10900K | |
| MSI GS76 Stealth 11UH | |
| Média AMD Ryzen 9 5900HX (1076 - 2267, n=29) | |
| Huawei MateBook 16 R7 5800H | |
| Minisforum HM90 | |
| Beelink GTR5 | |
| Lenovo Legion C7 15IMH05 82EH0030GE | |
| Acer Aspire 5 A515-45-R4R1 | |
| Intel NUC11PAQi7 | |
| Beelink GTI 11 | |
| Lenovo IdeaPad 3 15ALC6 | |
| Asus Vivobook 15 K513EQ | |
| Intel Hades Canyon NUC8i7HVK | |
| Beelink SER3 | |
| GMK NucBox 2 | |
| Beelink GK Mini | |
| Cinebench R15 / CPU Single 64Bit | |
| MSI GE76 Raider | |
| Beelink GTR5 | |
| MSI GS76 Stealth 11UH | |
| Média AMD Ryzen 9 5900HX (197 - 243, n=25) | |
| Huawei MateBook 16 R7 5800H | |
| Intel NUC11PAQi7 | |
| Asus Vivobook 15 K513EQ | |
| Intel Core i9-10900K | |
| Lenovo Legion C7 15IMH05 82EH0030GE | |
| Beelink GTI 11 | |
| Minisforum HM90 | |
| Acer Aspire 5 A515-45-R4R1 | |
| Intel Hades Canyon NUC8i7HVK | |
| Lenovo IdeaPad 3 15ALC6 | |
| GMK NucBox 2 | |
| Beelink SER3 | |
| Beelink GK Mini | |
| Blender / v2.79 BMW27 CPU | |
| Beelink GK Mini | |
| GMK NucBox 2 | |
| Beelink SER3 | |
| Beelink GTI 11 | |
| Asus Vivobook 15 K513EQ | |
| Intel Hades Canyon NUC8i7HVK | |
| Lenovo IdeaPad 3 15ALC6 | |
| Intel NUC11PAQi7 | |
| Acer Aspire 5 A515-45-R4R1 | |
| Lenovo Legion C7 15IMH05 82EH0030GE | |
| Beelink GTR5 | |
| Huawei MateBook 16 R7 5800H | |
| Média AMD Ryzen 9 5900HX (219 - 442, n=29) | |
| MSI GS76 Stealth 11UH | |
| Minisforum HM90 | |
| MSI GE76 Raider | |
| Intel Core i9-10900K | |
| 7-Zip 18.03 / 7z b 4 | |
| MSI GE76 Raider | |
| Intel Core i9-10900K | |
| Média AMD Ryzen 9 5900HX (36011 - 62503, n=29) | |
| Beelink GTR5 | |
| Huawei MateBook 16 R7 5800H | |
| MSI GS76 Stealth 11UH | |
| Minisforum HM90 | |
| Lenovo Legion C7 15IMH05 82EH0030GE | |
| Acer Aspire 5 A515-45-R4R1 | |
| Intel NUC11PAQi7 | |
| Asus Vivobook 15 K513EQ | |
| Beelink GTI 11 | |
| Lenovo IdeaPad 3 15ALC6 | |
| Intel Hades Canyon NUC8i7HVK | |
| GMK NucBox 2 | |
| Beelink SER3 | |
| Beelink GK Mini | |
| 7-Zip 18.03 / 7z b 4 -mmt1 | |
| MSI GE76 Raider | |
| Intel Core i9-10900K | |
| Beelink GTR5 | |
| Média AMD Ryzen 9 5900HX (4791 - 5905, n=29) | |
| MSI GS76 Stealth 11UH | |
| Huawei MateBook 16 R7 5800H | |
| Lenovo Legion C7 15IMH05 82EH0030GE | |
| Intel NUC11PAQi7 | |
| Asus Vivobook 15 K513EQ | |
| Beelink GTI 11 | |
| Minisforum HM90 | |
| Acer Aspire 5 A515-45-R4R1 | |
| Lenovo IdeaPad 3 15ALC6 | |
| Intel Hades Canyon NUC8i7HVK | |
| GMK NucBox 2 | |
| Beelink SER3 | |
| Beelink GK Mini | |
| Geekbench 5.5 / Multi-Core | |
| MSI GE76 Raider | |
| Intel Core i9-10900K | |
| MSI GS76 Stealth 11UH | |
| Média AMD Ryzen 9 5900HX (5057 - 9294, n=27) | |
| Lenovo Legion C7 15IMH05 82EH0030GE | |
| Beelink GTR5 | |
| Huawei MateBook 16 R7 5800H | |
| Minisforum HM90 | |
| Beelink GTI 11 | |
| Acer Aspire 5 A515-45-R4R1 | |
| Intel NUC11PAQi7 | |
| Lenovo IdeaPad 3 15ALC6 | |
| GMK NucBox 2 | |
| Beelink GK Mini | |
| Geekbench 5.5 / Single-Core | |
| MSI GE76 Raider | |
| MSI GS76 Stealth 11UH | |
| Beelink GTR5 | |
| Intel NUC11PAQi7 | |
| Média AMD Ryzen 9 5900HX (1271 - 1574, n=27) | |
| Huawei MateBook 16 R7 5800H | |
| Intel Core i9-10900K | |
| Beelink GTI 11 | |
| Lenovo Legion C7 15IMH05 82EH0030GE | |
| Minisforum HM90 | |
| Acer Aspire 5 A515-45-R4R1 | |
| Lenovo IdeaPad 3 15ALC6 | |
| GMK NucBox 2 | |
| Beelink GK Mini | |
| HWBOT x265 Benchmark v2.2 / 4k Preset | |
| Intel Core i9-10900K | |
| MSI GE76 Raider | |
| Média AMD Ryzen 9 5900HX (8.26 - 17.1, n=29) | |
| MSI GS76 Stealth 11UH | |
| Beelink GTR5 | |
| Huawei MateBook 16 R7 5800H | |
| Minisforum HM90 | |
| Lenovo Legion C7 15IMH05 82EH0030GE | |
| Acer Aspire 5 A515-45-R4R1 | |
| Intel NUC11PAQi7 | |
| Asus Vivobook 15 K513EQ | |
| Intel Hades Canyon NUC8i7HVK | |
| Beelink GTI 11 | |
| Lenovo IdeaPad 3 15ALC6 | |
| GMK NucBox 2 | |
| Beelink SER3 | |
| Beelink GK Mini | |
| LibreOffice / 20 Documents To PDF | |
| Beelink GK Mini | |
| Beelink SER3 | |
| Intel Core i9-10900K | |
| Minisforum HM90 | |
| GMK NucBox 2 | |
| Lenovo IdeaPad 3 15ALC6 | |
| Acer Aspire 5 A515-45-R4R1 | |
| Lenovo Legion C7 15IMH05 82EH0030GE | |
| Beelink GTI 11 | |
| Média AMD Ryzen 9 5900HX (44.1 - 87.4, n=29) | |
| Beelink GTR5 | |
| Huawei MateBook 16 R7 5800H | |
| MSI GS76 Stealth 11UH | |
| Asus Vivobook 15 K513EQ | |
| Intel NUC11PAQi7 | |
| MSI GE76 Raider | |
| R Benchmark 2.5 / Overall mean | |
| Beelink GK Mini | |
| GMK NucBox 2 | |
| Beelink SER3 | |
| Lenovo IdeaPad 3 15ALC6 | |
| Beelink GTI 11 | |
| Acer Aspire 5 A515-45-R4R1 | |
| Lenovo Legion C7 15IMH05 82EH0030GE | |
| Minisforum HM90 | |
| Asus Vivobook 15 K513EQ | |
| Intel NUC11PAQi7 | |
| MSI GS76 Stealth 11UH | |
| Intel Core i9-10900K | |
| Huawei MateBook 16 R7 5800H | |
| Média AMD Ryzen 9 5900HX (0.48 - 0.599, n=29) | |
| Beelink GTR5 | |
| MSI GE76 Raider | |
Cinebench R20: CPU (Multi Core) | CPU (Single Core)
Cinebench R15: CPU Multi 64Bit | CPU Single 64Bit
Blender: v2.79 BMW27 CPU
7-Zip 18.03: 7z b 4 | 7z b 4 -mmt1
Geekbench 5.5: Multi-Core | Single-Core
HWBOT x265 Benchmark v2.2: 4k Preset
LibreOffice : 20 Documents To PDF
R Benchmark 2.5: Overall mean
* ... menor é melhor
AIDA64: FP32 Ray-Trace | FPU Julia | CPU SHA3 | CPU Queen | FPU SinJulia | FPU Mandel | CPU AES | CPU ZLib | FP64 Ray-Trace | CPU PhotoWorxx
| Performance rating | |
| Média AMD Ryzen 9 5900HX | |
| Beelink GTR5 | |
| Beelink GTI 11 | |
| Intel NUC11PHKi7C | |
| GMK NucBox 2 | |
| Beelink GK Mini | |
| AIDA64 / FP32 Ray-Trace | |
| Média AMD Ryzen 9 5900HX (12470 - 16014, n=26) | |
| Beelink GTR5 | |
| Beelink GTI 11 | |
| Intel NUC11PHKi7C | |
| GMK NucBox 2 | |
| Beelink GK Mini | |
| AIDA64 / FPU Julia | |
| Média AMD Ryzen 9 5900HX (79554 - 101008, n=26) | |
| Beelink GTR5 | |
| Beelink GTI 11 | |
| Intel NUC11PHKi7C | |
| GMK NucBox 2 | |
| Beelink GK Mini | |
| AIDA64 / CPU SHA3 | |
| Média AMD Ryzen 9 5900HX (2754 - 3444, n=26) | |
| Beelink GTR5 | |
| Beelink GTI 11 | |
| Intel NUC11PHKi7C | |
| GMK NucBox 2 | |
| Beelink GK Mini | |
| AIDA64 / CPU Queen | |
| Média AMD Ryzen 9 5900HX (87865 - 105123, n=26) | |
| Beelink GTR5 | |
| Intel NUC11PHKi7C | |
| Beelink GTI 11 | |
| GMK NucBox 2 | |
| Beelink GK Mini | |
| AIDA64 / FPU SinJulia | |
| Beelink GTR5 | |
| Média AMD Ryzen 9 5900HX (10899 - 12806, n=26) | |
| Intel NUC11PHKi7C | |
| Beelink GTI 11 | |
| GMK NucBox 2 | |
| Beelink GK Mini | |
| AIDA64 / FPU Mandel | |
| Média AMD Ryzen 9 5900HX (43685 - 55702, n=26) | |
| Beelink GTR5 | |
| Intel NUC11PHKi7C | |
| Beelink GTI 11 | |
| GMK NucBox 2 | |
| Beelink GK Mini | |
| AIDA64 / CPU AES | |
| Média AMD Ryzen 9 5900HX (109927 - 137901, n=26) | |
| Beelink GTR5 | |
| Intel NUC11PHKi7C | |
| Beelink GTI 11 | |
| GMK NucBox 2 | |
| Beelink GK Mini | |
| AIDA64 / CPU ZLib | |
| Média AMD Ryzen 9 5900HX (706 - 878, n=26) | |
| Beelink GTR5 | |
| Intel NUC11PHKi7C | |
| Beelink GTI 11 | |
| GMK NucBox 2 | |
| Beelink GK Mini | |
| AIDA64 / FP64 Ray-Trace | |
| Média AMD Ryzen 9 5900HX (6664 - 8644, n=26) | |
| Beelink GTR5 | |
| Beelink GTI 11 | |
| Intel NUC11PHKi7C | |
| GMK NucBox 2 | |
| Beelink GK Mini | |
| AIDA64 / CPU PhotoWorxx | |
| Beelink GTI 11 | |
| Intel NUC11PHKi7C | |
| Beelink GTR5 | |
| Média AMD Ryzen 9 5900HX (14344 - 25533, n=26) | |
| GMK NucBox 2 | |
| Beelink GK Mini | |
Desempenho do sistema
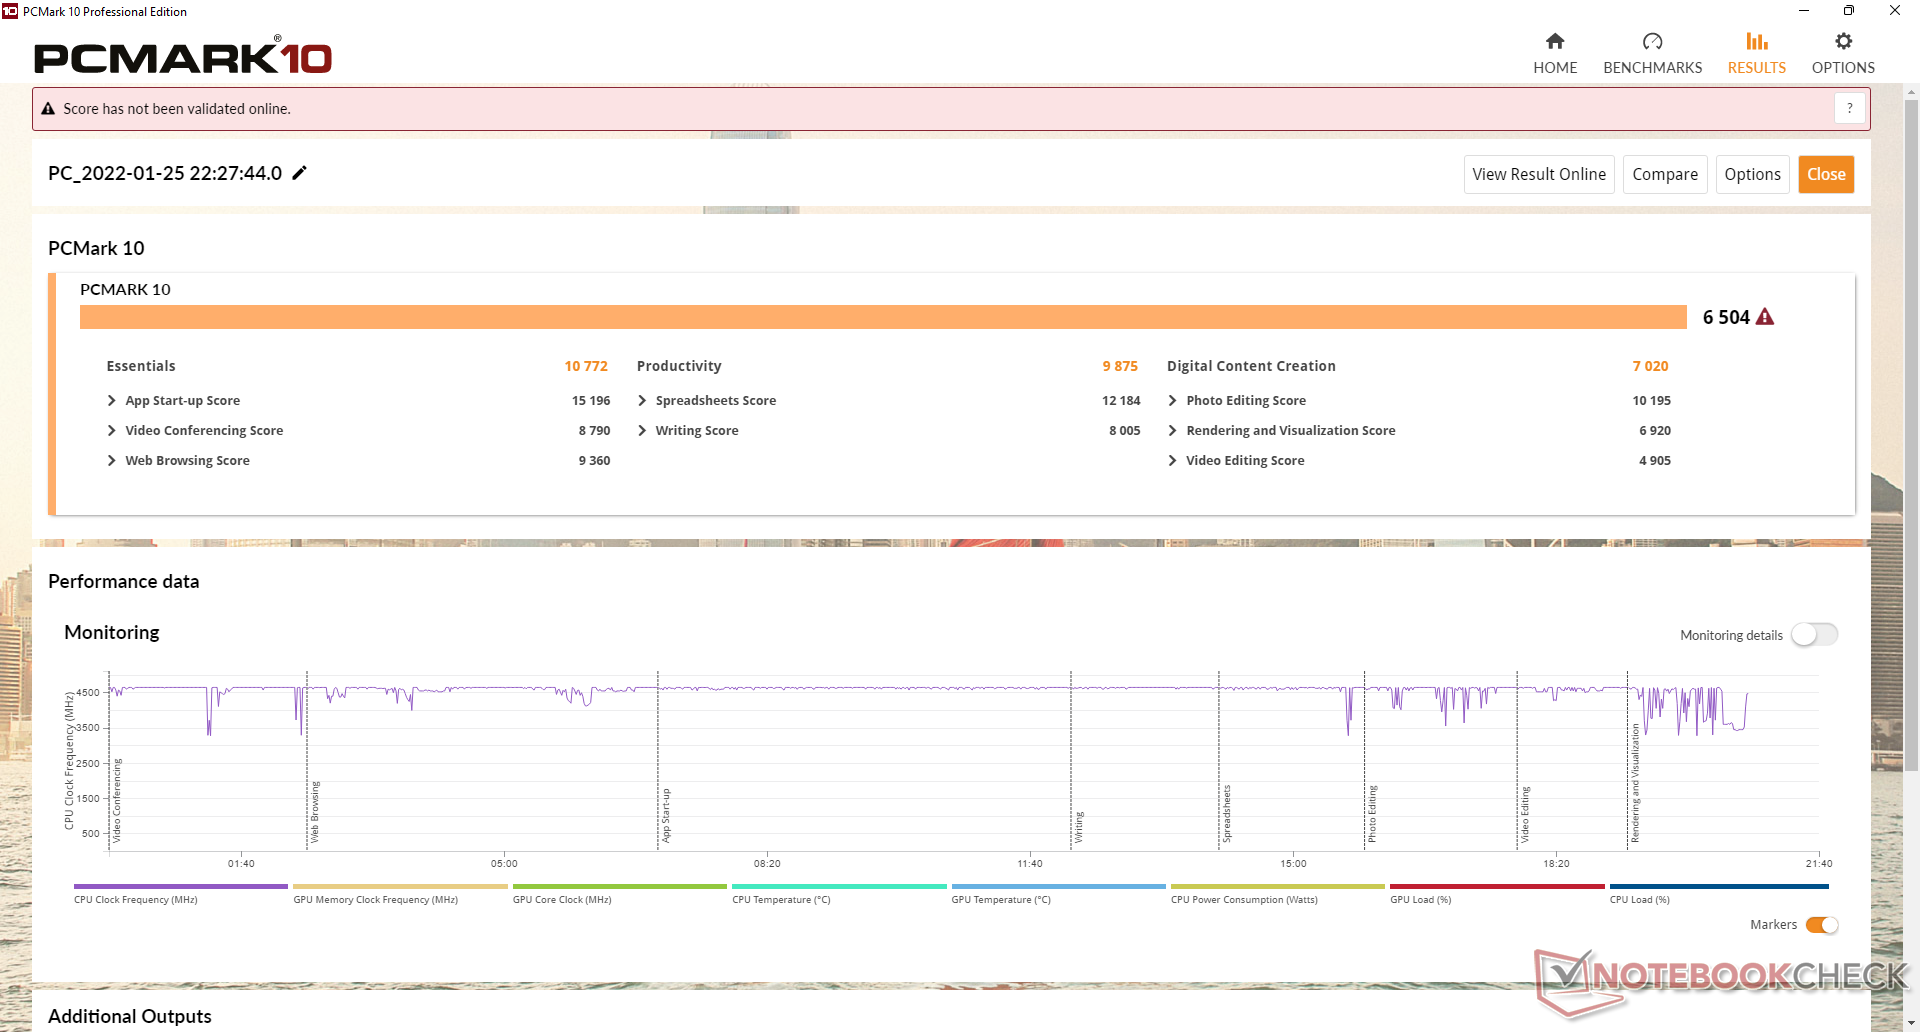
Os resultados do PCMark são excelentes e bem acima da maioria dos outros mini PCs e NUCs. Entretanto, encontramos duas falhas durante nossos testes em que a unidade se desligava automaticamente por aparentemente nenhuma razão. Não fomos capazes de repetir as falhas de forma confiável para o melhor ou para o pior.
CrossMark: Overall | Productivity | Creativity | Responsiveness
| PCMark 10 / Score | |
| Beelink GTR5 | |
| Média AMD Ryzen 9 5900HX, AMD Radeon RX Vega 8 (Ryzen 4000/5000) (6290 - 6507, n=5) | |
| Intel NUC11PHKi7C | |
| Intel NUC11PAQi7 | |
| Beelink GTI 11 | |
| GMK NucBox 2 | |
| Beelink GK Mini | |
| PCMark 10 / Essentials | |
| Beelink GTR5 | |
| Média AMD Ryzen 9 5900HX, AMD Radeon RX Vega 8 (Ryzen 4000/5000) (10087 - 10836, n=5) | |
| Intel NUC11PAQi7 | |
| Beelink GTI 11 | |
| Intel NUC11PHKi7C | |
| GMK NucBox 2 | |
| Beelink GK Mini | |
| PCMark 10 / Productivity | |
| Média AMD Ryzen 9 5900HX, AMD Radeon RX Vega 8 (Ryzen 4000/5000) (9852 - 10196, n=5) | |
| Beelink GTR5 | |
| Intel NUC11PHKi7C | |
| Intel NUC11PAQi7 | |
| Beelink GTI 11 | |
| GMK NucBox 2 | |
| Beelink GK Mini | |
| PCMark 10 / Digital Content Creation | |
| Beelink GTR5 | |
| Intel NUC11PHKi7C | |
| Média AMD Ryzen 9 5900HX, AMD Radeon RX Vega 8 (Ryzen 4000/5000) (6660 - 7105, n=5) | |
| Beelink GTI 11 | |
| Intel NUC11PAQi7 | |
| GMK NucBox 2 | |
| Beelink GK Mini | |
| CrossMark / Overall | |
| Beelink GTR5 | |
| Média AMD Ryzen 9 5900HX, AMD Radeon RX Vega 8 (Ryzen 4000/5000) (1402 - 1501, n=2) | |
| CrossMark / Productivity | |
| Beelink GTR5 | |
| Média AMD Ryzen 9 5900HX, AMD Radeon RX Vega 8 (Ryzen 4000/5000) (1387 - 1495, n=2) | |
| CrossMark / Creativity | |
| Beelink GTR5 | |
| Média AMD Ryzen 9 5900HX, AMD Radeon RX Vega 8 (Ryzen 4000/5000) (1553 - 1589, n=2) | |
| CrossMark / Responsiveness | |
| Beelink GTR5 | |
| Média AMD Ryzen 9 5900HX, AMD Radeon RX Vega 8 (Ryzen 4000/5000) (1068 - 1281, n=2) | |
| PCMark 10 Score | 6504 pontos | |
Ajuda | ||
| AIDA64 / Memory Copy | |
| GMK NucBox 2 | |
| Beelink GTR5 | |
| Beelink GTI 11 | |
| Média AMD Ryzen 9 5900HX (36725 - 43318, n=26) | |
| Intel NUC11PHKi7C | |
| Beelink GK Mini | |
| AIDA64 / Memory Read | |
| Beelink GTR5 | |
| Beelink GTI 11 | |
| Média AMD Ryzen 9 5900HX (41378 - 47593, n=26) | |
| Intel NUC11PHKi7C | |
| GMK NucBox 2 | |
| Beelink GK Mini | |
| AIDA64 / Memory Write | |
| GMK NucBox 2 | |
| Beelink GTI 11 | |
| Beelink GTR5 | |
| Média AMD Ryzen 9 5900HX (32536 - 46718, n=26) | |
| Intel NUC11PHKi7C | |
| Beelink GK Mini | |
| AIDA64 / Memory Latency | |
| Intel NUC11PHKi7C | |
| Beelink GTR5 | |
| Média AMD Ryzen 9 5900HX (73.5 - 97.1, n=26) | |
| Beelink GK Mini | |
| Beelink GTI 11 | |
| GMK NucBox 2 | |
* ... menor é melhor
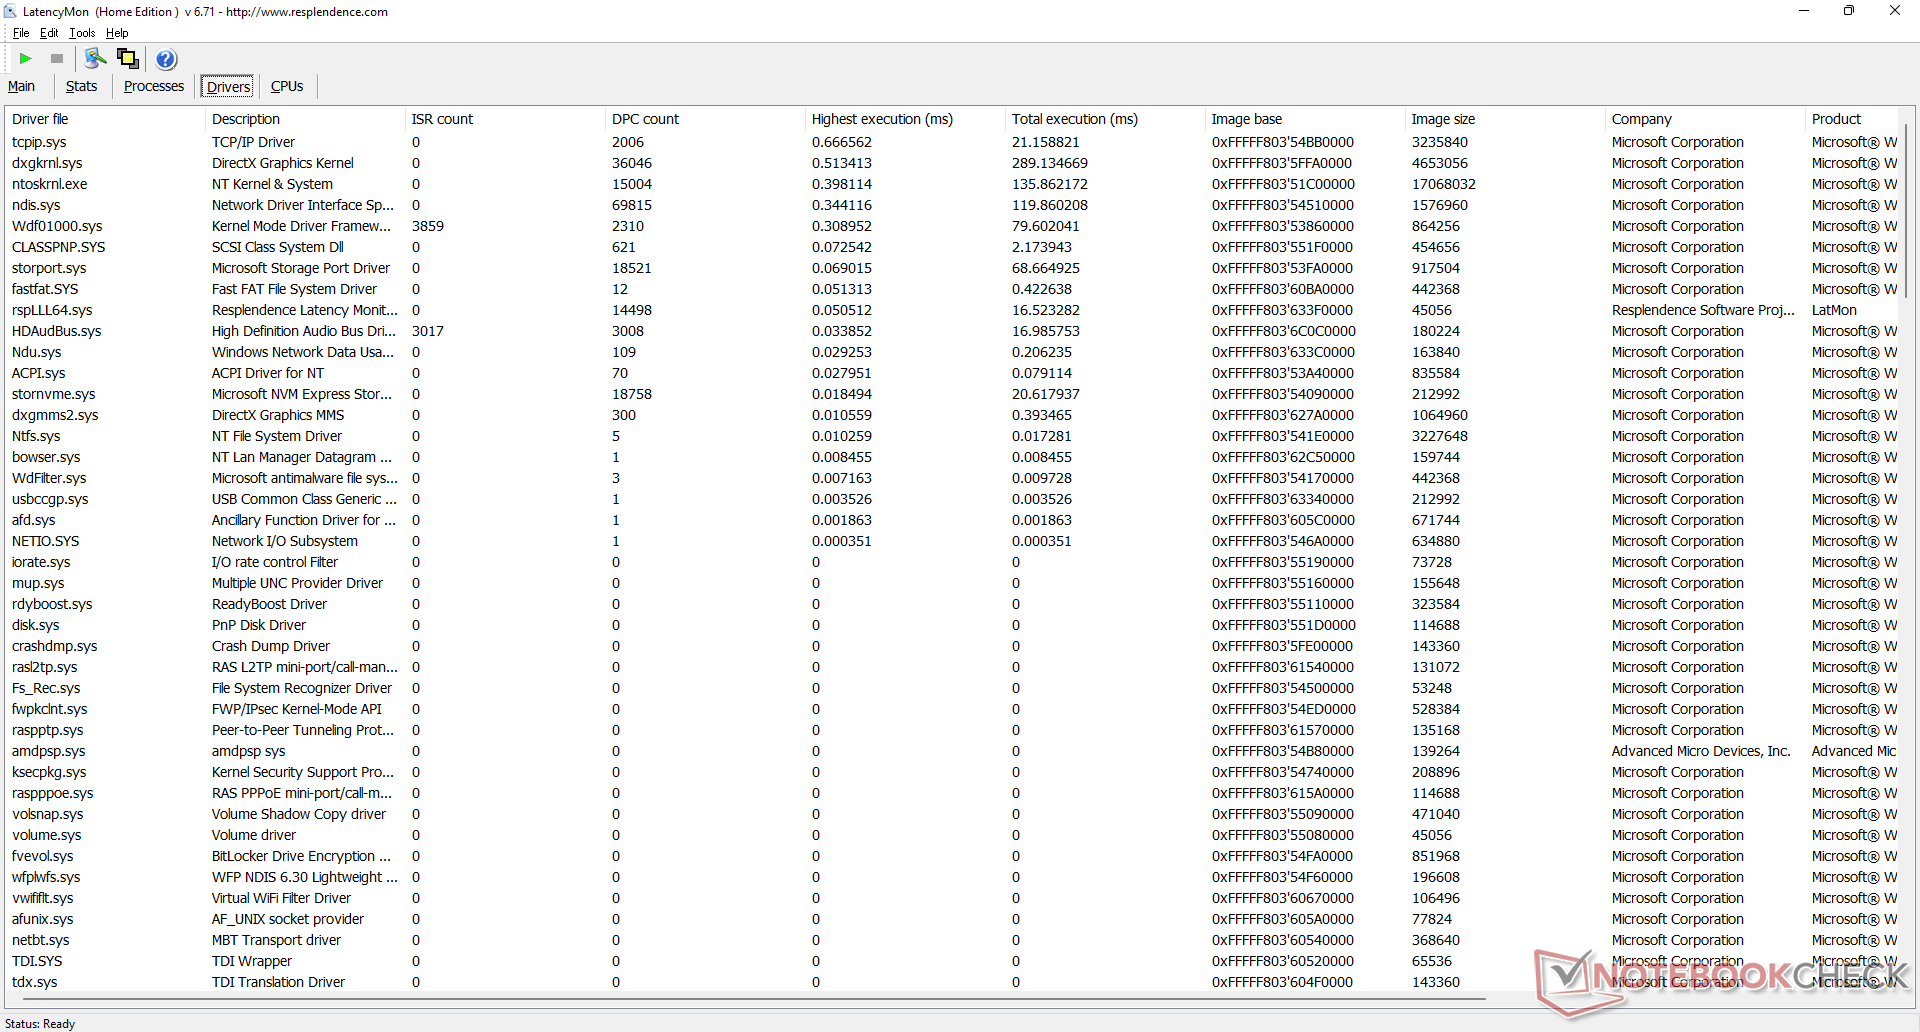
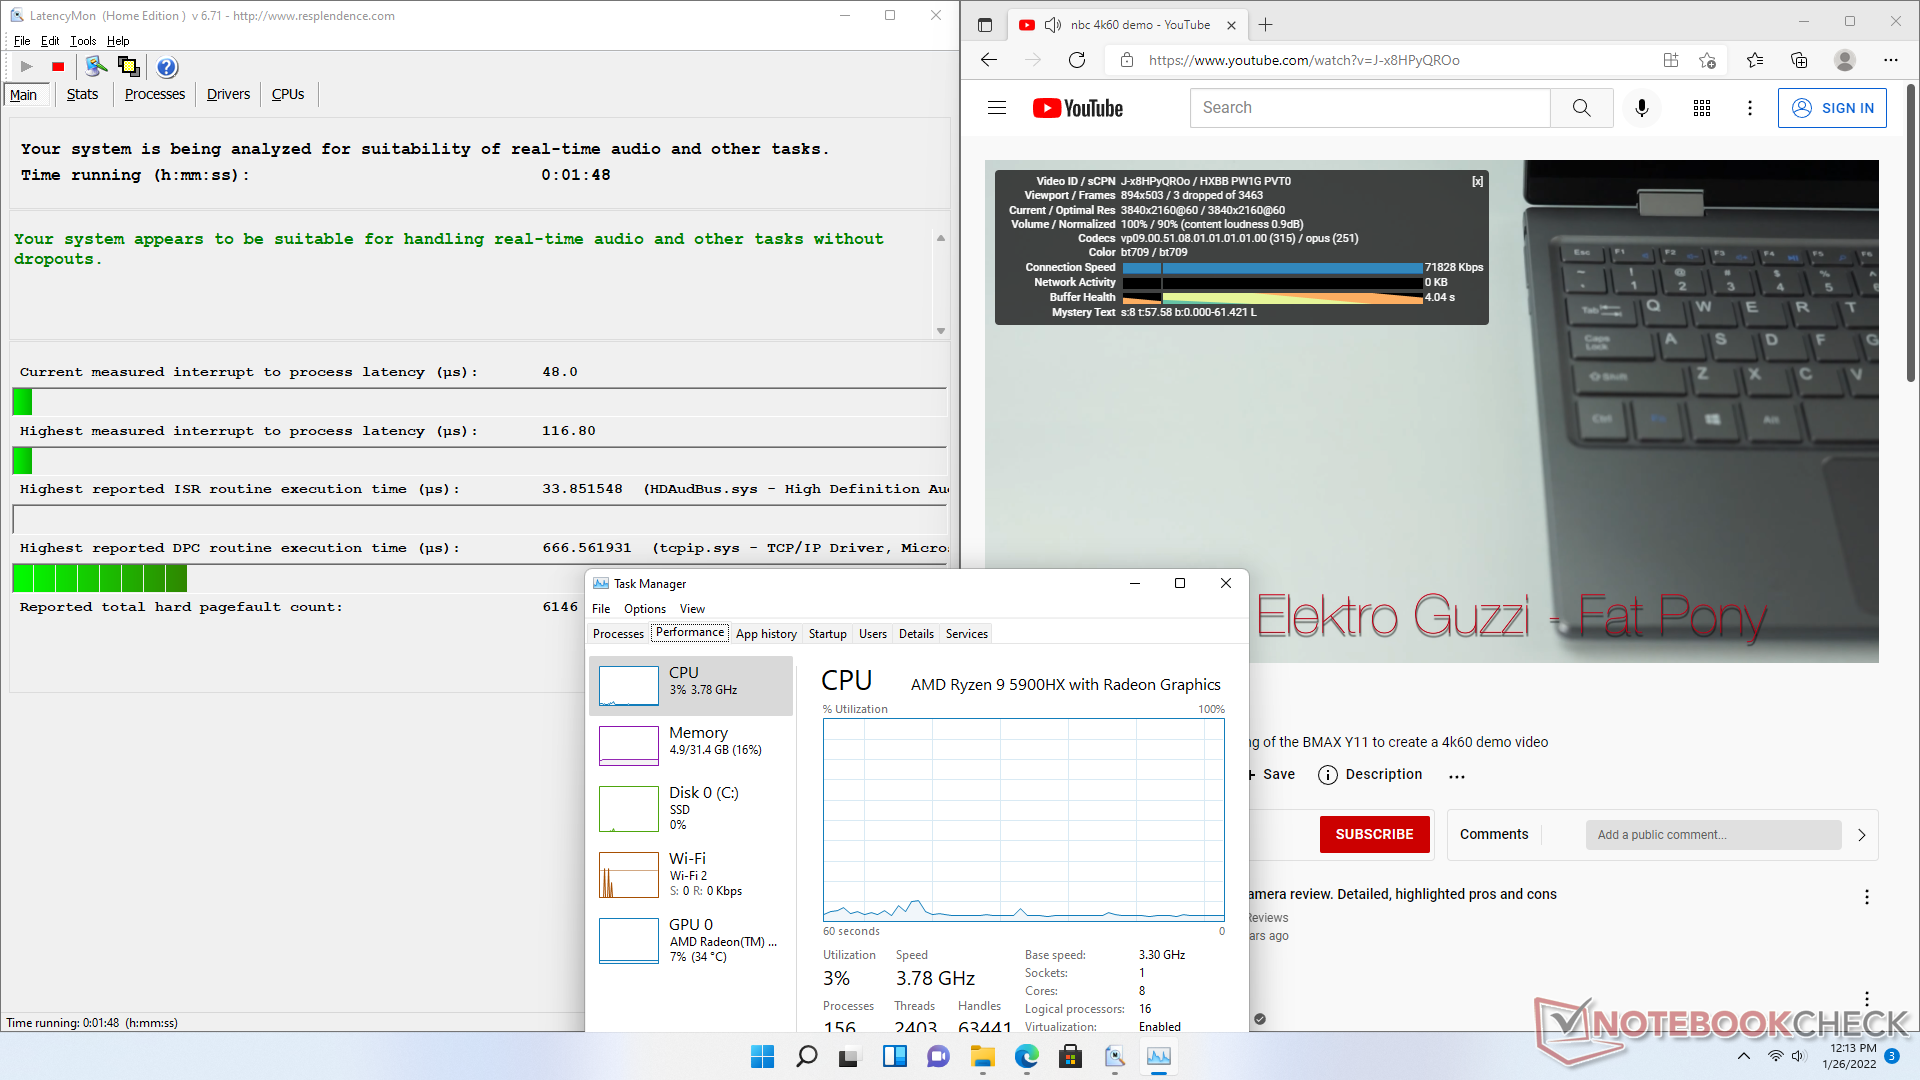
Latência do DPC
LatencyMon não mostra problemas de DPC ao abrir várias abas do navegador em nossa página inicial. a reprodução de vídeo de 4K a 60 FPS é suave, com apenas 3 quadros descartados durante nosso teste de minutos no YouTube.
| DPC Latencies / LatencyMon - interrupt to process latency (max), Web, Youtube, Prime95 | |
| Beelink GK Mini | |
| Intel NUC11PHKi7C | |
| GMK NucBox 2 | |
| Intel NUC11PAQi7 | |
| Beelink GTI 11 | |
| Beelink GTR5 | |
* ... menor é melhor
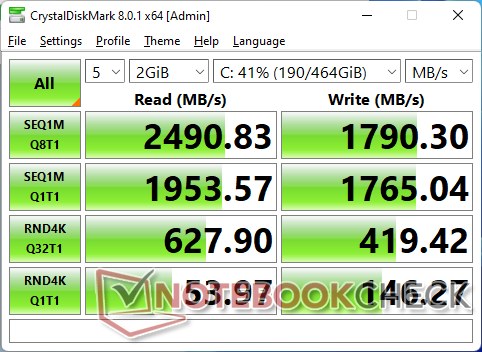
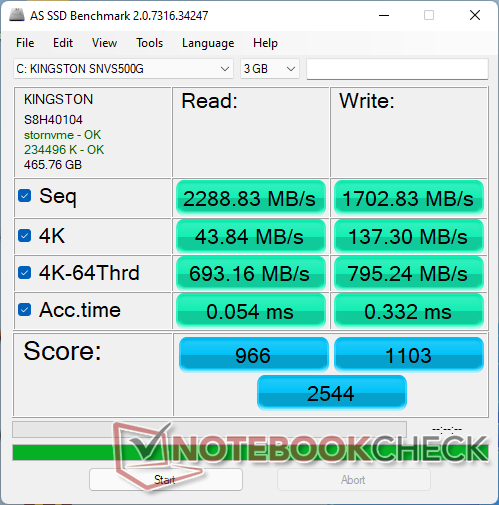
Dispositivos de armazenamento
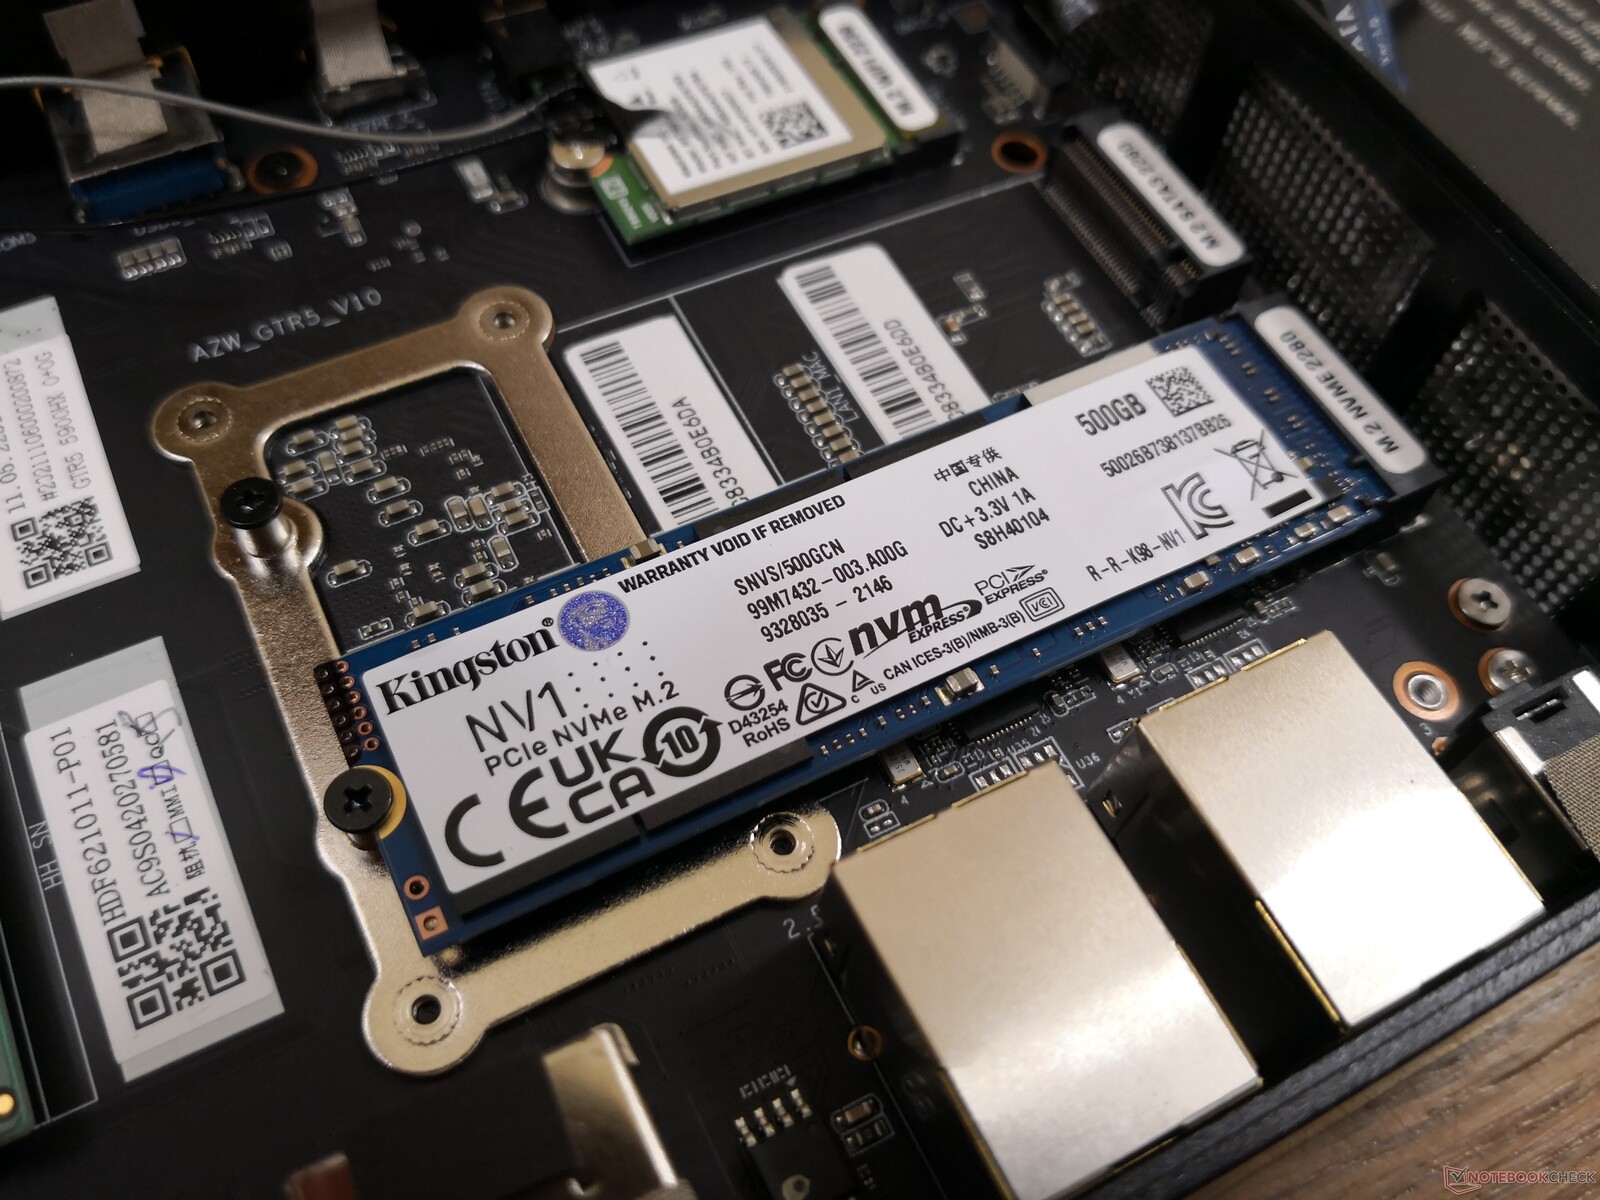
Nossa unidade de teste vem com uma faixa intermediária 500 GB Kingston NV1 PCIe3 x4 SSD. As velocidades da PCIe4 não são suportadas, ao contrário das últimas NUCs da Intel rodando em CPUs Core do 11º gênero. A unidade Kingston não mostra problemas mantendo sua taxa máxima de transferência de ~2300 MB/s por períodos prolongados.

| Drive Performance rating - Percent | |
| Intel NUC11PAQi7 | |
| Beelink GTI 11 | |
| Intel NUC11PHKi7C | |
| Beelink GTR5 | |
| GMK NucBox 2 | |
| Beelink GK Mini | |
* ... menor é melhor
Disk Throttling: DiskSpd Read Loop, Queue Depth 8
Desempenho da GPU
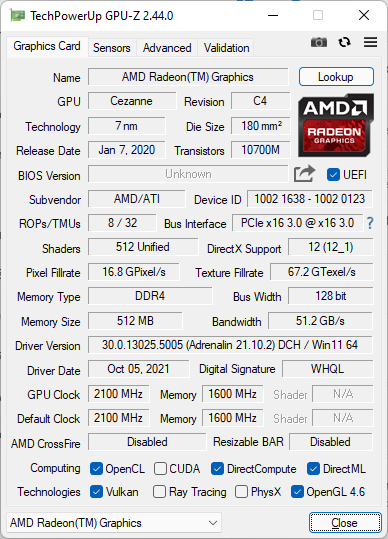
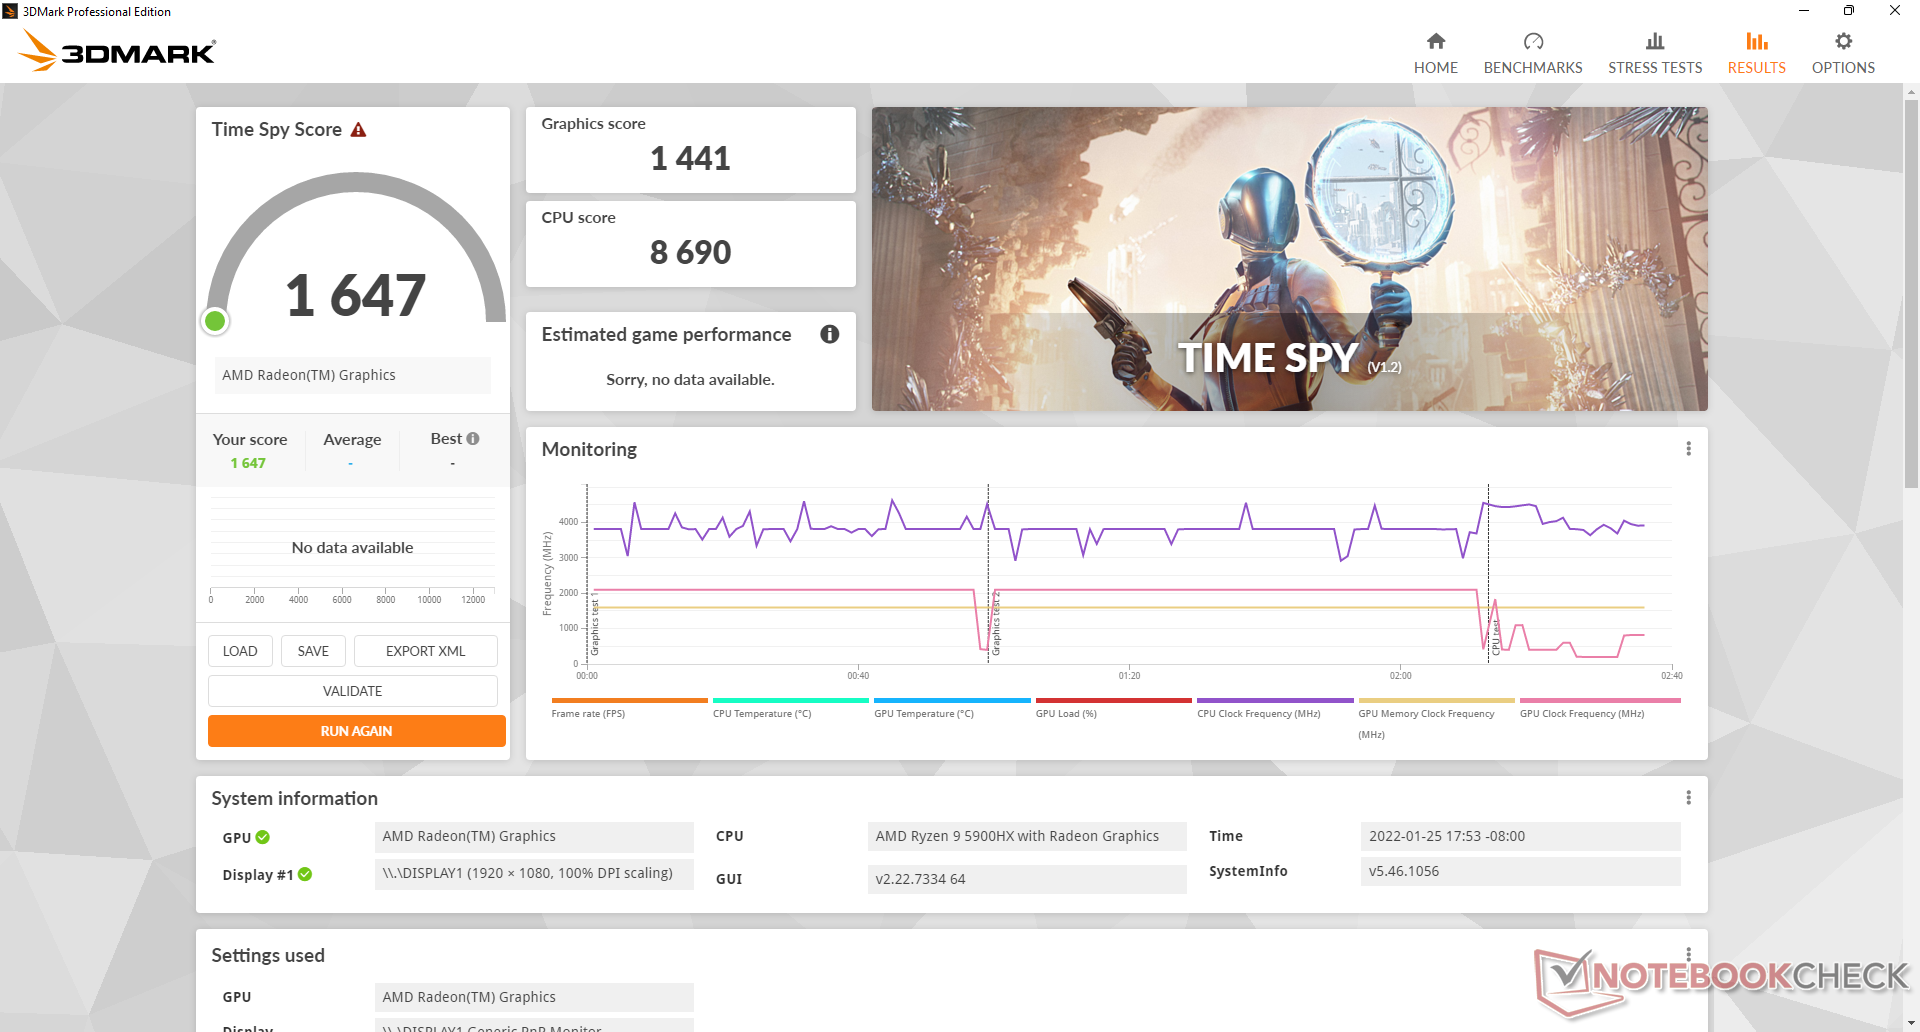
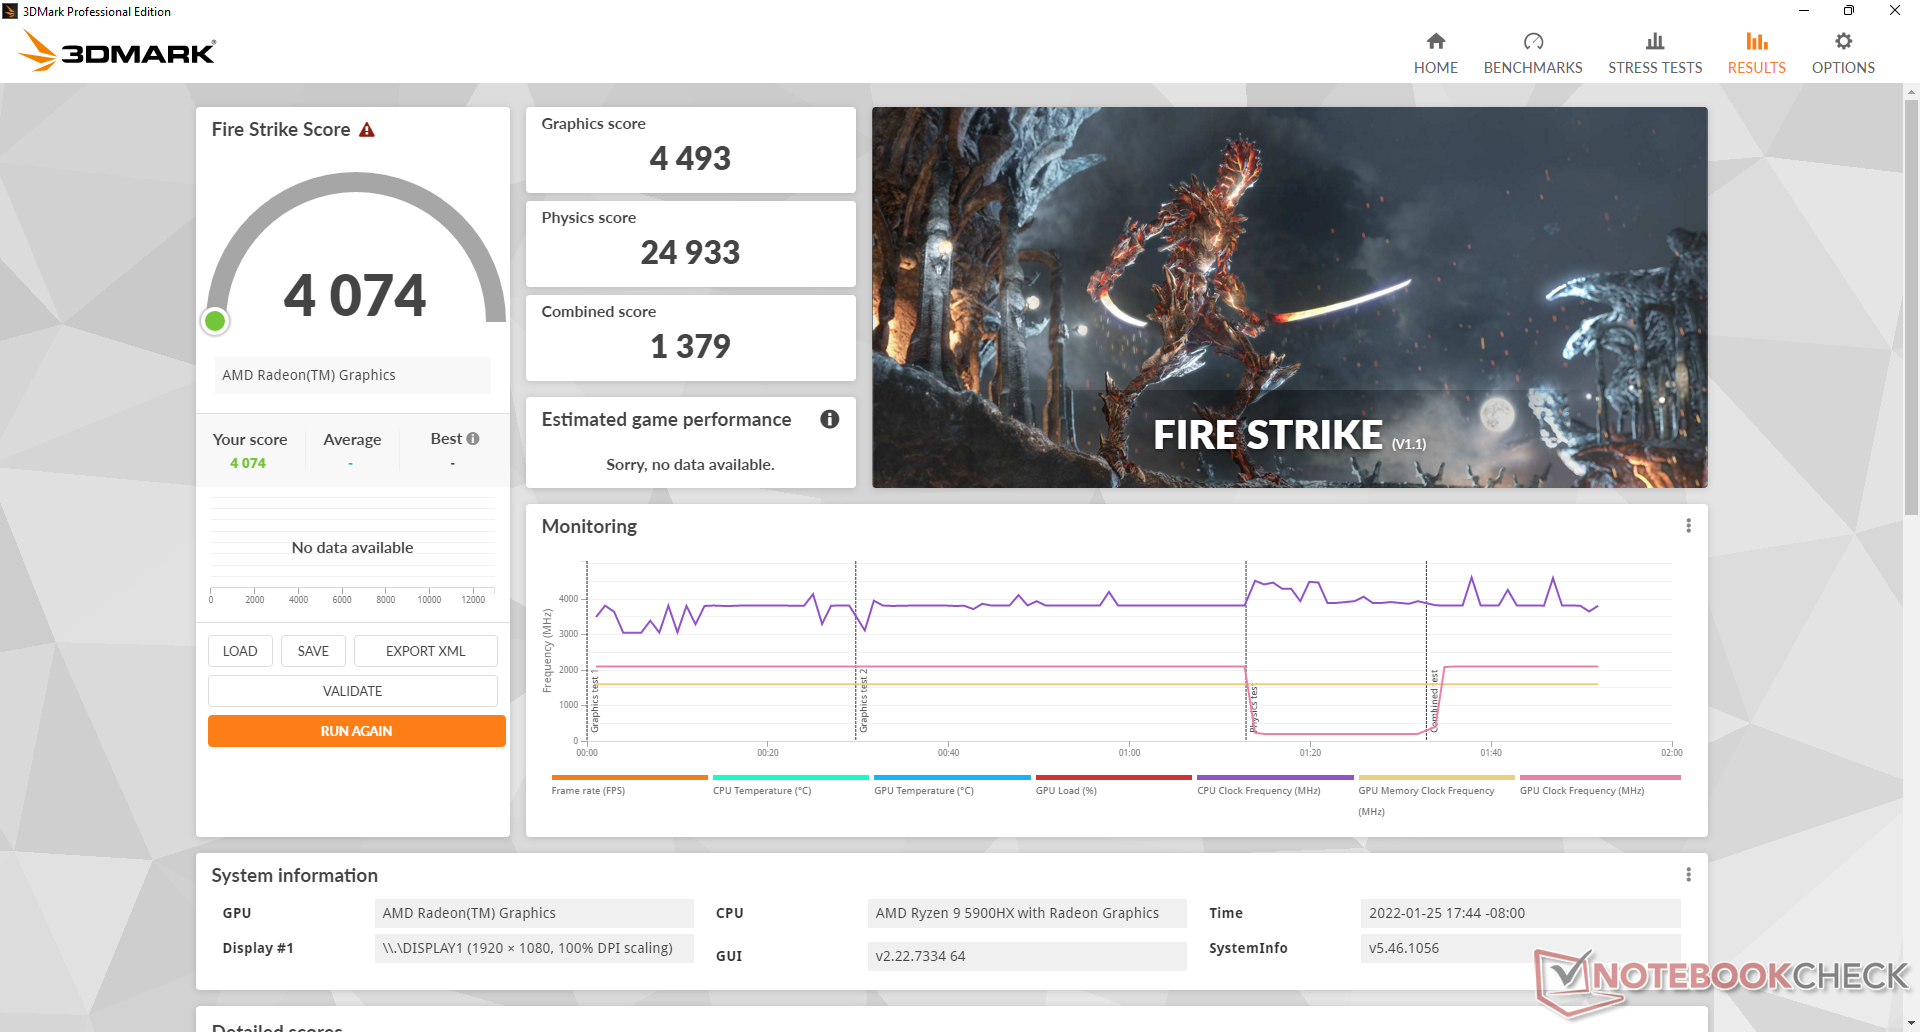
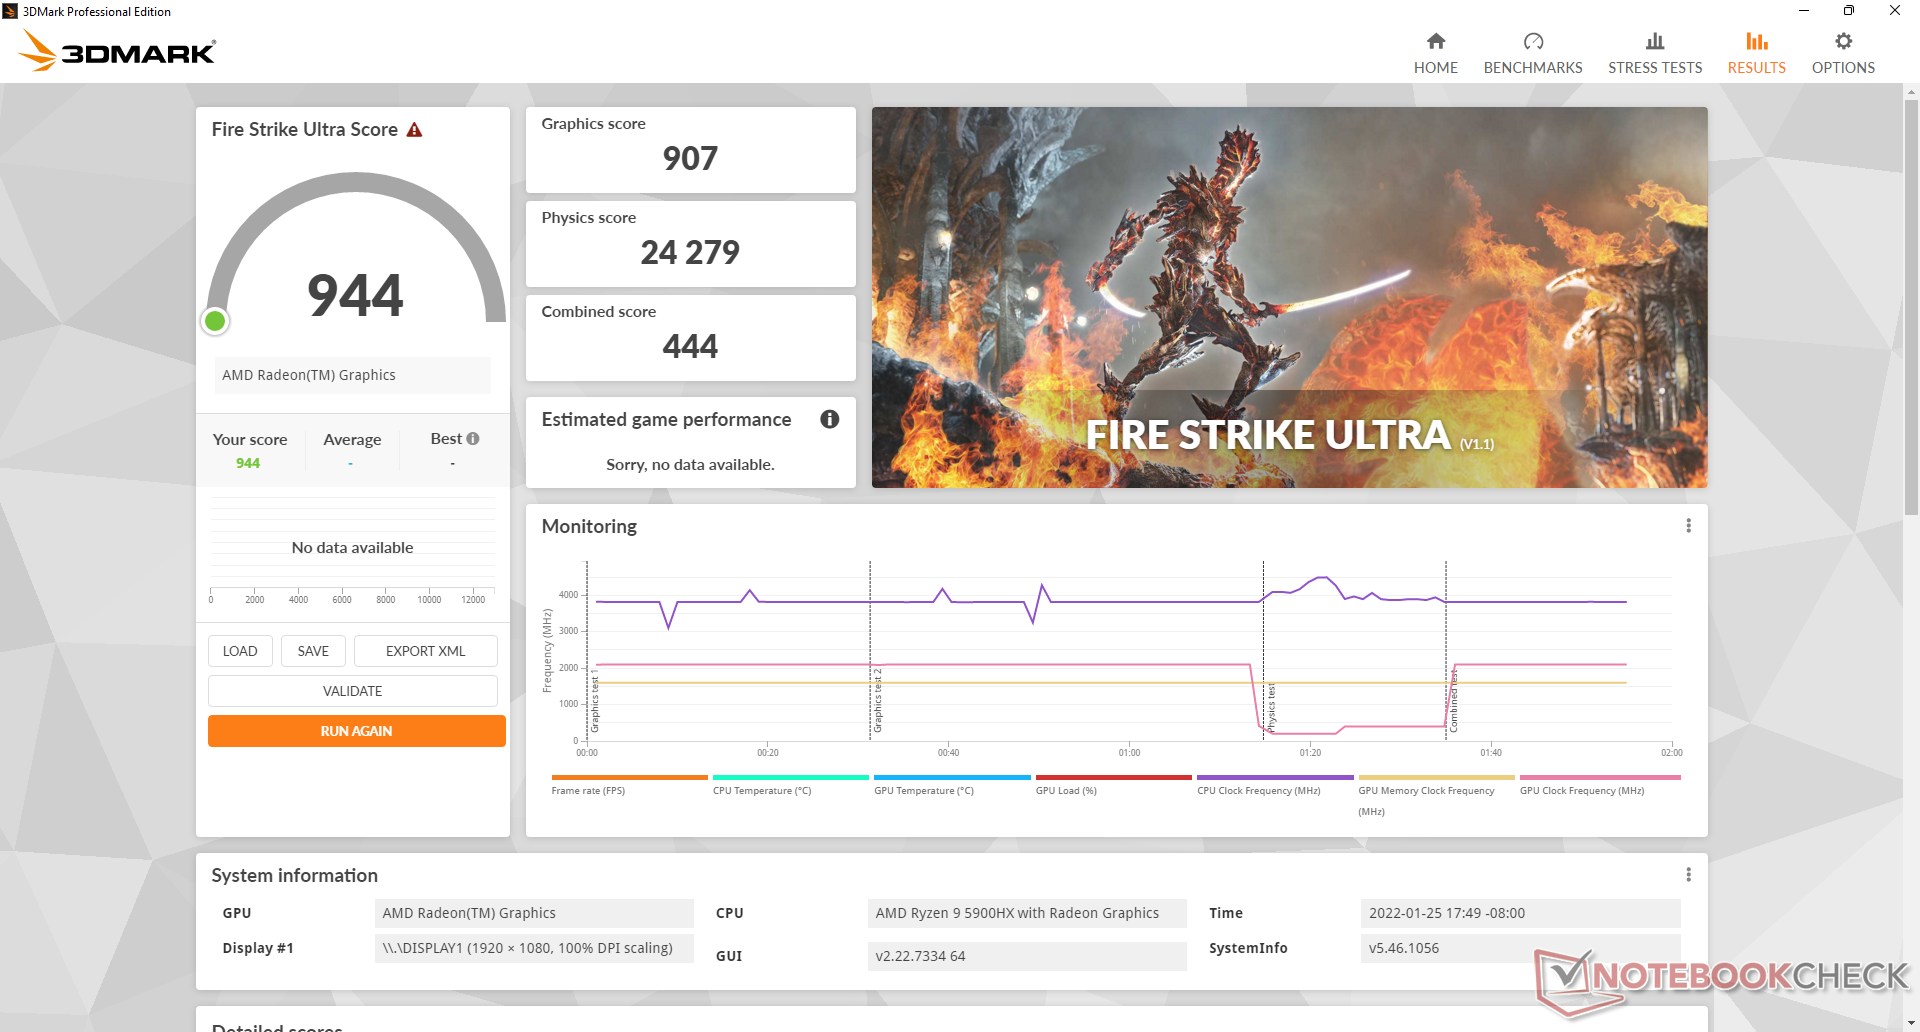
A integraçãoRadeon RX Vega 8 aqui é cerca de 20% mais rápido do que a média do laptop em nosso banco de dados equipado com a mesma GPU integrada. A Intel Iris Xe 96 EUs como encontrada na maioria dos laptops Core i7 da 11ª geração, ainda é a nossa solução AMD na maioria dos títulos, mas o delta entre eles é muito mais estreito desta vez. A maioria dos títulos modernos e exigentes funcionam razoavelmente bem em configurações baixas de 1080p.
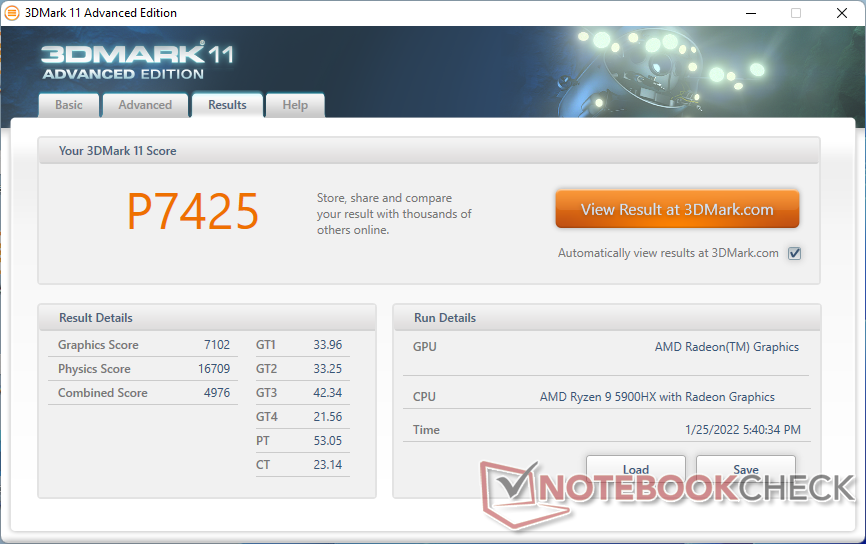
| 3DMark 11 Performance | 7425 pontos | |
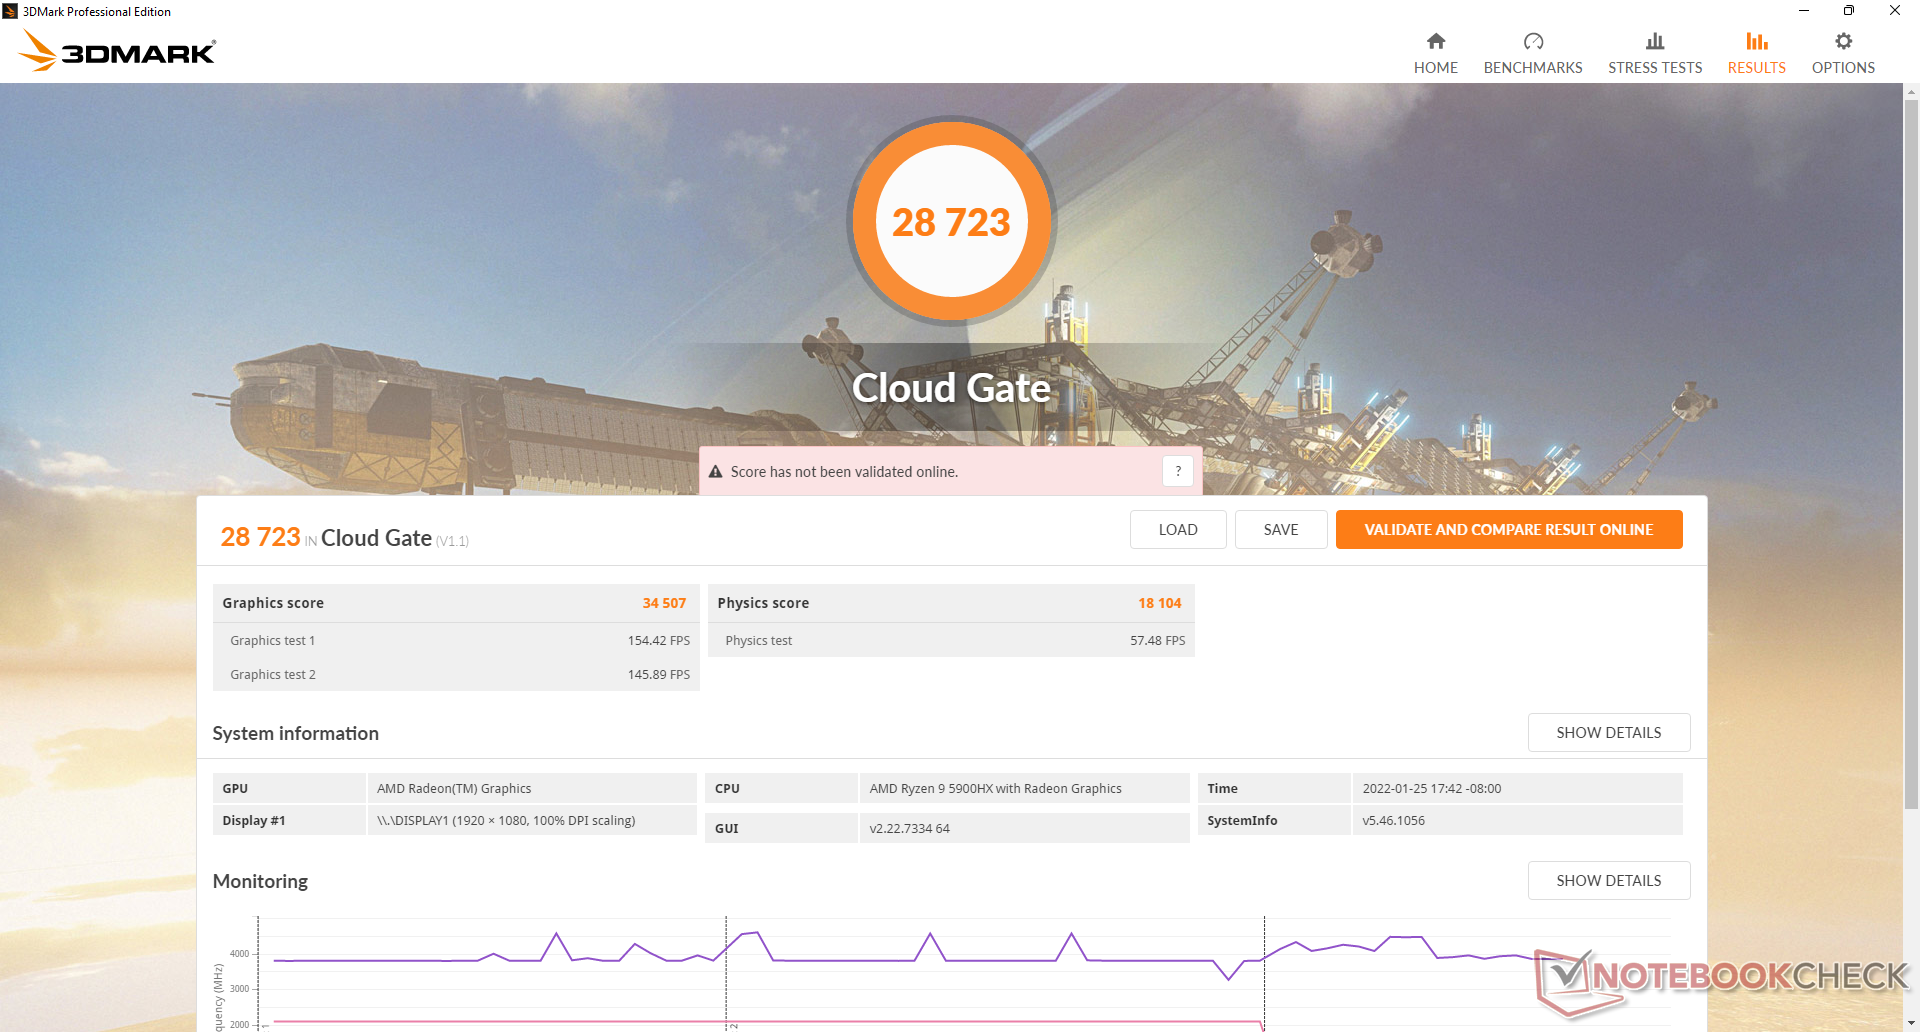
| 3DMark Cloud Gate Standard Score | 28723 pontos | |
| 3DMark Fire Strike Score | 4074 pontos | |
| 3DMark Time Spy Score | 1647 pontos | |
Ajuda | ||
Witcher 3 FPS Chart
| baixo | média | alto | ultra | |
|---|---|---|---|---|
| GTA V (2015) | 140 | 124 | 33.4 | 15.1 |
| The Witcher 3 (2015) | 86.9 | 55.2 | 26.8 | 17.1 |
| Dota 2 Reborn (2015) | 135 | 107 | 63.8 | 59.9 |
| Final Fantasy XV Benchmark (2018) | 44.8 | 22.3 | 15.7 | |
| X-Plane 11.11 (2018) | 58.2 | 45.7 | 40.5 | |
| Far Cry 5 (2018) | 62 | 29 | 27 | 25 |
| Strange Brigade (2018) | 99.1 | 37.8 | 31.9 | 27.5 |
Emissões
Ruído do sistema
O GTR5 é um dos mini PCs mais ruidosos que testamos, já que seus dois ventiladores internos estão sempre essencialmente ativos. Quando simplesmente sentados na tela do desktop Windows, por exemplo, já somos capazes de gravar um ruído do ventilador de 34,2 dB(A) comparado a ~25 dB(A) no GMK NucBox 2 ou Intel NUC11PAQi7 cada um com CPUs menos potentes.
A execução de cargas mais altas como jogos pode induzir um ruído do ventilador de 41 a 45 dB(A) a ser ainda mais alto que o da Intel NUC11PHKi7C equipada com o significativamente mais rápido GeForce RTX 2060. Não importa como se corta, o GTR5 vai ser barulhento na maioria das condições. A boa notícia é que os ventiladores não pulsam ou ciclam com muita freqüência, o que teria tornado o barulho ainda mais irritante.
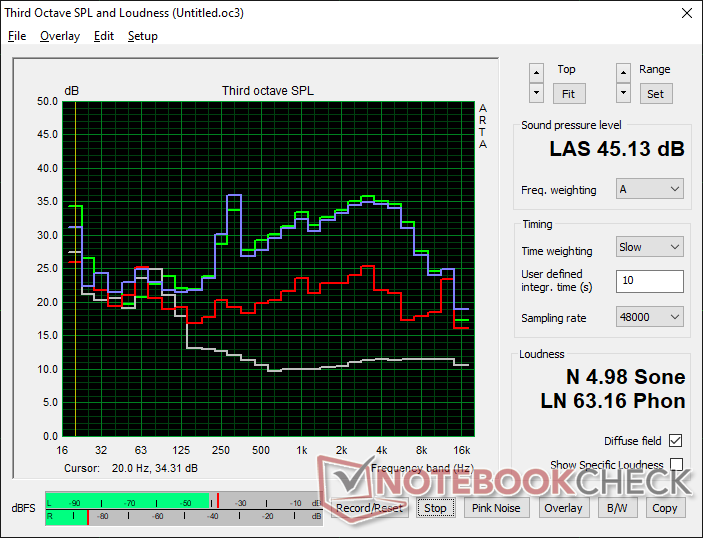
Barulho
| Ocioso |
| 34.2 / 34.2 / 34.2 dB |
| Carga |
| 44.6 / 45.1 dB |
 | ||
30 dB silencioso 40 dB(A) audível 50 dB(A) ruidosamente alto |
||
min: | ||
| Beelink GTR5 Vega 8, R9 5900HX, Kingston NV1 SNVS/500GCN | Beelink GTI 11 Iris Xe G7 80EUs, i5-1135G7, Kingston SA2000M8500G | GMK NucBox 2 Iris Plus Graphics 655, i5-8259U, Netac S930E8/256GPN | Intel NUC11PHKi7C GeForce RTX 2060 Mobile, i7-1165G7, Samsung SSD 980 Pro 500GB MZ-V8P500BW | Intel NUC11PAQi7 Iris Xe G7 96EUs, i7-1165G7, Samsung SSD 980 Pro 500GB MZ-V8P500BW | Beelink GK Mini UHD Graphics 600, Celeron J4125, Silicon Motion SM2258XT 256GB | |
|---|---|---|---|---|---|---|
| Noise | -4% | 18% | 13% | 12% | 1% | |
| desligado / ambiente * (dB) | 23.1 | 25.7 -11% | 25.6 -11% | 24.5 -6% | 25.6 -11% | 24.6 -6% |
| Idle Minimum * (dB) | 34.2 | 28.4 17% | 25.7 25% | 25.3 26% | 25.6 25% | 36.9 -8% |
| Idle Average * (dB) | 34.2 | 32 6% | 25.7 25% | 25.3 26% | 25.6 25% | 36.9 -8% |
| Idle Maximum * (dB) | 34.2 | 37.7 -10% | 25.7 25% | 25.3 26% | 25.6 25% | 36.9 -8% |
| Load Average * (dB) | 44.6 | 44.2 1% | 35.3 21% | 36.4 18% | 33.6 25% | 37 17% |
| Witcher 3 ultra * (dB) | 41.4 | 44.5 -7% | 39.7 4% | 33.6 19% | ||
| Load Maximum * (dB) | 45.1 | 56 -24% | 35.1 22% | 47.9 -6% | 54.5 -21% | 37 18% |
* ... menor é melhor
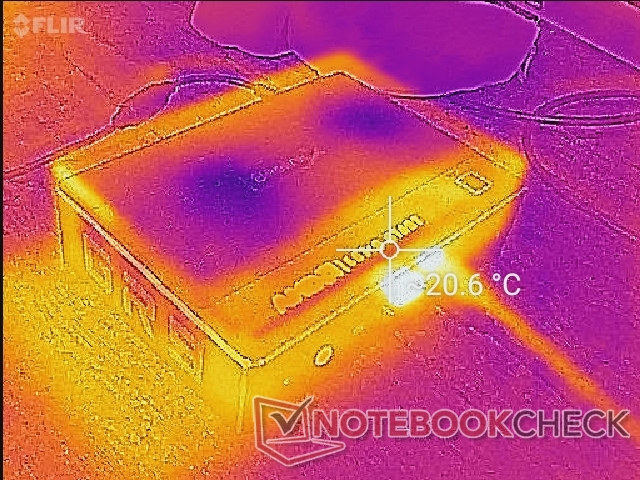
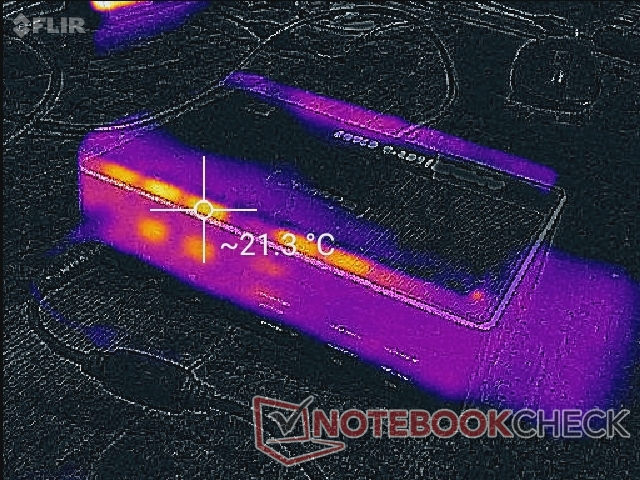
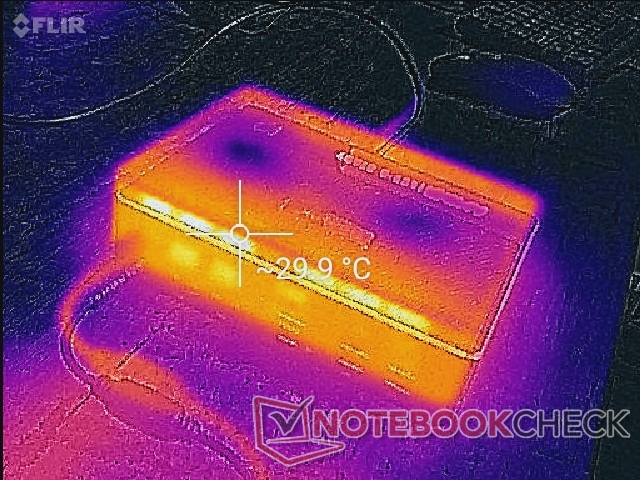
Temperatura
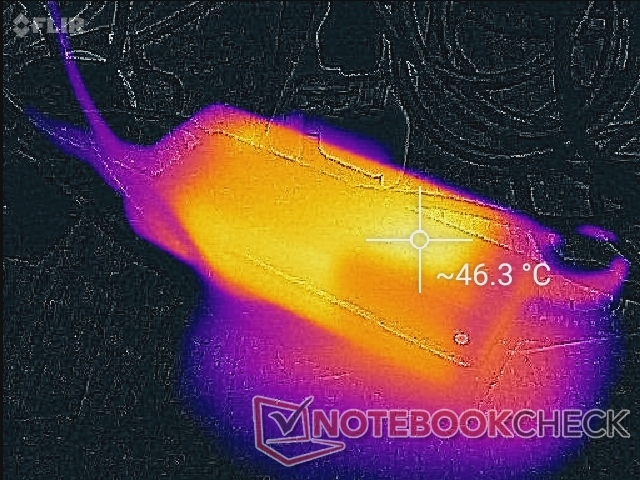
As temperaturas de superfície não são um problema, especialmente porque toda a parte superior da unidade é um respiradouro para a entrada de ar. Como resultado, não é recomendado colocar quaisquer papéis ou livros em cima do mini PC. Se posicionar a unidade verticalmente, certifique-se de não pressionar a parte superior do mini PC contra quaisquer paredes ou prateleiras para preservar o fluxo de ar.
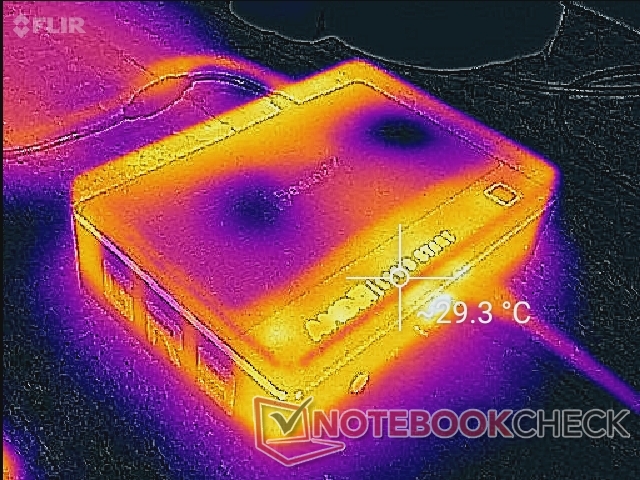
Teste de estresse
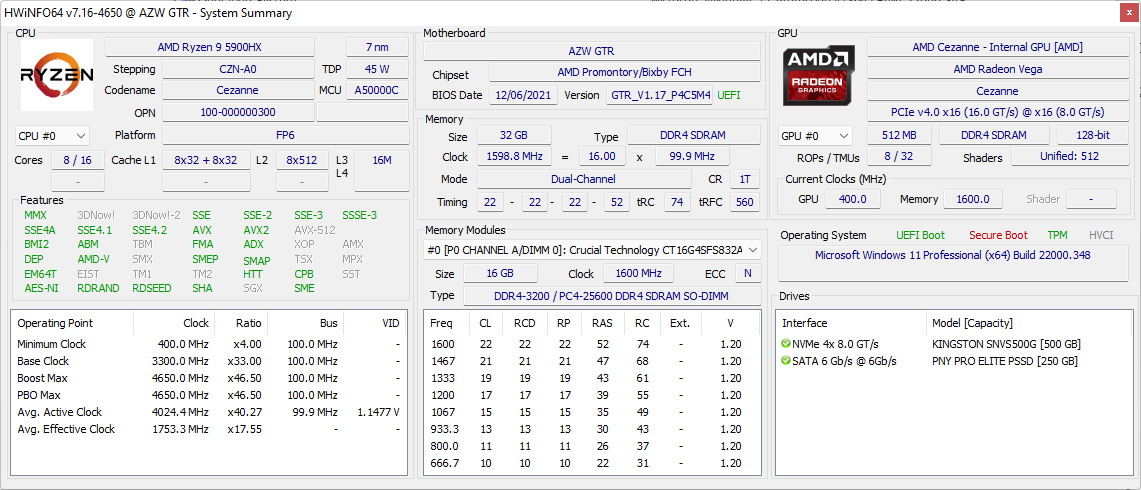
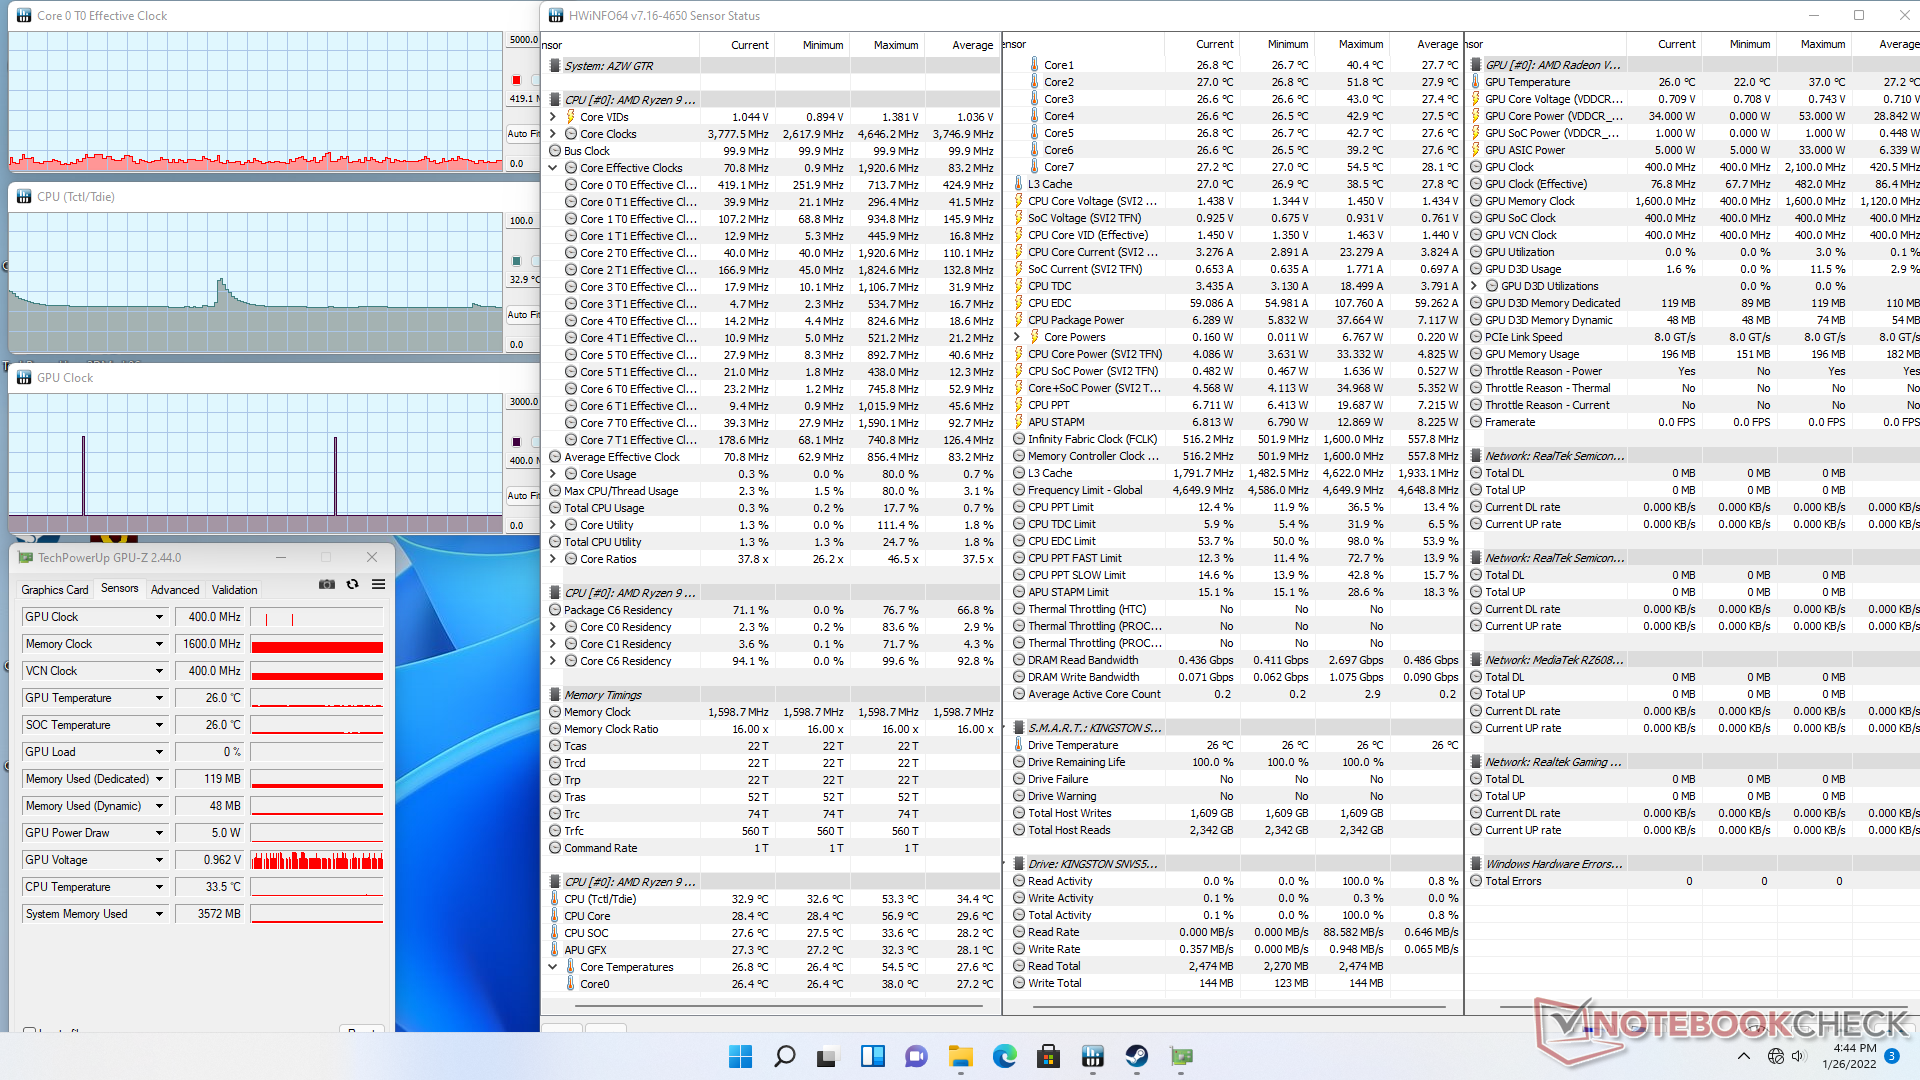
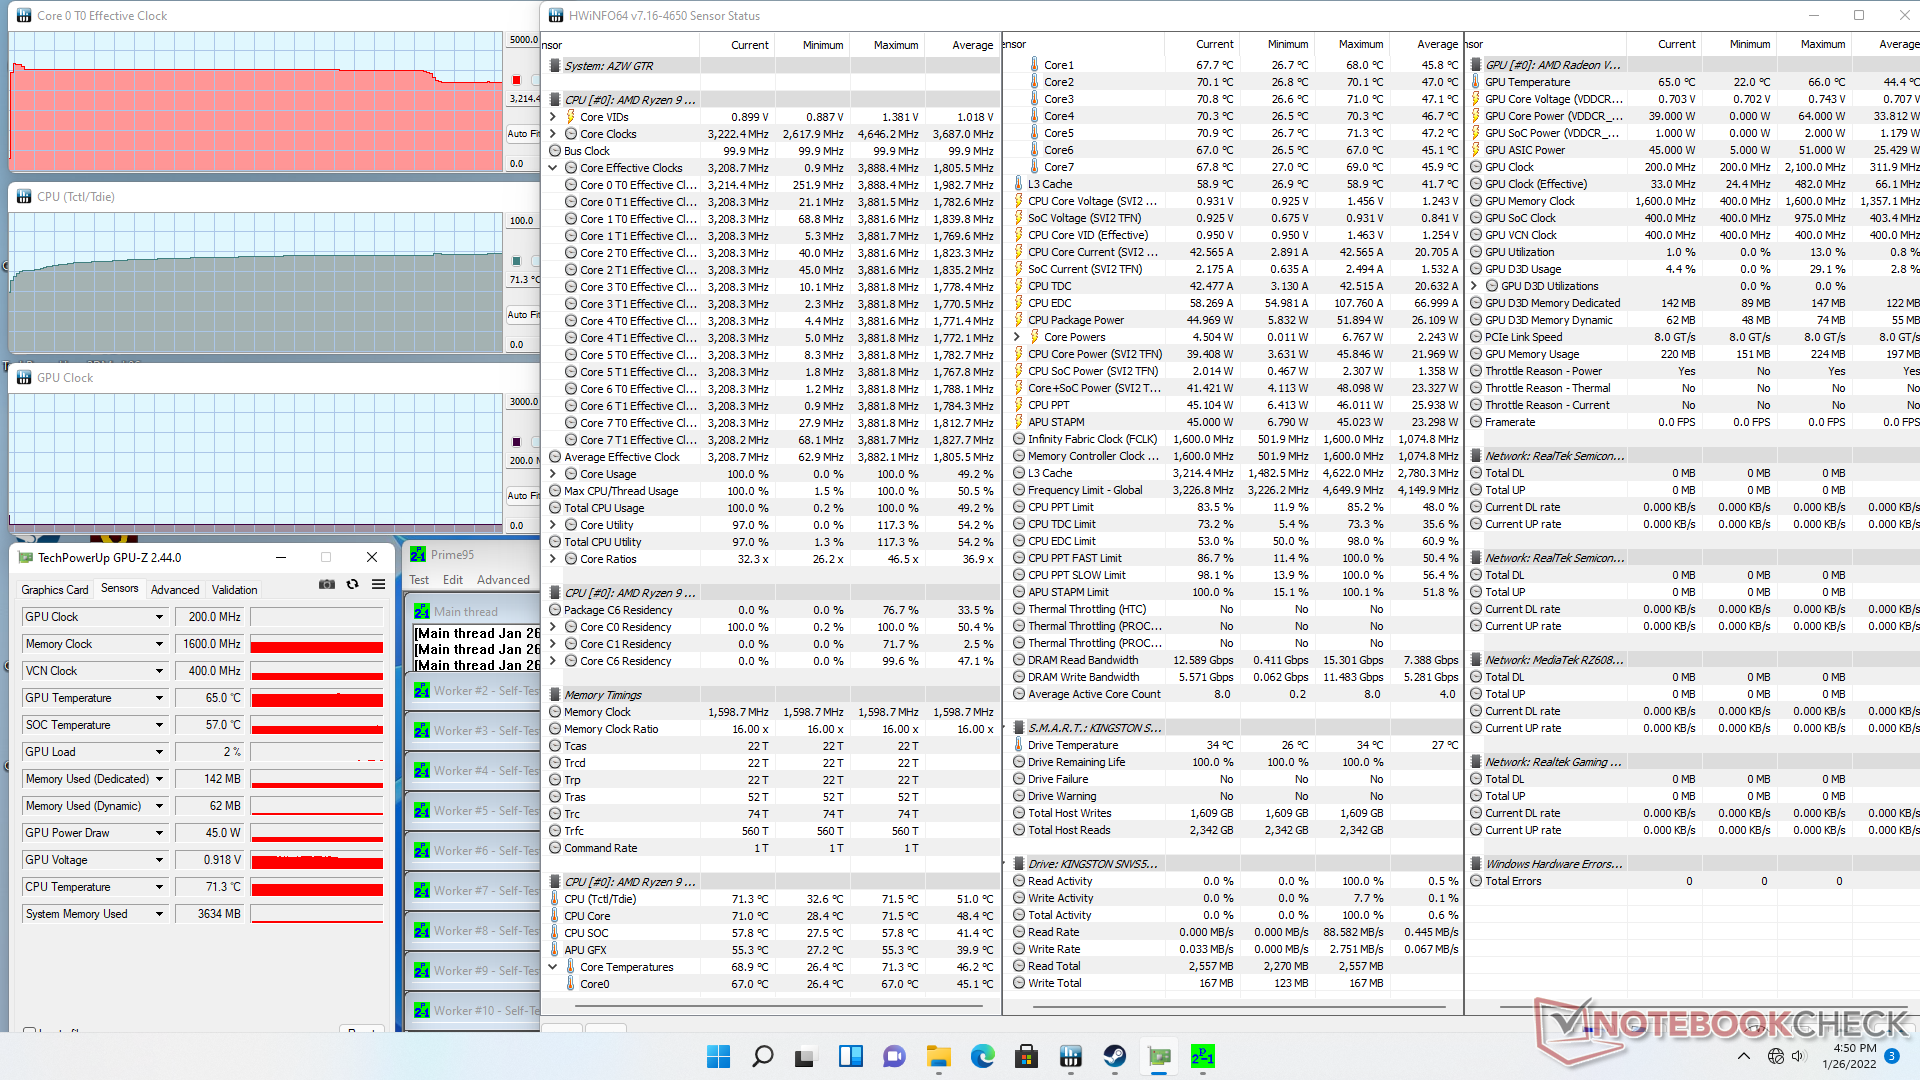
Ao executar Prime95 para enfatizar a CPU em configurações de BIOS de estoque, as taxas de relógio aumentariam para 3,9 GHz nos primeiros segundos antes de cair ligeiramente para 3,8 GHz mais estáveis. A temperatura central (Tctl/Tdie) se estabilizaria em 74 C para deixar espaço suficiente para o overclocking. O TDP da CPU parece estar a 55 W durante o início do teste antes de se estabelecer em 45 W de acordo com HWiNFO.
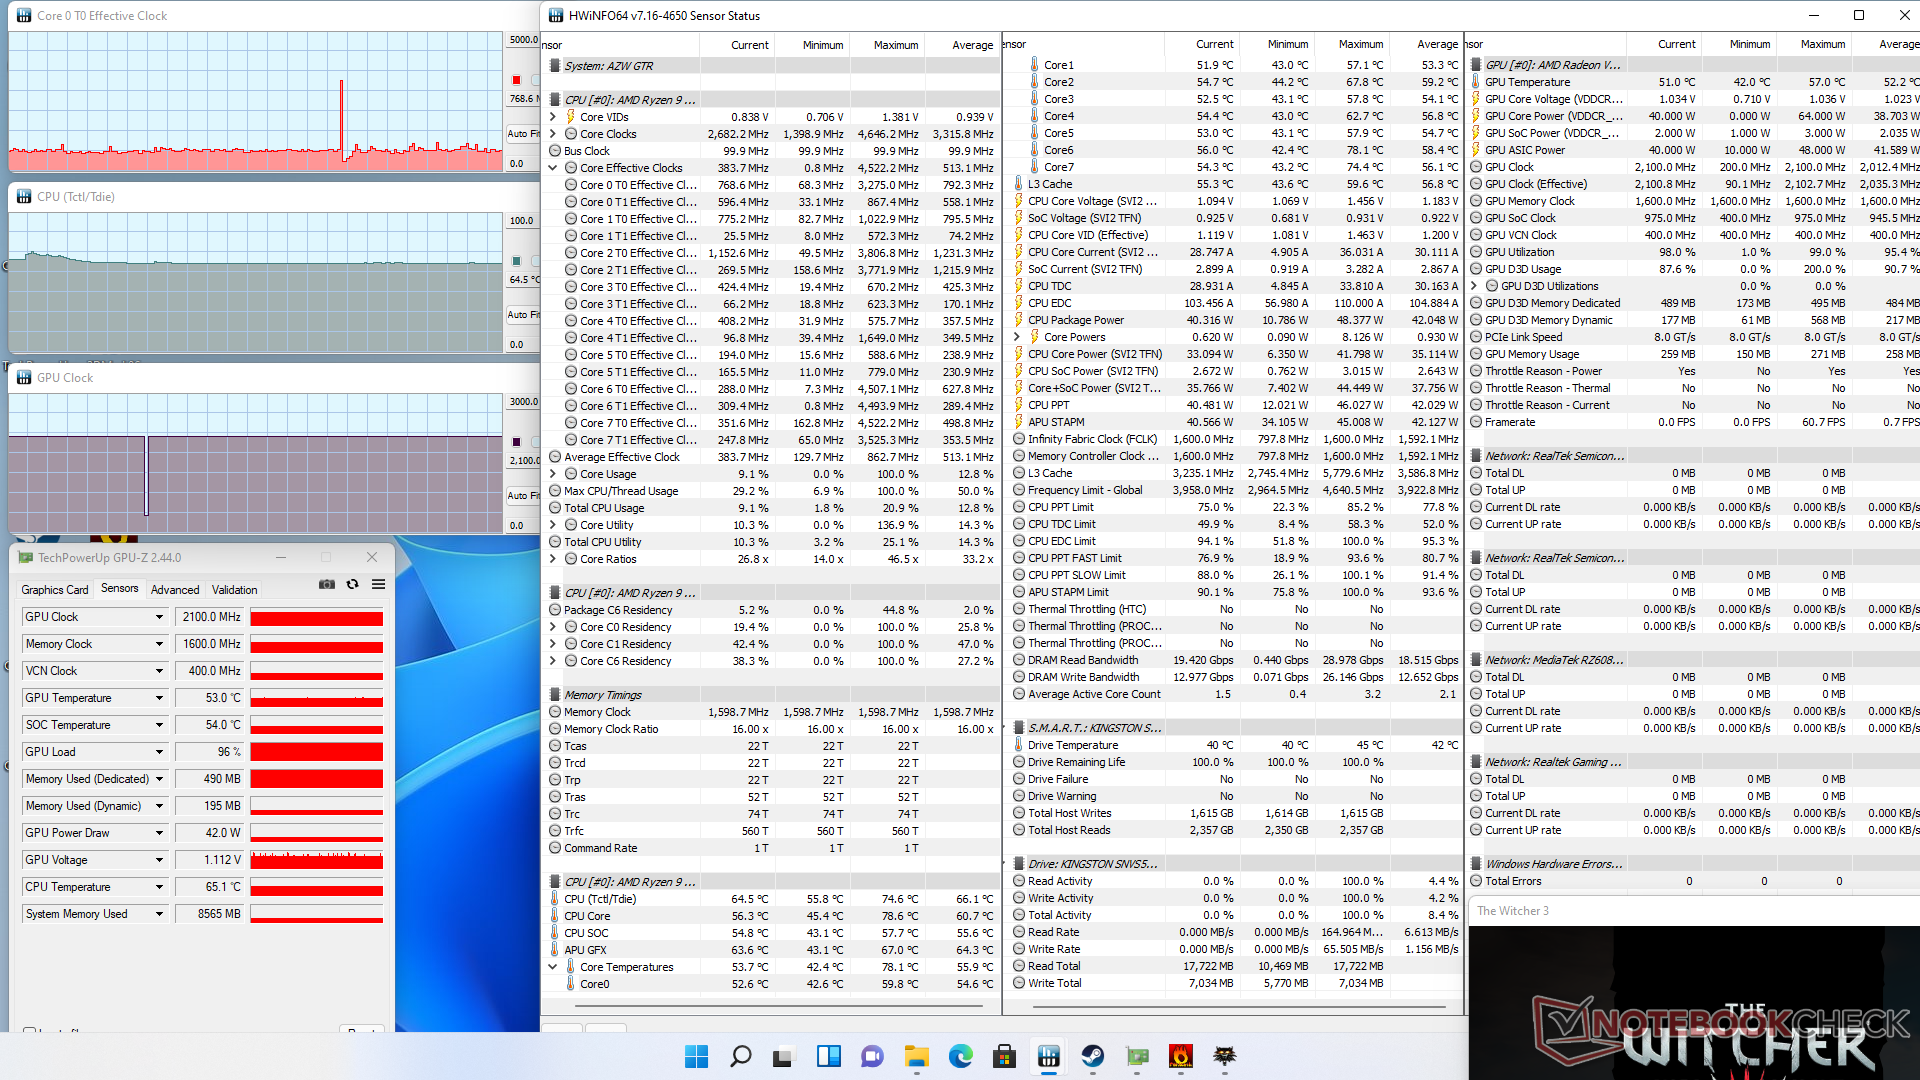
Ao rodar Witcher 3 para representar o estresse dos jogos, a GPU integrada se estabilizaria em 2100 MHz e a uma temperatura central da CPU (Tctl/Tdie) de 65 C. Executando este mesmo teste no Beelink GTI11 equipado com o Core i5-1135G7 menos exigente teria resultados de temperatura semelhantes.
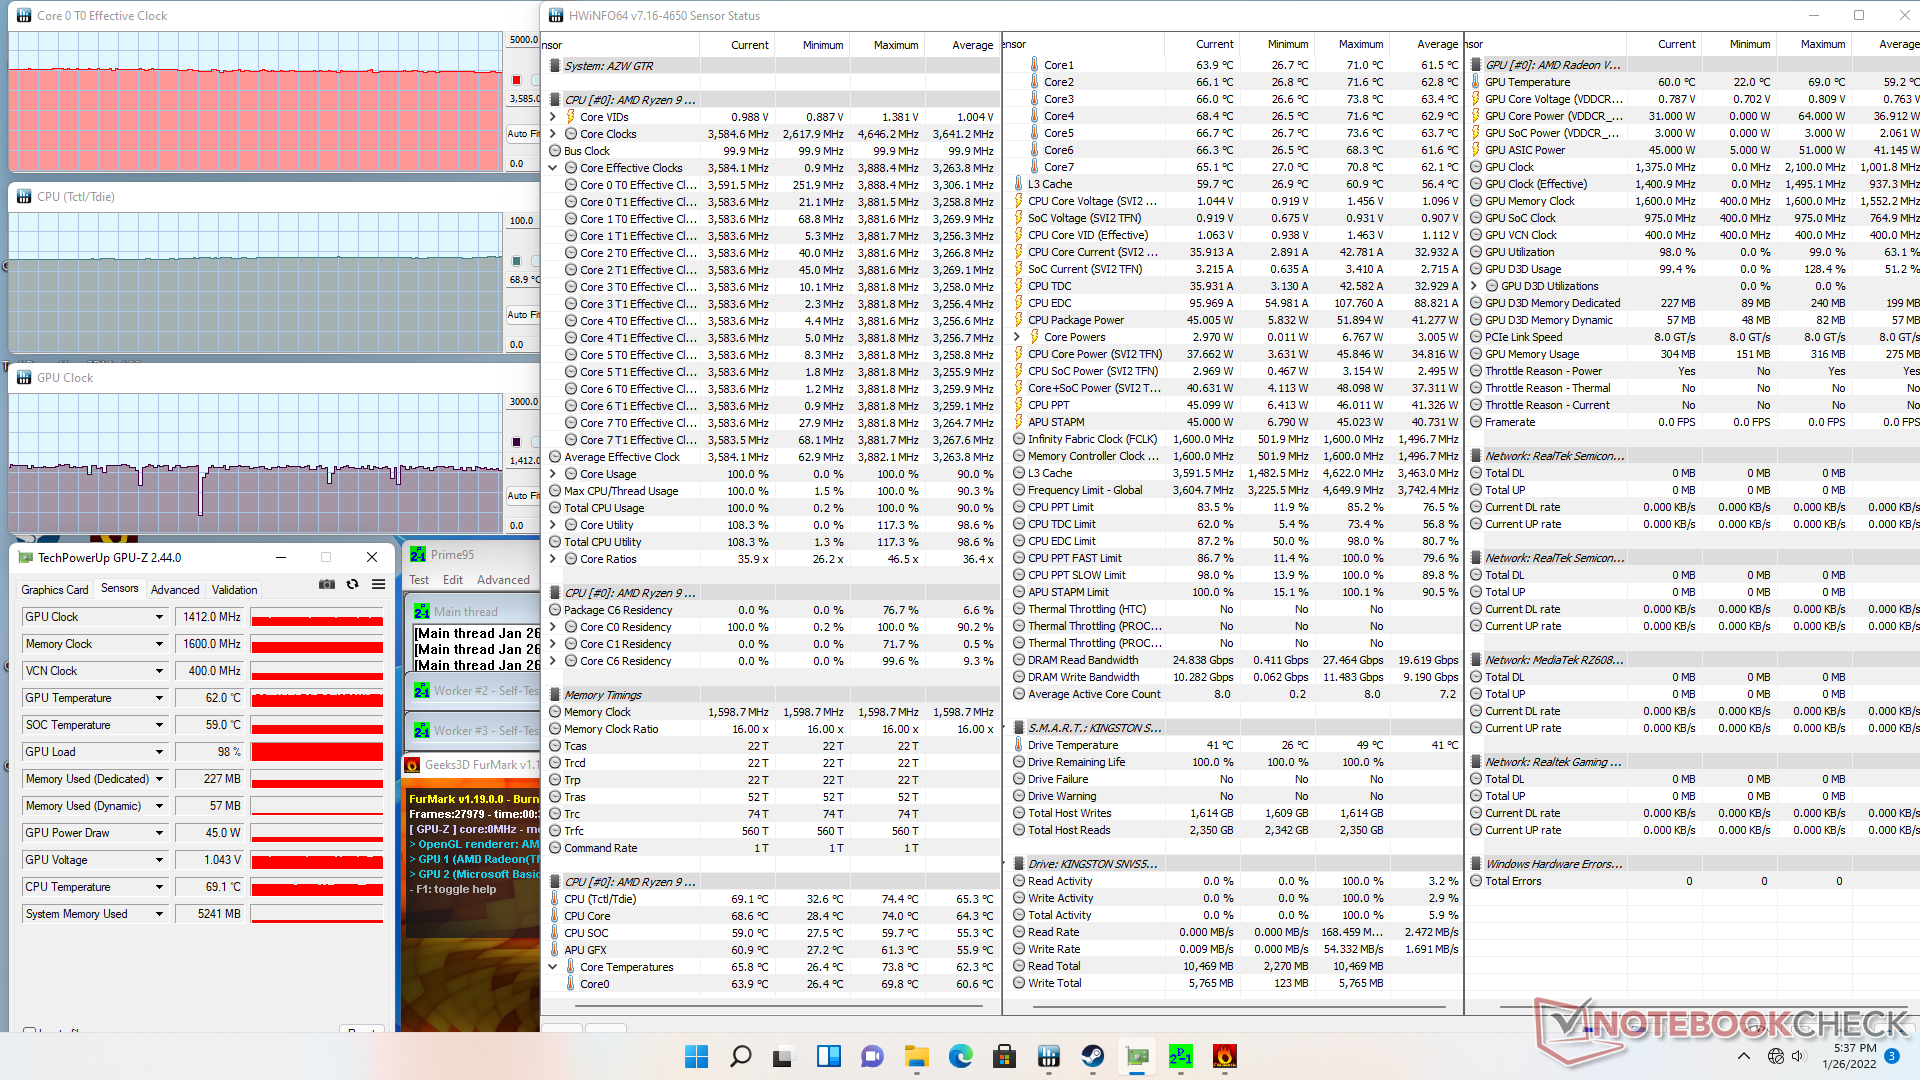
| Relógio CPU (GHz) | Relógio GPU (MHz) | Temperatura média da CPU Tctl/Tdie (°C) | |
| System Idle | -- | -- | 33 |
| Prime95 Stress | 3.8 | -- | 74 |
| Prime95 + FurMark Stress | 3.6 | 1412 | 69 |
| Witcher 3 Stress | ~0.8 | 2100 | 65 |
Gestão de energia
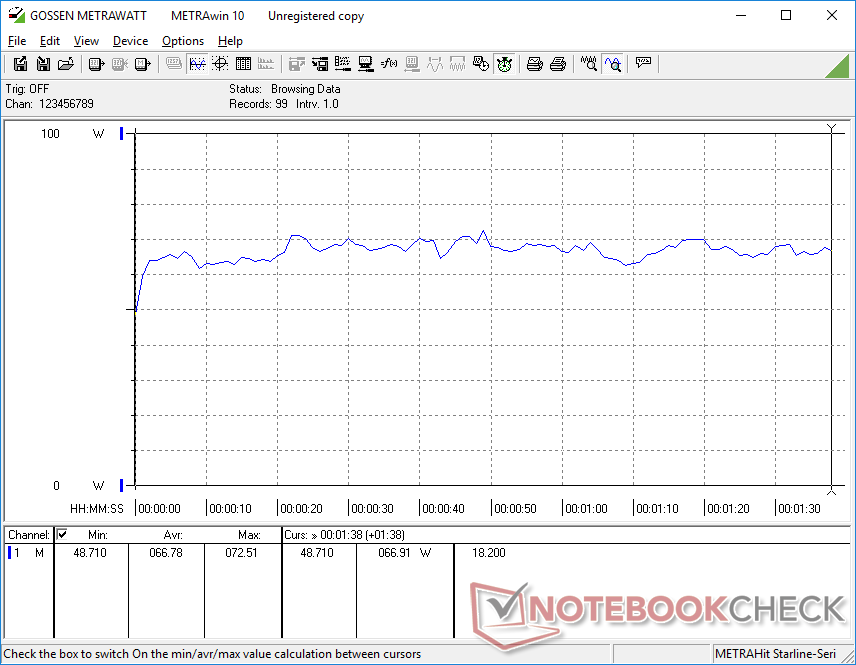
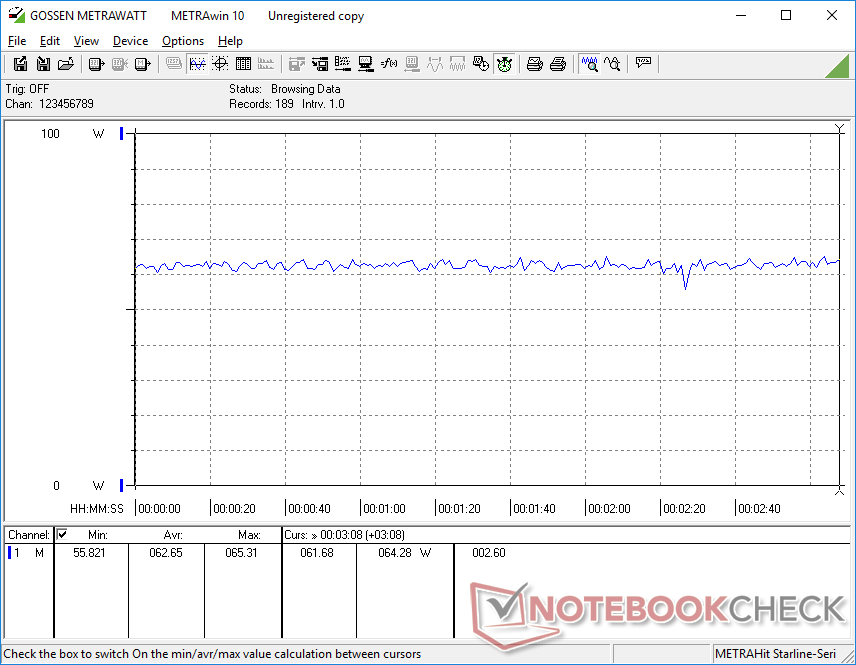
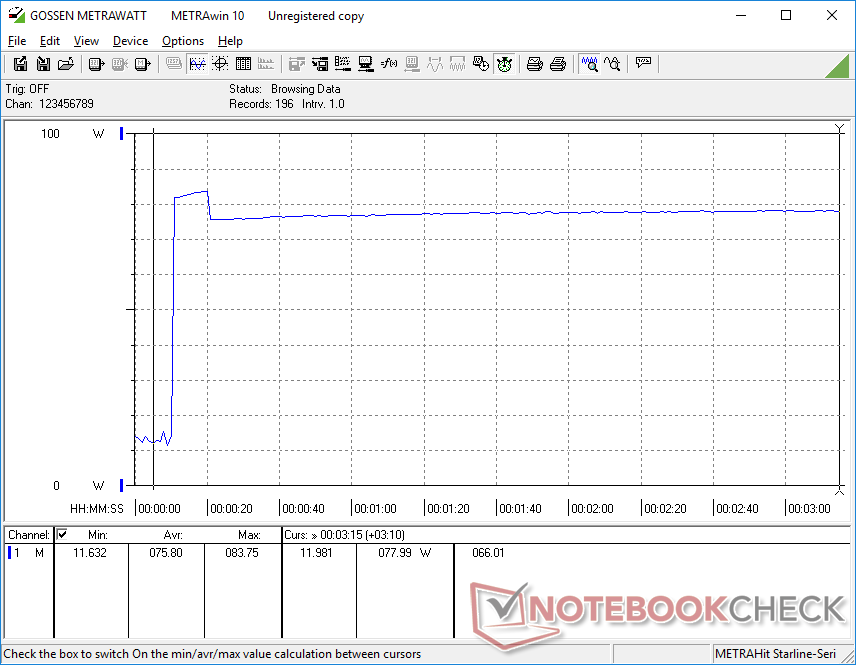
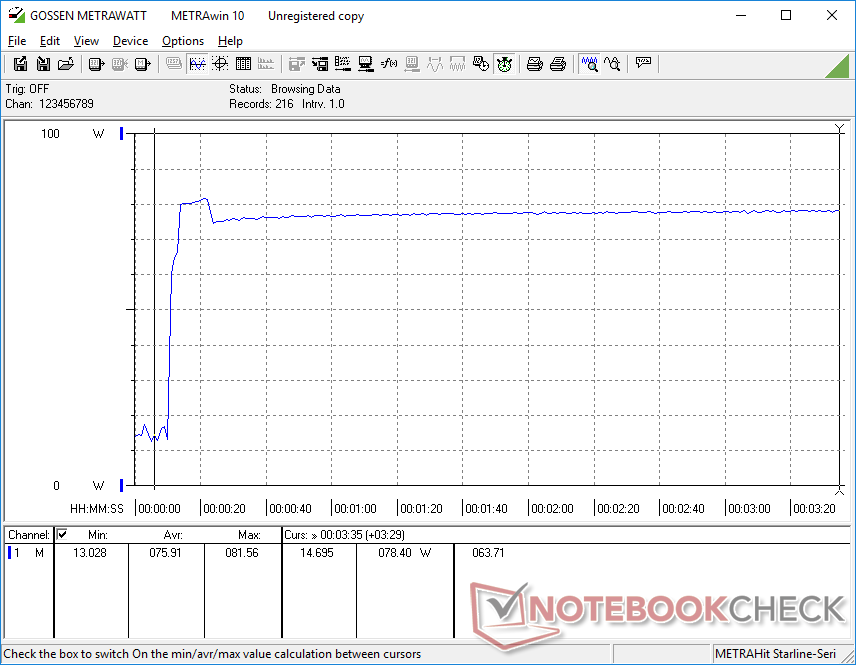
Consumo de energia
Correr com cargas maiores como jogos consumirá cerca de 2x mais energia do que o Core i7-powered Intel NUC11PAQi7 apesar do desempenho gráfico ligeiramente inferior de nosso Radeon RX Vega 8. Os proprietários do GTR5 ainda estariam obtendo aproximadamente 70 por cento mais rápido desempenho de CPU multi-fio, o que pode compensar seu consumo de energia comparativamente maior
Somos capazes de registrar um consumo máximo de 82 W a partir do pequeno (12,5 x 5 x 3 cm) adaptador CA de 90 W ao executar cargas extremas Prime95 e FurMark.
| desligado | |
| Ocioso | |
| Carga |
|
Key:
min: | |
| Beelink GTR5 R9 5900HX, Vega 8, Kingston NV1 SNVS/500GCN, , x, | Beelink GTI 11 i5-1135G7, Iris Xe G7 80EUs, Kingston SA2000M8500G, , x, | GMK NucBox 2 i5-8259U, Iris Plus Graphics 655, Netac S930E8/256GPN, , x, | Intel NUC11PHKi7C i7-1165G7, GeForce RTX 2060 Mobile, Samsung SSD 980 Pro 500GB MZ-V8P500BW, , x, | Intel NUC11PAQi7 i7-1165G7, Iris Xe G7 96EUs, Samsung SSD 980 Pro 500GB MZ-V8P500BW, , x, | Beelink GK Mini Celeron J4125, UHD Graphics 600, Silicon Motion SM2258XT 256GB, , x, | |
|---|---|---|---|---|---|---|
| Power Consumption | -48% | 23% | -85% | 29% | 66% | |
| Idle Minimum * (Watt) | 6.2 | 15.2 -145% | 6.1 2% | 5.8 6% | 5.6 10% | 3.2 48% |
| Idle Average * (Watt) | 8.9 | 16 -80% | 6.8 24% | 5.9 34% | 5.6 37% | 3.3 63% |
| Idle Maximum * (Watt) | 9 | 16 -78% | 7.3 19% | 20.7 -130% | 6 33% | 3.7 59% |
| Load Average * (Watt) | 66.8 | 48.6 27% | 46.3 31% | 130.8 -96% | 31.4 53% | 13.6 80% |
| Witcher 3 ultra * (Watt) | 62.6 | 53.8 14% | 154.4 -147% | 39 38% | ||
| Load Maximum * (Watt) | 81.6 | 104.3 -28% | 50.7 38% | 225.2 -176% | 80.5 1% | 17.8 78% |
* ... menor é melhor
Power Consumption Witcher 3 / Stresstest
Power Consumption external Monitor
Pro
Contra
Veredicto - Tudo sobre esse Processador
Qualquer PC com o Ryzen 9 5900HX vai ser insanamente rápido pelo preço e o GTR5 Beelink não é exceção. O processador AMD rivaliza com qualquer solução móvel Intel do 11º gênero em desempenho de CPU bruta, incluindo a mais cara Núcleo i9-11900H. Se você quiser maximizar o desempenho do processador mantendo o sistema o menor possível, então o GTR5 será sua melhor aposta
Para um desempenho máximo da CPU a um custo e tamanho mínimos, não procure mais do que o GTR5 Beelink.
Há duas desvantagens principais a ter em mente. Primeiro, os gráficos são limitados pela GPU integrada Radeon Vega 8, enquanto a maioria dos laptops com a mesma CPU normalmente viria com gráficos discretos mais rápidos. Os usuários quase certamente estarão vinculados à GPU quando executarem aplicações mais intensivas, como edição gráfica ou jogos. É uma pena que o Thunderbolt não seja suportado, o que teria abordado esta limitação via eGPUs. Em segundo lugar, o ruído do ventilador é mais alto do que a maioria dos outros mini PCs como resultado direto do enchimento de um processador tão rápido em um chassi de tamanho tão pequeno. Assim, o GTR5 pode não ser a melhor escolha para configurações de HTPC ou sala de conferência onde o ruído ambiente deve ser mantido a um mínimo. Talvez uma mudança para o resfriamento da câmara de vapor no futuro possa reduzir o ruído geral do ventilador. Os caçadores de desempenho de CPU com orçamentos mais apertados ficarão impressionados com o que o GTR5 tem a oferecer.
Preço e Disponibilidade
O Beelink GTR5 ainda não está amplamente disponível. Sua página Indiegogo pode ser encontrada aqui.
Price comparison

