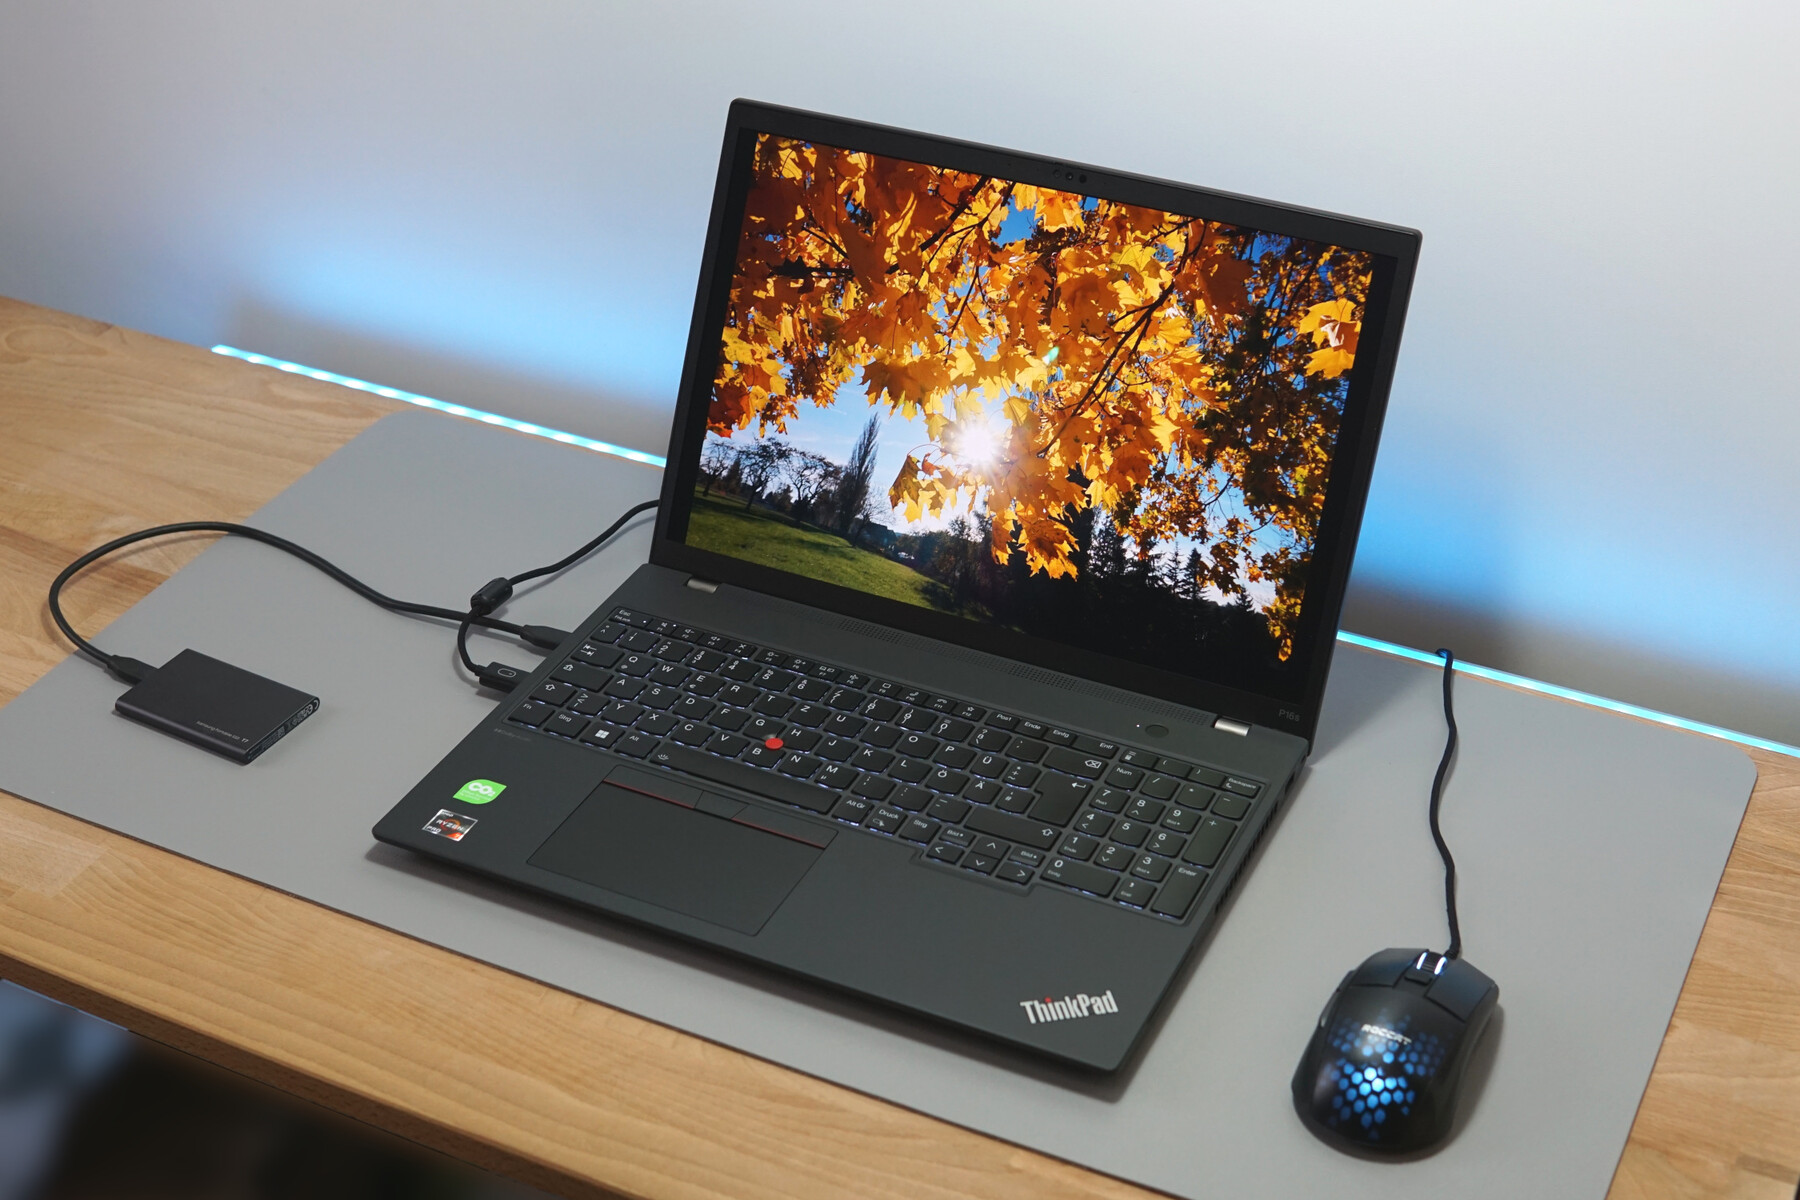
Análise do Lenovo ThinkPad P16s G2 AMD: Potência e OLED dentro deste laptop para estação de trabalho

Embora um chip de segurança adicional, a opção de realizar manutenção remota e um leitor de SmartCard possam ser de interesse apenas de clientes corporativos, a potência, o desempenho gráfico, a longa duração e a bela tela do laptop devem despertar o interesse do público em geral. Seu poderoso AMD Ryzen 7 Pro 7840U chama a atenção em particular.
Isso torna o ThinkPad P16s G2 adequado para trabalhar em casa, em trânsito, na universidade ou até mesmo para criativos. Além disso, não foi necessário instalar uma tela OLED e sua RAM e SSD oferecem uma boa variedade de opções de configuração para quase todos os campos de uso. Por sua vez, seus recursos visuais podem ser descritos como bastante conservadores, mas isso não precisa ser um ponto negativo.
Ao mesmo tempo, concorrentes comparáveis, como o Microsoft Surface Laptop Studio 2 ou o HP EliteBook 845 G10 têm designs um pouco mais arrojados. Nossa análise mostrará se eles são melhores ou piores ou simplesmente diferentes, e se o ThinkPad P16s G2 ainda tem espaço para crescer.
Possíveis concorrentes em comparação
Avaliação | Data | Modelo | Peso | Altura | Size | Resolução | Preço |
|---|---|---|---|---|---|---|---|
| 88.6 % v7 (old) | 01/2024 | Lenovo ThinkPad P16s G2 21K9000CGE R7 PRO 7840U, Radeon 780M | 1.8 kg | 24.4 mm | 16.00" | 3840x2400 | |
| 90.1 % v7 (old) | 08/2023 | HP EliteBook 845 G10 818N0EA R9 PRO 7940HS, Radeon 780M | 1.5 kg | 17.9 mm | 14.00" | 2560x1600 | |
| 87.8 % v7 (old) | 01/2024 | Lenovo ThinkPad P14s G4 21K5000LGE R7 PRO 7840U, Radeon 780M | 1.3 kg | 21.8 mm | 14.00" | 1920x1200 | |
| 88.6 % v7 (old) | 08/2023 | Schenker Vision 16 PH6PRX1 i7-13700H, Iris Xe G7 96EUs | 1.5 kg | 17.1 mm | 16.00" | 2560x1600 | |
| 88.6 % v7 (old) | 10/2023 | Acer Swift Edge SFE16 Ryzen 7 7840U R7 7840U, Radeon 780M | 1.2 kg | 13 mm | 16.00" | 3200x2000 | |
| 86.2 % v7 (old) | 01/2024 | Lenovo ThinkPad P16v G1 AMD R7 PRO 7840HS, RTX A1000 Laptop GPU | 2.3 kg | 24.7 mm | 16.00" | 1920x1200 | |
| 85.5 % v7 (old) | 10/2023 | Microsoft Surface Laptop Studio 2 RTX 4060 i7-13700H, GeForce RTX 4060 Laptop GPU | 2 kg | 22 mm | 14.40" | 2400x1600 |
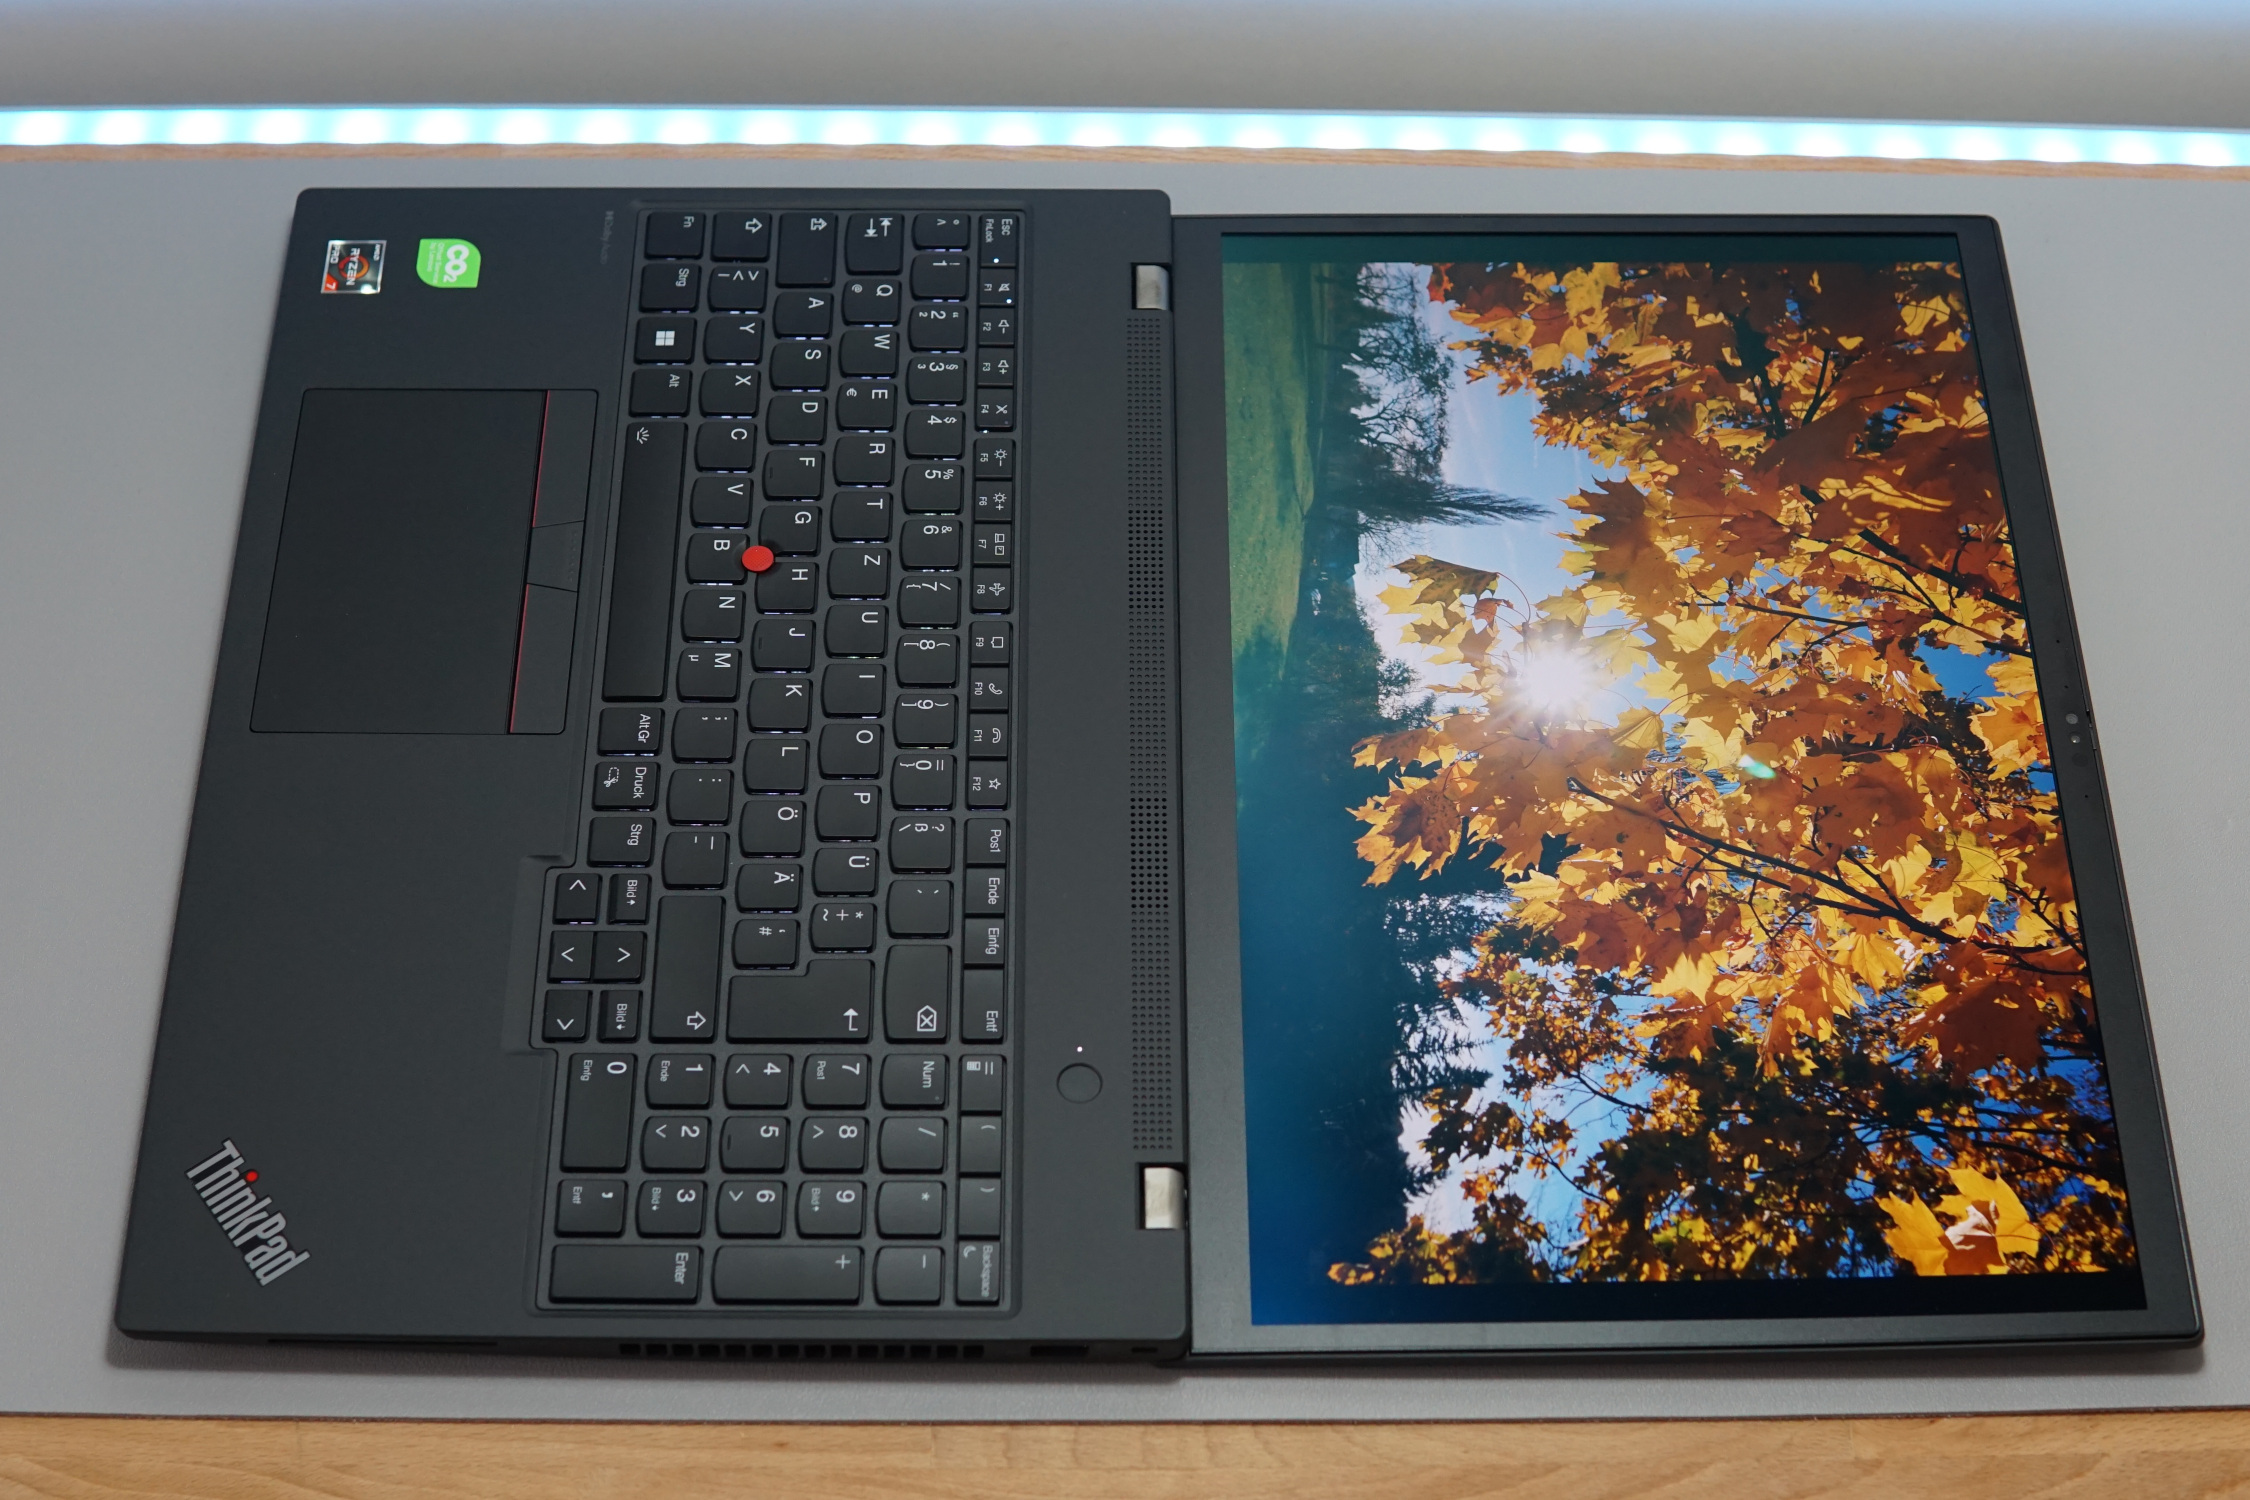
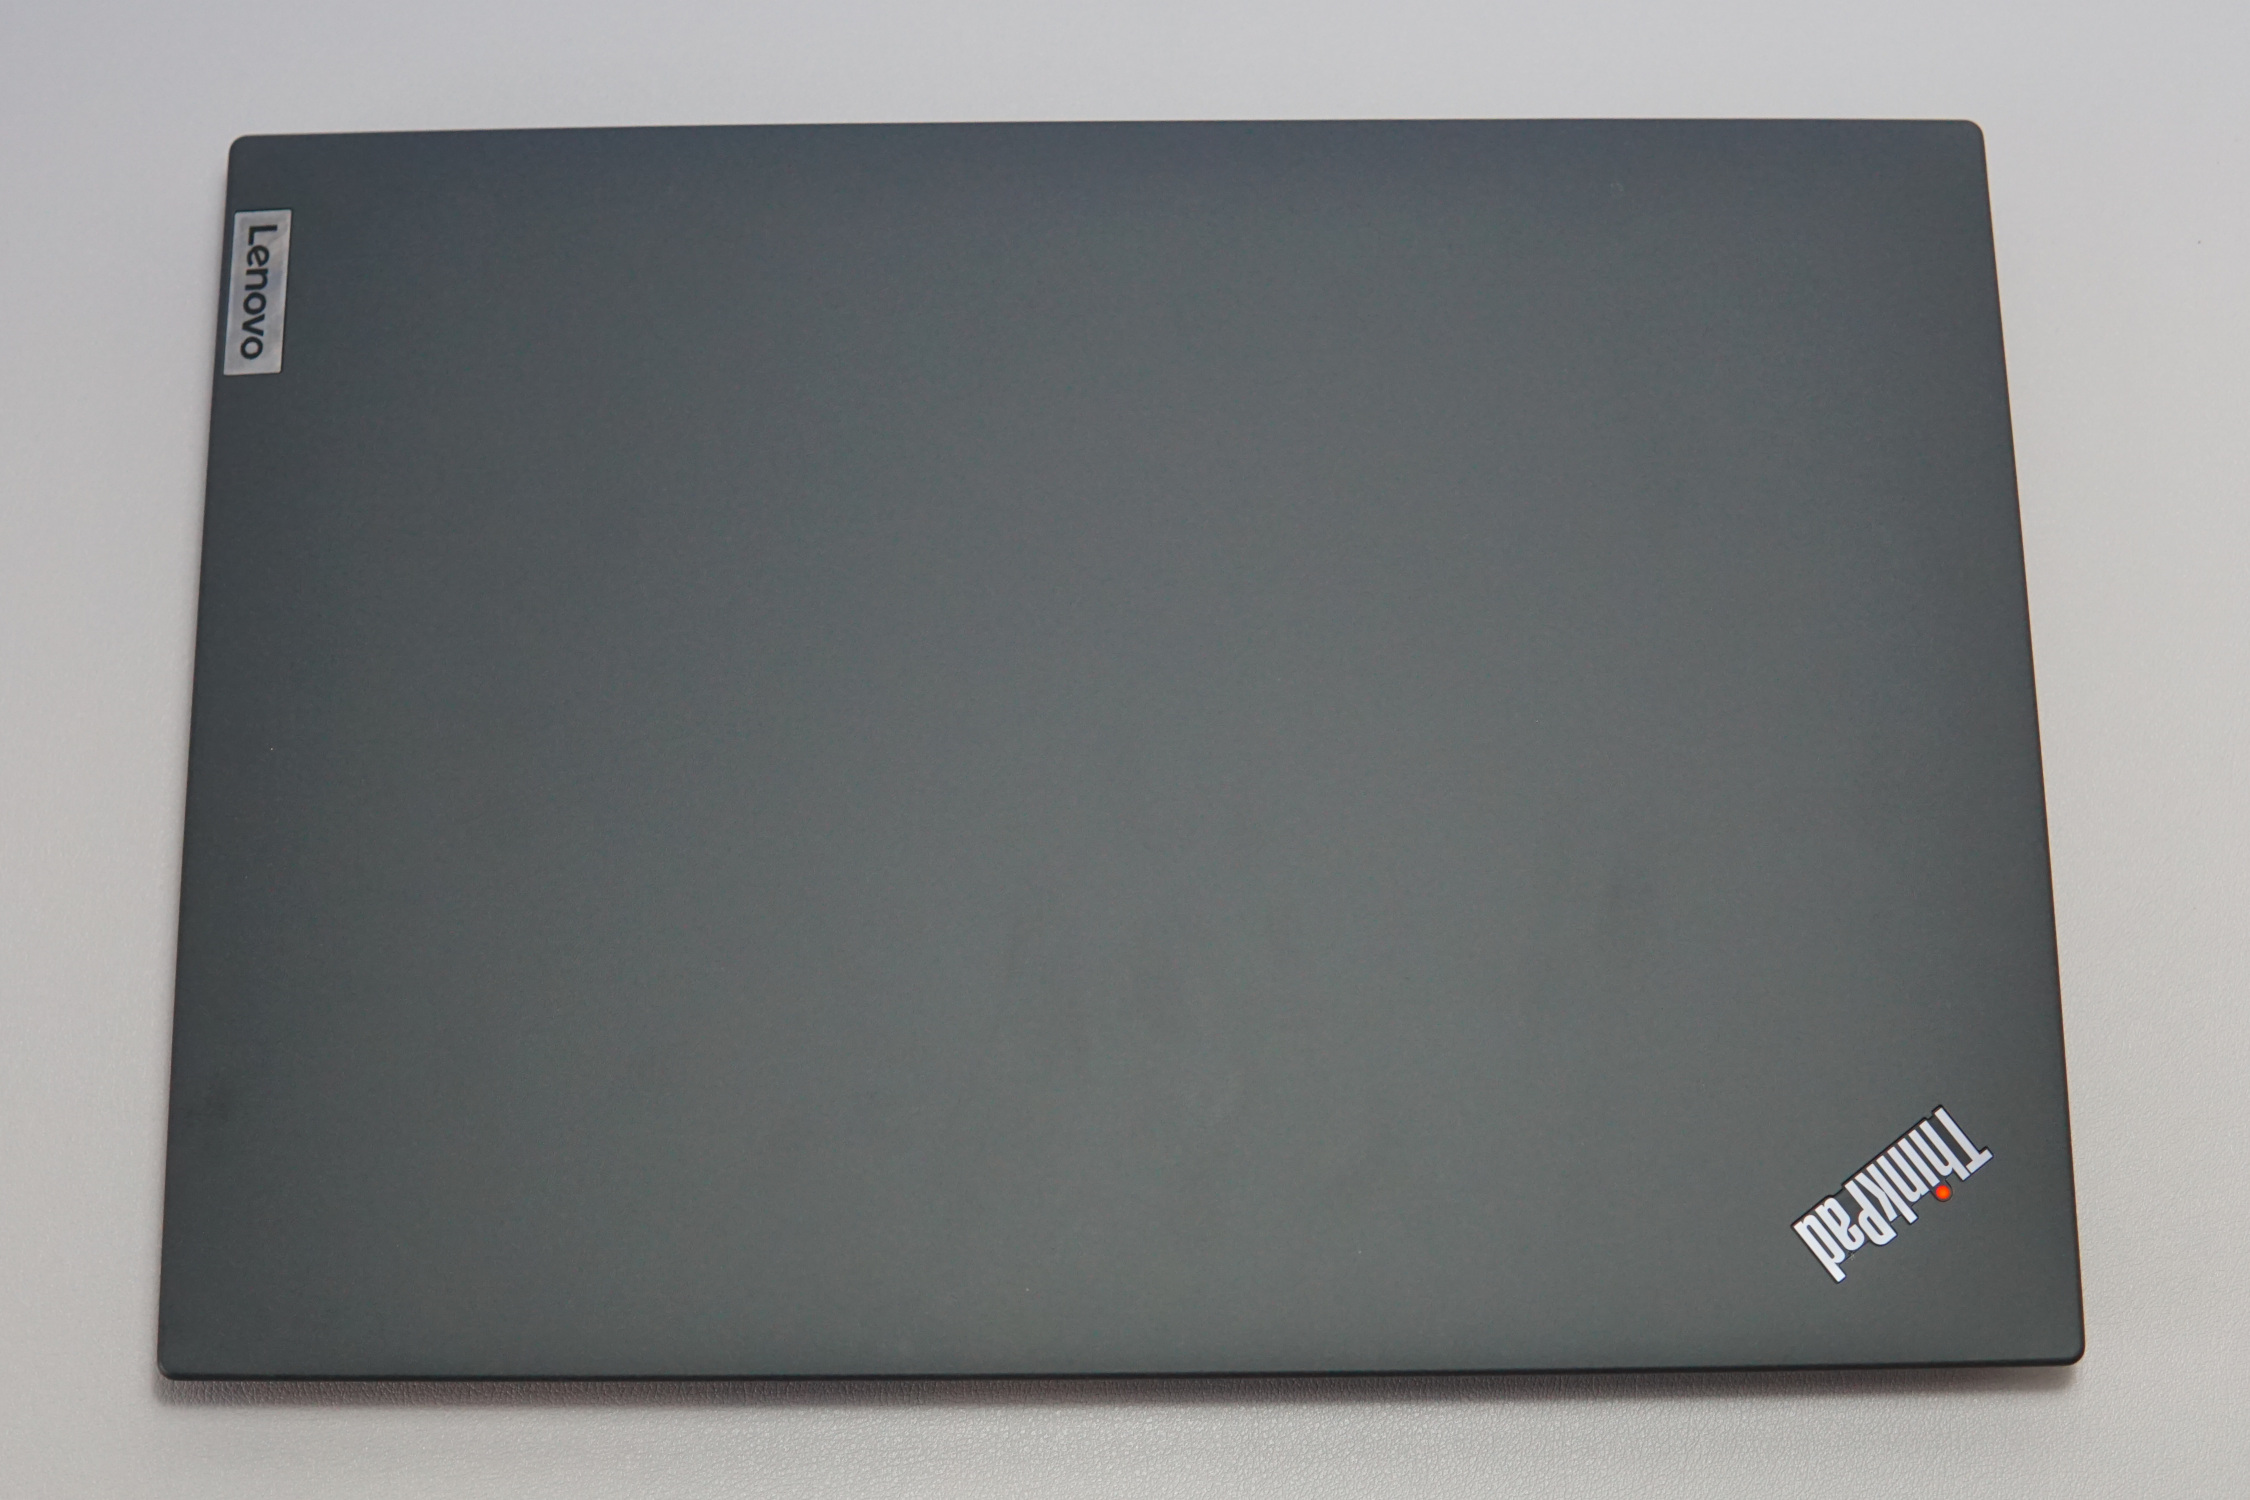
Case - O ThinkPad cinza e robusto
Superfície texturizada, gabinete cinza escuro: O visual do ThinkPad pode ser identificado a uma milha de distância. E, como sempre, o ponto acima do "I" é iluminado. Ele não parece elegante e de forma alguma é moderno. Em vez disso, ele parece robusto e durável. Dobradiças firmes que seguram a tela de 16 polegadas em qualquer ângulo e uma tampa que se fecha quase perfeitamente consolidam ainda mais essa impressão de alta qualidade e estabilidade - mesmo sem haver nenhum componente de metal no gabinete externo.
Naturalmente, a tela relativamente grande pode ser girada levemente. A base, por outro lado, permanece totalmente estável em todas as situações. Também não conseguimos extrair nenhum ruído do gabinete. Afinal de contas, trata-se de um laptop de trabalho que nem sempre será manuseado com cuidado.

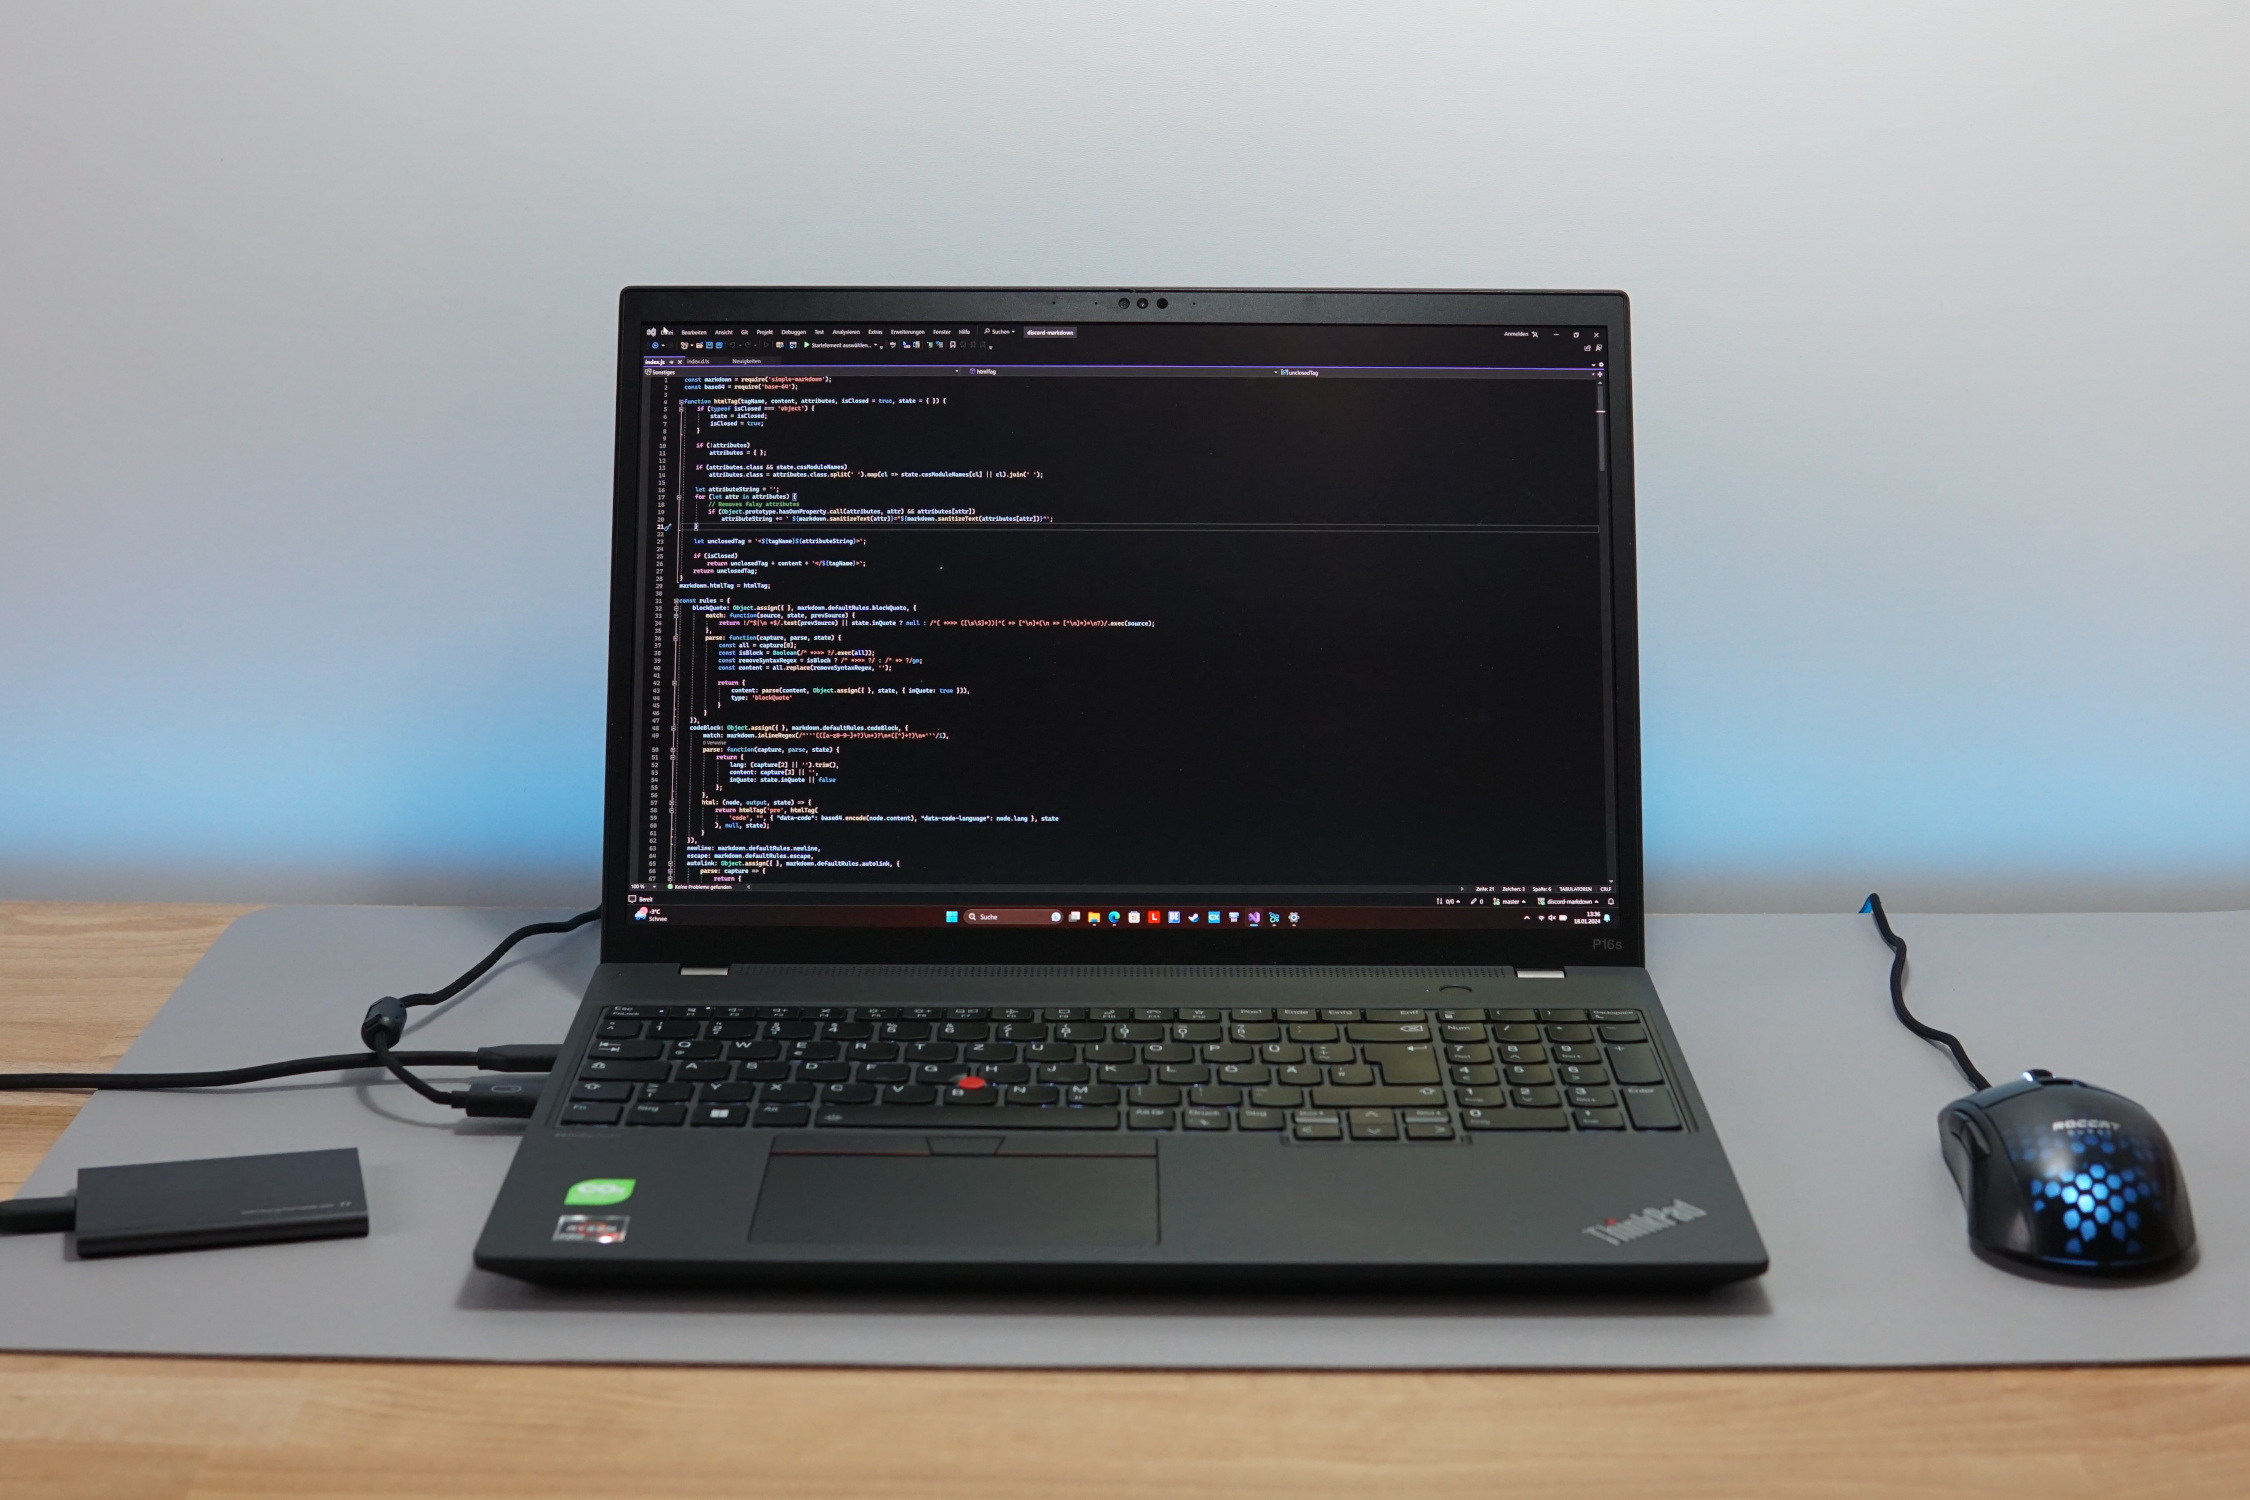
O tamanho e o peso do dispositivo mostram de onde vem a estabilidade. Para um laptop sem uma placa de vídeo dedicada e totalmente feito de plástico, 1,8 kg é certamente digno de nota. Mais ainda é a espessura da caixa, que mede quase 24 milímetros. A configuração quase idêntica do Acer Swift Edge SFE16 com configuração quase idêntica, tem cerca de metade da espessura e pesa 500 gramas a menos. Por sua vez, ele parece um pouco mais frágil do que o ThinkPad P16s.
Além disso, um gabinete espesso tem mais algumas vantagens, sobre as quais falaremos na seção "desempenho".
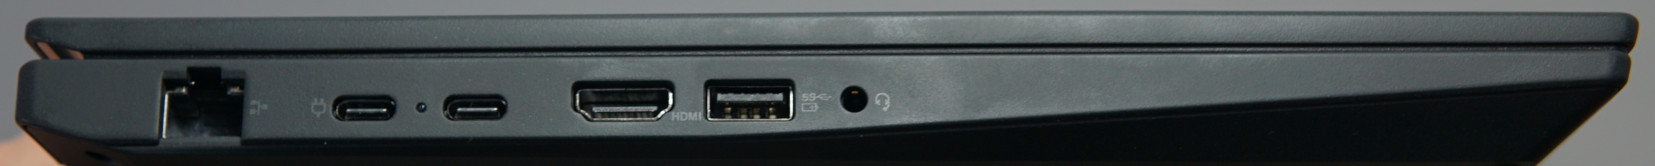
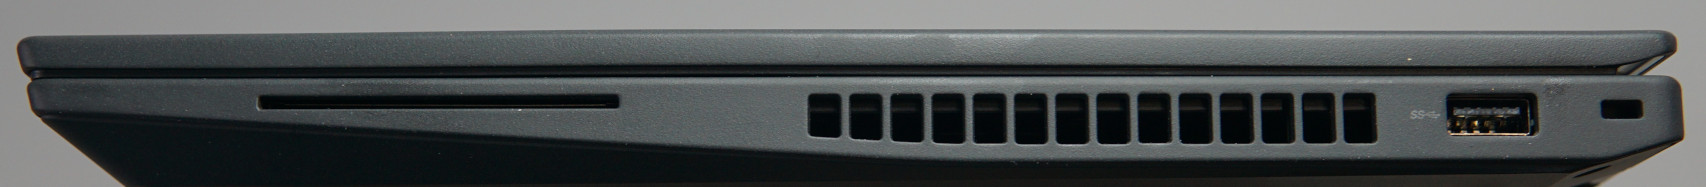
Conectividade - Luz e um pouco de sombra no P16s
A seleção de opções de conectividade do laptop parece ser boa em geral. Ele apresenta uma porta LAN de tamanho normal sem aba ou adaptador. Há uma porta USB-4 rápida e um total de quatro portas USB flexíveis, o que oferece muitas opções para periféricos. Uma porta HMDI também está instalada.
Por outro lado, apenas uma porta USB-4 não é o ideal. Normalmente, a estação de acoplamento deve estar conectada a ela para que o senhor possa acessar o desempenho total do notebook. A segunda porta USB-C pelo menos suporta carregamento, bem como DisplayPort, mas apenas a um quarto das velocidades de transferência que o USB 4 pode atingir. Além disso, as outras duas portas USB também poderiam ser um pouco mais rápidas. Ambas são conectadas via USB 3.0, que muitos SSDs agora superam facilmente.
Conectado à estação de acoplamento enquanto o senhor está sentado em sua mesa, essas pequenas falhas não devem ser muito perceptíveis. Mas muitos dos laptops de ponta da Intel oferecem melhores opções de conectividade. Isso normalmente inclui duas portas TB4. Entretanto, as portas USB-A rápidas também não são comuns aqui.
Comunicação
As taxas de transferência do dispositivo são um pouco fracas quando se trata de envio, tanto em 5 GHz quanto em 6 GHz. No entanto, suas taxas de recepção são as esperadas para o Wi-Fi 6E. Isso é muito melhor do que um simples cabo LAN pode oferecer. Além disso, graças à expansão da faixa de frequência, o senhor ainda poderá obter uma alta taxa de transferência com redes sem fio sobrepostas.
Webcam
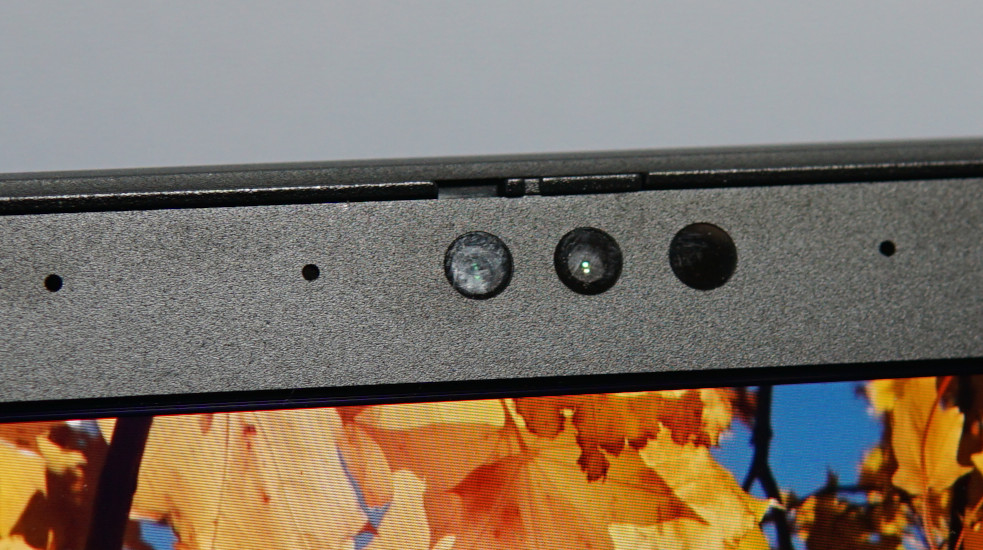
Somente os 5 MP garantem uma boa qualidade de imagem, o que significa que as pessoas do outro lado da sua chamada de vídeo em um smartphone provavelmente não conseguirão perceber que o senhor está usando a webcam de um laptop - bem diferente das webcams HD que são instaladas com frequência e que oferecem uma fração da resolução.
Os desvios de cor muito altos que medimos são resultado do clareamento automático das imagens. E isso funciona muito bem. Mesmo em condições de pouca luz, os rostos permanecem reconhecíveis. Ao mesmo tempo, a imagem fica rapidamente bastante granulada. Mesmo assim, a câmera em sua forma atual é perfeitamente adequada para chamadas de videoconferência.
Isso se deve principalmente ao excelente microfone de matriz dupla que grava as vozes com muita precisão e em um volume consistente, mesmo quando a distância e a direção da fala variam durante a conversa.
Um sensor IR possibilita o reconhecimento facial via Windows Hello e uma tampa mecânica para bloquear a lente completa os recursos da webcam.


Segurança
O senhor não deve perder nenhuma função de segurança. Tudo está incluído, desde um SmartCard até uma trava Kensington e recursos de login biométrico. Para isso, o senhor pode usar o sensor de impressão digital ou o reconhecimento facial. Além disso, há extras como um BIOS de auto-recuperação. A Lenovo resumiu todas essas funções sob o termo "ThinkShield". Mais informações podem ser encontradas em aqui.
Acessórios
O laptop não vem com adaptadores adicionais, um estojo ou qualquer outra coisa do gênero. Em vez disso, apenas uma fonte de alimentação USB-C simples está incluída. Em uma nota positiva, a embalagem do ThinkPad é feita inteiramente de papelão reciclado.
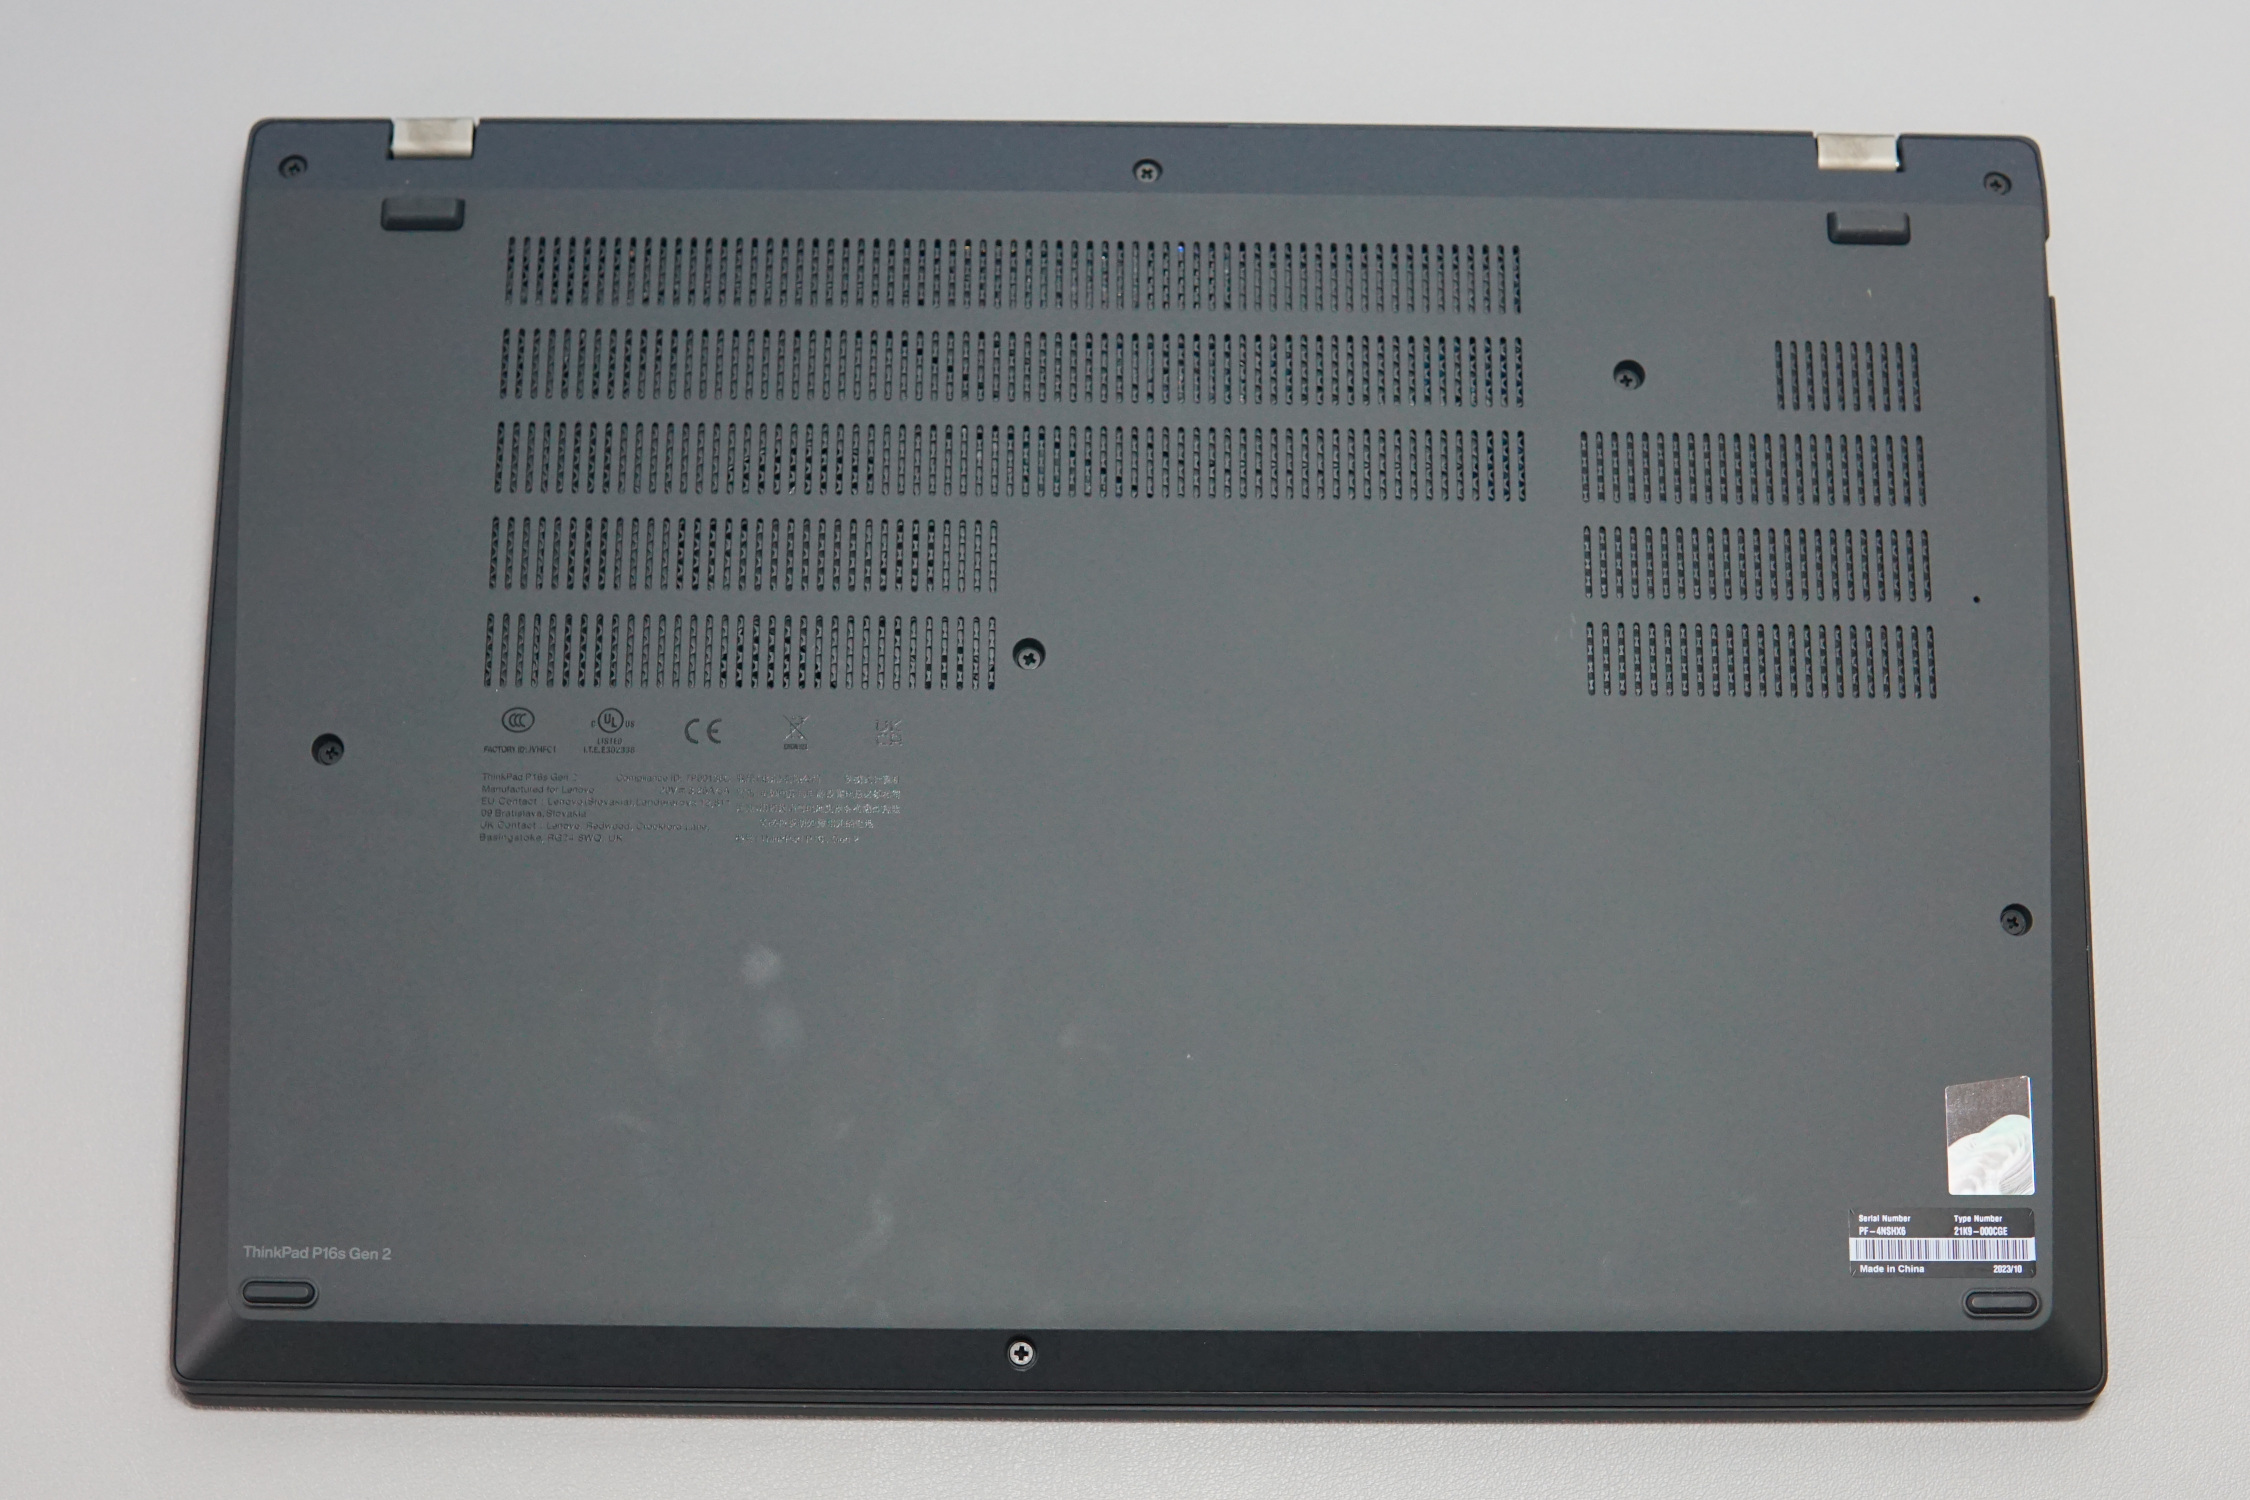
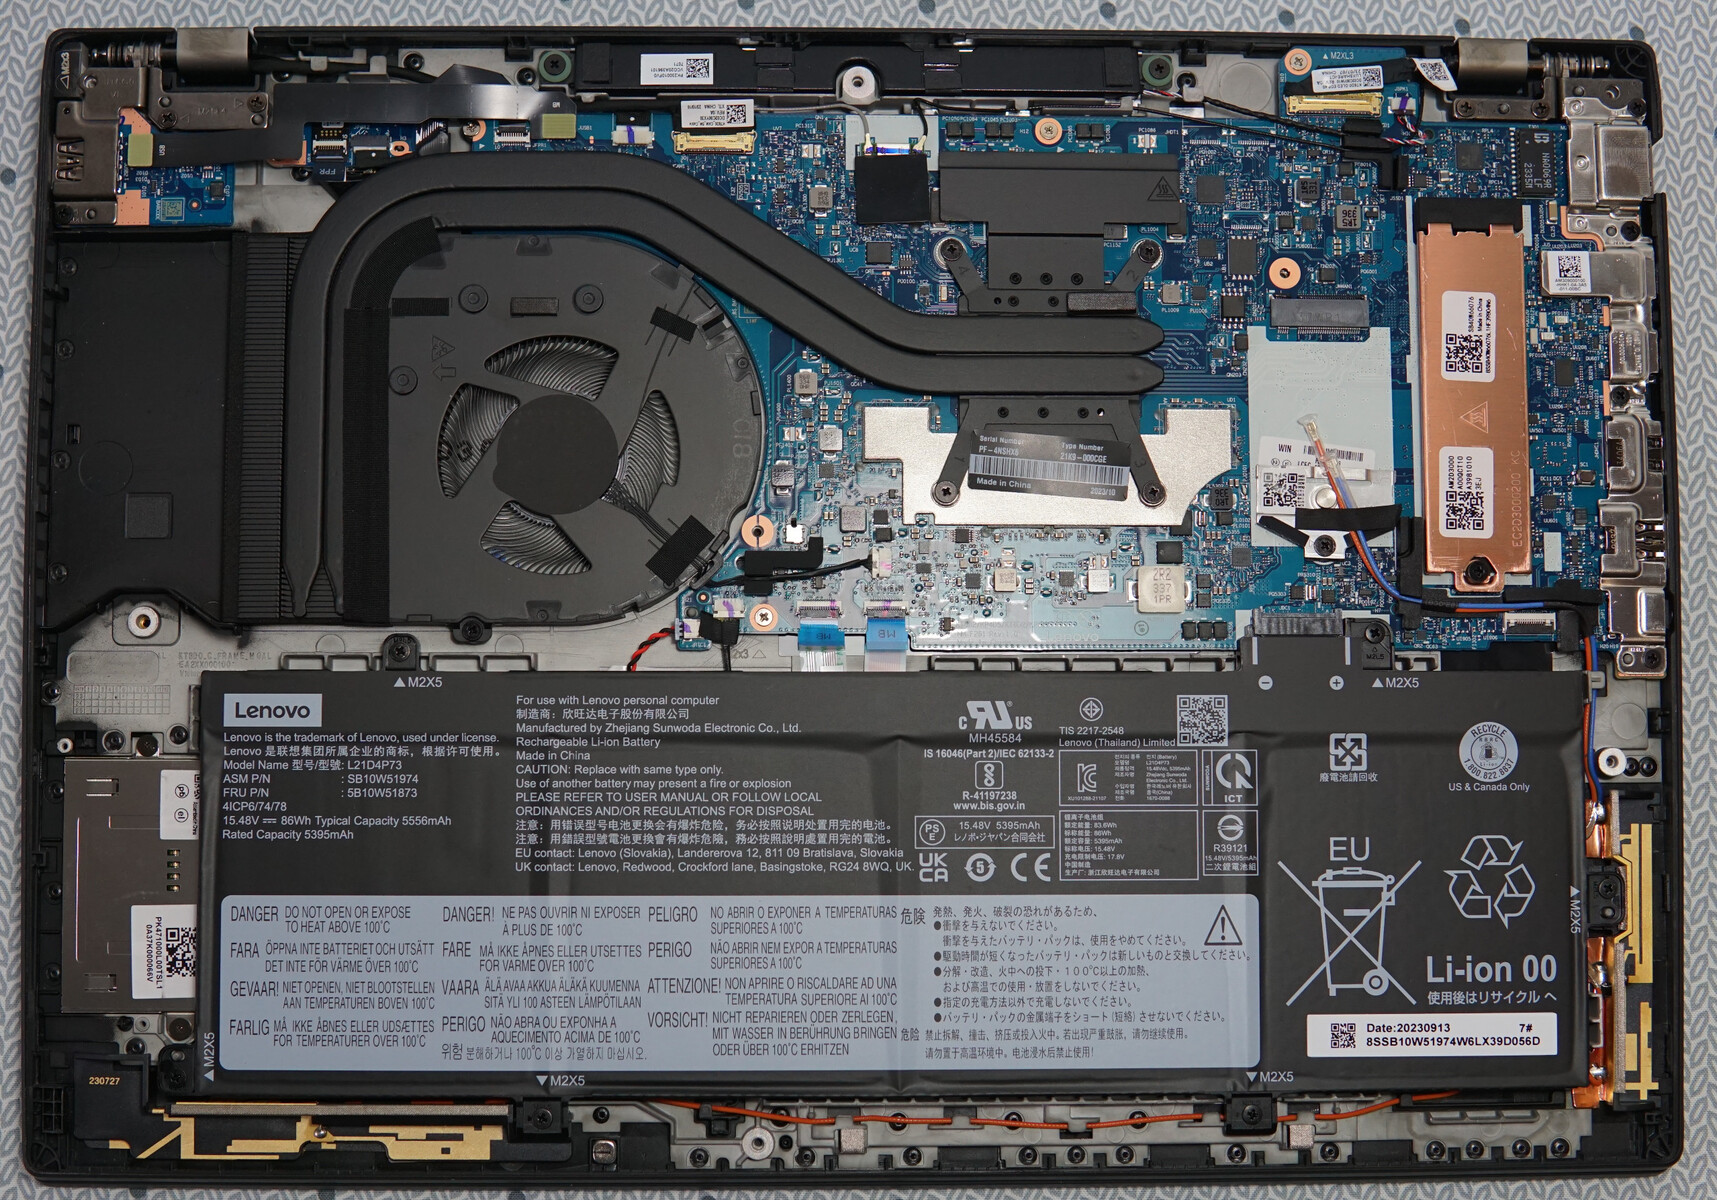
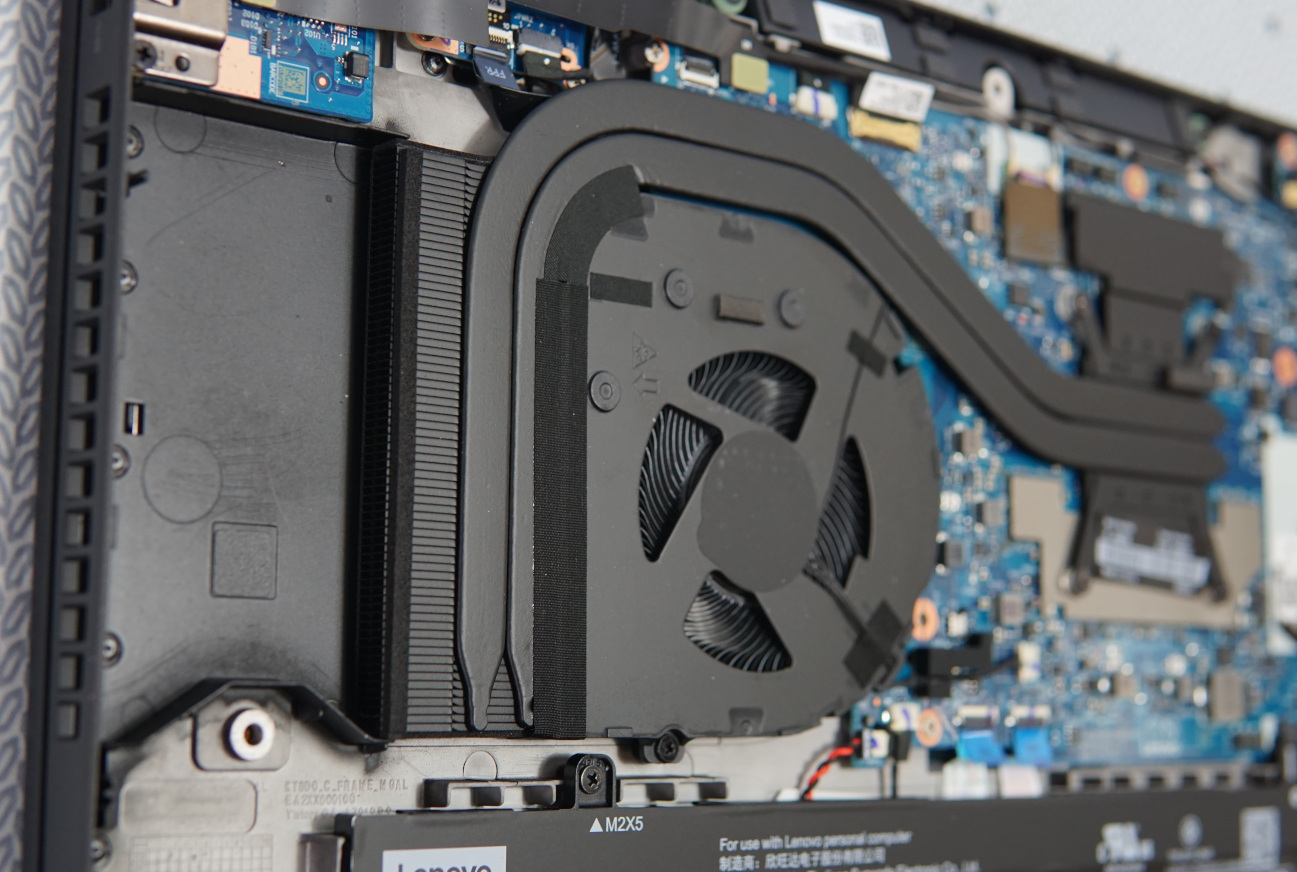
Manutenção
Como esperado, o ThinkPad P16s G2 AMD pode ser aberto facilmente e sem nenhum problema. Todos os parafusos Phillips são facilmente acessíveis. Posteriormente, o senhor pode remover a parte inferior do gabinete com paciência e força suficientes (mas sem necessidade de puxá-la violentamente) e, idealmente, com a ajuda de uma pequena ferramenta de elevação.
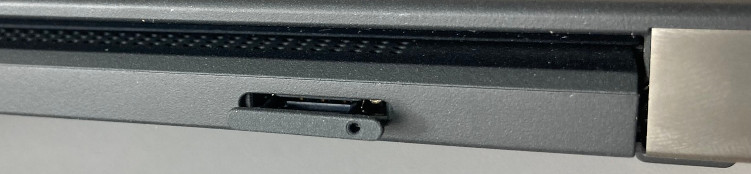
Seu SSD NVMe-M.2 pode ser trocado. A bateria e as ventoinhas podem ser acessadas sem problemas. Além disso, o senhor pode instalar um módulo 5G/LTE no gabinete. Há espaço para isso, os cabos da antena estão prontos para serem usados e um slot para cartão SIM está localizado na parte traseira.
Infelizmente, os módulos WLAN e RAM foram soldados. O senhor gostaria que a RAM fosse um pouco mais flexível em um laptop para estação de trabalho. Isso significa que, ao comprar, o senhor deve ter muito claro se deseja selecionar muita RAM em vez de pouca.
Garantia
A Lenovo oferece um ano de suporte premium que também cobre reparos no local no dia útil seguinte. Por uma taxa adicional, há opções para estender essa garantia.
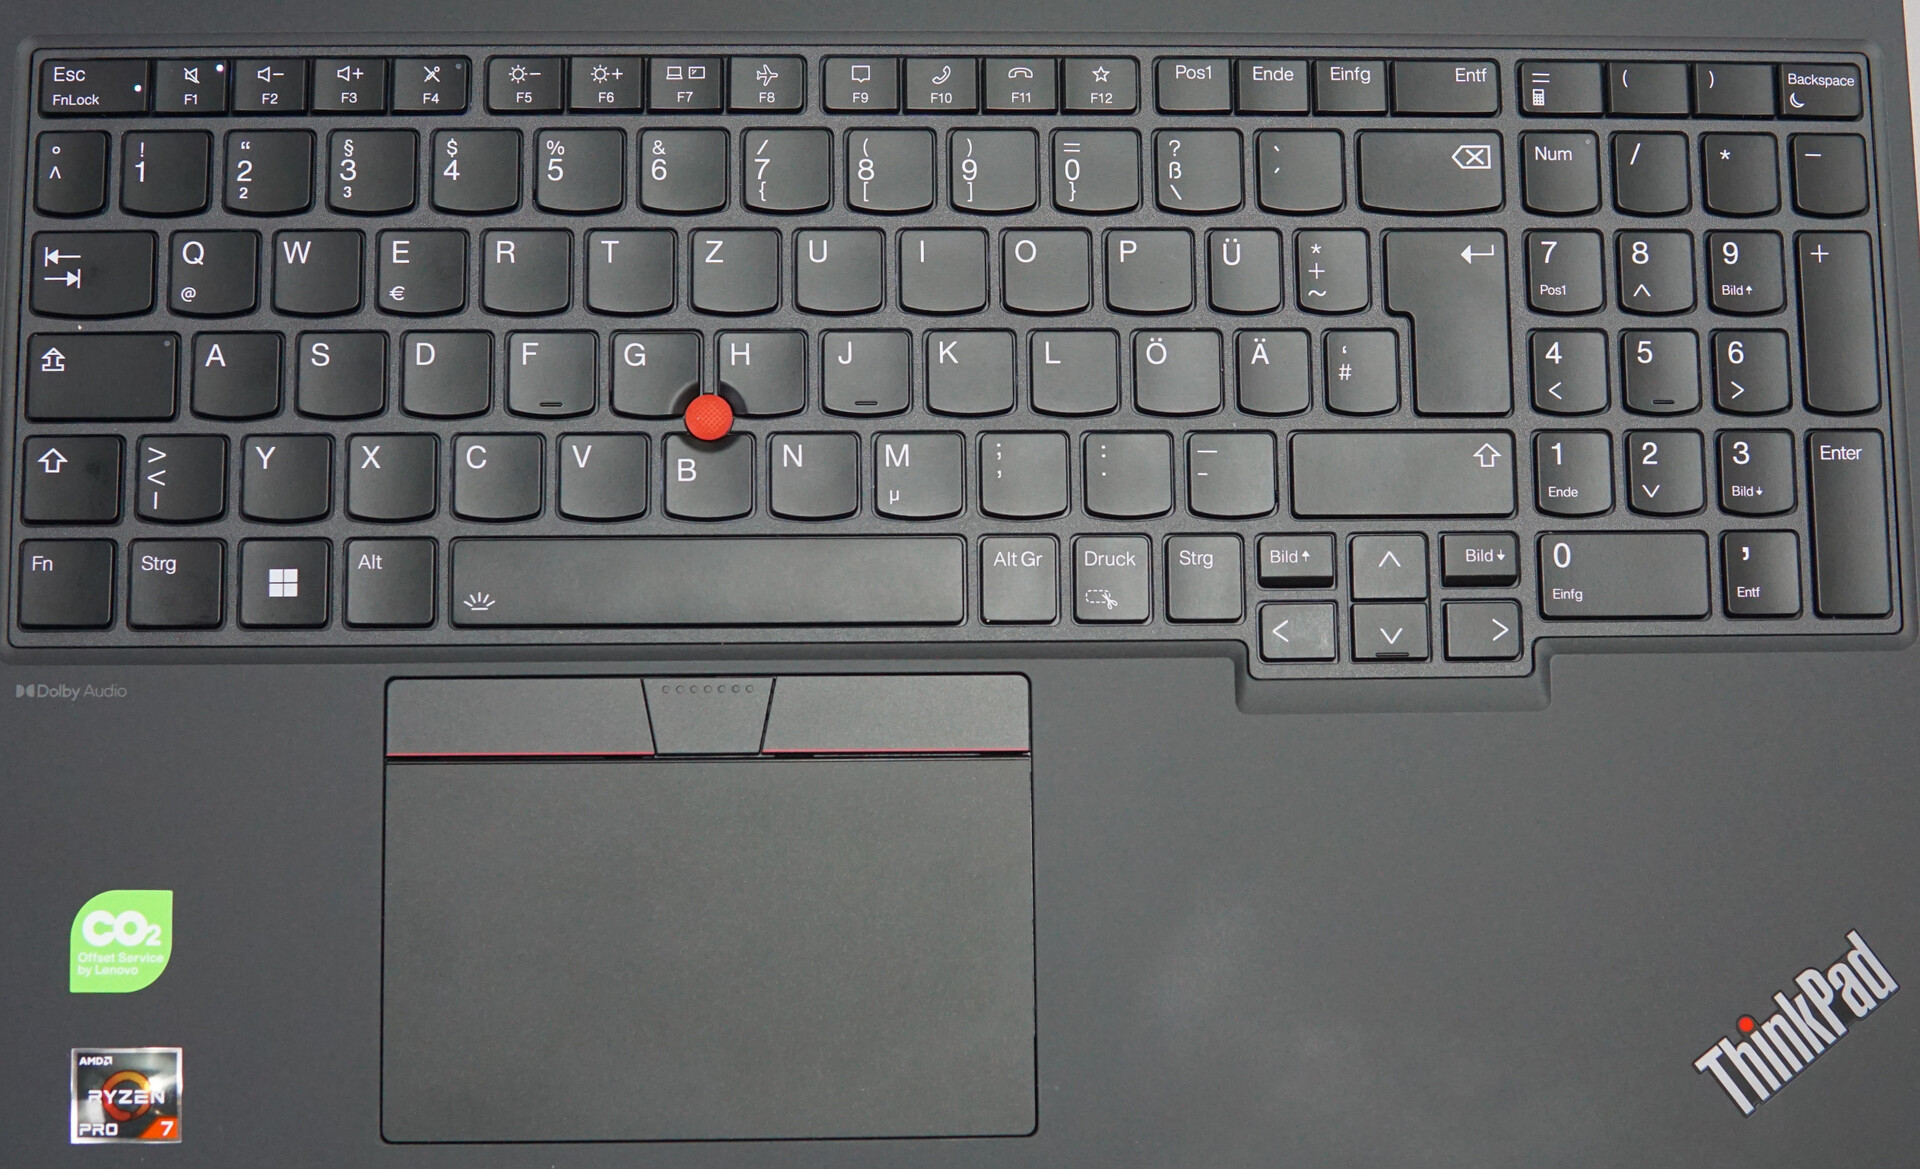
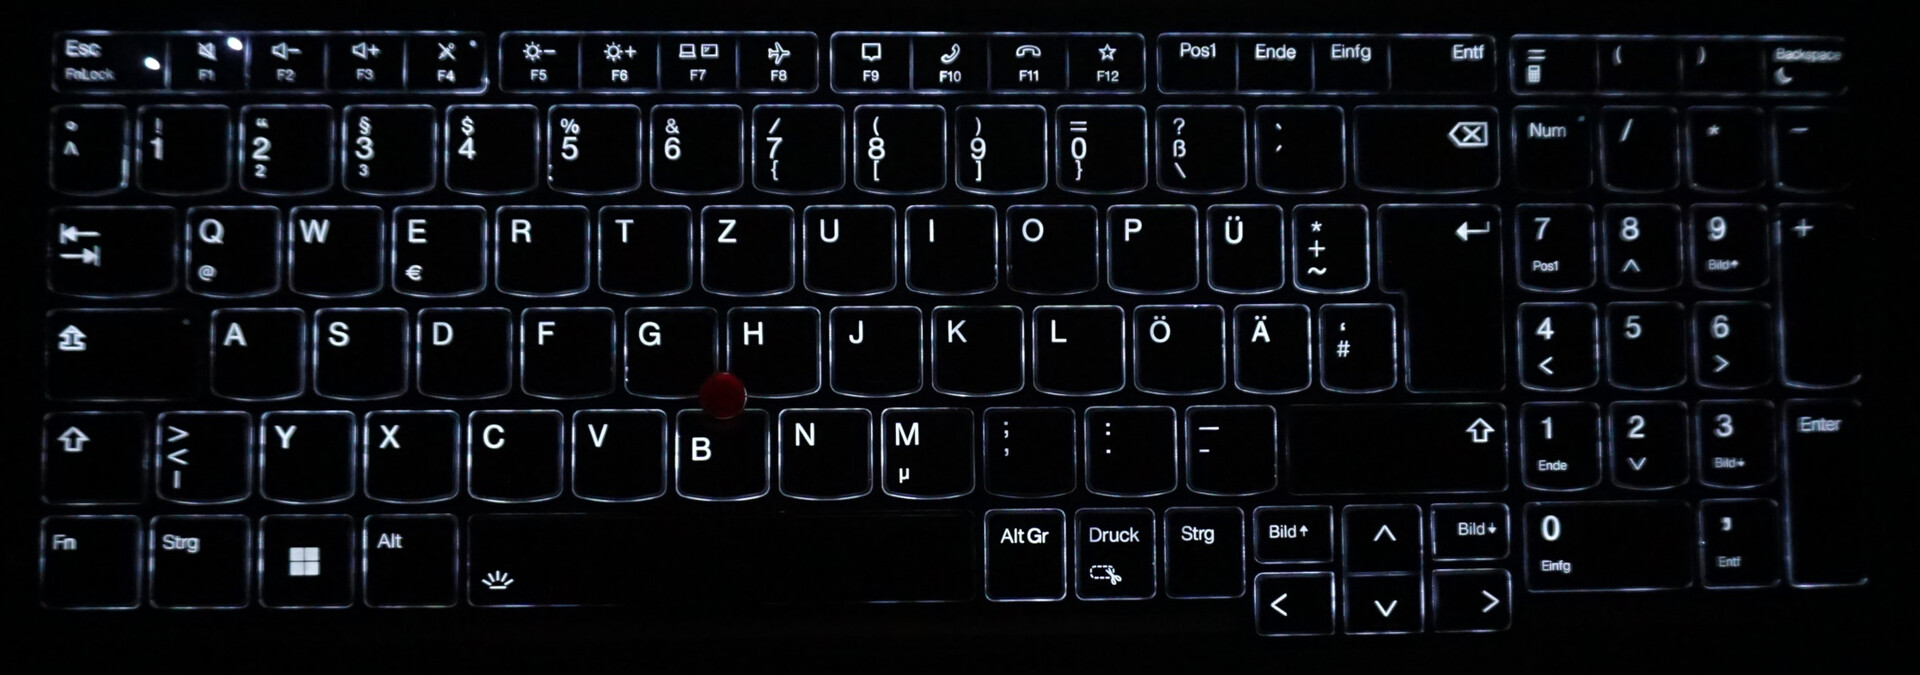
Dispositivos de entrada - Não é perfeito, mas é um teclado sólido para uma estação de trabalho
O teclado, o touchpad e o trackpoint merecem elogios. Pontos de pressão satisfatórios, resistência confortável das teclas e entradas precisas contribuem para uma operação suave e rápida. O senhor provavelmente não terá que lidar com a fadiga ao digitar ou ter que clicar três vezes ao controlar o ponteiro. Além disso, a luz de fundo do teclado, que tem dois níveis de brilho, mantém as teclas legíveis o tempo todo.
No entanto, ele não escapa de todas as críticas. Sua elevação de 1,5 mm (nossa medição) não é muito grande e o usuário percebe isso ao digitar se estiver acostumado a uma elevação muito maior. Além disso, a estrutura do teclado, que, como todos os outros componentes do gabinete, é feita de plástico, tem um pouco de folga. O senhor percebe isso mais no lado direito do que no esquerdo. No entanto, o senhor se acostuma com isso e essas questões não devem atrapalhar. No entanto, isso significa que não podemos dar a ele a nota máxima.
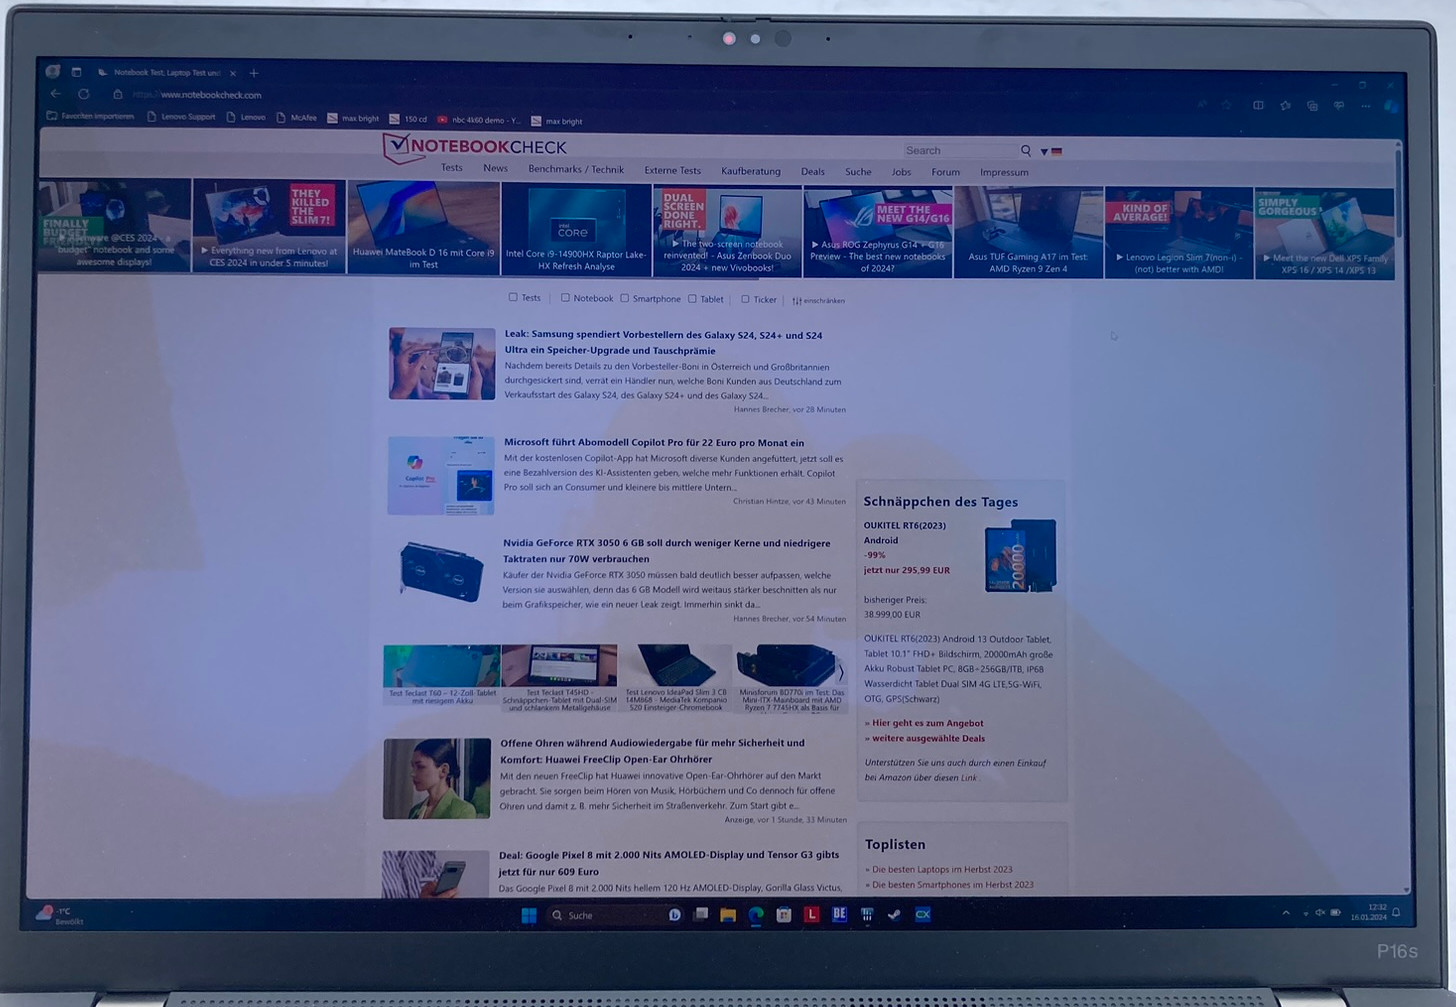
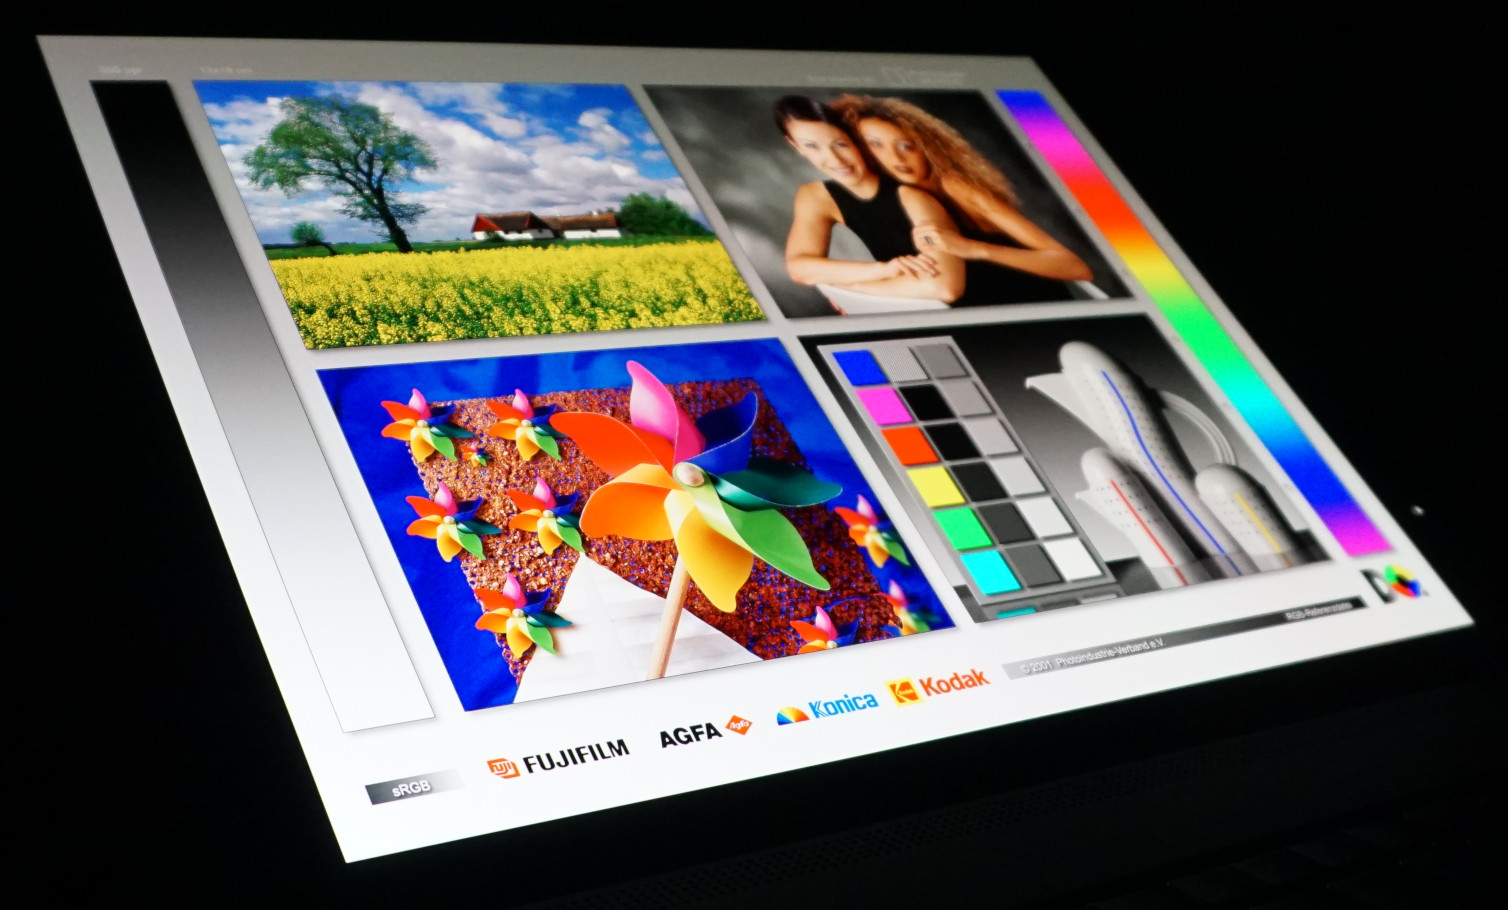
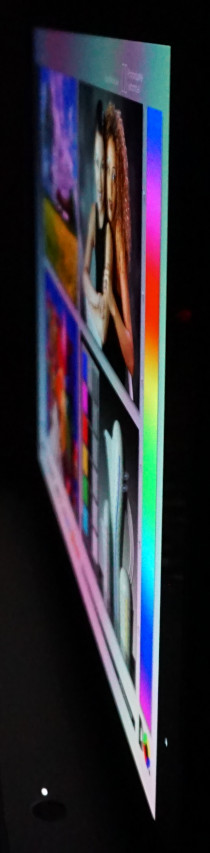
Tela - O P16s tem uma tela OLED vívida e brilhante
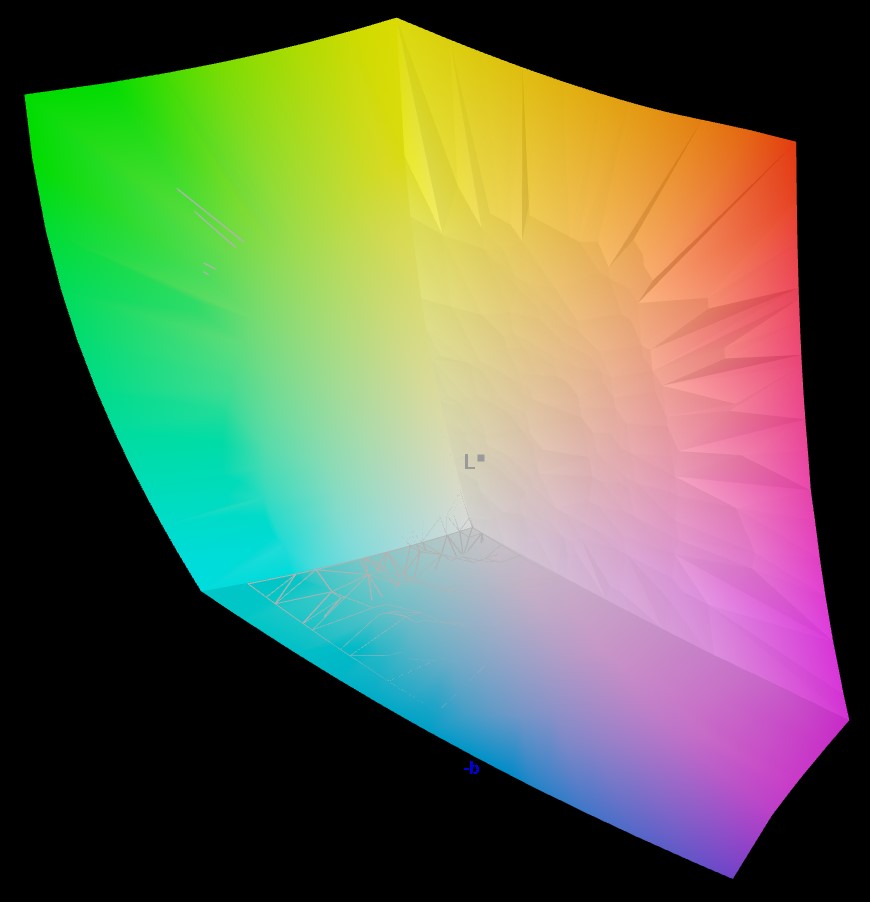
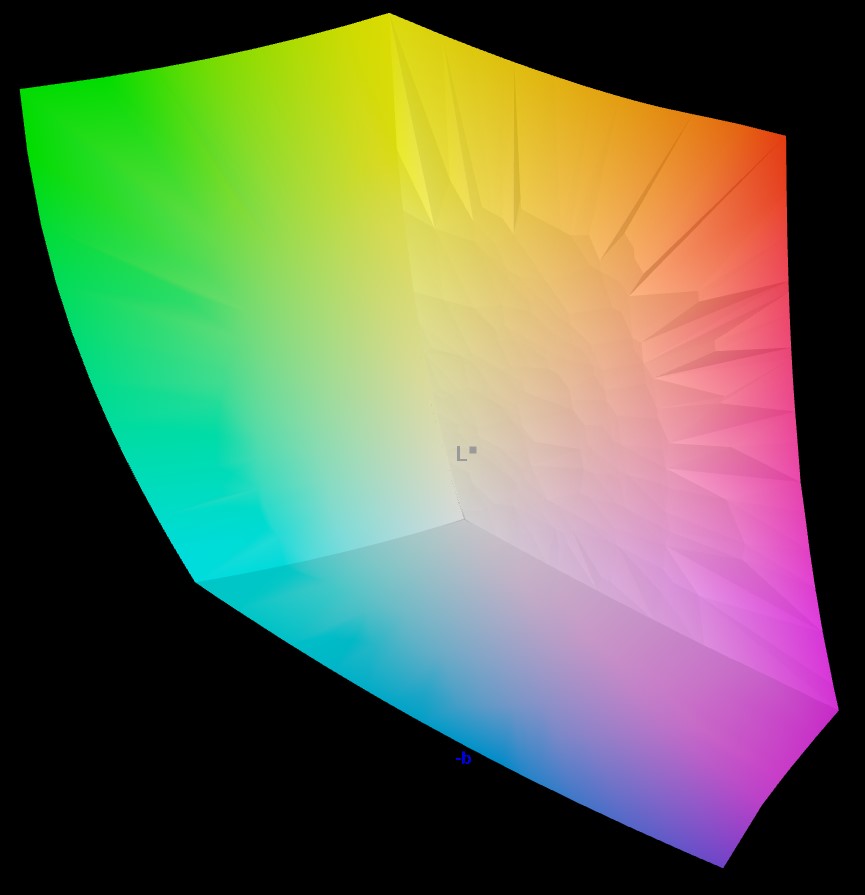
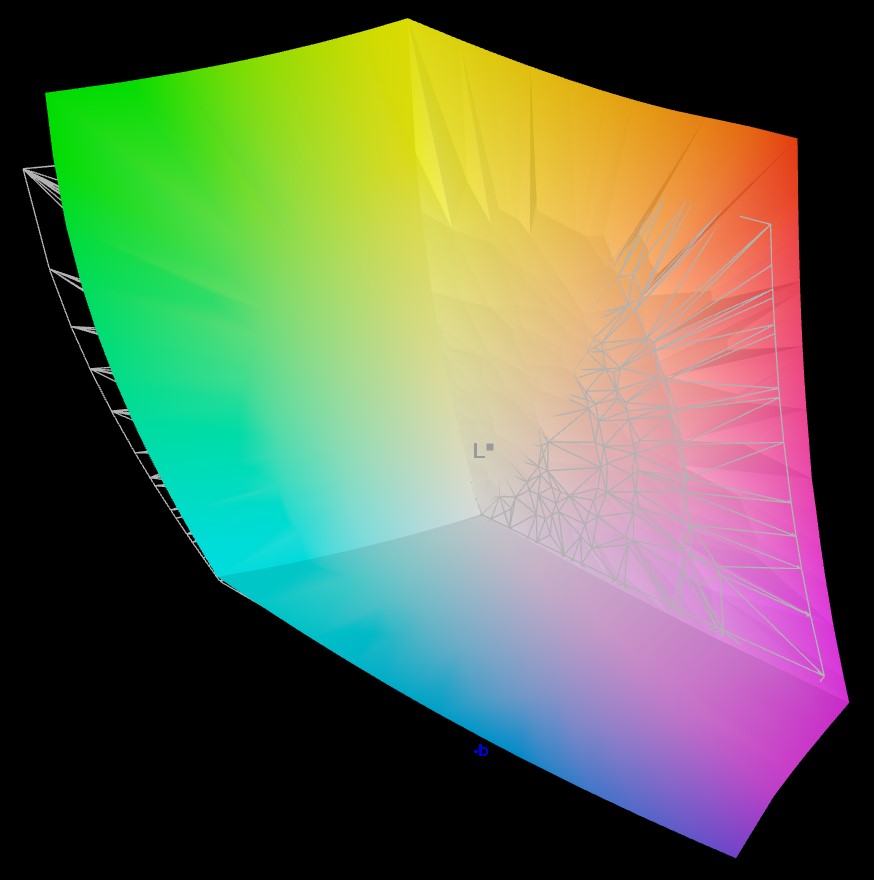
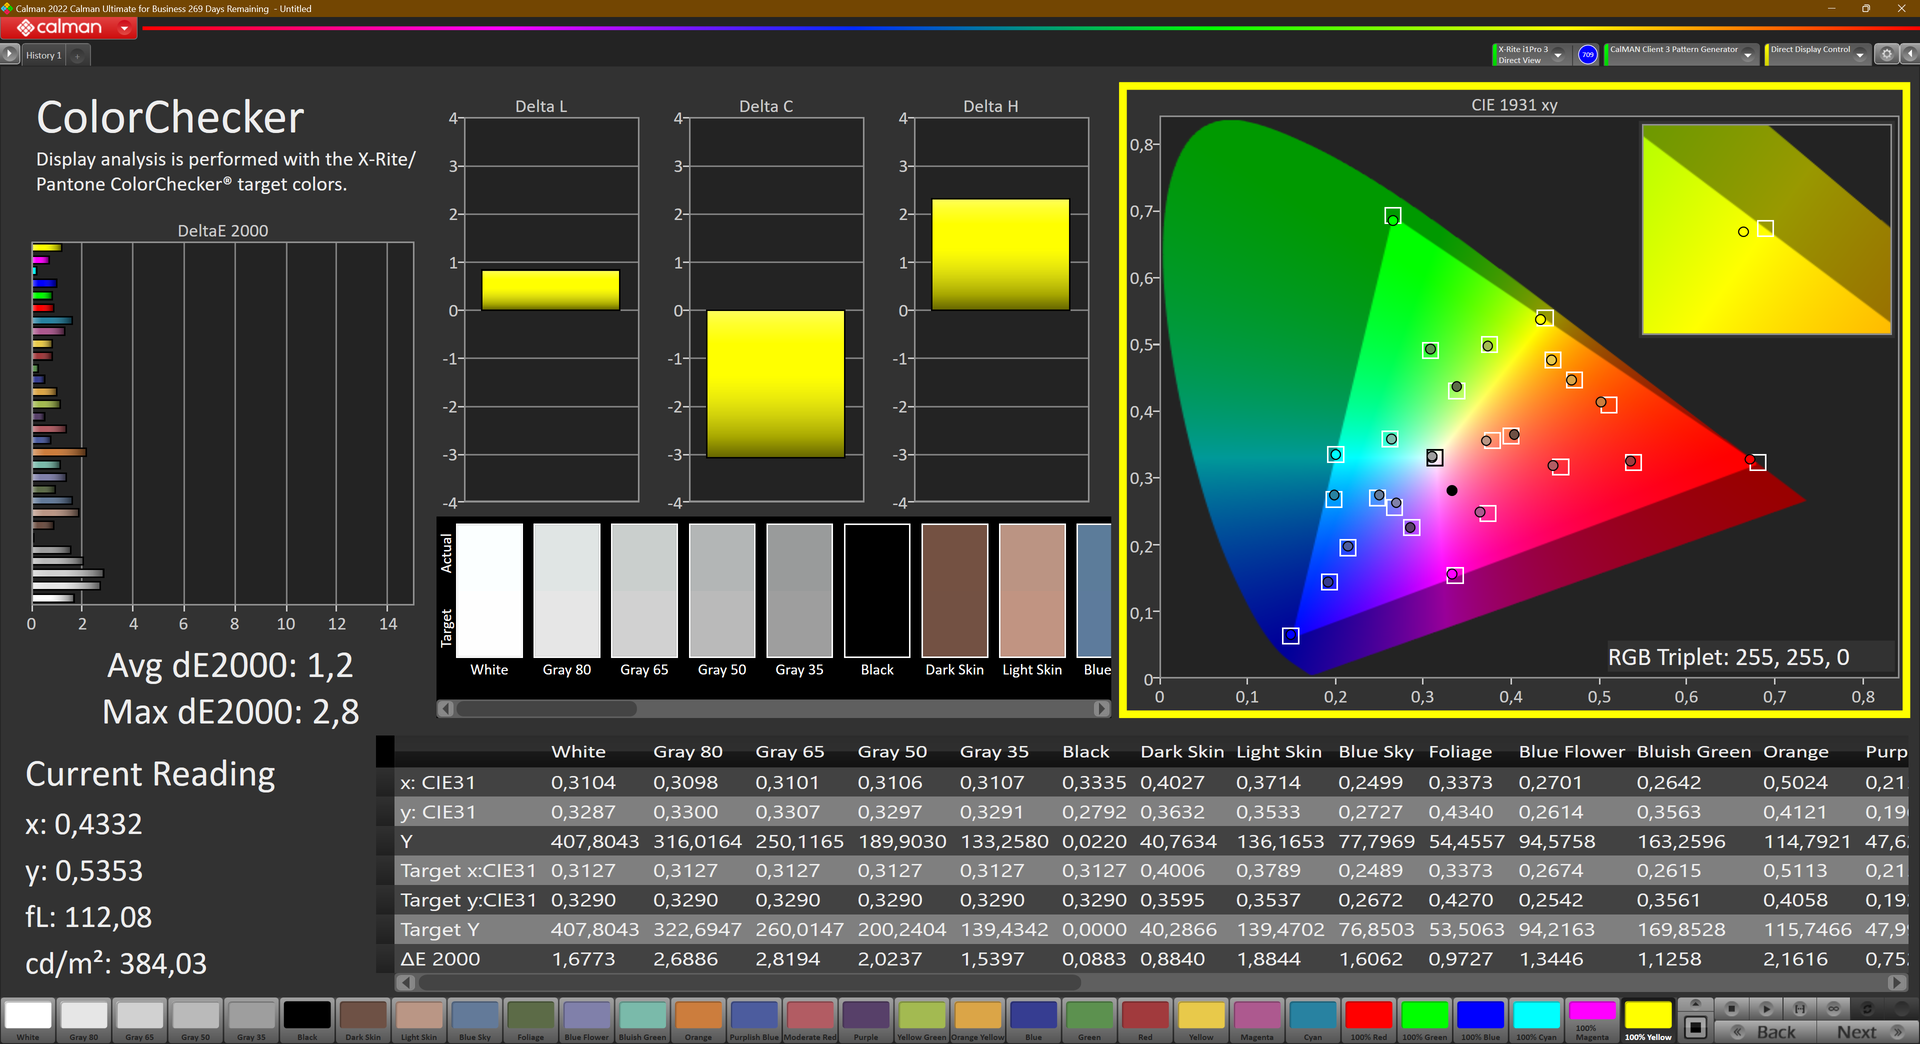
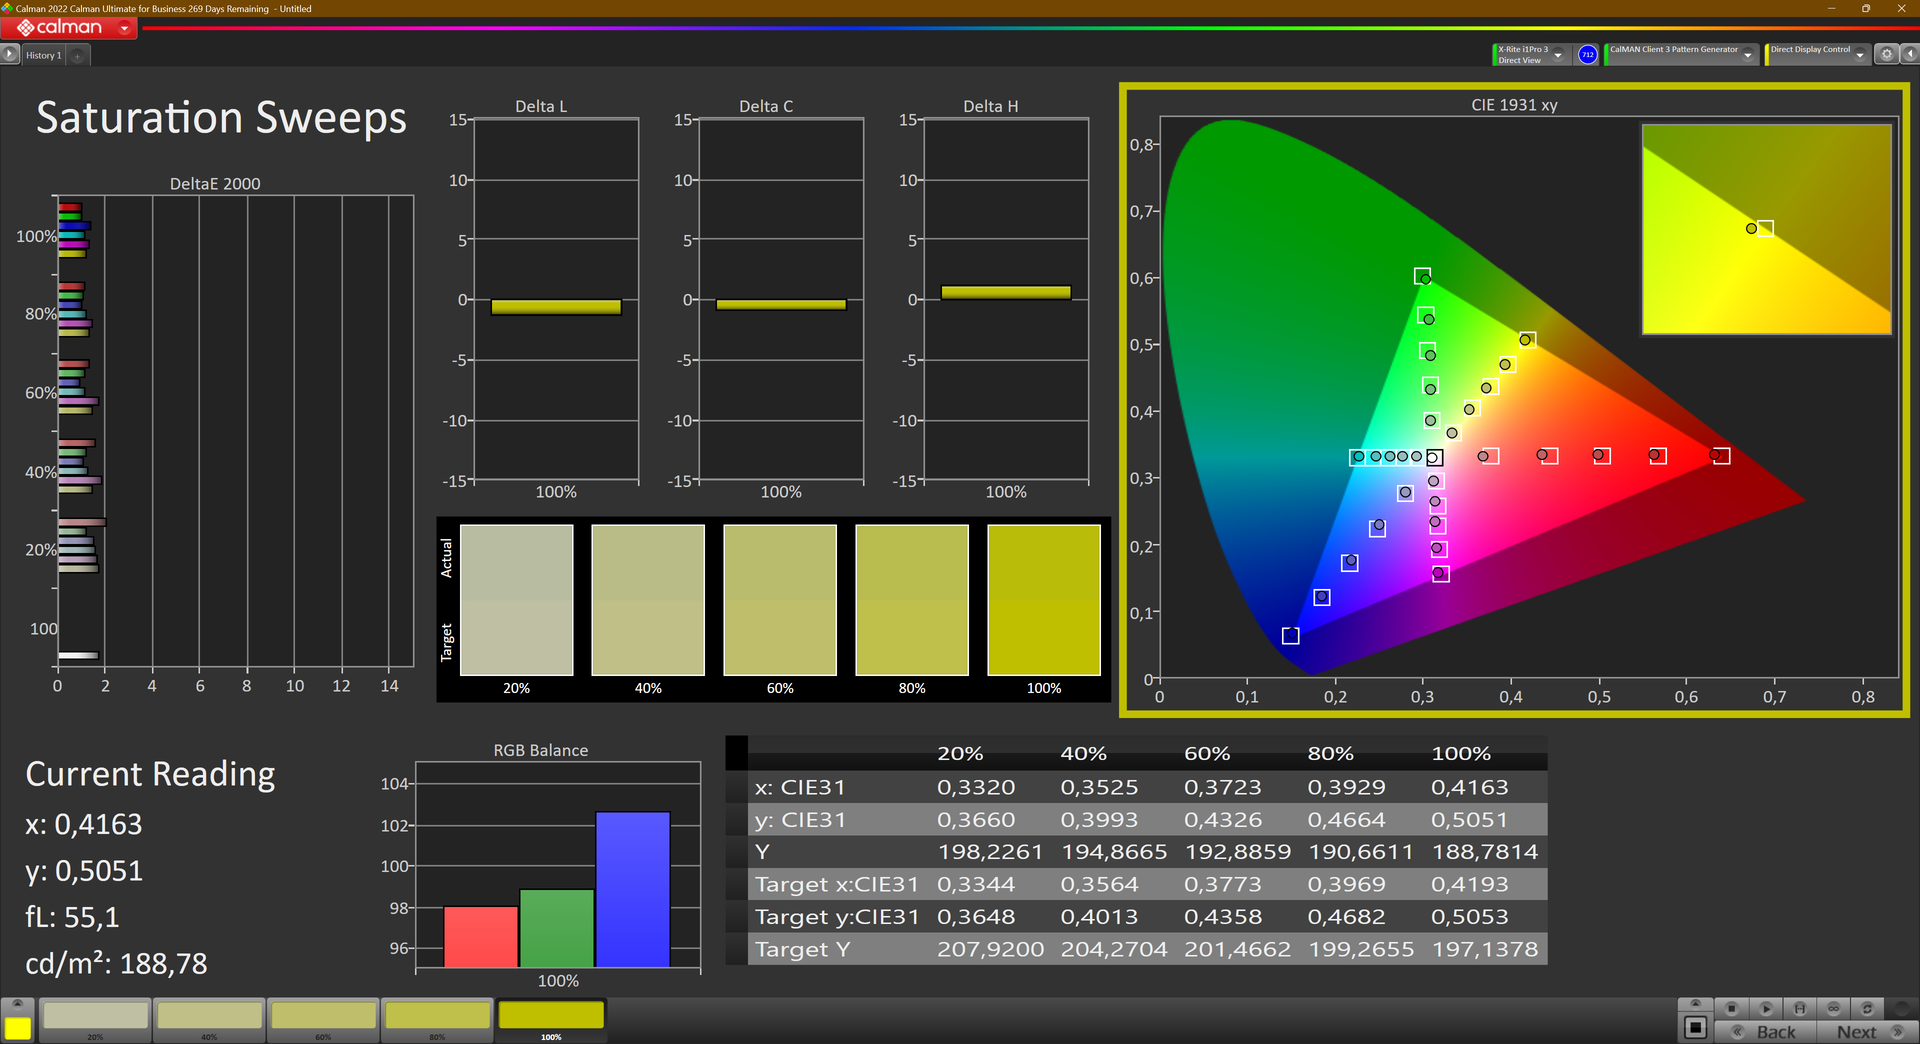
A tela OLED instalada não deve ser interessante apenas para trabalhos criativos. Embora sua resolução 4K que, em teoria, cobre o espaço de cores Display P3 em sua totalidade e garante forte contraste e precisão de cores, é claramente um bom começo para aplicativos gráficos exigentes.
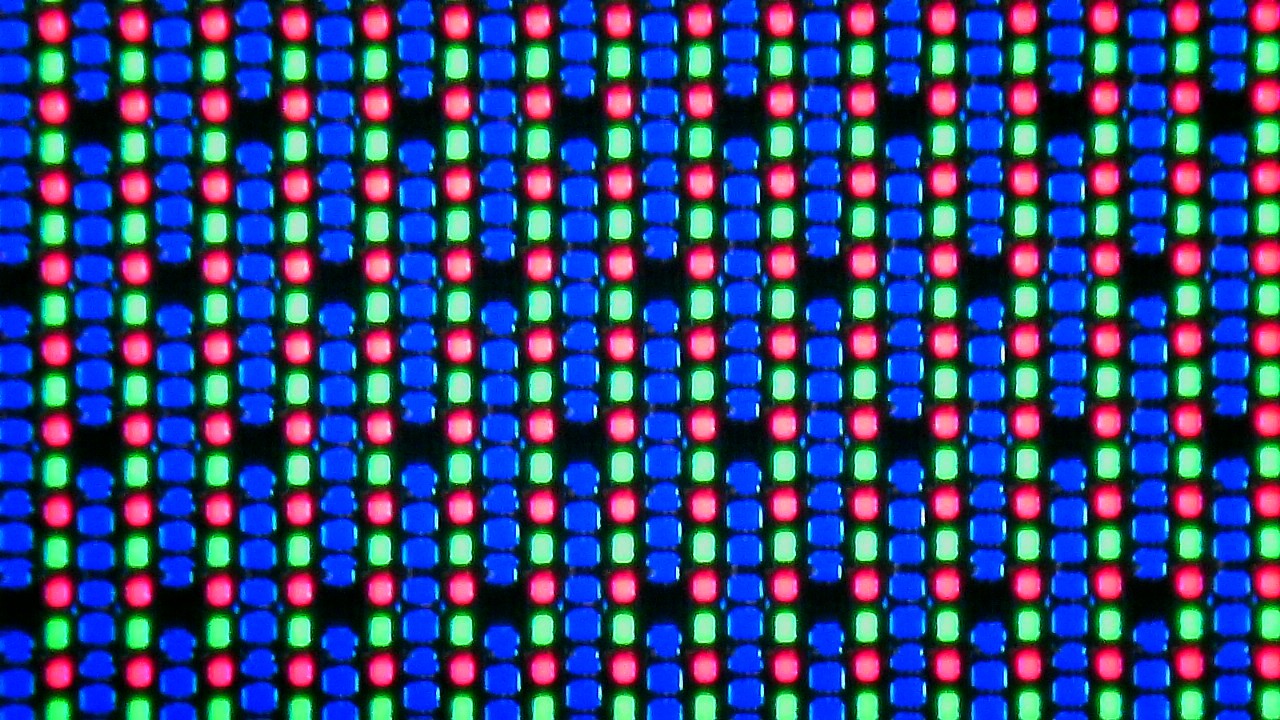
Mesmo em geral, o conteúdo parece intenso e radiante na tela do laptop. O texto que, às vezes, é mostrado de forma um pouco suja é compensado por sua resolução extremamente alta. O fato de os subpixels não serem estruturados de maneira uniforme às vezes resulta em bordas borradas. A ampliação do texto no valor recomendado de 175% faz com que isso não seja perceptível.
É preciso levar em conta sua superfície reflexiva quando se trata da representação precisa das cores da tela, o que não é ideal quando se usa o dispositivo em ambientes externos. No interior, os altos níveis de contraste da tela compensam isso.
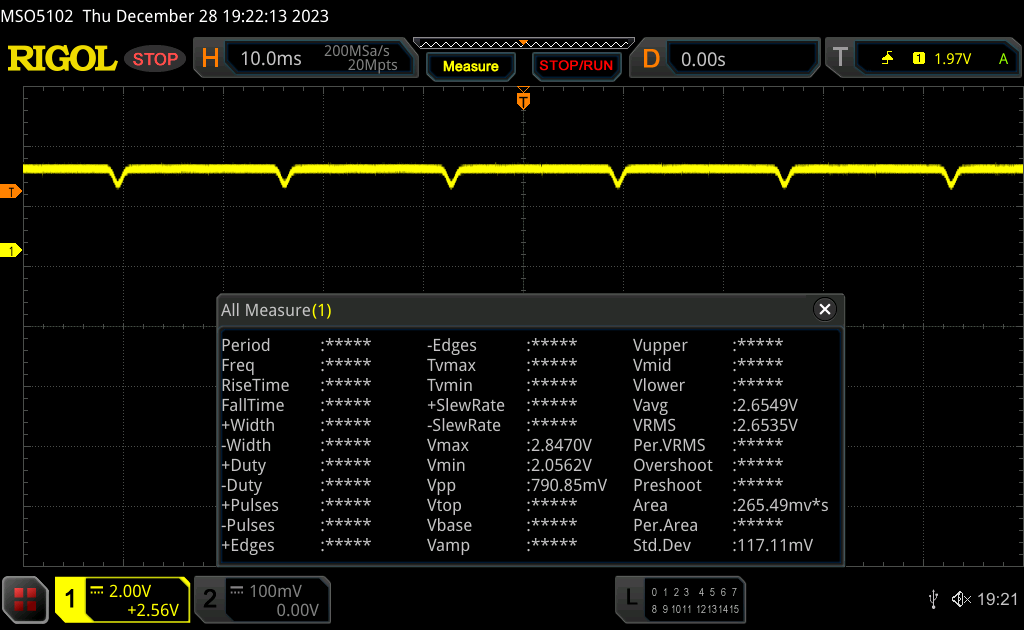
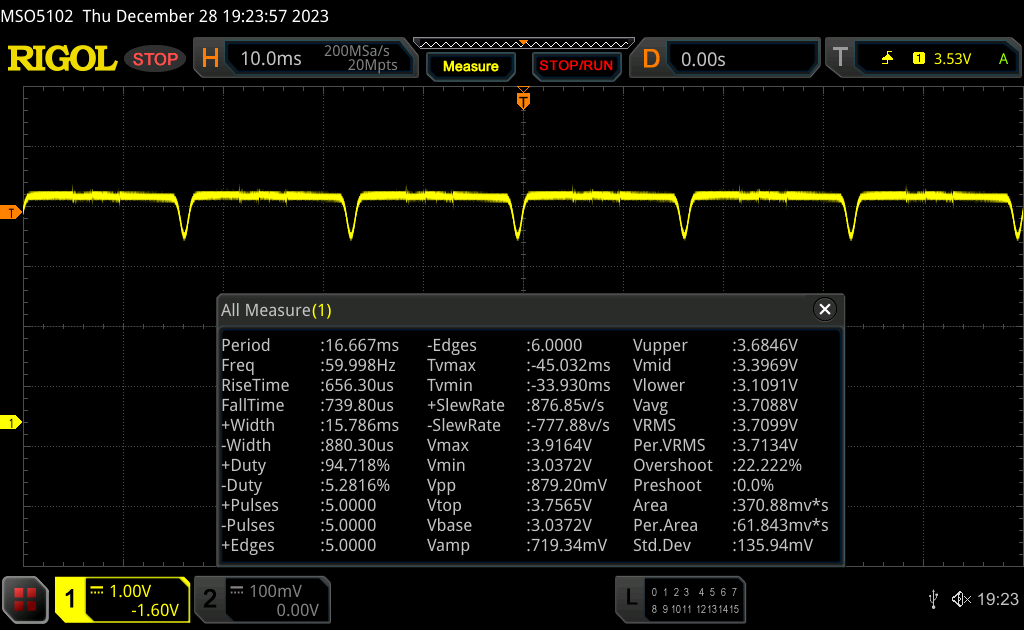
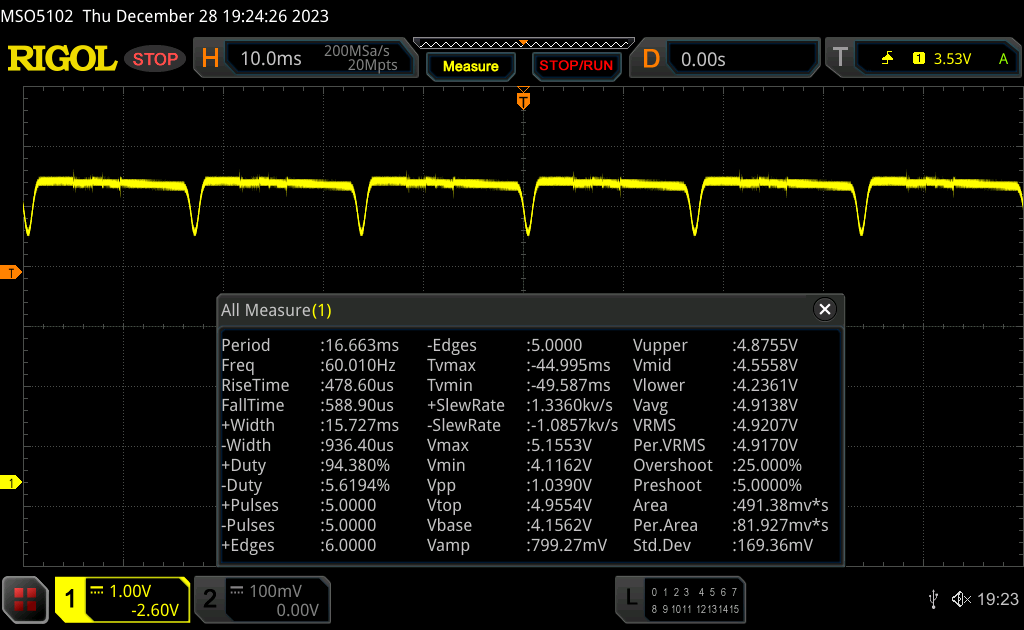
Além disso, a tela OLED usa um tipo de modulação de largura de pulso. Ela não é, de forma alguma, tão agressiva quanto a de alguns monitores LCD mais antigos. No entanto, o senhor poderá notá-la levemente, pois a frequência que medimos com alto brilho mostrou apenas 60 Hz.
Para usuários sensíveis, recomendamos uma das muitas outras opções de monitores que usam painéis IPS e, por sua vez, não usam PWM:
- WUXGA (1920x1200), IPS, 300nits, Antirreflexo, 16:10, 800:1, 45% NTSC
- WUXGA (1920x1200), Multitoque, IPS, 300 nits, Antirreflexo, 16:10, 800:1, 45% NTSC
- WUXGA (1920x1200), IPS, 400 nits, Antirreflexo, 16:10, 1000:1, 100% sRGB
- WUXGA (1920x1200), Multitoque, IPS, 500 nits, Antirreflexo, 16:10, 1000:1, 100% sRGB
| |||||||||||||||||||||||||
iluminação: 98 %
iluminação com acumulador: 417 cd/m²
Contraste: ∞:1 (Preto: 0 cd/m²)
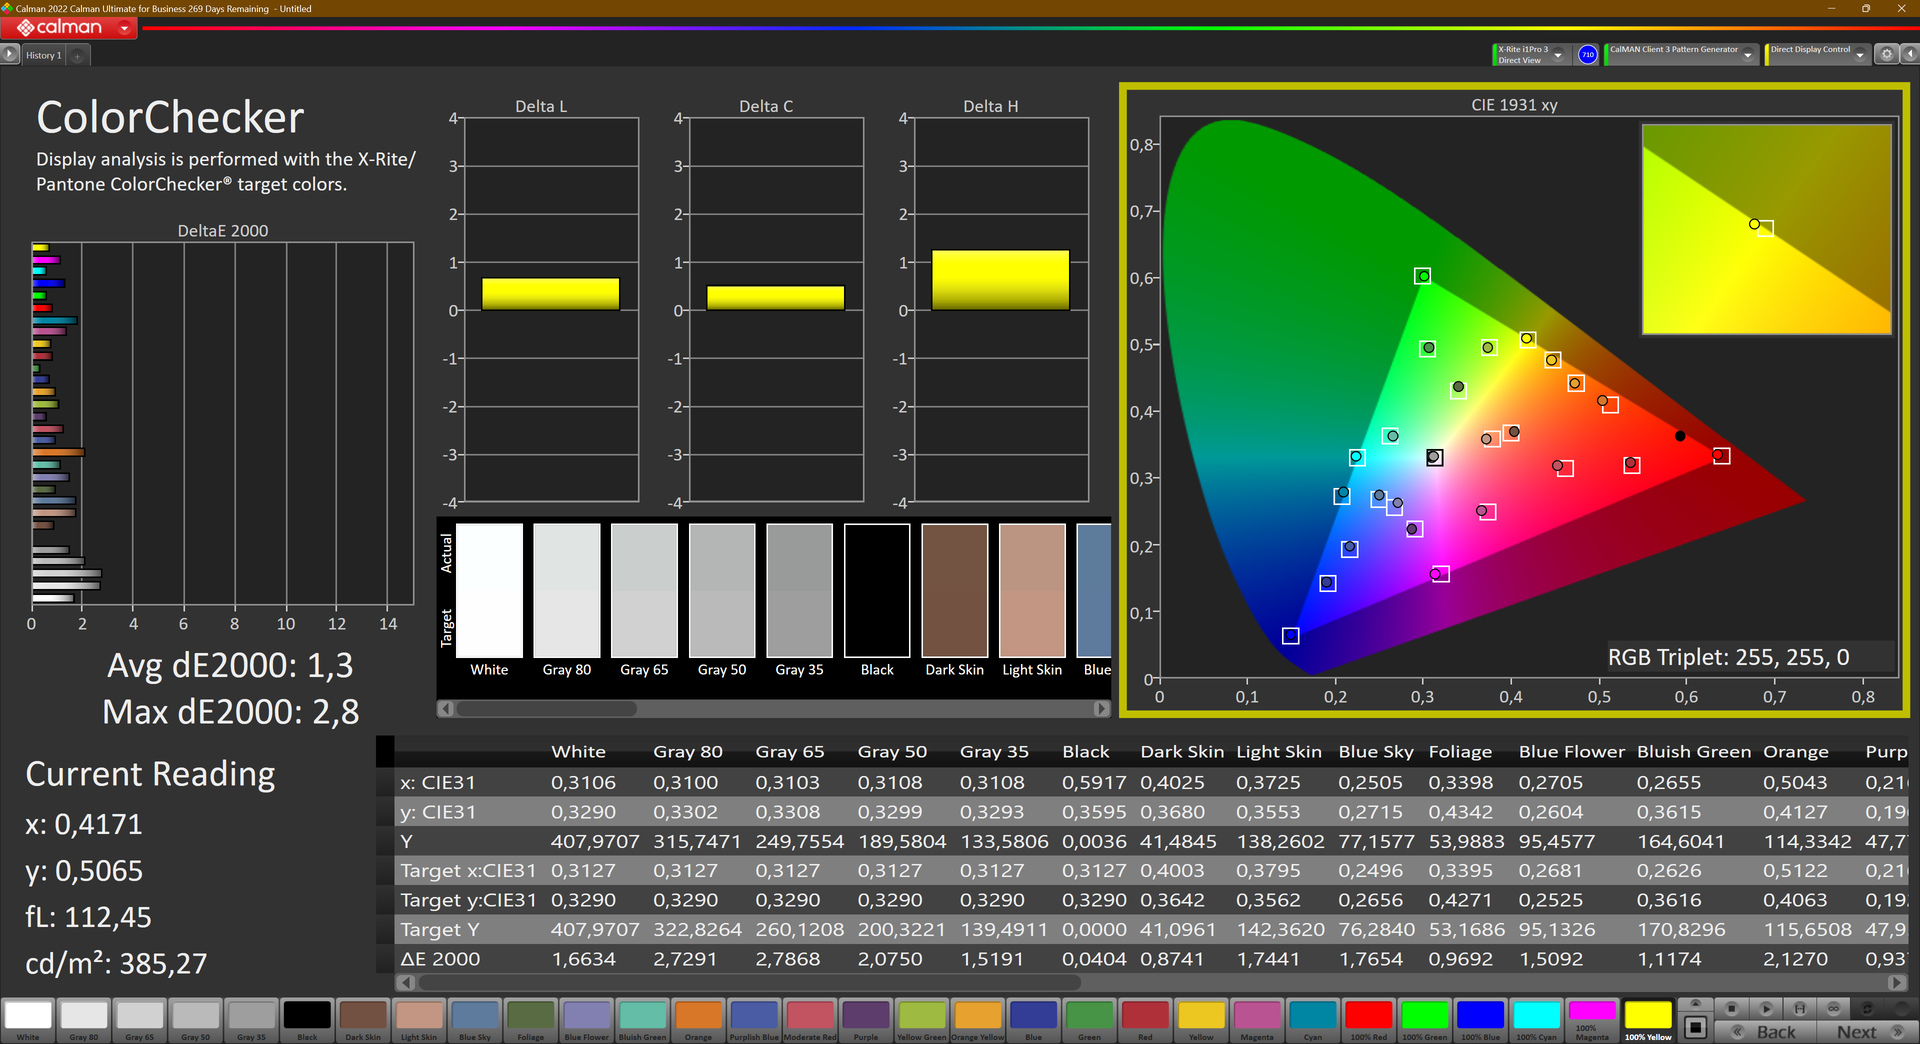
ΔE ColorChecker Calman: 1.3 | ∀{0.5-29.43 Ø4.73}
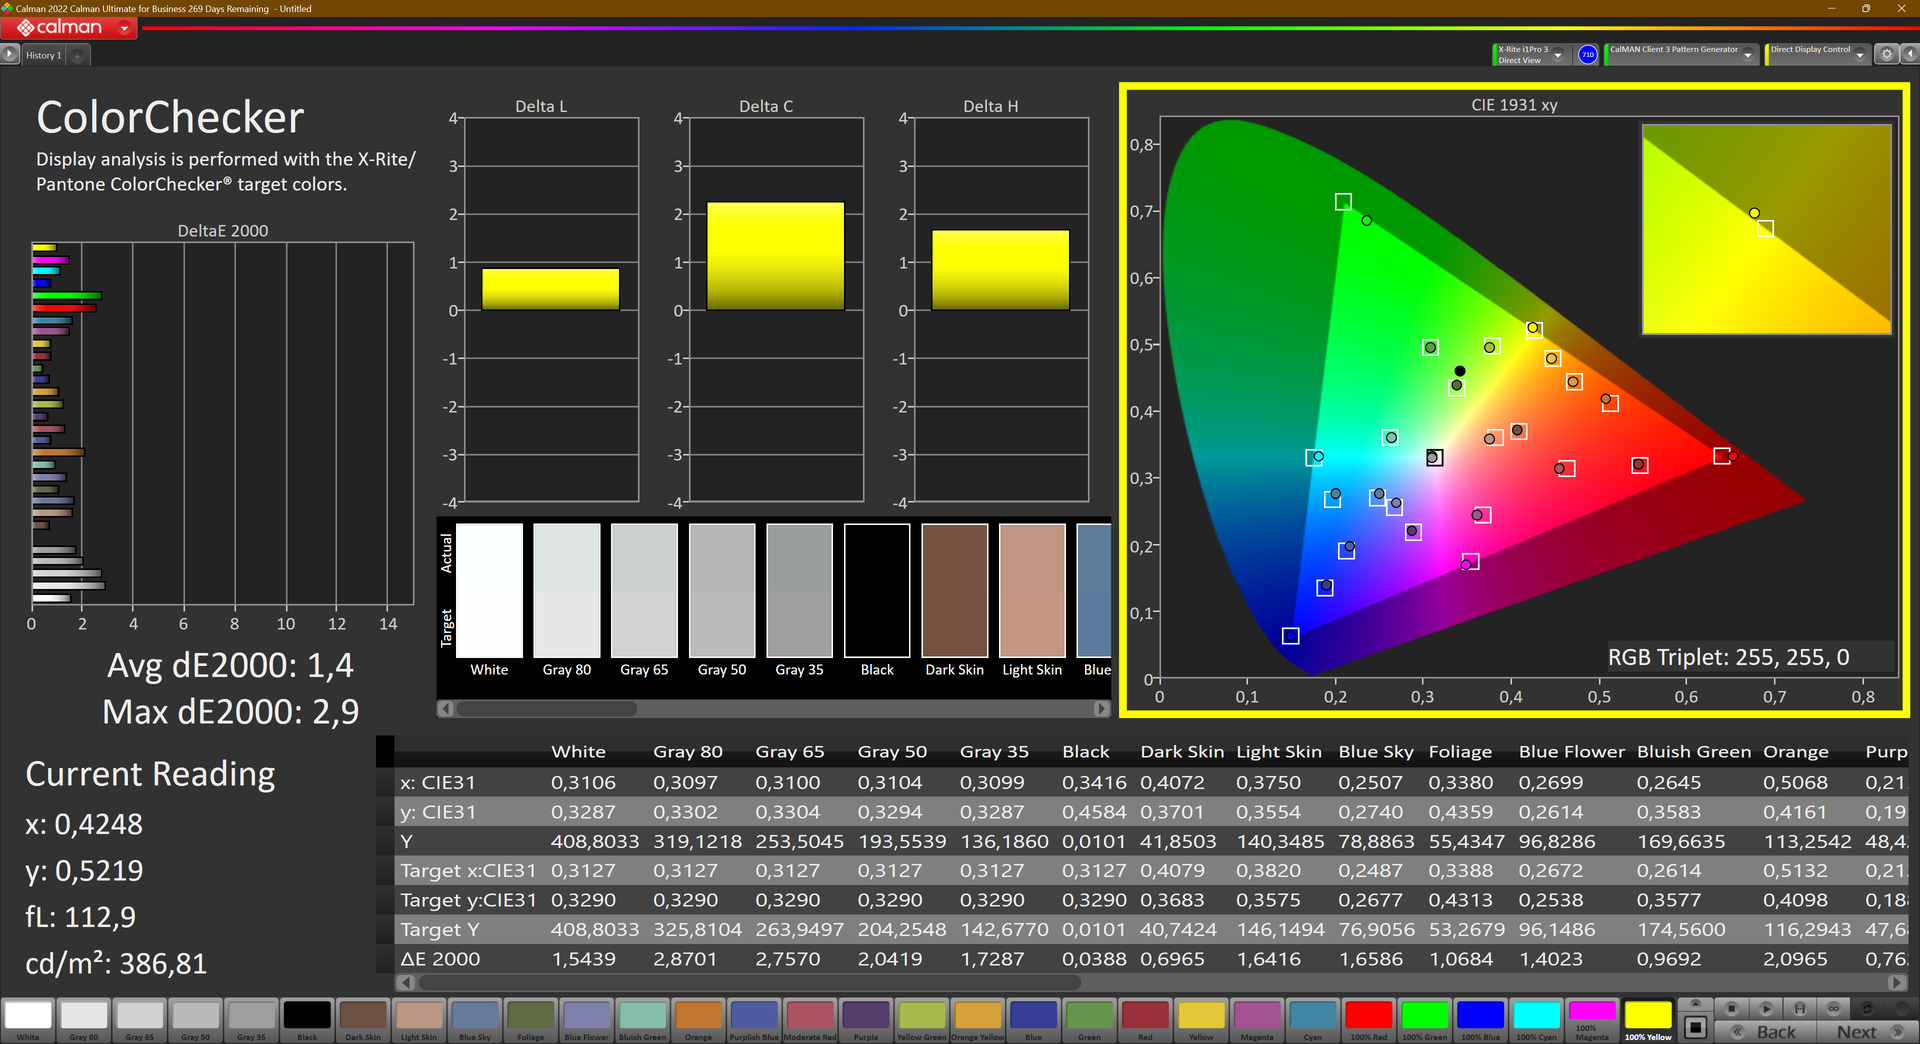
calibrated: 2.9
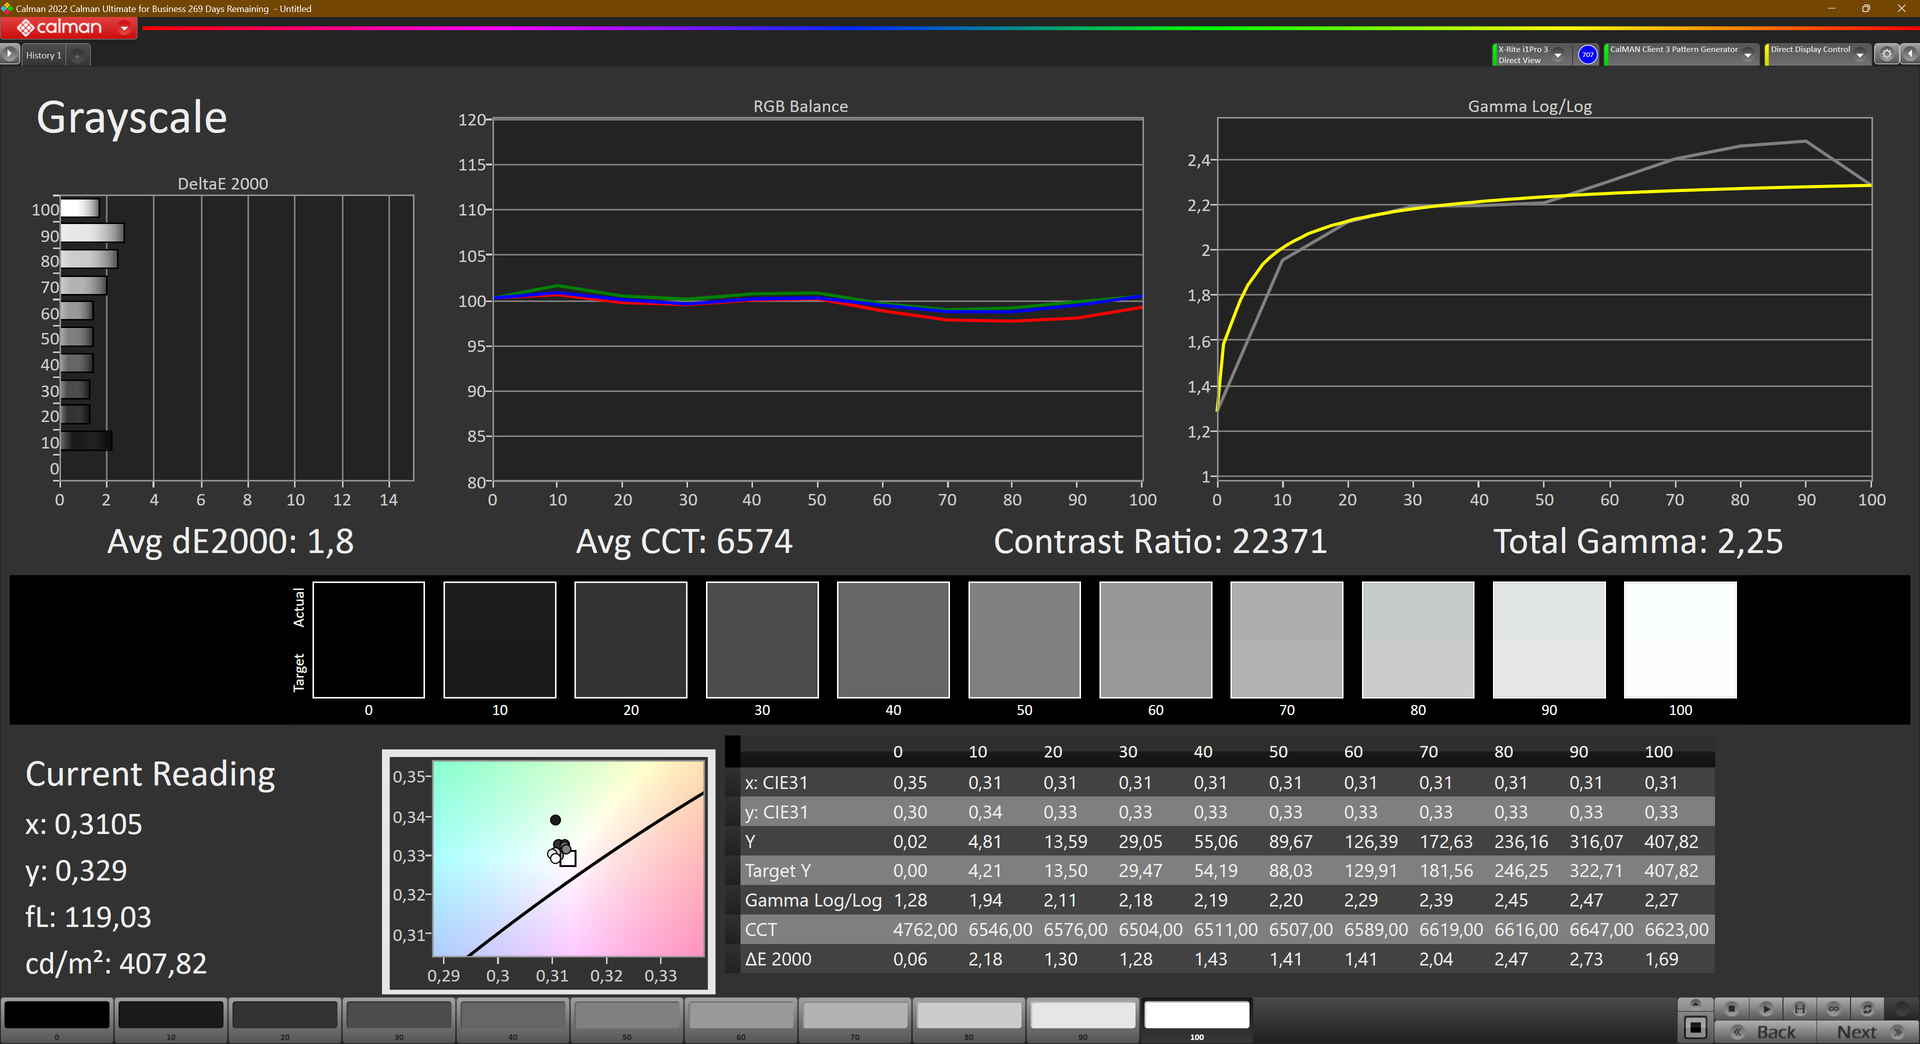
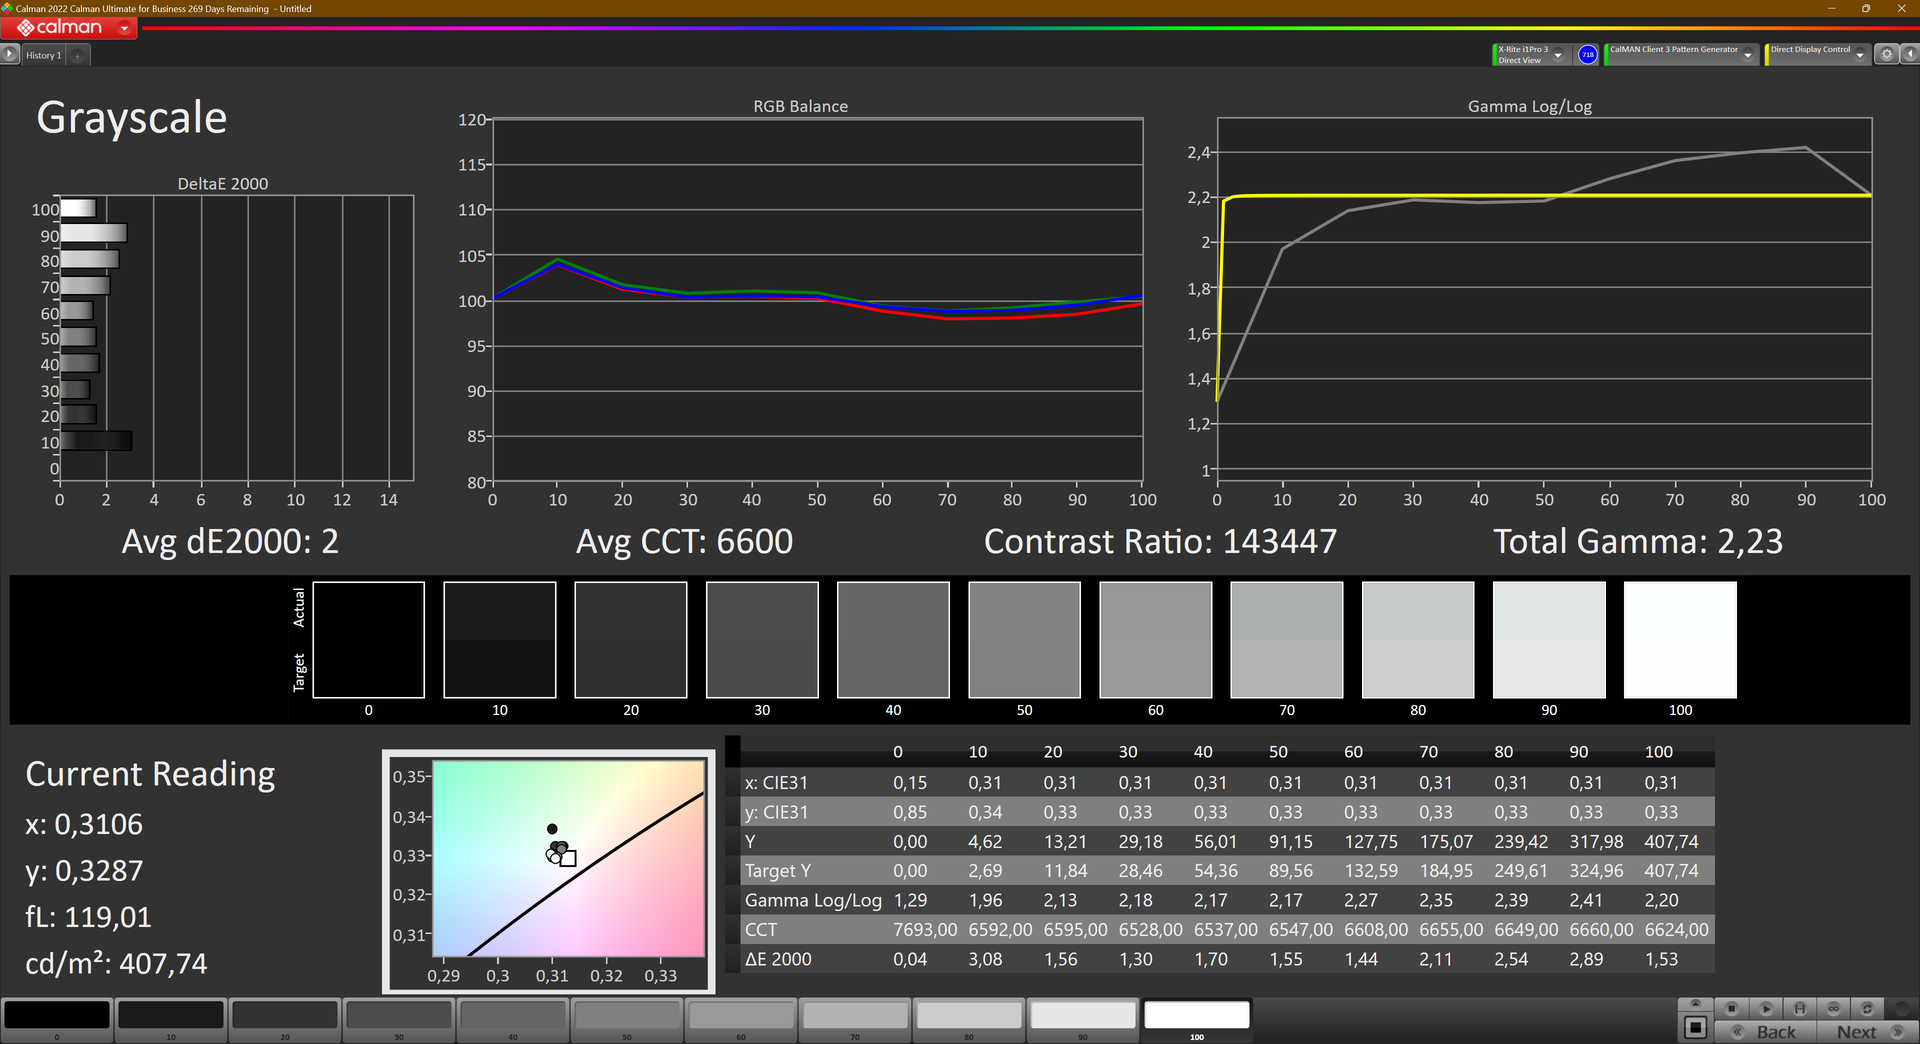
ΔE Greyscale Calman: 1.8 | ∀{0.09-98 Ø4.97}
96.9% AdobeRGB 1998 (Argyll 3D)
100% sRGB (Argyll 3D)
99.9% Display P3 (Argyll 3D)
Gamma: 2.25
CCT: 6574 K
| Lenovo ThinkPad P16s G2 21K9000CGE ATNA60YV04-0, OLED, 3840x2400, 16" | HP EliteBook 845 G10 818N0EA AUO6DA8, IPS, 2560x1600, 14" | Lenovo ThinkPad P14s G4 21K5000LGE Lenovo MNE007JA1-1, IPS, 1920x1200, 14" | Schenker Vision 16 PH6PRX1 BOE CQ NE160QDM-NZ1 , IPS, 2560x1600, 16" | Acer Swift Edge SFE16 Ryzen 7 7840U Samsung ATNA60BX03-0, OLED, 3200x2000, 16" | Lenovo ThinkPad P16v G1 AMD NE160WUM-N64, IPS, 1920x1200, 16" | Microsoft Surface Laptop Studio 2 RTX 4060 LQ144P1JX01, IPS, 2400x1600, 14.4" | |
|---|---|---|---|---|---|---|---|
| Display | -4% | -19% | -19% | 1% | -21% | -21% | |
| Display P3 Coverage (%) | 99.9 | 98.3 -2% | 69.4 -31% | 70 -30% | 99.9 0% | 67.8 -32% | 66.7 -33% |
| sRGB Coverage (%) | 100 | 99.8 0% | 99.9 0% | 99.3 -1% | 100 0% | 97.7 -2% | 99 -1% |
| AdobeRGB 1998 Coverage (%) | 96.9 | 86.2 -11% | 71.4 -26% | 71.2 -27% | 100 3% | 69.8 -28% | 68.9 -29% |
| Response Times | -628% | -2611% | -574% | 43% | -2587% | -3806% | |
| Response Time Grey 50% / Grey 80% * (ms) | 1.5 ? | 12.7 ? -747% | 45.9 ? -2960% | 11 ? -633% | 0.57 ? 62% | 50.6 ? -3273% | 77.6 ? -5073% |
| Response Time Black / White * (ms) | 1.3 ? | 7.9 ? -508% | 30.7 ? -2262% | 8 ? -515% | 1 ? 23% | 26 ? -1900% | 34.3 ? -2538% |
| PWM Frequency (Hz) | 60 | 238.8 | 17600 ? | ||||
| Screen | 9% | -11% | 3% | -44% | -51% | 35% | |
| Brightness middle (cd/m²) | 416 | 546 31% | 414 0% | 356 -14% | 379.8 -9% | 355 -15% | 511 23% |
| Brightness (cd/m²) | 421 | 564 34% | 392 -7% | 349 -17% | 383 -9% | 344 -18% | 503 19% |
| Brightness Distribution (%) | 98 | 86 -12% | 89 -9% | 93 -5% | 98 0% | 92 -6% | 89 -9% |
| Black Level * (cd/m²) | 0.38 | 0.26 | 0.28 | 0.17 | 0.26 | ||
| Colorchecker dE 2000 * | 1.3 | 1.3 -0% | 1.9 -46% | 1.7 -31% | 4.7 -262% | 2.9 -123% | 0.5 62% |
| Colorchecker dE 2000 max. * | 2.8 | 5.3 -89% | 3.6 -29% | 3 -7% | 7.51 -168% | 5.6 -100% | 1.1 61% |
| Colorchecker dE 2000 calibrated * | 2.9 | 1.2 59% | 0.8 72% | 1 66% | 0.55 81% | 1 66% | |
| Greyscale dE 2000 * | 1.8 | 1.1 39% | 2.9 -61% | 1.3 28% | 0.8 56% | 4.7 -161% | 0.8 56% |
| Gamma | 2.25 98% | 2.27 97% | 2.26 97% | 2.1 105% | 2.22 99% | 2.12 104% | 2.19 100% |
| CCT | 6574 99% | 6463 101% | 6227 104% | 6625 98% | 6381 102% | 6356 102% | 6650 98% |
| Contrast (:1) | 1437 | 1592 | 1271 | 2088 | 1965 | ||
| Média Total (Programa/Configurações) | -208% /
-101% | -880% /
-447% | -197% /
-99% | 0% /
-19% | -886% /
-466% | -1264% /
-678% |
* ... menor é melhor
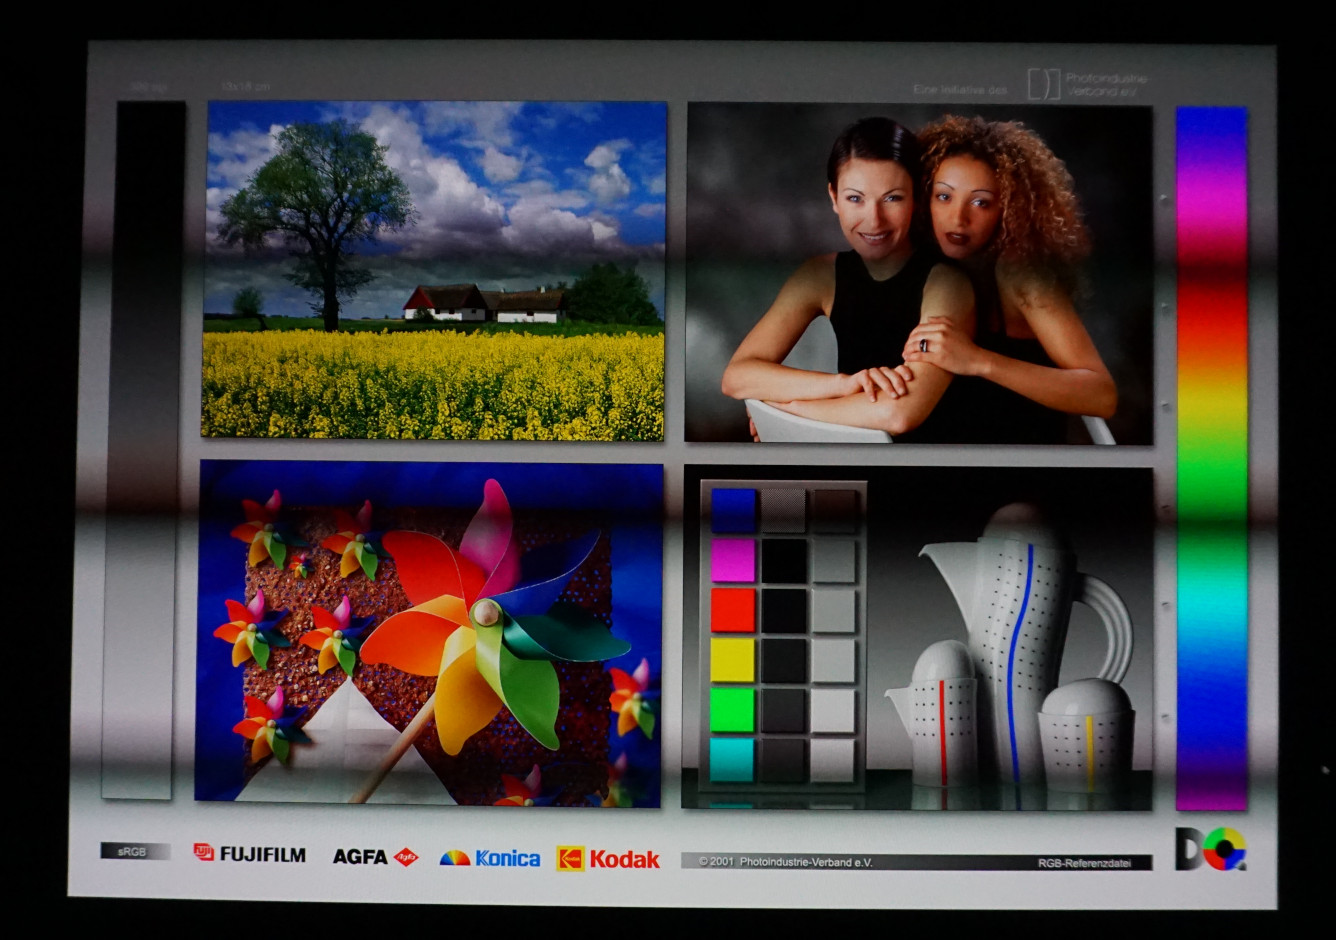
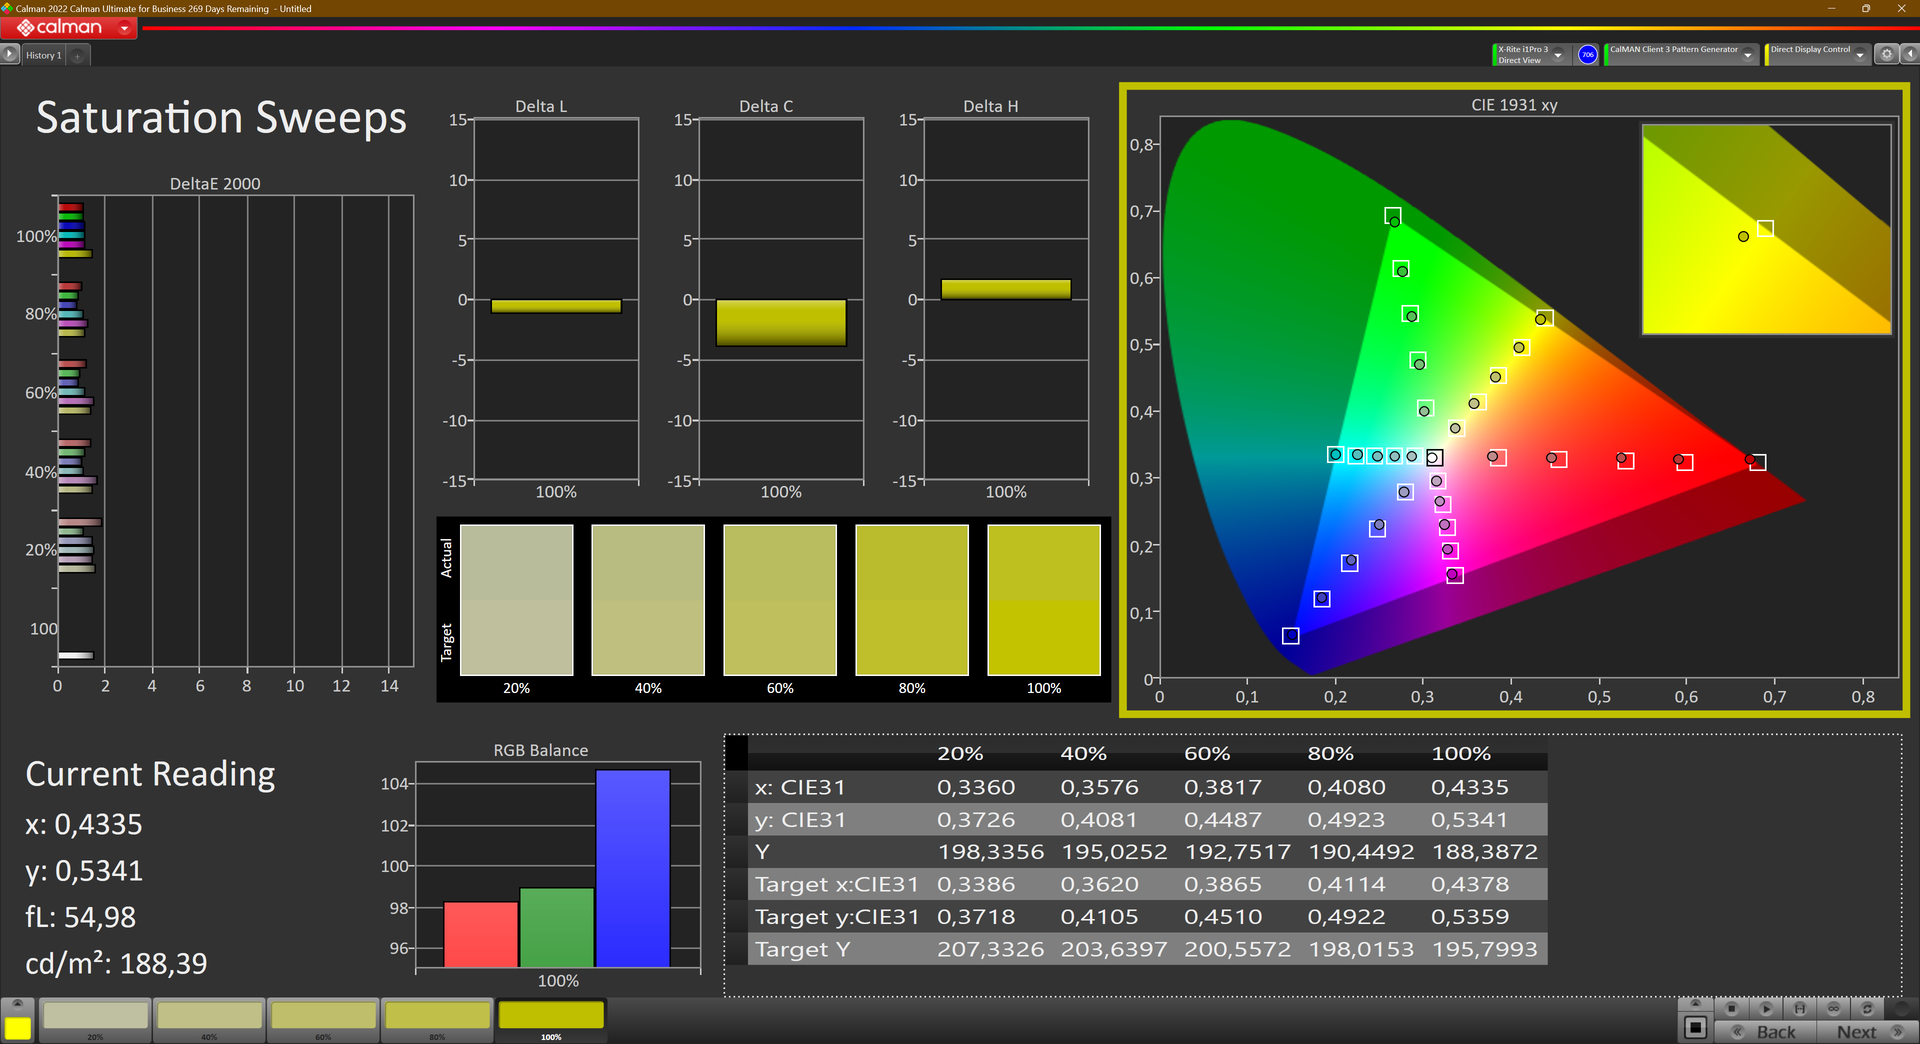
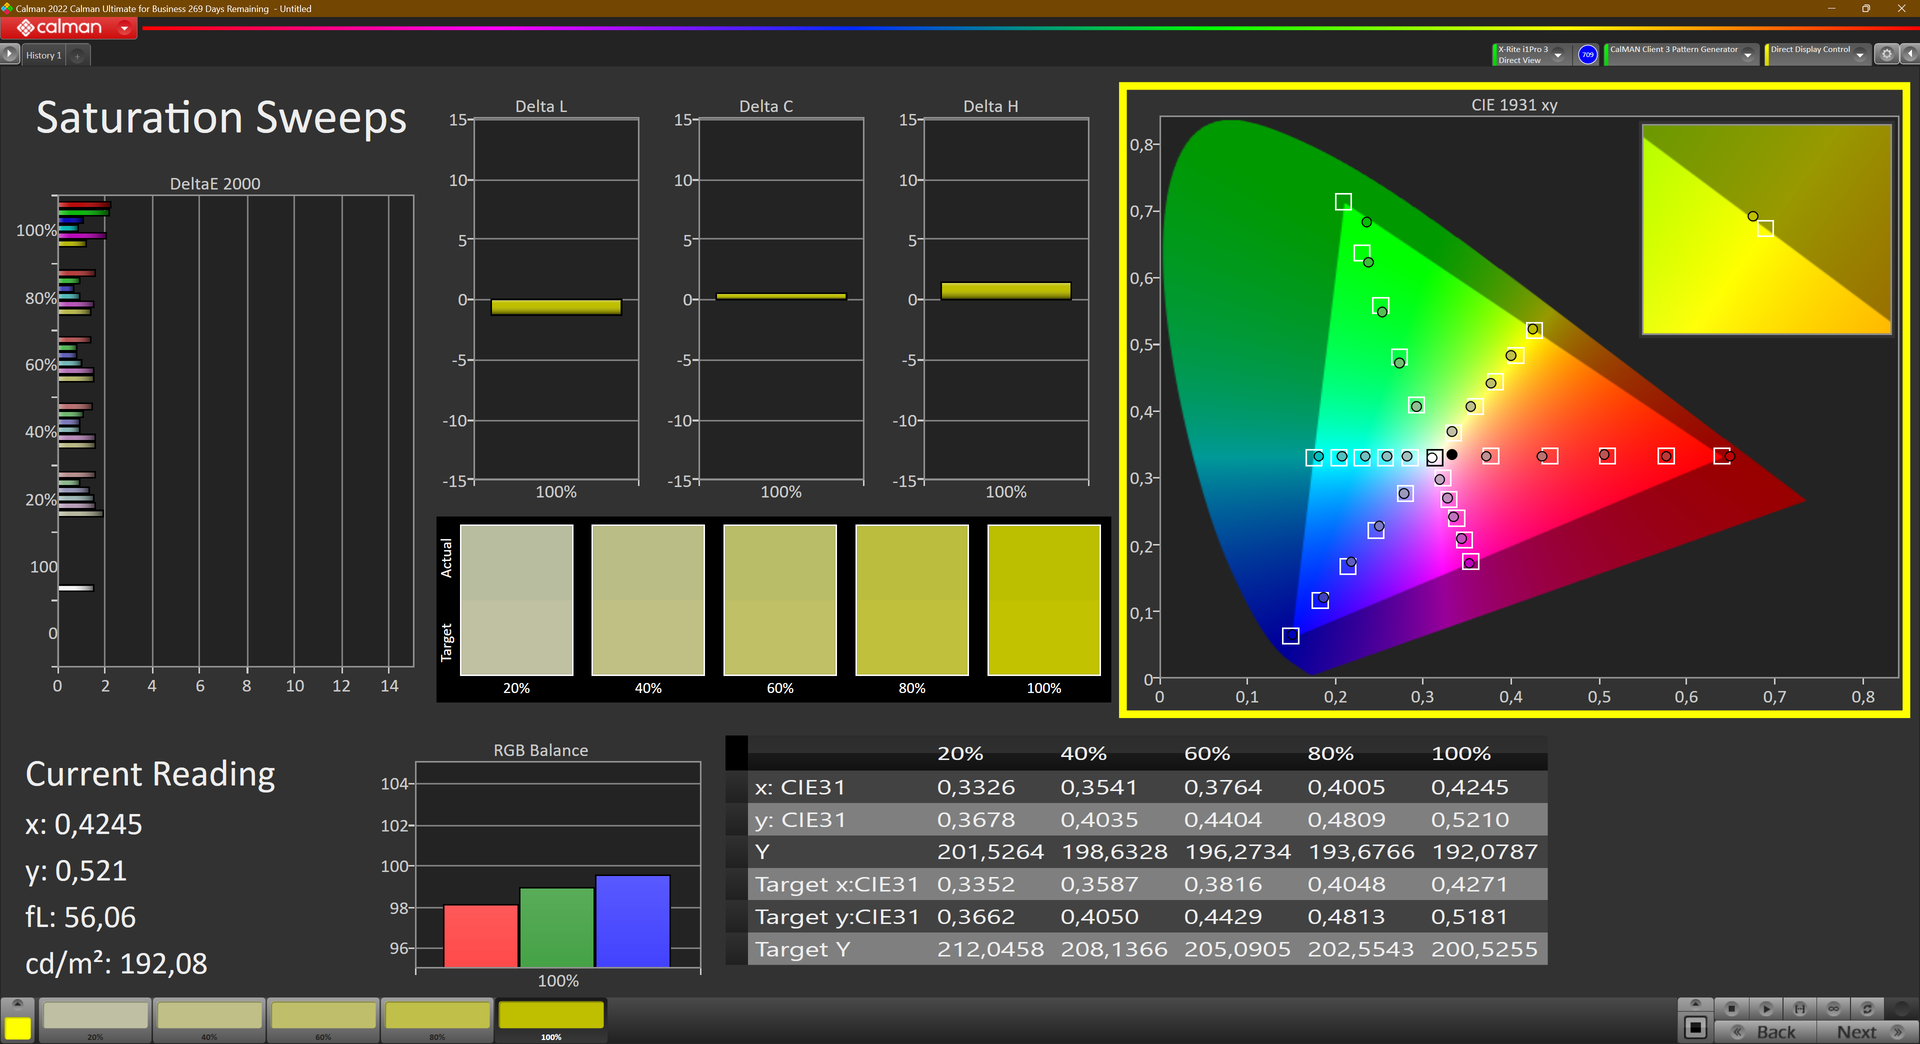
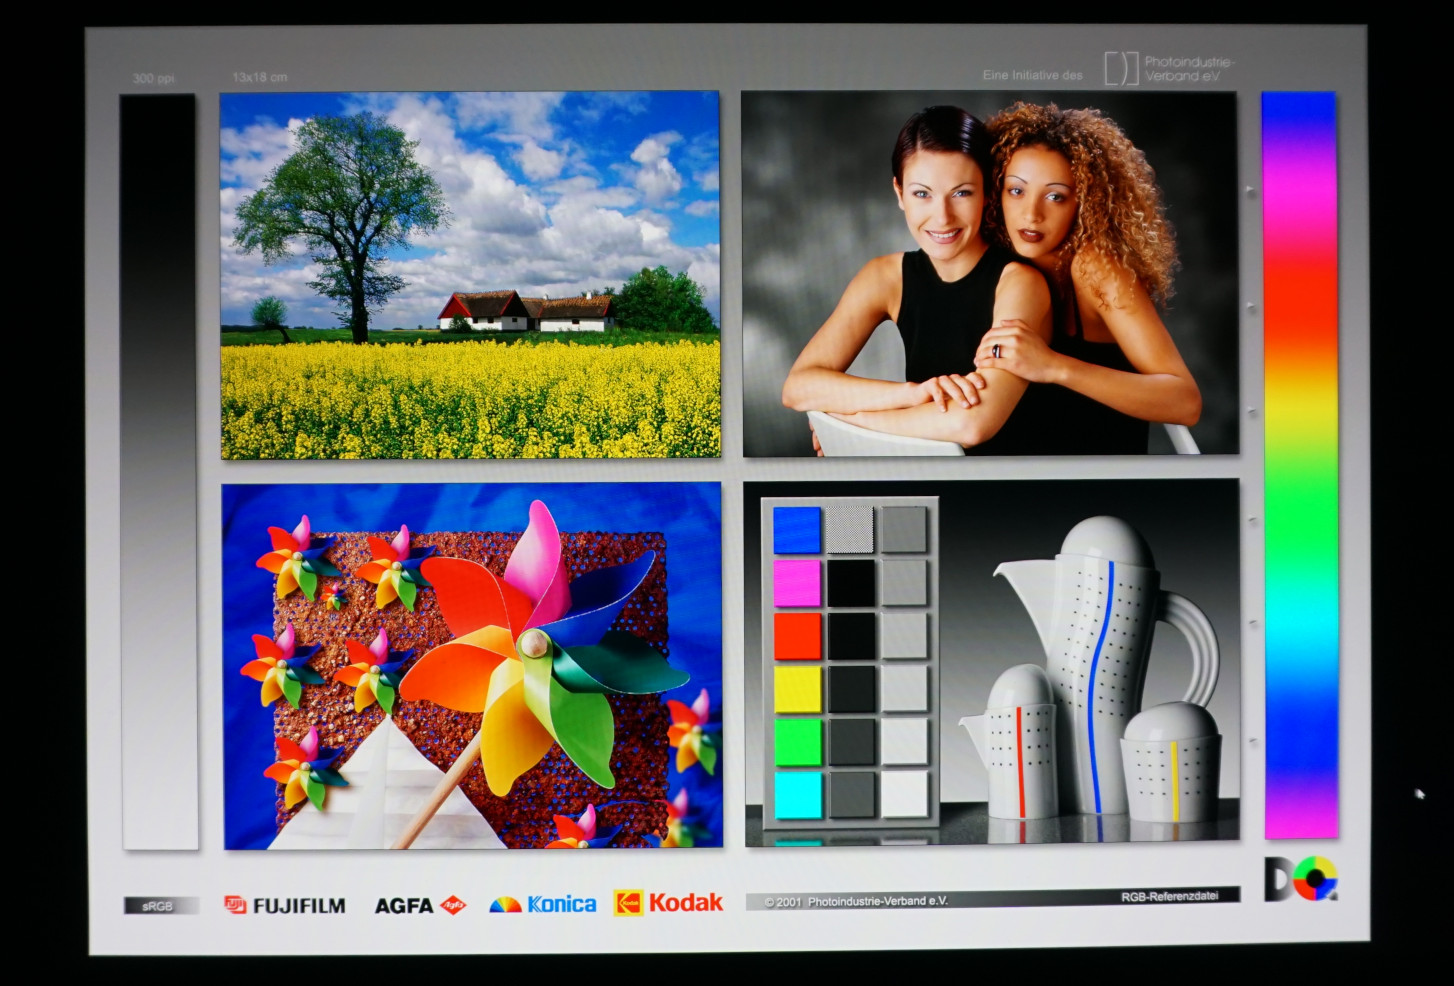
A tela OLED é tão generosa quanto o esperado quando se trata de representação de cores. Ele cobre completamente o Display-P3, um espaço de cores usado para produções de vídeo profissionais. Ele só não cobre o AdobeRGB em sua totalidade.
Ao medir a precisão das cores da tela, observamos valores abaixo do que é perceptível a olho nu - mesmo quando se tratava dos maiores desvios. Em média, os desvios foram ainda menores. Isso significa que as cores são representadas com precisão quase perfeita.

Exibir tempos de resposta
| ↔ Tempo de resposta preto para branco | ||
|---|---|---|
| 1.3 ms ... ascensão ↗ e queda ↘ combinadas | ↗ 0.7 ms ascensão | 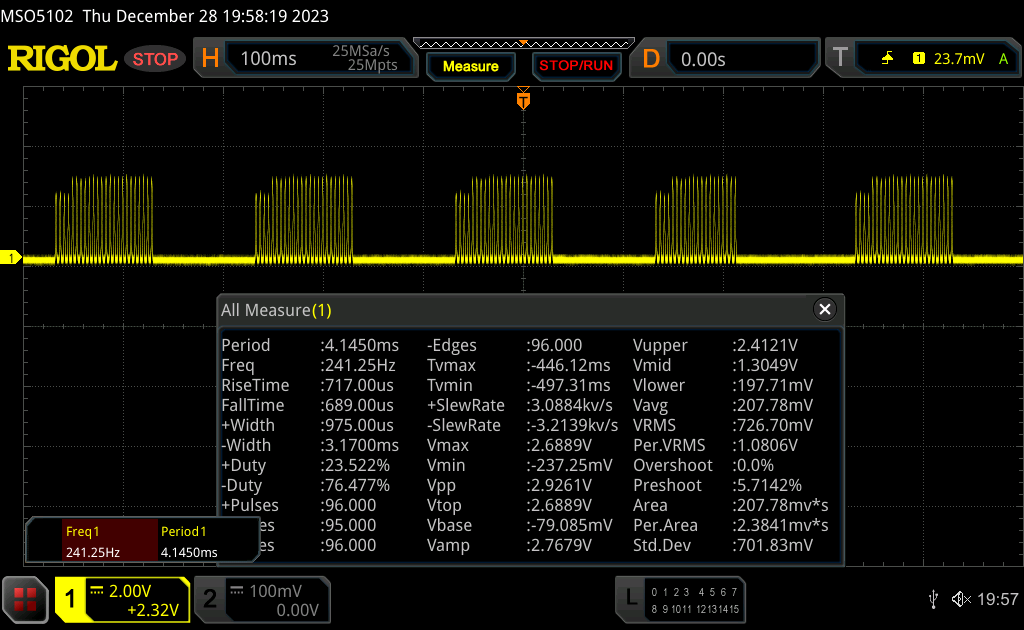 |
| ↘ 0.6 ms queda | ||
| A tela mostra taxas de resposta muito rápidas em nossos testes e deve ser muito adequada para jogos em ritmo acelerado. Em comparação, todos os dispositivos testados variam de 0.1 (mínimo) a 240 (máximo) ms. » 7 % de todos os dispositivos são melhores. Isso significa que o tempo de resposta medido é melhor que a média de todos os dispositivos testados (19.9 ms). | ||
| ↔ Tempo de resposta 50% cinza a 80% cinza | ||
| 1.5 ms ... ascensão ↗ e queda ↘ combinadas | ↗ 0.8 ms ascensão | 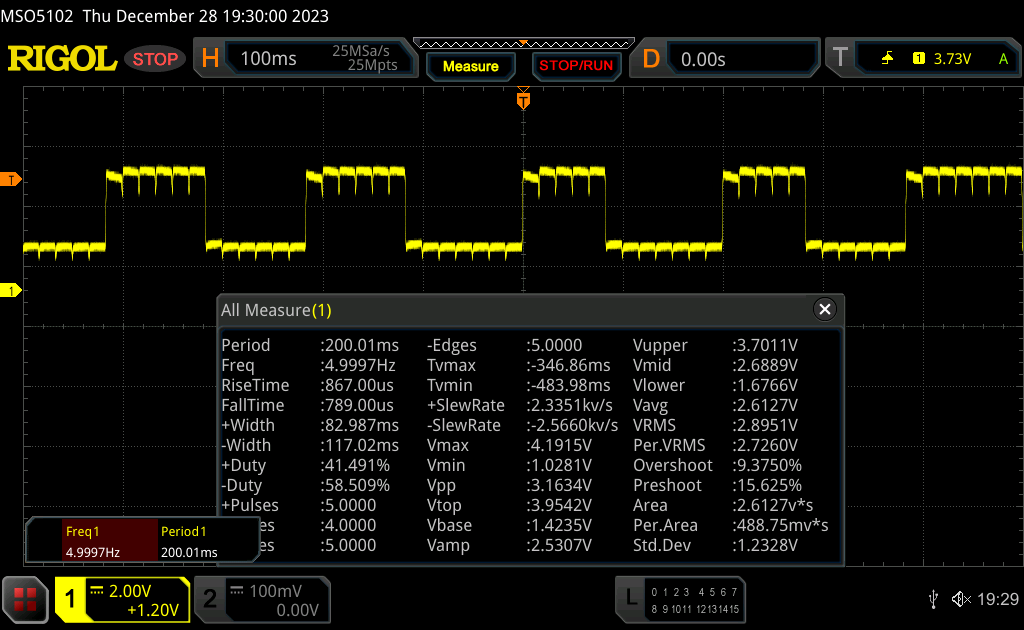 |
| ↘ 0.7 ms queda | ||
| A tela mostra taxas de resposta muito rápidas em nossos testes e deve ser muito adequada para jogos em ritmo acelerado. Em comparação, todos os dispositivos testados variam de 0.165 (mínimo) a 636 (máximo) ms. » 7 % de todos os dispositivos são melhores. Isso significa que o tempo de resposta medido é melhor que a média de todos os dispositivos testados (31.1 ms). | ||
Cintilação da tela / PWM (modulação por largura de pulso)
| Tela tremeluzindo/PWM detectado | 60 Hz | 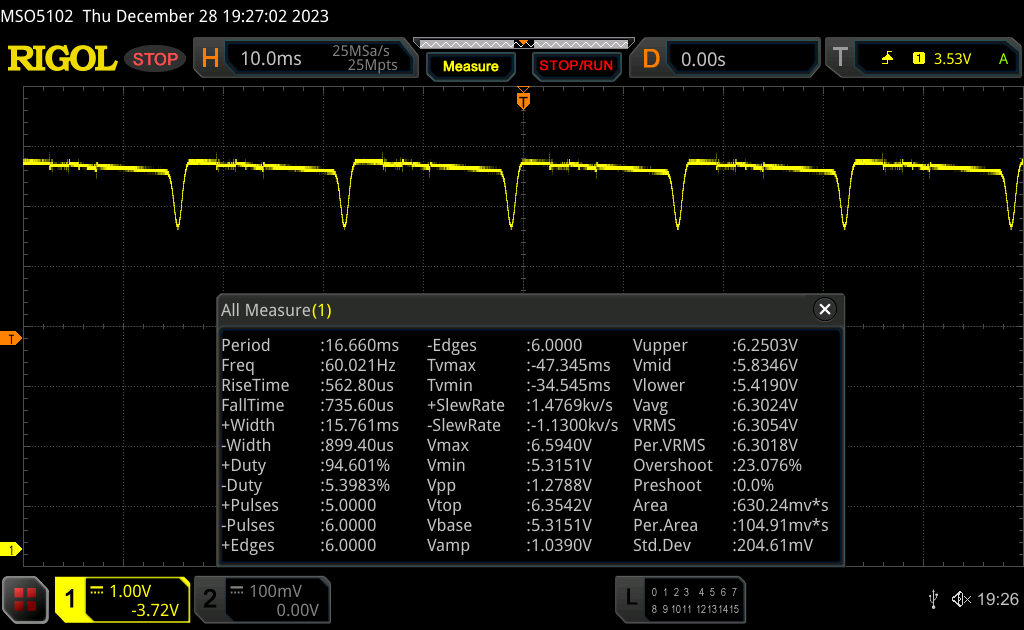 | |
A luz de fundo da tela pisca em 60 Hz (pior caso, por exemplo, utilizando PWM) . A frequência de 60 Hz é muito baixa, portanto a oscilação pode causar fadiga ocular e dores de cabeça após uso prolongado. [pwm_comparison] Em comparação: 52 % de todos os dispositivos testados não usam PWM para escurecer a tela. Se PWM foi detectado, uma média de 7798 (mínimo: 5 - máximo: 343500) Hz foi medida. | |||

Os altos níveis de contraste e o brilho de mais de 400 cd/m² garantem que o conteúdo permaneça legível mesmo em ambientes externos. No entanto, o senhor deve procurar um local com sombra, pois os reflexos podem atrapalhar.
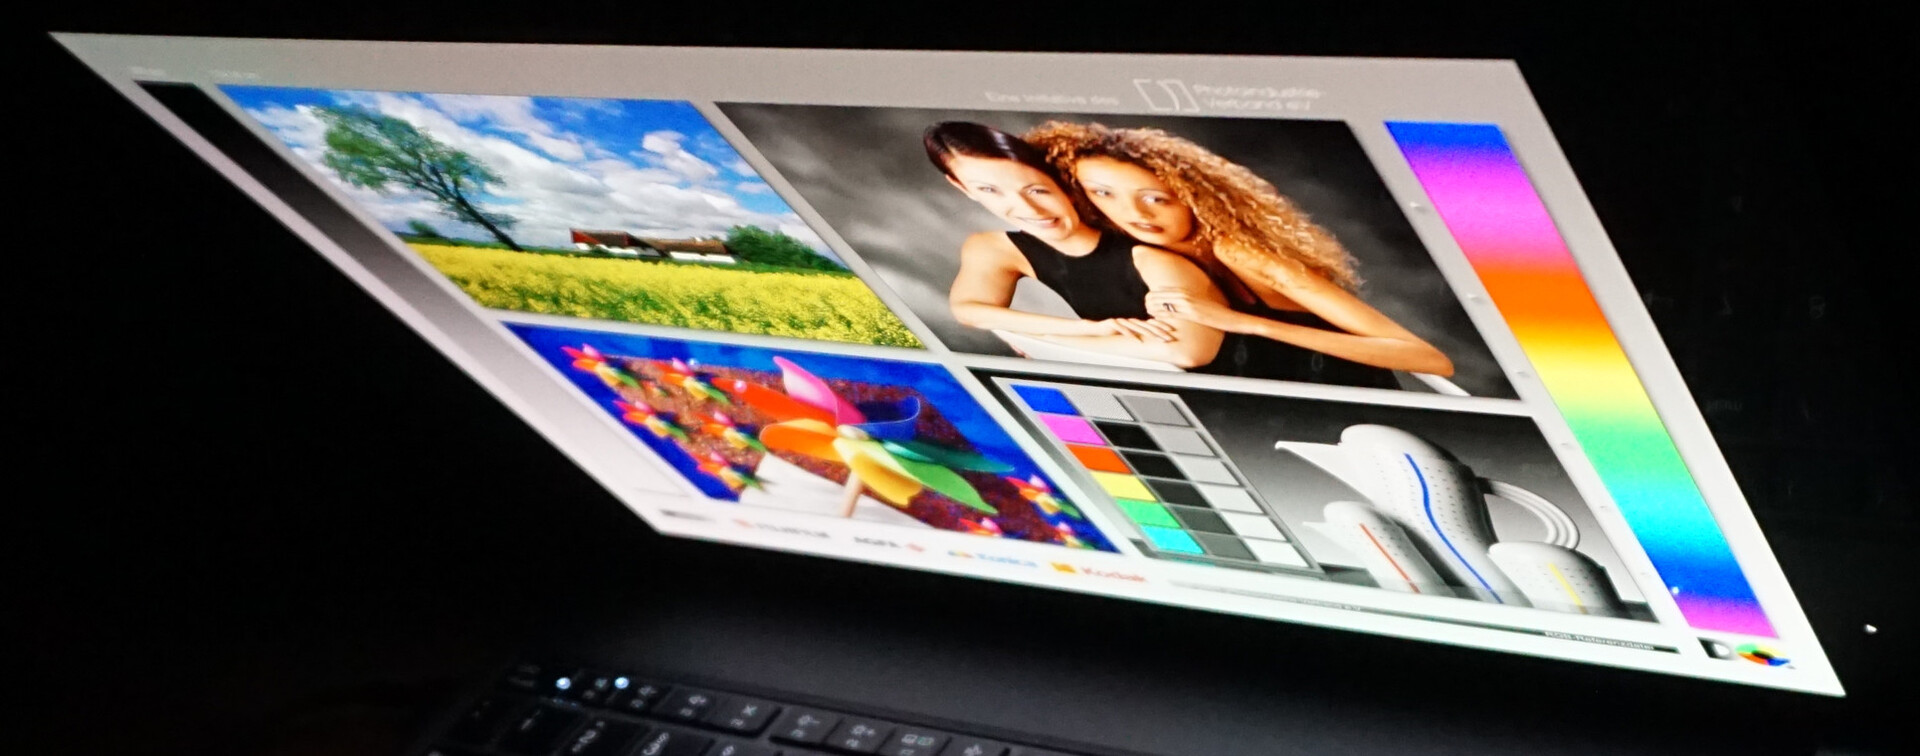
As cores e o brilho permanecem sempre os mesmos, quase independentemente do ângulo de visualização. As distorções de cores típicas das telas OLED só ocorrem a mais de 80 graus.
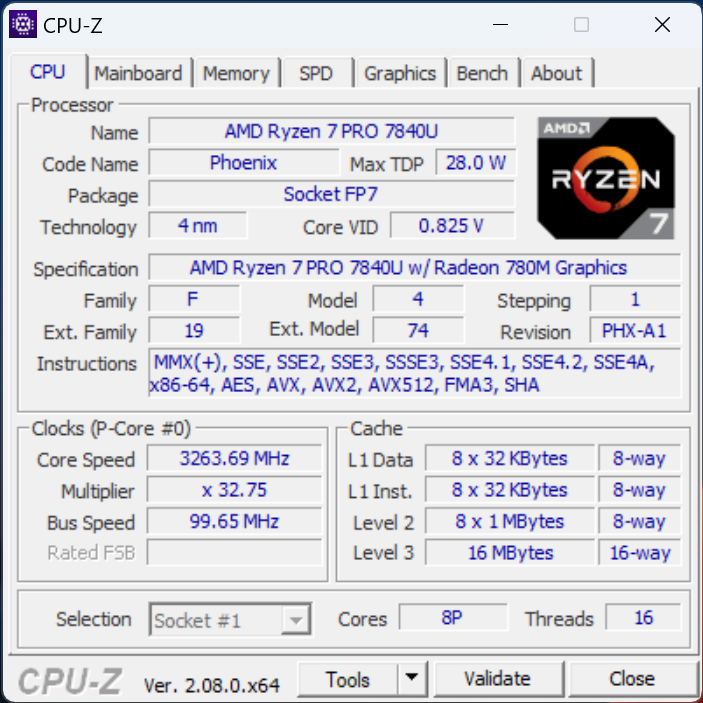
Desempenho - Ryzen 7 sob potência
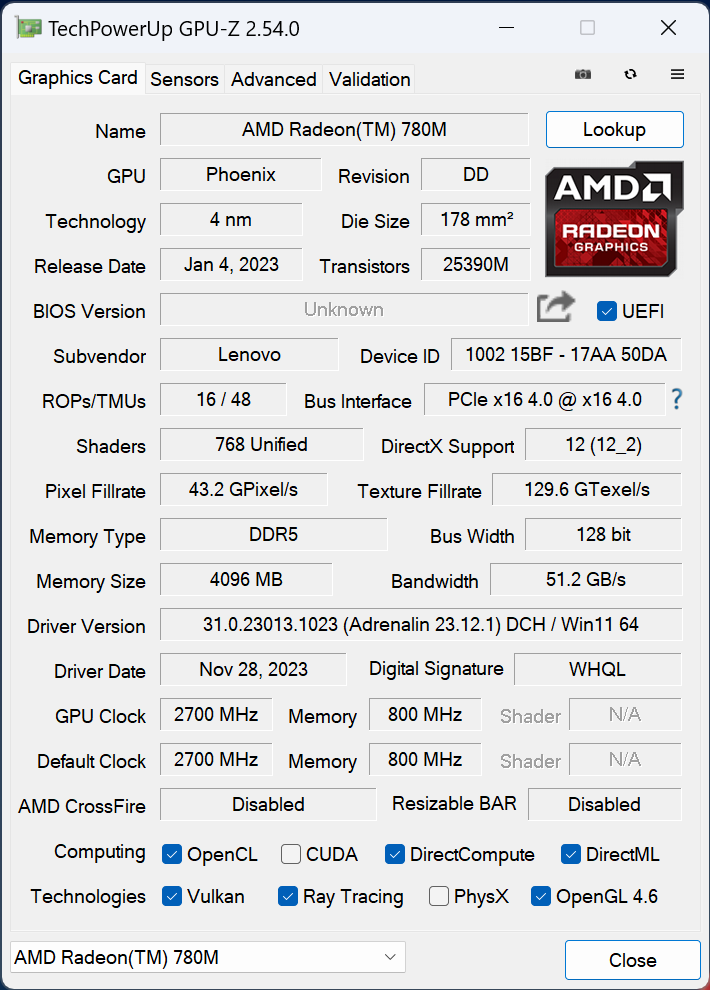
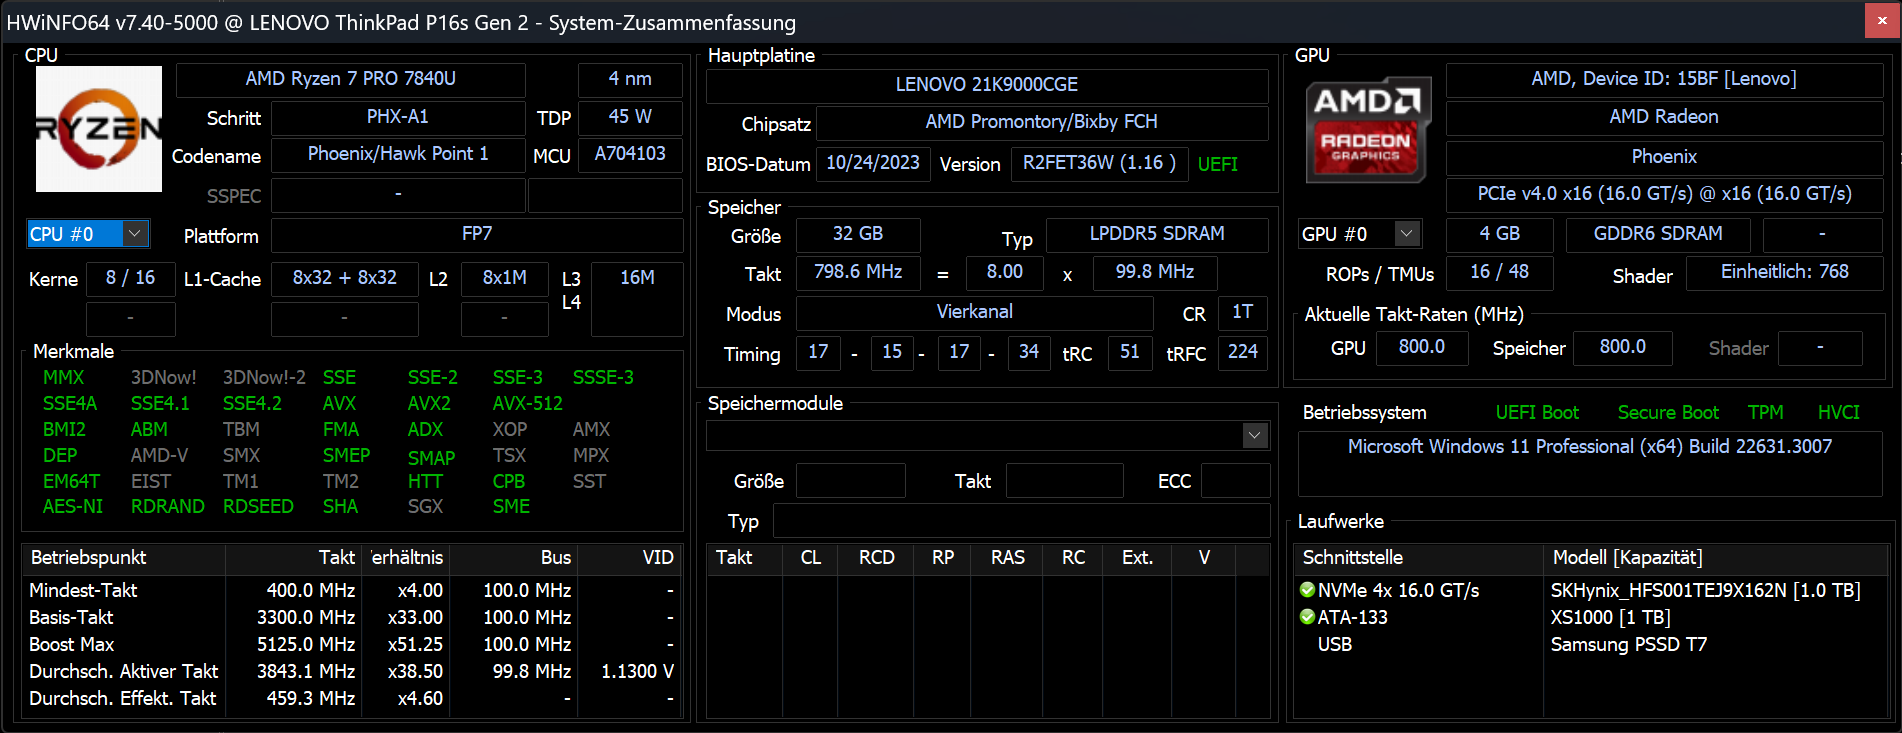
O AMD Ryzen 7 Pro 7840U é a força motriz dos ThinkPads P16s G2, juntamente com sua Radeon 780M iGPU. Essa combinação não só resulta em uma potência de computação surpreendente, mas também cria um forte desempenho gráfico - pelo menos para uma GPU integrada. A eficiência do sistema também não precisa ser desprezada. Além disso, o senhor também tem a opção de escolher o menor AMD Ryzen 5 Pro 7540U com a Radeon 740M.
Além do alto desempenho para um sistema móvel, a série Pro também apresenta um chip de segurança e muitas opções de manutenção remota, que são particularmente úteis para uso em frotas.
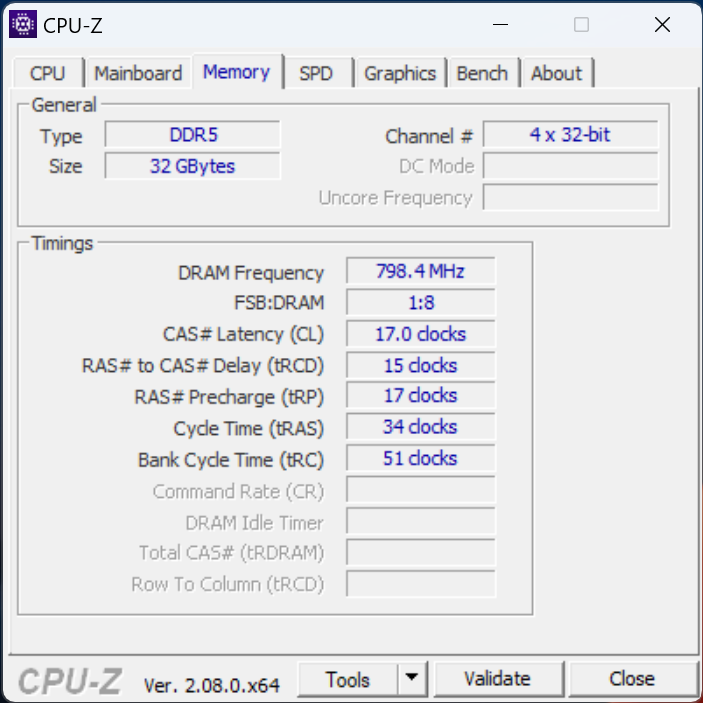
Além disso, o senhor pode escolher entre três tamanhos de RAM, a saber, 16, 32 ou 64 GB a 6.400 MHz. Elas são soldadas, o que significa que não podem ser trocadas ou expandidas.
Condições de teste
Estão disponíveis os três modos de desempenho conhecidos do Windows: desempenho máximo, balanceado e economia de energia máxima. Usando o software fornecido "Lenovo Commercial Vantage", o desempenho é sempre definido para a configuração mais alta. Mesmo usando a configuração baixa, o consumo de energia da CPU permanece bastante alto. Realizamos todos os nossos testes usando o modo de desempenho mais alto.
Por outro lado, se o senhor selecionar o modo balanceado, a potência de computação do laptop será ligeiramente reduzida. Entretanto, o senhor não deve perceber isso ao inicializar aplicativos, navegar na Web ou durante a maioria das outras tarefas diárias. Por sua vez, o ruído da ventoinha diminui apenas um pouco, mas mesmo usando o modo de desempenho mais alto, ele nunca atrapalha. Como esperado, seu desempenho diminui ainda mais no modo de economia de energia . Ao mesmo tempo, suas velocidades de computação permanecem bastante altas, enquanto a inicialização de programas leva a um pequeno atraso. Além disso, as ventoinhas permanecem consideravelmente mais silenciosas com esse modo selecionado.
Se o senhor desconectar o dispositivo da rede elétrica, as configurações mudarão para balanceadas. No entanto, elas podem ser alteradas de volta para o máximo imediatamente. Como resultado, o senhor tem acesso ao mais alto desempenho do laptop, mesmo no modo de bateria. A tabela a seguir mostra como exatamente os limites de energia mudam:
| PL2 | PL1 | |
|---|---|---|
| O mais alto desempenho | 51 watts | 41 watts |
| Equilibrado | 40 watts | 36 watts |
| Economia de energia | 32 watts | 30 watts |
Processador
Como esperado, o AMD Ryzen 7 Pro 7840U que, além disso, foi ajustado para aumentar a eficiência, oferece taxas de desempenho muito altas. Ele é uma das CPUs móveis mais potentes. Com um total de 16 threads e uma taxa de clock máxima acima de 5 GHz, ele sempre tem muitas reservas para multitarefa e usos complexos - como o senhor esperaria de um laptop de estação de trabalho.
Sua fonte de alimentação máxima de 51 watts é adequada para um modelo de 16 polegadas e se equilibra em 41 watts durante um período de tempo mais longo. O modelo de 14 polegadas ThinkPad P14s G4 de 14 polegadas com uma CPU idêntica tem acesso a 20% menos energia, por exemplo, e teve um desempenho pior nos benchmarks de CPU.
Mas até mesmo o AMD Ryzen 9 Pro 7940HS no HP EliteBook 845 G10que é melhor no papel, só conseguiu acompanhar o ritmo. O Intel Core i7-13700H também está em um nível semelhante, mas dentro do Microsoft Surface Laptop Studio 2por exemplo, ele se saiu pior sob carga permanente. Além disso, o consumo de energia do i7-13700H é muito maior.
Como resultado, nosso dispositivo de teste causou uma impressão total muito boa em todos os testes, fornecendo resultados acima da média com valores moderados de consumo de energia. A CPU da AMD se sai extremamente bem dentro do ThinkPad P16s G2.
O senhor pode encontrar outros benchmarks em nossa lista de benchmarks de CPU http://www.notebookcheck.com/Mobile-Prozessoren-Benchmarkliste.1809.0.html.
Cinebench R15 Multi continuous test
Cinebench R23: Multi Core | Single Core
Cinebench R20: CPU (Multi Core) | CPU (Single Core)
Cinebench R15: CPU Multi 64Bit | CPU Single 64Bit
Blender: v2.79 BMW27 CPU
7-Zip 18.03: 7z b 4 | 7z b 4 -mmt1
Geekbench 5.5: Multi-Core | Single-Core
HWBOT x265 Benchmark v2.2: 4k Preset
LibreOffice : 20 Documents To PDF
R Benchmark 2.5: Overall mean
| HWBOT x265 Benchmark v2.2 / 4k Preset | |
| Média da turma Workstation (14.4 - 40.5, n=25, últimos 2 anos) | |
| Lenovo ThinkPad P16v G1 AMD | |
| Lenovo ThinkPad P16s G2 21K9000CGE | |
| Microsoft Surface Laptop Studio 2 RTX 4060 | |
| HP EliteBook 845 G10 818N0EA | |
| MSI Prestige 16 B1MG-001US | |
| Lenovo ThinkPad P14s G4 21K5000LGE | |
| Média AMD Ryzen 7 PRO 7840U (13.6 - 17.8, n=5) | |
| Acer Swift Edge SFE16 Ryzen 7 7840U | |
| Schenker Vision 16 PH6PRX1 | |
| Lenovo ThinkPad P15v G3 21EM001AGE | |
| Lenovo ThinkPad X1 Carbon G11 21HNS54T00 | |
* ... menor é melhor
AIDA64: FP32 Ray-Trace | FPU Julia | CPU SHA3 | CPU Queen | FPU SinJulia | FPU Mandel | CPU AES | CPU ZLib | FP64 Ray-Trace | CPU PhotoWorxx
* ... menor é melhor
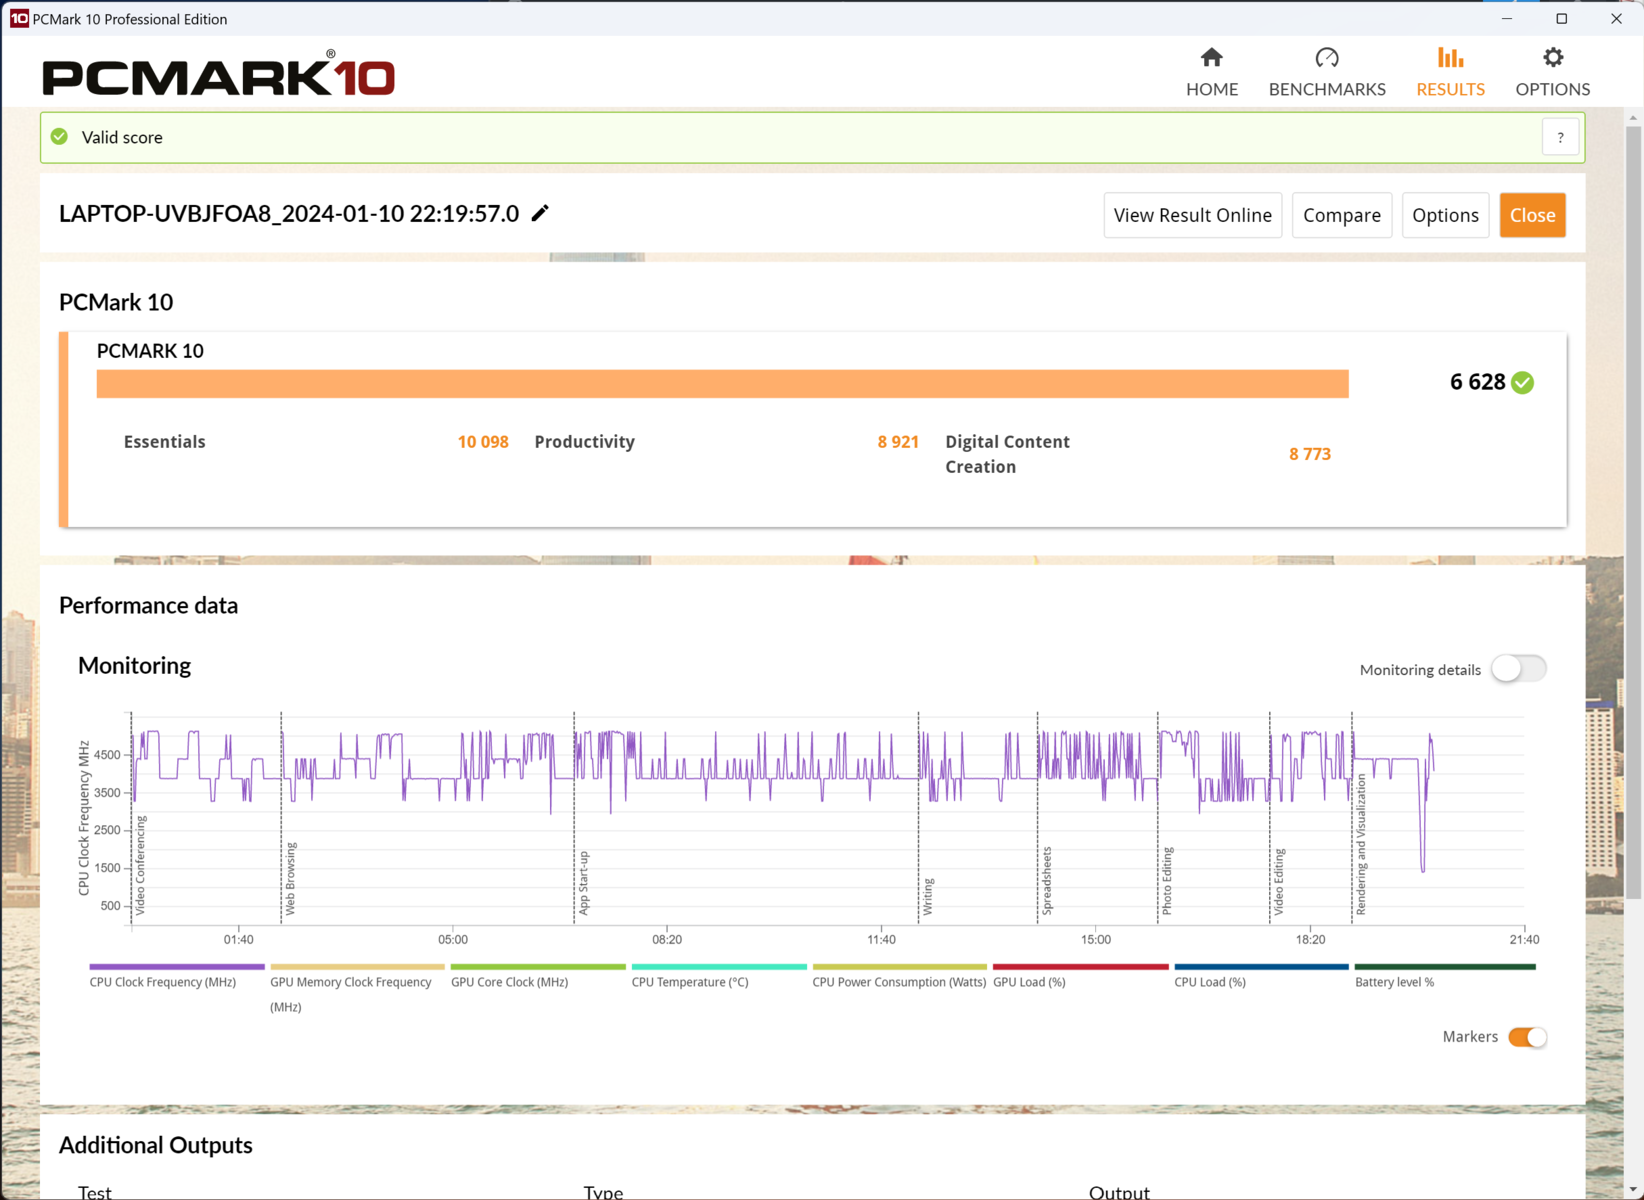
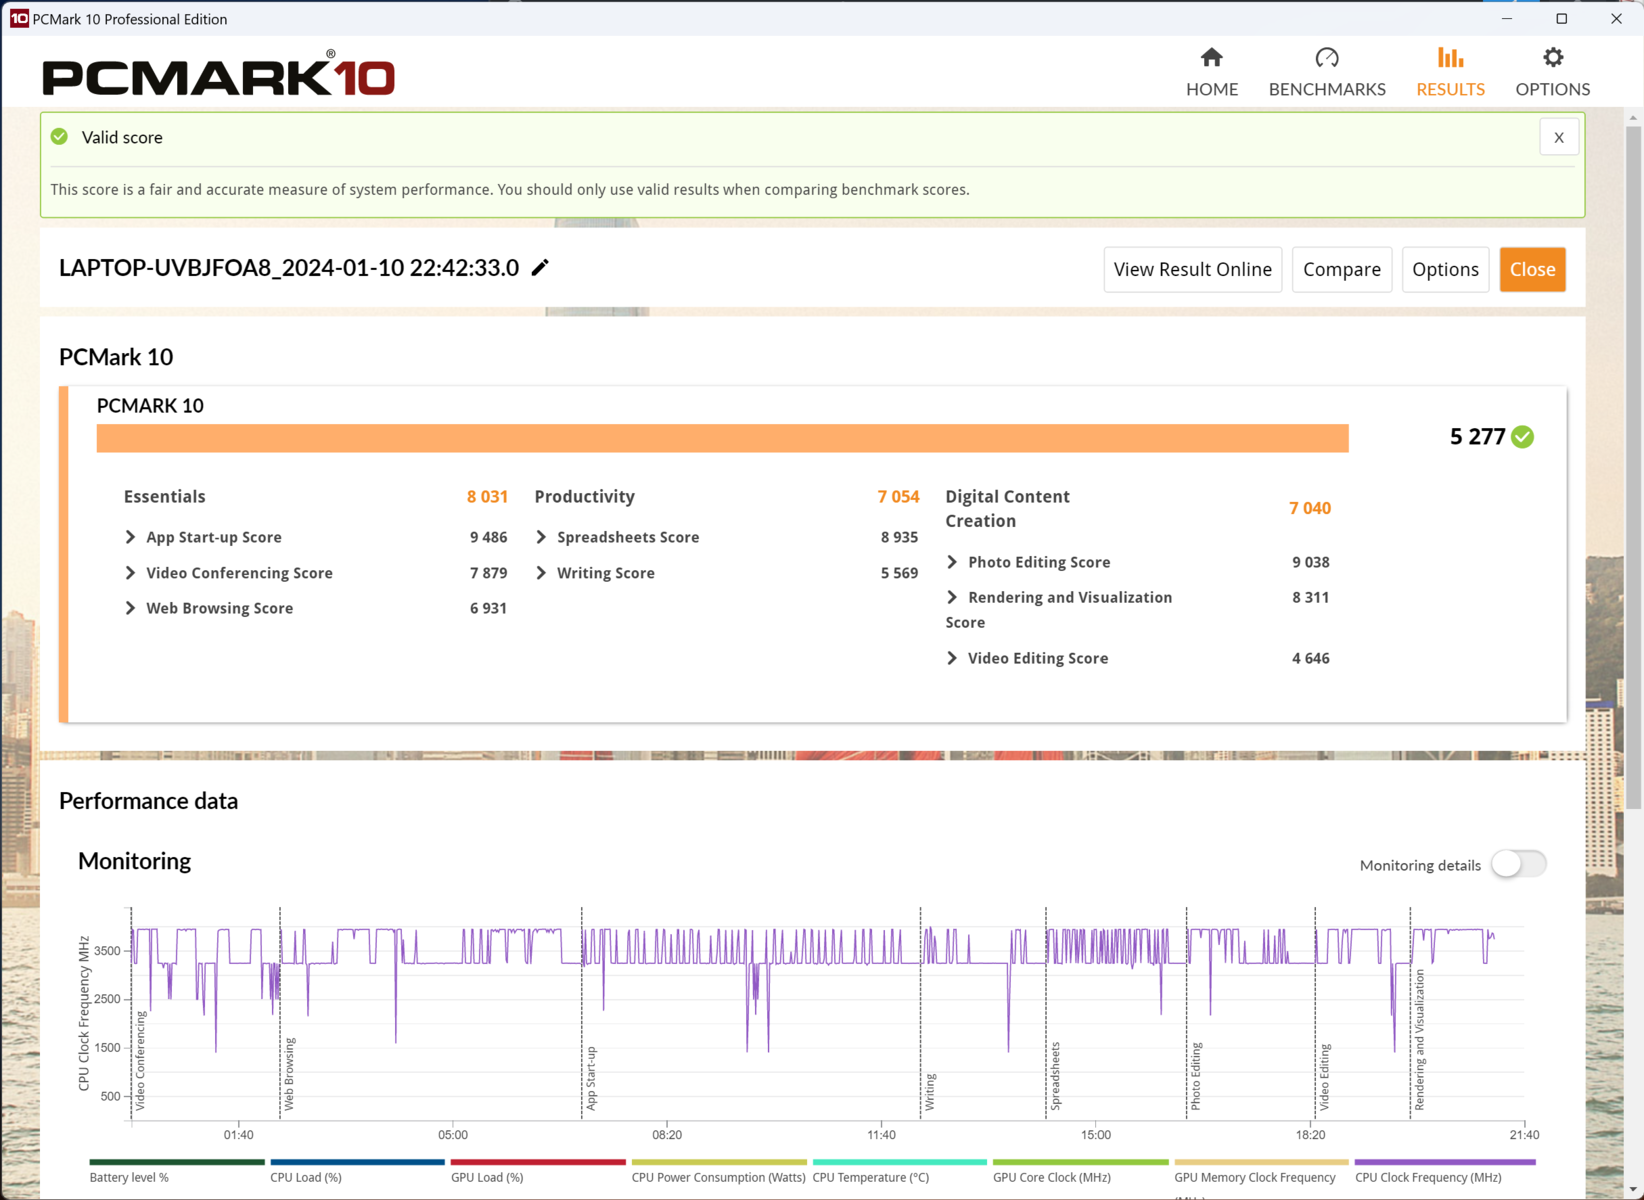
Desempenho do sistema
O desempenho geral do sistema do ThinkPad P16s G2 está em um nível muito alto. Ele superou claramente o Schenker Vision 16 com um i7-13700Hpor exemplo. E até mesmo um Lenovo ThinkPad P16v melhor configurado com uma placa de vídeo dedicada estava apenas alguns pontos percentuais à frente.
Isso significa que o manuseio do AMD G2 do P16s é suave, quase independente da carga atual. Mesmo com os benchmarks sendo executados em segundo plano, o laptop ainda pode ser operado bem e reage rapidamente. O senhor pode usar vários programas ao mesmo tempo e os processos de instalação ou tarefas complexas podem ser concluídos rapidamente.
CrossMark: Overall | Productivity | Creativity | Responsiveness
WebXPRT 3: Overall
WebXPRT 4: Overall
Mozilla Kraken 1.1: Total
| PCMark 10 / Score | |
| Média da turma Workstation (6436 - 10409, n=21, últimos 2 anos) | |
| Microsoft Surface Laptop Studio 2 RTX 4060 | |
| MSI Prestige 16 B1MG-001US | |
| Lenovo ThinkPad P16v G1 AMD | |
| Acer Swift Edge SFE16 Ryzen 7 7840U | |
| Média AMD Ryzen 7 PRO 7840U, AMD Radeon 780M (6541 - 7012, n=5) | |
| Lenovo ThinkPad P14s G4 21K5000LGE | |
| Lenovo ThinkPad P16s G2 21K9000CGE | |
| HP EliteBook 845 G10 818N0EA | |
| Lenovo ThinkPad P15v G3 21EM001AGE | |
| Schenker Vision 16 PH6PRX1 | |
| Lenovo ThinkPad X1 Carbon G11 21HNS54T00 | |
| PCMark 10 / Essentials | |
| MSI Prestige 16 B1MG-001US | |
| Acer Swift Edge SFE16 Ryzen 7 7840U | |
| Microsoft Surface Laptop Studio 2 RTX 4060 | |
| Lenovo ThinkPad X1 Carbon G11 21HNS54T00 | |
| Média da turma Workstation (9622 - 11157, n=21, últimos 2 anos) | |
| Média AMD Ryzen 7 PRO 7840U, AMD Radeon 780M (10055 - 10934, n=5) | |
| Lenovo ThinkPad P16v G1 AMD | |
| Lenovo ThinkPad P16s G2 21K9000CGE | |
| Lenovo ThinkPad P14s G4 21K5000LGE | |
| Schenker Vision 16 PH6PRX1 | |
| Lenovo ThinkPad P15v G3 21EM001AGE | |
| HP EliteBook 845 G10 818N0EA | |
| PCMark 10 / Productivity | |
| Média da turma Workstation (8789 - 20616, n=21, últimos 2 anos) | |
| Acer Swift Edge SFE16 Ryzen 7 7840U | |
| Lenovo ThinkPad P16v G1 AMD | |
| Média AMD Ryzen 7 PRO 7840U, AMD Radeon 780M (8921 - 9933, n=5) | |
| Microsoft Surface Laptop Studio 2 RTX 4060 | |
| Lenovo ThinkPad P14s G4 21K5000LGE | |
| HP EliteBook 845 G10 818N0EA | |
| Lenovo ThinkPad P16s G2 21K9000CGE | |
| MSI Prestige 16 B1MG-001US | |
| Lenovo ThinkPad P15v G3 21EM001AGE | |
| Lenovo ThinkPad X1 Carbon G11 21HNS54T00 | |
| Schenker Vision 16 PH6PRX1 | |
| PCMark 10 / Digital Content Creation | |
| Média da turma Workstation (7744 - 15631, n=21, últimos 2 anos) | |
| Microsoft Surface Laptop Studio 2 RTX 4060 | |
| MSI Prestige 16 B1MG-001US | |
| Lenovo ThinkPad P16v G1 AMD | |
| Lenovo ThinkPad P16s G2 21K9000CGE | |
| Lenovo ThinkPad P14s G4 21K5000LGE | |
| Lenovo ThinkPad P15v G3 21EM001AGE | |
| Média AMD Ryzen 7 PRO 7840U, AMD Radeon 780M (7806 - 8874, n=5) | |
| Acer Swift Edge SFE16 Ryzen 7 7840U | |
| HP EliteBook 845 G10 818N0EA | |
| Schenker Vision 16 PH6PRX1 | |
| Lenovo ThinkPad X1 Carbon G11 21HNS54T00 | |
| CrossMark / Overall | |
| Média da turma Workstation (1307 - 2267, n=24, últimos 2 anos) | |
| Lenovo ThinkPad X1 Carbon G11 21HNS54T00 | |
| Acer Swift Edge SFE16 Ryzen 7 7840U | |
| MSI Prestige 16 B1MG-001US | |
| Microsoft Surface Laptop Studio 2 RTX 4060 | |
| Schenker Vision 16 PH6PRX1 | |
| Média AMD Ryzen 7 PRO 7840U, AMD Radeon 780M (1533 - 1669, n=5) | |
| Lenovo ThinkPad P16s G2 21K9000CGE | |
| Lenovo ThinkPad P14s G4 21K5000LGE | |
| Lenovo ThinkPad P16v G1 AMD | |
| HP EliteBook 845 G10 818N0EA | |
| Lenovo ThinkPad P15v G3 21EM001AGE | |
| CrossMark / Productivity | |
| Acer Swift Edge SFE16 Ryzen 7 7840U | |
| Média da turma Workstation (1130 - 2122, n=24, últimos 2 anos) | |
| Lenovo ThinkPad X1 Carbon G11 21HNS54T00 | |
| MSI Prestige 16 B1MG-001US | |
| Schenker Vision 16 PH6PRX1 | |
| Microsoft Surface Laptop Studio 2 RTX 4060 | |
| Lenovo ThinkPad P16v G1 AMD | |
| Média AMD Ryzen 7 PRO 7840U, AMD Radeon 780M (1461 - 1624, n=5) | |
| Lenovo ThinkPad P16s G2 21K9000CGE | |
| Lenovo ThinkPad P14s G4 21K5000LGE | |
| Lenovo ThinkPad P15v G3 21EM001AGE | |
| HP EliteBook 845 G10 818N0EA | |
| CrossMark / Creativity | |
| Média da turma Workstation (1657 - 2725, n=24, últimos 2 anos) | |
| Lenovo ThinkPad X1 Carbon G11 21HNS54T00 | |
| Microsoft Surface Laptop Studio 2 RTX 4060 | |
| MSI Prestige 16 B1MG-001US | |
| Acer Swift Edge SFE16 Ryzen 7 7840U | |
| Média AMD Ryzen 7 PRO 7840U, AMD Radeon 780M (1697 - 1824, n=5) | |
| Lenovo ThinkPad P16s G2 21K9000CGE | |
| Schenker Vision 16 PH6PRX1 | |
| Lenovo ThinkPad P14s G4 21K5000LGE | |
| Lenovo ThinkPad P16v G1 AMD | |
| HP EliteBook 845 G10 818N0EA | |
| Lenovo ThinkPad P15v G3 21EM001AGE | |
| CrossMark / Responsiveness | |
| Acer Swift Edge SFE16 Ryzen 7 7840U | |
| Schenker Vision 16 PH6PRX1 | |
| Média da turma Workstation (993 - 2096, n=24, últimos 2 anos) | |
| MSI Prestige 16 B1MG-001US | |
| Lenovo ThinkPad X1 Carbon G11 21HNS54T00 | |
| Microsoft Surface Laptop Studio 2 RTX 4060 | |
| Lenovo ThinkPad P14s G4 21K5000LGE | |
| Lenovo ThinkPad P16v G1 AMD | |
| Lenovo ThinkPad P16s G2 21K9000CGE | |
| Média AMD Ryzen 7 PRO 7840U, AMD Radeon 780M (1049 - 1499, n=5) | |
| Lenovo ThinkPad P15v G3 21EM001AGE | |
| HP EliteBook 845 G10 818N0EA | |
| WebXPRT 4 / Overall | |
| Média da turma Workstation (189.2 - 326, n=25, últimos 2 anos) | |
| Microsoft Surface Laptop Studio 2 RTX 4060 | |
| MSI Prestige 16 B1MG-001US | |
| Lenovo ThinkPad P16v G1 AMD | |
| Acer Swift Edge SFE16 Ryzen 7 7840U | |
| Média AMD Ryzen 7 PRO 7840U, AMD Radeon 780M (234 - 245, n=2) | |
| HP EliteBook 845 G10 818N0EA | |
| Lenovo ThinkPad P15v G3 21EM001AGE | |
| Mozilla Kraken 1.1 / Total | |
| Lenovo ThinkPad P15v G3 21EM001AGE | |
| Lenovo ThinkPad P14s G4 21K5000LGE | |
| HP EliteBook 845 G10 818N0EA | |
| Lenovo ThinkPad P16s G2 21K9000CGE | |
| Média AMD Ryzen 7 PRO 7840U, AMD Radeon 780M (523 - 571, n=5) | |
| Lenovo ThinkPad P16v G1 AMD | |
| MSI Prestige 16 B1MG-001US | |
| Acer Swift Edge SFE16 Ryzen 7 7840U | |
| Microsoft Surface Laptop Studio 2 RTX 4060 | |
| Lenovo ThinkPad X1 Carbon G11 21HNS54T00 | |
| Lenovo ThinkPad X1 Carbon G11 21HNS54T00 | |
| Média da turma Workstation (411 - 538, n=25, últimos 2 anos) | |
* ... menor é melhor
| PCMark 10 Score | 6628 pontos | |
Ajuda | ||
| AIDA64 / Memory Copy | |
| Média da turma Workstation (56003 - 164795, n=25, últimos 2 anos) | |
| Acer Swift Edge SFE16 Ryzen 7 7840U | |
| Lenovo ThinkPad P14s G4 21K5000LGE | |
| Média AMD Ryzen 7 PRO 7840U (66487 - 67856, n=5) | |
| Lenovo ThinkPad P16s G2 21K9000CGE | |
| Microsoft Surface Laptop Studio 2 RTX 4060 | |
| Schenker Vision 16 PH6PRX1 | |
| HP EliteBook 845 G10 818N0EA | |
| Lenovo ThinkPad P16v G1 AMD | |
| AIDA64 / Memory Read | |
| Média da turma Workstation (55795 - 121563, n=25, últimos 2 anos) | |
| Schenker Vision 16 PH6PRX1 | |
| Microsoft Surface Laptop Studio 2 RTX 4060 | |
| Lenovo ThinkPad P16s G2 21K9000CGE | |
| Acer Swift Edge SFE16 Ryzen 7 7840U | |
| Média AMD Ryzen 7 PRO 7840U (47725 - 50543, n=5) | |
| Lenovo ThinkPad P14s G4 21K5000LGE | |
| Lenovo ThinkPad P16v G1 AMD | |
| HP EliteBook 845 G10 818N0EA | |
| AIDA64 / Memory Write | |
| Lenovo ThinkPad P14s G4 21K5000LGE | |
| Média AMD Ryzen 7 PRO 7840U (89477 - 94965, n=5) | |
| Acer Swift Edge SFE16 Ryzen 7 7840U | |
| Lenovo ThinkPad P16s G2 21K9000CGE | |
| Média da turma Workstation (55663 - 214520, n=25, últimos 2 anos) | |
| Microsoft Surface Laptop Studio 2 RTX 4060 | |
| Schenker Vision 16 PH6PRX1 | |
| HP EliteBook 845 G10 818N0EA | |
| Lenovo ThinkPad P16v G1 AMD | |
| AIDA64 / Memory Latency | |
| Lenovo ThinkPad P14s G4 21K5000LGE | |
| Média AMD Ryzen 7 PRO 7840U (128.6 - 138.9, n=5) | |
| Lenovo ThinkPad P16s G2 21K9000CGE | |
| Média da turma Workstation (84.5 - 165.2, n=25, últimos 2 anos) | |
| Acer Swift Edge SFE16 Ryzen 7 7840U | |
| HP EliteBook 845 G10 818N0EA | |
| Lenovo ThinkPad P16v G1 AMD | |
| Microsoft Surface Laptop Studio 2 RTX 4060 | |
| Schenker Vision 16 PH6PRX1 | |
* ... menor é melhor
Latência DPC
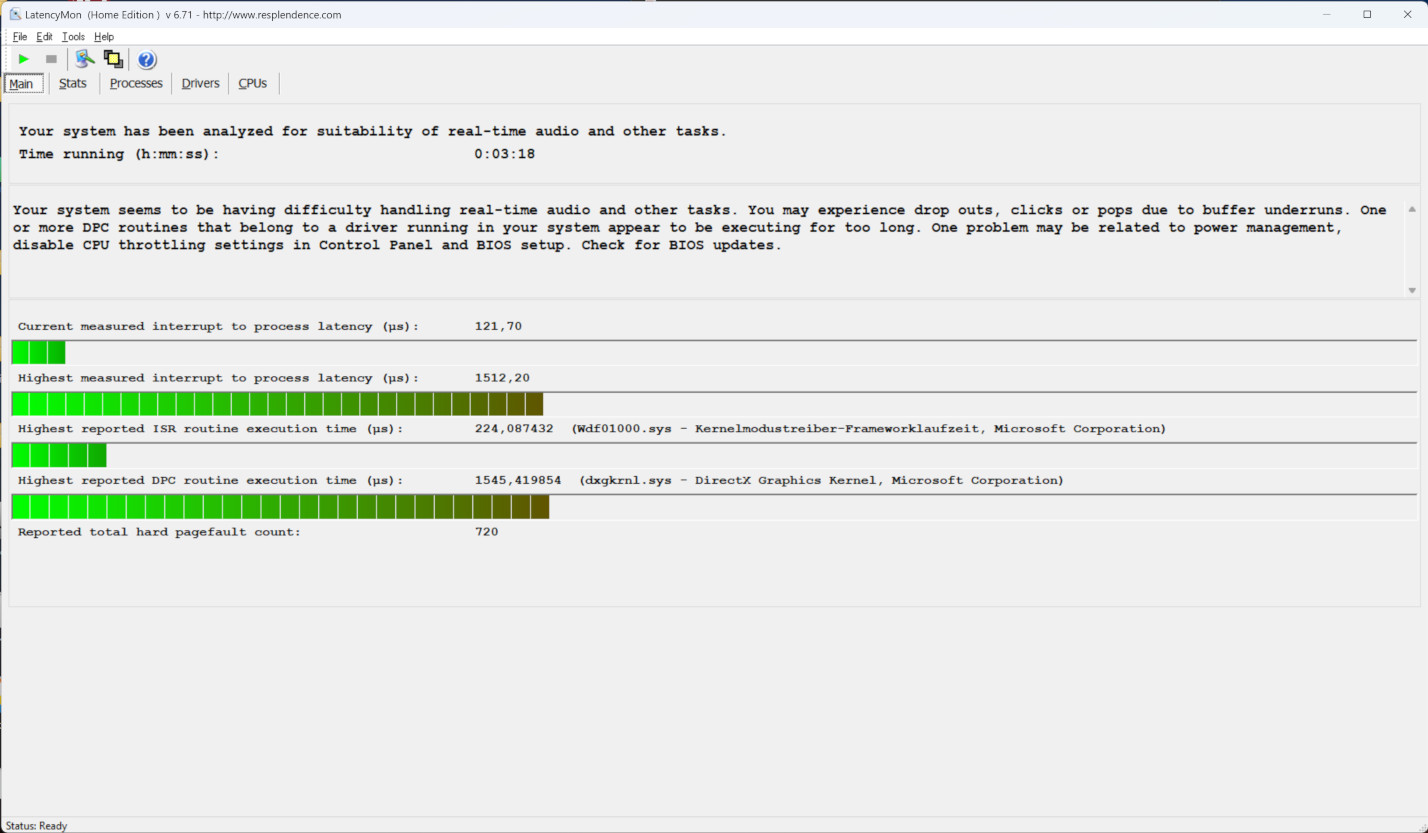
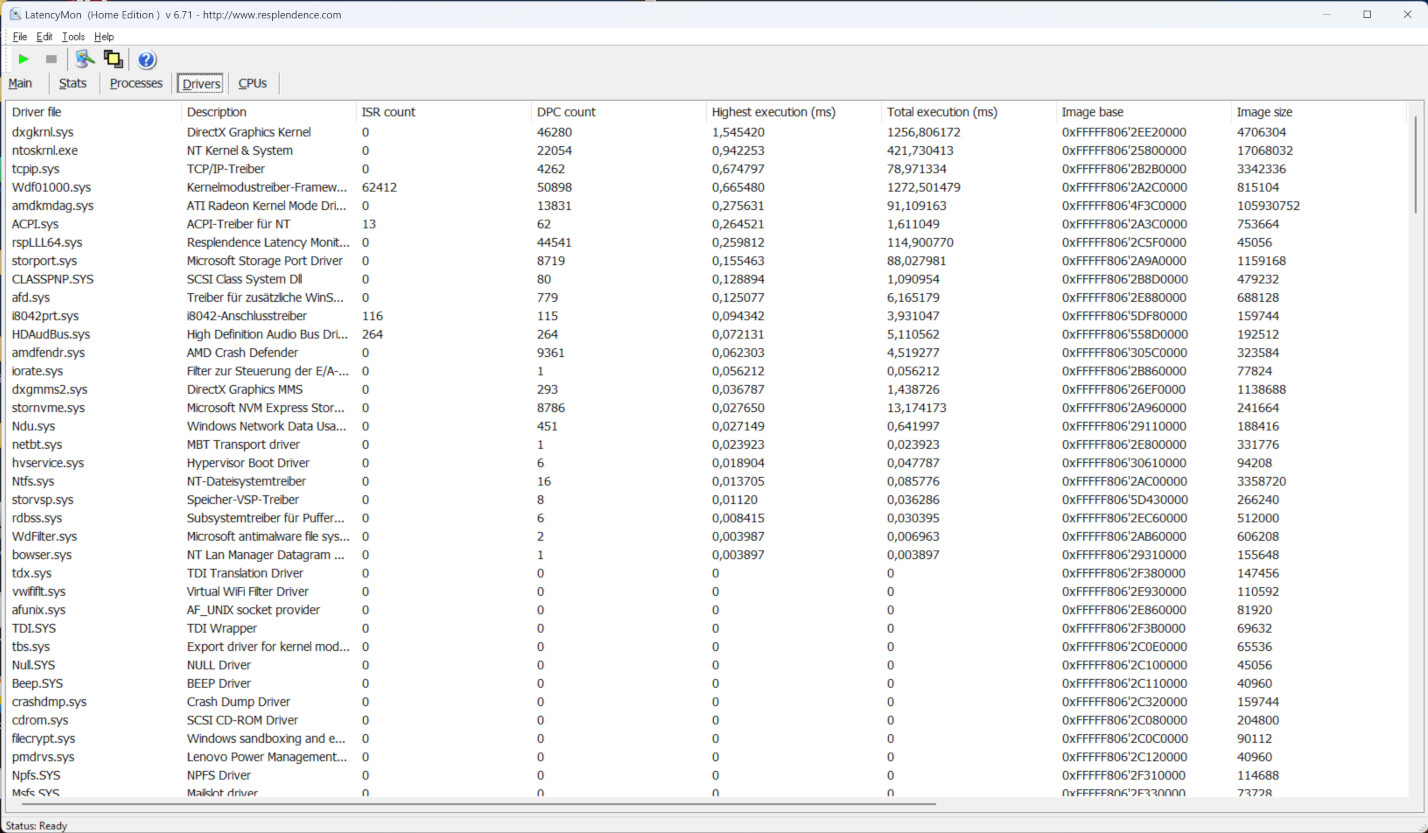
Os resultados do LatencyMon não foram totalmente satisfatórios. Pelo menos a edição de áudio em tempo real pode apresentar alguns problemas para o dispositivo. É interessante observar que os programas de driver DirectX, em particular, causaram alguns problemas. Uma atualização provavelmente resolveria alguns deles. Em geral, os resultados poderiam ser facilmente alterados em ambas as direções por meio de drivers atualizados ou novos softwares.
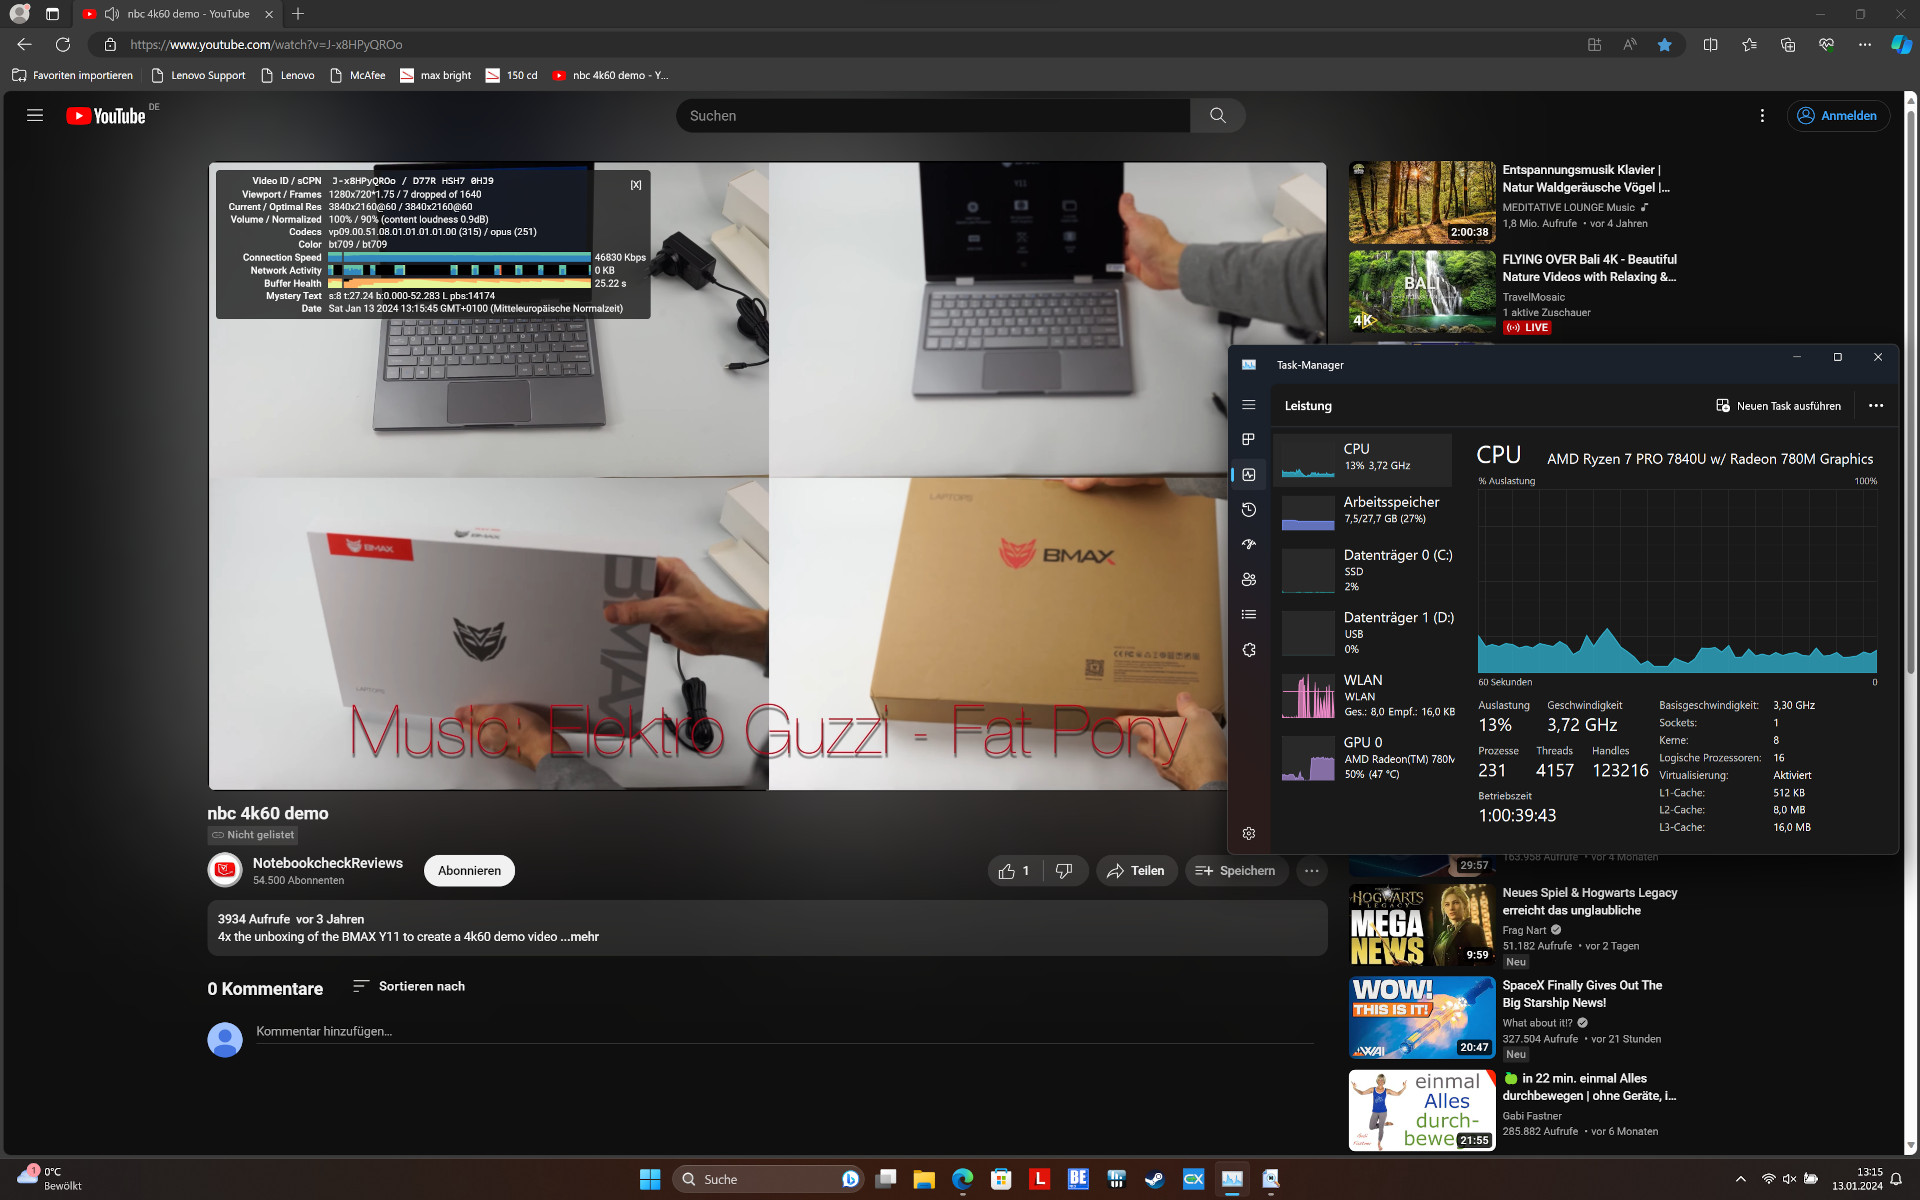
Os resultados de streaming de vídeo deixam um espaço semelhante para melhorias. Os 15 quadros perdidos são simplesmente excessivos e uma carga de GPU de 50% mostra que o driver gráfico ainda não foi ajustado de forma ideal (durante nosso teste, o status atual do driver era de 01/2024).
| DPC Latencies / LatencyMon - interrupt to process latency (max), Web, Youtube, Prime95 | |
| Microsoft Surface Laptop Studio 2 RTX 4060 | |
| Schenker Vision 16 PH6PRX1 | |
| Lenovo ThinkPad P16s G2 21K9000CGE | |
| Lenovo ThinkPad P14s G4 21K5000LGE | |
| HP EliteBook 845 G10 818N0EA | |
| Lenovo ThinkPad P16v G1 AMD | |
| Acer Swift Edge SFE16 Ryzen 7 7840U | |
* ... menor é melhor
Dispositivos de armazenamento
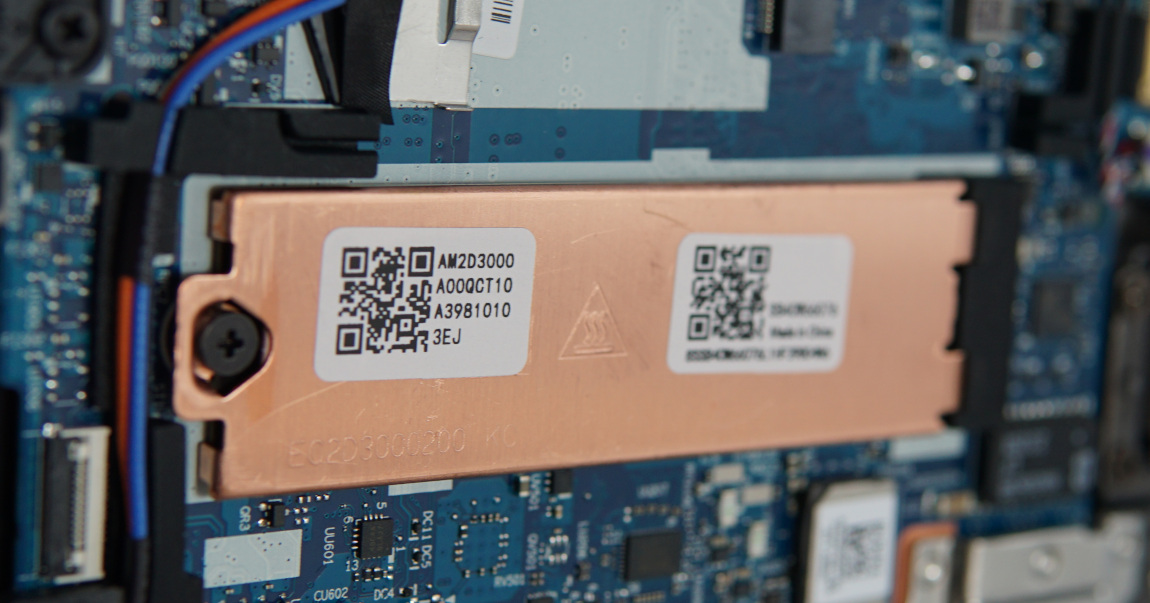
O resfriamento elaborado do laptop com uma grande placa de cobre realmente valeu a pena durante nosso teste contínuo. Seu desempenho de gravação sequencial permaneceu completamente estável e alto durante um longo período de tempo.
O M.2-SSD da SK Hynix não consegue lidar bem com grandes quantidades de arquivos pequenos com muitos acessos paralelos. Entretanto, isso deve ter apenas um pequeno efeito negativo durante a inicialização. Em uso normal, isso não deve ter um impacto perceptível.

* ... menor é melhor
Reading continuous performance: DiskSpd Read Loop, Queue Depth 8
Placa de vídeo
É claro que o senhor não deve esperar muito de uma iGPU, embora a AMD Radeon 780M tenha se saído bem de modo geral. Mesmo sem sua própria RAM e com hardware e fonte de alimentação limitados, ela estava quase no mesmo nível de uma RTX 2050 Mobile. Sua distância para a Nvidia RTX A1000 ou o RTX 3050 também não foi muito grande.
O ThinkPad P16s G2 AMD também se saiu bem no benchmark SPECviewperf, o que nos dá uma ideia de como ele se sai usando um software gráfico profissional. Aqui, a Nvidia T550 pode ser claramente mantido à distância. E, embora a RTX A1000 tenha ficado cerca de 50% à frente, ele requer muito mais potência, mais espaço e laptops de estação de trabalho, como um Dell Precision 5470 também são muito mais caros.
Outras iGPUs, como a Intel Iris Xe Graphics G7 96EUs são muito mais fracas e sua antecessora, a Radeon 680Mtambém ficou muito atrás quando se trata de desempenho gráfico.
Outras medições, testes e classificações podem ser encontrados em nossa lista de benchmarks de GPU http://www.notebookcheck.com/Mobile-Grafikkarten-Benchmarkliste.735.0.html.
| 3DMark 11 Performance | 12655 pontos | |
| 3DMark Cloud Gate Standard Score | 35205 pontos | |
| 3DMark Fire Strike Score | 7524 pontos | |
| 3DMark Time Spy Score | 3126 pontos | |
Ajuda | ||
| SPECviewperf Performance rating - Percent | |
| Média da turma Workstation | |
| HP ZBook Power 15 G10 | |
| Lenovo ThinkPad P16v G1 AMD | |
| Dell Precision 5000 5470 | |
| Lenovo ThinkPad P16s G2 21K9000CGE | |
| Média AMD Radeon 780M | |
| HP ZBook Firefly 14 G9-6B8A2EA | |
| Lenovo ThinkPad T14 G3-21CF004NGE | |
Desempenho em jogos
Os jogos não são, de forma alguma, um dos principais pontos fortes do P16. Mesmo assim, o ThinkPad provou ser capaz de jogar bem a maioria dos jogos com sua unidade gráfica integrada. Até mesmo o relativamente atual F1 23 pode ser executado em Full HD e com altos detalhes.
Jogos complexos como Starfield e, em geral, altas resoluções e detalhes máximos mostram rapidamente onde estão os limites da iGPU. Em particular, sua memória de vídeo externa não é mais suficiente.
| Starfield | |
| 1920x1080 High Preset | |
| Média AMD Radeon 780M (19 - 21.3, n=3) | |
| Lenovo ThinkPad P16s G2 21K9000CGE | |
| Lenovo ThinkPad P14s G4 21K5000LGE | |
| 1920x1080 Ultra Preset | |
| Média AMD Radeon 780M (15 - 19.1, n=3) | |
| Lenovo ThinkPad P14s G4 21K5000LGE | |
| Lenovo ThinkPad P16s G2 21K9000CGE | |
Usando a configuração de detalhes mais alta, o teste contínuo com o The Witcher 3 foi executado com total tranquilidade e sem surpresas desagradáveis. Isso significa que seu bom desempenho gráfico também permanece disponível por períodos mais longos.
Witcher 3 FPS diagram
| baixo | média | alto | ultra | QHD | 4K | |
|---|---|---|---|---|---|---|
| GTA V (2015) | 140 | 128.7 | 64.5 | 27.3 | 19.1 | 20.7 |
| The Witcher 3 (2015) | 138 | 94 | 47 | 30 | 20 | 15 |
| Dota 2 Reborn (2015) | 117.5 | 89.9 | 82.1 | 69.5 | 31.2 | |
| Final Fantasy XV Benchmark (2018) | 74.9 | 34.3 | 25.2 | 17.7 | 11.2 | |
| X-Plane 11.11 (2018) | 47.1 | 33.2 | 28.1 | 19.2 | ||
| Far Cry 5 (2018) | 69 | 46 | 42 | 40 | 27 | 12 |
| Strange Brigade (2018) | 157.4 | 65.5 | 56.1 | 46.9 | 31.7 | 16.3 |
| F1 23 (2023) | 81.6 | 72.3 | 51.3 | 11.9 | 7.36 | 3.24 |
| Starfield (2023) | 27 | 23 | 19 | 15 | 12 | 7 |
Emissões - O ThinkPad P16s é sempre reservado
Emissões de ruído
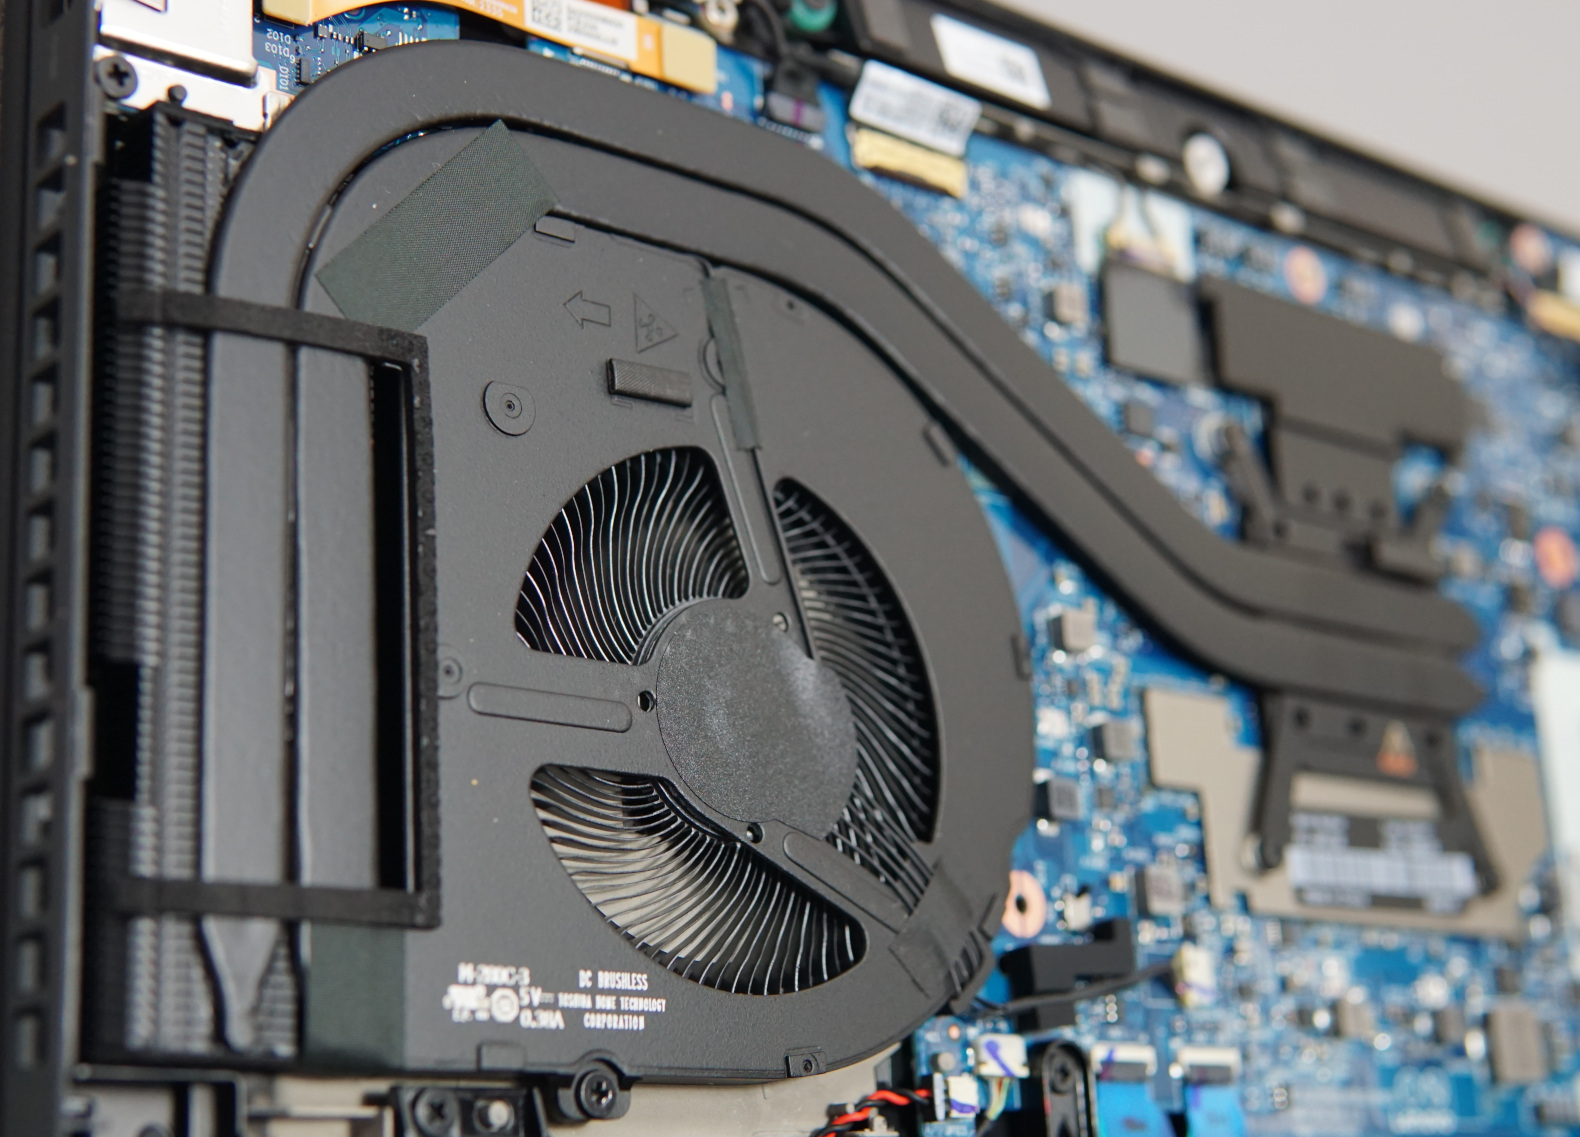
Em comparação com o menor ThinkPad P14s G4o ventilador do mesmo tamanho no atual ThinkPad P16s G2 tem que lidar com muito mais calor. Ao mesmo tempo, tem que superar uma pequena distância para o exterior. Isso não é ideal, mas provavelmente foi feito para economizar algum dinheiro.
Isso significa que as emissões de ruído do dispositivo são um pouco mais intensas durante a carga alta, estimamos que sejam cerca de duas vezes mais altas que as do P14s G4. Medimos emissões máximas de ruído de 40 dB, o que não é motivo de preocupação. Além disso, o P16s oferece um pouco mais de desempenho em comparação com o P14s G4 com a mesma CPU. Uma ventoinha maior ou mais bem posicionada poderia ter resultado em resultados consideravelmente melhores.
Um aspecto positivo, por outro lado, é o comportamento durante tarefas muito simples. Nesse caso, a ventoinha permanece completamente silenciosa.
Barulho
| Ocioso |
| 22.6 / 22.6 / 22.6 dB |
| Carga |
| 37.8 / 40.5 dB |
 | ||
30 dB silencioso 40 dB(A) audível 50 dB(A) ruidosamente alto |
||
min: | ||
| Lenovo ThinkPad P16s G2 21K9000CGE Radeon 780M, R7 PRO 7840U, SK hynix PC801 HFS001TEJ9X162N | HP EliteBook 845 G10 818N0EA Radeon 780M, R9 PRO 7940HS, SK hynix PC801 HFS001TEJ9X101N | Lenovo ThinkPad P14s G4 21K5000LGE Radeon 780M, R7 PRO 7840U, SK hynix PC801 HFS512GEJ9X162N | Schenker Vision 16 PH6PRX1 Iris Xe G7 96EUs, i7-13700H, Samsung 990 Pro 1 TB | Acer Swift Edge SFE16 Ryzen 7 7840U Radeon 780M, R7 7840U, SK hynix HFS512GEJ9X125N | Lenovo ThinkPad P16v G1 AMD RTX A1000 Laptop GPU, R7 PRO 7840HS, SK hynix PC801 HFS001TEJ9X101N | Microsoft Surface Laptop Studio 2 RTX 4060 GeForce RTX 4060 Laptop GPU, i7-13700H, Kioxia XG8 KXG80ZNV1T02 | |
|---|---|---|---|---|---|---|---|
| Noise | -8% | 4% | -11% | -8% | -8% | -18% | |
| desligado / ambiente * (dB) | 22.6 | 25.3 -12% | 22.4 1% | 25.5 -13% | 23.4 -4% | 24.3 -8% | 23.9 -6% |
| Idle Minimum * (dB) | 22.6 | 25.3 -12% | 22.4 1% | 25.5 -13% | 24.1 -7% | 24.3 -8% | 23.9 -6% |
| Idle Average * (dB) | 22.6 | 25.3 -12% | 22.4 1% | 28.7 -27% | 24.3 -8% | 24.3 -8% | 24.4 -8% |
| Idle Maximum * (dB) | 22.6 | 25.3 -12% | 22.4 1% | 29.1 -29% | 28 -24% | 24.3 -8% | 26.9 -19% |
| Load Average * (dB) | 37.8 | 34.4 9% | 31.3 17% | 33.8 11% | 41 -8% | 35.7 6% | 48.5 -28% |
| Witcher 3 ultra * (dB) | 40.3 | 43.4 -8% | 39.5 2% | 37.6 7% | 40.9 -1% | 43.7 -8% | 51.8 -29% |
| Load Maximum * (dB) | 40.5 | 43.4 -7% | 39.2 3% | 44.9 -11% | 40.9 -1% | 50.2 -24% | 51.8 -28% |
* ... menor é melhor
Temperatura
Mesmo sem as ventoinhas ativas, o laptop aquece minimamente. Esse é o caso enquanto o senhor estiver navegando na Web, fazendo streaming, realizando trabalho de escritório ou algo semelhante. Em nenhum momento o gabinete chega a 30 °C nesses cenários.
Por outro lado, o gabinete fica um pouco mais quente assim que o calor precisa ser dissipado do processador. Medimos mais de 40 °C no teclado e até mais de 47 °C na parte inferior. Isso significa que pode ser um pouco desconfortável usá-lo sob carga total.
(±) A temperatura máxima no lado superior é 42.7 °C / 109 F, em comparação com a média de 38.2 °C / 101 F , variando de 22.2 a 69.8 °C para a classe Workstation.
(-) A parte inferior aquece até um máximo de 47.2 °C / 117 F, em comparação com a média de 41.1 °C / 106 F
(+) Em uso inativo, a temperatura média para o lado superior é 25.7 °C / 78 F, em comparação com a média do dispositivo de 32 °C / ### class_avg_f### F.
(±) Jogando The Witcher 3, a temperatura média para o lado superior é 34.5 °C / 94 F, em comparação com a média do dispositivo de 32 °C / ## #class_avg_f### F.
(+) Os apoios para as mãos e o touchpad estão atingindo a temperatura máxima da pele (32.9 °C / 91.2 F) e, portanto, não estão quentes.
(-) A temperatura média da área do apoio para as mãos de dispositivos semelhantes foi 27.8 °C / 82 F (-5.1 °C / -9.2 F).
| Lenovo ThinkPad P16s G2 21K9000CGE AMD Ryzen 7 PRO 7840U, AMD Radeon 780M | HP EliteBook 845 G10 818N0EA AMD Ryzen 9 PRO 7940HS, AMD Radeon 780M | Lenovo ThinkPad P14s G4 21K5000LGE AMD Ryzen 7 PRO 7840U, AMD Radeon 780M | Schenker Vision 16 PH6PRX1 Intel Core i7-13700H, Intel Iris Xe Graphics G7 96EUs | Acer Swift Edge SFE16 Ryzen 7 7840U AMD Ryzen 7 7840U, AMD Radeon 780M | Lenovo ThinkPad P16v G1 AMD AMD Ryzen 7 PRO 7840HS, NVIDIA RTX A1000 Laptop GPU | Microsoft Surface Laptop Studio 2 RTX 4060 Intel Core i7-13700H, NVIDIA GeForce RTX 4060 Laptop GPU | |
|---|---|---|---|---|---|---|---|
| Heat | -2% | 3% | 5% | -4% | 1% | 6% | |
| Maximum Upper Side * (°C) | 42.7 | 45.6 -7% | 41.1 4% | 41.1 4% | 41.6 3% | 40.9 4% | 40.4 5% |
| Maximum Bottom * (°C) | 47.2 | 51.9 -10% | 48.2 -2% | 42 11% | 46.6 1% | 57.9 -23% | 42.2 11% |
| Idle Upper Side * (°C) | 27.8 | 26.5 5% | 26.5 5% | 28.5 -3% | 30.4 -9% | 24.5 12% | 26.6 4% |
| Idle Bottom * (°C) | 28.4 | 27 5% | 26.9 5% | 26.8 6% | 31 -9% | 25.5 10% | 27 5% |
* ... menor é melhor
Teste de estresse
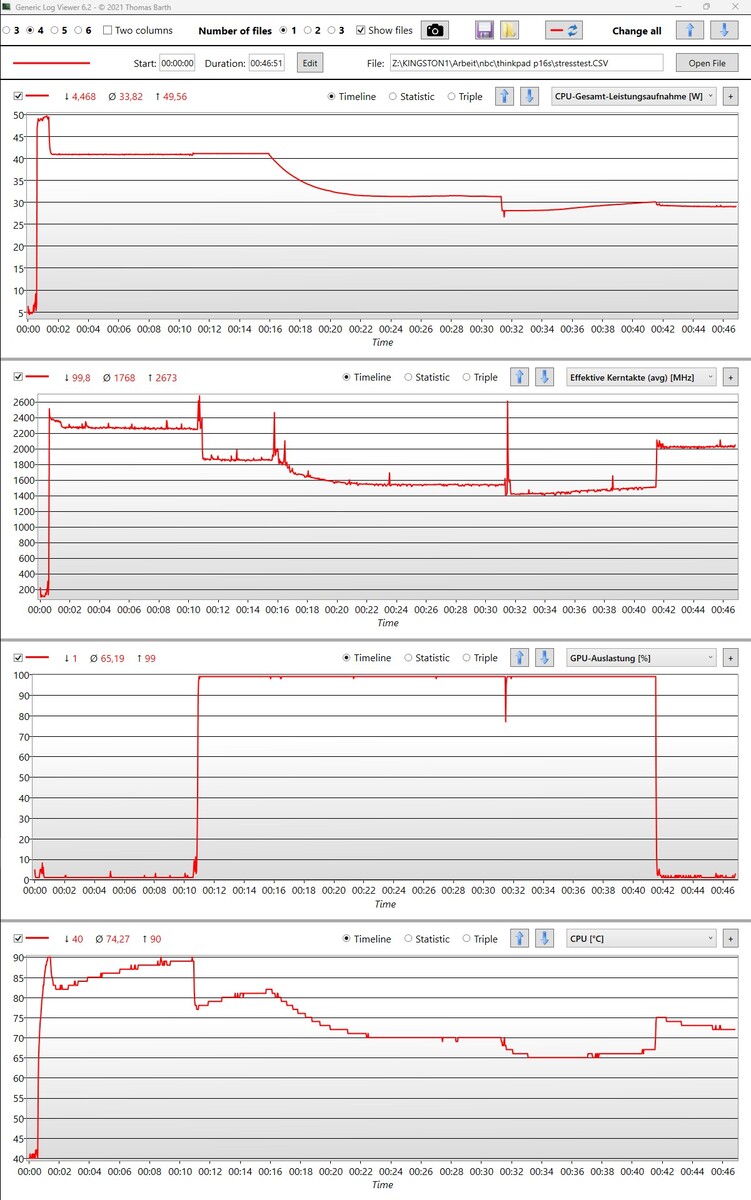
Se a CPU e a iGPU estiverem completamente carregadas usando o Prime95 e o FurMark, sua fonte de alimentação permanecerá estável, com 41 watts sendo fornecidos ao processador. Ao alternar o modo de desempenho, os parâmetros se ajustam suavemente.
A unidade gráfica pode ser totalmente utilizada ao mesmo tempo, em todas as diferentes configurações de energia. A ventoinha fica um pouco mais silenciosa quanto mais a fonte de alimentação máxima é reduzida.
A temperatura do processador que medimos atingiu apenas 90 °C por um curto período sob carga total. Com a maior economia de energia, as temperaturas permaneceram em 65 °C, apesar do menor volume da ventoinha. Nada impede que o senhor possa utilizar o sistema o tempo todo.
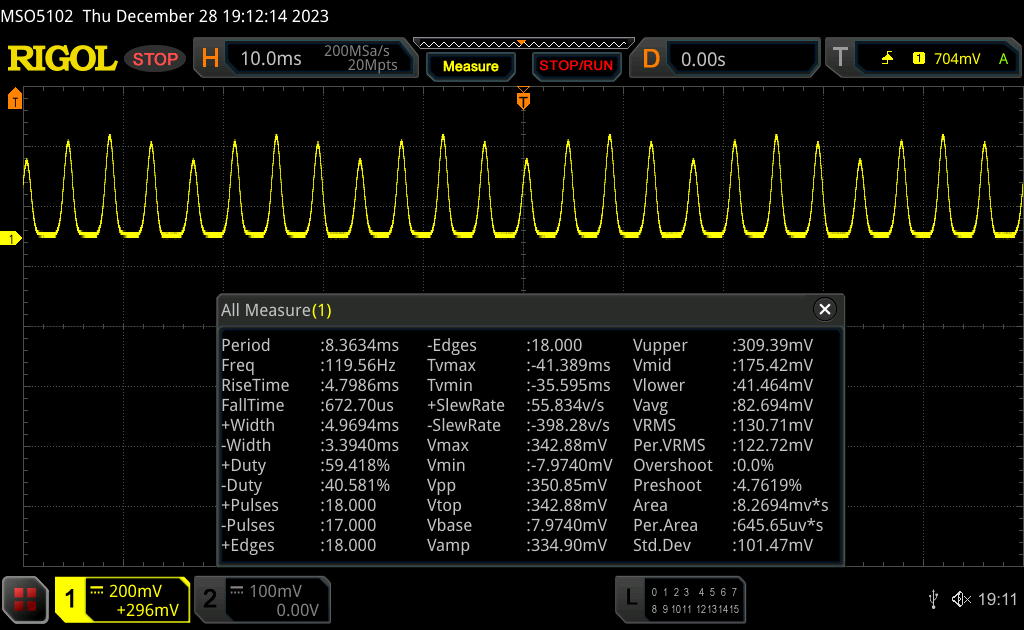
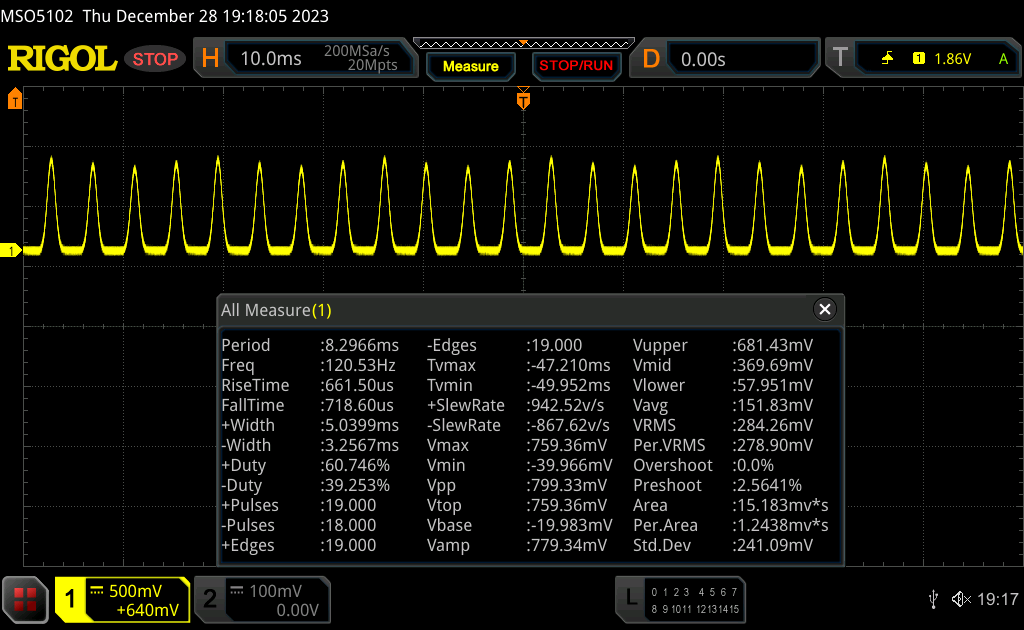
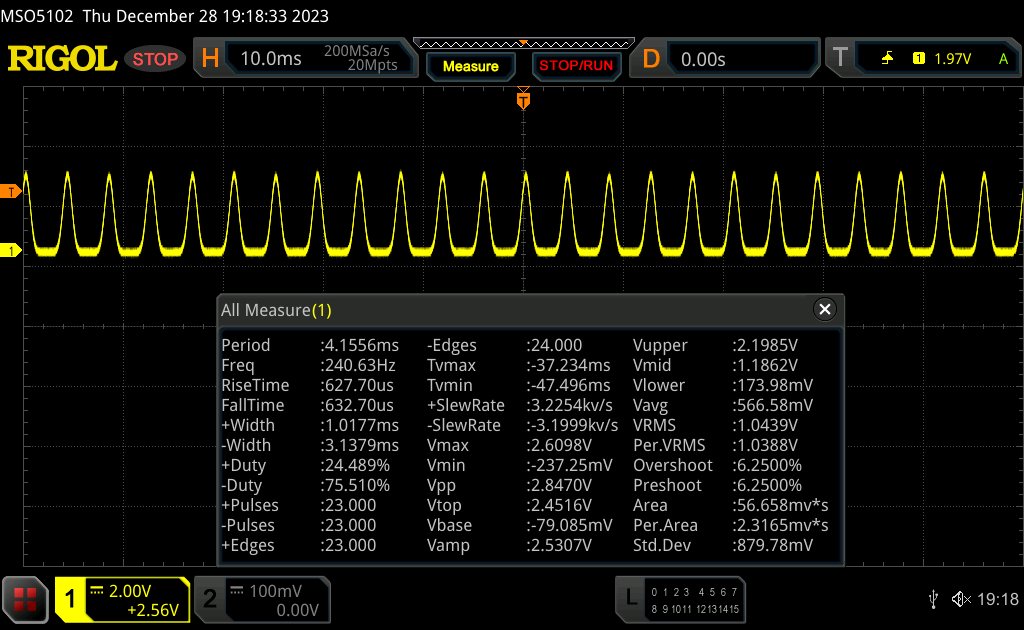
Alto-falantes
Os alto-falantes são fracos - faltam graves. Mesmo os médios baixos são pouco proeminentes e seu volume máximo poderia ser mais alto. Além disso, faltam alguns detalhes, embora as vozes geralmente soem bem, mesmo durante músicas complexas.
Eles são bons o suficiente para chamadas com vídeo, música de fundo ou streaming ocasional. Não esperaríamos nada melhor de alto-falantes simples de laptops, especialmente os de uma estação de trabalho.
Lenovo ThinkPad P16s G2 21K9000CGE análise de áudio
(±) | o volume do alto-falante é médio, mas bom (###valor### dB)
Graves 100 - 315Hz
(-) | quase nenhum baixo - em média 26.5% menor que a mediana
(±) | a linearidade dos graves é média (12.3% delta para a frequência anterior)
Médios 400 - 2.000 Hz
(+) | médios equilibrados - apenas 3.9% longe da mediana
(+) | médios são lineares (6.9% delta para frequência anterior)
Altos 2 - 16 kHz
(+) | agudos equilibrados - apenas 3.5% longe da mediana
(+) | os máximos são lineares (4.8% delta da frequência anterior)
Geral 100 - 16.000 Hz
(±) | a linearidade do som geral é média (21.3% diferença em relação à mediana)
Comparado com a mesma classe
» 77% de todos os dispositivos testados nesta classe foram melhores, 6% semelhantes, 18% piores
» O melhor teve um delta de 7%, a média foi 17%, o pior foi 35%
Comparado com todos os dispositivos testados
» 59% de todos os dispositivos testados foram melhores, 7% semelhantes, 33% piores
» O melhor teve um delta de 4%, a média foi 24%, o pior foi 134%
Apple MacBook Pro 16 2021 M1 Pro análise de áudio
(+) | os alto-falantes podem tocar relativamente alto (###valor### dB)
Graves 100 - 315Hz
(+) | bons graves - apenas 3.8% longe da mediana
(+) | o baixo é linear (5.2% delta para a frequência anterior)
Médios 400 - 2.000 Hz
(+) | médios equilibrados - apenas 1.3% longe da mediana
(+) | médios são lineares (2.1% delta para frequência anterior)
Altos 2 - 16 kHz
(+) | agudos equilibrados - apenas 1.9% longe da mediana
(+) | os máximos são lineares (2.7% delta da frequência anterior)
Geral 100 - 16.000 Hz
(+) | o som geral é linear (4.6% diferença em relação à mediana)
Comparado com a mesma classe
» 0% de todos os dispositivos testados nesta classe foram melhores, 0% semelhantes, 100% piores
» O melhor teve um delta de 5%, a média foi 17%, o pior foi 45%
Comparado com todos os dispositivos testados
» 0% de todos os dispositivos testados foram melhores, 0% semelhantes, 100% piores
» O melhor teve um delta de 4%, a média foi 24%, o pior foi 134%
Gerenciamento de energia - A estação de trabalho atinge seus limites
Consumo de energia
Devido ao alto consumo de energia permanente do sistema, a mísera fonte de alimentação de 65 watts pode chegar ao seu limite quando o hardware exigir o máximo. Entretanto, os 68 watts que medimos devem ser disponibilizados sem grandes problemas. Ainda assim, ela não tem um buffer para carregar o laptop. Se ele tiver apenas metade da carga, esse será o caso até que a CPU e a GPU precisem de menos energia. Ao mesmo tempo, não registramos nenhuma descarga indesejada durante o teste de estresse.
Uma fonte de alimentação maior, de 90 watts, certamente teria sido a melhor escolha para o ThinkPad P16s G2 AMD.
| desligado | |
| Ocioso | |
| Carga |
|
Key:
min: | |
| Lenovo ThinkPad P16s G2 21K9000CGE R7 PRO 7840U, Radeon 780M, SK hynix PC801 HFS001TEJ9X162N, OLED, 3840x2400, 16" | HP EliteBook 845 G10 818N0EA R9 PRO 7940HS, Radeon 780M, SK hynix PC801 HFS001TEJ9X101N, IPS, 2560x1600, 14" | Lenovo ThinkPad P14s G4 21K5000LGE R7 PRO 7840U, Radeon 780M, SK hynix PC801 HFS512GEJ9X162N, IPS, 1920x1200, 14" | Schenker Vision 16 PH6PRX1 i7-13700H, Iris Xe G7 96EUs, Samsung 990 Pro 1 TB, IPS, 2560x1600, 16" | Acer Swift Edge SFE16 Ryzen 7 7840U R7 7840U, Radeon 780M, SK hynix HFS512GEJ9X125N, OLED, 3200x2000, 16" | Lenovo ThinkPad P16v G1 AMD R7 PRO 7840HS, RTX A1000 Laptop GPU, SK hynix PC801 HFS001TEJ9X101N, IPS, 1920x1200, 16" | Média AMD Radeon 780M | Média da turma Workstation | |
|---|---|---|---|---|---|---|---|---|
| Power Consumption | -16% | 22% | -41% | -27% | -20% | -17% | -107% | |
| Idle Minimum * (Watt) | 6.1 | 4.3 30% | 2.9 52% | 6.3 -3% | 7.1 -16% | 4.1 33% | 6.01 ? 1% | 8.94 ? -47% |
| Idle Average * (Watt) | 6.5 | 10.1 -55% | 5.1 22% | 14.4 -122% | 10.1 -55% | 6.5 -0% | 8.15 ? -25% | 13.8 ? -112% |
| Idle Maximum * (Watt) | 7 | 11.2 -60% | 5.6 20% | 16.2 -131% | 18.6 -166% | 6.7 4% | 10.3 ? -47% | 17.5 ? -150% |
| Load Average * (Watt) | 56.6 | 64.4 -14% | 51.2 10% | 46.2 18% | 45.3 20% | 65.2 -15% | 57.6 ? -2% | 95 ? -68% |
| Witcher 3 ultra * (Watt) | 61.2 | 59.4 3% | 49.9 18% | 49.4 19% | 39.5 35% | 77.2 -26% | ||
| Load Maximum * (Watt) | 68.3 | 66.7 2% | 60.2 12% | 85.2 -25% | 52.9 23% | 147 -115% | 77 ? -13% | 175.2 ? -157% |
* ... menor é melhor
Power consumption Witcher 3 / stress test
Power consumption with external monitor
Tempos de execução
A alta eficiência do AMD Ryzen 7 Pro 7840U é um pouco atenuada pela tela OLED do notebook. Seus bons tempos de execução se devem, em grande parte, à grande capacidade de 84 Wh da bateria e não porque ela é econômica sob carga baixa.
O tempo de execução de mais de 13 horas e 10 horas (teste de navegação na Web) significa que o senhor pode usar o laptop em qualquer lugar sem nenhum problema. No entanto, esse é o caso apenas quando o brilho é reduzido. Em nosso teste, ele foi ajustado para cerca de 60%. Por outro lado, com o brilho total, a tela OLED requer muito mais energia, o que faz com que a navegação na Web esgote a bateria em menos de 7 horas.
Com uma tela diferente, por exemplo, a do muito semelhante ThinkPad P14s G4é possível abrir sites continuamente por mais de 11 horas, com uma bateria significativamente menor, de 52 Wh. Extrapolando cuidadosamente, o P16s G2 com o painel IPS e a representação média de cores deve poder ser usado por 16 horas de navegação.
| Lenovo ThinkPad P16s G2 21K9000CGE R7 PRO 7840U, Radeon 780M, 84 Wh | HP EliteBook 845 G10 818N0EA R9 PRO 7940HS, Radeon 780M, 51 Wh | Schenker Vision 16 PH6PRX1 i7-13700H, Iris Xe G7 96EUs, 80 Wh | Acer Swift Edge SFE16 Ryzen 7 7840U R7 7840U, Radeon 780M, 54 Wh | Lenovo ThinkPad P16v G1 AMD R7 PRO 7840HS, RTX A1000 Laptop GPU, 90 Wh | Microsoft Surface Laptop Studio 2 RTX 4060 i7-13700H, GeForce RTX 4060 Laptop GPU, 58 Wh | Média da turma Workstation | |
|---|---|---|---|---|---|---|---|
| Duração da bateria | -32% | 24% | -47% | 16% | 3% | -18% | |
| H.264 (h) | 13.3 | 9.3 -30% | 17.8 34% | 11.3 -15% | 9.51 ? -28% | ||
| WiFi v1.3 (h) | 10.6 | 7.9 -25% | 8 -25% | 5.6 -47% | 15 42% | 8.3 -22% | 8.53 ? -20% |
| Load (h) | 1.5 | 0.9 -40% | 2.6 73% | 1.1 -27% | 2.2 47% | 1.429 ? -5% |
Pro
Contra
Veredicto - O desempenho e a imagem são ótimos, o resto é razoável

O ThinkPad P16s G2 AMD apresenta uma variedade excepcionalmente grande de usos potenciais. O alto desempenho da CPU em conjunto com sua boa Radeon 780M iGPU permite o uso profissional, mesmo para tarefas mais exigentes do ponto de vista gráfico. Isso pode não ser tão rápido quanto em um dispositivo com uma placa de vídeo dedicada, no entanto, o laptop para estação de trabalho tem outras coisas a oferecer.
As ventoinhas geralmente são silenciosas ou permanecem completamente desativadas e, apesar de a tela OLED consumir muita energia, ela oferece tempos de execução decentes. Além disso, seu preço é razoável quando se considera seus recursos de desempenho. Tudo isso resulta em imagens brilhantes e ricas em contraste, permitindo que o senhor use o laptop para tarefas criativas. Por outro lado, sua portabilidade poderia certamente se beneficiar de uma tela um pouco menos elaborada.
Muita potência, desempenho gráfico geralmente suficiente e conectividade decente fazem do P16s G2 AMD um excelente laptop para trabalho, universidade ou trabalhos criativos.
Além disso, o dispositivo conta com uma infinidade de recursos de segurança e sua função de manutenção remota pode ser muito útil para os dispositivos da empresa. Seu gabinete robusto e o bom teclado também fazem dele um ótimo laptop para trabalho.
Por sua vez, suas críticas não são as mais severas. É claro que uma segunda porta USB4 seria útil. As ventoinhas poderiam ser um pouco mais eficientes, especialmente quando o senhor considera a quantidade de espaço que não está sendo usada na parte interna. Além disso, a energia fornecida pela fonte de alimentação pode ser um pouco limitada, mas não deve causar nenhuma limitação grave.
Uma alternativa com desempenho gráfico adicional poderia ser o Lenovo ThinkPad P16v G1por exemplo. O Lenovo ThinkPad P14s G1 , por exemplo, oferece melhor portabilidade e desempenho ligeiramente inferior Lenovo ThinkPad P14s G4 AMD-sua tela de 14 polegadas pode torná-lo mais adequado para ser usado em trânsito.
Preço e disponibilidade
A versão do ThinkPad P16s G2 com 64 GB de RAM e tela OLED pode ser encontrada por US$ 1.599 na Amazon.
Lenovo ThinkPad P16s G2 21K9000CGE
- 01/23/2024 v7 (old)
Mario Petzold
Transparência
A seleção dos dispositivos a serem analisados é feita pela nossa equipe editorial. A amostra de teste foi fornecida ao autor como empréstimo pelo fabricante ou varejista para fins desta revisão. O credor não teve influência nesta revisão, nem o fabricante recebeu uma cópia desta revisão antes da publicação. Não houve obrigação de publicar esta revisão. Como empresa de mídia independente, a Notebookcheck não está sujeita à autoridade de fabricantes, varejistas ou editores.
É assim que o Notebookcheck está testando
Todos os anos, o Notebookcheck analisa de forma independente centenas de laptops e smartphones usando procedimentos padronizados para garantir que todos os resultados sejam comparáveis. Desenvolvemos continuamente nossos métodos de teste há cerca de 20 anos e definimos padrões da indústria no processo. Em nossos laboratórios de teste, equipamentos de medição de alta qualidade são utilizados por técnicos e editores experientes. Esses testes envolvem um processo de validação em vários estágios. Nosso complexo sistema de classificação é baseado em centenas de medições e benchmarks bem fundamentados, o que mantém a objetividade.Price comparison

