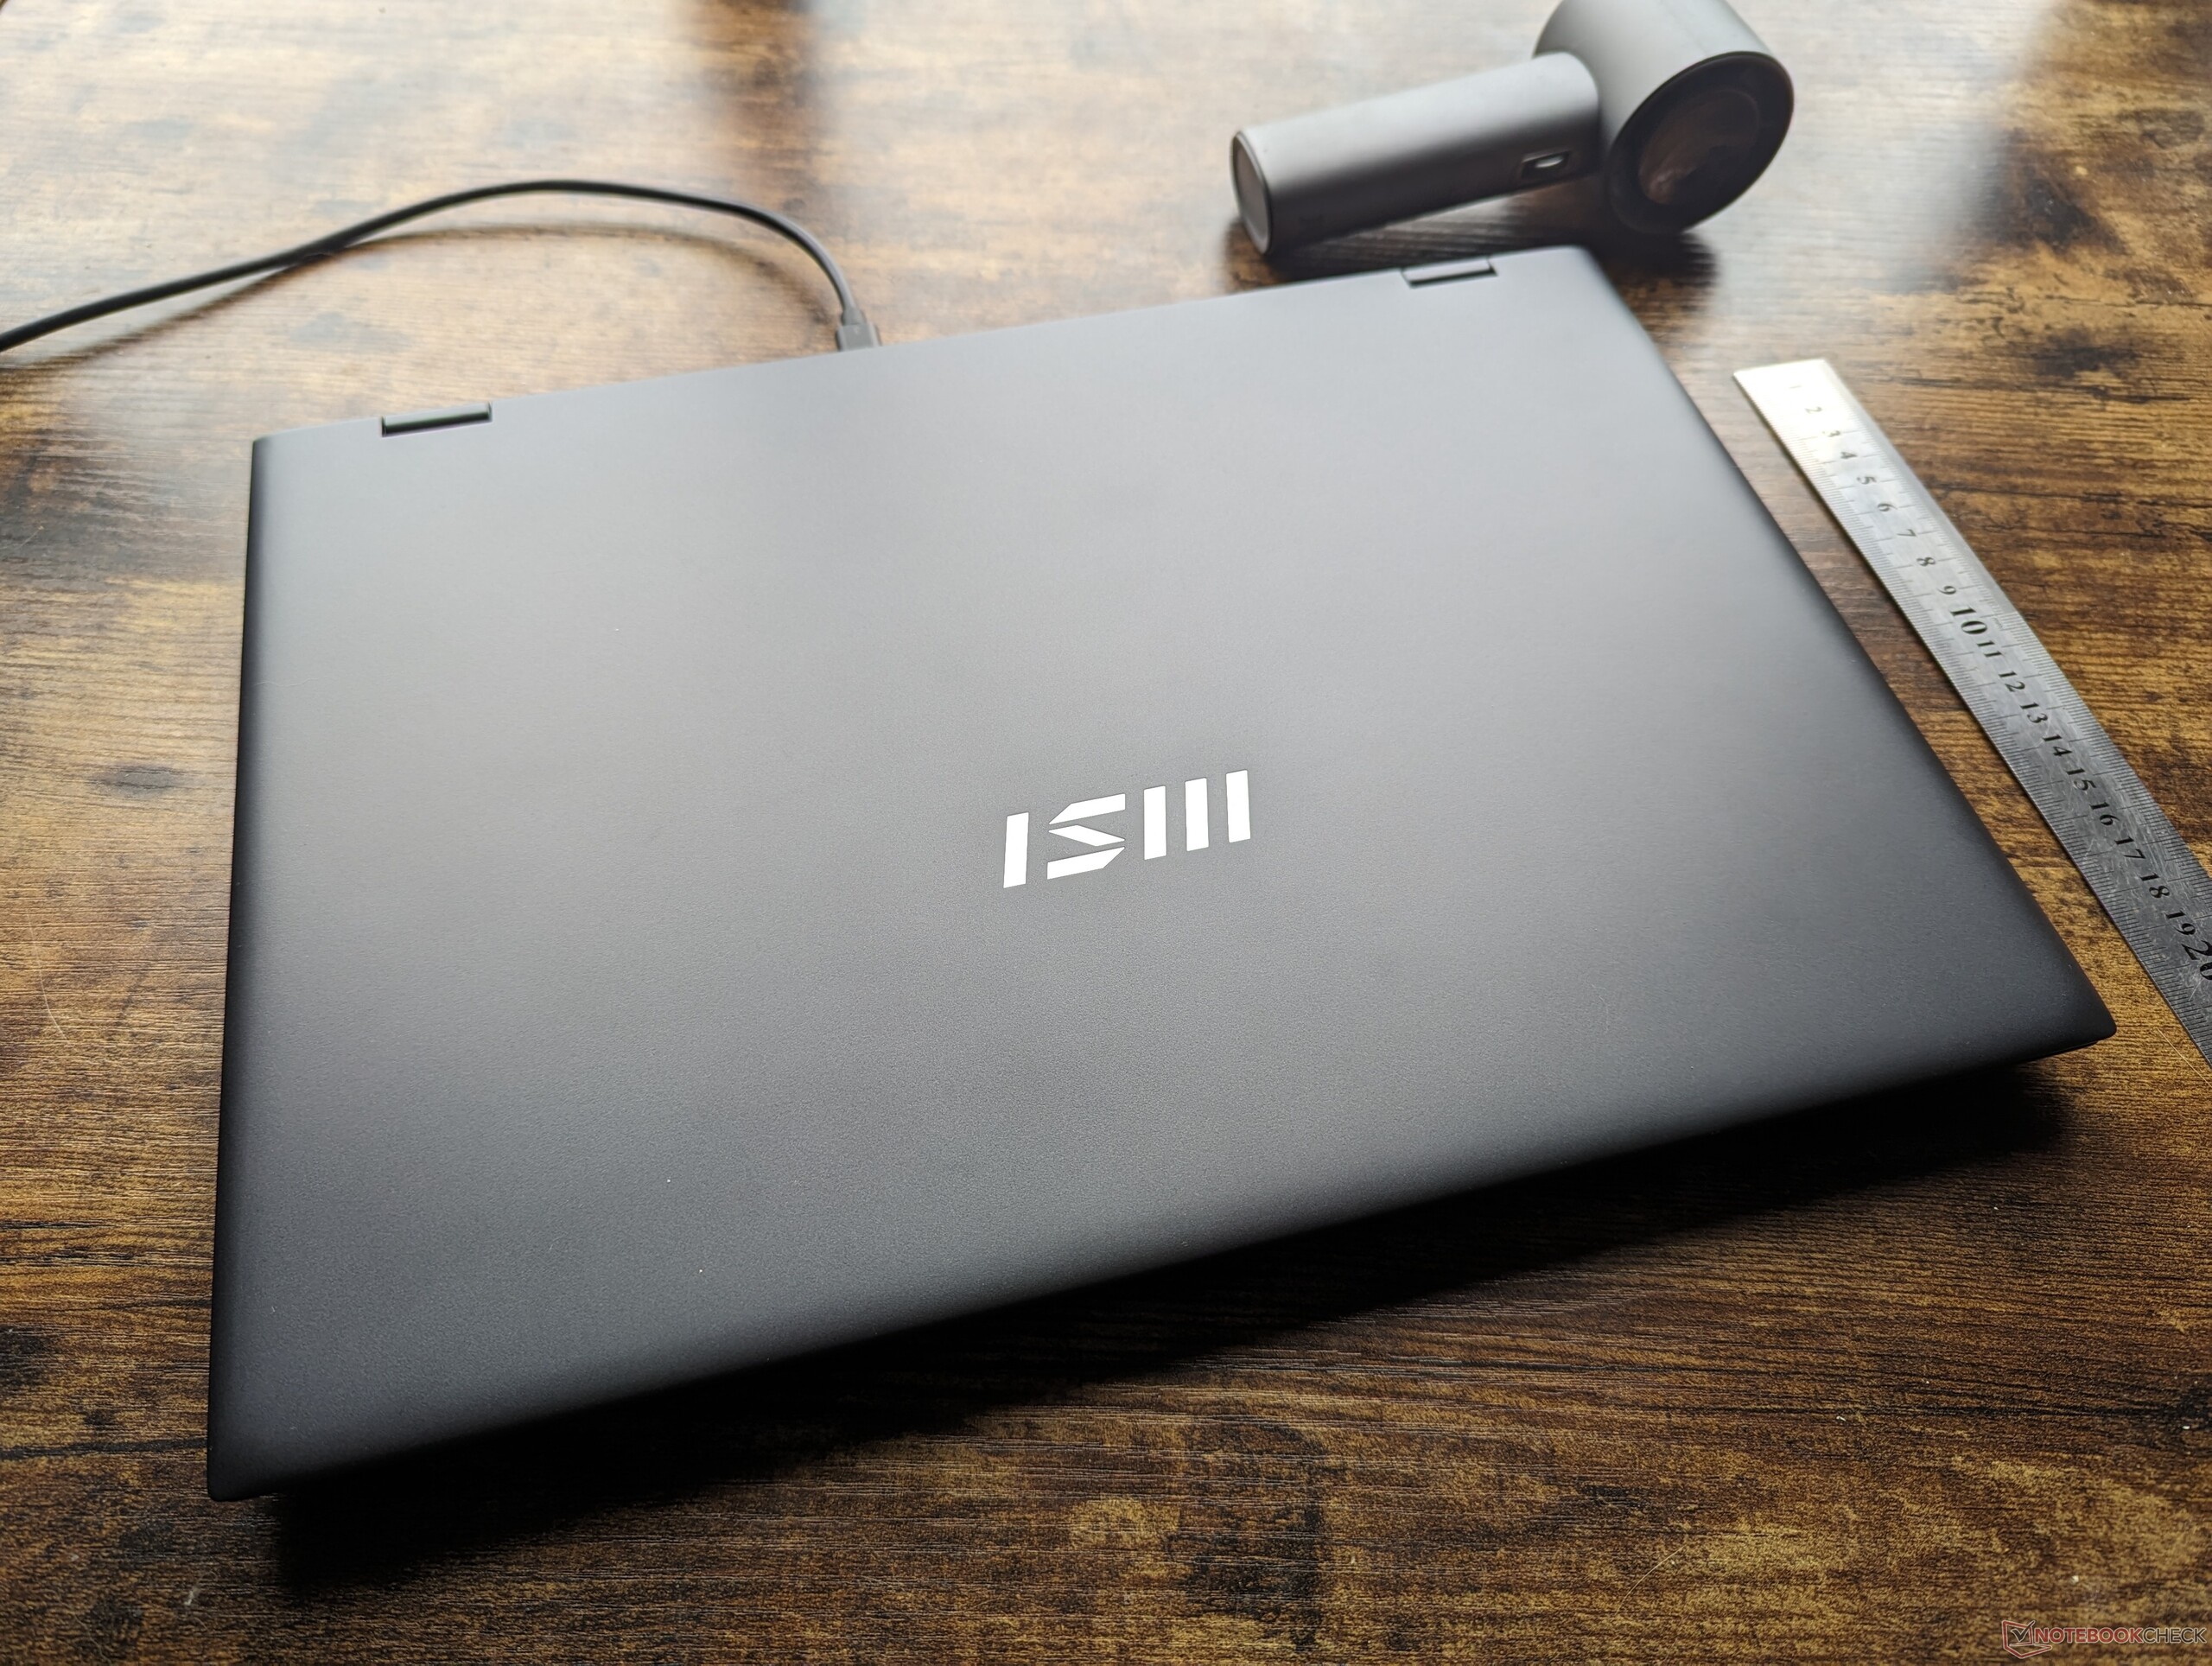
Análise do laptop MSI Prestige 16 B1MG: Do Core i7 Xe ao Core Ultra 7 Arc

O MSI Prestige 16 AI B1MG de 16 polegadas é um dos primeiros notebooks do mercado com opções de CPU Core Ultra Meteor Lake de 14ª geração. Ele é o sucessor do antigo Prestige 15 de 15,6 polegadas, com elementos internos e externos renovados para uma experiência de usuário totalmente nova. A família MSI Prestige é composta por notebooks de médio porte entre os notebooks de gama baixa Família Modern e a família Família Summit.
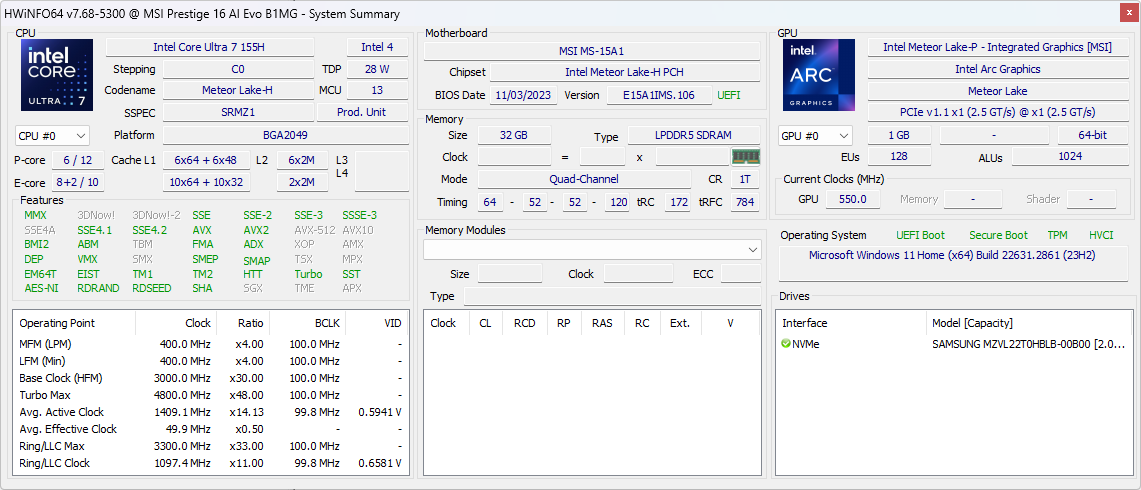
Nossa configuração em análise é uma unidade de varejo por US$ 1.400 com CPU Core Ultra 7 155H, gráficos Arc 8 integrados, tela IPS de 1600p, 32 GB de RAM LPDDR5-6400 MHz e SSD NVMe de 2 TB. Também estão disponíveis SKUs de ponta com o Core Ultra 9 185H, gráficos GeForce RTX 4060 ou 4070, gráficos Arc 370M e OLED 4K (2400p).
Os concorrentes do Prestige 16 incluem outros notebooks finos e leves para multimídia ou criadores de conteúdo, como a Série Dell XPS, Asus VivoBook Pro 16,LG Gram 16 2 em 1ou o Lenovo Yoga Pro 9i 16.
Mais análises da MSI:
Possíveis concorrentes em comparação
Avaliação | Data | Modelo | Peso | Altura | Size | Resolução | Preço |
|---|---|---|---|---|---|---|---|
| 88.1 % v7 (old) | 12/2023 | MSI Prestige 16 B1MG-001US Ultra 7 155H, Arc 8-Core | 1.6 kg | 19.1 mm | 16.00" | 2560x1600 | |
| 85.4 % v7 (old) | 12/2022 | MSI Prestige 15 A12UD-093 i7-1280P, GeForce RTX 3050 Ti Laptop GPU | 1.8 kg | 20.1 mm | 15.60" | 3840x2160 | |
| 85.8 % v7 (old) | 11/2023 | LG Gram 2in1 16 16T90R - G.AA78G i7-1360P, Iris Xe G7 96EUs | 1.5 kg | 17.2 mm | 16.00" | 2560x1600 | |
| 85.7 % v7 (old) | 11/2023 | Lenovo ThinkBook 16 G6 ABP R5 7530U, Vega 7 | 1.8 kg | 17.5 mm | 16.00" | 1920x1200 | |
| 87.6 % v7 (old) | 11/2023 | Asus VivoBook Pro 16 K6602VU i9-13900H, GeForce RTX 4050 Laptop GPU | 1.9 kg | 19 mm | 16.00" | 3200x2000 | |
| 87.1 % v7 (old) | 08/2023 | Dell Inspiron 16 Plus 7630 i7-13700H, GeForce RTX 4060 Laptop GPU | 2.2 kg | 19.95 mm | 16.00" | 2560x1600 |
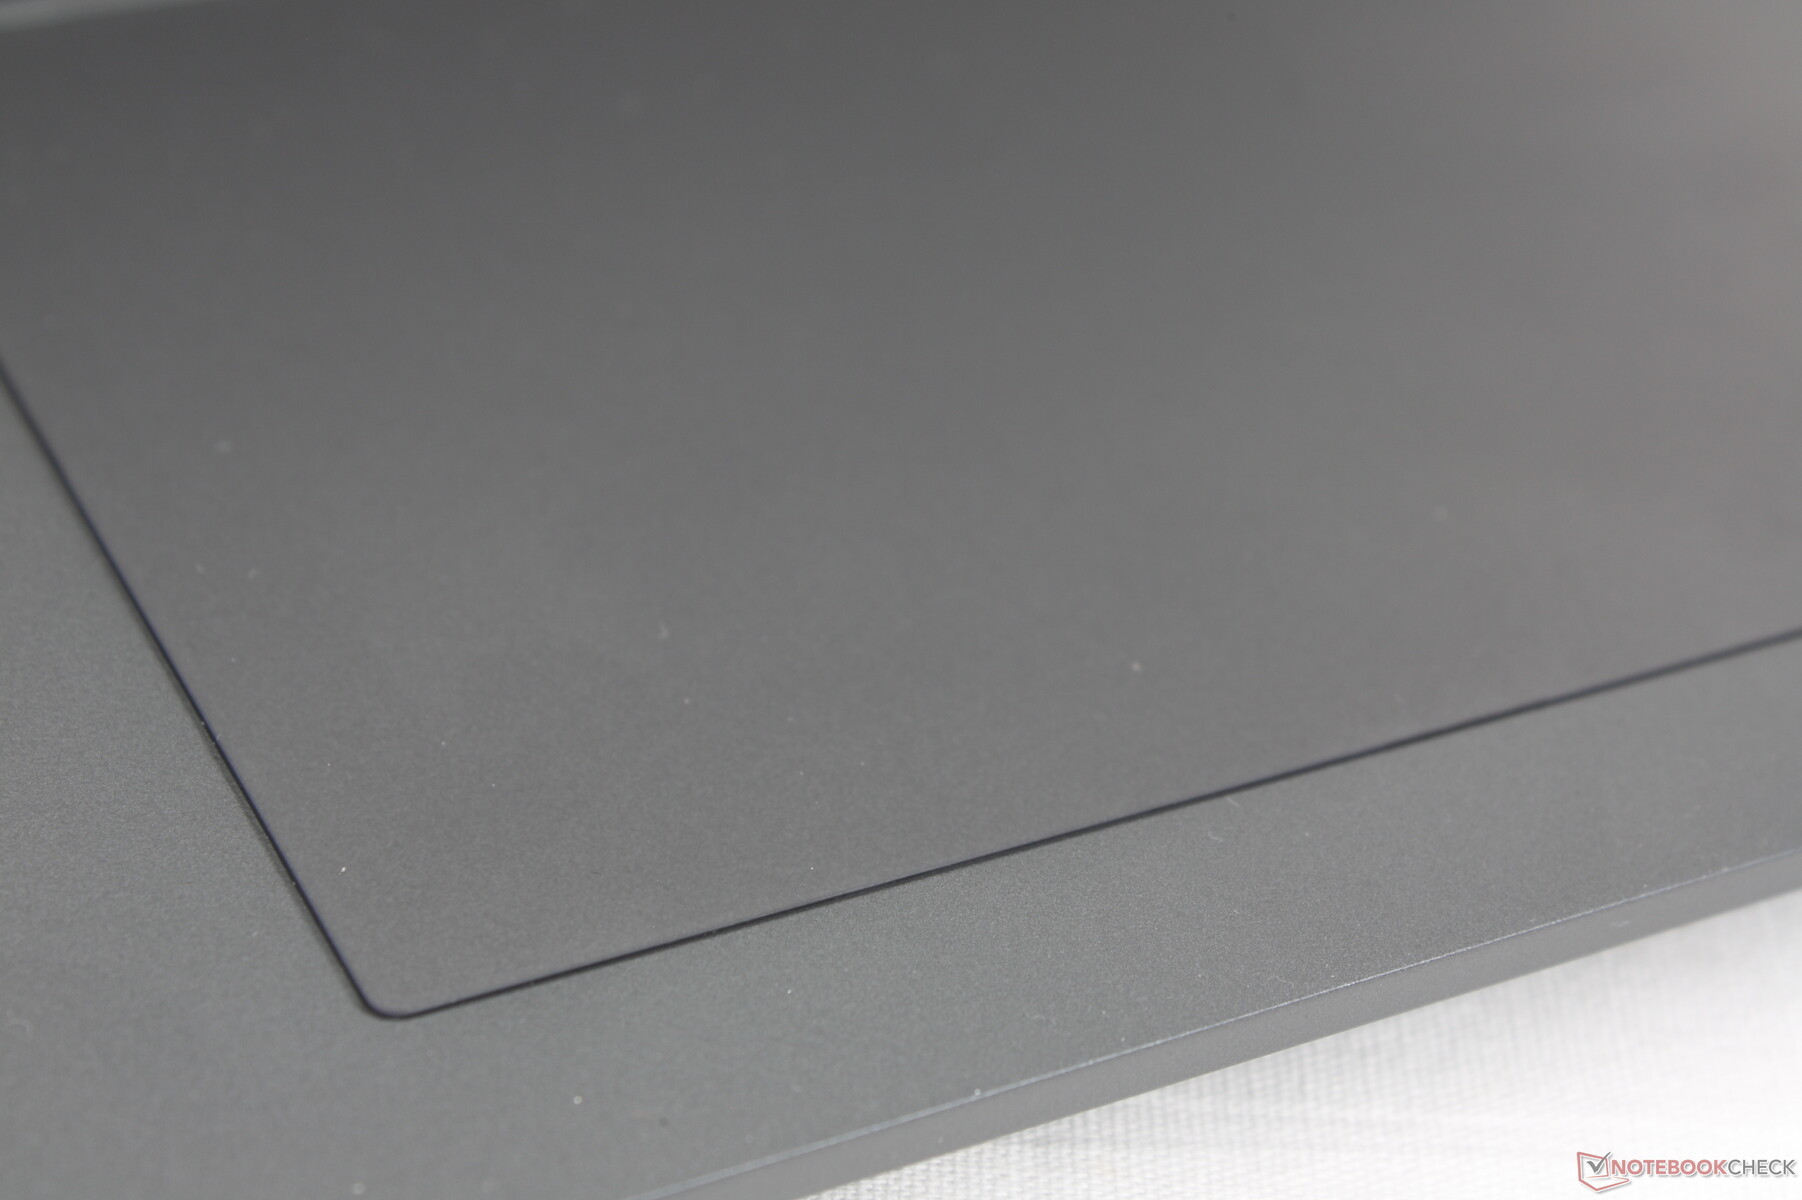
Case - Aparência fina, materiais finos
O chassi de metal é mais firme e resistente do que o encontrado em um MSI Modern ou Asus VivoBook mais barato. Aplicar pressão sobre o centro do teclado, por exemplo, dificilmente deformaria a superfície. A tampa é comparativamente mais suscetível a torções e danos, especialmente porque não tem o reforço do Gorilla Glass. A aplicação de pressão no centro da tampa externa deformaria sua superfície mais do que gostaríamos de ver. Nesse caso, alternativas como o HP Spectre ou o Razer Blade são muito mais resistentes, embora sejam mais pesados.
A proporção de aspecto 16:10 mais quadrada dá ao Prestige 16 uma área de cobertura maior do que a do Prestige 15. No entanto, ele compensa a diferença com um perfil mais fino e um peso mais leve. Na verdade, o Prestige 16 é um dos laptops multimídia de 16 polegadas mais leves, rivalizando com o LG Gram 16 2 em 1. Esperamos que as SKUs com gráficos discretos sejam um pouco mais pesadas, no entanto.
Conectividade - Pronto para o Wi-Fi 7
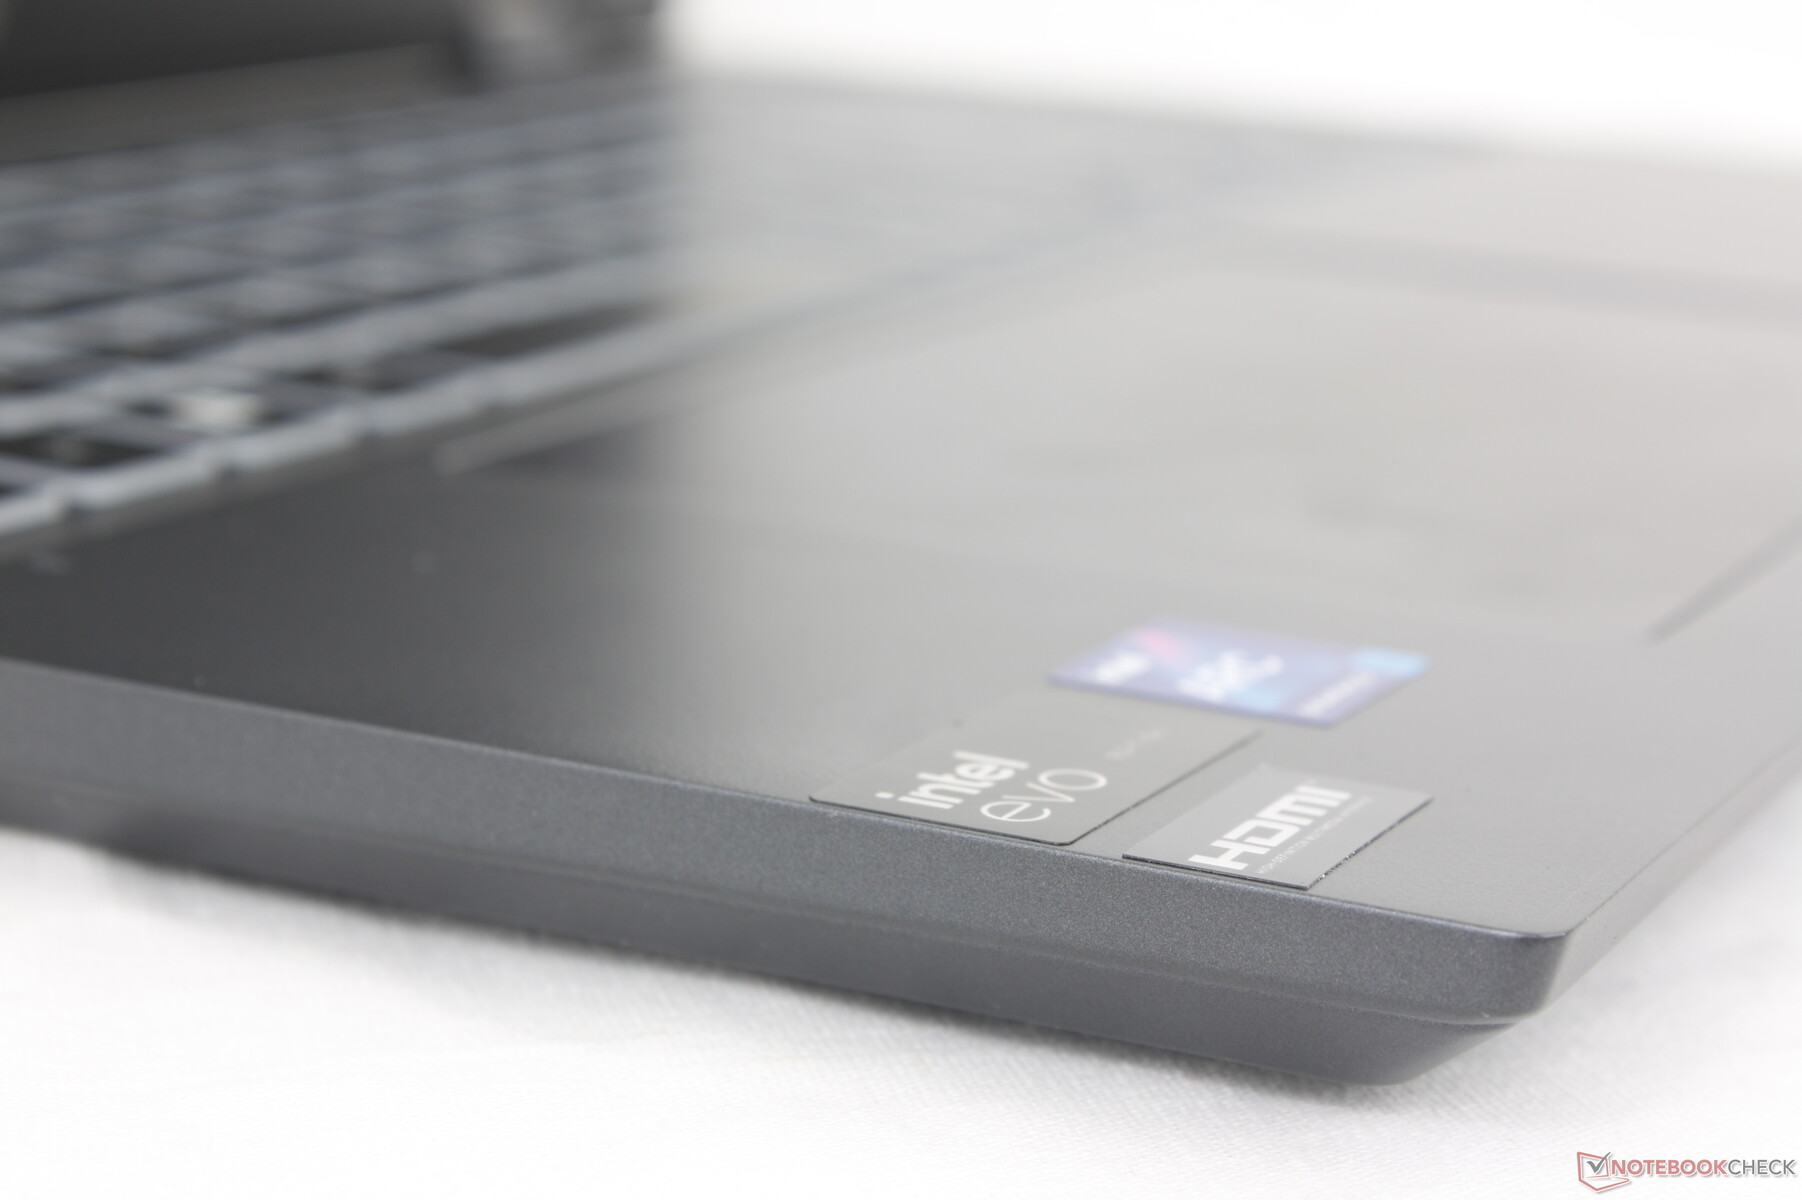
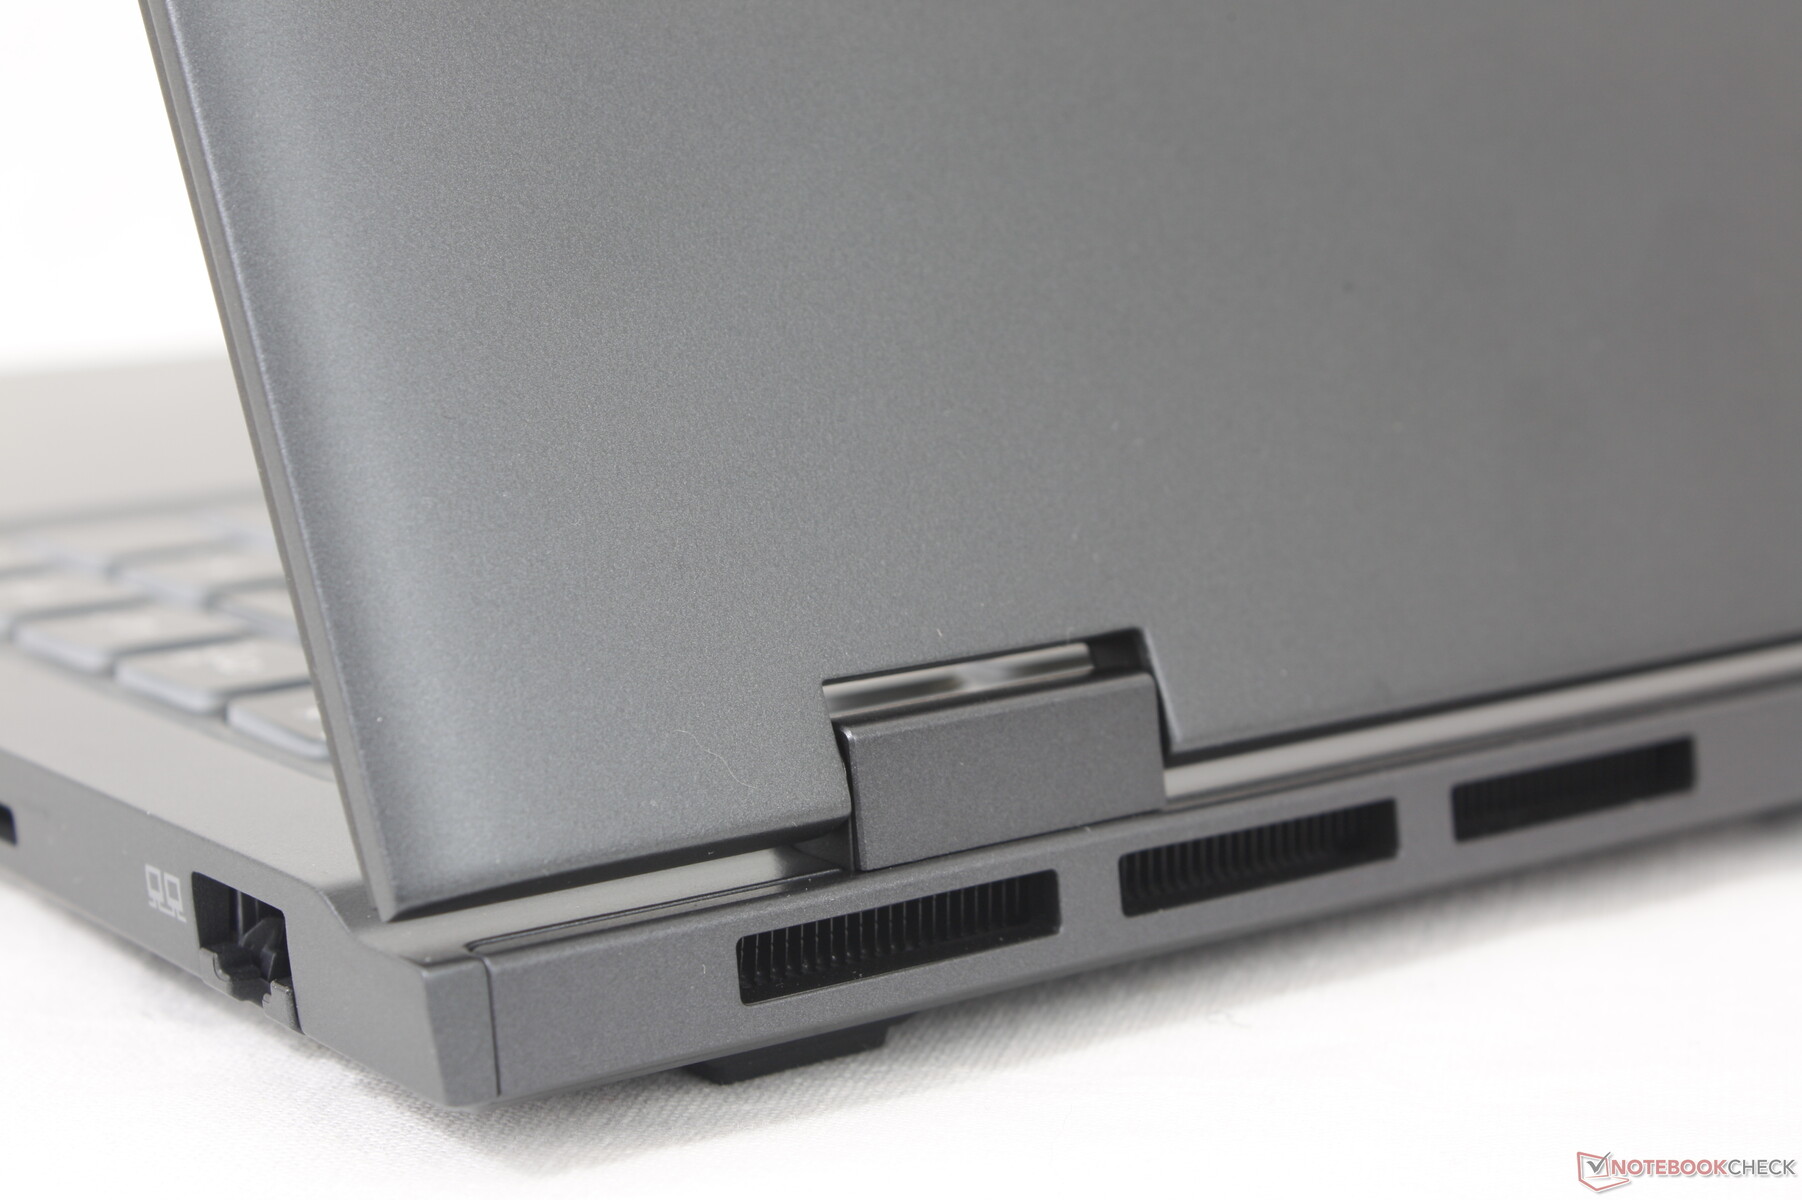
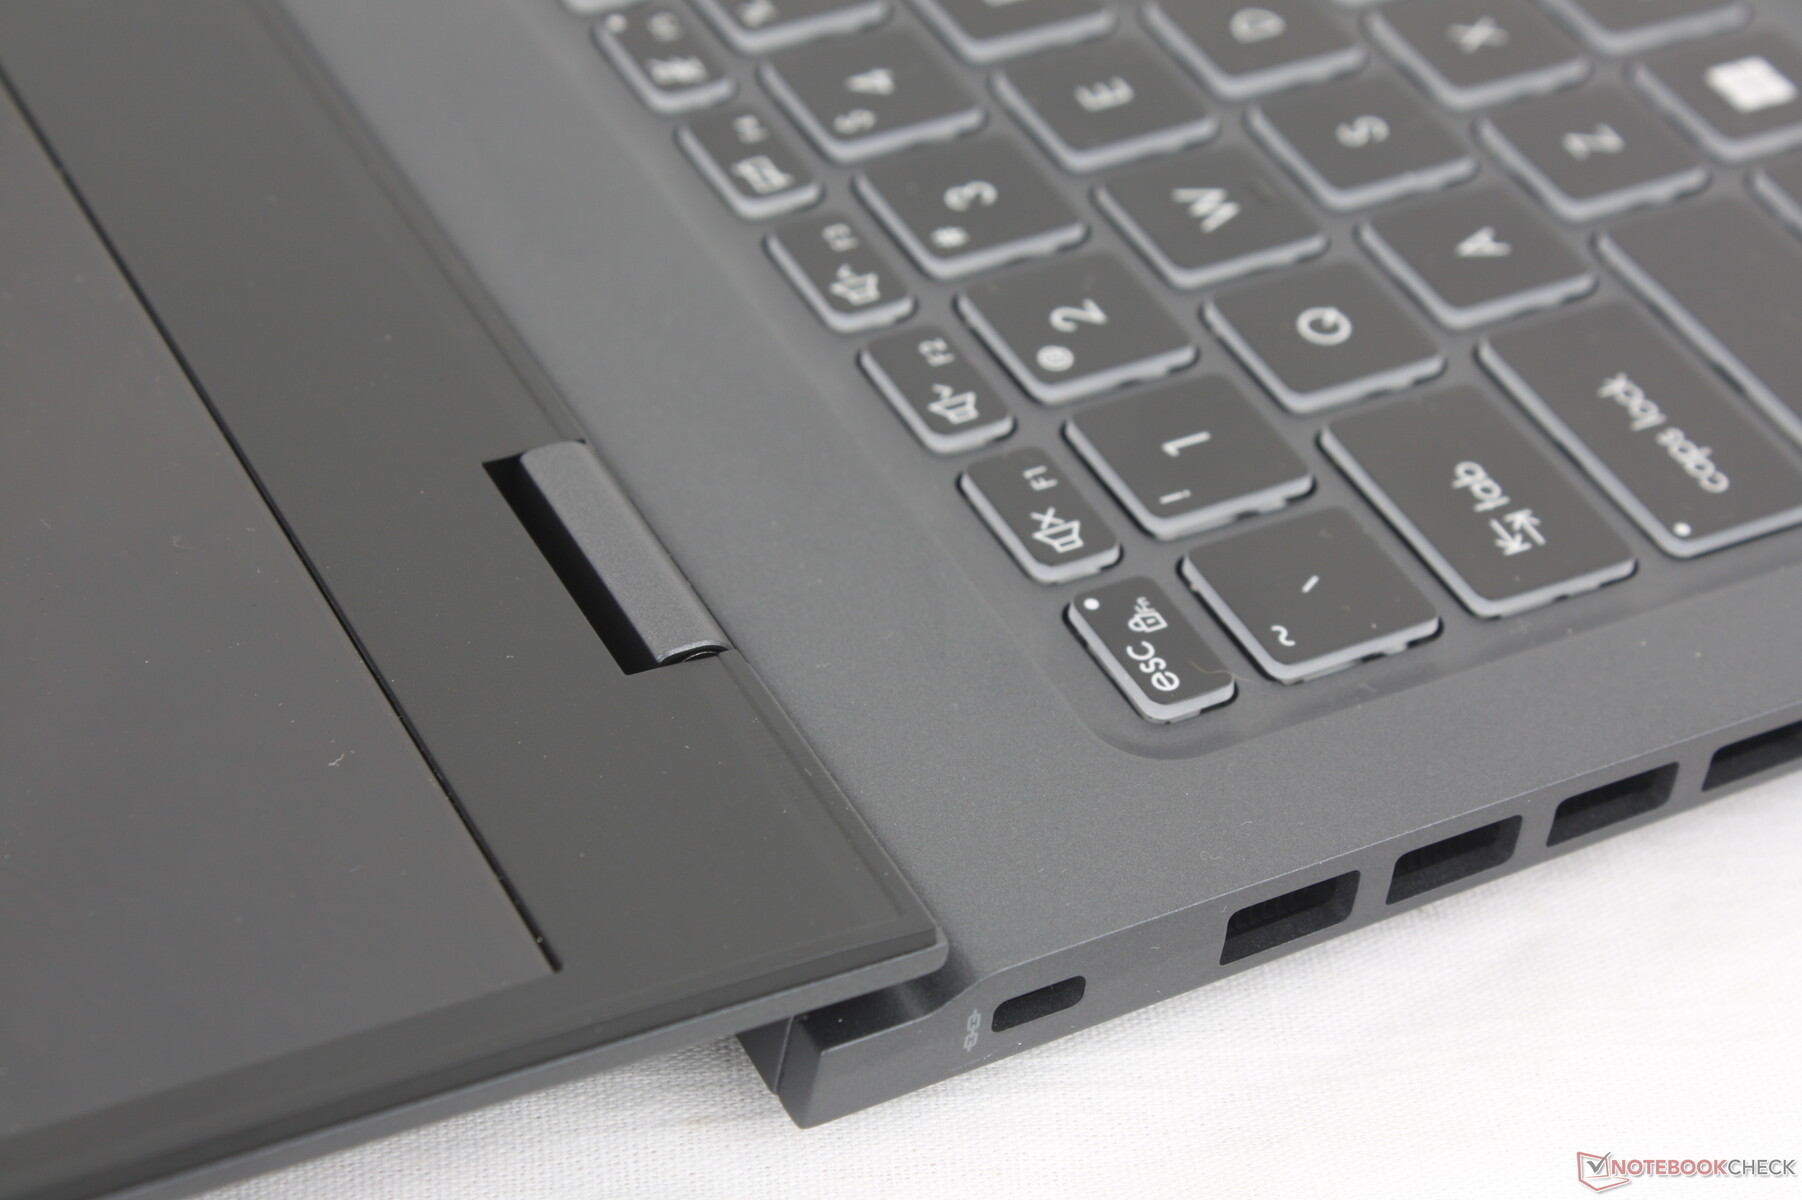
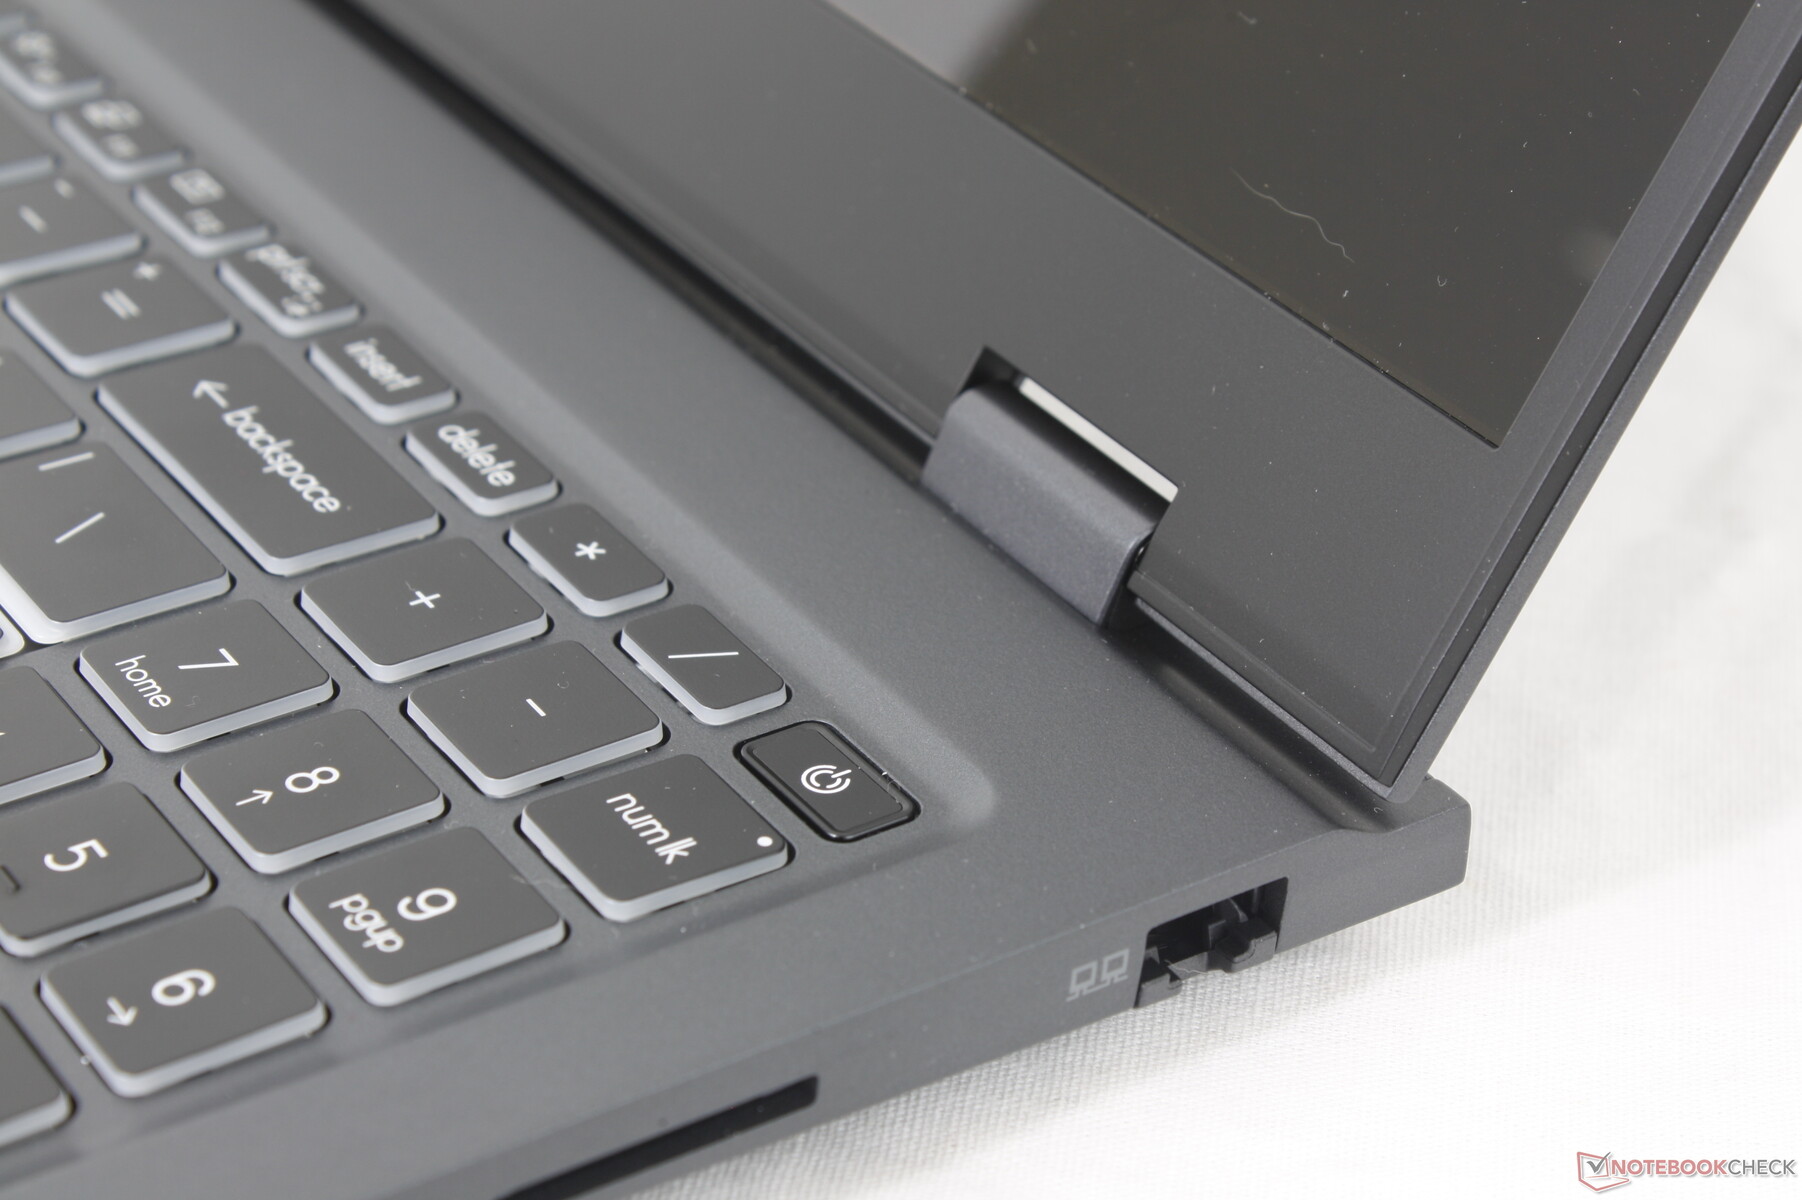
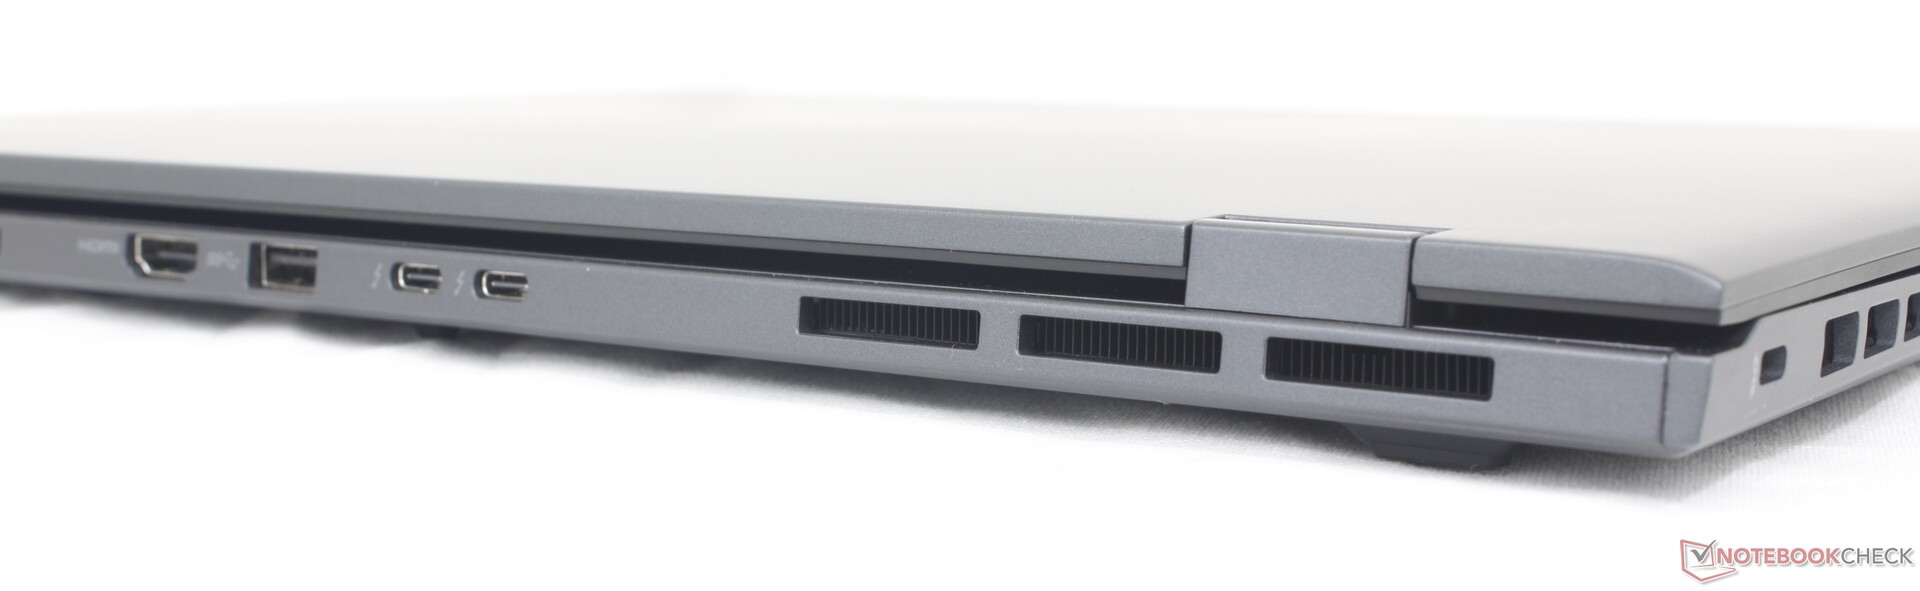
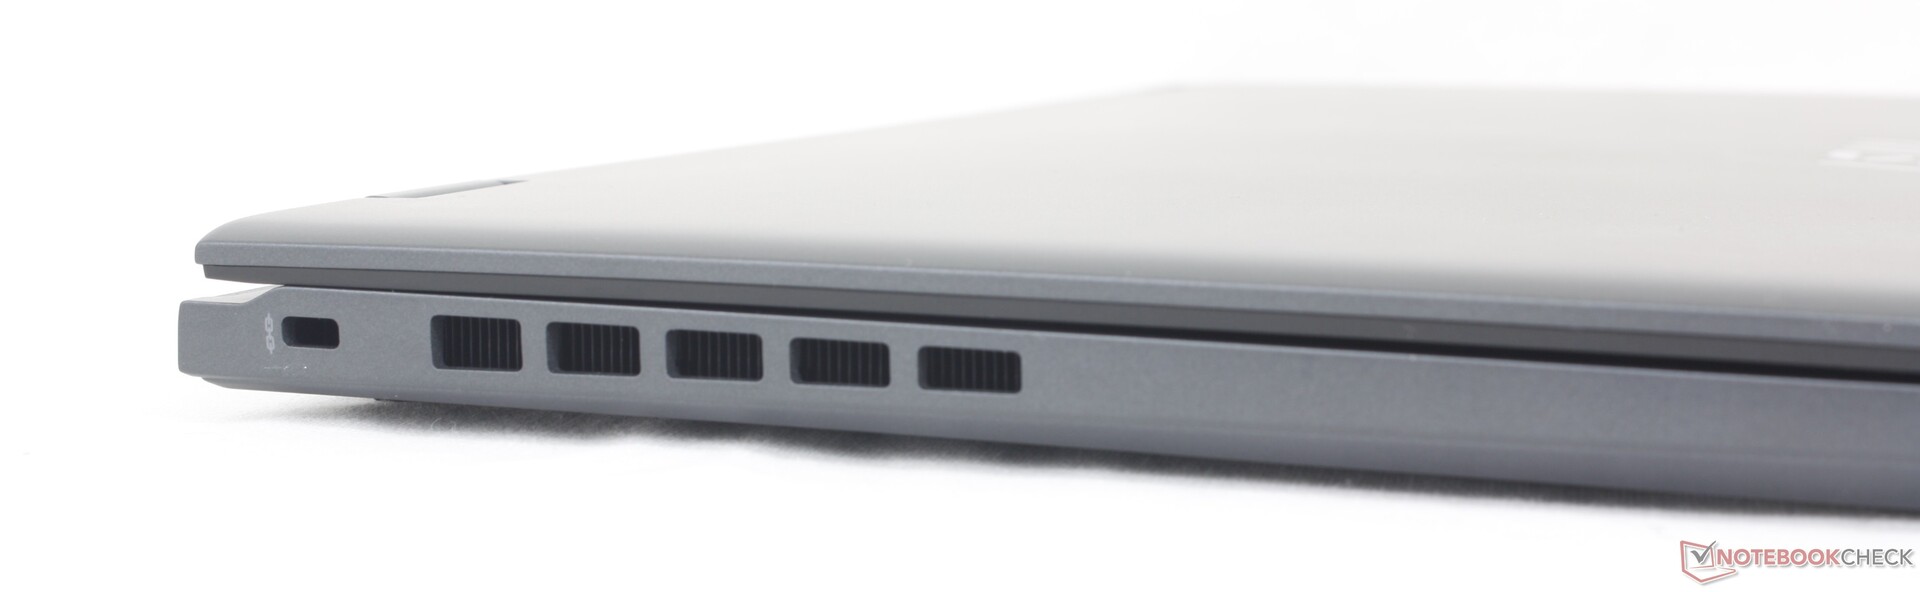
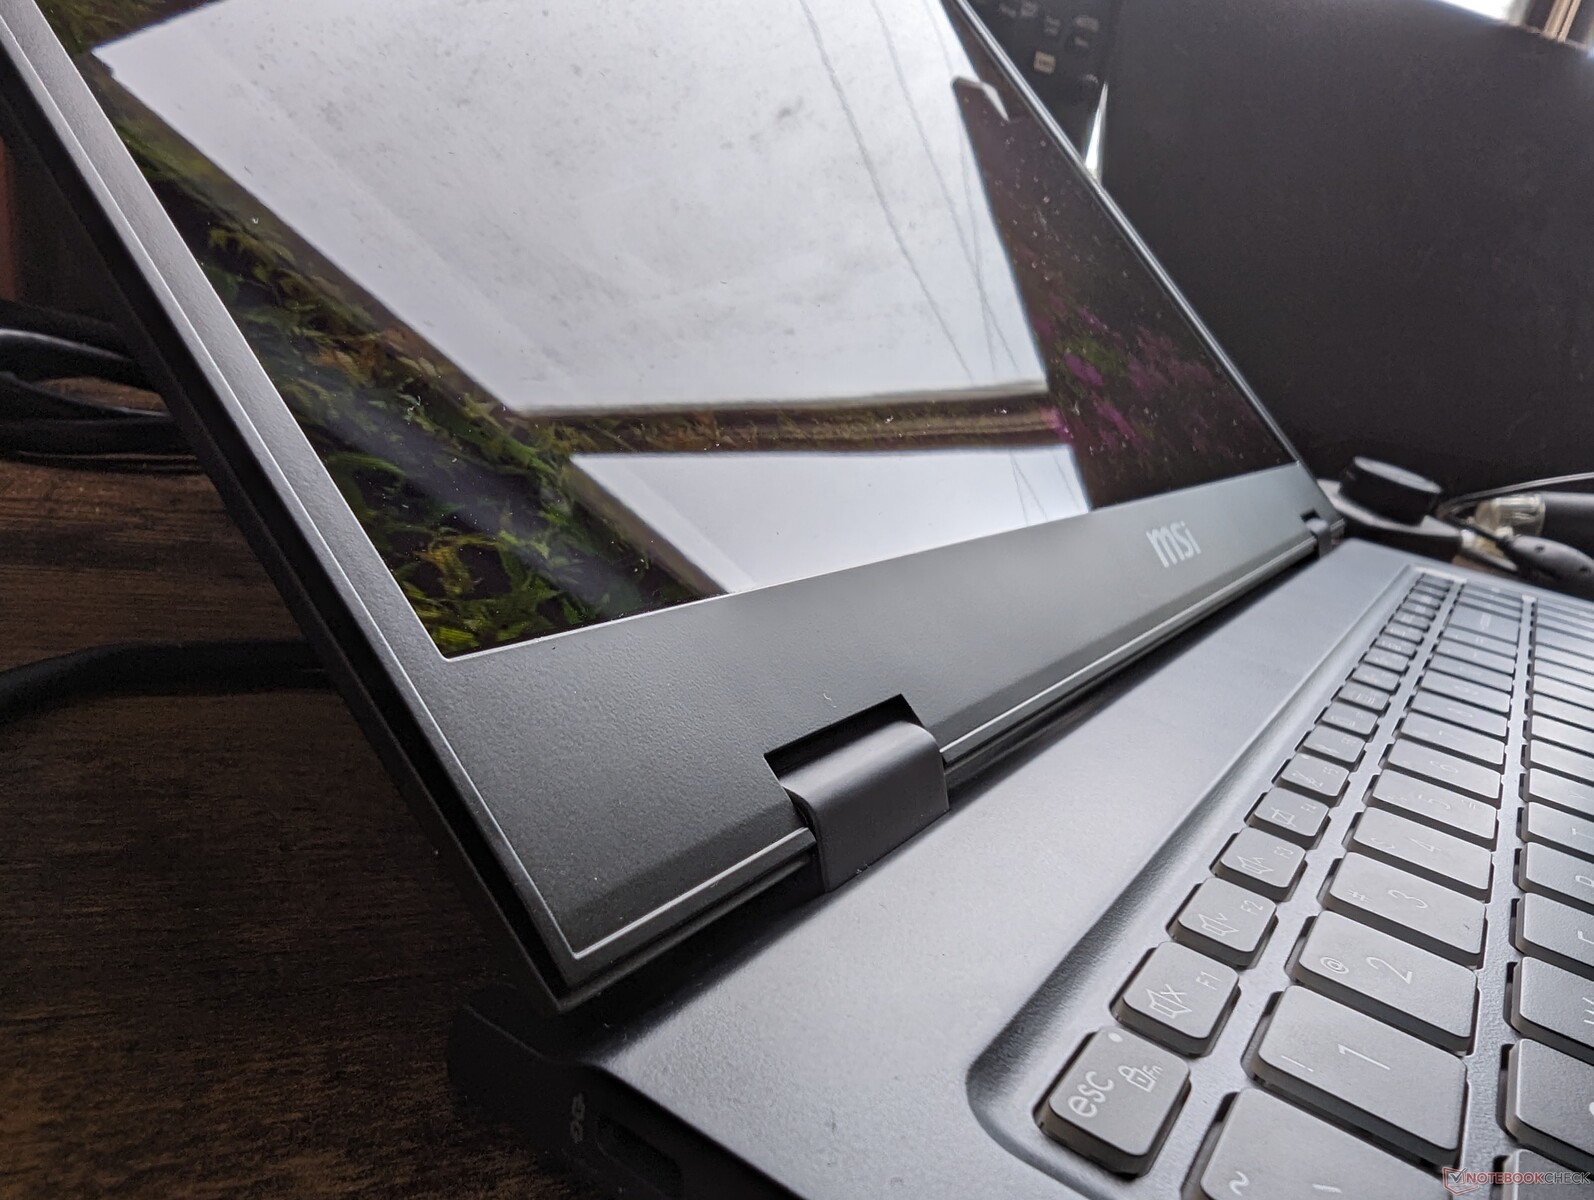
Ao contrário da maioria dos outros Ultrabooks, as portas do Prestige 16 estão concentradas na parte traseira e não nas laterais. Essa abordagem de design permite uma melhor ventilação ao longo das laterais, embora ao custo de uma menor acessibilidade às portas. As portas comumente usadas, como HDMI, USB-C e até mesmo USB-A, estão todas na parte traseira, o que pode não ser ideal para a maioria dos usuários.
Em comparação com o Prestige 15, o Prestige 16 trocou uma porta USB-A por uma porta RJ-45. As duas portas Thunderbolt 4 permanecem intactas para SKUs com apenas gráficos integrados. Se configurado com gráficos discretos, apenas uma das duas portas USB-C é compatível com Thunderbolt.
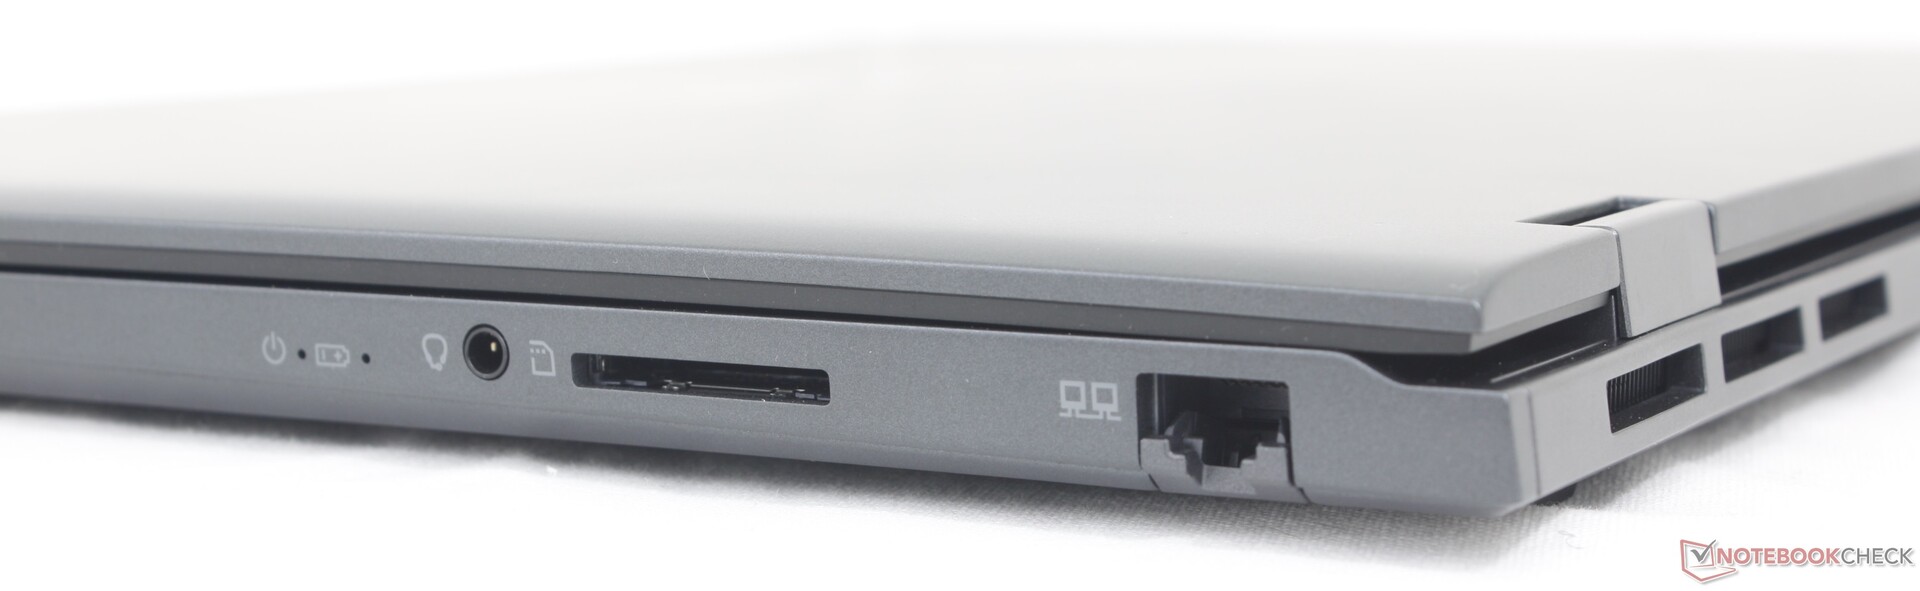
Leitor de cartão SD
O leitor de cartão SD integrado foi atualizado para proporcionar velocidades muito mais rápidas. A transferência de 1 GB de fotos do nosso cartão de teste UHS-II para o desktop levaria pouco menos de 6 segundos, em comparação com mais de 12 segundos no Prestige 15.
| SD Card Reader | |
| average JPG Copy Test (av. of 3 runs) | |
| MSI Prestige 16 B1MG-001US (Toshiba Exceria Pro SDXC 64 GB UHS-II) | |
| Asus VivoBook Pro 16 K6602VU (Angelbird AV Pro V60) | |
| Lenovo ThinkBook 16 G6 ABP (Angelbird AV Pro V60) | |
| MSI Prestige 15 A12UD-093 (AV Pro SD microSD 128 GB V60) | |
| LG Gram 2in1 16 16T90R - G.AA78G | |
| Dell Inspiron 16 Plus 7630 (AV Pro SD microSD 128 GB V60) | |
| maximum AS SSD Seq Read Test (1GB) | |
| Asus VivoBook Pro 16 K6602VU (Angelbird AV Pro V60) | |
| MSI Prestige 16 B1MG-001US (Toshiba Exceria Pro SDXC 64 GB UHS-II) | |
| Lenovo ThinkBook 16 G6 ABP (Angelbird AV Pro V60) | |
| MSI Prestige 15 A12UD-093 (AV Pro SD microSD 128 GB V60) | |
| Dell Inspiron 16 Plus 7630 (AV Pro SD microSD 128 GB V60) | |
| LG Gram 2in1 16 16T90R - G.AA78G | |
Comunicação
O Prestige 16 é um dos primeiros notebooks a ser fornecido com o módulo Killer BE1750W WLAN para compatibilidade com o Wi-Fi 7. No entanto, os roteadores Wi-Fi 7 ainda não estão amplamente disponíveis e, portanto, a inclusão do Wi-Fi 7 no momento tem mais a ver com a preparação para o futuro do que com benefícios imediatos. Mesmo assim, não tivemos problemas de conectividade quando emparelhado com nosso roteador de teste Wi-Fi 6E.
Webcam
Uma webcam de 2 MP com IR e obturador de privacidade físico é padrão. Alternativas como o HP Spectre já começaram a ser vendidos com sensores de 5 MP de resolução mais alta.


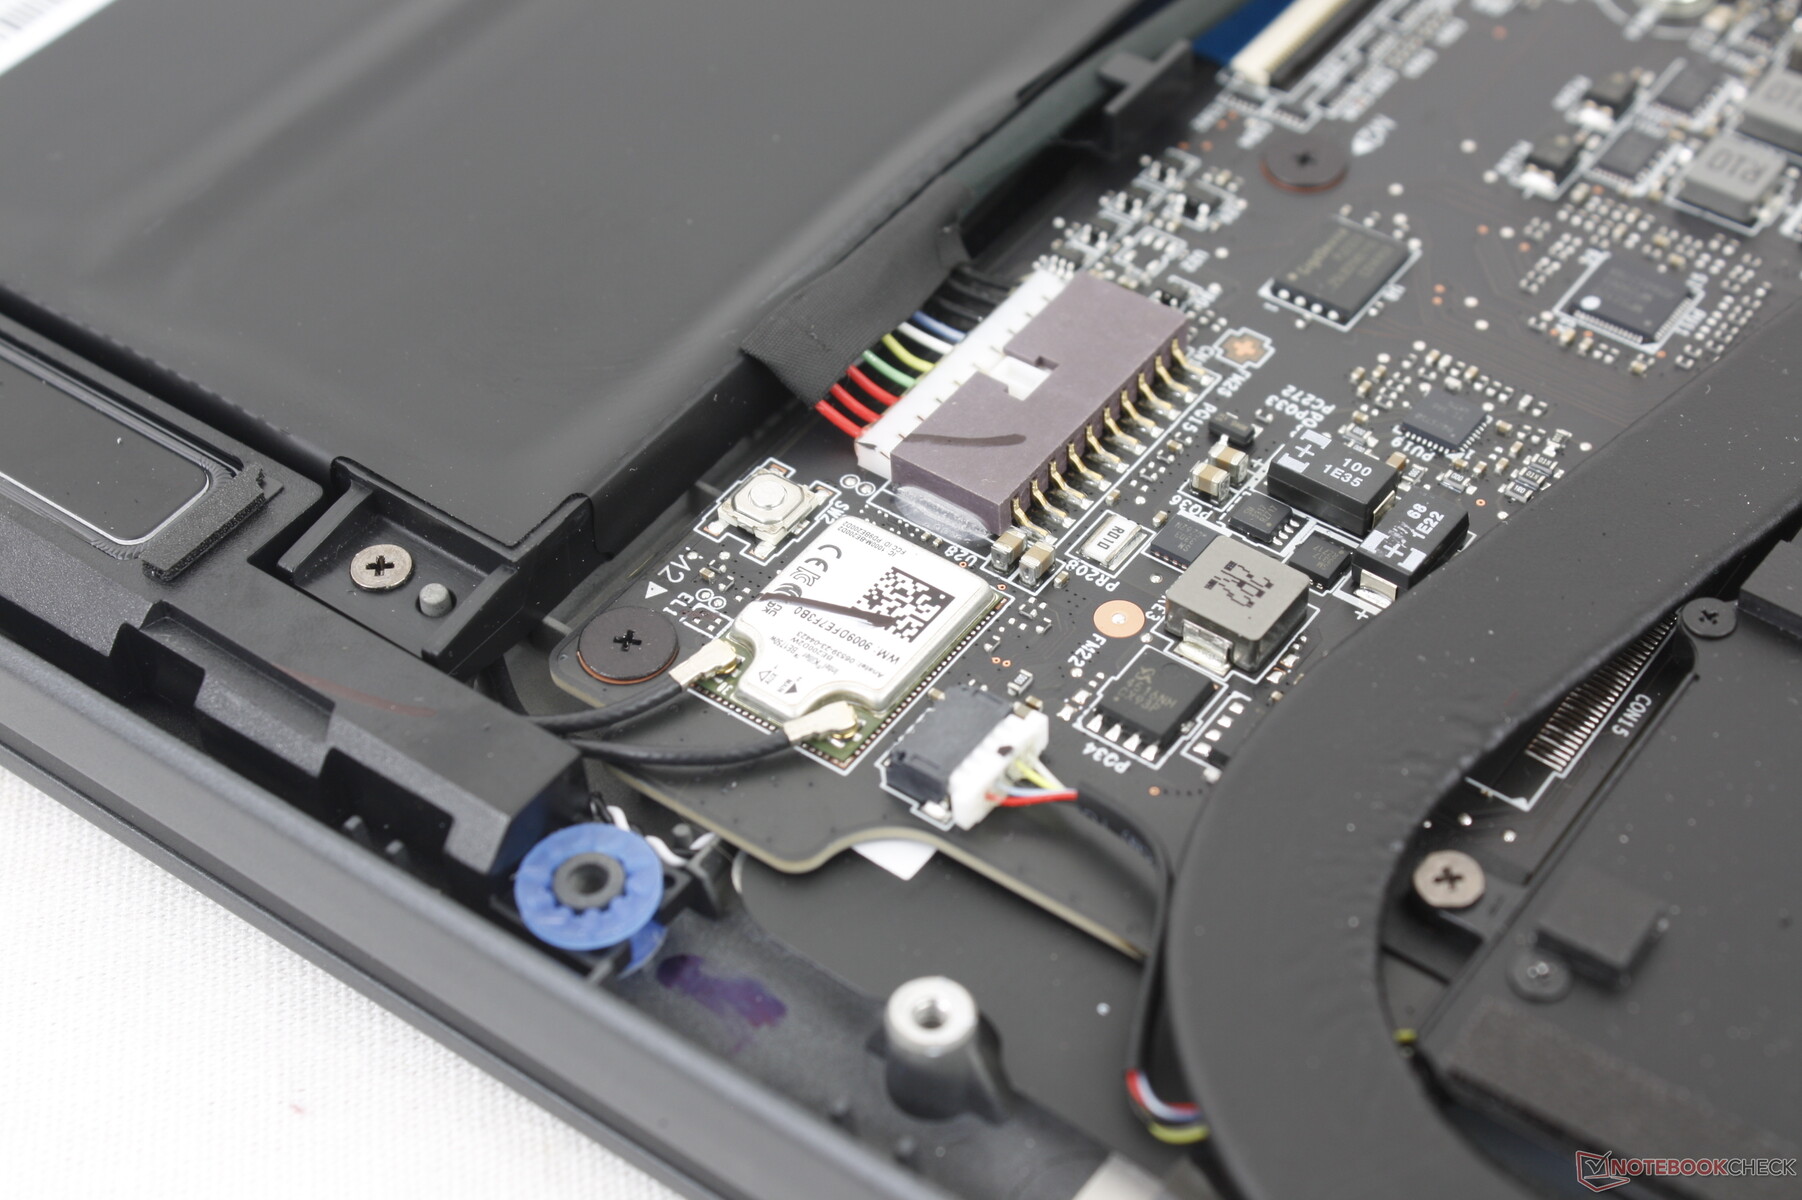
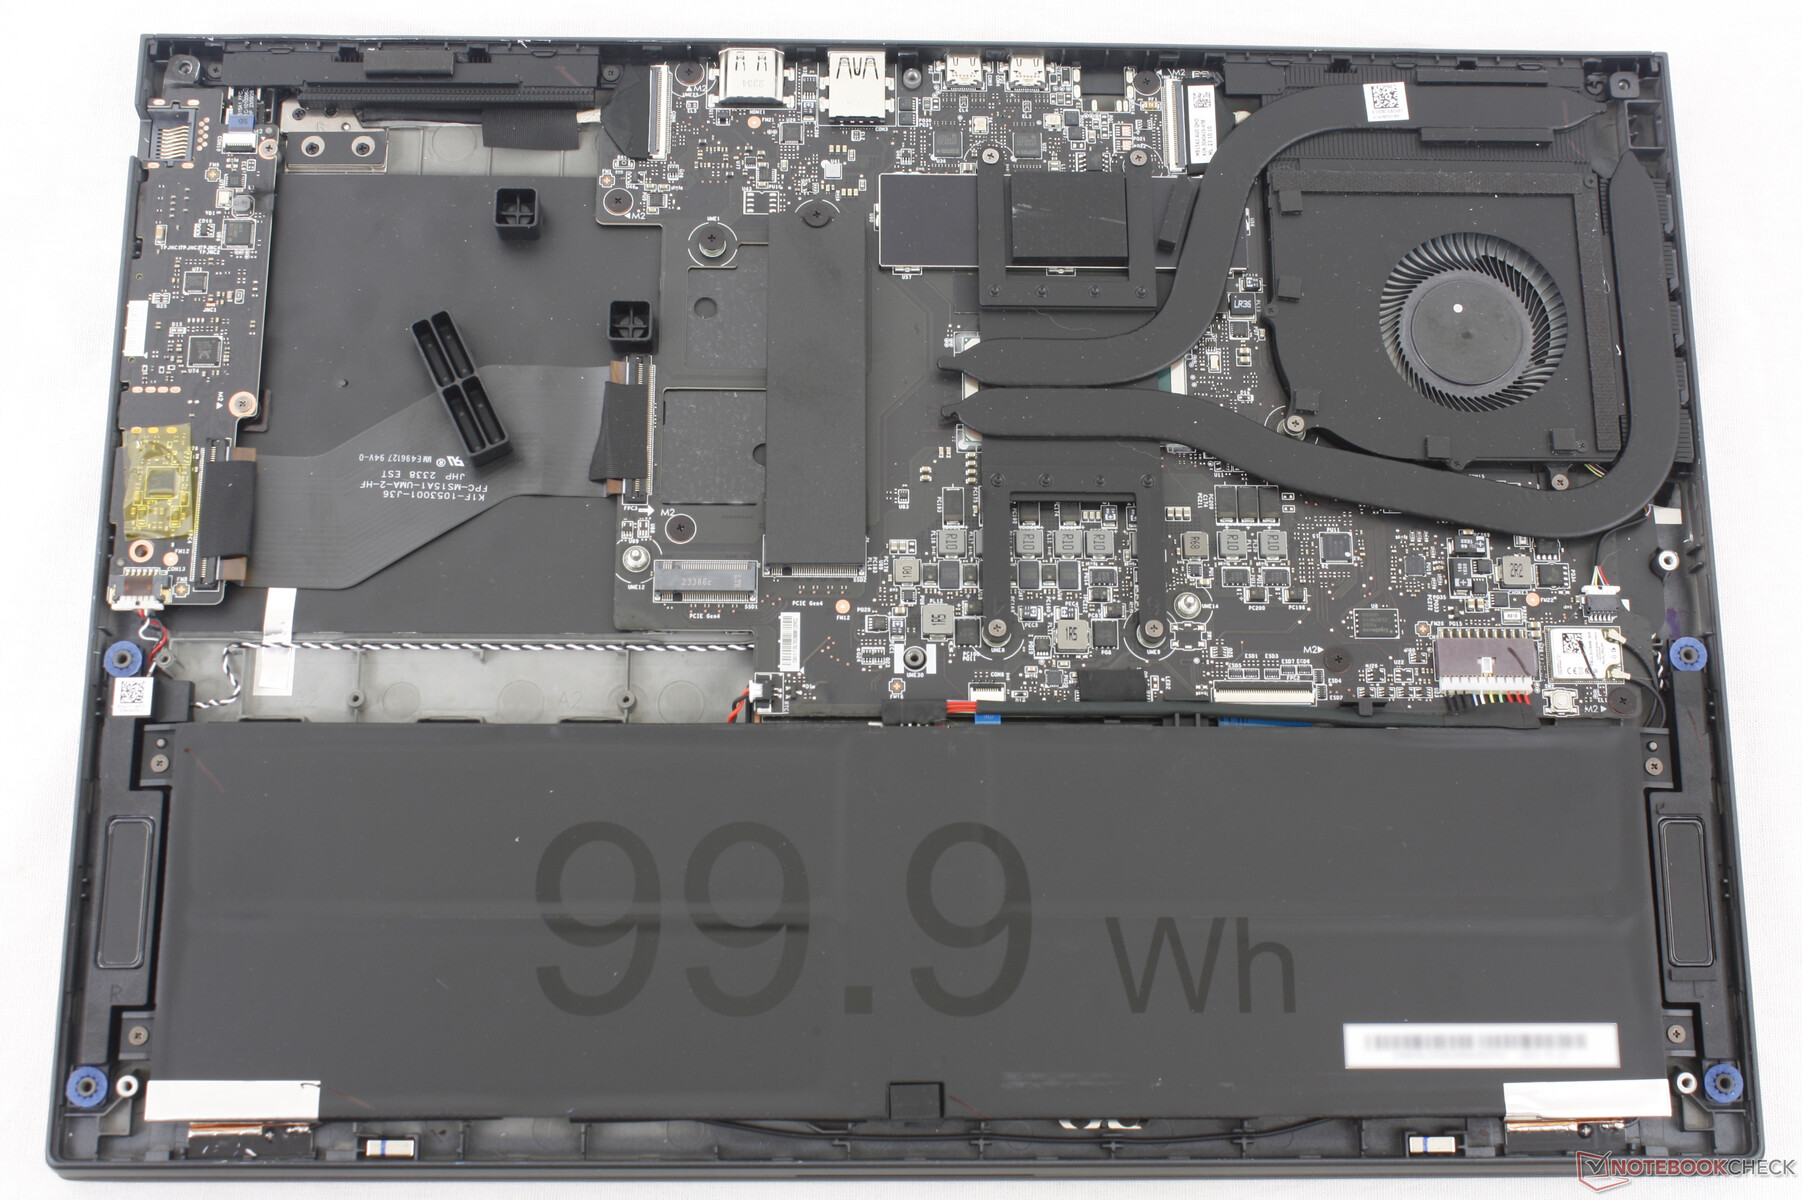
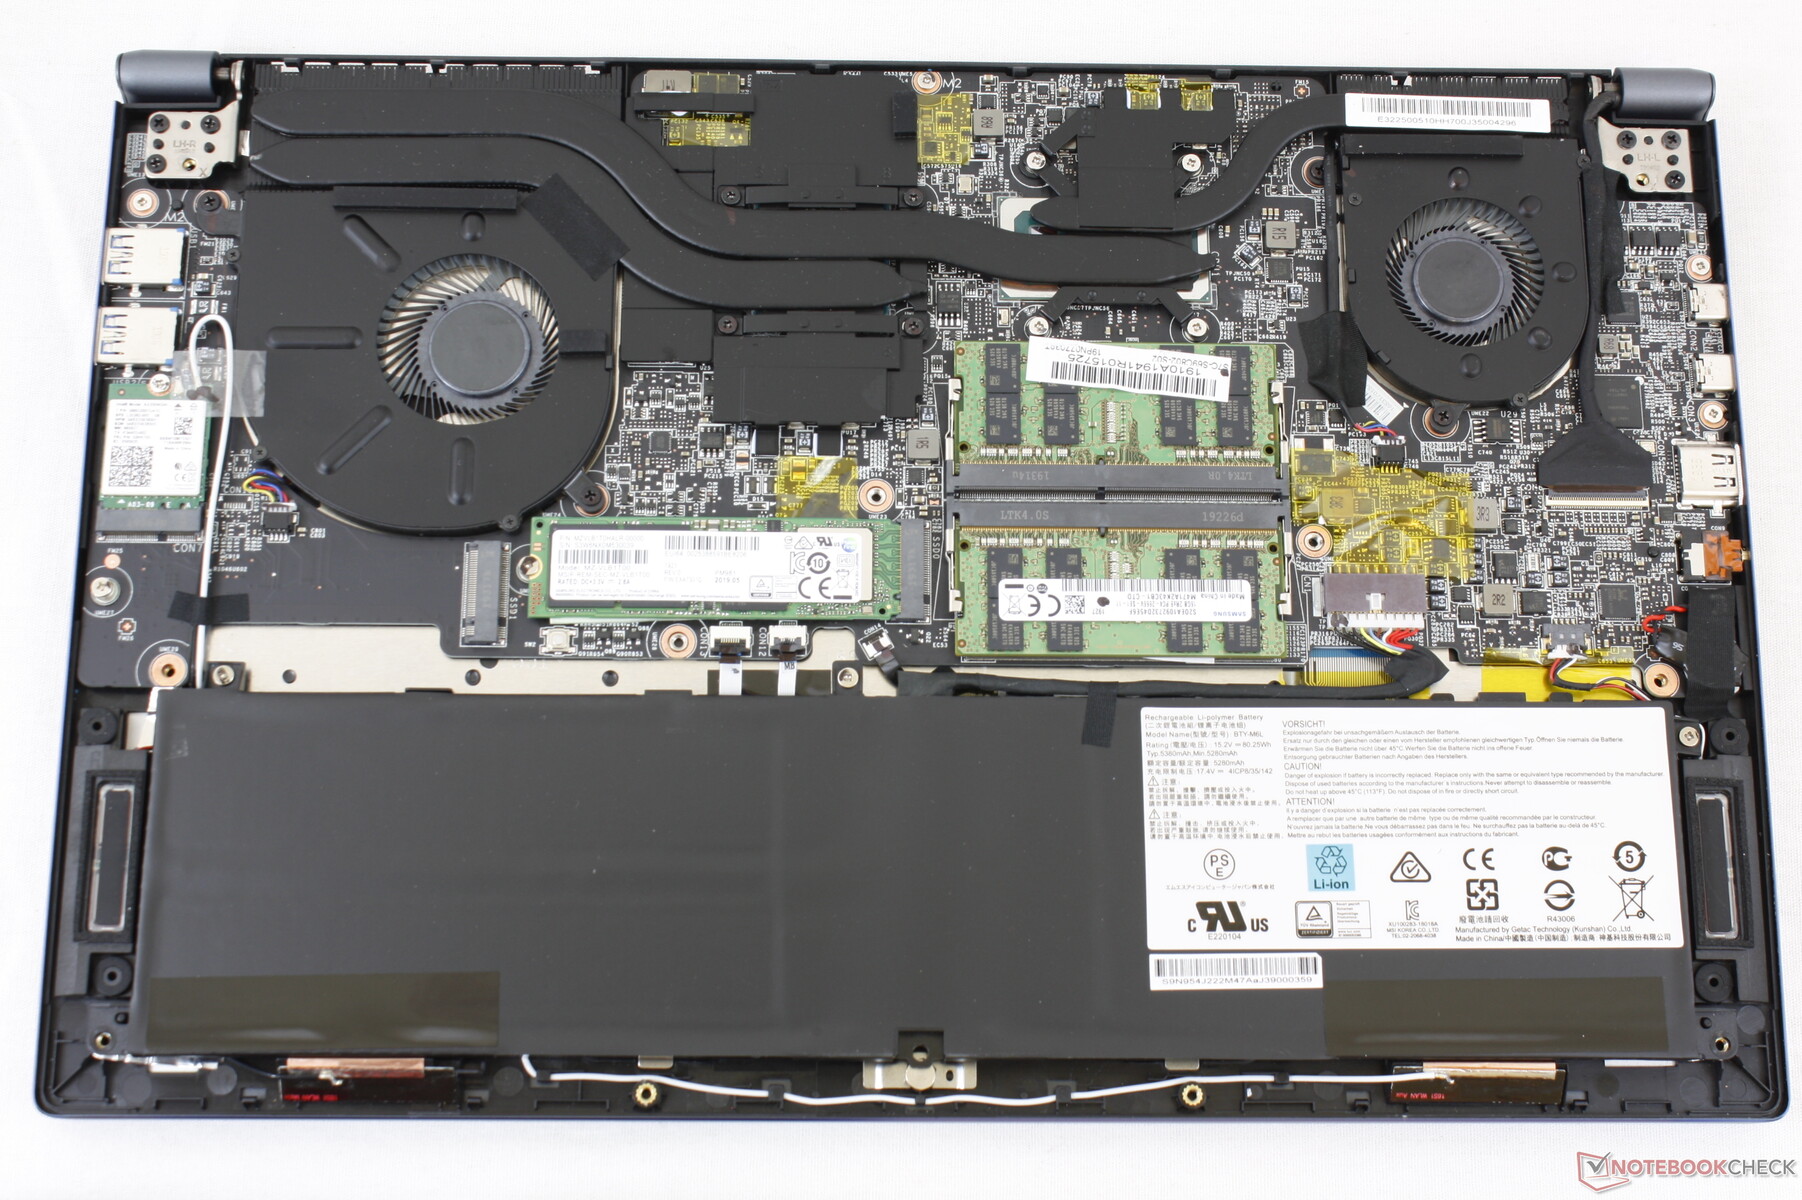
Manutenção
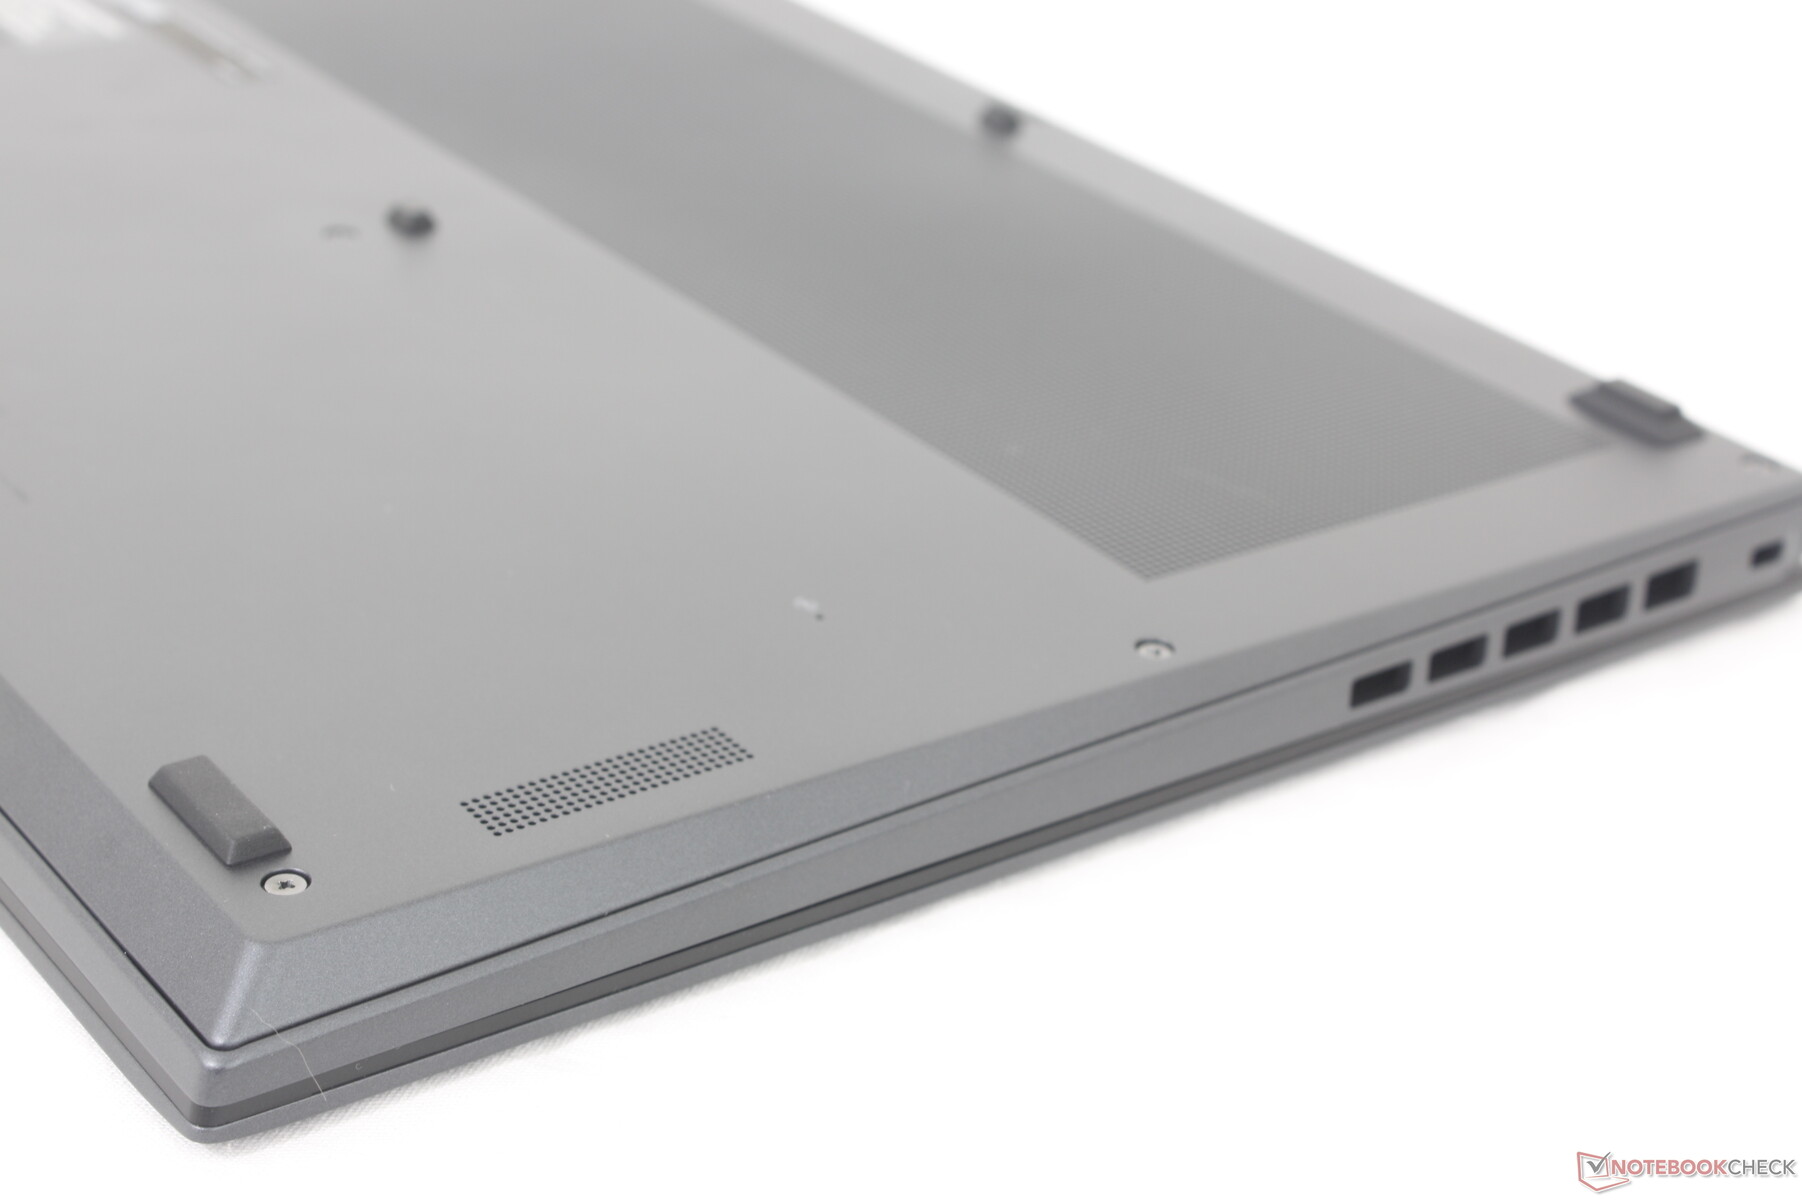
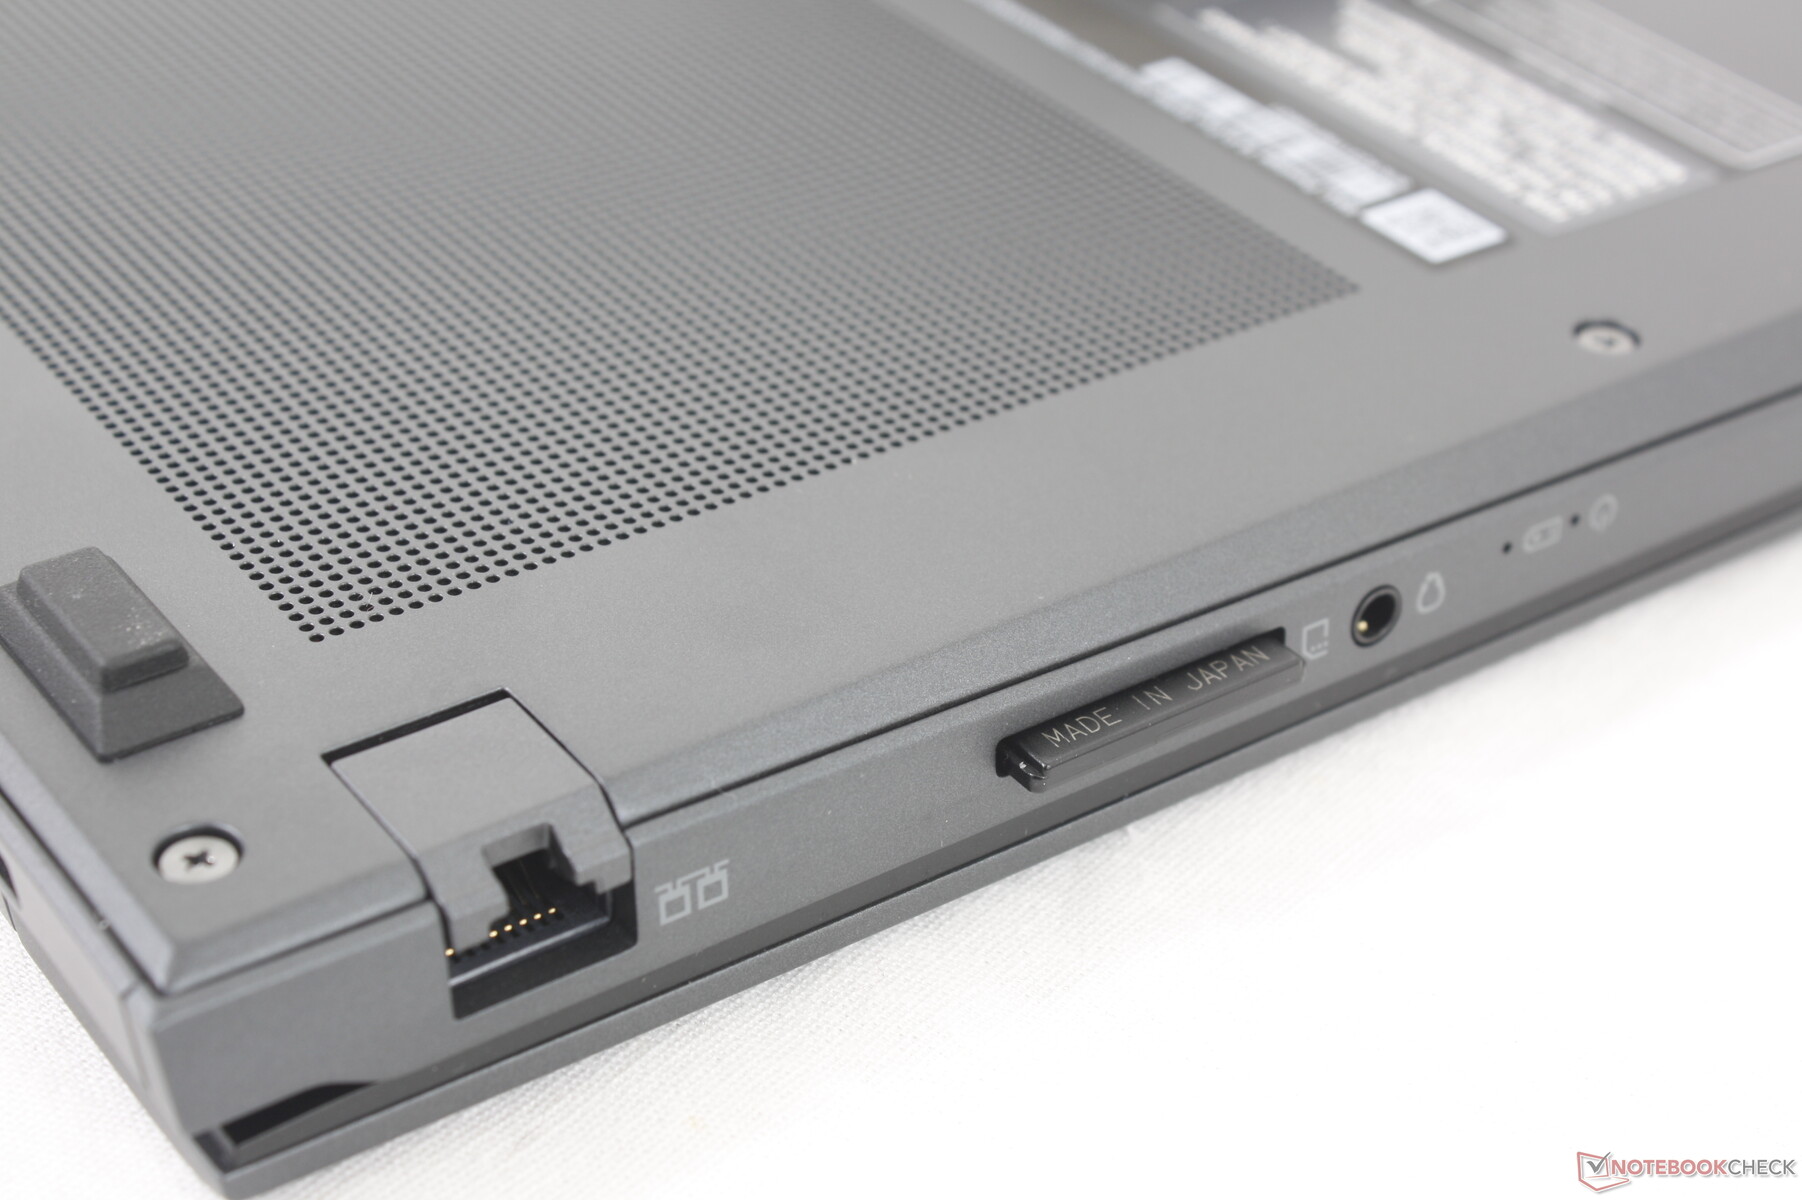
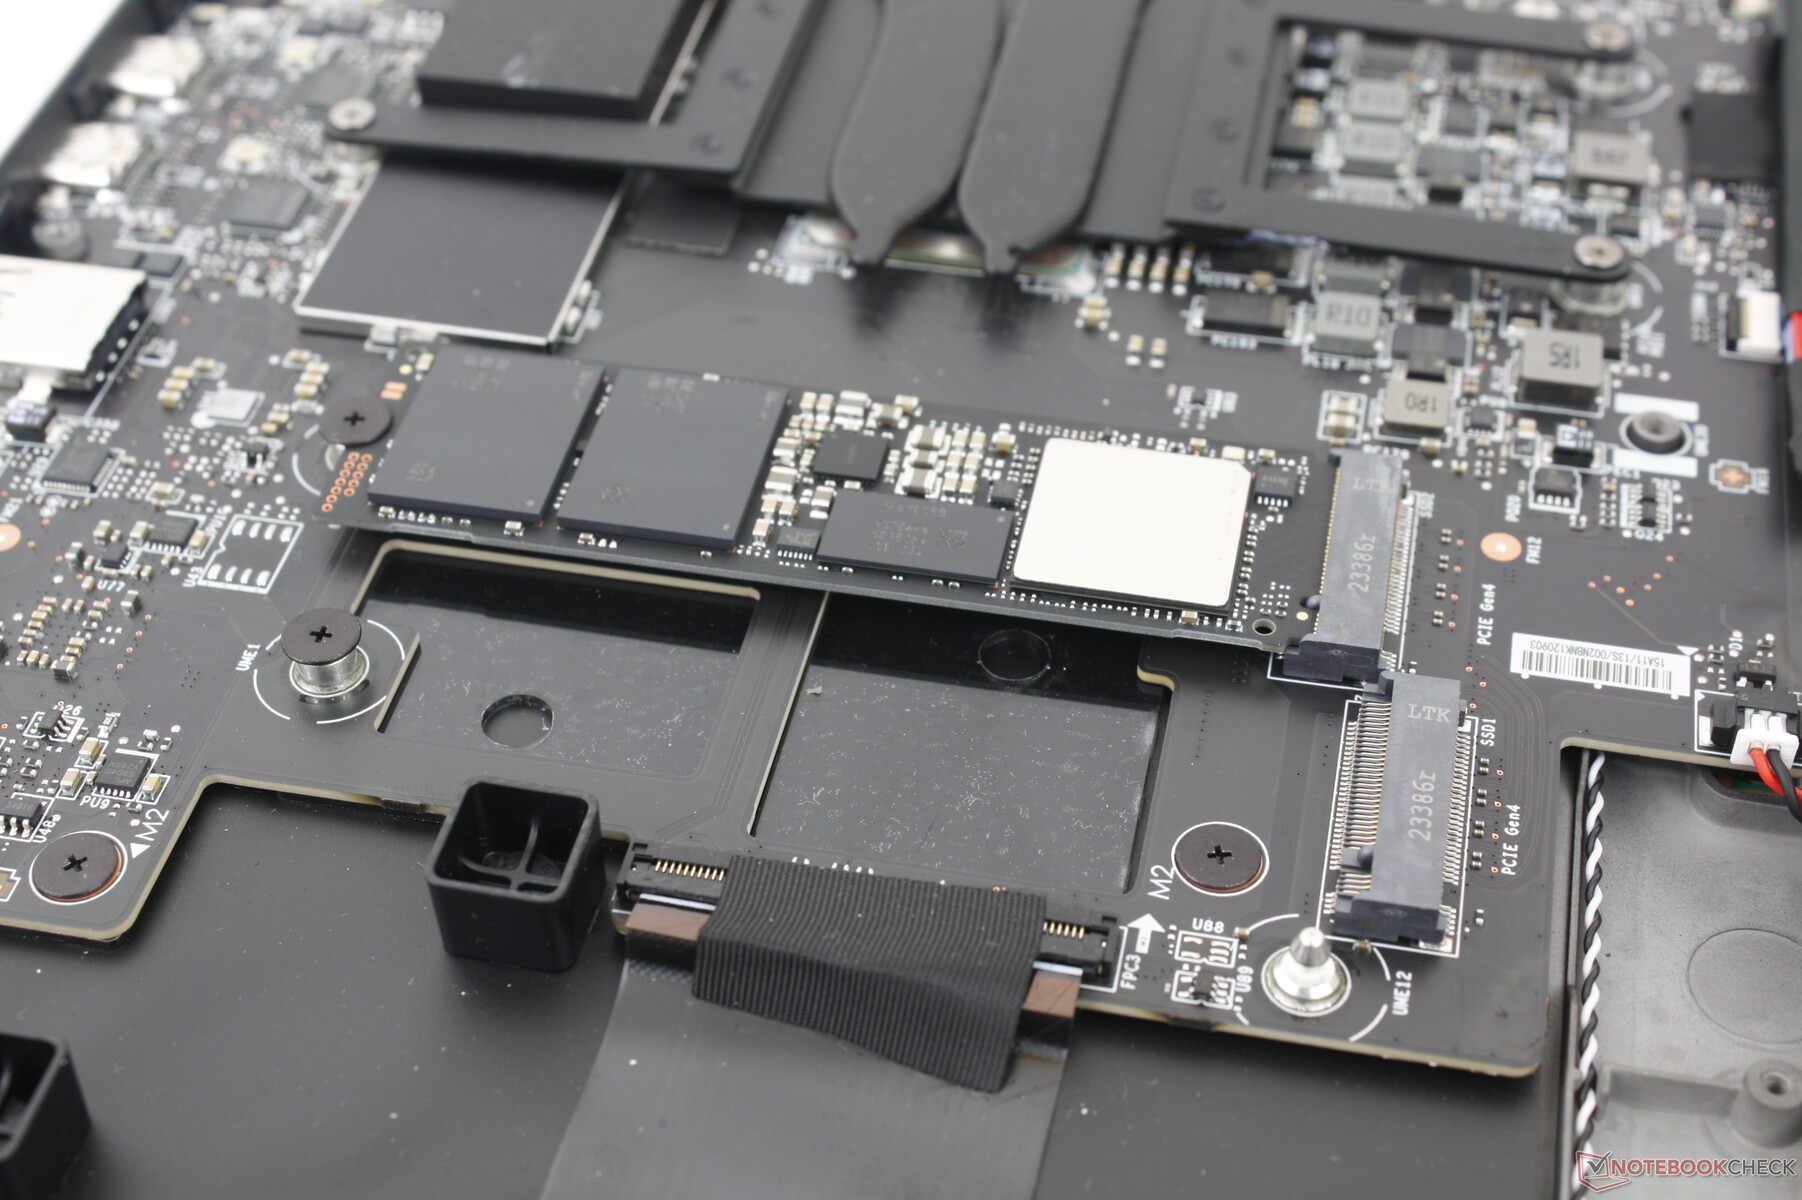
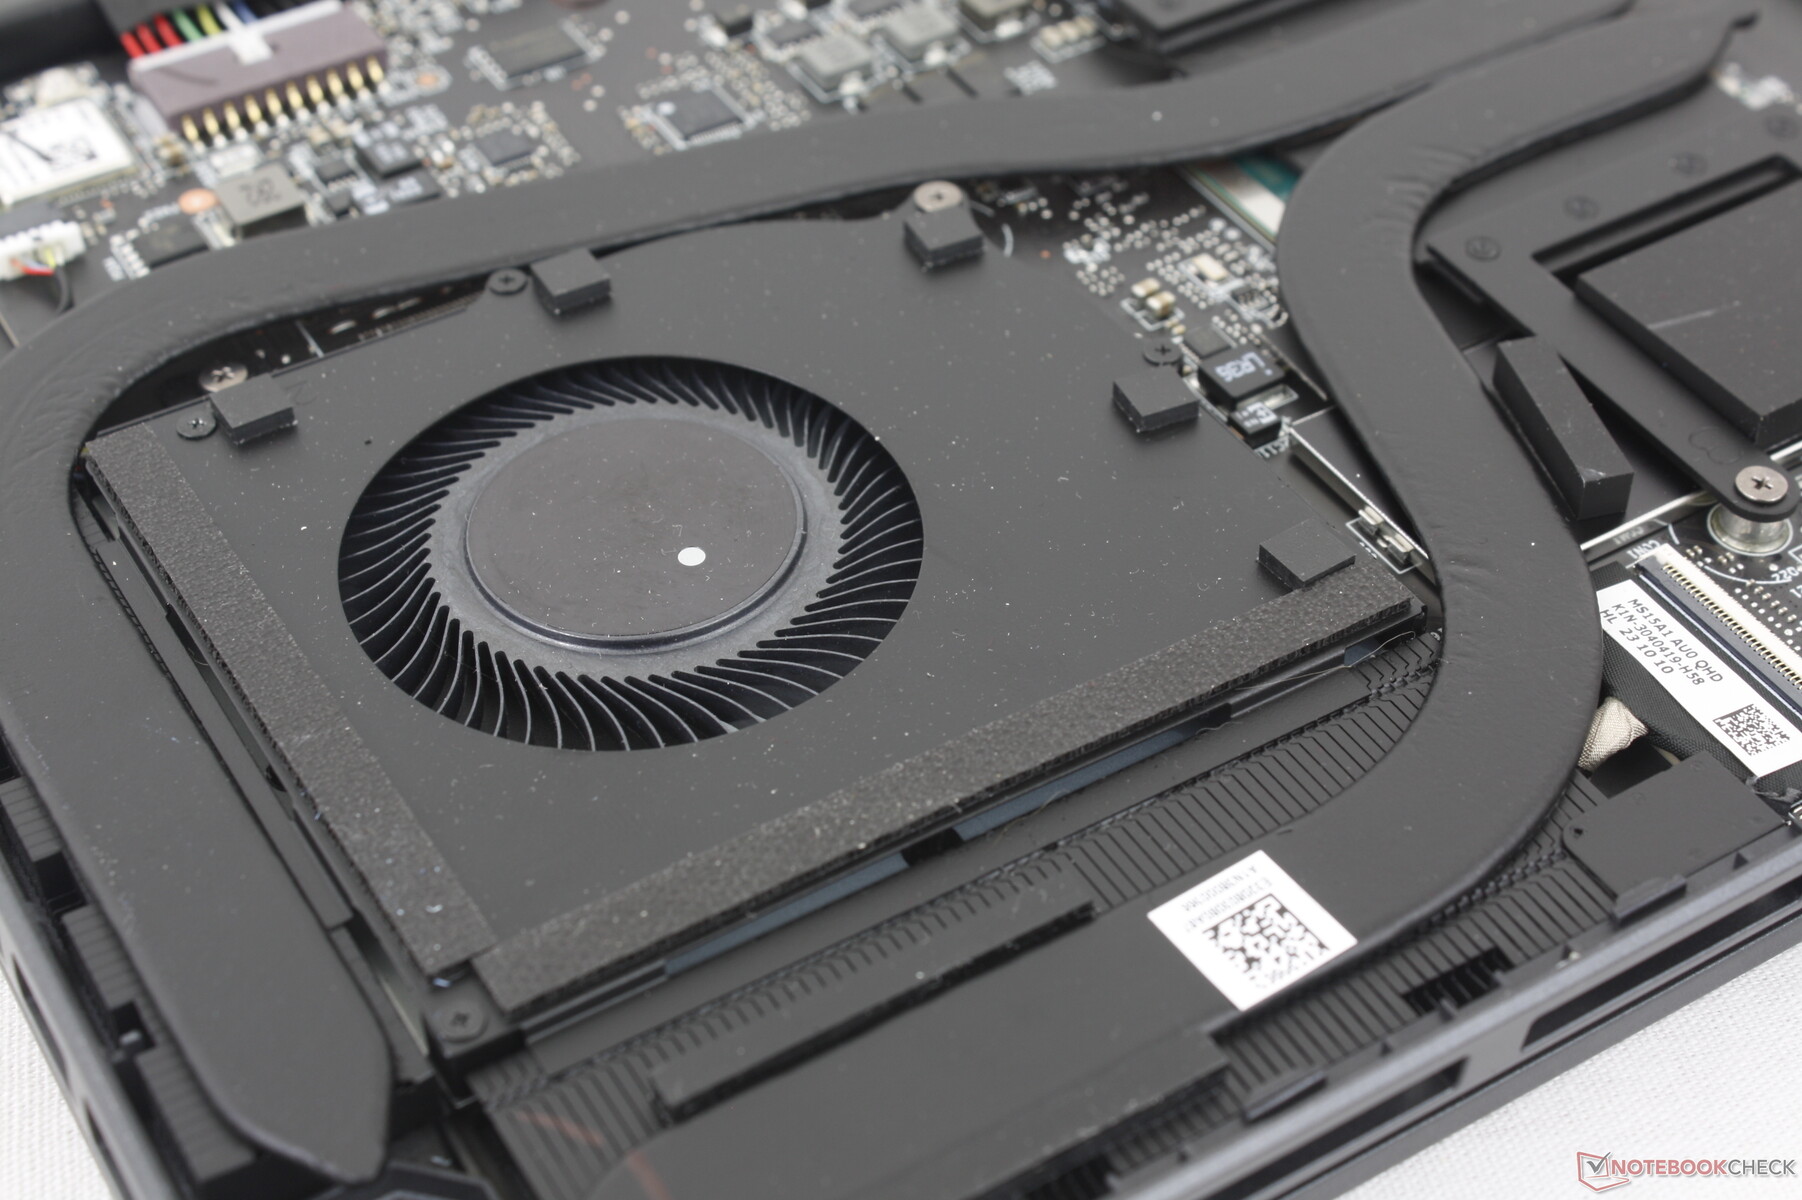
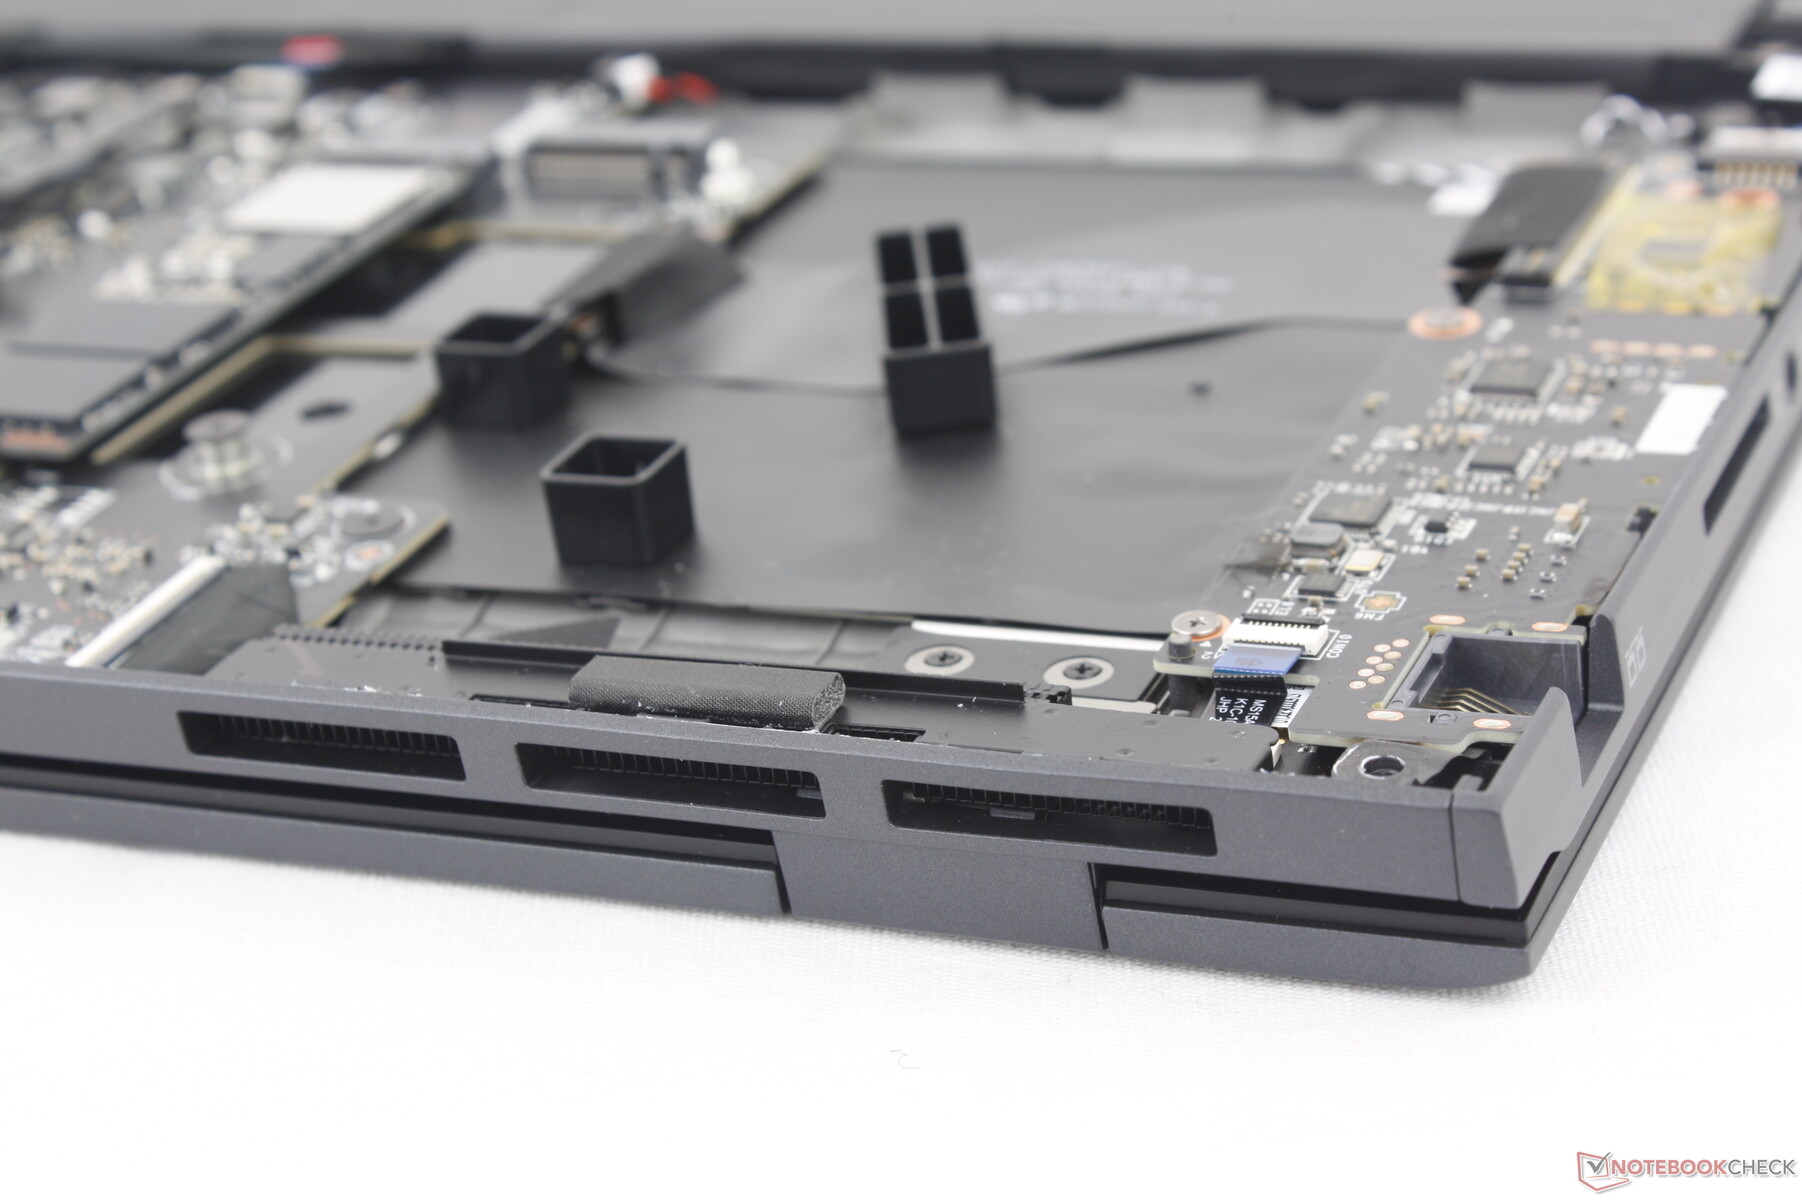
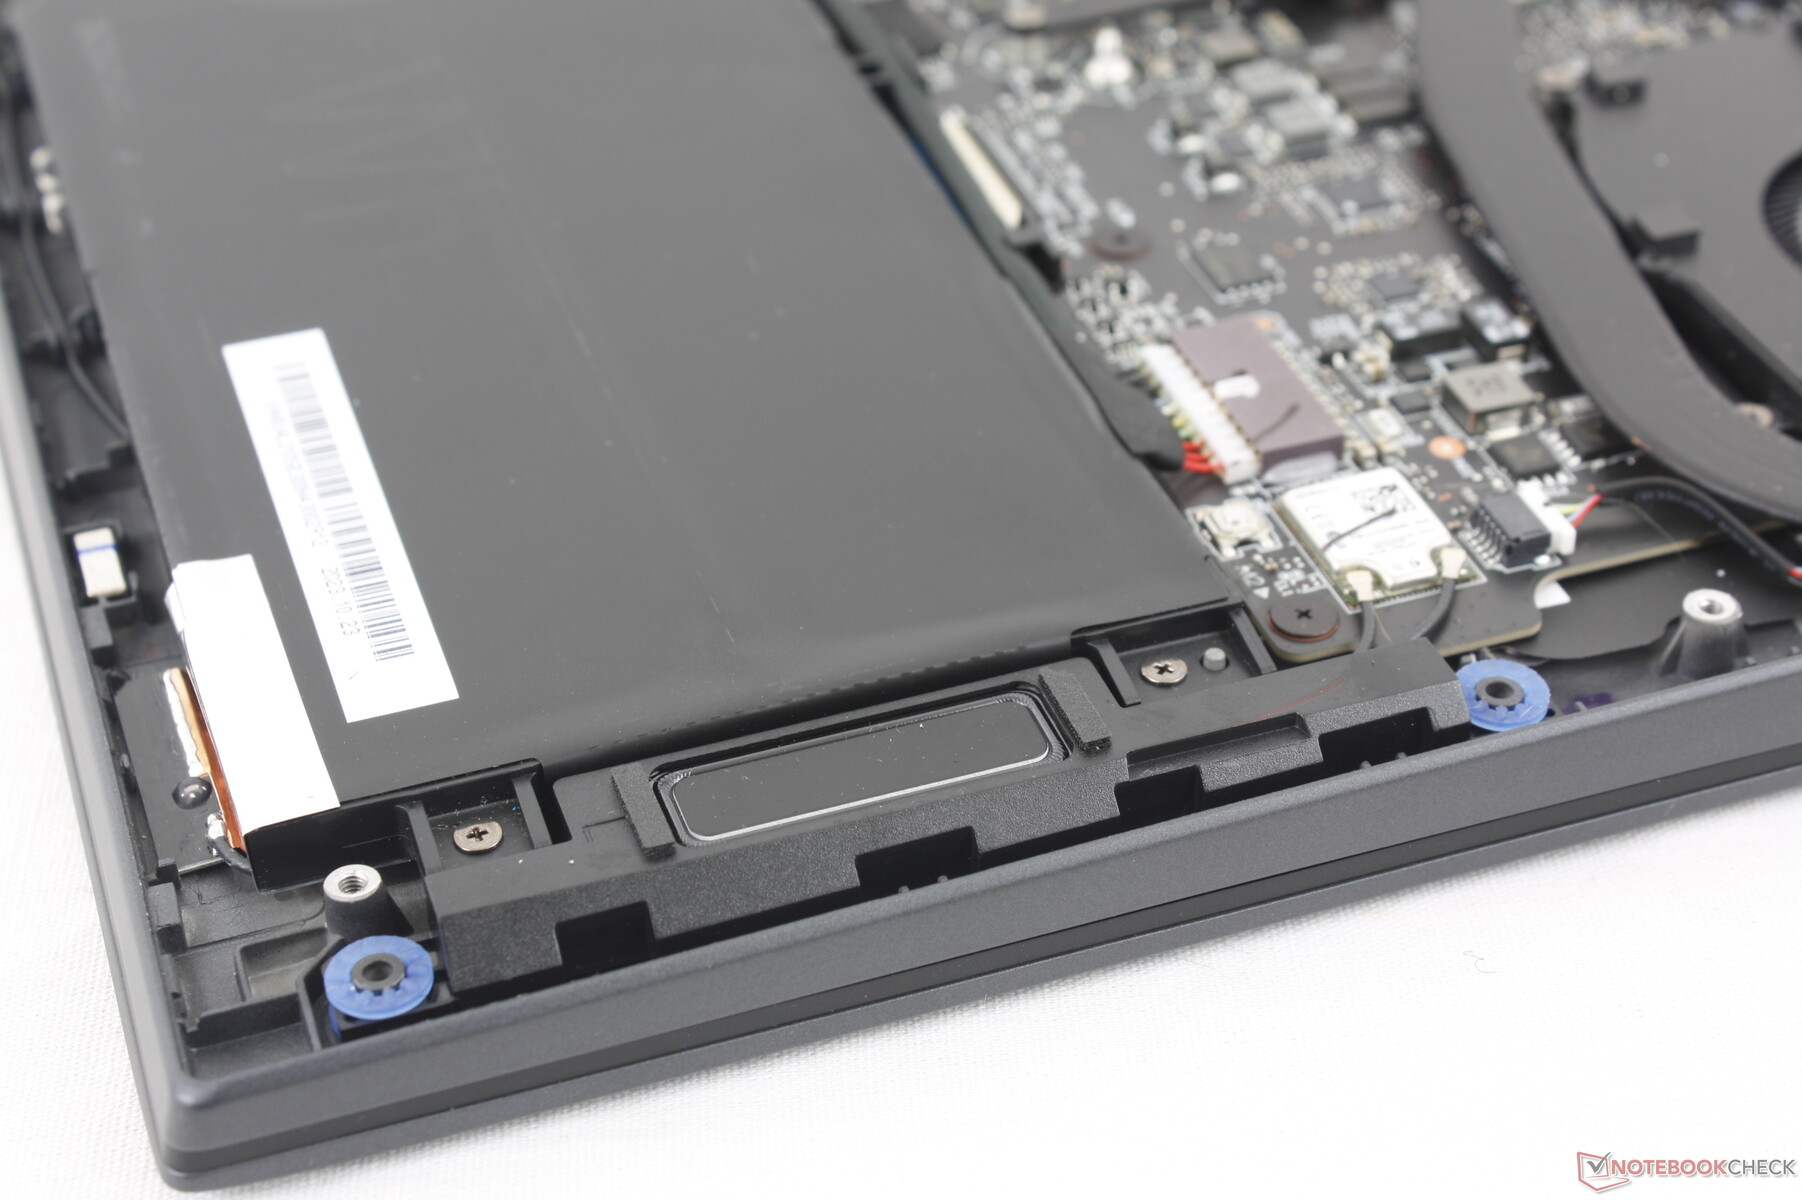
O painel inferior se solta com bastante facilidade após a remoção dos oito parafusos Phillips. Lembre-se de que um adesivo de vedação de fábrica deve ser quebrado para acessar os componentes internos.
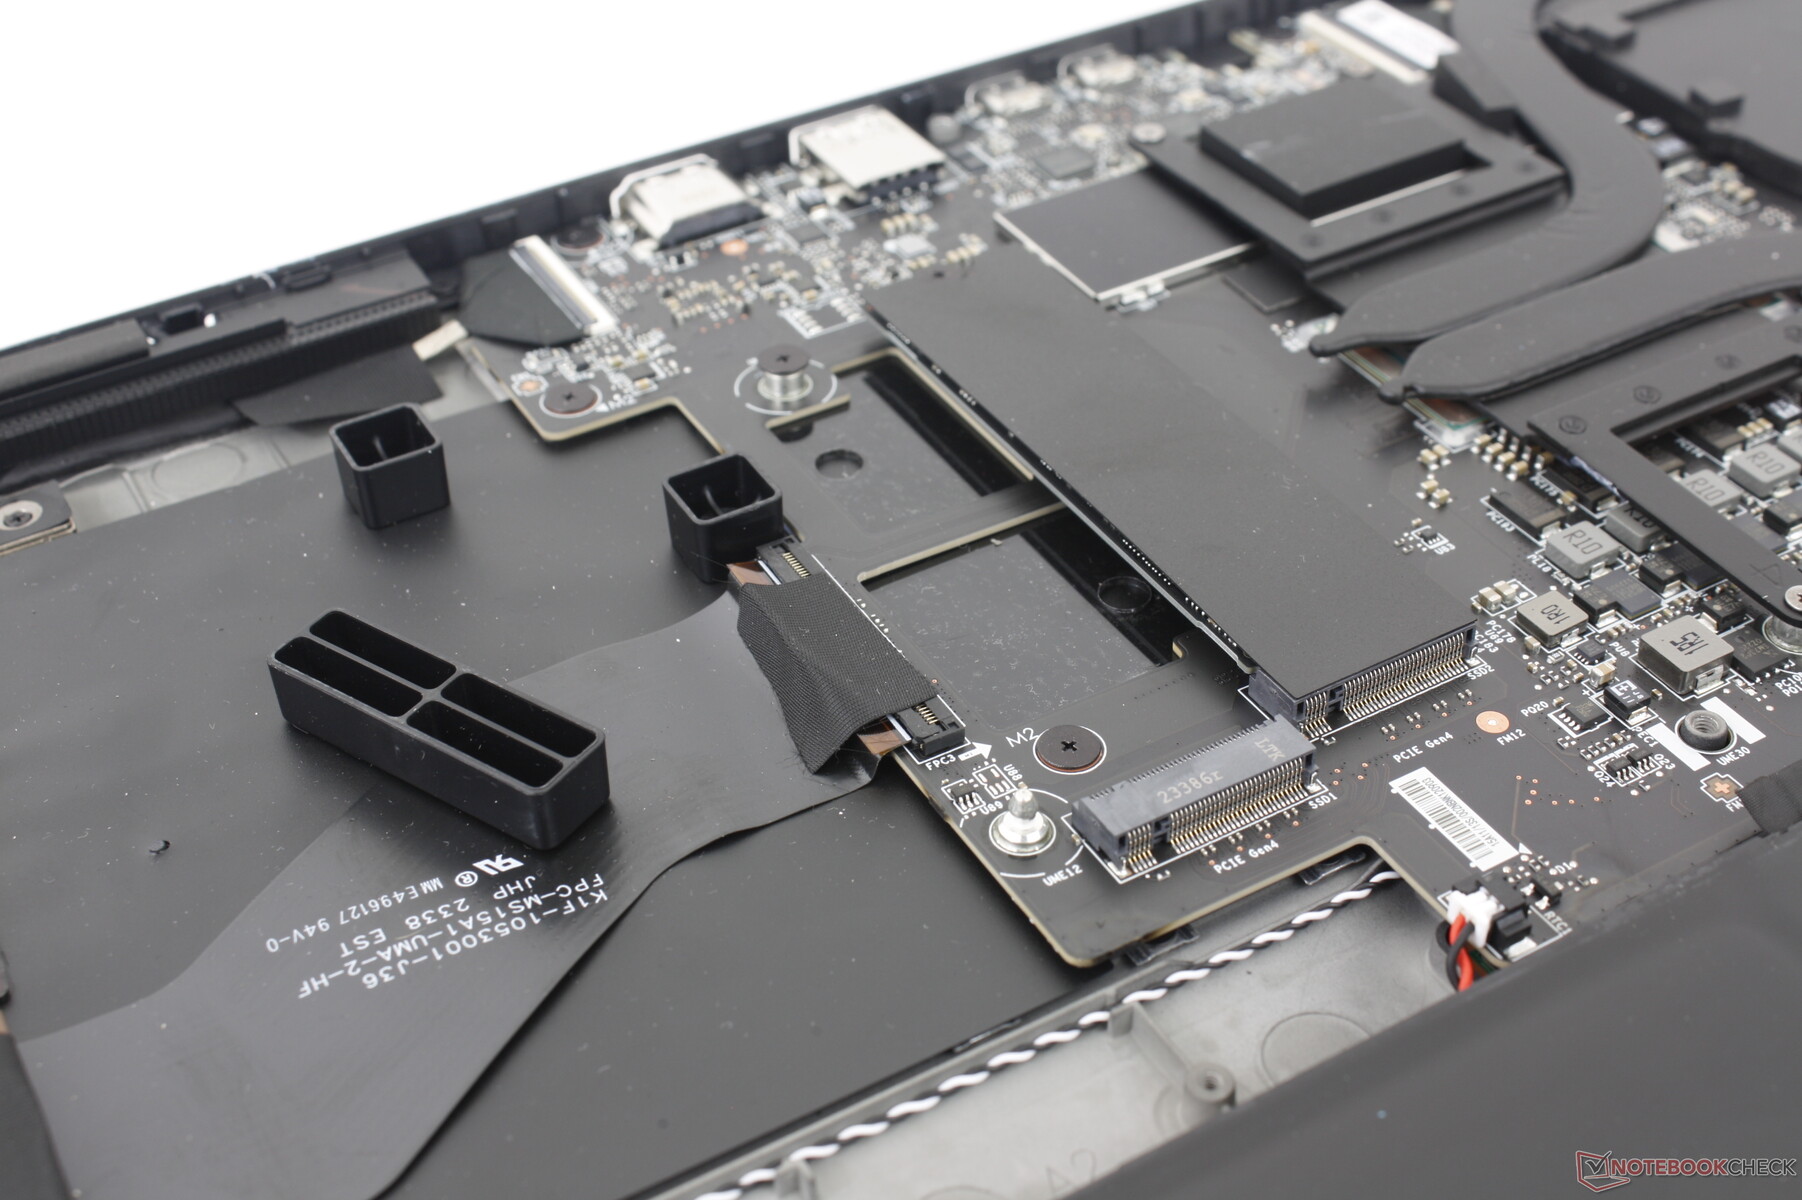
Na parte interna, os proprietários terão acesso a dois slots de SSD M.2 2280 PCIe4 x4 NVMe, enquanto os módulos de RAM e WLAN estão todos soldados. Em comparação, todos esses módulos são removíveis no design mais antigo do Prestige 15.
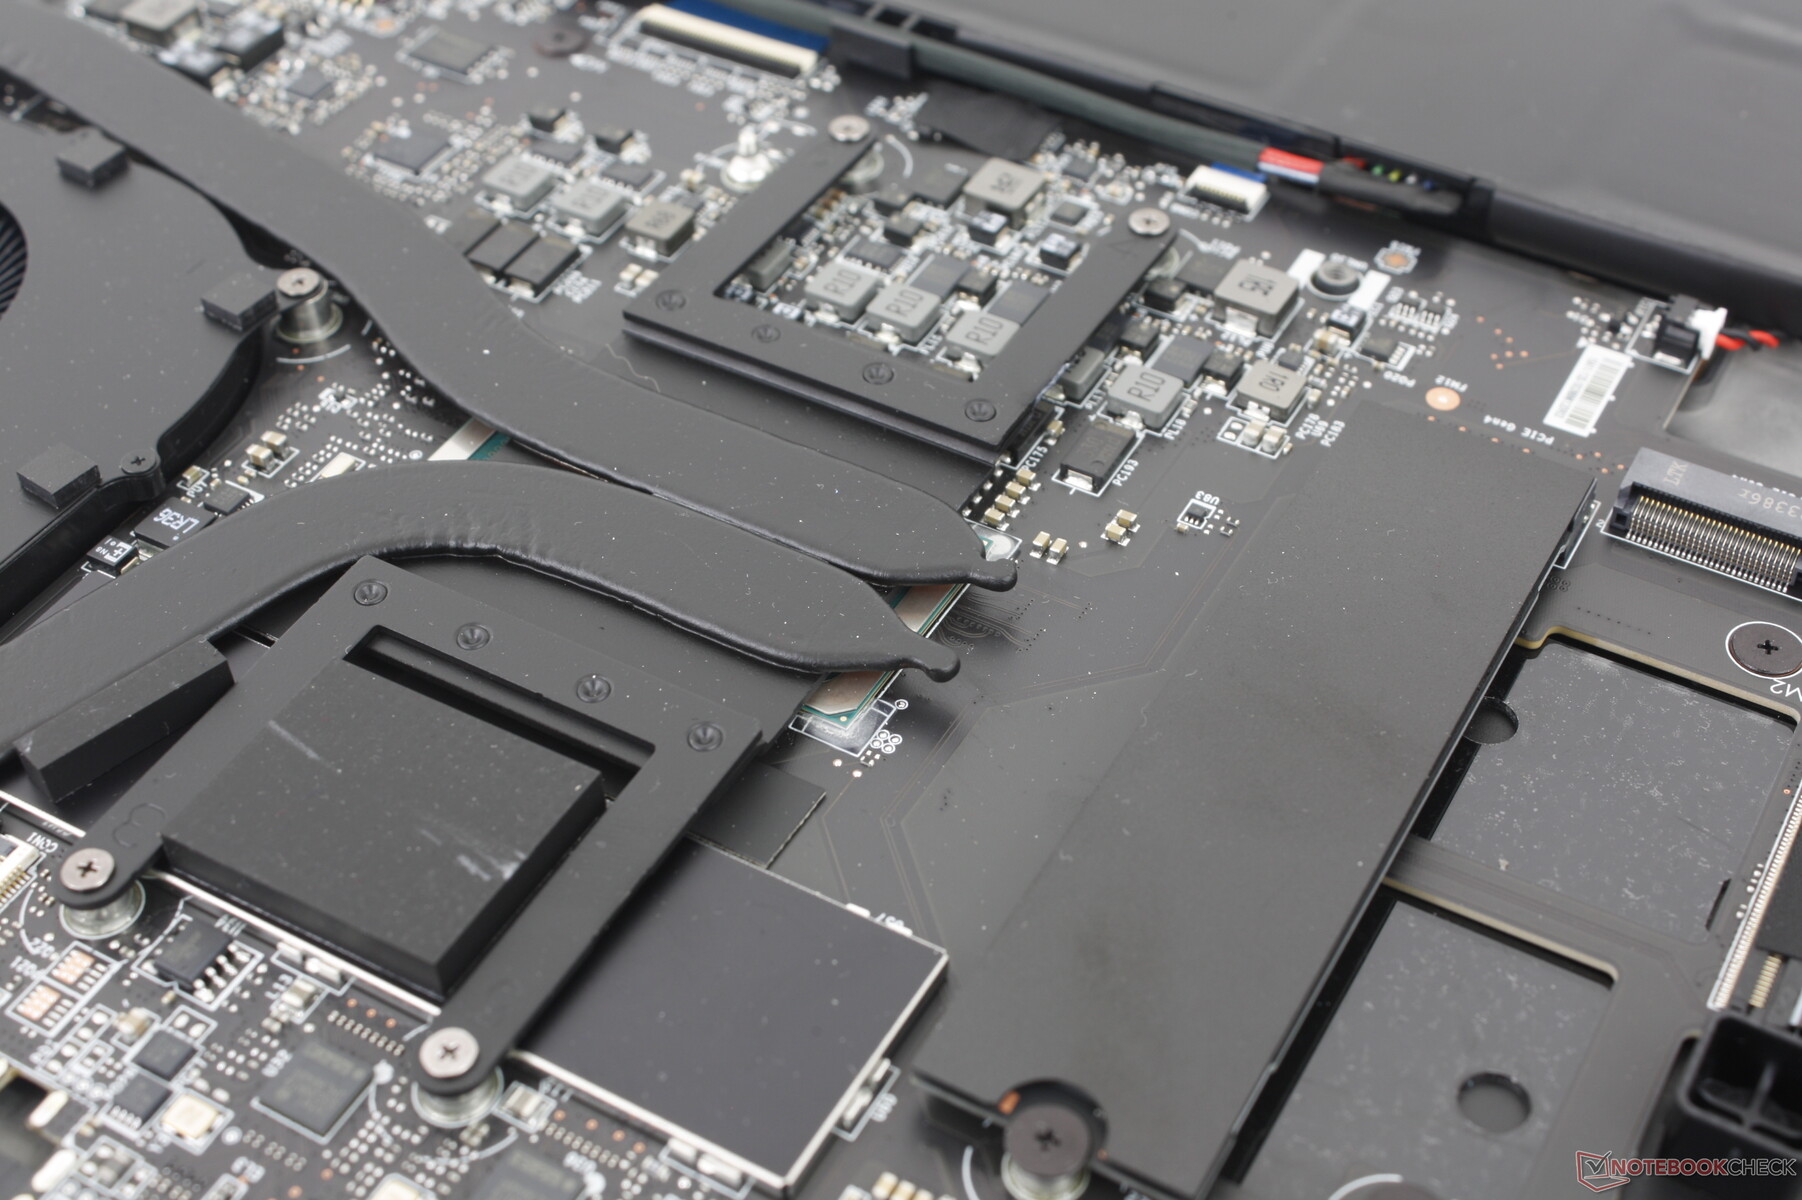
Observe o grande espaço vazio reservado para SKUs com gráficos discretos. O modelo vem equipado com mais tubos de calor, uma ventoinha adicional e SSDs M.2 reorganizados, se configurado com uma GPU dedicada.
Acessórios e garantia
Não há extras na caixa além do adaptador CA e da documentação. A garantia limitada usual de um ano se aplica se o produto for comprado nos EUA.
Dispositivos de entrada - maiores do que antes
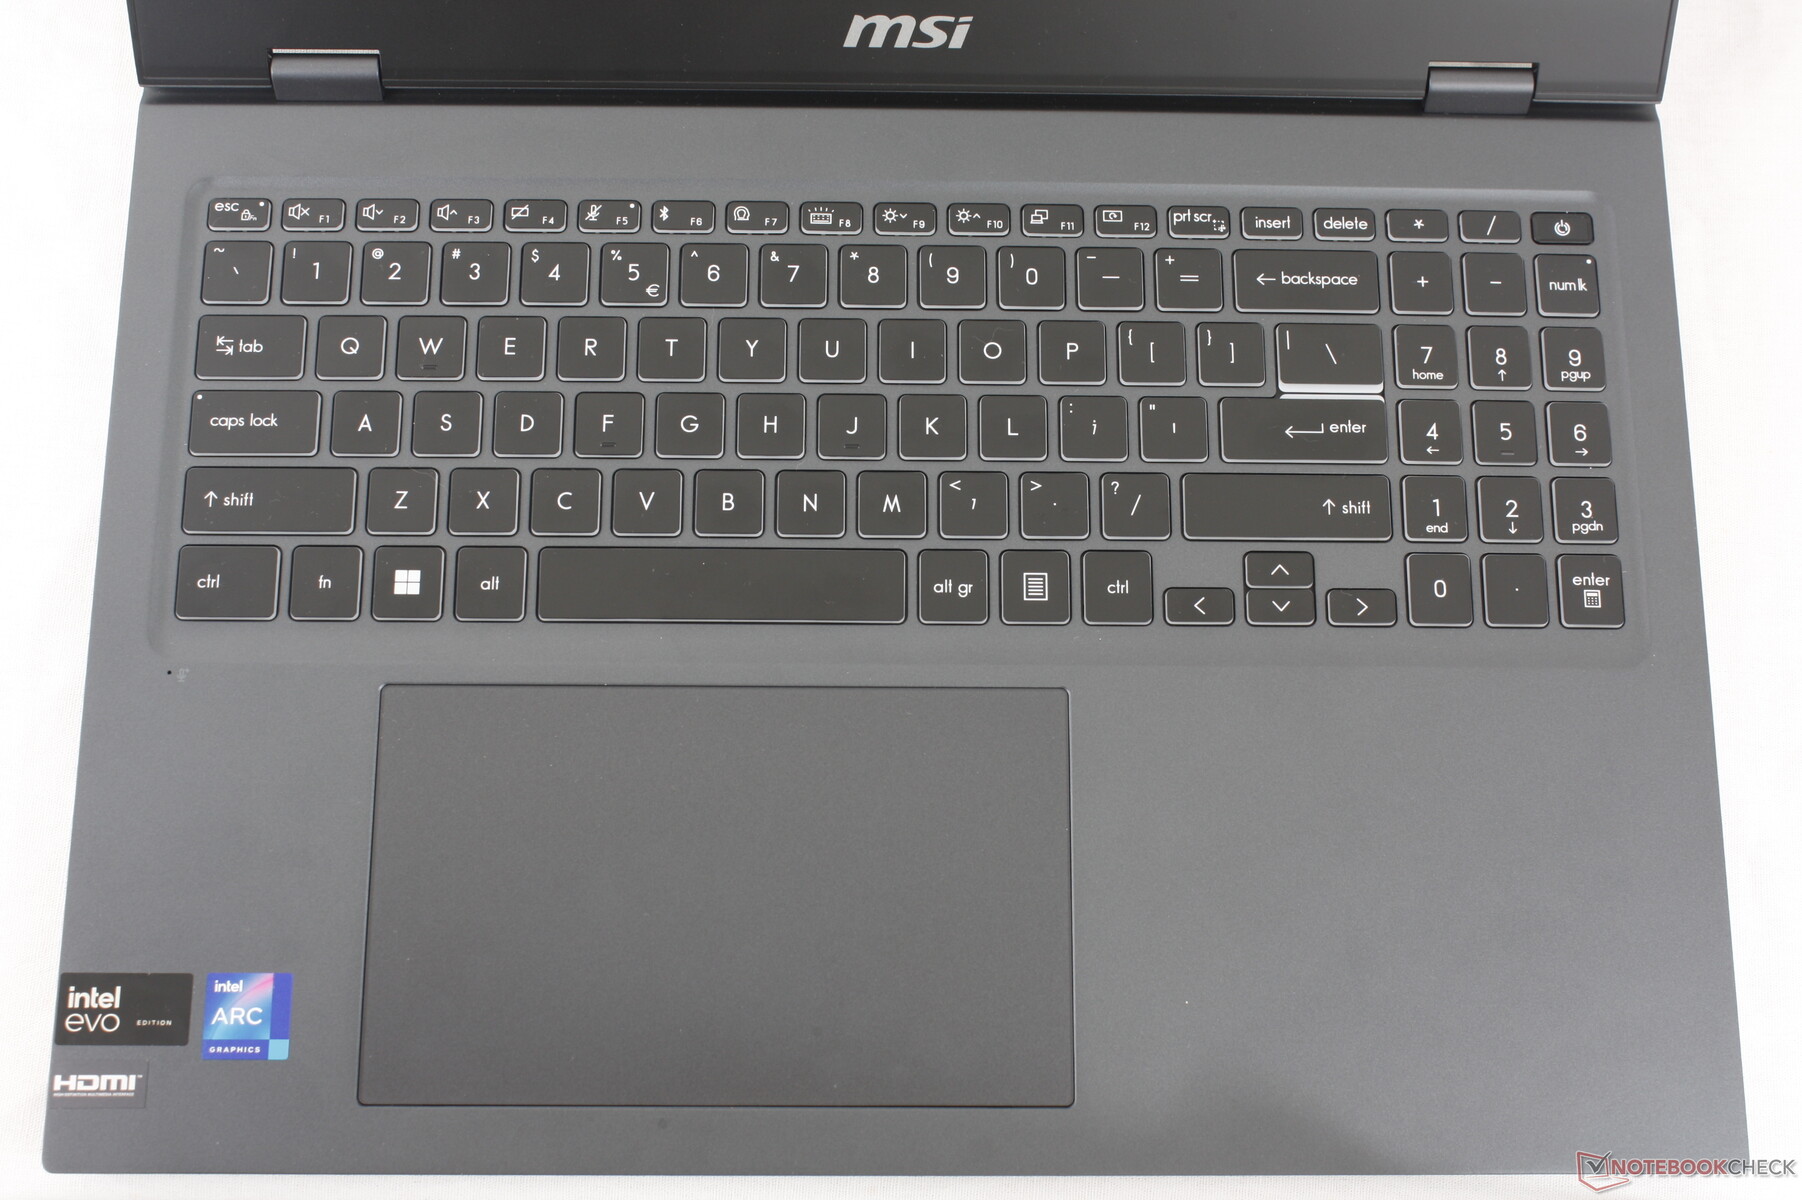
Teclado
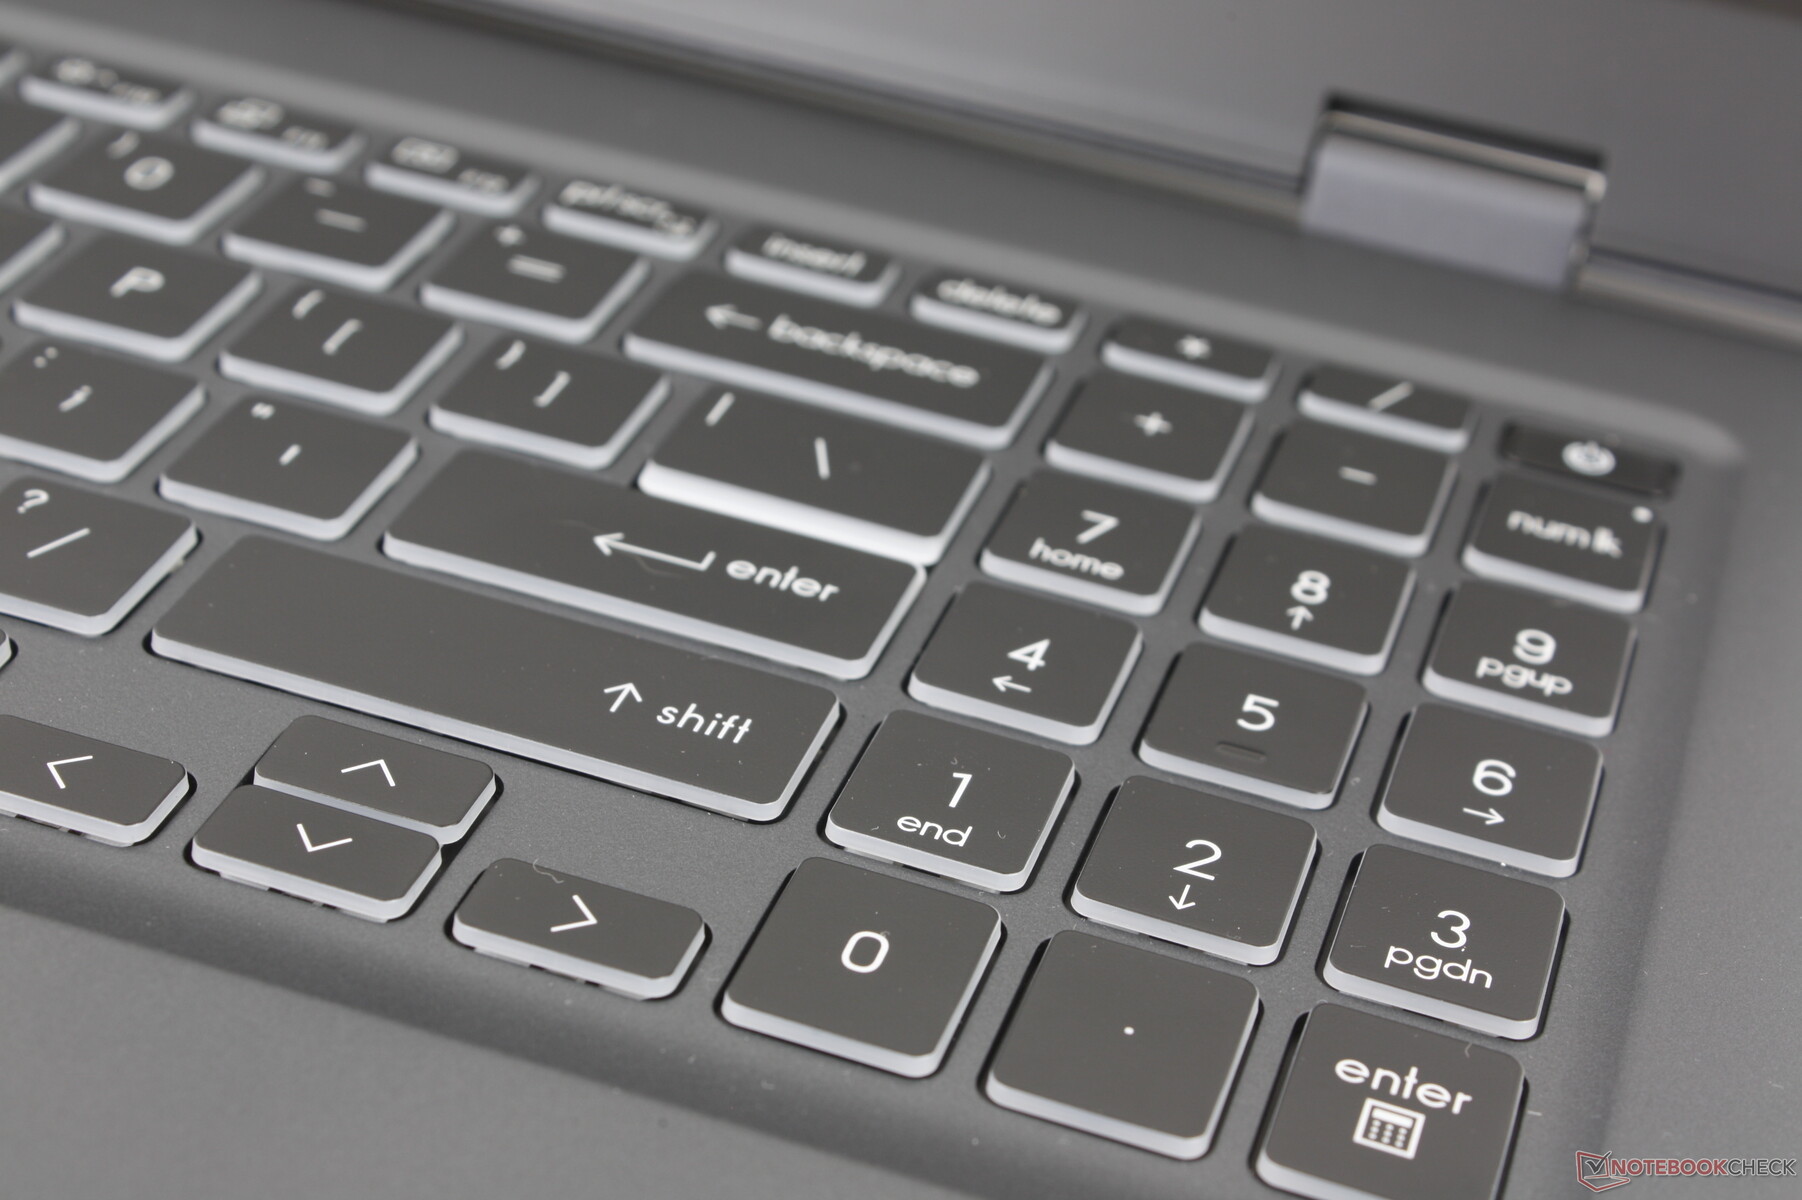
O teclado foi reformulado para incluir um teclado numérico integrado. Fora isso, o feedback das teclas é igual ao do Prestige 15, proporcionando uma experiência de digitação semelhante, apesar das mudanças no layout. Ainda achamos que o deslocamento das teclas é visivelmente mais raso do que o das teclas dos notebooks para jogos da MSI ou da concorrente Série HP Spectre. Elas não são excessivamente macias ou desconfortáveis, mas um feedback mais firme ou mais nítido a cada pressionamento também não faria mal.
Touchpad
O clickpad agora é muito maior (15 x 9 cm) para solucionar as dimensões estranhamente estreitas do clickpad do antigo Prestige 15 design. A tração é suave e confiável, sem aderência, mesmo quando se desliza em velocidades mais lentas.
O feedback ao clicar é apenas mediano, se não um pouco esponjoso. Pressionar para baixo exige muita força do dedo e, portanto, as ações podem se tornar cansativas sem um mouse externo.

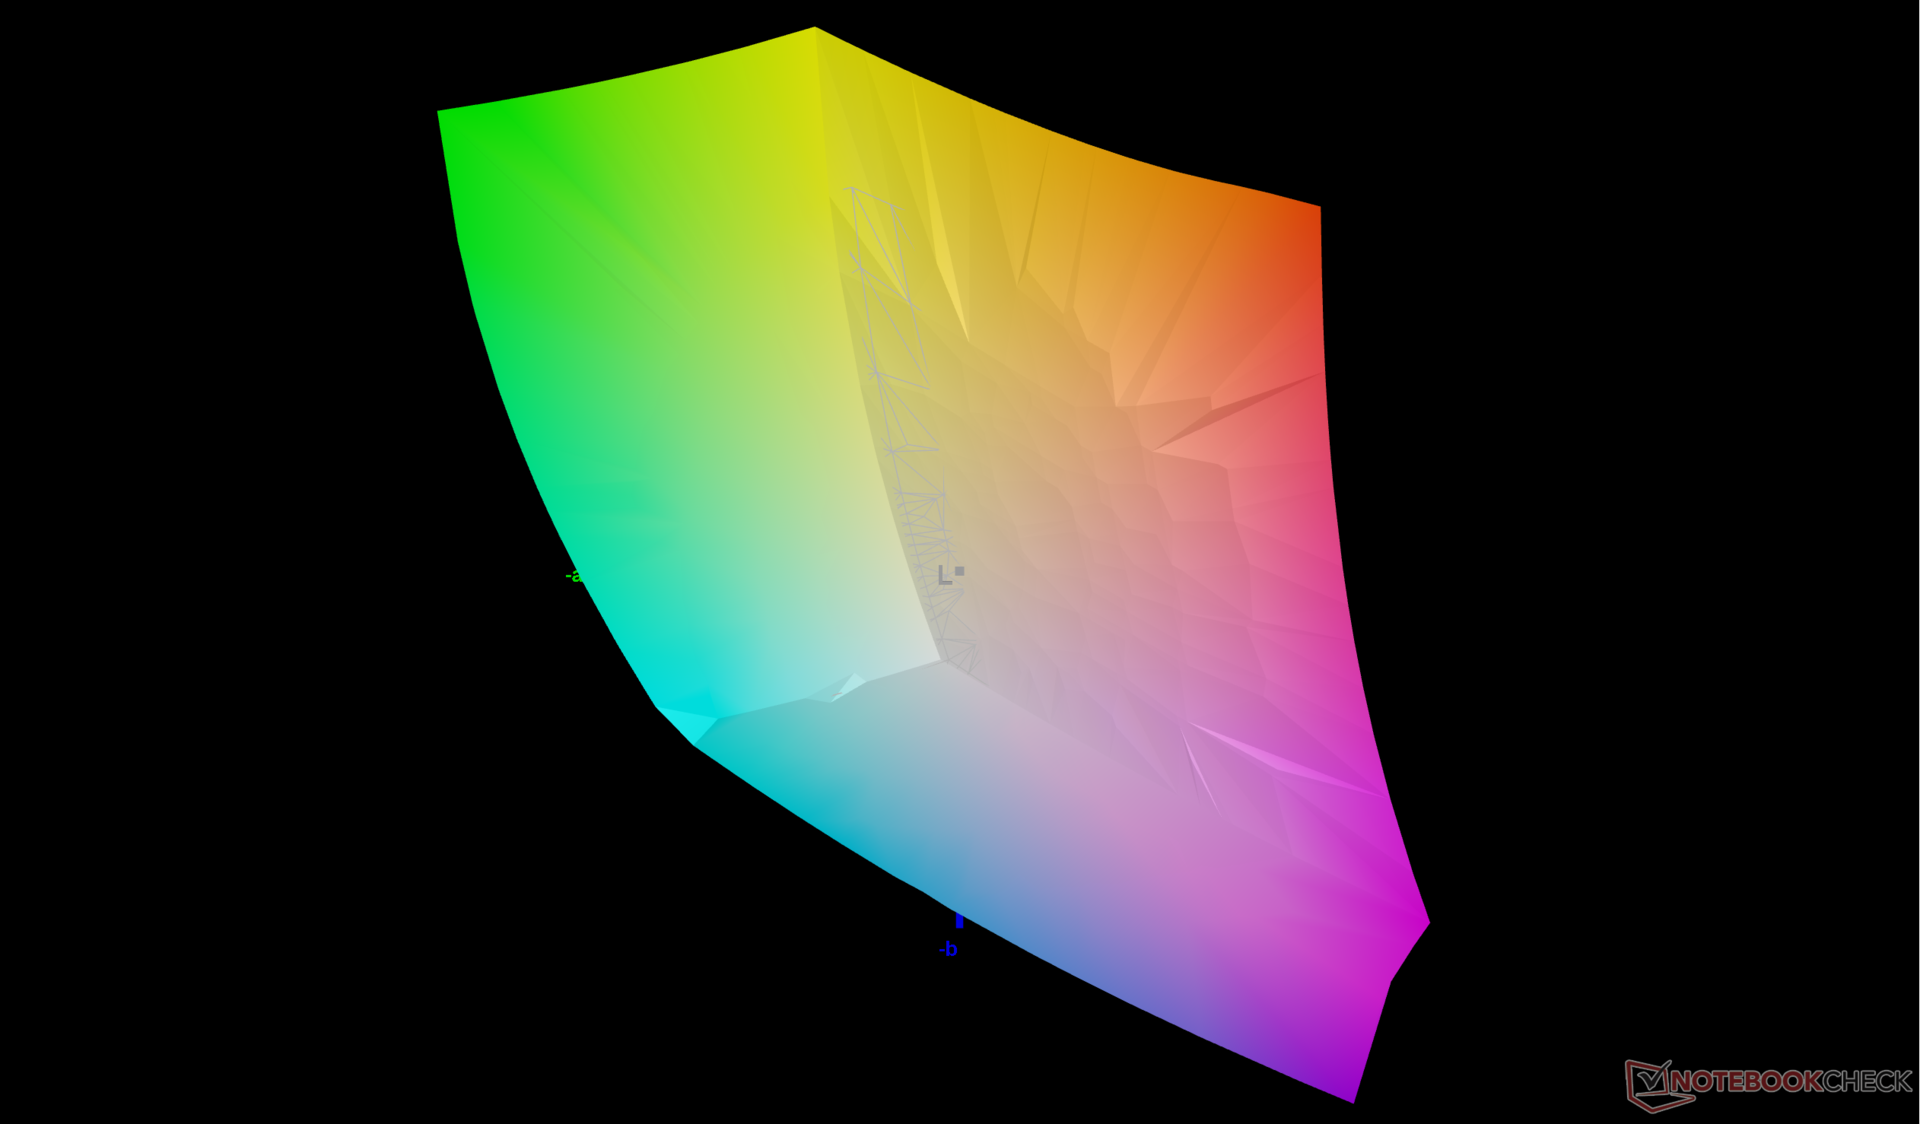
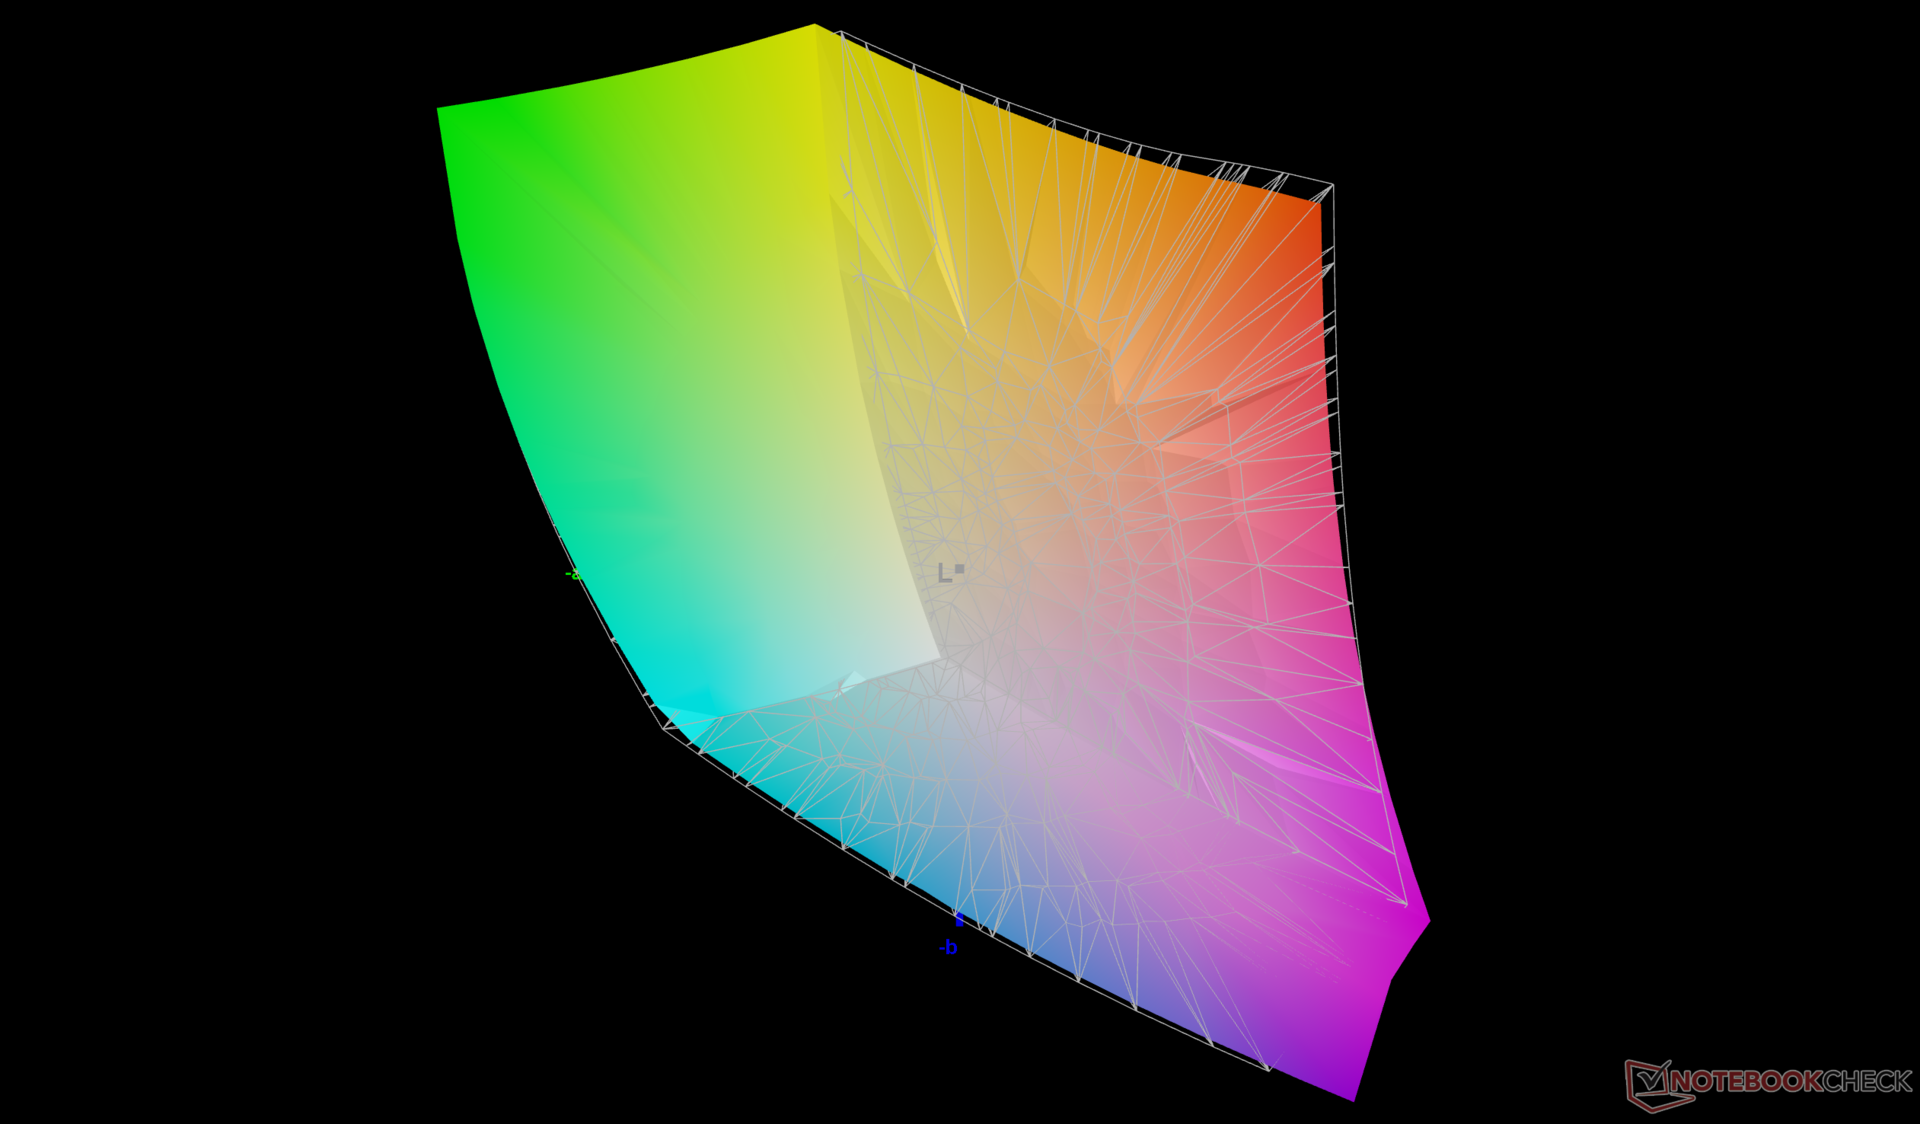
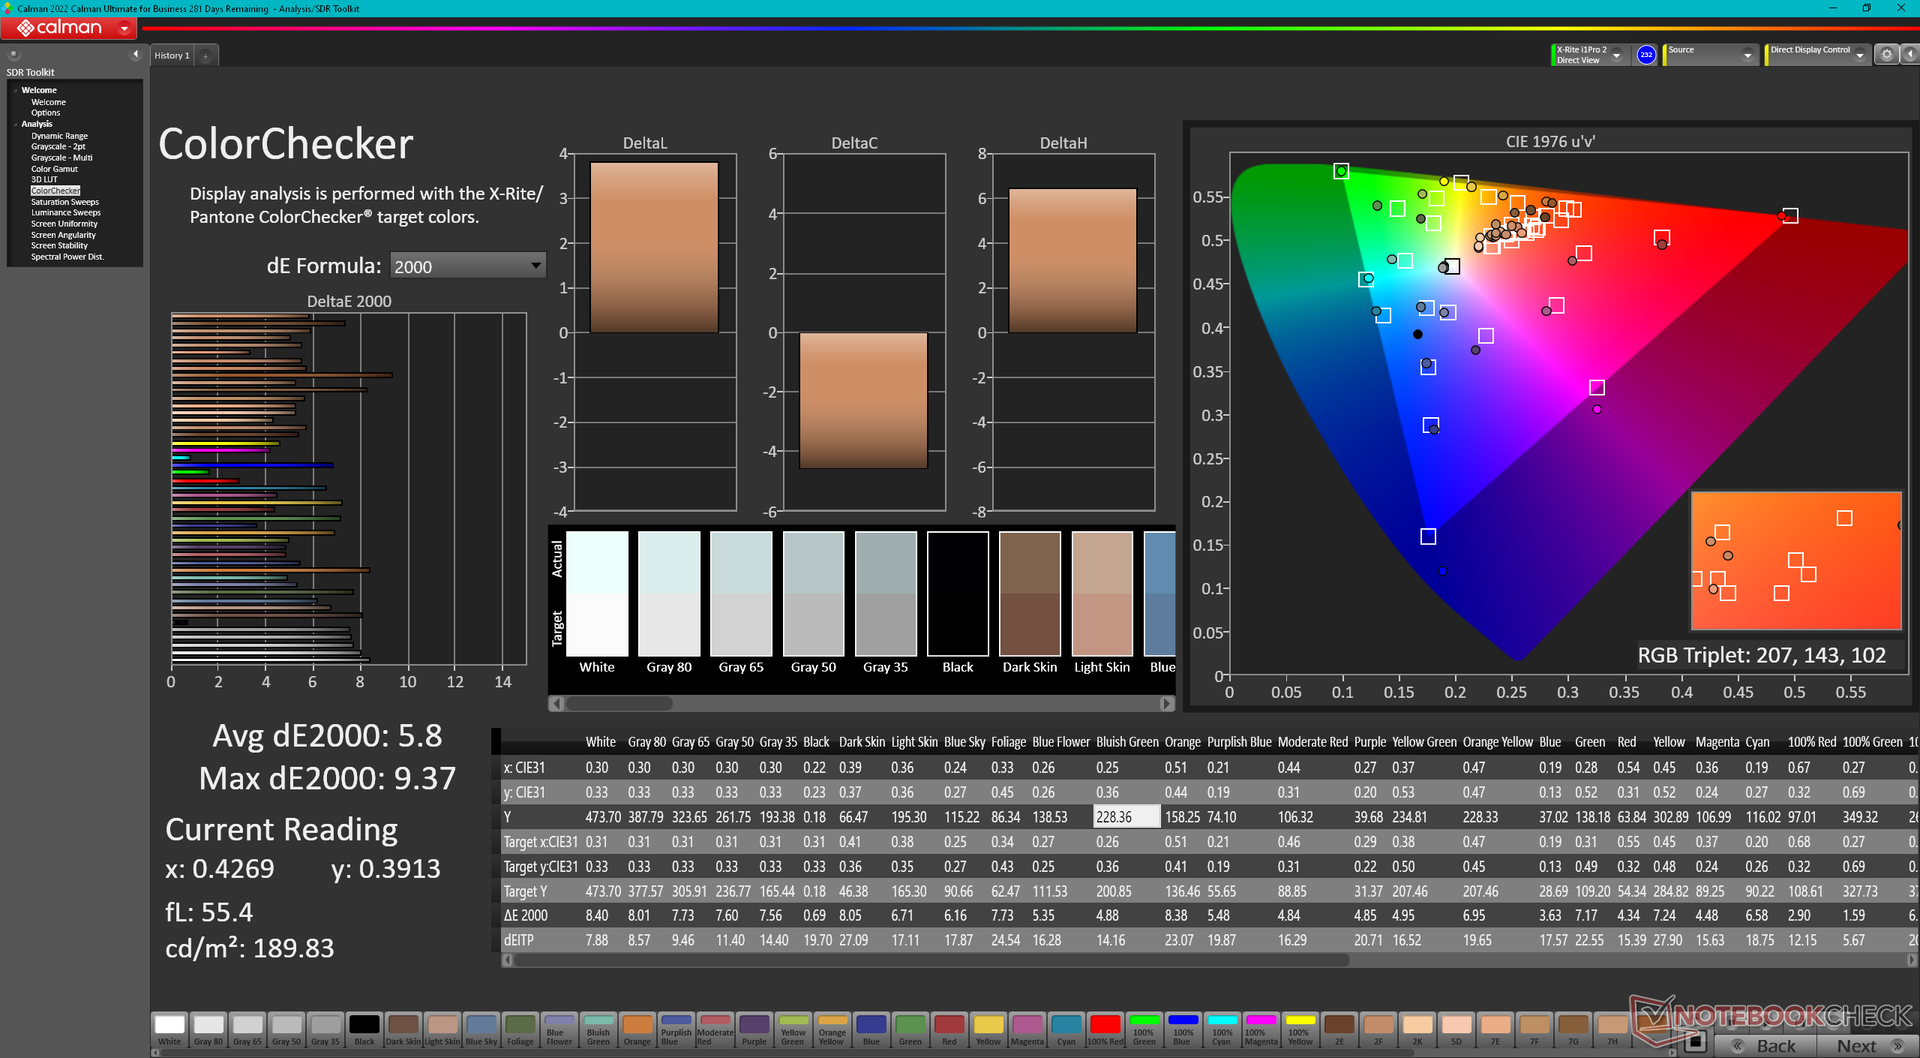
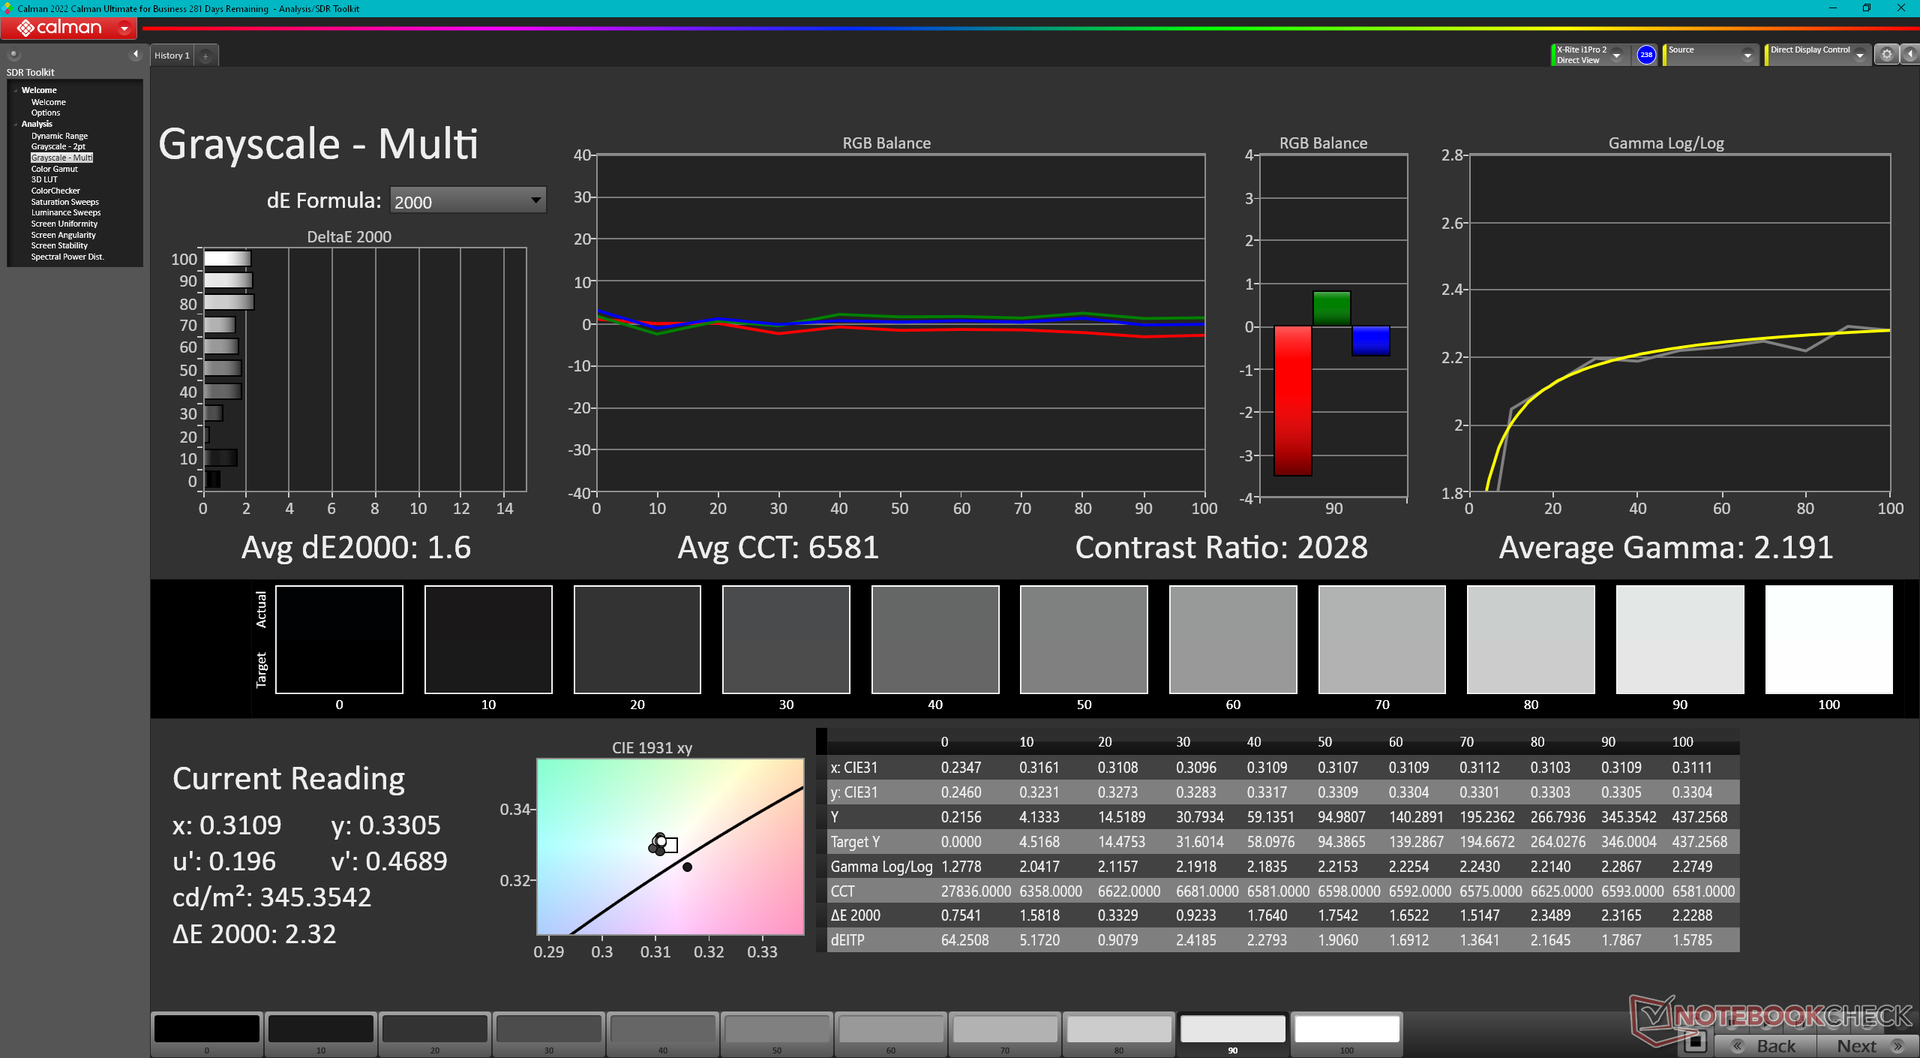
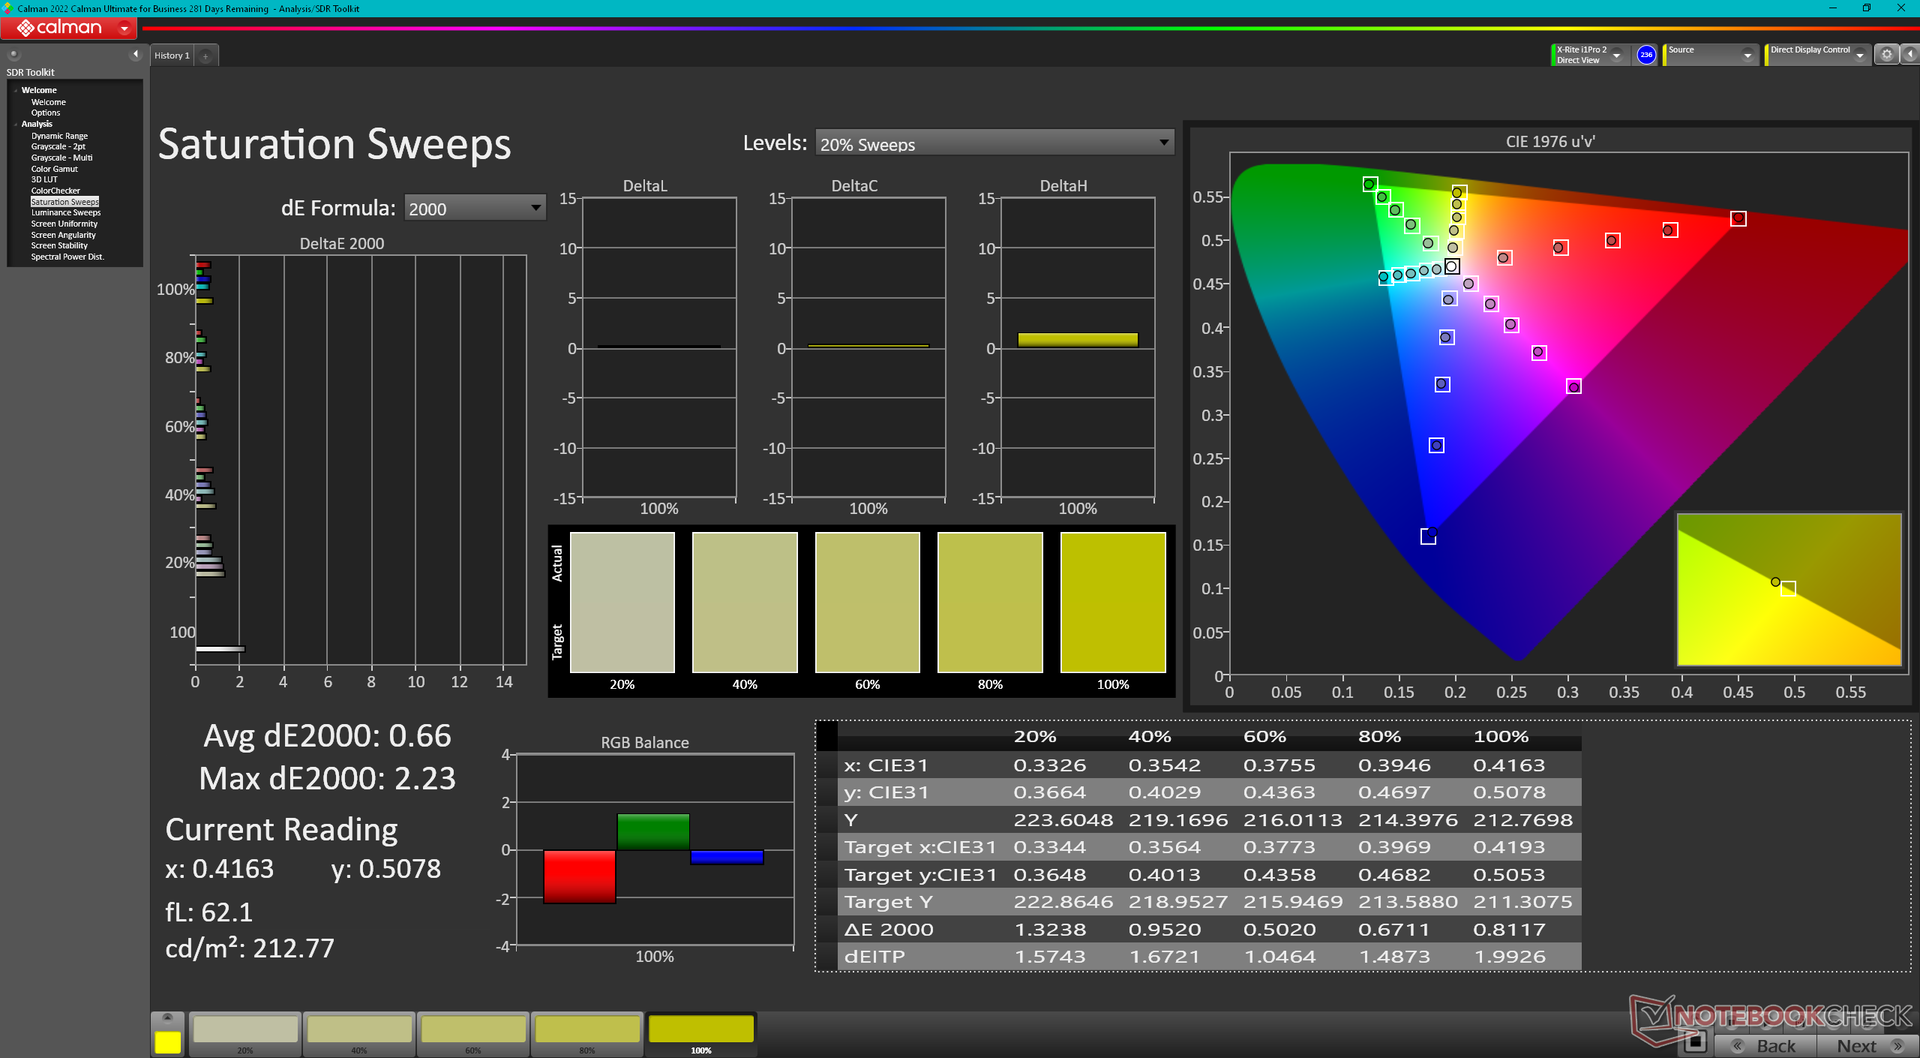
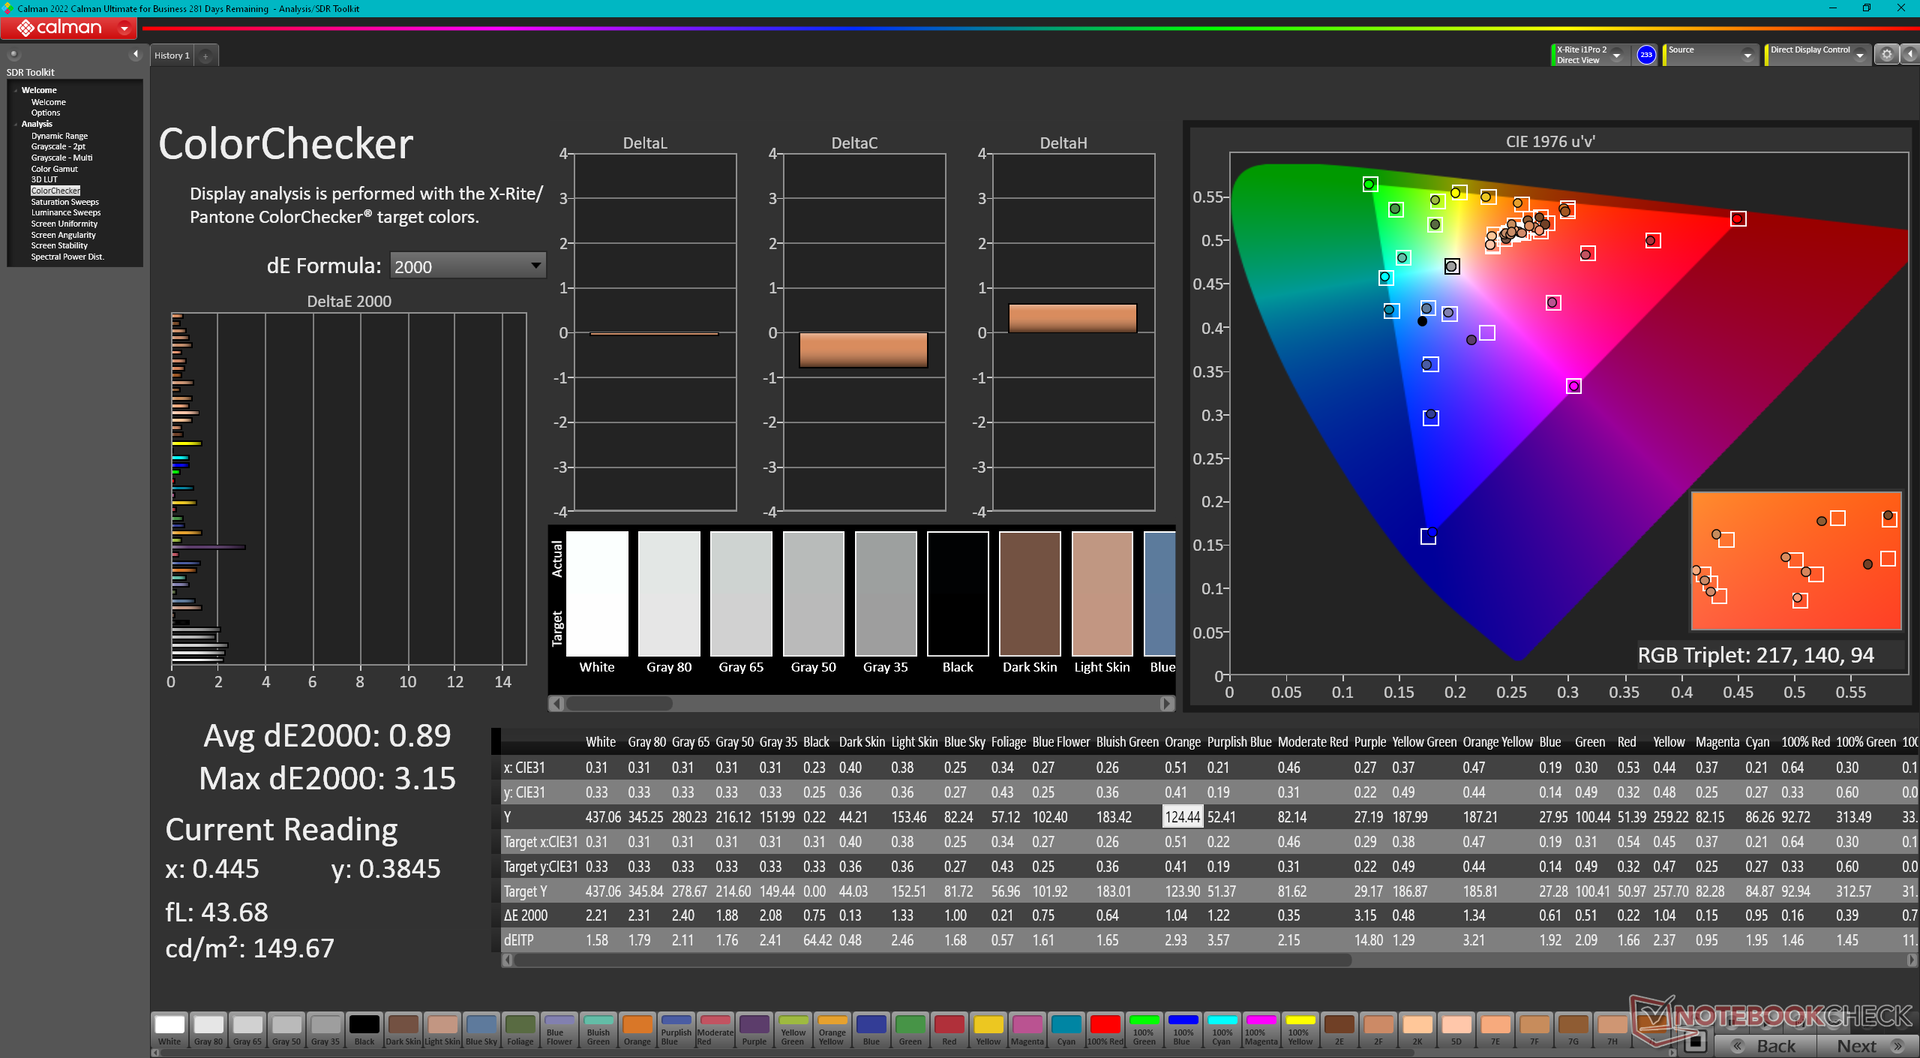
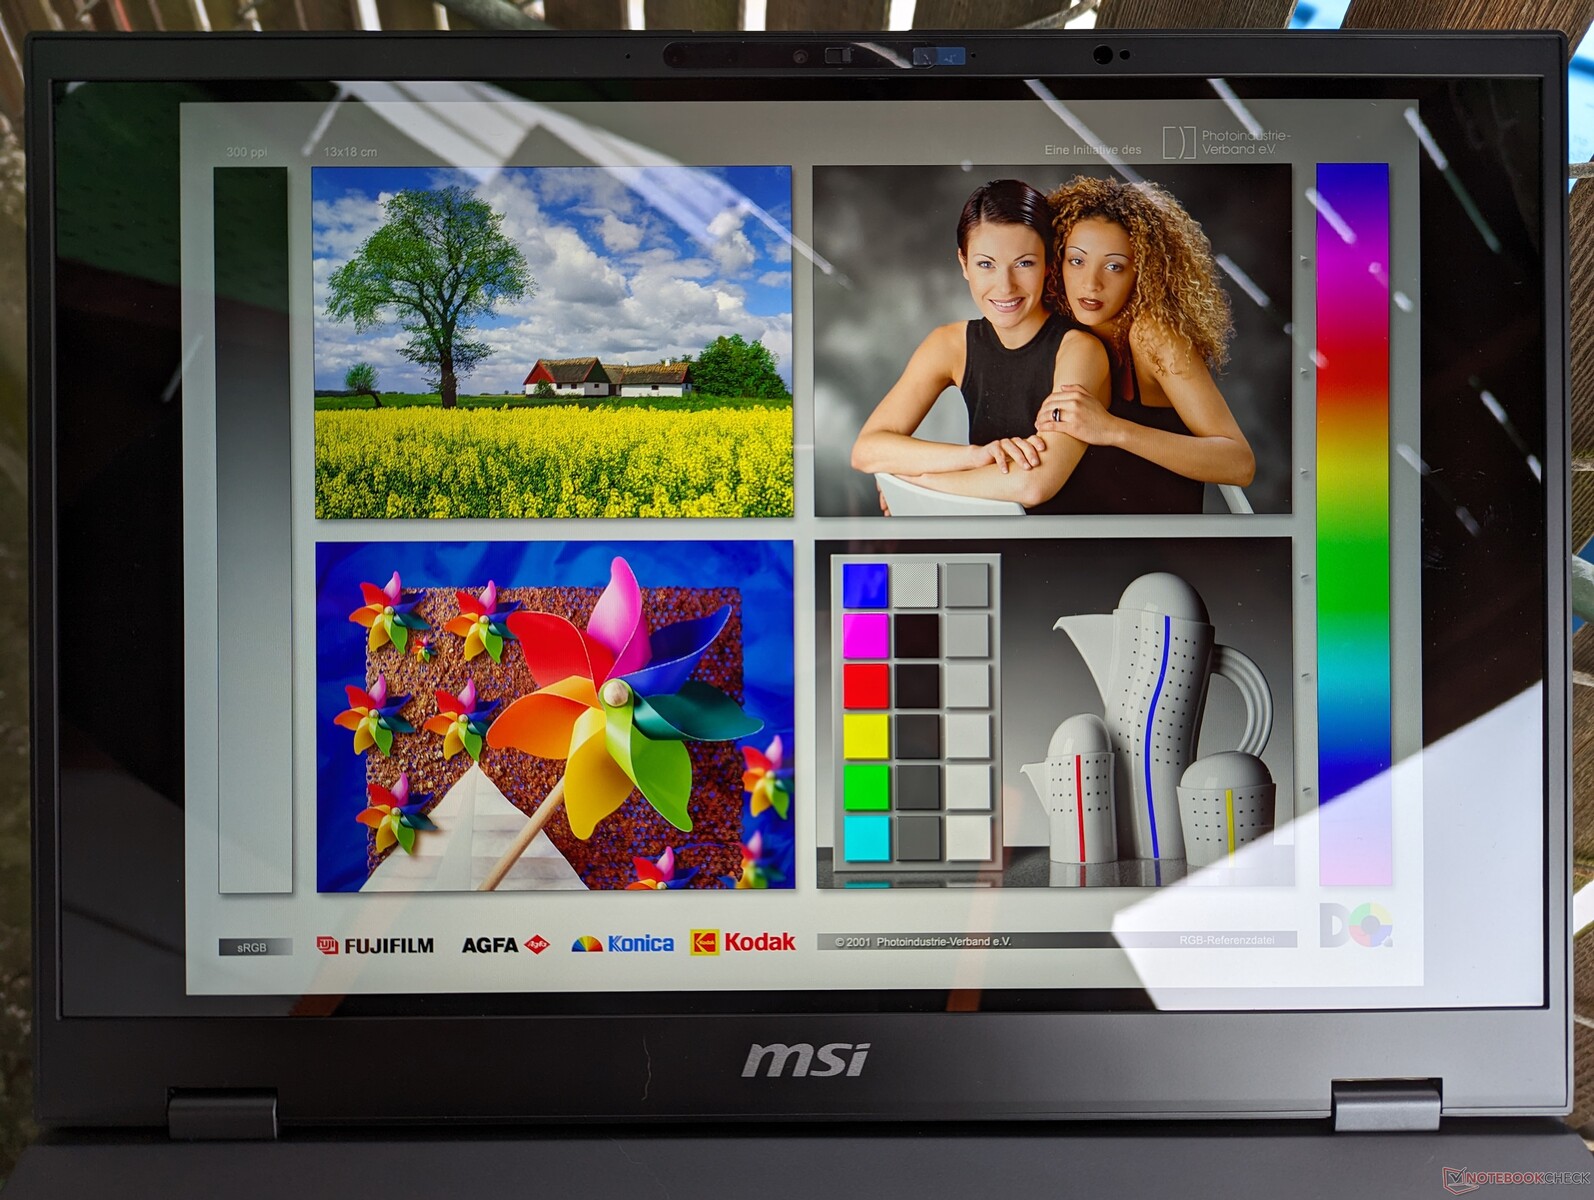
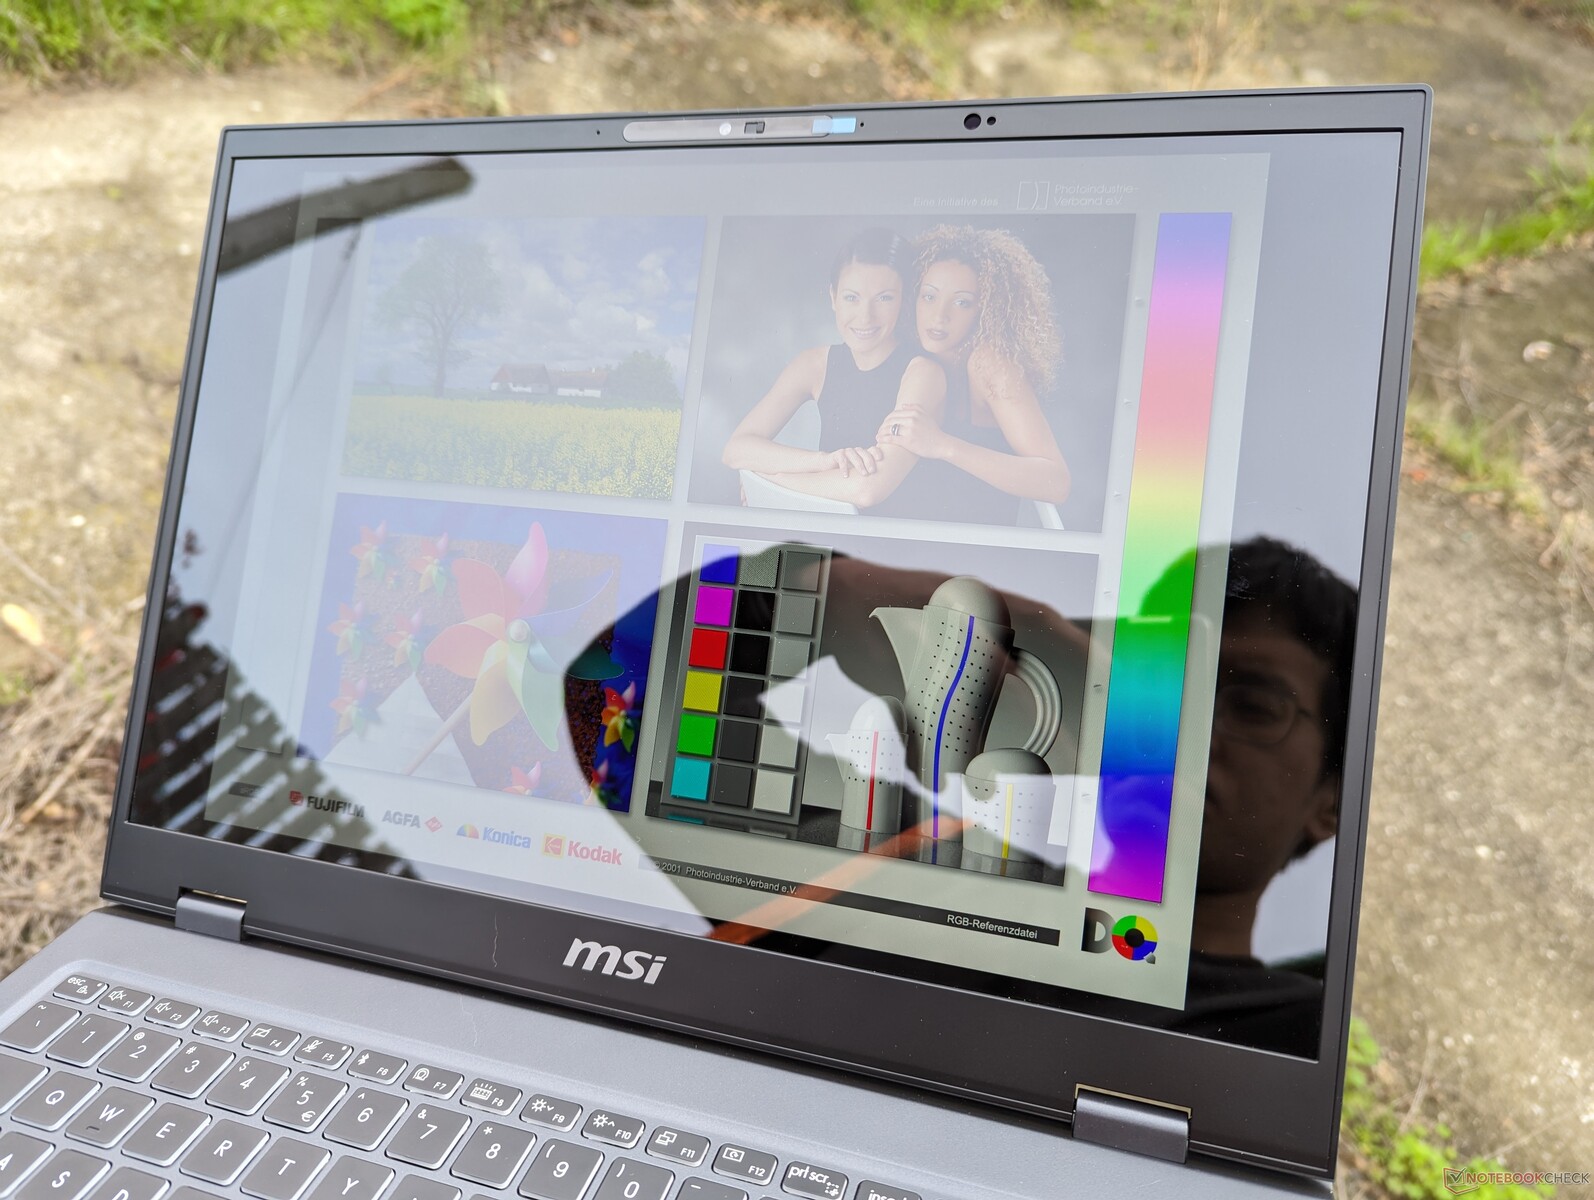
Tela - DCI-P3 completo em todas as SKUs
O Prestige 16 é o primeiro em nosso banco de dados a vir com o AU Optronics B160QAN03.R. Esse painel IPS brilhante e lustroso é de altíssima qualidade, com cores DCI-P3 completas e sem nenhum problema de granulação. Entretanto, os lentos tempos de resposta em preto e branco, a falta de sincronização adaptativa e a modesta taxa de atualização de 60 Hz o tornam mais adequado para edição de gráficos do que para jogos.
Uma segunda opção de tela está disponível com OLED e uma resolução nativa mais alta. Nenhum dos painéis suporta a funcionalidade de tela sensível ao toque.


| |||||||||||||||||||||||||
iluminação: 87 %
iluminação com acumulador: 473.6 cd/m²
Contraste: 2493:1 (Preto: 0.19 cd/m²)
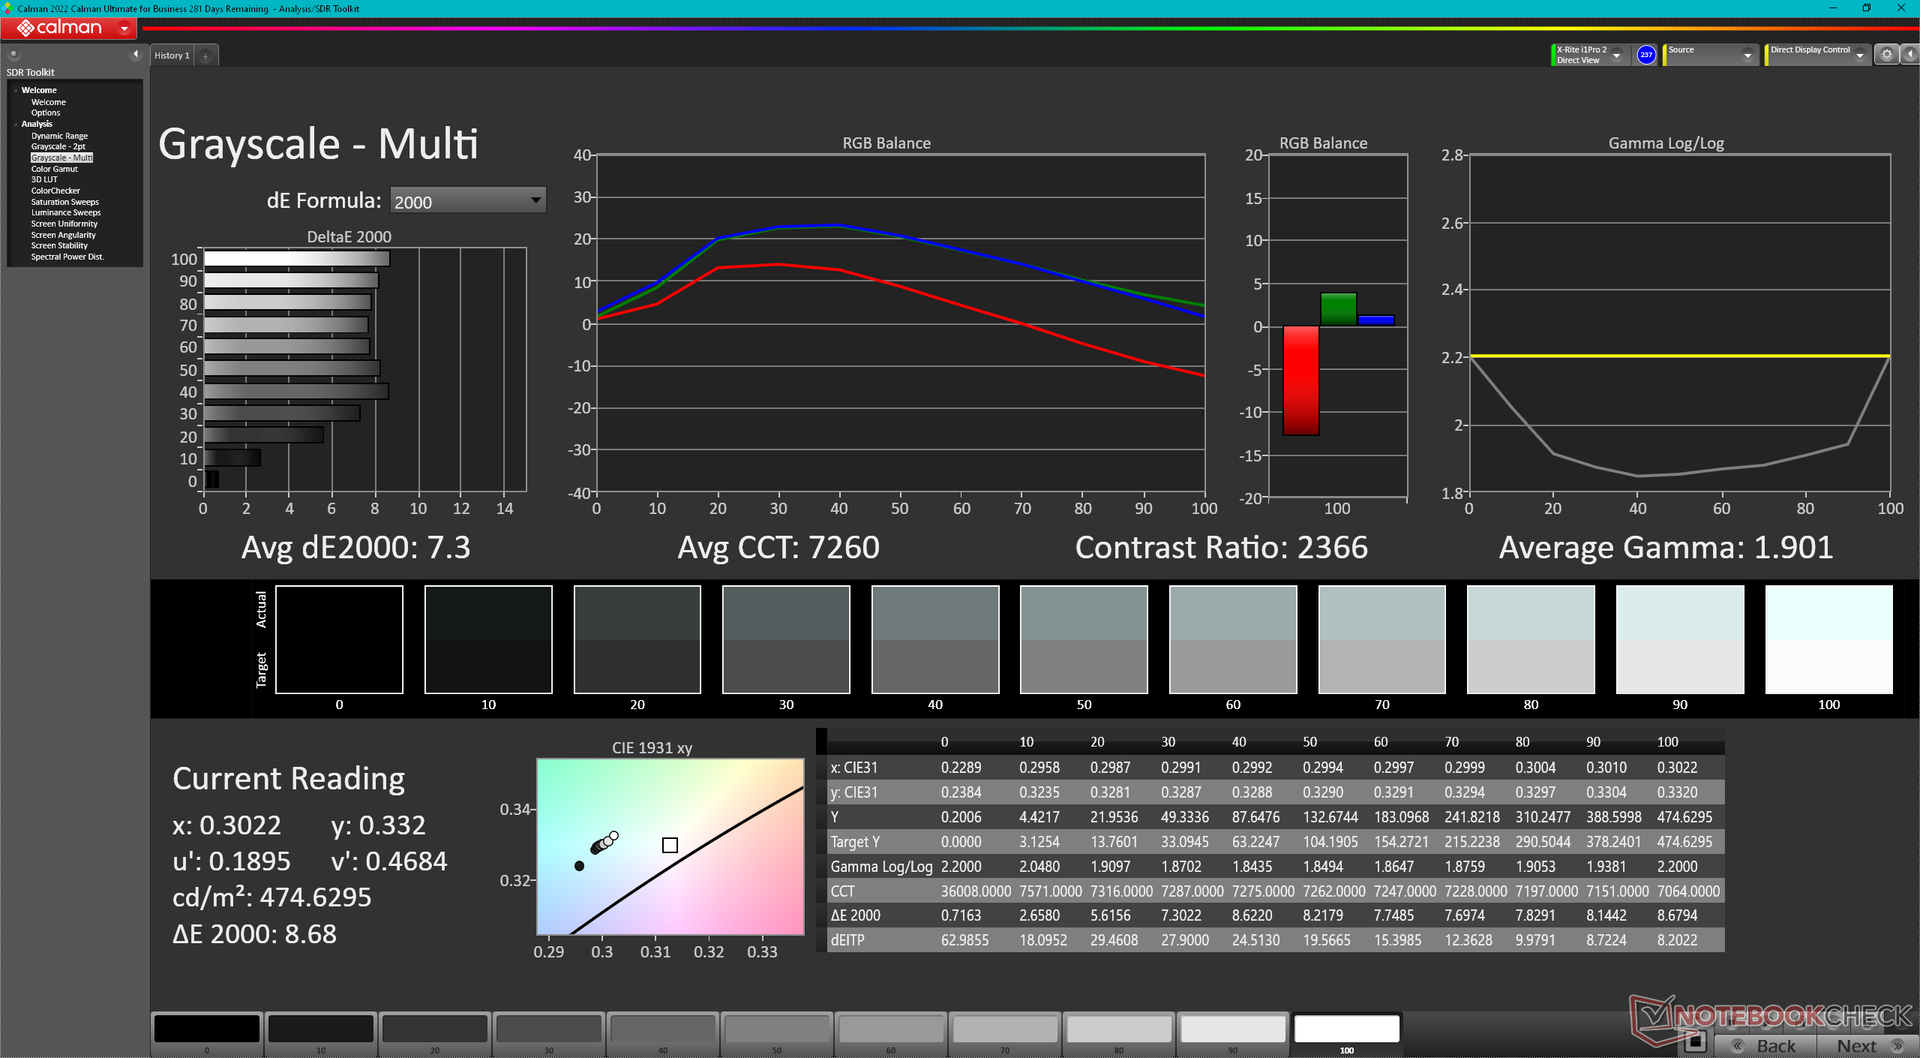
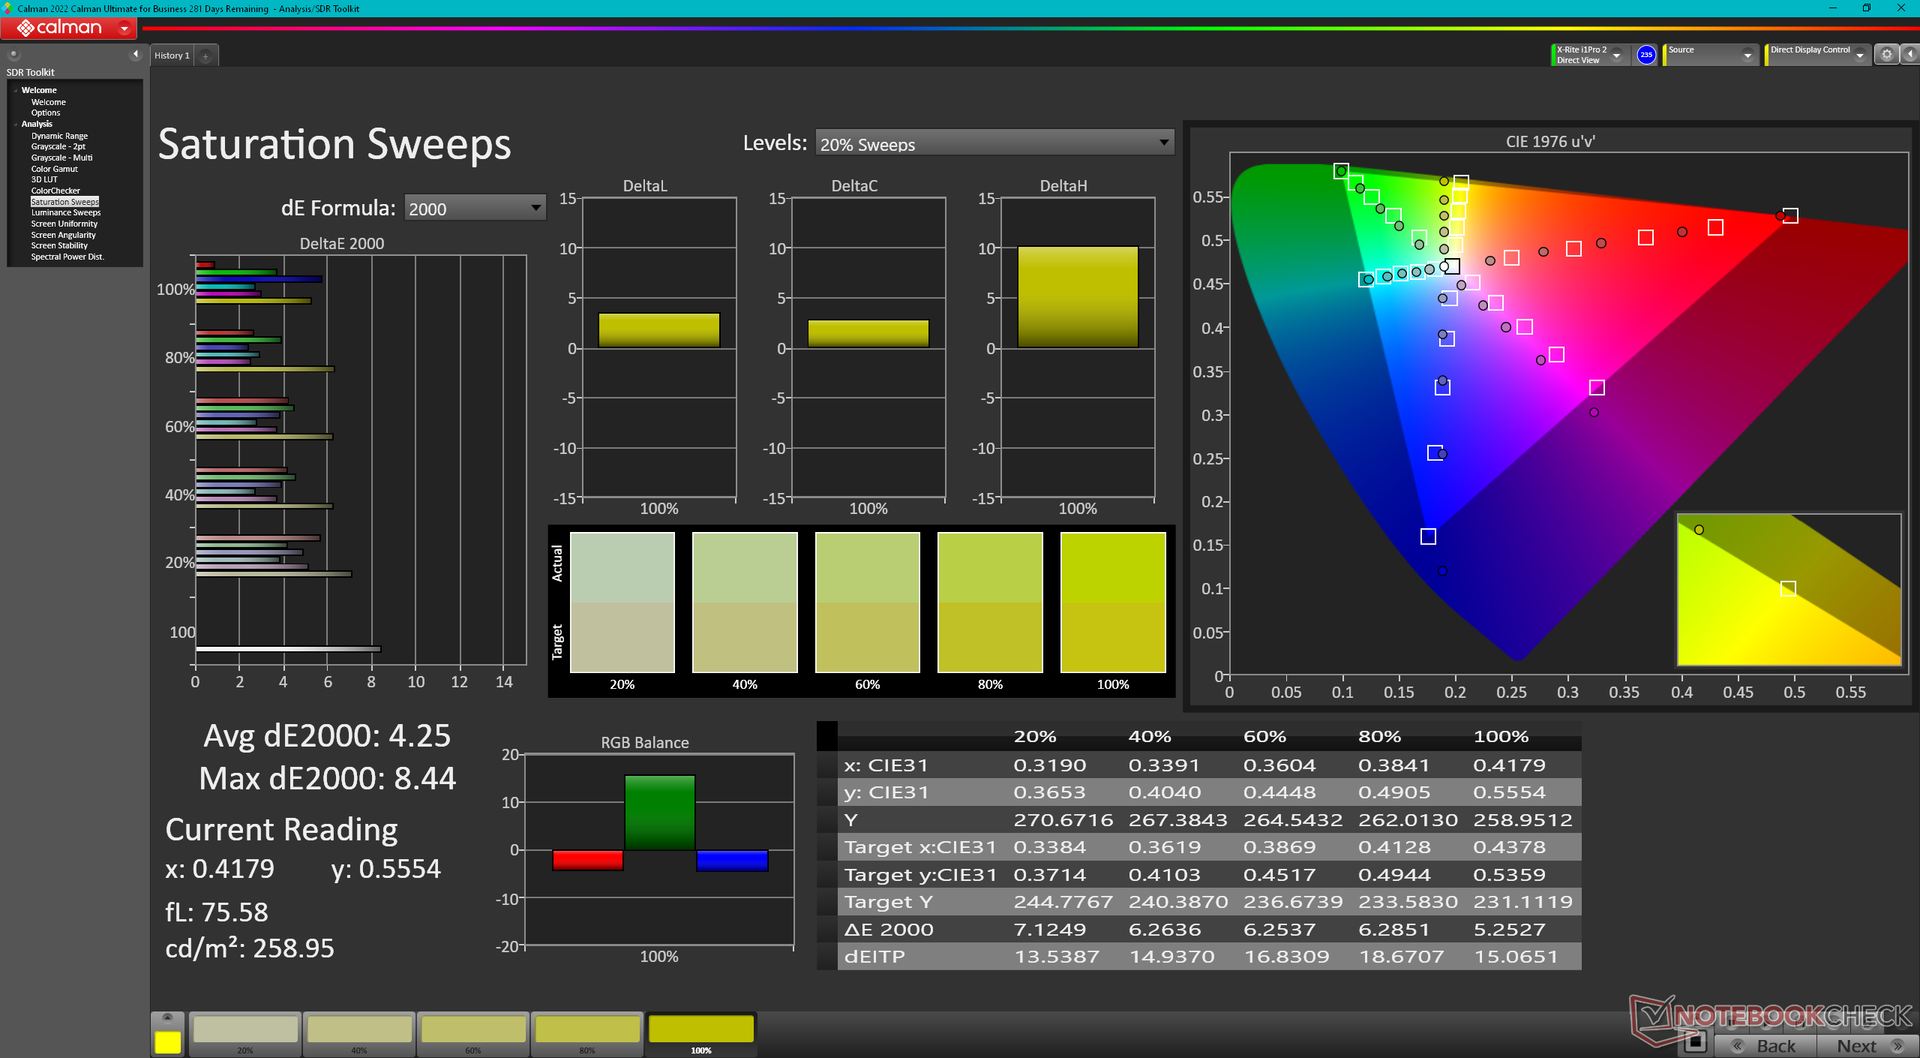
ΔE ColorChecker Calman: 5.9 | ∀{0.5-29.43 Ø4.71}
calibrated: 0.89
ΔE Greyscale Calman: 7.3 | ∀{0.09-98 Ø4.96}
84.6% AdobeRGB 1998 (Argyll 3D)
99.8% sRGB (Argyll 3D)
96.7% Display P3 (Argyll 3D)
Gamma: 1.9
CCT: 7260 K
| MSI Prestige 16 B1MG-001US AU Optronics B160QAN03.R, IPS, 2560x1600, 16" | MSI Prestige 15 A12UD-093 Sharp LQ156D1JW42, IPS, 3840x2160, 15.6" | LG Gram 2in1 16 16T90R - G.AA78G LP160WQ1-SPB2, IPS, 2560x1600, 16" | Lenovo ThinkBook 16 G6 ABP LEN160WUXGA, IPS, 1920x1200, 16" | Asus VivoBook Pro 16 K6602VU Samsung ATNA60BX01-1, OLED, 3200x2000, 16" | Dell Inspiron 16 Plus 7630 LG Philips 160WQ2, IPS, 2560x1600, 16" | |
|---|---|---|---|---|---|---|
| Display | -3% | 0% | -49% | 5% | -14% | |
| Display P3 Coverage (%) | 96.7 | 80.48 -17% | 96.5 0% | 40.4 -58% | 98.7 2% | 70.1 -28% |
| sRGB Coverage (%) | 99.8 | 96.95 -3% | 99.9 0% | 59.8 -40% | 99.7 0% | 99.6 0% |
| AdobeRGB 1998 Coverage (%) | 84.6 | 94.02 11% | 84.6 0% | 42 -50% | 96.5 14% | 72.3 -15% |
| Response Times | 10% | 30% | 32% | 80% | 29% | |
| Response Time Grey 50% / Grey 80% * (ms) | 49.4 ? | 51 ? -3% | 38.4 ? 22% | 32.8 ? 34% | 0.68 ? 99% | 35 ? 29% |
| Response Time Black / White * (ms) | 33.9 ? | 26 ? 23% | 21.4 ? 37% | 23.9 ? 29% | 13.2 ? 61% | 24.2 ? 29% |
| PWM Frequency (Hz) | 240 ? | |||||
| Screen | 27% | -19% | -83% | -13% | 0% | |
| Brightness middle (cd/m²) | 473.6 | 441 -7% | 329 -31% | 310 -35% | 353 -25% | 299.4 -37% |
| Brightness (cd/m²) | 456 | 416 -9% | 310 -32% | 290 -36% | 354 -22% | 290 -36% |
| Brightness Distribution (%) | 87 | 85 -2% | 88 1% | 86 -1% | 98 13% | 92 6% |
| Black Level * (cd/m²) | 0.19 | 0.155 18% | 0.39 -105% | 0.22 -16% | 0.21 -11% | |
| Contrast (:1) | 2493 | 2845 14% | 844 -66% | 1409 -43% | 1426 -43% | |
| Colorchecker dE 2000 * | 5.9 | 1.51 74% | 3.52 40% | 6.2 -5% | 4.23 28% | 4.25 28% |
| Colorchecker dE 2000 max. * | 9.37 | 3.56 62% | 6.96 26% | 24.7 -164% | 7.13 24% | 6.71 28% |
| Colorchecker dE 2000 calibrated * | 0.89 | 1.15 -29% | 5.3 -496% | 2.42 -172% | 0.52 42% | |
| Greyscale dE 2000 * | 7.3 | 2.49 66% | 5.75 21% | 3.8 48% | 2.5 66% | 5.5 25% |
| Gamma | 1.9 116% | 2.17 101% | 2.137 103% | 2.22 99% | 2.4 92% | 2.35 94% |
| CCT | 7260 90% | 6292 103% | 7584 86% | 6011 108% | 6642 98% | 6368 102% |
| Média Total (Programa/Configurações) | 11% /
17% | 4% /
-8% | -33% /
-60% | 24% /
7% | 5% /
1% |
* ... menor é melhor
A tela não vem pré-calibrada, o que é uma pena, pois todas as SKUs suportam cores DCI-P3. A temperatura da cor é excessivamente fria para valores médios relativamente altos de escala de cinza e DeltaE de cores de 7,3 e 5,8, respectivamente. Calibrar o painel por conta própria reduziria esses valores médios para <2 cada. Nosso perfil ICM calibrado está disponível para download gratuito acima.
Exibir tempos de resposta
| ↔ Tempo de resposta preto para branco | ||
|---|---|---|
| 33.9 ms ... ascensão ↗ e queda ↘ combinadas | ↗ 15.6 ms ascensão | 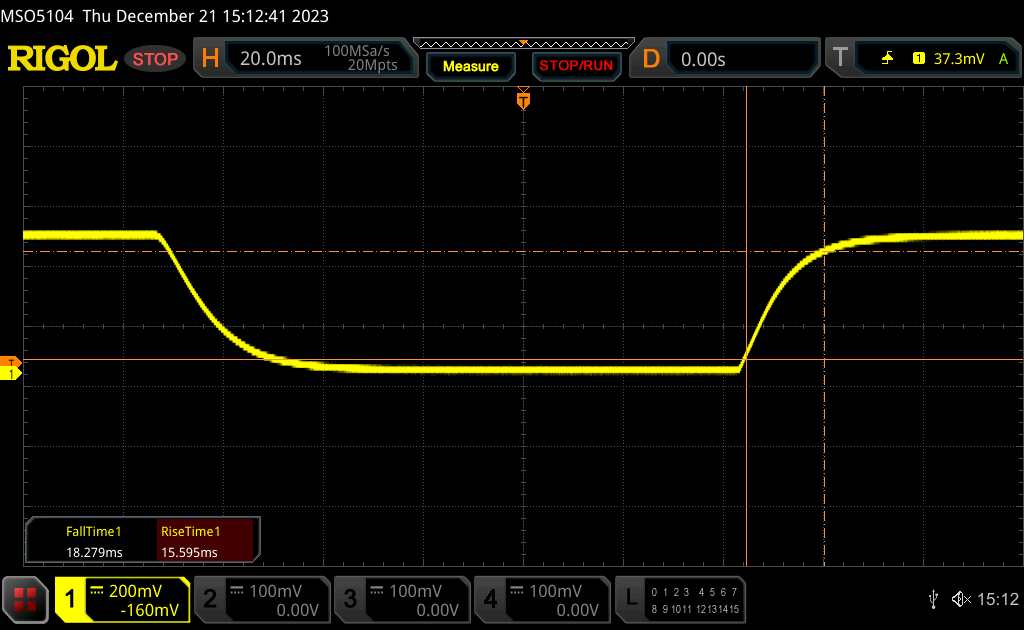 |
| ↘ 18.3 ms queda | ||
| A tela mostra taxas de resposta lentas em nossos testes e será insatisfatória para os jogadores. Em comparação, todos os dispositivos testados variam de 0.1 (mínimo) a 240 (máximo) ms. » 91 % de todos os dispositivos são melhores. Isso significa que o tempo de resposta medido é pior que a média de todos os dispositivos testados (19.8 ms). | ||
| ↔ Tempo de resposta 50% cinza a 80% cinza | ||
| 49.4 ms ... ascensão ↗ e queda ↘ combinadas | ↗ 22.6 ms ascensão | 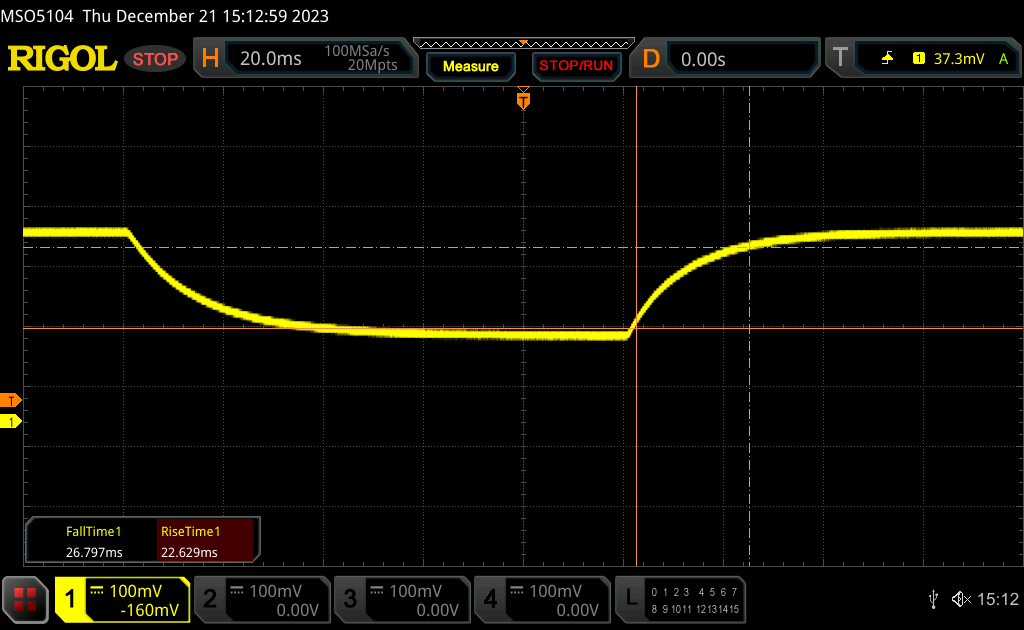 |
| ↘ 26.8 ms queda | ||
| A tela mostra taxas de resposta lentas em nossos testes e será insatisfatória para os jogadores. Em comparação, todos os dispositivos testados variam de 0.165 (mínimo) a 636 (máximo) ms. » 85 % de todos os dispositivos são melhores. Isso significa que o tempo de resposta medido é pior que a média de todos os dispositivos testados (31 ms). | ||
Cintilação da tela / PWM (modulação por largura de pulso)
| Tela tremeluzindo / PWM não detectado |  | ||
[pwm_comparison] Em comparação: 52 % de todos os dispositivos testados não usam PWM para escurecer a tela. Se PWM foi detectado, uma média de 7757 (mínimo: 5 - máximo: 343500) Hz foi medida. | |||
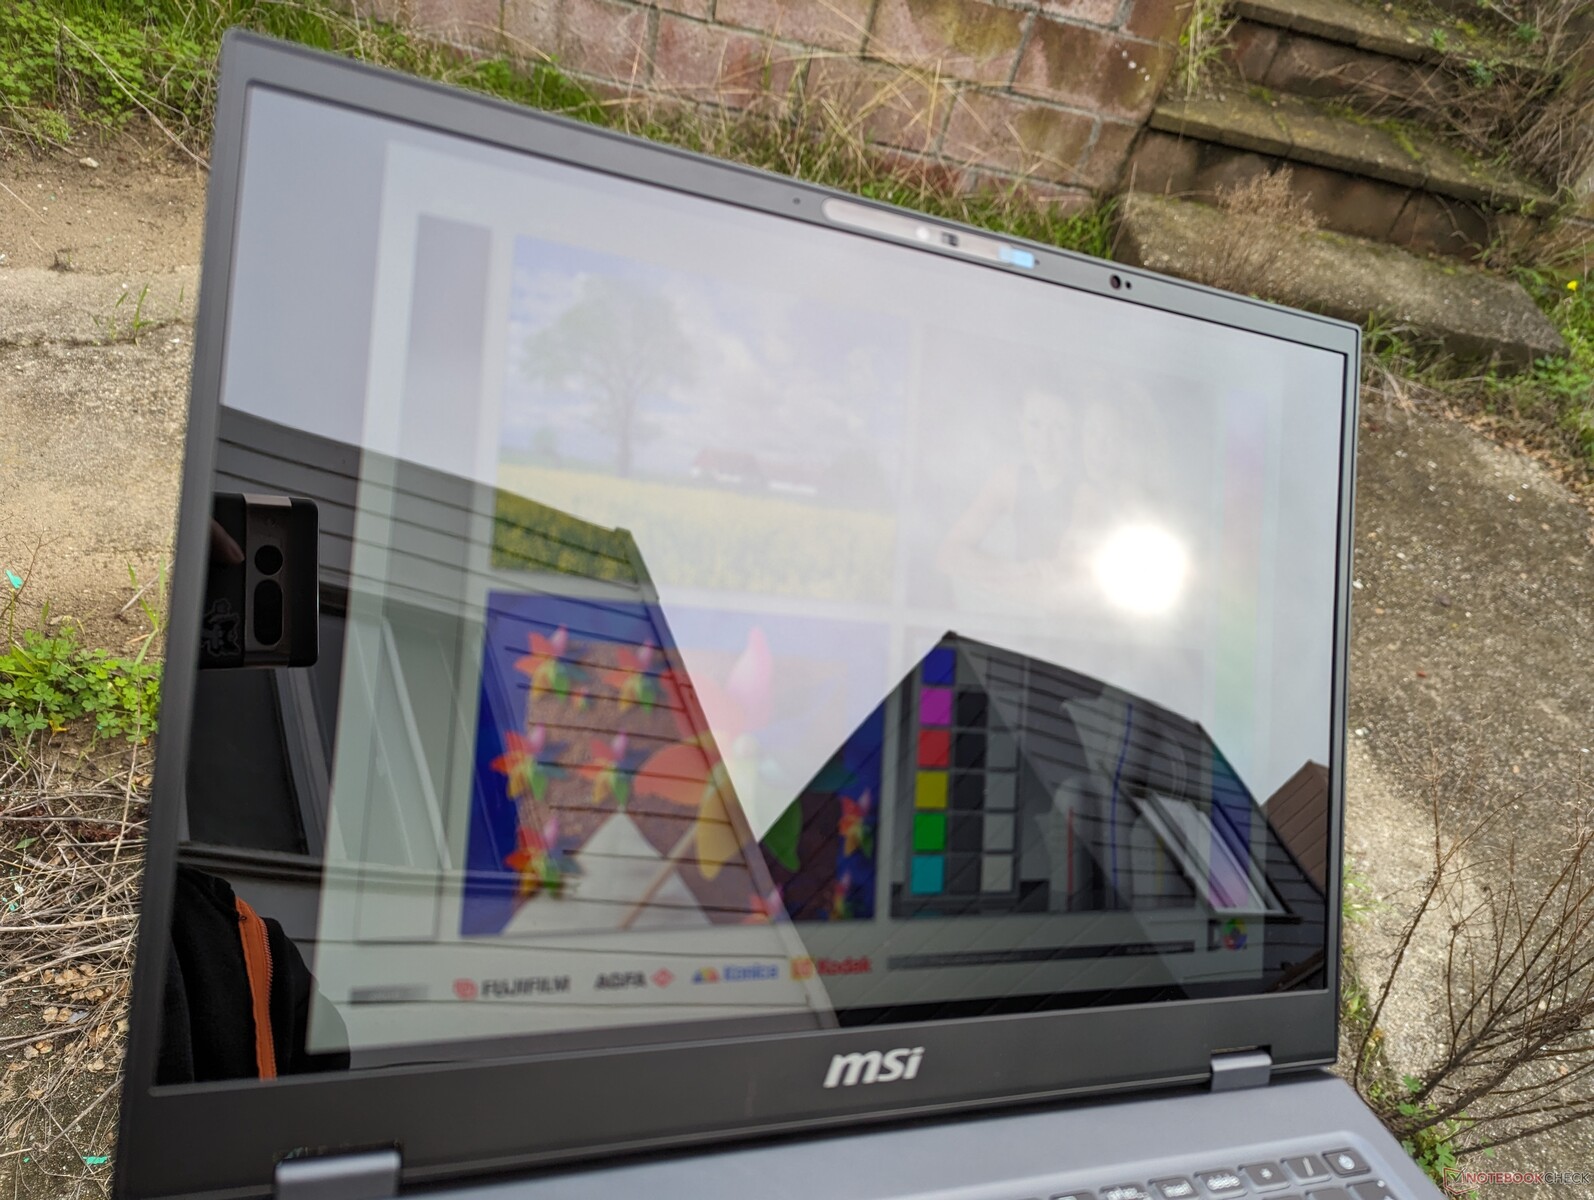
A tela superbrilhante pode contribuir para uma imagem mais nítida, mas também contribui para o brilho excessivo na maioria dos cenários de uso, especialmente em ambientes externos. A tela Mini-LED do MacBook Pro 16 é cerca de 30% mais brilhante do que a do MSI, o que proporciona uma visibilidade geralmente melhor em ambientes com muita luz.
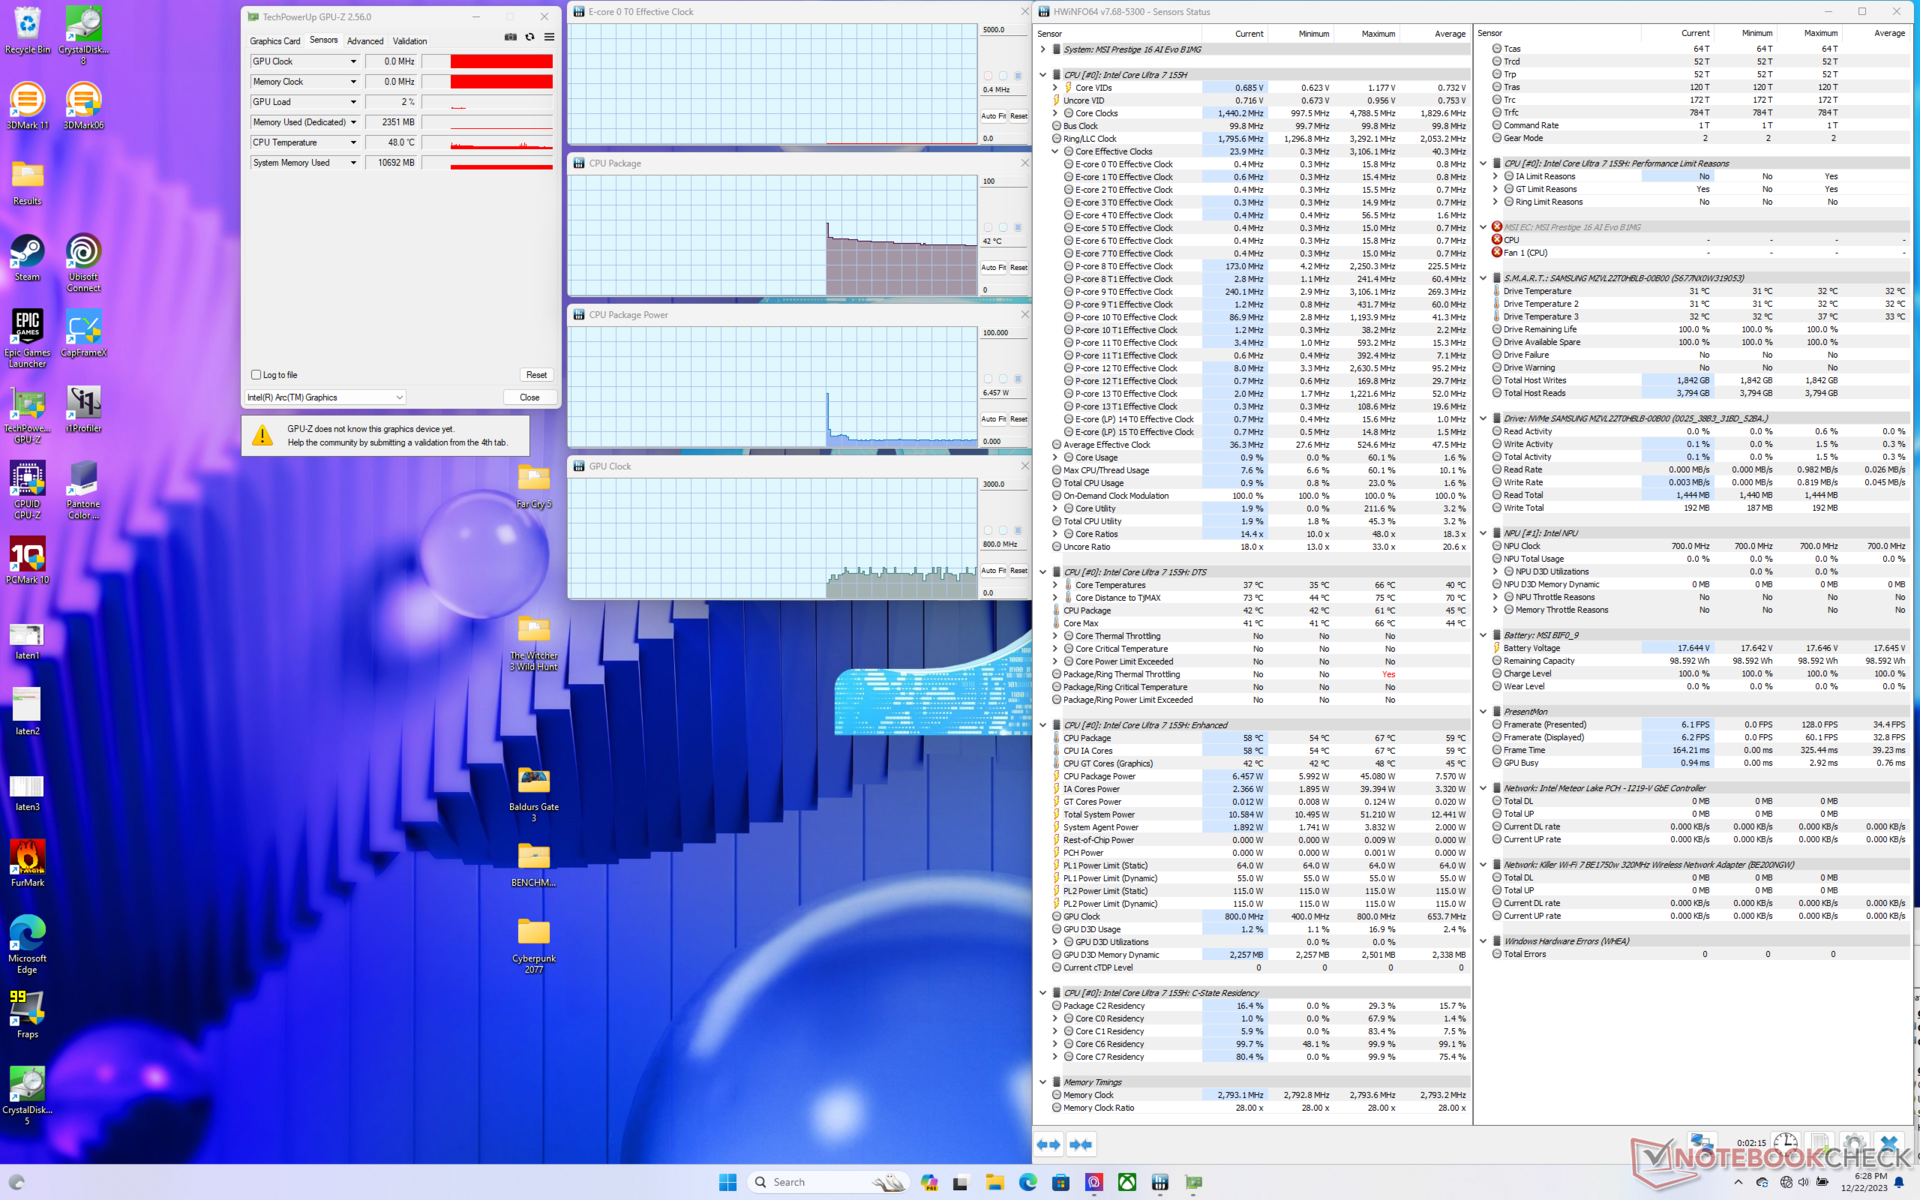
Desempenho - uma ascensão meteórica
Condições de teste
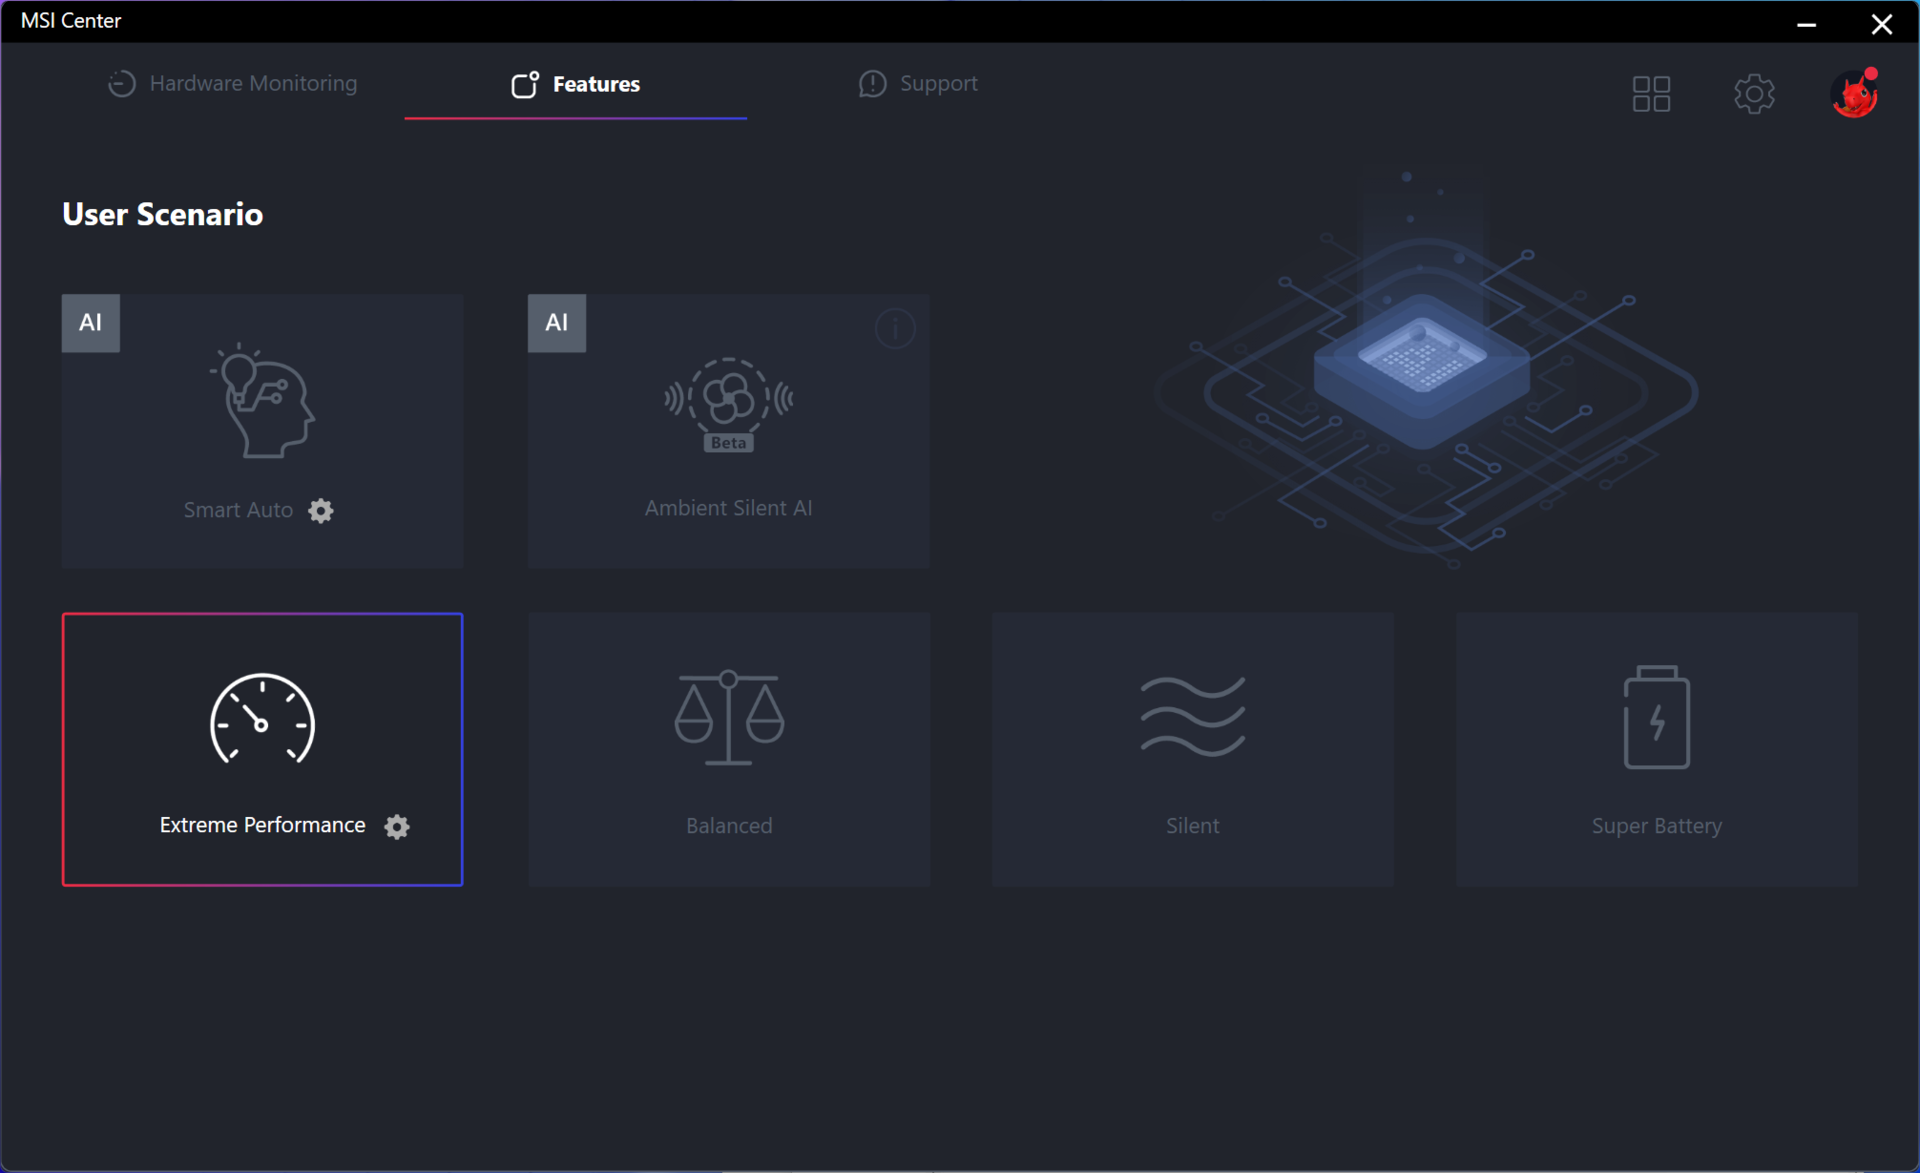
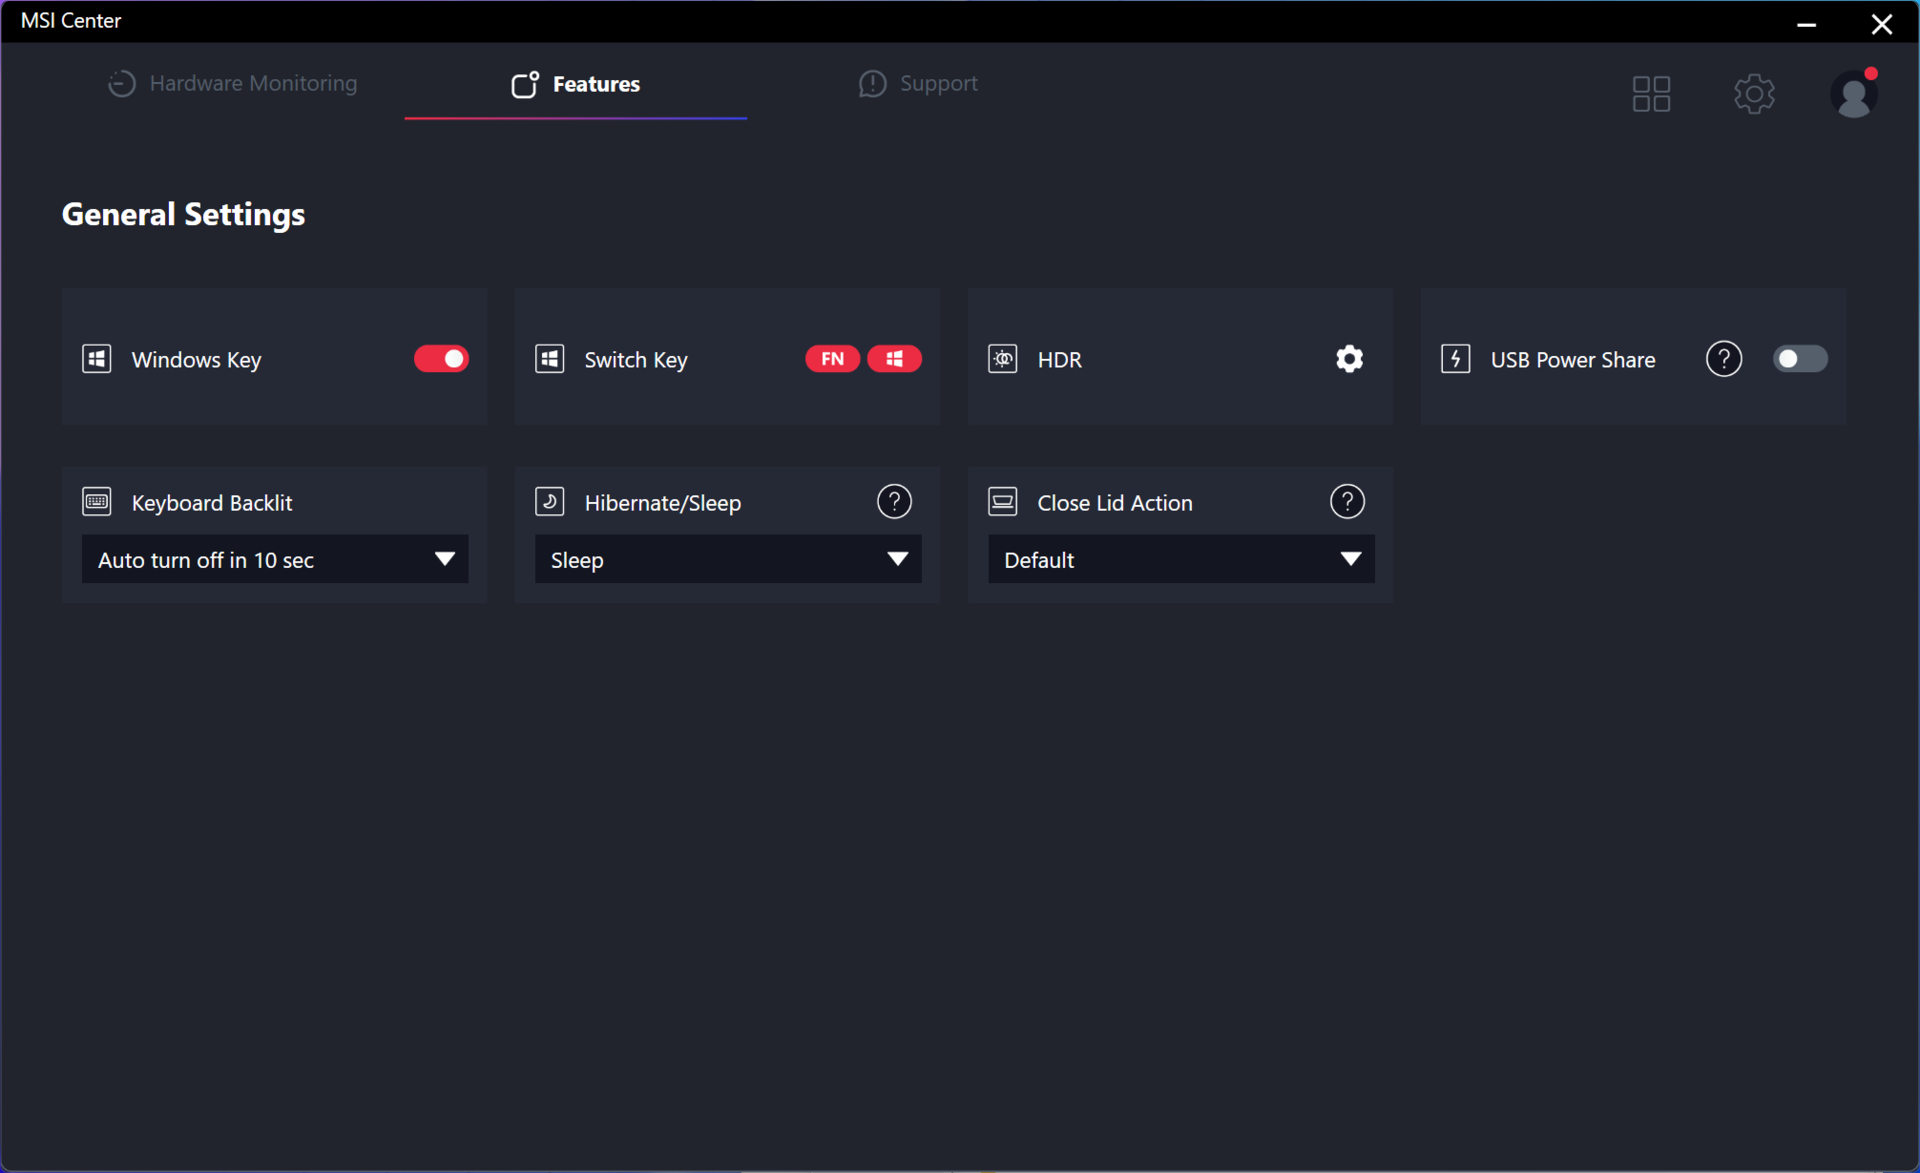
Definimos o Windows para o modo Desempenho e o MSI Center para o modo Desempenho extremo antes de executar os benchmarks abaixo. Os proprietários devem se familiarizar com o MSI Center, pois ele é o centro de atualizações e recursos específicos da MSI.
Processador
O desempenho da CPU é um grande salto em relação às opções Core U e Core P da última geração. Nosso Core Ultra 7 155H tem uma vantagem confortável de 20 a 25 por cento sobre o Core i7-1360P e a opção mais rápida da série Zen 4 U da AMD, o Ryzen 7 7840U.
Os usuários que esperam ganhos notáveis em relação às opções do Core H de 13ª geração ainda podem ficar desapontados. Por exemplo, o desempenho bruto de thread único e multi-thread fica um pouco aquém do Core i7-13700H. Em vez disso, os maiores diferenciais entre o Core H de 13ª e 14ª geração estão relacionados à aceleração aprimorada da iGPU e da IA das opções mais recentes.
Um processador de ponta Core Ultra 9 185H Também está disponível para o Prestige 16, mas não esperamos que seu desempenho seja muito mais rápido do que o da nossa configuração Core Ultra 7 155H, pois ambas as CPUs têm exatamente o mesmo número de núcleos, com apenas pequenas diferenças nas taxas de clock.
Cinebench R15 Multi Loop
Cinebench R23: Multi Core | Single Core
Cinebench R20: CPU (Multi Core) | CPU (Single Core)
Cinebench R15: CPU Multi 64Bit | CPU Single 64Bit
Blender: v2.79 BMW27 CPU
7-Zip 18.03: 7z b 4 | 7z b 4 -mmt1
Geekbench 5.5: Multi-Core | Single-Core
HWBOT x265 Benchmark v2.2: 4k Preset
LibreOffice : 20 Documents To PDF
R Benchmark 2.5: Overall mean
* ... menor é melhor
AIDA64: FP32 Ray-Trace | FPU Julia | CPU SHA3 | CPU Queen | FPU SinJulia | FPU Mandel | CPU AES | CPU ZLib | FP64 Ray-Trace | CPU PhotoWorxx
| Performance rating | |
| MSI Prestige 16 B1MG-001US | |
| Asus VivoBook Pro 16 K6602VU | |
| Média Intel Core Ultra 7 155H | |
| Dell Inspiron 16 Plus 7630 | |
| MSI Prestige 15 A12UD-093 | |
| LG Gram 2in1 16 16T90R - G.AA78G | |
| Lenovo ThinkBook 16 G6 ABP | |
| AIDA64 / FP32 Ray-Trace | |
| MSI Prestige 16 B1MG-001US | |
| Dell Inspiron 16 Plus 7630 | |
| Asus VivoBook Pro 16 K6602VU | |
| Média Intel Core Ultra 7 155H (6670 - 18470, n=50) | |
| Lenovo ThinkBook 16 G6 ABP | |
| MSI Prestige 15 A12UD-093 | |
| LG Gram 2in1 16 16T90R - G.AA78G | |
| LG Gram 2in1 16 16T90R - G.AA78G | |
| AIDA64 / FPU Julia | |
| MSI Prestige 16 B1MG-001US | |
| Asus VivoBook Pro 16 K6602VU | |
| Média Intel Core Ultra 7 155H (40905 - 93181, n=50) | |
| Lenovo ThinkBook 16 G6 ABP | |
| Dell Inspiron 16 Plus 7630 | |
| MSI Prestige 15 A12UD-093 | |
| LG Gram 2in1 16 16T90R - G.AA78G | |
| AIDA64 / CPU SHA3 | |
| MSI Prestige 16 B1MG-001US | |
| Asus VivoBook Pro 16 K6602VU | |
| Média Intel Core Ultra 7 155H (1940 - 4436, n=50) | |
| Dell Inspiron 16 Plus 7630 | |
| MSI Prestige 15 A12UD-093 | |
| LG Gram 2in1 16 16T90R - G.AA78G | |
| Lenovo ThinkBook 16 G6 ABP | |
| AIDA64 / CPU Queen | |
| Dell Inspiron 16 Plus 7630 | |
| Asus VivoBook Pro 16 K6602VU | |
| MSI Prestige 16 B1MG-001US | |
| Média Intel Core Ultra 7 155H (64698 - 94181, n=50) | |
| LG Gram 2in1 16 16T90R - G.AA78G | |
| MSI Prestige 15 A12UD-093 | |
| Lenovo ThinkBook 16 G6 ABP | |
| AIDA64 / FPU SinJulia | |
| MSI Prestige 16 B1MG-001US | |
| Lenovo ThinkBook 16 G6 ABP | |
| Média Intel Core Ultra 7 155H (5639 - 10647, n=50) | |
| Dell Inspiron 16 Plus 7630 | |
| Asus VivoBook Pro 16 K6602VU | |
| MSI Prestige 15 A12UD-093 | |
| LG Gram 2in1 16 16T90R - G.AA78G | |
| AIDA64 / FPU Mandel | |
| MSI Prestige 16 B1MG-001US | |
| Lenovo ThinkBook 16 G6 ABP | |
| Média Intel Core Ultra 7 155H (18236 - 47685, n=50) | |
| Asus VivoBook Pro 16 K6602VU | |
| Dell Inspiron 16 Plus 7630 | |
| MSI Prestige 15 A12UD-093 | |
| LG Gram 2in1 16 16T90R - G.AA78G | |
| AIDA64 / CPU AES | |
| Asus VivoBook Pro 16 K6602VU | |
| MSI Prestige 15 A12UD-093 | |
| LG Gram 2in1 16 16T90R - G.AA78G | |
| Média Intel Core Ultra 7 155H (45713 - 152179, n=50) | |
| MSI Prestige 16 B1MG-001US | |
| Dell Inspiron 16 Plus 7630 | |
| Lenovo ThinkBook 16 G6 ABP | |
| AIDA64 / CPU ZLib | |
| MSI Prestige 16 B1MG-001US | |
| Asus VivoBook Pro 16 K6602VU | |
| Média Intel Core Ultra 7 155H (557 - 1250, n=50) | |
| Dell Inspiron 16 Plus 7630 | |
| LG Gram 2in1 16 16T90R - G.AA78G | |
| MSI Prestige 15 A12UD-093 | |
| Lenovo ThinkBook 16 G6 ABP | |
| AIDA64 / FP64 Ray-Trace | |
| MSI Prestige 16 B1MG-001US | |
| Asus VivoBook Pro 16 K6602VU | |
| Dell Inspiron 16 Plus 7630 | |
| Média Intel Core Ultra 7 155H (3569 - 9802, n=50) | |
| Lenovo ThinkBook 16 G6 ABP | |
| MSI Prestige 15 A12UD-093 | |
| LG Gram 2in1 16 16T90R - G.AA78G | |
| AIDA64 / CPU PhotoWorxx | |
| Média Intel Core Ultra 7 155H (32719 - 54223, n=50) | |
| MSI Prestige 16 B1MG-001US | |
| MSI Prestige 15 A12UD-093 | |
| LG Gram 2in1 16 16T90R - G.AA78G | |
| Asus VivoBook Pro 16 K6602VU | |
| Dell Inspiron 16 Plus 7630 | |
| Lenovo ThinkBook 16 G6 ABP | |
Desempenho do sistema
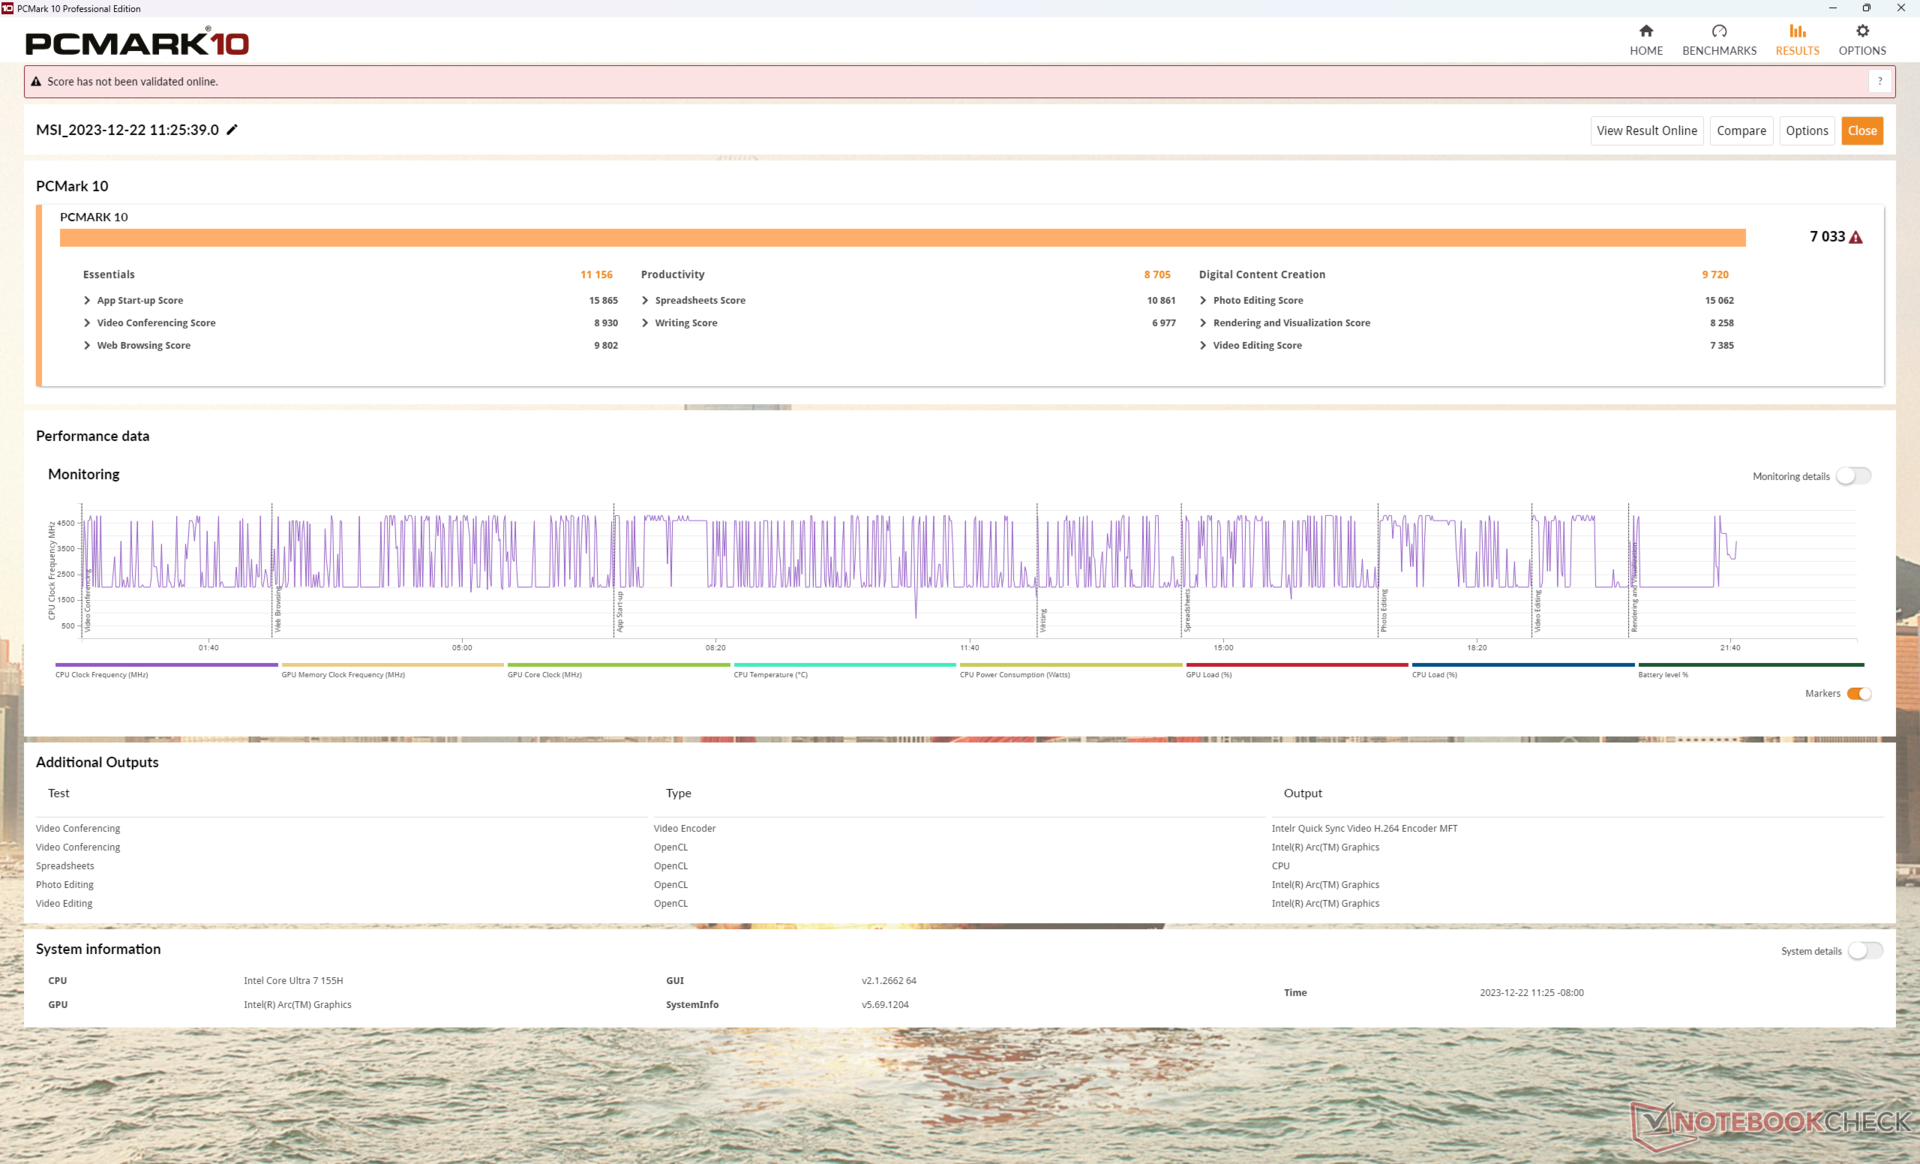
Os resultados do PCMark são comparáveis aos de notebooks multimídia com gráficos discretos de médio porte, como o Asus VivoBook Pro 16. No entanto, a importância das pontuações é questionável, pois os números são difíceis de comparar diretamente entre notebooks com iGPUs e dGPUs.
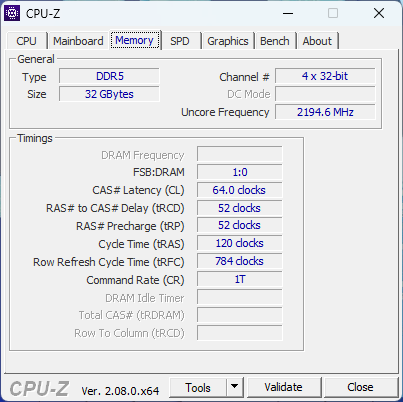
Vale a pena mencionar a rápida RAM do sistema de 6400 MHz, especialmente porque o desempenho da iGPU está intimamente ligado ao desempenho da RAM.
CrossMark: Overall | Productivity | Creativity | Responsiveness
WebXPRT 3: Overall
WebXPRT 4: Overall
Mozilla Kraken 1.1: Total
| PCMark 10 / Score | |
| Dell Inspiron 16 Plus 7630 | |
| Asus VivoBook Pro 16 K6602VU | |
| MSI Prestige 16 B1MG-001US | |
| Média Intel Core Ultra 7 155H, Intel Arc 8-Core iGPU (4809 - 7529, n=34) | |
| MSI Prestige 15 A12UD-093 | |
| Lenovo ThinkBook 16 G6 ABP | |
| LG Gram 2in1 16 16T90R - G.AA78G | |
| PCMark 10 / Essentials | |
| LG Gram 2in1 16 16T90R - G.AA78G | |
| Dell Inspiron 16 Plus 7630 | |
| MSI Prestige 16 B1MG-001US | |
| Lenovo ThinkBook 16 G6 ABP | |
| Média Intel Core Ultra 7 155H, Intel Arc 8-Core iGPU (7605 - 11289, n=34) | |
| Asus VivoBook Pro 16 K6602VU | |
| MSI Prestige 15 A12UD-093 | |
| PCMark 10 / Productivity | |
| Dell Inspiron 16 Plus 7630 | |
| Lenovo ThinkBook 16 G6 ABP | |
| MSI Prestige 15 A12UD-093 | |
| MSI Prestige 16 B1MG-001US | |
| Asus VivoBook Pro 16 K6602VU | |
| Média Intel Core Ultra 7 155H, Intel Arc 8-Core iGPU (6042 - 10591, n=34) | |
| LG Gram 2in1 16 16T90R - G.AA78G | |
| PCMark 10 / Digital Content Creation | |
| Dell Inspiron 16 Plus 7630 | |
| Asus VivoBook Pro 16 K6602VU | |
| MSI Prestige 16 B1MG-001US | |
| Média Intel Core Ultra 7 155H, Intel Arc 8-Core iGPU (4985 - 10709, n=34) | |
| MSI Prestige 15 A12UD-093 | |
| LG Gram 2in1 16 16T90R - G.AA78G | |
| Lenovo ThinkBook 16 G6 ABP | |
| CrossMark / Overall | |
| Dell Inspiron 16 Plus 7630 | |
| MSI Prestige 16 B1MG-001US | |
| Asus VivoBook Pro 16 K6602VU | |
| MSI Prestige 15 A12UD-093 | |
| Média Intel Core Ultra 7 155H, Intel Arc 8-Core iGPU (1366 - 1903, n=34) | |
| LG Gram 2in1 16 16T90R - G.AA78G | |
| Lenovo ThinkBook 16 G6 ABP | |
| CrossMark / Productivity | |
| Dell Inspiron 16 Plus 7630 | |
| MSI Prestige 16 B1MG-001US | |
| Asus VivoBook Pro 16 K6602VU | |
| MSI Prestige 15 A12UD-093 | |
| Média Intel Core Ultra 7 155H, Intel Arc 8-Core iGPU (1291 - 1798, n=33) | |
| LG Gram 2in1 16 16T90R - G.AA78G | |
| Lenovo ThinkBook 16 G6 ABP | |
| CrossMark / Creativity | |
| Dell Inspiron 16 Plus 7630 | |
| MSI Prestige 16 B1MG-001US | |
| Asus VivoBook Pro 16 K6602VU | |
| Média Intel Core Ultra 7 155H, Intel Arc 8-Core iGPU (1519 - 1929, n=33) | |
| MSI Prestige 15 A12UD-093 | |
| LG Gram 2in1 16 16T90R - G.AA78G | |
| Lenovo ThinkBook 16 G6 ABP | |
| CrossMark / Responsiveness | |
| MSI Prestige 15 A12UD-093 | |
| Dell Inspiron 16 Plus 7630 | |
| MSI Prestige 16 B1MG-001US | |
| Asus VivoBook Pro 16 K6602VU | |
| LG Gram 2in1 16 16T90R - G.AA78G | |
| Média Intel Core Ultra 7 155H, Intel Arc 8-Core iGPU (939 - 1802, n=33) | |
| Lenovo ThinkBook 16 G6 ABP | |
| WebXPRT 3 / Overall | |
| Dell Inspiron 16 Plus 7630 | |
| MSI Prestige 16 B1MG-001US | |
| Média Intel Core Ultra 7 155H, Intel Arc 8-Core iGPU (252 - 299, n=34) | |
| Lenovo ThinkBook 16 G6 ABP | |
| LG Gram 2in1 16 16T90R - G.AA78G | |
| MSI Prestige 15 A12UD-093 | |
| WebXPRT 4 / Overall | |
| Dell Inspiron 16 Plus 7630 | |
| MSI Prestige 16 B1MG-001US | |
| Média Intel Core Ultra 7 155H, Intel Arc 8-Core iGPU (166.4 - 309, n=29) | |
| Asus VivoBook Pro 16 K6602VU | |
| Lenovo ThinkBook 16 G6 ABP | |
| Mozilla Kraken 1.1 / Total | |
| MSI Prestige 15 A12UD-093 | |
| LG Gram 2in1 16 16T90R - G.AA78G | |
| Lenovo ThinkBook 16 G6 ABP | |
| Asus VivoBook Pro 16 K6602VU | |
| Média Intel Core Ultra 7 155H, Intel Arc 8-Core iGPU (517 - 614, n=35) | |
| MSI Prestige 16 B1MG-001US | |
| Dell Inspiron 16 Plus 7630 | |
* ... menor é melhor
| PCMark 10 Score | 7033 pontos | |
Ajuda | ||
| AIDA64 / Memory Copy | |
| Média Intel Core Ultra 7 155H (62397 - 96791, n=50) | |
| MSI Prestige 16 B1MG-001US | |
| MSI Prestige 15 A12UD-093 | |
| LG Gram 2in1 16 16T90R - G.AA78G | |
| Dell Inspiron 16 Plus 7630 | |
| Asus VivoBook Pro 16 K6602VU | |
| Lenovo ThinkBook 16 G6 ABP | |
| AIDA64 / Memory Read | |
| Média Intel Core Ultra 7 155H (60544 - 90647, n=50) | |
| MSI Prestige 16 B1MG-001US | |
| Dell Inspiron 16 Plus 7630 | |
| Asus VivoBook Pro 16 K6602VU | |
| MSI Prestige 15 A12UD-093 | |
| LG Gram 2in1 16 16T90R - G.AA78G | |
| Lenovo ThinkBook 16 G6 ABP | |
| AIDA64 / Memory Write | |
| LG Gram 2in1 16 16T90R - G.AA78G | |
| MSI Prestige 16 B1MG-001US | |
| Média Intel Core Ultra 7 155H (58692 - 93451, n=50) | |
| MSI Prestige 15 A12UD-093 | |
| Asus VivoBook Pro 16 K6602VU | |
| Dell Inspiron 16 Plus 7630 | |
| Lenovo ThinkBook 16 G6 ABP | |
| AIDA64 / Memory Latency | |
| Média Intel Core Ultra 7 155H (116.2 - 233, n=50) | |
| MSI Prestige 16 B1MG-001US | |
| LG Gram 2in1 16 16T90R - G.AA78G | |
| MSI Prestige 15 A12UD-093 | |
| Lenovo ThinkBook 16 G6 ABP | |
| Dell Inspiron 16 Plus 7630 | |
| Asus VivoBook Pro 16 K6602VU | |
* ... menor é melhor
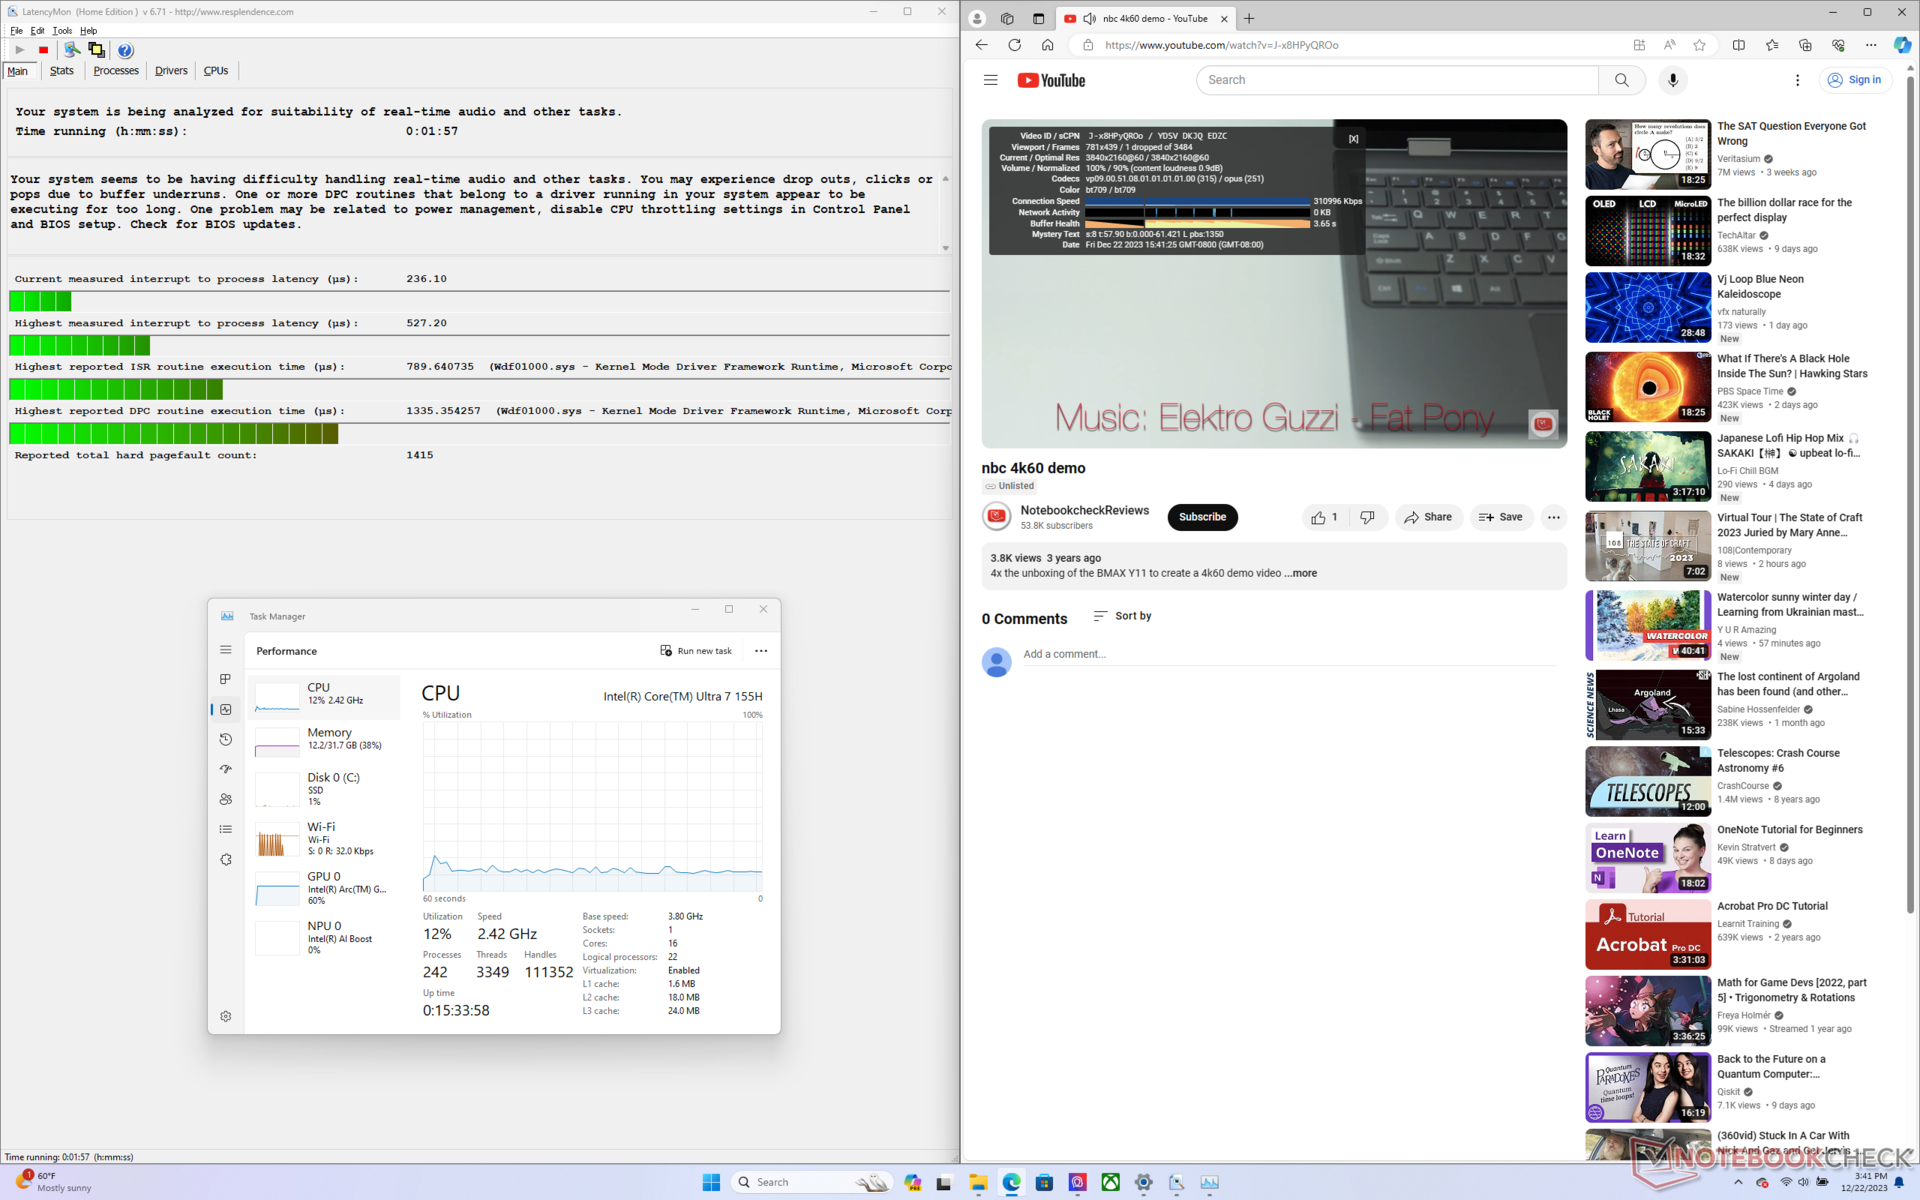
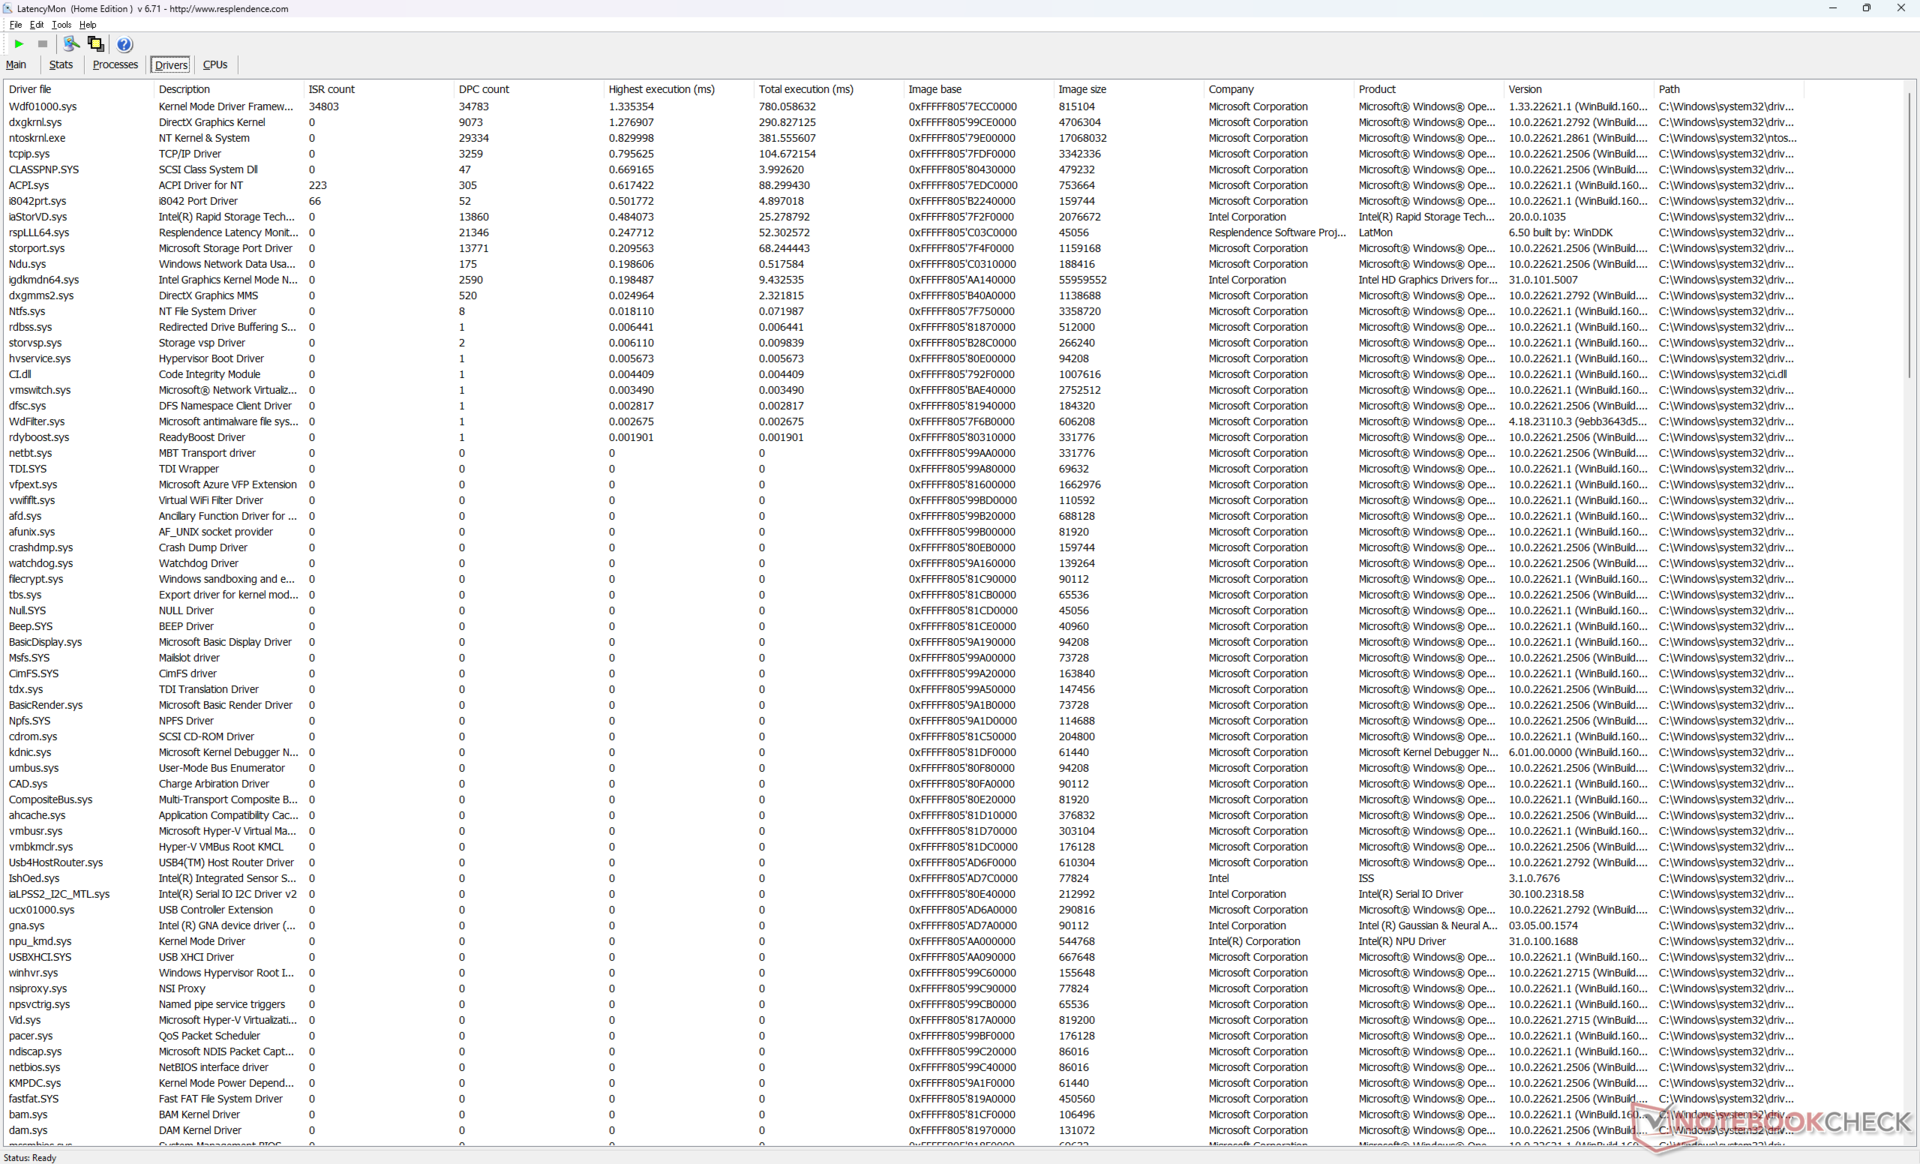
Latência DPC
O LatencyMon revela apenas pequenos problemas de DPC ao abrir várias guias do navegador em nossa página inicial. a reprodução de vídeo 4K a 60 FPS é quase perfeita, com apenas um quadro perdido registrado durante um vídeo de teste de 60 segundos.
| DPC Latencies / LatencyMon - interrupt to process latency (max), Web, Youtube, Prime95 | |
| LG Gram 2in1 16 16T90R - G.AA78G | |
| Asus VivoBook Pro 16 K6602VU | |
| MSI Prestige 15 A12UD-093 | |
| Lenovo ThinkBook 16 G6 ABP | |
| Dell Inspiron 16 Plus 7630 | |
| MSI Prestige 16 B1MG-001US | |
* ... menor é melhor
Dispositivos de armazenamento
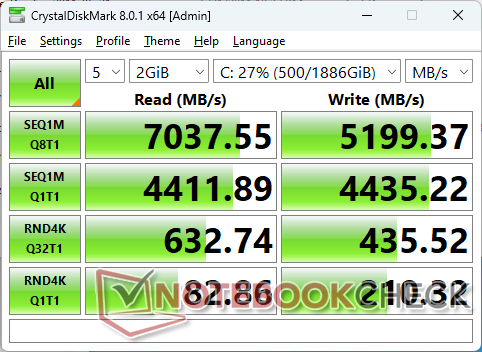
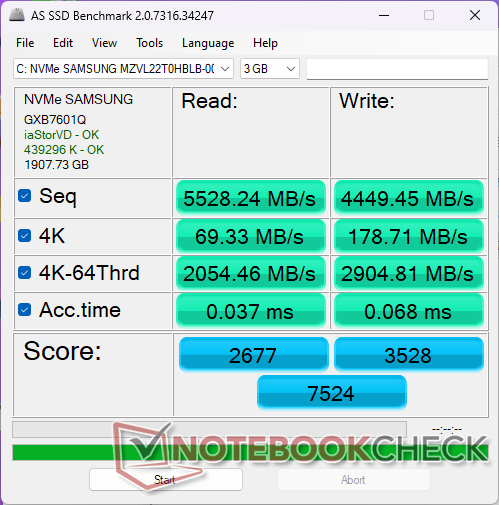
Nossa unidade vem equipada com um chip de 2 TB Samsung PM9A1 que é um dos SSDs NVMe PCIe4 x4 mais rápidos disponíveis para o consumidor e uma atualização do Micron 3400 do nosso antigo Prestige 15. A unidade é capaz de manter velocidades de ~7100 MB/s, mesmo sob pressão, o que é impressionante, considerando a espessura do chassi.

| Drive Performance rating - Percent | |
| MSI Prestige 16 B1MG-001US | |
| LG Gram 2in1 16 16T90R - G.AA78G | |
| MSI Prestige 15 A12UD-093 | |
| Dell Inspiron 16 Plus 7630 | |
| Lenovo ThinkBook 16 G6 ABP | |
| Asus VivoBook Pro 16 K6602VU | |
* ... menor é melhor
Disk Throttling: DiskSpd Read Loop, Queue Depth 8
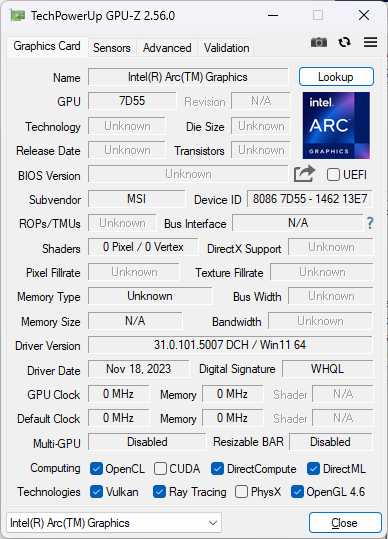
Desempenho da GPU - reconquistando a coroa dos gráficos integrados
Depois de uma estagnação nos últimos anos, a Intel finalmente reformulou sua GPU integrada para ser mais competitiva em relação à concorrente Radeon 680M e 780M da concorrência. os resultados do 3DMark colocam nossa Arc 8 à frente da Radeon 780M em cerca de 20% ou até 50% em títulos compatíveis com DX12. Os usuários que fazem o upgrade das placas de vídeo comuns Iris Xe 96 EUs devem esperar um aumento de desempenho bruto de cerca de 1,5x a 2x. Ainda não está no nível de uma GeForce RTX 3050 Ti, mas as pontuações estão definitivamente se aproximando de uma GeForce RTX 2050.
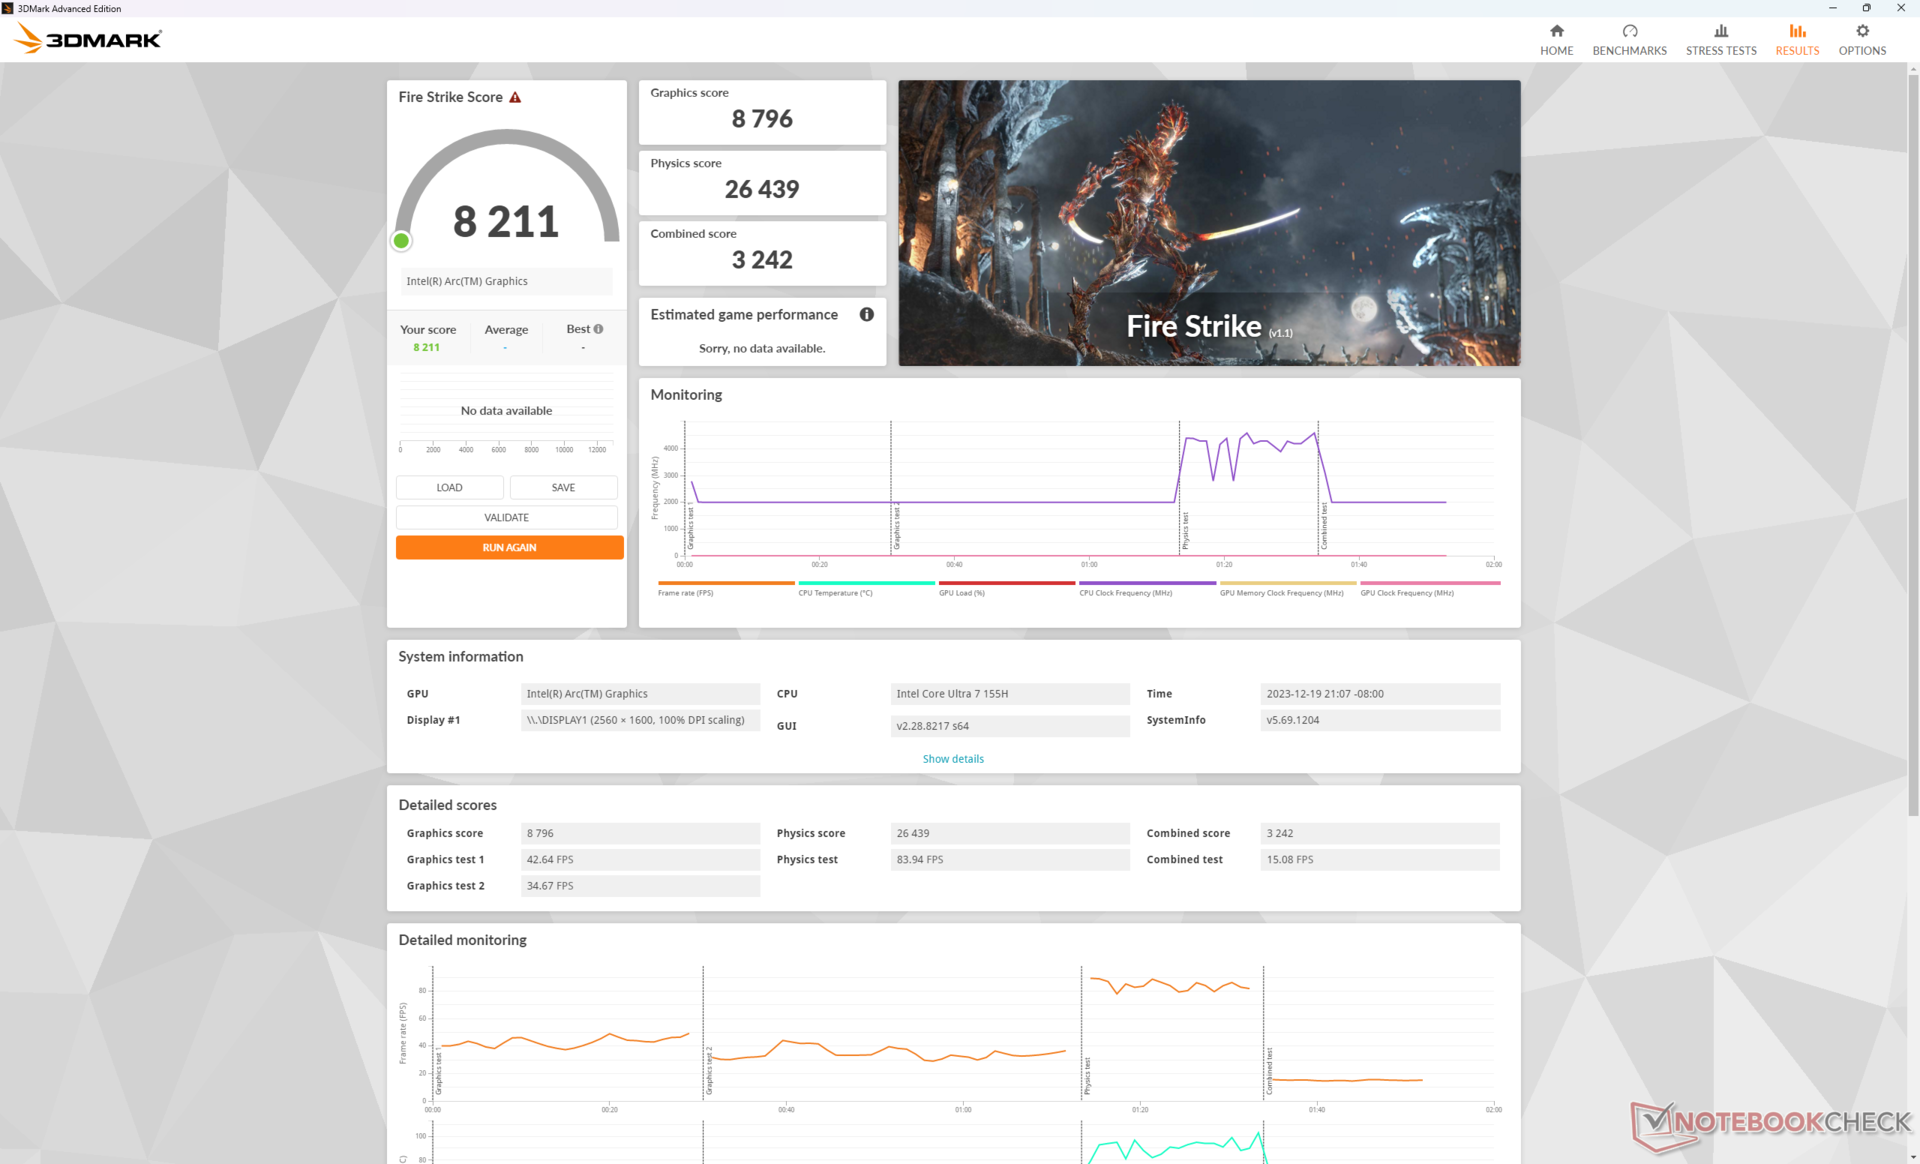
| Perfil de potência | Pontuação de física | Pontuação gráfica | Pontuação combinada |
| Desempenho extremo (Cooler Boost ativado) | 26439 | 8796 | 3242 |
| Desempenho extremo (Cooler Boost desligado) | 26460 (-0%) | 8614 (-2%) | 3187 (-2%) |
| Modo equilibrado | 25110 (-5%) | 8814 (-0%) | 3306 (-0%) |
| Modo de bateria | 21717 (-18%) | 7425 (-16%) | 2761 (-15%) |
A ativação do Cooler Boost não parece afetar significativamente o desempenho, de acordo com a tabela de resultados do site Fire Strike acima. A execução no modo Balanced afetaria o desempenho da CPU apenas ligeiramente, enquanto o modo Battery reduziria o desempenho de forma mais significativa em cerca de 15%.
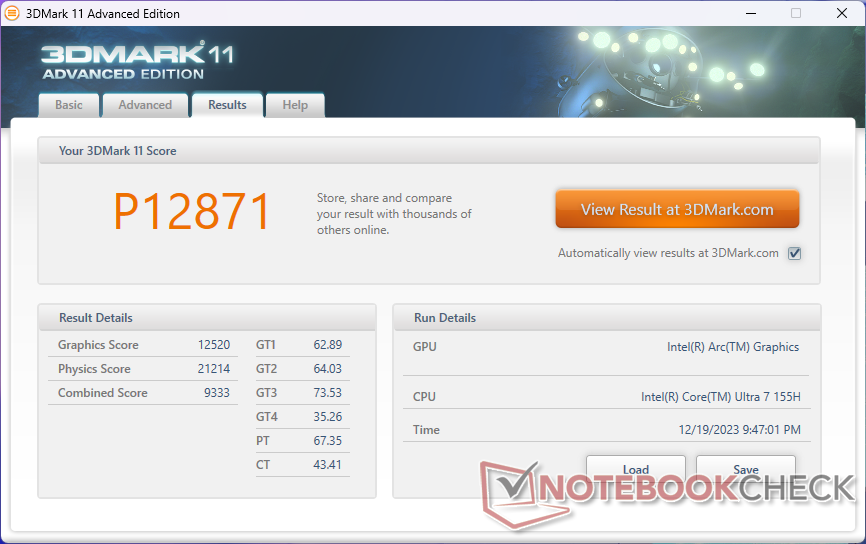
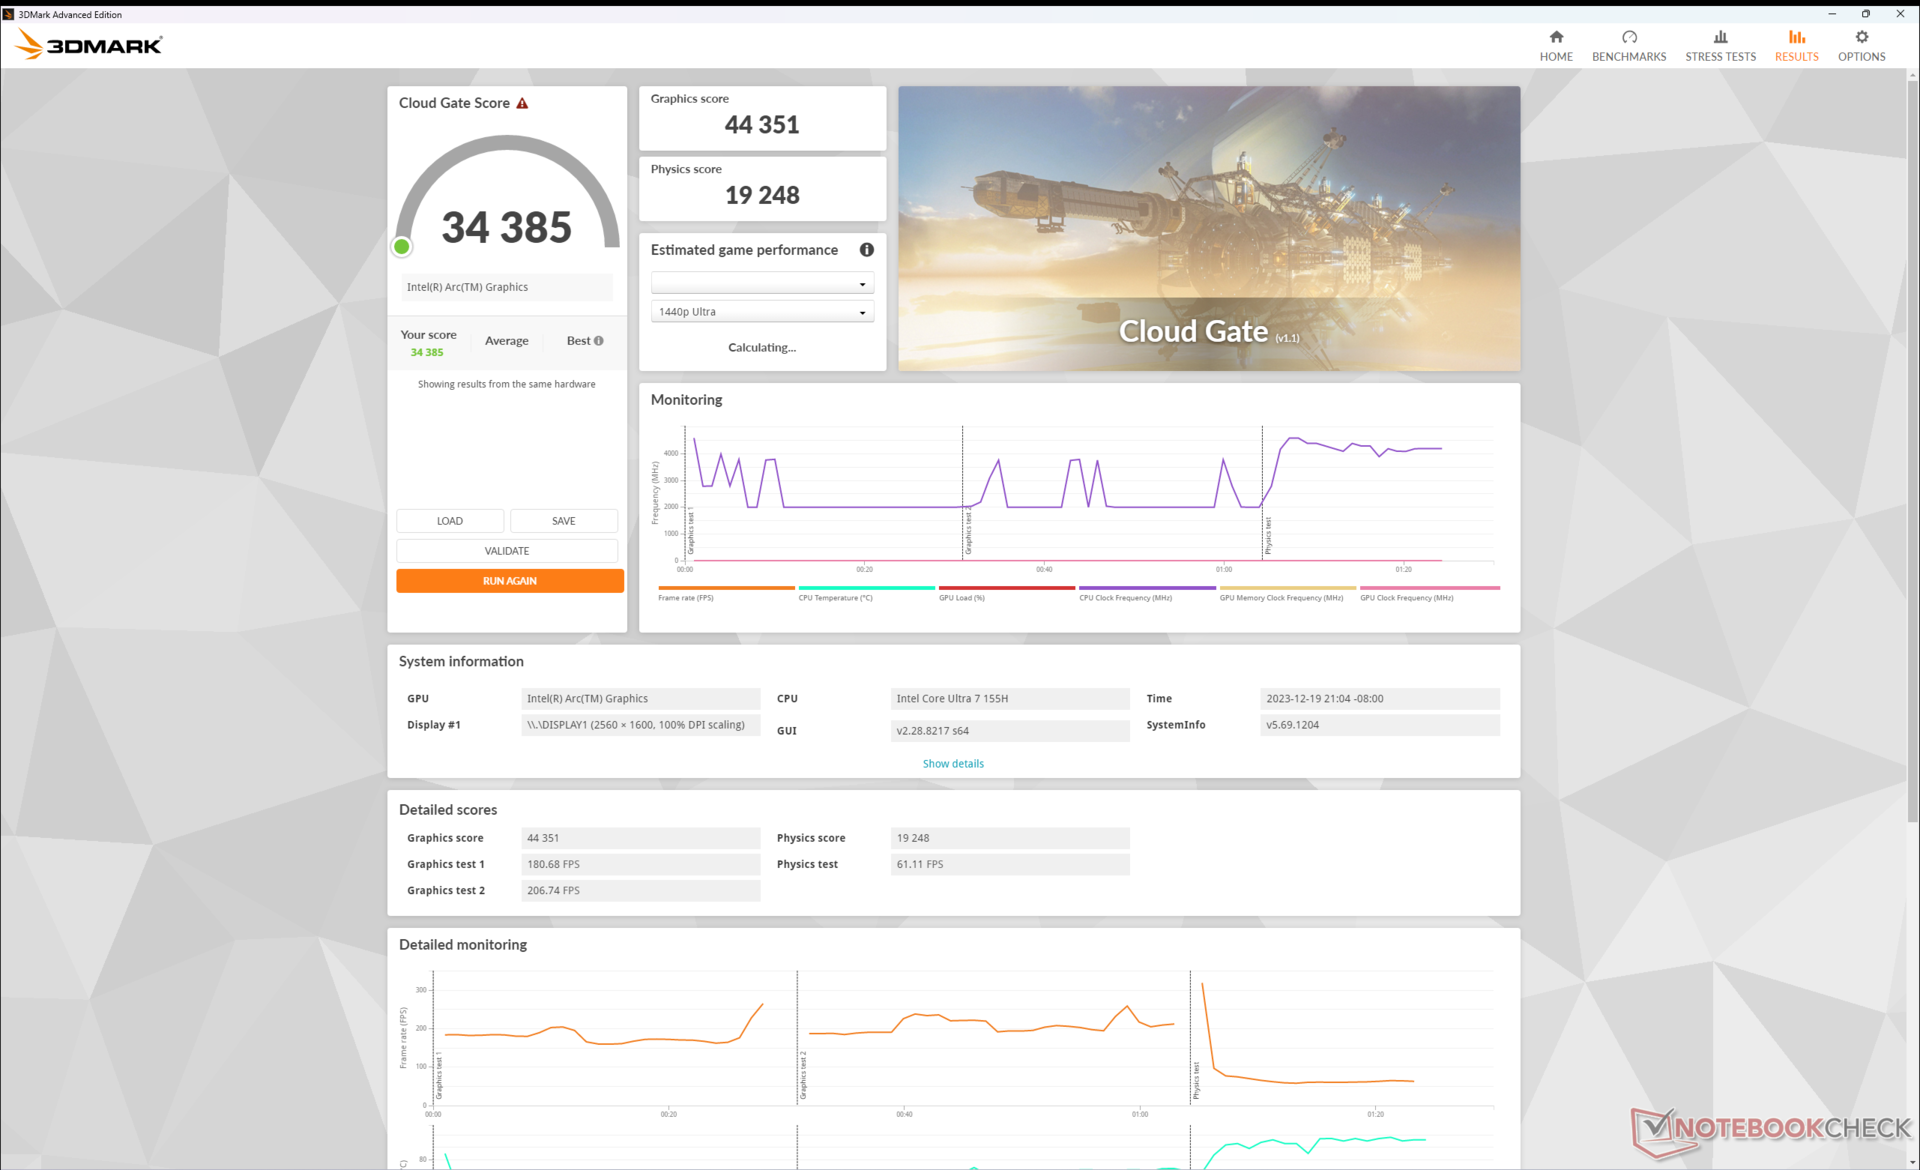
| 3DMark 11 Performance | 12871 pontos | |
| 3DMark Cloud Gate Standard Score | 34385 pontos | |
| 3DMark Fire Strike Score | 8211 pontos | |
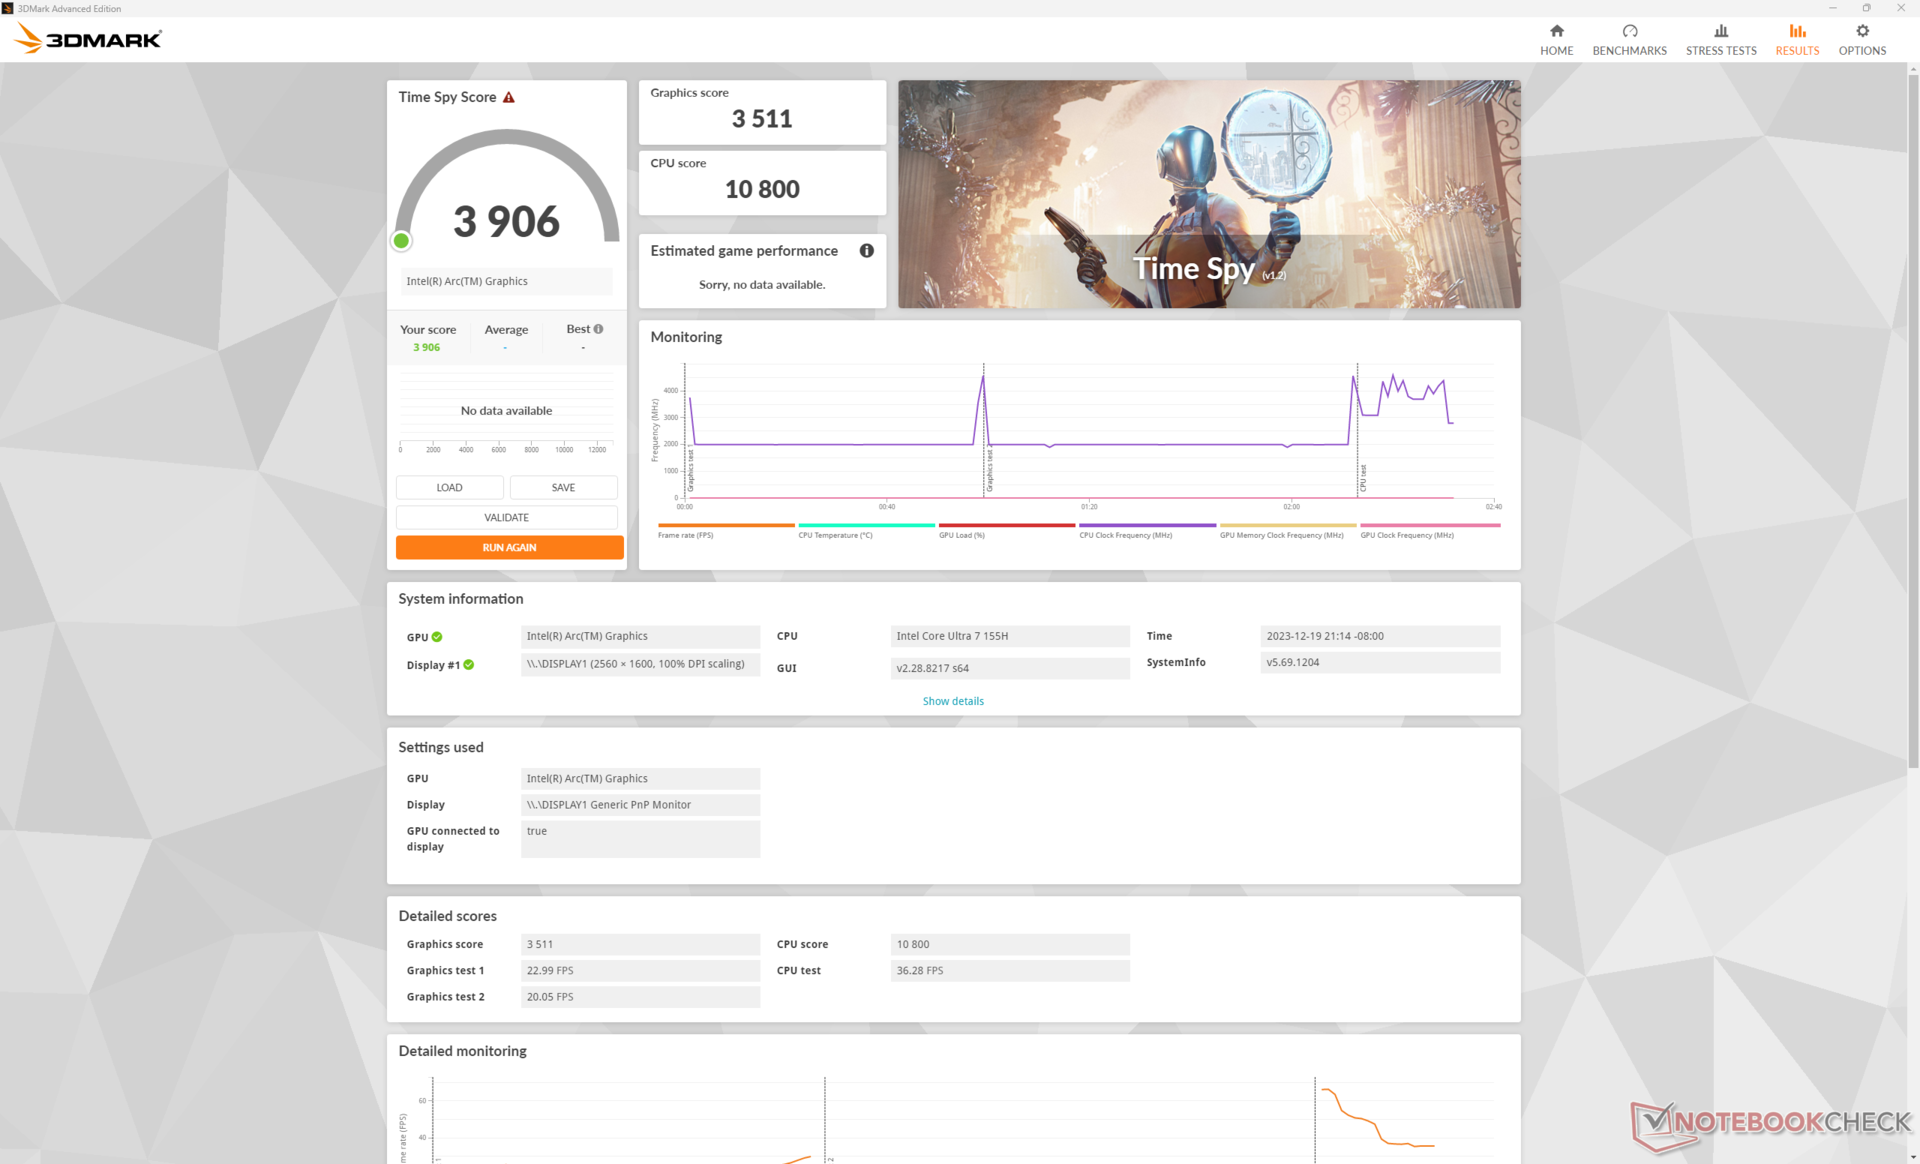
| 3DMark Time Spy Score | 3906 pontos | |
Ajuda | ||
* ... menor é melhor
Desempenho em jogos
O desempenho no mundo real ao rodar jogos é excelente, com resultados que rivalizam com a GeForce 3050 Ti no Prestige 15 do ano passado, conforme sugerido pelos resultados sintéticos de benchmark acima. O Far Cry 5 e o F1 22, por exemplo, têm um desempenho de apenas 5 a 15 por cento do Prestige 15. Lembre-se de que a GPU GeForce do Prestige 15 apresentava problemas de limitação notáveis que afetavam muito seu desempenho; a grande maioria dos outros notebooks GeForce RTX 3050 Ti, como o Asus Vivobook Pro 16Xainda executaria jogos significativamente mais rápido do que o nosso Arc 8 integrado.
No entanto, o desempenho geral é consistentemente melhor do que o da Radeon 780M em todos os jogos testados, em cerca de 5 a 20%. Alguns jogos DX12, como Tiny Tina's Wonderlands e F1 22, são executados até 50 a 60% melhor na nova GPU da Intel.
| The Witcher 3 - 1920x1080 Ultra Graphics & Postprocessing (HBAO+) | |
| Dell Inspiron 16 Plus 7630 | |
| Asus VivoBook Pro 16 K6602VU | |
| MSI Prestige 16 B1MG-001US | |
| MSI Prestige 15 A12UD-093 | |
| LG Gram 2in1 16 16T90R - G.AA78G | |
| Lenovo ThinkBook 16 G6 ABP | |
| GTA V - 1920x1080 Highest AA:4xMSAA + FX AF:16x | |
| Asus VivoBook Pro 16 K6602VU | |
| MSI Prestige 15 A12UD-093 | |
| Lenovo ThinkBook 16 G6 ABP | |
| LG Gram 2in1 16 16T90R - G.AA78G | |
| Final Fantasy XV Benchmark - 1920x1080 High Quality | |
| Dell Inspiron 16 Plus 7630 | |
| Asus VivoBook Pro 16 K6602VU | |
| MSI Prestige 16 B1MG-001US | |
| MSI Prestige 15 A12UD-093 | |
| LG Gram 2in1 16 16T90R - G.AA78G | |
| Lenovo ThinkBook 16 G6 ABP | |
| Strange Brigade - 1920x1080 ultra AA:ultra AF:16 | |
| Dell Inspiron 16 Plus 7630 | |
| Asus VivoBook Pro 16 K6602VU | |
| MSI Prestige 16 B1MG-001US | |
| MSI Prestige 15 A12UD-093 | |
| LG Gram 2in1 16 16T90R - G.AA78G | |
| Lenovo ThinkBook 16 G6 ABP | |
| Dota 2 Reborn - 1920x1080 ultra (3/3) best looking | |
| Dell Inspiron 16 Plus 7630 | |
| Asus VivoBook Pro 16 K6602VU | |
| MSI Prestige 16 B1MG-001US | |
| MSI Prestige 15 A12UD-093 | |
| LG Gram 2in1 16 16T90R - G.AA78G | |
| Lenovo ThinkBook 16 G6 ABP | |
| X-Plane 11.11 - 1920x1080 high (fps_test=3) | |
| Dell Inspiron 16 Plus 7630 | |
| Asus VivoBook Pro 16 K6602VU | |
| MSI Prestige 15 A12UD-093 | |
| LG Gram 2in1 16 16T90R - G.AA78G | |
| MSI Prestige 16 B1MG-001US | |
| Lenovo ThinkBook 16 G6 ABP | |
| Baldur's Gate 3 | |
| 1280x720 Low Preset AA:SM | |
| MSI Prestige 16 B1MG-001US | |
| Média Intel Arc 8-Core iGPU (31.8 - 57.6, n=15) | |
| 1920x1080 Low Preset AA:SM | |
| MSI Prestige 16 B1MG-001US | |
| Média Intel Arc 8-Core iGPU (21 - 40.3, n=27) | |
| 1920x1080 Medium Preset AA:T | |
| MSI Prestige 16 B1MG-001US | |
| Média Intel Arc 8-Core iGPU (16.3 - 31.1, n=28) | |
| 1920x1080 High Preset AA:T | |
| MSI Prestige 16 B1MG-001US | |
| Média Intel Arc 8-Core iGPU (15.4 - 27.7, n=27) | |
| 1920x1080 Ultra Preset AA:T | |
| MSI Prestige 16 B1MG-001US | |
| Média Intel Arc 8-Core iGPU (14.2 - 26.2, n=26) | |
| Cyberpunk 2077 | |
| 1280x720 Low Preset (FSR off) | |
| MSI Prestige 16 B1MG-001US | |
| Média Intel Arc 8-Core iGPU (34.5 - 58, n=20) | |
| LG Gram 2in1 16 16T90R - G.AA78G | |
| 1920x1080 Low Preset (FSR off) | |
| MSI Prestige 16 B1MG-001US | |
| Média Intel Arc 8-Core iGPU (11.3 - 38, n=38) | |
| LG Gram 2in1 16 16T90R - G.AA78G | |
| 1920x1080 Medium Preset (FSR off) | |
| MSI Prestige 16 B1MG-001US | |
| Média Intel Arc 8-Core iGPU (9.42 - 31.4, n=36) | |
| LG Gram 2in1 16 16T90R - G.AA78G | |
| 1920x1080 High Preset (FSR off) | |
| MSI Prestige 16 B1MG-001US | |
| Média Intel Arc 8-Core iGPU (7.3 - 27.6, n=36) | |
| LG Gram 2in1 16 16T90R - G.AA78G | |
| 1920x1080 Ultra Preset (FSR off) | |
| MSI Prestige 16 B1MG-001US | |
| Média Intel Arc 8-Core iGPU (13 - 24.7, n=28) | |
| LG Gram 2in1 16 16T90R - G.AA78G | |
Witcher 3 FPS Chart
| baixo | média | alto | ultra | |
|---|---|---|---|---|
| The Witcher 3 (2015) | 135.6 | 88.2 | 54.1 | 25.2 |
| Dota 2 Reborn (2015) | 101.7 | 92.8 | 79.1 | 75.6 |
| Final Fantasy XV Benchmark (2018) | 61 | 37.3 | 24.6 | |
| X-Plane 11.11 (2018) | 52.2 | 46.7 | 37.8 | |
| Far Cry 5 (2018) | 63 | 39 | 36 | 34 |
| Strange Brigade (2018) | 179.5 | 71 | 57.8 | 46.1 |
| Tiny Tina's Wonderlands (2022) | 53.3 | 41.2 | 30.1 | 25.1 |
| F1 22 (2022) | 77.7 | 71.6 | 53.3 | 15.3 |
| Baldur's Gate 3 (2023) | 31.9 | 28.2 | 24.1 | 23.4 |
| Cyberpunk 2077 (2023) | 35.7 | 29.5 | 25.2 | 22.1 |
Emissões - altas para um laptop com gráficos integrados
Ruído do sistema
O ruído do ventilador é mais silencioso do que o do Prestige 15 o ruído da ventoinha é mais silencioso do que o do Prestige 15 ao operar com cargas mais baixas, enquanto o oposto é verdadeiro ao operar com cargas mais altas. Ao navegar ou fazer streaming de vídeo, por exemplo, o ruído da ventoinha tende a variar entre 26 e 37 dB(A), em comparação com 31 a 42 dB(A) no modelo mais antigo. A execução de cargas exigentes, como Witcher 3 aumentaria o ruído da ventoinha para 46 dB(A) ou até mesmo para 53 dB(A) se o Cooler Boost estiver ativo. A faixa média de 40 dB(A) é bastante alta para um laptop que funciona apenas com gráficos integrados.
Esperamos que o ruído da ventoinha em SKUs com gráficos discretos se comporte de forma diferente do que experimentamos em nossa unidade de teste iGPU.
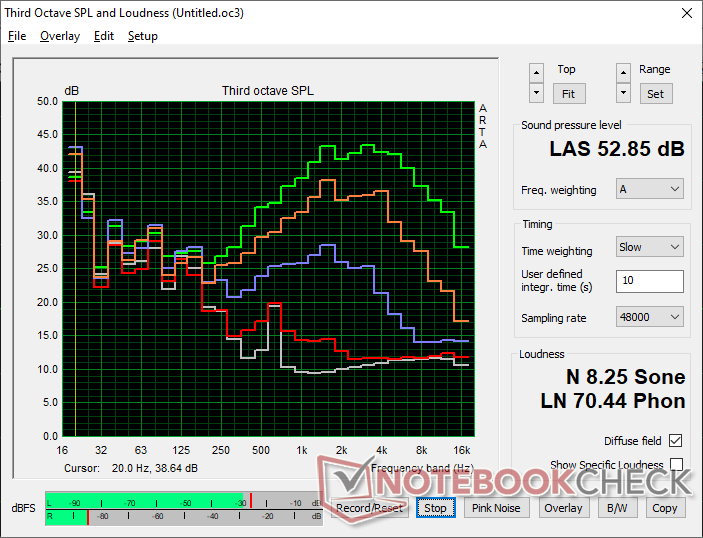
Barulho
| Ocioso |
| 24.5 / 26.3 / 26.3 dB |
| Carga |
| 36.5 / 52.9 dB |
 | ||
30 dB silencioso 40 dB(A) audível 50 dB(A) ruidosamente alto |
||
min: | ||
| MSI Prestige 16 B1MG-001US Arc 8-Core, Ultra 7 155H, Samsung PM9A1 MZVL22T0HBLB | MSI Prestige 15 A12UD-093 GeForce RTX 3050 Ti Laptop GPU, i7-1280P, Micron 3400 1TB MTFDKBA1T0TFH | LG Gram 2in1 16 16T90R - G.AA78G Iris Xe G7 96EUs, i7-1360P, Samsung PM9A1 MZVL21T0HCLR | Lenovo ThinkBook 16 G6 ABP Vega 7, R5 7530U, SK hynix HFS512GEJ9X125N | Asus VivoBook Pro 16 K6602VU GeForce RTX 4050 Laptop GPU, i9-13900H, Micron 2400 MTFDKBA1T0QFM | Dell Inspiron 16 Plus 7630 GeForce RTX 4060 Laptop GPU, i7-13700H, WD PC SN740 SDDPTQD-1T00 | |
|---|---|---|---|---|---|---|
| Noise | -6% | 8% | 13% | -4% | 4% | |
| desligado / ambiente * (dB) | 24.5 | 26 -6% | 25.1 -2% | 24.3 1% | 20.96 14% | 23.2 5% |
| Idle Minimum * (dB) | 24.5 | 26 -6% | 25.1 -2% | 24.3 1% | 25.28 -3% | 23.2 5% |
| Idle Average * (dB) | 26.3 | 30.7 -17% | 25.1 5% | 24.3 8% | 25.28 4% | 23.2 12% |
| Idle Maximum * (dB) | 26.3 | 30.7 -17% | 26.1 1% | 24.3 8% | 25.28 4% | 23.2 12% |
| Load Average * (dB) | 36.5 | 41.9 -15% | 31.4 14% | 29.7 19% | 51.88 -42% | 35.1 4% |
| Witcher 3 ultra * (dB) | 46.3 | 41.1 11% | 32.1 31% | 49 -6% | 52.5 -13% | |
| Load Maximum * (dB) | 52.9 | 40.7 23% | 36.6 31% | 41.4 22% | 51.8 2% | 52.5 1% |
* ... menor é melhor
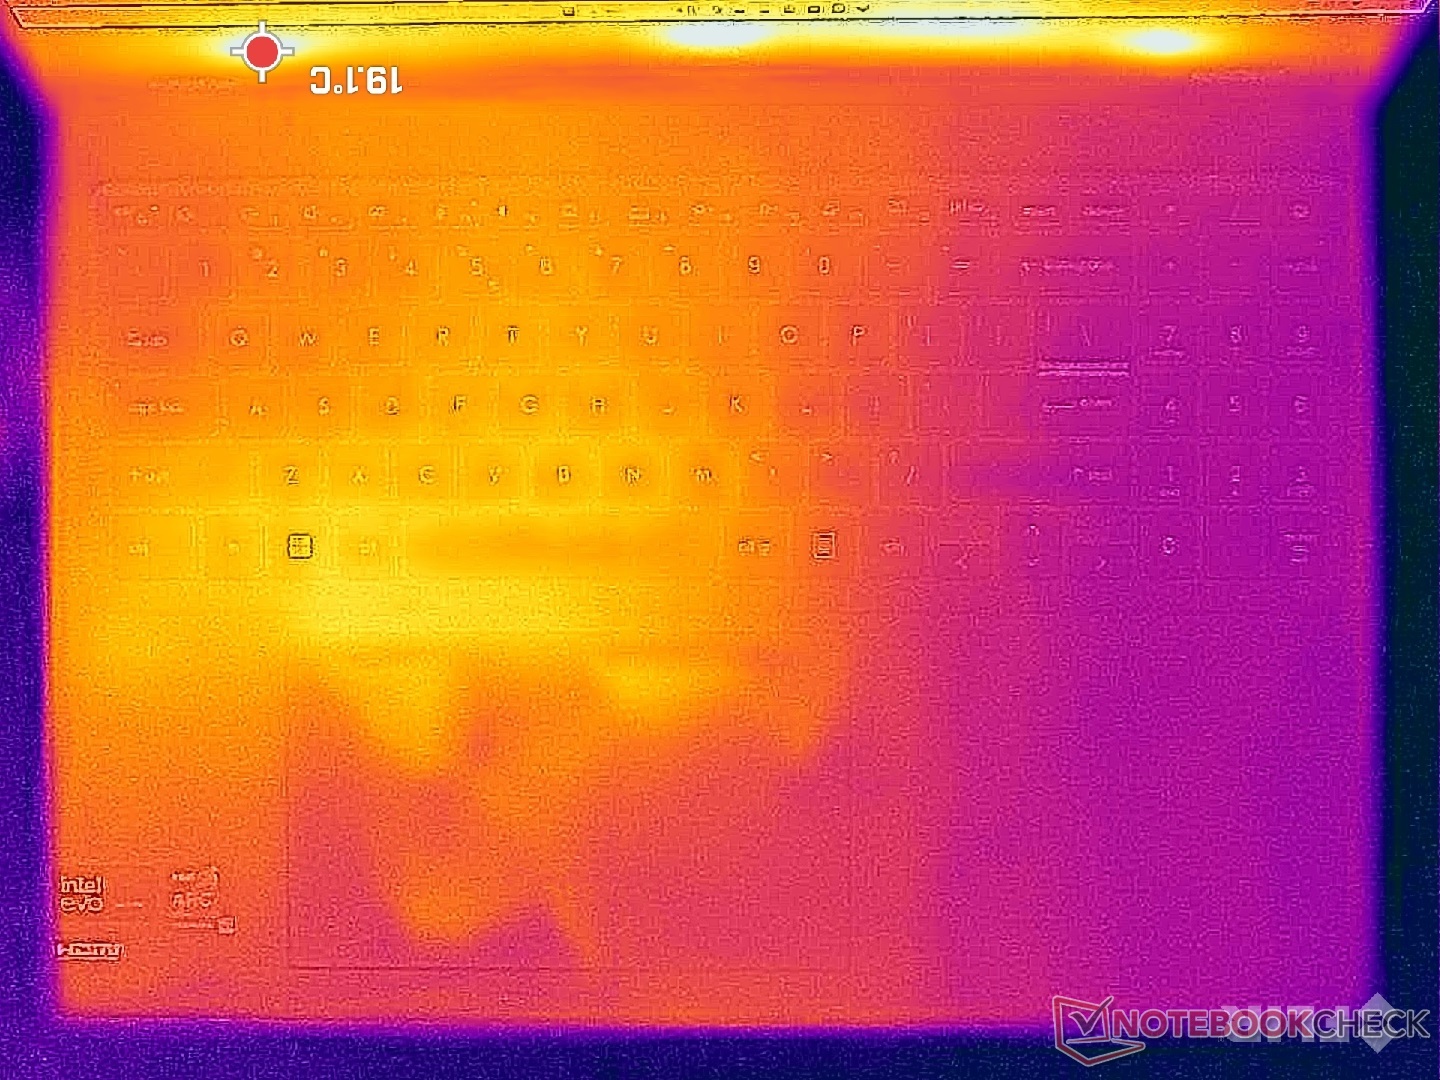
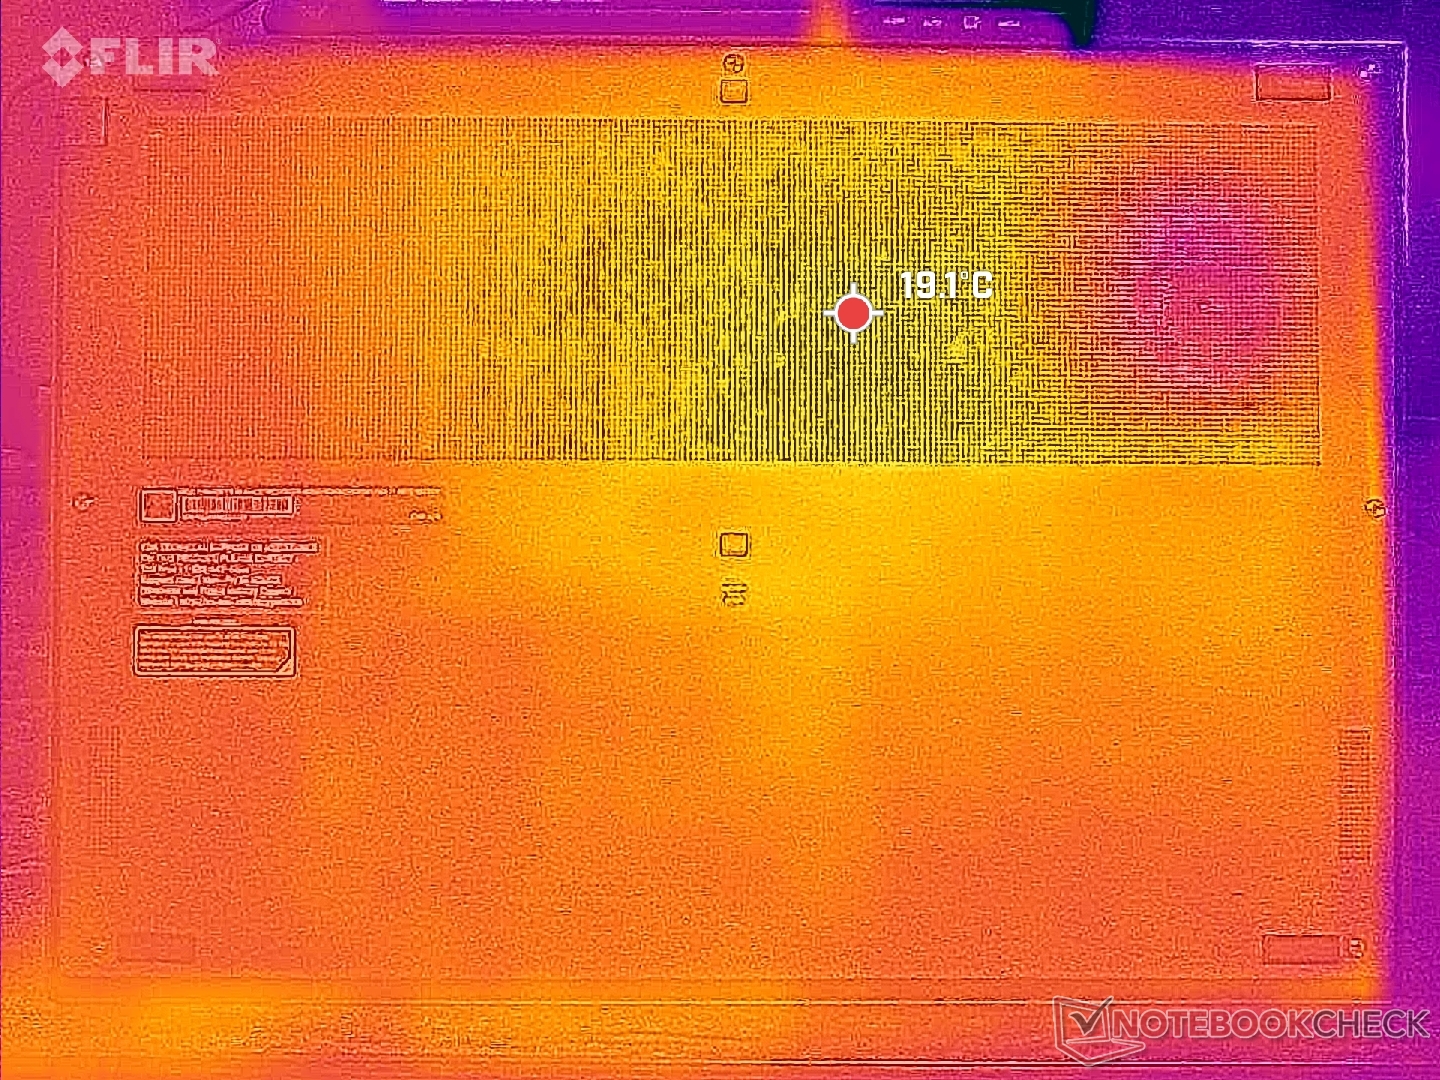
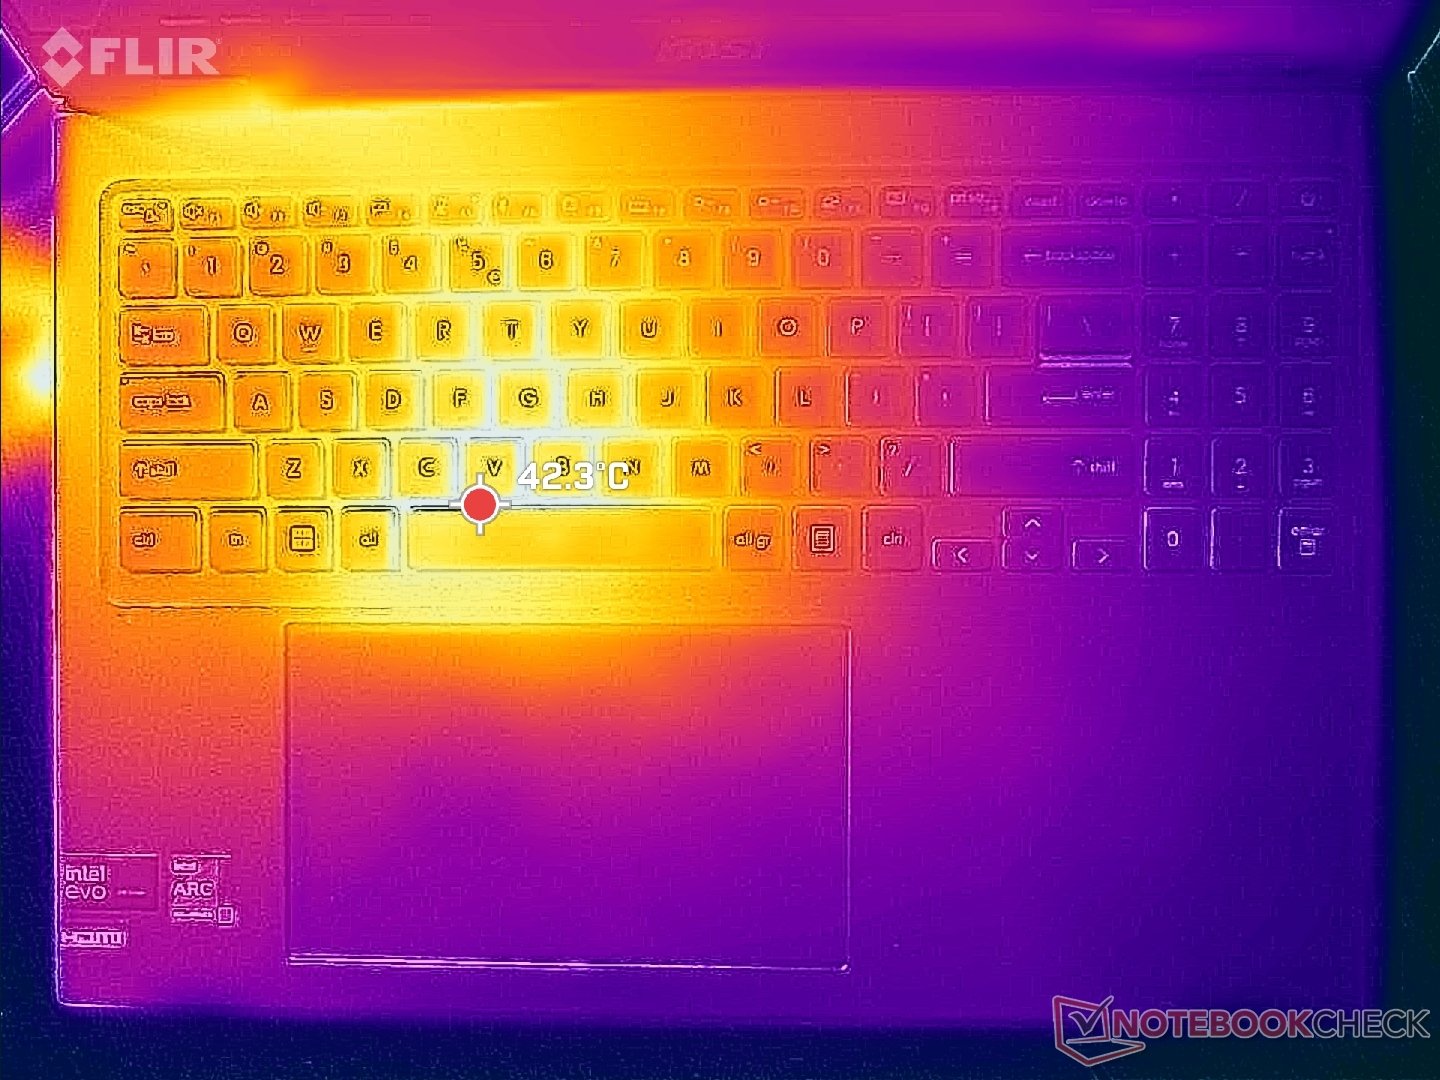
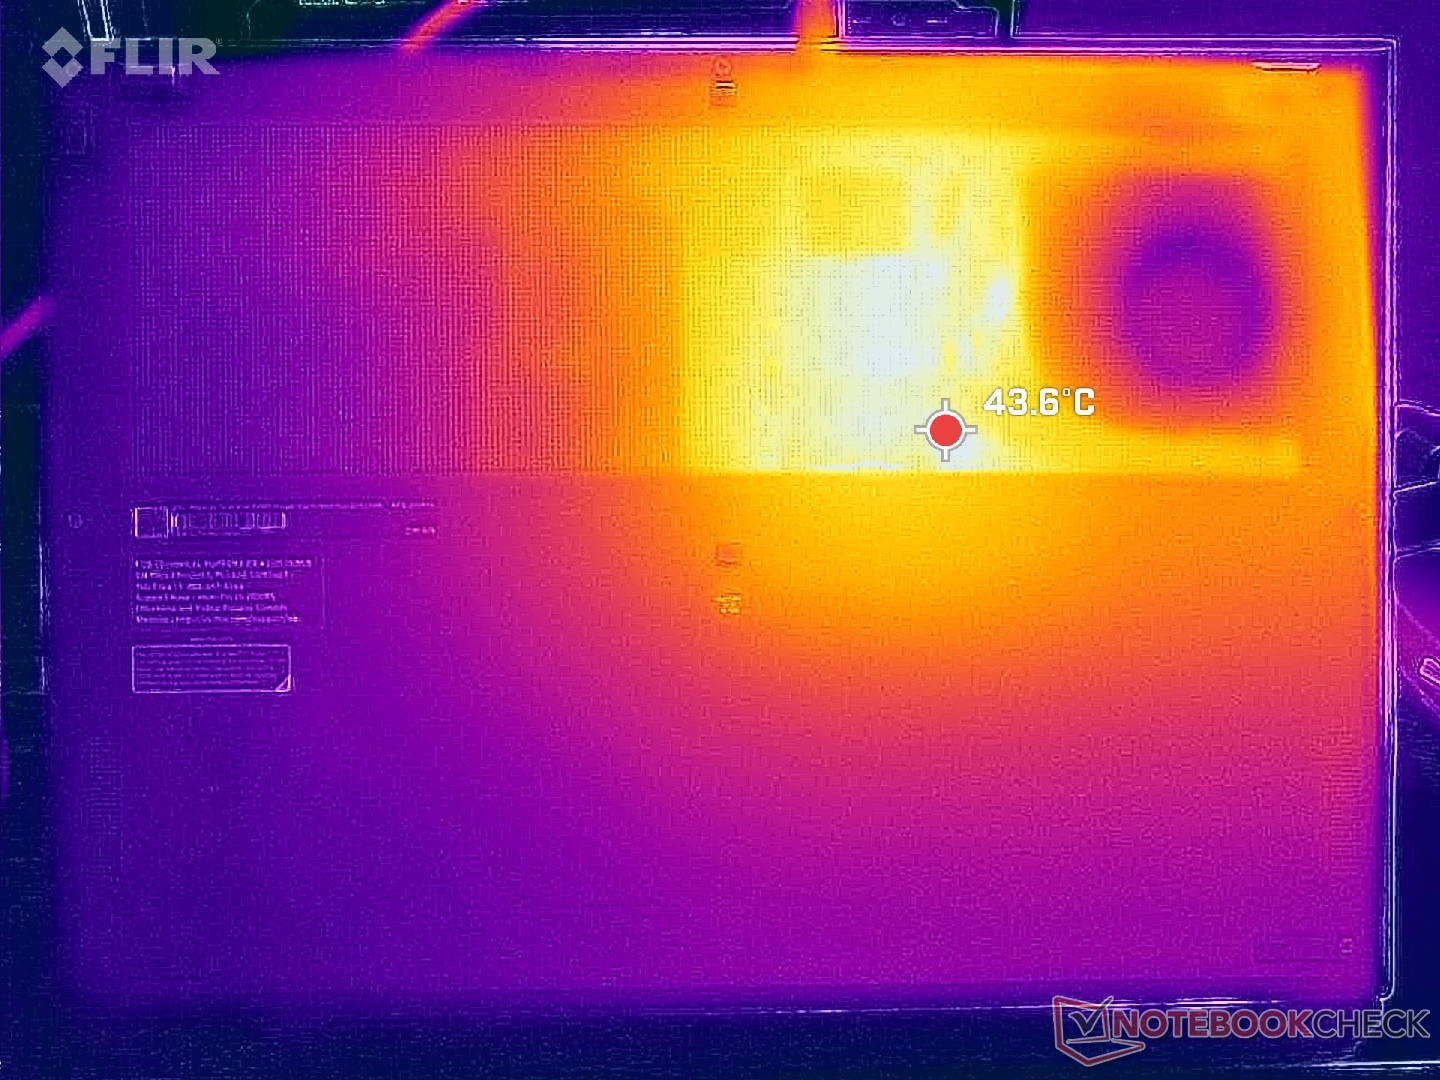
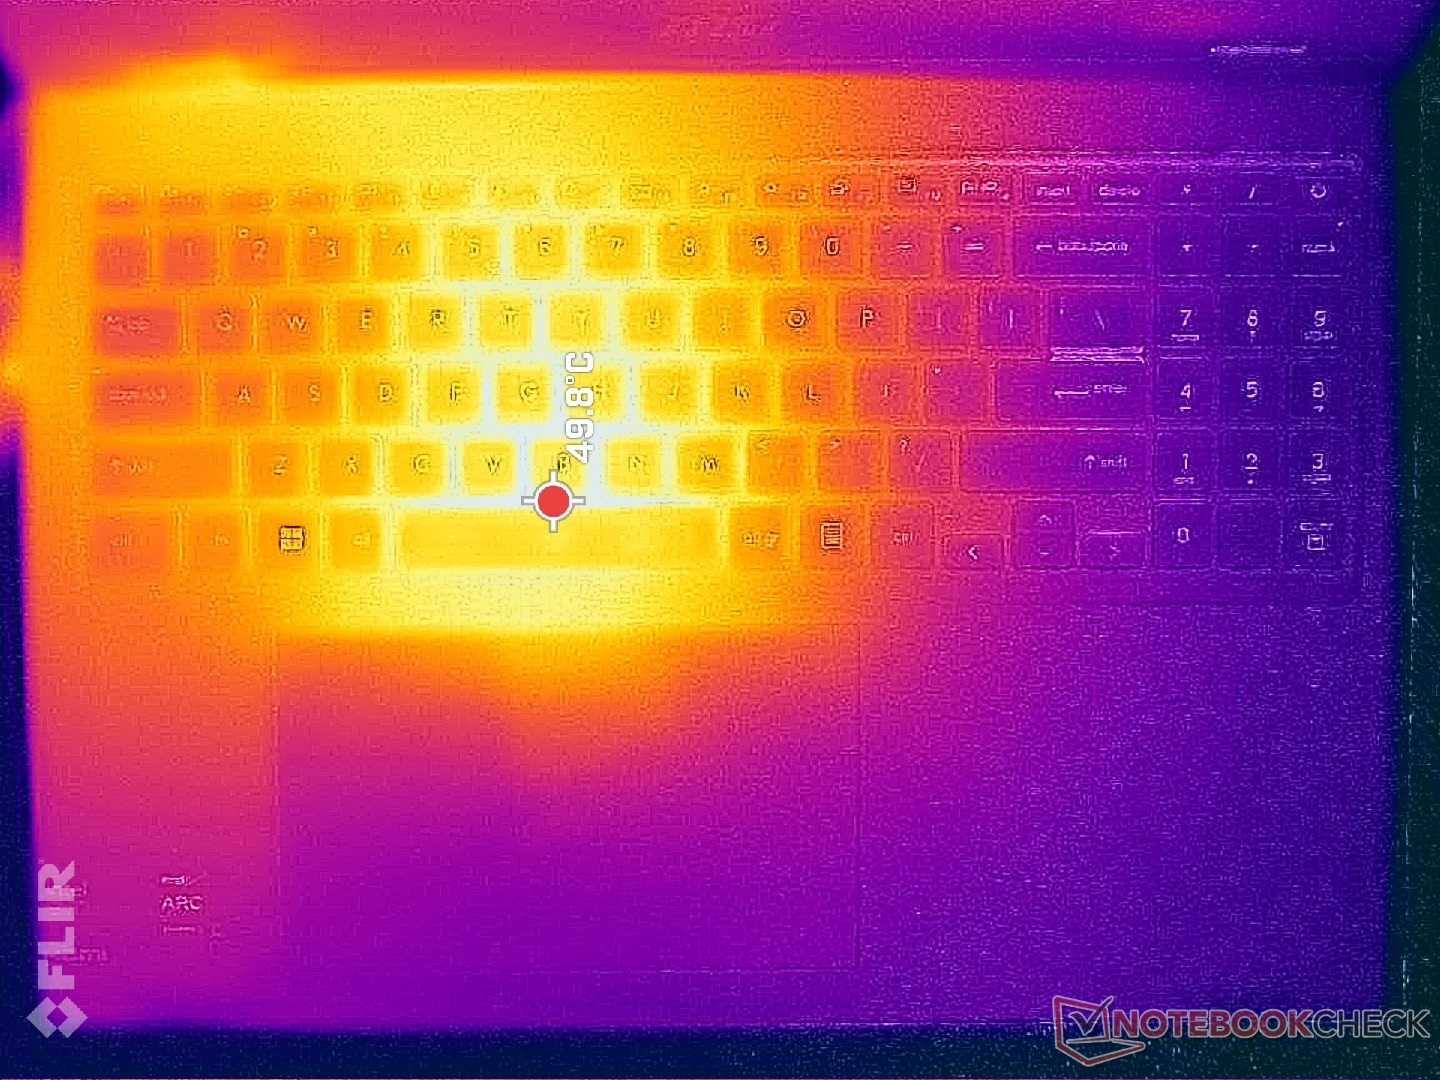
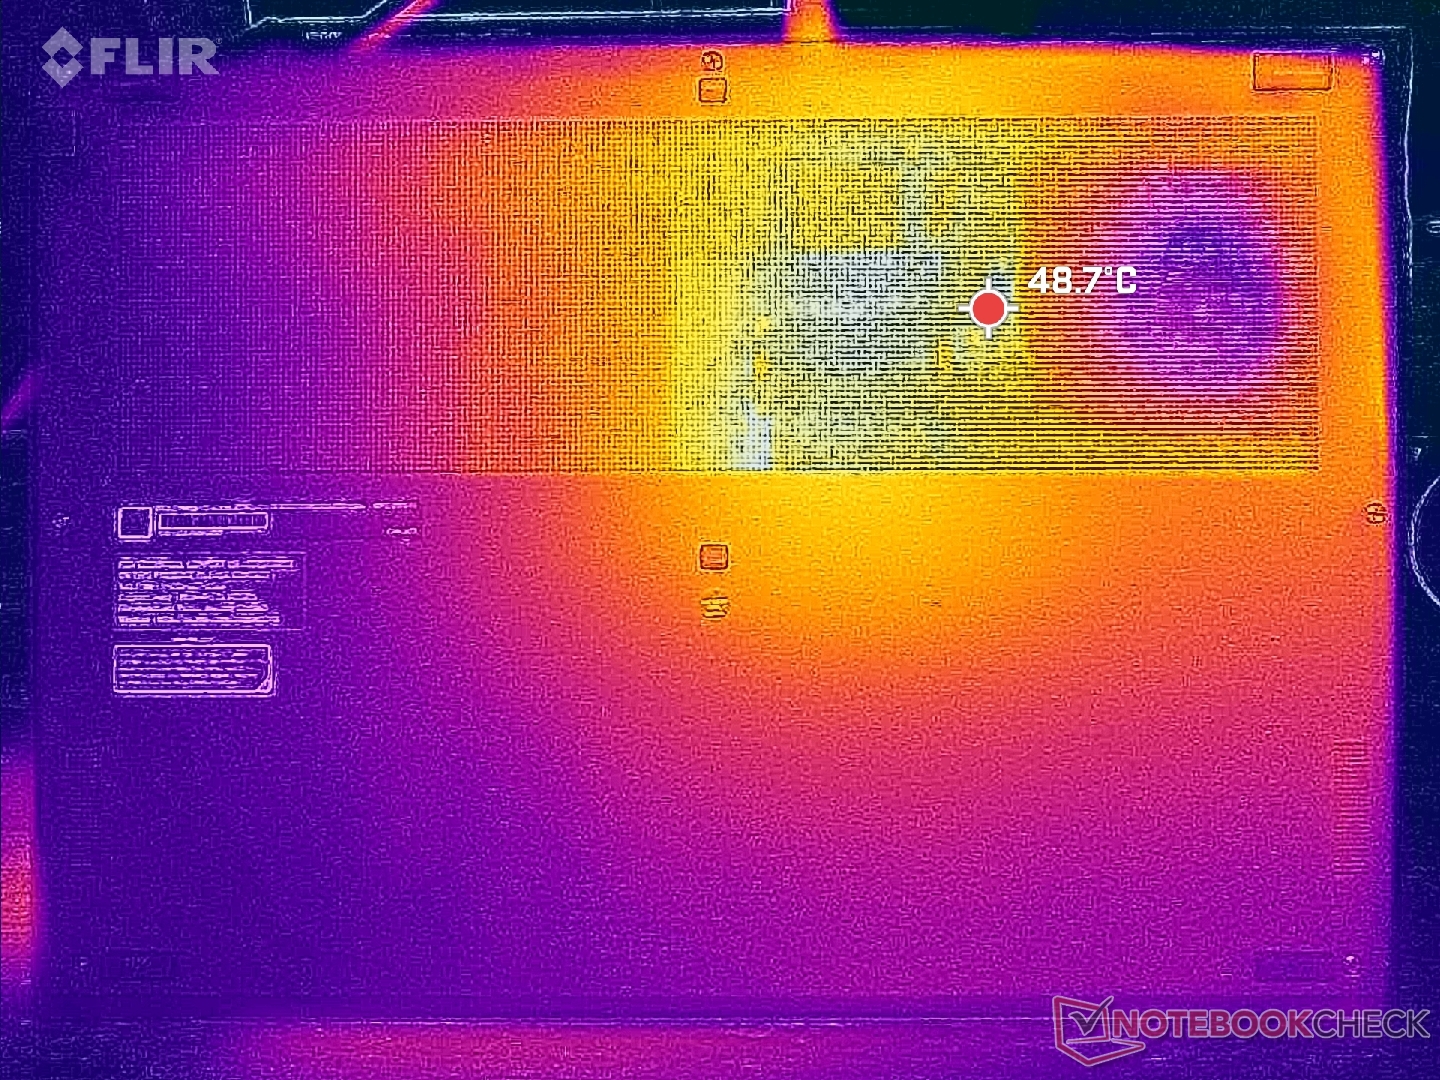
Temperatura
As temperaturas da superfície são mais altas na metade esquerda do laptop do que na direita devido ao posicionamento da CPU e da solução de resfriamento. O ponto quente próximo à tecla Space pode atingir até 50 °C ao executar cargas exigentes, o que é semelhante ao ponto quente do Prestige 15 do ano passado com a GPU dedicada GeForce RTX. Como resultado, as teclas WASD podem ficar bastante quentes durante os jogos, mas os apoios para as mãos e as teclas de seta permaneceriam muito mais frios. Os notebooks Prestige geralmente são mais quentes do que a média dos Ultrabooks sob carga devido a seus designs compactos e o Prestige 16 não é exceção.
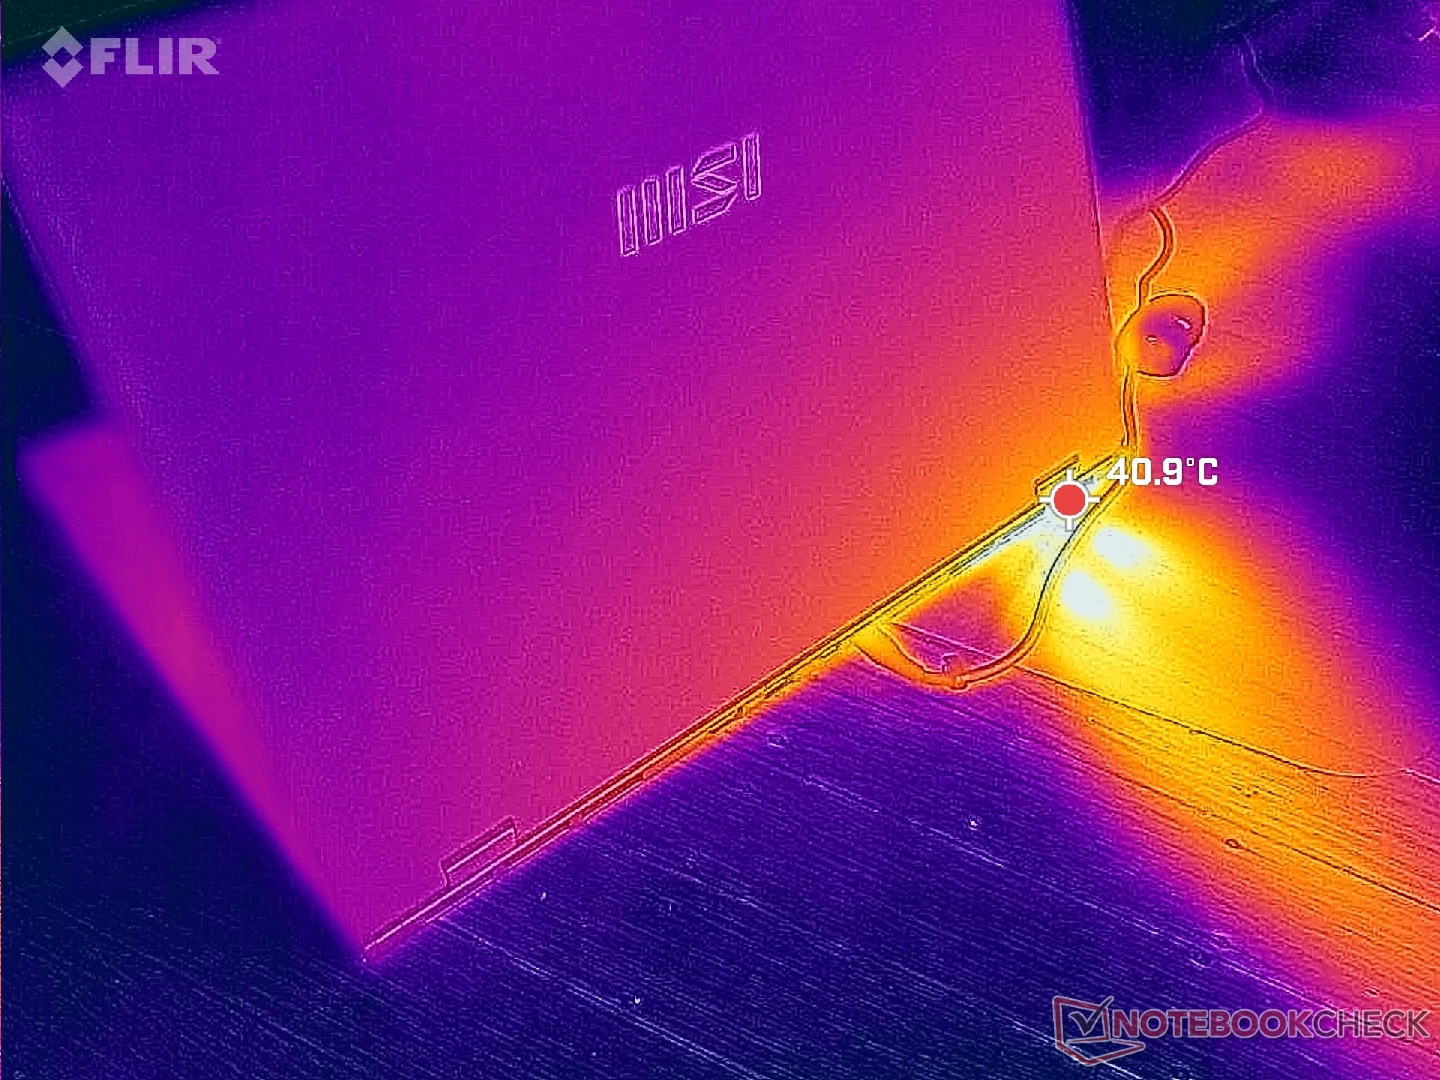
(-) A temperatura máxima no lado superior é 48.8 °C / 120 F, em comparação com a média de 36.8 °C / 98 F , variando de 21 a 71 °C para a classe Multimedia.
(-) A parte inferior aquece até um máximo de 47.6 °C / 118 F, em comparação com a média de 39.1 °C / 102 F
(+) Em uso inativo, a temperatura média para o lado superior é 23 °C / 73 F, em comparação com a média do dispositivo de 31.3 °C / ### class_avg_f### F.
(±) Jogando The Witcher 3, a temperatura média para o lado superior é 33.3 °C / 92 F, em comparação com a média do dispositivo de 31.3 °C / ## #class_avg_f### F.
(+) Os apoios para as mãos e o touchpad são mais frios que a temperatura da pele, com um máximo de 30 °C / 86 F e, portanto, são frios ao toque.
(±) A temperatura média da área do apoio para as mãos de dispositivos semelhantes foi 28.7 °C / 83.7 F (-1.3 °C / -2.3 F).
| MSI Prestige 16 B1MG-001US Intel Core Ultra 7 155H, Intel Arc 8-Core iGPU | MSI Prestige 15 A12UD-093 Intel Core i7-1280P, NVIDIA GeForce RTX 3050 Ti Laptop GPU | LG Gram 2in1 16 16T90R - G.AA78G Intel Core i7-1360P, Intel Iris Xe Graphics G7 96EUs | Lenovo ThinkBook 16 G6 ABP AMD Ryzen 5 7530U, AMD Radeon RX Vega 7 | Asus VivoBook Pro 16 K6602VU Intel Core i9-13900H, NVIDIA GeForce RTX 4050 Laptop GPU | Dell Inspiron 16 Plus 7630 Intel Core i7-13700H, NVIDIA GeForce RTX 4060 Laptop GPU | |
|---|---|---|---|---|---|---|
| Heat | -16% | -25% | -15% | -30% | -20% | |
| Maximum Upper Side * (°C) | 48.8 | 49 -0% | 55 -13% | 40.8 16% | 42.6 13% | 47.8 2% |
| Maximum Bottom * (°C) | 47.6 | 52.6 -11% | 55.4 -16% | 50.5 -6% | 48.4 -2% | 42.2 11% |
| Idle Upper Side * (°C) | 24.2 | 29.7 -23% | 34.9 -44% | 29.3 -21% | 39.4 -63% | 35.2 -45% |
| Idle Bottom * (°C) | 23.6 | 30.7 -30% | 30 -27% | 35.2 -49% | 39.8 -69% | 35 -48% |
* ... menor é melhor
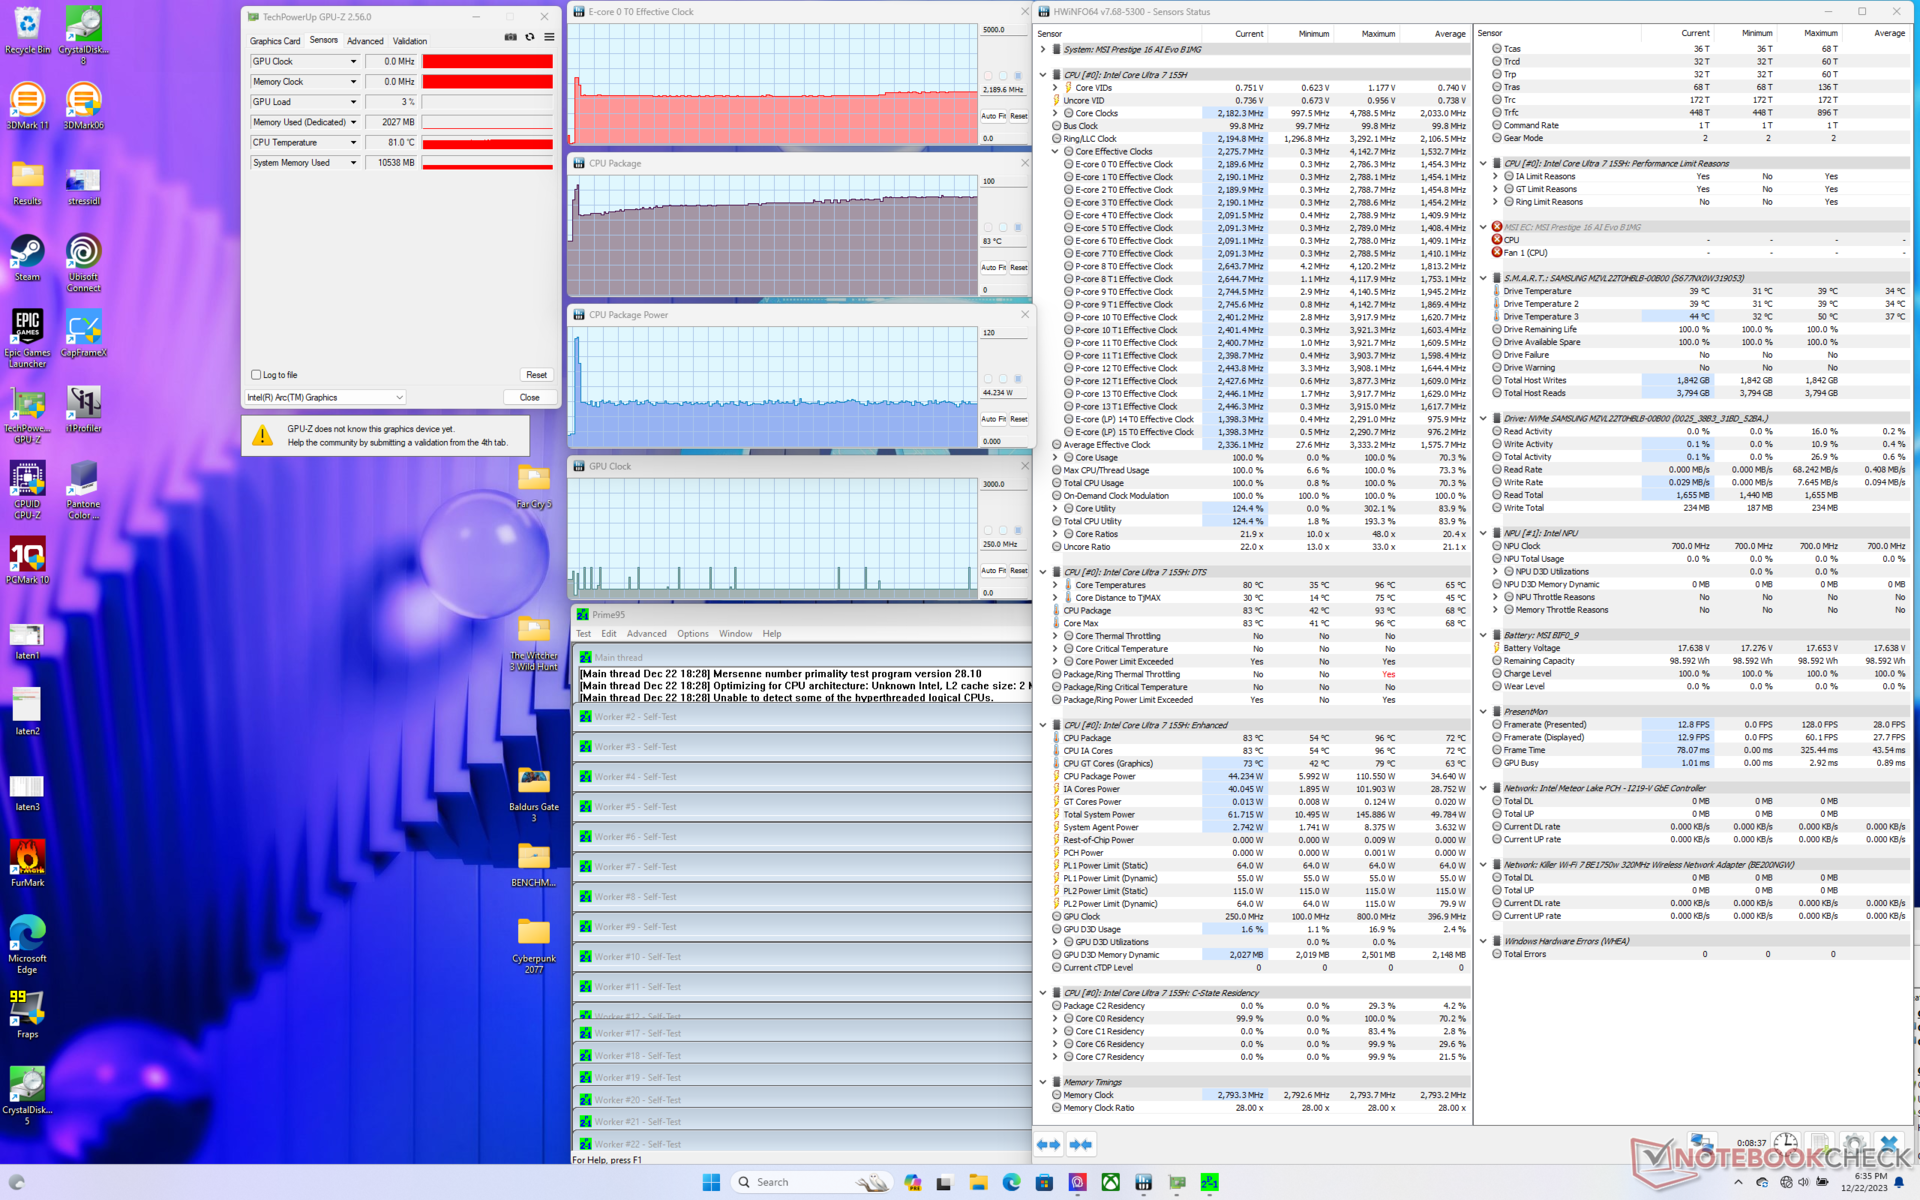
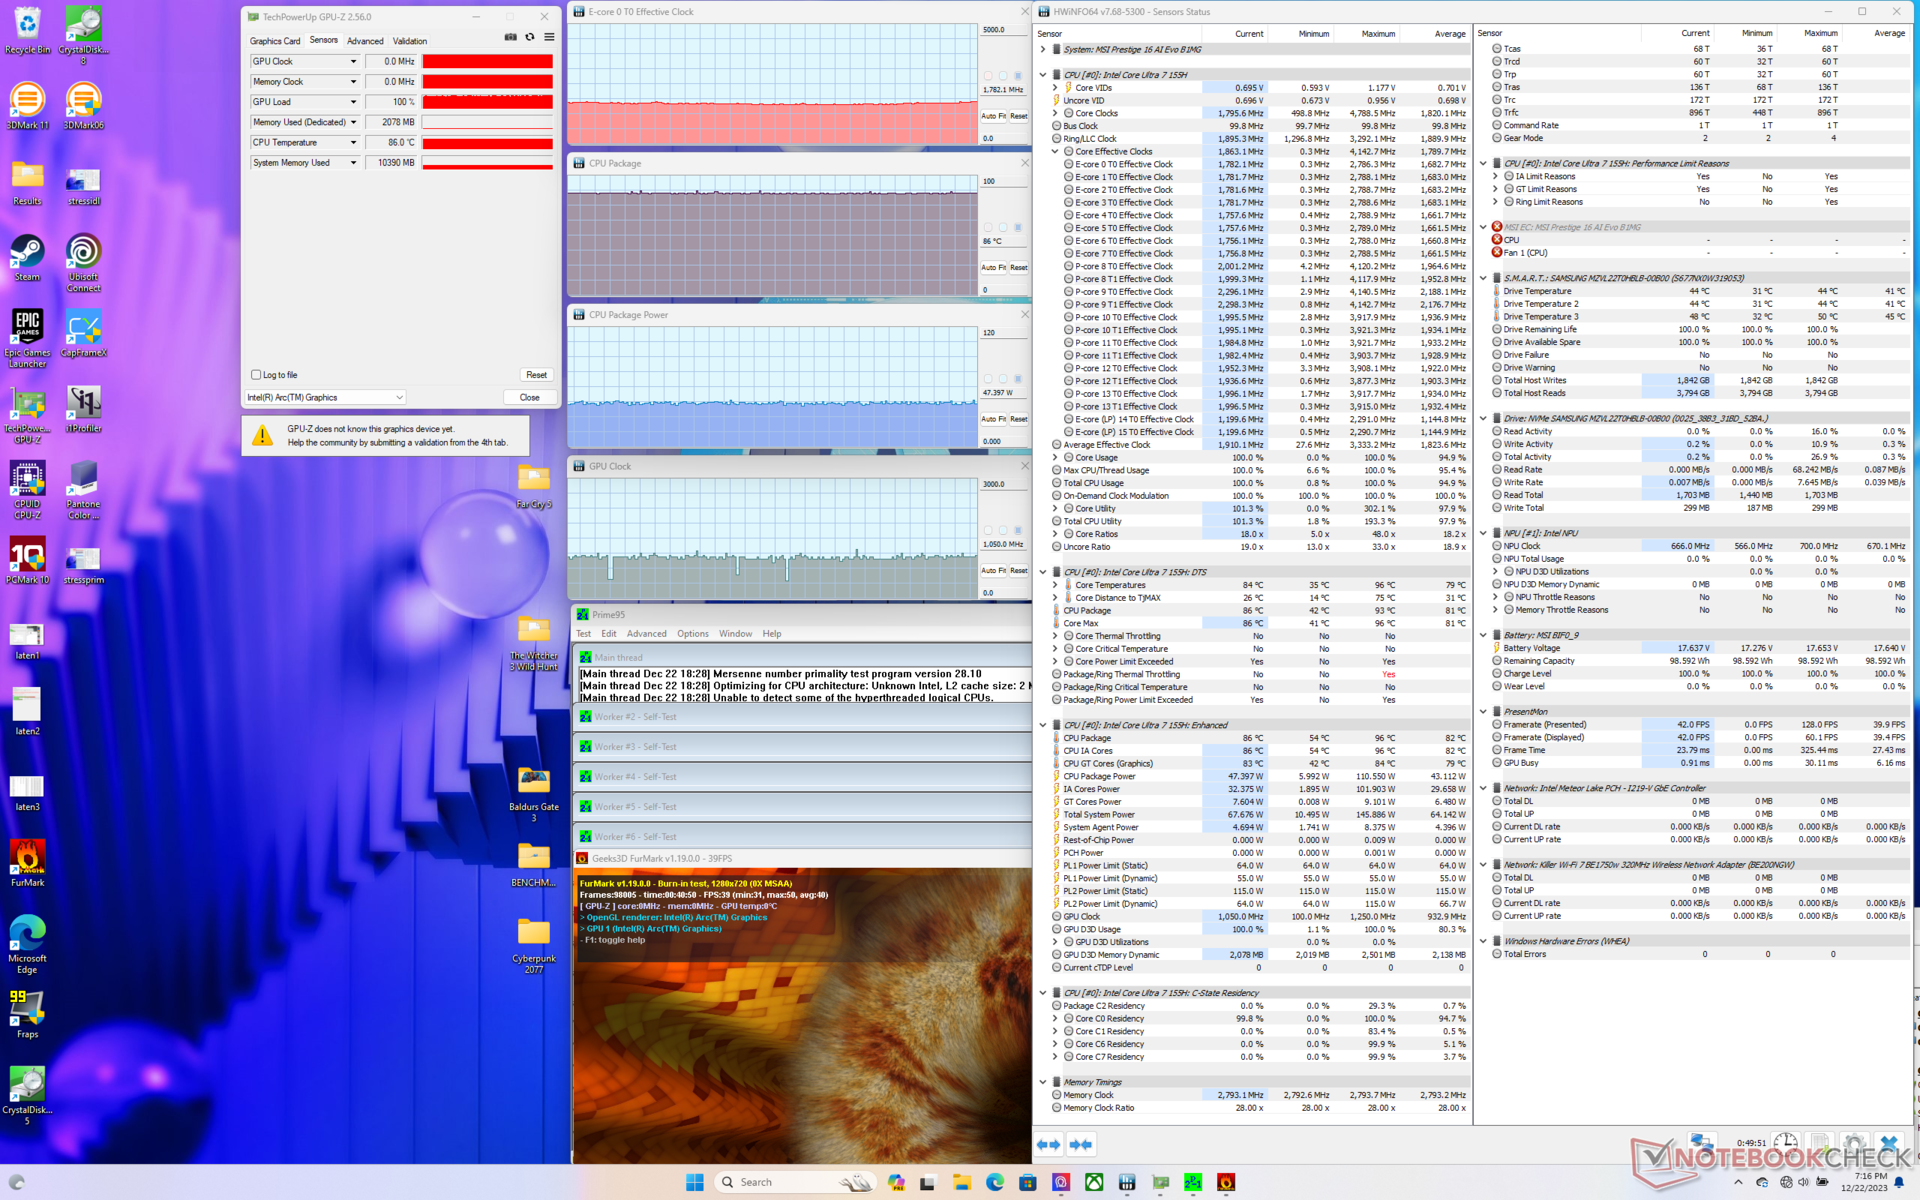
Teste de estresse
A potência do pacote da CPU aumentou para 110 W, 2,8 GHz e 96 °C por apenas alguns segundos ao iniciar o estresse do Prime95, antes de cair rapidamente e se estabilizar em 2,2 GHz, 44 W e 83 °C. Essa faixa é mais quente do que a média para um Ultrabook, mas é típica de um modelo Prestige. O Acer Swift Edge SFE16 com o Ryzen 7 7840U, por exemplo, se estabilizaria em 64 C mais frio, enquanto o Lenovo Slim Pro 9i 16IRP8 com Core H, estabilizaria a 77 °C em condições semelhantes.
A execução com o Cooler Boost ativo não parece afetar o desempenho. Por exemplo, a CPU se estabilizaria em 85 °C ao ser Witcher 3 com o Cooler Boost desligado versus 77 °C com o Cooler Boost ligado, enquanto as taxas de clock da GPU permaneceriam inalteradas. A menos que as temperaturas do núcleo sejam uma preocupação, o modo Cooler Boost geralmente não é necessário para o desempenho máximo. Essa observação está alinhada com nossas experiências em muitos outros notebooks MSI que contam com o Cooler Boost.

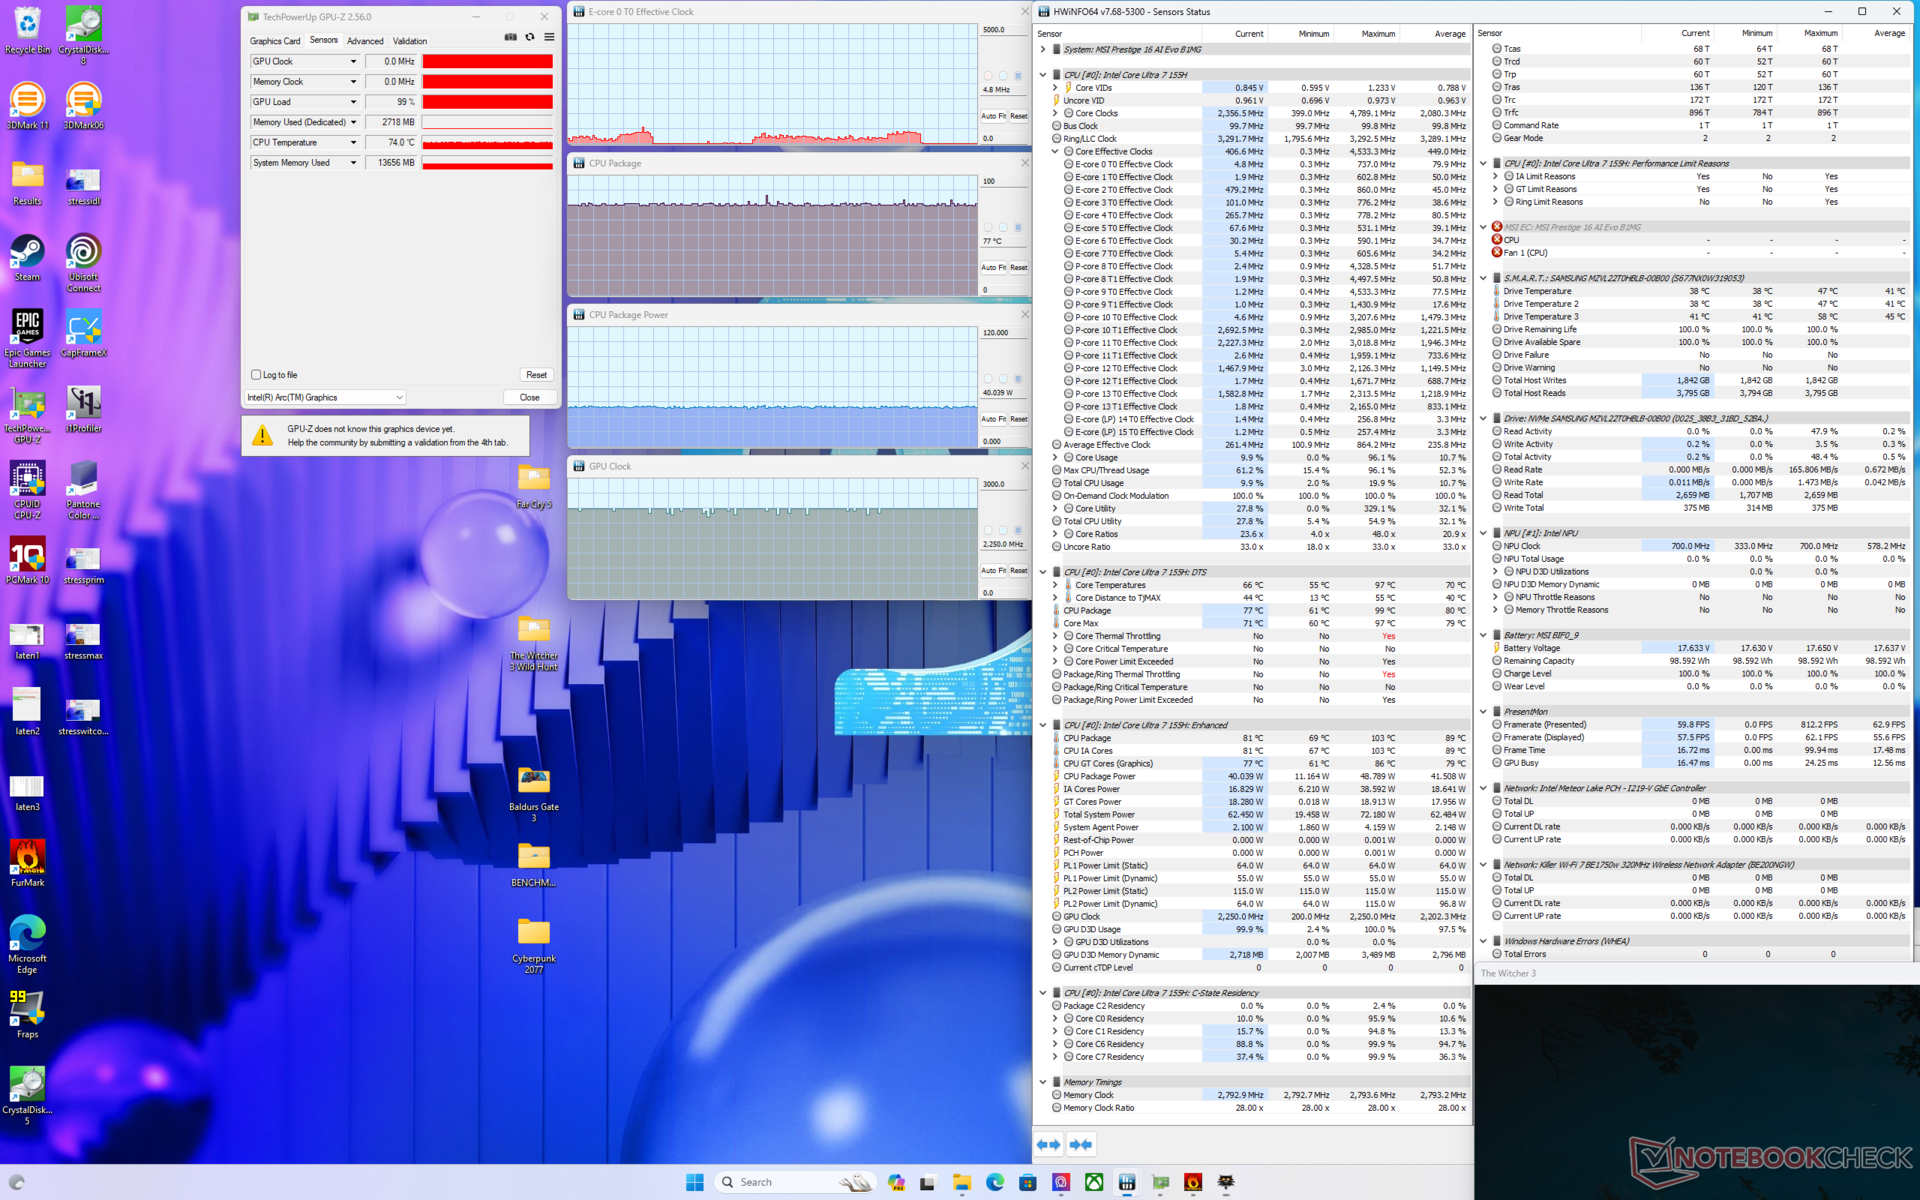
| Clock da CPU (GHz) | Clock da GPU (MHz) | Temperatura média da CPU (°C) | |
| Sistema ocioso | -- | -- | 42 |
| Estresse doPrime95 | 2.2 | -- | 83 |
| Prime95 + FurMark Stress | 1.8 | 1050 | 86 |
| Witcher 3 Stress(Extreme Performance w/ Cooler Boost off) | 0.5 | 2250 | 85 |
| Witcher 3 Estresse(desempenho extremo com o Cooler Boost ligado) | 0,5 | 2250 | 77 |
Alto-falantes
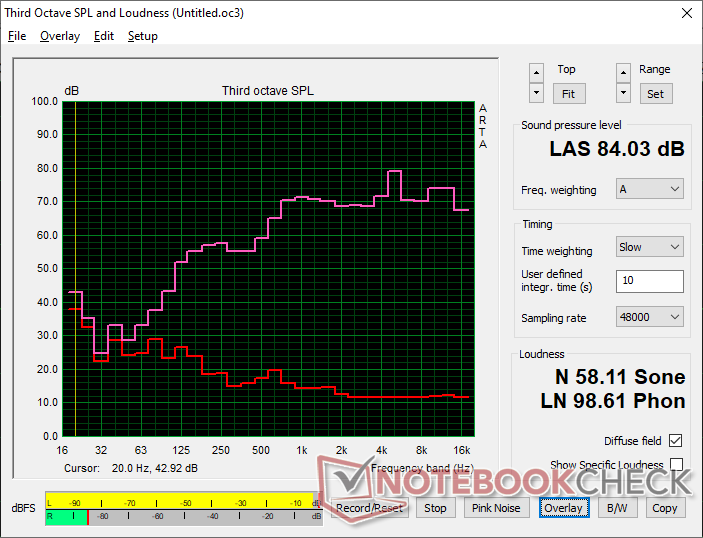
MSI Prestige 16 B1MG-001US análise de áudio
(+) | os alto-falantes podem tocar relativamente alto (###valor### dB)
Graves 100 - 315Hz
(-) | quase nenhum baixo - em média 15.3% menor que a mediana
(±) | a linearidade dos graves é média (7% delta para a frequência anterior)
Médios 400 - 2.000 Hz
(+) | médios equilibrados - apenas 4.3% longe da mediana
(+) | médios são lineares (4.3% delta para frequência anterior)
Altos 2 - 16 kHz
(+) | agudos equilibrados - apenas 3.2% longe da mediana
(+) | os máximos são lineares (6.5% delta da frequência anterior)
Geral 100 - 16.000 Hz
(+) | o som geral é linear (13.3% diferença em relação à mediana)
Comparado com a mesma classe
» 28% de todos os dispositivos testados nesta classe foram melhores, 4% semelhantes, 68% piores
» O melhor teve um delta de 5%, a média foi 17%, o pior foi 45%
Comparado com todos os dispositivos testados
» 14% de todos os dispositivos testados foram melhores, 3% semelhantes, 83% piores
» O melhor teve um delta de 4%, a média foi 23%, o pior foi 134%
Apple MacBook Pro 16 2021 M1 Pro análise de áudio
(+) | os alto-falantes podem tocar relativamente alto (###valor### dB)
Graves 100 - 315Hz
(+) | bons graves - apenas 3.8% longe da mediana
(+) | o baixo é linear (5.2% delta para a frequência anterior)
Médios 400 - 2.000 Hz
(+) | médios equilibrados - apenas 1.3% longe da mediana
(+) | médios são lineares (2.1% delta para frequência anterior)
Altos 2 - 16 kHz
(+) | agudos equilibrados - apenas 1.9% longe da mediana
(+) | os máximos são lineares (2.7% delta da frequência anterior)
Geral 100 - 16.000 Hz
(+) | o som geral é linear (4.6% diferença em relação à mediana)
Comparado com a mesma classe
» 0% de todos os dispositivos testados nesta classe foram melhores, 0% semelhantes, 100% piores
» O melhor teve um delta de 5%, a média foi 17%, o pior foi 45%
Comparado com todos os dispositivos testados
» 0% de todos os dispositivos testados foram melhores, 0% semelhantes, 100% piores
» O melhor teve um delta de 4%, a média foi 23%, o pior foi 134%
Gerenciamento de energia - baixas mais baixas com altas mais altas
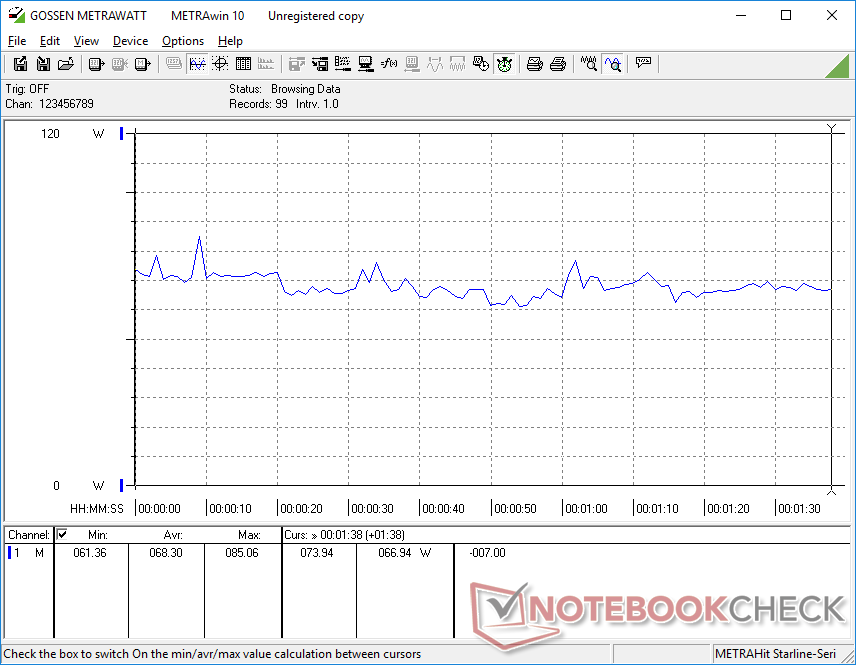
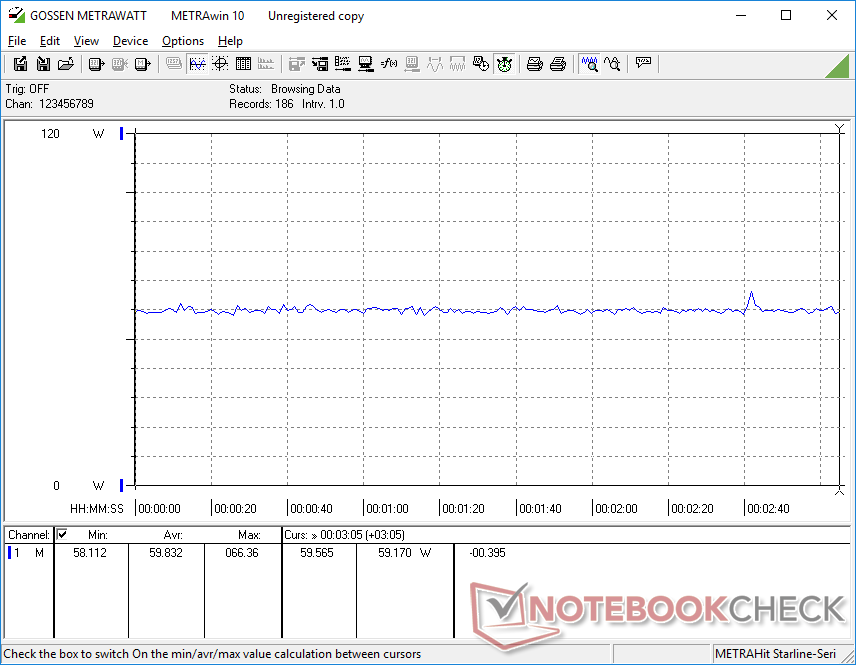
Consumo de energia
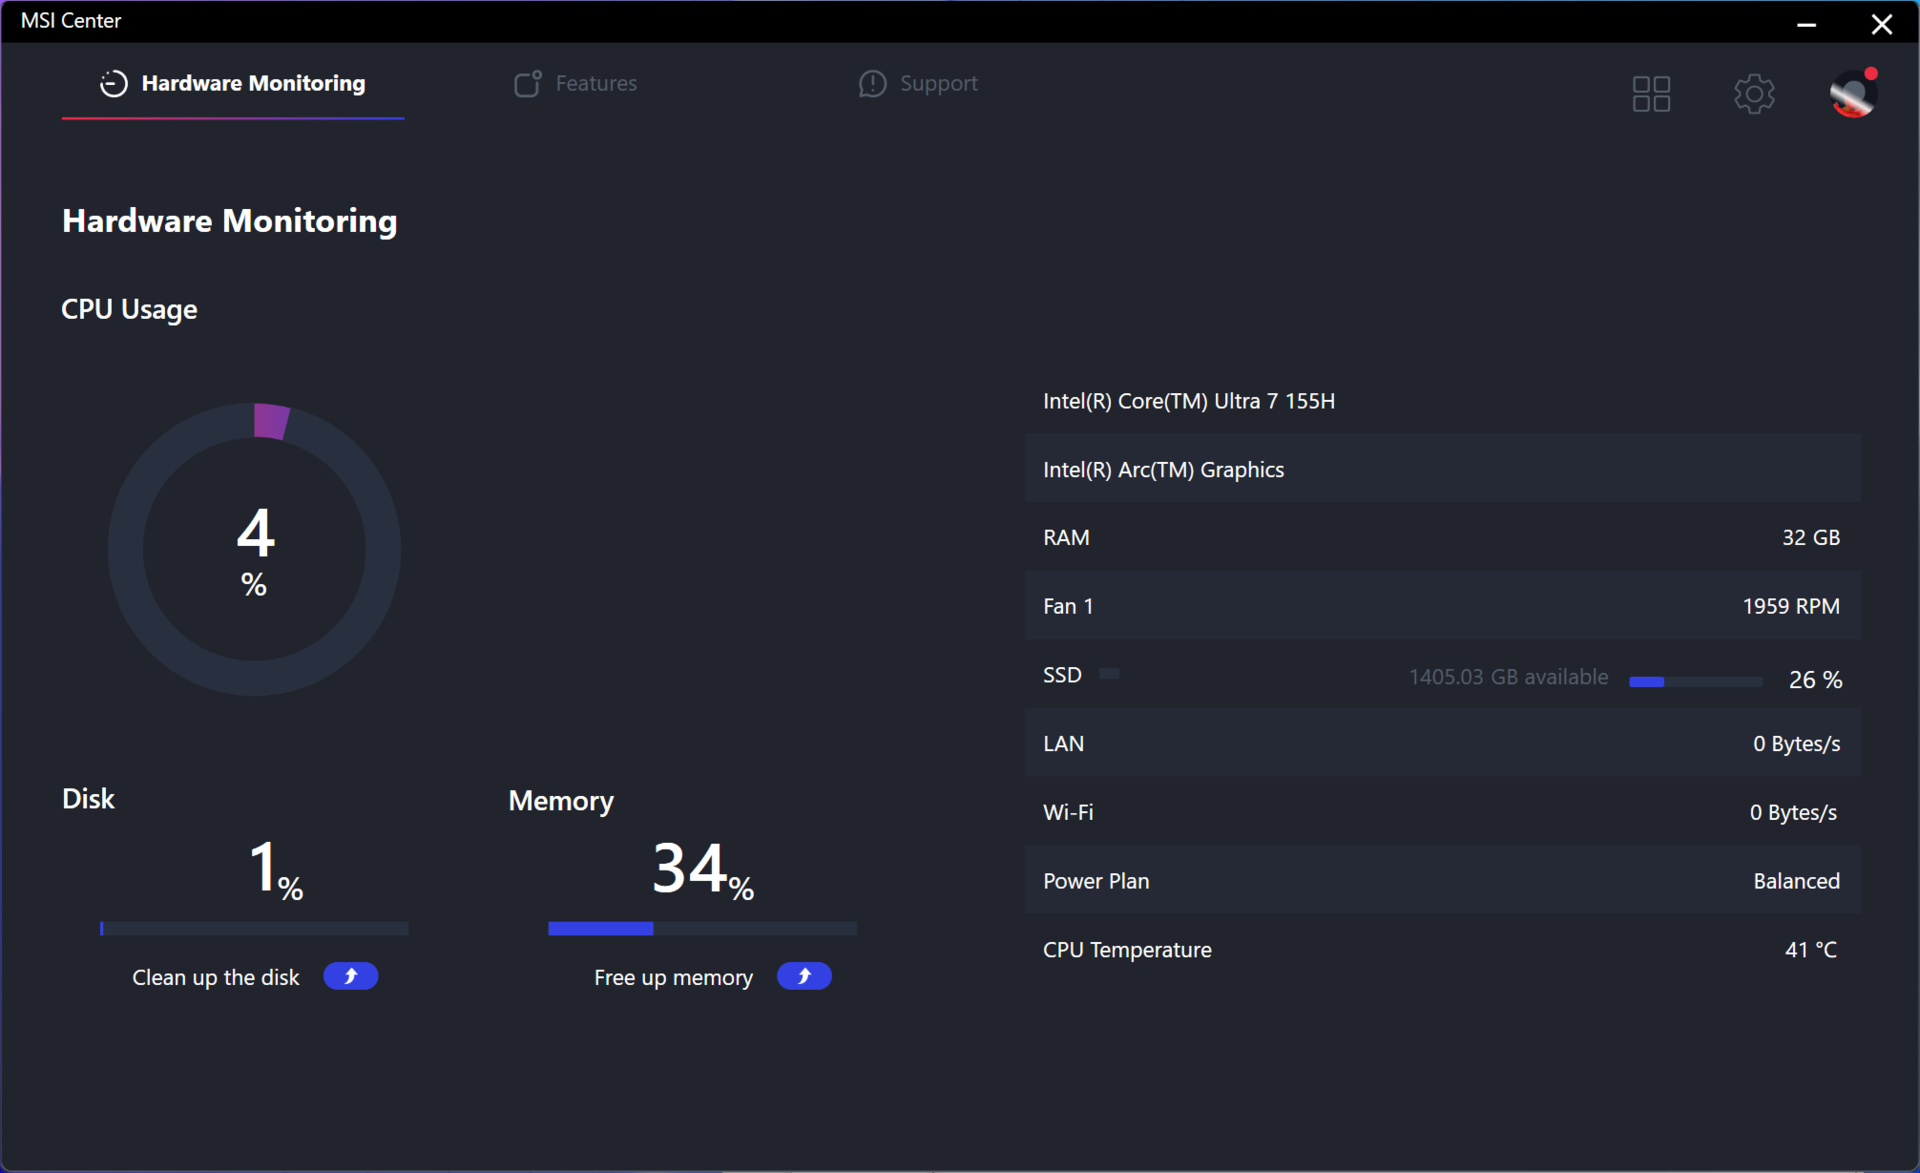
O consumo de energia pode ser tão baixo quanto 3 W quando em marcha lenta, o que é um dos mais baixos de qualquer laptop Intel de 16 polegadas que testamos. O piso muito baixo é provavelmente responsável pela duração extra longa da bateria na próxima seção abaixo.
Por outro lado, o consumo parece ser maior do que a maioria dos outros notebooks da série U ao executar cargas mais exigentes. A execução do 3DMark 06 ou de jogos, por exemplo, consumiria entre 60 W e 70 W, em comparação com 40 W e 55 W no MSI Prestige 15, LG Gram 16 2 em 1acer Swift Edge SFE16, ou o processador Core H Schenker Vision 14 em condições semelhantes. Isso também se aplica quando a CPU é totalmente estressada com o Prime95. No entanto, o desempenho por watt ainda é favorável à CPU de 14ª geração mais recente e, portanto, o maior consumo de energia não é necessariamente uma desvantagem.
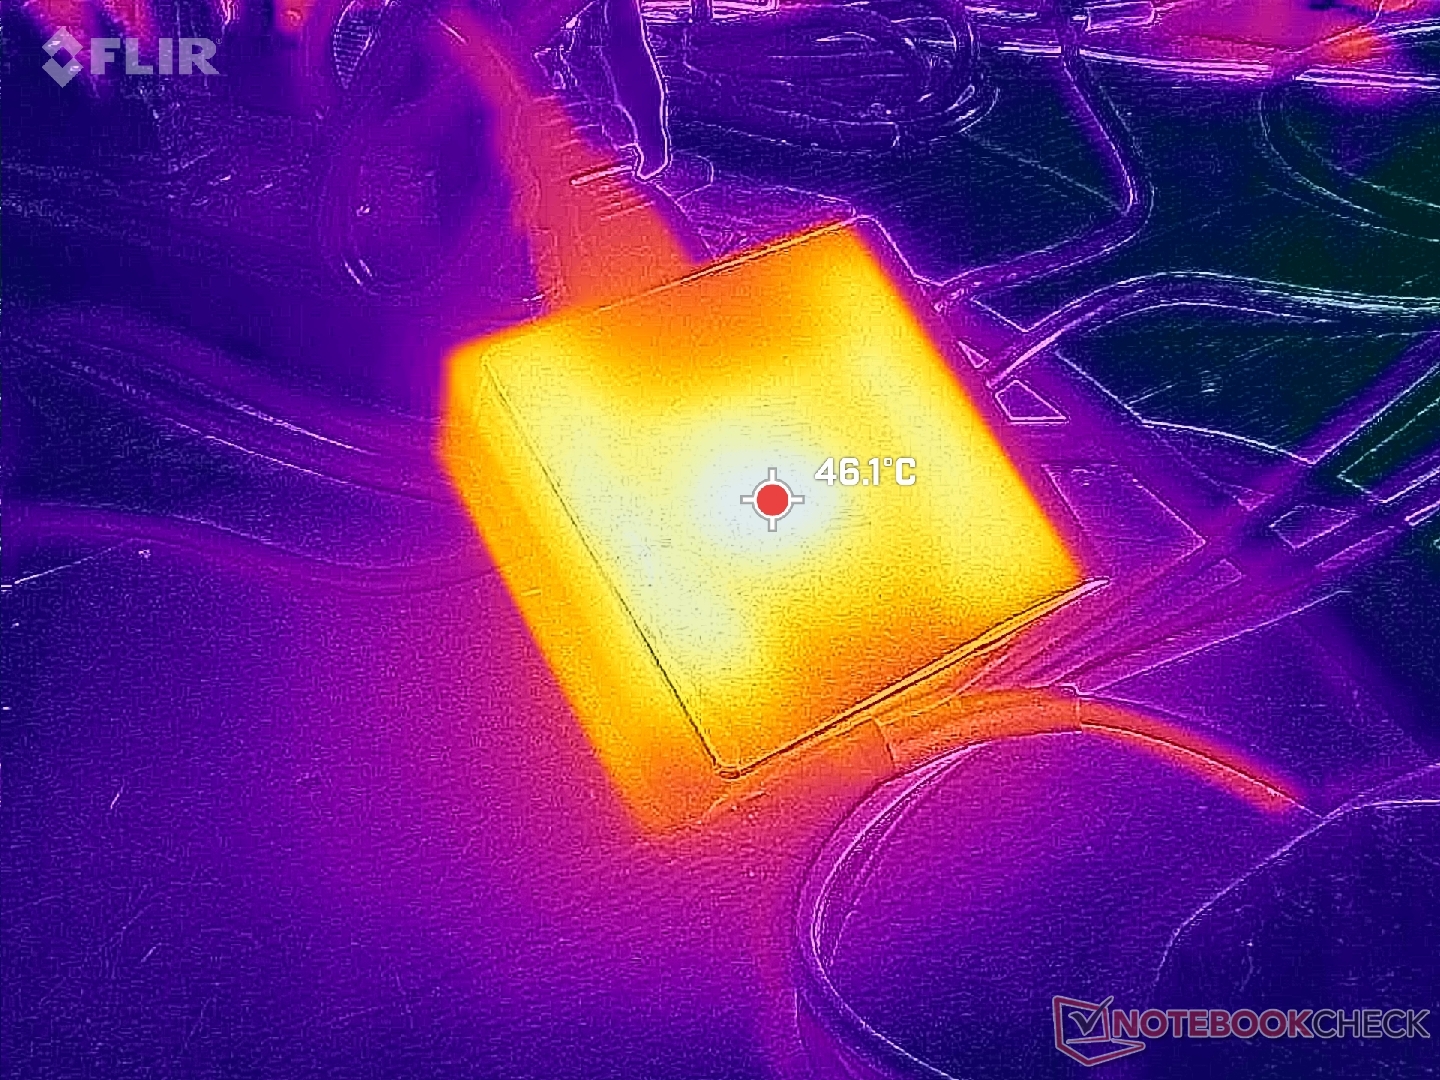
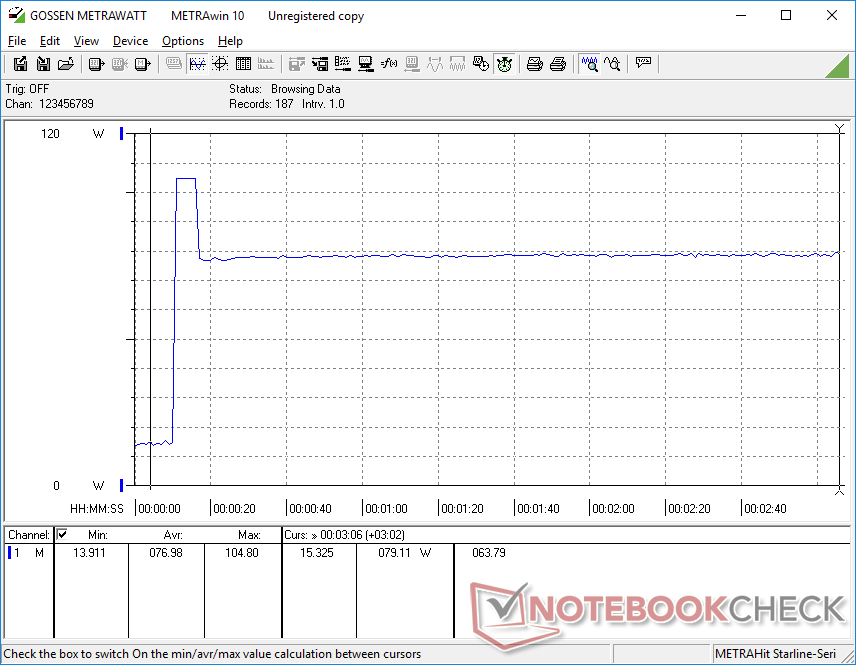
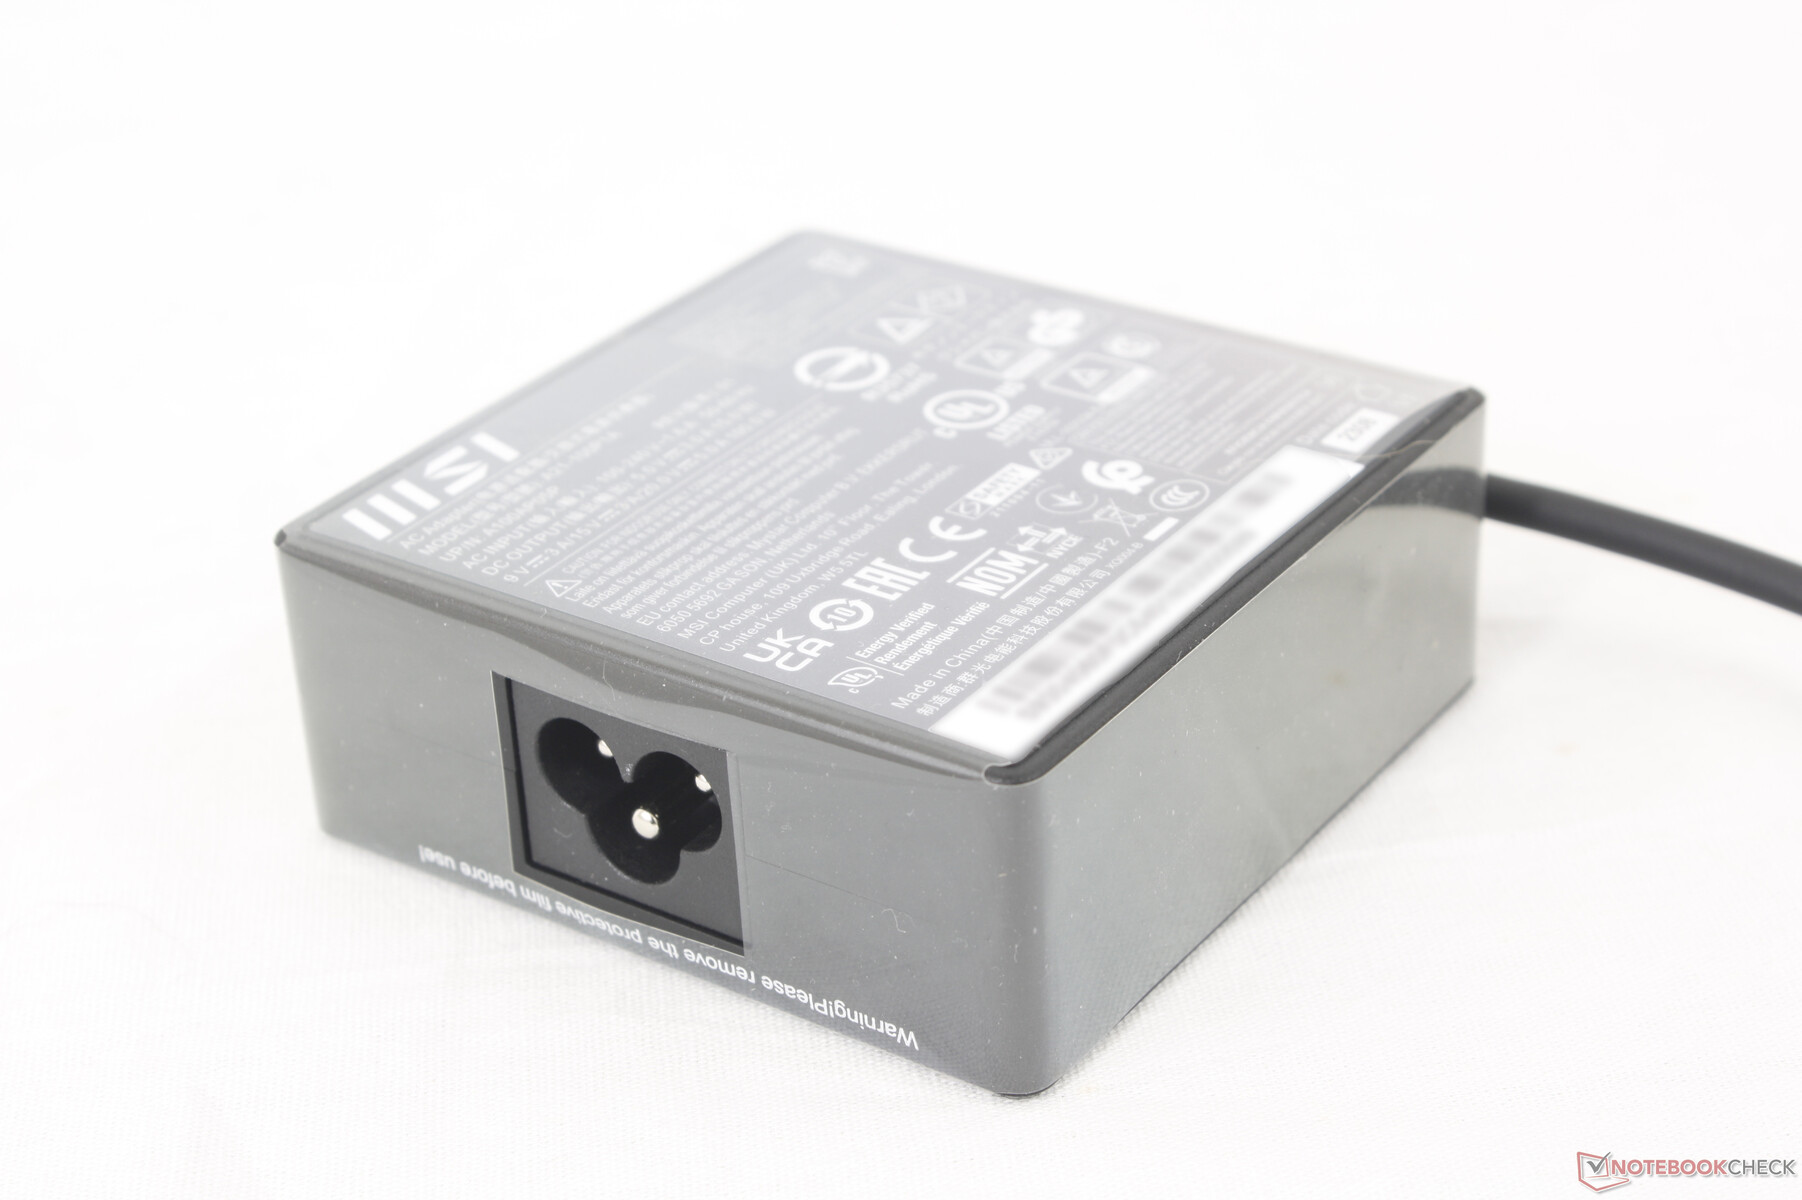
Conseguimos registrar um consumo máximo de 105 W do pequeno adaptador CA USB-C de 100 W (~7,5 x 7,5 x 3 cm) quando a CPU está com 100% de utilização. Essa taxa é apenas temporária devido ao potencial limitado do Turbo Boost e, portanto, tende a se estabilizar em torno de 70 W ao executar cargas pesadas. Observe que as SKUs com gráficos discretos RTX 4060 ou 4070 vêm com um adaptador CA USB-C maior, de 140 W.

| desligado | |
| Ocioso | |
| Carga |
|
Key:
min: | |
| MSI Prestige 16 B1MG-001US Ultra 7 155H, Arc 8-Core, Samsung PM9A1 MZVL22T0HBLB, IPS, 2560x1600, 16" | MSI Prestige 15 A12UD-093 i7-1280P, GeForce RTX 3050 Ti Laptop GPU, Micron 3400 1TB MTFDKBA1T0TFH, IPS, 3840x2160, 15.6" | LG Gram 2in1 16 16T90R - G.AA78G i7-1360P, Iris Xe G7 96EUs, Samsung PM9A1 MZVL21T0HCLR, IPS, 2560x1600, 16" | Lenovo ThinkBook 16 G6 ABP R5 7530U, Vega 7, SK hynix HFS512GEJ9X125N, IPS, 1920x1200, 16" | Asus VivoBook Pro 16 K6602VU i9-13900H, GeForce RTX 4050 Laptop GPU, Micron 2400 MTFDKBA1T0QFM, OLED, 3200x2000, 16" | Dell Inspiron 16 Plus 7630 i7-13700H, GeForce RTX 4060 Laptop GPU, WD PC SN740 SDDPTQD-1T00, IPS, 2560x1600, 16" | |
|---|---|---|---|---|---|---|
| Power Consumption | -2% | 2% | 24% | -161% | -124% | |
| Idle Minimum * (Watt) | 3 | 5.4 -80% | 5.5 -83% | 3.7 -23% | 21.06 -602% | 15.6 -420% |
| Idle Average * (Watt) | 9.5 | 11.8 -24% | 7.2 24% | 7.1 25% | 24.27 -155% | 17.7 -86% |
| Idle Maximum * (Watt) | 12 | 12.7 -6% | 12.9 -8% | 7.7 36% | 25.12 -109% | 20.6 -72% |
| Load Average * (Watt) | 68.3 | 45.9 33% | 55 19% | 43.9 36% | 52.4 23% | 87.4 -28% |
| Witcher 3 ultra * (Watt) | 59.8 | 45.7 24% | 47 21% | 40.8 32% | 110.2 -84% | 121.7 -104% |
| Load Maximum * (Watt) | 104.8 | 63 40% | 63.6 39% | 66.6 36% | 146 -39% | 138 -32% |
* ... menor é melhor
Power Consumption Witcher 3 / Stresstest
Power Consumption external Monitor
Duração da bateria
A capacidade da bateria aumentou de 80 Wh no Prestige 15 para 99 Wh em nosso Prestige 16. Combine isso com a eficiência da nova CPU Intel de 14ª geração e o senhor poderá obter tempos de execução extremamente longos de quase 18,5 horas de navegação WLAN no mundo real. Esse é um dos notebooks Windows mais duradouros que já testamos, com resultados que rivalizam com a série MacBook.
O carregamento da bateria vazia até a capacidade total leva cerca de 90 minutos.
| MSI Prestige 16 B1MG-001US Ultra 7 155H, Arc 8-Core, 99.9 Wh | MSI Prestige 15 A12UD-093 i7-1280P, GeForce RTX 3050 Ti Laptop GPU, 80 Wh | LG Gram 2in1 16 16T90R - G.AA78G i7-1360P, Iris Xe G7 96EUs, 80 Wh | Lenovo ThinkBook 16 G6 ABP R5 7530U, Vega 7, 45 Wh | Asus VivoBook Pro 16 K6602VU i9-13900H, GeForce RTX 4050 Laptop GPU, 96 Wh | Dell Inspiron 16 Plus 7630 i7-13700H, GeForce RTX 4060 Laptop GPU, 86 Wh | |
|---|---|---|---|---|---|---|
| Duração da bateria | -51% | -32% | -45% | -45% | -43% | |
| Reader / Idle (h) | 25.1 | 17.6 -30% | ||||
| WiFi v1.3 (h) | 18.3 | 8.9 -51% | 11.9 -35% | 10.1 -45% | 10.1 -45% | 9.4 -49% |
| Load (h) | 2.8 | 1.4 -50% | 2 -29% | 1.4 -50% | ||
| H.264 (h) | 7.1 | 11.6 | 9.8 |
Pro
Contra
Veredicto - A série Prestige no seu melhor
a Intel de 14ª geração deve ser um grande benefício para Ultrabooks como o MSI Prestige 16. Embora o desempenho bruto da CPU não seja muito superior ao da geração anterior, os ganhos no desempenho gráfico integrado e na duração da bateria são indiscutivelmente tão importantes para a categoria de Ultrabook. A Intel Arc 8 superou com sucesso a AMD Radeon 780M por margens notáveis, a ponto de a maioria dos jogadores casuais e editores de fotos ficarem satisfeitos com seu desempenho.
Alguns aspectos do modelo podem ser melhorados. Em primeiro lugar, a falta de uma alta taxa de atualização ou de opções de tela sensível ao toque significa que alternativas como o HP Spectre ou o Asus Vivobook ainda têm algumas vantagens. Em segundo lugar, o efeito fantasma é muito perceptível na configuração IPS, a ponto de incomodar até mesmo os jogadores casuais. Portanto, a SKU OLED pode valer a pena, apesar do inevitável impacto na duração da bateria. E, por último, o desempenho superior da iGPU tem o custo de um consumo de energia maior e um ruído mais alto da ventoinha do que a maioria dos outros Ultrabooks da série U ao executar tarefas com uso intensivo de GPU.
Os estudantes, em particular, vão adorar a longa duração da bateria, a tela DCI-P3 nítida e a ampla variedade de opções gráficas do Prestige 16, que é uma alternativa interessante ao MacBook Pro.
O design portátil, a tela colorida, a bateria de longa duração, os gráficos integrados rápidos e o leitor de cartão SD rápido são os principais destaques do Prestige 16. Os usuários vão querer explorar esses pontos fortes para aproveitar ao máximo o modelo da MSI.
Preço e disponibilidade
O MSI Prestige 16 com CPU de 14ª geração está agora amplamente disponível na Amazon com OLED por US$ 1650 ou na Best Buy com gráficos discretos Arc A370M por US$ 1400.
MSI Prestige 16 B1MG-001US
- 12/28/2023 v7 (old)
Allen Ngo
Transparência
A seleção dos dispositivos a serem analisados é feita pela nossa equipe editorial. A amostra de teste foi adquirida gratuitamente pelo autor às suas próprias custas. O credor não teve influência nesta revisão, nem o fabricante recebeu uma cópia desta revisão antes da publicação. Não houve obrigação de publicar esta revisão. Como empresa de mídia independente, a Notebookcheck não está sujeita à autoridade de fabricantes, varejistas ou editores.
É assim que o Notebookcheck está testando
Todos os anos, o Notebookcheck analisa de forma independente centenas de laptops e smartphones usando procedimentos padronizados para garantir que todos os resultados sejam comparáveis. Desenvolvemos continuamente nossos métodos de teste há cerca de 20 anos e definimos padrões da indústria no processo. Em nossos laboratórios de teste, equipamentos de medição de alta qualidade são utilizados por técnicos e editores experientes. Esses testes envolvem um processo de validação em vários estágios. Nosso complexo sistema de classificação é baseado em centenas de medições e benchmarks bem fundamentados, o que mantém a objetividade.Price comparison

