Veredicto - Vale a pena considerar o XMG Fusion 16 com OLED
Com o Fusion 16, a XMG oferece uma versão um pouco mais potente do conhecido Core 16. O recurso de destaque é o novo painel OLED, que oferece excelente qualidade de imagem e visuais visivelmente mais vibrantes do que a versão IPS. Apenas o brilho HDR poderia ser um pouco maior. Dito isso, o painel IPS com uma taxa de atualização de 300 Hz continua sendo uma alternativa sólida e não sofre com problemas de PWM.
O processador Intel HX mais rápido oferece um desempenho bruto da CPU significativamente maior, mas seu impacto nos jogos é limitado. De modo geral, as ventoinhas permanecem um pouco mais silenciosas do que as da concorrência, e o XMG oferece maior controle sobre as opções de configuração, incluindo até 128 GB de RAM e 16 TB de armazenamento SSD.
De modo geral, o novo XMG Fusion 16 é um pacote completo muito forte, e vale a pena escolher a tela OLED se o senhor quiser a melhor qualidade de imagem possível. A duração da bateria permanece praticamente inalterada. No entanto, se o senhor preferir um painel IPS, o Core 16, mais acessível, também é uma boa opção, pois o desempenho em jogos com o processador AMD é apenas marginalmente inferior.
Pro
Contra
Preço e disponibilidade
O Fusion 16 pode ser encomendado diretamente da XMG a partir de 1.899 euros. Nossa configuração de teste, que inclui várias atualizações, custa atualmente cerca de 2.700 euros.
Nota do tradutor: os laptops XMG não estão oficialmente disponíveis na América do Norte.
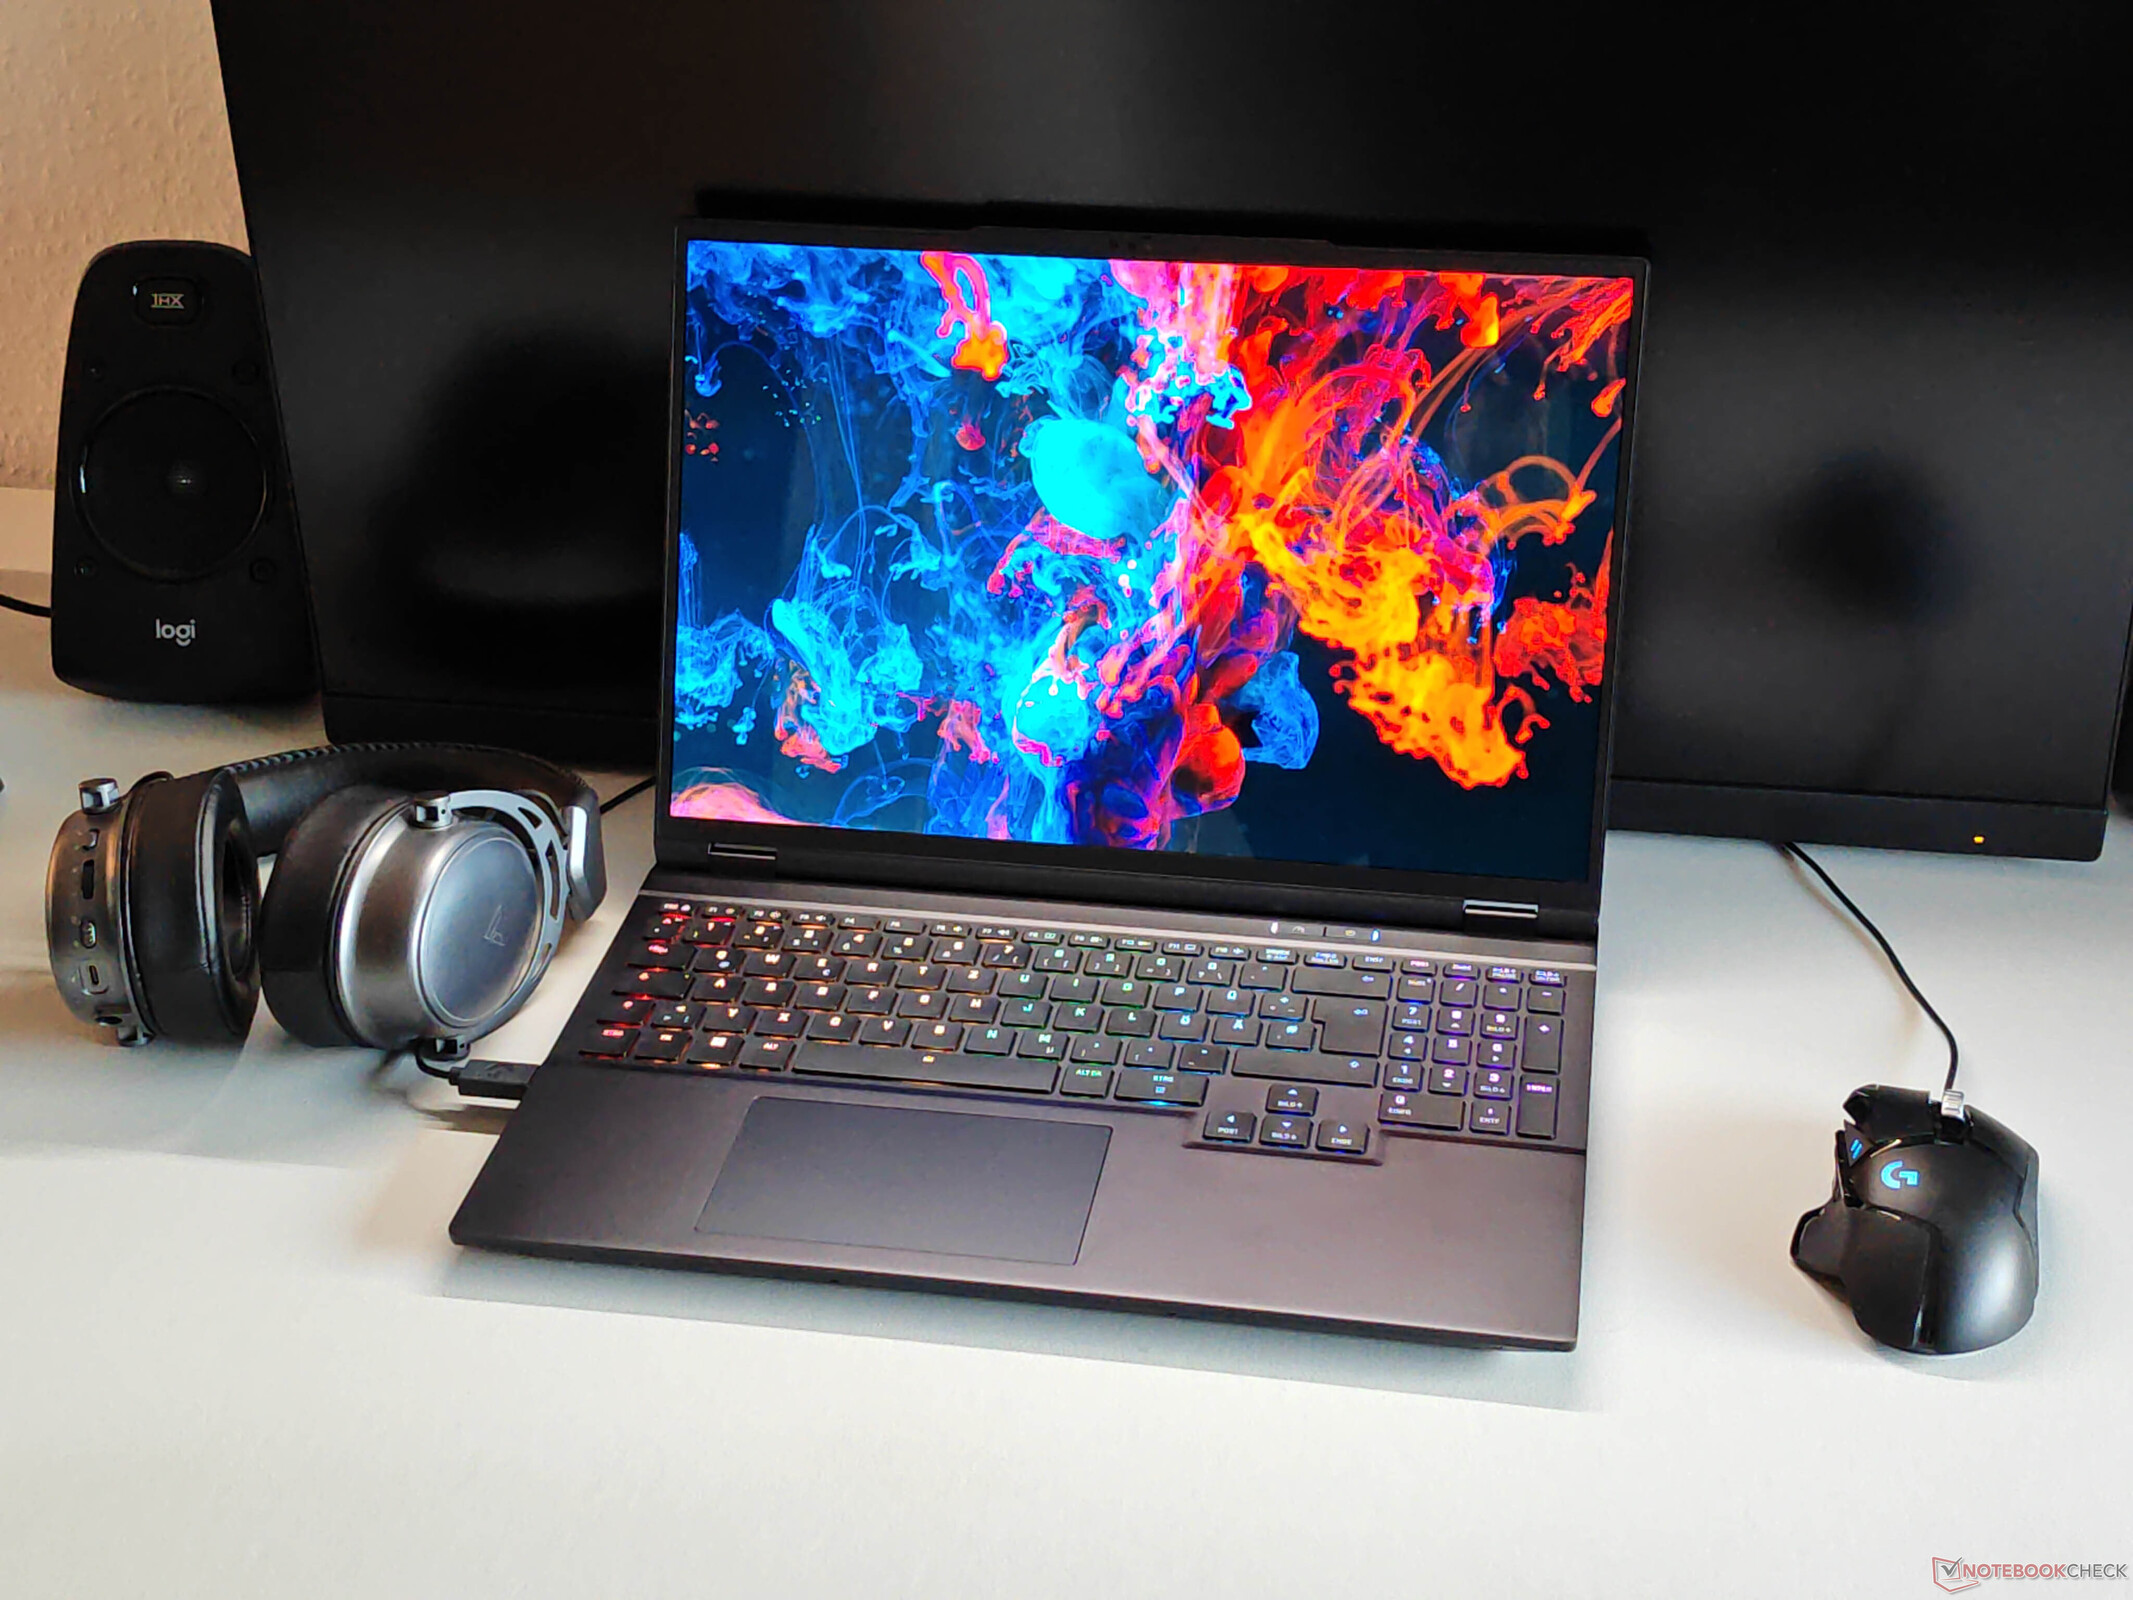
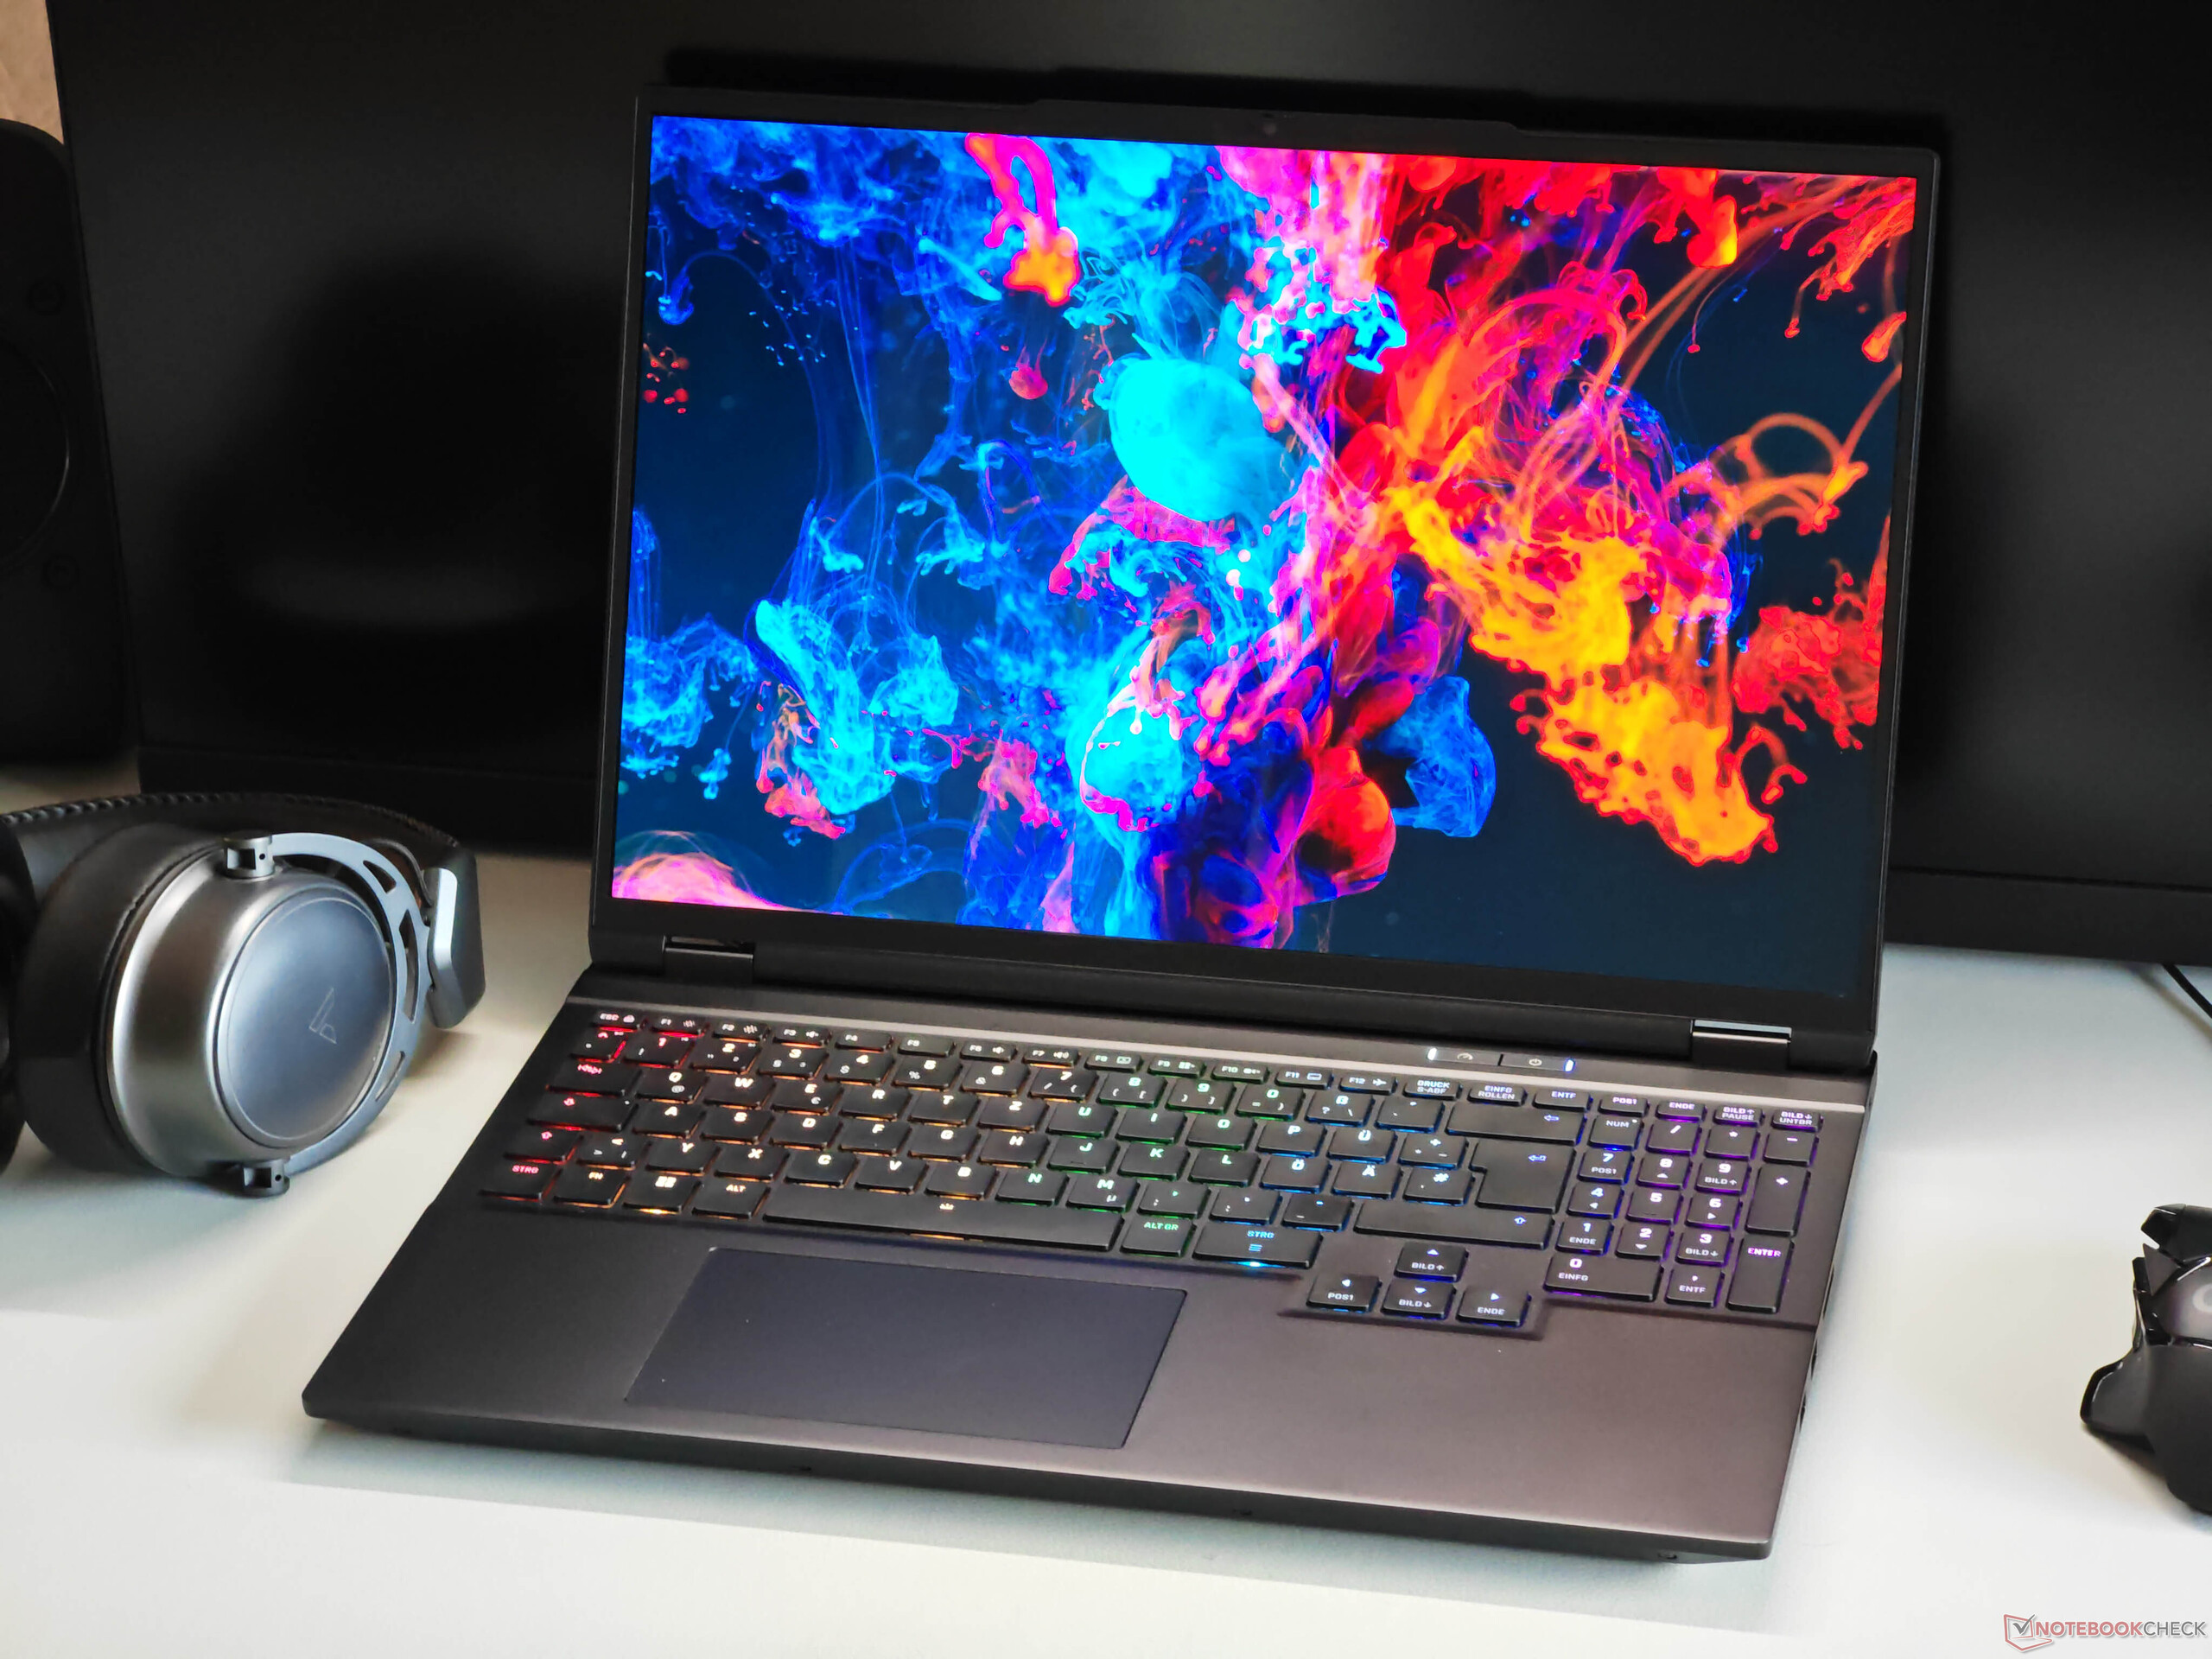
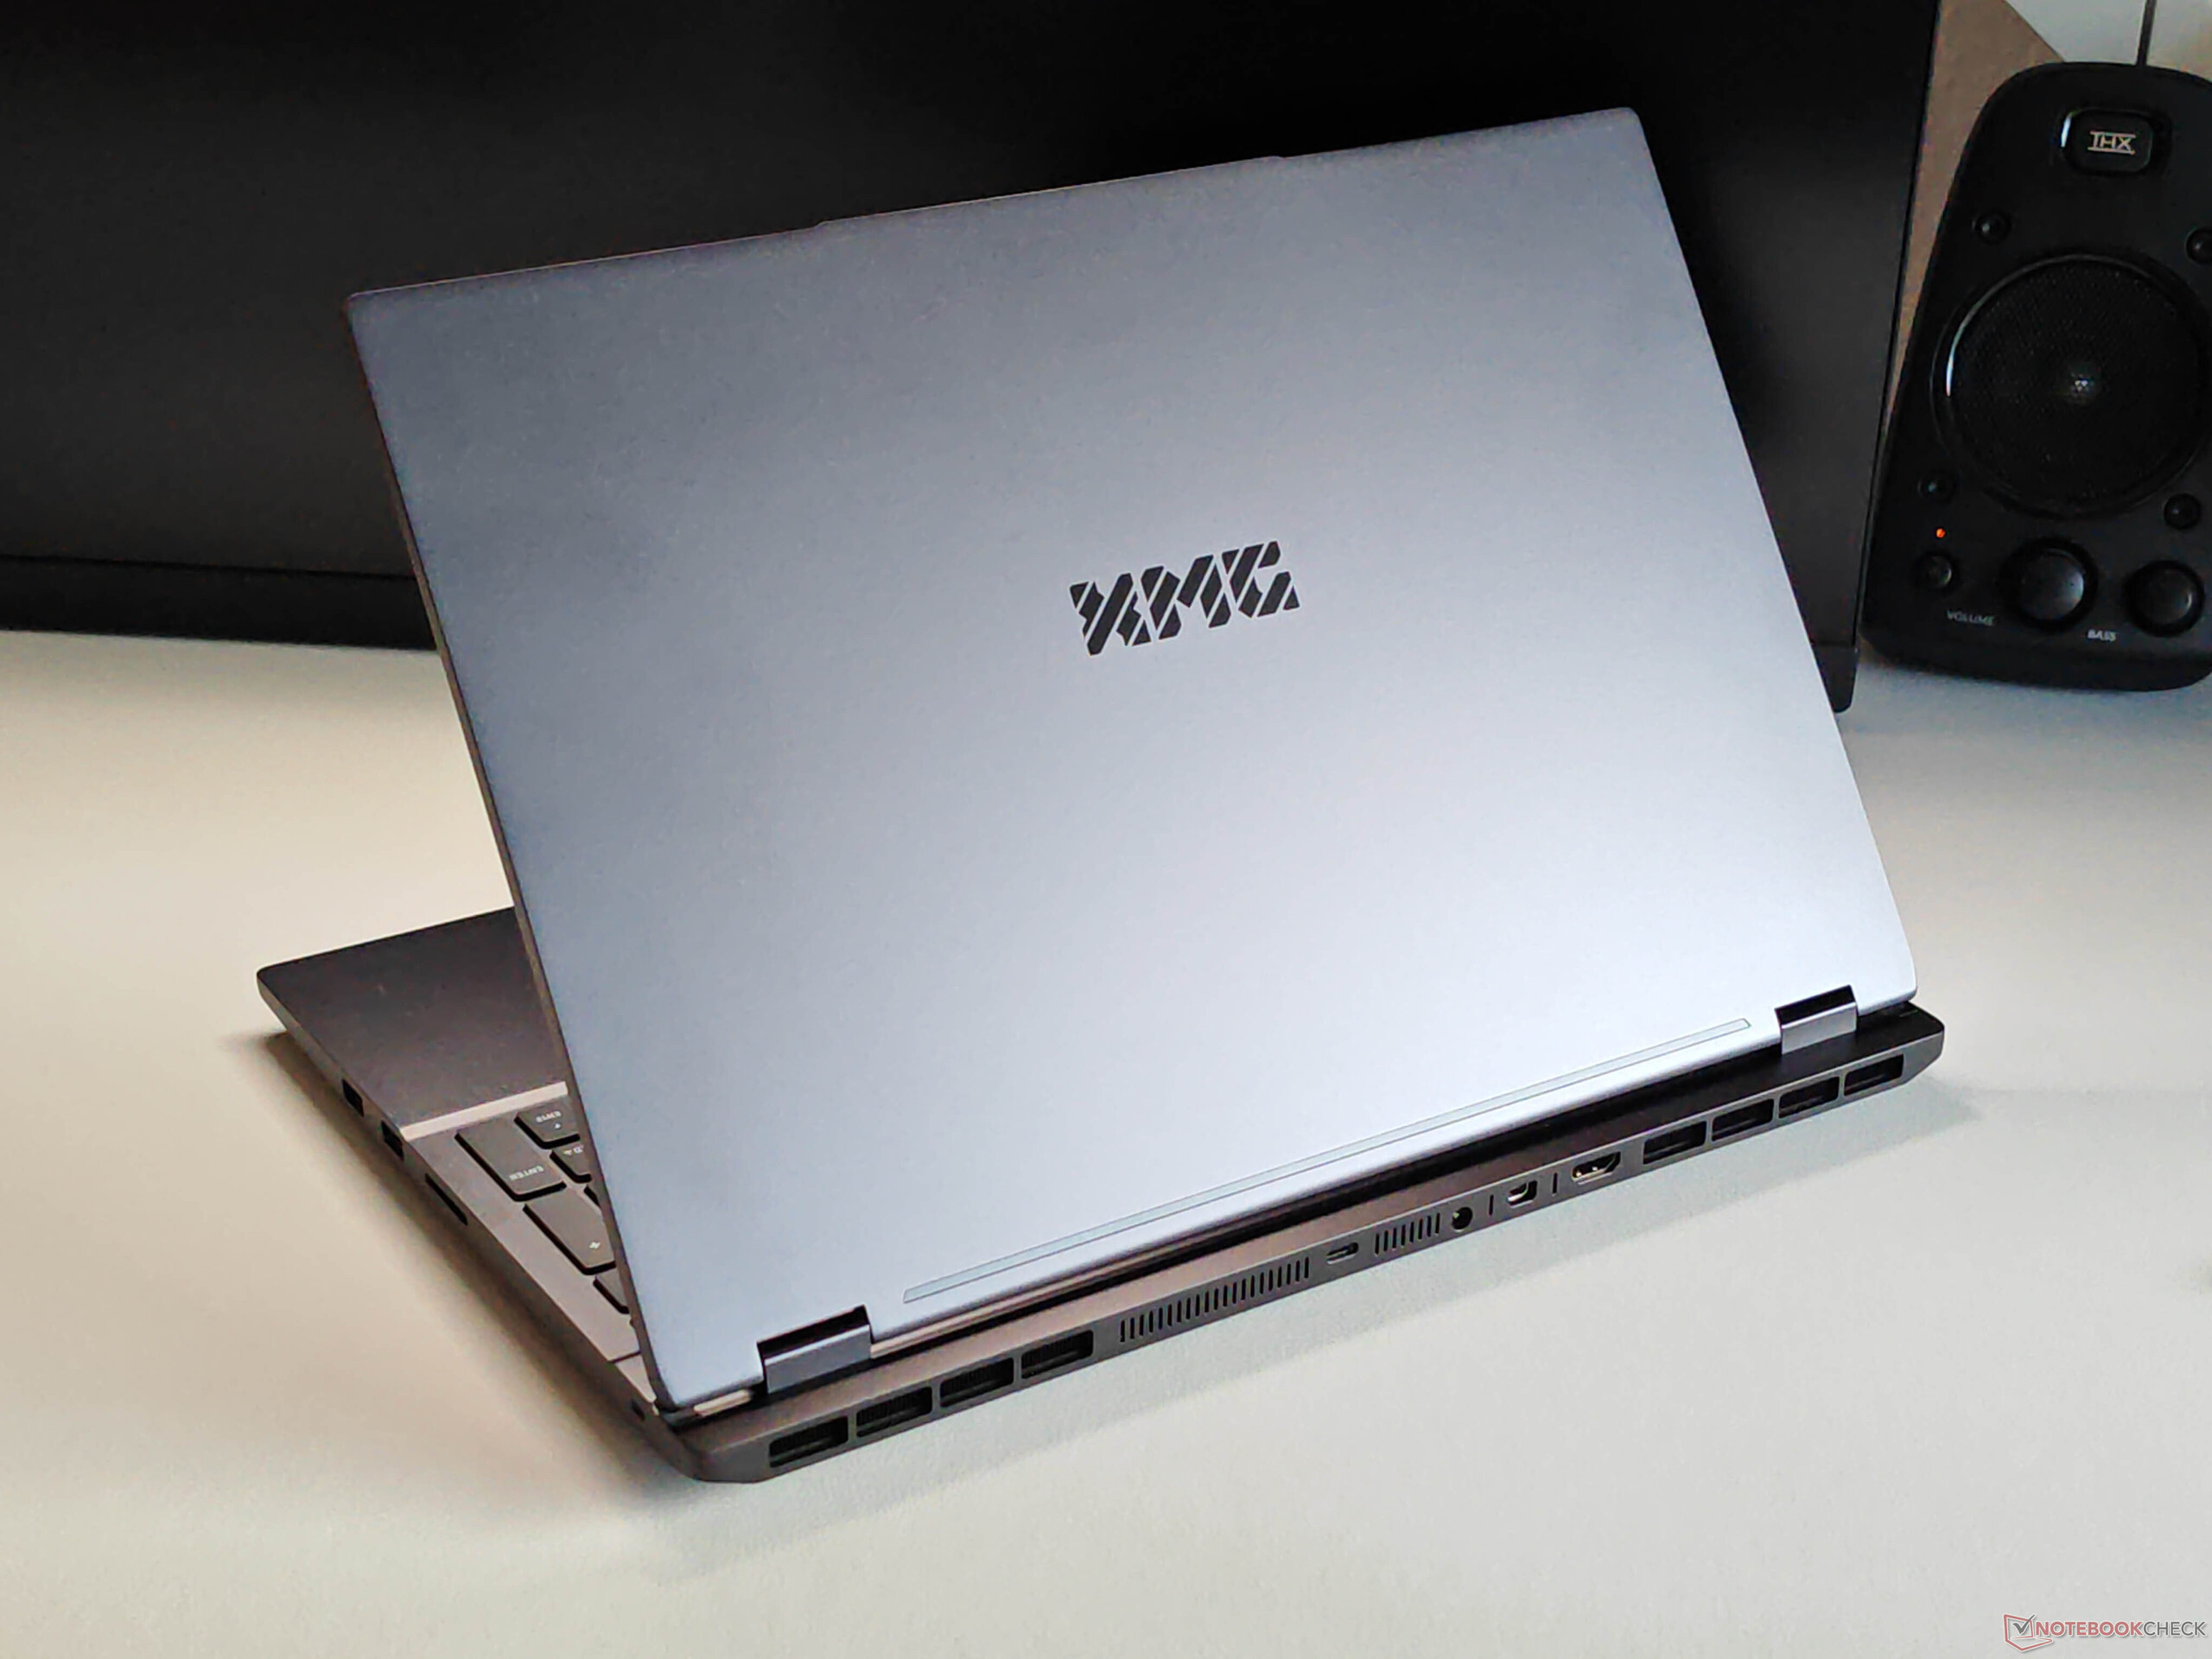
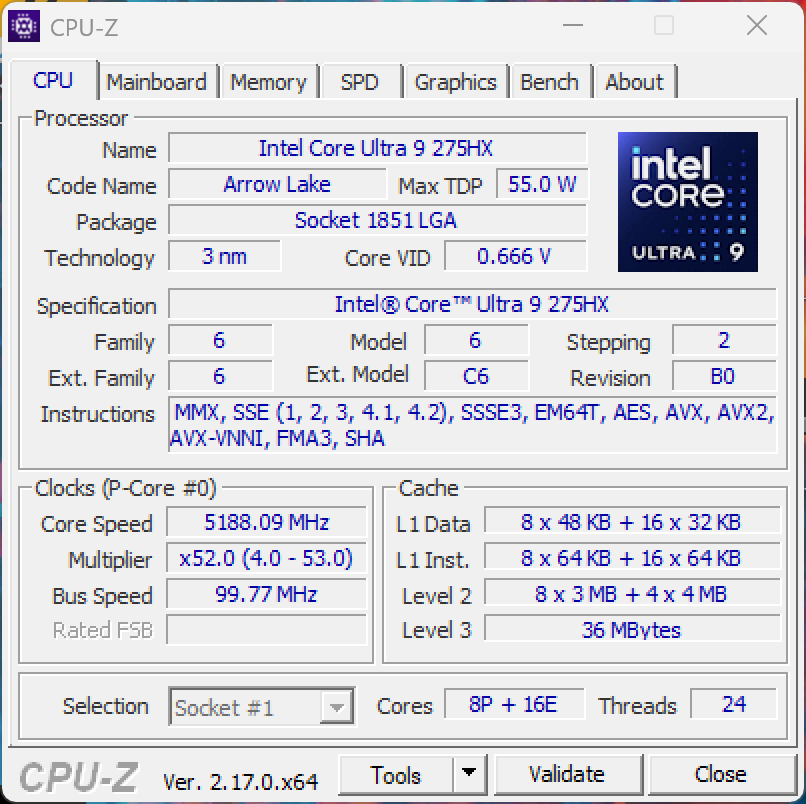
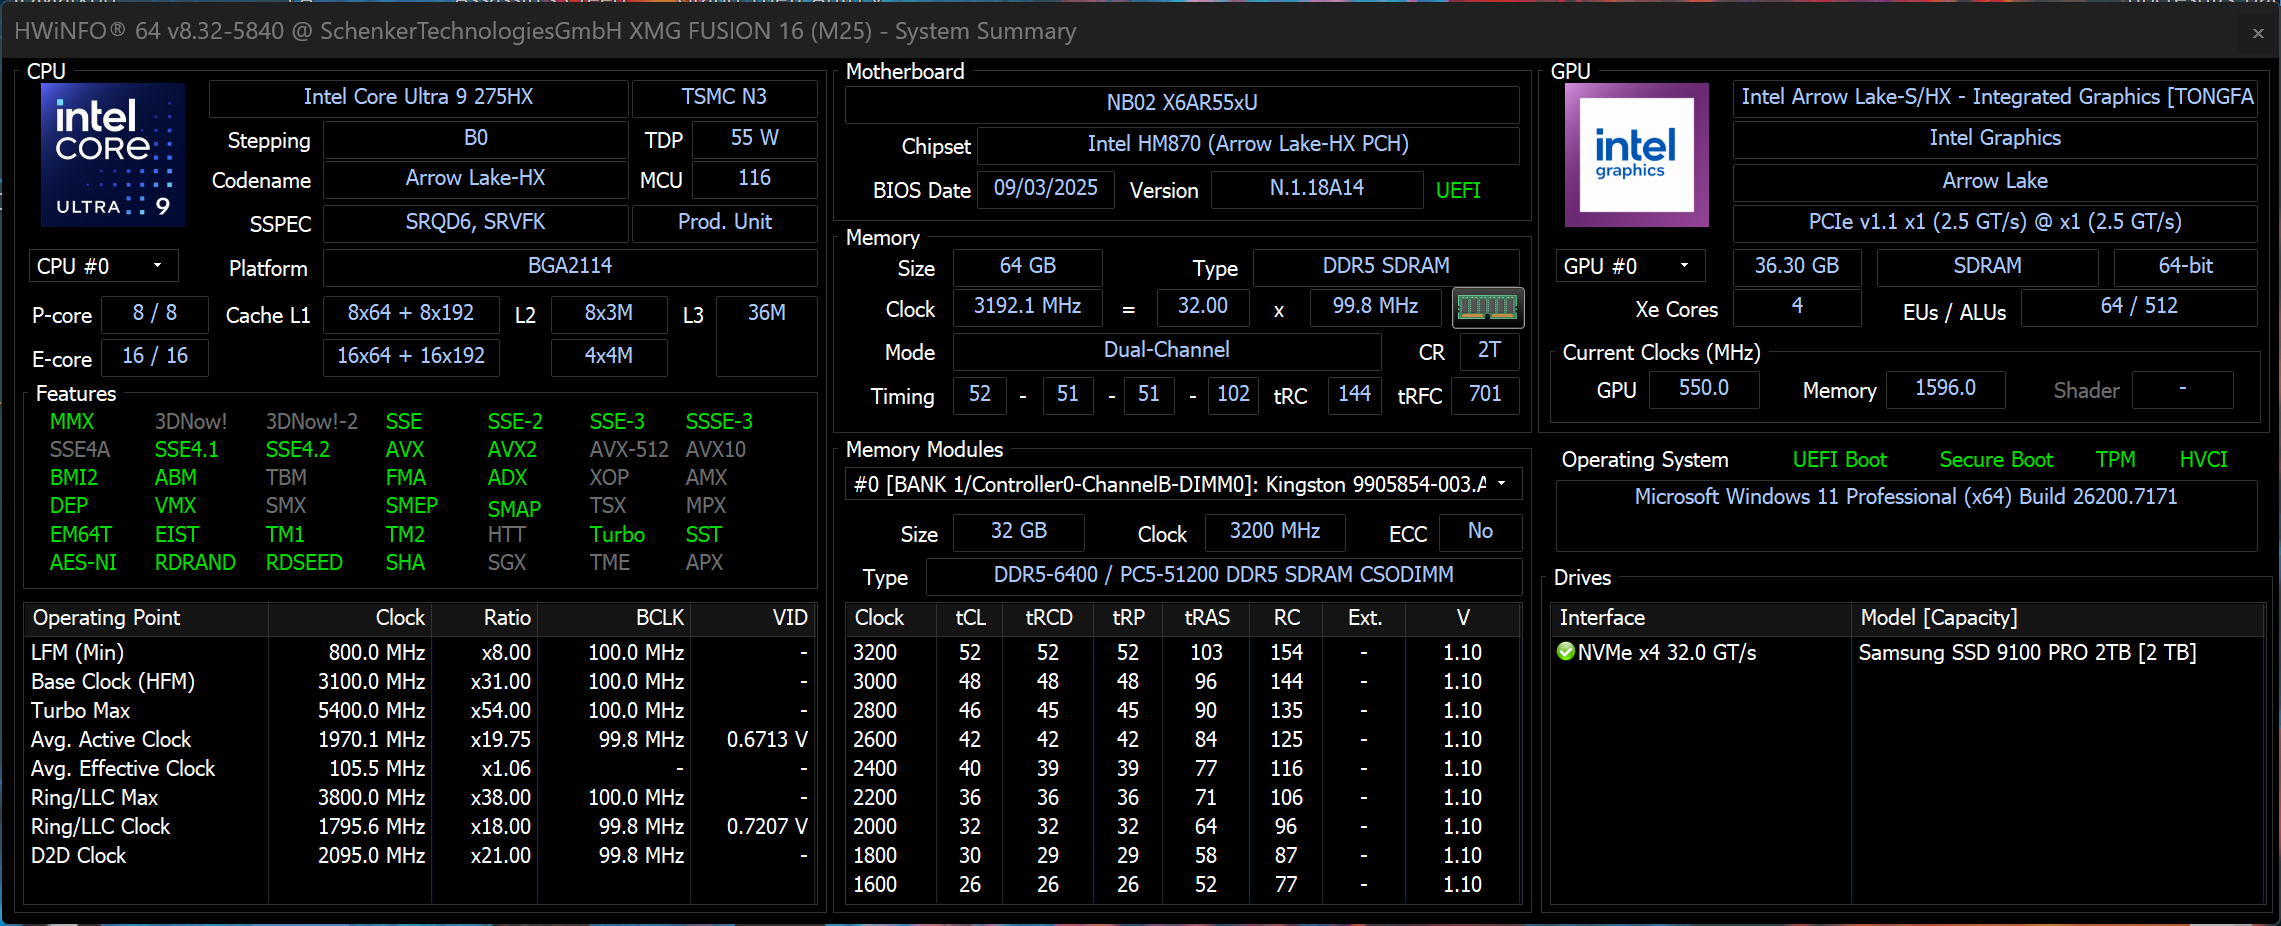
O Fusion 16 é o primeiro laptop para jogos da XMG a apresentar um painel OLED. O chassi já é conhecido do atual XMG Core 16 (AMD Ryzen com IPS), mas o Fusion 16 é equipado com o Intel Core Ultra 9 275HX de alto desempenho, a conhecida GPU para laptop GeForce RTX 5070 e uma nova tela OLED de 120 Hz.
Especificações
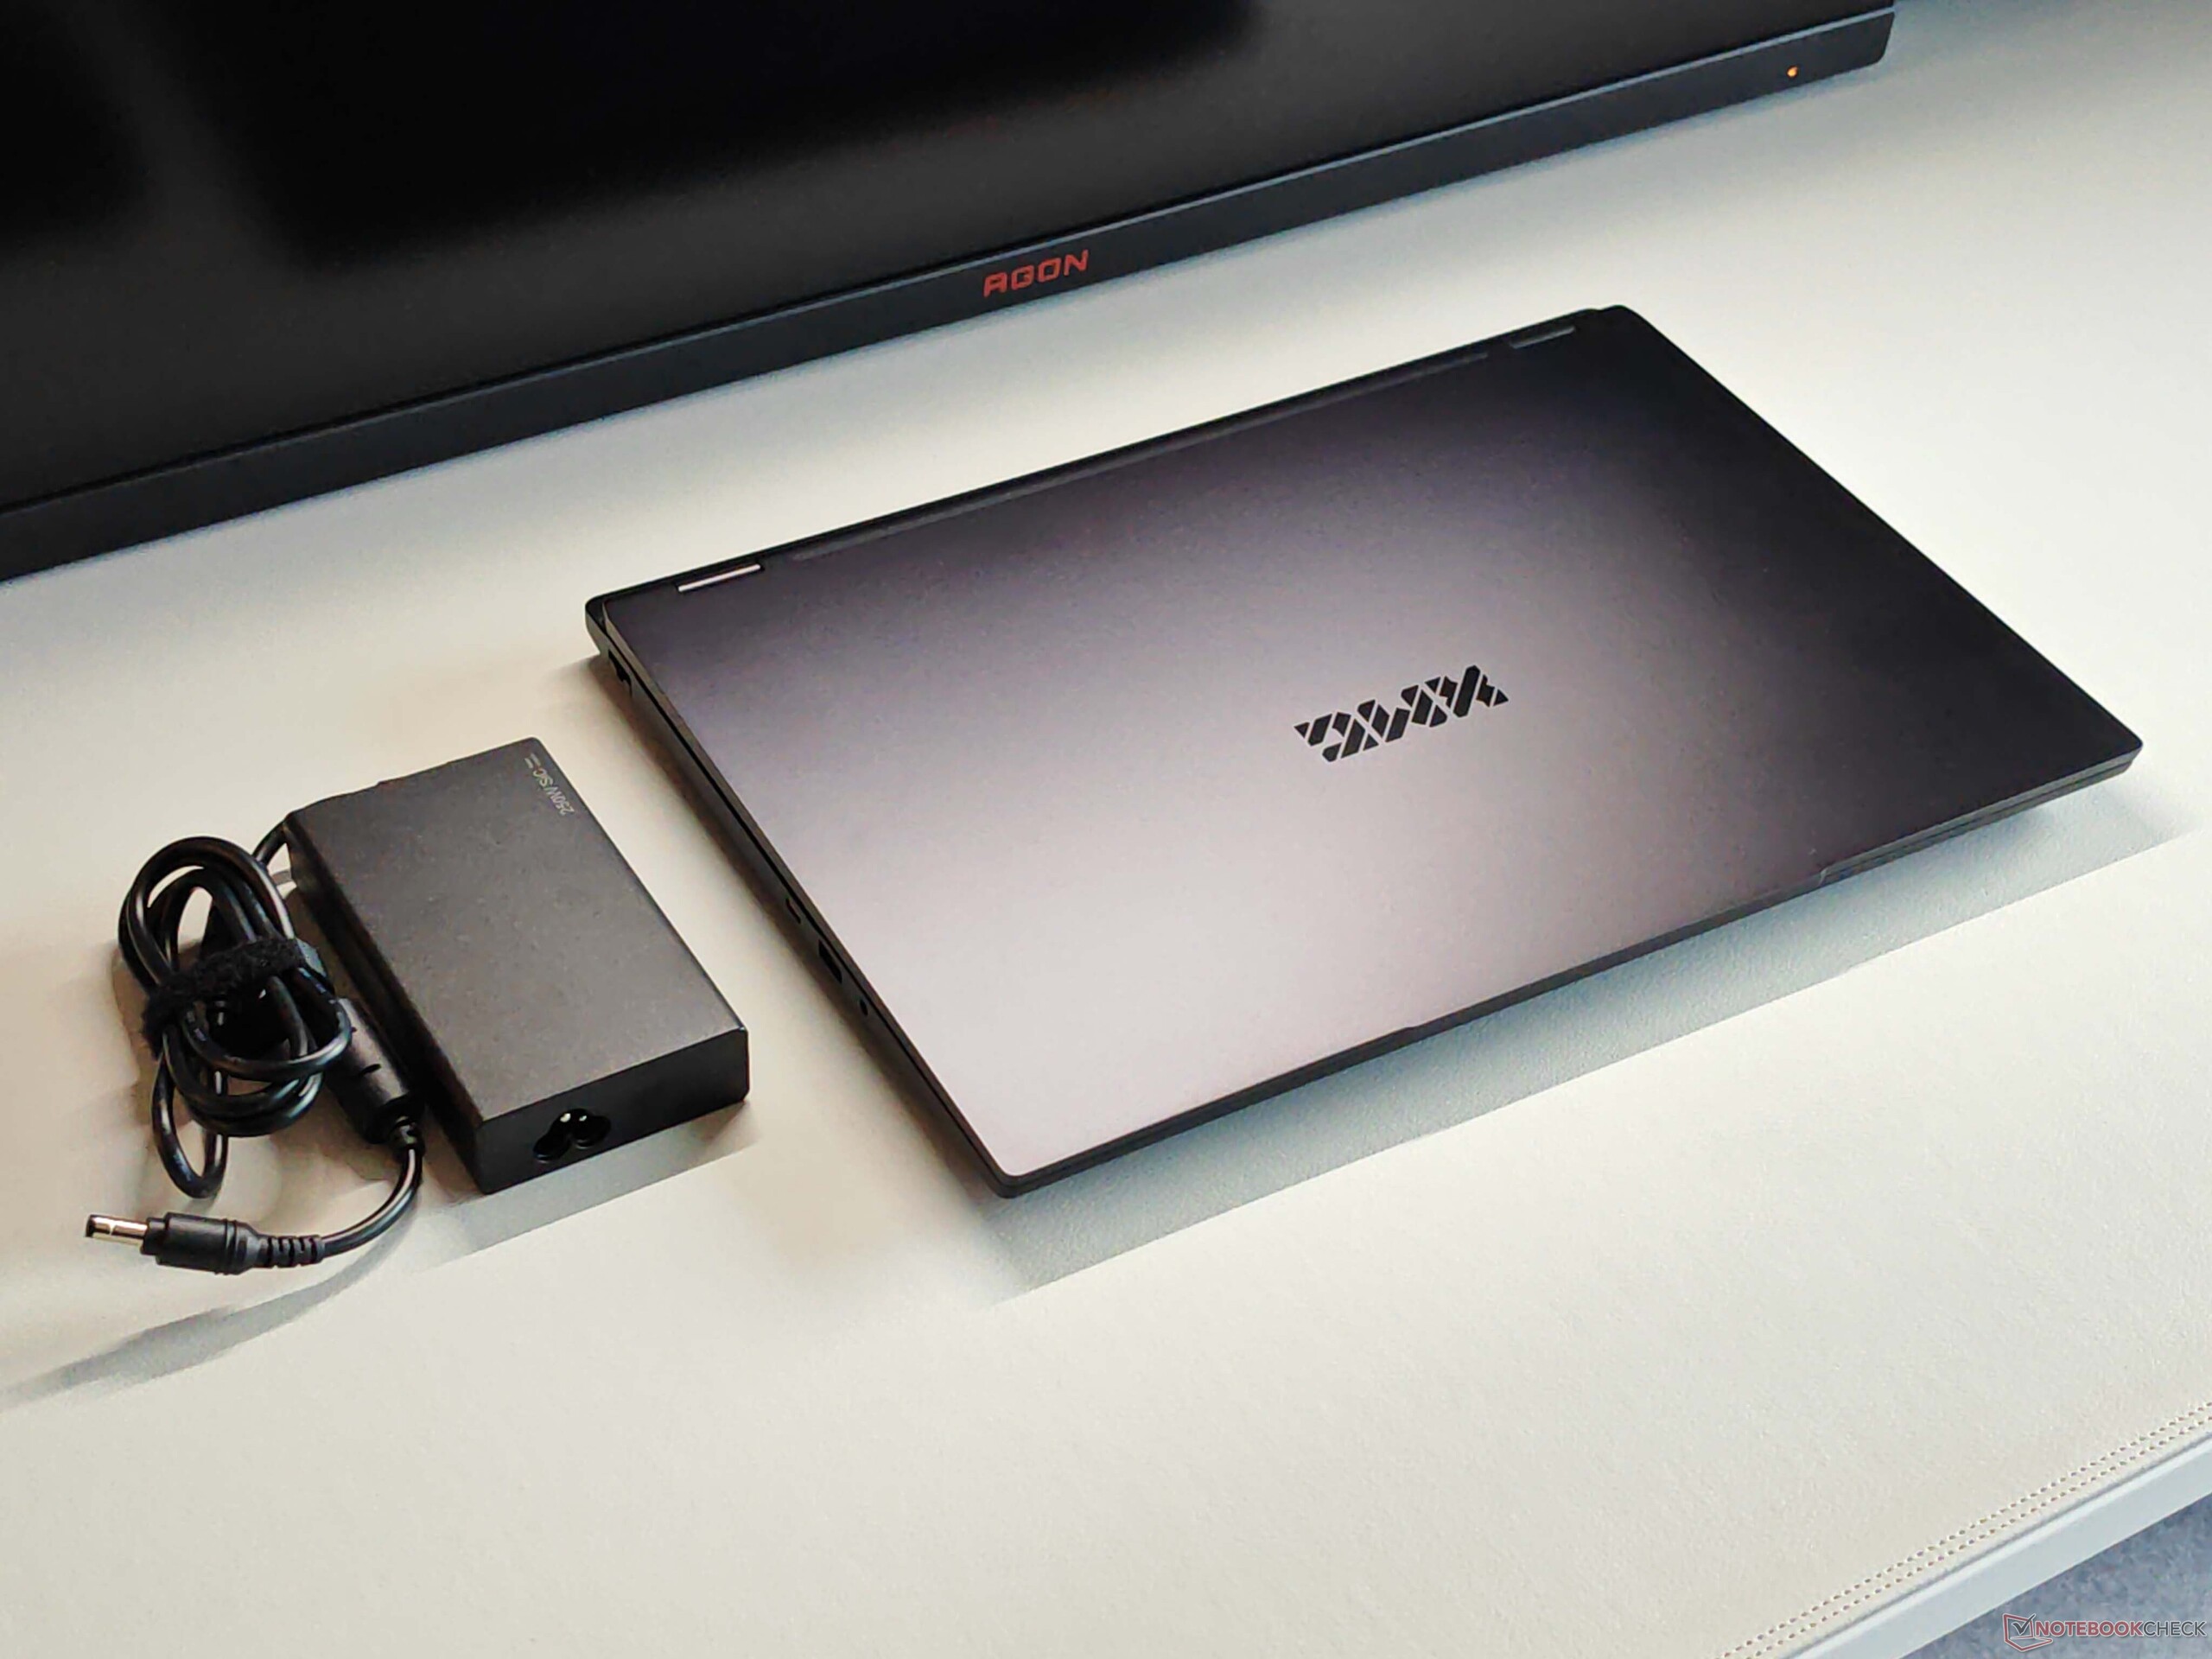
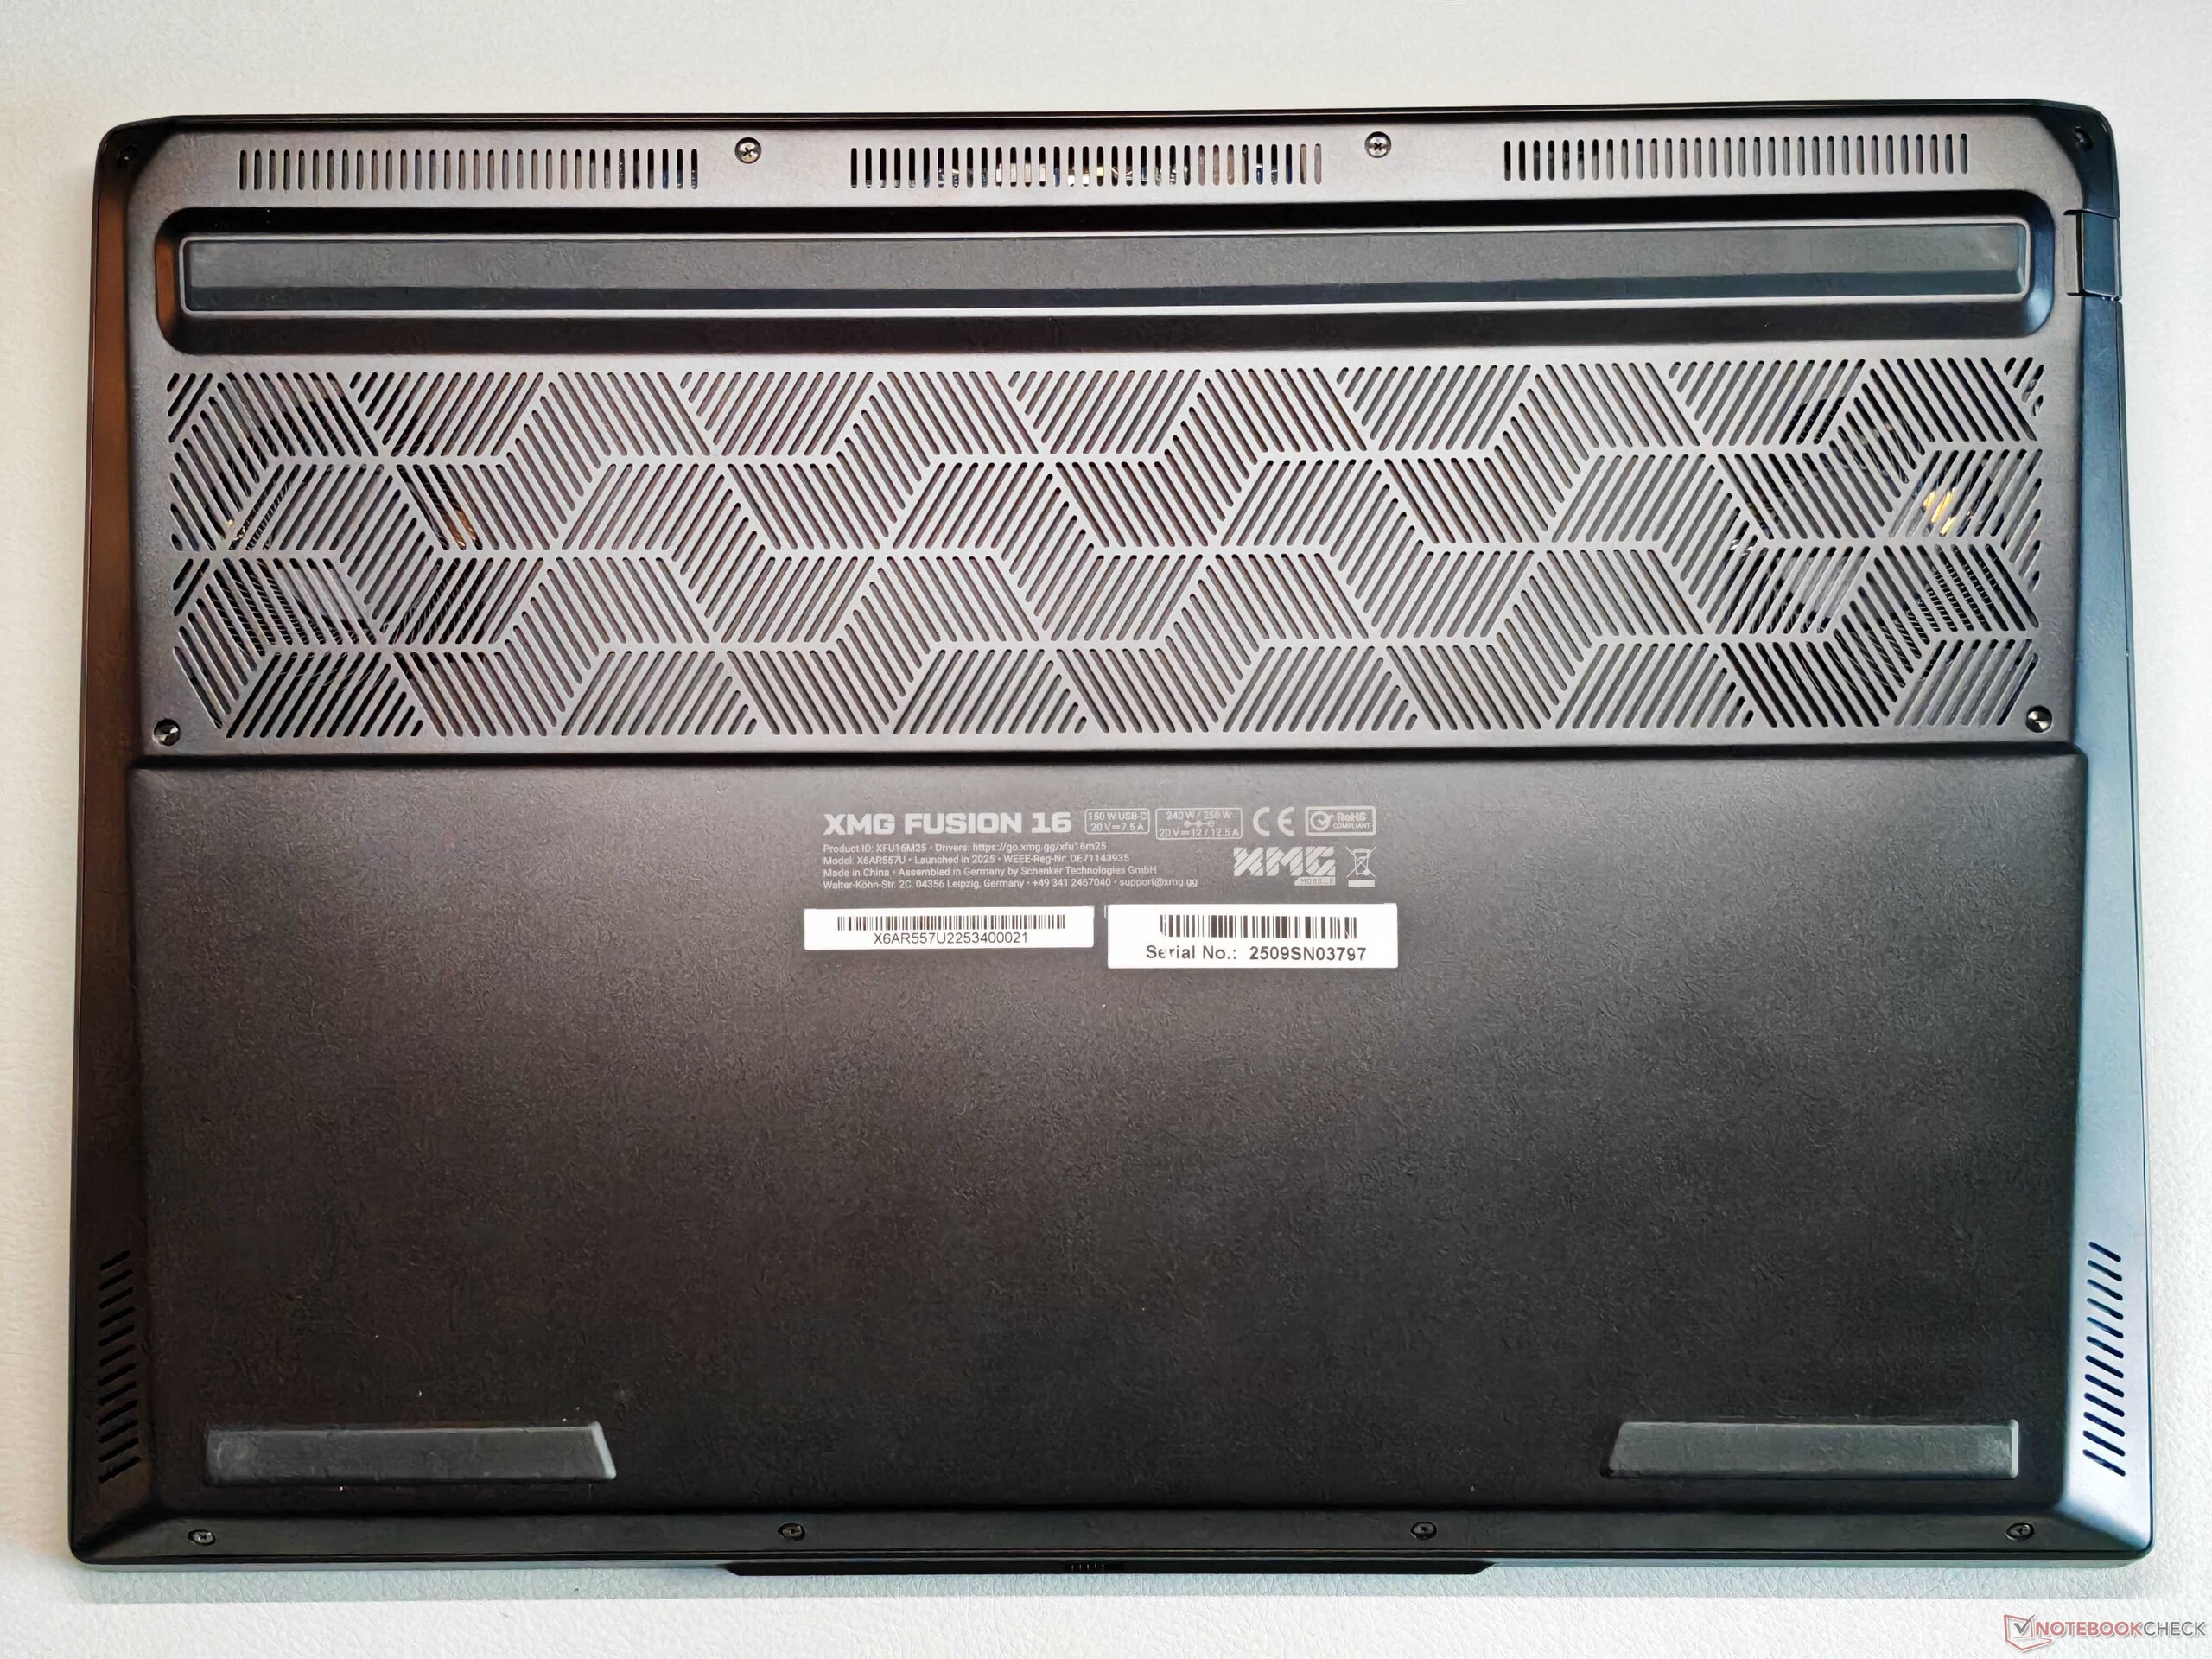
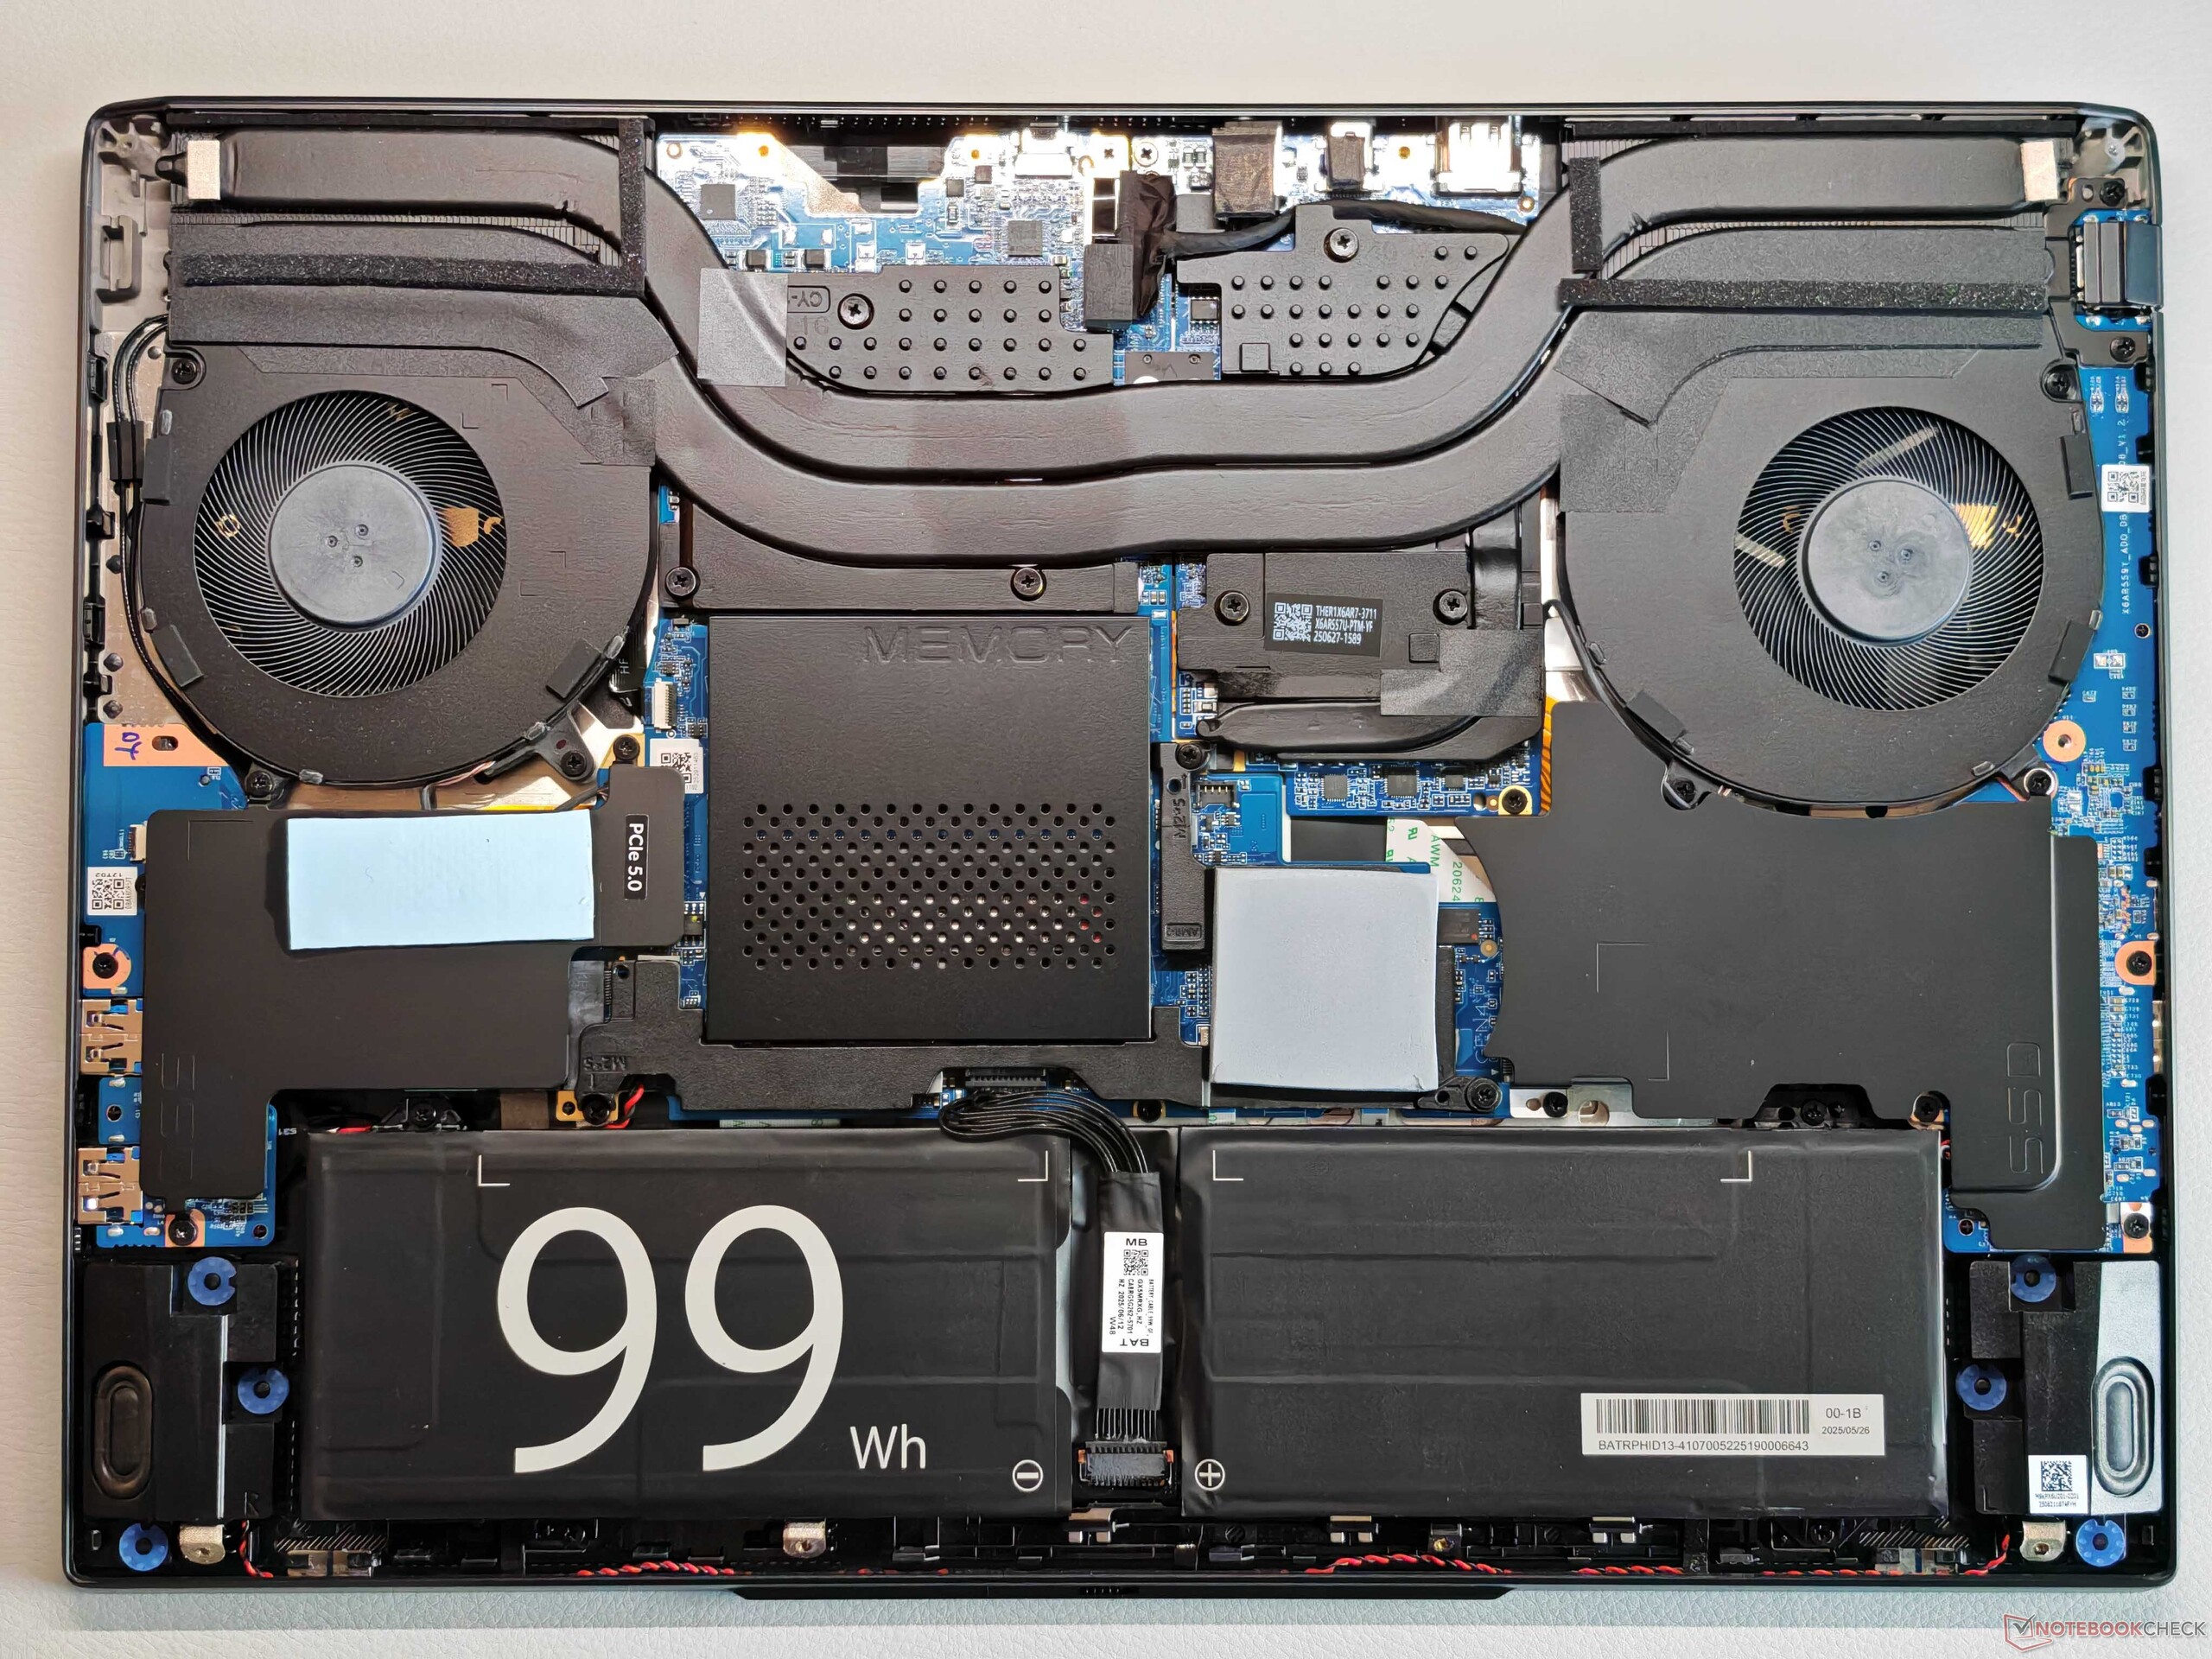
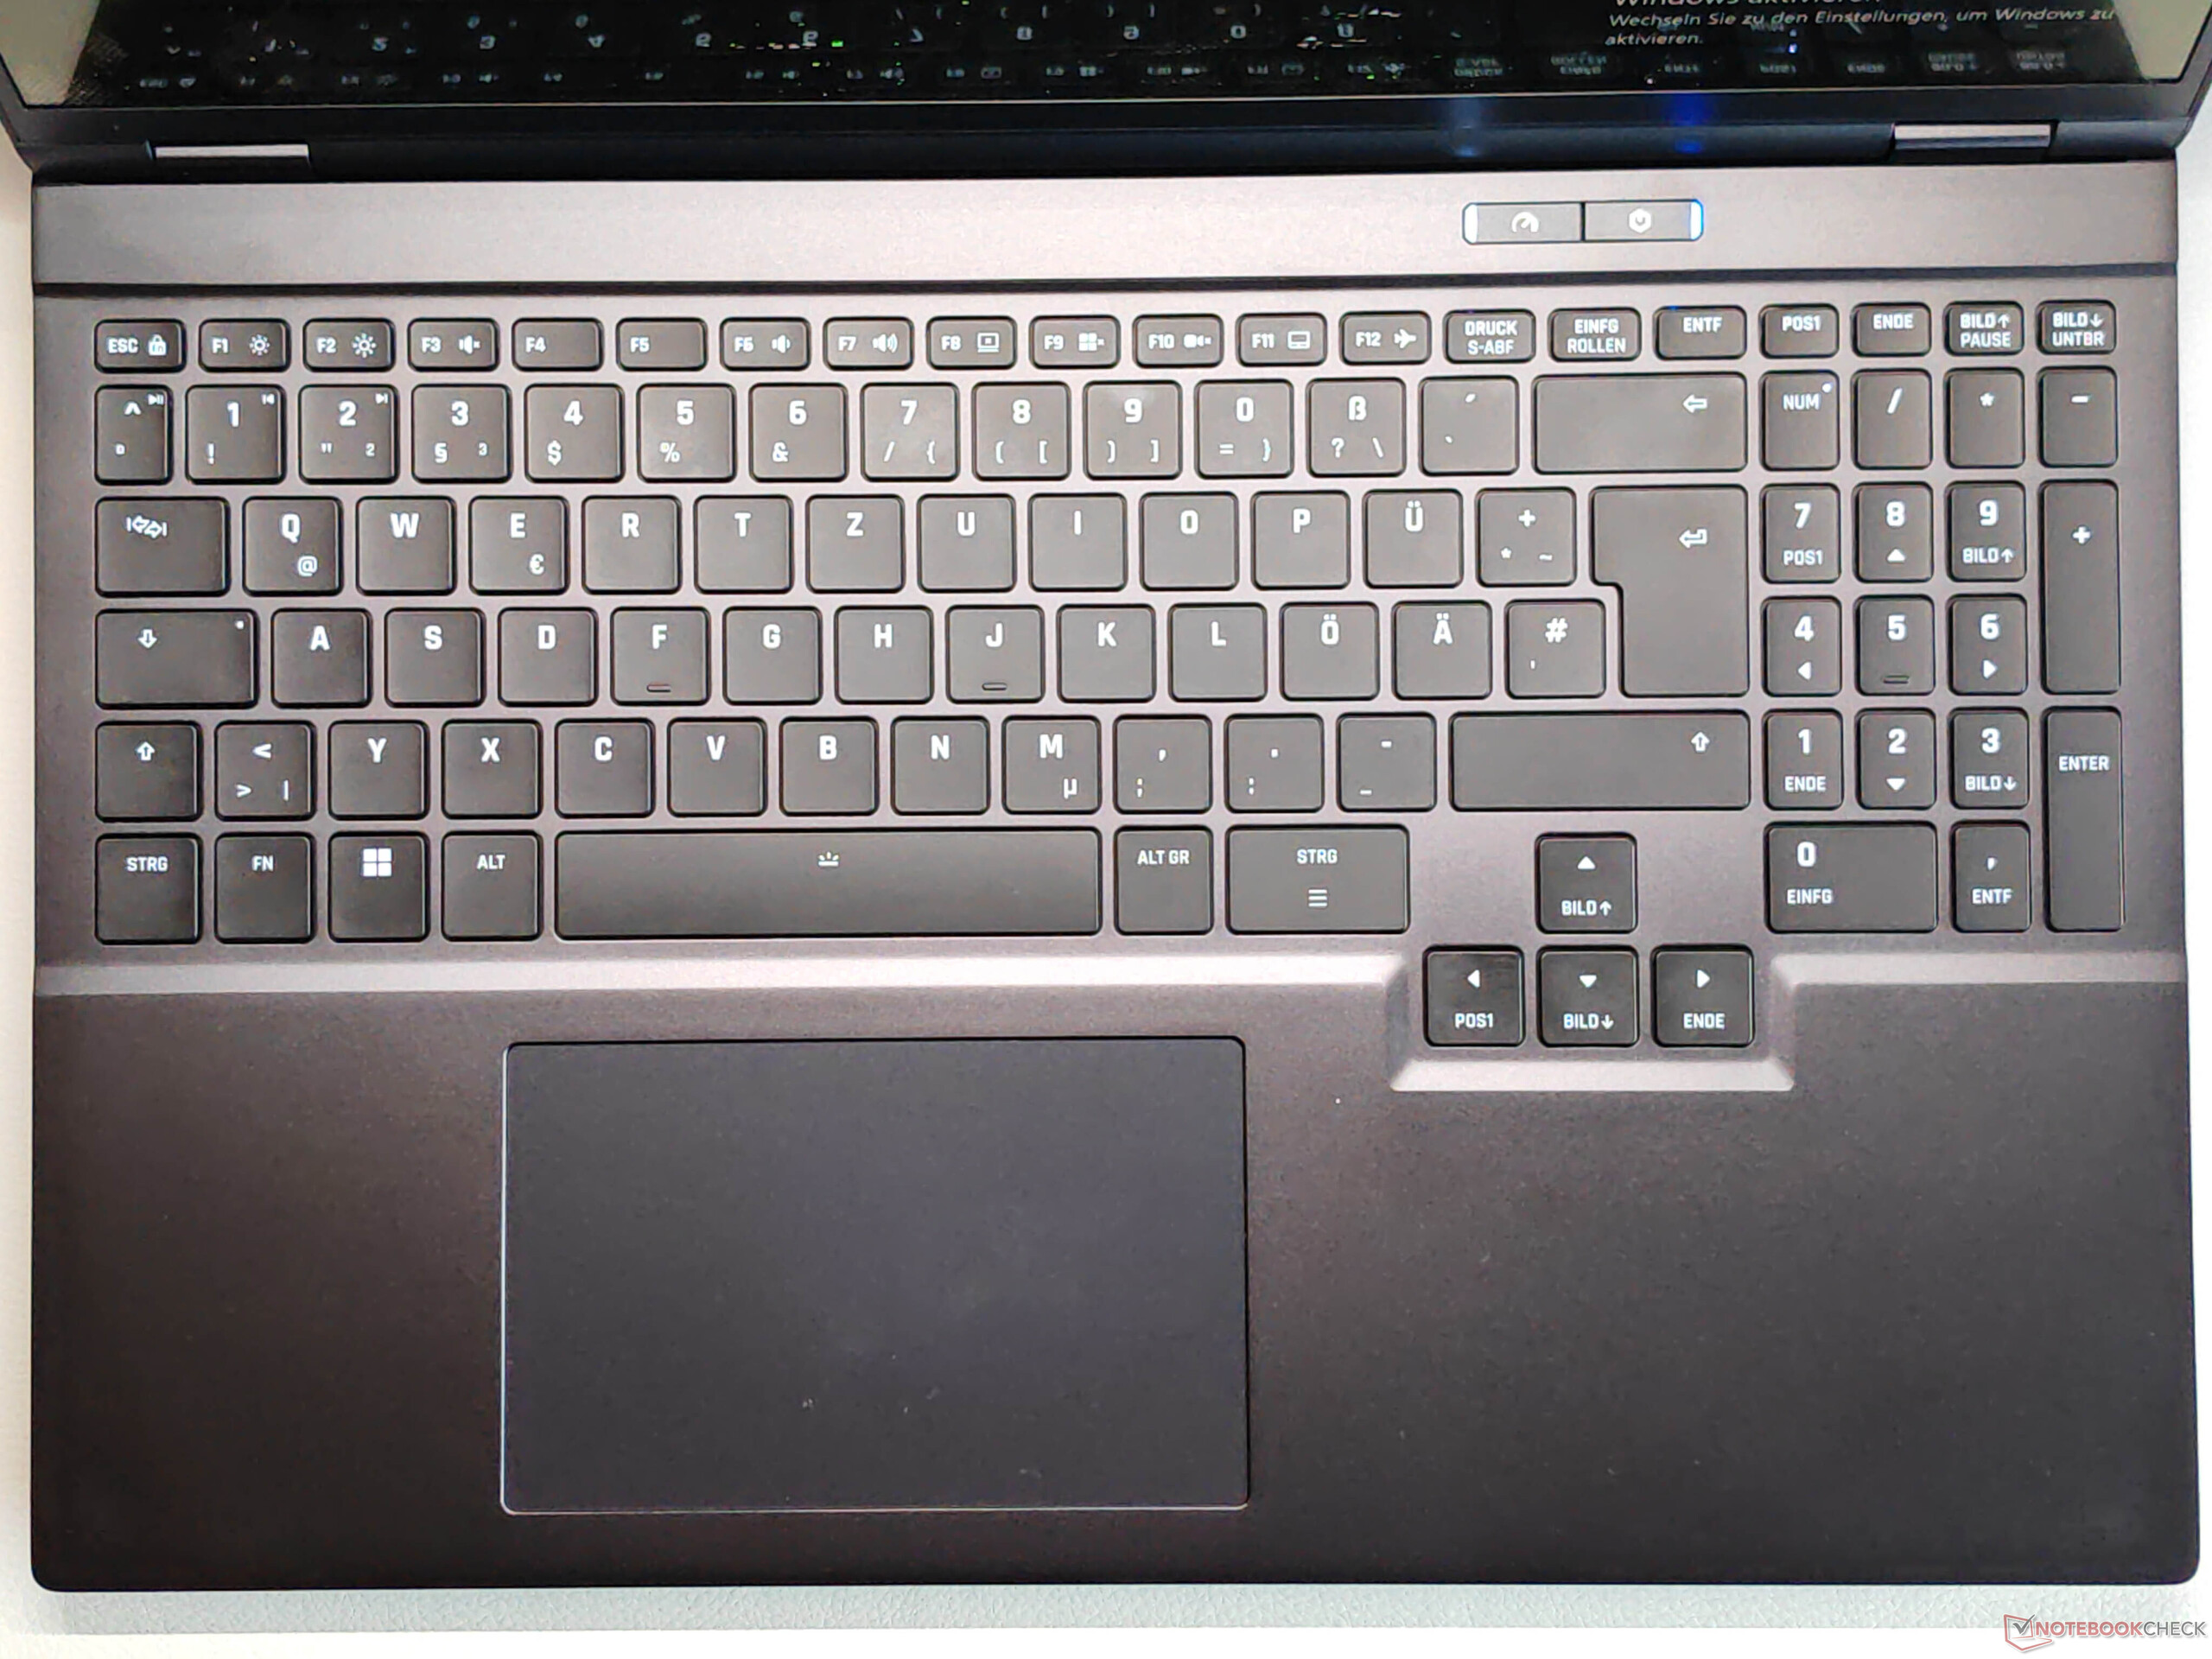
Estojos e equipamentos
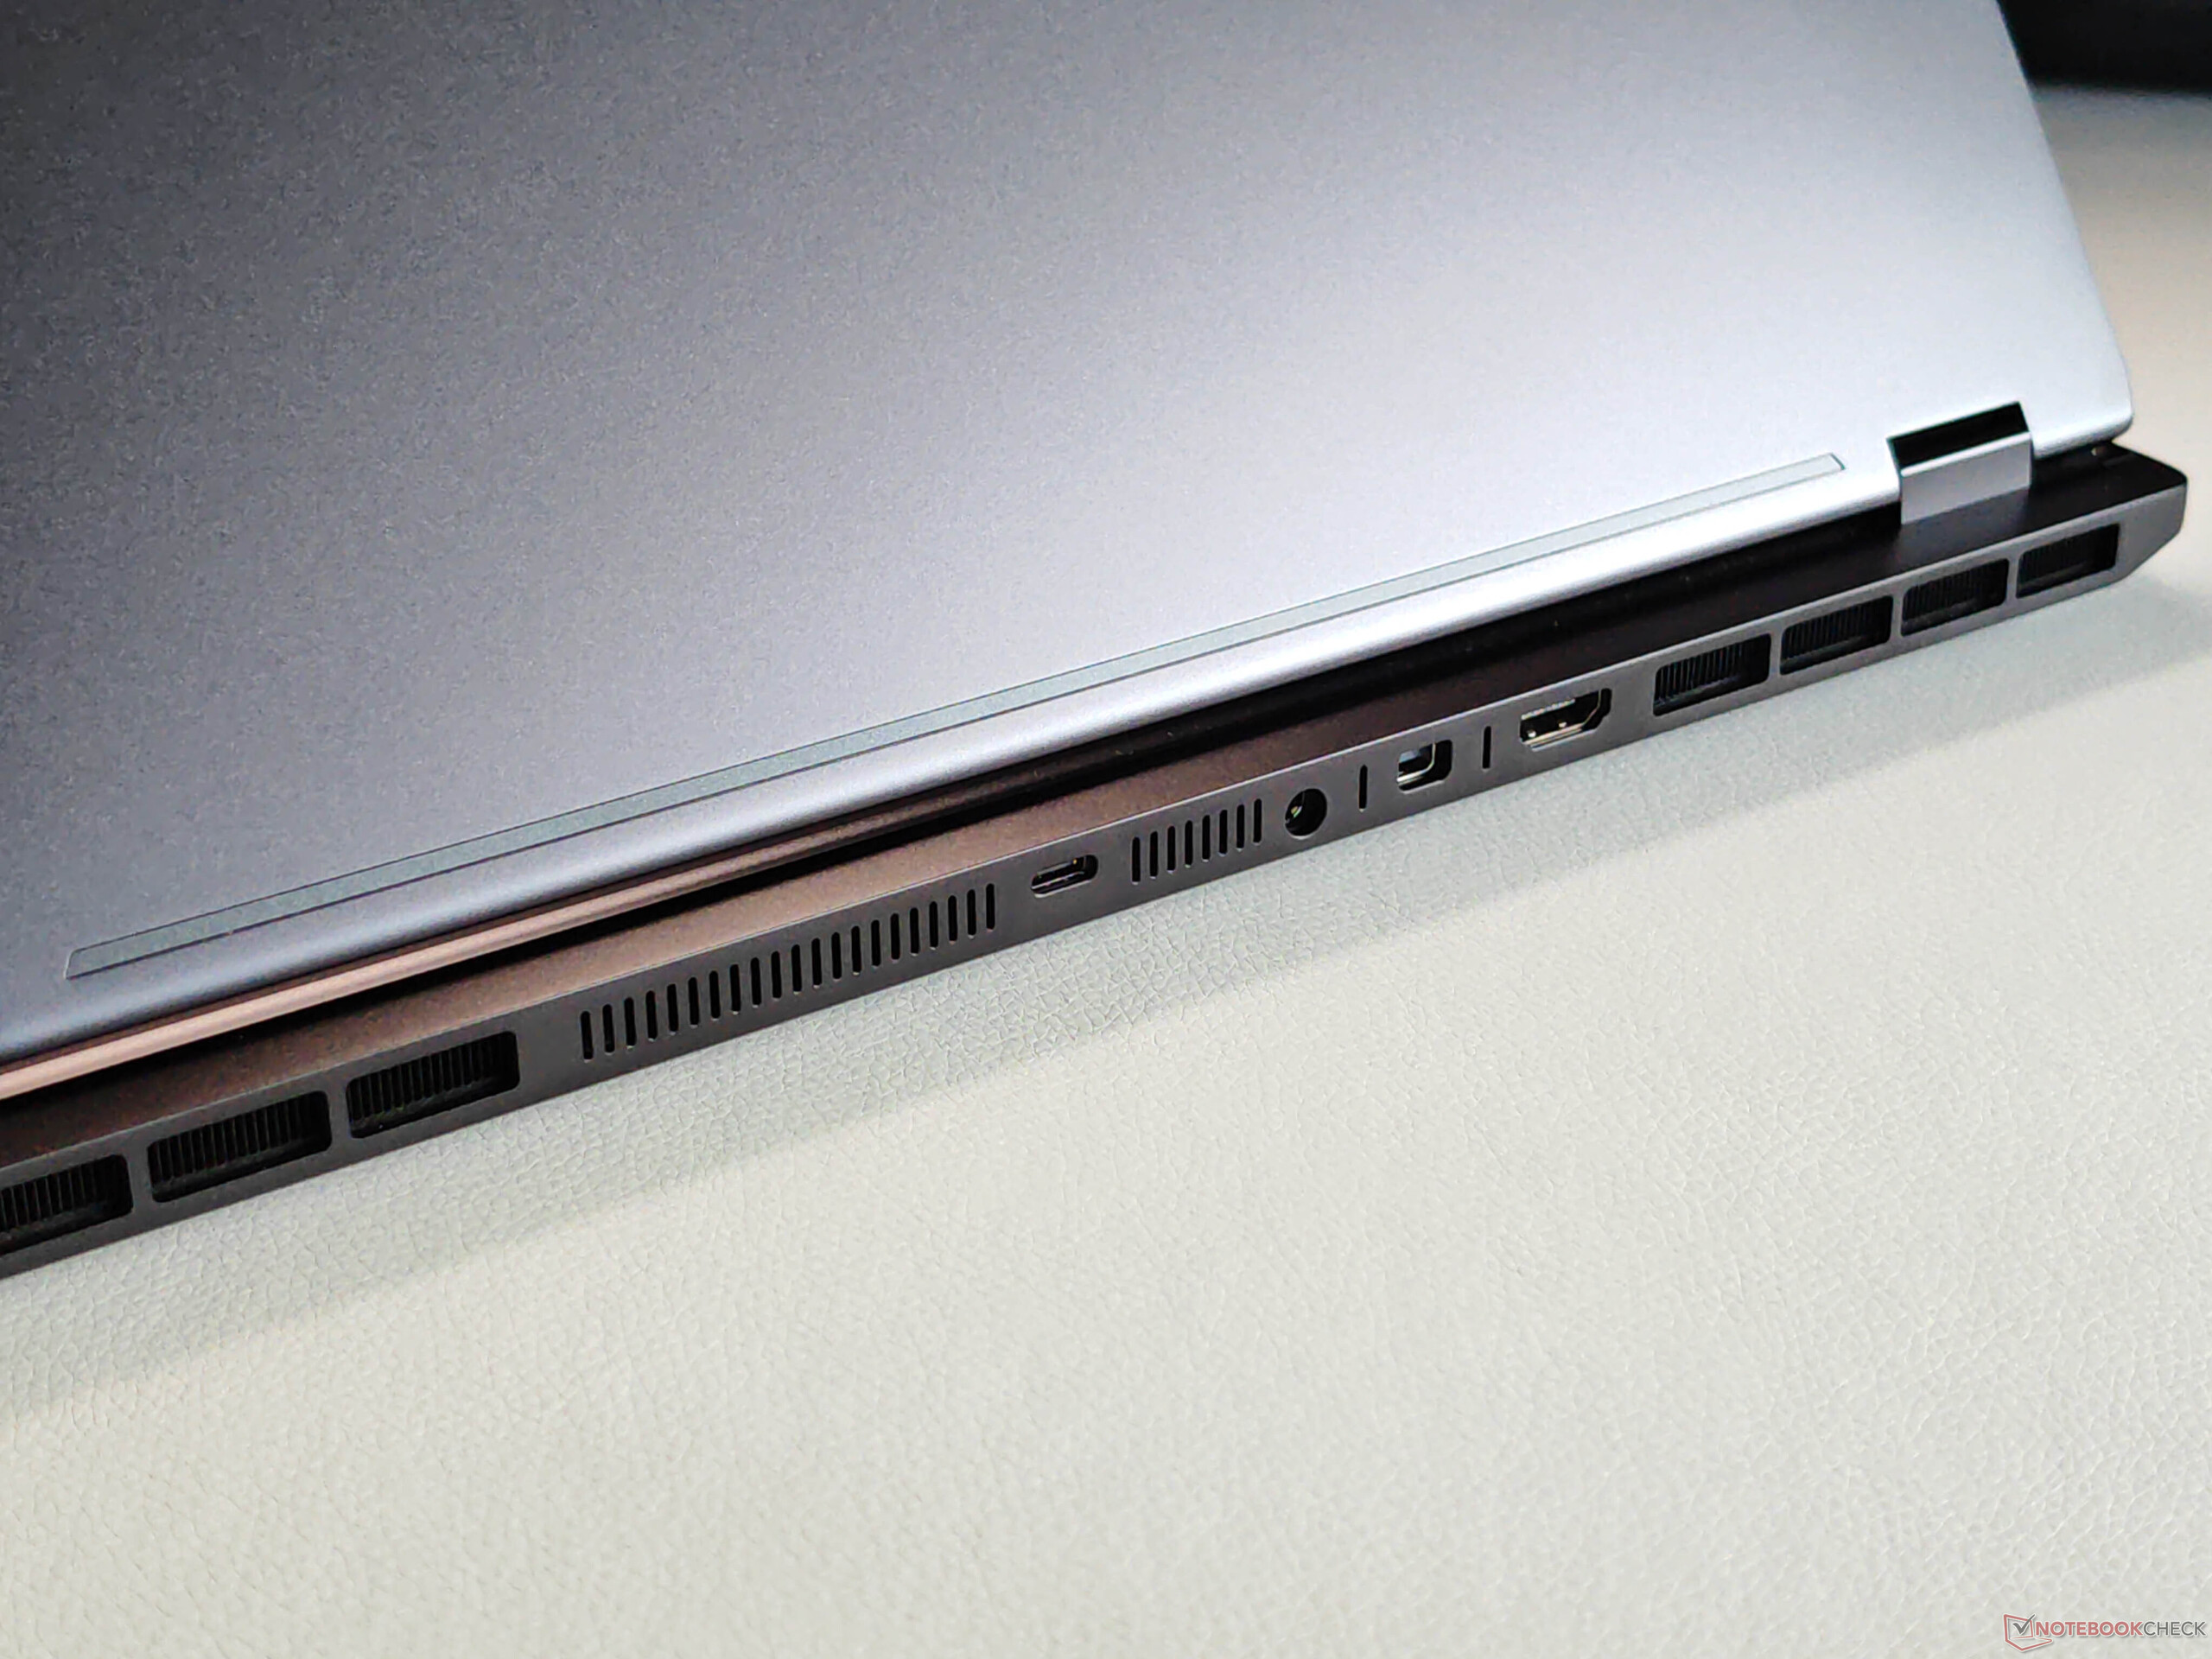
Não há diferenças no gabinete e nos dispositivos de entrada em comparação com o já testado XMG Core 16a nova versão OLED é apenas alguns gramas mais leve que o modelo IPS. No entanto, os recursos do novo Fusion 16 são um pouco melhores, já que uma porta Thunderbolt 4 também está disponível, além de um módulo Wi-Fi 7.


| SD Card Reader | |
| average JPG Copy Test (av. of 3 runs) | |
| Aorus Elite 16 AE6H (AV PRO microSD 128 GB V60) | |
| Schenker XMG Core 16 M25 (Angelbird AV Pro V60) | |
| Média da turma Gaming (20.9 - 210, n=54, últimos 2 anos) | |
| Schenker XMG FUSION 16 (M25) (Angelbird AV Pro V60) | |
| maximum AS SSD Seq Read Test (1GB) | |
| Schenker XMG Core 16 M25 (Angelbird AV Pro V60) | |
| Aorus Elite 16 AE6H (AV PRO microSD 128 GB V60) | |
| Média da turma Gaming (25.5 - 261, n=51, últimos 2 anos) | |
| Schenker XMG FUSION 16 (M25) (Angelbird AV Pro V60) | |
| Networking | |
| Schenker XMG FUSION 16 (M25) | |
| iperf3 transmit AXE11000 | |
| iperf3 receive AXE11000 | |
| Lenovo Legion Pro 5 16IAX10, RTX 5070 | |
| iperf3 transmit AXE11000 | |
| iperf3 receive AXE11000 | |
| iperf3 transmit AXE11000 6GHz | |
| Schenker XMG Core 16 M25 | |
| iperf3 transmit AXE11000 | |
| iperf3 receive AXE11000 | |
| Asus TUF Gaming A16 FA608UP | |
| iperf3 transmit AXE11000 | |
| iperf3 receive AXE11000 | |
| MSI Crosshair 16 HX AI D2XWGKG | |
| iperf3 transmit AXE11000 | |
| iperf3 receive AXE11000 | |
| iperf3 transmit AXE11000 6GHz | |
| iperf3 receive AXE11000 6GHz | |
| Aorus Elite 16 AE6H | |
| iperf3 transmit AXE11000 | |
| iperf3 receive AXE11000 | |
| Gigabyte Gaming A16 GA6H | |
| iperf3 transmit AXE11000 | |
| iperf3 receive AXE11000 | |

 GeForce RTX 5070 Laptop, Ultra 9 275HX, Samsung 9100 Pro 2 TB")
 GeForce RTX 5070 Laptop, Ultra 9 275HX, Samsung 9100 Pro 2 TB")
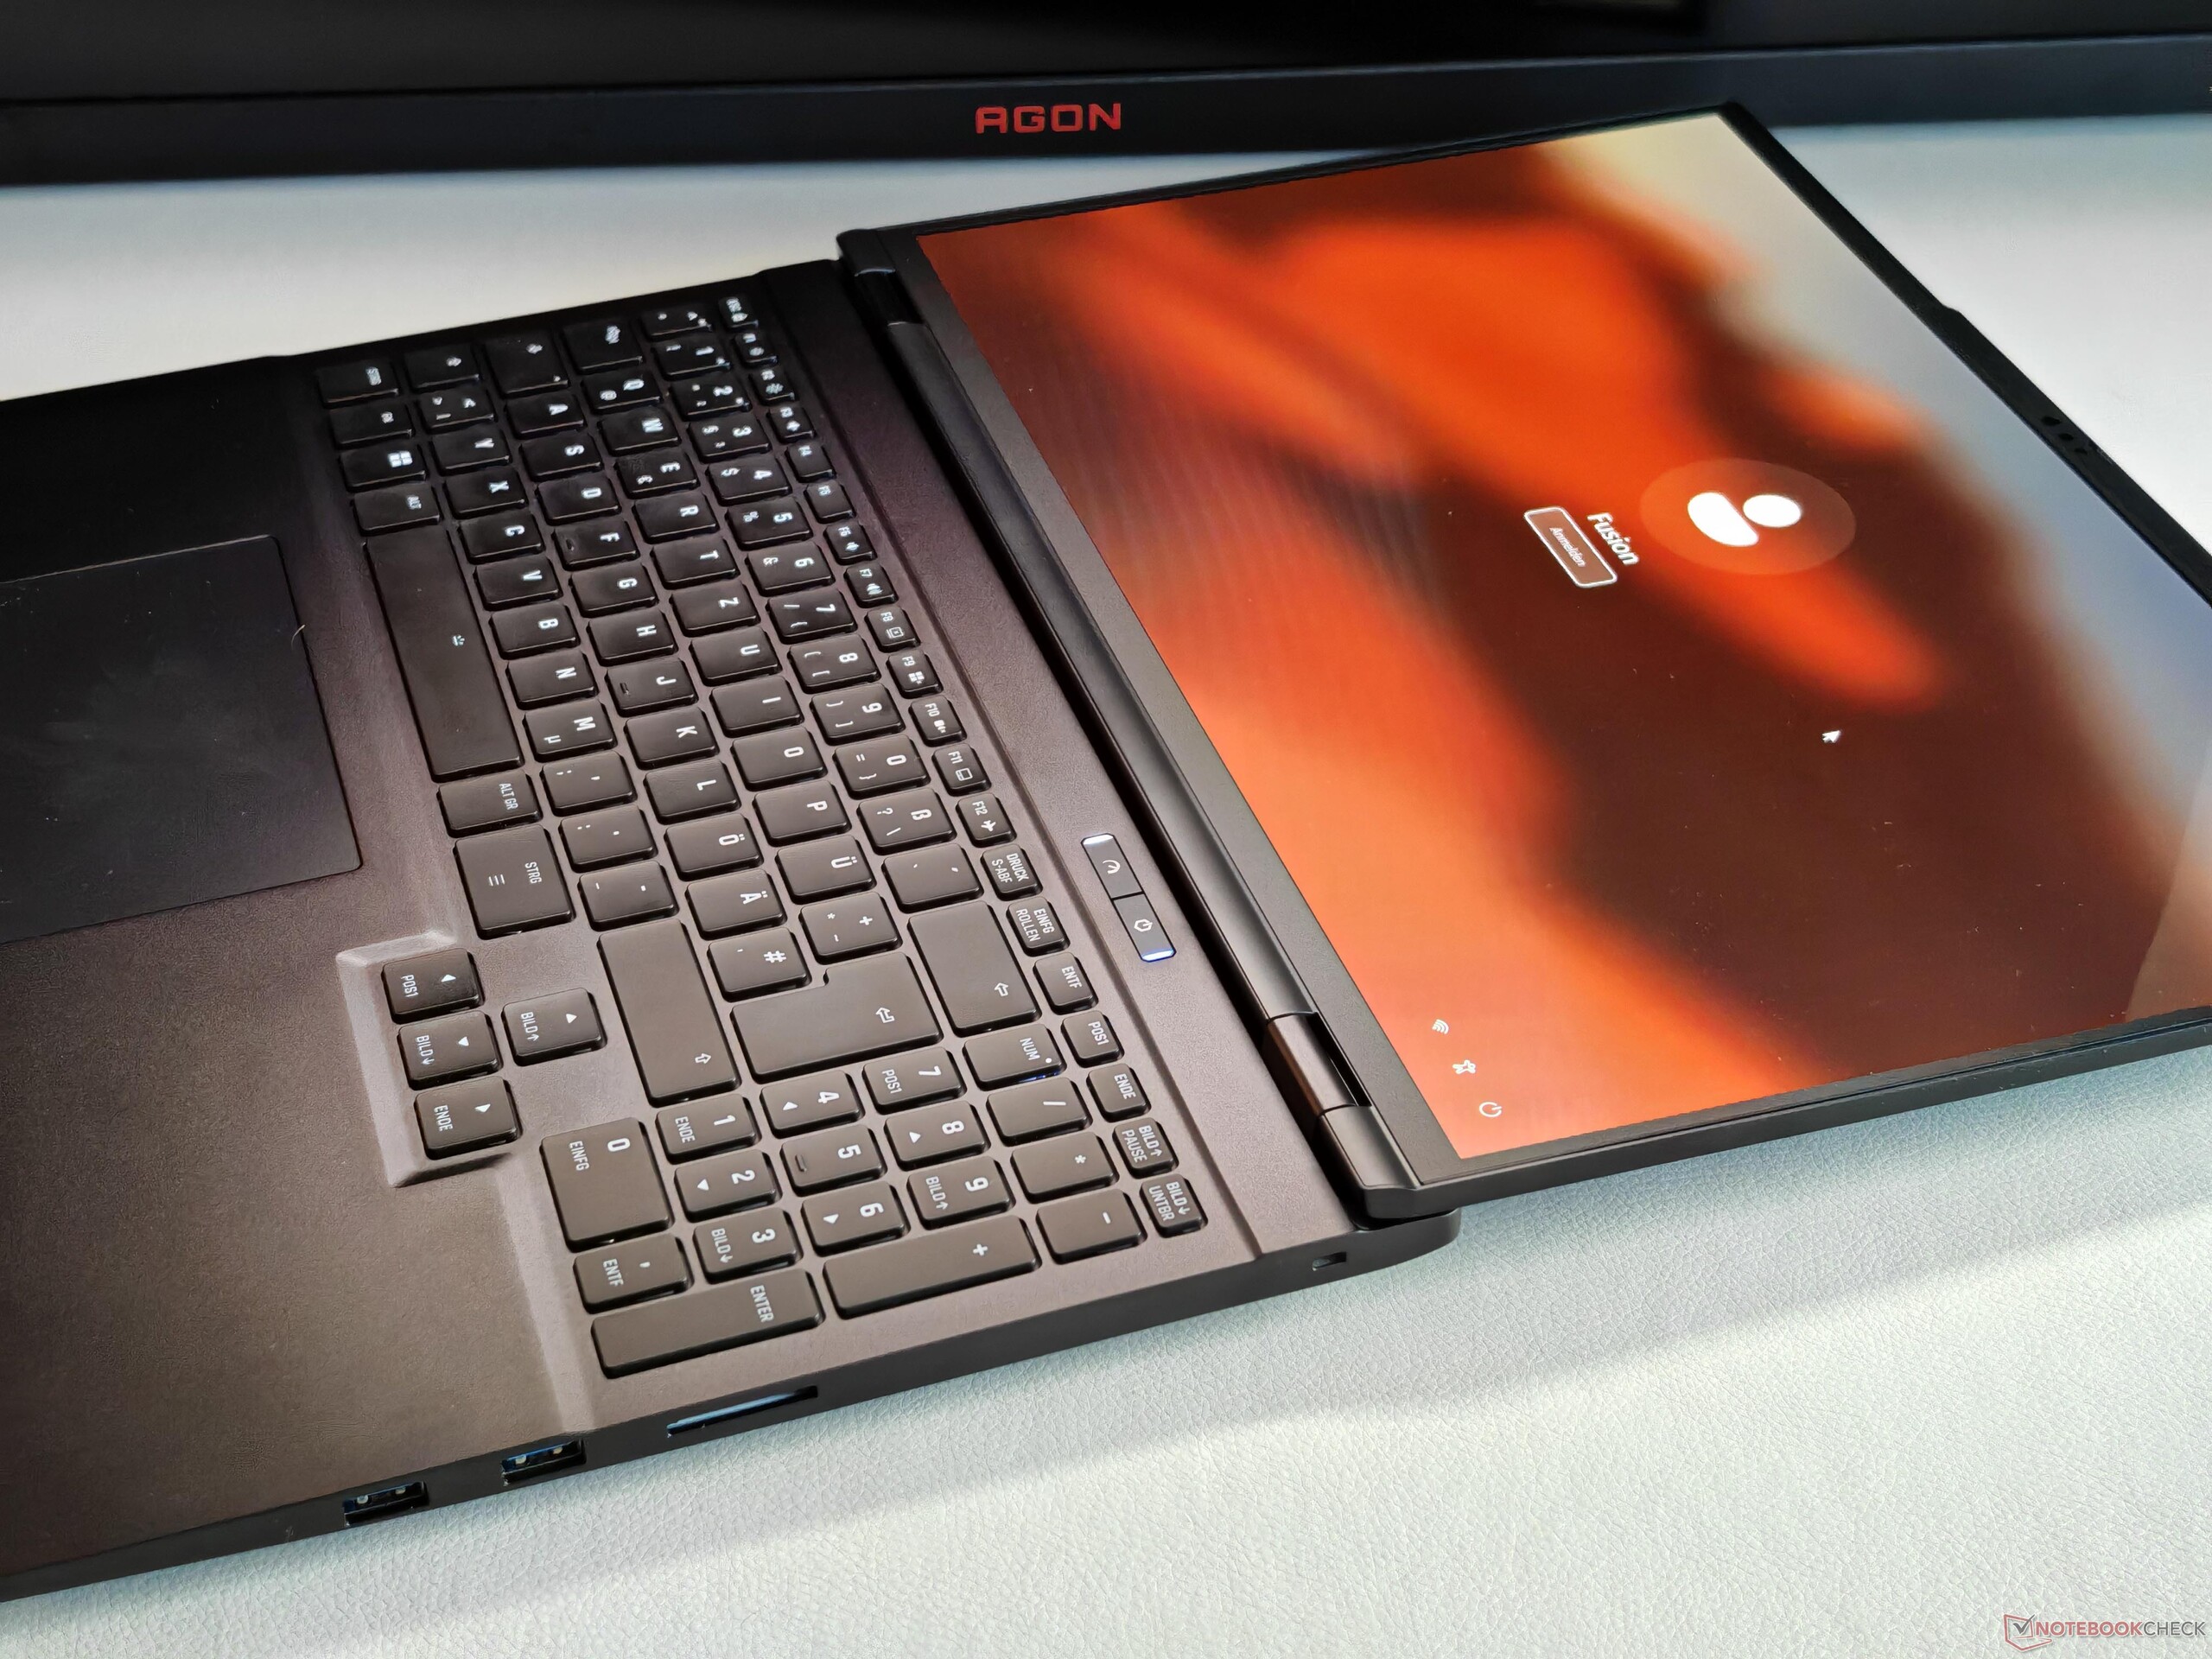
Tela - OLED de 120 Hz
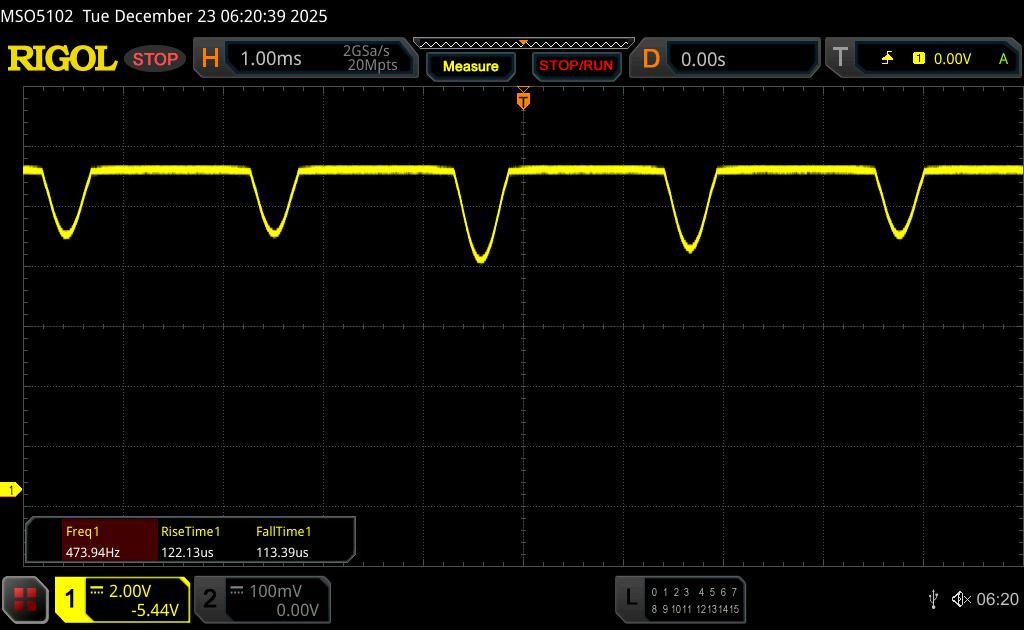
O Fusion 16 está disponível com o conhecido painel IPS (300 Hz) do Core 16 ou o novo painel OLED da Samsung (2.880 × 1.800 pixels, 16:10, 120 Hz, sobretaxa de €130). A qualidade da imagem na tela OLED brilhante é excelente, oferecendo cores vibrantes, alto contraste e tempos de resposta extremamente rápidos. No entanto, a cintilação PWM está presente a 480 Hz, embora a amplitude seja relativamente baixa.
O brilho médio no modo SDR mede 433 cd/m² (com um nível de preto de 0), enquanto o brilho HDR atinge um pico de pouco menos de 500 cd/m². Teria sido desejável um brilho mais alto, especialmente no modo HDR. O XMG fornece vários perfis calibrados de fábrica, mas nenhum deles é totalmente convincente. Em nossa análise usando o software profissional CalMAN, o perfil sRGB oferece os melhores resultados. Com nossa própria calibração (o perfil está disponível para download gratuito na caixa abaixo), a tela pode ser melhorada ainda mais, tornando o painel adequado também para edição de imagens.
| |||||||||||||||||||||||||
iluminação: 99 %
iluminação com acumulador: 434 cd/m²
Contraste: ∞:1 (Preto: 0 cd/m²)
ΔE ColorChecker Calman: 3 | ∀{0.5-29.43 Ø4.72}
calibrated: 1.4
ΔE Greyscale Calman: 3.4 | ∀{0.09-98 Ø4.97}
93.3% AdobeRGB 1998 (Argyll 3D)
100% sRGB (Argyll 3D)
99.9% Display P3 (Argyll 3D)
Gamma: 2.47
CCT: 6452 K
| Schenker XMG FUSION 16 (M25) ATNA60CL10_0, OLED, 2880x1800, 16", 120 Hz | Lenovo Legion Pro 5 16IAX10, RTX 5070 ATNA60HS01-0 (Samsung SDC420A), OLED, 2650x1600, 16", 165 Hz | Schenker XMG Core 16 M25 MNG007DA6-4, IPS, 2560x1600, 16", 300 Hz | Asus TUF Gaming A16 FA608UP MNG007DA5-3, IPS, 2560x1600, 16", 165 Hz | MSI Crosshair 16 HX AI D2XWGKG AUO B160QAN02.3, IPS, 2560x1600, 16", 240 Hz | Aorus Elite 16 AE6H NE160QDM-NYJ, IPS, 2560x1600, 16", 165 Hz | Gigabyte Gaming A16 GA6H NE160QDM-NYJ (BOE0C80), IPS, 2560x1600, 16", 165 Hz | |
|---|---|---|---|---|---|---|---|
| Display | 0% | -2% | -19% | -5% | -17% | -18% | |
| Display P3 Coverage (%) | 99.9 | 99.3 -1% | 98.8 -1% | 69.4 -31% | 95.5 -4% | 70.8 -29% | 69.4 -31% |
| sRGB Coverage (%) | 100 | 100 0% | 100 0% | 97.2 -3% | 99.7 0% | 99.8 0% | 99.5 0% |
| AdobeRGB 1998 Coverage (%) | 93.3 | 93.9 1% | 88.4 -5% | 71.9 -23% | 83.9 -10% | 72.6 -22% | 71.6 -23% |
| Response Times | -121% | -1278% | -877% | -832% | -2081% | -1781% | |
| Response Time Grey 50% / Grey 80% * (ms) | 0.56 ? | 2 ? -257% | 10.7 ? -1811% | 6.3 ? -1025% | 3.59 ? -541% | 16.8 ? -2900% | 14.3 ? -2454% |
| Response Time Black / White * (ms) | 0.58 ? | 1.4 ? -141% | 4.9 ? -745% | 4.8 ? -728% | 7.09 ? -1122% | 7.9 ? -1262% | 7 ? -1107% |
| PWM Frequency (Hz) | 480 ? | 1300 | |||||
| PWM Amplitude * (%) | 26 | 16.7 36% | |||||
| Screen | -2% | 16% | 26% | -49% | -20% | -29% | |
| Brightness middle (cd/m²) | 434 | 521 20% | 512 18% | 480 11% | 472 9% | 443 2% | 432 0% |
| Brightness (cd/m²) | 433 | 519 20% | 483 12% | 456 5% | 438 1% | 433 0% | 425 -2% |
| Brightness Distribution (%) | 99 | 98 -1% | 91 -8% | 91 -8% | 88 -11% | 90 -9% | 91 -8% |
| Black Level * (cd/m²) | 0.075 | 0.43 | 0.32 | 0.4 | 0.42 | 0.37 | |
| Colorchecker dE 2000 * | 3 | 2.5 17% | 2.4 20% | 1.4 53% | 6.07 -102% | 3.82 -27% | 4.76 -59% |
| Colorchecker dE 2000 max. * | 5.1 | 4.85 5% | 3.8 25% | 2.5 51% | 9.76 -91% | 7.61 -49% | 8.59 -68% |
| Colorchecker dE 2000 calibrated * | 1.4 | 2.5 -79% | 0.9 36% | 1.3 7% | 2.25 -61% | 1.33 5% | 1.18 16% |
| Greyscale dE 2000 * | 3.4 | 3.17 7% | 3.1 9% | 1.2 65% | 6.4 -88% | 5.5 -62% | 6.2 -82% |
| Gamma | 2.47 89% | 2.35 94% | 2.41 91% | 2.16 102% | 2.52 87% | 2.249 98% | 2.079 106% |
| CCT | 6452 101% | 6454 101% | 6534 99% | 6620 98% | 7987 81% | 6549 99% | 6690 97% |
| Contrast (:1) | 6947 | 1191 | 1500 | 1180 | 1055 | 1168 | |
| Média Total (Programa/Configurações) | -41% /
-29% | -421% /
-204% | -290% /
-136% | -295% /
-168% | -706% /
-363% | -609% /
-318% |
* ... menor é melhor


Exibir tempos de resposta
| ↔ Tempo de resposta preto para branco | ||
|---|---|---|
| 0.58 ms ... ascensão ↗ e queda ↘ combinadas | ↗ 0.33 ms ascensão | 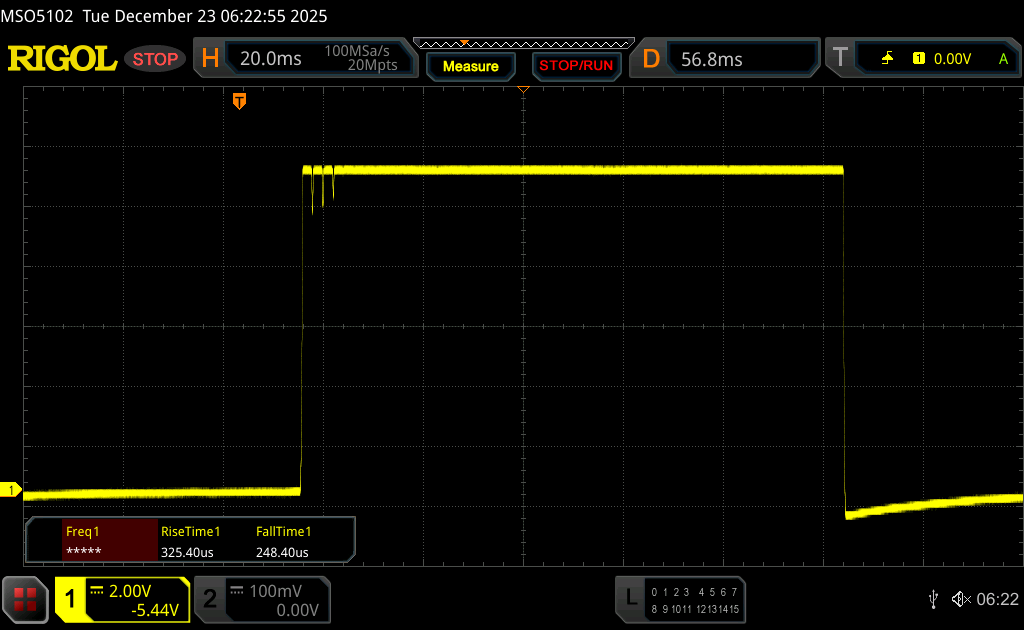 |
| ↘ 0.25 ms queda | ||
| A tela mostra taxas de resposta muito rápidas em nossos testes e deve ser muito adequada para jogos em ritmo acelerado. Em comparação, todos os dispositivos testados variam de 0.1 (mínimo) a 240 (máximo) ms. » 1 % de todos os dispositivos são melhores. Isso significa que o tempo de resposta medido é melhor que a média de todos os dispositivos testados (19.8 ms). | ||
| ↔ Tempo de resposta 50% cinza a 80% cinza | ||
| 0.56 ms ... ascensão ↗ e queda ↘ combinadas | ↗ 0.3 ms ascensão | 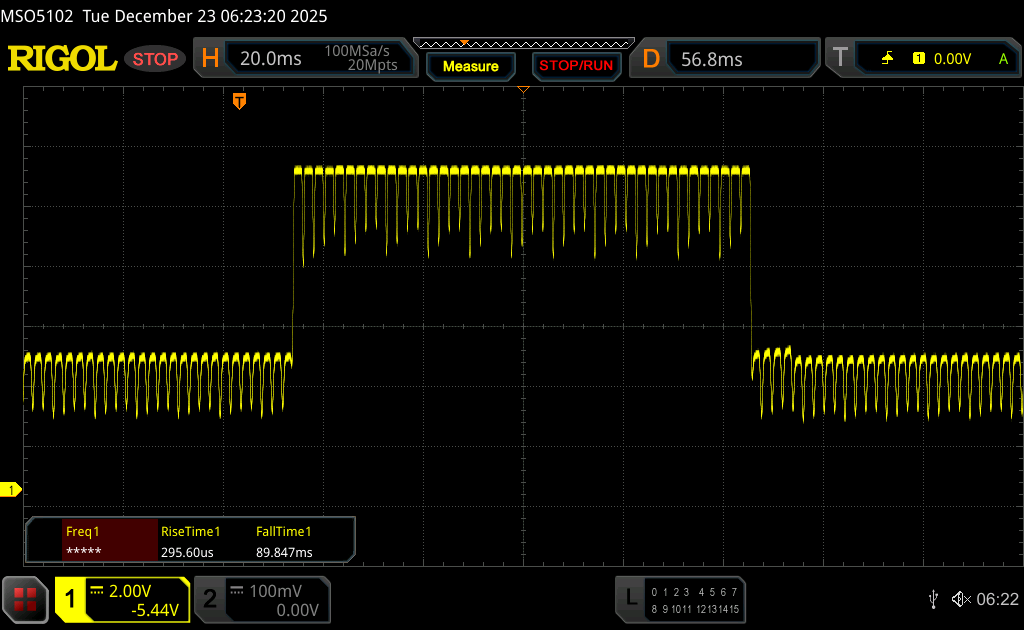 |
| ↘ 0.26 ms queda | ||
| A tela mostra taxas de resposta muito rápidas em nossos testes e deve ser muito adequada para jogos em ritmo acelerado. Em comparação, todos os dispositivos testados variam de 0.165 (mínimo) a 636 (máximo) ms. » 1 % de todos os dispositivos são melhores. Isso significa que o tempo de resposta medido é melhor que a média de todos os dispositivos testados (31 ms). | ||
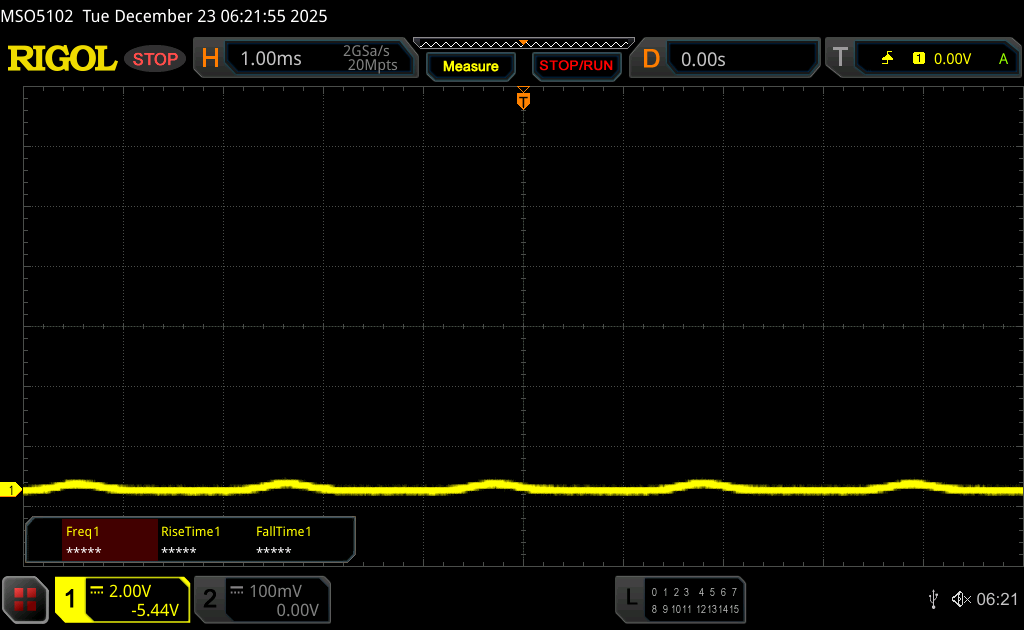
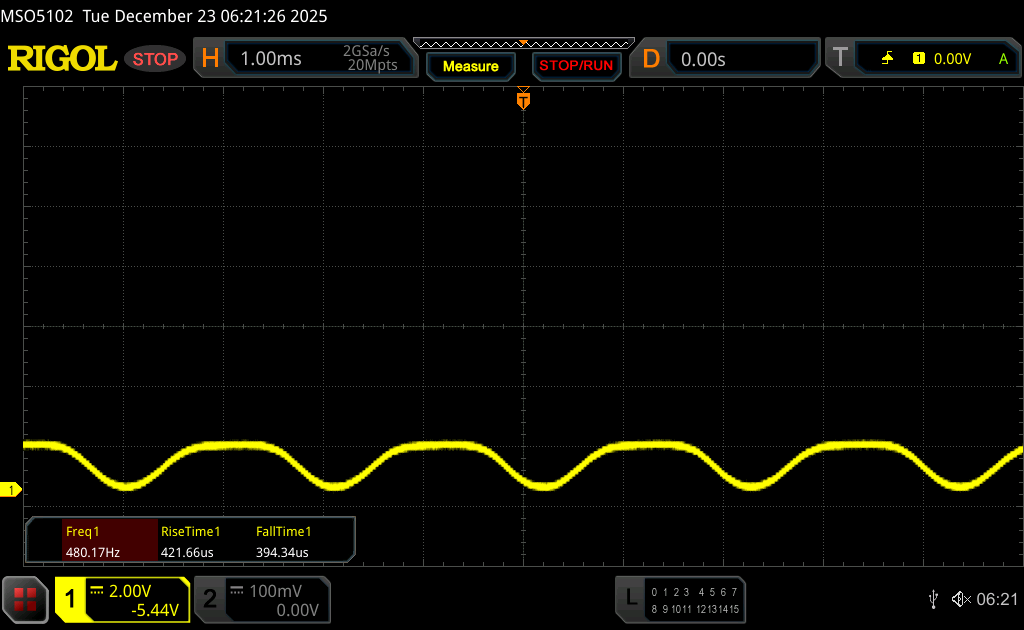
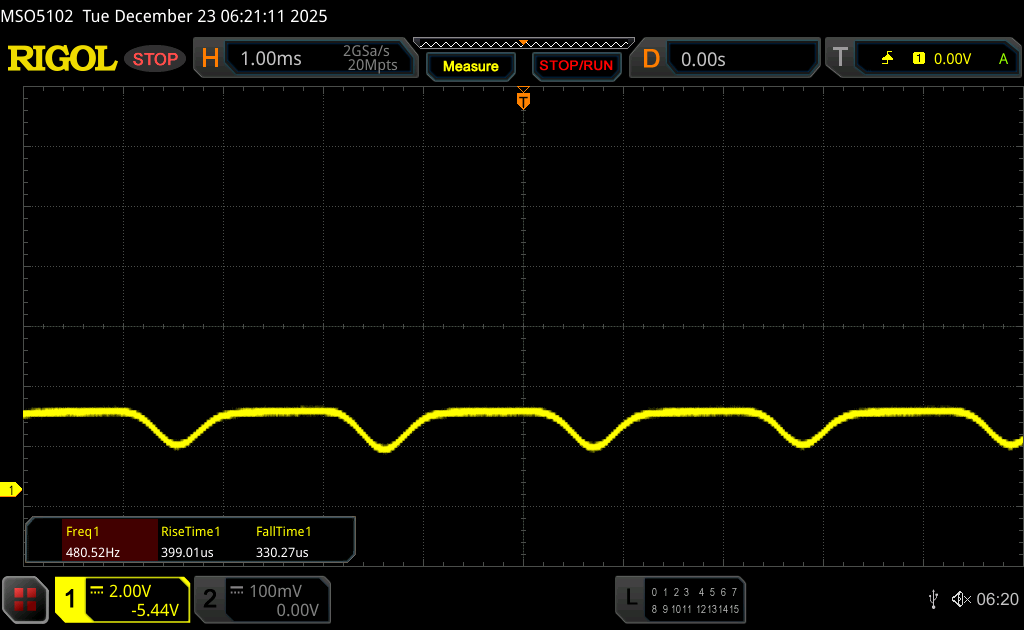
Cintilação da tela / PWM (modulação por largura de pulso)
| Tela tremeluzindo/PWM detectado | 480 Hz Amplitude: 26 % | ≤ 92 % configuração de brilho | 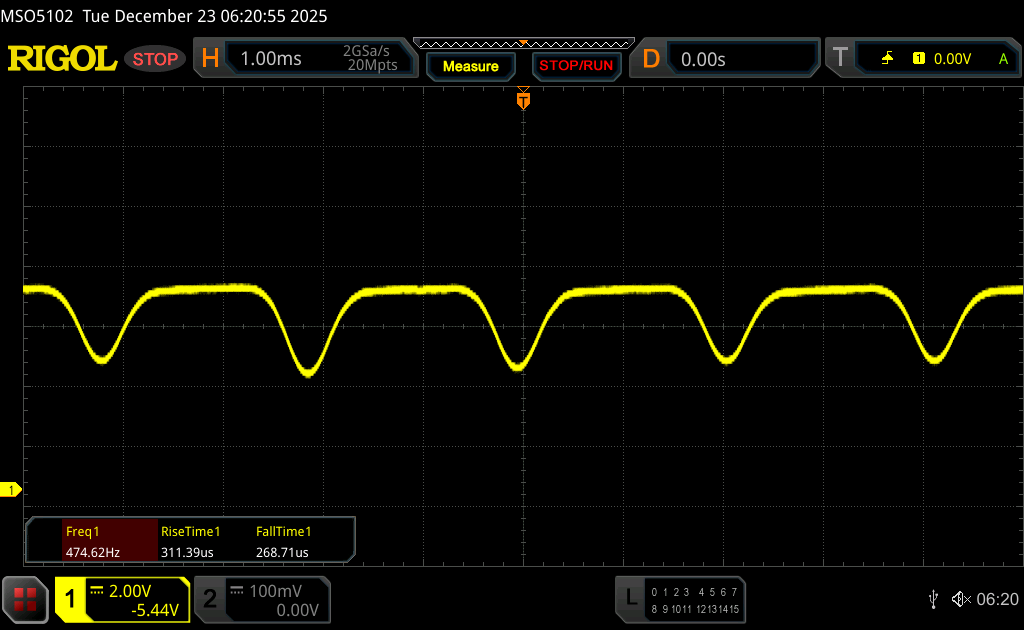 |
A luz de fundo da tela pisca em 480 Hz (pior caso, por exemplo, utilizando PWM) Cintilação detectada em uma configuração de brilho de 92 % e abaixo. Não deve haver cintilação ou PWM acima desta configuração de brilho. A frequência de 480 Hz é relativamente alta, portanto, a maioria dos usuários sensíveis ao PWM não deve notar nenhuma oscilação. No entanto, há relatos de que alguns usuários ainda são sensíveis ao PWM em 500 Hz e acima, portanto, esteja atento. [pwm_comparison] Em comparação: 52 % de todos os dispositivos testados não usam PWM para escurecer a tela. Se PWM foi detectado, uma média de 7781 (mínimo: 5 - máximo: 343500) Hz foi medida. | |||


Desempenho - Arrow Lake HX e Blackwell
Condições de teste
O XMG oferece vários perfis de energia, e executamos os benchmarks no modo Overboost - Normal. Também está disponível o modo Overboost - Extreme, mas ele não proporcionou nenhum ganho adicional de desempenho em jogos.
Processador
O Intel Core Ultra 9 275HX pode consumir até 150/140 watts no Fusion 16 e oferece excelente desempenho geral. Em comparação com o AMD Ryzen AI 9 HX 370 no XMG Core 16, o 275HX é, em média, 28% mais rápido em todos os nossos benchmarks de CPU. Ao funcionar com a energia da bateria, o processador é limitado a 40 watts, o que resulta em uma queda de 35% no desempenho de vários núcleos.
Cinebench R15 Teste de resistência múltipla
Cinebench 2024: CPU Multi Core | CPU Single Core
Cinebench R23: Multi Core | Single Core
Cinebench R20: CPU (Multi Core) | CPU (Single Core)
Cinebench R15: CPU Multi 64Bit | CPU Single 64Bit
Blender: v2.79 BMW27 CPU
7-Zip 18.03: 7z b 4 | 7z b 4 -mmt1
Geekbench 6.7: Multi-Core | Single-Core
Geekbench 5.5: Multi-Core | Single-Core
HWBOT x265 Benchmark v2.2: 4k Preset
LibreOffice : 20 Documents To PDF
R Benchmark 2.5: Overall mean
| CPU Performance rating | |
| Média Intel Core Ultra 9 275HX | |
| Aorus Elite 16 AE6H -1! | |
| MSI Crosshair 16 HX AI D2XWGKG | |
| Schenker XMG FUSION 16 (M25) | |
| Lenovo Legion Pro 5 16IAX10, RTX 5070 -2! | |
| Média da turma Gaming | |
| Schenker XMG Core 16 M25 | |
| Asus TUF Gaming A16 FA608UP | |
| Gigabyte Gaming A16 GA6H | |
| Cinebench 2024 / CPU Multi Core | |
| Média Intel Core Ultra 9 275HX (1547 - 2288, n=27) | |
| Schenker XMG FUSION 16 (M25) | |
| Aorus Elite 16 AE6H | |
| MSI Crosshair 16 HX AI D2XWGKG | |
| Média da turma Gaming (486 - 2298, n=92, últimos 2 anos) | |
| Schenker XMG Core 16 M25 | |
| Asus TUF Gaming A16 FA608UP | |
| Gigabyte Gaming A16 GA6H | |
| Cinebench 2024 / CPU Single Core | |
| Schenker XMG FUSION 16 (M25) | |
| MSI Crosshair 16 HX AI D2XWGKG | |
| Média Intel Core Ultra 9 275HX (123.1 - 138.2, n=27) | |
| Aorus Elite 16 AE6H | |
| Média da turma Gaming (95 - 138.2, n=92, últimos 2 anos) | |
| Schenker XMG Core 16 M25 | |
| Gigabyte Gaming A16 GA6H | |
| Asus TUF Gaming A16 FA608UP | |
| Cinebench R23 / Multi Core | |
| Média Intel Core Ultra 9 275HX (30712 - 40970, n=31) | |
| MSI Crosshair 16 HX AI D2XWGKG | |
| Schenker XMG FUSION 16 (M25) | |
| Aorus Elite 16 AE6H | |
| Lenovo Legion Pro 5 16IAX10, RTX 5070 | |
| Média da turma Gaming (10488 - 40970, n=112, últimos 2 anos) | |
| Schenker XMG Core 16 M25 | |
| Asus TUF Gaming A16 FA608UP | |
| Gigabyte Gaming A16 GA6H | |
| Cinebench R23 / Single Core | |
| Schenker XMG FUSION 16 (M25) | |
| MSI Crosshair 16 HX AI D2XWGKG | |
| Média Intel Core Ultra 9 275HX (2009 - 2267, n=31) | |
| Lenovo Legion Pro 5 16IAX10, RTX 5070 | |
| Aorus Elite 16 AE6H | |
| Schenker XMG Core 16 M25 | |
| Média da turma Gaming (1166 - 2356, n=112, últimos 2 anos) | |
| Gigabyte Gaming A16 GA6H | |
| Asus TUF Gaming A16 FA608UP | |
| Cinebench R20 / CPU (Multi Core) | |
| Média Intel Core Ultra 9 275HX (12026 - 16108, n=30) | |
| MSI Crosshair 16 HX AI D2XWGKG | |
| Schenker XMG FUSION 16 (M25) | |
| Aorus Elite 16 AE6H | |
| Lenovo Legion Pro 5 16IAX10, RTX 5070 | |
| Média da turma Gaming (4029 - 16108, n=111, últimos 2 anos) | |
| Schenker XMG Core 16 M25 | |
| Asus TUF Gaming A16 FA608UP | |
| Gigabyte Gaming A16 GA6H | |
| Cinebench R20 / CPU (Single Core) | |
| Schenker XMG FUSION 16 (M25) | |
| MSI Crosshair 16 HX AI D2XWGKG | |
| Média Intel Core Ultra 9 275HX (774 - 870, n=30) | |
| Aorus Elite 16 AE6H | |
| Lenovo Legion Pro 5 16IAX10, RTX 5070 | |
| Schenker XMG Core 16 M25 | |
| Média da turma Gaming (442 - 895, n=111, últimos 2 anos) | |
| Gigabyte Gaming A16 GA6H | |
| Asus TUF Gaming A16 FA608UP | |
| Cinebench R15 / CPU Multi 64Bit | |
| Média Intel Core Ultra 9 275HX (4737 - 6271, n=30) | |
| MSI Crosshair 16 HX AI D2XWGKG | |
| Aorus Elite 16 AE6H | |
| Schenker XMG FUSION 16 (M25) | |
| Lenovo Legion Pro 5 16IAX10, RTX 5070 | |
| Média da turma Gaming (1578 - 6271, n=111, últimos 2 anos) | |
| Schenker XMG Core 16 M25 | |
| Asus TUF Gaming A16 FA608UP | |
| Gigabyte Gaming A16 GA6H | |
| Cinebench R15 / CPU Single 64Bit | |
| Schenker XMG FUSION 16 (M25) | |
| Média Intel Core Ultra 9 275HX (306 - 343, n=31) | |
| MSI Crosshair 16 HX AI D2XWGKG | |
| Lenovo Legion Pro 5 16IAX10, RTX 5070 | |
| Aorus Elite 16 AE6H | |
| Média da turma Gaming (188.8 - 343, n=111, últimos 2 anos) | |
| Asus TUF Gaming A16 FA608UP | |
| Gigabyte Gaming A16 GA6H | |
| Schenker XMG Core 16 M25 | |
| Blender / v2.79 BMW27 CPU | |
| Gigabyte Gaming A16 GA6H | |
| Asus TUF Gaming A16 FA608UP | |
| Média da turma Gaming (80 - 330, n=109, últimos 2 anos) | |
| Schenker XMG Core 16 M25 | |
| Lenovo Legion Pro 5 16IAX10, RTX 5070 | |
| Schenker XMG FUSION 16 (M25) | |
| MSI Crosshair 16 HX AI D2XWGKG | |
| Média Intel Core Ultra 9 275HX (82 - 116, n=29) | |
| 7-Zip 18.03 / 7z b 4 | |
| Média Intel Core Ultra 9 275HX (98236 - 124155, n=30) | |
| Schenker XMG FUSION 16 (M25) | |
| Aorus Elite 16 AE6H | |
| MSI Crosshair 16 HX AI D2XWGKG | |
| Lenovo Legion Pro 5 16IAX10, RTX 5070 | |
| Média da turma Gaming (33491 - 148086, n=110, últimos 2 anos) | |
| Schenker XMG Core 16 M25 | |
| Asus TUF Gaming A16 FA608UP | |
| Gigabyte Gaming A16 GA6H | |
| 7-Zip 18.03 / 7z b 4 -mmt1 | |
| Schenker XMG FUSION 16 (M25) | |
| MSI Crosshair 16 HX AI D2XWGKG | |
| Média Intel Core Ultra 9 275HX (6026 - 7149, n=30) | |
| Lenovo Legion Pro 5 16IAX10, RTX 5070 | |
| Schenker XMG Core 16 M25 | |
| Média da turma Gaming (4199 - 7436, n=110, últimos 2 anos) | |
| Aorus Elite 16 AE6H | |
| Asus TUF Gaming A16 FA608UP | |
| Gigabyte Gaming A16 GA6H | |
| Geekbench 6.7 / Multi-Core | |
| Lenovo Legion Pro 5 16IAX10, RTX 5070 | |
| Média Intel Core Ultra 9 275HX (16033 - 21668, n=33) | |
| Schenker XMG FUSION 16 (M25) | |
| Aorus Elite 16 AE6H | |
| MSI Crosshair 16 HX AI D2XWGKG | |
| Schenker XMG Core 16 M25 | |
| Média da turma Gaming (6625 - 22104, n=111, últimos 2 anos) | |
| Asus TUF Gaming A16 FA608UP | |
| Gigabyte Gaming A16 GA6H | |
| Geekbench 6.7 / Single-Core | |
| Schenker XMG FUSION 16 (M25) | |
| MSI Crosshair 16 HX AI D2XWGKG | |
| Média Intel Core Ultra 9 275HX (2843 - 3160, n=33) | |
| Lenovo Legion Pro 5 16IAX10, RTX 5070 | |
| Aorus Elite 16 AE6H | |
| Schenker XMG Core 16 M25 | |
| Média da turma Gaming (1490 - 3259, n=111, últimos 2 anos) | |
| Asus TUF Gaming A16 FA608UP | |
| Gigabyte Gaming A16 GA6H | |
| Geekbench 5.5 / Multi-Core | |
| Schenker XMG FUSION 16 (M25) | |
| Média Intel Core Ultra 9 275HX (19105 - 25855, n=31) | |
| Aorus Elite 16 AE6H | |
| MSI Crosshair 16 HX AI D2XWGKG | |
| Lenovo Legion Pro 5 16IAX10, RTX 5070 | |
| Média da turma Gaming (6460 - 27010, n=110, últimos 2 anos) | |
| Schenker XMG Core 16 M25 | |
| Asus TUF Gaming A16 FA608UP | |
| Gigabyte Gaming A16 GA6H | |
| Geekbench 5.5 / Single-Core | |
| Schenker XMG FUSION 16 (M25) | |
| MSI Crosshair 16 HX AI D2XWGKG | |
| Lenovo Legion Pro 5 16IAX10, RTX 5070 | |
| Média Intel Core Ultra 9 275HX (2033 - 2292, n=31) | |
| Aorus Elite 16 AE6H | |
| Schenker XMG Core 16 M25 | |
| Média da turma Gaming (986 - 2474, n=110, últimos 2 anos) | |
| Asus TUF Gaming A16 FA608UP | |
| Gigabyte Gaming A16 GA6H | |
| HWBOT x265 Benchmark v2.2 / 4k Preset | |
| Média Intel Core Ultra 9 275HX (30.7 - 43.8, n=30) | |
| Lenovo Legion Pro 5 16IAX10, RTX 5070 | |
| MSI Crosshair 16 HX AI D2XWGKG | |
| Aorus Elite 16 AE6H | |
| Schenker XMG FUSION 16 (M25) | |
| Schenker XMG Core 16 M25 | |
| Média da turma Gaming (11.5 - 44.3, n=110, últimos 2 anos) | |
| Asus TUF Gaming A16 FA608UP | |
| Gigabyte Gaming A16 GA6H | |
| LibreOffice / 20 Documents To PDF | |
| Asus TUF Gaming A16 FA608UP | |
| Gigabyte Gaming A16 GA6H | |
| Schenker XMG Core 16 M25 | |
| Schenker XMG FUSION 16 (M25) | |
| Média da turma Gaming (19 - 88.8, n=110, últimos 2 anos) | |
| Lenovo Legion Pro 5 16IAX10, RTX 5070 | |
| Média Intel Core Ultra 9 275HX (33.2 - 62.1, n=30) | |
| MSI Crosshair 16 HX AI D2XWGKG | |
| Aorus Elite 16 AE6H | |
| R Benchmark 2.5 / Overall mean | |
| Gigabyte Gaming A16 GA6H | |
| Asus TUF Gaming A16 FA608UP | |
| Média da turma Gaming (0.3439 - 0.759, n=111, últimos 2 anos) | |
| Aorus Elite 16 AE6H | |
| Lenovo Legion Pro 5 16IAX10, RTX 5070 | |
| Média Intel Core Ultra 9 275HX (0.3943 - 0.4568, n=30) | |
| Schenker XMG FUSION 16 (M25) | |
| MSI Crosshair 16 HX AI D2XWGKG | |
| Schenker XMG Core 16 M25 | |
* ... menor é melhor
AIDA64: FP32 Ray-Trace | FPU Julia | CPU SHA3 | CPU Queen | FPU SinJulia | FPU Mandel | CPU AES | CPU ZLib | FP64 Ray-Trace | CPU PhotoWorxx
| Performance rating | |
| Média Intel Core Ultra 9 275HX | |
| MSI Crosshair 16 HX AI D2XWGKG | |
| Schenker XMG FUSION 16 (M25) | |
| Lenovo Legion Pro 5 16IAX10, RTX 5070 | |
| Aorus Elite 16 AE6H | |
| Schenker XMG Core 16 M25 | |
| Média da turma Gaming | |
| Asus TUF Gaming A16 FA608UP | |
| Gigabyte Gaming A16 GA6H | |
| AIDA64 / FP32 Ray-Trace | |
| Schenker XMG Core 16 M25 | |
| MSI Crosshair 16 HX AI D2XWGKG | |
| Média Intel Core Ultra 9 275HX (28039 - 39895, n=30) | |
| Schenker XMG FUSION 16 (M25) | |
| Lenovo Legion Pro 5 16IAX10, RTX 5070 | |
| Aorus Elite 16 AE6H | |
| Média da turma Gaming (10227 - 85542, n=109, últimos 2 anos) | |
| Asus TUF Gaming A16 FA608UP | |
| Gigabyte Gaming A16 GA6H | |
| AIDA64 / FPU Julia | |
| MSI Crosshair 16 HX AI D2XWGKG | |
| Média Intel Core Ultra 9 275HX (140254 - 200744, n=30) | |
| Schenker XMG FUSION 16 (M25) | |
| Lenovo Legion Pro 5 16IAX10, RTX 5070 | |
| Aorus Elite 16 AE6H | |
| Schenker XMG Core 16 M25 | |
| Média da turma Gaming (51376 - 238426, n=109, últimos 2 anos) | |
| Asus TUF Gaming A16 FA608UP | |
| Gigabyte Gaming A16 GA6H | |
| AIDA64 / CPU SHA3 | |
| Média Intel Core Ultra 9 275HX (6710 - 9817, n=30) | |
| MSI Crosshair 16 HX AI D2XWGKG | |
| Schenker XMG FUSION 16 (M25) | |
| Aorus Elite 16 AE6H | |
| Lenovo Legion Pro 5 16IAX10, RTX 5070 | |
| Média da turma Gaming (2180 - 9817, n=109, últimos 2 anos) | |
| Schenker XMG Core 16 M25 | |
| Asus TUF Gaming A16 FA608UP | |
| Gigabyte Gaming A16 GA6H | |
| AIDA64 / CPU Queen | |
| Lenovo Legion Pro 5 16IAX10, RTX 5070 | |
| Média Intel Core Ultra 9 275HX (113887 - 140937, n=30) | |
| Aorus Elite 16 AE6H | |
| MSI Crosshair 16 HX AI D2XWGKG | |
| Schenker XMG FUSION 16 (M25) | |
| Asus TUF Gaming A16 FA608UP | |
| Média da turma Gaming (49785 - 173351, n=98, últimos 2 anos) | |
| Schenker XMG Core 16 M25 | |
| Gigabyte Gaming A16 GA6H | |
| AIDA64 / FPU SinJulia | |
| Schenker XMG Core 16 M25 | |
| Asus TUF Gaming A16 FA608UP | |
| Média da turma Gaming (4424 - 33636, n=109, últimos 2 anos) | |
| Média Intel Core Ultra 9 275HX (11172 - 14425, n=30) | |
| MSI Crosshair 16 HX AI D2XWGKG | |
| Aorus Elite 16 AE6H | |
| Schenker XMG FUSION 16 (M25) | |
| Lenovo Legion Pro 5 16IAX10, RTX 5070 | |
| Gigabyte Gaming A16 GA6H | |
| AIDA64 / FPU Mandel | |
| MSI Crosshair 16 HX AI D2XWGKG | |
| Média Intel Core Ultra 9 275HX (72596 - 104508, n=30) | |
| Schenker XMG FUSION 16 (M25) | |
| Lenovo Legion Pro 5 16IAX10, RTX 5070 | |
| Aorus Elite 16 AE6H | |
| Schenker XMG Core 16 M25 | |
| Média da turma Gaming (25115 - 128721, n=109, últimos 2 anos) | |
| Asus TUF Gaming A16 FA608UP | |
| Gigabyte Gaming A16 GA6H | |
| AIDA64 / CPU AES | |
| Média Intel Core Ultra 9 275HX (105608 - 247074, n=30) | |
| MSI Crosshair 16 HX AI D2XWGKG | |
| Schenker XMG FUSION 16 (M25) | |
| Schenker XMG Core 16 M25 | |
| Lenovo Legion Pro 5 16IAX10, RTX 5070 | |
| Aorus Elite 16 AE6H | |
| Média da turma Gaming (39258 - 247074, n=109, últimos 2 anos) | |
| Asus TUF Gaming A16 FA608UP | |
| Gigabyte Gaming A16 GA6H | |
| AIDA64 / CPU ZLib | |
| Média Intel Core Ultra 9 275HX (1582 - 2263, n=30) | |
| MSI Crosshair 16 HX AI D2XWGKG | |
| Schenker XMG FUSION 16 (M25) | |
| Aorus Elite 16 AE6H | |
| Lenovo Legion Pro 5 16IAX10, RTX 5070 | |
| Média da turma Gaming (574 - 2531, n=109, últimos 2 anos) | |
| Schenker XMG Core 16 M25 | |
| Asus TUF Gaming A16 FA608UP | |
| Gigabyte Gaming A16 GA6H | |
| AIDA64 / FP64 Ray-Trace | |
| Schenker XMG Core 16 M25 | |
| MSI Crosshair 16 HX AI D2XWGKG | |
| Média Intel Core Ultra 9 275HX (14847 - 21854, n=30) | |
| Schenker XMG FUSION 16 (M25) | |
| Lenovo Legion Pro 5 16IAX10, RTX 5070 | |
| Aorus Elite 16 AE6H | |
| Média da turma Gaming (5509 - 45446, n=109, últimos 2 anos) | |
| Asus TUF Gaming A16 FA608UP | |
| Gigabyte Gaming A16 GA6H | |
| AIDA64 / CPU PhotoWorxx | |
| Lenovo Legion Pro 5 16IAX10, RTX 5070 | |
| Schenker XMG Core 16 M25 | |
| Schenker XMG FUSION 16 (M25) | |
| Média Intel Core Ultra 9 275HX (37482 - 62916, n=30) | |
| Aorus Elite 16 AE6H | |
| Média da turma Gaming (12271 - 89891, n=109, últimos 2 anos) | |
| Asus TUF Gaming A16 FA608UP | |
| MSI Crosshair 16 HX AI D2XWGKG | |
| Gigabyte Gaming A16 GA6H | |
Desempenho do sistema
A impressão subjetiva de desempenho é excelente e os resultados nos benchmarks sintéticos também são muito bons.
PCMark 10: Score | Essentials | Productivity | Digital Content Creation
CrossMark: Overall | Productivity | Creativity | Responsiveness
WebXPRT 3: Overall
WebXPRT 4: Overall
Mozilla Kraken 1.1: Total
| Performance rating | |
| Schenker XMG FUSION 16 (M25) | |
| Lenovo Legion Pro 5 16IAX10, RTX 5070 | |
| Média Intel Core Ultra 9 275HX, NVIDIA GeForce RTX 5070 Laptop | |
| Schenker XMG Core 16 M25 -4! | |
| MSI Crosshair 16 HX AI D2XWGKG | |
| Aorus Elite 16 AE6H | |
| Média da turma Gaming | |
| Gigabyte Gaming A16 GA6H | |
| Asus TUF Gaming A16 FA608UP -4! | |
| PCMark 10 / Score | |
| Schenker XMG FUSION 16 (M25) | |
| Lenovo Legion Pro 5 16IAX10, RTX 5070 | |
| Média Intel Core Ultra 9 275HX, NVIDIA GeForce RTX 5070 Laptop (8018 - 9667, n=4) | |
| Média da turma Gaming (5828 - 11574, n=96, últimos 2 anos) | |
| MSI Crosshair 16 HX AI D2XWGKG | |
| Aorus Elite 16 AE6H | |
| Gigabyte Gaming A16 GA6H | |
| PCMark 10 / Essentials | |
| Lenovo Legion Pro 5 16IAX10, RTX 5070 | |
| Aorus Elite 16 AE6H | |
| MSI Crosshair 16 HX AI D2XWGKG | |
| Média Intel Core Ultra 9 275HX, NVIDIA GeForce RTX 5070 Laptop (10259 - 11025, n=4) | |
| Média da turma Gaming (8810 - 12600, n=100, últimos 2 anos) | |
| Schenker XMG FUSION 16 (M25) | |
| Gigabyte Gaming A16 GA6H | |
| PCMark 10 / Productivity | |
| Schenker XMG FUSION 16 (M25) | |
| Média Intel Core Ultra 9 275HX, NVIDIA GeForce RTX 5070 Laptop (8307 - 16716, n=4) | |
| Média da turma Gaming (6845 - 21327, n=98, últimos 2 anos) | |
| Lenovo Legion Pro 5 16IAX10, RTX 5070 | |
| Aorus Elite 16 AE6H | |
| MSI Crosshair 16 HX AI D2XWGKG | |
| Gigabyte Gaming A16 GA6H | |
| PCMark 10 / Digital Content Creation | |
| Lenovo Legion Pro 5 16IAX10, RTX 5070 | |
| MSI Crosshair 16 HX AI D2XWGKG | |
| Média Intel Core Ultra 9 275HX, NVIDIA GeForce RTX 5070 Laptop (13010 - 16417, n=4) | |
| Schenker XMG FUSION 16 (M25) | |
| Aorus Elite 16 AE6H | |
| Média da turma Gaming (7602 - 19657, n=98, últimos 2 anos) | |
| Gigabyte Gaming A16 GA6H | |
| CrossMark / Overall | |
| Média Intel Core Ultra 9 275HX, NVIDIA GeForce RTX 5070 Laptop (2084 - 2269, n=5) | |
| Aorus Elite 16 AE6H | |
| MSI Crosshair 16 HX AI D2XWGKG | |
| Schenker XMG FUSION 16 (M25) | |
| Lenovo Legion Pro 5 16IAX10, RTX 5070 | |
| Schenker XMG Core 16 M25 | |
| Média da turma Gaming (1366 - 2409, n=97, últimos 2 anos) | |
| Gigabyte Gaming A16 GA6H | |
| Asus TUF Gaming A16 FA608UP | |
| CrossMark / Productivity | |
| Aorus Elite 16 AE6H | |
| Média Intel Core Ultra 9 275HX, NVIDIA GeForce RTX 5070 Laptop (1931 - 2173, n=5) | |
| MSI Crosshair 16 HX AI D2XWGKG | |
| Schenker XMG FUSION 16 (M25) | |
| Lenovo Legion Pro 5 16IAX10, RTX 5070 | |
| Média da turma Gaming (1386 - 2254, n=97, últimos 2 anos) | |
| Schenker XMG Core 16 M25 | |
| Gigabyte Gaming A16 GA6H | |
| Asus TUF Gaming A16 FA608UP | |
| CrossMark / Creativity | |
| Schenker XMG Core 16 M25 | |
| Schenker XMG FUSION 16 (M25) | |
| Média Intel Core Ultra 9 275HX, NVIDIA GeForce RTX 5070 Laptop (2322 - 2430, n=5) | |
| MSI Crosshair 16 HX AI D2XWGKG | |
| Aorus Elite 16 AE6H | |
| Lenovo Legion Pro 5 16IAX10, RTX 5070 | |
| Média da turma Gaming (1343 - 2729, n=97, últimos 2 anos) | |
| Asus TUF Gaming A16 FA608UP | |
| Gigabyte Gaming A16 GA6H | |
| CrossMark / Responsiveness | |
| Aorus Elite 16 AE6H | |
| Média Intel Core Ultra 9 275HX, NVIDIA GeForce RTX 5070 Laptop (1754 - 2143, n=5) | |
| Gigabyte Gaming A16 GA6H | |
| MSI Crosshair 16 HX AI D2XWGKG | |
| Schenker XMG FUSION 16 (M25) | |
| Lenovo Legion Pro 5 16IAX10, RTX 5070 | |
| Média da turma Gaming (1226 - 2334, n=97, últimos 2 anos) | |
| Schenker XMG Core 16 M25 | |
| Asus TUF Gaming A16 FA608UP | |
| WebXPRT 3 / Overall | |
| Schenker XMG Core 16 M25 | |
| Schenker XMG FUSION 16 (M25) | |
| Lenovo Legion Pro 5 16IAX10, RTX 5070 | |
| Média Intel Core Ultra 9 275HX, NVIDIA GeForce RTX 5070 Laptop (309 - 364, n=5) | |
| MSI Crosshair 16 HX AI D2XWGKG | |
| Média da turma Gaming (242 - 532, n=101, últimos 2 anos) | |
| Aorus Elite 16 AE6H | |
| Asus TUF Gaming A16 FA608UP | |
| Gigabyte Gaming A16 GA6H | |
| WebXPRT 4 / Overall | |
| Schenker XMG Core 16 M25 | |
| Aorus Elite 16 AE6H | |
| Lenovo Legion Pro 5 16IAX10, RTX 5070 | |
| Média Intel Core Ultra 9 275HX, NVIDIA GeForce RTX 5070 Laptop (297 - 330, n=5) | |
| MSI Crosshair 16 HX AI D2XWGKG | |
| Schenker XMG FUSION 16 (M25) | |
| Média da turma Gaming (176.4 - 354, n=101, últimos 2 anos) | |
| Gigabyte Gaming A16 GA6H | |
| Asus TUF Gaming A16 FA608UP | |
| Mozilla Kraken 1.1 / Total | |
| Asus TUF Gaming A16 FA608UP | |
| Gigabyte Gaming A16 GA6H | |
| Média da turma Gaming (391 - 590, n=106, últimos 2 anos) | |
| Lenovo Legion Pro 5 16IAX10, RTX 5070 | |
| Schenker XMG FUSION 16 (M25) | |
| Aorus Elite 16 AE6H | |
| Média Intel Core Ultra 9 275HX, NVIDIA GeForce RTX 5070 Laptop (407 - 431, n=5) | |
| Schenker XMG Core 16 M25 | |
| MSI Crosshair 16 HX AI D2XWGKG | |
* ... menor é melhor
| PCMark 10 Score | 9667 pontos | |
Ajuda | ||
| AIDA64 / Memory Copy | |
| Lenovo Legion Pro 5 16IAX10, RTX 5070 | |
| Schenker XMG FUSION 16 (M25) | |
| Média Intel Core Ultra 9 275HX (56003 - 94460, n=30) | |
| Aorus Elite 16 AE6H | |
| Schenker XMG Core 16 M25 | |
| Média da turma Gaming (21750 - 129946, n=109, últimos 2 anos) | |
| MSI Crosshair 16 HX AI D2XWGKG | |
| Asus TUF Gaming A16 FA608UP | |
| Gigabyte Gaming A16 GA6H | |
| AIDA64 / Memory Read | |
| Lenovo Legion Pro 5 16IAX10, RTX 5070 | |
| Schenker XMG FUSION 16 (M25) | |
| Aorus Elite 16 AE6H | |
| Schenker XMG Core 16 M25 | |
| Média Intel Core Ultra 9 275HX (55795 - 97151, n=30) | |
| MSI Crosshair 16 HX AI D2XWGKG | |
| Média da turma Gaming (22956 - 118858, n=109, últimos 2 anos) | |
| Asus TUF Gaming A16 FA608UP | |
| Gigabyte Gaming A16 GA6H | |
| AIDA64 / Memory Write | |
| Aorus Elite 16 AE6H | |
| Asus TUF Gaming A16 FA608UP | |
| Lenovo Legion Pro 5 16IAX10, RTX 5070 | |
| Schenker XMG FUSION 16 (M25) | |
| Schenker XMG Core 16 M25 | |
| Média Intel Core Ultra 9 275HX (55663 - 116129, n=30) | |
| Média da turma Gaming (22297 - 135096, n=109, últimos 2 anos) | |
| MSI Crosshair 16 HX AI D2XWGKG | |
| Gigabyte Gaming A16 GA6H | |
| AIDA64 / Memory Latency | |
| Média Intel Core Ultra 9 275HX (105.8 - 161.6, n=30) | |
| Aorus Elite 16 AE6H | |
| MSI Crosshair 16 HX AI D2XWGKG | |
| Schenker XMG FUSION 16 (M25) | |
| Média da turma Gaming (75.3 - 259, n=109, últimos 2 anos) | |
| Lenovo Legion Pro 5 16IAX10, RTX 5070 | |
| Gigabyte Gaming A16 GA6H | |
| Asus TUF Gaming A16 FA608UP | |
| Schenker XMG Core 16 M25 | |
* ... menor é melhor
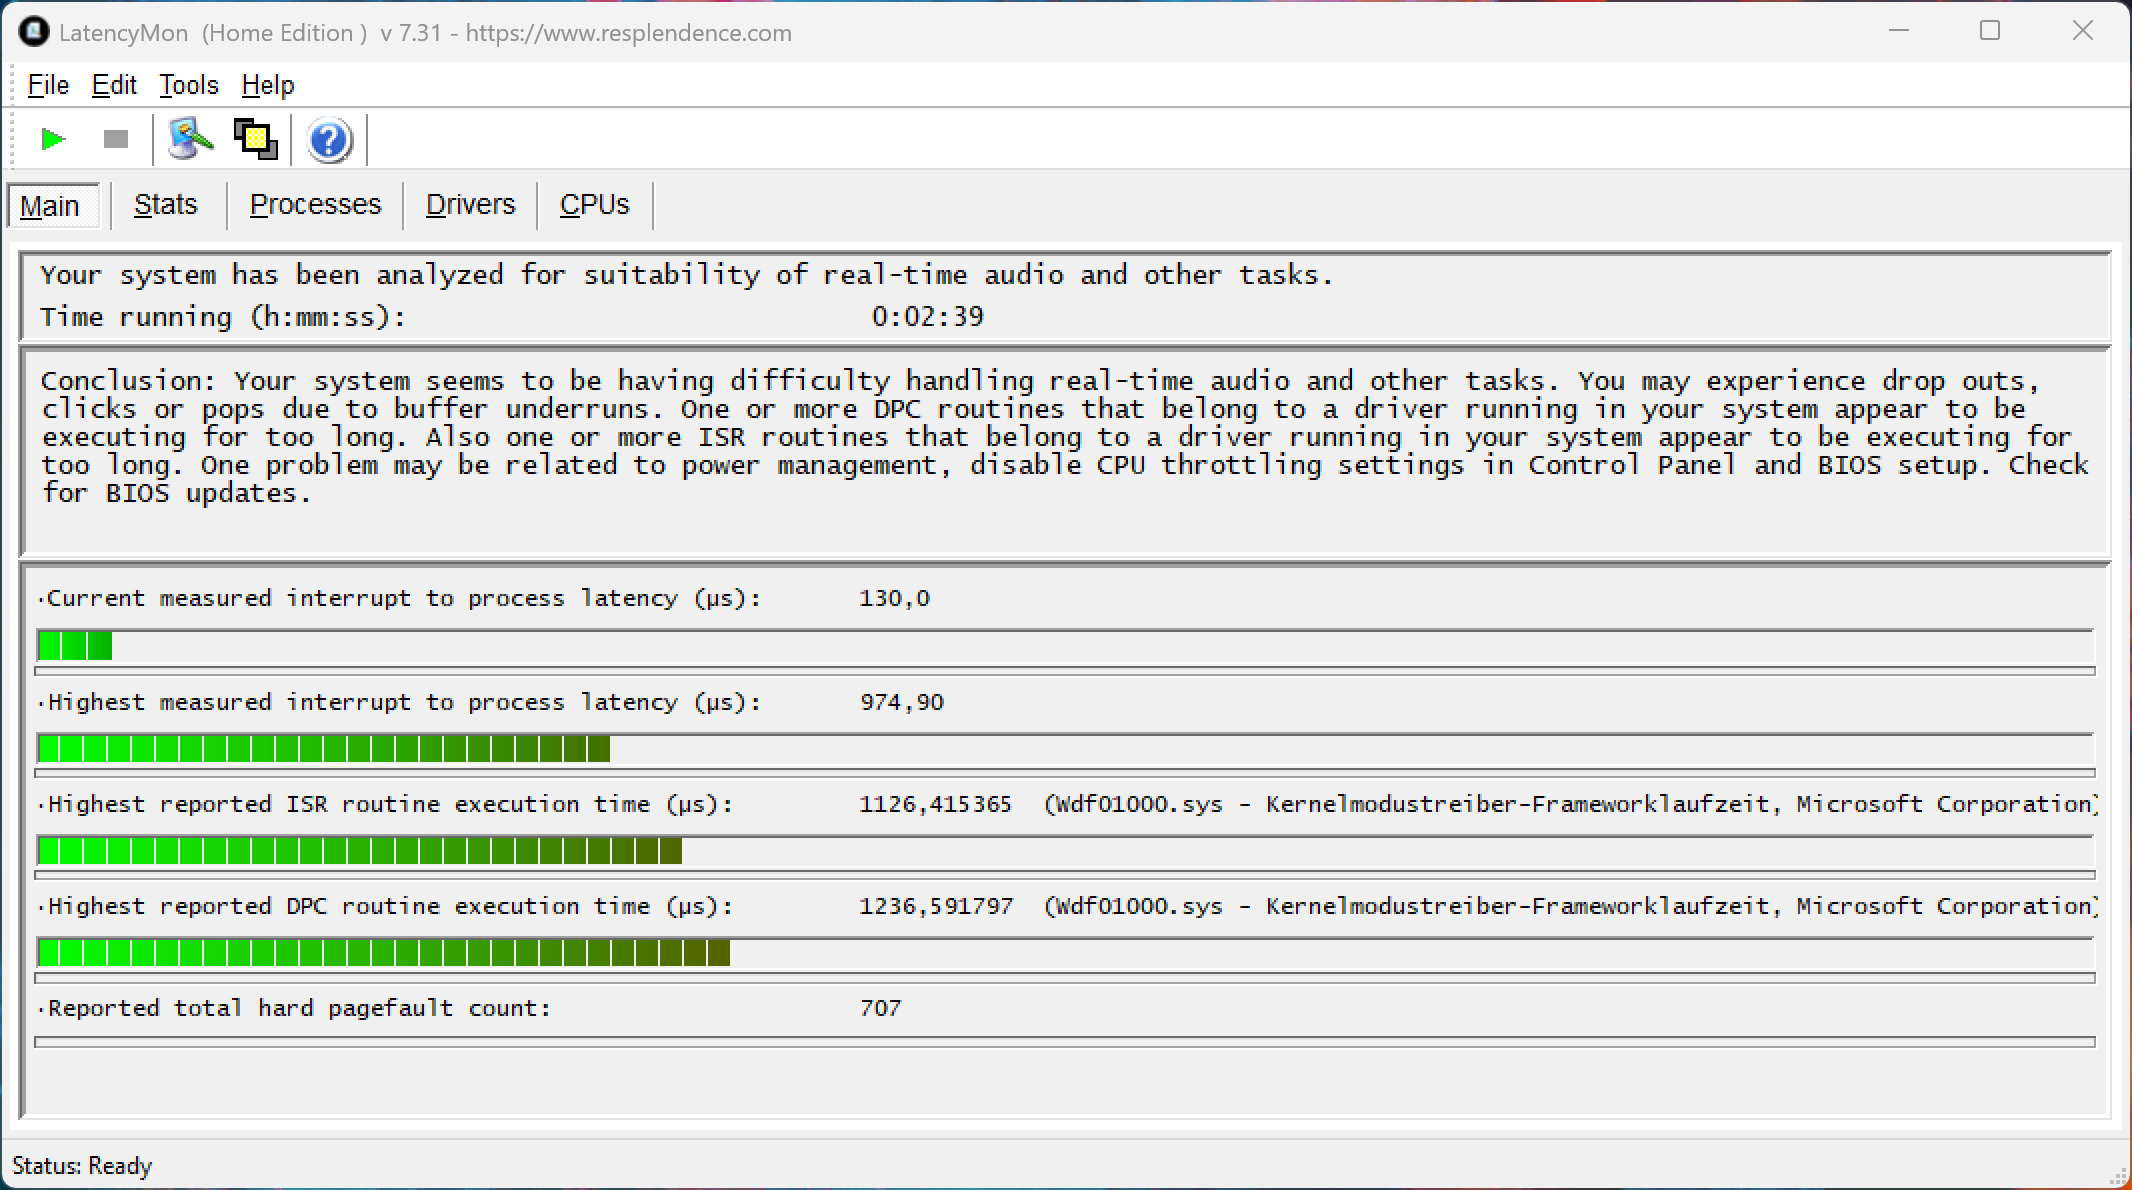
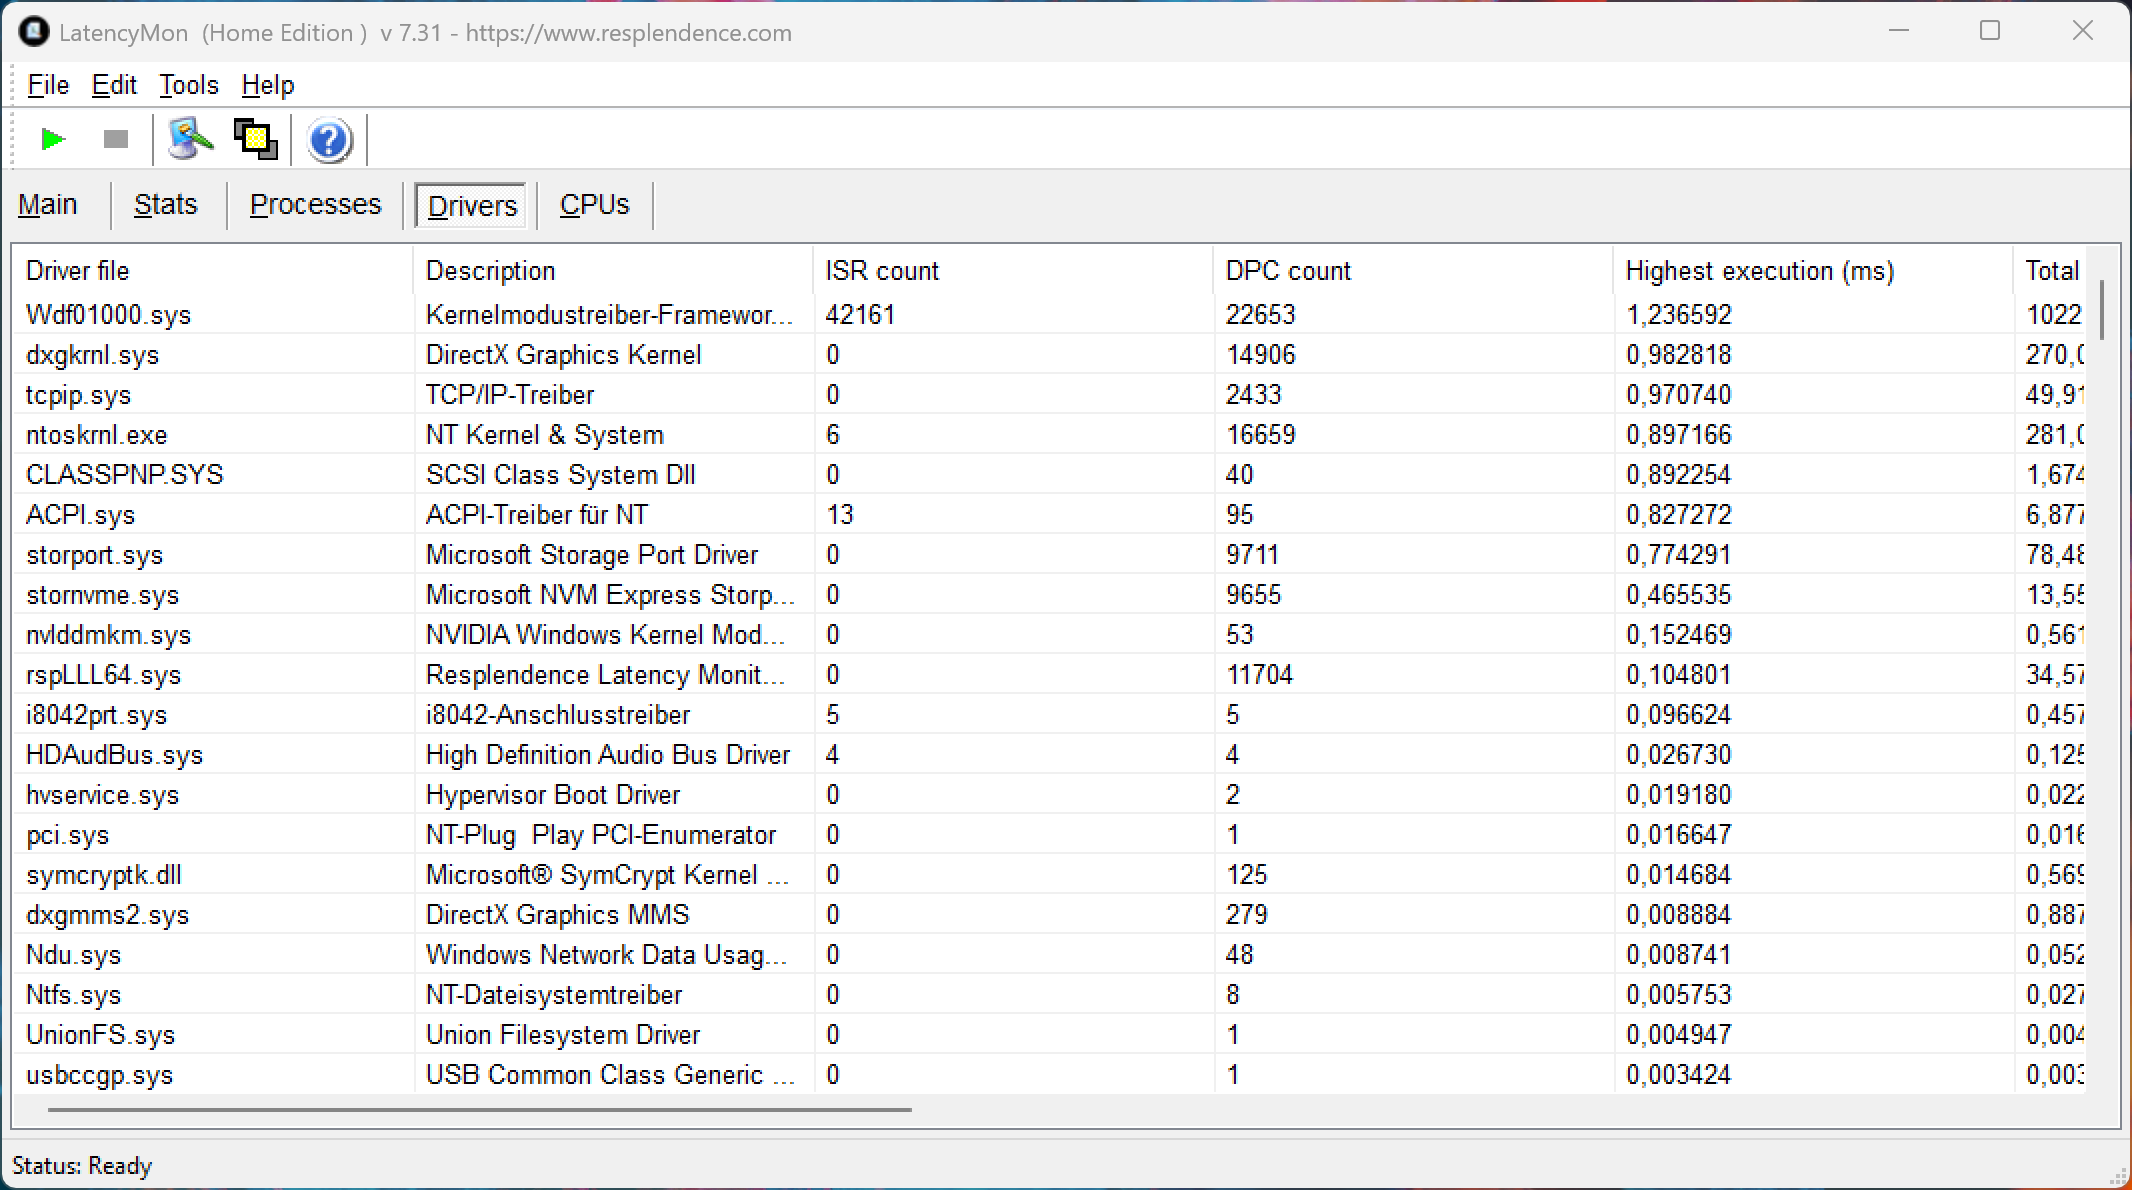
Latências de DPC
Em nosso teste de latência padronizado, a unidade de análise com a versão atual do BIOS mostra pequenas limitações ao usar aplicativos de áudio em tempo real.
| DPC Latencies / LatencyMon - interrupt to process latency (max), Web, Youtube, Prime95 | |
| Gigabyte Gaming A16 GA6H | |
| MSI Crosshair 16 HX AI D2XWGKG | |
| Schenker XMG FUSION 16 (M25) | |
| Aorus Elite 16 AE6H | |
| Lenovo Legion Pro 5 16IAX10, RTX 5070 | |
| Schenker XMG Core 16 M25 | |
| Asus TUF Gaming A16 FA608UP | |
* ... menor é melhor
Dispositivos de armazenamento
O Fusion 16 suporta PCIe 5.0 e nossa unidade de teste está equipada com um SSD Samsung 9100 Pro de 2 TB correspondente (1,73 TB livre). O desempenho é muito bom e permanece estável mesmo sob carga contínua.

* ... menor é melhor
Limitação de disco: Loop de leitura do DiskSpd, profundidade da fila 8
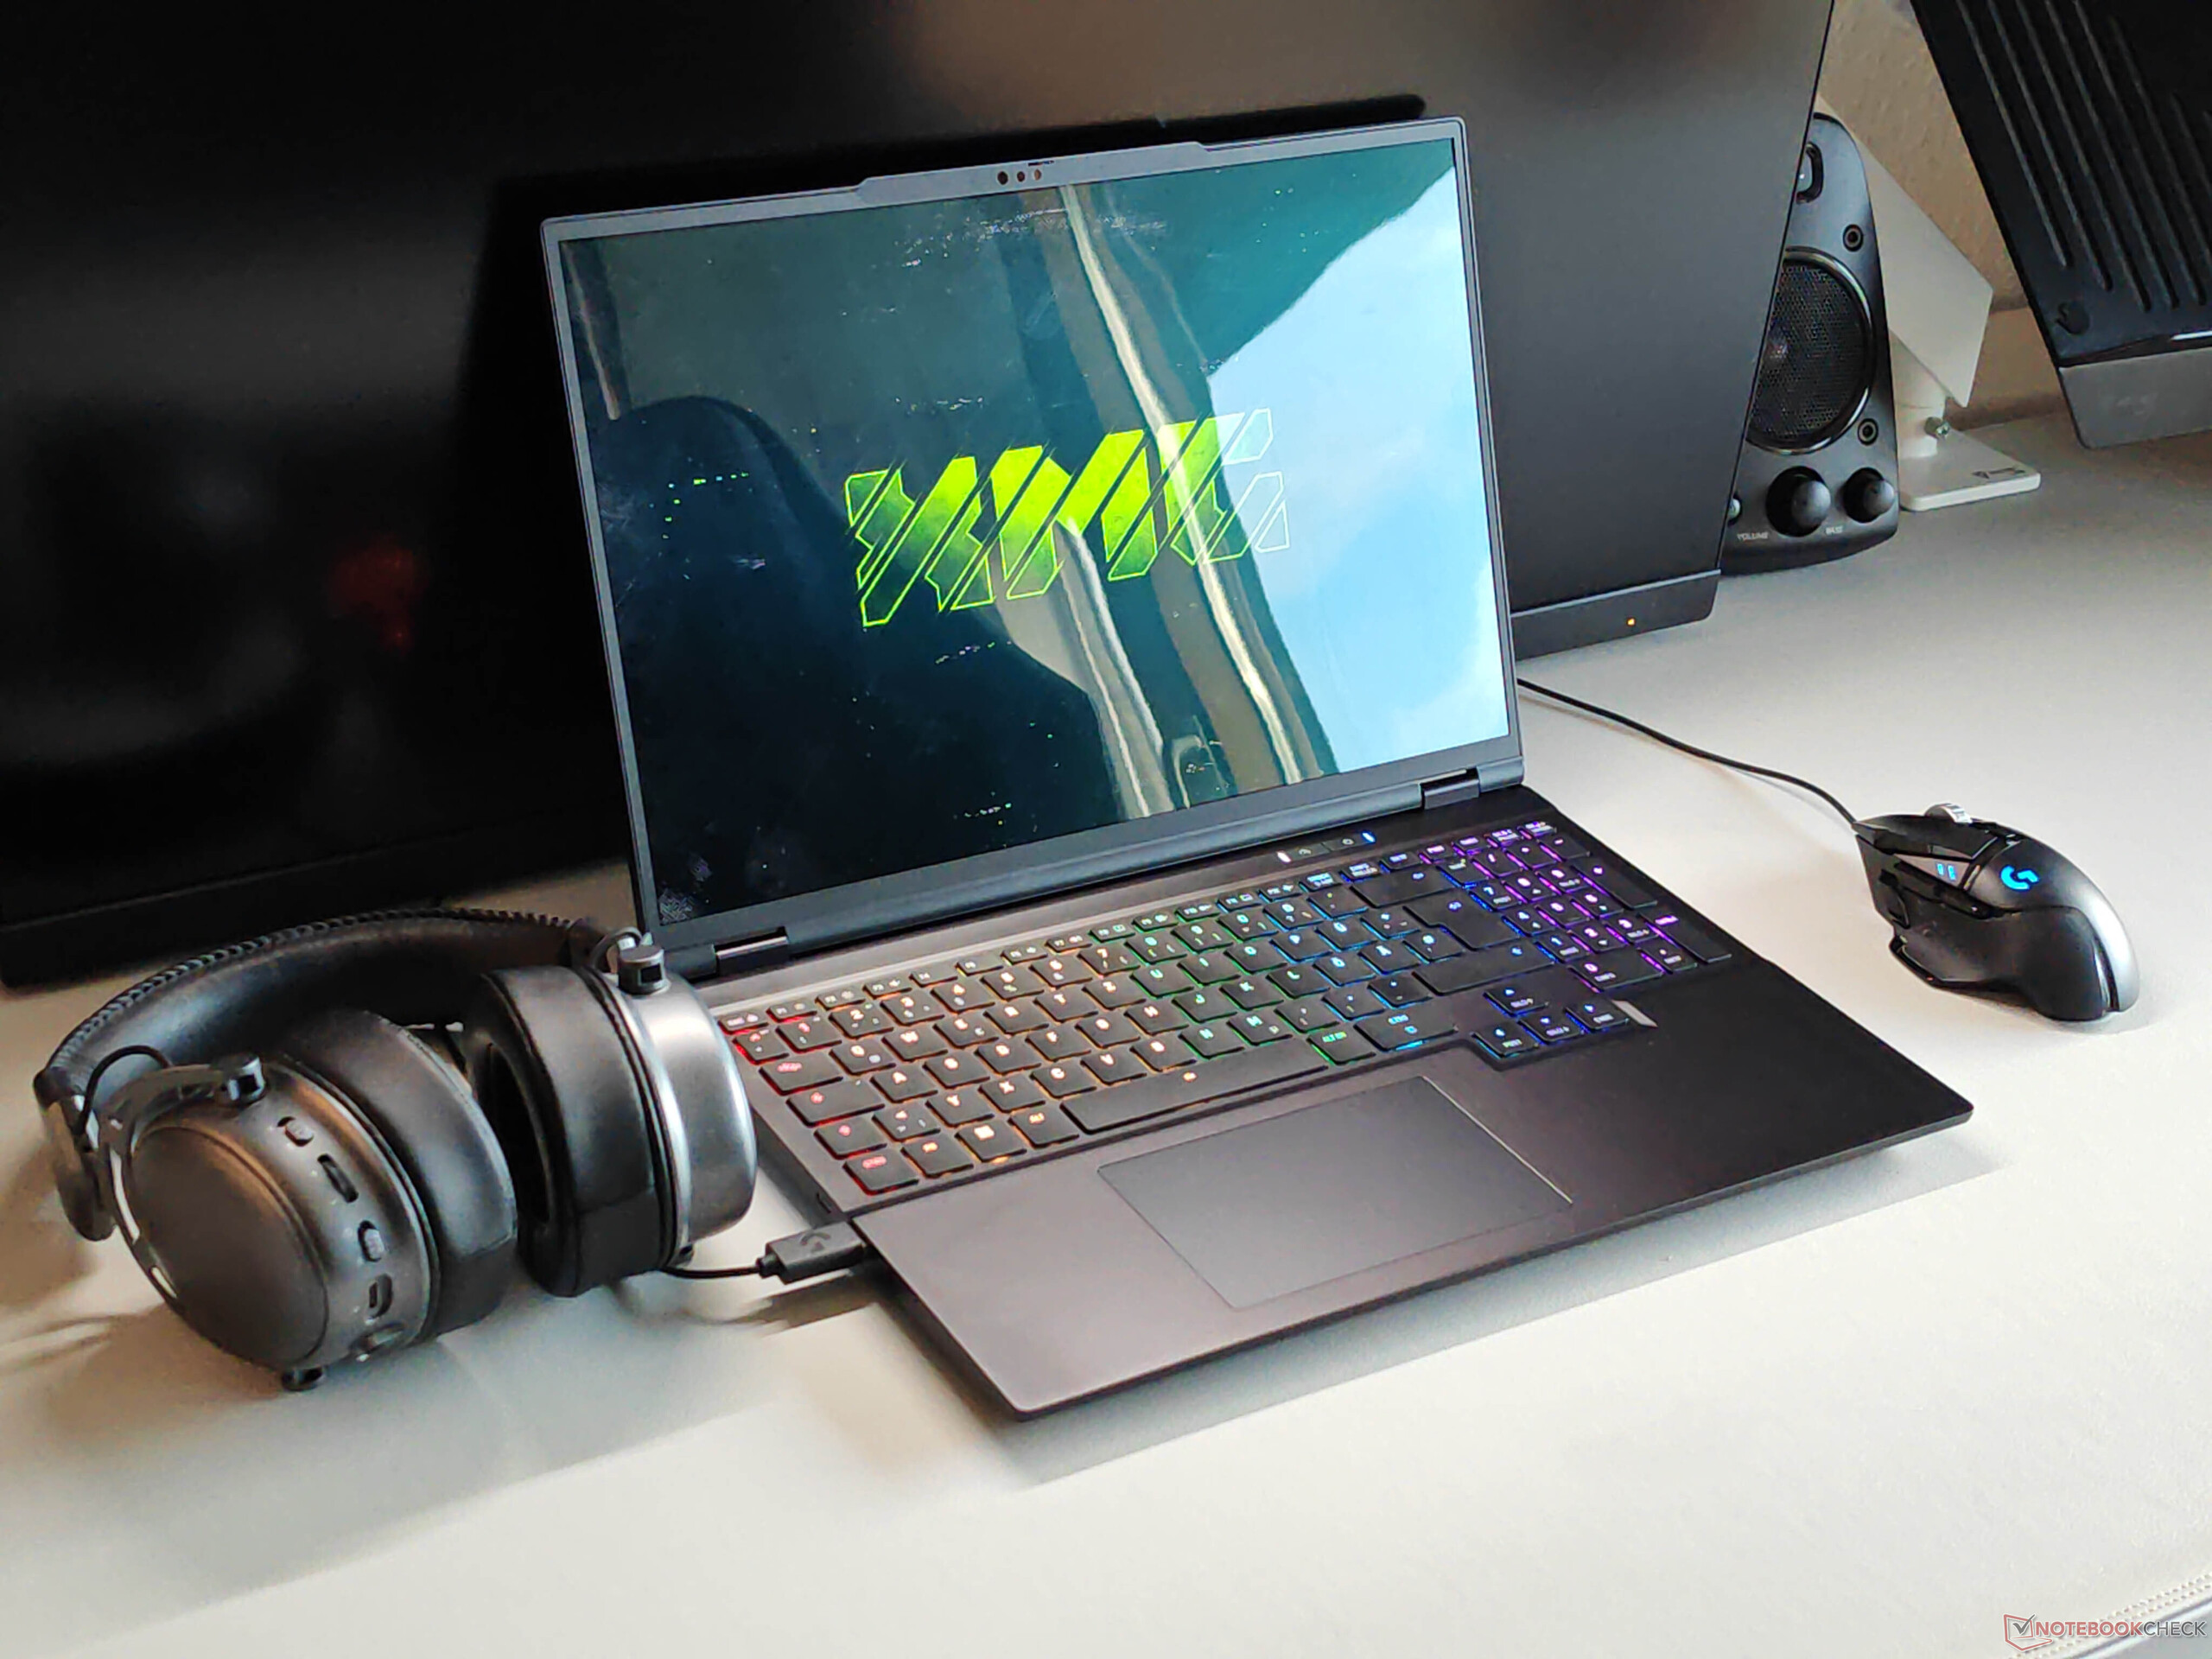
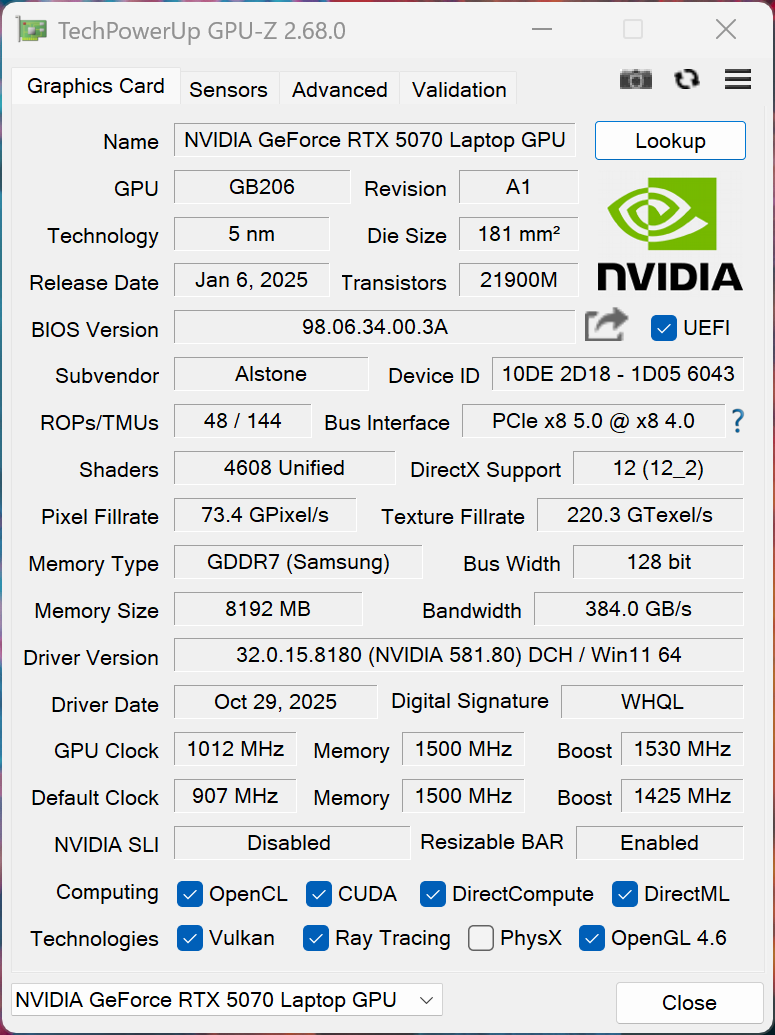
Desempenho da GPU
Assim como o Core 16, a versão mais rápida do laptop RTX 5070 para laptop Está instalada (115 watts) e o desempenho está de acordo com as expectativas. Entretanto, o Core Ultra 9 275HX mais rápido não oferece uma grande vantagem sobre o processador AMD do Core 16. Todos os jogos modernos funcionam sem problemas em configurações razoáveis, embora os 8 GB de VRAM possam se tornar uma limitação em resoluções mais altas (mais detalhes estão disponíveis em http://www.notebookcheck.net/Is-8-GB-VRAM-enough-for-modern-games-We-tested-it.1180853.0.html). Ao funcionar com a energia da bateria, a GPU é limitada a um máximo de 50 watts, aproximadamente 50% menos energia.
| 3DMark 11 Performance | 37410 pontos | |
| 3DMark Fire Strike Score | 28680 pontos | |
| 3DMark Time Spy Score | 13439 pontos | |
| 3DMark Steel Nomad Score | 3075 pontos | |
| 3DMark Steel Nomad Light Score | 13426 pontos | |
Ajuda | ||
| Blender / v3.3 Classroom OPTIX/RTX | |
| Schenker XMG Core 16 M25 | |
| Gigabyte Gaming A16 GA6H | |
| MSI Crosshair 16 HX AI D2XWGKG | |
| Asus TUF Gaming A16 FA608UP | |
| Schenker XMG FUSION 16 (M25) | |
| Média NVIDIA GeForce RTX 5070 Laptop (17 - 24, n=28) | |
| Aorus Elite 16 AE6H | |
| Média da turma Gaming (9 - 32, n=111, últimos 2 anos) | |
| Lenovo Legion Pro 5 16IAX10, RTX 5070 | |
| Blender / v3.3 Classroom CUDA | |
| Média NVIDIA GeForce RTX 5070 Laptop (29 - 228, n=29) | |
| Schenker XMG Core 16 M25 | |
| Schenker XMG FUSION 16 (M25) | |
| Gigabyte Gaming A16 GA6H | |
| Asus TUF Gaming A16 FA608UP | |
| Média da turma Gaming (15 - 228, n=111, últimos 2 anos) | |
| Aorus Elite 16 AE6H | |
| MSI Crosshair 16 HX AI D2XWGKG | |
| Lenovo Legion Pro 5 16IAX10, RTX 5070 | |
| Blender / v3.3 Classroom CPU | |
| Gigabyte Gaming A16 GA6H | |
| Asus TUF Gaming A16 FA608UP | |
| Média NVIDIA GeForce RTX 5070 Laptop (137 - 507, n=26) | |
| Média da turma Gaming (122 - 565, n=107, últimos 2 anos) | |
| Schenker XMG Core 16 M25 | |
| Lenovo Legion Pro 5 16IAX10, RTX 5070 | |
| MSI Crosshair 16 HX AI D2XWGKG | |
| Schenker XMG FUSION 16 (M25) | |
* ... menor é melhor

Gráfico de ultra FPS do Cyberpunk 2077
| baixo | média | alto | ultra | QHD | |
|---|---|---|---|---|---|
| GTA V (2015) | 143.7 | 124.5 | |||
| Dota 2 Reborn (2015) | 211 | 185.7 | 177 | 164.3 | |
| Final Fantasy XV Benchmark (2018) | 231 | 179.7 | 136.2 | 97.4 | |
| X-Plane 11.11 (2018) | 142.4 | 117.4 | 99.3 | ||
| Strange Brigade (2018) | 519 | 335 | 278 | 242 | 165.7 |
| Baldur's Gate 3 (2023) | 179.1 | 142.7 | 123.4 | 121 | 84.1 |
| Cyberpunk 2077 (2023) | 164.9 | 137.6 | 115.3 | 103.8 | 65.2 |
| F1 24 (2024) | 296 | 291 | 241 | 86.4 | 55.2 |
| F1 25 (2025) | 243 | 218 | 172.3 | 27.7 | 15.5 |
| Call of Duty Black Ops 7 (2025) | 224 | 152 | 117 | 44 | 28 |
Emissões
Ruído do sistema
As ventoinhas permanecem muito silenciosas durante o uso diário, e o Fusion 16 também é mais silencioso do que a maioria dos concorrentes, atingindo um máximo de 49,7 dB(A) durante os jogos. Não foram detectados outros ruídos eletrônicos.
Barulho
| Ocioso |
| 25.7 / 25.7 / 28 dB |
| Carga |
| 38.9 / 49.7 dB |
 | ||
30 dB silencioso 40 dB(A) audível 50 dB(A) ruidosamente alto |
||
min: | ||
| Schenker XMG FUSION 16 (M25) Ultra 9 275HX, GeForce RTX 5070 Laptop | Lenovo Legion Pro 5 16IAX10, RTX 5070 Ultra 7 255HX, GeForce RTX 5070 Laptop | Schenker XMG Core 16 M25 Ryzen AI 9 HX 370, GeForce RTX 5070 Laptop | Asus TUF Gaming A16 FA608UP R7 260, GeForce RTX 5070 Laptop | MSI Crosshair 16 HX AI D2XWGKG Ultra 9 275HX, GeForce RTX 5070 Laptop | Aorus Elite 16 AE6H Ultra 9 275HX, GeForce RTX 5070 Laptop | Gigabyte Gaming A16 GA6H i7-13620H, GeForce RTX 5070 Laptop | |
|---|---|---|---|---|---|---|---|
| Noise | 4% | 2% | -12% | -12% | -16% | -7% | |
| desligado / ambiente * (dB) | 25.7 | 23 11% | 24.8 4% | 25.1 2% | 25.56 1% | 24 7% | 24 7% |
| Idle Minimum * (dB) | 25.7 | 23 11% | 24.8 4% | 32.2 -25% | 28.3 -10% | 25 3% | 25 3% |
| Idle Average * (dB) | 25.7 | 23 11% | 24.8 4% | 32.2 -25% | 28.3 -10% | 29 -13% | 26 -1% |
| Idle Maximum * (dB) | 28 | 23 18% | 27.1 3% | 32.2 -15% | 28.3 -1% | 32 -14% | 27 4% |
| Load Average * (dB) | 38.9 | 43.85 -13% | 40.2 -3% | 38.1 2% | 50.26 -29% | 60 -54% | 54 -39% |
| Cyberpunk 2077 ultra * (dB) | 49.7 | 50.27 -1% | 49.2 1% | 53.9 -8% | 57.8 -16% | 59 -19% | 54 -9% |
| Load Maximum * (dB) | 49.7 | 52.9 -6% | 49.2 1% | 57.1 -15% | 57.95 -17% | 61 -23% | 55 -11% |
* ... menor é melhor
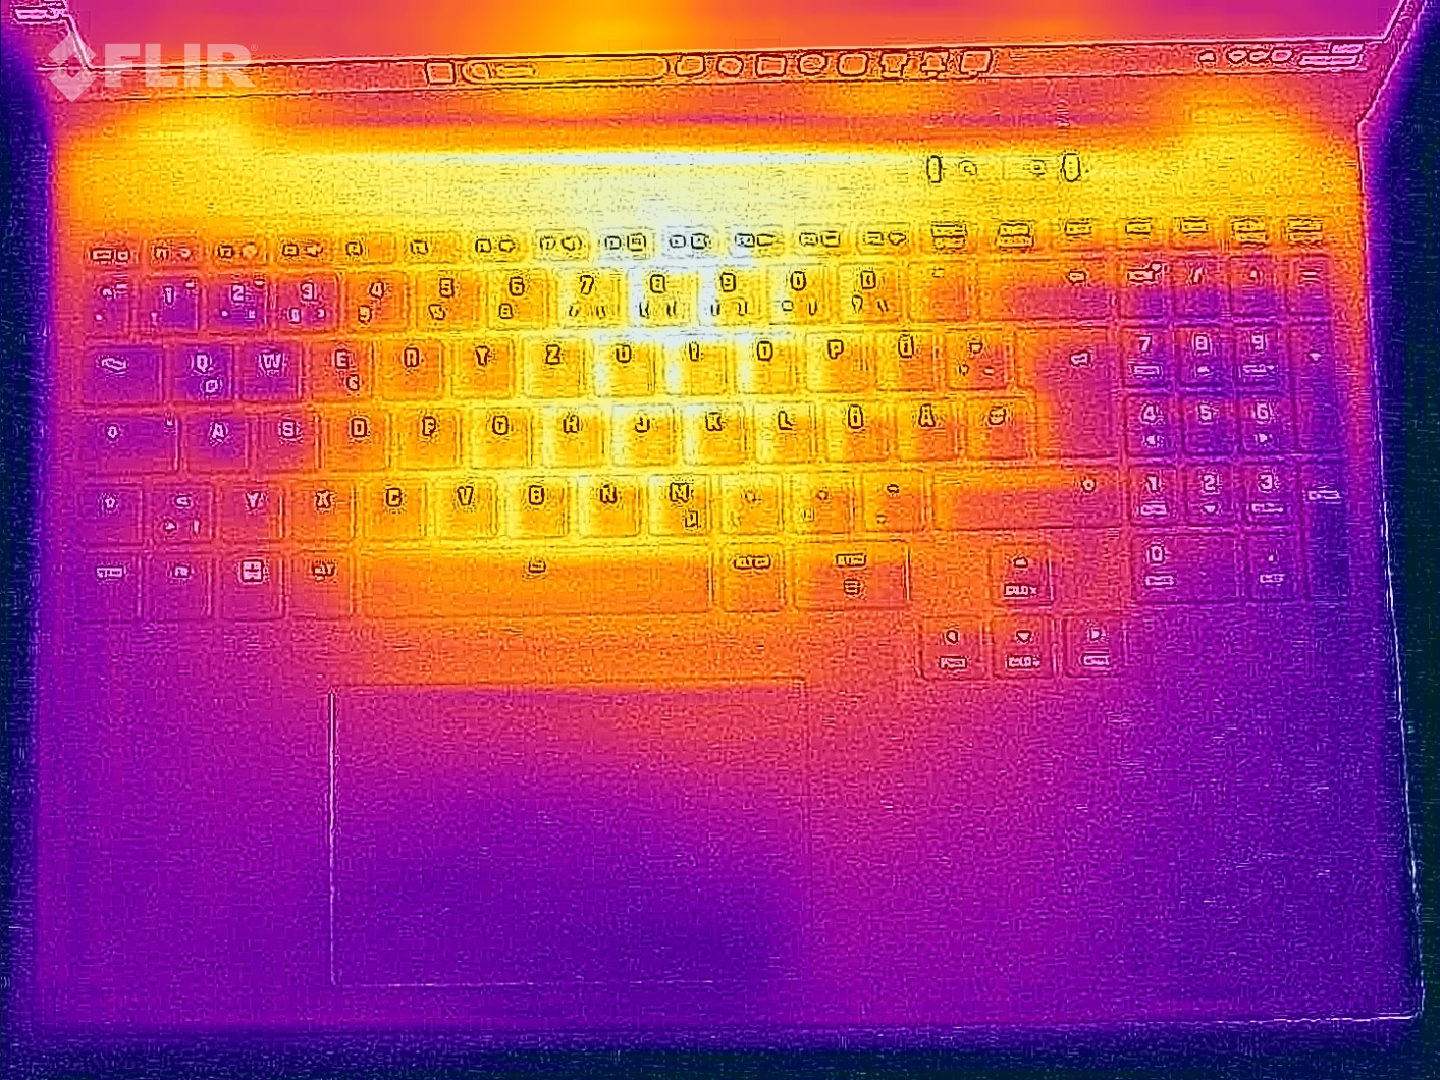
Temperatura
O Fusion 16 permanece discreto em termos de temperatura, e um máximo de 48 °C na parte inferior não é crítico durante os jogos.

(±) A temperatura máxima no lado superior é 43.2 °C / 110 F, em comparação com a média de 40.4 °C / 105 F , variando de 21.2 a 68.8 °C para a classe Gaming.
(-) A parte inferior aquece até um máximo de 48 °C / 118 F, em comparação com a média de 43.2 °C / 110 F
(+) Em uso inativo, a temperatura média para o lado superior é 25.8 °C / 78 F, em comparação com a média do dispositivo de 33.9 °C / ### class_avg_f### F.
(±) 3: The average temperature for the upper side is 36.6 °C / 98 F, compared to the average of 33.9 °C / 93 F for the class Gaming.
(+) Os apoios para as mãos e o touchpad são mais frios que a temperatura da pele, com um máximo de 31.4 °C / 88.5 F e, portanto, são frios ao toque.
(-) A temperatura média da área do apoio para as mãos de dispositivos semelhantes foi 28.8 °C / 83.8 F (-2.6 °C / -4.7 F).

| Schenker XMG FUSION 16 (M25) Ultra 9 275HX, GeForce RTX 5070 Laptop | Lenovo Legion Pro 5 16IAX10, RTX 5070 Ultra 7 255HX, GeForce RTX 5070 Laptop | Schenker XMG Core 16 M25 Ryzen AI 9 HX 370, GeForce RTX 5070 Laptop | Asus TUF Gaming A16 FA608UP R7 260, GeForce RTX 5070 Laptop | MSI Crosshair 16 HX AI D2XWGKG Ultra 9 275HX, GeForce RTX 5070 Laptop | Aorus Elite 16 AE6H Ultra 9 275HX, GeForce RTX 5070 Laptop | Gigabyte Gaming A16 GA6H i7-13620H, GeForce RTX 5070 Laptop | |
|---|---|---|---|---|---|---|---|
| Heat | -9% | -11% | 7% | -4% | -13% | -18% | |
| Maximum Upper Side * (°C) | 43.2 | 42 3% | 46.7 -8% | 39.5 9% | 44.8 -4% | 41 5% | 50 -16% |
| Maximum Bottom * (°C) | 48 | 44 8% | 58.5 -22% | 45.1 6% | 43.4 10% | 45 6% | 49 -2% |
| Idle Upper Side * (°C) | 26.6 | 33 -24% | 28.3 -6% | 25.7 3% | 31.2 -17% | 35 -32% | 35 -32% |
| Idle Bottom * (°C) | 27.6 | 34 -23% | 29.9 -8% | 25.5 8% | 28.8 -4% | 36 -30% | 34 -23% |
* ... menor é melhor
Alto-falantes
Schenker XMG FUSION 16 (M25) análise de áudio
(+) | os alto-falantes podem tocar relativamente alto (###valor### dB)
Graves 100 - 315Hz
(-) | quase nenhum baixo - em média 17.9% menor que a mediana
(±) | a linearidade dos graves é média (10.5% delta para a frequência anterior)
Médios 400 - 2.000 Hz
(±) | médios mais altos - em média 5.7% maior que a mediana
(+) | médios são lineares (4.6% delta para frequência anterior)
Altos 2 - 16 kHz
(+) | agudos equilibrados - apenas 3.1% longe da mediana
(+) | os máximos são lineares (4.8% delta da frequência anterior)
Geral 100 - 16.000 Hz
(+) | o som geral é linear (14.8% diferença em relação à mediana)
Comparado com a mesma classe
» 29% de todos os dispositivos testados nesta classe foram melhores, 7% semelhantes, 64% piores
» O melhor teve um delta de 6%, a média foi 18%, o pior foi 132%
Comparado com todos os dispositivos testados
» 20% de todos os dispositivos testados foram melhores, 4% semelhantes, 76% piores
» O melhor teve um delta de 4%, a média foi 24%, o pior foi 134%
Lenovo Legion Pro 5 16IAX10, RTX 5070 análise de áudio
(±) | o volume do alto-falante é médio, mas bom (###valor### dB)
Graves 100 - 315Hz
(-) | quase nenhum baixo - em média 20% menor que a mediana
(±) | a linearidade dos graves é média (9.3% delta para a frequência anterior)
Médios 400 - 2.000 Hz
(±) | médios mais altos - em média 6.1% maior que a mediana
(±) | a linearidade dos médios é média (7.9% delta para frequência anterior)
Altos 2 - 16 kHz
(+) | agudos equilibrados - apenas 2.2% longe da mediana
(+) | os máximos são lineares (6.3% delta da frequência anterior)
Geral 100 - 16.000 Hz
(±) | a linearidade do som geral é média (19.4% diferença em relação à mediana)
Comparado com a mesma classe
» 67% de todos os dispositivos testados nesta classe foram melhores, 7% semelhantes, 26% piores
» O melhor teve um delta de 6%, a média foi 18%, o pior foi 132%
Comparado com todos os dispositivos testados
» 48% de todos os dispositivos testados foram melhores, 7% semelhantes, 45% piores
» O melhor teve um delta de 4%, a média foi 24%, o pior foi 134%
Asus TUF Gaming A16 FA608UP análise de áudio
(±) | o volume do alto-falante é médio, mas bom (###valor### dB)
Graves 100 - 315Hz
(±) | graves reduzidos - em média 11.8% menor que a mediana
(±) | a linearidade dos graves é média (8.7% delta para a frequência anterior)
Médios 400 - 2.000 Hz
(+) | médios equilibrados - apenas 3% longe da mediana
(+) | médios são lineares (3% delta para frequência anterior)
Altos 2 - 16 kHz
(+) | agudos equilibrados - apenas 4.4% longe da mediana
(±) | a linearidade dos máximos é média (7.4% delta para frequência anterior)
Geral 100 - 16.000 Hz
(+) | o som geral é linear (12.6% diferença em relação à mediana)
Comparado com a mesma classe
» 16% de todos os dispositivos testados nesta classe foram melhores, 3% semelhantes, 81% piores
» O melhor teve um delta de 6%, a média foi 18%, o pior foi 132%
Comparado com todos os dispositivos testados
» 11% de todos os dispositivos testados foram melhores, 2% semelhantes, 86% piores
» O melhor teve um delta de 4%, a média foi 24%, o pior foi 134%
MSI Crosshair 16 HX AI D2XWGKG análise de áudio
(±) | o volume do alto-falante é médio, mas bom (###valor### dB)
Graves 100 - 315Hz
(-) | quase nenhum baixo - em média 15.6% menor que a mediana
(±) | a linearidade dos graves é média (10.5% delta para a frequência anterior)
Médios 400 - 2.000 Hz
(±) | médios mais altos - em média 6.6% maior que a mediana
(±) | a linearidade dos médios é média (7.1% delta para frequência anterior)
Altos 2 - 16 kHz
(+) | agudos equilibrados - apenas 1.6% longe da mediana
(+) | os máximos são lineares (5.8% delta da frequência anterior)
Geral 100 - 16.000 Hz
(+) | o som geral é linear (14.7% diferença em relação à mediana)
Comparado com a mesma classe
» 28% de todos os dispositivos testados nesta classe foram melhores, 7% semelhantes, 64% piores
» O melhor teve um delta de 6%, a média foi 18%, o pior foi 132%
Comparado com todos os dispositivos testados
» 19% de todos os dispositivos testados foram melhores, 4% semelhantes, 77% piores
» O melhor teve um delta de 4%, a média foi 24%, o pior foi 134%
Aorus Elite 16 AE6H análise de áudio
(+) | os alto-falantes podem tocar relativamente alto (###valor### dB)
Graves 100 - 315Hz
(±) | graves reduzidos - em média 10.8% menor que a mediana
(±) | a linearidade dos graves é média (7.5% delta para a frequência anterior)
Médios 400 - 2.000 Hz
(+) | médios equilibrados - apenas 2.1% longe da mediana
(+) | médios são lineares (4.8% delta para frequência anterior)
Altos 2 - 16 kHz
(+) | agudos equilibrados - apenas 2.5% longe da mediana
(+) | os máximos são lineares (4.3% delta da frequência anterior)
Geral 100 - 16.000 Hz
(+) | o som geral é linear (8.1% diferença em relação à mediana)
Comparado com a mesma classe
» 1% de todos os dispositivos testados nesta classe foram melhores, 1% semelhantes, 98% piores
» O melhor teve um delta de 6%, a média foi 18%, o pior foi 132%
Comparado com todos os dispositivos testados
» 2% de todos os dispositivos testados foram melhores, 1% semelhantes, 98% piores
» O melhor teve um delta de 4%, a média foi 24%, o pior foi 134%
Gerenciamento de energia
Não há surpresas em termos de consumo de energia. Medimos um pico de 243 watts durante o teste de estresse, mas esse valor se estabiliza rapidamente em torno de 170 watts. O adaptador de energia compacto de 250 watts é, portanto, suficiente. O consumo de energia em espera de 1,8 watts é relativamente alto.
| desligado | |
| Ocioso | |
| Carga |
|
Key:
min: | |
| Schenker XMG FUSION 16 (M25) Ultra 9 275HX, GeForce RTX 5070 Laptop, Samsung 9100 Pro 2 TB, OLED, 2880x1800, 16" | Lenovo Legion Pro 5 16IAX10, RTX 5070 Ultra 7 255HX, GeForce RTX 5070 Laptop, SK Hynix HFS001TEJ9X115N, OLED, 2650x1600, 16" | Schenker XMG Core 16 M25 Ryzen AI 9 HX 370, GeForce RTX 5070 Laptop, Samsung 990 Pro 2 TB MZVL72T0HDLB, IPS, 2560x1600, 16" | Asus TUF Gaming A16 FA608UP R7 260, GeForce RTX 5070 Laptop, Western Digital PC SN5000S SDEQNSJ-1T00, IPS, 2560x1600, 16" | MSI Crosshair 16 HX AI D2XWGKG Ultra 9 275HX, GeForce RTX 5070 Laptop, Micron 2500 1TB MTFDKBA1T0QGN, IPS, 2560x1600, 16" | Aorus Elite 16 AE6H Ultra 9 275HX, GeForce RTX 5070 Laptop, Gigabyte AG470S1TB-SI B10, IPS, 2560x1600, 16" | Gigabyte Gaming A16 GA6H i7-13620H, GeForce RTX 5070 Laptop, Kingston OM8PGP41024Q-A0, IPS, 2560x1600, 16" | Média NVIDIA GeForce RTX 5070 Laptop | Média da turma Gaming | |
|---|---|---|---|---|---|---|---|---|---|
| Power Consumption | -2% | 9% | 23% | -51% | -4% | 20% | 4% | -11% | |
| Idle Minimum * (Watt) | 15.3 | 10.6 31% | 7.4 52% | 4.6 70% | 26.2 -71% | 8.5 44% | 9 41% | 10.8 ? 29% | 13.1 ? 14% |
| Idle Average * (Watt) | 16.8 | 12.3 27% | 14.9 11% | 9.8 42% | 33.8 -101% | 13.6 19% | 11 35% | 15.4 ? 8% | 18.7 ? -11% |
| Idle Maximum * (Watt) | 17.3 | 18.6 -8% | 15.2 12% | 10.2 41% | 34 -97% | 22 -27% | 23 -33% | 21 ? -21% | 24.4 ? -41% |
| Load Average * (Watt) | 94.7 | 104 -10% | 100.8 -6% | 76.1 20% | 112 -18% | 113 -19% | 91 4% | 98.7 ? -4% | 108.1 ? -14% |
| Cyberpunk 2077 ultra external monitor * (Watt) | 180.9 | 227 -25% | 181.4 -0% | 198.1 -10% | 220 -22% | 219 -21% | 130 28% | ||
| Cyberpunk 2077 ultra * (Watt) | 185.3 | 231 -25% | 184.8 -0% | 198.9 -7% | 224 -21% | 223 -20% | 132.5 28% | ||
| Load Maximum * (Watt) | 242.7 | 248 -2% | 251.1 -3% | 235.2 3% | 315 -30% | 257 -6% | 155 36% | 218 ? 10% | 254 ? -5% |
* ... menor é melhor
Consumo de energia Cyberpunk / Teste de estresse
Consumo de energia do monitor externo
Duração da bateria
Apesar do painel OLED, a duração da bateria é basicamente muito semelhante à do Core 16 com tela IPS. No teste de Wi-Fi com 150 cd/m², medimos 10:15 horas e 7:39 horas com brilho total.

| Schenker XMG FUSION 16 (M25) Ultra 9 275HX, GeForce RTX 5070 Laptop, 99.8 Wh | Lenovo Legion Pro 5 16IAX10, RTX 5070 Ultra 7 255HX, GeForce RTX 5070 Laptop, 80 Wh | Schenker XMG Core 16 M25 Ryzen AI 9 HX 370, GeForce RTX 5070 Laptop, 99.8 Wh | Asus TUF Gaming A16 FA608UP R7 260, GeForce RTX 5070 Laptop, 90 Wh | MSI Crosshair 16 HX AI D2XWGKG Ultra 9 275HX, GeForce RTX 5070 Laptop, 90 Wh | Aorus Elite 16 AE6H Ultra 9 275HX, GeForce RTX 5070 Laptop, 99 Wh | Gigabyte Gaming A16 GA6H i7-13620H, GeForce RTX 5070 Laptop, 76 Wh | Média da turma Gaming | |
|---|---|---|---|---|---|---|---|---|
| Battery Runtime | -40% | -2% | 21% | 8% | -17% | -25% | -31% | |
| WiFi Websurfing (h) | 10.3 | 6.2 -40% | 10.9 6% | 13 26% | 11.1 8% | 8.5 -17% | 7.7 -25% | 7.04 ? -32% |
| WiFi Websurfing max. Brightness (h) | 7.7 | 7 -9% | 8.9 16% | 5.45 ? -29% |
Avaliação geral do Notebookcheck
Schenker XMG FUSION 16 (M25)
- 12/29/2025 v8
Andreas Osthoff
 Total Sustainability Score:
 Possíveis alternativas em comparação
Imagem | Modelo / Análises | Preço | Peso | Altura | Tela |
|---|---|---|---|---|---|
1. 87.5%  | Schenker XMG FUSION 16 (M25) Intel Core Ultra 9 275HX ⎘ NVIDIA GeForce RTX 5070 Laptop ⎘ 64 GB Memória, 2048 GB SSD | Amazon: Preço de tabela: 2700€ | 2.1 kg | 23 mm | 16.00" 2880x1800 212 PPI OLED |
2. 86.2%  | Lenovo Legion Pro 5 16IAX10, RTX 5070 Intel Core Ultra 7 255HX ⎘ NVIDIA GeForce RTX 5070 Laptop ⎘ 32 GB Memória, 1024 GB SSD | Amazon: Preço de tabela: 1800 Euro | 2.3 kg | 25.95 mm | 16.00" 2650x1600 189 PPI OLED |
3. 86.2%  | Schenker XMG Core 16 M25 AMD Ryzen AI 9 HX 370 ⎘ NVIDIA GeForce RTX 5070 Laptop ⎘ 64 GB Memória, 2048 GB SSD | Amazon: Preço de tabela: 2100€ | 2.1 kg | 23 mm | 16.00" 2560x1600 189 PPI IPS |
4. 83.8%  | Asus TUF Gaming A16 FA608UP AMD Ryzen 7 260 ⎘ NVIDIA GeForce RTX 5070 Laptop ⎘ 32 GB Memória, 1024 GB SSD | Amazon: Preço de tabela: 2199€ | 2.2 kg | 25.7 mm | 16.00" 2560x1600 189 PPI IPS |
5. 81.9%  | MSI Crosshair 16 HX AI D2XWGKG Intel Core Ultra 9 275HX ⎘ NVIDIA GeForce RTX 5070 Laptop ⎘ 16 GB Memória, 1024 GB SSD | Amazon: Preço de tabela: 2500 EUR | 2.5 kg | 27.9 mm | 16.00" 2560x1600 189 PPI IPS |
6. 84.4%  | Aorus Elite 16 AE6H Intel Core Ultra 9 275HX ⎘ NVIDIA GeForce RTX 5070 Laptop ⎘ 32 GB Memória, 1024 GB SSD | Preço de tabela: 2300 EUR | 2.4 kg | 26 mm | 16.00" 2560x1600 189 PPI IPS |
7. 80.1%  | Gigabyte Gaming A16 GA6H Intel Core i7-13620H ⎘ NVIDIA GeForce RTX 5070 Laptop ⎘ 16 GB Memória, 1024 GB SSD | Amazon: 1. $1,341.81 GIGABYTE - Gaming A16 Gaming... 2. $1,229.98 GIGABYTE - Gaming A16 Gaming... 3. $1,029.00 GIGABYTE - Gaming A16 Gaming... Preço de tabela: 1700 EUR | 2.3 kg | 23 mm | 16.00" 2560x1600 189 PPI IPS |
Transparência
A seleção dos dispositivos a serem analisados é feita pela nossa equipe editorial. A amostra de teste foi fornecida ao autor como empréstimo pelo fabricante ou varejista para fins desta revisão. O credor não teve influência nesta revisão, nem o fabricante recebeu uma cópia desta revisão antes da publicação. Não houve obrigação de publicar esta revisão. Como empresa de mídia independente, a Notebookcheck não está sujeita à autoridade de fabricantes, varejistas ou editores.
É assim que o Notebookcheck está testando
Todos os anos, o Notebookcheck analisa de forma independente centenas de laptops e smartphones usando procedimentos padronizados para garantir que todos os resultados sejam comparáveis. Desenvolvemos continuamente nossos métodos de teste há cerca de 20 anos e definimos padrões da indústria no processo. Em nossos laboratórios de teste, equipamentos de medição de alta qualidade são utilizados por técnicos e editores experientes. Esses testes envolvem um processo de validação em vários estágios. Nosso complexo sistema de classificação é baseado em centenas de medições e benchmarks bem fundamentados, o que mantém a objetividade.