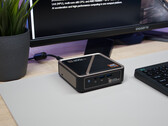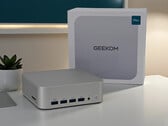
Sapphire Edge AI: Mini-PC com AMD Ryzen AI 9 HX 370 e tampa magnética
AMD Ryzen AI 9 HX 370 | AMD Radeon 890M | 430 g

O AMD Ryzen AI 9 HX 170 é um poderoso chip da família Strix Point que deve ser lançado em junho de 2024. Diz-se que a APU apresenta 12 núcleos de CPU (24 threads) rodando a até 5,1 GHz, um adaptador gráfico RDNA 3+ de 16 CU e uma unidade de processamento neural XDNA 2 de 45 TOPS.
Arquitetura e recursos
As APUs da família Strix Point devem ser equipadas com núcleos Zen 5 e Zen 5c, sendo o último uma versão um pouco mais lenta, menor e mais eficiente em termos de energia do primeiro. O salto do Zen 2 para o Zen 3 nos trouxe um aumento de IPC de quase 20% e vimos um tipo muito semelhante de ganhos de geração para geração quando o Zen 4 chegou, portanto, é seguro presumir que o Zen 5 trará pelo menos 15% de melhoria de IPC quando chegar.
Espera-se que o HX 170 tenha um controlador de RAM LPDDR5X-8533 super-rápido, impressionantes 36 MB de cache L3 e suporte a PCIe 4.0 para uma taxa de transferência de 1,9 GB/s por pista. Ele também terá um mecanismo de IA muito poderoso e provavelmente será compatível nativamente com USB 4/Thunderbolt 4, assim como seus antecessores imediatos da série 8000.
Desempenho
12 núcleos de CPU de arquitetura de ponta devem ser capazes de rivalizar com chips de desktop que demandam muita energia, como o Core i7-13700 em cargas de trabalho multi-thread e single-thread. Atualizaremos esta seção assim que colocarmos as mãos em um laptop equipado com o HX 170.
Gráficos
Espera-se que o chip Ryzen AI 9 tenha um adaptador gráfico integrado de 16 CU alimentado pela arquitetura RDNA 3+. A Radeon 780Ma iGPU mais potente que a AMD tem a oferecer atualmente, apresenta 12 CUs da arquitetura RDNA 3 (768 shaders unificados), para referência - o que é mais do que suficiente para jogar jogos de 2023 e 2024 a 1080p / Low.
Naturalmente, o novo adaptador gráfico será capaz de operar pelo menos três monitores SUHD 4320p e também será capaz de codificar e decodificar por hardware codecs de vídeo populares, incluindo AVC, HEVC, AV1.
Consumo de energia
Há rumores de que o HX 170 tenha um TDP básico de 55 W ou 65 W. Esse chip exigirá um chassi bastante grande e pesado com uma solução de resfriamento potente para que o calor não seja um problema.
Espera-se que o chip seja construído com um processo TSMC de 3 nm para alta eficiência energética, a partir de H1 2024.
| Codinome | Strix Point-HX (Zen 5/5c) |
| Série | AMD Strix / Gorgon Point |
| Frequência | 2000 - 5100 MHz |
| Cache de Nível 2 | 12 MB |
| Cache de Nível 3 | 24 MB |
| Número de Núcelos / Subprocessos | 12 / 24 4 x 5.1 GHz AMD Zen 5 8 x 3.3 GHz AMD Zen 5c |
| Consumo de Energia (TDP = Thermal Design Power) | 28 Watt |
| TDP Turbo PL2 | 54 Watt |
| Tecnologia de Produção | 4 nm |
| Tempratura Máx. | 100 °C |
| Conector | FP8 |
| Características | DDR5-5600/LPDDR5x-8000 RAM, PCIe 4, USB 4, XDNA 2 NPU (50 TOPS), SMT, AES, AVX, AVX2, AVX512, FMA3, MMX (+), SHA, SSE, SSE2, SSE3, SSSE3, SSE4.1, SSE4.2, SSE4A |
| GPU | AMD Radeon 890M ( - 2900 MHz) |
| NPU / AI | 50 TOPS INT8 |
| Chip AI | 80 TOPS INT8 |
| 64 Bit | Suporte para 64 Bit |
| Architecture | x86 |
| Data do Anúncio | 06/02/2024 |
| Link do Produto (externo) | www.amd.com |


GMK AD-GP1 Radeon 7600M XT: AMD Radeon RX 7600M XT, 0.7 kg
ánalise » Análise da estação de acoplamento GMK AD-GP1 Radeon RX 7600M XT: Simples de usar, mas envelhecendo rapidamente
Asus ROG Zephyrus G14 2025 5070 Ti: NVIDIA GeForce RTX 5070 Ti Laptop, 14.00", 1.6 kg
ánalise » Laptop RTX 5070 Ti quase tão rápido quanto o laptop RTX 5080 - Análise do Asus ROG Zephyrus G14 2025
Asus ProArt P16 H7606WP: NVIDIA GeForce RTX 5070 Laptop, 16.00", 1.8 kg
ánalise » OLED 4K é substituído por OLED 2.8K de 120 Hz - Análise do laptop Asus ProArt P16 com RTX 5070
Asus ROG Zephyrus G14 2025 GA403WW: NVIDIA GeForce RTX 5080 Laptop, 14.00", 1.6 kg
ánalise » 14 polegadas com o laptop GeForce RTX 5080 - Análise do Asus ROG Zephyrus G14 2025
Acemagic F3A: AMD Radeon 890M, 1 kg
ánalise » O mini PC acessível com um AMD Ryzen AI 9 HX 370 que custa menos de US$ 700 - Análise detalhada do Acemagic F3A
Razer Blade 16 2025 RTX 5090: NVIDIA GeForce RTX 5090 Laptop, 16.00", 2.1 kg
ánalise » Os notebooks para jogos mais finos com o laptop RTX 5090 - Asus ROG Zephyrus G16 vs. Razer Blade 16
Framework Laptop 13.5 Ryzen AI 9 HX 370: AMD Radeon 890M, 13.50", 1.3 kg
ánalise » Análise do Framework Laptop 13.5 Ryzen AI 9: Ignore a versão Intel para obter melhor desempenho
Razer Blade 16 2025 RTX 5090: NVIDIA GeForce RTX 5090 Laptop, 16.00", 2.1 kg
ánalise » Análise do Razer Blade 16 2025 - Laptop para jogos agora com GeForce RTX 5090 e um gabinete ainda mais fino
ánalise » Análise do laptop Nvidia GeForce RTX 5090 - Mais rápido, mas ainda há mais por vir
ONEXPLAYER X1 Pro GA15H-HX370-32GB-1TB-H: AMD Radeon 890M, 10.95", 0.9 kg
ánalise » Portátil, tablet e laptop para jogos XL: Análise do OneXplayer X1 Pro
Minisforum AI X1 Pro: AMD Radeon 890M, 1.4 kg
ánalise » Análise do Minisforum AI X1 Pro: Um mini PC completo para o escritório, multimídia, jogos e tarefas criativas
Asus TUF Gaming A16 FA608WV: NVIDIA GeForce RTX 4060 Laptop GPU, 16.00", 2.2 kg
ánalise » Análise do Asus TUF Gaming A16: Laptop para jogos legal, silencioso e acessível com um ponto fraco proeminente, mas viável
GMK EVO-X1: AMD Radeon 890M, 0.6 kg
ánalise » Análise do mini PC GMKtec EVO-X1: Novo design quadradão com Oculink e Ryzen AI 9
GPD Pocket 4: AMD Radeon 890M, 8.80", 0.8 kg
ánalise » Análise do PC de mão GPD Pocket 4 Ryzen AI 9: Pequeno, rápido e tão adorável
Minisforum EliteMini AI370: AMD Radeon 890M, 0.5 kg
ánalise » Análise do Minisforum EliteMini AI370: O mini PC estabelece novos padrões com uma APU AMD Zen 5 Strix Point
Beelink SER9: AMD Radeon 890M, 0.8 kg
ánalise » Análise do Beelink SER9: O AMD Zen 5 torna este mini PC mais rápido do que nunca
Asus VivoBook S 14 OLED M5406WA: AMD Radeon 890M, 14.00", 1.3 kg
ánalise » Análise do laptop Asus VivoBook S 14 OLED: Desempenho bem-sucedido do Ryzen AI 9 HX 370
Asus TUF Gaming A14 FA401WV-WB94: NVIDIA GeForce RTX 4060 Laptop GPU, 14.00", 1.5 kg
ánalise » Análise do Asus TUF Gaming A14 FA401WV: O Zen 5 Ryzen 9 continua a impressionar
Asus ROG Zephyrus G16 GA605WV: NVIDIA GeForce RTX 4060 Laptop GPU, 16.00", 1.8 kg
ánalise » Análise do Asus ROG Zephyrus G16 2024 - O notebook fino para jogos agora com AMD Zen 5
Asus ProArt P16 H7606WI: NVIDIA GeForce RTX 4070 Laptop GPU, 16.00", 1.8 kg
ánalise » Análise do laptop Asus ProArt P16 - O AMD Zen 5 encontra o laptop RTX 4070 e o OLED 4K
Asus ProArt PX13 HN7306: AMD Radeon 890M
ánalise » Análise da iGPU do AMD Zen 5 Strix Point - Radeon 890M versus Intel Arc Graphics, Apple M3 e Qualcomm Adreno X1-85
Asus Zenbook S 16 UM5606-RK333W: AMD Radeon 890M, 16.00", 1.5 kg
ánalise » Análise da iGPU do AMD Zen 5 Strix Point - Radeon 890M versus Intel Arc Graphics, Apple M3 e Qualcomm Adreno X1-85
Asus ProArt P16 H7606WI: AMD Radeon 890M
ánalise » Análise da CPU AMD Zen 5 Strix Point - Ryzen AI 9 HX 370 versus Intel Core Ultra, Apple M3 e Qualcomm Snapdragon X Elite
Asus ProArt PX13 HN7306: NVIDIA GeForce RTX 4070 Laptop GPU, 13.30", 1.4 kg
ánalise » Análise da CPU AMD Zen 5 Strix Point - Ryzen AI 9 HX 370 versus Intel Core Ultra, Apple M3 e Qualcomm Snapdragon X Elite
Asus Zenbook S 16 UM5606-RK333W: AMD Radeon 890M, 16.00", 1.5 kg
ánalise » Análise da CPU AMD Zen 5 Strix Point - Ryzen AI 9 HX 370 versus Intel Core Ultra, Apple M3 e Qualcomm Snapdragon X Elite
Asus ProArt PX13 HN7306: NVIDIA GeForce RTX 4070 Laptop GPU, 13.30", 1.4 kg
ánalise » Análise do Asus ProArt PX13 - O laptop 2-em-1 de 13,3 polegadas mais rápido do mundo graças ao AMD Zen 5 e ao RTX 4070
Asus Zenbook S 16 UM5606-RK333W: AMD Radeon 890M, 16.00", 1.5 kg
ánalise » Análise do laptop Asus Zenbook S 16 - O primeiro laptop Copilot+ com AMD Zen 5 em um gabinete de 1,3 cm de espessura
Asus ProArt P16 H7606WW: NVIDIA GeForce RTX 5080 Laptop, 16.00", 1.9 kg
ánalise externa » Asus ProArt P16 H7606WW
Asus ProArt P16 H7606WX: NVIDIA GeForce RTX 5090 Laptop, 16.00", 1.9 kg
ánalise externa » Asus ProArt P16 H7606WX
MSI Prestige A16 AI+ A3HMG: AMD Radeon 890M, 16.00", 2 kg
ánalise externa » MSI Prestige A16 AI+ A3HMG
MSI Creator A16 AI+ A3HVFG: NVIDIA GeForce RTX 4060 Laptop GPU, 16.00", 2.1 kg
ánalise externa » MSI Creator A16 AI+ A3HVFG
MSI Stealth A16 AI+ A3XWGG: NVIDIA GeForce RTX 5070 Laptop, 16.00", 2.1 kg
ánalise externa » MSI Stealth A16 AI+ A3XWGG
Gigabyte Aero X16 2WHA: NVIDIA GeForce RTX 5070 Laptop, 16.00", 1.9 kg
ánalise externa » Gigabyte Aero X16 2WHA
MSI Stealth A16 AI+ A3XWHG: NVIDIA GeForce RTX 5070 Ti, 16.00", 2.1 kg
ánalise externa » MSI Stealth A16 AI+ A3XWHG
Asus ROG Zephyrus G14 2025 5070 Ti: NVIDIA GeForce RTX 5070 Ti Laptop, 14.00", 1.6 kg
ánalise externa » Asus ROG Zephyrus G14 2025 5070 Ti
Asus ROG Zephyrus G14 2025 GA403WW: NVIDIA GeForce RTX 5080 Laptop, 14.00", 1.6 kg
ánalise externa » Asus ROG Zephyrus G14 2025 GA403WW
MSI Stealth A18 AI+ A3XWHG: NVIDIA GeForce RTX 5070 Ti Laptop, 18.00", 2.9 kg
ánalise externa » MSI Stealth A18 AI+ A3XWHG
Asus ROG Zephyrus G14 GA403WR: NVIDIA GeForce RTX 5070 Ti Laptop, 14.00", 1.6 kg
ánalise externa » Asus ROG Zephyrus G14 GA403WR
Asus ProArt P16 H7606WP: NVIDIA GeForce RTX 5070 Laptop, 16.00", 1.8 kg
ánalise externa » Asus ProArt P16 H7606WP
Framework Laptop 13.5 Ryzen AI 9 HX 370: AMD Radeon 890M, 13.50", 1.3 kg
ánalise externa » Framework Laptop 13.5 Ryzen AI 9 HX 370
Asus ProArt PX13 HN7306WU, HX 370: NVIDIA GeForce RTX 4050 Laptop GPU, 13.30", 1.4 kg
ánalise externa » Asus ProArt PX13 HN7306WU, HX 370
MSI Stealth A16 AI+ A3XVGG, HX 370: AMD Radeon 890M, 16.00", 2.1 kg
ánalise externa » MSI Stealth A16 AI+ A3XVGG, HX 370
Razer Blade 16 2025 RTX 5090: NVIDIA GeForce RTX 5090 Laptop, 16.00", 2.1 kg
ánalise externa » Razer Blade 16 2025 RTX 5090
Asus TUF Gaming A16 FA608WV: NVIDIA GeForce RTX 4060 Laptop GPU, 16.00", 2.2 kg
ánalise externa » Asus TUF Gaming A16 FA608WV
Asus Vivobook S 16 M5606W: AMD Radeon 880M, 16.00", 1.5 kg
ánalise externa » Asus Vivobook S 16 M5606W
Asus ProArt PX13 HN7306WV: NVIDIA GeForce RTX 4060 Laptop GPU, 13.30", 1.4 kg
ánalise externa » Asus ProArt PX13 HN7306, RTX 4060
Asus ROG Zephyrus G16 GA605WI: NVIDIA GeForce RTX 4070 Laptop GPU, 16.00", 1.9 kg
ánalise externa » Asus ROG Zephyrus G16 GA605WI
Asus TUF Gaming A14 FA401WV-WB94: NVIDIA GeForce RTX 4060 Laptop GPU, 14.00", 1.5 kg
ánalise externa » Asus TUF Gaming A14 FA401WV-WB94
Asus VivoBook S 14 OLED M5406WA: AMD Radeon 890M, 14.00", 1.3 kg
ánalise externa » Asus VivoBook S 14 OLED M5406WA
Asus ProArt P16 H7606WI: NVIDIA GeForce RTX 4070 Laptop GPU, 16.00", 1.8 kg
ánalise externa » Asus ProArt P16 H7606WI
Asus ProArt PX13 HN7306: NVIDIA GeForce RTX 4070 Laptop GPU, 13.30", 1.4 kg
ánalise externa » Asus ProArt PX13 HN7306
Asus ROG Zephyrus G16 GA605WV: NVIDIA GeForce RTX 4060 Laptop GPU, 16.00", 1.8 kg
ánalise externa » Asus ROG Zephyrus G16 GA605WV
Asus TUF Gaming A14 FA401: NVIDIA GeForce RTX 4060 Laptop GPU, 14.00", 1.5 kg
ánalise externa » Asus TUF Gaming A14 FA401
Asus TUF Gaming A16 FA608: NVIDIA GeForce RTX 4070 Laptop GPU, 16.00", 2.2 kg
ánalise externa » Asus TUF Gaming A16 FA608
Asus Zenbook S 16 UM5606-RK333W: AMD Radeon 890M, 16.00", 1.5 kg
ánalise externa » Asus Zenbook S16 UM5606
Asus ProArt P16 H7606: NVIDIA GeForce RTX 4060 Laptop GPU, 16.00", 1.9 kg
ánalise externa » Asus ProArt P16 H7606
Framework Laptop 13.5 Ryzen AI 9 HX 370: AMD Radeon 890M, 13.50", 1.3 kg
» O Framework Laptop recebe outro aumento de preço após apenas uma semana
Sapphire Edge AI, Ryzen AI 9 HX 370: AMD Radeon 890M, 0.4 kg
» Análise do Sapphire Edge AI: O retorno do mini PC com potência de IA e AMD Ryzen AI 9 HX 370
Asus ProArt P16 RTX 5090: NVIDIA GeForce RTX 5090 Laptop, 16.00", 2 kg
» Asus vs. Lenovo: Quem tem a melhor tela OLED em tandem?
Schenker XMG Core 16 M25: NVIDIA GeForce RTX 5070 Laptop, 16.00", 2.1 kg
» O Core 16 M25 AMD da XMG é um bom equipamento versátil para jogos e trabalho
Asus ProArt P16 RTX 5090: NVIDIA GeForce RTX 5090 Laptop, 16.00", 2 kg
» Visualização do Asus ProArt P16 - Agora com o laptop RTX 5090 e o Lumina Pro OLED
Tuxedo Infinity Book Pro 14 Gen10 AMD: AMD Radeon 890M, 14.00", 1.5 kg
» Processador AMD rápido, até 128 GB de RAM e Linux - O InfinityBook Pro 14 deixa uma boa impressão em nossa análise
Asus ROG Zephyrus G14 2025 5070 Ti: NVIDIA GeForce RTX 5070 Ti Laptop, 14.00", 1.6 kg
» Veredicto sobre o Asus ROG Zephyrus G16: potente, mas ainda mais lento do que seu irmão menor G14
» O Asus ROG Zephyrus G14 é incomparável, pois o Razer Blade 14 está limitado ao laptop RTX 5070
Asus ProArt P16 H7606WP: NVIDIA GeForce RTX 5070 Laptop, 16.00", 1.8 kg
» É um erro que a Asus só ofereça o ProArt P16 com o laptop RTX 5070
» Lançamento da Asus ProArt P16 com tela sensível ao toque OLED, até 64 GB de RAM e RTX 5070
Asus ROG Zephyrus G14 2025 GA403WW: NVIDIA GeForce RTX 5080 Laptop, 14.00", 1.6 kg
» Asus ROG Zephyrus G14: O gamer de 14 polegadas mais rápido, mas sem a 5090, é uma oportunidade perdida
ONEXPLAYER X1 Pro GA15H-HX370-32GB-1TB-H: AMD Radeon 890M, 10.95", 0.9 kg
» OneXplayer X1 Pro: Nintendo Switch com esteroides
Asus VivoBook S 14 OLED M5406WA: AMD Radeon 890M, 14.00", 1.3 kg
» Asus Vivobook S 16 (S5606CA) lançado com as mais recentes CPUs móveis Intel Core Ultra 200H Arrow Lake e tela OLED Lumina
Asus ProArt P16 H7606WI: AMD Radeon 890M
» Simulação de desempenho da APU portátil Strix Point: Ryzen AI 9 HX 370 brilha em jogos mesmo quando testado com apenas 17 W
Asus ProArt PX13 HN7306: NVIDIA GeForce RTX 4070 Laptop GPU, 13.30", 1.4 kg
» Simulação de desempenho da APU portátil Strix Point: Ryzen AI 9 HX 370 brilha em jogos mesmo quando testado com apenas 17 W
Asus Zenbook S 16 UM5606-RK333W: AMD Radeon 890M, 16.00", 1.5 kg
» Simulação de desempenho da APU portátil Strix Point: Ryzen AI 9 HX 370 brilha em jogos mesmo quando testado com apenas 17 W
» Comparação de CPUs Móveis
Comparação de todas as séries de CPUs móveis
» Processadores Móveis - Benchmarklist
Benchmarklist de todos os CPUs conhecidos que são usados em portáteis (CPUs de desktop e laptop)
» Os Top 10 Portáteis Multimídia
» Os Top 10 Portáteis de Jogos
» Os Top 10 Portáteis Leves para Jogos
» Os Top 10 Portáteis Acessíveis de Escritório/Empresariais
» Os Top 10 Portáteis Premium de Escritório/Empresariais
» Os Top 10 dos Portáteis Workstation
» Os Top 10 Subportáteis
» Os Top 10 Ultrabooks
» Os Top 10 Conversíveis
» Os Top 10 Tablets
» Os Top 10 Smartphones
» A melhores Telas de Portáteis Analisadas Pela Notebookcheck
» Top 10 dos portáteis abaixo dos 500 Euros da Notebookcheck
» Top 10 dos Portáteis abaixo dos 300 Euros