Asus TUF Dash F15 FX517ZC revisão de laptop: 1440p, 165 Hz, e cores P3 completas para menos de $1000
Ao contrário da principal série Asus ROG, a série Asus TUF é o lar de laptops para jogos de médio alcance que normalmente omitem características luxuosas como luzes RGB ou Asus Keystone em favor de preços mais acessíveis. A série TUF Dash F15 FX517 em particular pode ser configurada com um orçamento GeForce opção RTX 3050 (FX517ZC) até o RTX 3070 (FX517ZR). Esta revisão se concentra na opção RTX 3050.
Recomendamos verificar nossa revisão existente sobre a configuração do RTX 3070, pois ele compartilha o mesmo display 1440p 165 Hz, CPU Core i7-12650H, e essencialmente as mesmas características físicas que a configuração do RTX 3050. Os concorrentes neste espaço incluem outros laptops para jogos a preços acessíveis que custam US$ 1000 ou menos, como o Dell G15 5510, MSI Bravo 15, Lenovo IdeaPad Gaming 3 15ou o Gigabyte G5.
Mais revisões do Asus
Possíveis concorrentes em comparação
Avaliação | Data | Modelo | Peso | Altura | Size | Resolução | Preço |
|---|---|---|---|---|---|---|---|
| 84.9 % v7 (old) | 08/2022 | Asus TUF Dash F15 FX517ZC i7-12650H, GeForce RTX 3050 4GB Laptop GPU | 1.9 kg | 20.7 mm | 15.60" | 2560x1440 | |
| 85.8 % v7 (old) | 07/2022 | Asus TUF Dash F15 FX517ZR i7-12650H, GeForce RTX 3070 Laptop GPU | 2 kg | 20.7 mm | 15.60" | 2560x1440 | |
| 81 % v7 (old) | 06/2022 | Dell G15 5510 i5-10500H, GeForce RTX 3050 4GB Laptop GPU | 2.5 kg | 23 mm | 15.60" | 1920x1080 | |
| 78.2 % v7 (old) | 04/2022 | MSI Bravo 15 B5DD-010US R5 5600H, Radeon RX 5500M | 2.3 kg | 24.95 mm | 15.60" | 1920x1080 | |
| 79.7 % v7 (old) | 03/2022 | Lenovo Ideapad Gaming 3 15IHU-82K1002RGE i5-11300H, GeForce RTX 3050 Ti Laptop GPU | 2 kg | 24.2 mm | 15.60" | 1920x1080 | |
| 81.7 % v7 (old) | 11/2021 | Gigabyte G5 GD i5-11400H, GeForce RTX 3050 4GB Laptop GPU | 2.1 kg | 31.6 mm | 15.60" | 1920x1080 |
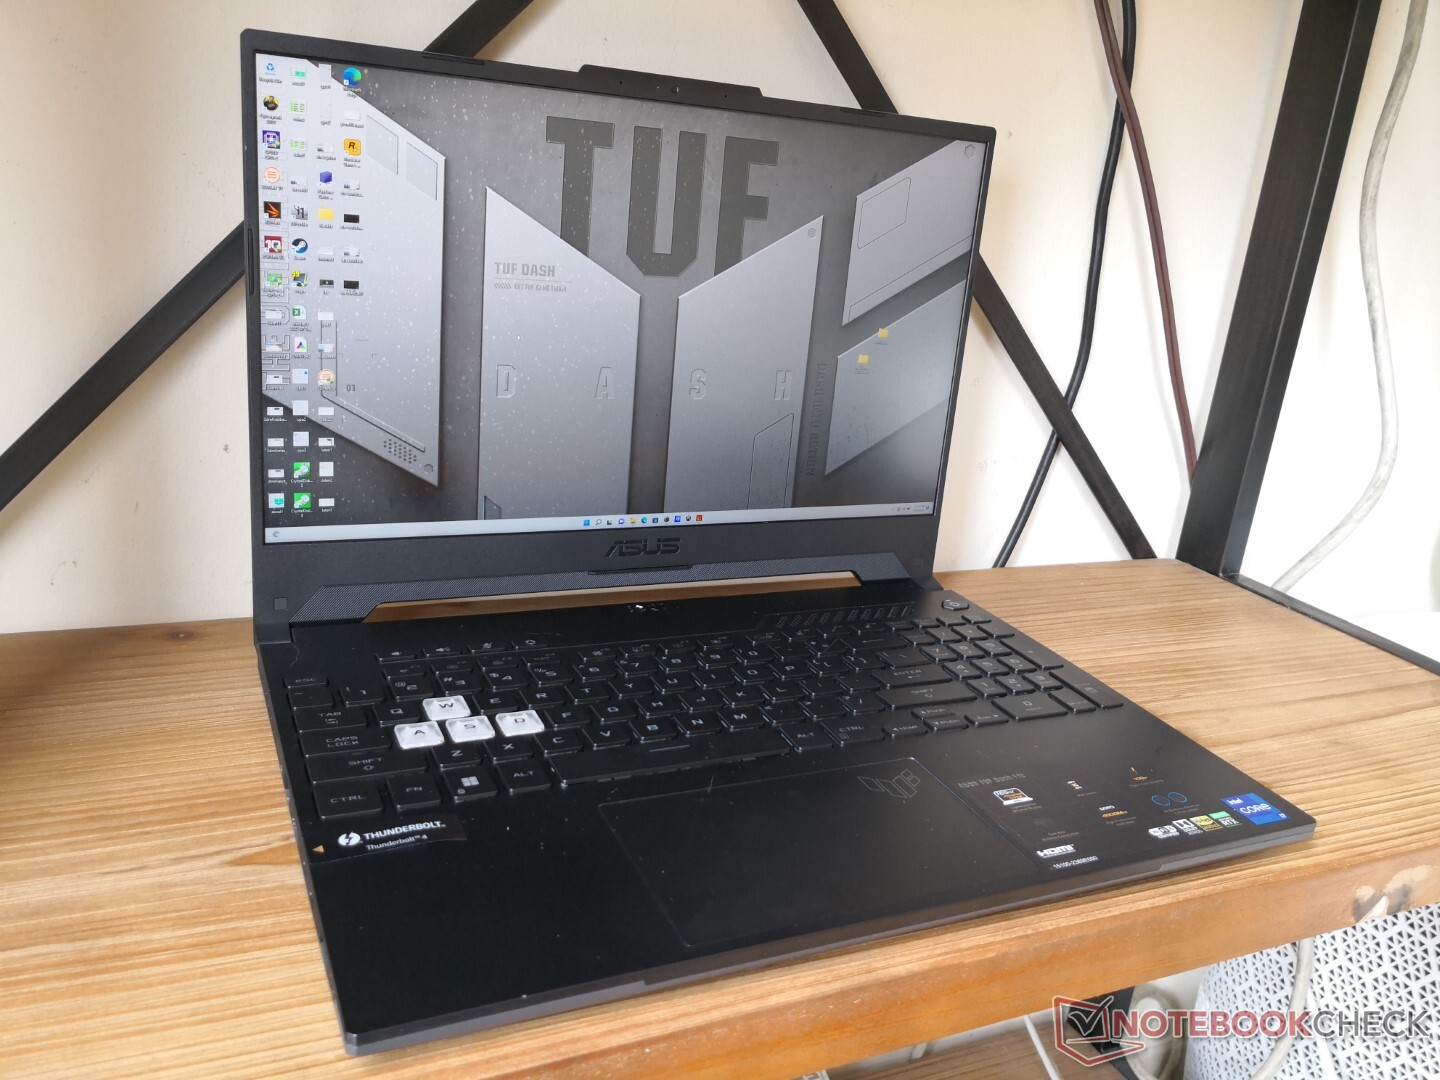
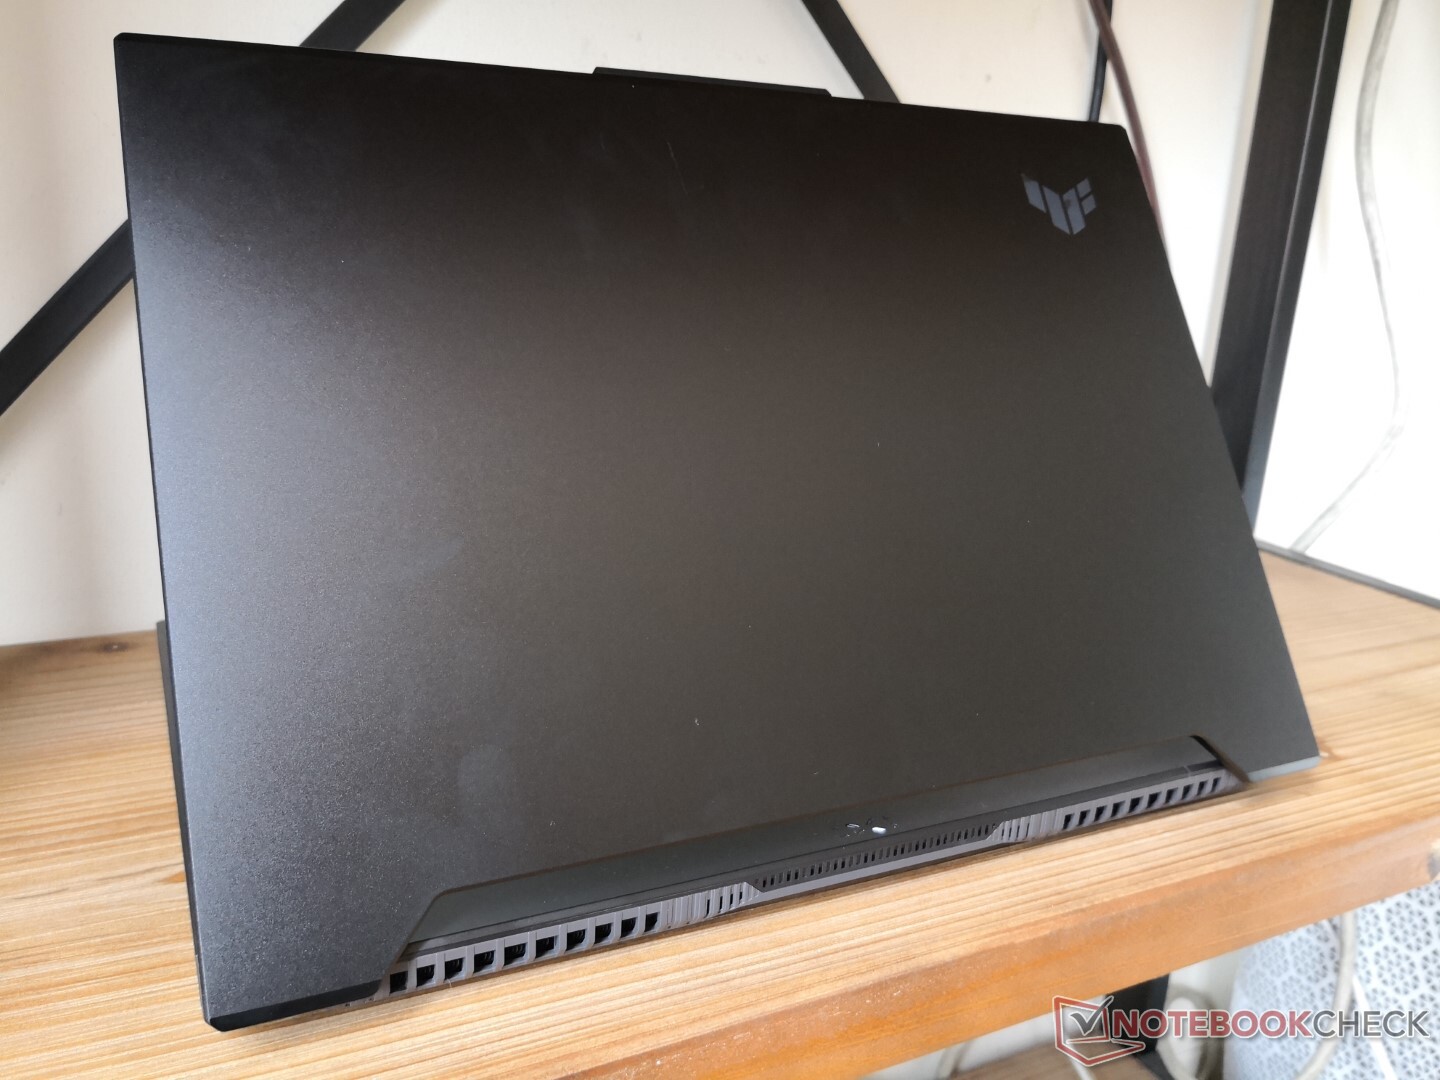
Caso
Conectividade
É importante observar que embora existam duas portas USB-C, somente a mais próxima à borda frontal suporta carga USB-C. Ambas são de outra forma capazes de DisplayPort-over-USB.
Comunicação
O modelo é fornecido sem suporte a Wi-Fi 6E, o que provavelmente economizará custos. No entanto, o desempenho é suficiente e estável o suficiente para o público alvo dos jogadores do orçamento.
| Networking | |
| iperf3 transmit AX12 | |
| Gigabyte G5 GD | |
| Lenovo Ideapad Gaming 3 15IHU-82K1002RGE | |
| MSI Bravo 15 B5DD-010US | |
| iperf3 receive AX12 | |
| Lenovo Ideapad Gaming 3 15IHU-82K1002RGE | |
| Gigabyte G5 GD | |
| MSI Bravo 15 B5DD-010US | |
| iperf3 receive AXE11000 | |
| Dell G15 5510 | |
| Asus TUF Dash F15 FX517ZR | |
| Asus TUF Dash F15 FX517ZC | |
| iperf3 transmit AXE11000 | |
| Asus TUF Dash F15 FX517ZR | |
| Asus TUF Dash F15 FX517ZC | |
Webcam
A webcam integrada é a webcam padrão de 1 MP, sem nenhuma função de persiana ou RI.


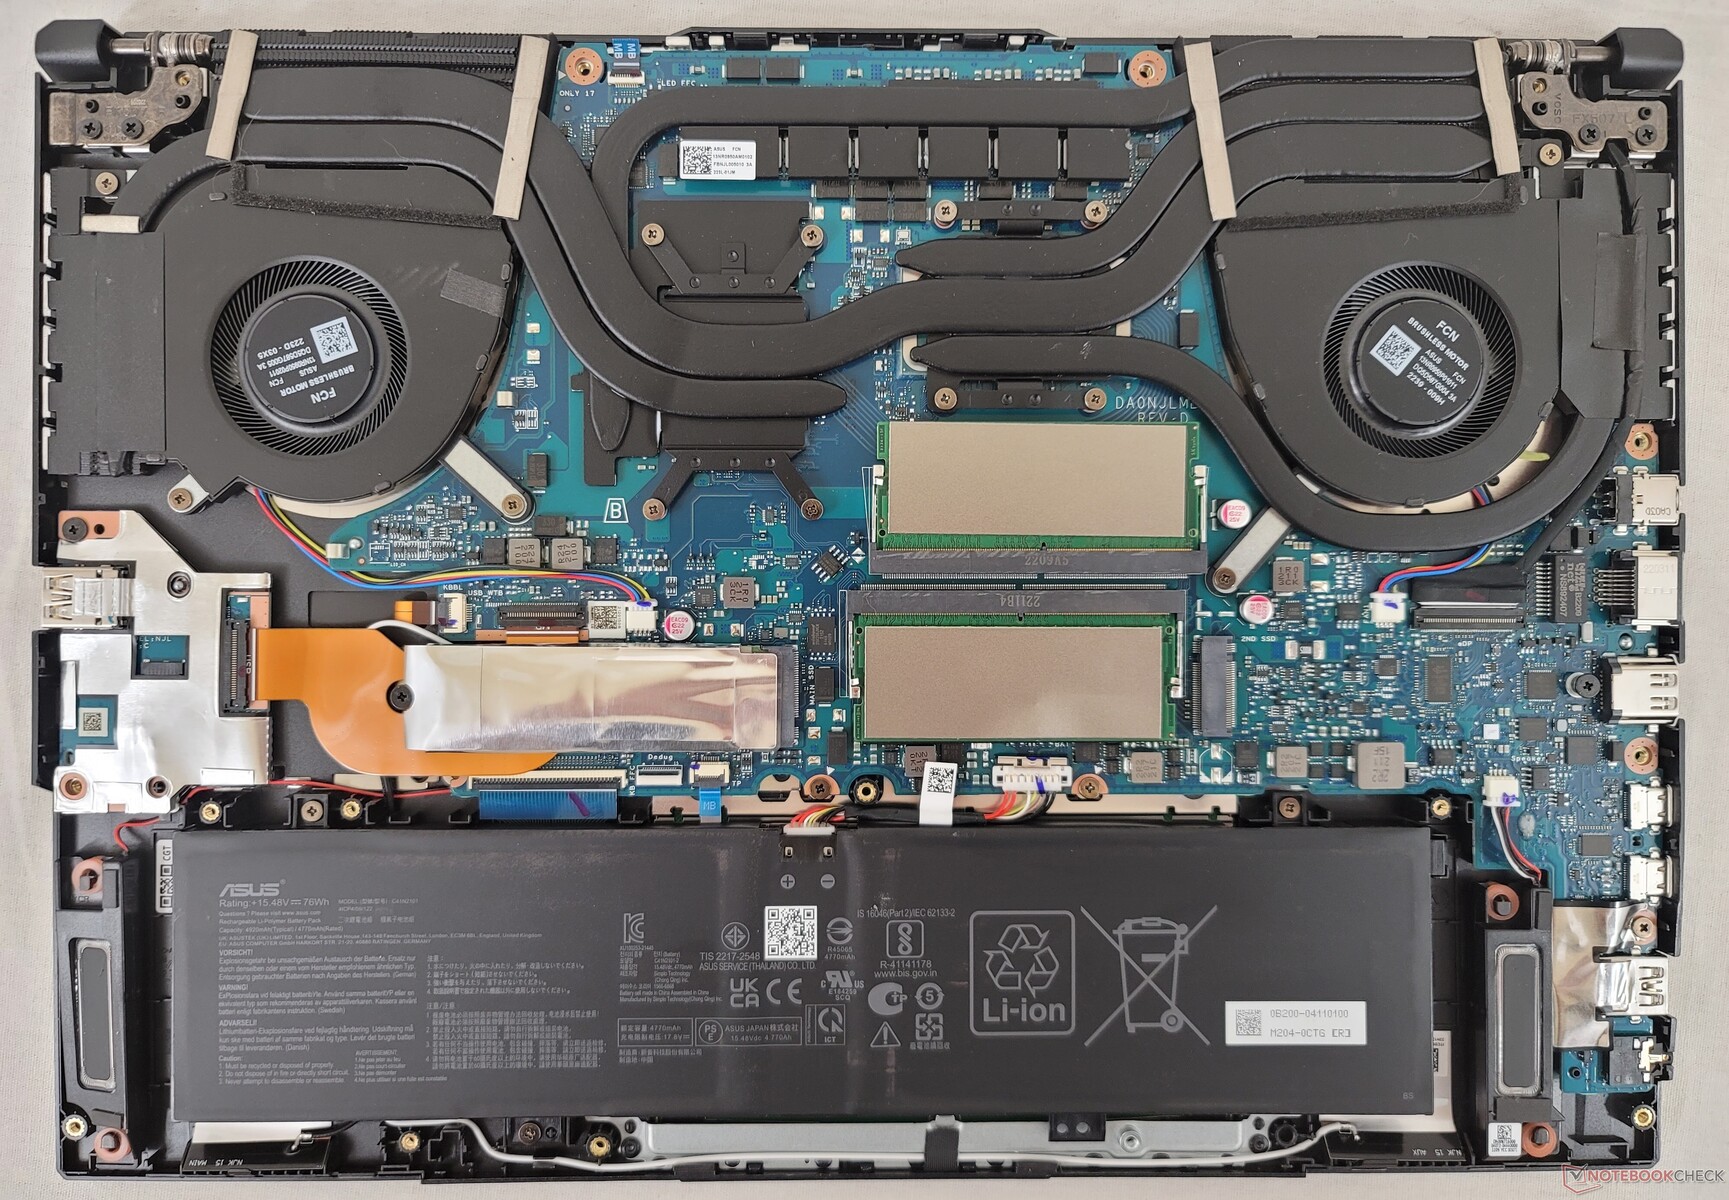
Manutenção
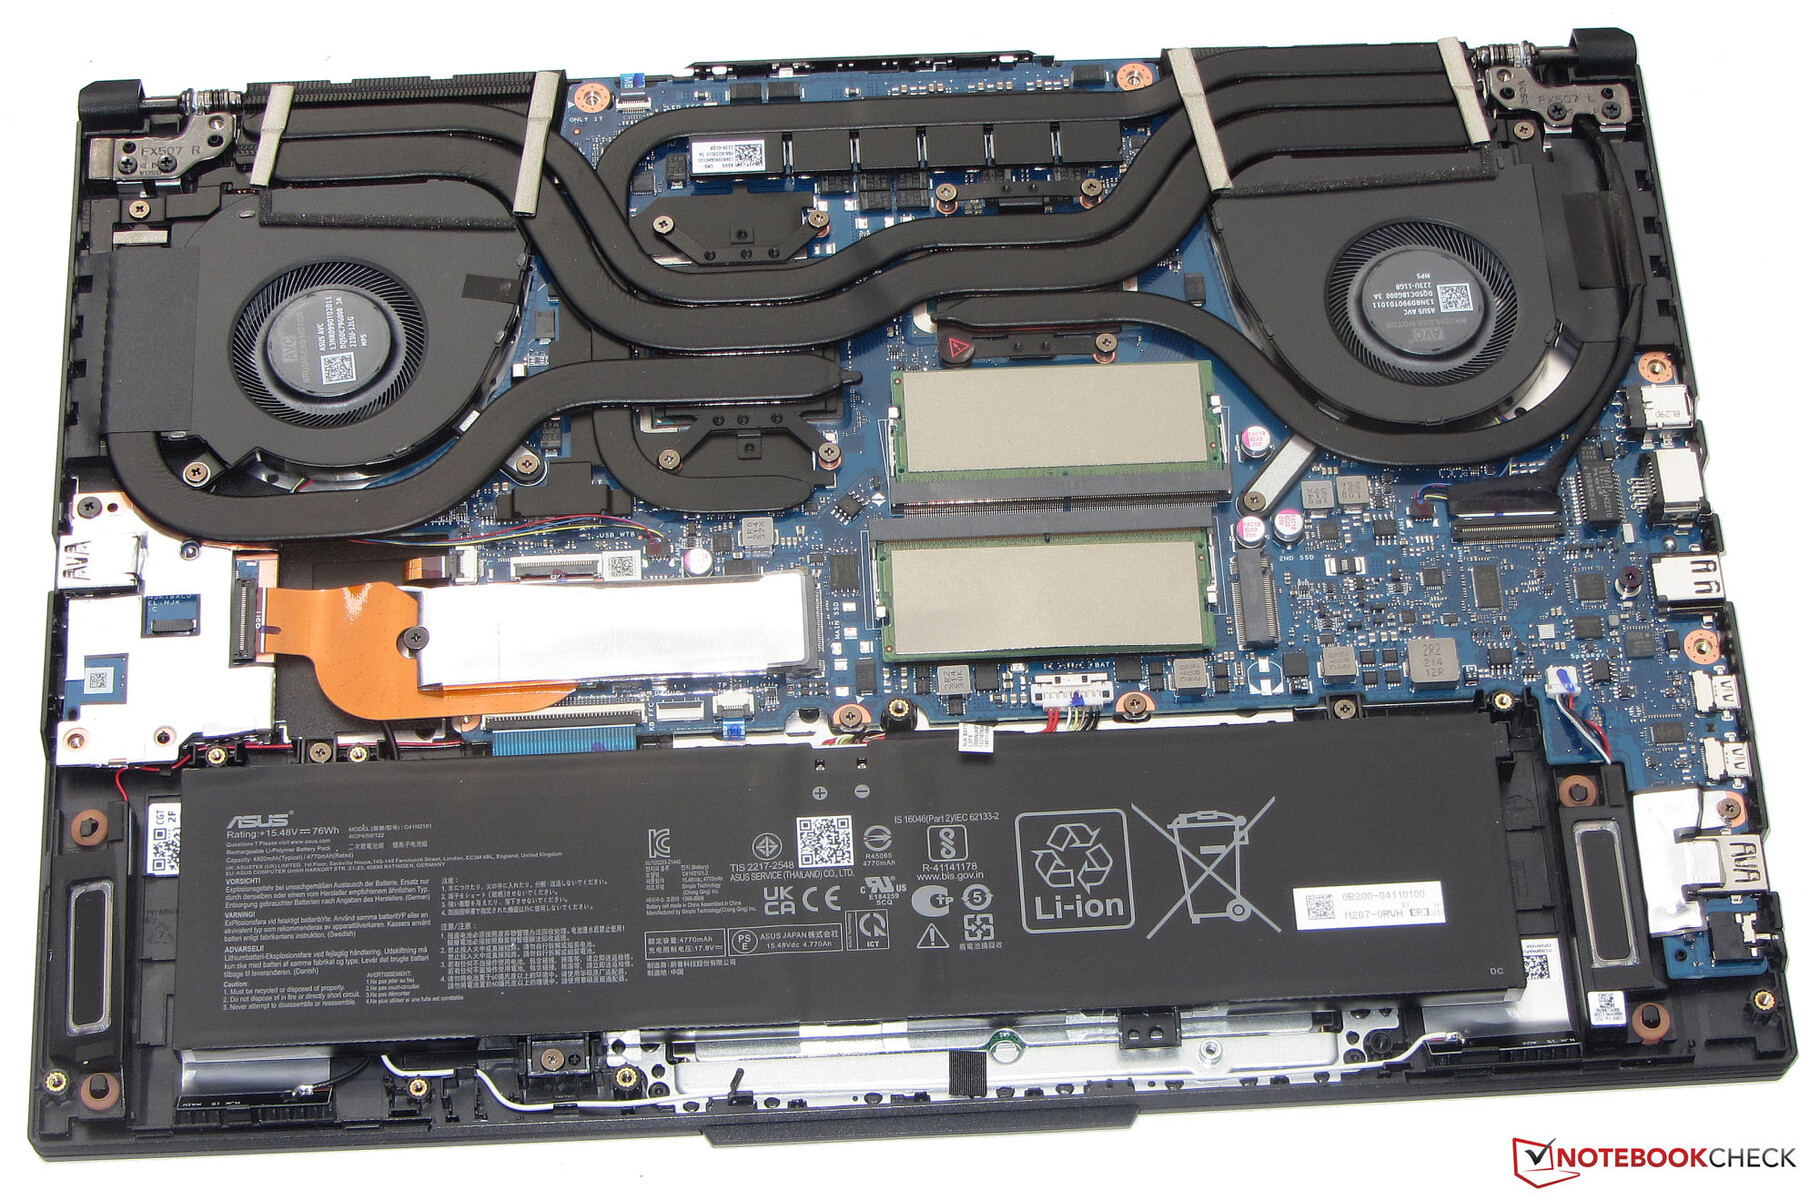
O painel inferior pode ser removido muito facilmente com apenas uma chave de fenda Philips para revelar 2x baías de armazenamento M.2, 2x slots SODIMM, e o módulo WLAN enfiado embaixo do SSD M.2 primário. Quando comparado com a FX517ZR, nossa FX517ZC utiliza menos tubos de calor de cobre sobre a GPU como mostrado abaixo para um peso um pouco mais leve.
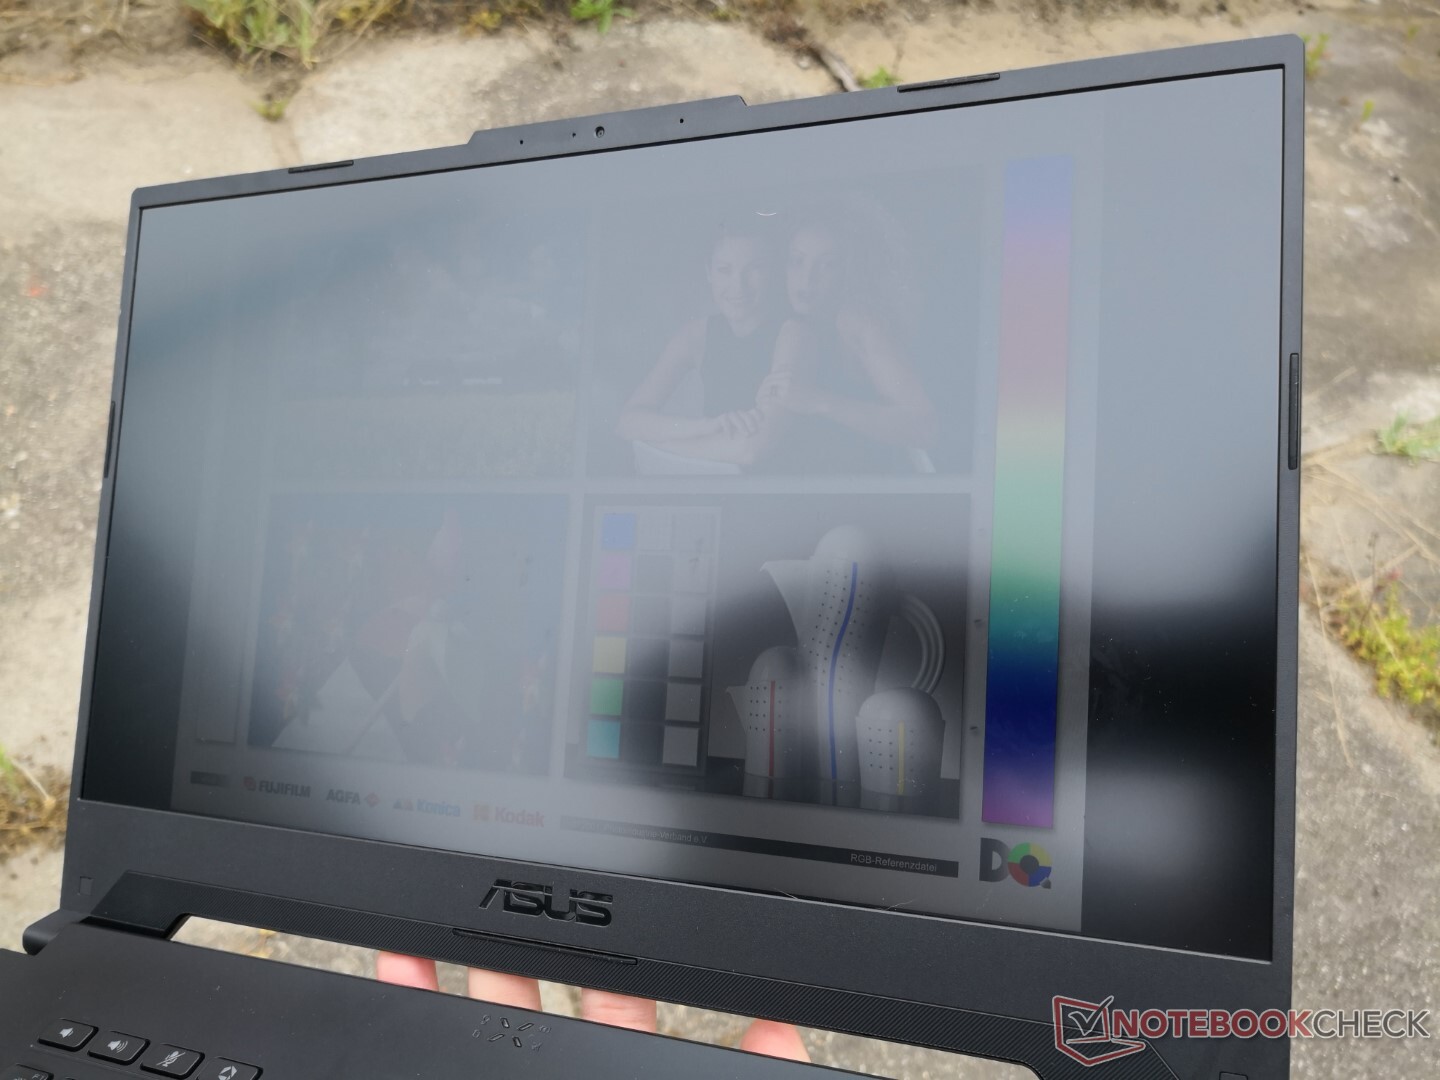
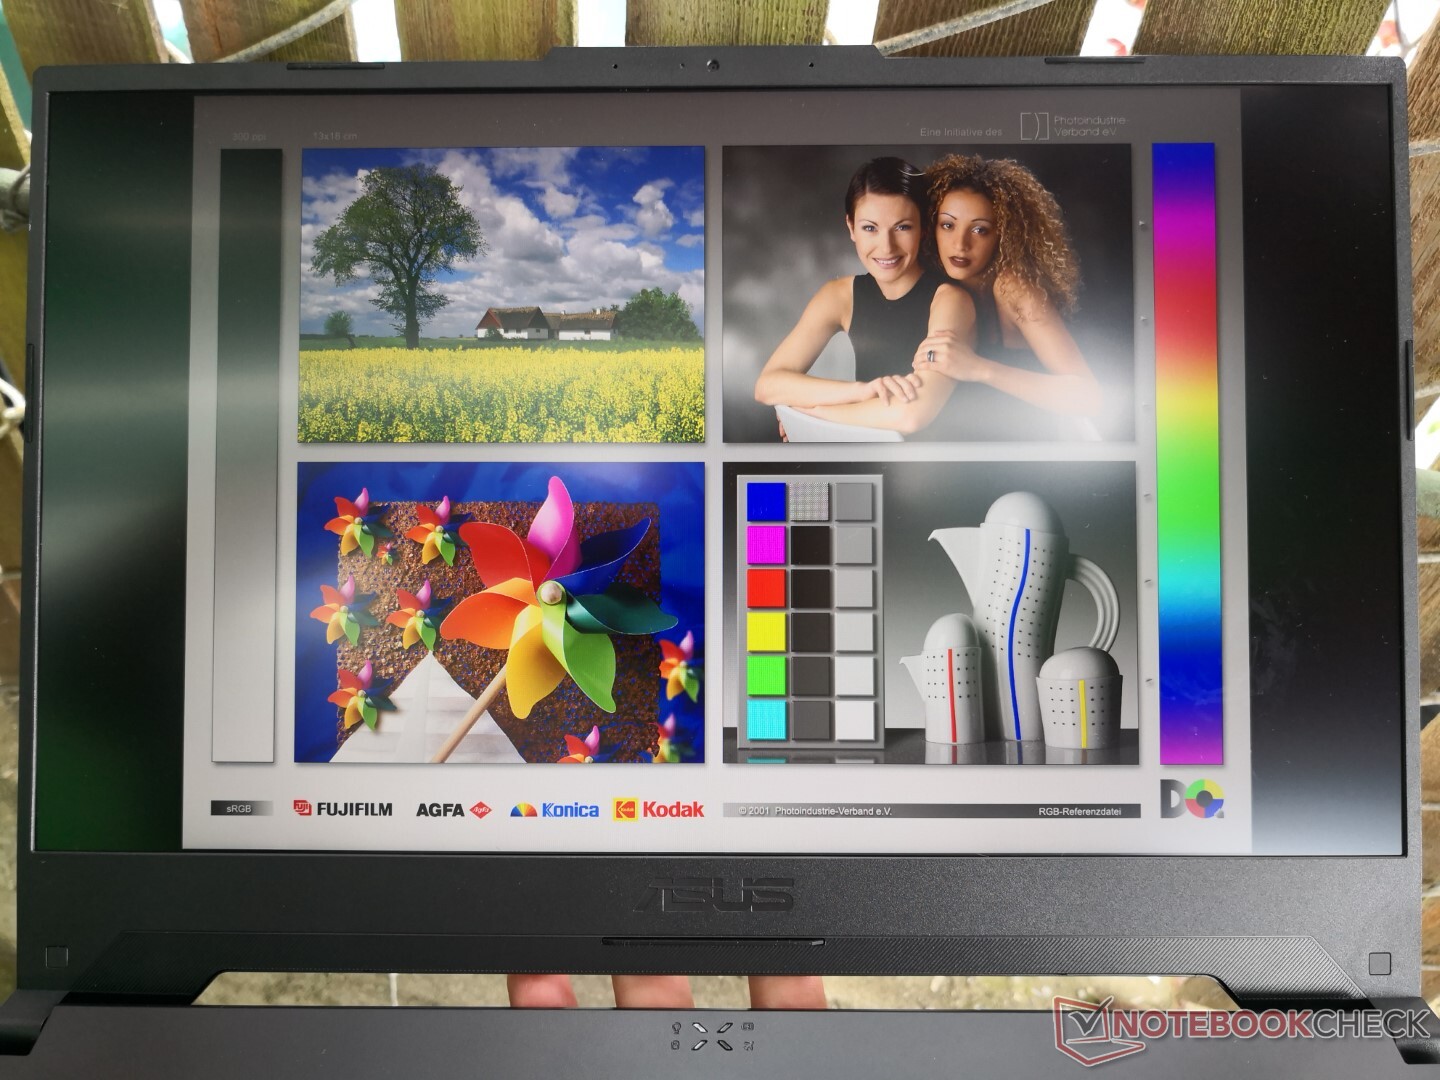
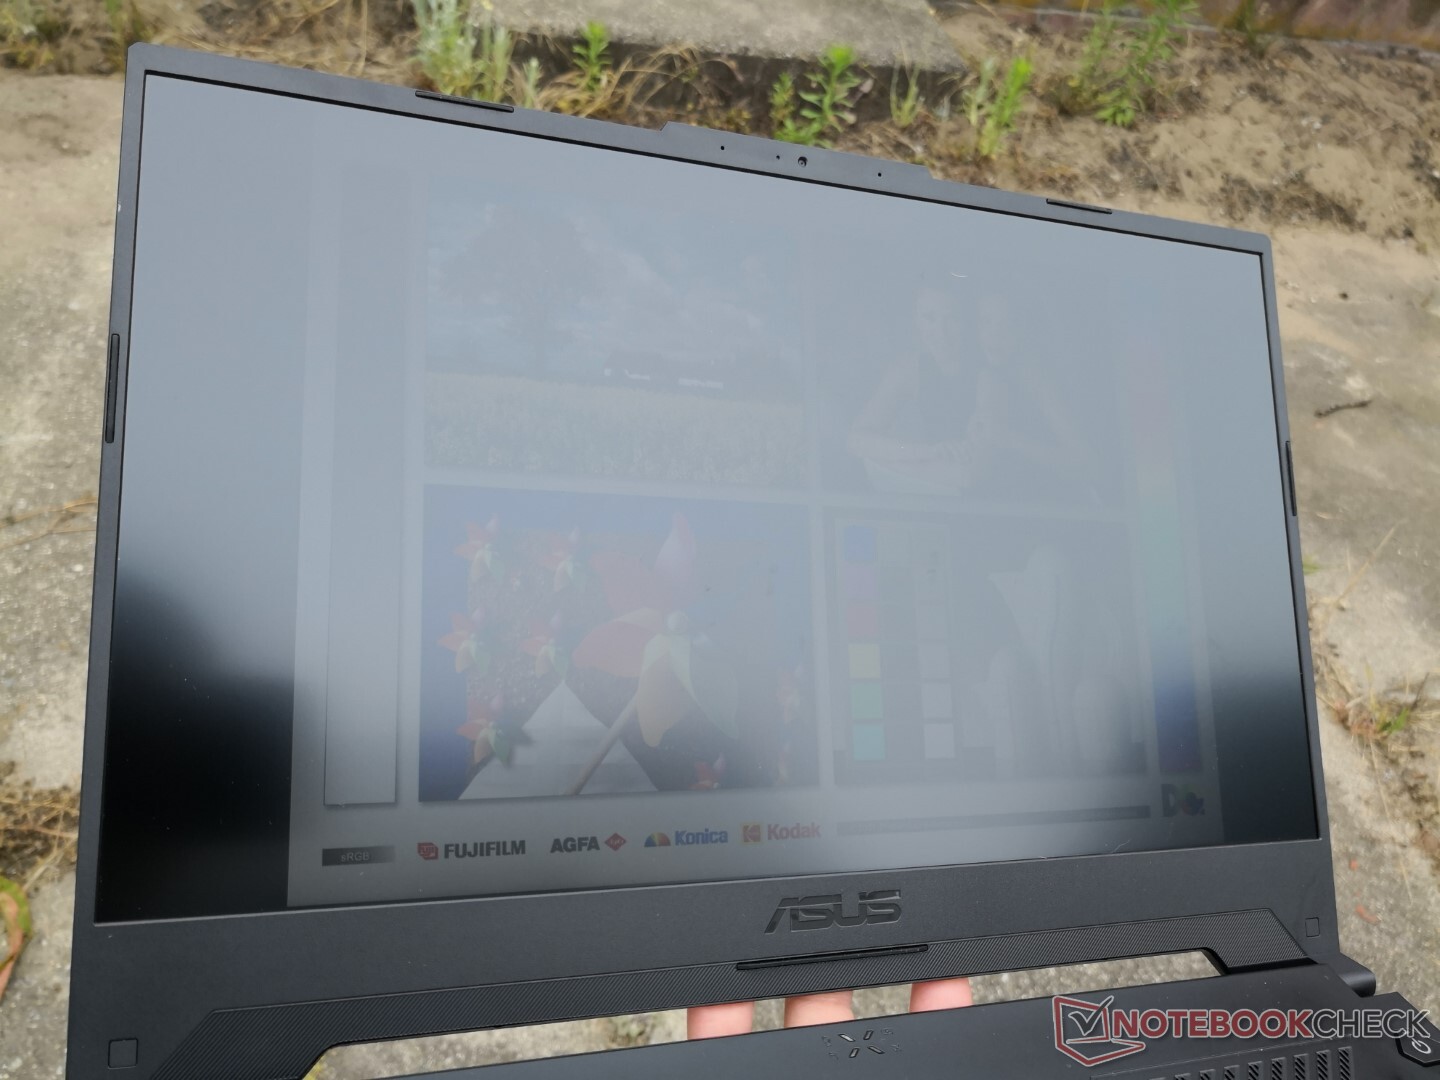
Mostrar


| |||||||||||||||||||||||||
iluminação: 88 %
iluminação com acumulador: 354.2 cd/m²
Contraste: 1107:1 (Preto: 0.32 cd/m²)
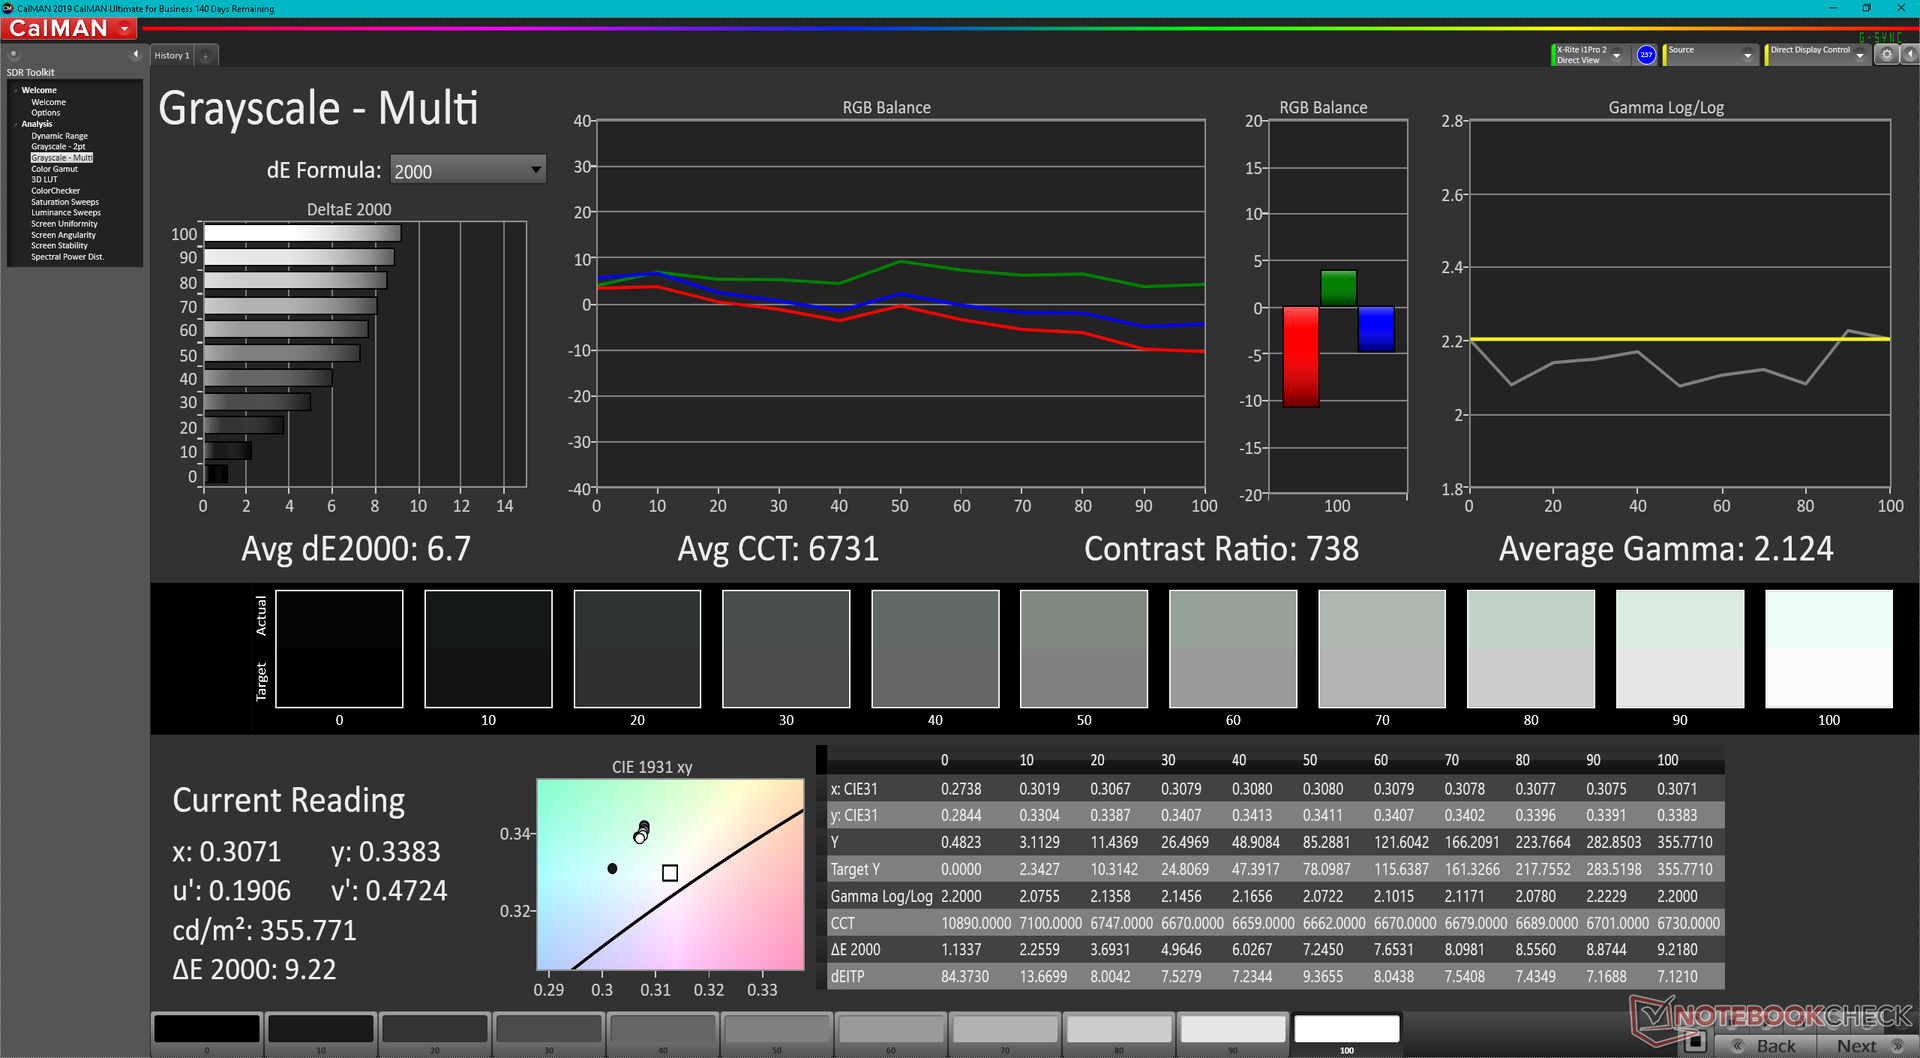
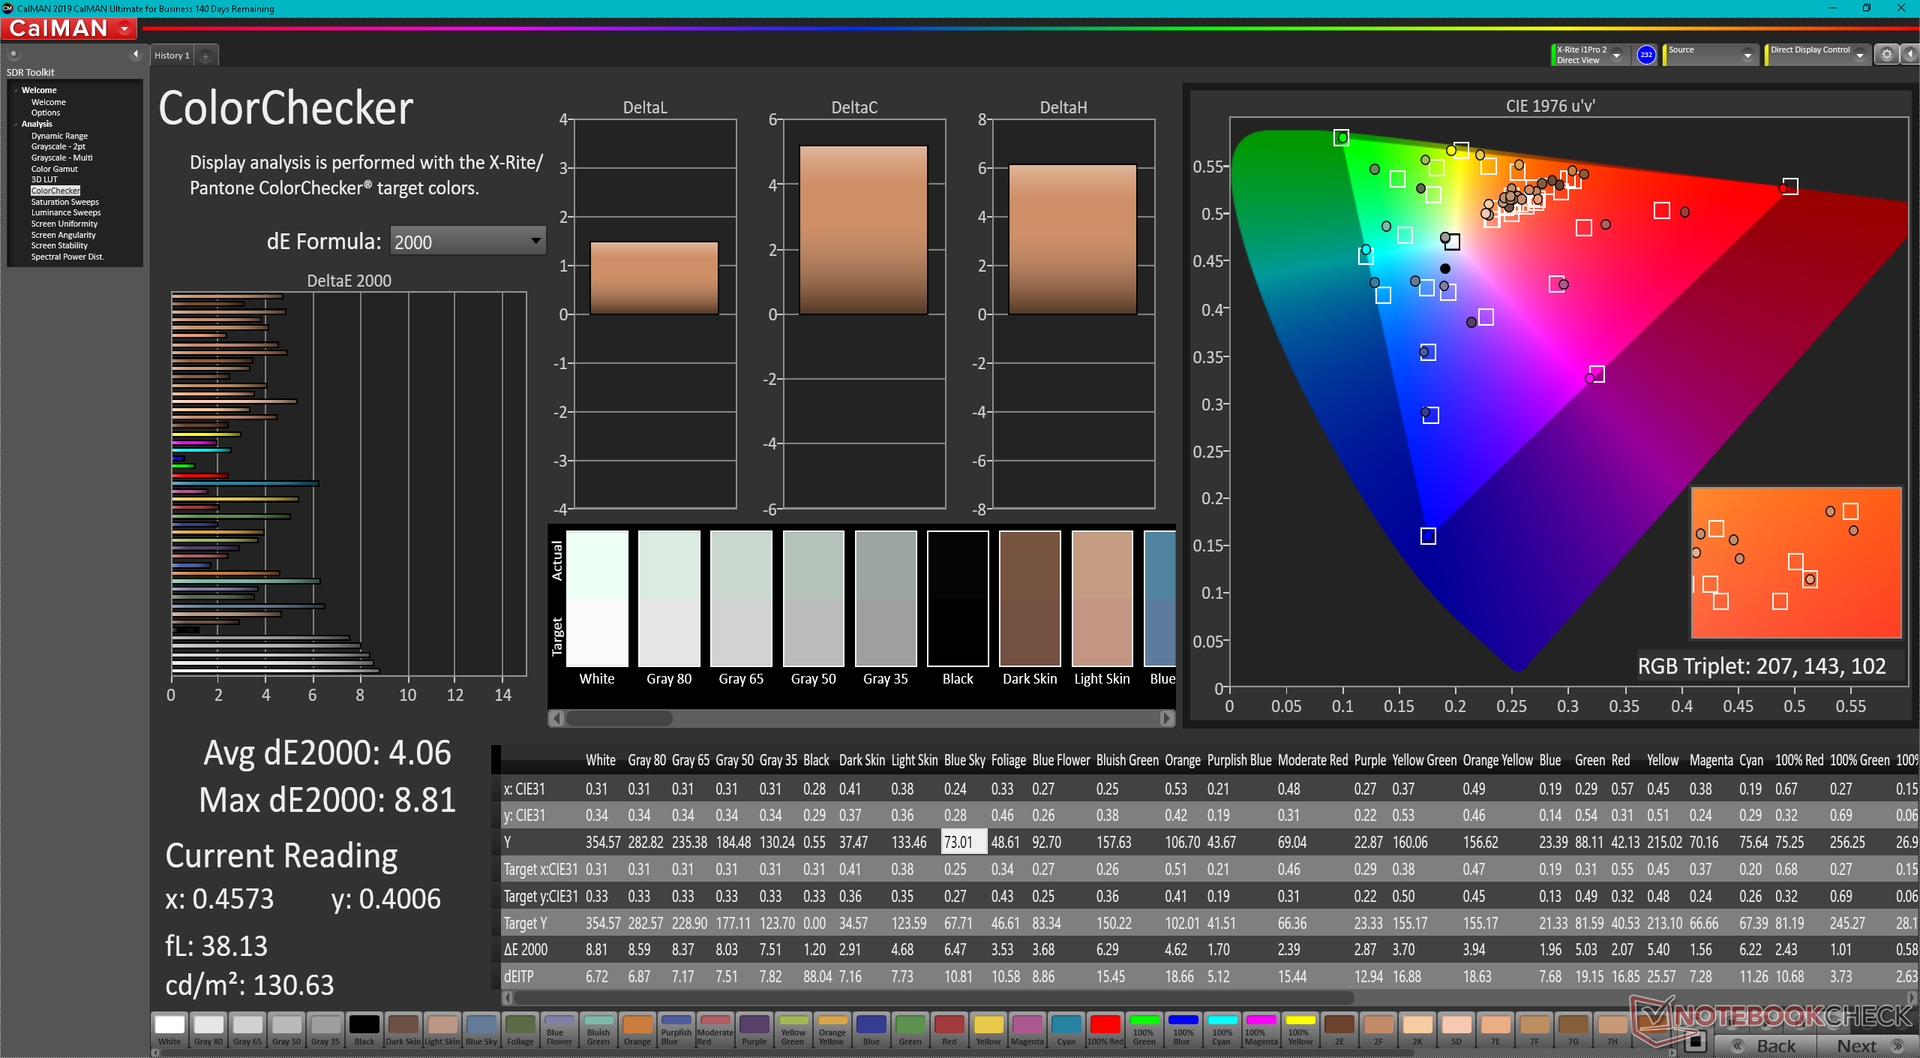
ΔE ColorChecker Calman: 4.06 | ∀{0.5-29.43 Ø4.71}
ΔE Greyscale Calman: 6.7 | ∀{0.09-98 Ø4.96}
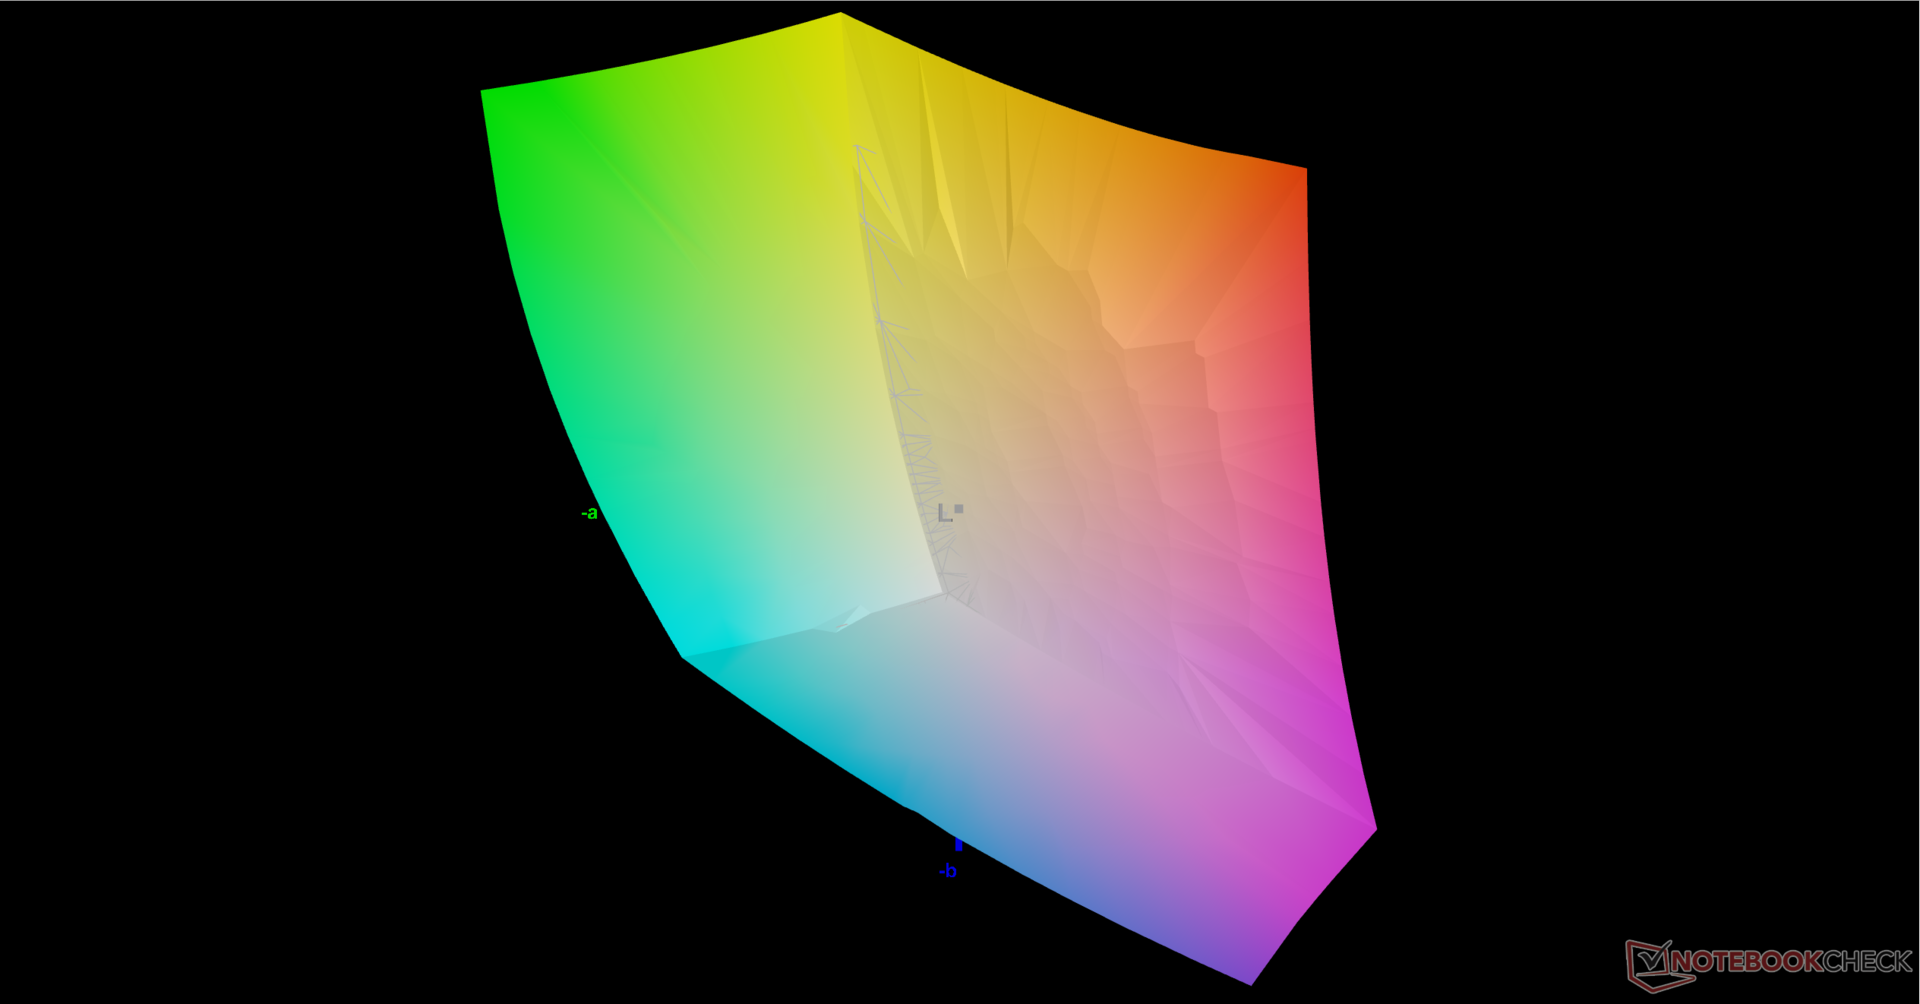
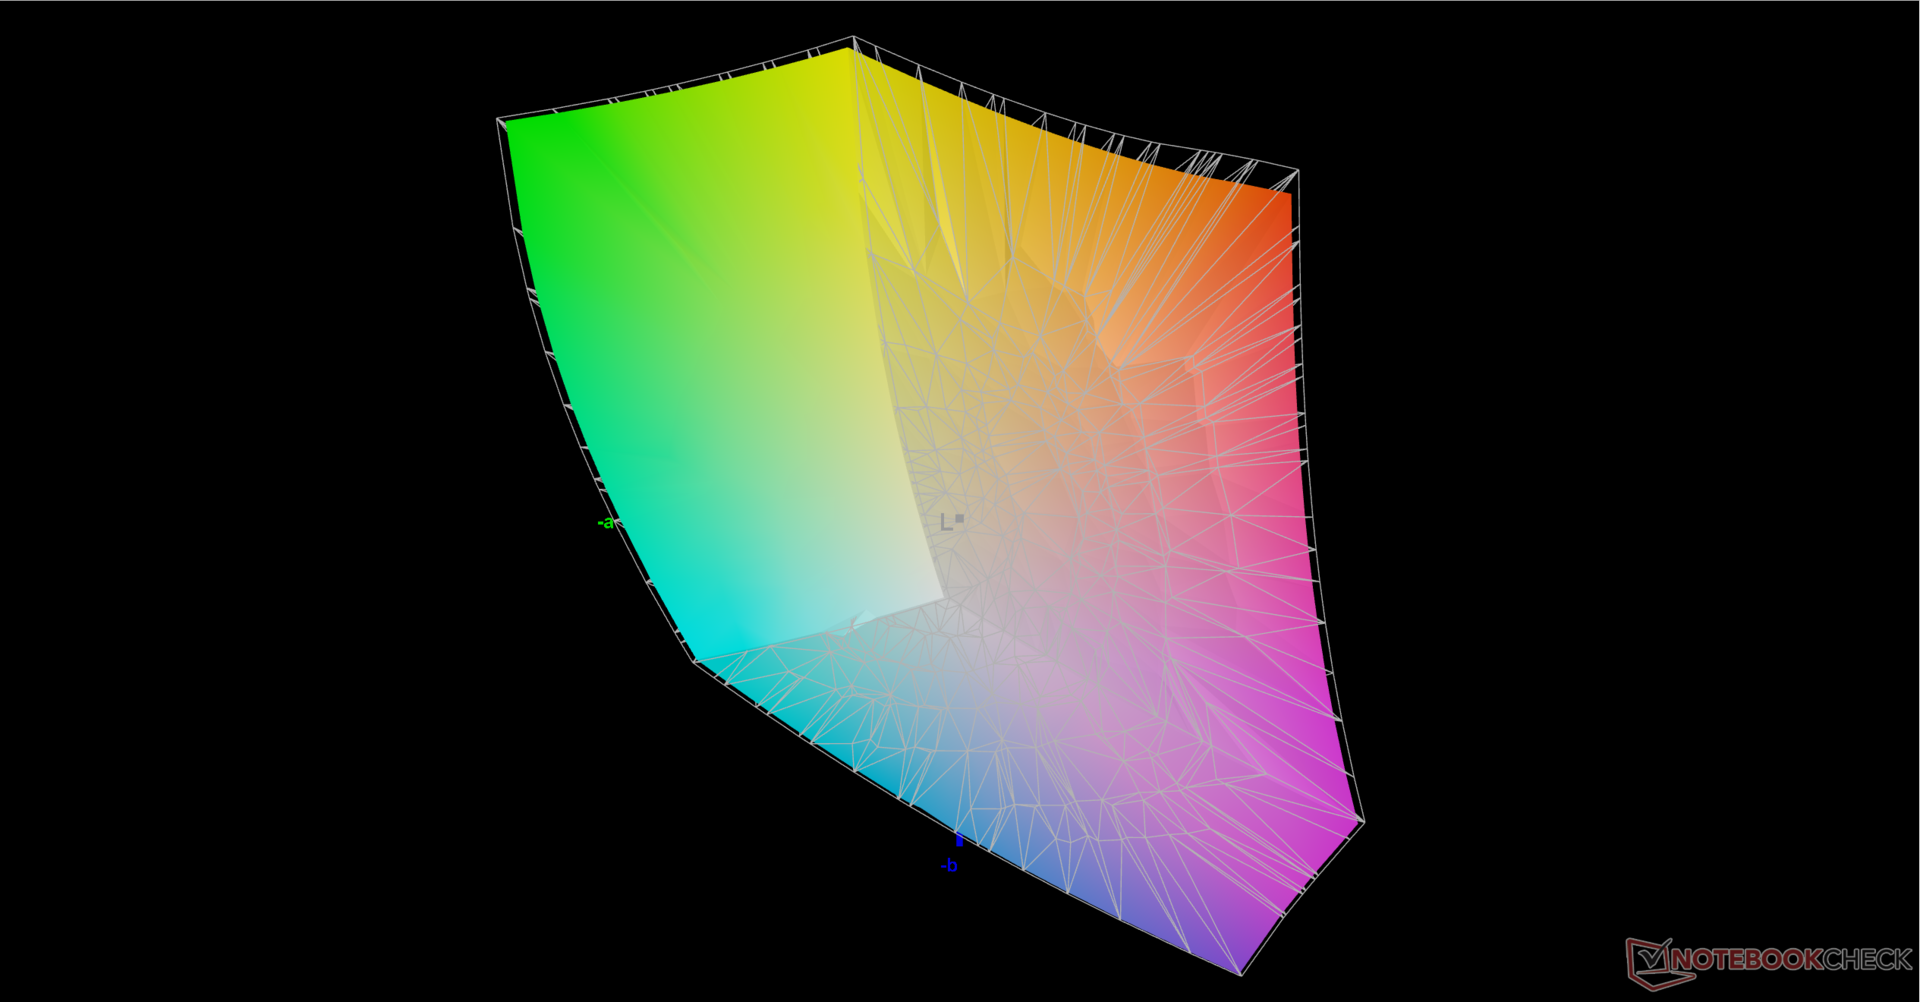
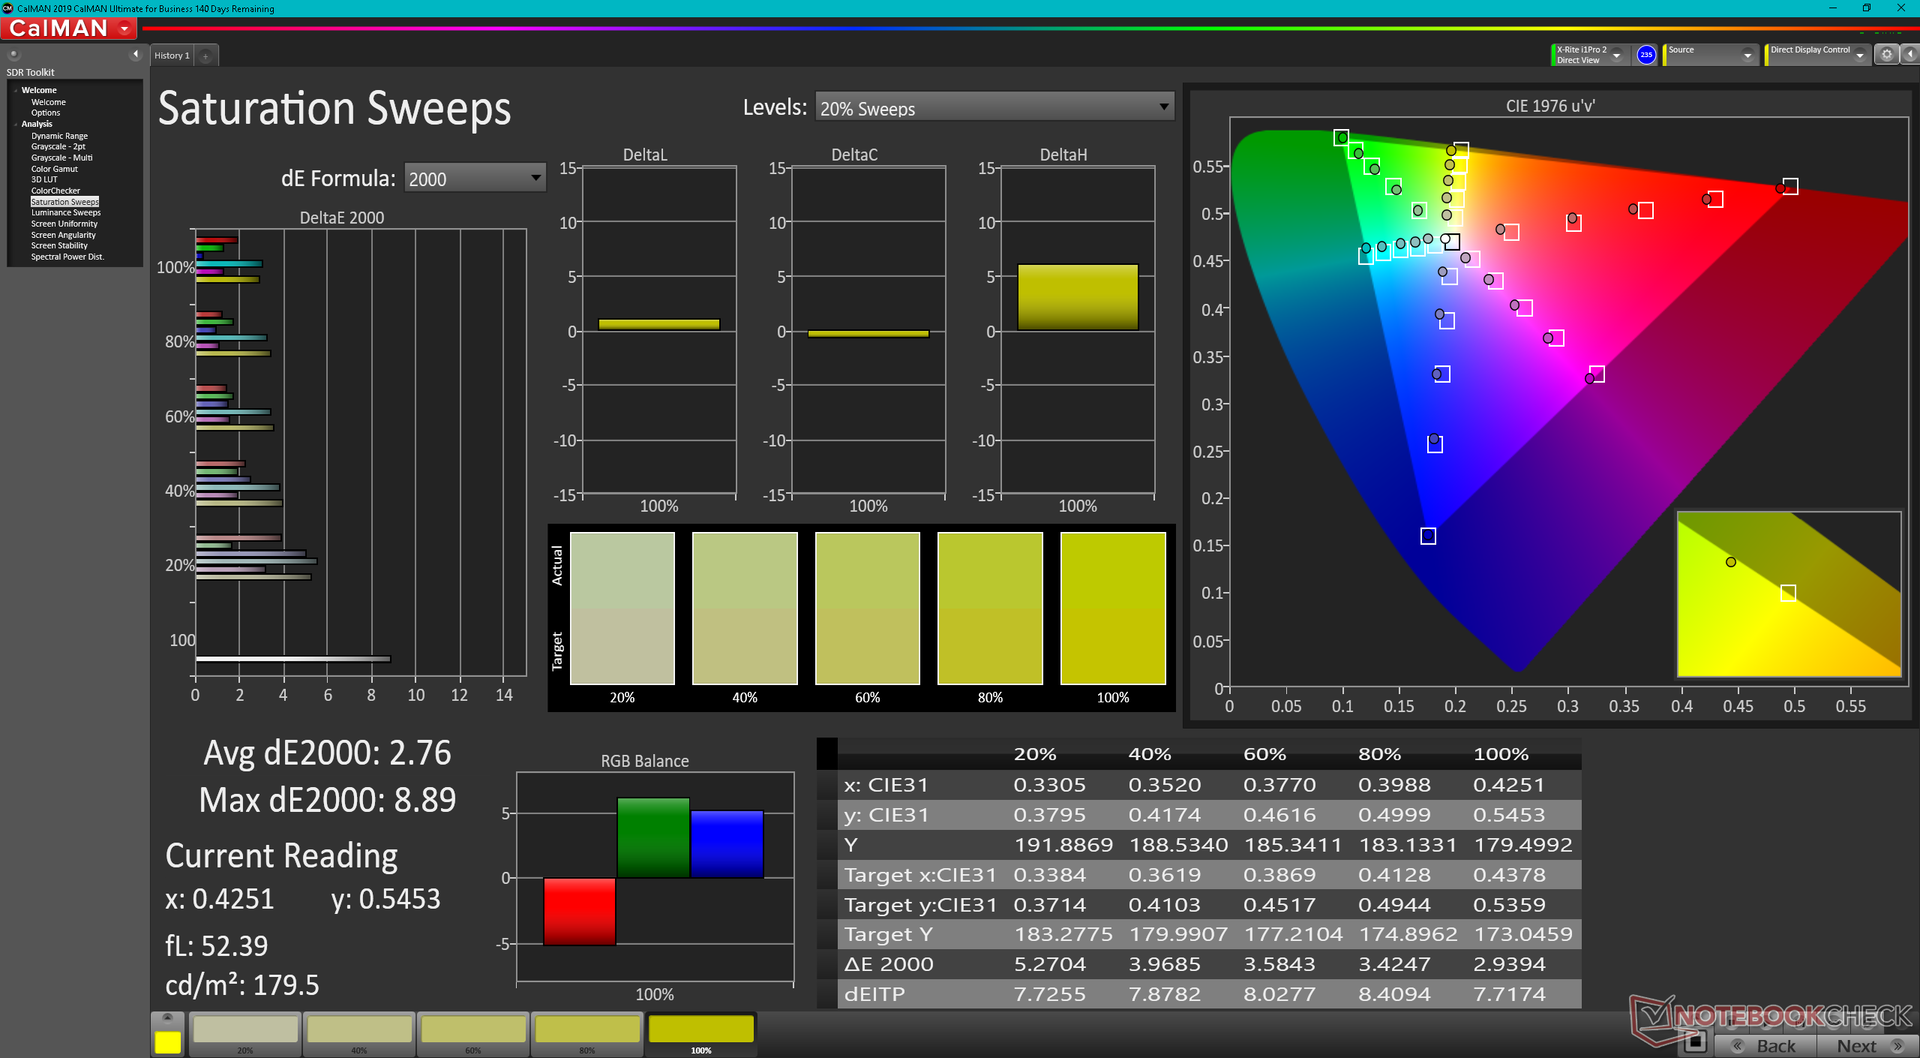
85.1% AdobeRGB 1998 (Argyll 3D)
99.9% sRGB (Argyll 3D)
95.8% Display P3 (Argyll 3D)
Gamma: 2.12
CCT: 6731 K
| Asus TUF Dash F15 FX517ZC BOE CQ NE156QHM-NY1, IPS, 2560x1440, 15.6" | Asus TUF Dash F15 FX517ZR BOE CQ NE156QHM-NY1, IPS, 2560x1440, 15.6" | Dell G15 5510 YMHWH_156HRA (CMN1522), IPS, 1920x1080, 15.6" | MSI Bravo 15 B5DD-010US Chi Mei N156HRA-EA1, IPS, 1920x1080, 15.6" | Lenovo Ideapad Gaming 3 15IHU-82K1002RGE LEN156FHD, IPS, 1920x1080, 15.6" | Gigabyte G5 GD Chi Mei N156HRA-EA1, IPS, 1920x1080, 15.6" | |
|---|---|---|---|---|---|---|
| Display | 1% | -48% | -47% | -50% | -48% | |
| Display P3 Coverage (%) | 95.8 | 98.4 3% | 41.6 -57% | 42.1 -56% | 39.7 -59% | 41.8 -56% |
| sRGB Coverage (%) | 99.9 | 99.9 0% | 62.2 -38% | 62.8 -37% | 59.6 -40% | 62.3 -38% |
| AdobeRGB 1998 Coverage (%) | 85.1 | 85.9 1% | 43 -49% | 43.6 -49% | 41.1 -52% | 43.2 -49% |
| Response Times | 22% | -198% | -162% | -345% | -217% | |
| Response Time Grey 50% / Grey 80% * (ms) | 8.4 ? | 5.6 ? 33% | 33.3 ? -296% | 25.6 ? -205% | 46.4 ? -452% | 34.4 ? -310% |
| Response Time Black / White * (ms) | 10.4 ? | 9.4 ? 10% | 20.7 ? -99% | 22.8 ? -119% | 35.2 ? -238% | 23.2 ? -123% |
| PWM Frequency (Hz) | ||||||
| Screen | 17% | -5% | -25% | -15% | -5% | |
| Brightness middle (cd/m²) | 354.2 | 286 -19% | 288 -19% | 265.1 -25% | 307 -13% | 261 -26% |
| Brightness (cd/m²) | 330 | 266 -19% | 264 -20% | 245 -26% | 292 -12% | 246 -25% |
| Brightness Distribution (%) | 88 | 87 -1% | 88 0% | 87 -1% | 88 0% | 87 -1% |
| Black Level * (cd/m²) | 0.32 | 0.25 22% | 0.24 25% | 0.35 -9% | 0.21 34% | 0.19 41% |
| Contrast (:1) | 1107 | 1144 3% | 1200 8% | 757 -32% | 1462 32% | 1374 24% |
| Colorchecker dE 2000 * | 4.06 | 2.14 47% | 3.67 10% | 4.68 -15% | 5.9 -45% | 3.9 4% |
| Colorchecker dE 2000 max. * | 8.81 | 5.22 41% | 18.12 -106% | 19.96 -127% | 21.6 -145% | 19.26 -119% |
| Greyscale dE 2000 * | 6.7 | 2.8 58% | 2.6 61% | 4.5 33% | 4.9 27% | 2.7 60% |
| Gamma | 2.12 104% | 2.23 99% | 2.187 101% | 2.22 99% | 2.26 97% | 2.248 98% |
| CCT | 6731 97% | 7092 92% | 6971 93% | 6632 98% | 6504 100% | 6828 95% |
| Colorchecker dE 2000 calibrated * | 0.67 | 3.22 | 3.7 | 4.8 | 3.24 | |
| Média Total (Programa/Configurações) | 13% /
14% | -84% /
-45% | -78% /
-51% | -137% /
-74% | -90% /
-48% |
* ... menor é melhor
Exibir tempos de resposta
| ↔ Tempo de resposta preto para branco | ||
|---|---|---|
| 10.4 ms ... ascensão ↗ e queda ↘ combinadas | ↗ 6.4 ms ascensão | 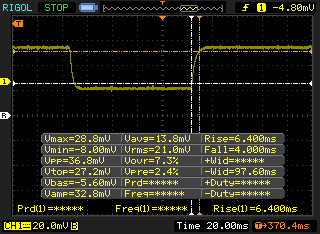 |
| ↘ 4 ms queda | ||
| A tela mostra boas taxas de resposta em nossos testes, mas pode ser muito lenta para jogadores competitivos. Em comparação, todos os dispositivos testados variam de 0.1 (mínimo) a 240 (máximo) ms. » 28 % de todos os dispositivos são melhores. Isso significa que o tempo de resposta medido é melhor que a média de todos os dispositivos testados (19.8 ms). | ||
| ↔ Tempo de resposta 50% cinza a 80% cinza | ||
| 8.4 ms ... ascensão ↗ e queda ↘ combinadas | ↗ 4.4 ms ascensão | 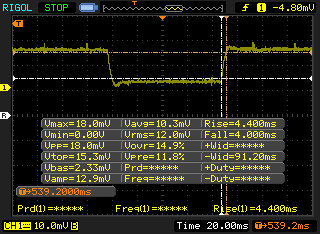 |
| ↘ 4 ms queda | ||
| A tela mostra taxas de resposta rápidas em nossos testes e deve ser adequada para jogos. Em comparação, todos os dispositivos testados variam de 0.165 (mínimo) a 636 (máximo) ms. » 22 % de todos os dispositivos são melhores. Isso significa que o tempo de resposta medido é melhor que a média de todos os dispositivos testados (30.9 ms). | ||
Cintilação da tela / PWM (modulação por largura de pulso)
| Tela tremeluzindo / PWM não detectado | 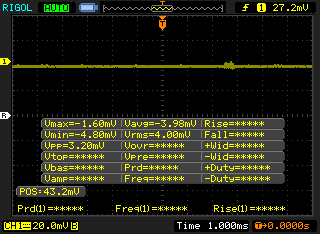 | ||
[pwm_comparison] Em comparação: 52 % de todos os dispositivos testados não usam PWM para escurecer a tela. Se PWM foi detectado, uma média de 7744 (mínimo: 5 - máximo: 343500) Hz foi medida. | |||

Desempenho
Condições de teste
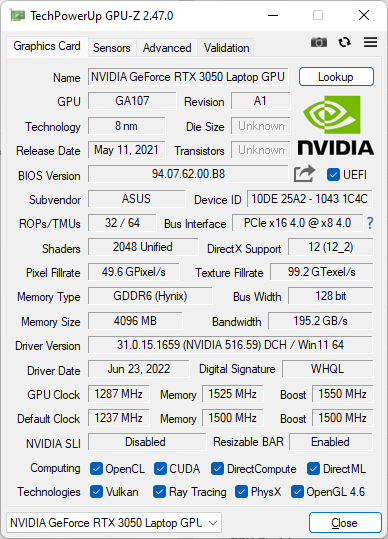
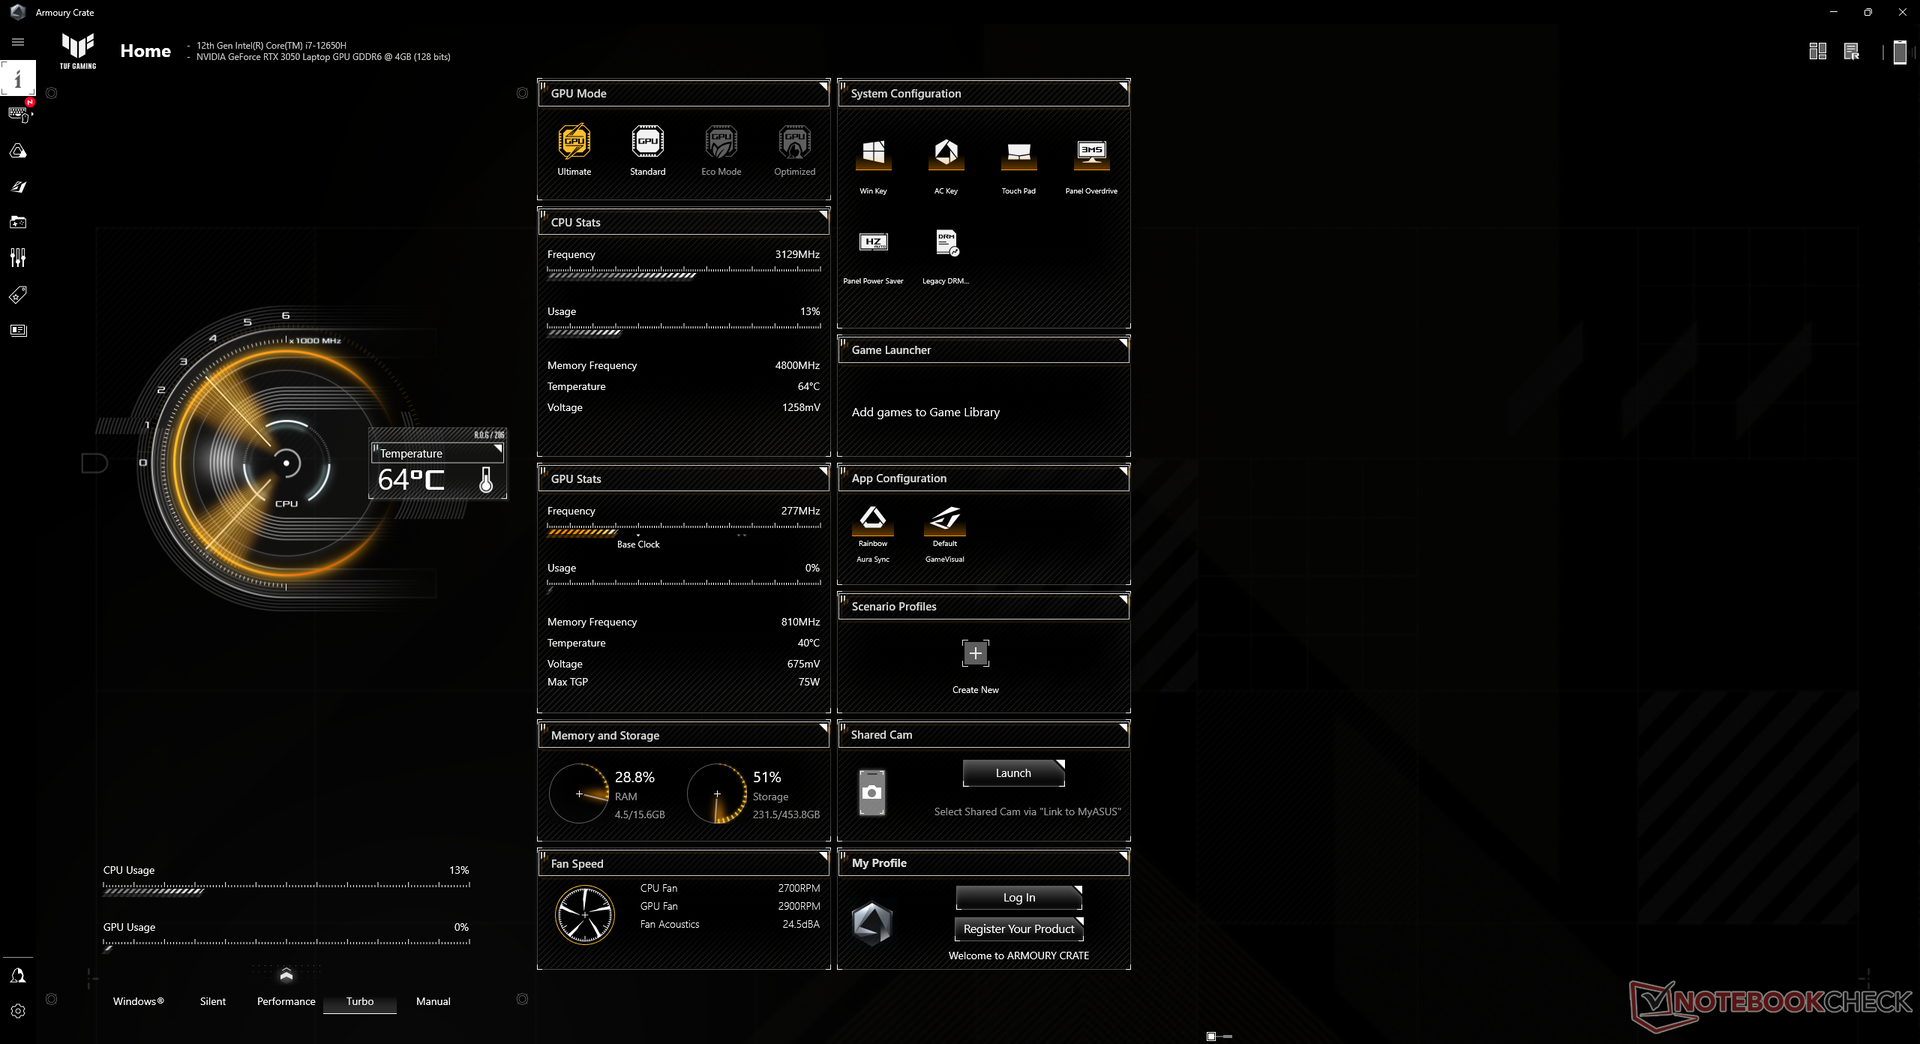
Definimos nossa unidade para modos Turbo e GPU discretos antes de executar qualquer parâmetro de desempenho abaixo. O sistema utiliza o MSHybrid/MUX para comutação gráfica que os usuários podem alternar através do software Armoury Crate. É altamente recomendado que os proprietários se familiarizem com o Armoury Crate, pois ele serve como o centro de comando do sistema. O modelo tem até mesmo uma útil tecla dedicada no teclado para o lançamento do aplicativo.

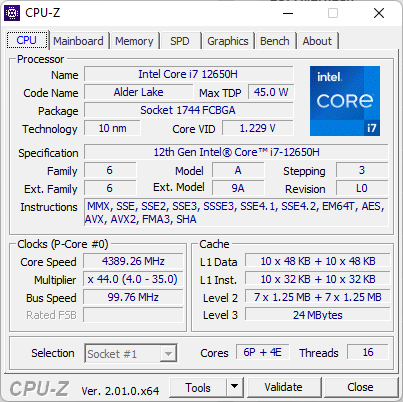
Processador
O desempenho geral da CPU é mais similar ao da Núcleo i7-11800H em aplicações com várias roscas, sendo cerca de 15% a 20% mais rápido em aplicações com uma única rosca.
Cinebench R15 Multi Loop
Cinebench R23: Multi Core | Single Core
Cinebench R15: CPU Multi 64Bit | CPU Single 64Bit
Blender: v2.79 BMW27 CPU
7-Zip 18.03: 7z b 4 | 7z b 4 -mmt1
Geekbench 5.5: Multi-Core | Single-Core
HWBOT x265 Benchmark v2.2: 4k Preset
LibreOffice : 20 Documents To PDF
R Benchmark 2.5: Overall mean
| Cinebench R20 / CPU (Multi Core) | |
| MSI GE67 HX 12UGS | |
| MSI Vector GP66 12UGS | |
| Acer Nitro 5 AN515-58-72QR | |
| MSI Raider GE66 12UHS | |
| Gigabyte A5 X1 | |
| MSI GP66 Leopard 11UH-028 | |
| Asus TUF Dash F15 FX517ZC | |
| Dell G15 5515 | |
| Média Intel Core i7-12650H (2106 - 6009, n=14) | |
| MSI GS66 Stealth 10UG | |
| MSI Bravo 15 B5DD-010US | |
| Gigabyte G5 GD | |
| Cinebench R20 / CPU (Single Core) | |
| MSI Vector GP66 12UGS | |
| MSI Raider GE66 12UHS | |
| Acer Nitro 5 AN515-58-72QR | |
| Asus TUF Dash F15 FX517ZC | |
| MSI GE67 HX 12UGS | |
| Média Intel Core i7-12650H (552 - 696, n=14) | |
| MSI GP66 Leopard 11UH-028 | |
| Gigabyte A5 X1 | |
| Gigabyte G5 GD | |
| Dell G15 5515 | |
| MSI Bravo 15 B5DD-010US | |
| MSI GS66 Stealth 10UG | |
| Cinebench R15 / CPU Multi 64Bit | |
| MSI GE67 HX 12UGS | |
| Acer Nitro 5 AN515-58-72QR | |
| MSI Raider GE66 12UHS | |
| MSI Vector GP66 12UGS | |
| Gigabyte A5 X1 | |
| MSI GP66 Leopard 11UH-028 | |
| Dell G15 5515 | |
| Asus TUF Dash F15 FX517ZC | |
| Média Intel Core i7-12650H (753 - 2253, n=14) | |
| MSI GS66 Stealth 10UG | |
| Gigabyte G5 GD | |
| MSI Bravo 15 B5DD-010US | |
| Cinebench R15 / CPU Single 64Bit | |
| MSI Vector GP66 12UGS | |
| MSI Raider GE66 12UHS | |
| Acer Nitro 5 AN515-58-72QR | |
| MSI GE67 HX 12UGS | |
| Asus TUF Dash F15 FX517ZC | |
| Média Intel Core i7-12650H (206 - 261, n=14) | |
| Gigabyte A5 X1 | |
| Dell G15 5515 | |
| MSI GP66 Leopard 11UH-028 | |
| MSI Bravo 15 B5DD-010US | |
| Gigabyte G5 GD | |
| MSI GS66 Stealth 10UG | |
| HWBOT x265 Benchmark v2.2 / 4k Preset | |
| MSI GE67 HX 12UGS | |
| MSI Vector GP66 12UGS | |
| MSI Raider GE66 12UHS | |
| Acer Nitro 5 AN515-58-72QR | |
| Gigabyte A5 X1 | |
| MSI GP66 Leopard 11UH-028 | |
| Dell G15 5515 | |
| Asus TUF Dash F15 FX517ZC | |
| Média Intel Core i7-12650H (6.62 - 17.4, n=16) | |
| MSI GS66 Stealth 10UG | |
| MSI Bravo 15 B5DD-010US | |
| Gigabyte G5 GD | |
| LibreOffice / 20 Documents To PDF | |
| Dell G15 5515 | |
| Gigabyte A5 X1 | |
| MSI Bravo 15 B5DD-010US | |
| Asus TUF Dash F15 FX517ZC | |
| MSI GP66 Leopard 11UH-028 | |
| MSI GS66 Stealth 10UG | |
| Média Intel Core i7-12650H (35.1 - 58.5, n=14) | |
| Gigabyte G5 GD | |
| MSI GE67 HX 12UGS | |
| Acer Nitro 5 AN515-58-72QR | |
| MSI Vector GP66 12UGS | |
| MSI Raider GE66 12UHS | |
| R Benchmark 2.5 / Overall mean | |
| MSI GS66 Stealth 10UG | |
| Gigabyte G5 GD | |
| MSI GP66 Leopard 11UH-028 | |
| MSI Bravo 15 B5DD-010US | |
| Dell G15 5515 | |
| Gigabyte A5 X1 | |
| Asus TUF Dash F15 FX517ZC | |
| Média Intel Core i7-12650H (0.4584 - 0.515, n=14) | |
| MSI GE67 HX 12UGS | |
| Acer Nitro 5 AN515-58-72QR | |
| MSI Raider GE66 12UHS | |
| MSI Vector GP66 12UGS | |
* ... menor é melhor
AIDA64: FP32 Ray-Trace | FPU Julia | CPU SHA3 | CPU Queen | FPU SinJulia | FPU Mandel | CPU AES | CPU ZLib | FP64 Ray-Trace | CPU PhotoWorxx
| Performance rating | |
| Asus TUF Dash F15 FX517ZR | |
| MSI Bravo 15 B5DD-010US | |
| Média Intel Core i7-12650H | |
| Gigabyte G5 GD | |
| Dell G15 5510 | |
| Asus TUF Dash F15 FX517ZC | |
| Lenovo Ideapad Gaming 3 15IHU-82K1002RGE | |
| AIDA64 / FP32 Ray-Trace | |
| Asus TUF Dash F15 FX517ZR | |
| Média Intel Core i7-12650H (5422 - 15620, n=14) | |
| MSI Bravo 15 B5DD-010US | |
| Gigabyte G5 GD | |
| Dell G15 5510 | |
| Lenovo Ideapad Gaming 3 15IHU-82K1002RGE | |
| Asus TUF Dash F15 FX517ZC | |
| AIDA64 / FPU Julia | |
| Asus TUF Dash F15 FX517ZR | |
| MSI Bravo 15 B5DD-010US | |
| Média Intel Core i7-12650H (26386 - 76434, n=14) | |
| Dell G15 5510 | |
| Gigabyte G5 GD | |
| Lenovo Ideapad Gaming 3 15IHU-82K1002RGE | |
| Asus TUF Dash F15 FX517ZC | |
| AIDA64 / CPU SHA3 | |
| Asus TUF Dash F15 FX517ZR | |
| Gigabyte G5 GD | |
| Média Intel Core i7-12650H (1479 - 3244, n=14) | |
| MSI Bravo 15 B5DD-010US | |
| Lenovo Ideapad Gaming 3 15IHU-82K1002RGE | |
| Dell G15 5510 | |
| Asus TUF Dash F15 FX517ZC | |
| AIDA64 / CPU Queen | |
| Asus TUF Dash F15 FX517ZR | |
| Média Intel Core i7-12650H (59278 - 89537, n=14) | |
| MSI Bravo 15 B5DD-010US | |
| Asus TUF Dash F15 FX517ZC | |
| Dell G15 5510 | |
| Gigabyte G5 GD | |
| Lenovo Ideapad Gaming 3 15IHU-82K1002RGE | |
| AIDA64 / FPU SinJulia | |
| MSI Bravo 15 B5DD-010US | |
| Asus TUF Dash F15 FX517ZR | |
| Dell G15 5510 | |
| Média Intel Core i7-12650H (4690 - 8726, n=14) | |
| Gigabyte G5 GD | |
| Asus TUF Dash F15 FX517ZC | |
| Lenovo Ideapad Gaming 3 15IHU-82K1002RGE | |
| AIDA64 / FPU Mandel | |
| MSI Bravo 15 B5DD-010US | |
| Asus TUF Dash F15 FX517ZR | |
| Média Intel Core i7-12650H (15001 - 37738, n=14) | |
| Gigabyte G5 GD | |
| Dell G15 5510 | |
| Lenovo Ideapad Gaming 3 15IHU-82K1002RGE | |
| Asus TUF Dash F15 FX517ZC | |
| AIDA64 / CPU AES | |
| Gigabyte G5 GD | |
| MSI Bravo 15 B5DD-010US | |
| Lenovo Ideapad Gaming 3 15IHU-82K1002RGE | |
| Asus TUF Dash F15 FX517ZR | |
| Média Intel Core i7-12650H (32702 - 92530, n=14) | |
| Asus TUF Dash F15 FX517ZC | |
| Dell G15 5510 | |
| AIDA64 / CPU ZLib | |
| Asus TUF Dash F15 FX517ZR | |
| Média Intel Core i7-12650H (443 - 891, n=14) | |
| Asus TUF Dash F15 FX517ZC | |
| MSI Bravo 15 B5DD-010US | |
| Gigabyte G5 GD | |
| Dell G15 5510 | |
| Lenovo Ideapad Gaming 3 15IHU-82K1002RGE | |
| AIDA64 / FP64 Ray-Trace | |
| Asus TUF Dash F15 FX517ZR | |
| Média Intel Core i7-12650H (3096 - 8448, n=14) | |
| Gigabyte G5 GD | |
| MSI Bravo 15 B5DD-010US | |
| Dell G15 5510 | |
| Lenovo Ideapad Gaming 3 15IHU-82K1002RGE | |
| Asus TUF Dash F15 FX517ZC | |
| AIDA64 / CPU PhotoWorxx | |
| Asus TUF Dash F15 FX517ZR | |
| Média Intel Core i7-12650H (22046 - 44164, n=14) | |
| Asus TUF Dash F15 FX517ZC | |
| Gigabyte G5 GD | |
| MSI Bravo 15 B5DD-010US | |
| Dell G15 5510 | |
| Lenovo Ideapad Gaming 3 15IHU-82K1002RGE | |
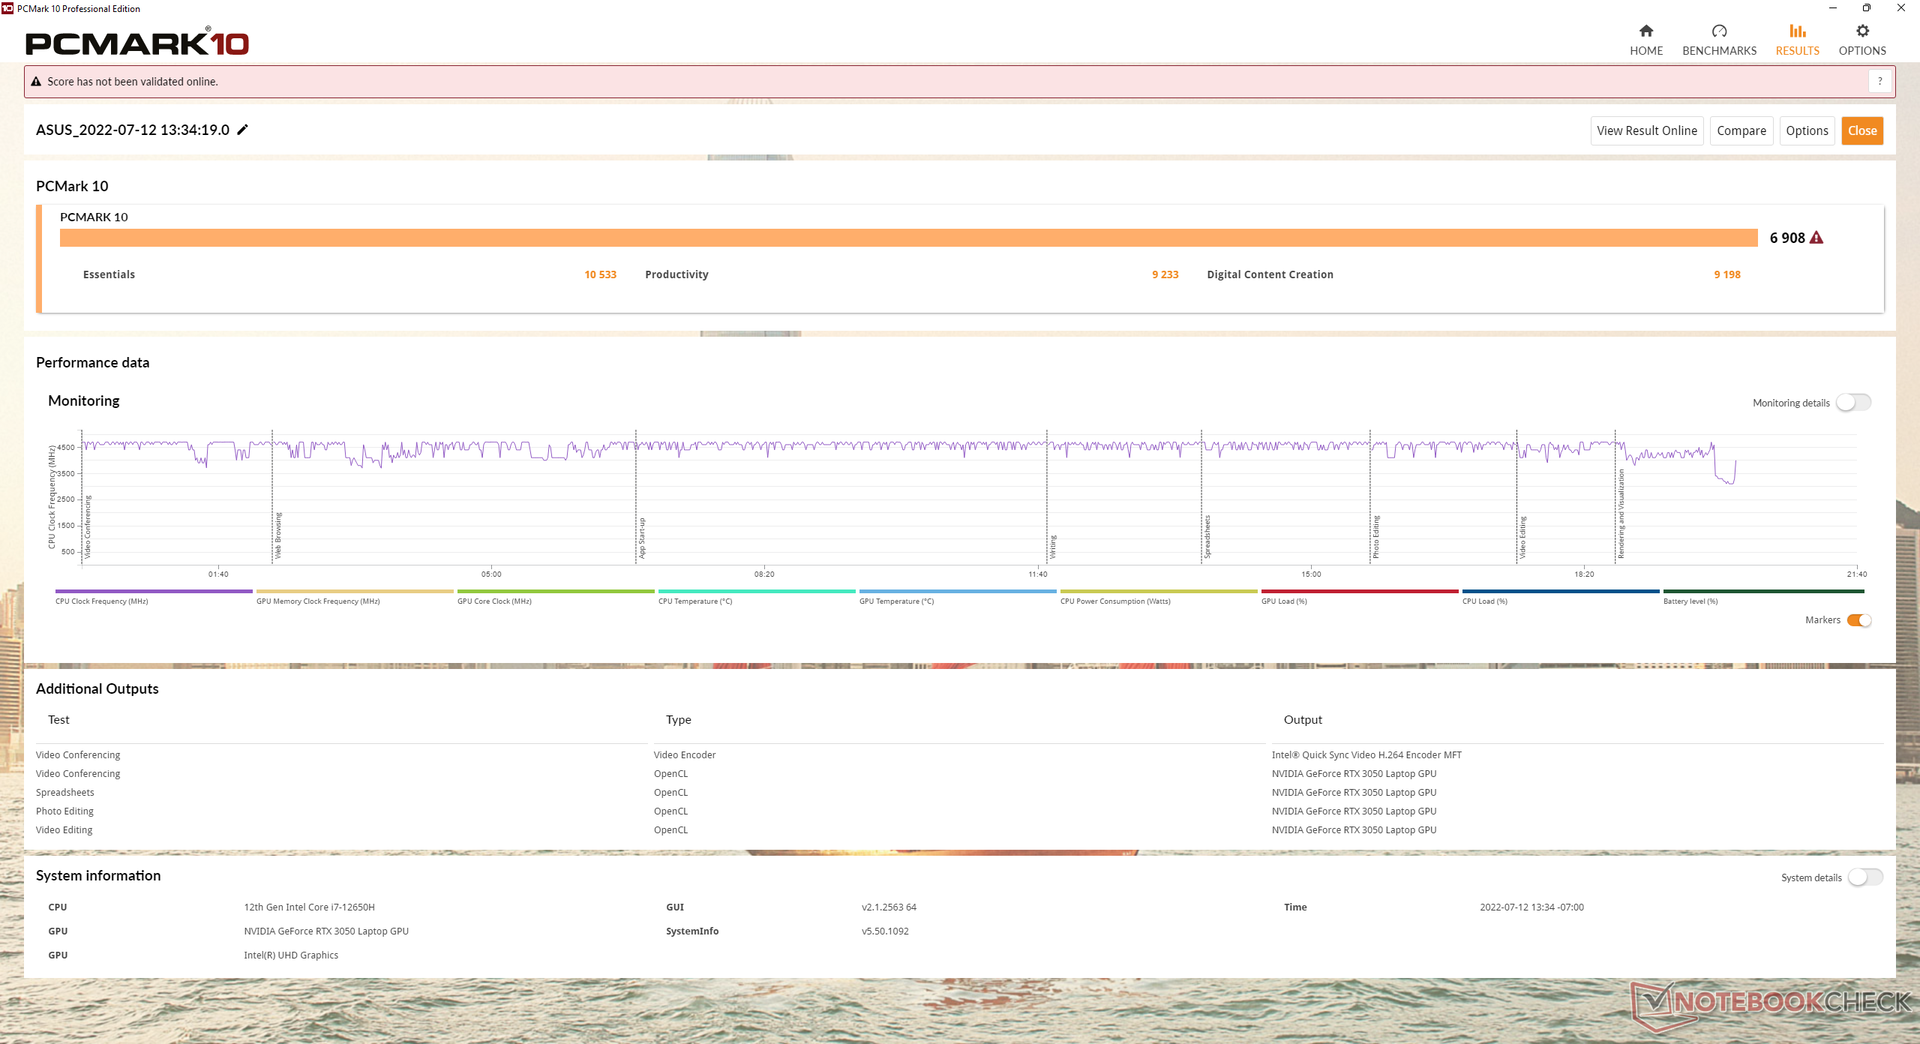
Desempenho do sistema
CrossMark: Overall | Productivity | Creativity | Responsiveness
| PCMark 10 / Score | |
| Asus TUF Dash F15 FX517ZC | |
| Média Intel Core i7-12650H, NVIDIA GeForce RTX 3050 4GB Laptop GPU (n=1) | |
| Asus TUF Dash F15 FX517ZR | |
| MSI Bravo 15 B5DD-010US | |
| Gigabyte G5 GD | |
| Lenovo Ideapad Gaming 3 15IHU-82K1002RGE | |
| Dell G15 5510 | |
| PCMark 10 / Essentials | |
| Asus TUF Dash F15 FX517ZC | |
| Média Intel Core i7-12650H, NVIDIA GeForce RTX 3050 4GB Laptop GPU (n=1) | |
| Asus TUF Dash F15 FX517ZR | |
| MSI Bravo 15 B5DD-010US | |
| Gigabyte G5 GD | |
| Lenovo Ideapad Gaming 3 15IHU-82K1002RGE | |
| Dell G15 5510 | |
| PCMark 10 / Productivity | |
| Asus TUF Dash F15 FX517ZR | |
| Asus TUF Dash F15 FX517ZC | |
| Média Intel Core i7-12650H, NVIDIA GeForce RTX 3050 4GB Laptop GPU (n=1) | |
| Lenovo Ideapad Gaming 3 15IHU-82K1002RGE | |
| MSI Bravo 15 B5DD-010US | |
| Gigabyte G5 GD | |
| Dell G15 5510 | |
| PCMark 10 / Digital Content Creation | |
| Asus TUF Dash F15 FX517ZC | |
| Média Intel Core i7-12650H, NVIDIA GeForce RTX 3050 4GB Laptop GPU (n=1) | |
| Asus TUF Dash F15 FX517ZR | |
| MSI Bravo 15 B5DD-010US | |
| Gigabyte G5 GD | |
| Dell G15 5510 | |
| Lenovo Ideapad Gaming 3 15IHU-82K1002RGE | |
| CrossMark / Overall | |
| Asus TUF Dash F15 FX517ZR | |
| Asus TUF Dash F15 FX517ZC | |
| Média Intel Core i7-12650H, NVIDIA GeForce RTX 3050 4GB Laptop GPU (n=1) | |
| Lenovo Ideapad Gaming 3 15IHU-82K1002RGE | |
| CrossMark / Productivity | |
| Asus TUF Dash F15 FX517ZC | |
| Média Intel Core i7-12650H, NVIDIA GeForce RTX 3050 4GB Laptop GPU (n=1) | |
| Asus TUF Dash F15 FX517ZR | |
| Lenovo Ideapad Gaming 3 15IHU-82K1002RGE | |
| CrossMark / Creativity | |
| Asus TUF Dash F15 FX517ZR | |
| Asus TUF Dash F15 FX517ZC | |
| Média Intel Core i7-12650H, NVIDIA GeForce RTX 3050 4GB Laptop GPU (n=1) | |
| Lenovo Ideapad Gaming 3 15IHU-82K1002RGE | |
| CrossMark / Responsiveness | |
| Asus TUF Dash F15 FX517ZC | |
| Média Intel Core i7-12650H, NVIDIA GeForce RTX 3050 4GB Laptop GPU (n=1) | |
| Asus TUF Dash F15 FX517ZR | |
| Lenovo Ideapad Gaming 3 15IHU-82K1002RGE | |
| PCMark 10 Score | 6908 pontos | |
Ajuda | ||
| AIDA64 / Memory Copy | |
| Asus TUF Dash F15 FX517ZR | |
| Média Intel Core i7-12650H (43261 - 69735, n=14) | |
| Asus TUF Dash F15 FX517ZC | |
| Gigabyte G5 GD | |
| MSI Bravo 15 B5DD-010US | |
| Dell G15 5510 | |
| Lenovo Ideapad Gaming 3 15IHU-82K1002RGE | |
| AIDA64 / Memory Read | |
| Asus TUF Dash F15 FX517ZR | |
| Média Intel Core i7-12650H (47313 - 67412, n=14) | |
| Asus TUF Dash F15 FX517ZC | |
| Gigabyte G5 GD | |
| MSI Bravo 15 B5DD-010US | |
| Dell G15 5510 | |
| Lenovo Ideapad Gaming 3 15IHU-82K1002RGE | |
| AIDA64 / Memory Write | |
| Asus TUF Dash F15 FX517ZR | |
| Média Intel Core i7-12650H (45617 - 59361, n=14) | |
| Asus TUF Dash F15 FX517ZC | |
| Gigabyte G5 GD | |
| Dell G15 5510 | |
| MSI Bravo 15 B5DD-010US | |
| Lenovo Ideapad Gaming 3 15IHU-82K1002RGE | |
| AIDA64 / Memory Latency | |
| Asus TUF Dash F15 FX517ZR | |
| Gigabyte G5 GD | |
| Lenovo Ideapad Gaming 3 15IHU-82K1002RGE | |
| Média Intel Core i7-12650H (71.6 - 103.9, n=14) | |
| Dell G15 5510 | |
| MSI Bravo 15 B5DD-010US | |
| Asus TUF Dash F15 FX517ZC | |
* ... menor é melhor
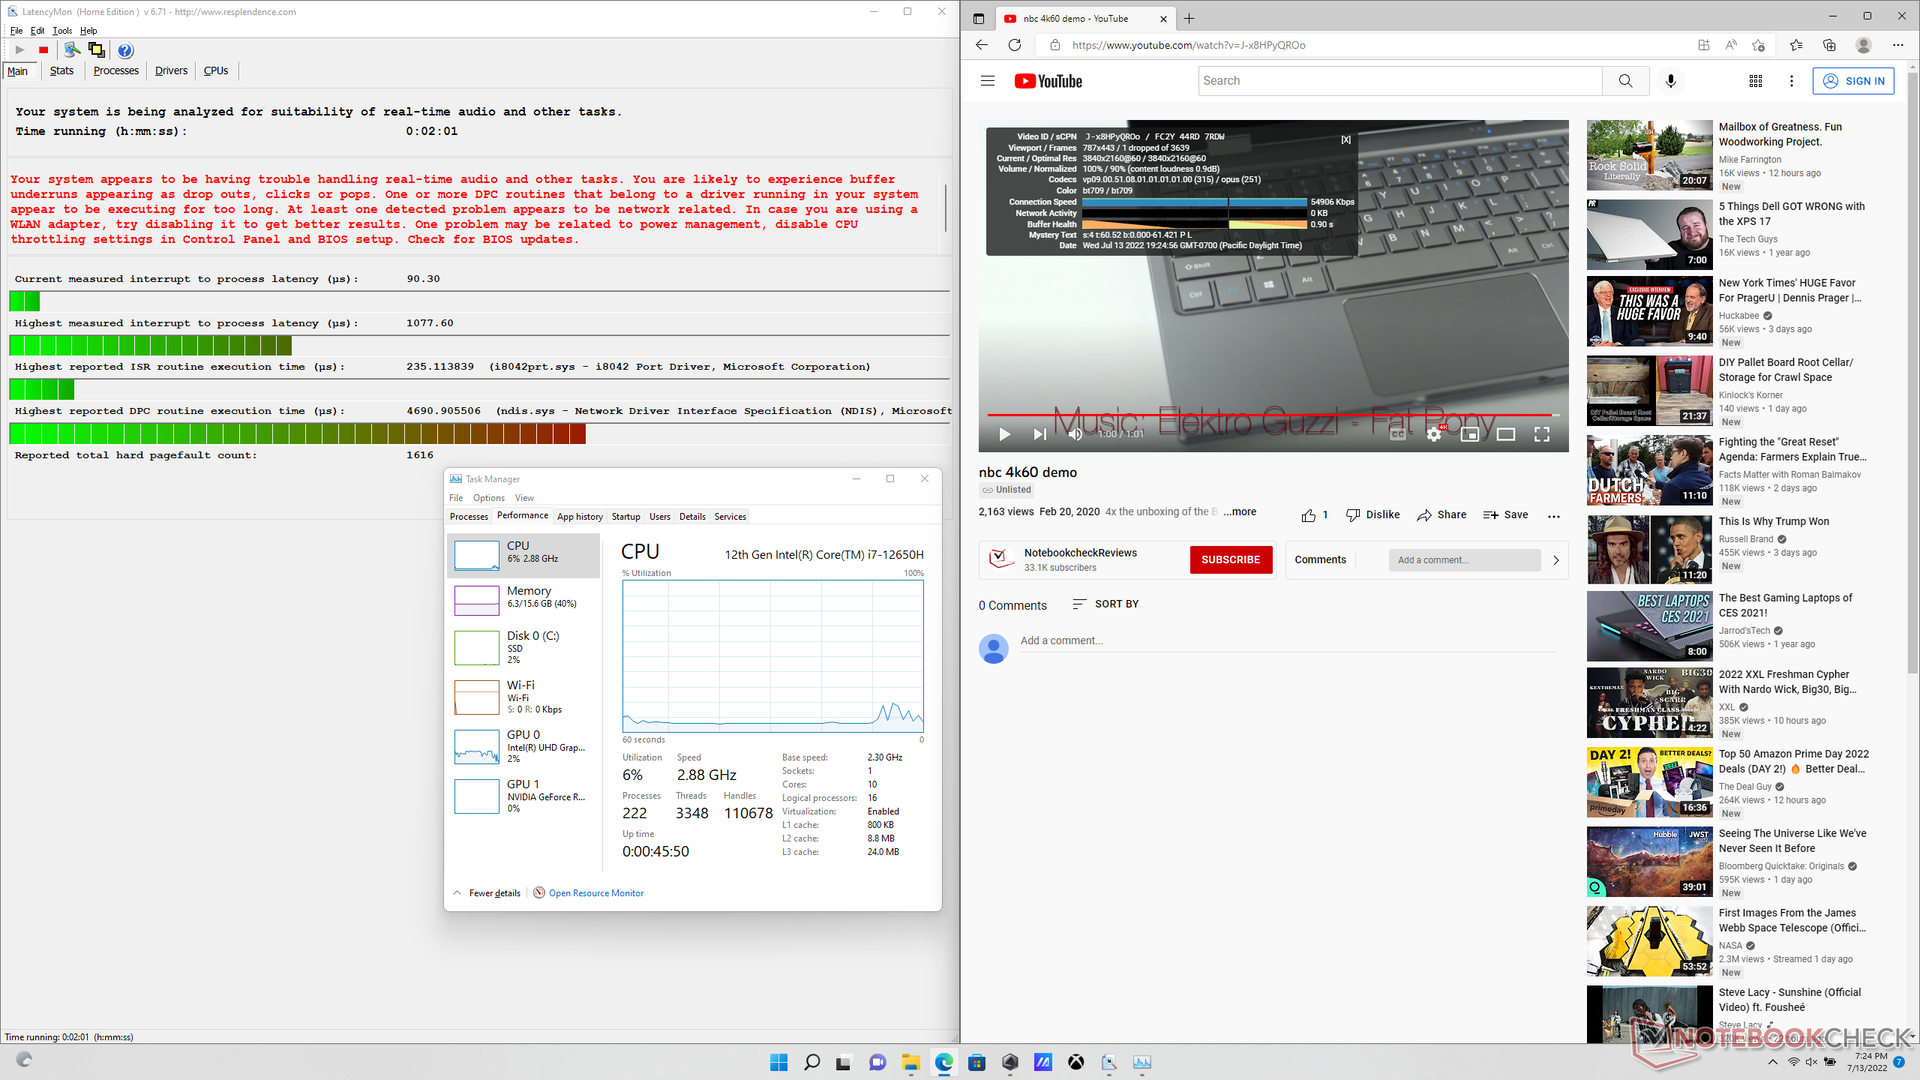
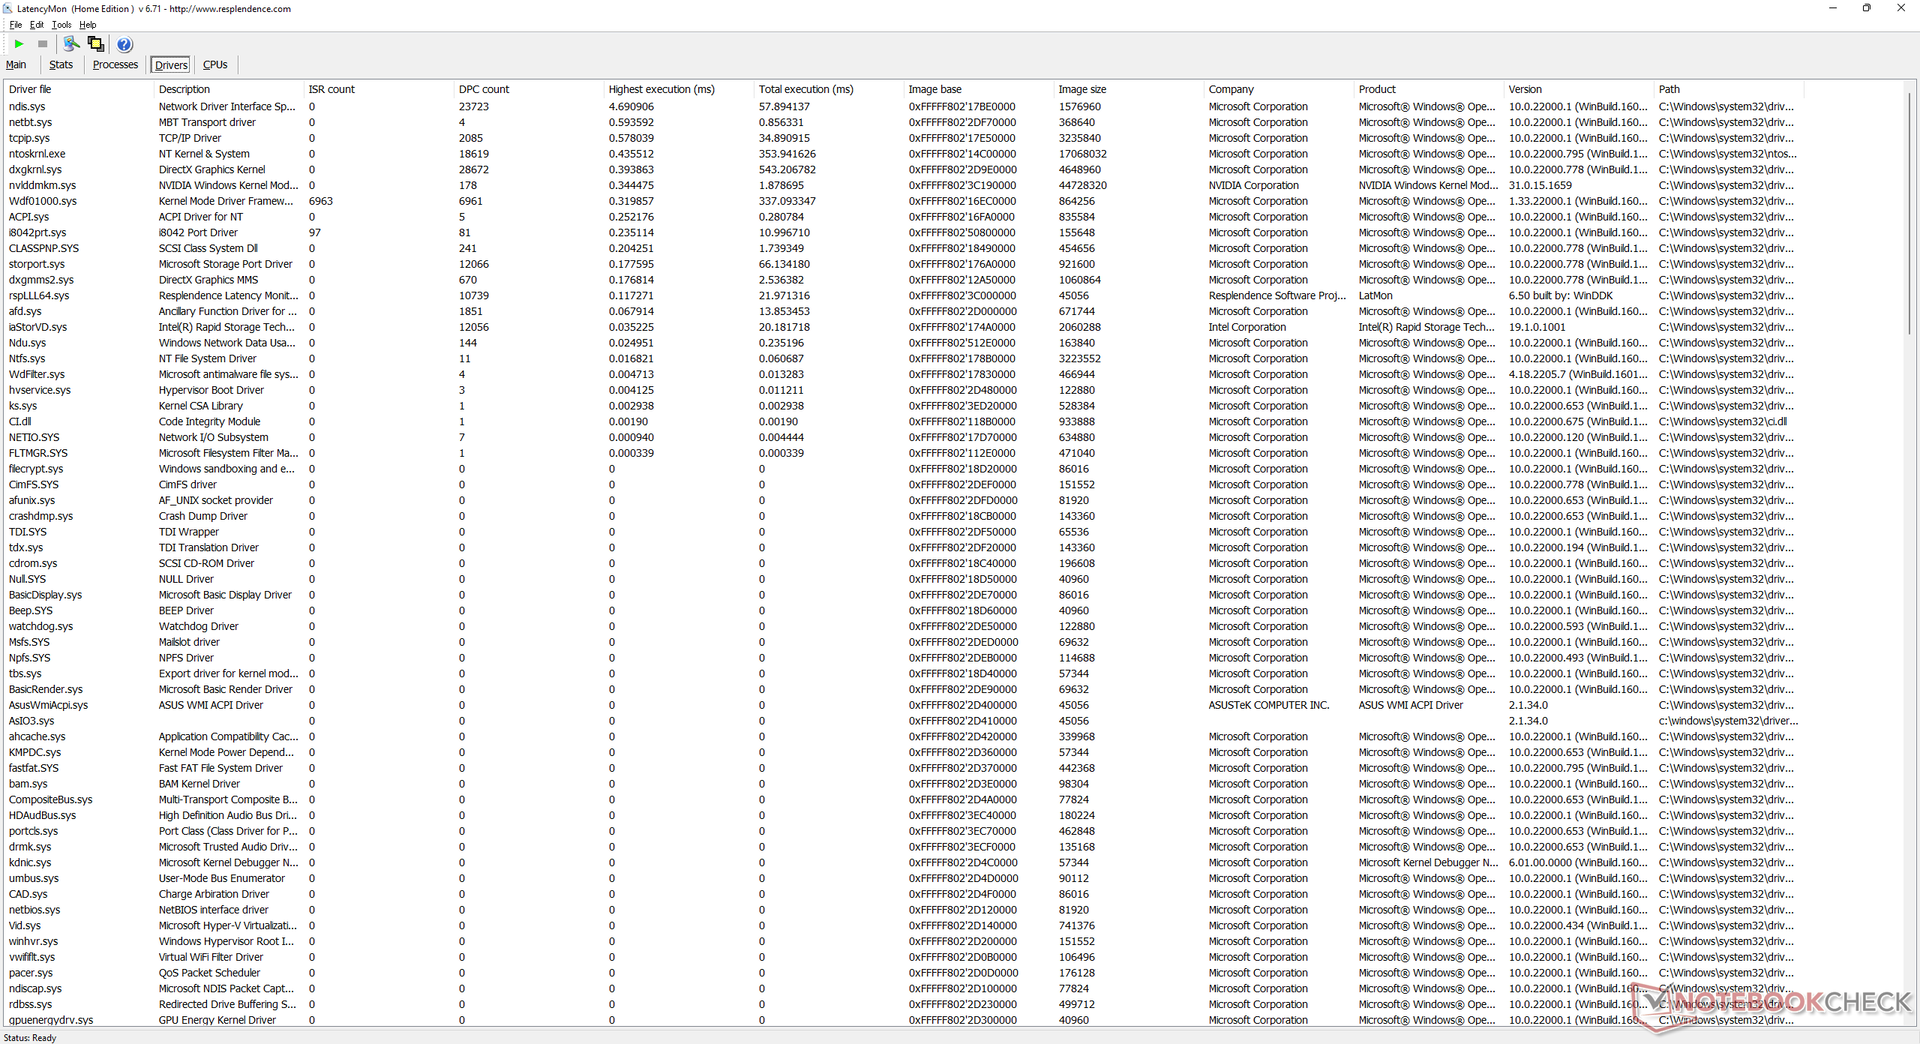
Latência do DPC
Tivemos problemas com DPC ao abrir várias abas do navegador em nossa página inicial. a reprodução do vídeo 4K a 60 FPS é perfeita com apenas um único frame caído durante nosso vídeo de um minuto.
| DPC Latencies / LatencyMon - interrupt to process latency (max), Web, Youtube, Prime95 | |
| Dell G15 5510 | |
| MSI Bravo 15 B5DD-010US | |
| Asus TUF Dash F15 FX517ZC | |
| Lenovo Ideapad Gaming 3 15IHU-82K1002RGE | |
| Asus TUF Dash F15 FX517ZR | |
| Gigabyte G5 GD | |
* ... menor é melhor
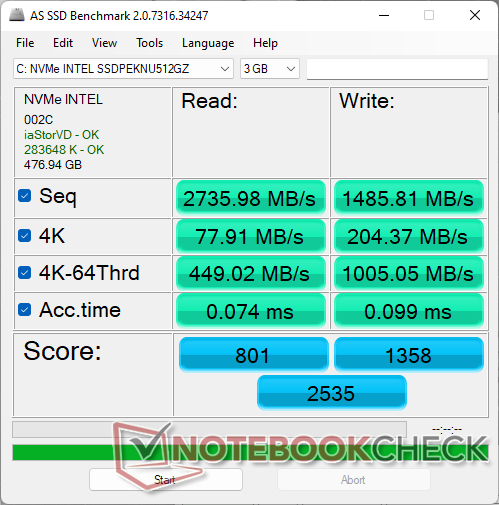
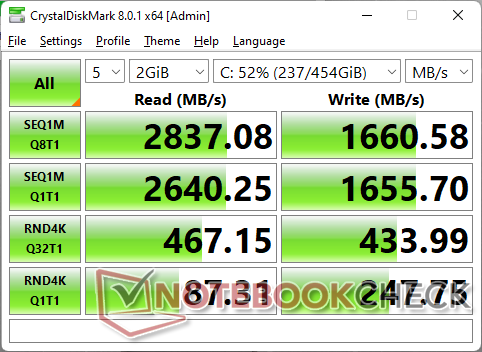
Dispositivos de armazenamento - Suporta até 2x SSDs M.2
Nossa unidade de teste é enviada com um alcance médio SSD Intel 670p para uma taxa de leitura sequencial sustentada de cerca de 2300 MB/s. O sistema pode suportar até dois SSDs M.2 2280 internos simultaneamente.

| Drive Performance rating - Percent | |
| Gigabyte G5 GD | |
| Asus TUF Dash F15 FX517ZR | |
| Dell G15 5510 | |
| Asus TUF Dash F15 FX517ZC | |
| Lenovo Ideapad Gaming 3 15IHU-82K1002RGE | |
| MSI Bravo 15 B5DD-010US | |
* ... menor é melhor
Disk Throttling: DiskSpd Read Loop, Queue Depth 8
Desempenho da GPU
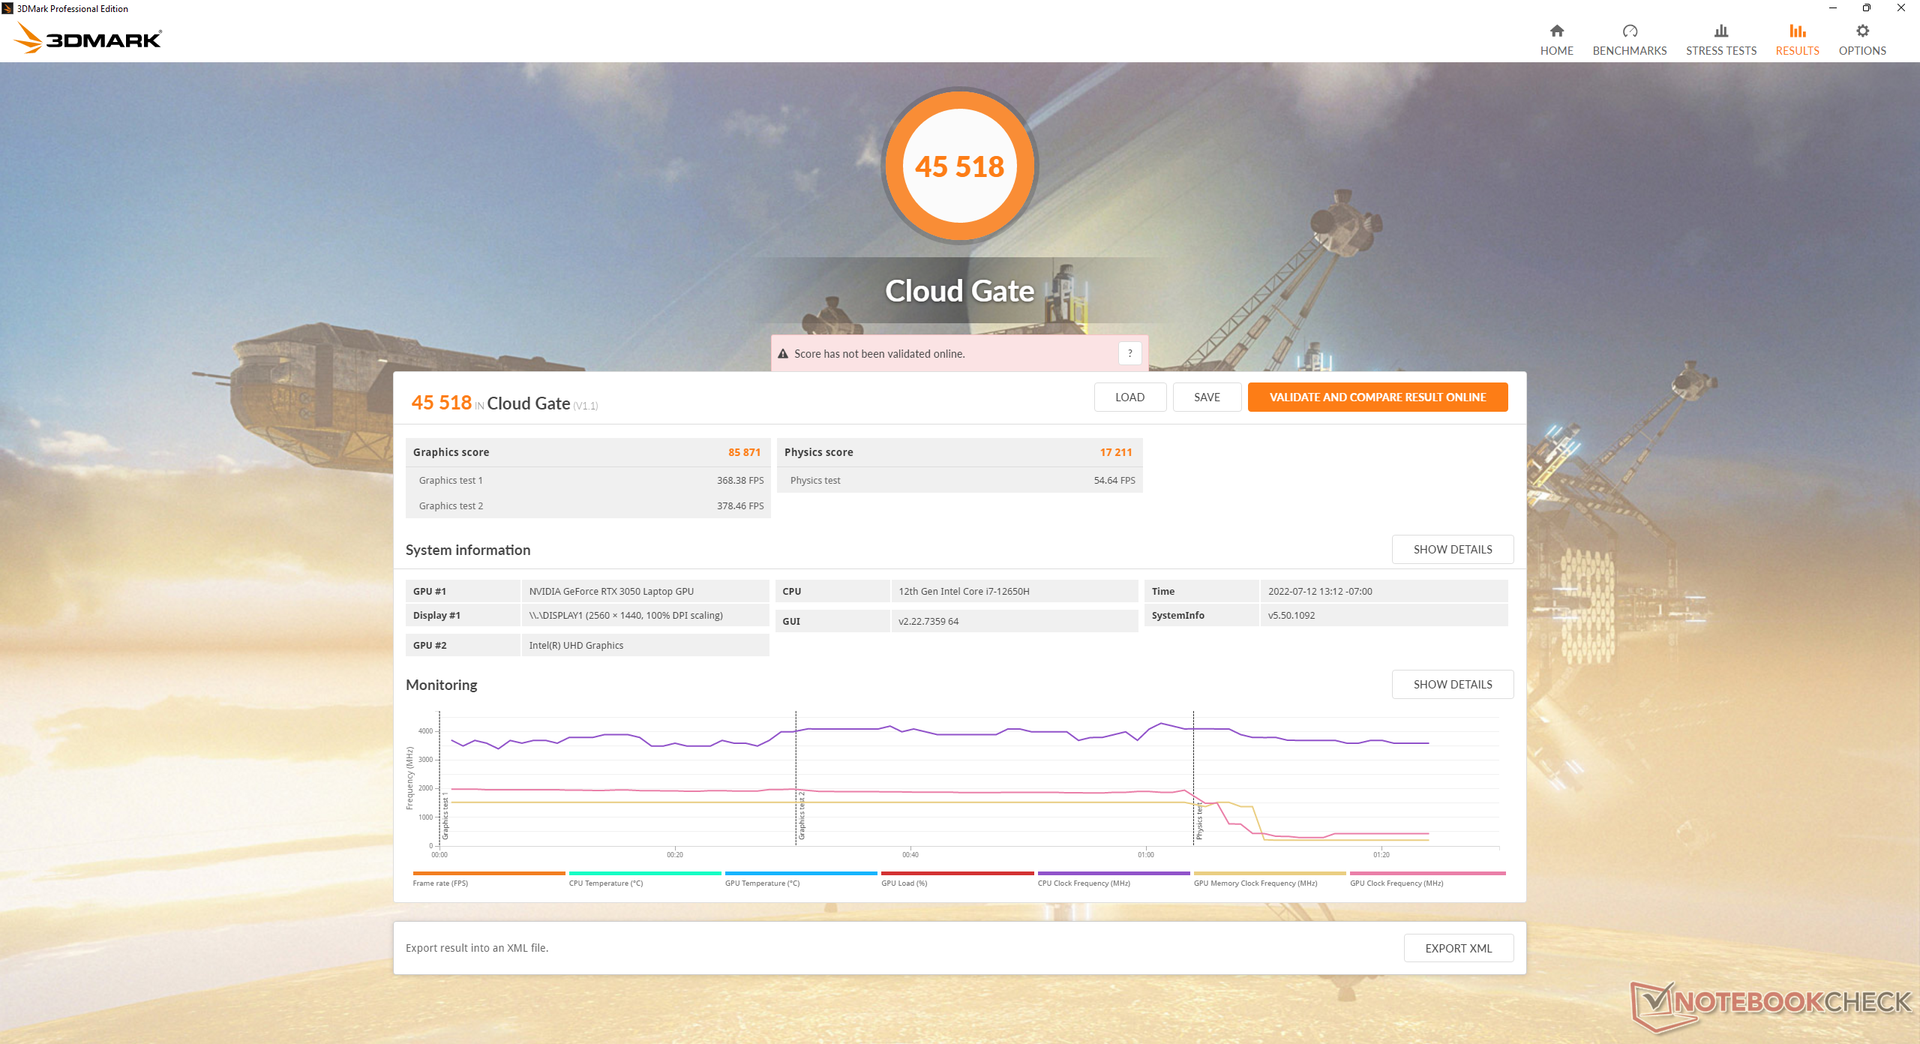
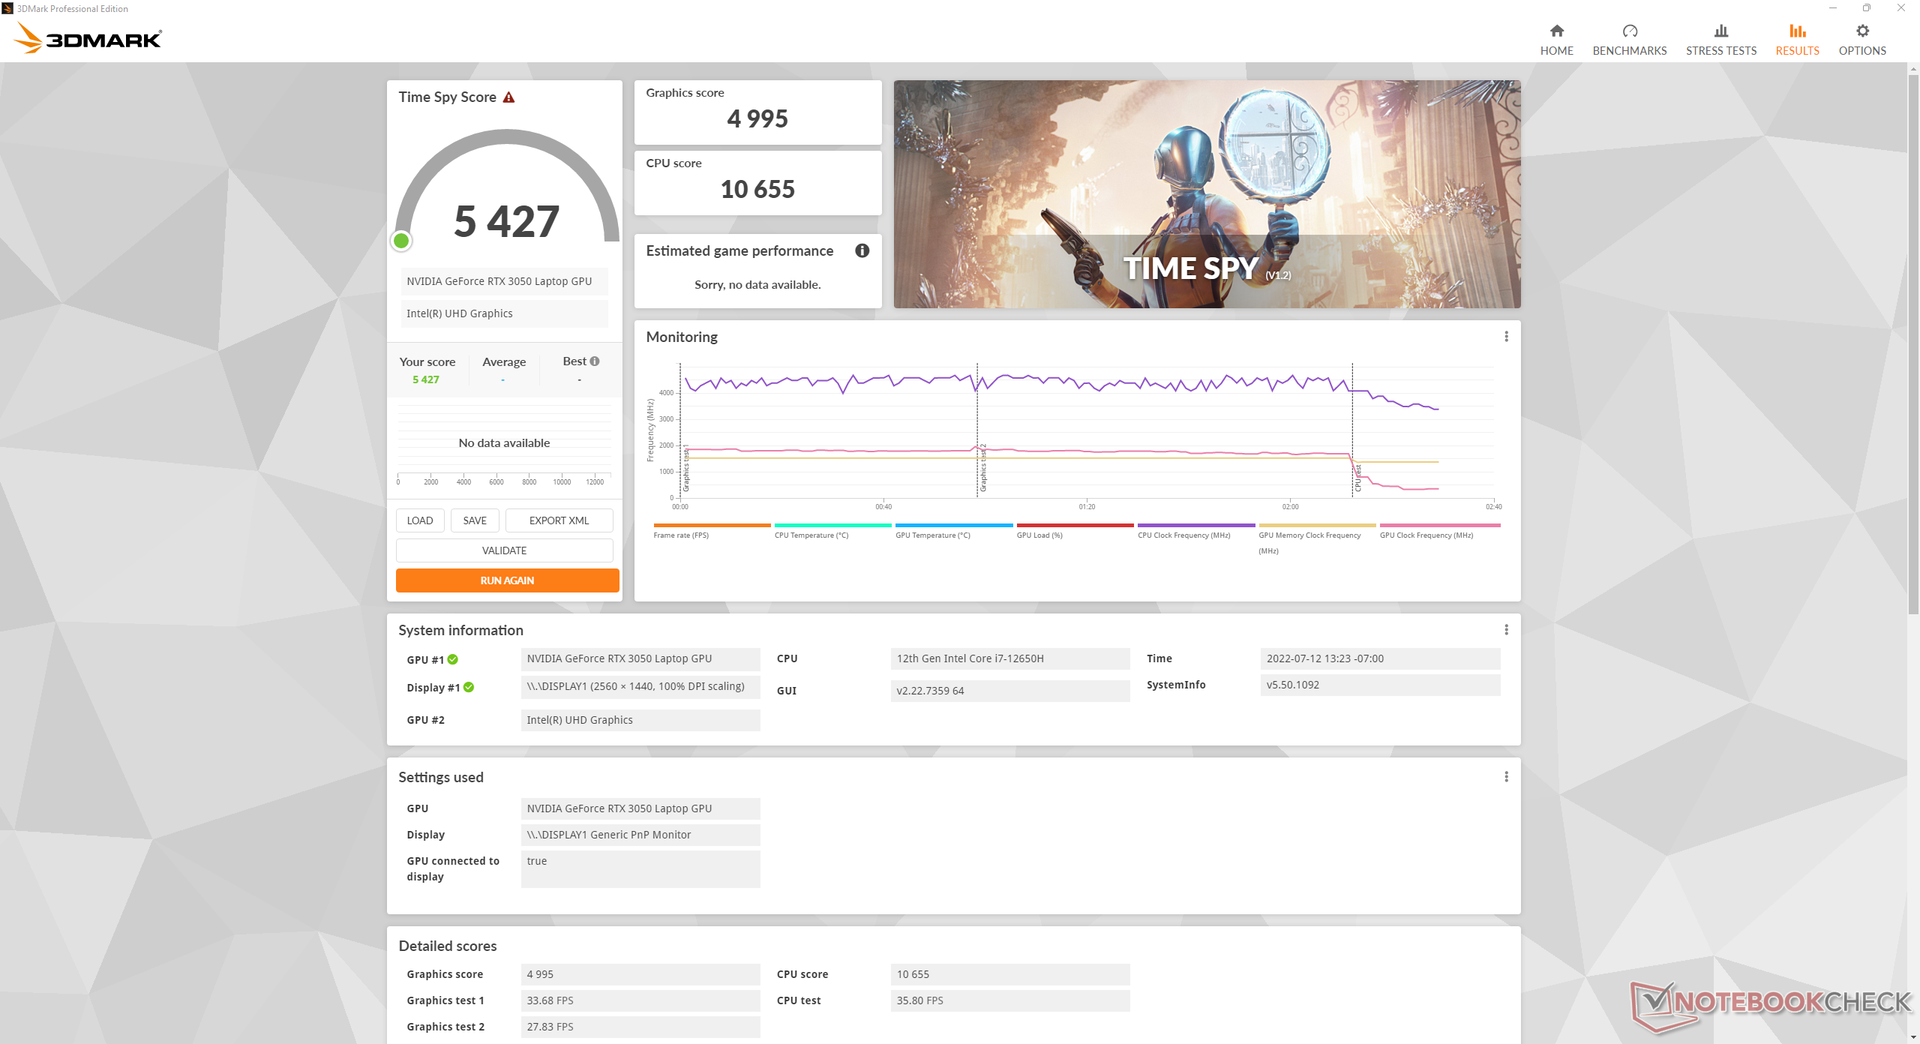
Nossos 75 W GeForce RTX 3050 tem um desempenho cerca de 40% mais lento que o dos 105 W GeForce RTX 3070 na FX517ZR. A diferença se torna mais pronunciada quando executamos títulos pesados de GPU como o Cyberpunk 2077, onde nosso RTX 3050 pode estar quase 50% atrás. Os jogadores de laptop ainda rodando no RTX 2060 mais antigo não estão perdendo muito, pois a GPU Turing é mais rápida do que o RTX 3050 em cerca de 25 por cento.
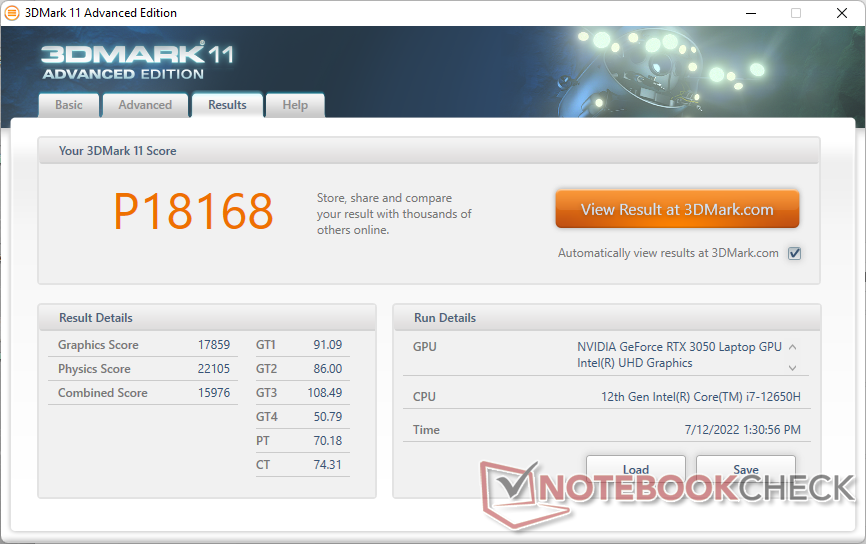
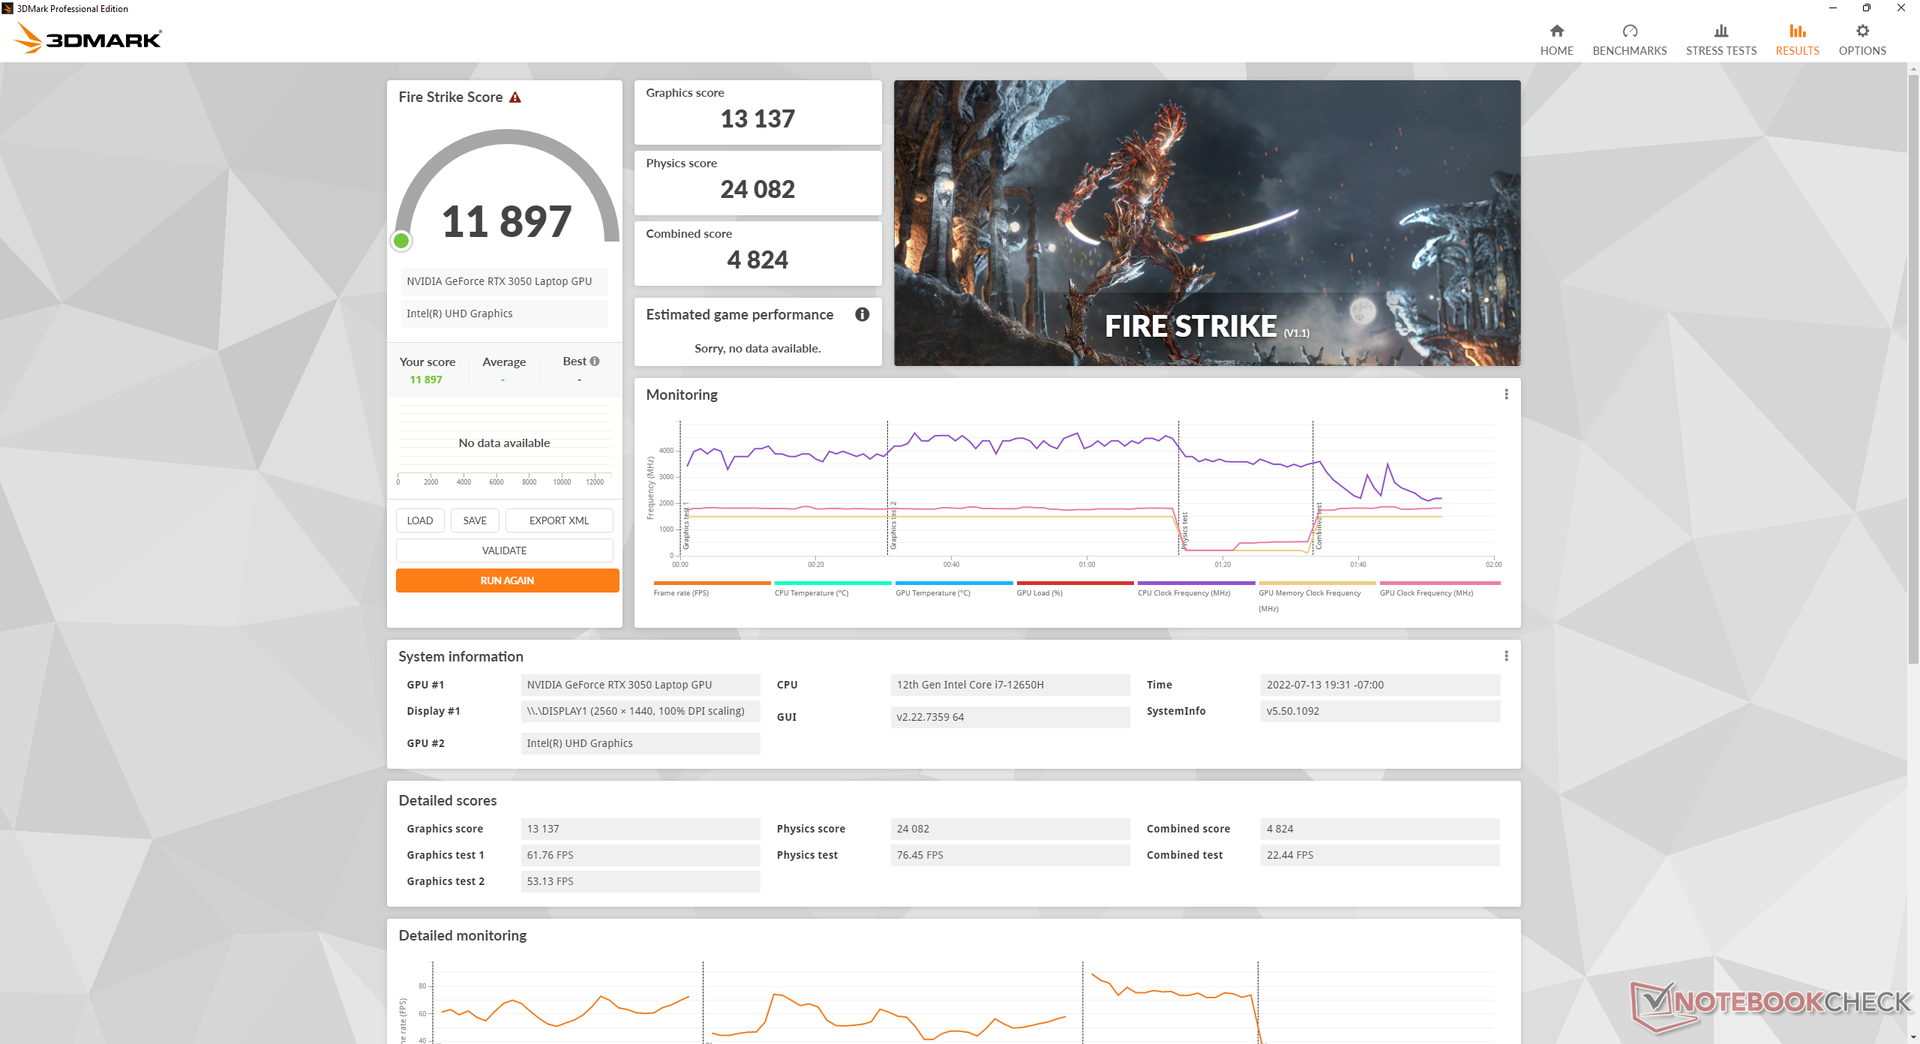
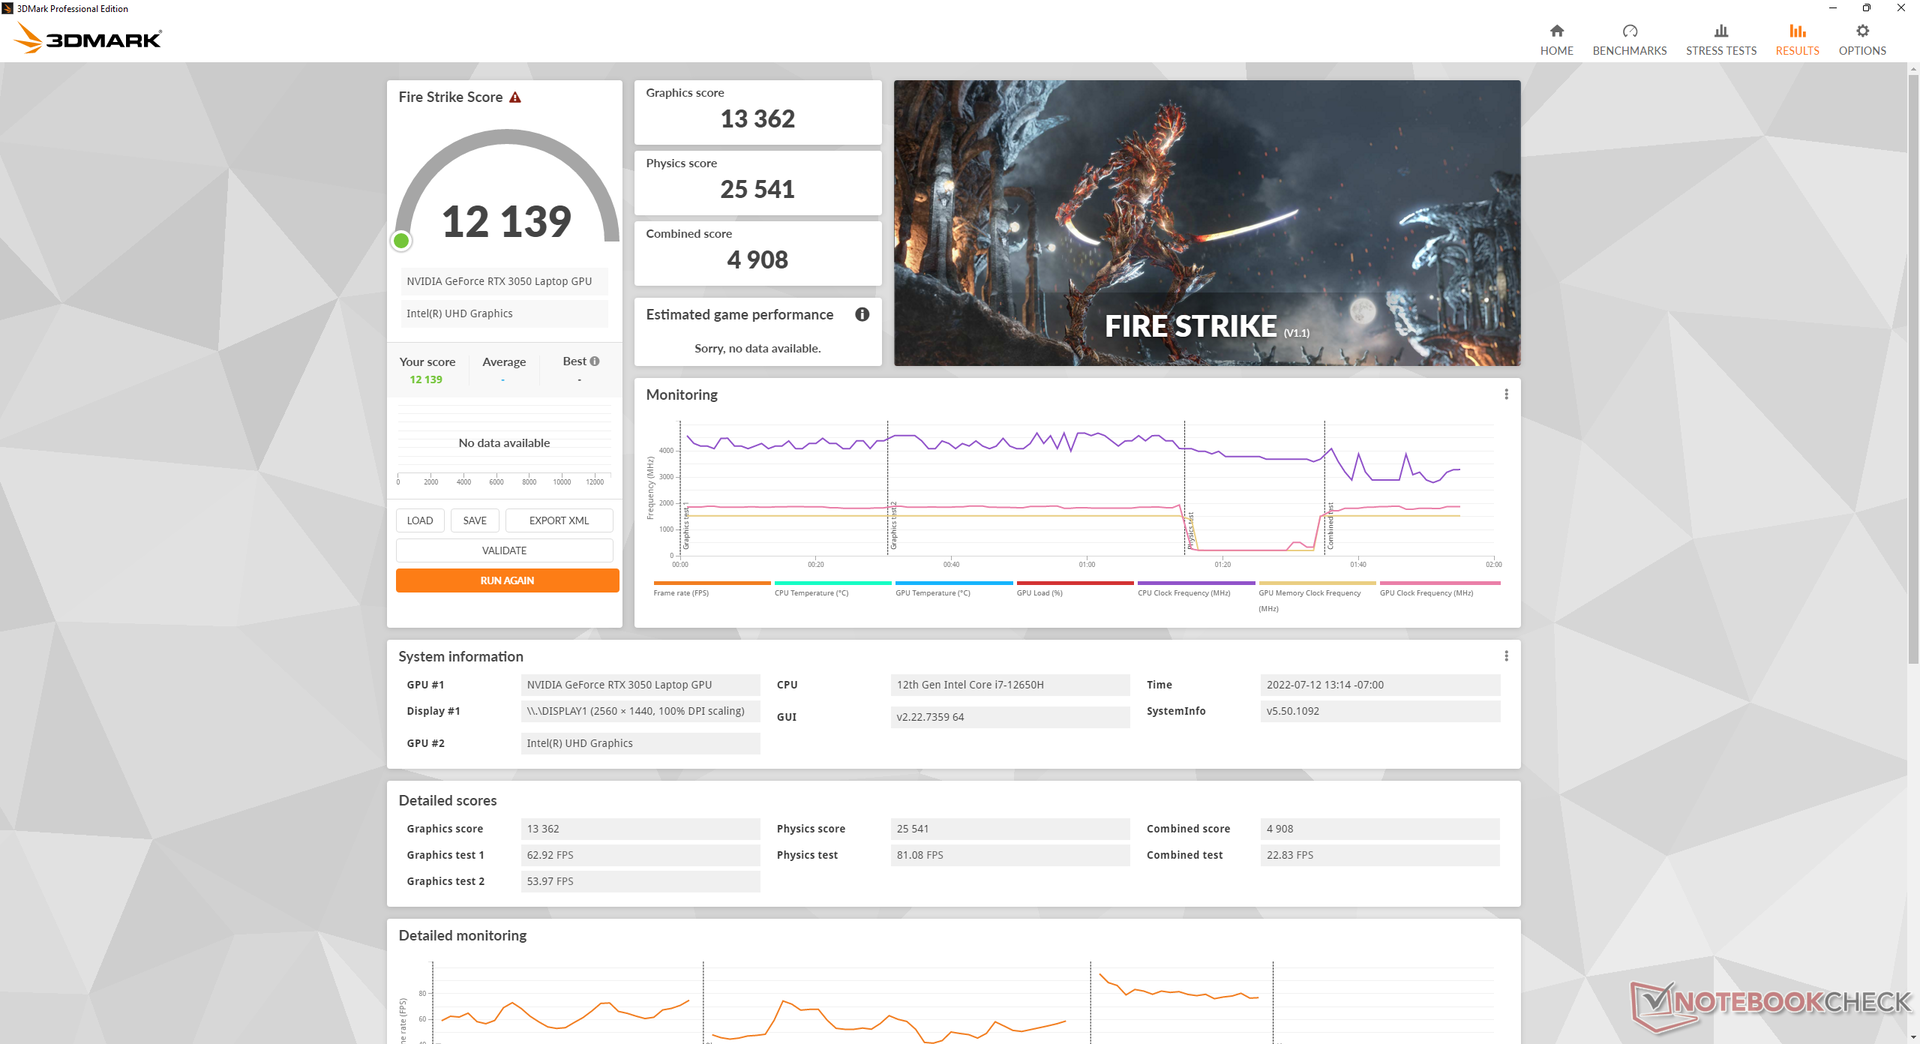
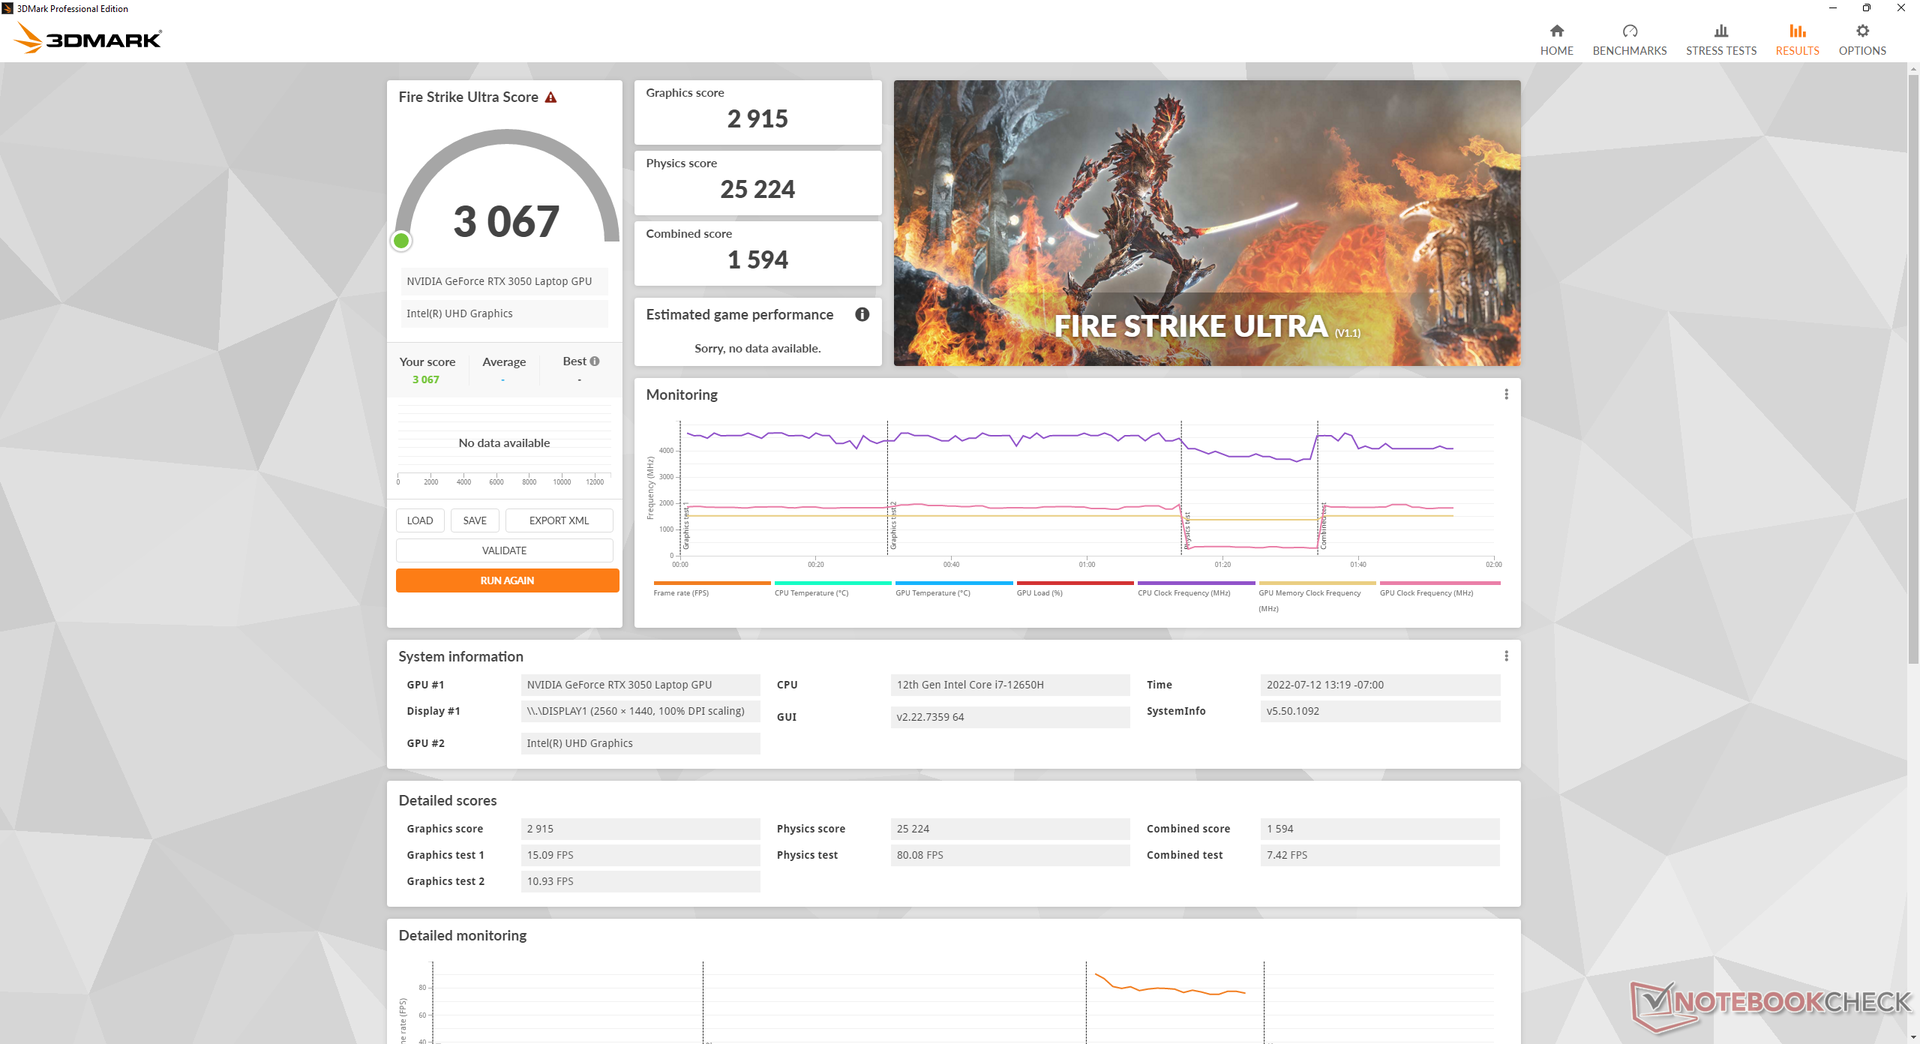
| 3DMark 11 Performance | 18168 pontos | |
| 3DMark Cloud Gate Standard Score | 45518 pontos | |
| 3DMark Fire Strike Score | 12139 pontos | |
| 3DMark Time Spy Score | 5427 pontos | |
Ajuda | ||
Witcher 3 FPS Chart
| baixo | média | alto | ultra | |
|---|---|---|---|---|
| GTA V (2015) | 184 | 179 | 148.2 | 70.9 |
| The Witcher 3 (2015) | 282.1 | 171.6 | 98.7 | 51.9 |
| Dota 2 Reborn (2015) | 176.5 | 163.2 | 156.3 | 147.7 |
| Final Fantasy XV Benchmark (2018) | 143.4 | 74 | 51 | |
| X-Plane 11.11 (2018) | 148.1 | 129.9 | 103.1 | |
| Strange Brigade (2018) | 320 | 135.8 | 108.1 | 90.8 |
| Cyberpunk 2077 1.6 (2022) | 77.9 | 62.1 | 44 | 36.1 |
Emissões
Ruído do sistema - Mais de 50 dB(A) quando se joga
O ruído do ventilador depende muito da configuração do perfil de potência do Armoury Crate: Windows, Silencioso, Equilibrado, Turbo e Manual. Recomendamos o modo Silent se simplesmente navegar na web ou fazer streaming, pois os ventiladores internos podem ser bastante barulhentos. Se no modo Equilibrado, por exemplo, o ventilador freqüentemente pulsaria até 32 dB(A) contra um fundo silencioso de 24 dB(A) apenas a partir da navegação na web
O ruído do ventilador estabilizaria em 48,7 dB(A) e 53,4 dB(A) quando jogando no modo Equilibrado e no modo Turbo, respectivamente. Nossa seção de Teste de Estresse abaixo mostra que os TDP e TGP mais altos só são acessíveis no modo Turbo, o que significa que os usuários devem suportar os ventiladores mais altos se quiserem extrair o desempenho total do laptop. A faixa de 50+ dB(A) é maior do que na maioria dos outros laptops para jogos, incluindo o Dell G15 5510 ou Lenovo Ideapad Gaming 3 15 cada um com a mesma GPU RTX 3050
.
Barulho
| Ocioso |
| 24 / 24 / 32.3 dB |
| Carga |
| 43.7 / 53.6 dB |
 | ||
30 dB silencioso 40 dB(A) audível 50 dB(A) ruidosamente alto |
||
min: | ||
| Asus TUF Dash F15 FX517ZC GeForce RTX 3050 4GB Laptop GPU, i7-12650H, Intel SSD 670p SSDPEKNU512GZ | Asus TUF Dash F15 FX517ZR GeForce RTX 3070 Laptop GPU, i7-12650H, Samsung PM991a MZVLQ1T0HBLB | Dell G15 5510 GeForce RTX 3050 4GB Laptop GPU, i5-10500H, SK Hynix BC711 HFM512GD3HX015N | MSI Bravo 15 B5DD-010US Radeon RX 5500M, R5 5600H, Kingston OM8PCP3512F-AB | Lenovo Ideapad Gaming 3 15IHU-82K1002RGE GeForce RTX 3050 Ti Laptop GPU, i5-11300H, Micron 2210 MTFDHBA512QFD | Gigabyte G5 GD GeForce RTX 3050 4GB Laptop GPU, i5-11400H, ESR512GTLG-E6GBTNB4 | |
|---|---|---|---|---|---|---|
| Noise | -6% | -1% | -2% | 4% | -9% | |
| desligado / ambiente * (dB) | 23.9 | 26 -9% | 26 -9% | 24.5 -3% | 23.9 -0% | 24 -0% |
| Idle Minimum * (dB) | 24 | 26 -8% | 26 -8% | 24.5 -2% | 23.9 -0% | 29 -21% |
| Idle Average * (dB) | 24 | 32 -33% | 27 -13% | 32.8 -37% | 26.8 -12% | 30 -25% |
| Idle Maximum * (dB) | 32.3 | 33 -2% | 33 -2% | 32.8 -2% | 26.8 17% | 32 1% |
| Load Average * (dB) | 43.7 | 48 -10% | 45 -3% | 34.5 21% | 43.5 -0% | 53 -21% |
| Witcher 3 ultra * (dB) | 53.4 | 47 12% | 45 16% | 42.5 20% | 43.5 19% | 52 3% |
| Load Maximum * (dB) | 53.6 | 49 9% | 47 12% | 58.5 -9% | 53.1 1% | 54 -1% |
* ... menor é melhor
Temperatura
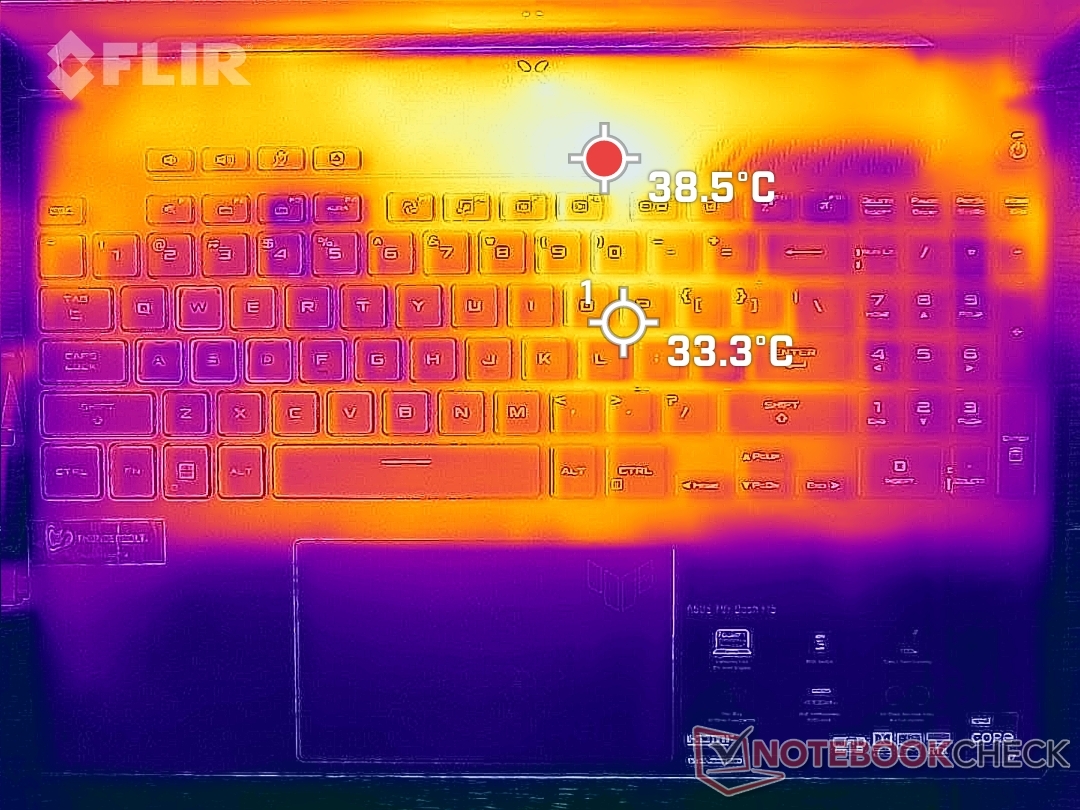
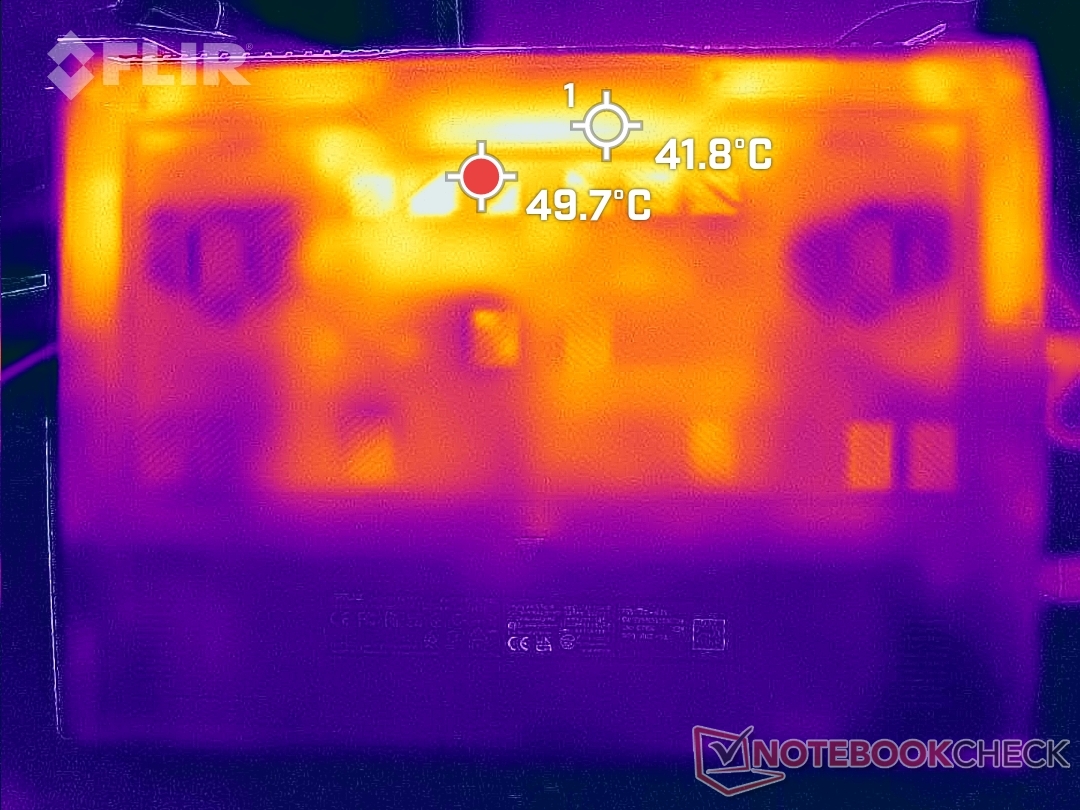
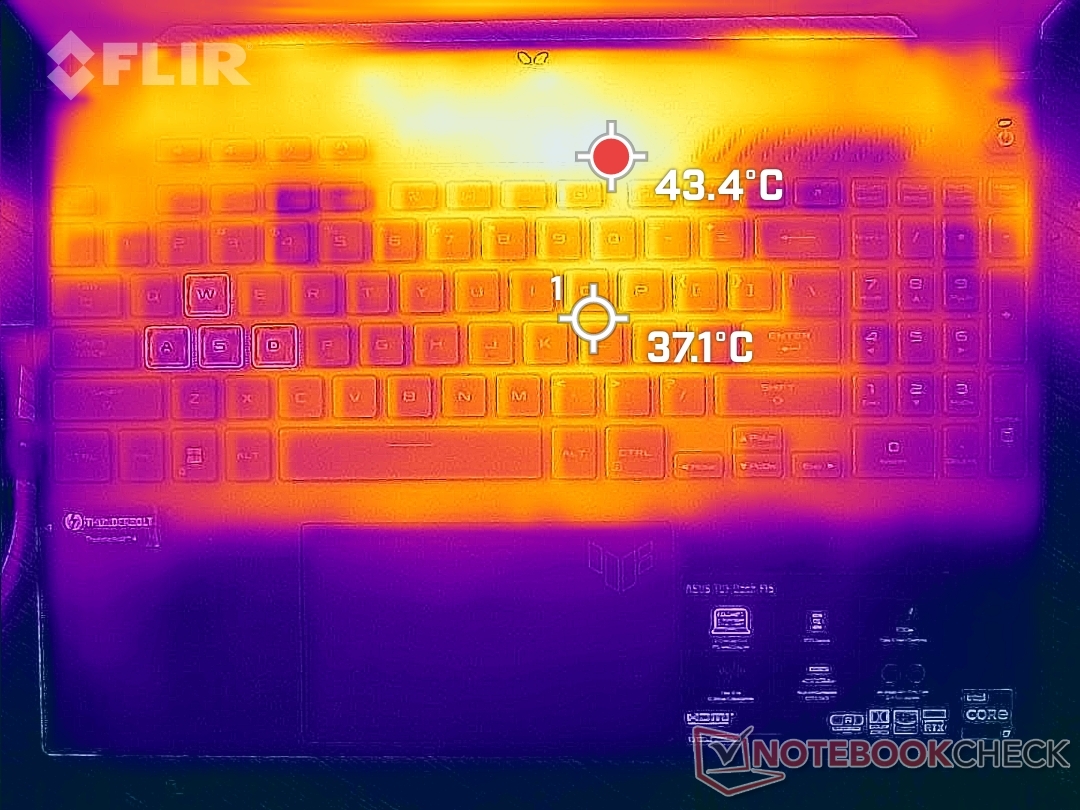
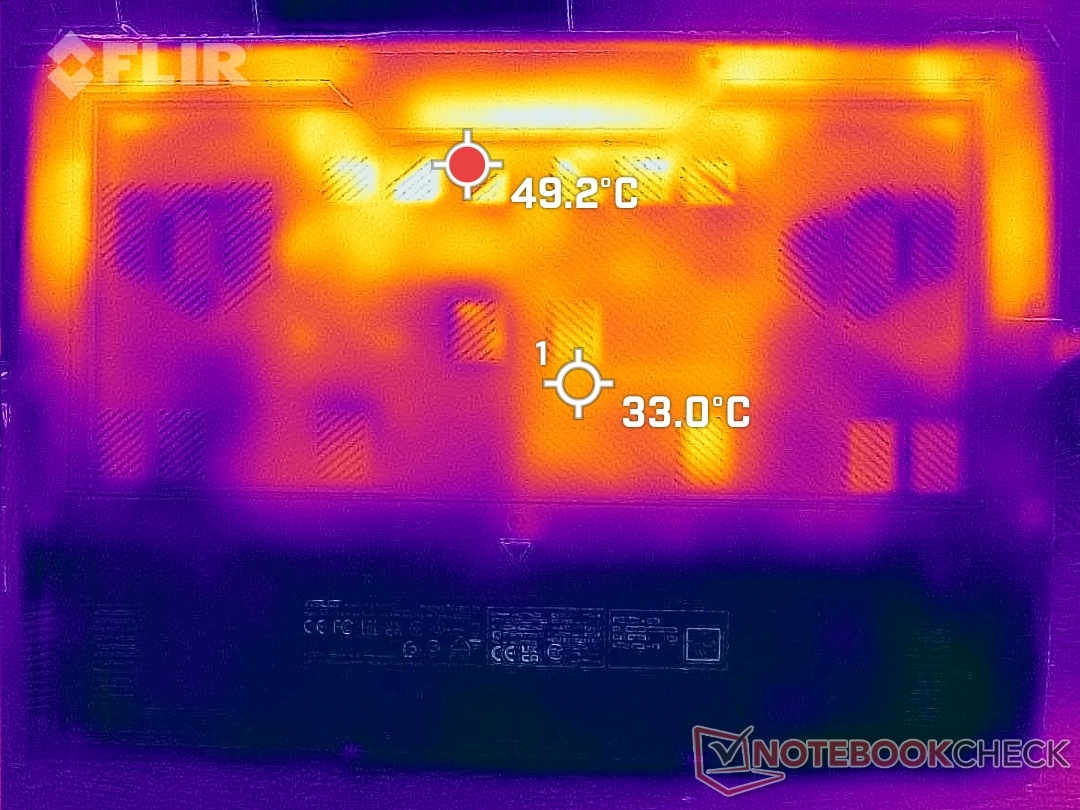
As temperaturas superficiais podem chegar a 33 C a 37 C no centro do teclado, quando o jogo é mais frio do que o que observamos no Acer Swift X 16 equipado com a mesma GPU RTX 3050 em mais de alguns graus. O ponto quente no Asus pode atingir 43 C ou mais, mas esta área está felizmente acima da primeira fileira de teclas do teclado, como mostrado pelos mapas de temperatura abaixo, onde é improvável que os usuários toquem quando estiverem jogando.
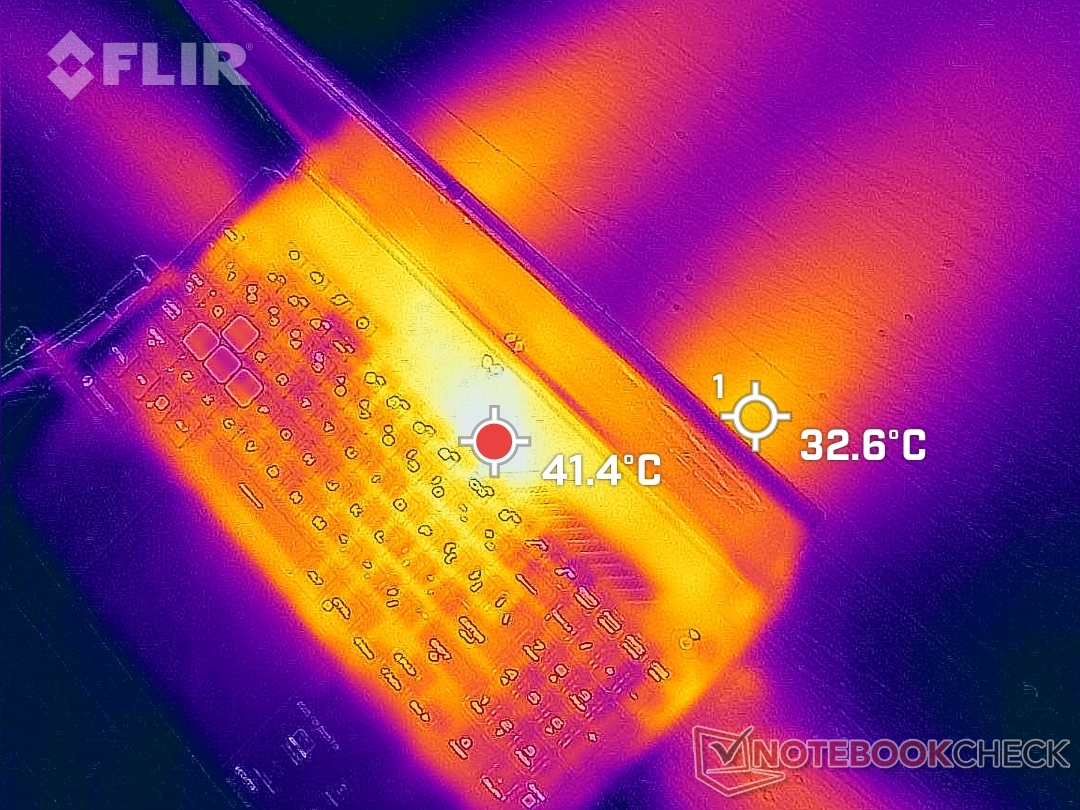
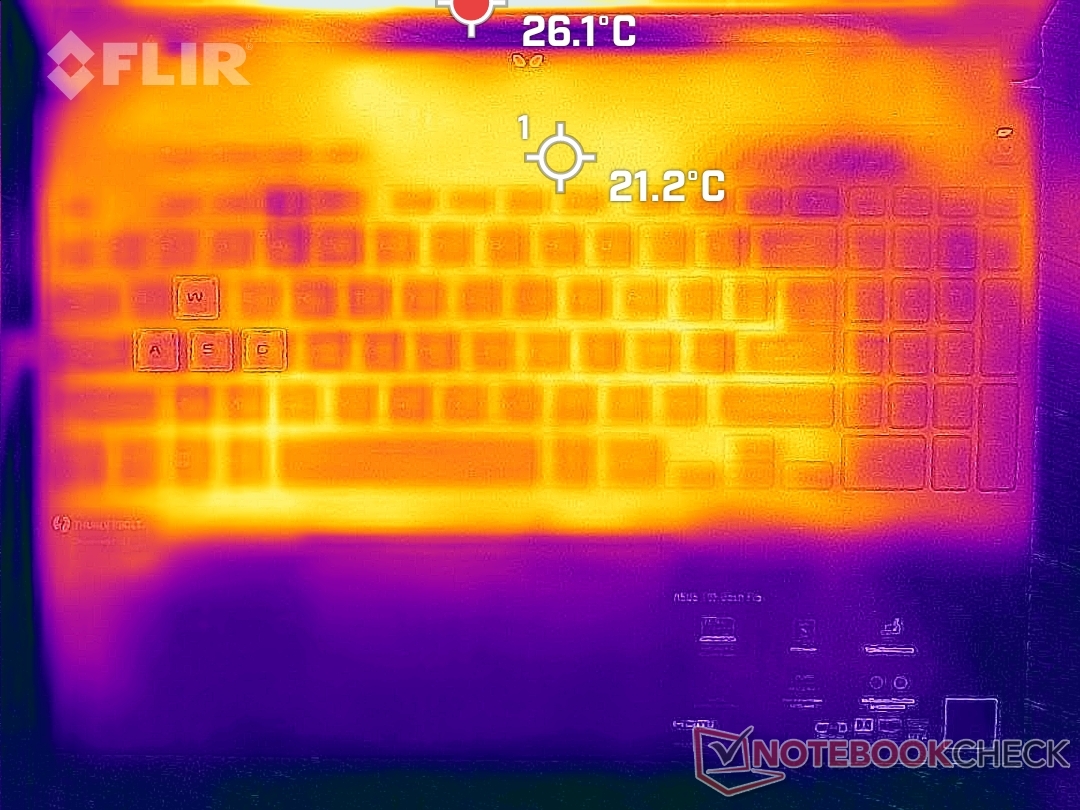
(±) A temperatura máxima no lado superior é 43.4 °C / 110 F, em comparação com a média de 40.4 °C / 105 F , variando de 21.2 a 68.8 °C para a classe Gaming.
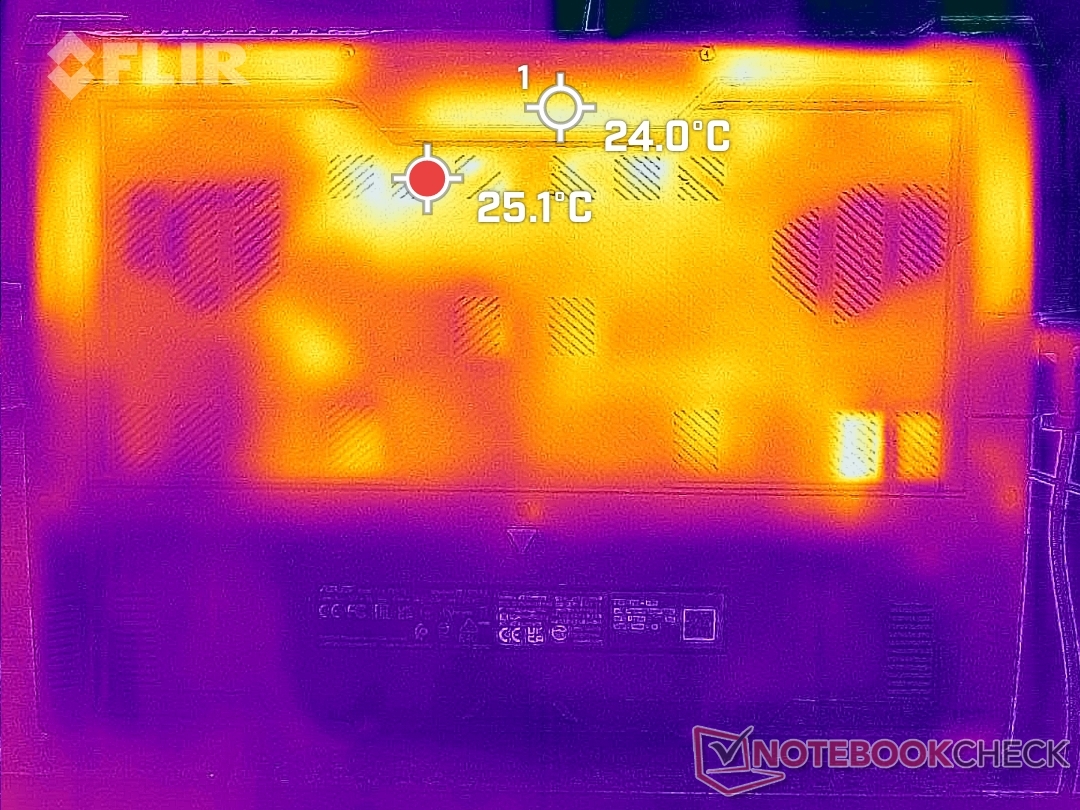
(±) A parte inferior aquece até um máximo de 44.4 °C / 112 F, em comparação com a média de 43.2 °C / 110 F
(+) Em uso inativo, a temperatura média para o lado superior é 19.2 °C / 67 F, em comparação com a média do dispositivo de 33.9 °C / ### class_avg_f### F.
(+) Jogando The Witcher 3, a temperatura média para o lado superior é 26.3 °C / 79 F, em comparação com a média do dispositivo de 33.9 °C / ## #class_avg_f### F.
(+) Os apoios para as mãos e o touchpad são mais frios que a temperatura da pele, com um máximo de 19.4 °C / 66.9 F e, portanto, são frios ao toque.
(+) A temperatura média da área do apoio para as mãos de dispositivos semelhantes foi 28.8 °C / 83.8 F (+9.4 °C / 16.9 F).
| Asus TUF Dash F15 FX517ZC Intel Core i7-12650H, NVIDIA GeForce RTX 3050 4GB Laptop GPU | Asus TUF Dash F15 FX517ZR Intel Core i7-12650H, NVIDIA GeForce RTX 3070 Laptop GPU | Dell G15 5510 Intel Core i5-10500H, NVIDIA GeForce RTX 3050 4GB Laptop GPU | MSI Bravo 15 B5DD-010US AMD Ryzen 5 5600H, AMD Radeon RX 5500M | Lenovo Ideapad Gaming 3 15IHU-82K1002RGE Intel Core i5-11300H, NVIDIA GeForce RTX 3050 Ti Laptop GPU | Gigabyte G5 GD Intel Core i5-11400H, NVIDIA GeForce RTX 3050 4GB Laptop GPU | |
|---|---|---|---|---|---|---|
| Heat | -36% | -15% | -32% | -10% | -20% | |
| Maximum Upper Side * (°C) | 43.4 | 52 -20% | 52 -20% | 52.2 -20% | 43.2 -0% | 45 -4% |
| Maximum Bottom * (°C) | 44.4 | 52 -17% | 49 -10% | 48.6 -9% | 47.9 -8% | 50 -13% |
| Idle Upper Side * (°C) | 21.2 | 33 -56% | 26 -23% | 38 -79% | 24.9 -17% | 28 -32% |
| Idle Bottom * (°C) | 24 | 36 -50% | 26 -8% | 28.4 -18% | 27 -13% | 31 -29% |
* ... menor é melhor
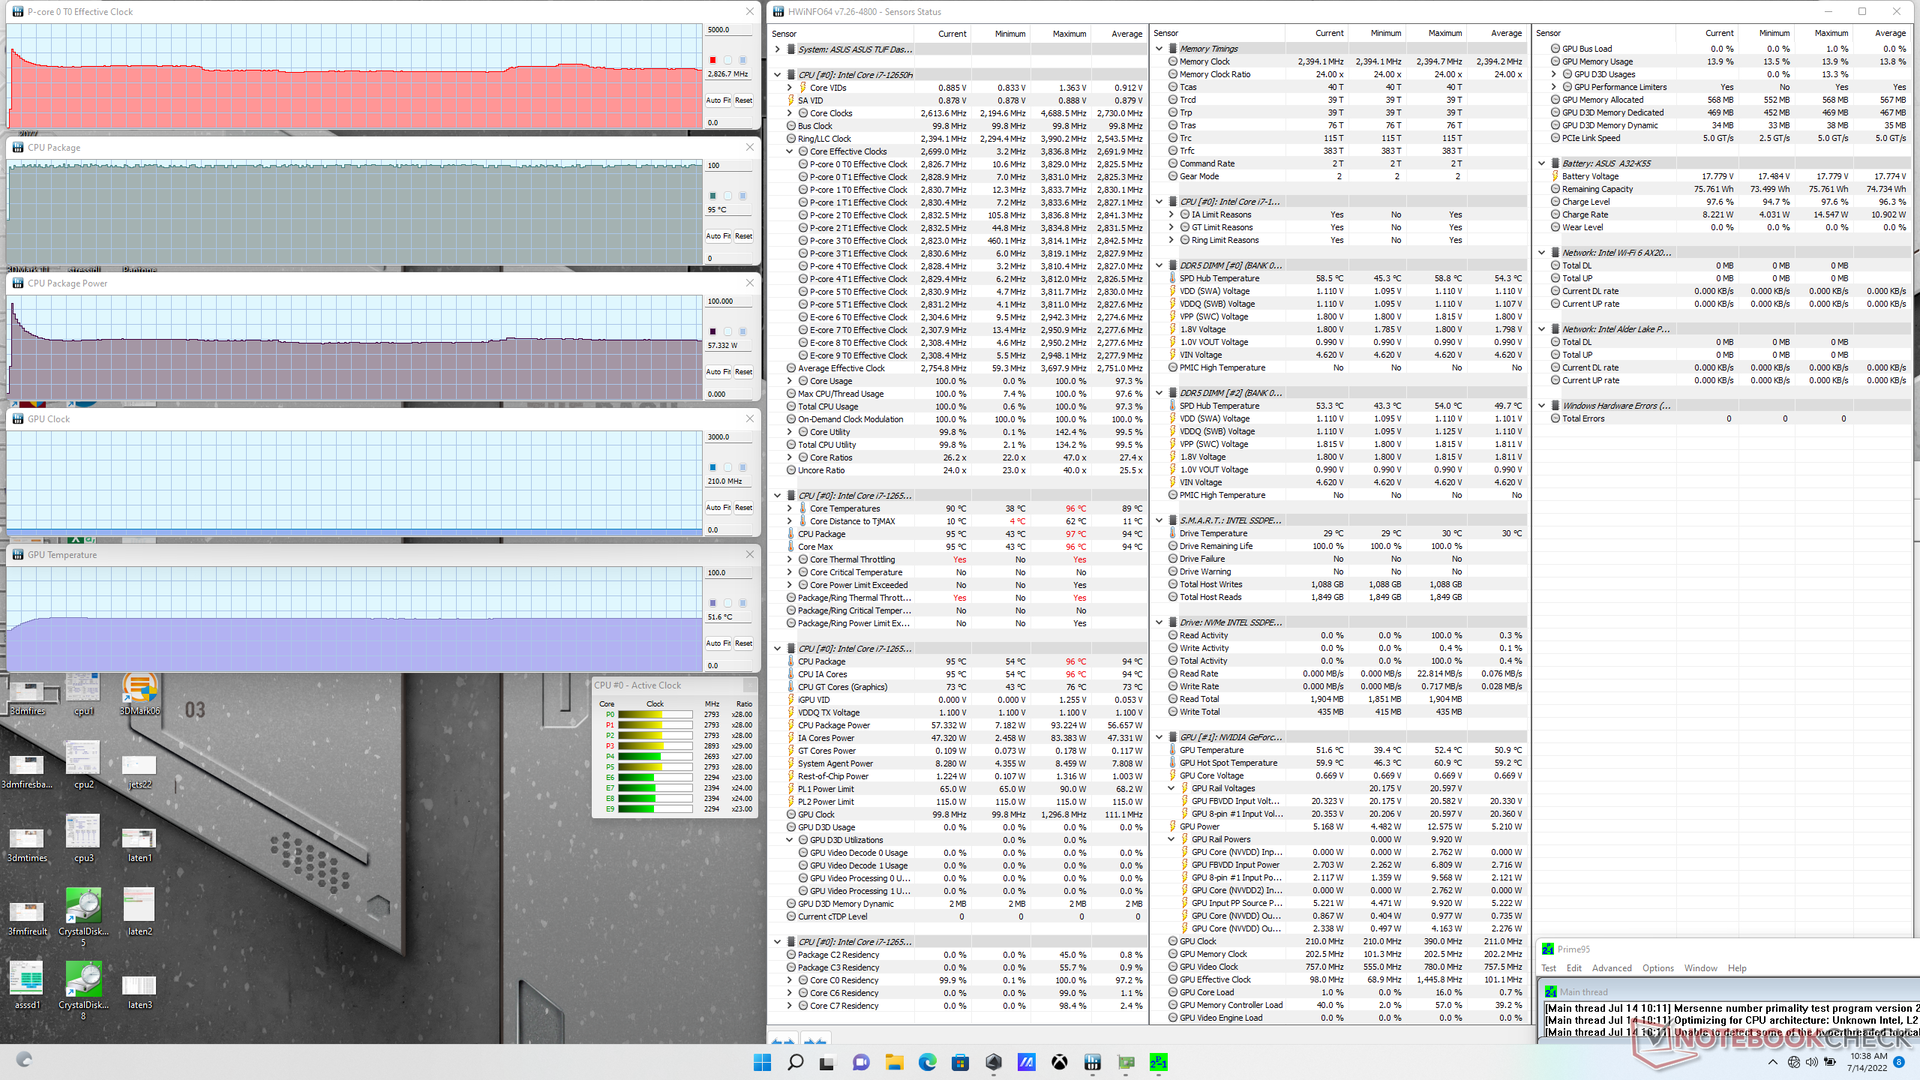
Teste de estresse
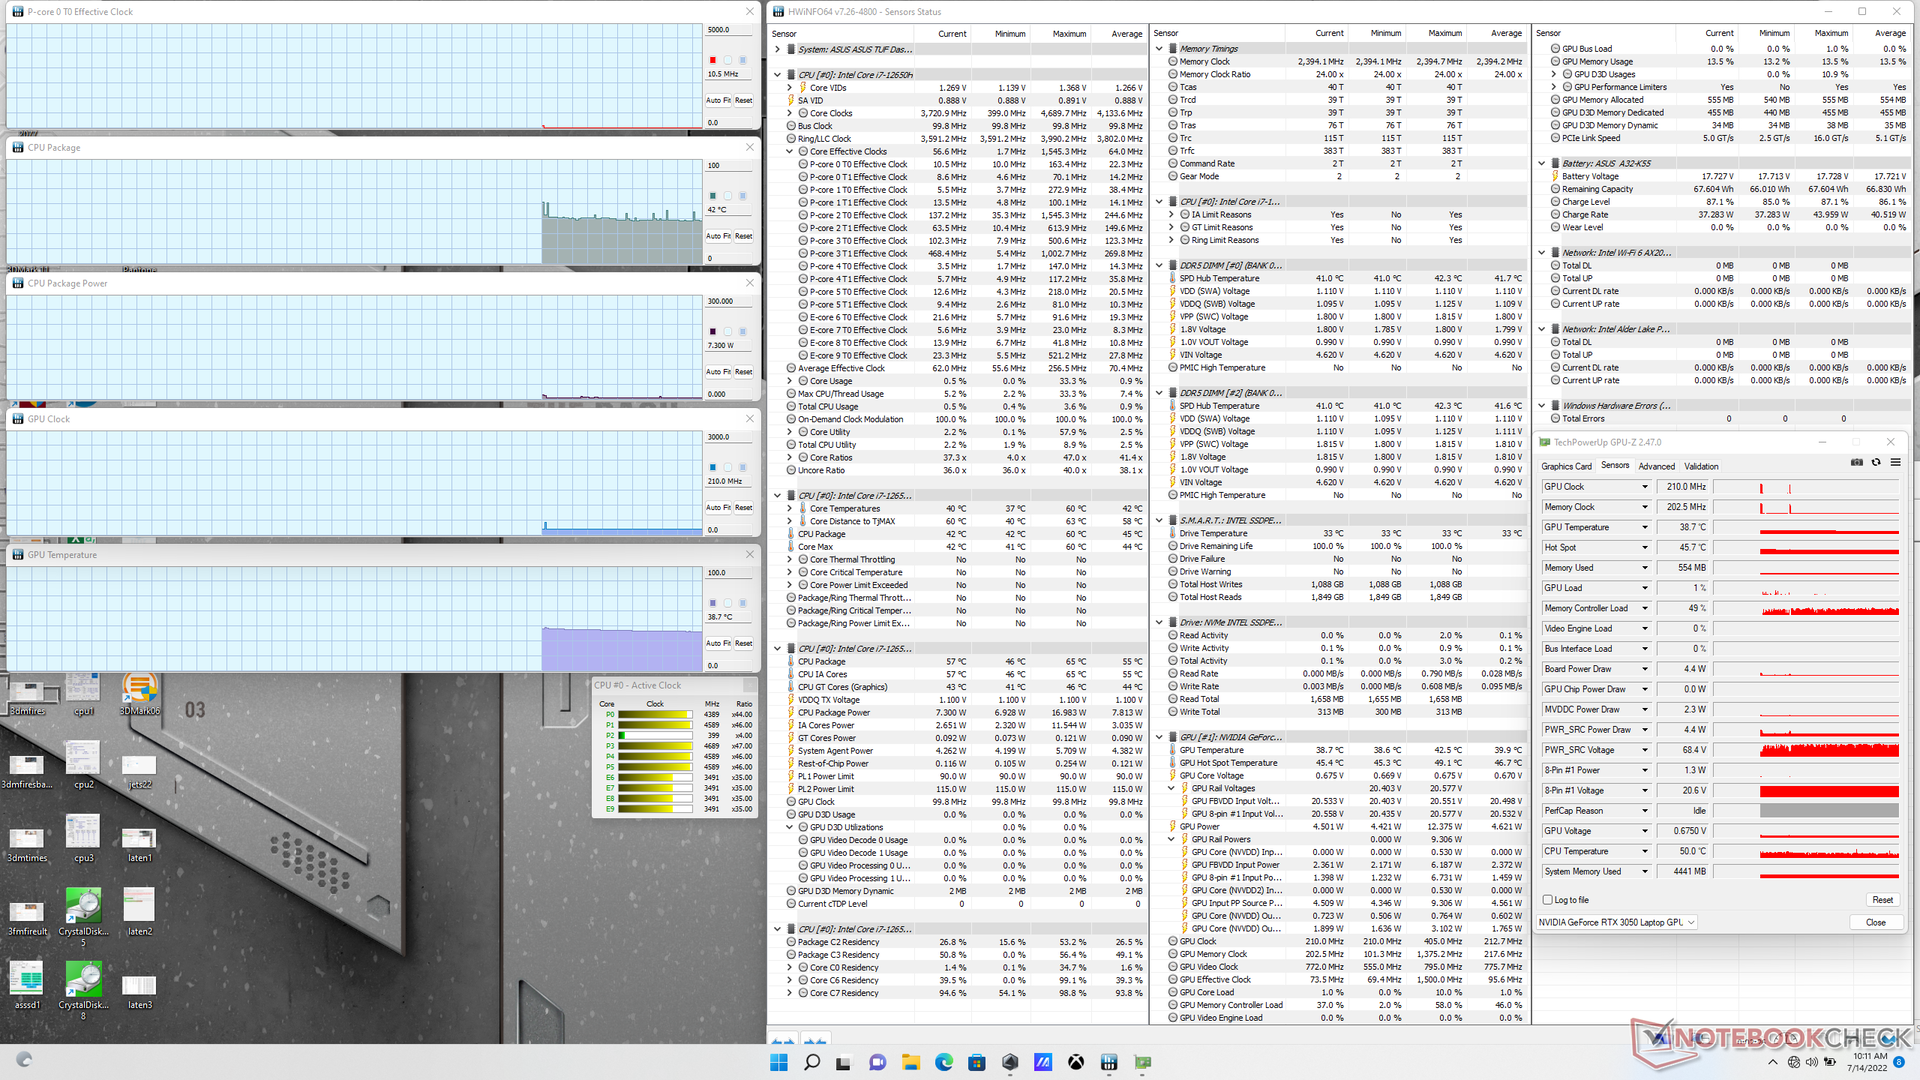
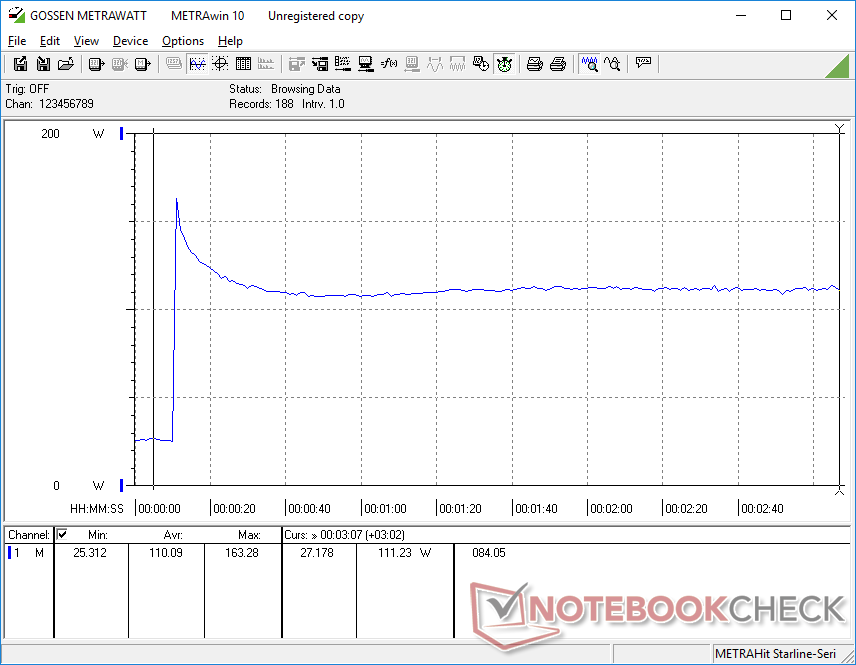
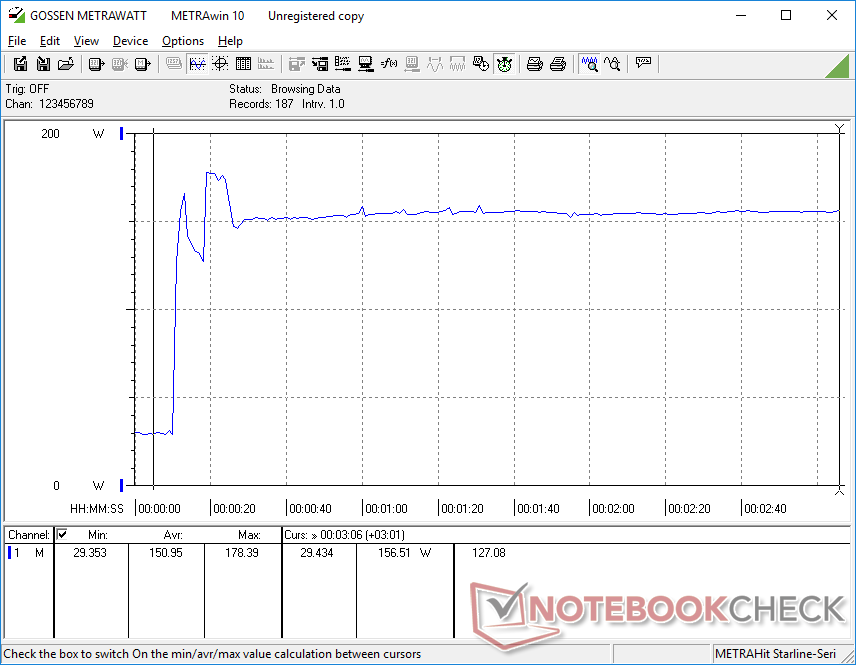
As taxas de relógio da CPU, a temperatura central e o consumo de energia da embalagem aumentariam para 3,7 GHz, 95 C e 93 W, respectivamente, ao iniciar a tensão Prime95. Entretanto, as taxas de relógio começariam a cair imediatamente antes de eventualmente se estabilizarem em 2,9 GHz e um consumo de energia de 57 W, a fim de evitar que as temperaturas centrais atingissem temperaturas mais altas. É claro que a solução de resfriamento é um fator limitante para um maior desempenho da CPU.
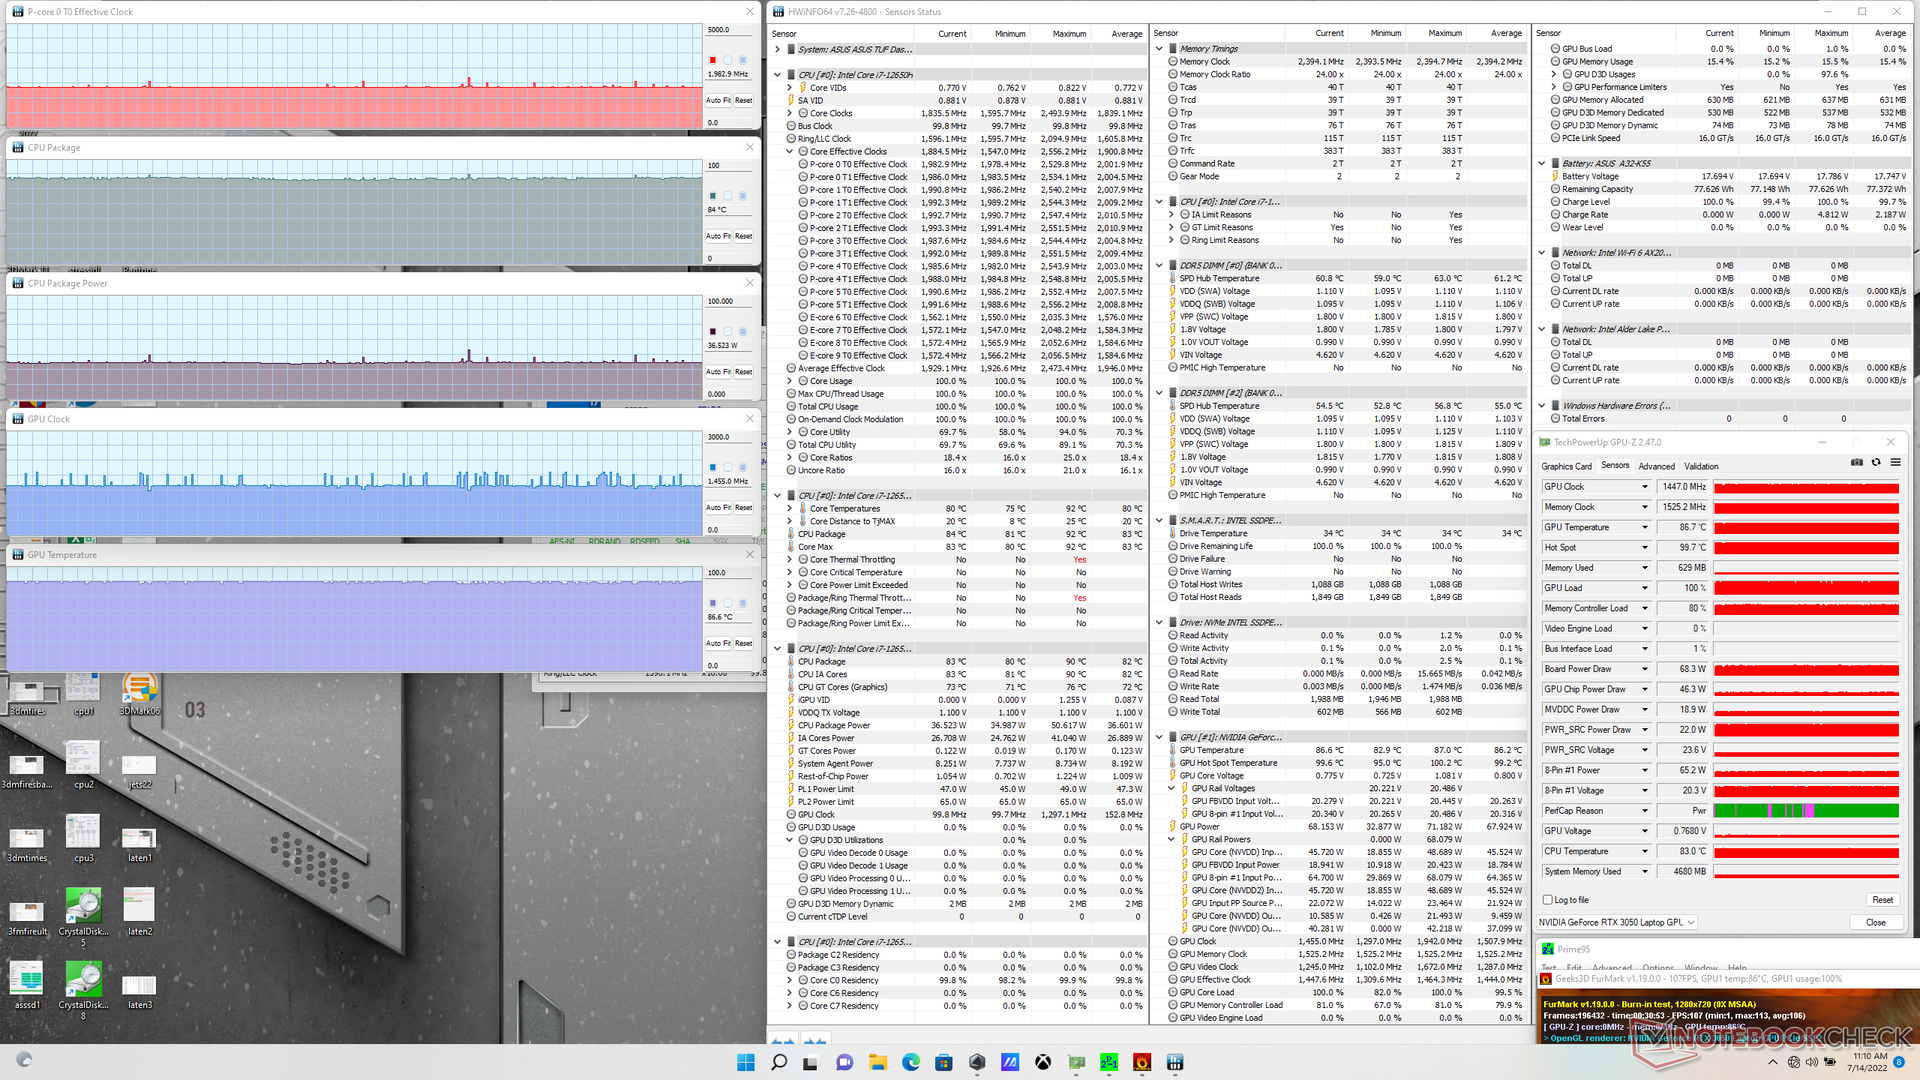
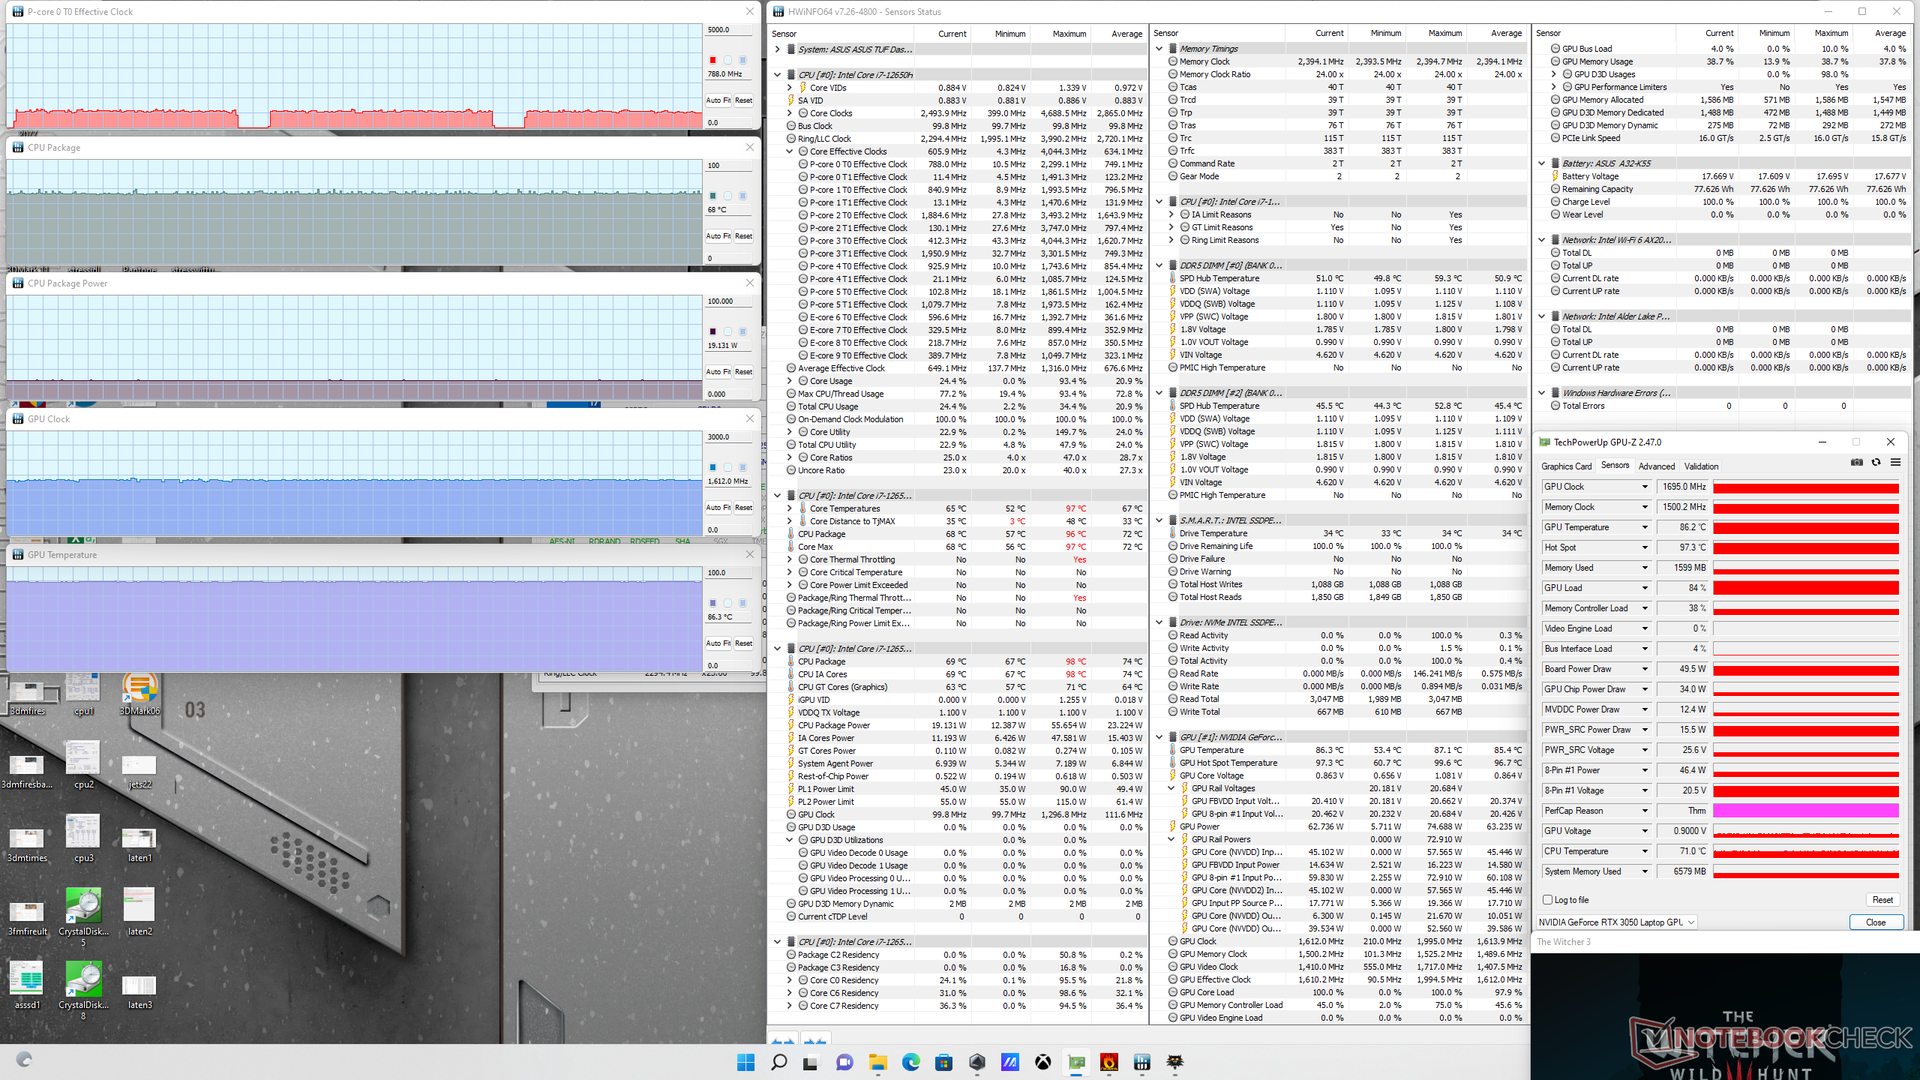
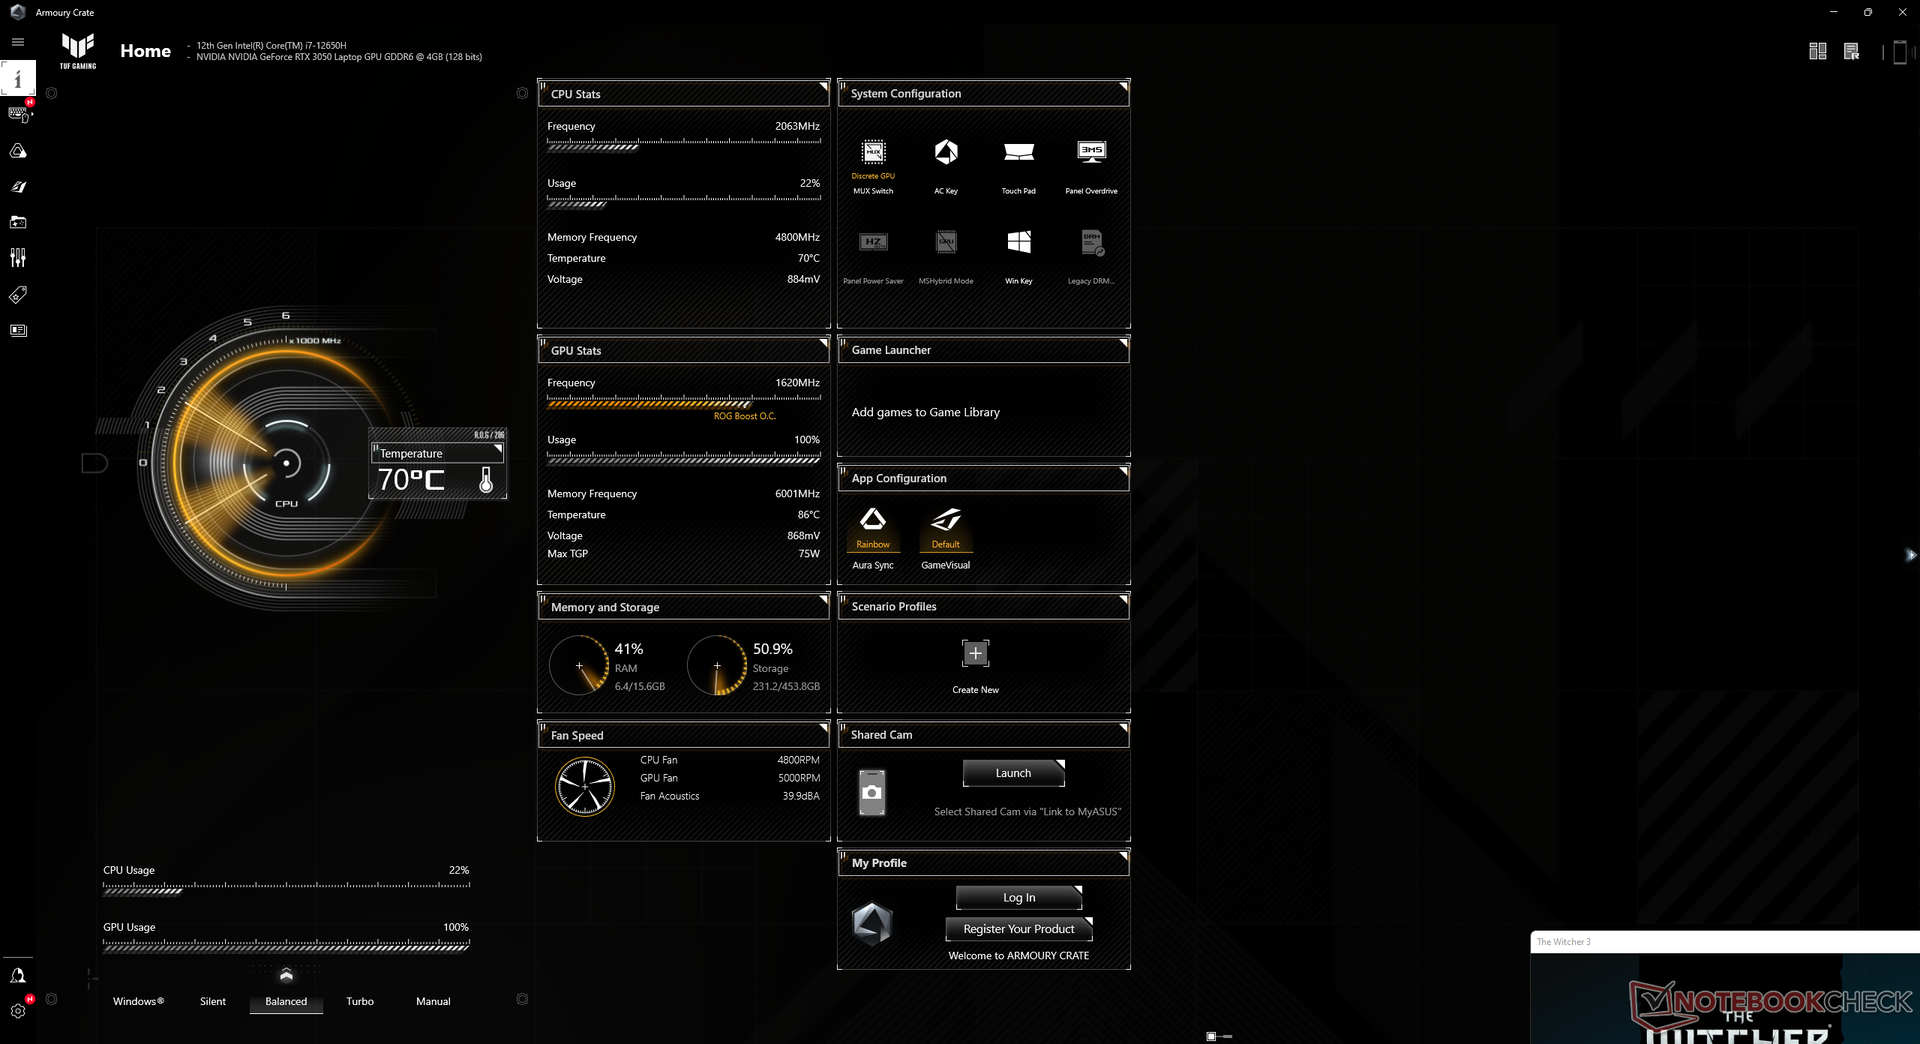
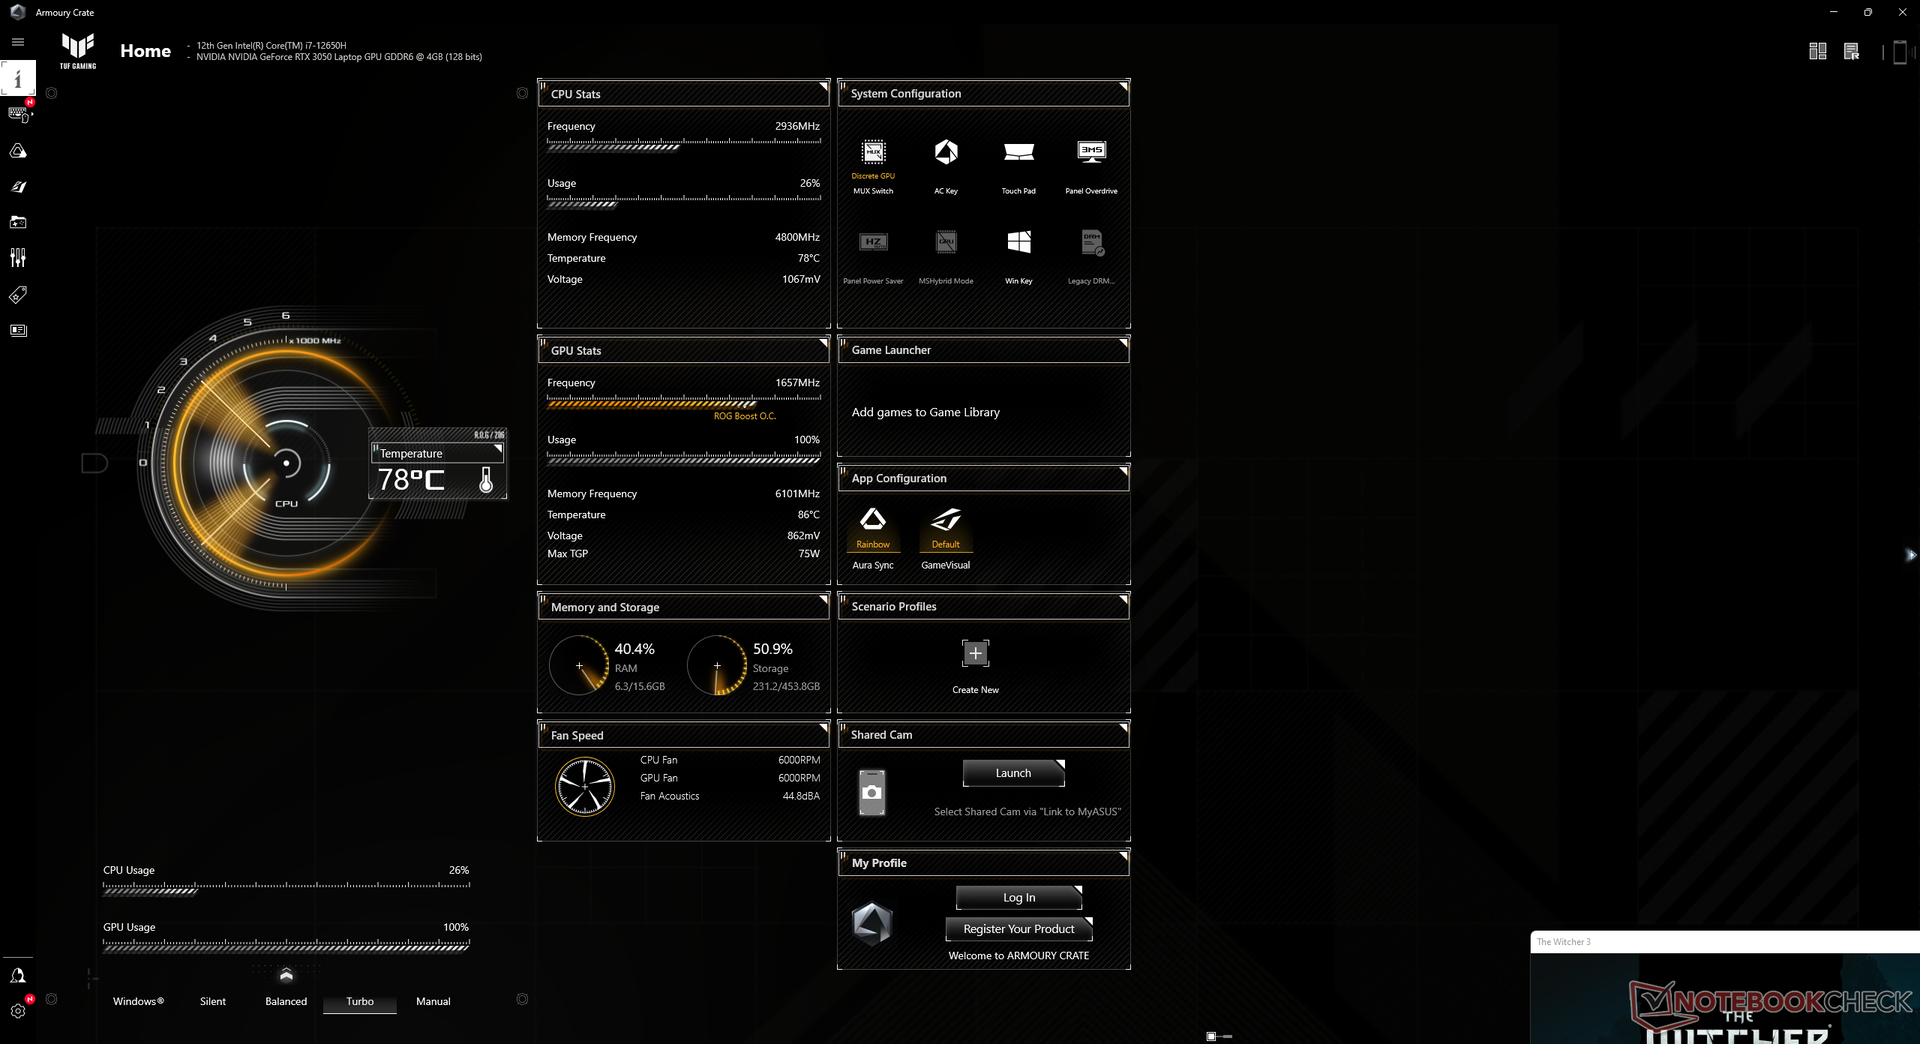
O relógio GPU, relógio de memória e temperatura central estabilizariam em 1612 MHz, 1500 MHz e 86 C, respectivamente, quando em funcionamento Witcher 3 no perfil de potência balanceada. O relógio GPU e o relógio de memória aumentariam apenas ligeiramente se funcionando no modo Turbo, mas a temperatura GPU permaneceria a mesma, já que o ruído do ventilador é maior no modo Turbo, conforme observado acima, para compensar os relógios mais altos. Note que tanto a potência da GPU quanto a da CPU aumentariam de 50 W para 65 W e 19 W para 28 W, respectivamente, quando em funcionamento Witcher 3 no modo Turbo.
A temperatura da GPU quando o jogo é tão quente quanto na FX517ZR, embora nossa GPU seja muito mais lenta.
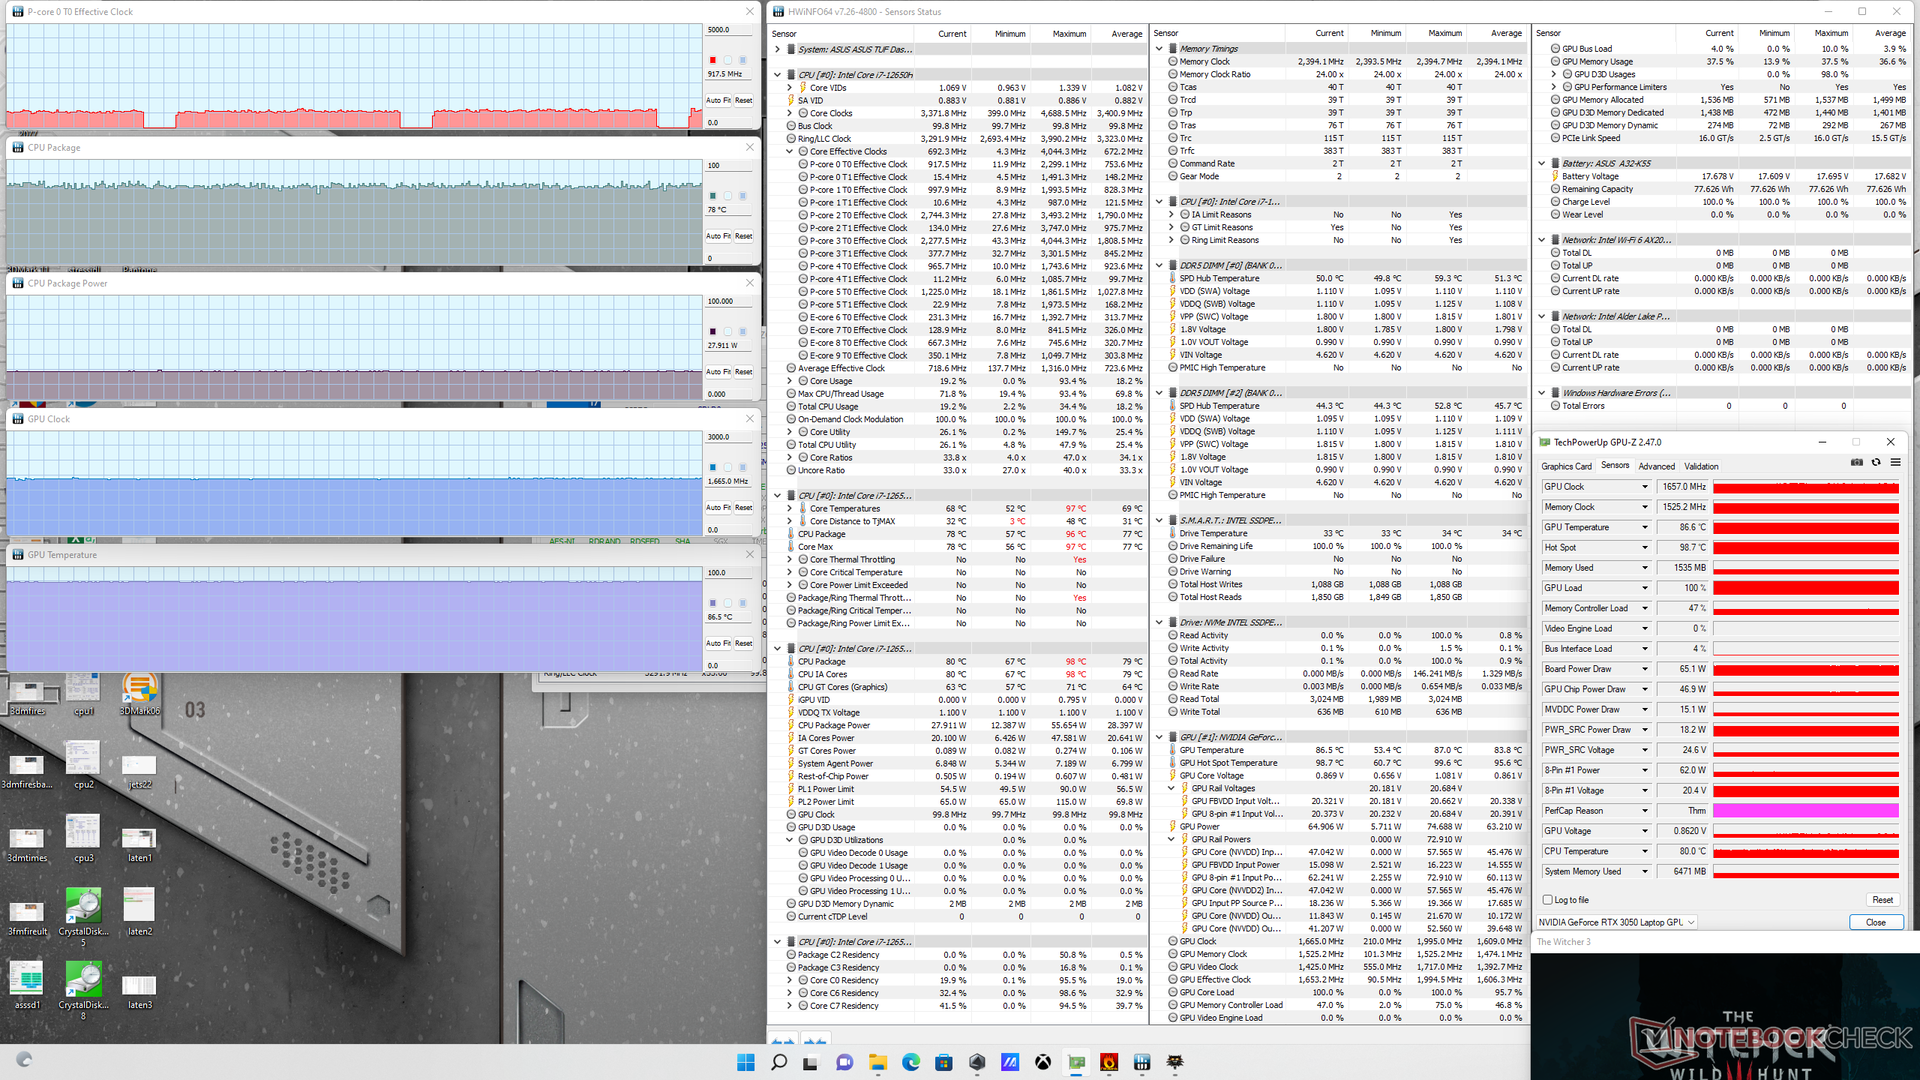
| Relógio CPU (GHz) | Relógio GPU (MHz) | Temperatura média da CPU (°C) | Temperatura média da GPU (°C) | |
| System Idle | -- | -- | 42 | 39 |
| Prime95 Stress | ~2.9 | -- | 95 | 52 |
| Prime95 + FurMark Stress | 2.0 | 1455 | 84 | 87 |
| Witcher 3 Stress (modo equilibrado) | ~0.8 | 1612 | 68 | 86 |
| Witcher 3 Stress (modo Turbo) | ~0.9 | 1665 | 78 | 86 |
Oradores
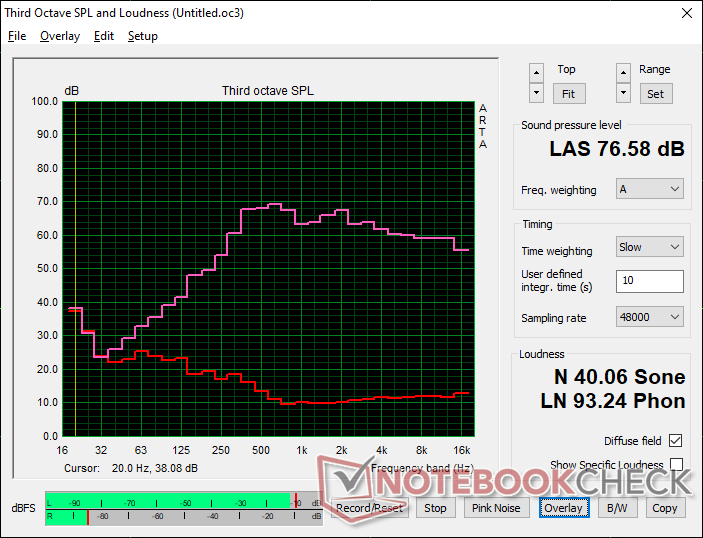
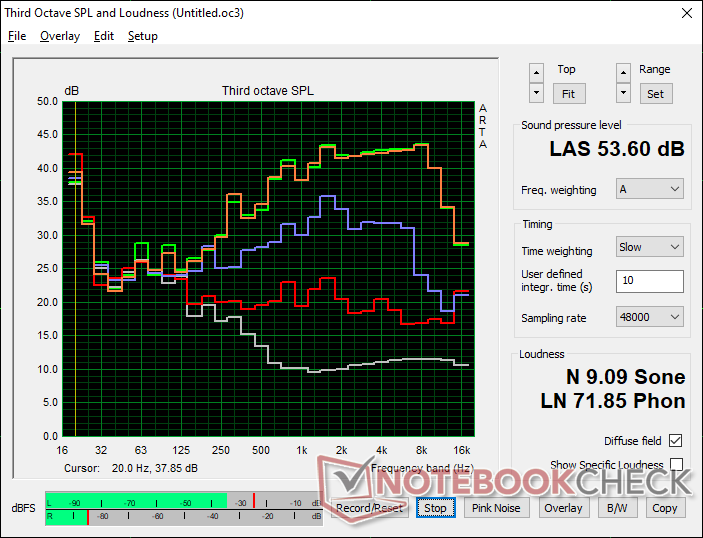
Asus TUF Dash F15 FX517ZC análise de áudio
(±) | o volume do alto-falante é médio, mas bom (###valor### dB)
Graves 100 - 315Hz
(±) | graves reduzidos - em média 11.8% menor que a mediana
(±) | a linearidade dos graves é média (8.6% delta para a frequência anterior)
Médios 400 - 2.000 Hz
(±) | médios mais altos - em média 6.1% maior que a mediana
(+) | médios são lineares (4.9% delta para frequência anterior)
Altos 2 - 16 kHz
(+) | agudos equilibrados - apenas 1.6% longe da mediana
(+) | os máximos são lineares (2.8% delta da frequência anterior)
Geral 100 - 16.000 Hz
(+) | o som geral é linear (14.2% diferença em relação à mediana)
Comparado com a mesma classe
» 25% de todos os dispositivos testados nesta classe foram melhores, 7% semelhantes, 68% piores
» O melhor teve um delta de 6%, a média foi 18%, o pior foi 132%
Comparado com todos os dispositivos testados
» 17% de todos os dispositivos testados foram melhores, 4% semelhantes, 79% piores
» O melhor teve um delta de 4%, a média foi 23%, o pior foi 134%
Apple MacBook Pro 16 2021 M1 Pro análise de áudio
(+) | os alto-falantes podem tocar relativamente alto (###valor### dB)
Graves 100 - 315Hz
(+) | bons graves - apenas 3.8% longe da mediana
(+) | o baixo é linear (5.2% delta para a frequência anterior)
Médios 400 - 2.000 Hz
(+) | médios equilibrados - apenas 1.3% longe da mediana
(+) | médios são lineares (2.1% delta para frequência anterior)
Altos 2 - 16 kHz
(+) | agudos equilibrados - apenas 1.9% longe da mediana
(+) | os máximos são lineares (2.7% delta da frequência anterior)
Geral 100 - 16.000 Hz
(+) | o som geral é linear (4.6% diferença em relação à mediana)
Comparado com a mesma classe
» 0% de todos os dispositivos testados nesta classe foram melhores, 0% semelhantes, 100% piores
» O melhor teve um delta de 5%, a média foi 17%, o pior foi 45%
Comparado com todos os dispositivos testados
» 0% de todos os dispositivos testados foram melhores, 0% semelhantes, 100% piores
» O melhor teve um delta de 4%, a média foi 23%, o pior foi 134%
Gestão de energia - Ainda faminto de energia
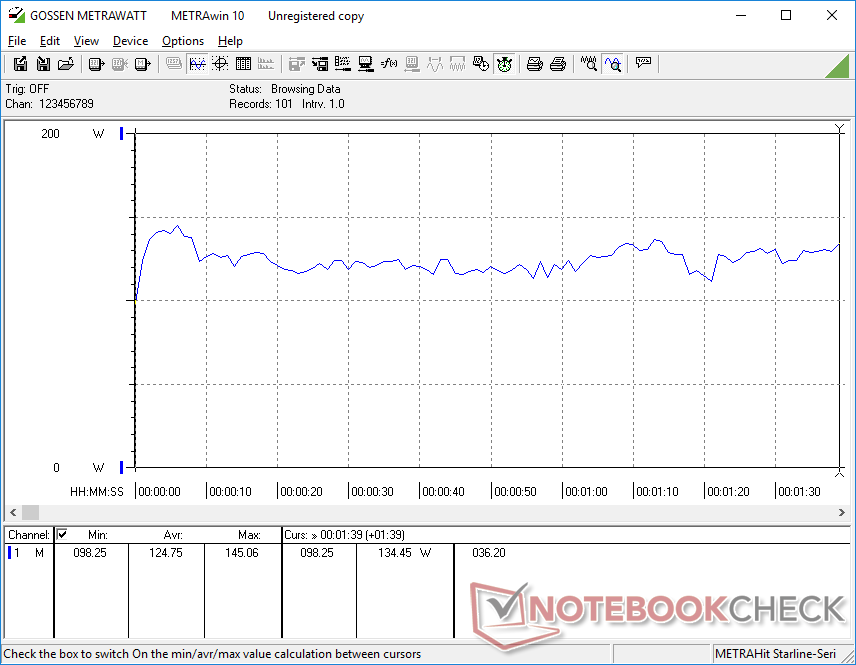
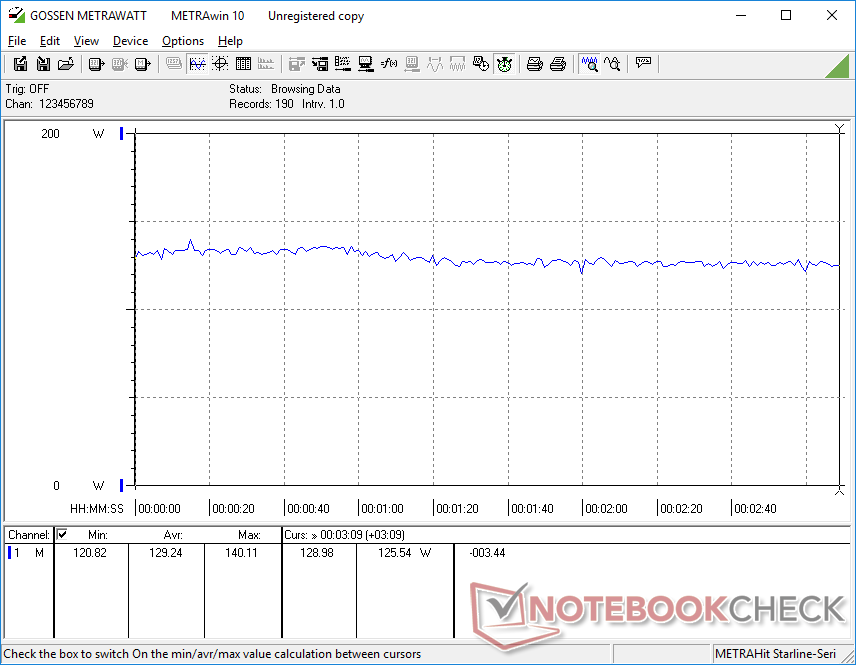
Consumo de energia
Se o RTX 3050 é 40% mais lento que o RTX 3070, isso significa que podemos esperar que o consumo de energia seja 40% mais baixo também? Infelizmente, nossa FX517ZC exigiria apenas 7% menos do que a FX517ZR ao rodar os mesmos jogos nas mesmas configurações gráficas
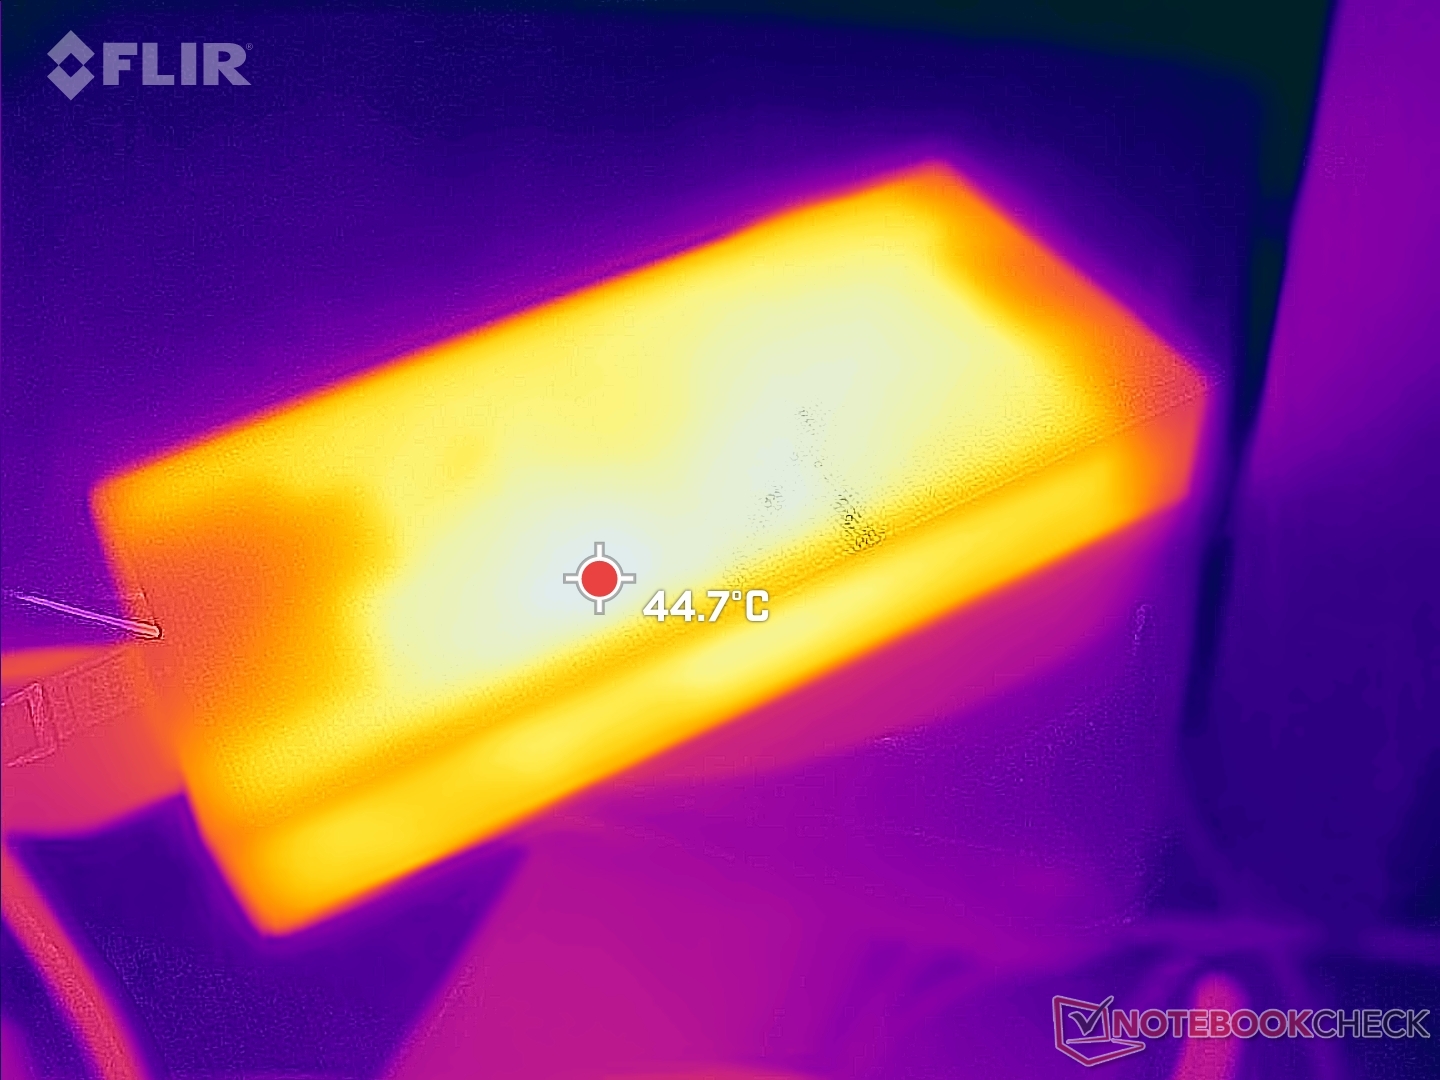
Note que a FX517ZC é fornecida com um adaptador AC de 180 W (~15 x 7,2 x 2,3 cm) enquanto que a FX517ZR é fornecida com um adaptador de 200 W ligeiramente maior.
| desligado | |
| Ocioso | |
| Carga |
|
Key:
min: | |
| Asus TUF Dash F15 FX517ZC i7-12650H, GeForce RTX 3050 4GB Laptop GPU, Intel SSD 670p SSDPEKNU512GZ, IPS, 2560x1440, 15.6" | Asus TUF Dash F15 FX517ZR i7-12650H, GeForce RTX 3070 Laptop GPU, Samsung PM991a MZVLQ1T0HBLB, IPS, 2560x1440, 15.6" | Dell G15 5510 i5-10500H, GeForce RTX 3050 4GB Laptop GPU, SK Hynix BC711 HFM512GD3HX015N, IPS, 1920x1080, 15.6" | MSI Bravo 15 B5DD-010US R5 5600H, Radeon RX 5500M, Kingston OM8PCP3512F-AB, IPS, 1920x1080, 15.6" | Lenovo Ideapad Gaming 3 15IHU-82K1002RGE i5-11300H, GeForce RTX 3050 Ti Laptop GPU, Micron 2210 MTFDHBA512QFD, IPS, 1920x1080, 15.6" | Gigabyte G5 GD i5-11400H, GeForce RTX 3050 4GB Laptop GPU, ESR512GTLG-E6GBTNB4, IPS, 1920x1080, 15.6" | |
|---|---|---|---|---|---|---|
| Power Consumption | 4% | 28% | 33% | 35% | 6% | |
| Idle Minimum * (Watt) | 9.2 | 10 -9% | 3 67% | 6.6 28% | 4.9 47% | 13 -41% |
| Idle Average * (Watt) | 15.9 | 14 12% | 8 50% | 9.8 38% | 8.3 48% | 15 6% |
| Idle Maximum * (Watt) | 29.5 | 20 32% | 13 56% | 10.8 63% | 8.9 70% | 20 32% |
| Load Average * (Watt) | 124.8 | 122 2% | 103 17% | 70.5 44% | 81 35% | 102 18% |
| Witcher 3 ultra * (Watt) | 129.2 | 138.6 -7% | 139.5 -8% | 103.2 20% | 119 8% | 124 4% |
| Load Maximum * (Watt) | 178.4 | 189 -6% | 204 -14% | 175 2% | 172 4% | 148 17% |
* ... menor é melhor
Power Consumption Witcher 3 / Stresstest
Power Consumption external Monitor
Vida útil da bateria - Não tão longa
A vida útil da bateria é menor do que o esperado, mas esperamos que seja um bug. Quando ajustado ao perfil de potência balanceado com a GPU integrada ativa via MSHybrid, só conseguimos gravar um tempo de execução de apenas 4 horas em comparação com 7 horas na FX517ZR. Os resultados não melhorariam mesmo após a repetição do teste.
| Asus TUF Dash F15 FX517ZC i7-12650H, GeForce RTX 3050 4GB Laptop GPU, 76 Wh | Asus TUF Dash F15 FX517ZR i7-12650H, GeForce RTX 3070 Laptop GPU, 76 Wh | Dell G15 5510 i5-10500H, GeForce RTX 3050 4GB Laptop GPU, 56 Wh | MSI Bravo 15 B5DD-010US R5 5600H, Radeon RX 5500M, 53 Wh | Lenovo Ideapad Gaming 3 15IHU-82K1002RGE i5-11300H, GeForce RTX 3050 Ti Laptop GPU, 45 Wh | Gigabyte G5 GD i5-11400H, GeForce RTX 3050 4GB Laptop GPU, 41 Wh | |
|---|---|---|---|---|---|---|
| Duração da bateria | 75% | 50% | 58% | 65% | -22% | |
| WiFi v1.3 (h) | 4 | 7 75% | 6 50% | 6.3 58% | 6.6 65% | 3.1 -22% |
| Reader / Idle (h) | 10.8 | 11.3 | 9.2 | 5.7 | ||
| H.264 (h) | 5.8 | 7.7 | 3.6 | |||
| Load (h) | 2.3 | 1 | 1 | 1.1 | 1.1 |
Pro
Contra
Veredicto - Preço de entrada com excelente exibição de alto nível
Além da óbvia economia de preço, pode-se preferir laptops para jogos de nível básico para seus ventiladores mais silenciosos, temperaturas mais baixas, maior vida útil da bateria e menor consumo de energia quando comparado com as opções mais potentes de alta tecnologia. Assim, esperávamos que o Asus TUF Dash F15 FX517ZC e seu RTX 3050 fosse mais silencioso, mais frio, mais duradouro e menos exigente do que seu equivalente TUF Dash F15 FX517ZR RTX 3070. A realidade é que quaisquer diferenças entre a FX517ZC e a FX517ZR em termos de temperatura, consumo de energia e ruído são infelizmente menores em relação à grande diferença de desempenho da GPU entre elas. Em outras palavras, se você esperava que a FX517ZC fosse visivelmente mais silenciosa, mais fria e mais duradoura do que suas configurações superiores, então você pode ficar desapontado.
O Asus TUF Dash F15 FX517ZC vem com um visor IPS 1440p165 melhor do que o esperado para sua faixa de preço. O consumo de energia, o ruído do ventilador e a vida útil da bateria, no entanto, não são melhores do que os modelos mais rápidos e de maior durabilidade.
Para um laptop para jogos básico, porém, a FX517ZC ainda é muito boa, pois não economiza na tela, memória RAM ou CPU, que muitos outros laptops para jogos tendem a fazer no valor de US$ 1000 e abaixo do alcance. O painel 1440p oferece cobertura total P3, tempos de resposta rápidos, sincronização adaptativa e 165 Hz, o que é uma raridade em um sistema de orçamento. A CPU do 12º gênero Core i7-12650H, embora não seja tão diferente do 11º gênero Core i7-11800H, se conjuga bem com a GPU RTX 3050 acessível neste caso.
Preço e Disponibilidade
A série Asus TUF Dash F15 FX517 está agora amplamente disponível online. Entretanto, nossa SKU RTX 3050 específica é incomum. Os usuários encontrarão as configurações RTX 3050 Ti, RTX 3060, e RTX 3070 mais prontamente disponíveis a partir desta escrita. A configuração do RTX 3060 pode ser encontrada em na Amazon por $1070 USD enquanto o RTX 3050 Ti pode ser encontrado em Best Buy por $1200.
Asus TUF Dash F15 FX517ZC
- 08/08/2022 v7 (old)
Allen Ngo
Price comparison

