Breve Análise do Portátil LG Gram 14Z980 (i5-8250U)
| SD Card Reader | |
| average JPG Copy Test (av. of 3 runs) | |
| Lenovo ThinkPad X1 Carbon 2018-20KGS03900 (Toshiba Exceria Pro M501) | |
| Dell XPS 13 9380 2019 (Toshiba Exceria Pro SDXC 64 GB UHS-II) | |
| LG Gram 14Z980-U.AAW5U1 (Toshiba Exceria Pro M501 microSDXC 64GB) | |
| Asus Zenbook 14 UX433FN-A6023T (Toshiba Exceria Pro M501 microSDXC 64GB) | |
| maximum AS SSD Seq Read Test (1GB) | |
| Lenovo ThinkPad X1 Carbon 2018-20KGS03900 (Toshiba Exceria Pro M501) | |
| Dell XPS 13 9380 2019 (Toshiba Exceria Pro SDXC 64 GB UHS-II) | |
| LG Gram 14Z980-U.AAW5U1 (Toshiba Exceria Pro M501 microSDXC 64GB) | |
| Asus Zenbook 14 UX433FN-A6023T (Toshiba Exceria Pro M501 microSDXC 64GB) | |
| Networking | |
| iperf3 transmit AX12 | |
| Lenovo Yoga C930-13IKB | |
| Dell XPS 13 9380 2019 | |
| Huawei Matebook X Pro i5 | |
| LG Gram 14Z980-U.AAW5U1 | |
| iperf3 receive AX12 | |
| Huawei Matebook X Pro i5 | |
| LG Gram 14Z980-U.AAW5U1 | |
| Lenovo Yoga C930-13IKB | |
| Dell XPS 13 9380 2019 | |
| |||||||||||||||||||||||||
iluminação: 83 %
iluminação com acumulador: 333.8 cd/m²
Contraste: 835:1 (Preto: 0.4 cd/m²)
ΔE ColorChecker Calman: 3.54 | ∀{0.5-29.43 Ø4.71}
calibrated: 2.36
ΔE Greyscale Calman: 4.7 | ∀{0.09-98 Ø4.96}
94.7% sRGB (Argyll 1.6.3 3D)
61.2% AdobeRGB 1998 (Argyll 1.6.3 3D)
66% AdobeRGB 1998 (Argyll 3D)
94.3% sRGB (Argyll 3D)
64.7% Display P3 (Argyll 3D)
Gamma: 2.14
CCT: 6261 K
| LG Gram 14Z980-U.AAW5U1 LG Philips LP140WF7-SPG1, IPS, 14", 1920x1080 | Dell XPS 13 9380 2019 ID: AUO 282B B133ZAN Dell: 90NTH, IPS, 13.3", 3840x2160 | Huawei Matebook X Pro i5 Tianma XM, IPS, 13.9", 3000x2000 | HP Spectre x360 13t-ae000 LGD0588, IPS, 13.3", 3840x2160 | Asus Zenbook 14 UX433FN-A6023T AU Optronics B140HAN03.2, IPS, 14", 1920x1080 | Lenovo Yoga C930-13IKB B139HAN03_0, IPS, 13.9", 1920x1080 | |
|---|---|---|---|---|---|---|
| Display | -1% | 2% | 9% | -3% | -0% | |
| Display P3 Coverage (%) | 64.7 | 64.7 0% | 65.9 2% | 71.9 11% | 64.5 0% | 64.3 -1% |
| sRGB Coverage (%) | 94.3 | 93.1 -1% | 95.2 1% | 98.1 4% | 87.9 -7% | 94.6 0% |
| AdobeRGB 1998 Coverage (%) | 66 | 65.3 -1% | 67.6 2% | 73.1 11% | 64.4 -2% | 66.2 0% |
| Response Times | -39% | 3% | -24% | -12% | -2% | |
| Response Time Grey 50% / Grey 80% * (ms) | 36.8 ? | 58 ? -58% | 40.4 ? -10% | 51.6 ? -40% | 44 ? -20% | 40.8 ? -11% |
| Response Time Black / White * (ms) | 30 ? | 36 ? -20% | 25.6 ? 15% | 32.4 ? -8% | 31 ? -3% | 27.6 ? 8% |
| PWM Frequency (Hz) | ||||||
| Screen | 6% | 12% | 20% | -14% | -20% | |
| Brightness middle (cd/m²) | 333.8 | 404 21% | 442.7 33% | 329.8 -1% | 330 -1% | 316 -5% |
| Brightness (cd/m²) | 307 | 389 27% | 428 39% | 318 4% | 285 -7% | 291 -5% |
| Brightness Distribution (%) | 83 | 85 2% | 84 1% | 74 -11% | 78 -6% | 83 0% |
| Black Level * (cd/m²) | 0.4 | 0.37 7% | 0.31 23% | 0.25 37% | 0.23 43% | 0.36 10% |
| Contrast (:1) | 835 | 1092 31% | 1428 71% | 1319 58% | 1435 72% | 878 5% |
| Colorchecker dE 2000 * | 3.54 | 3.72 -5% | 2.24 37% | 2.37 33% | 5.77 -63% | 5.9 -67% |
| Colorchecker dE 2000 max. * | 5.8 | 7.38 -27% | 7.19 -24% | 4.08 30% | 10.46 -80% | 12.9 -122% |
| Colorchecker dE 2000 calibrated * | 2.36 | 2.06 13% | 1.11 53% | 3.18 -35% | 1.3 45% | |
| Greyscale dE 2000 * | 4.7 | 4.44 6% | 9.7 -106% | 2.8 40% | 7.61 -62% | 8.6 -83% |
| Gamma | 2.14 103% | 2.34 94% | 1.42 155% | 2.145 103% | 2.46 89% | 2.1 105% |
| CCT | 6261 104% | 7095 92% | 6227 104% | 6441 101% | 7485 87% | 6854 95% |
| Color Space (Percent of AdobeRGB 1998) (%) | 61.2 | 60 -2% | 61.6 1% | 67 9% | 57 -7% | 60.7 -1% |
| Color Space (Percent of sRGB) (%) | 94.7 | 93 -2% | 95 0% | 98 3% | 88 -7% | 94.5 0% |
| Média Total (Programa/Configurações) | -11% /
-1% | 6% /
9% | 2% /
12% | -10% /
-12% | -7% /
-14% |
* ... menor é melhor
Exibir tempos de resposta
| ↔ Tempo de resposta preto para branco | ||
|---|---|---|
| 30 ms ... ascensão ↗ e queda ↘ combinadas | ↗ 18.4 ms ascensão | 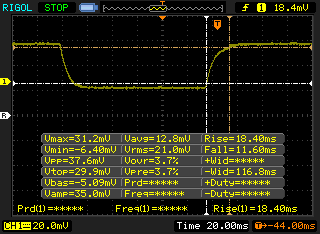 |
| ↘ 11.6 ms queda | ||
| A tela mostra taxas de resposta lentas em nossos testes e será insatisfatória para os jogadores. Em comparação, todos os dispositivos testados variam de 0.1 (mínimo) a 240 (máximo) ms. » 80 % de todos os dispositivos são melhores. Isso significa que o tempo de resposta medido é pior que a média de todos os dispositivos testados (19.8 ms). | ||
| ↔ Tempo de resposta 50% cinza a 80% cinza | ||
| 36.8 ms ... ascensão ↗ e queda ↘ combinadas | ↗ 19.6 ms ascensão | 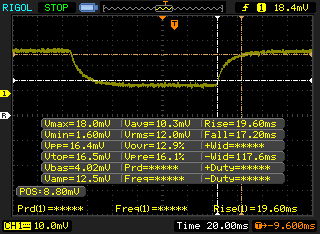 |
| ↘ 17.2 ms queda | ||
| A tela mostra taxas de resposta lentas em nossos testes e será insatisfatória para os jogadores. Em comparação, todos os dispositivos testados variam de 0.165 (mínimo) a 636 (máximo) ms. » 53 % de todos os dispositivos são melhores. Isso significa que o tempo de resposta medido é pior que a média de todos os dispositivos testados (30.9 ms). | ||
Cintilação da tela / PWM (modulação por largura de pulso)
| Tela tremeluzindo / PWM não detectado | 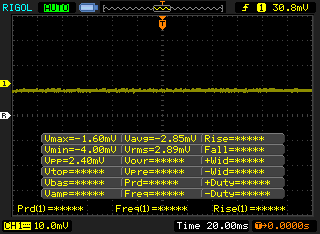 | ||
[pwm_comparison] Em comparação: 52 % de todos os dispositivos testados não usam PWM para escurecer a tela. Se PWM foi detectado, uma média de 7748 (mínimo: 5 - máximo: 343500) Hz foi medida. | |||
| Cinebench R15 | |
| CPU Single 64Bit | |
| Lenovo Yoga 730-15IKB | |
| Acer Aspire 5 A515-52G-53PU | |
| Asus FX503VM-EH73 | |
| Asus Zenbook 14 UX433FN-A6023T | |
| Acer Nitro 5 AN515-42-R6V0 | |
| Lenovo Yoga C930-13IKB | |
| LG Gram 14Z980-U.AAW5U1 | |
| Média Intel Core i5-8250U (81 - 147, n=97) | |
| Asus ZenBook UX530UX-FY070T | |
| Honor Magicbook | |
| CPU Multi 64Bit | |
| Asus FX503VM-EH73 | |
| Lenovo Yoga 730-15IKB | |
| Acer Nitro 5 AN515-42-R6V0 | |
| Lenovo Yoga C930-13IKB | |
| Asus Zenbook 14 UX433FN-A6023T | |
| Honor Magicbook | |
| Média Intel Core i5-8250U (320 - 730, n=101) | |
| Acer Aspire 5 A515-52G-53PU | |
| LG Gram 14Z980-U.AAW5U1 | |
| Asus ZenBook UX530UX-FY070T | |
| Cinebench R10 | |
| Rendering Multiple CPUs 32Bit | |
| Lenovo Yoga 730-15IKB | |
| Asus FX503VM-EH73 | |
| Lenovo Yoga C930-13IKB | |
| Média Intel Core i5-8250U (14148 - 22097, n=42) | |
| Acer Aspire 5 A515-52G-53PU | |
| Asus Zenbook 14 UX433FN-A6023T | |
| Rendering Single 32Bit | |
| Lenovo Yoga 730-15IKB | |
| Asus Zenbook 14 UX433FN-A6023T | |
| Acer Aspire 5 A515-52G-53PU | |
| Asus FX503VM-EH73 | |
| Lenovo Yoga C930-13IKB | |
| Média Intel Core i5-8250U (5349 - 8356, n=42) | |
| wPrime 2.10 - 1024m | |
| Acer Aspire 5 A515-52G-53PU | |
| Asus Zenbook 14 UX433FN-A6023T | |
| Média Intel Core i5-8250U (243 - 402, n=13) | |
| Asus FX503VM-EH73 | |
* ... menor é melhor
| PCMark 8 Home Score Accelerated v2 | 3218 pontos | |
| PCMark 8 Work Score Accelerated v2 | 4520 pontos | |
| PCMark 10 Score | 3463 pontos | |
Ajuda | ||
| LG Gram 14Z980-U.AAW5U1 SK Hynix SC313 HFS256G39TNF | Dell XPS 13 9380 2019 SK hynix PC401 HFS256GD9TNG | Huawei Matebook X Pro i5 Samsung PM961 MZVLW256HEHP | Asus Zenbook 14 UX433FN-A6023T Intel SSD 660p SSDPEKNW512G8 | Lenovo ThinkPad X1 Carbon 2018-20KGS03900 Samsung SSD PM981 MZVLB512HAJQ | |
|---|---|---|---|---|---|
| AS SSD | 55% | 104% | 68% | 188% | |
| Seq Read (MB/s) | 476.1 | 2035 327% | 2416 407% | 1501 215% | 2396 403% |
| Seq Write (MB/s) | 487.4 | 658 35% | 1170 140% | 630 29% | 1376 182% |
| 4K Read (MB/s) | 30.57 | 39.74 30% | 48.33 58% | 47.38 55% | 52.4 71% |
| 4K Write (MB/s) | 66.1 | 105.7 60% | 103.1 56% | 125.9 90% | 134.3 103% |
| 4K-64 Read (MB/s) | 352.9 | 461 31% | 1039 194% | 321.4 -9% | 876 148% |
| 4K-64 Write (MB/s) | 263.1 | 300.1 14% | 399.6 52% | 772 193% | 1529 481% |
| Access Time Read * (ms) | 0.092 | 0.061 34% | 0.058 37% | 0.091 1% | 0.029 68% |
| Access Time Write * (ms) | 0.055 | 0.051 7% | 0.036 35% | 0.046 16% | 0.027 51% |
| Score Read (Points) | 431 | 704 63% | 1329 208% | 519 20% | 1168 171% |
| Score Write (Points) | 378 | 471 25% | 620 64% | 961 154% | 1801 376% |
| Score Total (Points) | 1040 | 1479 42% | 2575 148% | 1719 65% | 3529 239% |
| Copy ISO MB/s (MB/s) | 514 | 893 74% | 739 44% | 1248 143% | 1247 143% |
| Copy Program MB/s (MB/s) | 259.3 | 287.9 11% | 312.3 20% | 237.3 -8% | 460.2 77% |
| Copy Game MB/s (MB/s) | 521 | 618 19% | 486.3 -7% | 463 -11% | 1107 112% |
* ... menor é melhor

| 3DMark 11 | |
| 1280x720 Performance GPU | |
| Acer Swift 3 SF315-41-R6J9 | |
| Asus Zenbook 14 UX433FN-A6023T | |
| Honor Magicbook | |
| Asus VivoBook S410UQ-NH74 | |
| Lenovo ThinkPad E590-20NC0003GE | |
| LG Gram 14Z980-U.AAW5U1 | |
| Média Intel UHD Graphics 620 (1144 - 3432, n=244) | |
| Samsung Notebook 9 NP930QAA | |
| Fujitsu Lifebook A357-A3570MPH06DE | |
| Lenovo ThinkPad 13 20J1005TPB | |
| 1280x720 Performance Combined | |
| Asus Zenbook 14 UX433FN-A6023T | |
| Acer Swift 3 SF315-41-R6J9 | |
| Honor Magicbook | |
| Asus VivoBook S410UQ-NH74 | |
| Média Intel UHD Graphics 620 (927 - 2505, n=244) | |
| Samsung Notebook 9 NP930QAA | |
| Lenovo ThinkPad E590-20NC0003GE | |
| LG Gram 14Z980-U.AAW5U1 | |
| Fujitsu Lifebook A357-A3570MPH06DE | |
| Lenovo ThinkPad 13 20J1005TPB | |
| 3DMark | |
| 1280x720 Cloud Gate Standard Graphics | |
| Asus Zenbook 14 UX433FN-A6023T | |
| Acer Swift 3 SF315-41-R6J9 | |
| Honor Magicbook | |
| Asus VivoBook S410UQ-NH74 | |
| LG Gram 14Z980-U.AAW5U1 | |
| Samsung Notebook 9 NP930QAA | |
| Lenovo ThinkPad E590-20NC0003GE | |
| Média Intel UHD Graphics 620 (6205 - 16400, n=225) | |
| Fujitsu Lifebook A357-A3570MPH06DE | |
| Lenovo ThinkPad 13 20J1005TPB | |
| 1920x1080 Fire Strike Graphics | |
| Asus Zenbook 14 UX433FN-A6023T | |
| Acer Swift 3 SF315-41-R6J9 | |
| Honor Magicbook | |
| Asus VivoBook S410UQ-NH74 | |
| LG Gram 14Z980-U.AAW5U1 | |
| Lenovo ThinkPad E590-20NC0003GE | |
| Média Intel UHD Graphics 620 (557 - 2608, n=213) | |
| Fujitsu Lifebook A357-A3570MPH06DE | |
| Lenovo ThinkPad 13 20J1005TPB | |
| 3DMark 11 Performance | 1940 pontos | |
| 3DMark Cloud Gate Standard Score | 8276 pontos | |
| 3DMark Fire Strike Score | 1101 pontos | |
Ajuda | ||
| The Witcher 3 | |
| 1024x768 The Witcher 3 low | |
| Média da turma Subnotebook (38.8 - 176, n=12, últimos 2 anos) | |
| Média Intel UHD Graphics 620 (8.8 - 50.9, n=64) | |
| 1366x768 The Witcher 3 medium | |
| Média da turma Subnotebook (74.5 - 115, n=7, últimos 2 anos) | |
| Média Intel UHD Graphics 620 (8 - 27.9, n=29) | |
| 1920x1080 The Witcher 3 high | |
| Média da turma Subnotebook (25.6 - 64, n=12, últimos 2 anos) | |
| Média Intel UHD Graphics 620 (4.2 - 13.5, n=17) | |
| 1920x1080 The Witcher 3 ultra | |
| Média da turma Subnotebook (13.9 - 34.6, n=12, últimos 2 anos) | |
| Média Intel UHD Graphics 620 (2.97 - 5.2, n=7) | |
| baixo | média | alto | ultra | |
|---|---|---|---|---|
| BioShock Infinite (2013) | 60.5 | 35.2 | 29.7 | 9.9 |
| Rise of the Tomb Raider (2016) | 22.4 | 13.1 | 7.2 | |
| Rocket League (2017) | 56.7 | 31.6 | 21.4 |
| LG Gram 14Z980-U.AAW5U1 UHD Graphics 620, i5-8250U, SK Hynix SC313 HFS256G39TNF | Dell XPS 13 9380 2019 UHD Graphics 620, i5-8265U, SK hynix PC401 HFS256GD9TNG | Huawei Matebook X Pro i5 GeForce MX150, i5-8250U, Samsung PM961 MZVLW256HEHP | Lenovo Yoga C930-13IKB UHD Graphics 620, i5-8250U, SK hynix PC401 HFS256GD9TNG | Lenovo ThinkPad X1 Carbon 2018-20KGS03900 UHD Graphics 620, i5-8550U, Samsung SSD PM981 MZVLB512HAJQ | |
|---|---|---|---|---|---|
| Noise | -5% | -4% | 0% | -4% | |
| desligado / ambiente * (dB) | 28.2 | 30.4 -8% | 27.9 1% | 29.3 -4% | 28.9 -2% |
| Idle Minimum * (dB) | 28.4 | 30.4 -7% | 27.9 2% | 29.3 -3% | 28.9 -2% |
| Idle Average * (dB) | 28.4 | 30.4 -7% | 27.9 2% | 29.3 -3% | 28.9 -2% |
| Idle Maximum * (dB) | 28.4 | 30.4 -7% | 27.9 2% | 29.7 -5% | 32.5 -14% |
| Load Average * (dB) | 35.7 | 31.7 11% | 36.2 -1% | 31.8 11% | 35.1 2% |
| Load Maximum * (dB) | 34.2 | 38.1 -11% | 45.2 -32% | 32.7 4% | 35.1 -3% |
| Witcher 3 ultra * (dB) | 45 |
* ... menor é melhor
Barulho
| Ocioso |
| 28.4 / 28.4 / 28.4 dB |
| Carga |
| 35.7 / 34.2 dB |
 | ||
30 dB silencioso 40 dB(A) audível 50 dB(A) ruidosamente alto |
||
min: | ||
(-) A temperatura máxima no lado superior é 45.2 °C / 113 F, em comparação com a média de 35.9 °C / 97 F , variando de 21.4 a 59 °C para a classe Subnotebook.
(±) A parte inferior aquece até um máximo de 41.4 °C / 107 F, em comparação com a média de 39.2 °C / 103 F
(+) Em uso inativo, a temperatura média para o lado superior é 24 °C / 75 F, em comparação com a média do dispositivo de 30.8 °C / ### class_avg_f### F.
(+) Os apoios para as mãos e o touchpad são mais frios que a temperatura da pele, com um máximo de 29.2 °C / 84.6 F e, portanto, são frios ao toque.
(±) A temperatura média da área do apoio para as mãos de dispositivos semelhantes foi 28.2 °C / 82.8 F (-1 °C / -1.8 F).
LG Gram 14Z980-U.AAW5U1 análise de áudio
(±) | o volume do alto-falante é médio, mas bom (###valor### dB)
Graves 100 - 315Hz
(-) | quase nenhum baixo - em média 23.7% menor que a mediana
(±) | a linearidade dos graves é média (11.6% delta para a frequência anterior)
Médios 400 - 2.000 Hz
(+) | médios equilibrados - apenas 3.9% longe da mediana
(±) | a linearidade dos médios é média (7% delta para frequência anterior)
Altos 2 - 16 kHz
(+) | agudos equilibrados - apenas 1.8% longe da mediana
(+) | os máximos são lineares (4.6% delta da frequência anterior)
Geral 100 - 16.000 Hz
(±) | a linearidade do som geral é média (20.4% diferença em relação à mediana)
Comparado com a mesma classe
» 65% de todos os dispositivos testados nesta classe foram melhores, 8% semelhantes, 26% piores
» O melhor teve um delta de 5%, a média foi 18%, o pior foi 53%
Comparado com todos os dispositivos testados
» 54% de todos os dispositivos testados foram melhores, 8% semelhantes, 38% piores
» O melhor teve um delta de 4%, a média foi 23%, o pior foi 134%
Apple MacBook 12 (Early 2016) 1.1 GHz análise de áudio
(+) | os alto-falantes podem tocar relativamente alto (###valor### dB)
Graves 100 - 315Hz
(±) | graves reduzidos - em média 11.3% menor que a mediana
(±) | a linearidade dos graves é média (14.2% delta para a frequência anterior)
Médios 400 - 2.000 Hz
(+) | médios equilibrados - apenas 2.4% longe da mediana
(+) | médios são lineares (5.5% delta para frequência anterior)
Altos 2 - 16 kHz
(+) | agudos equilibrados - apenas 2% longe da mediana
(+) | os máximos são lineares (4.5% delta da frequência anterior)
Geral 100 - 16.000 Hz
(+) | o som geral é linear (10.2% diferença em relação à mediana)
Comparado com a mesma classe
» 7% de todos os dispositivos testados nesta classe foram melhores, 2% semelhantes, 90% piores
» O melhor teve um delta de 5%, a média foi 18%, o pior foi 53%
Comparado com todos os dispositivos testados
» 5% de todos os dispositivos testados foram melhores, 1% semelhantes, 94% piores
» O melhor teve um delta de 4%, a média foi 23%, o pior foi 134%
| desligado | |
| Ocioso | |
| Carga |
|
Key:
min: | |
| LG Gram 14Z980-U.AAW5U1 i5-8250U, UHD Graphics 620, SK Hynix SC313 HFS256G39TNF, IPS, 1920x1080, 14" | Dell XPS 13 9380 2019 i5-8265U, UHD Graphics 620, SK hynix PC401 HFS256GD9TNG, IPS, 3840x2160, 13.3" | Huawei Matebook X Pro i5 i5-8250U, GeForce MX150, Samsung PM961 MZVLW256HEHP, IPS, 3000x2000, 13.9" | Asus Zenbook 14 UX433FN-A6023T i7-8565U, GeForce MX150, Intel SSD 660p SSDPEKNW512G8, IPS, 1920x1080, 14" | Lenovo Yoga C930-13IKB i5-8250U, UHD Graphics 620, SK hynix PC401 HFS256GD9TNG, IPS, 1920x1080, 13.9" | Lenovo ThinkPad X1 Carbon 2018-20KGS03900 i5-8550U, UHD Graphics 620, Samsung SSD PM981 MZVLB512HAJQ, IPS, 2560x1440, 14" | |
|---|---|---|---|---|---|---|
| Power Consumption | -47% | -56% | -24% | -34% | -53% | |
| Idle Minimum * (Watt) | 2.7 | 4.8 -78% | 3.5 -30% | 2.6 4% | 3.3 -22% | 3.8 -41% |
| Idle Average * (Watt) | 6 | 8.6 -43% | 8.9 -48% | 5.6 7% | 6.8 -13% | 8.9 -48% |
| Idle Maximum * (Watt) | 6.5 | 10.4 -60% | 12.3 -89% | 7.3 -12% | 9.5 -46% | 11.9 -83% |
| Load Average * (Watt) | 32.5 | 37.9 -17% | 54.2 -67% | 47 -45% | 40.8 -26% | 47.5 -46% |
| Load Maximum * (Watt) | 35.5 | 48.5 -37% | 52.1 -47% | 61.8 -74% | 57 -61% | 52.5 -48% |
| Witcher 3 ultra * (Watt) | 42.4 |
* ... menor é melhor
| LG Gram 14Z980-U.AAW5U1 i5-8250U, UHD Graphics 620, 72 Wh | Dell XPS 13 9380 2019 i5-8265U, UHD Graphics 620, 52 Wh | Huawei Matebook X Pro i5 i5-8250U, GeForce MX150, 57.4 Wh | HP Spectre x360 13t-ae000 i5-8550U, UHD Graphics 620, 60 Wh | Asus Zenbook 14 UX433FN-A6023T i7-8565U, GeForce MX150, 50 Wh | Lenovo Yoga C930-13IKB i5-8250U, UHD Graphics 620, 60 Wh | Lenovo ThinkPad X1 Carbon 2018-20KGS03900 i5-8550U, UHD Graphics 620, 57 Wh | |
|---|---|---|---|---|---|---|---|
| Duração da bateria | -32% | -29% | -34% | -31% | -27% | -34% | |
| Reader / Idle (h) | 37.3 | 17.2 -54% | 20.7 -45% | 23.9 -36% | 22.1 -41% | ||
| WiFi v1.3 (h) | 12 | 8.3 -31% | 9.3 -22% | 7.1 -41% | 8.3 -31% | 9.2 -23% | 8.7 -27% |
| Load (h) | 2.7 | 2.4 -11% | 2.2 -19% | 2 -26% | 2.1 -22% | 1.8 -33% |
Pro
Contra
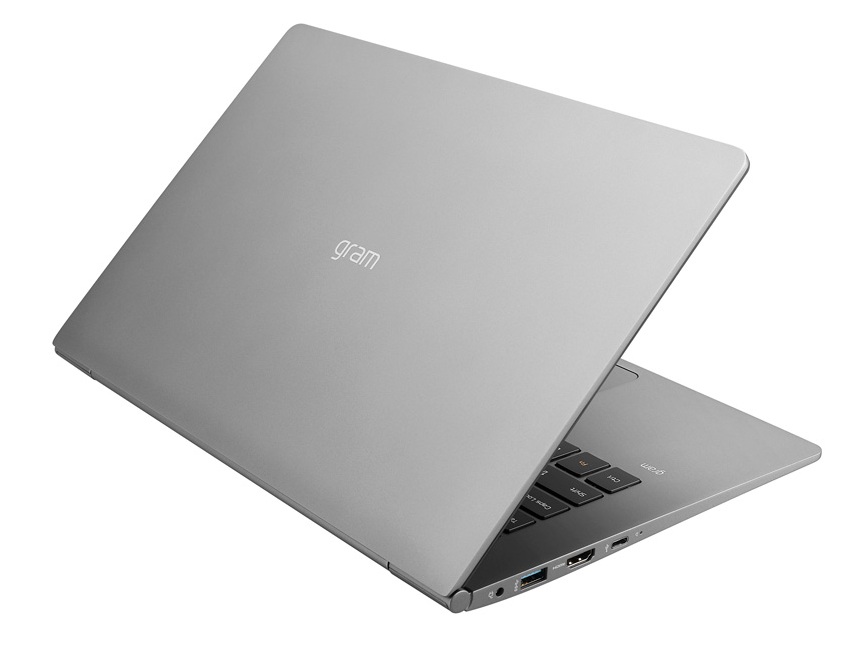
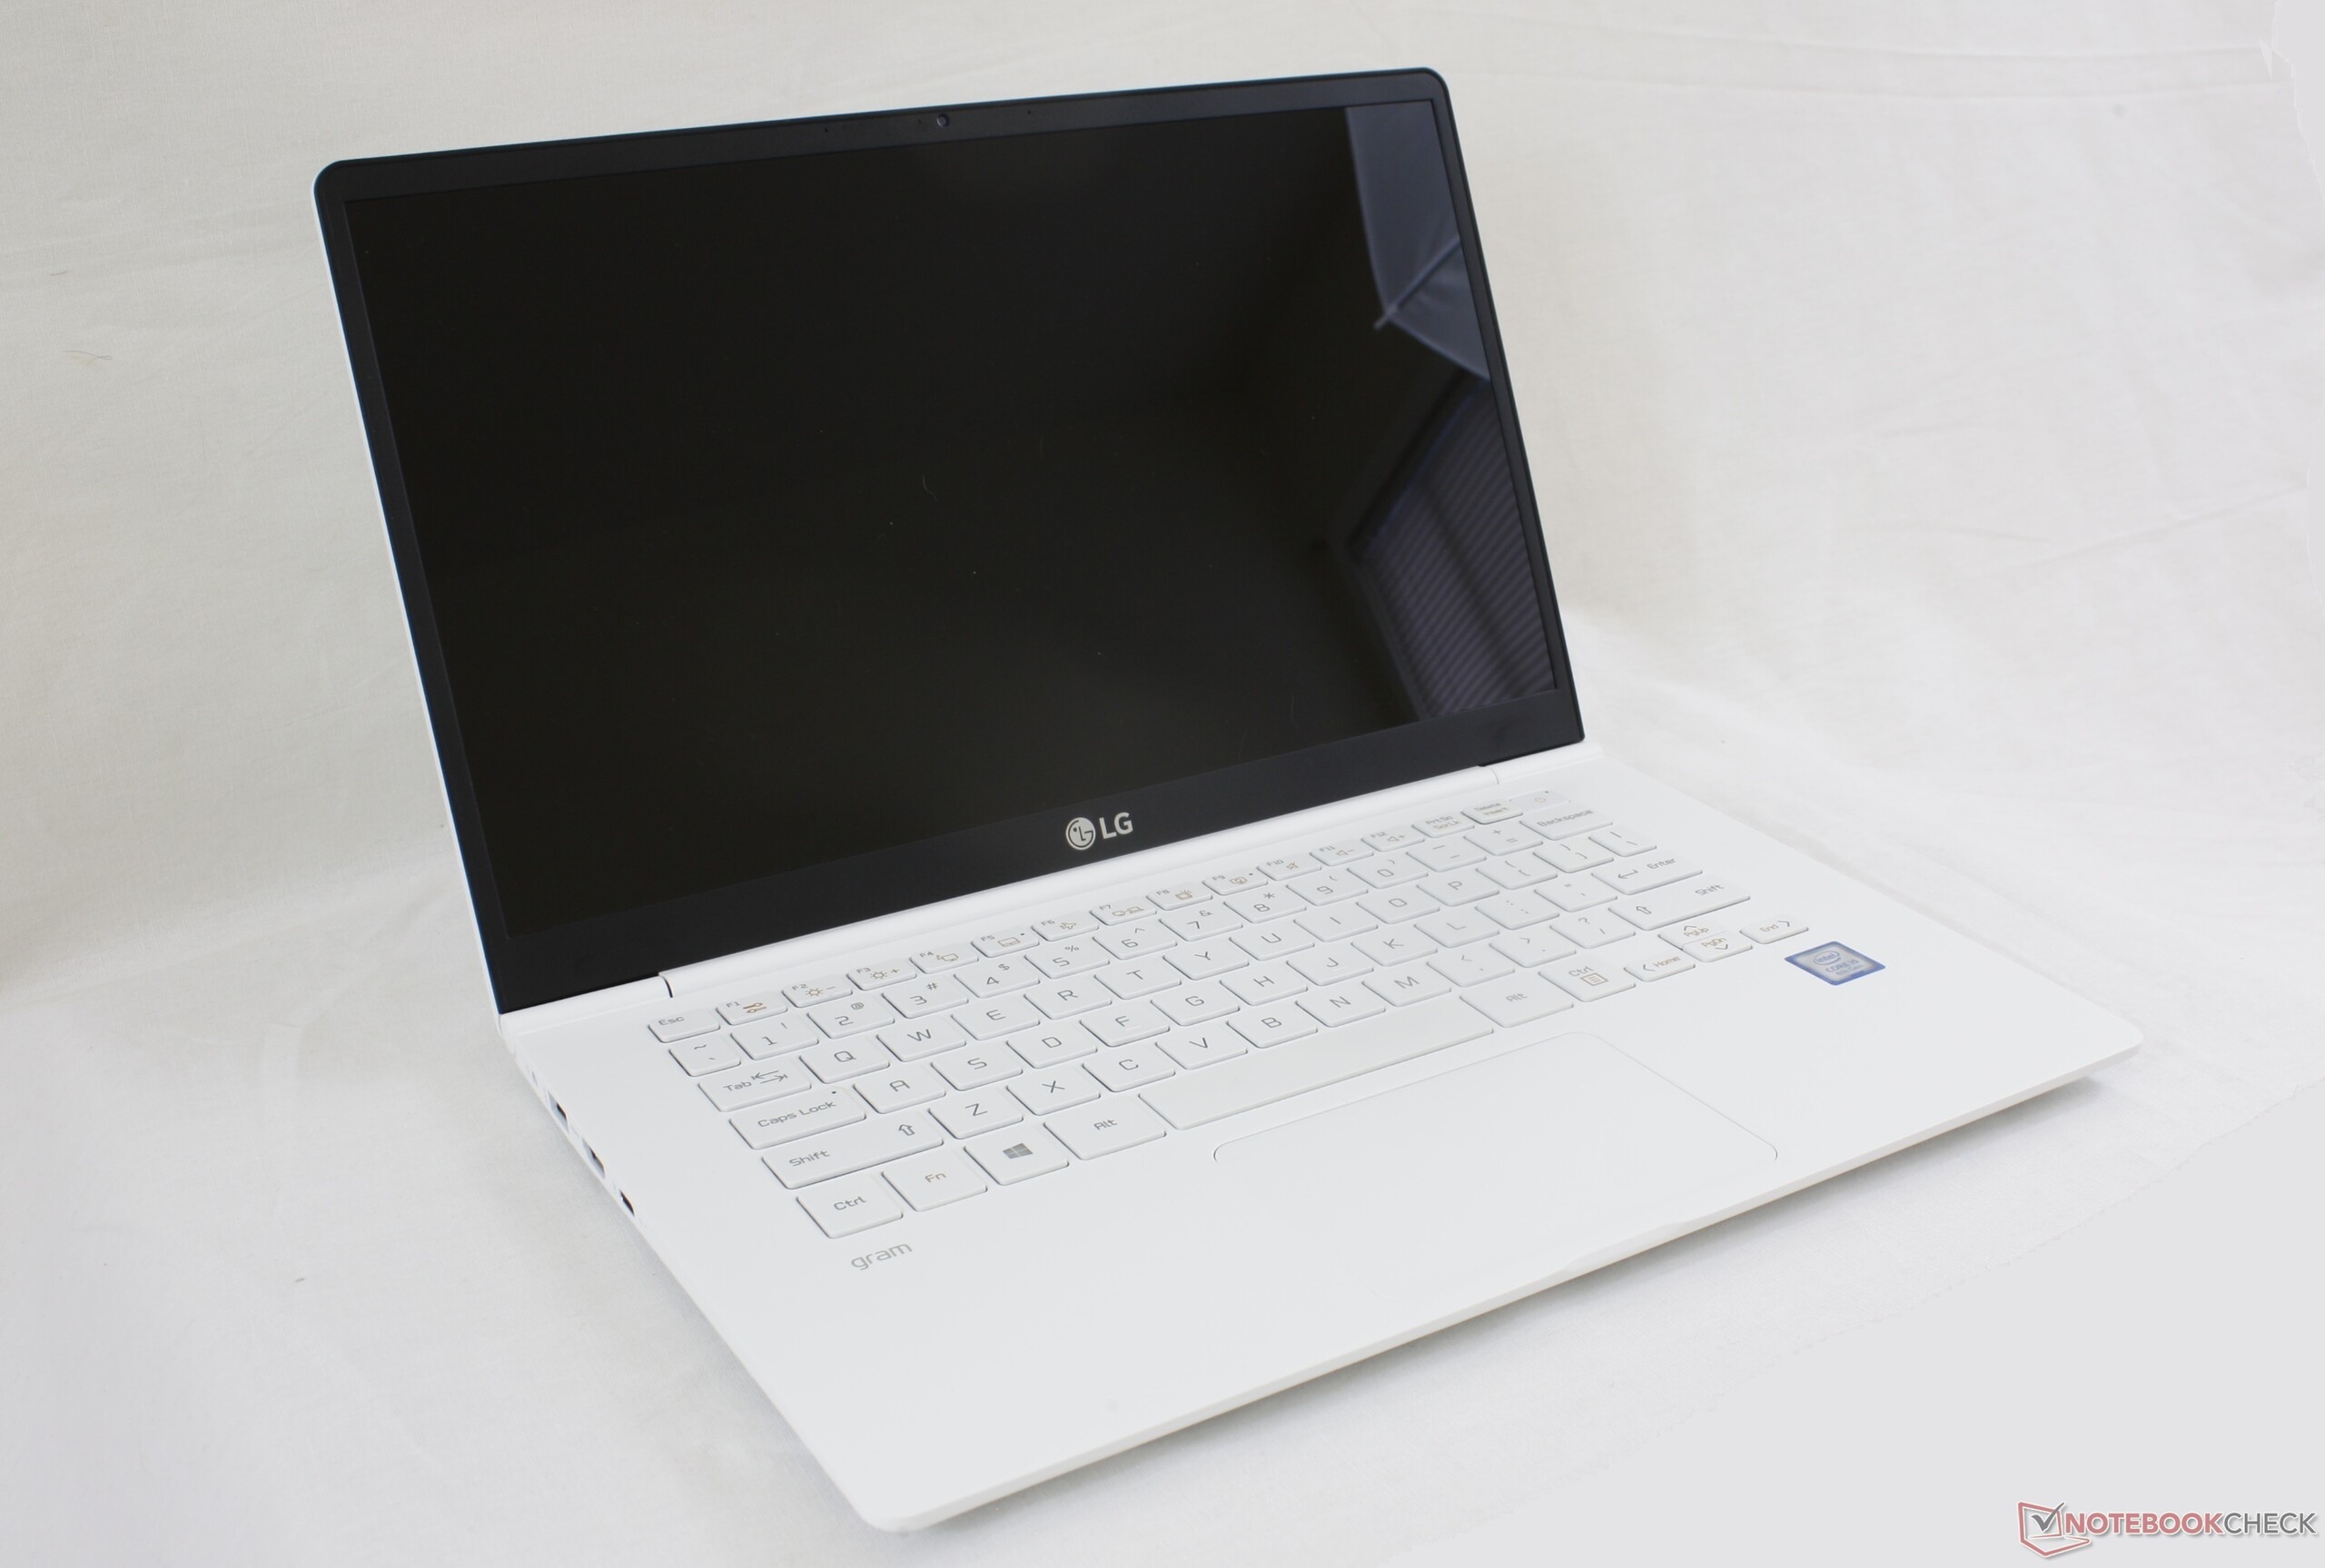
A maioria dos consumidores no mercado à procura de um Ultrabook pode primeiro dar uma olhada na Dell, HP, Lenovo, Asus ou Acer. De nossa experiência com o LG Gram 14, no entanto, acreditamos que merece a mesma atenção que um XPS, Spectre, ou ZenBook. A solução LG de 14 polegadas oferece duas vantagens principais que não estão disponíveis na maioria dos concorrentes: um peso extraordinariamente leve de pouco menos de 1 kg e uma duração de bateria impressionantemente longa de mais de 10 horas. Esses destaques por si só podem ser suficientes para atrair usuários que estão constantemente em movimento e acham que telas de 13 polegadas são muito pequenas.
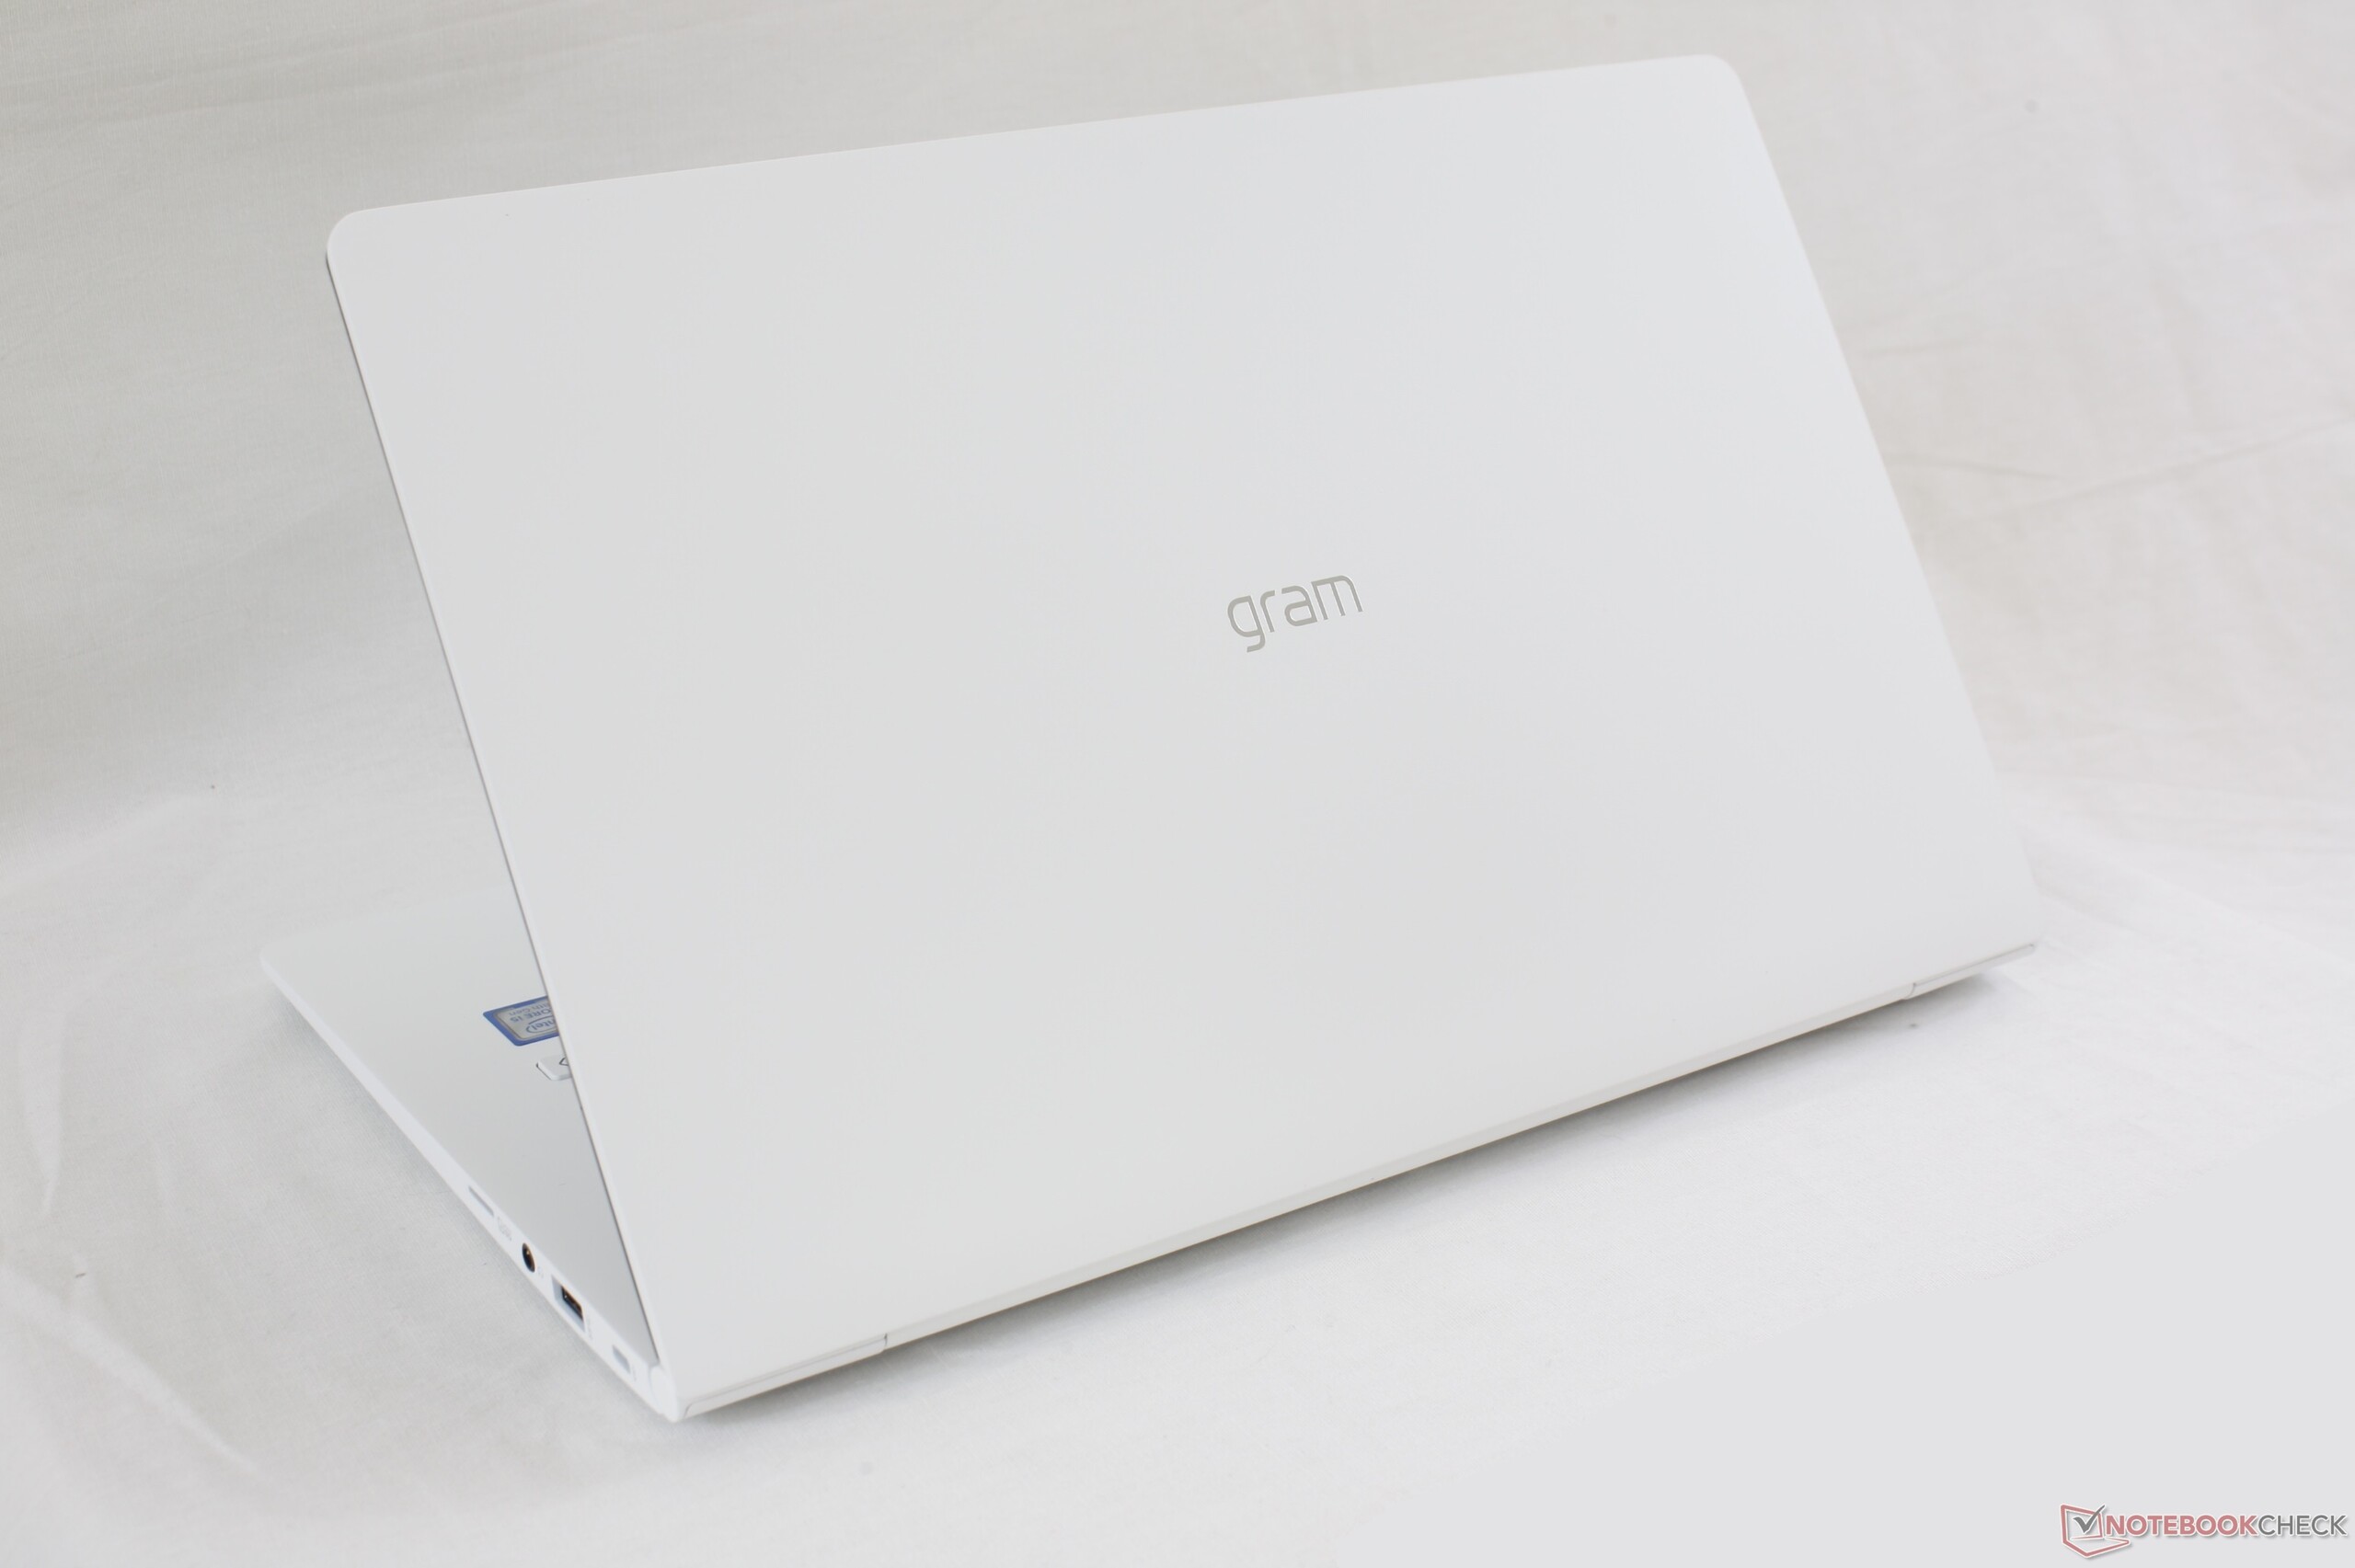
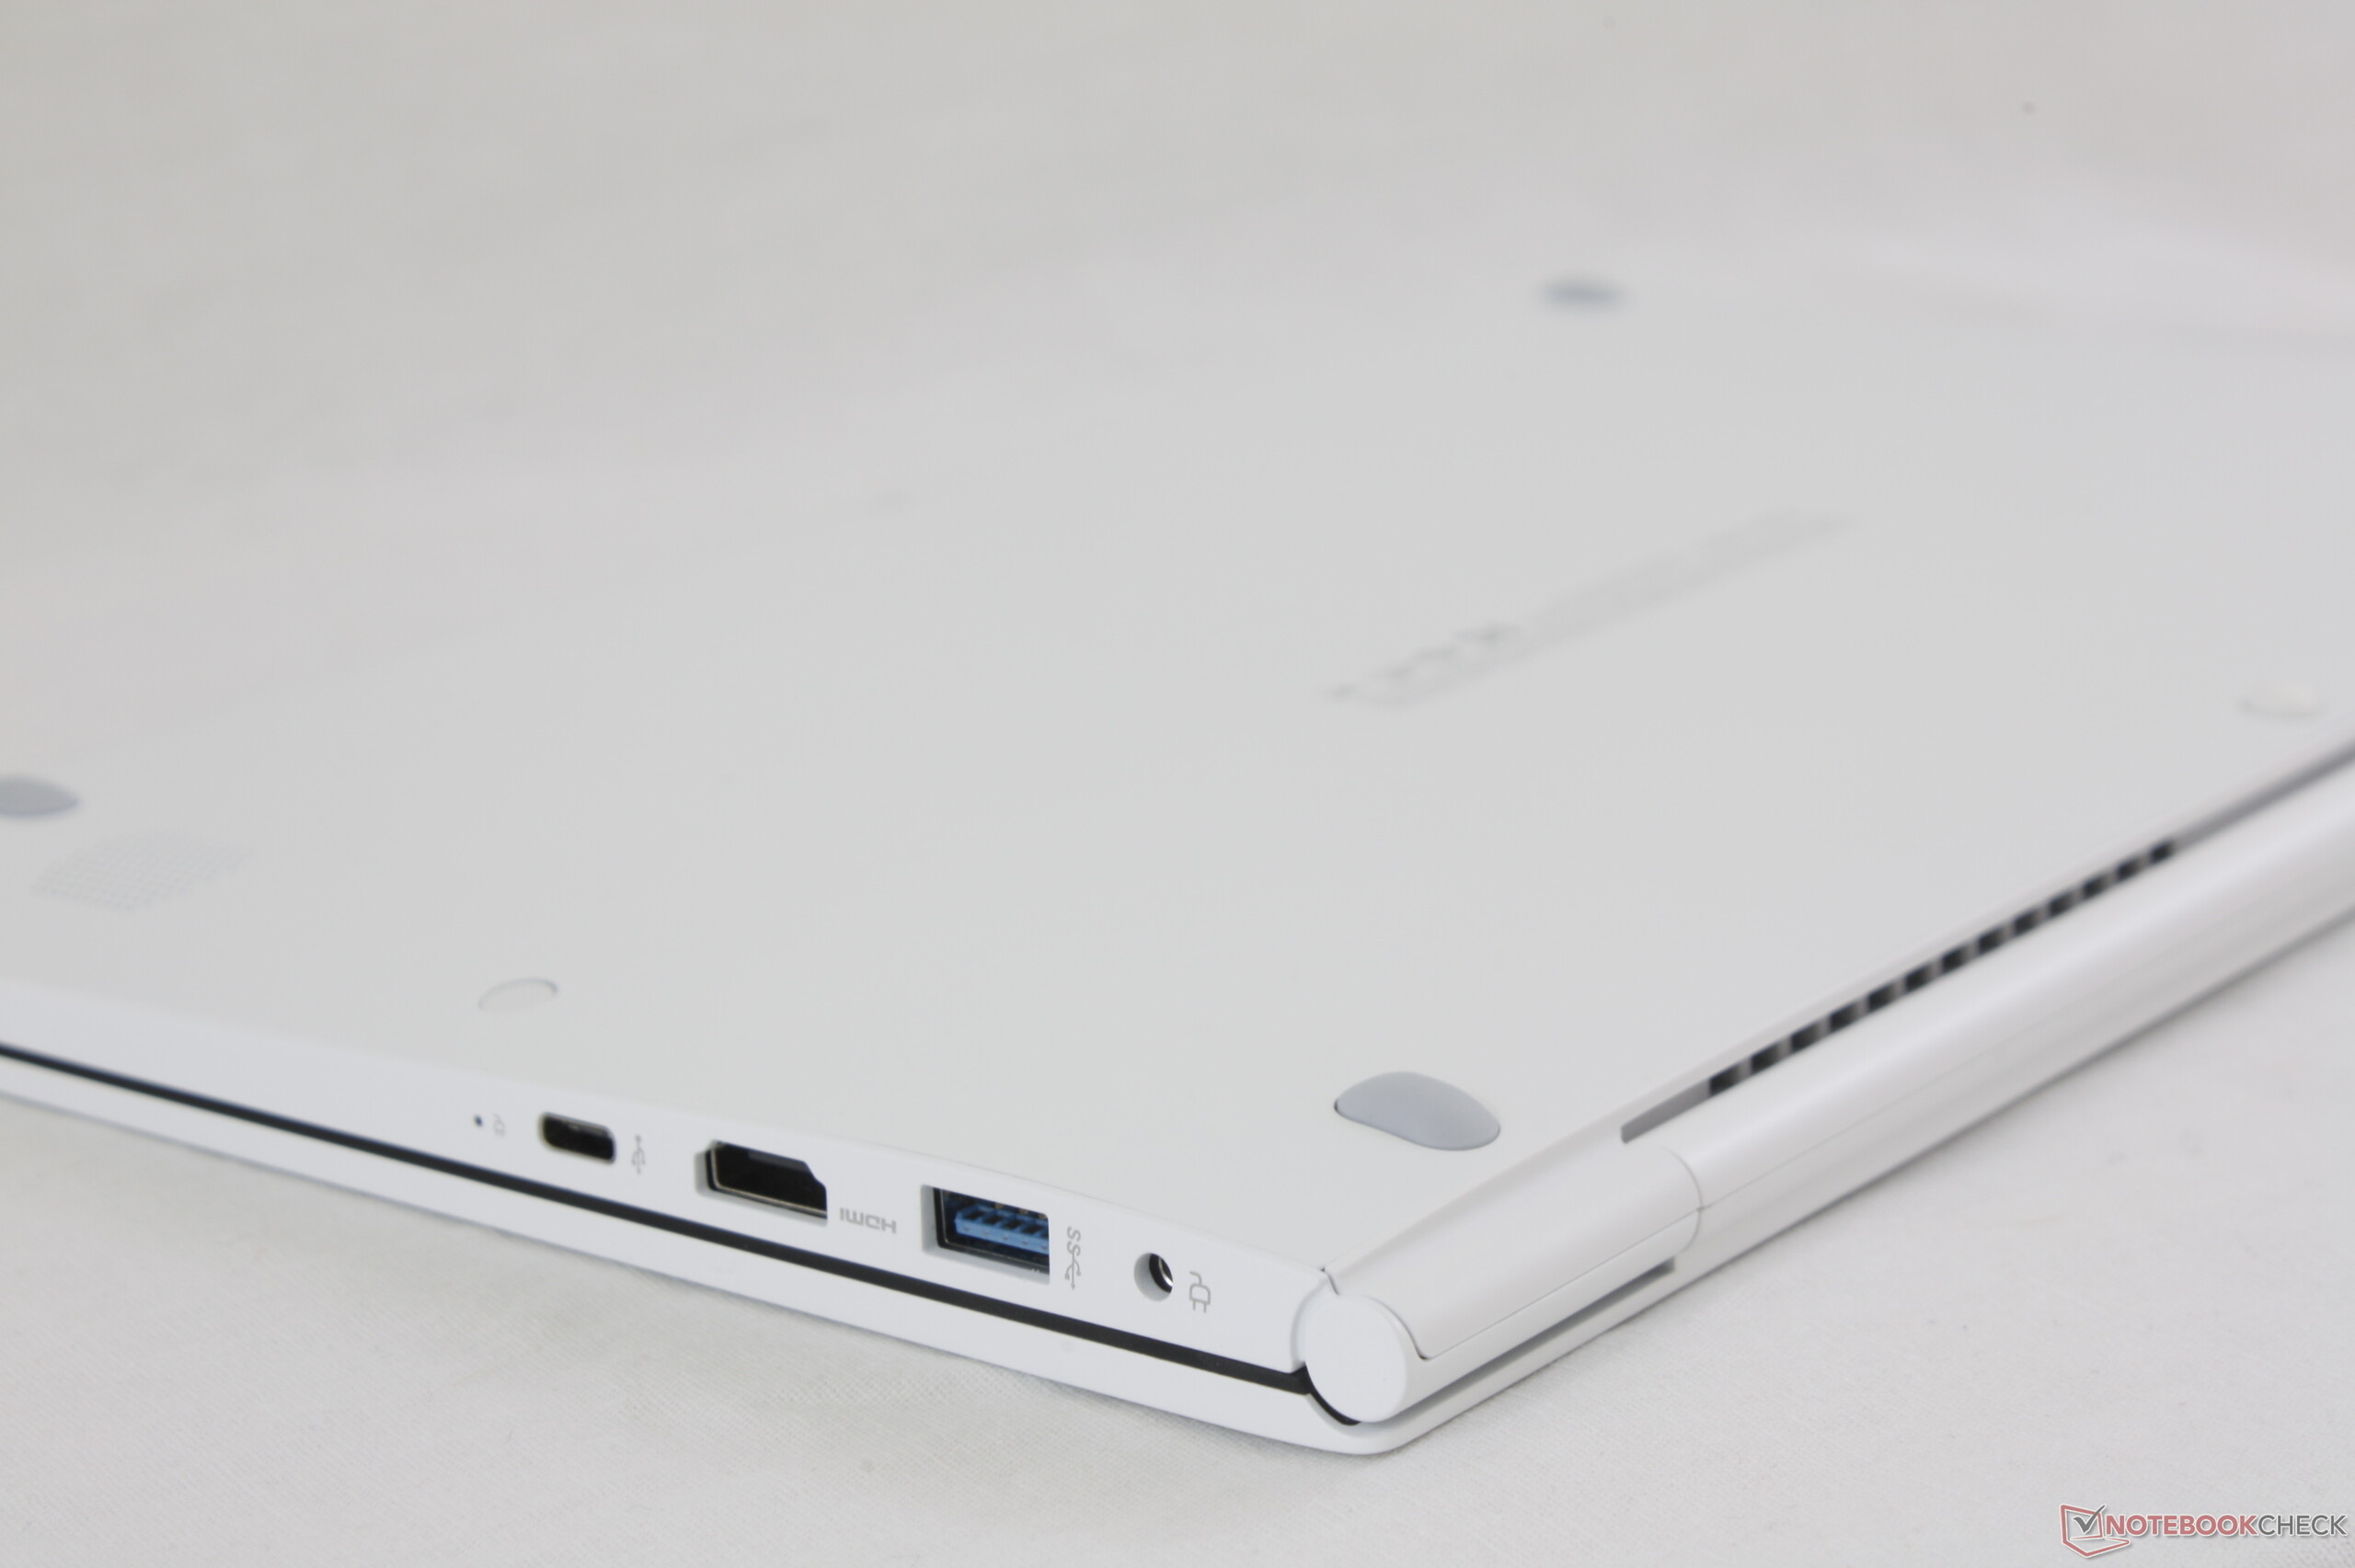
Existe uma lista de desvantagens e muitas delas são consequência de manter o peso o mais baixo possível. Por um lado, o Gram 14 não possui opções comumente encontradas em outros Ultrabooks, incluindo Thunderbolt 3, NVMe, tela tácil, painel mate, 4K UHD, Gorilla Glass e gráficos discretos. A ausência do reforço do Gorilla Glass, em particular, significa uma tampa muito flexível e mais propensa a danos. O desempenho da CPU abaixo da média, o carregamento lento e a capacidade de manutenção difícil atrapalham a longevidade do sistema. Este é mais um Ultrabook para viajantes, em vez de um cavalo de trabalho de escritório frequentemente conectado a estações docking e monitores externos.
O LG Gram 14 é um Ultrabook não apreciado e subestimado. Os usuários que não desejam muitos dos recursos avançados ou opções de conectividade comumente encontrados em outros Ultrabooks carros-chefe vão encontrar muito do que gostar no Gram super-leve. Usuários avançados e artistas digitais, no entanto, vão querer algo com mais potência de CPU e GPU.
LG Gram 14Z980-U.AAW5U1
- 04/05/2019 v6 (old)
Allen Ngo
Price comparison
